
Electrical Load Evaluation in Igwuruta, Port Harcourt for ...
35
GSJ: Volume 8, Issue 3, March 2020, Online: ISSN 2320-9186 www.globalscientificjournal.com Electrical Load Evaluation in Igwuruta, Port Harcourt for Improved Distribution 1 OkachiCheta Emmanuel and 2 Prof. D C.Idoniboyeobu 1,2 Department of Electrical Engineering, Power OptionRivers State University, Port Harcourt. 1 [email protected] 2 idoniboyeobu.d@ust.edu.ng. ABSTRACT: This study of the Electrical Load Evaluation in Igwuruta, Port Harcourt for improved distribution. Electrical load analysis identities potential problems in the distribution network such as energy usage, harmonic inference, unexpected spikes that a visual inspection alone may not identify. The 33KV Old Airport feeders that supply electricity to Igwuruta, Port Harcourt was critically examined in this study. This study used Electrical Transient Analyzer Programme (ETAP) and from the simulation, the existing distribution network had overloading of transformers and low voltage profile. To solve the problems, optimal capacitor bank of 48000KVR were introduced to the entire system network to improve voltage performance and voltage upgrade on the distribution network. The simulation of the improved distribution network shows that the voltage profile has improved with the statutory limit between 95% - 105% and by the penetration of the capacitor bank in the network, the voltage was improved by 18.4% bus 2, bus 3: 18.4% and bus 27: 5.96% and all the transformer were within the normal operating condition. GSJ: Volume 8, Issue 3, March 2020 ISSN 2320-9186 699 GSJ© 2020 www.globalscientificjournal.com
-
Upload
khangminh22 -
Category
Documents
-
view
1 -
download
0
Transcript of Electrical Load Evaluation in Igwuruta, Port Harcourt for ...
GSJ: Volume 8, Issue 3, March 2020, Online: ISSN 2320-9186
www.globalscientificjournal.com
Electrical Load Evaluation in Igwuruta, Port Harcourt for Improved Distribution
1OkachiCheta Emmanuel and 2Prof. D C.Idoniboyeobu 1,2Department of Electrical Engineering, Power OptionRivers State University, Port Harcourt. [email protected] [email protected].
ABSTRACT: This study of the Electrical Load Evaluation in Igwuruta, Port Harcourt for improved distribution.
Electrical load analysis identities potential problems in the distribution network such as energy usage, harmonic
inference, unexpected spikes that a visual inspection alone may not identify. The 33KV Old Airport feeders that
supply electricity to Igwuruta, Port Harcourt was critically examined in this study. This study used Electrical
Transient Analyzer Programme (ETAP) and from the simulation, the existing distribution network had overloading
of transformers and low voltage profile. To solve the problems, optimal capacitor bank of 48000KVR were
introduced to the entire system network to improve voltage performance and voltage upgrade on the distribution
network. The simulation of the improved distribution network shows that the voltage profile has improved with the
statutory limit between 95% - 105% and by the penetration of the capacitor bank in the network, the voltage was
improved by 18.4% bus 2, bus 3: 18.4% and bus 27: 5.96% and all the transformer were within the normal
operating condition.
GSJ: Volume 8, Issue 3, March 2020 ISSN 2320-9186 699
GSJ© 2020 www.globalscientificjournal.com

CHAPTER 1
INTRODUCTION
1.1 Background of the Study
Load evaluation verifies whether electrical systems are safe and efficient, and that installations
show no signs of overload. Load analysis highlights potential problems in the distribution
network such as energy usage, harmonic inference or unexpected spikes that a visual inspection
alone may not identify. Electric Power System is made up of the Generating System,
Transmission Station and Distribution Stations Respectively. Electric power is transmitted by
high voltage transmission lines from sending end sub-receiving and end substation. At the
receiving end substation, the voltage is been stepped down to a lower value which are 33kv or
even 11kv as the case may be for customer usage.(Centrica Business solution,2019).
However, in Nigeria the limiting factors to efficient and reliable power supply apart from low
power generation may include poor transmission feeders, poor or inefficient voltage control
system due to lack of planning, faulty distribution system on the part of the electrical supplier
(PHED). Voltage drop along the line and from the distribution system due to the flow of current
and load variations on the consumer end, transmission and distribution network, damage of
substations, short circuit or over loading of electrical mains (supply) and tripping of power
GSJ: Volume 8, Issue 3, March 2020 ISSN 2320-9186 700
GSJ© 2020 www.globalscientificjournal.com

system. These factors have resulted to unreliable frequent power outages and voltage variations.
The demand for electrical power always exceeds the supply in practice especially in a developing
country like Nigeria resulting to the interruption of an electrical supply which can be avoided by
load-shedding, thereby causing excessive load on the feeders and the generating plant, leading to
epithetic power supply system.
Distribution transformers step down the voltage to the level suitable for household and
commercial utilities and hence feed several customers through the secondary distribution lines
(distributors) at the same voltage. Residential and commercial customers are connected to the
secondary distribution line through the service drops. Although electrical power consumers are
in need of higher amount of electrical power may be connected directly to the primary
distribution line or the sub-transmission level.
The research gives steady state solution of the voltage at all the buses for a particular condition.
In the study fast Decoupled Newton – Raphson load flow analysis was used to analyze electrical
power supply to Igwuruta Town Port Harcourt because thus method gives the solution of non-
linear simultaneous equation in polar form. The total time taken to get the convergent criteria is
less, and the number of iterations required to get the convergent criteria are limited as it does not
depend on the buses. Igwuruta is located in Ikwerre Local Government Areas of Rivers State,
Nigeria. Electricity is being supplied to Igwuruta from the 33kv old Air-Port feeder, which the
main source is from Port Harcourt Main Transmission Station 3x60 MVA. However, challenges
such as low voltages are experiences in some areas which led to the installation of transformer
without planning, resulting to overloading the of the feeder as the city expands and voltage drops
are experienced in the transmission due to the distance covered by the line which serves the area.
Despite these challenges, there is the insufficient megawatt from the National Grid to the state,
electricity exercise control over the socioeconomic development of the state. In regards to this,
GSJ: Volume 8, Issue 3, March 2020 ISSN 2320-9186 701
GSJ© 2020 www.globalscientificjournal.com

this academic research will identity the numerous problems on the network and it will becomes
paramount to carryout proper load flow analysis with a view to achieve efficient supply of power
in Igwuruta area in particular and the state at large.
1.2 Statement of Problems
Admitting the decline nature of the power sector in Nigeria. Especially in the Igwuruta Town,
Port Harcourt electricity power distribution network is faced with problem such as over loading
of distributed transformers by the customer usage, low voltage experiences, voltage drops due to
the distance covered by the transmission line, insufficient power supply from the National Grid,
poor maintenance on the transmission and distribution line etc. But a comprehensive and proper
load flow analysis using fast decoupled method will be used to achieve and restore steady and
efficient supply of power in Igwuruta town and the state at large by solving the problems such as
over loading of distributed transformers by the customer usage, low voltage experiences, the
installation of transformer without planning etc.
1.3 Research Aim
The aim of this study is to conduct an analysis of electrical load evaluation in Igwuruta town,
Port Harcourt for improved Distribution using fast decoupled method.
1.4 Objectives of the Research
The objectives of this research are considered as follows:
(1) To assess the physical conditions of the electric power distribution network for Igwuruta
town, Port Harcourt, in order to obtain relevant information/Data for analysis of voltage
problems.
GSJ: Volume 8, Issue 3, March 2020 ISSN 2320-9186 702
GSJ© 2020 www.globalscientificjournal.com

(2) To carryout field survey on the distributions lines and equipment and to improve the
distribution network using optimal capacitor replacement.
(3) To model and to simulate the network using ETAP.
(4) To improve the power using capacitor bank.
(5) To validate the existing network with the capacitor bank for improved performance.
CHAPTER 2
LITERATURE REVIEW
2.1 Importance of Load Flow Studies
Load flow studies are used to ensure that electrical power transfer from generators to consumers
through the grid system is stable, reliable and economic. The increasing presence of distributed
alternative energy sources, often in geographically remote locations, complicates flow studies
and has triggered a resurgence of interest in the research work. In a three phase as power system
active and reactive power flows from the generating station to the load through different
networks buses and branches. The flow of active and reactive power is called power flow or load
flow. Load flow studies provides a systematic mathematical approach for determination of
various bus voltage, there phase angle active and reactive power flows through different
branches generators and loads under steady state condition.(Centrica Business solution, 2019). In
order to obtain a reliable power system operation under normal balanced three phase steady state
conditions, it is required to have the followings:
- Generation supplies the load demand and losses.
- Bus voltage magnitudes remain close to rated values.
- Generator operates within specific real and reactive power limits.
GSJ: Volume 8, Issue 3, March 2020 ISSN 2320-9186 703
GSJ© 2020 www.globalscientificjournal.com

- Transmission lines and transformer are not overloaded.
According to the scholar Ahmed, 2013 pinned that load flow analysis is the solution for the
operating condition of a power system. Load flow analysis is used for power system planning,
operational planning and operations construct (Brown 2013) also employed in multiple
assessments, stability analysis and system optimization.
2.2 Literature Survey/Techniques of Load Flow Analysis
In the literature, there are a number of efficient and reliable load flow solution techniques, such
as Gauss-seidel, Newton – Raphson and fast Decoupled load flow. In 1967, Tinney and Hart
developed the classical Newton based power flow solution method. Later work by (Stott and
Alsac 1974), made the fast decoupled Newton method and the algorithm remains unchanged for
different applications.
Even though this method worked well for transmission systems, but its convergence performance
is poor for most distribution systems due to the high R/X ratio which deteriorate the diagonal
dominance of the Jacobian matrix for this reason, various other types of methods consist of
backward/forward sweeps on a ladder system. The formulation of the algorithm for those were
different from the Newton’s power flow method, which made those methods hard to be extended
to other applications in which the Newton method seemed more appropriate.
(Tripathy et al 2004), presented a Newton like method for solving ill-conditioned power systems.
Their method showed voltage convergence but could not be efficiently used for optimal power
flow calculations.
2.3 Load Flow Analysis Using PSAT Soft for Test System Simulation
GSJ: Volume 8, Issue 3, March 2020 ISSN 2320-9186 704
GSJ© 2020 www.globalscientificjournal.com
Power system analysis toolbox (PSAT) is an open source MATLAB and Graphical user interface
(GUI)/octave-base software package for analysis and design of small to medium size power
systems. The tool box is provided with a GUI and a Simulink editor for editing or designing a
single line diagram of any power system networks. PSAT can perform power flow, continuation
power flow (CPF) optimal power flow (off), small signal stability analysis.
(Abungu and Kipkirui 2009) state that decoupled load flow method using MATLAB 7.6
(r2013b) to develop an efficient and reliable program and PSAT as a validating tool. The
procedural methods calculated and analyzed a well-conditioned load study with minimal losses
on the buses; branches and the minimal number of iteration required for convergence were noted.
IEEE 14 bus system was used as the test system in the study.
2.4 Radial Distribution Network (RDN) of Load flow Algorithm
Li et al, 2014, in their view stated that algorithm have been developed to tackle the load flow
power problem. They formed node-branch incidence matrix that depict the relationship between
the bus injection powers and branch powers, then an estimated voltage drop and angle formulas
were used along with the incidence matric to solving the load flow power. Li et al, 2016,
modifies the previously mentioned algorithm to counter the fundamental error problem resulting
in high precision results for both weakly meshed/meshed networks.
Jabr.et al, 2012 state that RDN used the same convex formulation to obtain the optimal
configuration for minimizes its real power waste. The modeling of the load power of Radial
Distribution Network as Quadratically constrained convex optimization problem (QCCOP)
convexification of the continuous decision variables of the optimization problem guaranteed the
global optimality of the acquired solution. Moreover, the solution was obtained using interior –
point method algorithm through CPLEX optimization software after passing the parameters from
GSJ: Volume 8, Issue 3, March 2020 ISSN 2320-9186 705
GSJ© 2020 www.globalscientificjournal.com

MATLAB. The proposed algorithm has shown high computational efficiency, which paves the
way for real time optimization problems regarding the operation of Radial Distribution Network.
2.5 Determination of Bus Voltages, Power Losses and Load Flow in the
NorthernNigeria 33kv Transmission Sub-Grid
According to the scholar (Izuegbunamet al, 2011) researchers, the Nigerian Electric Power
Transmission network operated by Transmission Company of Nigeria (TCN) operates at a very
high pressure of 330kv while its lower transmission pressure is 132kv.
The planning, design and operation of power systems requires load flow computations to analyse
the steady state performance of the power system under various operating conditions and to
study the effects of changes in the configuration of equipment. In their view, the very low bus
voltage and poor power magnitude obtained from this study without voltage compensation
revealed the reality of the perpetual poor power supply to the North West part of Nigeria.This
project which seems to be a prototype of the entire network can be solved using load flow studies
which involves the use of computer programs designed specifically for this purpose.
2.6 A Promising Method for Uncertain Load Flow Studies
According to (Su, 2005) and (Chen et al., 2008), probabilistic methods are tools for planning
studies. Though there are different short comings as a result of non-normal probability
distribution and the statistical dependence of the input data as well as the problems associated
with identifying probability distribution for some input data accurately.In their view (Zian Wang
et al., 2009) suggested a method for solving the load flow using interval arithmetic taking the
uncertainty at the nodal values. Their articles also stated that the required solution to the non-
linear equations can be obtained by interval Newton operator, Krawczyk operator or Hansen-
Sengupta operator.
GSJ: Volume 8, Issue 3, March 2020 ISSN 2320-9186 706
GSJ© 2020 www.globalscientificjournal.com

(Barboza et al., 2004) also gave the methodology for solving the uncertain power flow problems
and a mathematical representation was applied to the load flow analysis by considering
Krawczyk's method to solve the nonlinear equations. It is mentioned that the existing problem of
excessive conservation in solving the interval linear equation could be overcome by Krawczyk's
method. In this method the linearized power flow equations should be preconditioned by an M-
matrix in order to guarantee convergence. The scholar also said that (Wang et al., 2005) the set
of non-linear equations were solved by Gauss-Seidel method. Preconditioning is required but if
interval input is too cumbersome, convergence is not guaranteed, that is why this method cannot
give an exact solution. (Yu et al., 2009) Fast Decoupled power flow using interval arithmetic has
been used to obtain the solution to the power flow with uncertainty.
This algorithm converges very fast and considers retaining the midpoint of the load flow studies.
This is a specific feature that ensures the convergence in accordance with the punctual load flow
studies. The algorithm is effective and avoids unnecessary computation effort like
preconditioning.
2.7 Performance of Newton-Raphson Technique in Load Flow Analysis Using Matlab
In the view of (Klingman and HinimeIbau 2008) the slack bus set the angle difference between
two voltages, the angle of the slack bus is not important, although it sets the reference angles of
all the other bus voltages.The main objective for the calculation of power flow study is to find
the magnitude of voltage /V/ and the phase angle (δ) of the power losses at each bus section, the
real and reactive power flowing in each line of the power system.It was observed that Newton-
Raphson's approach has made the calculations easier because the number of buses increased
while the number of iterations decreased.
GSJ: Volume 8, Issue 3, March 2020 ISSN 2320-9186 707
GSJ© 2020 www.globalscientificjournal.com

2.8 Electrical Load Flow Studies for Efficient Power Supply in Bayelsa State Using
NewtonRaphson Technique
According to the scholars, (Idoniboyeobu and Nemine 2017), the load flow analysis is the
backbone of power system analysis and design. It is the necessary for planning, operation,
economic scheduling and exchange of power between utilities. The work is to determine the
voltage magnitude, phase angle at the buses, real and reactive power of the transmission lines, to
help the system engineering during operation and future expansion of the network.
2.9 Power Flow Analysis of Abule-Egba 33KV Distribution Grid System with Real
Network Simulations
Load flows are required to analyze the steady state performance of the power system during
planning, design and operation of electrical power systems. These load flow studies can be done
using computer programs designed specifically for this purpose.According to (Abdulkareem, et
al, 2014) model and simulation are methods used to overcome the computational problems of
power flow solution using load flow iterative technique such as Newton-Raphson and Gauss-
Seidel. It needs a model based on real condition. The making of this model must be based on real
and valid data so that the model can represent real condition.
2.10 Analysis of the Load Flow Problem in Power System Planning Studies
In an electrical Power system, power flows from generating station to the load through different
branches of the network. According to (Afolabi, et al., 2015) states that the flow of active and
reactive power is known as load flow or power flow. Power flow analysis is an important tool
used by mostly power engineers for planning and determining the steady state operations of a
power system. Also (Mageshvaranet al., 2008) said that load flow studies is to determine the
various bus voltages/phase angles, active and reactive power flow through different branches,
generators, transformers, settings and load under steady state conditions. The power system is
modeled by an electric circuit which consist of generation, transmission and distribution
GSJ: Volume 8, Issue 3, March 2020 ISSN 2320-9186 708
GSJ© 2020 www.globalscientificjournal.com

networks. Elgerd, 2012 and Kothari and Nagreth, 2007, said that the main information obtained
from the load flow or power flow analysis consist of phase angles of load flow bus voltage and
magnitude, reactive powers and voltage phase angles of generator buses, real and reactive power
flow on transmission lines and power of the reference bus; other variables also being specified.
The load flow problem equations are non-linear and as such it requires iterative techniques such
as Newton- Raphson, fast decoupled and Gauss- seidel etc. in solving it. According to Aroop et
al., 2015 and Milano, 2009, the development of these methods mainlyled to the basic
requirement of load flow calculation such as convergence properties, memory requirement,
computing efficiency, convenience and flexibility of the implementation. However, it was
concluded that in planning of a power system, Gauss-Seidel method can be used especially for a
small system with less computational complexity due to the good computational characteristics it
exhibited. The effective and most reliable amongst the three load flow methods is the fast
decoupled method because it converges fast and is more accurate.
2.11 Application of Fast Decoupled Load Flow Method for Distribution Systems with
High R/X Ratio Lines
(Ochi, et al, 2013) in their view proposed 'a fast decoupled load flow calculation method for
distribution systems with high R/X ratio. The method was based on a coordinate transformation
in Y-matrix for Jacobian matrix in the load flow method. But comparing it with the Newton-
Raphson's method, it was found that a short computational time was realized although its
convergence characteristics worsen. In a bid to solve the problem, a coordinate transformation in
Y-matrix of the fast decoupled method for better convergence was employed (Ochi et al., 2013).
2.12 Impact of Distributed Generation on the Quality of Power Supply in Nigeria; Port
Harcourt Network Case Study
According to Ajabuego et al, (2017) in their work considered the impact of Distributed,
Generation (DG) on the quality of electricity supply in Port Harcourt network. They gave
GSJ: Volume 8, Issue 3, March 2020 ISSN 2320-9186 709
GSJ© 2020 www.globalscientificjournal.com

account on the impact of both the present and the future load demand. In achieving this, power
flow analysis and continuous power flow (CPF) optimization method was used to achieve the
simulation. The simulation was done using MATLAB 7.9 Power System Analysis Toolbox
(PSAT) Simulink environment to analyse thenetwork. The result shows that the dispersion level
of DG's among the buses increases, there was a very remarkable improvement in the voltage
profile, real and reactive power and load ability of the network.
2.13 Load Flow Analysis of Port Harcourt Electricity Network by Fast Decoupled and
Newton-Raphson Techniques
Ibeni (2017) in his work on Load Flow Analysis of Port Harcourt Electricity Network by using
Fast Decoupled and Newton-Raphson methods showed that the power dispatched from the
national grid network to the transmission substations were inadequate, and as such each injection
substation had percentage of loading of the power available.
From the simulation results, it showed that sufficient power is required from the grid to the
various injection substations via Port Harcourt Town (Z4) control transmission substation
because the lack of adequate power supply from the grid to the transmission substations down to
the distribution injection substations will result to power sharing and to address this anomaly it
was recommended that: The 33KV distribution network be expanded by installing more
transformers, protective systems, and capacitors banks as realized from the affected buses so as
to keep the desirable voltage limits; the injection substations for the network under consideration
should be made to operate at least 80 per cent of power supply to the secondary distribution
network; the reactive power demanded locally at the bus injection substation can be used to
minimize the line power loss associated with the network; there should be a periodic load flow
analysis carried out by the Electricity Distribution Company to ascertain the status of the
network without over stressing it.
GSJ: Volume 8, Issue 3, March 2020 ISSN 2320-9186 710
GSJ© 2020 www.globalscientificjournal.com

2.14 Comparison between Load Flow Analysis Methods in Power System using
MATLAB
According to Kriti (2014), in his work on the 'Comparison between Lord Flow Analysis,
Methods in Power System Using MATLAB'. He stated that the analysis, designing, and
comparison between different load flow system techniques such as Newton-Raphson, Gauss-
Seidel etc. in power system using MATLAB was done successfully and the desired results were
obtained. In Gauss-Seidel method, it was found that the rate of convergence was slow, it can be
easily programmed and the number of iterations increases directly with the number of buses in
the system whereas in the Newton-Raphson method, the convergence was very fast and the
number of iterations is independent of the size of the system; the solution is high as obtained. It
was stated as observed that in Newton Raphson method, convergence is not sensitive to the
choice of slack bus. In conclusion it was practical that only the Newton-Raphson and the Fast
decoupled load flow methods were the most popular methods. The fast decoupled load flow is
definitely superior to the Newton-Raphson method because of its speed and storage capability
(Kriti, 2014).
2.15 Load Flow Analysis Using ETAP Software for Network Simulation
Jayaprakash, et al, (2016) in their work on load flow analysis to investigate the performance of
electrical system during normal and abnormal operating conditions, provided information needed
to: minimize MW and MVar losses; optimize circuit usage; develop practical voltage profiles;
develop equipment specification guidelines and identifies transformer tap settings.ETAP is a
computer based software that simulates real time steady-state power system operations, enabling
the computation of system bus voltage profiles, real and reactive power flow and line losses etc.
(Jayaprakash, et al., 2016).
GSJ: Volume 8, Issue 3, March 2020 ISSN 2320-9186 711
GSJ© 2020 www.globalscientificjournal.com

ETAP offers the most accurate load flow analysis tools on the market, create and evaluate
electrical system designs effectively. ETAP calculate voltage drop and power losses and
efficiently build and evaluate system models using the advanced power flow analysis. ETAP
system models efficiently and effectively function such as automatic device evaluation, alarms
for critical and marginal units, a powerful results report comparison analyzer and intelligent, user
friendly graphics make it the most reliable load flow analysis software (Ahmed 2017).
ETAP load flow software provides results, power factors for each branch, directional currents
flows, and voltage drop calculations throughout each electrical system model. ETAP allows for
multiple grid connections, detailed generator modeling, solar turbines and induction generators
for radial and mesh networks. ETAP interactively utilizes multiple calculation methods in order
to calculate the best possible results.
2.16 Summary of Review Literature
The problem of power losses, voltage breakdown, voltage instability etc. are major concern
particularly to the distribution network at large. The rate of power voltages in the distribution
network is becoming an uncontrollable situation. The major contribution of this work is that, it
has identified the associated problems on the on the 33KV distribution network as a result of
overload which were captured via simulation of the existing network for the purpose of overload.
Based on the system overload analysis were made using optimal capacitor replacement method
by optimal of sizing of capacitor bank with the capacitor of 48000KVAR were used to
compensate the entire system network to improve the condition of the system (33kv distribution
network). De-coupled correction method should be used when installing capacitor bank in a
network.
GSJ: Volume 8, Issue 3, March 2020 ISSN 2320-9186 712
GSJ© 2020 www.globalscientificjournal.com

CHAPTER 3
MATERIAL AND METHOD
3.1 Materials
The major source of data for this research work was gotten from Port Harcourt Electricity
Distribution Company (PHEDC). Gathering/sourcing for an important task, various books,
thesis, publications and theories have been referred to. The data gathered are: installed capacity
of transmission substation, installed capacity of injection substation, examined feeders, total
number and power rating of distribution transformers and single line diagram of power
distribution network for Igwuruta Town, Port Harcourt (source, PHEDC)
Method: Fast decoupled method was used for computing bus voltages and the simulation on
each of the feeders was done using ETAP version 16.00 in order to improve the existing system
condition performance.
GSJ: Volume 8, Issue 3, March 2020 ISSN 2320-9186 713
GSJ© 2020 www.globalscientificjournal.com
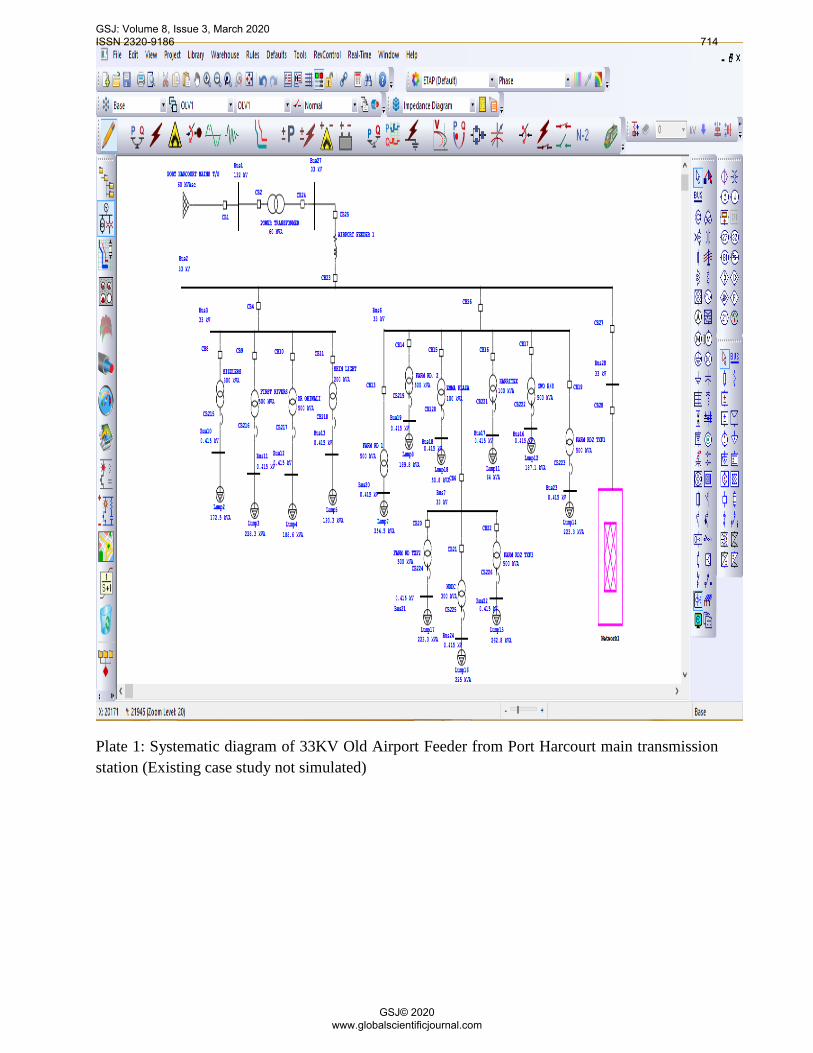
Plate 1: Systematic diagram of 33KV Old Airport Feeder from Port Harcourt main transmission station (Existing case study not simulated)
GSJ: Volume 8, Issue 3, March 2020 ISSN 2320-9186 714
GSJ© 2020 www.globalscientificjournal.com
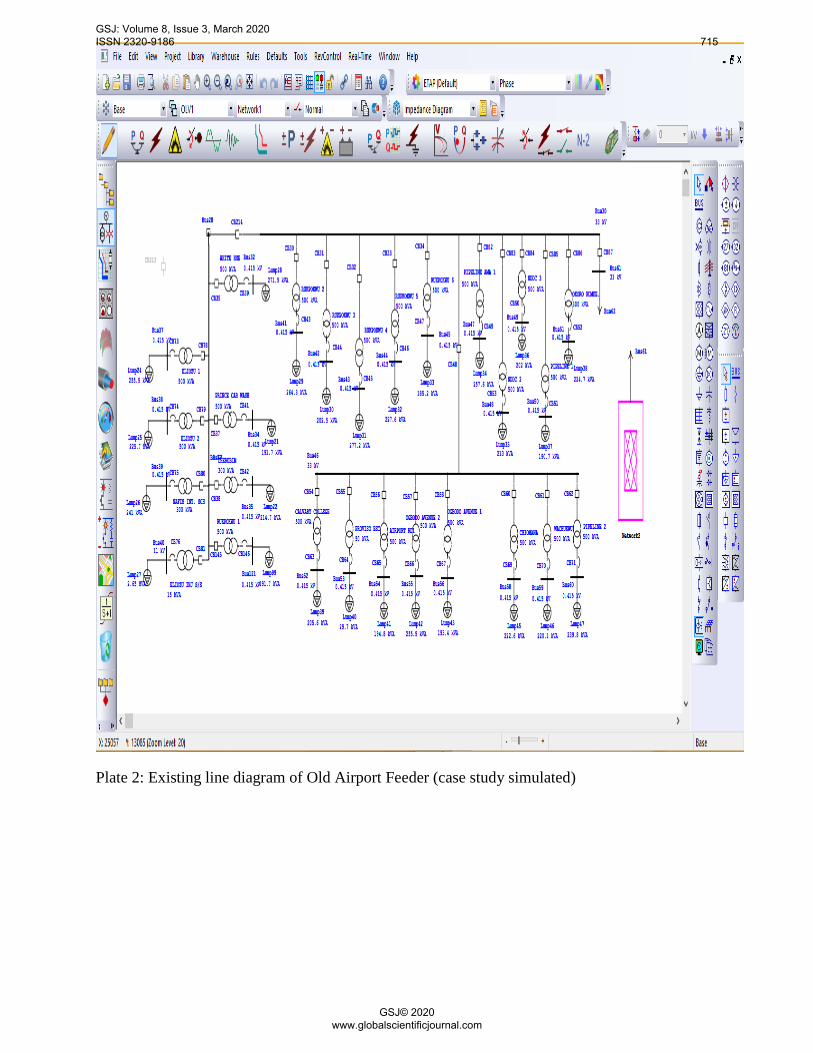
Plate 2: Existing line diagram of Old Airport Feeder (case study simulated)
GSJ: Volume 8, Issue 3, March 2020 ISSN 2320-9186 715
GSJ© 2020 www.globalscientificjournal.com
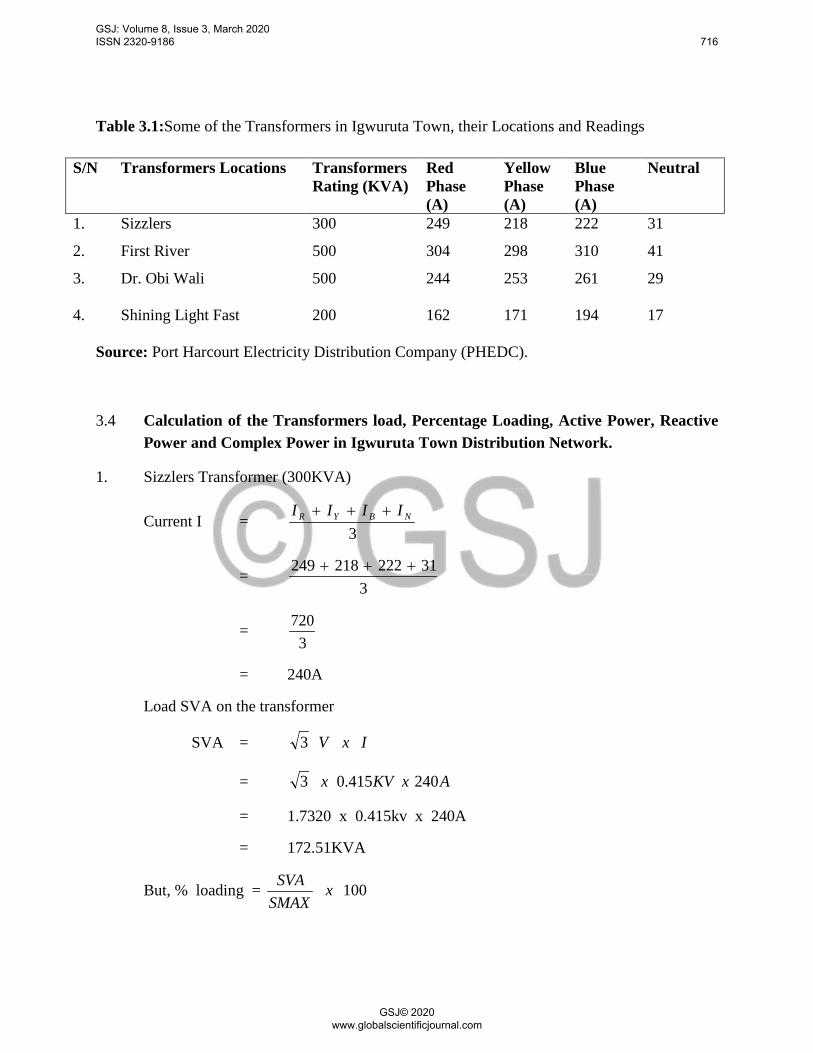
Table 3.1:Some of the Transformers in Igwuruta Town, their Locations and Readings
S/N Transformers Locations Transformers Rating (KVA)
Red Phase (A)
Yellow Phase (A)
Blue Phase (A)
Neutral
1. Sizzlers 300 249 218 222 31
2. First River 500 304 298 310 41
3. Dr. Obi Wali 500 244 253 261 29
4. Shining Light Fast 200 162 171 194 17
Source: Port Harcourt Electricity Distribution Company (PHEDC).
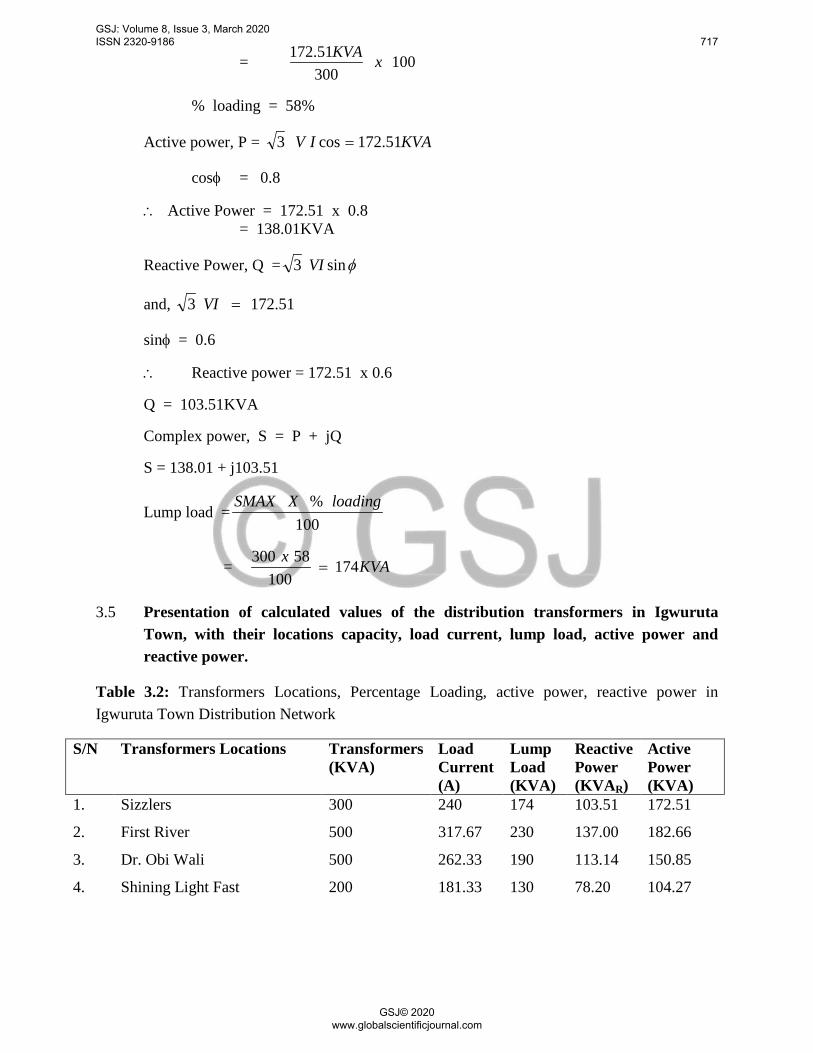
3.4 Calculation of the Transformers load, Percentage Loading, Active Power, Reactive Power and Complex Power in Igwuruta Town Distribution Network.
1. Sizzlers Transformer (300KVA)
Current I = 3
NBYR IIII +++
= 3
31222218249 +++
= 3
720
= 240A
Load SVA on the transformer
SVA = IxV3
= AxKVx 240415.03
= 1.7320 x 0.415kv x 240A
= 172.51KVA
But, % loading = 100xSMAX
SVA
GSJ: Volume 8, Issue 3, March 2020 ISSN 2320-9186 716
GSJ© 2020 www.globalscientificjournal.com
= 10030051.172 xKVA
% loading = 58%
Active power, P = KVAIV 51.172cos3 =
cosφ = 0.8
∴ Active Power = 172.51 x 0.8 = 138.01KVA
Reactive Power, Q = φsin3 VI
and, 51.1723 =VI
sinφ = 0.6
∴ Reactive power = 172.51 x 0.6
Q = 103.51KVA
Complex power, S = P + jQ
S = 138.01 + j103.51
Lump load =100
% loadingXSMAX
= KVAx 174100
58300=
3.5 Presentation of calculated values of the distribution transformers in Igwuruta Town, with their locations capacity, load current, lump load, active power and reactive power.
Table 3.2: Transformers Locations, Percentage Loading, active power, reactive power in Igwuruta Town Distribution Network
S/N Transformers Locations Transformers (KVA)
Load Current (A)
Lump Load (KVA)
Reactive Power (KVAR)
Active Power (KVA)
1. Sizzlers 300 240 174 103.51 172.51
2. First River 500 317.67 230 137.00 182.66
3. Dr. Obi Wali 500 262.33 190 113.14 150.85
4. Shining Light Fast 200 181.33 130 78.20 104.27
GSJ: Volume 8, Issue 3, March 2020 ISSN 2320-9186 717
GSJ© 2020 www.globalscientificjournal.com
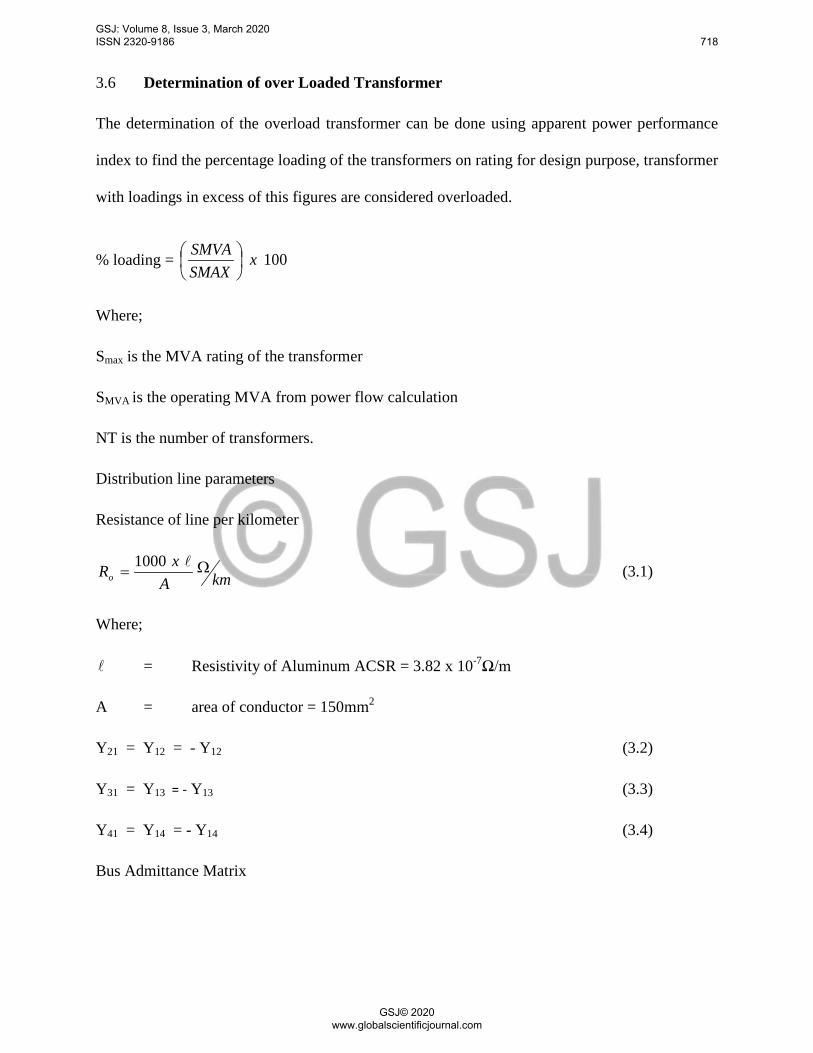
3.6 Determination of over Loaded Transformer
The determination of the overload transformer can be done using apparent power performance
index to find the percentage loading of the transformers on rating for design purpose, transformer
with loadings in excess of this figures are considered overloaded.
% loading = 100xSMAXSMVA
Where;
Smax is the MVA rating of the transformer
SMVA is the operating MVA from power flow calculation
NT is the number of transformers.
Distribution line parameters
Resistance of line per kilometer
kmAxRo
Ω=1000 (3.1)
Where;
= Resistivity of Aluminum ACSR = 3.82 x 10⁻⁷Ω/m
A = area of conductor = 150mm2
Y21 = Y12 = - Y12 (3.2)
Y31 = Y13 = - Y13 (3.3)
Y41 = Y14 = - Y14 (3.4)
Bus Admittance Matrix
GSJ: Volume 8, Issue 3, March 2020 ISSN 2320-9186 718
GSJ© 2020 www.globalscientificjournal.com

=
4441
3331
2221
14131211
YOOYOYOYOOYY
YYYY
Ybus (3.5)
From Ohm’s law the current entering only of the buses is given by;
[I] = [YBus [V] (3.6)
=
4
3
2
1
4441
3331
2221
14131211
4
3
2
1
VVVV
YOOYOYOYOOYY
YYYY
IIII
(3.7)
The current entering bus I1 is given by;
I1 = Y11 V1 + Y12 V2 + Y13V3 + Y14 V4 (3.8)
The current entering bus I2 is given by
I3 = Y21 V1 + Y22 V2 (3.9)
The current entering bus I3 is given by;
I3 = Y31 V1 + Y33 V3 (3.10)
The current entering bus I4 is given by;
I4 = Y41 V1 + Y44 V4 (3.11)
Complex power injected into bus I is given by;
*111
* IVjQPS =+= (3.12)
1*
11*
1IVjQPS =−= (3.13)
Therefore, from equation (3.13)
*1
111 V
jQPI −= (3.14)
Similarly, I2, I3 and I4 injected into bus 2, 3 and 4 is given as;
GSJ: Volume 8, Issue 3, March 2020 ISSN 2320-9186 719
GSJ© 2020 www.globalscientificjournal.com

*2
222 V
jQPI −= (3.15)
*3
333 V
jQPI
−= (3.16)
*4
444 V
jQPI −= (3.17)
Complex power injected into the ith bus is given as;
ijQPS += 11
*11 IV=
11*1 jQPS +=
1*
1 IV=
iii IVjQP *=−∴ (3.18)
But current entering the ith bus of anη bus system is given as;
nnn vyvyvyvyI ....31321211 +++=
kkk
VYI 11
1 ∑=
=η
(3.19)
Substitute I1 from equation (3.19) into equation (3.18)
Υ=− ∑
=kik
kVVjQP
η
1
*11 (3.20)
Let )()(),( 111*
ikkkkkk YYandVVVV θδδ ==−= (3.21)
Substitute equation (3.21) into equation (3.20).
)( 111
111 δθδη
−+=− ∑=
ikkkkk
VYVjQP (3.22)
GSJ: Volume 8, Issue 3, March 2020 ISSN 2320-9186 720
GSJ© 2020 www.globalscientificjournal.com

[ ])(sin)(cos 111111
11 δδθδδθη
−++−+=− ∑=
kikkkkkk
jVVYjQP
Separating the real and imaginary parts
Real power, )(cos111
1 ikikkkk
VVYP δδθη
−+= ∑=
(3.23)
Reactive power, )(sin11
1 ikikkikk
VVYQ δδθη
−+= ∑=
(3.24)
V1 = Bus voltage of bus i
P1 = Active power injected into ith bus
Q1 = reactive power injected into ith bus
Yik = Off diagonal element of the Y-buss matrix
Yii = Diagonal element of the Y-bus matrix
Vi = Voltage at bus η
FAST DECOUPLED METHOD
This method is the modification of newton – Raphson, which takes the advantage of the weak,
coupling between P - δandQ - /V/ due to the high X:R ratios. The Jacobian matric are obtained
after partial derivatives of equations (3.23) and (3.24) are expressed which gives linearized
relationship between angle. The equation can be written in matrix form as:
∆
∆
=
∆∆
VJJJJ
QP δ
42
31 (3.25)
Equation (3.25) is reduced to half by ignoring the element of J2 and J3, equation (3.25) is
simplified as;
∆
∆
=
∆∆
VJOOJ
QP δ
4
1 (3.26)
GSJ: Volume 8, Issue 3, March 2020 ISSN 2320-9186 721
GSJ© 2020 www.globalscientificjournal.com

Expanding equation (3.26) give two separate matrixes,
δδ
δ ∆
∂∂
∆∆PJP 1 (3.27)
vvPvJQ ∆
∂∂
∆∆ 4 (3.28)
δ∆−=∆ IBV
P
1
(3.29)
vBVQ II ∆−=
∆
1
(3.30)
B1 and B11 are the imaginary parts of the bus admittance, it is better to ignore all shunt connected
elements, as to make the formation of J1 and J4 simple. This allow for only one single matrix than
performing repeated inversion. The successive and voltage magnitude and phase angle changes
are;
[ ]VPB ∆
−=∆−11δ (3.31)
[ ]VQBV ∆
−=∆−111 (3.32)
3.7 Software Selection
ETAP is a fully graphical enterprise package that runs on Microsoft ® windows ® 2003, 2008,
2012, XP, vista, 7 and 8 operating systems. ETAP is the most comprehensive analysis tool for
the decision and testing of power systems available. Using its standard offline simulation
modules. ETAP can utilize real-time operating data for advanced monitoring, real – time
GSJ: Volume 8, Issue 3, March 2020 ISSN 2320-9186 722
GSJ© 2020 www.globalscientificjournal.com

simulation, optimization, energy management systems, and high – speed intelligent load
shedding.
ETAP enables engineers to handle the diverse discipline of power systems for a broad spectrum
of industries in one integrated package with multiple interface views such as AC and DC
networks, cable raceways, ground grid, GIS, panels, are flash, protective device
coordination/selectively and AC and DC control system diagram.
DESIGN CALCULATION OF CAPACITOR BANK
The analysis and the calculation of the size of capacitor bank to used is a major tool for power
improvement, therefore capacitor bank will assist to regulate, control and compensate for power
loss, reactive power losses and voltage profile inadequacy. The location of the capacitor bank
must be taken into consideration when depends of the location of the inductive loads and their
requested reactive power.
- Centralized correction: One capacitor bank installed near the main in coming
switchboard.
- Decoupled correction: Capacitor banks are installed hear distribution switchboards that
supply voltage to the main consumer responsible for the low power factor.
- Local correction: Capacitor banks are installed near individual consumers.
Presentation of collected data from the system network (Igwuruta network).
The following data were collected; Bus 2, Bus 3, Bus 4 from the simulated result, the total power
in KW
BUS 2
Capacitor Bank formular sizing for improve performance
GSJ: Volume 8, Issue 3, March 2020 ISSN 2320-9186 723
GSJ© 2020 www.globalscientificjournal.com

CKvar = kw (tan φ1 - tanφ2) (3.33)
Where,
Capacitor Bank in KVAr
Present power factor (Pf)1 = tan φ1
Desired power factor (Pf)2 = tanφ2
System frequency (f) = 50H2
From equation above, CKvar = kw (tan φ1 - tanφ2)
Total Active power KW
Present power factor (Pf)1 =0.8
Desired power factor (Pf)2 = 0.9
System frequency (f) = 50H2
From equation (3.33) CKvar = kw (tan φ1 - tanφ2)
cosφ1= 0.8
φ1 = cos-1 (0.8) = 36.87o
φ2 = cos-1 (0.9) = 25.84o
CKVar = 16959.410 (tan 36.87 – tan 25.84)
= 16959.410 (0.7500 – 0.4842)
= 16959.410 (0.2658)
= 4507.77KVar
GSJ: Volume 8, Issue 3, March 2020 ISSN 2320-9186 724
GSJ© 2020 www.globalscientificjournal.com

Table 3.3: Presentation of Calculated values of capacitor bank in each of the buses.
Bus ID Active power (KW)
Capacitor Bank (KVAr)
No. of capacitor bank/size (KVAr)
The sizes of capacitor bank per bus (KVAr)
Bus 2 16959.410 4507.77 400 x 12 4800
Bus 3 415.049 110.32 200 x 1 200
After the penetration of the capacitor bank in the Igwuruta network, the percentage of voltage
magnitude on Buses was improved. Bus 2: = 18.4%, Bus 3: = 18.4%, Bus 6: = 18.4%,
Bus 7: = 18.4%, Bus 27: =5.96%.
GSJ: Volume 8, Issue 3, March 2020 ISSN 2320-9186 725
GSJ© 2020 www.globalscientificjournal.com

CHAPTER 4
RESULTS AND DISCUSSION
Plate 8:Improved systematic line diagram of 33kv Old Airport Feeder (using capacitor bank).
GSJ: Volume 8, Issue 3, March 2020 ISSN 2320-9186 726
GSJ© 2020 www.globalscientificjournal.com

4.1 Presentation of result and discussion base on analytical methods are presented in
tabular and graphical form are shown below:
Plate 18:Plot of Bus Voltage Magnitude [Existing] and Bus Voltage Magnitude [Improved] Vs Bus Voltage Number.
Table 4.1: Bus Voltage Magnitude (Existing) and Bus Voltage Magnitude (Improved) against Bus voltage Number.
Bus 2 73.682 87.255
Bus 3 73.682 87.255
Bus 6 73.682 87.255
Bus 7 73.682 87.255
Bus 27 97.663 103.491
Bus 28 73.682 87.255
The above table shows the existing bus voltage magnitude and bus voltage magnitude
(improved) against the bus number.
73.682 73.682 73.682 73.682
97.663
73.682
87.255 87.255 87.255 87.255
103.491
87.255
B U S 2 B U S 3 B U S 6 B U S 7 B U S 2 7 B U S 2 8
BUS VOLTAGE MAGNITUDE AND IMPROVED VOLTAGE MAGNITUDE
VOLTAGE MAGNITUDE IMPROVED VOLTAGE MAGNITUDE
GSJ: Volume 8, Issue 3, March 2020 ISSN 2320-9186 727
GSJ© 2020 www.globalscientificjournal.com
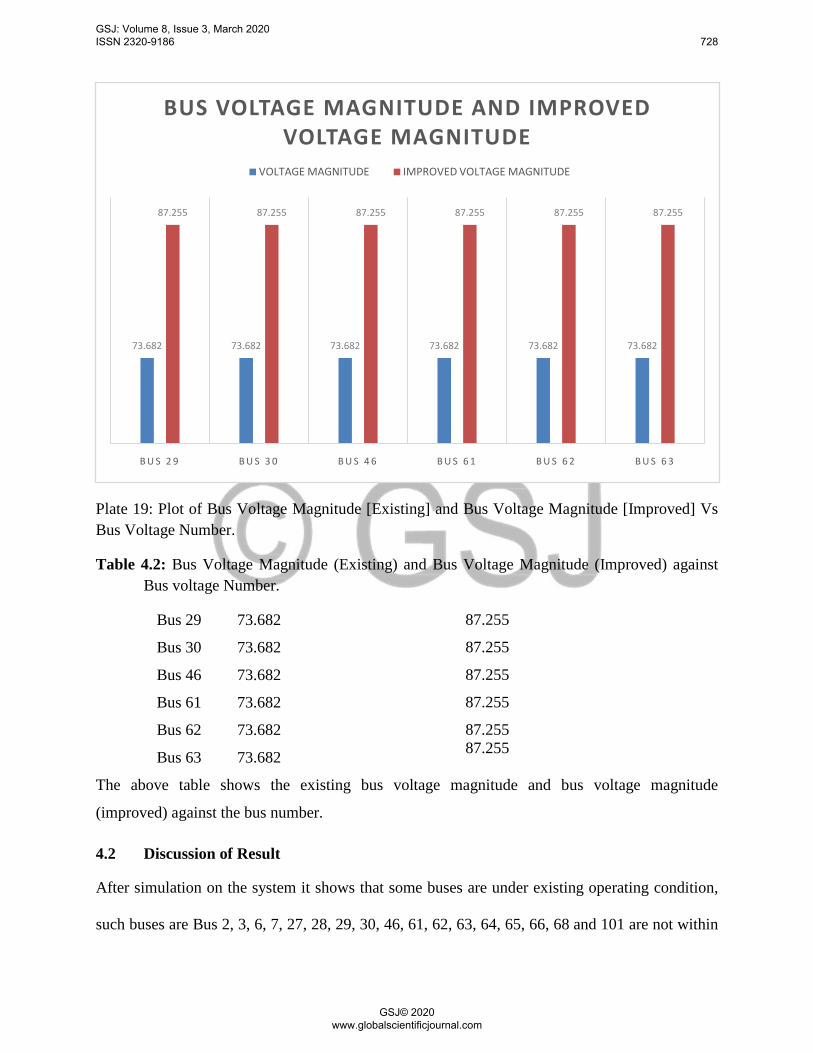
Plate 19: Plot of Bus Voltage Magnitude [Existing] and Bus Voltage Magnitude [Improved] Vs Bus Voltage Number.
Table 4.2: Bus Voltage Magnitude (Existing) and Bus Voltage Magnitude (Improved) against Bus voltage Number.
Bus 29 73.682 87.255
Bus 30 73.682 87.255
Bus 46 73.682 87.255
Bus 61 73.682 87.255
Bus 62
Bus 63
73.682
73.682
87.255 87.255
The above table shows the existing bus voltage magnitude and bus voltage magnitude
(improved) against the bus number.
4.2 Discussion of Result
After simulation on the system it shows that some buses are under existing operating condition,
such buses are Bus 2, 3, 6, 7, 27, 28, 29, 30, 46, 61, 62, 63, 64, 65, 66, 68 and 101 are not within
73.682 73.682 73.682 73.682 73.682 73.682
87.255 87.255 87.255 87.255 87.255 87.255
B U S 2 9 B U S 3 0 B U S 4 6 B U S 6 1 B U S 6 2 B U S 6 3
BUS VOLTAGE MAGNITUDE AND IMPROVED VOLTAGE MAGNITUDE
VOLTAGE MAGNITUDE IMPROVED VOLTAGE MAGNITUDE
GSJ: Volume 8, Issue 3, March 2020 ISSN 2320-9186 728
GSJ© 2020 www.globalscientificjournal.com

the acceptable normal voltage of ± 5% of the dealed voltage as a result of overloading, poor
transmission feeders, power or inefficient voltage control system due to lack of planning, faulty
distribution system on the part of the electrical supplier (PHED) and as such case it creates
voltage instability in the system network. The examination of the 33kv distribution network
revealed the effect of poor power quality on the expected voltage of the distributed line in the
study case Igwuruta, especially, the case of overload on the existing transformers and cables.
However, to improve the distribution network capacitor bank was used to reduces loss (I2 R loss)
associated with transmission and distribution of the current to the consumer’s loads, improve
voltage regulation, quality of power, power factor, voltage profile of the system. Therefore,
capacitor bank will assist to regulate control and compensate for power loss, reactive power
losses and voltage profile inadequacy.
To improve the efficiency of the system two (2) capacitor bank rated at 16000KVAR each were
optimally sized and allocated to support the voltage at the critical buses (bus 62 and 63) in order
to enhanced power system operation by minimizing losses and improve the profile of the
voltage. It will also helped to enhanced power flow on the critical part of the system network.
Therefore, the problem of voltage fluctuation and harmonies can be overcome by the penetration
of the FACTS-controller. A flexible AC transmission system consisting of power electronic
devices along with power system devices to enhance the controllability and stability of the
distribution system and increase the power transfer capabilities. After the penetration of the
capacitor bank in the Igwuruta network, the percentage of voltage magnitude on Buses was
improved. Bus 2: = 18.4%, Bus 3: = 18.4%, Bus 6: = 18.4%, Bus 7: = 18.4%, Bus 27: =5.96%.
GSJ: Volume 8, Issue 3, March 2020 ISSN 2320-9186 729
GSJ© 2020 www.globalscientificjournal.com

CHAPTER 5
CONCLUSION AND RECOMMENDATIONS
5.1 Conclusion
After careful examination of the study case (Igwuruta 33kv distribution network), the research
work showed that the existing state of the electrical power network of Iguruta 33kv distribution
network taking its supply of power from 33kv Airport feeder that was transmitted from Port
Harcourt main in Trans-Amadi. The research was modeled in Electrical Transient Analyzer
Programme (ETAP 16.00 version) with the application of power flow equation, voltage equation
sizing of capacitor equation etc, for reason of ascertaining the system (network) conditions in the
areas of voltage stability (whether there is a strong mismatch between nominal declared voltage
with regards to IEE regulation and the existing operating voltage) in order into enhance system
performance.
Importantly, the study engaged optimal capacitor placement of improving system overload by
determining the optimal size of capacitor bank required to improve the specific bus overload
problem of the system (network in a view to enhance power quality, voltage profile and power
factor. The fixing of the sized capacitor bank at the affected buses improved the voltage profile
and performance on the network. After the penetration of the capacitor bank in the Igwuruta
network, the percentage of voltage magnitude on Buses was improved. Bus 2: = 18.4%, Bus 3: =
18.4%, Bus 6: = 18.4%, Bus 7: = 18.4%, Bus 27: =5.96%.
Sequel to the findings, it is deduced that power flow studies are key for future planning of power
system expansion as well as determining the best and reliable operating condition of the existing
system.
GSJ: Volume 8, Issue 3, March 2020 ISSN 2320-9186 730
GSJ© 2020 www.globalscientificjournal.com

5.2 Recommendations
Based on the analysis and findings, the following recommendations are pointed out to ensure
optimal performance and reliability of the 33kv distribution.
- Replacement of undersized cables in the network.
- Fixing capacitor bank compensator where necessary in order to reduce voltage instability
problems, electricity cost due to excessive losses.
- Periodic load flow analysis should be carried out by the Port Harcourt Electricity
Distribution Company (PHEDC) to know the status of the network without over stressing
the system (ETAP 16.00 software).
- Additional 500KVA transformer should be added in the network especially to where the
system experiences critical overload.
GSJ: Volume 8, Issue 3, March 2020 ISSN 2320-9186 731
GSJ© 2020 www.globalscientificjournal.com

REFERENCES
Abdulkareem, A., Awosope, C.O.A., Orovwode, H.E., &Adekakum, A.A (2014).Power Flow Analysis ofAbule-Egba 33KV Distribution Grid System with Real Network Simulations.OSR Journal of Electrical and Electronics Engineering 2(9), 67-80.
Abungun&Kipkirui K.S., (2009). Decoupled Load flow study method.University of Electrical
and Information Engineeringhttp://ere.unonbi.ac.ke Afolabi, O.A., Ali, W.H, Cofie, P., Fuller, J., Obiomon, P. &Kolawole, E.S (2015).Analysis of
the Load Flow Problem in Power System Planning Studies.Energy and Power Engineering, 7(10), 509-523.
Ahmed, A.S.H (2013). Simulation and Modelling of Detailed Load Flow Analysis for the
40KV and 132KVA Iraqi Grid, Journal of Engineering, 19 (10), 1-14. Ajabuego, O. G., Okafor , E. C. N., Izuegbunam, F., &Olubiwe, M. (2017). Impact of
Distributed Generation on the Quality of Power Supply in Nigeria; Port Harcourt Network Case Study.
Aroop, B., Satyajit, B. &Sanjib, H. (2014);.Power Flow Analysis on IEEE 57 Bus System
Using Matlab, International Journal & Engineering Research Technology. http://dx.dol.org/10.4236/epe.2015.71Q048.
Barboza, L, Dimuro, G. &Reiser, R. (2004).Poiver Flow with Load
Uncertainty.TendeciasemMatemeticaAplicadaecomputational, Bayan, M.E. Wu F.F. “Optimal Sizing of Capacitors Placed on a radial Distribution system”,
IEEE Transaction on Power Delivery, Vol. 4, No. Pp. 196 – 200. Brown, H.E (2013). Solution of Large Network by Matrix Methods, 2nd ed, Baghdad: JOHN
WIELY & SONS, INC. Chen, P., Chen, Z., &Bak-Jensen, B. (2008).Probalistic Load Flow: A Review. 2008 Third
International Conference in Electric Utility Deregreletion as restructuring and Power Technologies. doi:10.1109/drpt.2008.4523658.
Chiang, H.D.: “A Decoupled Load Flow Method for Distribution Power Network Algorithms,
Analysis and Convergence Study.” Electrical Power and Energy System, 13(3), 130 – 138, 1991.
Chiany et al “More Load Flow Fractals” Proceedings of the 29th IEEE Conference on Decision
and Control, 1990. doi:10.5540/tema.2004.05.01.0027. Elgerd, O.L. (2012). Electric Energy System Theory.An Introduction (2nd ed.) New York: Mc-
Graw-Hill.
GSJ: Volume 8, Issue 3, March 2020 ISSN 2320-9186 732
GSJ© 2020 www.globalscientificjournal.com

Goswami, S.K. and Basu, S.K. Direct Solution of Distribution Systems, IEE Proc. C., 188(1), Pp.
9 – 13, 1991. Ibeni, C, (2017). Load Flow Analysis of Port Harcourt Electricity Network by Fast Decoupled
and Newton- Raphson Techniques. Izuegbunam, F. L., Duruibe, S.I., &Ojukwu G.G (2011).Power Flow and Contingency
Assessment Simulation on the expanding 330KV Nigeria Grid Using Power World Simulator, Journal of Emerging Trends on Engineering as Applied Science, 2, 1002-1008.
Jabr, R.A, Singh, R., & Pal, B.C (2012).Minimum Loss Network Reconfiguration Using Mixed-
Integer Convex Programming.IEEE Transactions on Power Systems, 27(2), 1106-1115. Jayaprakash, J; Angelin,P.M; Jothilakshmi, R.&Juanola, P. J.(2016). Planning andCoordination
of Relay in Distribution System using ETAP. Pakistan journal of Biotechnology, 13(5), 252-256.
Klingman W. R &HimmdBlau D.M (2008), Nonlinear Programming with the aid of a multiple –
gradient, Summation. TechniqueJournal of the ACM, 11(4), 400-415 Doi: 101145/321239. 321241.
Kothari, I.J., &Nagrath, D.P. (2007).Modern Power System Analysis (3rd Ed.) New York: Mc-
Graw-Hill. Kriti, S. (2014).Comparison between Load Flow Analysis Methods in Power System using
MATLAB. International Journal of Scientific & Engineering Research, 5 (5),l-8Retrieved from http://www.ijser.org 6th, November 2017.
Li H., Zhang. A., Shen X., &Xu, J (2014).A Load Flow Method for Weekly Meshed Distribution
Networks Using Powers as Flow Variables.International Journal of Electrical Power & Energy for Energy System, 22(5), 375-350.
Mageshvaran, R., Jacob Raglend, Yuvaraj, V., Rizwankhan, P, Vijayakumar, T.,
&Sudheera.(2008). Implementation of non-Traditional Optimization Techniques (PSO, CPSO, HDE) for the Optimal Load Flow Solution. TEN CON 2008-2008 IEEE Regun 10 Conference, 19-21, doi:10.1109/tencon.2008.4766830).
Milano, F. (2009).Continuous Newton's Method for Power Flow Analysis IEEE Transactions on
Power Systems, 24(1), 50-57.
GSJ: Volume 8, Issue 3, March 2020 ISSN 2320-9186 733
GSJ© 2020 www.globalscientificjournal.com