Effects of Varieties and Population of Soybean Intercropped ...
11
Journal of Plant Sciences 2021; 9(4): 128-138 http://www.sciencepublishinggroup.com/j/jps doi: 10.11648/j.jps.20210904.12 ISSN: 2331-0723 (Print); ISSN: 2331-0731 (Online) Effects of Varieties and Population of Soybean Intercropped with Maize on Yield and Yield Components of Associated Crops Negasa Dangia 1 , Zerihun Jalata 2, * , Gerba Daba 3 1 Oromia Agricultural Office, Wama-Hagelo District Office, Wama Hagalo, Ethiopia 2 Department of Plant Sciences, Faculty of Agriculture, Wollega University, Nekemte, Ethiopia 3 Department of Horticulture and Plant Science, College of Agriculture and Veterinary Medicine, Jimma University, Jimma, Ethiopia Email address: * Corresponding author To cite this article: Negasa Dangia, Zerihun Jalata, Gerba Daba. Effects of Varieties and Population of Soybean Intercropped with Maize on Yield and Yield Components of Associated Crops. Journal of Plant Sciences. Vol. 9, No. 4, 2021, pp. 128-138. doi: 10.11648/j.jps.20210904.12 Received: August 19, 2020; Accepted: September7, 2020; Published: July 15, 2021 Abstract: Cereal-legume intercropping practices improve the sustainability of production and productivity. However, identification of suitable crop and plant density of the component crops is essential. A field experiment was conducted to evaluate the varietal effects of soybean intercropped with maize and the effect of plant densities of soybean varieties intercropped with maize on yield and yield components of associated crops and the productivity of the system at Wama- Hagelo District, western Ethiopia during 2019. Maize variety ‘P1238W’ (Limu) was intercropped with three varieties of soybean (‘Jalale,’ ‘Boshe’ and local) in a factorial combination of three populations densities of 25%, 50%, and 75% of the recommended population density along with the sole crops of the irrespective varieties of soybean and maize in randomized complete block (RCB) design with three replications. Data was collected on growth, yield and yield related parameters on both crops. The result revealed a plant density of intercropped soybean varieties significantly (P<0.01) affected yield and yield components of maize. Highest values for the number of ears per plant (1.88) and grain yield (7.19 tha -1 ) of maize were obtained from 25% soybean population and particularly from variety ‘Boshe’ for grain yield. Moreover, plant population and soybean variety significantly (P<0.01) affected grain yield of soybean showing the highest grain yield (1.58 tha -1 ) of soybean was recorded for variety ‘Boshe’. Generally, the highest LER (Land equivalent ratio) of grain yield (1.65 tha -1 ) and highest net benefit (44491.40 ETB (Ethiopian Birr) or∼1334.7USD ha -1 ) obtained from maize intercropped with ‘Boshe’ variety at a population of 50% revealing intercropping maize with ‘Boshe’ soybean at 50% plant population found to be appropriate to achieve high productivity. Keywords: Cropping System, Crop Productivity, Intercropping, Maize, Soybean, Yield 1. Introduction Low crop productivity and rapid population growth is the main problem facing sub-Saharan Africa including Ethiopia. To feed the ever-increasing human population and accomplish the increasing demand for agricultural products, agricultural production and productivity must be increased beyond the current level [1]. Therefore, to enhance and sustain agricultural productivity with minimum degradation of natural resources, the efficient use of available growth resources is imperative. Hence, in order to ensure both food security and environmental quality, it is essential to seek best management practices, which include appropriate cropping systems that can efficiently utilize solar and soil resources with minimum nutrient inputs [2, 3]. Intercropping is the agricultural practice of cultivating two or more crops in the same space at the same time [4]. Intercropping is a common practice in many areas of Africa as a part of traditional farming systems commonly implemented due to declining land sizes and food security problems [5, 6]. It is also considered as a means to address some of the major problems associated with modern
-
Upload
khangminh22 -
Category
Documents
-
view
3 -
download
0
Transcript of Effects of Varieties and Population of Soybean Intercropped ...

Journal of Plant Sciences 2021; 9(4): 128-138
http://www.sciencepublishinggroup.com/j/jps
doi: 10.11648/j.jps.20210904.12
ISSN: 2331-0723 (Print); ISSN: 2331-0731 (Online)
Effects of Varieties and Population of Soybean Intercropped with Maize on Yield and Yield Components of Associated Crops
Negasa Dangia1, Zerihun Jalata
2, *, Gerba Daba
3
1Oromia Agricultural Office, Wama-Hagelo District Office, Wama Hagalo, Ethiopia 2Department of Plant Sciences, Faculty of Agriculture, Wollega University, Nekemte, Ethiopia 3Department of Horticulture and Plant Science, College of Agriculture and Veterinary Medicine, Jimma University, Jimma, Ethiopia
Email address:
*Corresponding author
To cite this article: Negasa Dangia, Zerihun Jalata, Gerba Daba. Effects of Varieties and Population of Soybean Intercropped with Maize on Yield and Yield
Components of Associated Crops. Journal of Plant Sciences. Vol. 9, No. 4, 2021, pp. 128-138. doi: 10.11648/j.jps.20210904.12
Received: August 19, 2020; Accepted: September7, 2020; Published: July 15, 2021
Abstract: Cereal-legume intercropping practices improve the sustainability of production and productivity. However,
identification of suitable crop and plant density of the component crops is essential. A field experiment was conducted to
evaluate the varietal effects of soybean intercropped with maize and the effect of plant densities of soybean varieties
intercropped with maize on yield and yield components of associated crops and the productivity of the system at Wama-
Hagelo District, western Ethiopia during 2019. Maize variety ‘P1238W’ (Limu) was intercropped with three varieties of
soybean (‘Jalale,’ ‘Boshe’ and local) in a factorial combination of three populations densities of 25%, 50%, and 75% of the
recommended population density along with the sole crops of the irrespective varieties of soybean and maize in randomized
complete block (RCB) design with three replications. Data was collected on growth, yield and yield related parameters on both
crops. The result revealed a plant density of intercropped soybean varieties significantly (P<0.01) affected yield and yield
components of maize. Highest values for the number of ears per plant (1.88) and grain yield (7.19 tha-1
) of maize were
obtained from 25% soybean population and particularly from variety ‘Boshe’ for grain yield. Moreover, plant population and
soybean variety significantly (P<0.01) affected grain yield of soybean showing the highest grain yield (1.58 tha-1
) of soybean
was recorded for variety ‘Boshe’. Generally, the highest LER (Land equivalent ratio) of grain yield (1.65 tha-1
) and highest net
benefit (44491.40 ETB (Ethiopian Birr) or∼1334.7USD ha-1
) obtained from maize intercropped with ‘Boshe’ variety at a
population of 50% revealing intercropping maize with ‘Boshe’ soybean at 50% plant population found to be appropriate to
achieve high productivity.
Keywords: Cropping System, Crop Productivity, Intercropping, Maize, Soybean, Yield
1. Introduction
Low crop productivity and rapid population growth is the
main problem facing sub-Saharan Africa including Ethiopia.
To feed the ever-increasing human population and
accomplish the increasing demand for agricultural products,
agricultural production and productivity must be increased
beyond the current level [1]. Therefore, to enhance and
sustain agricultural productivity with minimum degradation
of natural resources, the efficient use of available growth
resources is imperative. Hence, in order to ensure both food
security and environmental quality, it is essential to seek best
management practices, which include appropriate cropping
systems that can efficiently utilize solar and soil resources
with minimum nutrient inputs [2, 3].
Intercropping is the agricultural practice of cultivating
two or more crops in the same space at the same time [4].
Intercropping is a common practice in many areas of Africa
as a part of traditional farming systems commonly
implemented due to declining land sizes and food security
problems [5, 6]. It is also considered as a means to address
some of the major problems associated with modern

Journal of Plant Sciences 2021; 9(4): 128-138 129
farming including moderate yield, pest and pathogen
accumulation, soil degradation and environmental
deterioration, thereby helping to deliver sustainable and
productive agriculture [4, 7]. Intercropping is an example of
sustainable agricultural systems that contribute to achieving
ecological balance, more utilization of available growth
resources such as nutrients, water and light, and a way to
increase diversity in the agricultural ecosystem [8, 9].
According to Seran and Brintha [10] intercropping systems
control soil erosion by preventing raindrops from hitting the
bare soil, offers greater financial stability than sole
cropping. That means intercropping allows high insurance
against crop failure, notably in environments known for
heavy weather conditions like frost, flood, drought, and
overall provides high financial stability for farmers [4].
Maize based intercropping system with legume helps in
improving soil health as well as the yield of the crop [11] but
competition among mixtures and population densities of the
component crops in cereal legume intercropping is the major
aspect affecting yield as compared with sole cropping of
cereals [12]. On the other hand, soybean is the primary
source of edible oil globally with the highest gross output of
vegetable oil (20%) and protein (40%) which can substitute
other pulse crops and animal products such as meat and milk
[13]. Though soybean is recently introduced in Ethiopia,
soybean has grown very fast with a national average yield of
2.1tha-1
. Its productivity depends on varietal selection,
population density including when grown as intercrop.
Comparative analyses of various crops intercropped with
soybean have indicated that maize is the best partner in a
soybean intercropping system [14].
In Ethiopia, maize is one of the most important major
food crops among cereal, ranking second after teff in area
coverage and first in production and productivity with a
national average yield of 3.7 ton ha-1
[13]. Economically
viable intercropping largely depends on adaptation of
intercrop pattern and selection of compatible crops that
maximize positive interaction and minimize competition
[15]. One of the key factors successful for intercropping is
proper plant density, which depends on the plant species
as well as the particular varieties used [16]. However,
currently in southwestern Ethiopia, sole cropping of the
maize crop is widely practiced though there is a shortage
of arable land and greater benefits of intercropping maize
with legumes, particularly with soybean [17]. Therefore,
to utilize the resources efficiently and improve
productivity, the information on maize-soybean
intercropping as well as, varietal selection and planting
density with intercropping is an important knowledge gap
that requires investigation in the study area. Thus, this
study was designed with the objectives of determining the
varietal effects of soybean (Glycine max L.) intercropped
with maize (Zea mays L.) and the effect of plant densities
of soybean varieties intercropped with maize on yield and
yield components of associated crops and the productivity
of the system.
2. Materials and Methods
2.1. Study Area
Field experiment was conducted during 2019 main
cropping season under the rainfed condition at Wama Hagelo
District, Bata Kusaye Farmers Training Center (FTC),
located in Oromia Regional State, in East Wollega Zone,
West Ethiopia at a distance of 322 km from Addis Ababa.
The site is located at latitude of 8°55'7''N and 36°55'55'' E,
with an elevation of 1609 meters above sea level. It has a
warm humid climate with an average minimum and
maximum temperature of 18 and 27°C, respectively, and
receives an average annual rainfall of 1500 mm - 2200 mm
which covers from April to October. The soil type of the
experimental site was reddish-brown and its pH is 5.82. The
area was characterized by maize dominant based farming
system and crop-livestock mixed farming system in which
cultivation of maize, sorghum, and niger seed are the major
crops grown in the area (Wama-Hagelo District Agriculture
and Natural Resource Office, 2019 unpublished).
2.2. Description of Experimental Materials
Improved maize variety (‘P 3812 W’) was used as the
main crop which is adapted to the area and high yielding and
more preferred by farmers of this area. And three soybean
varieties namely ‘Boshe’, ‘Jalale’ (introduced from Bako
Agricultural Research Center), and local (obtained from
Bata-Kusaye FTC) were used similarly with high yield
potential and adapted to an altitude of 1200-1900 m above
sea level [18]. Thus, the experiment consisted of two factors
namely soybean varieties (‘Jalale’, ‘Boshe’, and local variety)
and plant populations (25%, 50%, and 75% of the sole
population of each variety, which is 250,000 plants ha-1
) and
each soybean variety was intercropped with maize.
2.3. Experimental Design, Treatments and Layout
The treatment consisted of planting of maize at density of
100% of sole crop with three common bean varieties
(‘Jalale’,’Boshe’ and local variety) at the density of 25%
(62,500 plants ha-1), 50% (125,000 plants ha-1) and75%
(187,500 plantsha-1).
The plot of both sole and intercropped maize and soybean
had a size of 4.2 m * 6 m=25.2 m2. Generally, the total plot
of the experiment had a size of 66.6 m * 21 m=1398.6 m2.
The soybean varieties were sown in between rows of maize
with a spacing of 37.5 cm far from each maize row, by
maintaining 5, 10, and 15 cm intra row spacing for 75%, 50%,
and 25%, respectively. The intra-row spacing for soybean
varieties was adjusted according to planting density in the
system. Hence, the soybean population ha-1
used in the
intercrop for 75%, 50% and 25% was 187,500, 125,000 and
62,500 plants, respectively. Sole maize and soybean were
planted at their optimum plant densities of 44,444 and
250,000 plants ha-1
, respectively. Sole maize was planted in a
row of 75 cm x 30 cm and sole soybean was planted by
maintaining 40 cm and 10 cm inter and intra row spacing,

130 Negasa Dangia et al.: Effects of Varieties and Population of Soybean Intercropped with Maize on
Yield and Yield Components of Associated Crops
respectively. There were nine rows of maize in each plot;
each row had a length of 4.2 m and a width of 6 m. The
middle seven rows were used for data collection. The spacing
between adjacent replication was 1.5 m and that of the
adjacent plot was 1 m. The experiment was laid out in RCB
design a factorial arrangement of two factors of soybean
varieties and plant populations with three replications. The
experiment consisted of two factors namely soybean varieties
and plant populations. Each soybean variety was
intercropped with maize. The experiment consisted of 13
treatments and 39 plots. Each treatment was randomly
assigned to the experimental unit within a block. The three
soybean varieties were intercropped with maize in the
combination as shown in Table 1.
Table 1. Treatment combinations.
No. Treatment combination Description Plant populations
1 100M, 25B 100% maize + 25% Boshe (62,500) 62,500
2 100M, 50B 100% maize + 50% Boshe (125,000) 125,000
3 100M, 75B 100% maize + 75% Boshe (187,500) 187,500
4 100 M, 25J 100% maize + 25% Jalale (62,500) 62,500
5 100M, 50J 100% maize + 50% Jalale (125,000) 125,000
6 100M, 75J 100% maize + 75% Jalale (187,500) 187,500
7 100M, 25L 100% maize + 25% Local (62,500) 62,500
8 100M, 50L 100% maize + 50% Local (125,000) 125,000
9 100M, 75L 100% maize + 75% Local (187,500) 187,500
10 0M, 100B Sole Boshe 250,000
11 0 M, 100J Sole Jalale 250,000
12 0M, 100L Sole Local 250,000
13 100M Sole maize 44,444
M=Maize, B=’Boshe’ soybean variety, J=’Jalale’ soybean Variety and L=Local variety of soybean, Total plot area=66.6m*21m=1398.6m2
2.4. Experimental Procedure and Field Management
In order to achieve better seedling establishment, the land
was plowed and leveled before planting using local oxen
plough. Two seeds were planted per hill and later on
seedlings were thinned to one plant per hill two weeks after
emergence and soybean varieties were sown at 15 days
during maize thinning. At time of planting both sole and
intercropped maize received 100 kg ha-1
of NPS (19N-
38P2O5- 7SO4) and 75 kg ha-1
of Urea was applied uniformly
into all plots. All the NPS were applied at planting, while
urea (150 kg ha-1
) was applied in two splits (75 kg ha-1
) at
planting and the remaining half (75 kg ha-1
) at 40 days after
sowing). For sole soybeans, 100 DAP kg ha-1
was applied at
the time of sowing. Urea (N) was not applied into sole
soybean assuming the soybean could benefit from self-fixed
nitrogen. All cultural practices were applied in accordance to
the recommendation. Both maize and soybean were
harvested from the net plot after they attained their normal
physiological maturity and they were threshed manually.
2.5. Data Collection Procedures
2.5.1. Maize Components
Phenological and growth parameters of Maize: Data on
days to 50% tasselling for maize was taken on the number of
days from planting to 50% of the plants produced tassel
and/or silk. Days to 90% physiological maturity was
recorded when 90% of the plants reached black layer
formation stage [19]. Plant height for maize was measured at
silking stage from five randomly taken plants per net plot and
the average was taken for analysis. Leaf length was measured
from the ligule to apex for all five randomly selected plants
after anthesis and the average was recorded for the plot. Leaf
width was measured at the widest point along its length for
all five randomly selected plants after anthesis and the
average was recorded for the plot. Leaf area of five randomly
taken plants from net plot area was determined at 50% of
tasseling stage using the method described by Sticker et al.
[20] as leaf area=leaf length x maximum width of leaf x 0.75.
Leaf area index was calculated by dividing the leaf area of
five plants to the ground area occupied by the plant [19].
Yield and Yield Related characters of Maize: The ear
length of ten randomly selected plants were measured using a
ruler after harvest and the average was recorded for the plot.
Ear diameter of ten randomly selected plants was measured
using ruler after harvest and the average was recorded for the
plot [19]. Hundred kernel weights were determined by
counting the number of kernels from a bulk of shelled seed
and weighing it using sensitive balance from a plot at harvest
after adjusting to 12.5% moisture content. Grain yield was
determined for the net plot after shelling and the moisture
content was adjusted to 12.5%. Above-ground dry biomass
was taken after sun drying for 20 days samples of plants from
net plot [21]. Harvest index was calculated as the ratio of
grain yield to the weight of above-ground dry biomass.
2.5.2. Soybean Components
Phenological and growth Parameters of Soybean: Days
to 50% flowering and days to 90% physiological maturity
was determined as the number of days from sowing to the
time when 50% of the plants started to flowering and 90%
physiological maturity based on visual observation. The
number of primary branches were determined by counting
the total number of primary branches from ten randomly
taken plants at physiological maturity and measured from
the ground level to the tip of the main stem by linear
meter.
Yield and Yield Related Parameters of Soybean: Number
of pods per plant was recorded by visual counting the pods of

Journal of Plant Sciences 2021; 9(4): 128-138 131
ten randomly selected soybeans in each net plot. And the
number of seeds per pod was recorded by visual counting the
seeds of ten randomly taken pods in each net plot at maturity
and the final stand count was expressed in percent of the
initial count to determine the loss in stand count due to
competition. Above-ground dry biomass of the ten randomly
taken plants were measured after sun drying at physiological
maturity. Seed yield was recorded from the net plot area of
each plot after sun drying for 10 days to the designated
moisture content of 10% [22]. The weight (g) of 100 seeds
were taken from seeds of each net plot at a moisture content
of 10% and harvest index was also calculated.
System productivity: The system productivity of
component crops were determined in terms of land
equivalent ratio (LER) and Monetary advantage (MA). LER
is defined as the relative land area required as a sole crop to
produce the same yields as intercropping [23]. The LER from
the yield of maize and soybean crop would be used to
evaluate the productivity of intercropping versus sole
cropping. Land Equivalent Ratio (LER) is the most common
index adopted in intercropping to measure land productivity.
LER was computed as follows:
Monetary advantage (MA) was calculated from the yield
of maize and soybean to measure the productivity and
profitability of intercropping as compared to sole cropping of
the associated component crops [23]. Monetary returns
values were estimated based on the market price of produce
(maize and soybean) during the harvest period. Accordingly,
MV was calculated by multiplying yields of the component
crops by their respective current market price for all varieties
of soybean and maize yield. MA was calculated as described
by Willey [24].
Soil Sampling and Analysis: Representative soil samples at
a depth of 0-30 cm were taken randomly both before planting
and after harvesting to determine some selected soil
physicochemical properties. The samples were taken
randomly in a zigzag pattern from 12 points across the
experimental field and from the whole plots before planting
and after harvesting respectively. The soil samples were air
dried and ground to pass through 2 mm mesh size sieve. The
composite soil samples were analyzed at Nekemte Soil
Research Center for determination of Soil pH, soil texture,
total nitrogen, Cat ion Exchange Capacity (CEC), and soil
organic matter.
2.6. Statistical Analysis
The analysis of variance (ANOVA) was carried out using
statistical packages and procedures out lined by Gomez and
Gomez [25]. Mean separations were carried out using the
Least Significant Difference (LSD) at 5% probability level.
3. Results and Discussion
3.1. Physicochemical Properties of the Soil
The soil texture of the experimental site was sandy clay
soil with a proportion of 48% sand, 36% clay and 16% silt
(Table 2) showing the textural class of the experimental soil
was ideal for maize production [26]. The soil pH of the
experimental site was 5.57 which is moderately acidic. The
analytical results indicated that the organic carbon content of
the experimental soil (2.27%) is low according to Landon
[27], who classified the organic carbon content of soil < 4%,
4-10%, and > 10% as low, medium and high, respectively
(Table 2). The analyzed soil had a value of 0.20% total
nitrogen which is a rating medium [27], who classified total
nitrogen content of < 0.1, 0.1-0.15, 0.15-0.25, and > 0.25 as
very low, low, medium, and high, respectively.
Moreover, the organic matter content of the soil (3.92%) is
medium according to the classification of Berhanu [28]
where soils with organic matter content of > 5.20, 2.6-5.2,
0.8-2.6 and < 0.8% were classified as high, medium, low and
very low, respectively. The analysis indicated that the CEC of
the soil was 17.86 cmol kg-1
(Table 2), which was medium,
according to Landon [27], CEC by Ammonium Acetate at pH
7.0 method with values < 5, 5-15, 15-25, 25-40, and > 40 are
classified as very low, low, medium, high and very high. In
general, the properties of the experimental soil and the
weather conditions at the site were conducive for the growth
of both maize and soybean.
Table 2. Major soil characteristics of the experimental site before planting.
Soil Character Value Status
Soil texture
Sand (%) 48
Clay (%) 36
Silt (%) 16
Soil textural class Sandy clay
Soil pH 5.57 Moderately acidic
Total nitrogen (%) 0.20 Low
Organic Carbon (%) 2.27 Medium
Organic matter (%) 3.92 Medium
Cation Exchange Capacity [cmol (+) kg-1] 17.86 Medium
3.2. Maize Components
Maize phenology and growth parameters:
The main effect of variety and plant population of the
intercropped soybean and their interaction showed no
significant effect on days to 50% tasselling and silking of
maize. On the other hand, the cropping system had a
significant (P < 0.05) effect on days to 50% tasselling and
silking of maize (Table 3). The absence of significant effects
on the maize component could be due to the dominant nature
of maize as compared to soybean in resource utilization. This
is in agreement with Tilahun [29] report days to silking and
tasseling of maize in maize/faba bean intercropping.
Likewise, in maize and faba bean intercropping reported also
no variation in days to silking and tasseling of maize [29].
Furthermore, day to 90% physiological maturity of maize
was not significantly affected by main effect of soybean
varieties. While the plant population of soybean and cropping

132 Negasa Dangia et al.: Effects of Varieties and Population of Soybean Intercropped with Maize on
Yield and Yield Components of Associated Crops
system had a highly significant (P < 0.01) effect on days to
90% physiological maturity of maize (Table 3). Intercropped
75% of soybean with maize significantly delayed days to
physiological maturity as compared to 25% of soybean
(Table 3) may be due to competition effect of soybean plant
population for nutrients especially water, which can result in
lowered metabolic processes in the plant which increase
maturity date. Teshome [30] reported days to 90%
physiological maturity of maize was not significantly
affected by the associated soybean varieties and the
interaction of varieties by population.
Plant height of maize was not significantly affected by the
main effects of soybean varieties, plant population of
soybean, their interaction, and cropping system (Table 3).
This was probably because of early sowing of maize helps to
utilize important resources in maize-soybean varieties
intercropping. The maize leaf area and leaf area index were
highly significantly (P < 0.01) affected by plant population of
soybean and cropping system (Table 3). The leaf area (LA)
and leaf area index (LAI) of maize due to intercropping local
variety (3325 cm2, 1.48) significantly higher than that of
‘Boshe’. (3099 cm2, 1.38), respectively. And the 25% plant
population of soybean population gave highest LA (3461.1
cm2) and LAI (1.54) while the lowest LA (3046 cm
2) and
LAI (1.35), was due to 75% plant population (Table 3) which
might be due to increased competition for growth resources
as the density of the associated soybean varieties increased.
This could be due to inter specific competition between
associated crops for growth resources under the intercropping
system than sole cropping. This result agreed with Tsubo et
al. [31] who reported that on maize/bean intercropping, the
intercropped maize leaf area was significantly reduced
because of the photosynthetic organ (leaves) become thinner
and reduced its area due to shading effect of the component
crop. Wogayehu [32] also found that LAI of maize was
significantly affected by intercropped bean varieties and
Tilahun [29] reported that intercropping reduced LAI of
maize in faba bean/ maize intercropping.
Yield and Yield Components of Maize
Ear length and Ear diameter: Soybean plant population and
the interaction had a significant (P < 0.05) effect on ear length
and ear diameter of maize (Table 3). The highest ear length
and ear diameter of maize were obtained from the intercropped
soybean population of 25% (24.62 cm and 5.28 cm) and 75%
(23.86 cm and 4.79 cm), respectively. On the other hand, the
lowest ear length and ear diameter of maize were obtained
from the intercropped soybean population of 75% (23.86 cm
and 4.79 cm), respectively (Table 3). The highest ear length
and ear diameter recorded from maize intercropped with
soybean at 25% planting density might be due to less planting
density that might have resulted in less competition. The lower
ear length and ear diameter of maize recorded from 75%
soybean intercropped with maize might be due to interspecific
competition between component crops.
Number of Ears Per Plant: The main effects of the plant
population showed a significant (P < 0.05) effect on the
number of ears per plant (Table 3). The highest number of
ears per plant (1.88) was obtained from maize
intercropped with 25% of the soybean population while
the lowest number of ears per plant (1.71) was obtained
from maize intercropped with 75% of soybean population
(Table 3). This might be due to increased interspecific
competition for growth resources from the associated
soybean as its density increased. Similarly, Teshome et al.
[17] found that the number of an ear of maize was
influenced by the main effects of plant population of
soybean varieties and cropping system.
Table 3. The Phenology, Growth, and Yield and Yield related characters of maize as affected by the associated soybean varieties and planting densities grown
in sole and intercropped with soybean at Hagalo area.
Treatments DT DS DM PH
(cm)
LA
(cm2) LAI
EL
(cm)
ED
(cm) NEPP HI (%)
HKW
(g)
ADB
(tha-1)
GY
(tha-1)
Soybean varieties
Maize +Boshe 74.62 78.22 136.49 222.80 3099c 1.38 24.15 5.06 1.81 38.38a 26.33b 18.64 7.15a
Maize +Jalale 74.47 78.15 136.48 220.89 3250b 1.44 24.22 5.15 1.77 38.57a 25.99a 18.54 7.15a
Maize +Local 74.59 78.19 136.77 222.60 3325a 1.48 24.22 4.99 1.73 37.41b 26.0ab 18.86 7.05b
LSD (0.05) NS NS NS NS 137.1 0.061 NS NS NS 0.79 0.02 NS 0.03
Soybean population
Maize + 25% 74.57 78.17 135.50c 222.44 3461.1a 1.54a 24.62a 5.28a 1.88a 38.84a 26.31a 18.52 7.19a
Maize +50% 74.54 78.22 136.27b 222.21 3168b 1.41b 24.12b 5.14a 1.72b 38.15ab 26.16b 18.67 7.12b
Maize +75% 74.57 78.18 137.97a 221.65 3046c 1.35b 23.86c 4.79b 1.71b 37.37b 25.85c 18.85 7.04c
LSD (0.05) NS NS 0.336 NS 137.1 0.061 0.13 0.23 0.14 0.79 0.02 NS 0.03
CV (%) 0.3 0.20 0.20 0.98 4.3 4.3 0.56 4.46 8.09 2.07 0.42 2.76 0.51
Cropping System
Sole Cropping 74.14b 77.70b 135.07b 222.58 3329.3a 1.48a 25.27 5.52 1.89 40.44a 26.35a 18.98 7.43a
Intercropping 74.56a 78.19a 136.58a 222.10 3173.6b 1.41b 24.20 5.07 1.77 38.7b 26.01b 18.65 7.19b
LSD (0.05) 0.19 0.39 0.63 NS 116.17 0.04 NS NS NS 0.97 0.18 NS 0.21
CV (%) 0.07 0.15 0.13 0.1 1.02 0.85 0.69 2.55 4.68 1.35 0.20 0.67 0.82
Means within the same column followed by the same letter or by no letters of each factor do not differ significantly at 5% probability level; LSD=Least
Significant Difference (P< 0.05); CV=Coefficient of Variation; NS=Non Significant; DT=days to 50% tasseling; DS=days to 50% silking; DM=days to 90%
maturity; PH=Plant height; LA=leaf area; LAI=leaf area index, EL=ear length; ED=ear diameter; NEPP=number of ears per plant; HI=harvest index;
HKW=hundred kernel weight; ADB=above ground dry biomass; GY=grain yield;
Hundred Kernel Weight: The main effects of plant population, varieties of soybean and cropping system showed

Journal of Plant Sciences 2021; 9(4): 128-138 133
a significant (P < 0.01) effect on a hundred kernel weight
(Table 3). The highest hundred kernel weight (26.31g) was
obtained from maize intercropped with 25% of the soybean
population while intercropping with 75% soybean population
gave the lowest hundred kernel weight (25.85 g) (Table 3). In
conformity to this, significantly the highest hundred kernel
weight (26.33g) was recorded from ‘Boshe’ variety and the
lowest hundred kernel weight (25.99g) was obtained from
‘Jalale’ variety. Hundred kernel weight of maize was also
significantly affected by the cropping system. A higher
hundred kernel weight of maize (26.35g) was obtained from
sole maize and the lower hundred kernel weight of maize
(26.01g) was obtained from the intercropped maize with
soybean variety (Table 3).
Aboveground Dry Biomass: There were no significant
effects of varieties, plant population of the intercropped
soybean, and their interaction on aboveground dry biomass
(Table 3). In conformity with this result, Teshome et al. [17]
observed that the main effect of variety and plant population
of the intercropped soybean and their interaction showed no
significant effect on maize above-ground dry biomass.
Similarly, Zerihun [33] reported no significant difference in
dry biomass of the intercropped maize due to the associated
soybean varieties and between the sole and intercropped
maize for aboveground dry biomass, The decrease in the
aboveground dry biomass of maize under intercropping
might be due to competition between the two crops for
growth resources. Another study reported by Behairy [34]
and Kisetu and Nyasasi [35] confirmed that non-significant
differences between monocropped maize and intercropped
maize with soybean on aboveground dry biomass.
Harvest Index (HI) in %:The main effects of soybean
varieties, plant population, and cropping system showed a
significant (P < 0.05) effect on harvest index while the
interaction effect of soybean variety was not significant
(Table 3). The highest harvest index of maize (38.84%) was
recorded from intercropping of maize with 25% of the
soybean population whereas the lowest HI (38.15%) was
recorded from intercropping of maize with 50% of soybean
population. Additionally, the highest HI (38.57%) of the
maize component was obtained in association with soybean
variety ‘Jalale’ while the lowest HI (37.41%) was obtained in
association with soybean local variety (Table 3). In the other
hand, significantly higher HI of maize (40.44%) was
obtained from sole maize than the intercropped maize (38.7%)
(Table 3). Lower HI of maize under intercropping might be
due to interspecific competition for growth resources. The
present result agreed with Zerihun [33] finding where higher
HI (44.7%) of maize was recorded from sole maize than
intercropped maize (41.5%) with soybean varieties.
Grain yield: The main effects of plant population, soybean
varieties, and cropping system showed highly significant (P <
0.01) effects on grain yield of the maize component.
However, grain yield was not significantly affected by their
interactions (Table 3). The highest maize yield (7.19 t ha-1
)
was obtained from the combinations of 100% maize x 25%
plant population of soybean ‘Boshe’ variety while the lowest
grain yield (7.04 t ha-1
) was obtained from a combination of
100% maize x 75% plant population of soybean. The highest
grain yield of maize from 25% population of soybean variety
‘Boshe’ might be due to a reduction in competition for
growth resources. Sole cropped maize had significantly
higher grain yield (7.43 t ha-1
) than the intercropped system
(7.19 t ha-1
) (Table 3). The grain yield reduction of the
intercropped maize might be associated with interspecific
competition between the intercrop components for growth
resources and the depressive effects of soybean on maize at
the early growth stage because both crops were planted
simultaneously and soybean has emerged earlier than maize.
Following this result, Dechasa [36] reported that the yield of
sole cropped sorghum was significantly higher than
intercropped sorghum.
3.3. Soybean Component
Growth Parameters
Days to 50% flowering: The main effect of soybean
varieties and plant population of soybean had a significant (P
< 0.01) effect on days to 50% flowering (Table 4). This could
be due to the varietal difference. On the other hand, local
variety significantly delayed days to reach 50% flowering.
Intercropped 25% of soybean with maize significantly
delayed days to 50% flowering as compared to 50% and 75%
of soybean (Table 4). This was probably due to relatively less
competition between plants for growth resources, which
allows the crop to more vegetative growth leading to delayed
flowering. Similarly, Belstie et al. [37] reported that a
prolonged period of flowering was observed for 1:1 spatial
arrangement. Sole and intercropped soybean did not show
significant effect. This result is in agreement with Njouku
and Muoneke [38] who reported that there was no effect on
cowpea intercropping on days to 50% as compared to the
sole crop.
Days to 90% physiological Maturity: had significantly
affected (P < 0.05) by the main effect of soybean varieties
and plant population of soybean (Table 4). Intercropped 75%
of soybean with maize significantly delayed days to
physiological maturity of soybean as compared to 25% and
50% of soybean (Table 4) indicating competition effect of
soybean plant population for nutrients especially water,
which can result in lowered metabolic processes in the plant
which increase maturity date. Moreover, maturity was
significantly different among varieties of soybean. ‘Jalale’
and ‘Boshe’ reached days to 90% physiological maturity
significantly earlier than intercropped local (Table 4).
Plant height: The main effect of soybean varieties and
cropping system had a significant effect on plant height
(Table 4). This may be due to the competition of plants for
light. However, the height of soybean was not
significantly affected by plant population of soybean. The
highest height of soybean (63.75 cm) was recorded from
intercropping of ‘Jalale’ with maize whereas the lowest
height (58.74 cm) was recorded from intercropping of
local variety with maize.
The number of primary branches The main effect of plant

134 Negasa Dangia et al.: Effects of Varieties and Population of Soybean Intercropped with Maize on
Yield and Yield Components of Associated Crops
population, soybean varieties, and interaction of the main
effects had a highly significant (P < 0.01) effect on number of
primary branches (Table 4). The highest number of primary
branches of soybean (5.90) was recorded from intercropping
of ‘Jalale’ with maize whereas the lowest number of primary
branches (2.98) was recorded from intercropping of local
variety with maize. Soybean at 25% plant population and at
75% plant population gave significantly the highest (5.09)
and lowest (3.10) primary branches, respectively (Table 4).
These results agreed with that of Teshome [30] who reported
that the highest number of primary branches was recorded
from 25% soybean population while the lowest number of
primary branches was recorded from 75% soybean
population.
Yield and Yield Components of Soybean
The number of pods per plant: The number of pods per
plant was highly significantly (P ˂ 0.01) affected by the
main effect of plant population, cropping system, interaction
and soybean varieties (Table 4). The highest number of pods
per plant (39.59) was recorded from 25% soybean population
while the lowest number of pods per plant (34.46) was
obtained from 75% soybean population (Table 4). The
highest number of pods per plant (39.74) was obtained for
variety ‘Boshe’ while variety local had the lowest (32.54)
(Table 4). The decrease in the number of pods per plant at
higher plant density might be due to increased inter and
intraspecific competition for growth resources, which might
have lead to a reduced number of effective branches.
Similarly, Luiz and Robert [39] reported that increasing the
bean population in maize/bean intercropping significantly
decreased the number of pods per bean plant. A significantly
higher number of pods per soybean plant (104.79) was
obtained from intercropped than sole cropped soybean (36.96)
(Table 4).
The number of seeds per pod: Number of seeds per pod
was significantly affected (P ˂0.05) by the main effect of
the plant population of soybean and cropping system.
However, the number of seeds per pod was significantly
affected by plant population, interaction, and cropping
system (Table 4).
Hundred Seed Weight: Hundred seed weight of the
associated soybean was not significantly affected by the main
effect of cropping system, but was significantly (P < 0.01)
affected by soybean variety, plant population, and interaction
(Table 4). The highest hundred seed weight (20.21 g) was
recorded for variety ‘Jalale’ while the lowest seed weight was
recorded for variety Local (18.47 g) (Table 4). The variation
in seed weight for varieties could be since seed size is a
genetic trait hence it did not change much with a change in a
cropping system. This result was in agreement with Zerihun
[33] report that thousand seed weight of soybean was
significantly (P<0.05) different under maize/soybean
intercropping due to soybean variety.
Table 4. Phenology, Yield and Yield related, characters of soybean as affected by the associated soybean varieties and planting densities grown in the sole and
intercropped with maize.
Treatments DF DN PH NPB NPPP NSPP HSW (g) ADB (tha-1) HI (%) SY (tha-1)
Soybean varieties
Maize+Boshe 68.16b 111.49b 63.75a 5.90a 42.58a 2.80a 18.66b 5.15a 31a 1.58a
Maize+Jalale 67.14c 111.26b 60.25b 3.32b 40.74b 2.77b 20.21a 5.11a 31a 1.58a
Maize+Local 73.64a 118.07a 58.74c 2.98c 32.64c 2.62c 18.47b 4.07b 22c 0.91b
LSD (0.05) 0.078 0.266 0.267 0.32 0.32 0.15 0.32 0.04 0.002 0.01
Soybean densities
Maize+25% 69.73a 113.45b 60.91 5.09a 40.06a 2.94 18.85 4.67c 27.78b 1.31c
Maize+50% 69.63b 113.64ab 60.93 4.01b 38.52b 2.72 19.14 4.78b 28.33a 1.38b
Maize+75% 69.58b 113.73a 60.92 3.10c 37.38c 2.68 19.36 4.89a 28.11ab 1.39a
LSD (0.05) 0.078 0.266 NS 0.32 0.32 NS 0.32 0.04 0.004 0.01
CV (%) 0.1 0.2 0.4 7.9 0.8 5.6 1.7 0.9 0.8 0.8
Cropping System
Sole Cropping 68.24 113.52 56.65b 4.81 104.79a 2.98a 20.02 8.19a 25.70 2.22a
Intercropping 69.65 113.61 60.92a 4.07 36.75b 2.78b 19.12 4.78b 28.12 1.36b
LSD (0.05) NS NS 2.26 NS 14.34 0.04 NS 0.42 3.2 0.27
CV (%) 4.3 3.2 3.8 34.8 20 1.5 5.6 6.4 24.1 14.8
Means in the same column followed by the same letters are not significantly different at 5% level of significance according to LSD test. NS=Not significant at
P < 0.05; LSD=Least significant difference; CV=Coefficient of variation, DF=days to flowering, DM=days to maturity, PH=Plant height; NPB=number of
primary branch; NS=Non Significant; NPPP=number of pod per plant; NSPP=Number of seed per pod; ADB=above ground dry biomass,, HSW=Hundred
seed weight; SY=Grain yield
Aboveground dry biomass of Soybean: The aboveground
dry biomass of the soybean component showed a significant
(P < 0.01) variation between soybean varieties, plant
population, and cropping system (Table 4). The highest
aboveground dry biomass was obtained from 75% (5.12 t ha-1
)
while the lowest biomass yield was from 25% (4.21 t ha-1
)
soybean population (Table 4) and the highest aboveground
dry biomass (5.15 t ha-1
) was recorded from ‘Boshe’ variety
of soybean followed by ‘Jalale’ variety (5.11 t ha-1
). The
cropping system also had a highly significant (P < 0.01)
effect on aboveground dry biomass of the soybean and
maximum biomass yield (8.19 t ha-1
) was recorded from sole
cropped soybean than the intercropped soybean (4.78 t ha-1
)
(Table 4). The current finding was in line with Birteeb et al.
[40] who reported that intercropping system significantly
reduced the biomass yield of the intercropped legumes. The

Journal of Plant Sciences 2021; 9(4): 128-138 135
differences in canopy height of soybean varieties and maize
lead to shading effect.
Harvest Index of Soybean: Harvest index of soybean was
highly significant (P < 0.01) affected by variety and plant
population, their interaction, and cropping system (Table 4).
The highest soybean harvest index (28.33%) was obtained
from 50% soybean population and the lowest soybean
harvest index (27.78%) was obtained from 25% population
(Table 4). The highest harvest index was recorded from
variety ‘Boshe’ and ‘Jalale’ intercropped with maize might be
due to the high grain yield to biomass obtained by the variety
as a result of high partitioning of dry matter to the grain.
Seed Yield of Soybean: There was also a significant (P <
0.01) variation in grain yield due to the effect of associated
varieties, plant population, interaction, and cropping system
(Table 4). The highest yield (1.58 t ha-1
) was obtained from the
intercropped variety ‘Boshe’ and ‘Jalale’ with maize (Table 4).
This may be due to could be due to higher-yielding potential as
it had the highest aboveground dry biomass and hundred
grains weight. Similarly, Egbe [8] reported such significant
yield differences among varieties of soybean in the
intercropping system. With regards to plant population, the
highest seed yield (1.39 t ha-1
) was recorded from the soybean
population of 75% followed by 50% soybean population (1.38
t ha-1
), and the lowest was obtained from 25% soybean
population (1.31 t ha-1
) (Table 4).
Therefore, grain yield increased with the increase in plant
population of soybean which could be the result of more plants
established under the intercropping system. This conforms to
Akunda [41] which demonstrated higher soybean populations
provided a way to optimizing yields in soybean/millet
intercropping systems. In the case of the cropping system,
higher seed yield (2.22 t ha-1
) was obtained from sole cropped
soybean than the intercropped soybean (1.36 t ha-1
) (Table 4).
This reduction in soybean yields under intercropping could be
due to interspecific competition between the intercrop
components and also the aggressive effects of maize (C4
species) on soybean, a C3 species. Also shading by the taller
maize plants under the intercropping could reduce the
photosynthetic rate of the lower growing plants and thereby
reduce their yields. Muoneke et al. [42] reported similar yield
reduction in soybean intercropped with maize and sorghum
and attributed the yield depression to interspecific competition
and the depressive effect of the cereals.
3.4. System Productivity
Land Equivalent Ratio (LER): The productivity of
intercropping was evaluated using the partial and total LERs as
indices. The partial LER of maize varied significantly in terms
of soybean varieties and plant population. A significant increase
in partial LER (0.44 to 0.70) of soybean was calculated due to a
proportional increase in planting densities (Table 5). In all
intercrops, LER was superior in resources use efficiency as
compared to sole cropping. This justified that the intercropping
was better than their respective sole cropping. The intercropped
maize yielded the equivalent of 58.18% to 68.57% and 41.4% to
60.76% of its sole crop yield in terms of soybean varieties and
planting densities, respectively. Besides, soybean varieties
yielded the equivalent of 31.43% to 41.82% of their sole crop
yield, while 37.82% to 39.49% of their sole crop yield (Table 5)
was obtained due to soybean planting densities. This showed
that it was advantageous as compared to sole cropping of either
of the component crops as depicted by total LER values above
one indicated complementarity in resource utilization by the
component crops.
Table 5. Main effects of Soybean varieties and their plant population on LER, GMV, and MAI of maize-soybean intercropping.
Treatment LER Monetary value (Ethiopian Birr/ha) MAI (Monetary
advantage index) Maize soybean Total Maize Soybean GMV (Gross monetary value)
Soybean varieties
Maize+Boshe 0.96a 0.69a 1.65 49406ab 61567a 110431 43716.64a
Maize+Jalale 0.95b 0.68a 1.63 48544b 61228a 109772 42427.21b
Maize+Local 0.96a 0.44b 1.4 48864a 56721b 105585 30167.14c
LSD (0.05) 0.004 0.008 696.9 703.2 391.94
Soybean population
Maize+25% 0.97a 0.59c 1.56 49893a 60391c 110284 39589.13a
Maize+50% 0.96b 0.62a 1.58 49801a 60841b 110642 40615.42b
Maize+75% 0.95c 0.62a 1.57 47121b 58285a 105406 38268.42c
LSD (0.05) 0.004 0.008 696.9 703.2 391.94
CV (%) 0.4 1.3 1.4 1.2 1.8
Cropping System
Sole Cropping 1a 1a 1:00 48937.9 58649b 107586.9 -
Intercropping 0.97b 0.61b 1.58 49905 61924a 111829 43428
LSD (0.05) 0.01 0.1 0.11 NS 727.96 593.30
CV (%) 0.42 12.3 12.4 17.3 4.56 1.44
Means within the column and rows followed by the same letter do not differ significantly at 5% probability level; LSD=Least Significant Difference;
CV=Coefficient of Variation, ETB=Ethiopian Birr=1 US dollar=∼33 Birr).
Gross Monetary Value (GMV): The result revealed that the
GMV increased with the increase in planting density of
soybean in intercropped maize/soybean. This might be
because of higher seed yield values and the higher price per
kg of soybean which contributed more in gross monetary
value than maize as depicted by the monetary value of
soybean varieties in intercrops. Thus, the highest GMV of
ETB (Ethiopian Birr) 49893.00 ha-1
and lowest GMV of ETB
136 Negasa Dangia et al.: Effects of Varieties and Population of Soybean Intercropped with Maize on
Yield and Yield Components of Associated Crops
47121.00 per ha were obtained when maize intercropped
with soybean at planting densities of 25% and 75%,
respectively (Table 5). This depicted that the GMV of
intercrops (ETB 49905.00 ha-1
) was higher than that of sole
cropped maize (ETB 48937.90 ha-1
) (Table 5). Thus, the
intercrop system was economically feasible relative to sole
crop maize as reported from different intercrop studies
including Segun Olasanmi and Bamire [43] (maize-cowpea),
Addo-Quaye et al. [44] (maize-soybean), and Alemayehu et
al. [45] (maize common bean). However, the GMV (ETB
58649.00 ha-1
) of sole cropped soybean was by far superior
to GMV of intercrops (ETB 61924.00 ha-1
) which showed
that the GMV of sole cropped soybean was greater than that
of intercrops by ETB 967.10 ha-1
Table 5). This might be
because of a higher contribution of soybean seed yield from
sole cropping compared to intercrop as the higher price per
kg of soybean.
Monetary Advantage Index: Monetary advantage (MA) of
intercropping was used to calculate the absolute value of the
yield advantage. According to Willey [24] the appropriate
economic assessment of intercropping should be in terms of
increased value per unit area of land.
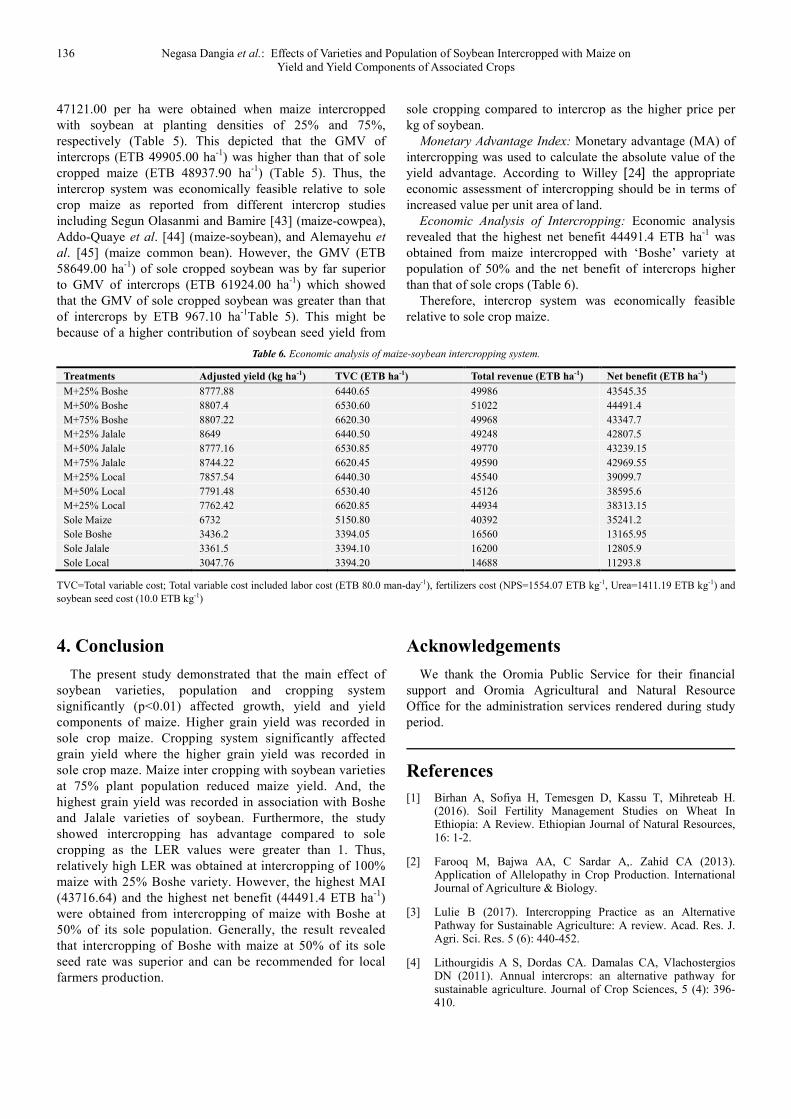
Economic Analysis of Intercropping: Economic analysis
revealed that the highest net benefit 44491.4 ETB ha-1
was
obtained from maize intercropped with ‘Boshe’ variety at
population of 50% and the net benefit of intercrops higher
than that of sole crops (Table 6).
Therefore, intercrop system was economically feasible
relative to sole crop maize.
Table 6. Economic analysis of maize-soybean intercropping system.
Treatments Adjusted yield (kg ha-1) TVC (ETB ha-1) Total revenue (ETB ha-1) Net benefit (ETB ha-1)
M+25% Boshe 8777.88 6440.65 49986 43545.35
M+50% Boshe 8807.4 6530.60 51022 44491.4
M+75% Boshe 8807.22 6620.30 49968 43347.7
M+25% Jalale 8649 6440.50 49248 42807.5
M+50% Jalale 8777.16 6530.85 49770 43239.15
M+75% Jalale 8744.22 6620.45 49590 42969.55
M+25% Local 7857.54 6440.30 45540 39099.7
M+50% Local 7791.48 6530.40 45126 38595.6
M+25% Local 7762.42 6620.85 44934 38313.15
Sole Maize 6732 5150.80 40392 35241.2
Sole Boshe 3436.2 3394.05 16560 13165.95
Sole Jalale 3361.5 3394.10 16200 12805.9
Sole Local 3047.76 3394.20 14688 11293.8
TVC=Total variable cost; Total variable cost included labor cost (ETB 80.0 man-day-1), fertilizers cost (NPS=1554.07 ETB kg-1, Urea=1411.19 ETB kg-1) and
soybean seed cost (10.0 ETB kg-1)
4. Conclusion
The present study demonstrated that the main effect of
soybean varieties, population and cropping system
significantly (p<0.01) affected growth, yield and yield
components of maize. Higher grain yield was recorded in
sole crop maize. Cropping system significantly affected
grain yield where the higher grain yield was recorded in
sole crop maze. Maize inter cropping with soybean varieties
at 75% plant population reduced maize yield. And, the
highest grain yield was recorded in association with Boshe
and Jalale varieties of soybean. Furthermore, the study
showed intercropping has advantage compared to sole
cropping as the LER values were greater than 1. Thus,
relatively high LER was obtained at intercropping of 100%
maize with 25% Boshe variety. However, the highest MAI
(43716.64) and the highest net benefit (44491.4 ETB ha-1
)
were obtained from intercropping of maize with Boshe at
50% of its sole population. Generally, the result revealed
that intercropping of Boshe with maize at 50% of its sole
seed rate was superior and can be recommended for local
farmers production.
Acknowledgements
We thank the Oromia Public Service for their financial
support and Oromia Agricultural and Natural Resource
Office for the administration services rendered during study
period.
References
[1] Birhan A, Sofiya H, Temesgen D, Kassu T, Mihreteab H. (2016). Soil Fertility Management Studies on Wheat In Ethiopia: A Review. Ethiopian Journal of Natural Resources, 16: 1-2.
[2] Farooq M, Bajwa AA, C Sardar A,. Zahid CA (2013). Application of Allelopathy in Crop Production. International Journal of Agriculture & Biology.
[3] Lulie B (2017). Intercropping Practice as an Alternative Pathway for Sustainable Agriculture: A review. Acad. Res. J. Agri. Sci. Res. 5 (6): 440-452.
[4] Lithourgidis A S, Dordas CA. Damalas CA, Vlachostergios DN (2011). Annual intercrops: an alternative pathway for sustainable agriculture. Journal of Crop Sciences, 5 (4): 396-410.

Journal of Plant Sciences 2021; 9(4): 128-138 137
[5] Waddington S R., Mulugetta M, Siziba S, Karigwindi J (2007). Long-term yield sustainability and financial returns from grain legume–maize intercrops on a sandy soil in sub humid north central Zimbabwe. Expl Agric. Vol. 43, pp. 489–503.
[6] Tamiru H (2014). Effect of Intercrop row arrangement on maize and haricot bean productivity and the residual soil. World Journal of Agricultural Sciences, 2 (4): 069-077.
[7] Brooker, R. W, A. E. Bennett, W. Feng -Cong, T. J. Daniell, T. S. Georgem, P. D. Hallett, et al. (2015. Improving intercropping: A synthesis of research in agronomy, plant physiology and ecology. New Phytologist. 206, 107–117.
[8] Egbe O, Alibo S, Nwueze I (2010). Evaluation of some extra-early-and early maturing cowpea varieties for intercropping with maize in southern guinea Savanah of Nigeria. Agriculture and Biology Journal of North America, 1 (5): 845-858.
[9] Fathi N O (2014). Crop yield and nitrogen bio availability mediated by nitrogen fertilization in maize/soybean intercropping system with and without Rhizobium Inoculation. Alexandria Science Exchange Journal, 35 (2).
[10] Seran T H, Brintha I (2010). Review on maize based intercropping. Journal of Agronomy, 9 (3): 135–145.
[11] Beedy T L, Snapp S, Akinnifesi F K, Sileshi G W (2010). Impact of Gliricidia sepium intercropping system. Agricultural Ecosystem and Environment, 138 (3/4), 139- 146.
[12] Teshome G, Tamado T, Negash G (2016). Influence of Varieties and Population of Intercropped Soybean with Maize on Land Equivalent Ratio (LER) and Growth Monetary Value (GMV) of the Component Crops. Journal of Biology, Agriculture and Healthcare, Vol. 6, No. 11. www.iiste.org.
[13] FAO (Food and Agricultural Organization) (2017). Data-base agricultural production (FAO). http://faostat.fao.org/. Accessed on September 30, 2019.
[14] Berhanu A, Adam B, Yalew M (2018). Analysis of Cost and Return of Soybean Production Under Small Holder Farmers in Pawe District North Western Ethiopia. Journal of Natural Sciences Research, Vol. 8, No. 1, 2018. Accessed on July 12, 2019.
[15] Seran T H, Brintha I. (2009). Studies on determining a suitable pattern of capsicum (Capsicum annum L.)-vegetable cowpea (Vigna unguiculata L.) intercropping. Karnataka Journal of Agricultural Science, 22: 1153-1154.
[16] Padhi A K, Panigrahi R K, Jena B K (2010). Effect of planting geometry and duration of intercrops on performance of pigeonpea-finger millet intercropping systems. Indian J. Agric. Res. 44, 43-47.
[17] Teshome G, Tamado T, Negash G (2015). Effect of Varieties and Population of Intercropped Soybean with Maize on Yield and Yield components at Haro Sabu, Western Ethiopia. Science, Technology and Arts Research Journal, 4 (4): 31-39.
[18] MOANR (Ministry of Agriculture and Natural Resource) (2016). Plant Variety Release, Protection and seed Quality Directorate: Crop Varieties Register Addis Ababa, Ethiopia. Issue No. 19.
[19] Tadesse J, Leta T, Techale B, Lemi B (2018). Genetic variability, heritability and genetic advance of maize (Zea mays L.) inbred lines for yield and yield related traits in
southwestern Ethiopia. Journal of Plant Breeding and Crop Science, Vol. 10 (10), pp. 281-289.
[20] Sticker F C, Wearden S, Pauli A W (1961). Leaf Area Determination in Grain Sorghum. Agronomy Journal, 53: 187-188.
[21] Eyasu E, Shanka D, Dalga D, Elias E (2018). Yield Response of Maize (Zea mays L.) Varieties to Row Spacing Under Irrigation at Geleko, Ofa Woreda, Wolaita Zone, Southern Ethiopia. Journal of Experimental Agriculture International 20 (1): 1-10.
[22] Kibiru K (2018). Effect of Inter Row Spacing on Yield Components and Yield of Soybean [Glycine Max (L.) Merrill] Varieties in Dale Sedi District, Western Ethiopia. Agri Res& Tech: Open Access J. 18 (4).
[23] Mead R, Willey R W (1980). The concept of a land equivalent ratio and advantages. Experimental Agriculture, 16: 217- 226.
[24] Willey RW (1979). Intercropping – its importance and research needs. Field Crops Research 32: 1-10.
[25] Gomez K. A, Gomez A A (1984). Statistical Procedures for Agricultural Research. 2nd Edition. John Wiley and Sons Inc. Inter-Science Publications. New York. pp. 180-225.
[26] Onwume I C, Sinha I D (1991). Field crop production in tropical Africa: Principles and Practice. Technical Center for Agricultural and Rural Cooperation, Netherlands. https://books.google. com.et.
[27] Landon J R (1991). Brooker Tropical Soil Manual: A hand book for soil survey and Agricultural land evaluation in the tropics and Subtropics. Longman scientific and technical, Essex, Newyork, p. 474.
[28] Berhanu D (1980). The physical criteria and their rating proposed for land evaluation in the highland region of Ethiopia. Land use planning and regulatory department, Ministry of Agriculture. Addis Ababa, Ethiopia.
[29] Tilahun T (2002). Effects of Planting Arrangement of Component Crops on Productivity of Maize/Faba Bean Intercropping Systems. MSc. Thesis, Haramaya, University, Ethiopia.
[30] Teshome G (2017). Performances of Different Varieties and Population of Soybean (Glycine max L.) under Intercropping Systems with Maize (Zea mays L.). Advances in Life Science and Technology, Vol. 53: 2224-7181. www.iiste.org.
[31] Tsubo M, Walker S, Ogindio H O (2005). A simulation model a cereal-legume intercropping for semi- arid regions. Model applications. Field Crop Res. 93: 23-33.
[32] Wogayehu W (2005). Evaluation of common bean (Phaseolus vulgaris L.) varieties intercropping with maize (Zea mays L.) for double cropping at Haramaya and Hirna Areas, Eastern Ethiopia. MSc. Thesis, Haramaya University, Ethiopia.
[33] Zerihun A (2011). System Productivity as Influenced by Integrated Organic and Inorganic Fertilizer Application in Maize (zea mays l.) Intercropped with Soybean (Glycine max L. Merrill) Varieties at Bako, Western Ethiopia. M. Sc. Thesis. Haramaya University, Ethiopia.
[34] Behairy TG (1994). Effect of intercropping patterns on soybean growth and photosynthetic apparatus. Egyptian Journal of Physiological Sciences, pp: 167-178.

138 Negasa Dangia et al.: Effects of Varieties and Population of Soybean Intercropped with Maize on
Yield and Yield Components of Associated Crops
[35] Kisetu E, Nyasasi B T (2014). Determination of land productivity under maize-cowpea intercropping system in agro ecological zone of mount Uluguru in Morogoro, Tanzania. Global Journal of Agricultural Sciences Vol. 2: 147-157.
[36] Dechasa H (2005). Effect of moisture conservation methods and plant density of component crops on performance of sorghum/bean intercropping in Meiso district, west Hararghe. M. Sc. Thesis, Haramaya University, Ethiopia.
[37] Belstie L, Walelign W, Sheleme B (2016). Determinations of haricot bean (Phaseolus vulgaris L.) planting density and spatial arrangement for staggered Intercropping with Maize (Zea mays L.) at Wondo Genet, Southern Ethiopia. Academic Research Journal, 4 (6): 297-320.
[38] Njouku D N, Muoneke C O (2008). Effect of cowpea planting density on growth, yield and productivity of component crops in cowpea/cassava intercropping system. Journal of Tropical Agriculture, Food, Environment and extension, 72 (2): 106-113.
[39] Luiz B M, Robert W W (2003). Effects of plant population and nitrogen fertilizer on yield and efficiency of maize-bean intercropping. Pesq agropec bras Brasília 38 (11): 1257-1264.
[40] Birteeb P T, Addah W, Jakper N, Addo-Kwafo A (2011). Effects of intercropping cereal-legume on biomass and grain yield in the savannah zone. Livestock Research for Rural Development, 23 (198).
[41] Akunda E M (2001). Intercropping and population density effects on yield component, seed quality and photosynthesis of sorghum and soybean. Journal of Food Technology (Africa) 6: 170-172.
[42] Muoneke C O, Ogwuche M O, Kalu B A (2007). Effect of maize planting Density on the performance of maize/soybean intercropping system in a guinea savanna agroecosystem. Afrcan Journal of Agricultural Research 2: 667-677.
[43] Segun-Olasanmi A O, Bamire A S (2010). Analysis of costs and returns to maize-cowpea intercrop production in Oyo state, Nigeria, September 19-23, 2010, Poster presented at the Joint 3rd African Association of Agricultural Economists (AAAE) and 48thAgricultural Economists Association of South Africa (AEASA) Conference. Cape Town, South Africa.
[44] Addo-Quaye A, Darkwa A, Ocloo G K (2011). Yield and productivity of component crops in a maize-soybean intercropping system as affected by time of planting and spatial arrangement. Journal of Agriculture and Biological Science, 6 (9): 50-57.
[45] Alemayehu A, Tamado T, Nigusie D, Yigzaw D, Tesfaye T, Wortmann C S (2016). Maize-common bean/lupine intercrop productivity and profitability in maize-based cropping system of Northwestern Ethiopia. Ethiop. J. Sci. & Technol. 9 (2) 69- 85.