Effects of Imposed Acid–Base Derangement on the ...
12
Anesthesiology 2004; 100:1457– 68 © 2004 American Society of Anesthesiologists, Inc. Lippincott Williams & Wilkins, Inc. Effects of Imposed Acid–Base Derangement on the Cardiovascular Effects and Pharmacokinetics of Bupivacaine and Thiopental Laurence E. Mather, Ph.D.,* Leigh A. Ladd, B.V.Sc.,† Susan E. Copeland, M.Vet.Clin.Stud.,‡ Dennis H.-T. Chang, Ph.D.§ Background: By changing physicochemical properties such as effective lipophilicity, changes in blood pH could alter the distribution, elimination, and effects of weakly ionizing drugs. The authors examined the outcome of imposed acid– base de- rangement on cardiovascular effects and myocardial and whole body pharmacokinetics of bupivacaine, a weak base, and thio- pental, a weak acid. Methods: Intravenous infusions of rac-bupivacaine HCl (37.5 mg) or rac-thiopental sodium (250 mg, subanesthetic dose) were administered over 3 min to previously instrumented con- scious ewes with normal blood pH, acidemia imposed by lactic acid infusion, or alkalemia imposed by bicarbonate infusion. Hemodynamic and electrocardiographic effects were recorded; arterial and coronary sinus drug blood concentrations were analyzed by chiral high-performance liquid chromatography. Results: Bupivacaine decreased myocardial contractility, cor- onary perfusion, heart rate, and cardiac output; however, car- diac output and stroke volume were not as affected by bupiva- caine with acidemia. Thiopental decreased myocardial contractility and stroke volume and increased heart rate; aci- demia enhanced the tachycardia and produced a greater de- crease in stroke volume than with alkalemia. Taken as a whole, the cardiovascular changes were not systematically modified by acid– base derangement. Overall, the tissue distribution of bu- pivacaine was favored by alkalemia, but thiopental pharmaco- kinetics were essentially unaffected by acid– base derangement. Acid– base derangement did not influence the kinetics of either drug enantioselectively. Conclusions: At the doses used, the hemodynamic and elec- trocardiographic effects of bupivacaine and thiopental were not systematically modified by acid– base derangement, nor were there changes in regional or whole body pharmacokinetics of either drug that were clearly related to acid– base status. EXCEPT for drugs that act through their metabolites, the time course of action of drugs on the heart generally relates closely to the time course of their concentrations in the heart. 1 Studies to ascertain the importance of controlling physiologic and biochemical factors such as perfusate pH, perfusion rate, and protein composition have mostly been performed in isolated perfused organ systems that allow the variables to be controlled sepa- rately. For example, studies using quinidine have found its cardiac tissue permeability and consequent cardiac effects to be principally dependent on unbound rather than total drug concentrations, but with significant tis- sue permeability to the ionized drug form. 2–4 More re- cent study designs have now allowed the regional myo- cardial pharmacokinetics and effects of cardioactive drugs to be described concomitantly in large animals. 5,6 In this study, we examined the effects of imposed acidemia and alkalemia on pharmacokinetics and effects of two cardioactive drugs, bupivacaine (a weak base, pKa 8.1) and thiopental (a weak acid, pKa 7.6) in con- scious sheep. Both bupivacaine and thiopental are sus- ceptible to changes in extent of ionization through changes in local pH; decreasing the local pH increases the fractional ionization of bupivacaine and decreases the fractional ionization of thiopental, and vice versa. For both drugs, the relative concentration ratio of ion- ized to nonionized forms would change approximately twofold over the pH range used in the study. The signif- icance of this is that nonionized forms are much more lipophilic than ionized forms and thus more readily dif- fuse into cells. Because the nonionized form is always in dynamic equilibrium across the membrane, if intracellu- lar pH favors ionization more than does extracellular pH, net drug partitioning into the cytoplasm by “ion trap- ping” will be favored, resulting in a drug concentration gradient that is sensitive to a change in extracellular pH. The relative degrees of plasma protein and tissue binding also influence drug concentration gradients. Because of hydrophobic bonding, nonionized forms are generally more highly bound than ionized forms, but the effect of changes in local pH gradients on the equilibrium be- tween plasma protein and tissue-bound drug, and there- fore local drug concentration gradient, is generally not predictable from current knowledge. Therefore, it is possible that acid– base derangement, by affecting the extent of ionization of ionizable drugs, could influence their interactions with receptors and their pharmaco- logic effects, as well as their regional and whole body pharmacokinetics. Previous studies suggest that the myocardial effects of both bupivacaine and thiopental would be exacerbated by acidosis, although for bupiva- caine, hypoxia also was required. 7,8 Moreover, both bupivacaine and thiopental are used as racemates, i.e., equal part mixtures of R- and S-enanti- * Professor of Anesthesia and Analgesia (Research), † Senior Research Officer, ‡ Research Officer, Centre for Anesthesia and Pain Management Research, De- partment of Anesthesia and Pain Management, University of Sydney at Royal North Shore Hospital. § Senior Research Officer, Centre for Anesthesia and Pain Management Research, Department of Anesthesia and Pain Management, Univer- sity of Sydney at Royal North Shore Hospital. Current position: College of Social and Health Sciences, University of Western Sydney, Bankstown Campus, Australia. Received from Centre for Anesthesia and Pain Management Research, Depart- ment of Anesthesia and Pain Management, University of Sydney at Royal North Shore Hospital, St. Leonards, Australia. Submitted for publication May 7, 2003. Accepted for publication January 7, 2004. Supported in part by the National Health and Medical Research Council of Australia, Canberra, Australia, and by the Centre for Anaesthesia and Pain Management Research Ltd., Sydney, Australia. Address correspondence to Prof. Mather: Centre for Anesthesia and Pain Management Research, Department of Anesthesia and Pain Management, Univer- sity of Sydney at Royal North Shore Hospital, St. Leonards, NSW 2065, Australia. Address electronic mail to: [email protected]. Individual article reprints may be purchased through the Journal Web site, www.anesthesiology.org. Anesthesiology, V 100, No 6, Jun 2004 1457 Downloaded from http://pubs.asahq.org/anesthesiology/article-pdf/100/6/1457/355898/0000542-200406000-00018.pdf by guest on 30 March 2022
-
Upload
khangminh22 -
Category
Documents
-
view
2 -
download
0
Transcript of Effects of Imposed Acid–Base Derangement on the ...
Anesthesiology 2004; 100:1457–68 © 2004 American Society of Anesthesiologists, Inc. Lippincott Williams & Wilkins, Inc.
Effects of Imposed Acid–Base Derangement on theCardiovascular Effects and Pharmacokinetics ofBupivacaine and ThiopentalLaurence E. Mather, Ph.D.,* Leigh A. Ladd, B.V.Sc.,† Susan E. Copeland, M.Vet.Clin.Stud.,‡ Dennis H.-T. Chang, Ph.D.§
Background: By changing physicochemical properties suchas effective lipophilicity, changes in blood pH could alter thedistribution, elimination, and effects of weakly ionizing drugs.The authors examined the outcome of imposed acid–base de-rangement on cardiovascular effects and myocardial and wholebody pharmacokinetics of bupivacaine, a weak base, and thio-pental, a weak acid.
Methods: Intravenous infusions of rac-bupivacaine HCl (37.5mg) or rac-thiopental sodium (250 mg, subanesthetic dose)were administered over 3 min to previously instrumented con-scious ewes with normal blood pH, acidemia imposed by lacticacid infusion, or alkalemia imposed by bicarbonate infusion.Hemodynamic and electrocardiographic effects were recorded;arterial and coronary sinus drug blood concentrations wereanalyzed by chiral high-performance liquid chromatography.
Results: Bupivacaine decreased myocardial contractility, cor-onary perfusion, heart rate, and cardiac output; however, car-diac output and stroke volume were not as affected by bupiva-caine with acidemia. Thiopental decreased myocardialcontractility and stroke volume and increased heart rate; aci-demia enhanced the tachycardia and produced a greater de-crease in stroke volume than with alkalemia. Taken as a whole,the cardiovascular changes were not systematically modified byacid–base derangement. Overall, the tissue distribution of bu-pivacaine was favored by alkalemia, but thiopental pharmaco-kinetics were essentially unaffected by acid–base derangement.Acid–base derangement did not influence the kinetics of eitherdrug enantioselectively.
Conclusions: At the doses used, the hemodynamic and elec-trocardiographic effects of bupivacaine and thiopental were notsystematically modified by acid–base derangement, nor werethere changes in regional or whole body pharmacokinetics ofeither drug that were clearly related to acid–base status.
EXCEPT for drugs that act through their metabolites, thetime course of action of drugs on the heart generallyrelates closely to the time course of their concentrationsin the heart.1 Studies to ascertain the importance ofcontrolling physiologic and biochemical factors such as
perfusate pH, perfusion rate, and protein compositionhave mostly been performed in isolated perfused organsystems that allow the variables to be controlled sepa-rately. For example, studies using quinidine have foundits cardiac tissue permeability and consequent cardiaceffects to be principally dependent on unbound ratherthan total drug concentrations, but with significant tis-sue permeability to the ionized drug form.2–4 More re-cent study designs have now allowed the regional myo-cardial pharmacokinetics and effects of cardioactivedrugs to be described concomitantly in large animals.5,6
In this study, we examined the effects of imposedacidemia and alkalemia on pharmacokinetics and effectsof two cardioactive drugs, bupivacaine (a weak base,pKa 8.1) and thiopental (a weak acid, pKa 7.6) in con-scious sheep. Both bupivacaine and thiopental are sus-ceptible to changes in extent of ionization throughchanges in local pH; decreasing the local pH increasesthe fractional ionization of bupivacaine and decreasesthe fractional ionization of thiopental, and vice versa.For both drugs, the relative concentration ratio of ion-ized to nonionized forms would change approximatelytwofold over the pH range used in the study. The signif-icance of this is that nonionized forms are much morelipophilic than ionized forms and thus more readily dif-fuse into cells. Because the nonionized form is always indynamic equilibrium across the membrane, if intracellu-lar pH favors ionization more than does extracellular pH,net drug partitioning into the cytoplasm by “ion trap-ping” will be favored, resulting in a drug concentrationgradient that is sensitive to a change in extracellular pH.The relative degrees of plasma protein and tissue bindingalso influence drug concentration gradients. Because ofhydrophobic bonding, nonionized forms are generallymore highly bound than ionized forms, but the effect ofchanges in local pH gradients on the equilibrium be-tween plasma protein and tissue-bound drug, and there-fore local drug concentration gradient, is generally notpredictable from current knowledge. Therefore, it ispossible that acid–base derangement, by affecting theextent of ionization of ionizable drugs, could influencetheir interactions with receptors and their pharmaco-logic effects, as well as their regional and whole bodypharmacokinetics. Previous studies suggest that themyocardial effects of both bupivacaine and thiopentalwould be exacerbated by acidosis, although for bupiva-caine, hypoxia also was required.7,8
Moreover, both bupivacaine and thiopental are used asracemates, i.e., equal part mixtures of R- and S-enanti-
* Professor of Anesthesia and Analgesia (Research), † Senior Research Officer,‡ Research Officer, Centre for Anesthesia and Pain Management Research, De-partment of Anesthesia and Pain Management, University of Sydney at RoyalNorth Shore Hospital. § Senior Research Officer, Centre for Anesthesia and PainManagement Research, Department of Anesthesia and Pain Management, Univer-sity of Sydney at Royal North Shore Hospital. Current position: College of Socialand Health Sciences, University of Western Sydney, Bankstown Campus,Australia.
Received from Centre for Anesthesia and Pain Management Research, Depart-ment of Anesthesia and Pain Management, University of Sydney at Royal NorthShore Hospital, St. Leonards, Australia. Submitted for publication May 7, 2003.Accepted for publication January 7, 2004. Supported in part by the NationalHealth and Medical Research Council of Australia, Canberra, Australia, and by theCentre for Anaesthesia and Pain Management Research Ltd., Sydney, Australia.
Address correspondence to Prof. Mather: Centre for Anesthesia and PainManagement Research, Department of Anesthesia and Pain Management, Univer-sity of Sydney at Royal North Shore Hospital, St. Leonards, NSW 2065, Australia.Address electronic mail to: [email protected]. Individual article reprintsmay be purchased through the Journal Web site, www.anesthesiology.org.
Anesthesiology, V 100, No 6, Jun 2004 1457
Dow
nloaded from http://pubs.asahq.org/anesthesiology/article-pdf/100/6/1457/355898/0000542-200406000-00018.pdf by guest on 30 M
arch 2022

omers. Previous studies have demonstrated enantioselec-tivity in pharmacokinetics and pharmacodynamics ofthese drugs, with R-bupivacaine and S-thiopental beingconsidered the more toxic enantiomers.9–13 Thus, thepotential exists for acid–base derangement to cause dif-ferential pharmacologic effects through enantioselectivepharmacokinetic changes.
Therefore, our objectives in this study were threefold:(1) to determine whether imposition of acid–base de-rangement altered the hemodynamic/inotropic/electro-cardiologic effects of bupivacaine or thiopental, (2) todetermine whether any such pharmacologic effectscould be explained by changes in regional or wholebody pharmacokinetics of these drugs or both, and (3) todetermine whether acid–base derangement producedany enantioselective effects in the pharmacokinetics ofthese drugs.
Materials and Methods
Experimental DetailsThe study protocol was jointly approved by the Animal
Care and Ethics Committee of the Royal North ShoreHospital, St. Leonards, Australia, and the University ofTechnology, Sydney, Australia. The subjects consisted of13 nonpregnant Merino-cross ewes (age, 1–2 yr; weight[mean � SD], 46 � 5 kg); 11 subjects contributed dataon bupivacaine, 9 contributed data on thiopental, and 7contributed data on both drugs. Six additional subjectswere used in pilot experiments. All subjects were vacci-nated against clostridial diseases and caseous lymphade-nitis and were drenched with the anthelmintic ivermec-tin before delivery to the animal house. They wereallowed to acclimatize to their new environment for atleast 1 week before surgical preparation for studies.
Preparation for Studies. Surgical preparation con-sisted of two stages, a left thoracotomy and cannulationof blood vessels performed during general anesthesia, atleast 7 days apart. The thoracotomy involved placementof (1) active redirection transit time probes (Triton Tech-nology, San Diego, CA) around the pulmonary trunk(21 mm) and left main coronary artery (6 mm) for re-spective measurement of cardiac output and left coro-nary artery blood flow; (2) a pressure transducer cathe-ter (3-French, 100 cm, model SPR-524; MillarInstruments, Houston, TX) transmurally into the left ven-tricle to provide left ventricular pressure, from whichthe maximum value of its positive first derivative (LVdP/dtmax) was determined as an index of myocardialcontractility; (3) a polyurethane catheter (45-cm, 16- or18-gauge Cavafix Certo 358 or 255; B Braun MelsungenAG, Melsungen, Germany) in the coronary sinus forblood sampling; and (4) electrodes made from fishingwire (20-pound nylon-coated stainless steel) around thedorsal and ventral extremities of the fifth rib to acquireelectrocardiographic signals. The left hemiazygos vein,
which drains into the coronary sinus in the sheep, wasligated to prevent contamination of coronary sinus bloodsamples with systemic venous blood.
At surgery for cannulation, two polyurethane catheters(16- or 18-gauge, 45-cm, Cavafix Certo 358 or 255) formeasurement of arterial blood pressure and sampling ofarterial blood were placed in the left carotid artery to thebrachiocephalic trunk. A double-lumen central venouscatheter (70-cm Cavafix Duo, B Braun Melsungen AG)was placed via the jugular vein for administration ofdrugs. After recovery, cannulated sheep were kept inmetabolic crates so that patency of catheters could bemaintained by continuous flushing with heparinized(5 U/ml) saline (0.9%) at approximately 3 ml/h per cath-eter by a high-pressure infusion system.
Flucloxacillin (1 g intravenous) was given before inci-sion and hourly during surgery as prophylaxis againstinfection. Postoperative analgesia was provided with0.5% bupivacaine by blockade, during chest closure, ofthe intercostal nerves cranial and caudal to the thoracot-omy incision, along with carprofen (75 mg intravenous)and buprenorphine (0.3 mg intravenous) after anestheticinduction, during anesthetic recovery, and also two orthree times daily for approximately 4 days thereafter.
Dosage Regimens and Treatments. A period of 4–7 days was left between the second surgery and the firststudy in accord with the recovery of the animals. Studieswere performed with the animals conscious and sup-ported by a sling in a metabolic crate to prevent alter-ation of their position relative to the monitoring systemand to support their weight if they wanted to relax.
Five treatments were studied: test drug infusion withnormal arterial pH, with acidemia from intravenous in-fusion of lactic acid, and with alkalemia from intravenousinfusion of sodium bicarbonate; in addition, acidemia andalkalemia control studies were performed in which saline(0.9%) was substituted for the test drug. The test drugsconsisted of rac-bupivacaine HCl (37.5 mg) or rac-thiopen-tal sodium (250 mg) infused intravenously over 3 min at10 ml/min. Based on our previous experiments, thedosage regimen of bupivacaine was expected to be sub-convulsive and that of thiopental was expected to besubanesthetic; both doses, however, were expected tocause significant myocardial depression. Bupivacainestudies preceded thiopental studies.
The regimens used to produce acidemia and alkalemiawere determined empirically in pilot studies. Acidemiawas produced by infusing 15% rac-lactic acid at 10 ml/min for 5 min, 5 ml/min for 15 min, then 2.5 ml/min for25 min; infusion of the test drug or saline began 5 minafter the start of the lactic acid infusion. Alkalemia wasproduced by infusing 8.4% sodium bicarbonate at13 ml/min for 25 min, then 7.5 ml/min for 25 min;infusion of test drug or saline began 10 min after the startof bicarbonate infusion. For studies with normal blood
1458 MATHER ET AL.
Anesthesiology, V 100, No 6, Jun 2004
Dow
nloaded from http://pubs.asahq.org/anesthesiology/article-pdf/100/6/1457/355898/0000542-200406000-00018.pdf by guest on 30 M
arch 2022
pH, saline (0.9%) was infused with the same regimen asfor the bicarbonate infusion.
Blood Sampling Regimen. Samples of arterial andcoronary sinus blood were collected into heparinizedsyringes just before the start of the infusions to changeblood pH and then before and 0.5, 1, 1.5, 2, 2.5, 3, 3.5,4, 4.5, 5, 7.5, 10, 15, 20, 30, 40, 45, and 60 min after thestart of infusion of test drug or saline. Further arterialsamples were taken at 90, 120, 150, and 180 min tobetter characterize the whole body pharmacokinetics.The samples were stored at �20°C until analysis of drugconcentration by chiral high-performance liquid chroma-tography.14,15 Arterial blood gases and acid–base bal-ance were analyzed in samples drawn before and 1, 3, 5,10, 20, 30, and 60 min after the start of infusion of drugor saline.
Data Acquisition and ProcessingHemodynamic and Electrocardiographic Data.
Analog data were acquired and stored digitally by apersonal computer interfaced with a physiologic moni-toring system (Triton System 6; Triton Technology, SanDiego, CA) and data acquisition/analysis system (MP100with Acqknowledge v3 software; Biopac Inc., Santa Bar-bara, CA) at a sample rate of 256 Hz.16 Heart rate wasobtained from the electrocardiographic trace, and strokevolume was obtained from the quotient of cardiac out-put and heart rate. The monitoring systems were cali-brated, and baseline data were collected for 5 min. Datawere acquired for 3 h after the start of infusion of drugor saline. Hemodynamic data were collected as the meanvalues of 30-s epochs, except for LV dP/dtmax, whichwas collected as the maximum value in the epoch.
Mean arterial blood pressure, LV dP/dtmax, heart rate,cardiac output, and left coronary artery blood flowshowed a baseline drift with alkalemia, so an automaticbaseline correction algorithm (see Appendix) was de-signed and incorporated into the spreadsheet used fordata maintenance (Excel 97; Microsoft, Redmond, WA).This correction was applied to all data sets for consis-tency; however, its effects were negligible for the nor-mal pH and acidemia data sets.
The electrocardiogram was analyzed for arrhythmiasand measurements were made of time between begin-ning of P wave to beginning of Q wave (or R wave if noQ wave was present) (P to R wave interval), time fromonset of Q wave to end of T wave (Q to T wave interval),time between consecutive R waves (R to R wave inter-val), and width of the electrocardiographic wave com-plex (QRS width); also, the Q to T wave interval wascorrected for heart rate by dividing it by the square rootof the R to R wave interval (corrected Q to T waveinterval [QTc]). For these measurements, means weretaken of three consecutive complexes that were not partof an arrhythmia in the 10 s immediately preceding thefollowing times: during the control period at 1, 2, 3, 4,
and 5 min; at 10 and 15 min while acid–base balancewas being changed; and at 0.5, 1, 1.5, 2, 2.5, 3, 3.5, 4,4.5, 5, 6, 7.5, 10, 15, 20, 30, 45, and 55 min after the startof drug infusion. Cardiac arrhythmias during the first 10min of saline or drug infusion were grouped into su-praventricular arrhythmias (supraventricular prematurebeats, supraventricular tachycardia, supraventricular bi-geminy) and ventricular arrhythmias (ventricular prema-ture beats, ventricular tachycardia, ventricular bigeminy,ventricular trigeminy).
Hemodynamic and electrocardiographic data were an-alyzed for the magnitude of greatest effect (Emax or Emin)and its time of occurrence. In addition, the sum of theeffect differences to 10 min for cardiovascular and he-modynamic data and to 5 min for electrocardiographicdata were determined to capture any differences be-tween treatments in magnitude and immediate timecourse attributable to drug effect.16 These data provideuseful univariate statistics for time series data that areanalogous to areas under the curves.
Statistical AnalysesStatistix for Windows (version 7.1; Analytical Solu-
tions, Tallahassee, FL) was used on a personal computer.Cardiovascular and pharmacokinetic data were analyzedby two-factor analysis of variance with treatment themain effect and subject a repeated factor. The null hy-pothesis was that there was no difference in effectsbetween treatments. A criterion of P � 0.05 was taken asweak evidence for rejection of the null hypothesis, andP � 0.01 was taken as strong evidence. If there was asignificant effect of treatment, differences in mean val-ues between treatment groups were determined by themethod of least significant differences.
Results in graphic form are reported as mean � SEM toshow the predicted variability of the mean values. Tab-ulated results are reported as mean with 95% confidenceinterval. The absolute values for the relevant pretreat-ment predrug (baseline) cardiovascular parameters,along with maximum after-drug changes (either Emax orEmin, as appropriate, expressed as percent of baselinevalues) are also given. Note that after-drug 95% confi-dence intervals that do not include 100% are significantchanges (P � 0.05).17 All tests were two tailed. Thefrequency of subjects having cardiac arrhythmias witheach treatment was compared by chi-square analysis.
The effects of acid–base derangement on whole bodypharmacokinetics were explored sequentially. First,each drug was treated as a racemate (i.e., the same as thedosage form) by summing the respective measuredblood concentrations of the enantiomers. Each set ofarterial blood drug concentration–time data was fittedwith a triexponential decay equation by an iterativenonlinear weighted least squares procedure decided onthe basis of minimal objective function and of symmetryof residuals.18 From the equation of best fit, relevant
1459THIOPENTAL AND BUPIVACAINE PK/PD WITH pH DERANGEMENT
Anesthesiology, V 100, No 6, Jun 2004
Dow
nloaded from http://pubs.asahq.org/anesthesiology/article-pdf/100/6/1457/355898/0000542-200406000-00018.pdf by guest on 30 M
arch 2022
pharmacokinetic properties of a three-compartmentopen model (initial dilution volume [Vc], total apparentvolume of distribution [Vss], mean total body clearance[CLt], and slow half-life [T1/2�]) were determined.The effect of acid–base derangement on the pharm-acokinetic properties was determined by two-factor(subject � treatment) analysis of variance. Second, thepharmacokinetics of the separate enantiomers were de-termined as above.18 Using the Student one-sample t test,enantioselectivity was assessed by comparing, to a valueof unity, the ratio of the value for the R-enantiomer tothe corresponding value for the S-enantiomer (R:S ratio)of the respective relevant pharmacokinetic properties.Because the enantiomer concentrations were measuredin each blood sample, this ratio reflects the within-subject pharmacokinetic variability. The effect of acid–base derangement on the R:S ratio of each relevantpharmacokinetic parameter was determined by two-factor (subject � treatment) analysis of variance. Third,regional (myocardial) pharmacokinetics were deter-mined from the concentrations of drug (as racemate) inpaired arterial and coronary sinus blood samples and
coronary arterial blood flow. Because some samplingcatheters and probes failed during the study period,paired data were available for only four subjects witheach drug and treatment; hence, calculations of myocar-dial kinetics by mass balance were based on mean drugconcentration–time–blood flow data.5,6,10
Comparisons between bupivacaine and thiopentalwere not contemplated because the principal objectiveswere to determine whether the pharmacodynamics andpharmacokinetics of each drug were altered by acid–base derangement.
Results
Arterial Blood Gases and Acid–Base BalanceLactic acid infusions decreased arterial blood pH to
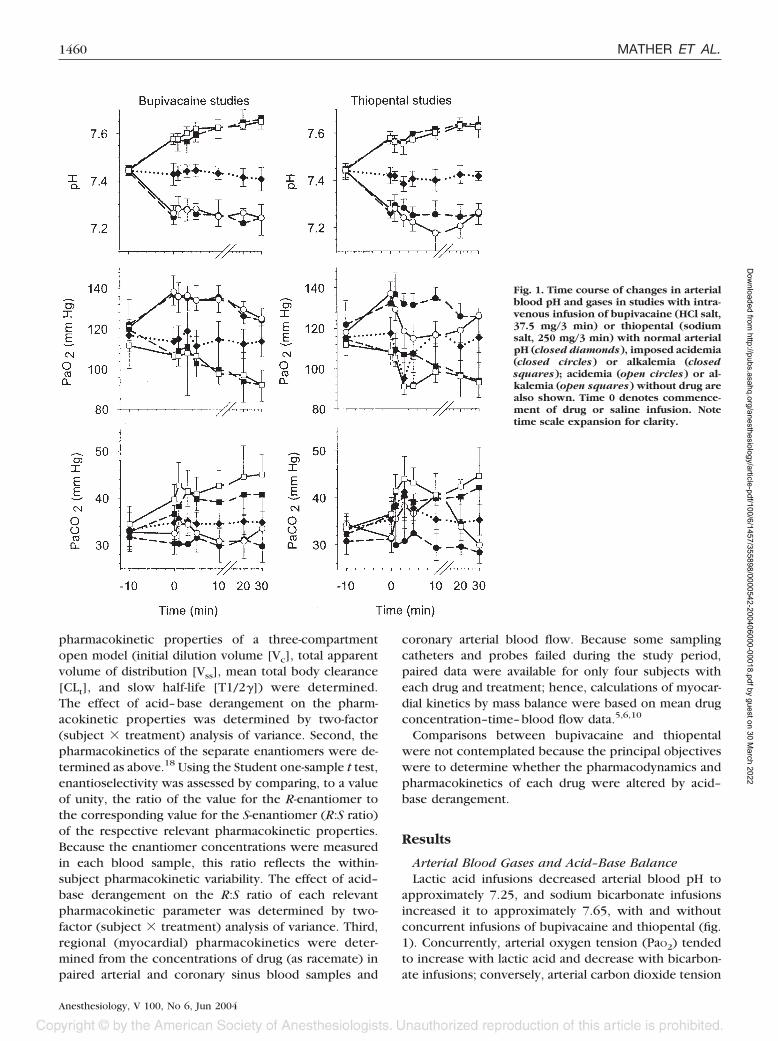
approximately 7.25, and sodium bicarbonate infusionsincreased it to approximately 7.65, with and withoutconcurrent infusions of bupivacaine and thiopental (fig.1). Concurrently, arterial oxygen tension (PaO2) tendedto increase with lactic acid and decrease with bicarbon-ate infusions; conversely, arterial carbon dioxide tension
Fig. 1. Time course of changes in arterialblood pH and gases in studies with intra-venous infusion of bupivacaine (HCl salt,37.5 mg/3 min) or thiopental (sodiumsalt, 250 mg/3 min) with normal arterialpH (closed diamonds), imposed acidemia(closed circles) or alkalemia (closedsquares); acidemia (open circles) or al-kalemia (open squares) without drug arealso shown. Time 0 denotes commence-ment of drug or saline infusion. Notetime scale expansion for clarity.
1460 MATHER ET AL.
Anesthesiology, V 100, No 6, Jun 2004
Dow
nloaded from http://pubs.asahq.org/anesthesiology/article-pdf/100/6/1457/355898/0000542-200406000-00018.pdf by guest on 30 M
arch 2022

(PaCO2) tended to increase with bicarbonate and de-crease with lactic acid infusion. However, the animalswere neither hypoxemic nor hypercapnic during thestudies.
Hemodynamic and Electrocardiographic EffectsMean within-subject predrug values did not differ be-
tween treatments with the one exception of QTc intervalwith thiopental (see discussion of effects of thiopentallater in this section). Figure 2 shows the representative
time course of effects for raw data and for automaticbaseline-corrected data (expressed as percent of base-line) for LV dP/dtmax with thiopental infusion. Withnormal arterial pH, both bupivacaine and thiopental al-ways produced maximum drug-induced changes within5 min with recovery by 10–15 min. The maximumchanges (Emax or Emin) paralleled the changes in sums ofeffect differences values, which accounted for differ-ences in the time courses of effects; therefore, for brev-ity, sums of effect differences data are not shown.
Fig. 2. Time course of changes to left ven-tricular dP/dtmax with intravenous infu-sion of thiopental (sodium salt, 250 mg/3 min) under conditions of normal arte-rial pH, imposed acidemia, or alkalemia.Effects of imposed acidemia or alkalemiawithout drug are also shown. Data areshown as mean (center thick lines) �SEM (outside thin lines) of absolute rawdata (left panels) and percent of baselineafter automatic baseline correction (rightpanels). Time 0 denotes commencementof drug or saline (control) infusion. Notetime scale expansion for clarity.
1461THIOPENTAL AND BUPIVACAINE PK/PD WITH pH DERANGEMENT
Anesthesiology, V 100, No 6, Jun 2004
Dow
nloaded from http://pubs.asahq.org/anesthesiology/article-pdf/100/6/1457/355898/0000542-200406000-00018.pdf by guest on 30 M
arch 2022
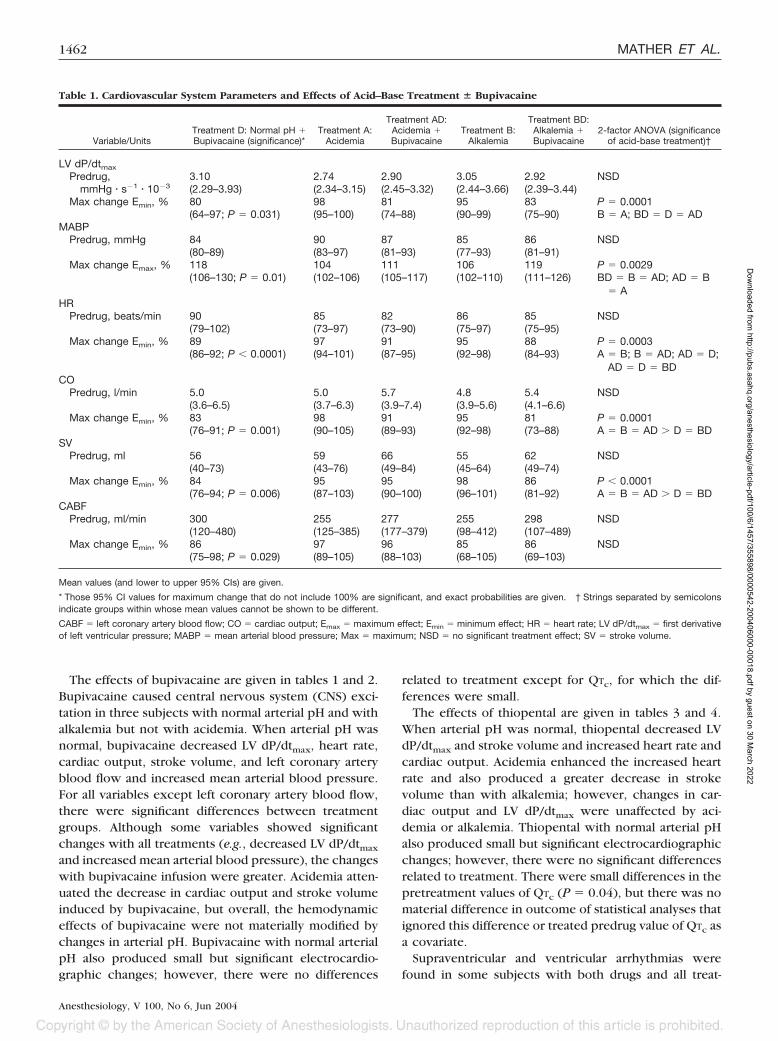
The effects of bupivacaine are given in tables 1 and 2.Bupivacaine caused central nervous system (CNS) exci-tation in three subjects with normal arterial pH and withalkalemia but not with acidemia. When arterial pH wasnormal, bupivacaine decreased LV dP/dtmax, heart rate,cardiac output, stroke volume, and left coronary arteryblood flow and increased mean arterial blood pressure.For all variables except left coronary artery blood flow,there were significant differences between treatmentgroups. Although some variables showed significantchanges with all treatments (e.g., decreased LV dP/dtmax
and increased mean arterial blood pressure), the changeswith bupivacaine infusion were greater. Acidemia atten-uated the decrease in cardiac output and stroke volumeinduced by bupivacaine, but overall, the hemodynamiceffects of bupivacaine were not materially modified bychanges in arterial pH. Bupivacaine with normal arterialpH also produced small but significant electrocardio-graphic changes; however, there were no differences
related to treatment except for QTc, for which the dif-ferences were small.
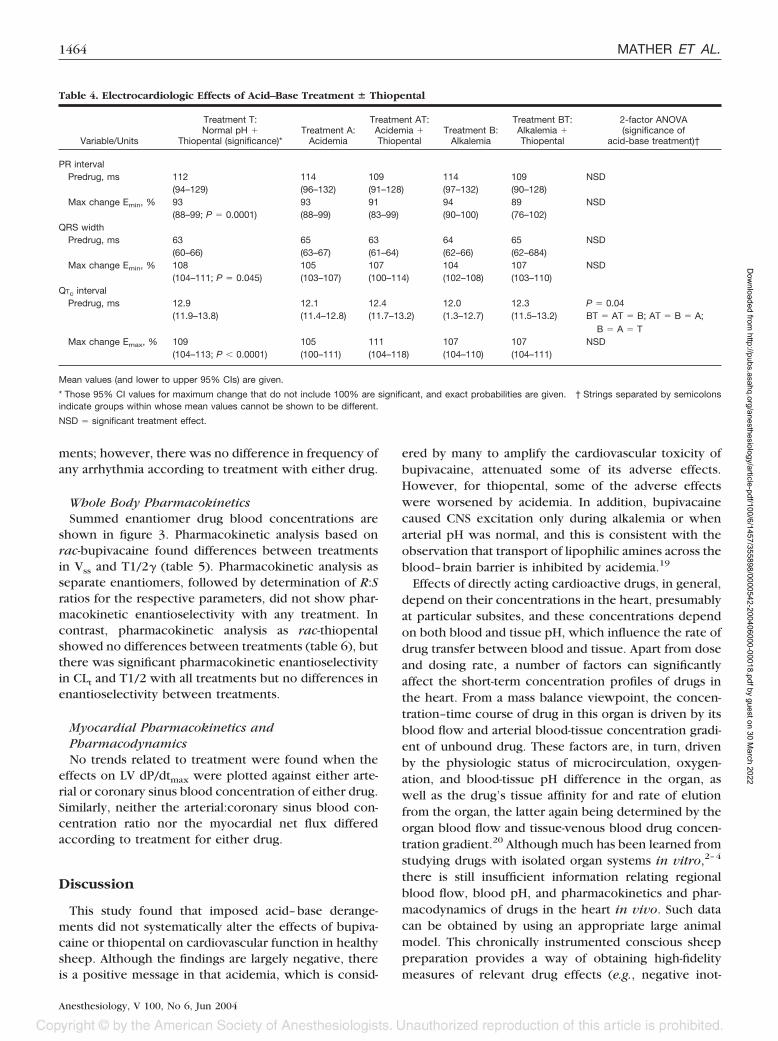
The effects of thiopental are given in tables 3 and 4.When arterial pH was normal, thiopental decreased LVdP/dtmax and stroke volume and increased heart rate andcardiac output. Acidemia enhanced the increased heartrate and also produced a greater decrease in strokevolume than with alkalemia; however, changes in car-diac output and LV dP/dtmax were unaffected by aci-demia or alkalemia. Thiopental with normal arterial pHalso produced small but significant electrocardiographicchanges; however, there were no significant differencesrelated to treatment. There were small differences in thepretreatment values of QTc (P � 0.04), but there was nomaterial difference in outcome of statistical analyses thatignored this difference or treated predrug value of QTc asa covariate.
Supraventricular and ventricular arrhythmias werefound in some subjects with both drugs and all treat-
Table 1. Cardiovascular System Parameters and Effects of Acid–Base Treatment � Bupivacaine
Variable/UnitsTreatment D: Normal pH �Bupivacaine (significance)*
Treatment A:Acidemia
Treatment AD:Acidemia �Bupivacaine
Treatment B:Alkalemia
Treatment BD:Alkalemia �Bupivacaine
2-factor ANOVA (significanceof acid-base treatment)†
LV dP/dtmax
Predrug, 3.10 2.74 2.90 3.05 2.92 NSDmmHg � s�1 � 10�3 (2.29–3.93) (2.34–3.15) (2.45–3.32) (2.44–3.66) (2.39–3.44)
Max change Emin, % 80 98 81 95 83 P � 0.0001(64–97; P � 0.031) (95–100) (74–88) (90–99) (75–90) B � A; BD � D � AD
MABPPredrug, mmHg 84 90 87 85 86 NSD
(80–89) (83–97) (81–93) (77–93) (81–91)Max change Emax, % 118 104 111 106 119 P � 0.0029
(106–130; P � 0.01) (102–106) (105–117) (102–110) (111–126) BD � B � AD; AD � B� A
HRPredrug, beats/min 90 85 82 86 85 NSD
(79–102) (73–97) (73–90) (75–97) (75–95)Max change Emin, % 89 97 91 95 88 P � 0.0003
(86–92; P � 0.0001) (94–101) (87–95) (92–98) (84–93) A � B; B � AD; AD � D;AD � D � BD
COPredrug, l/min 5.0 5.0 5.7 4.8 5.4 NSD
(3.6–6.5) (3.7–6.3) (3.9–7.4) (3.9–5.6) (4.1–6.6)Max change Emin, % 83 98 91 95 81 P � 0.0001
(76–91; P � 0.001) (90–105) (89–93) (92–98) (73–88) A � B � AD � D � BDSV
Predrug, ml 56 59 66 55 62 NSD(40–73) (43–76) (49–84) (45–64) (49–74)
Max change Emin, % 84 95 95 98 86 P � 0.0001(76–94; P � 0.006) (87–103) (90–100) (96–101) (81–92) A � B � AD � D � BD
CABFPredrug, ml/min 300 255 277 255 298 NSD
(120–480) (125–385) (177–379) (98–412) (107–489)Max change Emin, % 86 97 96 85 86 NSD
(75–98; P � 0.029) (89–105) (88–103) (68–105) (69–103)
Mean values (and lower to upper 95% CIs) are given.
* Those 95% CI values for maximum change that do not include 100% are significant, and exact probabilities are given. † Strings separated by semicolonsindicate groups within whose mean values cannot be shown to be different.
CABF � left coronary artery blood flow; CO � cardiac output; Emax � maximum effect; Emin � minimum effect; HR � heart rate; LV dP/dtmax � first derivativeof left ventricular pressure; MABP � mean arterial blood pressure; Max � maximum; NSD � no significant treatment effect; SV � stroke volume.
1462 MATHER ET AL.
Anesthesiology, V 100, No 6, Jun 2004
Dow
nloaded from http://pubs.asahq.org/anesthesiology/article-pdf/100/6/1457/355898/0000542-200406000-00018.pdf by guest on 30 M
arch 2022
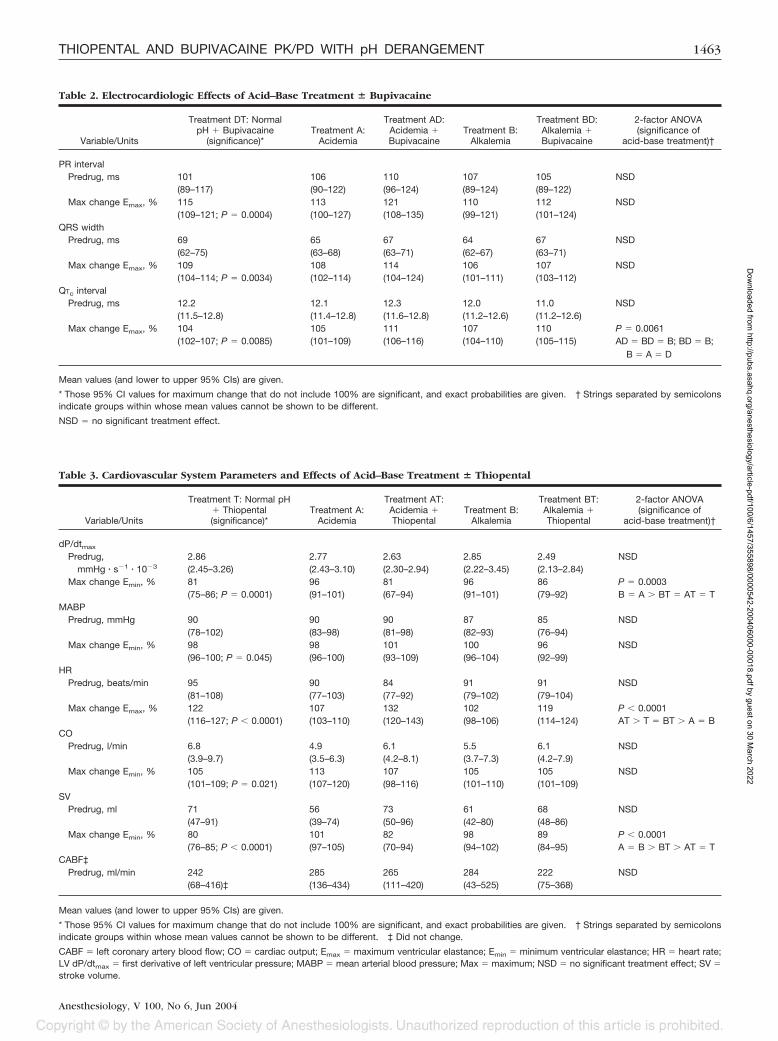
Table 3. Cardiovascular System Parameters and Effects of Acid–Base Treatment � Thiopental
Variable/Units
Treatment T: Normal pH� Thiopental(significance)*
Treatment A:Acidemia
Treatment AT:Acidemia �Thiopental
Treatment B:Alkalemia
Treatment BT:Alkalemia �Thiopental
2-factor ANOVA(significance of
acid-base treatment)†
dP/dtmax
Predrug, 2.86 2.77 2.63 2.85 2.49 NSDmmHg � s�1 � 10�3 (2.45–3.26) (2.43–3.10) (2.30–2.94) (2.22–3.45) (2.13–2.84)
Max change Emin, % 81 96 81 96 86 P � 0.0003(75–86; P � 0.0001) (91–101) (67–94) (91–101) (79–92) B � A � BT � AT � T
MABPPredrug, mmHg 90 90 90 87 85 NSD
(78–102) (83–98) (81–98) (82–93) (76–94)Max change Emin, % 98 98 101 100 96 NSD
(96–100; P � 0.045) (96–100) (93–109) (96–104) (92–99)HR
Predrug, beats/min 95 90 84 91 91 NSD(81–108) (77–103) (77–92) (79–102) (79–104)
Max change Emax, % 122 107 132 102 119 P � 0.0001(116–127; P � 0.0001) (103–110) (120–143) (98–106) (114–124) AT � T � BT � A � B
COPredrug, l/min 6.8 4.9 6.1 5.5 6.1 NSD
(3.9–9.7) (3.5–6.3) (4.2–8.1) (3.7–7.3) (4.2–7.9)Max change Emin, % 105 113 107 105 105 NSD
(101–109; P � 0.021) (107–120) (98–116) (101–110) (101–109)SV
Predrug, ml 71 56 73 61 68 NSD(47–91) (39–74) (50–96) (42–80) (48–86)
Max change Emin, % 80 101 82 98 89 P � 0.0001(76–85; P � 0.0001) (97–105) (70–94) (94–102) (84–95) A � B � BT � AT � T
CABF‡Predrug, ml/min 242 285 265 284 222 NSD
(68–416)‡ (136–434) (111–420) (43–525) (75–368)
Mean values (and lower to upper 95% CIs) are given.
* Those 95% CI values for maximum change that do not include 100% are significant, and exact probabilities are given. † Strings separated by semicolonsindicate groups within whose mean values cannot be shown to be different. ‡ Did not change.
CABF � left coronary artery blood flow; CO � cardiac output; Emax � maximum ventricular elastance; Emin � minimum ventricular elastance; HR � heart rate;LV dP/dtmax � first derivative of left ventricular pressure; MABP � mean arterial blood pressure; Max � maximum; NSD � no significant treatment effect; SV �stroke volume.
Table 2. Electrocardiologic Effects of Acid–Base Treatment � Bupivacaine
Variable/Units
Treatment DT: NormalpH � Bupivacaine
(significance)*Treatment A:
Acidemia
Treatment AD:Acidemia �Bupivacaine
Treatment B:Alkalemia
Treatment BD:Alkalemia �Bupivacaine
2-factor ANOVA(significance of
acid-base treatment)†
PR intervalPredrug, ms 101 106 110 107 105 NSD
(89–117) (90–122) (96–124) (89–124) (89–122)Max change Emax, % 115 113 121 110 112 NSD
(109–121; P � 0.0004) (100–127) (108–135) (99–121) (101–124)QRS width
Predrug, ms 69 65 67 64 67 NSD(62–75) (63–68) (63–71) (62–67) (63–71)
Max change Emax, % 109 108 114 106 107 NSD(104–114; P � 0.0034) (102–114) (104–124) (101–111) (103–112)
QTc intervalPredrug, ms 12.2 12.1 12.3 12.0 11.0 NSD
(11.5–12.8) (11.4–12.8) (11.6–12.8) (11.2–12.6) (11.2–12.6)Max change Emax, % 104 105 111 107 110 P � 0.0061
(102–107; P � 0.0085) (101–109) (106–116) (104–110) (105–115) AD � BD � B; BD � B;B � A � D
Mean values (and lower to upper 95% CIs) are given.
* Those 95% CI values for maximum change that do not include 100% are significant, and exact probabilities are given. † Strings separated by semicolonsindicate groups within whose mean values cannot be shown to be different.
NSD � no significant treatment effect.
1463THIOPENTAL AND BUPIVACAINE PK/PD WITH pH DERANGEMENT
Anesthesiology, V 100, No 6, Jun 2004
Dow
nloaded from http://pubs.asahq.org/anesthesiology/article-pdf/100/6/1457/355898/0000542-200406000-00018.pdf by guest on 30 M
arch 2022
ments; however, there was no difference in frequency ofany arrhythmia according to treatment with either drug.
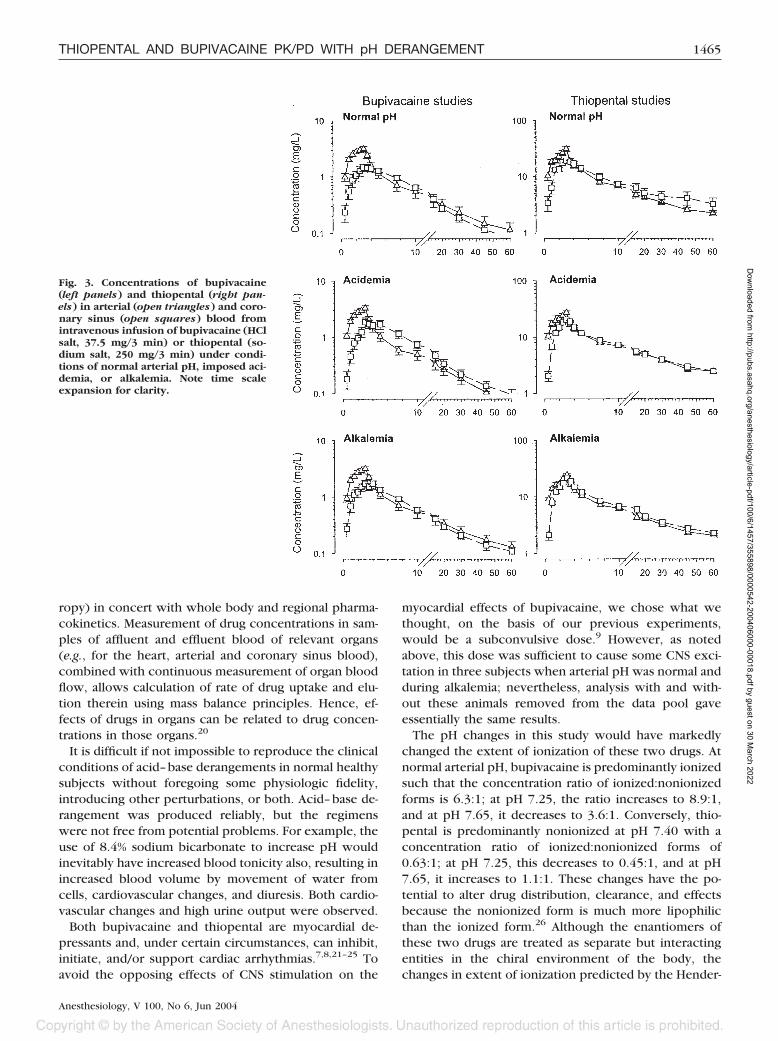
Whole Body PharmacokineticsSummed enantiomer drug blood concentrations are
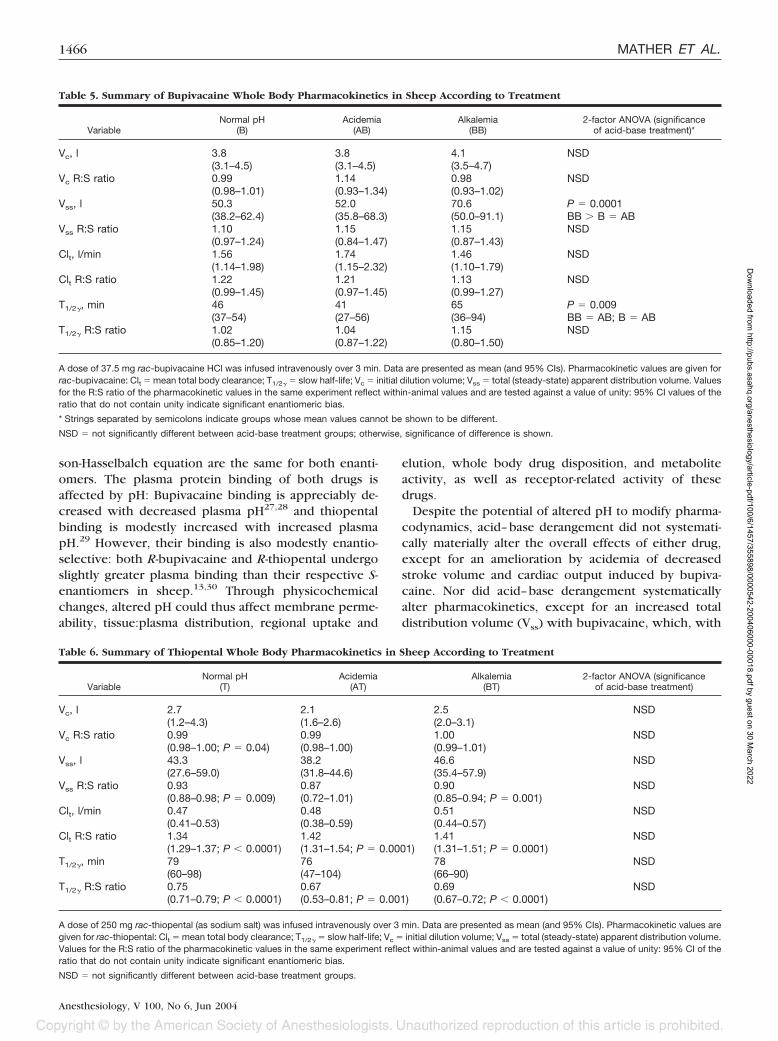
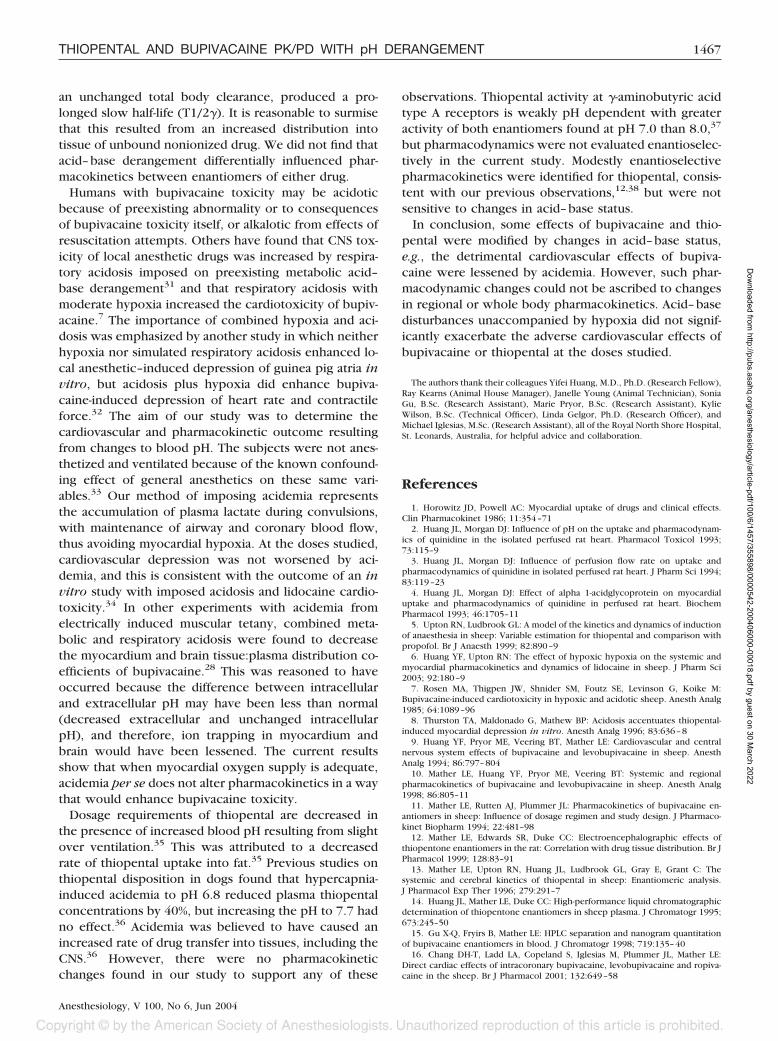
shown in figure 3. Pharmacokinetic analysis based onrac-bupivacaine found differences between treatmentsin Vss and T1/2� (table 5). Pharmacokinetic analysis asseparate enantiomers, followed by determination of R:Sratios for the respective parameters, did not show phar-macokinetic enantioselectivity with any treatment. Incontrast, pharmacokinetic analysis as rac-thiopentalshowed no differences between treatments (table 6), butthere was significant pharmacokinetic enantioselectivityin CLt and T1/2 with all treatments but no differences inenantioselectivity between treatments.
Myocardial Pharmacokinetics andPharmacodynamicsNo trends related to treatment were found when the
effects on LV dP/dtmax were plotted against either arte-rial or coronary sinus blood concentration of either drug.Similarly, neither the arterial:coronary sinus blood con-centration ratio nor the myocardial net flux differedaccording to treatment for either drug.
Discussion
This study found that imposed acid–base derange-ments did not systematically alter the effects of bupiva-caine or thiopental on cardiovascular function in healthysheep. Although the findings are largely negative, thereis a positive message in that acidemia, which is consid-
ered by many to amplify the cardiovascular toxicity ofbupivacaine, attenuated some of its adverse effects.However, for thiopental, some of the adverse effectswere worsened by acidemia. In addition, bupivacainecaused CNS excitation only during alkalemia or whenarterial pH was normal, and this is consistent with theobservation that transport of lipophilic amines across theblood–brain barrier is inhibited by acidemia.19
Effects of directly acting cardioactive drugs, in general,depend on their concentrations in the heart, presumablyat particular subsites, and these concentrations dependon both blood and tissue pH, which influence the rate ofdrug transfer between blood and tissue. Apart from doseand dosing rate, a number of factors can significantlyaffect the short-term concentration profiles of drugs inthe heart. From a mass balance viewpoint, the concen-tration–time course of drug in this organ is driven by itsblood flow and arterial blood-tissue concentration gradi-ent of unbound drug. These factors are, in turn, drivenby the physiologic status of microcirculation, oxygen-ation, and blood-tissue pH difference in the organ, aswell as the drug’s tissue affinity for and rate of elutionfrom the organ, the latter again being determined by theorgan blood flow and tissue-venous blood drug concen-tration gradient.20 Although much has been learned fromstudying drugs with isolated organ systems in vitro,2–4
there is still insufficient information relating regionalblood flow, blood pH, and pharmacokinetics and phar-macodynamics of drugs in the heart in vivo. Such datacan be obtained by using an appropriate large animalmodel. This chronically instrumented conscious sheeppreparation provides a way of obtaining high-fidelitymeasures of relevant drug effects (e.g., negative inot-
Table 4. Electrocardiologic Effects of Acid–Base Treatment � Thiopental
Variable/Units
Treatment T:Normal pH �
Thiopental (significance)*Treatment A:
Acidemia
Treatment AT:Acidemia �Thiopental
Treatment B:Alkalemia
Treatment BT:Alkalemia �Thiopental
2-factor ANOVA(significance of
acid-base treatment)†
PR intervalPredrug, ms 112 114 109 114 109 NSD
(94–129) (96–132) (91–128) (97–132) (90–128)Max change Emin, % 93 93 91 94 89 NSD
(88–99; P � 0.0001) (88–99) (83–99) (90–100) (76–102)QRS width
Predrug, ms 63 65 63 64 65 NSD(60–66) (63–67) (61–64) (62–66) (62–684)
Max change Emin, % 108 105 107 104 107 NSD(104–111; P � 0.045) (103–107) (100–114) (102–108) (103–110)
QTc intervalPredrug, ms 12.9 12.1 12.4 12.0 12.3 P � 0.04
(11.9–13.8) (11.4–12.8) (11.7–13.2) (1.3–12.7) (11.5–13.2) BT � AT � B; AT � B � A;B � A � T
Max change Emax, % 109 105 111 107 107 NSD(104–113; P � 0.0001) (100–111) (104–118) (104–110) (104–111)
Mean values (and lower to upper 95% CIs) are given.
* Those 95% CI values for maximum change that do not include 100% are significant, and exact probabilities are given. † Strings separated by semicolonsindicate groups within whose mean values cannot be shown to be different.
NSD � significant treatment effect.
1464 MATHER ET AL.
Anesthesiology, V 100, No 6, Jun 2004
Dow
nloaded from http://pubs.asahq.org/anesthesiology/article-pdf/100/6/1457/355898/0000542-200406000-00018.pdf by guest on 30 M
arch 2022
ropy) in concert with whole body and regional pharma-cokinetics. Measurement of drug concentrations in sam-ples of affluent and effluent blood of relevant organs(e.g., for the heart, arterial and coronary sinus blood),combined with continuous measurement of organ bloodflow, allows calculation of rate of drug uptake and elu-tion therein using mass balance principles. Hence, ef-fects of drugs in organs can be related to drug concen-trations in those organs.20
It is difficult if not impossible to reproduce the clinicalconditions of acid–base derangements in normal healthysubjects without foregoing some physiologic fidelity,introducing other perturbations, or both. Acid–base de-rangement was produced reliably, but the regimenswere not free from potential problems. For example, theuse of 8.4% sodium bicarbonate to increase pH wouldinevitably have increased blood tonicity also, resulting inincreased blood volume by movement of water fromcells, cardiovascular changes, and diuresis. Both cardio-vascular changes and high urine output were observed.
Both bupivacaine and thiopental are myocardial de-pressants and, under certain circumstances, can inhibit,initiate, and/or support cardiac arrhythmias.7,8,21–25 Toavoid the opposing effects of CNS stimulation on the
myocardial effects of bupivacaine, we chose what wethought, on the basis of our previous experiments,would be a subconvulsive dose.9 However, as notedabove, this dose was sufficient to cause some CNS exci-tation in three subjects when arterial pH was normal andduring alkalemia; nevertheless, analysis with and with-out these animals removed from the data pool gaveessentially the same results.
The pH changes in this study would have markedlychanged the extent of ionization of these two drugs. Atnormal arterial pH, bupivacaine is predominantly ionizedsuch that the concentration ratio of ionized:nonionizedforms is 6.3:1; at pH 7.25, the ratio increases to 8.9:1,and at pH 7.65, it decreases to 3.6:1. Conversely, thio-pental is predominantly nonionized at pH 7.40 with aconcentration ratio of ionized:nonionized forms of0.63:1; at pH 7.25, this decreases to 0.45:1, and at pH7.65, it increases to 1.1:1. These changes have the po-tential to alter drug distribution, clearance, and effectsbecause the nonionized form is much more lipophilicthan the ionized form.26 Although the enantiomers ofthese two drugs are treated as separate but interactingentities in the chiral environment of the body, thechanges in extent of ionization predicted by the Hender-
Fig. 3. Concentrations of bupivacaine(left panels) and thiopental (right pan-els) in arterial (open triangles) and coro-nary sinus (open squares) blood fromintravenous infusion of bupivacaine (HClsalt, 37.5 mg/3 min) or thiopental (so-dium salt, 250 mg/3 min) under condi-tions of normal arterial pH, imposed aci-demia, or alkalemia. Note time scaleexpansion for clarity.
1465THIOPENTAL AND BUPIVACAINE PK/PD WITH pH DERANGEMENT
Anesthesiology, V 100, No 6, Jun 2004
Dow
nloaded from http://pubs.asahq.org/anesthesiology/article-pdf/100/6/1457/355898/0000542-200406000-00018.pdf by guest on 30 M
arch 2022
son-Hasselbalch equation are the same for both enanti-omers. The plasma protein binding of both drugs isaffected by pH: Bupivacaine binding is appreciably de-creased with decreased plasma pH27,28 and thiopentalbinding is modestly increased with increased plasmapH.29 However, their binding is also modestly enantio-selective: both R-bupivacaine and R-thiopental undergoslightly greater plasma binding than their respective S-enantiomers in sheep.13,30 Through physicochemicalchanges, altered pH could thus affect membrane perme-ability, tissue:plasma distribution, regional uptake and
elution, whole body drug disposition, and metaboliteactivity, as well as receptor-related activity of thesedrugs.
Despite the potential of altered pH to modify pharma-codynamics, acid–base derangement did not systemati-cally materially alter the overall effects of either drug,except for an amelioration by acidemia of decreasedstroke volume and cardiac output induced by bupiva-caine. Nor did acid–base derangement systematicallyalter pharmacokinetics, except for an increased totaldistribution volume (Vss) with bupivacaine, which, with
Table 5. Summary of Bupivacaine Whole Body Pharmacokinetics in Sheep According to Treatment
VariableNormal pH
(B)Acidemia
(AB)Alkalemia
(BB)2-factor ANOVA (significance
of acid-base treatment)*
Vc, l 3.8 3.8 4.1 NSD(3.1–4.5) (3.1–4.5) (3.5–4.7)
Vc R:S ratio 0.99 1.14 0.98 NSD(0.98–1.01) (0.93–1.34) (0.93–1.02)
Vss, l 50.3 52.0 70.6 P � 0.0001(38.2–62.4) (35.8–68.3) (50.0–91.1) BB � B � AB
Vss R:S ratio 1.10 1.15 1.15 NSD(0.97–1.24) (0.84–1.47) (0.87–1.43)
Clt, l/min 1.56 1.74 1.46 NSD(1.14–1.98) (1.15–2.32) (1.10–1.79)
Clt R:S ratio 1.22 1.21 1.13 NSD(0.99–1.45) (0.97–1.45) (0.99–1.27)
T1/2�, min 46 41 65 P � 0.009(37–54) (27–56) (36–94) BB � AB; B � AB
T1/2� R:S ratio 1.02 1.04 1.15 NSD(0.85–1.20) (0.87–1.22) (0.80–1.50)
A dose of 37.5 mg rac-bupivacaine HCl was infused intravenously over 3 min. Data are presented as mean (and 95% CIs). Pharmacokinetic values are given forrac-bupivacaine: Clt � mean total body clearance; T1/2� � slow half-life; Vc � initial dilution volume; Vss � total (steady-state) apparent distribution volume. Valuesfor the R:S ratio of the pharmacokinetic values in the same experiment reflect within-animal values and are tested against a value of unity: 95% CI values of theratio that do not contain unity indicate significant enantiomeric bias.
* Strings separated by semicolons indicate groups whose mean values cannot be shown to be different.
NSD � not significantly different between acid-base treatment groups; otherwise, significance of difference is shown.
Table 6. Summary of Thiopental Whole Body Pharmacokinetics in Sheep According to Treatment
VariableNormal pH
(T)Acidemia
(AT)Alkalemia
(BT)2-factor ANOVA (significance
of acid-base treatment)
Vc, l 2.7 2.1 2.5 NSD(1.2–4.3) (1.6–2.6) (2.0–3.1)
Vc R:S ratio 0.99 0.99 1.00 NSD(0.98–1.00; P � 0.04) (0.98–1.00) (0.99–1.01)
Vss, l 43.3 38.2 46.6 NSD(27.6–59.0) (31.8–44.6) (35.4–57.9)
Vss R:S ratio 0.93 0.87 0.90 NSD(0.88–0.98; P � 0.009) (0.72–1.01) (0.85–0.94; P � 0.001)
Clt, l/min 0.47 0.48 0.51 NSD(0.41–0.53) (0.38–0.59) (0.44–0.57)
Clt R:S ratio 1.34 1.42 1.41 NSD(1.29–1.37; P � 0.0001) (1.31–1.54; P � 0.0001) (1.31–1.51; P � 0.0001)
T1/2�, min 79 76 78 NSD(60–98) (47–104) (66–90)
T1/2� R:S ratio 0.75 0.67 0.69 NSD(0.71–0.79; P � 0.0001) (0.53–0.81; P � 0.001) (0.67–0.72; P � 0.0001)
A dose of 250 mg rac-thiopental (as sodium salt) was infused intravenously over 3 min. Data are presented as mean (and 95% CIs). Pharmacokinetic values aregiven for rac-thiopental: Clt � mean total body clearance; T1/2� � slow half-life; Vc � initial dilution volume; Vss � total (steady-state) apparent distribution volume.Values for the R:S ratio of the pharmacokinetic values in the same experiment reflect within-animal values and are tested against a value of unity: 95% CI of theratio that do not contain unity indicate significant enantiomeric bias.
NSD � not significantly different between acid-base treatment groups.
1466 MATHER ET AL.
Anesthesiology, V 100, No 6, Jun 2004
Dow
nloaded from http://pubs.asahq.org/anesthesiology/article-pdf/100/6/1457/355898/0000542-200406000-00018.pdf by guest on 30 M
arch 2022
an unchanged total body clearance, produced a pro-longed slow half-life (T1/2�). It is reasonable to surmisethat this resulted from an increased distribution intotissue of unbound nonionized drug. We did not find thatacid–base derangement differentially influenced phar-macokinetics between enantiomers of either drug.
Humans with bupivacaine toxicity may be acidoticbecause of preexisting abnormality or to consequencesof bupivacaine toxicity itself, or alkalotic from effects ofresuscitation attempts. Others have found that CNS tox-icity of local anesthetic drugs was increased by respira-tory acidosis imposed on preexisting metabolic acid–base derangement31 and that respiratory acidosis withmoderate hypoxia increased the cardiotoxicity of bupiv-acaine.7 The importance of combined hypoxia and aci-dosis was emphasized by another study in which neitherhypoxia nor simulated respiratory acidosis enhanced lo-cal anesthetic–induced depression of guinea pig atria invitro, but acidosis plus hypoxia did enhance bupiva-caine-induced depression of heart rate and contractileforce.32 The aim of our study was to determine thecardiovascular and pharmacokinetic outcome resultingfrom changes to blood pH. The subjects were not anes-thetized and ventilated because of the known confound-ing effect of general anesthetics on these same vari-ables.33 Our method of imposing acidemia representsthe accumulation of plasma lactate during convulsions,with maintenance of airway and coronary blood flow,thus avoiding myocardial hypoxia. At the doses studied,cardiovascular depression was not worsened by aci-demia, and this is consistent with the outcome of an invitro study with imposed acidosis and lidocaine cardio-toxicity.34 In other experiments with acidemia fromelectrically induced muscular tetany, combined meta-bolic and respiratory acidosis were found to decreasethe myocardium and brain tissue:plasma distribution co-efficients of bupivacaine.28 This was reasoned to haveoccurred because the difference between intracellularand extracellular pH may have been less than normal(decreased extracellular and unchanged intracellularpH), and therefore, ion trapping in myocardium andbrain would have been lessened. The current resultsshow that when myocardial oxygen supply is adequate,acidemia per se does not alter pharmacokinetics in a waythat would enhance bupivacaine toxicity.
Dosage requirements of thiopental are decreased inthe presence of increased blood pH resulting from slightover ventilation.35 This was attributed to a decreasedrate of thiopental uptake into fat.35 Previous studies onthiopental disposition in dogs found that hypercapnia-induced acidemia to pH 6.8 reduced plasma thiopentalconcentrations by 40%, but increasing the pH to 7.7 hadno effect.36 Acidemia was believed to have caused anincreased rate of drug transfer into tissues, including theCNS.36 However, there were no pharmacokineticchanges found in our study to support any of these
observations. Thiopental activity at �-aminobutyric acidtype A receptors is weakly pH dependent with greateractivity of both enantiomers found at pH 7.0 than 8.0,37
but pharmacodynamics were not evaluated enantioselec-tively in the current study. Modestly enantioselectivepharmacokinetics were identified for thiopental, consis-tent with our previous observations,12,38 but were notsensitive to changes in acid–base status.
In conclusion, some effects of bupivacaine and thio-pental were modified by changes in acid–base status,e.g., the detrimental cardiovascular effects of bupiva-caine were lessened by acidemia. However, such phar-macodynamic changes could not be ascribed to changesin regional or whole body pharmacokinetics. Acid–basedisturbances unaccompanied by hypoxia did not signif-icantly exacerbate the adverse cardiovascular effects ofbupivacaine or thiopental at the doses studied.
The authors thank their colleagues Yifei Huang, M.D., Ph.D. (Research Fellow),Ray Kearns (Animal House Manager), Janelle Young (Animal Technician), SoniaGu, B.Sc. (Research Assistant), Marie Pryor, B.Sc. (Research Assistant), KylieWilson, B.Sc. (Technical Officer), Linda Gelgor, Ph.D. (Research Officer), andMichael Iglesias, M.Sc. (Research Assistant), all of the Royal North Shore Hospital,St. Leonards, Australia, for helpful advice and collaboration.
References
1. Horowitz JD, Powell AC: Myocardial uptake of drugs and clinical effects.Clin Pharmacokinet 1986; 11:354–71
2. Huang JL, Morgan DJ: Influence of pH on the uptake and pharmacodynam-ics of quinidine in the isolated perfused rat heart. Pharmacol Toxicol 1993;73:115–9
3. Huang JL, Morgan DJ: Influence of perfusion flow rate on uptake andpharmacodynamics of quinidine in isolated perfused rat heart. J Pharm Sci 1994;83:119–23
4. Huang JL, Morgan DJ: Effect of alpha 1-acidglycoprotein on myocardialuptake and pharmacodynamics of quinidine in perfused rat heart. BiochemPharmacol 1993; 46:1705–11
5. Upton RN, Ludbrook GL: A model of the kinetics and dynamics of inductionof anaesthesia in sheep: Variable estimation for thiopental and comparison withpropofol. Br J Anaesth 1999; 82:890–9
6. Huang YF, Upton RN: The effect of hypoxic hypoxia on the systemic andmyocardial pharmacokinetics and dynamics of lidocaine in sheep. J Pharm Sci2003; 92:180–9
7. Rosen MA, Thigpen JW, Shnider SM, Foutz SE, Levinson G, Koike M:Bupivacaine-induced cardiotoxicity in hypoxic and acidotic sheep. Anesth Analg1985; 64:1089–96
8. Thurston TA, Maldonado G, Mathew BP: Acidosis accentuates thiopental-induced myocardial depression in vitro. Anesth Analg 1996; 83:636–8
9. Huang YF, Pryor ME, Veering BT, Mather LE: Cardiovascular and centralnervous system effects of bupivacaine and levobupivacaine in sheep. AnesthAnalg 1994; 86:797–804
10. Mather LE, Huang YF, Pryor ME, Veering BT: Systemic and regionalpharmacokinetics of bupivacaine and levobupivacaine in sheep. Anesth Analg1998; 86:805–11
11. Mather LE, Rutten AJ, Plummer JL: Pharmacokinetics of bupivacaine en-antiomers in sheep: Influence of dosage regimen and study design. J Pharmaco-kinet Biopharm 1994; 22:481–98
12. Mather LE, Edwards SR, Duke CC: Electroencephalographic effects ofthiopentone enantiomers in the rat: Correlation with drug tissue distribution. Br JPharmacol 1999; 128:83–91
13. Mather LE, Upton RN, Huang JL, Ludbrook GL, Gray E, Grant C: Thesystemic and cerebral kinetics of thiopental in sheep: Enantiomeric analysis.J Pharmacol Exp Ther 1996; 279:291–7
14. Huang JL, Mather LE, Duke CC: High-performance liquid chromatographicdetermination of thiopentone enantiomers in sheep plasma. J Chromatogr 1995;673:245–50
15. Gu X-Q, Fryirs B, Mather LE: HPLC separation and nanogram quantitationof bupivacaine enantiomers in blood. J Chromatogr 1998; 719:135–40
16. Chang DH-T, Ladd LA, Copeland S, Iglesias M, Plummer JL, Mather LE:Direct cardiac effects of intracoronary bupivacaine, levobupivacaine and ropiva-caine in the sheep. Br J Pharmacol 2001; 132:649–58
1467THIOPENTAL AND BUPIVACAINE PK/PD WITH pH DERANGEMENT
Anesthesiology, V 100, No 6, Jun 2004
Dow
nloaded from http://pubs.asahq.org/anesthesiology/article-pdf/100/6/1457/355898/0000542-200406000-00018.pdf by guest on 30 M
arch 2022
17. Asai T: Confidence in statistical analysis (editorial). Br J Anaesth 2002;89:807–10
18. Sebalt RJ, Kreeft JH: Efficient pharmacokinetic modelling of complexinitial clinical dosing regimens: The universal elementary dosing regimen andcomputer algorithm EDFAST. J Pharm Sci 1987; 76:93–100
19. Pardridge WM, Sakiyama R, Fierer G: Blood-brain barrier transport andbrain sequestration of propranolol and lidocaine. Am J Physiol 1974; 247(part2):R582–8
20. Mather LE: Anatomical-physiological approaches in pharmacokinetics andpharmacodynamics. Clin Pharmacokinet 2001; 40:707–22
21. Eledjam JJ, de La Coussaye JE, Brugada J, Bassoul B, Gagnol JP, Fabregat JR,Masse C, Sassine A: In vitro study on mechanisms of bupivacaine-induced de-pression of myocardial contractility. Anesth Analg 1989; 69:732–5
22. Kanaya N, Zakhary DR, Murray PA, Damron DS: Thiopental alters contrac-tion, intracellular Ca2�, and pH in rat ventricular myocytes. ANESTHESIOLOGY 1998;89:202–14
23. Huang YF, Upton RN, Gray EC, Grant C, Zheng D, Ludbrook GL: Theeffects of short intravenous infusions of thiopentone on myocardial function,blood flow and oxygen consumption in sheep. Anaesth Intensive Care 1997;25:627–33
24. Napolitano CA, Raatikainen MJ, Martens JR, Dennis DM: Effects of intra-venous anesthetics on atrial wavelength and atrioventricular nodal conduction inguinea pig heart: Potential antidysrhythmic properties and clinical implications.ANESTHESIOLOGY 1996; 85:393–402
25. Mokriski BK, Nagle SE, Papuchis GC, Cohen SM, Waxman GJ: Electrocon-vulsive therapy-induced cardiac arrhythmias during anesthesia with methohexi-tal, thiamylal, or thiopental sodium. J Clin Anesth 1992; 4:208–12
26. Strichartz GR, Sanchez V, Arthur GR, Chafetz R, Martin D: Fundamentalproperties of local anesthetics: II. Measured octanol:buffer partition coefficientsand pKa values of clinically used drugs. Anesth Analg 1990; 71:158–70
27. Coyle DE, Denson DD, Thompson GA, Myers JA, Arthur GR, BridenbaughPO: The influence of lactic acid on the serum protein binding of bupivacaine:species differences. ANESTHESIOLOGY 1984; 61:127–33
28. Nancarrow C, Runciman WB, Mather LE, Upton RN, Plummer JL: Theinfluence of acidosis on the distribution of lidocaine and bupivacaine into themyocardium and brain of the sheep. Anesth Analg 1987; 66:925–35
29. Kingston HG, Kendrick A, Sommer KM, Olsen GD, Downes H: Binding ofthiopental in neonatal serum. ANESTHESIOLOGY 1990; 72:428–31
30. Rutten AJ, Mather LE, Plummer JL, Henning EC: Postoperative course ofplasma protein binding of lignocaine, ropivacaine and bupivacaine in sheep.J Pharm Pharmacol 1992; 44:355–8
31. Englesson S, Matousek M: Central nervous system effects of local anaes-thetic agents. Br J Anaesth 1975; 47(suppl):241–6
32. Sage DJ, Feldman HS, Arthur GR, Datta S, Ferretti AM, Norway SB, CovinoBG: Influence of lidocaine and bupivacaine on isolated guinea pig atria in thepresence of acidosis and hypoxia. Anesth Analg 1984; 63:1–7
33. Runciman WB, Mather LE: Effects of anaesthesia on drug disposition,Mechanisms of Action of Drugs in Anaesthetic Practice. Edited by Feldman SA,Scurr CF, Paton W. London, Edward Arnold, 1987, pp 87–122
34. Yakaitis RW, Thomas JD, Mahaffey JE: Cardiovascular effects of lidocaineduring acid-base imbalance. Anesth Analg 1976; 55:863–8
35. Dundee JW: Thiopentone and Other Barbiturates. Edinburgh, E&S Living-stone, 1956, pp 38–9
36. Brodie BB, Mark LC, Papper EM, Lief PA, Bernstein E, Rovenstine EA: Thefate of thiopental in man and a method for its estimation in biological material.J Pharmacol Exp Ther 1950; 98:85–96
37. Cordato D, Chebib M, Mather LE, Herkes GK, Johnston GA: Stereoselectiveinteraction of R-(�)-thiopentone and S-(-)-thiopentone enantiomers at the GABAA
receptors. Br J Pharmacol 1999; 128:77–8238. Cordato DJ, Mather LE, Gross AS, Herkes GK: Pharmacokinetics of thio-
pental enantiomers during and following prolonged high-dose therapy. ANESTHE-SIOLOGY 1999; 91:1693–702
Appendix: Automatic Baseline Correction
Corrections of baseline slope (baseline linear) drift and baselinefirst-order curvature (log or first exponential) were effected in twostages. The first corrected for first-order curvature of the baseline, andthe second corrected for slope of baseline. Higher-order correctionshad to be performed in diminishing order so that the last operationperformed was slope correction. We define a first-order curve as one ofwhich the first differential is linear. A second-order curve would be oneof which the differential is a first-order curve. Slope is zero-ordercurvature. A parabolic curve (y � ax2 � bx � c) differentiates to astraight line y � 2ax � b; thus, a parabola by our working definitionis a first-order curve.
Curvature correction was begun by finding the first differential ofthe data with respect to time and calculating its slope. This slope is theaverage second differentiation. The data were then differentiated againto find d2y/dx2. Dividing the average of the second differentiation by 2produced a correction factor that was subtracted from each pointduring integration of the second differential. A second integrationproduces the original data set, but corrected for first-order curvature.
The baseline slope was corrected similarly. Finding the slope of theundifferentiated and curve-corrected data and dividing it by two pro-vided the correction factor. On differentiation of the curvature-cor-rected data, we then corrected for slope by adding the correctionfactor to each datum at reintegration to provide a fully curvature- andslope-corrected baseline.
Only baseline data (before and after response) were used for findingthe two correction factors for data normalization. The correctionswere then applied to all data, both baseline and drug response. Theabscissa at the time of commencement of drug delivery was set to itsunprocessed value. By including the post–drug effect data in thecalculation of correction factors, correction was by interpolation,rather than extrapolation, because this is a much safer method for datapreservation. When correction factors were calculated from all data,rather than baseline only, the baseline correction was not as effective,although in many cases, the algorithm still improved correction of thebaseline drift.
1468 MATHER ET AL.
Anesthesiology, V 100, No 6, Jun 2004
Dow
nloaded from http://pubs.asahq.org/anesthesiology/article-pdf/100/6/1457/355898/0000542-200406000-00018.pdf by guest on 30 M
arch 2022