Effect of Organic and Conventional Production Methods on ...
21
HAL Id: anses-03318144 https://hal-anses.archives-ouvertes.fr/anses-03318144 Submitted on 9 Aug 2021 HAL is a multi-disciplinary open access archive for the deposit and dissemination of sci- entific research documents, whether they are pub- lished or not. The documents may come from teaching and research institutions in France or abroad, or from public or private research centers. L’archive ouverte pluridisciplinaire HAL, est destinée au dépôt et à la diffusion de documents scientifiques de niveau recherche, publiés ou non, émanant des établissements d’enseignement et de recherche français ou étrangers, des laboratoires publics ou privés. Effect of Organic and Conventional Production Methods on Fruit Yield and Nutritional Quality Parameters in Three Traditional Cretan Grape Varieties: Results from a Farm Survey Gultakin Hasanaliyeva, Eleni Chatzidimitrou, Juan Wang, Marcin Baranski, Nikolaos Volakakis, Panagiotis Pakos, Chris Seal, Eduardo Rosa, Emilia Markellou, Per Iversen, et al. To cite this version: Gultakin Hasanaliyeva, Eleni Chatzidimitrou, Juan Wang, Marcin Baranski, Nikolaos Volakakis, et al.. Effect of Organic and Conventional Production Methods on Fruit Yield and Nutritional Quality Parameters in Three Traditional Cretan Grape Varieties: Results from a Farm Survey. Foods, MDPI, 2021, 10 (2), pp.476. 10.3390/foods10020476. anses-03318144
-
Upload
khangminh22 -
Category
Documents
-
view
5 -
download
0
Transcript of Effect of Organic and Conventional Production Methods on ...

HAL Id: anses-03318144https://hal-anses.archives-ouvertes.fr/anses-03318144
Submitted on 9 Aug 2021
HAL is a multi-disciplinary open accessarchive for the deposit and dissemination of sci-entific research documents, whether they are pub-lished or not. The documents may come fromteaching and research institutions in France orabroad, or from public or private research centers.
L’archive ouverte pluridisciplinaire HAL, estdestinée au dépôt et à la diffusion de documentsscientifiques de niveau recherche, publiés ou non,émanant des établissements d’enseignement et derecherche français ou étrangers, des laboratoirespublics ou privés.
Effect of Organic and Conventional Production Methodson Fruit Yield and Nutritional Quality Parameters in
Three Traditional Cretan Grape Varieties: Results froma Farm Survey
Gultakin Hasanaliyeva, Eleni Chatzidimitrou, Juan Wang, Marcin Baranski,Nikolaos Volakakis, Panagiotis Pakos, Chris Seal, Eduardo Rosa, Emilia
Markellou, Per Iversen, et al.
To cite this version:Gultakin Hasanaliyeva, Eleni Chatzidimitrou, Juan Wang, Marcin Baranski, Nikolaos Volakakis, etal.. Effect of Organic and Conventional Production Methods on Fruit Yield and Nutritional QualityParameters in Three Traditional Cretan Grape Varieties: Results from a Farm Survey. Foods, MDPI,2021, 10 (2), pp.476. �10.3390/foods10020476�. �anses-03318144�

foods
Article
Effect of Organic and Conventional Production Methods onFruit Yield and Nutritional Quality Parameters in ThreeTraditional Cretan Grape Varieties: Results from a Farm Survey
Gultakin Hasanaliyeva 1,2,* , Eleni Chatzidimitrou 2,3, Juan Wang 2,4,5, Marcin Baranski 6 ,Nikolaos Volakakis 2,7, Panagiotis Pakos 2, Chris Seal 4 , Eduardo A. S. Rosa 8, Emilia Markellou 9 ,Per Ole Iversen 10,11 , Vanessa Vigar 12, Adam Willson 13, Bronwyn Barkla 13 , Carlo Leifert 10,13,*and Leonidas Rempelos 2,*
�����������������
Citation: Hasanaliyeva, G.;
Chatzidimitrou, E.; Wang, J.; Baranski,
M.; Volakakis, N.; Pakos, P.; Seal, C.;
Rosa, E.A.S.; Markellou, E.; Iversen,
P.O.; et al. Effect of Organic and
Conventional Production Methods on
Fruit Yield and Nutritional Quality
Parameters in Three Traditional
Cretan Grape Varieties: Results from
a Farm Survey. Foods 2021, 10, 476.
https://doi.org/10.3390/foods10020476
Academic Editor: Susana Río Segade
Received: 18 January 2021
Accepted: 17 February 2021
Published: 22 February 2021
Publisher’s Note: MDPI stays neutral
with regard to jurisdictional claims in
published maps and institutional affil-
iations.
Copyright: © 2021 by the authors.
Licensee MDPI, Basel, Switzerland.
This article is an open access article
distributed under the terms and
conditions of the Creative Commons
Attribution (CC BY) license (https://
creativecommons.org/licenses/by/
4.0/).
1 Department of Sustainable Crop and Food Protection, Faculty of Agriculture, Food and EnvironmentalSciences, Universita Catollica del Sacro Cuore, I-29122 Piacenza, Italy
2 Nafferton Ecological Farming Group, School of Agriculture, Food and Rural Development,Newcastle University, Newcastle upon Tyne NE1 7RU, UK; [email protected] (E.C.);[email protected] (J.W.); [email protected] (N.V.); [email protected] (P.P.)
3 Residues and Food Safety Unit, Regulated Products Assessment Department, French Agency for FoodEnvironmental and Occupational Health and Safety, France (ANSES), 94701 Maisons-Alfort, France
4 Human Nutrition Research Centre, Institute of Cellular Medicine, Newcastle University,Newcastle upon Tyne NE2 4HH, UK; [email protected]
5 School of Agriculture and Biology, Shanghai Jiao Tong University, Shanghai 200240, China6 Laboratory of Neurobiology, Nencki Institute of Experimental Biology, Polish Academy of Sciences,
Pasteura 3, 02-093 Warsaw, Poland; [email protected] Geokomi plc, Agriculture Consultancy, P.O. Box 21, Sivas-Faistos, GR 70200 Crete, Greece8 Centre for the Research and Technology of Agro-Environment and Biological Sciences,
Universidade de Trás-os-Montes e Alto Douro (UTAD), 5001-801, Vila Real, Portugal; [email protected] Department of Phytopathology, Benaki Phytopathological Institute (BPI), 14561 Athens, Greece;
[email protected] Department of Nutrition, IMB, University of Oslo, Sognsvannsveien, 0372 Oslo, Norway;
[email protected] Department of Haematology, Oslo University Hospital, 0372 Oslo, Norway12 NatMed, Southern Cross University, Military Road, Lismore, NSW 2480, Australia; [email protected] Southern Cross Plant Science, Southern Cross University, Military Road, Lismore, NSW 2480, Australia;
[email protected] (A.W.); [email protected] (B.B.)* Correspondence: [email protected] (G.H.); [email protected] (C.L.);
[email protected] (L.R.)
Abstract: The antioxidants found in grapes and wine have been linked to health benefits in humans,but may be affected by agronomic parameters, grape type/variety, and processing. Here, wereport results of a farm survey which investigated the effects of production system (organic vs.conventional) and grape variety on fruit yield, total antioxidant activity/capacity (TAA, assessedby the Trolox Equivalent Antioxidant Capacity (TEAC) and 2,2-diphenyl-1-picrylhydrazyl (DPPH)radical scavenging assays), and total concentrations of total phenolics (TPC) and anthocyanins(TAC) in grapes of one red (Kotsifali) and two white (Villana and/or Vidiano) traditional Cretangrape varieties. Analysis of variance (ANOVA) results showed that grape variety choice had amore substantial effect on TPC, TAA, and TAC than primary production protocols, and significantinteractions were identified between production system and grape variety choice for TAATEAC.Specifically, TAATEAC was significantly (57%) higher in organic than conventional Vidiano grapes,while there was no significant effect of production system on TAATEAC in Kotsifali and Villanagrapes. As expected from previous studies, the TAC was substantially higher in red Kotsifali grapes.Redundancy analysis (RDA) identified grape variety as the only strong explanatory variable/driverfor yield, TPC, TAA, and TAC of table grapes, and positive associations were detected between thevariety Vidiano and both TPC and TAATEAC. All other explanatory variables included in the RDA(including supplementary irrigation, orchard orientation, production system, soil type, vineyard age,plant density, and fertiliser inputs) explained only a small proportion of the additional variation.
Foods 2021, 10, 476. https://doi.org/10.3390/foods10020476 https://www.mdpi.com/journal/foods

Foods 2021, 10, 476 2 of 20
Keywords: table grapes; polyphenols; anthocyanins; antioxidant activity/capacity; Trolox Equiva-lent Antioxidant Capacity (TEAC); 2,2-diphenyl-1-picrylhydrazyl (DPPH); sugar content; organic;conventional; RDA
1. Introduction
Table grapes and wine are a rich source of phytochemicals with antioxidant activity,including polyphenols and anthocyanins [1,2], and both table grape consumption andmoderate wine consumption have been linked to positive effects on human health [3,4].Polyphenols and anthocyanins are secondary metabolites/phytochemicals that determine,or are associated with, important functions/characteristics in plants including growth,pigmentation, reproduction, and flavour [5]. They are also thought to be important com-ponents of the plants’ protective mechanisms against both biotic and abiotic stress (e.g.,pathogens, predators, and ultraviolet (UV) radiation) [6]. The concentrations of antioxidantcompounds in plants are known to be affected by a range of physiological and environ-mental factors, including ripeness of the fruit, variety choice, pedo-climatic conditions,agronomic practices, disease and pest damage, fruit maturity, and length of postharveststorage [1,6,7].
Consumer perception that organic foods have a higher sensory and nutritional qualityhas been a major driver for the increase in demand for organic fruit and vegetables,including grapes [8,9]. Some consumers also perceive table grapes and wine made fromtraditional grape varieties as having superior sensory quality characteristics, and thereare efforts to preserve the growing of traditional grape varieties for future exploitation ofdesirable agronomic (e.g., resistance/robustness), nutritional, and sensory traits [10].
Recent systematic reviews and meta-analyses reported that organic production meth-ods result in lower yields, but higher concentrations of phytochemical/antioxidants andhigher antioxidant activity in crops, and this was primarily linked to a lower and/or morebalanced supply of nitrogen when organic instead of mineral N-fertilisers are used [11,12].However, compared with other crops (e.g., cereals and vegetables) there is limited pub-lished information on the effect of organic management practices on grape yields, as wellas on sensory and nutritional quality parameters in table grapes and wine [1,2,13,14].
A recent United Kingdom (UK) retail survey confirmed that there are substantialdifferences in phenolic concentrations and antioxidant activity/capacity (measured by theTrolox Equivalent Antioxidant Capacity/2,2-azinobis-(3-ethylbenzothiazoline)-6-sulfonicacid (TEAC/ABTS) and 2,2-diphenyl-1-picrylhydrazyl (DPPH) methods) among grapetypes (white vs. red vs. black), but that significant differences in nutritional quality param-eters between organic and conventional table grapes could only be detected for specificwhite, red, and black varieties [15]. Although retail surveys provide the most accurateestimate of product quality at the point of consumption, information on pedo-climaticconditions, specific agronomic practices used (e.g., use of supplementary irrigation), andvineyard characteristics (e.g., vineyard age, spacing, and orientation) can usually not beobtained from retailers. Confounding effects of environmental and agronomic factorsthat may have contributed to the differences between varieties and production systemsobserved can, therefore, not be identified in retail surveys [15].
There are, to our knowledge, virtually no studies that compared antioxidant/phenoliclevels in indigenous, traditional Mediterranean grape varieties/landraces, and the effectsof organic and conventional production methods on their nutritional quality. Althoughthe production of many traditional varieties has declined substantially over the last 50years, they are thought to be more adapted/resistant to local abiotic (e.g., temperatureand water stress) and biotic (e.g., fungal diseases) stress factors [10,16,17]. In the contextof predictions for more variable and extreme weather conditions resulting from climatechange, the importance of preserving and promoting the production of indigenous, tradi-tional grape varieties (e.g., as a genetic reservoir for resistance, robustness, and resource

Foods 2021, 10, 476 3 of 20
use efficiency traits) is, therefore, increasingly recognized [10,16,17]. Robust, traditionalgrape genotypes with high phytochemical/antioxidant levels may be particularly suitablefor the organic/low-input sector, since they would deliver “added nutritional value” inline with consumer expectations/demands [8,9,14,18].
The main objective of the farm survey-based study reported here was, therefore, toidentify the effects of production system (organic vs, conventional) on the fruit yield andthe nutritional composition of one red (Kotsifali) and two white (Vidiano and Villana)indigenous, traditional Cretan grape varieties [19] that are used as table grapes and forwine production. A second objective was to compare the relative importance of (a) specificagronomic practices (e.g., fertilisation and irrigation), (b) soil type, (c) orchard parameters(e.g., age of plants and orientation of plant rows), (d) grape type/variety, and (e) productionsystem (organic vs. conventional) on grape yield and quality parameters using redundancyanalyses. Grapes were also assessed for sugar content (◦Brix), which is the determinantsensory quality parameter for table grapes, as well as for wine-making. Surveys werecarried out in two contrasting growing seasons to estimate potential confounding effects ofclimatic background conditions on grape performance.
2. Materials and Methods2.1. Grape Farm Survey Strategy
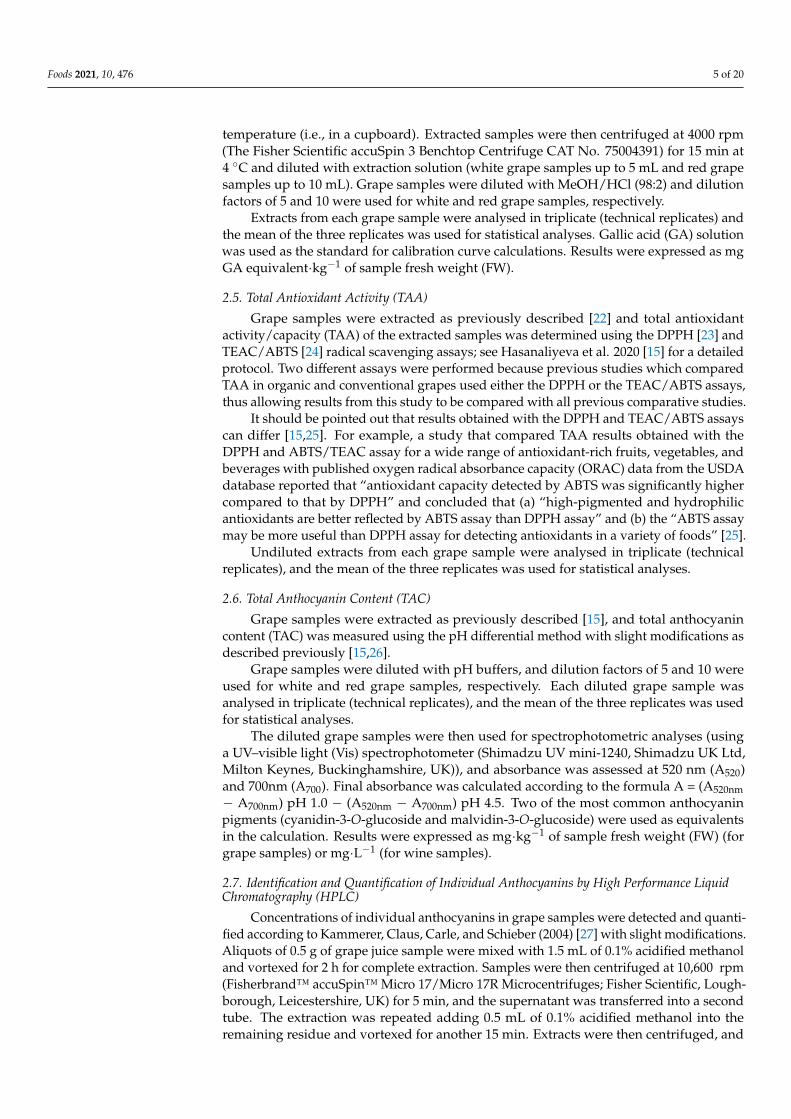
The farm survey was based on collecting grape samples and soil/agronomic/vineyarddata immediately before harvest on farms (vineyards) in the Heraklion region, which is amain grape production region of Crete, Greece. Grapes were collected in two successivegrowing seasons (2013/2014 and 2014/2015) with climatic conditions typical for the region(Figure 1). The average annual temperature was similar in both years (19.4 and 18.9 ◦C inthe 2013/2014 and 2014/2015 season, respectively, but total annual rainfall was lower inthe 2013/2014 (468 mm) than the 2014/2015 (691 mm) season. Moreover, in 2014, there wasvirtually no (1 mm) rain recorded in August, while, in 2015, there was substantial rainfall(28 mm) prior to harvest in August (Figure 1).
Figure 1. Total monthly precipitation and mean air temperature (◦C) in the 2013/2014 and 2015/2016 growing seasons.Data from Knossos weather station, Heraklion prefecture, Crete, Greece (elevation: 115 m; latitude: 35◦18′00′′ north (N);longitude: 25◦12′00′′ east (E); https://stratus.meteo.noa.gr/front accessed on 1 December 2020).

Foods 2021, 10, 476 4 of 20
On all participating farms, data on (a) grape yields (based on the total weight ofgrapes harvested in fields where grape samples were taken; weights were determinedat delivery to the winery) and (b) soil texture (all vineyards included in the survey hadeither sandy loam or clay loam soils) were recorded by investigators. A range of othervineyard and agronomic parameters were recorded via questionnaires with farmers orfarm managers (see Table S1, Supplementary Materials, for further information on thefarms/vineyards included in the study). The survey was repeated between mid-Augustand mid-September in 2014 and 2015. The three main local, organically, and conventionallygrown grape varieties (Kotsifali, Vidiano, and Vilana) were chosen for the farm survey.These traditional varieties are thought to be well adapted to the local environmentaland low-input agronomic background conditions for grapevine production in Crete (Dr.Manolis Kabourakis, Mediterranean University Crete, personal communication). Althoughmainly used for wine production, these varieties are also marketed and consumed asfresh fruit locally. Samples were collected from 22 vineyards in 2014 and 26 vineyardsin 2015. From each vineyard, 10 bunches of grapes were collected randomly by walkingin a zig-zag pattern through the field to generate samples covering the variation withinthe whole vineyard. They were placed into polyethylene cool boxes and transferred tothe Livadopa experimental station (Sivas, Festos, Crete), where they were prepared forlonger-term storage. Ten individual healthy grape berries were cut from each bunchusing scissors. Care was taken to leave a short 0.5–1 cm stem on each grape berry, toprevent wounding-related stress responses (e.g., induction of phenolic synthesis) in theberry. One hundred berries from 10 different bunches were then placed into labelled (date,management, vineyard name, and cultivar) plastic bags and stored in a−20 ◦C freezer. Thesame procedure was repeated for a set of backup samples. All samples were transported(on dry ice) to the School of Agriculture, Food and Rural Development at NewcastleUniversity, while the backup samples were stored in a −20 ◦C freezer at Geokomi Ltd.(Sivas, Crete, Greece). For sample preparation, grape berries were left to thaw for 1–2 h atambient temperature in their plastic bags. Each bag was then emptied into an aluminiumtray and weighed (about 150–200 g), followed by the removal of the short stem. Grapeberries were then cut in half to allow removal of all seeds and then homogenised (onlypulp and skin) for 30–120 s. Five aliquots of juice from each sample were then labelled(date, management, vineyard name, and cultivar) and transferred into a −80 ◦C freezeruntil used for different analyses.
2.2. Sugar and Dry Matter Content
Dry matter (DM) [20] and sugar content (SC) (OPTi Brix 54 Handheld Digital Refrac-tometer) were determined as physical properties.
2.3. Chemical Reagents
Folin–Ciocalteau (FC) phenol reagent, gallic acid, potassium persulfate, and radi-cal scavenging assay reagents (6-hydroxy-2,5,7,8-tetramethylchroman-2-carboxylic acid(Trolox), 2,2-diphenyl-1-picrylhydrazyl (DPPH), and 2,2-azinobis-(3-ethylbenzothiazoline)-6-sulfonic acid (ABTS)) were purchased from Sigma-Aldrich (St. Louis, MO, USA.). Sodiumcarbonate (SC), methanol, hydrochloric acid (HCl, 12 N), sodium chloride, sodium dihydro-gen phosphate, sodium hydrogen phosphate, potassium chloride, sodium acetate, formicacid, acetonitrile, and methanol (MeOH HPLC grade) were supplied by Fisher Scientific(Loughborough, Leicestershire, UK).
2.4. Total Phenolic Content (TPC)
Total phenolic content was determined using the Folin–Ciocalteau (FC) colorimetricassay method [21]; see Hasanaliyeva et al. 2020 [15] for a detailed protocol.
Grape samples were extracted according to Tassoni, Tango, and Ferri (2013) [21]. Halfa gram (0.5 g fresh weight (FW)) of homogenized grape sample was mixed with 4 mLof extraction solution (MeOH:HCl (98:2)) and incubated overnight in the dark at room
Foods 2021, 10, 476 5 of 20
temperature (i.e., in a cupboard). Extracted samples were then centrifuged at 4000 rpm(The Fisher Scientific accuSpin 3 Benchtop Centrifuge CAT No. 75004391) for 15 min at4 ◦C and diluted with extraction solution (white grape samples up to 5 mL and red grapesamples up to 10 mL). Grape samples were diluted with MeOH/HCl (98:2) and dilutionfactors of 5 and 10 were used for white and red grape samples, respectively.
Extracts from each grape sample were analysed in triplicate (technical replicates) andthe mean of the three replicates was used for statistical analyses. Gallic acid (GA) solutionwas used as the standard for calibration curve calculations. Results were expressed as mgGA equivalent·kg−1 of sample fresh weight (FW).
2.5. Total Antioxidant Activity (TAA)
Grape samples were extracted as previously described [22] and total antioxidantactivity/capacity (TAA) of the extracted samples was determined using the DPPH [23] andTEAC/ABTS [24] radical scavenging assays; see Hasanaliyeva et al. 2020 [15] for a detailedprotocol. Two different assays were performed because previous studies which comparedTAA in organic and conventional grapes used either the DPPH or the TEAC/ABTS assays,thus allowing results from this study to be compared with all previous comparative studies.
It should be pointed out that results obtained with the DPPH and TEAC/ABTS assayscan differ [15,25]. For example, a study that compared TAA results obtained with theDPPH and ABTS/TEAC assay for a wide range of antioxidant-rich fruits, vegetables, andbeverages with published oxygen radical absorbance capacity (ORAC) data from the USDAdatabase reported that “antioxidant capacity detected by ABTS was significantly highercompared to that by DPPH” and concluded that (a) “high-pigmented and hydrophilicantioxidants are better reflected by ABTS assay than DPPH assay” and (b) the “ABTS assaymay be more useful than DPPH assay for detecting antioxidants in a variety of foods” [25].
Undiluted extracts from each grape sample were analysed in triplicate (technicalreplicates), and the mean of the three replicates was used for statistical analyses.
2.6. Total Anthocyanin Content (TAC)
Grape samples were extracted as previously described [15], and total anthocyanincontent (TAC) was measured using the pH differential method with slight modifications asdescribed previously [15,26].
Grape samples were diluted with pH buffers, and dilution factors of 5 and 10 wereused for white and red grape samples, respectively. Each diluted grape sample wasanalysed in triplicate (technical replicates), and the mean of the three replicates was usedfor statistical analyses.
The diluted grape samples were then used for spectrophotometric analyses (usinga UV–visible light (Vis) spectrophotometer (Shimadzu UV mini-1240, Shimadzu UK Ltd,Milton Keynes, Buckinghamshire, UK)), and absorbance was assessed at 520 nm (A520)and 700nm (A700). Final absorbance was calculated according to the formula A = (A520nm− A700nm) pH 1.0 − (A520nm − A700nm) pH 4.5. Two of the most common anthocyaninpigments (cyanidin-3-O-glucoside and malvidin-3-O-glucoside) were used as equivalentsin the calculation. Results were expressed as mg·kg−1 of sample fresh weight (FW) (forgrape samples) or mg·L−1 (for wine samples).
2.7. Identification and Quantification of Individual Anthocyanins by High Performance LiquidChromatography (HPLC)
Concentrations of individual anthocyanins in grape samples were detected and quanti-fied according to Kammerer, Claus, Carle, and Schieber (2004) [27] with slight modifications.Aliquots of 0.5 g of grape juice sample were mixed with 1.5 mL of 0.1% acidified methanoland vortexed for 2 h for complete extraction. Samples were then centrifuged at 10,600 rpm(Fisherbrand™ accuSpin™ Micro 17/Micro 17R Microcentrifuges; Fisher Scientific, Lough-borough, Leicestershire, UK) for 5 min, and the supernatant was transferred into a secondtube. The extraction was repeated adding 0.5 mL of 0.1% acidified methanol into theremaining residue and vortexed for another 15 min. Extracts were then centrifuged, and

Foods 2021, 10, 476 6 of 20
the supernatants were combined and re-centrifuged. After centrifugation, extracts werepassed through a 0.45 µS, 25 mm filter (Dutscher Scientific UK Ltd., Syringe Filter Nylon,non-sterile) and stored at −80 ◦C until analysis by HPLC.
Analyses and separation of individual anthocyanin components were performed usinga Phenomenex, SynergiTM 4 µm Hydro-RP 80 Å (C18 phase, 250 × 4.6 mm) column, fittedwith a C18 guard column (3.2–8.0 mm internal diameter (ID)) at a temperature of 25 ◦C. TheShimadzu HPLC system (Shimadzu UK Ltd, Milton Keynes, Buckinghamshire, UK) wasequipped with LabSolution software, a DGU-20A3R degasser, two LC-20AD pumps, anSIL-20AC HT autosampler, an SPD-M20A diode array detector, and a CTO-20AC columnoven. The detector was set to an acquisition range of 190–700 nm.
Water/formic acid/acetonitrile (A) (87:10:3) and water/formic acid/acetonitrile (B)(40:10:50) were used as the mobile phase with a flow rate of 0.8 mL·min−1. The gradientprogramme for the mobile phases (A:B) was as follows: 0.02 min (10:90), 5 min (10:90), 15min (25:75), 20 min (31:69), 25 min (40:60), 35 min (50:50), 45 min (100:0), 50 min (10:90), and55 min (10:90). An injection volume of 50 µL was used for all samples, and quantificationwas performed at 520 nm.
Identification was based on peak relative retention times and elution order of chro-matograms obtained by Kammerer et al. (2004) [27]. Individual anthocyanins were quanti-fied using a calibration curve of malvidin-3-O-glucoside in the range of 50 to 0.05 µg·mL−1.
2.8. Identification of Individual Anthocyanins by LC–MS
LC–MS analyses to confirm the identity of anthocyanins identified by HPLC analysiswas carried out by the Newcastle University Protein and Proteome Analysis (NUPPA)laboratory based on previously described methods [27–29]. Anthocyanin extracts wereprovided in a neat and 1/10 dilution. Samples were acidified with trifluoroacetic acid(TFA) to a final concentration of 0.1% (v/v). Each sample was analysed with an individualLC–MS experiment using a Thermo RSLC Nano LC (www.thermofisher.com accessed on 1December 2020, Gloucester, UK) coupled to a Sciex 6600 mass spectrometer (www.sciex.com, Framingham, MA, USA) Mobile phases were made as follows; loading buffer 4%(v/v) acetonitrile with 0.1% (v/v) TFA, buffer A (4% acetonitrile 0.1% formic acid (FA)),and buffer B (80% acetonitrile 0.1% FA). Separation was carried out using a linear gradientfrom 4–80% Buffer B over 40 min. This was followed by a 10 min wash at 90% Buffer B,and then a column equilibration at 4% Buffer B to return the column to original startingconditions. Next, 5 µL samples (1/10 dilution) were loaded onto the 300 µm C18 trapcolumn for desalting before being resolved on a 23 cm 75 µm ID home-packed analyticalcolumn containing Dr Maisch 3 µm particle size stationary phase. Analytes were injectedonline into the mass spectrometer, which acquired data in a data-dependant format. Surveyscans were performed over an m/z range of 400–1200. From each survey, the 30 mostintense ions were selected for MS/MS; charge states +1 to +5 were considered for MS/MS.Precursors were fragmented with a rolling collision energy, as a function of the charge stateof the peptide ion. The total cycle time was 1.7 s.
Data were visualised using Analyst v2.2 (Sciex). Extracted ion chromatograms, m/zanthocyanin values, and respective MS/MS spectra for relevant m/z were exported andcompared with previously published data [27–29].
2.9. Statistical Analysis
The effects and interactions between factors on measured parameters were assessedby analysis of variance (ANOVA) derived from linear mixed-effects (LME) models [30] byusing the nlme package in R [31]. The hierarchical nature of the design was reflected inthe random error structures that were specified as farm/year/management/variety. Thenormality of the residuals of all models was tested using Quantile-Quantile (QQ) plots. Dif-ferences between the grape varieties or the interactions between factors were tested usingTukey contrasts in the general linear hypothesis testing (GLHT) function of the multcomppackage in R. A linear mixed-effects model was used for the Tukey contrasts, containing a

Foods 2021, 10, 476 7 of 20
treatment main effect, with three levels, with the random error term specified as describedabove. The relationships between soil, orchard, and agronomic factors (recorded on partici-pating farms via structured questionnaires) and table grape yield and quality parameterswere investigated by redundancy analysis (RDA) using the CANOCO 5 software [32].Automatic forward selection of the variety, environmental, and agronomic factors was usedwithin the RDAs, while their significance in explaining additional variance was calculatedby using Monte Carlo permutation tests. The amount of total N, P, and K with organicfertilisers was estimated on the basis of average published N, P, and K contents of thedifferent organic fertilisers used (Table S1, Supplementary Materials).
Due to the small number of yield and quality response variables available for RDA,the number of explanatory variables/drivers was restricted to nine. In the biplot derivedfrom RDA shown in Figure 1, production systems, variety, soil type, irrigation, vineyardage, plant density, and estimated total nitrogen (N) and potassium (K) inputs were used asexplanatory variables/drivers. In the biplot resulting from RDA shown in Figure S1 (Sup-plementary Materials), we used variety, soil types, orchard orientation, irrigation, vineyardage, plant density, and estimated total N, P, and K inputs as explanatory variables/drivers.
3. Results
In the farm survey reported here, grapes of two white varieties (Villana and Vidiano)and one red variety (Kotsifali) were collected from 13 organic and 13 conventional grapeorchards (Table S1, Supplementary Materials) in two consecutive years. Red wines madefrom Kotsifali and white wines made from Vidiano grapes were also collected from wineriesthat were supplied by farms included in the grape survey. Table grapes and wines wereassessed for (a) dry matter (DM) and sugar content (◦ Brix), (b) total phenolic content(TPC), (c) total antioxidant activity (TAA) assessed by two different methods TAADPPH andTAATEAC, (d) total anthocyanin concentration (TAC) assessed by two different equivalences(TACcyan and TACmal), and (e) anthocyanin profiles (Tables 1 and 2).

Foods 2021, 10, 476 8 of 20
Table 1. Effect of, and interaction among, production system (organic (ORG) vs. conventional (CONV)), variety, and year for the yield, dry matter content (DM), sugar content (SC) ofpulp/juice, total phenolic content (TPC), total antioxidant activity (TAA) using the 2,2-diphenyl-1-picrylhydrazyl (DPPH) or Trolox Equivalent Antioxidant Capacity (TEAC (assays andtotal anthocyanin content (TAC) (expressed as cyanidin-3-O-glucoside (cyan) and malvidin-3-O-glucoside (mal) equivalents) in table grapes of the Cretan local varieties Kotsifali, Villana,and Vidiano (three-factor ANOVA). TE, Trolox equivalent.
Factors Yield(t/ha)
DM(%)
SC Pulp(◦Brix)
SC Juice(◦Brix)
TPC(mg GAE·kg−1)
TAA(DPPH)
(µmol TE·g−1)
TAA(TEAC)
(µmol TE·g−1)
TAC(mg cyan·kg−1)
TAC(mg mal·kg−1)
Year (Yr)2014 (n = 22) 14.6 ± 1.1 23.0 ± 0.6 21.5 ± 0.7 21.5 ± 0.5 2037 ± 150 84 ± 6 14.3 ± 1.1 432 ± 47 456 ± 502015 (n = 26) 14.2 ± 1.1 21.3 ± 0.5 18.5 ± 0.4 19.1 ± 0.5 1423 ± 94 75 ± 5 7.3 ± 0.6 296 ± 23 313 ± 25ProductionSystem (PS)ORG (n = 24) 14.0 ± 1.3 21.6 ± 0.6 19.2 ± 0.5 19.7 ± 0.6 1770 ± 139 79 ± 6 11.3 ± 1.2 341 ± 48 360 ± 51
CONV (n = 24) 14.8 ± 0.9 22.5 ± 0.6 20.5 ± 0.7 20.7 ± 0.5 1638 ± 133 79 ± 6 9.7 ± 1.0 372 ± 34 392 ± 36Variety (Va)
Kotsifali (n = 18) 14.6 ± 1.3 23.5 ± 0.5 20.7 ± 0.6 21.6 ± 0.6 1906 ± 131 a 114 ± 2 a 12.9 ± 1.2 a 356 ± 29 a 376 ± 31 aVillana (n = 16) 15.7 ± 7.0 21.1 ± 0.7 19.3 ± 0.8 19.2 ± 0.7 1222 ± 113 b 57 ± 1 b 6.7 ± 0.8 b 9 ± 2 b 10 ± 2 bVidiano (n = 14) 12.5 ± 1.0 21.3 ± 0.6 19.4 ± 0.8 19.6 ± 0.6 1996 ± 192 a 59 ± 1 b 11.7 ± 1.6 a 21 ± 4 b 23 ± 4 bANOVA results
(p-values)Main effects
Yr NS 0.0201 0.0028 0.0078 0.0022 <0.0001 <0.0001 T TPS NS NS T NS NS NS 0.0456 NS NSVa NS T NS T 0.0014 <0.0001 0.0001 <0.0001 <0.0001
InteractionsYr × PS NS NS NS NS NS NS NS NS NSYr × Va NS NS NS NS NS 0.0067 2 NS 0.0275 2 0.0275 2
PS × Va NS NS NS NS NS NS 0.0160 1 NS NSYr × PS × Va NS NS NS NS NS NS NS NS NS
GAE, gallic acid equivalents; The values presented are means ± standard error (SE); means with the same letter within the same column are not significantly different according to Tukey’s honestly significantdifference test (p < 0.05); NS, not significant; ND, not determined: T, trend (0.1 > p > 0.05); 1 see Table 2 for interaction means (±SE); 2 see Table S2 (Supplementary Materials) for interaction means (±SE).

Foods 2021, 10, 476 9 of 20
Table 2. Interactions means± SE for the effects of variety farming system on total antioxidant activityin table grapes.
Factor 1Factor 2
Farming SystemParameter Variety Organic Conventional
Antioxidant activity(TEAC) µmol TE·g−1
Kotsifali 12.6 ± 1.7 a A 13.1 ± 1.7 a AVillana 7.1 ± 1.1 b B 6.4 ± 1.2 b BVidiano 14.3 ± 2.4 a A 9.1 ± 1.6 b B
TE, Trolox equivalent; means labeled with the same lowercase letter within the same row and capital letters withinthe same column are not significant different (general linear hypothesis test p < 0.05).
3.1. Yields, Dry Matter and Sugar Content in Grapes
The dry matter content and sugar levels in grape pulp and grape juice were slightly,but significantly higher (by 8%, 16%, and 13%, respectively) in 2014 than 2015, but therewas no significant effect of year on grape yields. There were no significant effects of varietyand production system on grape yields, dry matter, and sugar content detected (Table 1).However, we observed substantial variation in grape yield between orchards (especiallyfor Villana); numerically, Villana had the highest average yields (15.7 t·ha−1), followed byKotsifali (14.6 t·ha−1) and Vidiano (12.5 t·ha−1) (Table 1).
3.2. Antioxidant Activity and Phenolic and Anthocyanin Content in Grapes
The TPC, TAADPPH, and TAATEAC values were significantly higher (by 43%, 12%,and 96%, respectively) in the 2013/2014 season (which had no rainfall during the harvestperiod; Figure 1) than the 2014/2015 season (which had significant rainfall prior to harvestin August; Figure 1), and there were also trends (0.01 > p > 0.05) toward significantlyhigher TACcyan and TACmal in 2013/2014 (Table 1). However, for TAADPPH, TACcyan, andTACmal, significant interactions between year and variety were also detected. When theseinteractions were examined further, concentrations of TAADPPH and TAC were found to besignificantly higher in 2014 than 2015 in Kotsifali grapes only (Table S2, SupplementaryMaterials). No significant effects of year on the profiles of individual anthocyanins in thered grapes (Kotsifali) could be detected (Table S3, Supplementary Materials).
A significant main effect of production system was only identified for the TAATEAC,which was 16% higher in organic compared with conventional grapes (Table 1). However,for TAATEAC, there was also a significant interaction between production system and grapevariety (Table 1). When this interaction was further examined, organic Vidiano grapeswere found to have significantly (57%) higher TAATEAC than conventional Vidiano grapes,while organic and conventional grapes of the varieties Kotsifali and Villana had similarTAATEAC (Table 2).
Anthocyanin profiles were only analysed in red grapes (Kotsifali), and no significanteffect of production system could be detected (Table S3, Supplementary Materials).
Significant main effects of variety were detected for TPC, TAA, and TAC (Table 1).As expected from previous studies (see Section 4), only red grapes contained substantialconcentrations anthocyanins, while white grapes contained virtually no anthocyanins(Table 1). The finding that TPC and TAATEAC were significantly (~60% and ~85%, respec-tively) higher in red Kotsifali than white Villana grapes was also as expected from previousstudies (Table 1).
However, in this study, the traditional white variety (Vidiano) overall had similarTPC and TAATEAC when compared with the red variety (Kotsifali). This and the findingthat organic white Vidiano grapes had similar TAATEAC when compared to organic redKotsifali grapes, while conventional Vidiano grapes had significantly lower TAATEACthan conventional Kotsifali grapes, were unexpected (Table 2). It should be pointed outthat TAADPPH was significantly (~95%) higher in Kotsifali than both Vidiano and Villanagrapes, and that there was no significant difference in TAADPPH between Vidiano andVillana (Table 1).

Foods 2021, 10, 476 10 of 20
3.3. Associations between Variety and Agronomic Drivers and Grape Yield and Composition
Similar to the ANOVA, the RDA also identified grape type/variety as the strongest(FVillana = 17.1; FVidiano = 5.7; FKotsifali = 5.7) and only significant (PVillana = 0.002; PVidiano =0.018; PKotsifali = 0.018) explanatory variable/driver for the grape composition parametersassessed (Figure 2). The strength (F-value) of all other explanatory variables included in theRDA was substantially lower and decreased in the following order: irrigation (Fwith irrigation= 1.3; Fwithout irrigation = 1.3) > orchard orientation (Fsouth-east facing = 0.6; Fsouth facing = 0.6;Fwest facing = 0.9) > production system (Forganic = 0.6; Fconventional = 0.6) > soil type (Fclay loam= 0.4; Fsandy loam = 0.4), while vineyard age, plant density, and estimated total nitrogen andpotassium inputs explained very little (F ≤ 0.2) of the additional variation (Figure 2).
Figure 2. Biplot derived from the redundancy analysis showing the relationship between variety, production system,agronomic, and orchard site and soil explanatory variables/drivers and grape yield and quality parameters. Eigenvalueswere 32.5% and 8.6% for Axis 1 and 2, respectively. Fixed explanatory variables (
Foods 2021, 10, x FOR PEER REVIEW 10 of 20
Response variables () YLD, grape yield TPC, phenolic content TEAC, antioxidant activity (ABTS assay) DPPH, antioxidant activity (DPPH) BrixP, sugar content in pulp BrixJ, sugar content in juice DM, grape dry matter content TAC-M, anthocyanin content (cyanidin-3- O-glucoside equivalents) TAC-C, anthocyanin content (malvidin-3- O-glucoside equivalents) Continuous explanatory variables (―) VA, vineyard age (F-value = 0.3; P = 0.62) PD, plant density (F < 0.1; P = 0.9), N, total N-input* (F = 0.3; P = 0.62) K, total K-input* (K; F = 0.1; P = 0.76).
Figure 2. Biplot derived from the redundancy analysis showing the relationship between variety, production system, ag-ronomic, and orchard site and soil explanatory variables/drivers and grape yield and quality parameters. Eigenvalues were 32.5% and 8.6% for Axis 1 and 2, respectively. Fixed explanatory variables () were (a) variety: Vil, Villana (F = 17.1, P = 0.002); Vid, Vidiano (F = 5.7, P = 0.018); Kot, Kotsifali (F = 5.7; P = 0.018), (b) irrigation: +Ir, with drip irrigation (F = 1.3, P = 0.27); −Ir, without drip irrigation (F = 1.3, P = 0.27), (c) orchard orientation, facing: W, west (F = 0.9, P = 0.36); S, south (F = 0.6, P = 0.44); SE, southeast (F = 0.6, P = 0.44), (d) production system (organic (O), F = 0.6, P = 0.44; conventional (C) F = 0.6; P = 0.44), and (e) soil texture: cl, clay loam (F = 0.4, P = 0.59); sl, sandy loam (F = 0.4, P = 0.59). * From mineral and/or organic fertilizer.
4. Discussion A range of previous studies analysed the effects of pedo-climatic conditions, agro-
nomic protocols, grape type/variety, region, and/or vintage on sensory and nutritional quality parameters in table grape and/or wine [15,21,33,34]. A number of studies assessed the effects of organic production methods on grape quality parameters, but reported var-iable trends (Tables 3–5).
However, there is very limited information on the performance of indigenous, tradi-tional grape varieties in organic and conventional production systems. This is, to our knowledge, the first study in which a significant interaction between production systems (organic vs. conventional) and different traditional Cretan grape varieties is reported. The study was based on farms in a traditional Cretan wine-growing region with a very uni-form temperature and rainfall pattern, to minimise potential confounding effects of vari-able environmental background conditions. We recorded a range of orchard (e.g., soil type, age, and orientation) and agronomic (e.g., irrigation and NPK inputs with fertilisers) parameters on all farms. This allowed us to investigate possible associations between grape yield and quality parameters and (a) grape variety, (b) production system (organic vs. conventional), and (c) specific agronomic and orchard/site explanatory variables/driv-ers by RDA.
4.1. Effect of Variety and Production System on Grape Yields The finding that grape yields of all three varieties were similar in organic and con-
ventional production was unexpected, since a meta-analysis of comparative studies re-ported that crop yields are higher in conventional compared with organic production [12].
) were (a) variety: Vil, Villana (F = 17.1,P = 0.002); Vid, Vidiano (F = 5.7, P = 0.018); Kot, Kotsifali (F = 5.7; P = 0.018), (b) irrigation: +Ir, with drip irrigation (F = 1.3,P = 0.27); −Ir, without drip irrigation (F = 1.3, P = 0.27), (c) orchard orientation, facing: W, west (F = 0.9, P = 0.36); S,south (F = 0.6, P = 0.44); SE, southeast (F = 0.6, P = 0.44), (d) production system (organic (O), F = 0.6, P = 0.44; conventional(C) F = 0.6; P = 0.44), and (e) soil texture: cl, clay loam (F = 0.4, P = 0.59); sl, sandy loam (F = 0.4, P = 0.59). * From mineraland/or organic fertilizer.
The RDA drivers explained approximately 41% of the variation (32.5% by axis 1 and afurther 8.6% by axis 2) associated with the grape composition response variables assessed(Figure 2). There were strong positive associations between the red grape variety Kotsifaliand total anthocyanin content and TAADPPH, as well as a weaker positive association withTAATEAC, DM, and sugar content along both the negative axes 1 and 2. There was also apositive association between the variety Vidiano and TPC (along both the negative axis1 and positive axis 2) and TAATEAC along the negative axis 1. In contrast, for the varietyVillana, RDA identified negative associations with all composition parameters assessed,but a positive association with grape yield along the positive axis 1 (Figure 2).
There were also weak positive associations between grape yield and the use of supple-mentary irrigation, west-facing orchards, higher N and K inputs, clay soils, older orchards,and conventional crop management along the positive axis 1 (Figure 2). In contrast, therewere weak positive associations between all nutritional composition parameters and higher
Foods 2021, 10, 476 11 of 20
planting density, southeast- and south-facing orchards, sandy loam soils, and non-useof irrigation along the negative axis 1 (Figure 2). When production system was replacedwith total estimated P-input in the list of explanatory variables used for RDA, very similarresults were obtained (Figure S1, Supplementary Materials).
4. Discussion
A range of previous studies analysed the effects of pedo-climatic conditions, agro-nomic protocols, grape type/variety, region, and/or vintage on sensory and nutritionalquality parameters in table grape and/or wine [15,21,33,34]. A number of studies as-sessed the effects of organic production methods on grape quality parameters, but reportedvariable trends (Tables 3–5).
However, there is very limited information on the performance of indigenous, tra-ditional grape varieties in organic and conventional production systems. This is, to ourknowledge, the first study in which a significant interaction between production systems(organic vs. conventional) and different traditional Cretan grape varieties is reported. Thestudy was based on farms in a traditional Cretan wine-growing region with a very uniformtemperature and rainfall pattern, to minimise potential confounding effects of variableenvironmental background conditions. We recorded a range of orchard (e.g., soil type, age,and orientation) and agronomic (e.g., irrigation and NPK inputs with fertilisers) parameterson all farms. This allowed us to investigate possible associations between grape yield andquality parameters and (a) grape variety, (b) production system (organic vs. conventional),and (c) specific agronomic and orchard/site explanatory variables/drivers by RDA.
4.1. Effect of Variety and Production System on Grape Yields
The finding that grape yields of all three varieties were similar in organic and conven-tional production was unexpected, since a meta-analysis of comparative studies reportedthat crop yields are higher in conventional compared with organic production [12].
The absence of significant yield differences between organic and conventional produc-tion may have been due to low downy mildew disease severity. This is the most importantfactor affecting grape yields and quality and is more difficult to control in organic farmingsystems, where the use of synthetic chemical fungicides is prohibited and farmers are onlyallowed to use relatively inefficient Cu-fungicides [15,16]. Crete has a semiarid climate(there is virtually no rainfall and low relative humidity between June and August/earlySeptember when grapes are harvested), which is known to result in much lower downymildew disease pressure and associated crop losses than in many other European grape-growing regions [15,16]. However, since the varieties included in this study are primarilyused for wine-making, the lack of yield differences between organic and conventionalproduction systems may also have been due to lower fertiliser (in particular N) inputs ingrapes primarily used for wine-making [35].
Similarly, the finding of no significant differences in yield between varieties wasunexpected, but may also have been due to the relatively low-input (especially with respectto fertiliser and supplementary irrigation) agronomic protocols used in both organic andconventional production in Crete and/or the large variability in yields between orchardsobserved for the variety Villana, which numerically produced the highest yields.
This view is supported by results from RDA, which indicated that (a) variety choicewas the strongest explanatory variable/driver for both yield and grape quality parame-ters, and (b) there were trade-offs between yield and nutritionally relevant antioxidantconcentrations and activity. These RDA results are consistent with previous studies, whichreported that the intensification (e.g., increased use of irrigation, fertiliser inputs, and/orcrop protection products) of agronomic practices to increase yields may cause a “dilutioneffect” resulting a reduction in antioxidant/phytochemical and mineral micro-nutrientconcentrations in crops [11,35,36]. In this study, explanatory variable/drivers that werepositively associated with increased yield (e.g., the variety Villana and, to a lesser extent, theuse of drip irrigation, higher N and K inputs, clay soils, conventional production systems,

Foods 2021, 10, 476 12 of 20
west-facing orchards, and older plants) were also negatively associated with antioxidantconcentrations, activity, sugar, dry matter, and anthocyanin and phenolic concentrations.
Table 3. Antioxidant activity/capacity (TEAC and DPPH assays), total phenolic content (TPC), and total anthocyanincontent (TAC) reported for different white grape varieties grown in organic and conventional production systems in differentcountries/regions.
Parameter Assessed. Production System CountryGrape Type
Grape Variety Organic Conventional ANOVAResults
or Region(Study Type) Reference
TAATEAC (mM TE·L−1)Villana 7 ± 1.1 6 ± 1.2 NS GR (FS) this studyVidiano 14 ± 2.4 9 ± 1.6 * GR (FS) this study
Early Sweet 5 ± 1.0 8 ± 1.4 NS SA (RS) [15] 1
Prime 6 ± 0.3 5 ± 0.5 NS SA (RS) [15] 1
Sugarlone 7 ± 1.3 4 ± 0.3 NS SA (RS) [15] 1
Thompson 6 ± 1.1 5 ± 0.6 NS SA (RS) [15] 1
TAADPPH (mM TE·L−1)Villana 59 ± 1.7 58 ± 1.4 NS GR (FS) this studyVidiano 57 ± 1.4 57 ± 1.4 NS GR (FS) this study
Early Sweet 54 ± 2.7 42 ± 0.4 NS SA (RS) [15] 1
Prime 53 ± 2.6 57 ± 2.0 NS SA (RS) [15] 1
Sugarlone 61 ± 1.6 60 ± 1.2 NS SA (RS) [15] 1
Thompson 61 ± 1.7 56 ± 1.8 NS SA (RS) [15] 1
Pignoletto 7 ± 0.8 8 ± 0.3 NS IT (FS) [22]Albana 6 ± 0.1 7 ± 0.4 * IT (FS) [34]
Muscat Ottonel 16 ± 0.4 14 ± 0.2 NS RO (FS) [37]Aromat de Iasi 3 ± 0.2 2 ± 0.6 * RO (FS) [37]Traminer roz 7 ± 0.3 5 ± 0.2 * RO (FS) [37]
Riesling italian 9 ± 0.7 8 ± 0.4 * RO (FS) [37]Feteasca regală 10 ± 0.2 12 ± 0.9 * RO (FS) [37]
Timpuriu de Cluj 12 ± 1.1 16 ± 1.9 * RO (FS) [37]TPC (mg GAE·kg−1)
Villana 1201 ± 146 243 ± 182 NS GR (FS) this studyVidiano 2243 ± 250 1748 ± 194 NS GR (FS) this study
Early Sweet 1180 ± 19 1328 ± 142 NS SA (RS) [15] 1
Prime 1088 ± 72 1388 ± 35 * SA (RS) [15] 1
Sugarlone 1845 ± 87 1556 ± 109 * SA (RS) [15] 1
Thompson 943 ± 113 861 ± 49 NS SA (RS) [15] 1
Muscat Ottonel 631 ± 21 41 ± 32 * RO (FS) [37]Aromat de Iasi 220 ± 14 228 ± 6 NS RO (FS) [37]Traminer roz 219 ± 4 330 ± 2 NS RO (FS) [37]
Riesling italian 423 ± 10 436 ± 11 NS RO (FS) [37]Feteasca regală 579 ± 11 575 ± 9 NS RO (FS) [37]
Timpuriu de Cluj 331 ± 4 380 ± 23 NS RO (FS) [37]Niagara 22 ± 1 7 ± 1 * BR (RS) [38]Niagara 524 ± 7 339 ± 7 * BR (RS) [13]
Means ± SE for the production system which resulted in significantly higher values are shown in bold. 1 Grape retail survey carriedout in 2015. Study type: FS, farm survey; RS, retail survey. TAATEAC/TAADPPH, total antioxidant activity/capacity; TPC, total phenolicconcentration; TAC, total anthocyanin concentration. Asterisks within the same row denote that the mean for organic grapes is significantlydifferent from the mean for conventional grapes (p < 0.05); NS within the same row denotes that the mean for organic grape is notsignificantly different from the mean for conventional grapes (p > 0.05). GR, Greece; BR, Brazil; TR, Turkey; RO, Romania; FR, France; IT,Italy; SA, South Africa; MED, Mediterranean countries.

Foods 2021, 10, 476 13 of 20
Table 4. Total antioxidant activity/capacity reported for different red/black grape varieties grown in organic and conven-tional production systems in different countries/regions.
Parameter Assessed Production System CountryGrape Type
Grape Variety Organic Conventional ANOVAResults
or Region(Study Type) Reference
TAATEAC (mM TE·L−1)Kotsifali 13 ± 1.7 13 ± 1.7 NS GR (FS) this studyAllison 5 ± 0.4 4 ± 0.1 NS SA (RS) [15] 1
Crimson 9 ± 1.6 5 ± 0.6 NS SA (RS) [15] 1
Flame 3 ± 0.2 2 ± 0.3 NS SA (RS) [15] 1
Sweet Celebration 12 ± 2.0 15 ± 0.9 NS SA (RS) [15] 1
Allison 11 ± 0.1 7 ± 2.6 NS MED (RS) [15] 2
Crimson 9 ± 1.3 9 ± 0.9 NS MED (RS) [15] 1
Flame 14 ± 3.4 16 ± 4.9 NS MED (RS) [15] 2
Scarlotta 6 ± 0.8 5 ± 1.0 NS MED (RS) [15] 1
Autumn Royal 16 ± 3.2 13 ± 1.5 NS MED (RS) [15] 1
Midnight Beauty 30 ± 3.9 17 ± 2.6 * MED (RS) [15] 1
Allison 7 ± 0.7 6 ± 0.4 NS MED (RS) [15] 2
Crimson 5 ± 0.8 6 ± 0.6 NS MED (RS) [15] 2
Bordo + Isabel 52 ± 0.3 31 ± 0.2 * BR (RS) [39]Bordo 131 ± 1.7 131 ± 1.7 NS BR (FS) [7]
TAADPPH (mM TE·L−1)Kotsifali 113 ± 2.7 115 ± 2.7 NS GR (FS) this study
Sangioves 25 ± 0.6 31 ± 3.2 * IT (FS) [22]Allison 100 ± 3.4 102 ± 0.1 NS SA (RS) [15] 1
Crimson 97 ± 2.0 96 ± 1.5 NS SA (RS) [15] 1
Flame 51 ± 0.6 52 ± 2.4 NS SA (RS) [15] 1
Sweet Celebration 109 ± 6.4 108 ± 1.3 NS SA (RS) [15] 1
Allison 97 ± 3.5 102 ± 12.0 NS MED (RS) [15] 2
Crimson 103 ± 4.9 106 ± 6.4 NS MED (RS) [15] 1
Flame 157 ± 19.5 144 ± 28.3 NS MED (RS) [15] 2
Scarlotta 98 ± 4.4 90 ± 8.1 NS MED (RS) [15] 1
Autumn Royal 114 ± 8.3 105 ± 7.4 NS MED (RS) [15] 1
Midnight Beauty 160 ± 12.9 123 ± 14.2 * MED (RS) [15] 1
Allison 144 ± 2.7 142 ± 3.3 NS MED (RS) [15] 2
Crimson 141 ± 4.2 140 ± 1.6 NS MED (RS) [15] 2
Lambrusco 26 ± 1.0 20 ± 1.0 * IT (FS) [22]Bordo + Isabel 54 ± 0.2 41 ± 0.7 * BR (RS) [39]
Bordo 77 ± 3.4 102 ± 1.7 NS BR (FS) [7]Bordo 146 ± 1 126 ± 2 * BR (RS) [40]
Napoca 32 ± 1.4 25 ± 1.3 NS RO (FS) [37]Muscat Hamburg 23 ± 0.1 23 ± 0.5 NS RO (FS) [37]
Means ± SE for the production system which resulted in significantly higher values are shown in bold. 1 Grape retail survey carried outin 2015; 2 grape retail survey carried out in 2012. Study type: FS, farm Survey; RS, retail survey. TAATEAC/TAADPPH, total antioxidantactivity/capacity. Asterisks within the same row denote that the mean for organic grapes is significantly different from the mean forconventional grapes (p < 0.05); NS within the same row denotes that the mean for organic grape is not significantly different from themean for conventional grapes (p > 0.05). GR, Greece; BR, Brazil; TR, Turkey; RO, Romania; FR, France; IT, Italy; SA, South Africa; MED,Mediterranean countries.
4.2. Effect of Year, Variety, and Production System on Table Grape Quality Parameters
The finding of higher phenolic and antioxidant activity in the 2013/2014 season com-pared with the 2014/2015 season was expected and most likely due to farmers harvestinggrapes before the optimum ripening stage in 2015 to avoid fungal infection/spoilage ofgrapes after the unusually high rainfall in late August (Figure 1). This view is supported bythe lower sugar content found in grapes harvested in 2015 compared with those harvestedin 2014, since sugar content was shown to increase in grapes over time [2,6]. Wineries inthe Heraklion area recommend that grapes of all three varieties are harvested early in years

Foods 2021, 10, 476 14 of 20
with heavy rainfall in late August/early September (personal communication, Dr ManolisKabourakis, Hellenic Mediterranean University, Crete, Greece).
Differences between production years were also reported in a recent table grape retailsurvey [15].
Results reported here show that overall variety choice had a substantially largereffect on antioxidant activity and concentrations than either production system (organic vs.conventional) or non-production system-specific agronomic parameters such as the use ofsupplementary irrigation and total N, P, and K inputs and orchard parameters (soil type,age, orchard orientation, and plant density). However, the study also demonstrated thatproduction system can have substantial effects on grape quality in specific varieties (higherTAATEAC activity in organic than conventional Vidiano grapes). These results are consistentwith previous studies that compared antioxidant activity and phenolic concentrations indifferent grape types (white, red, and black) and organic and conventional grapes of thesame variety (see studies listed in Tables 3–5). Furthermore, as previously reported forother white grape varieties [15], the varieties Vidiano and Villiana were found to containvirtually no anthocyanins.
Previous studies also reported higher antioxidant activity and/or concentrations inred/black than white grapes and differences in concentrations between varieties belongingto the same grape type (white or black/red) (Tables 3–5). Moreover, for many varietiesincluded in previous comparative studies, no significant composition differences betweenorganic and conventional grapes were found, and there was no consistent effects of produc-tion systems for those varieties in which significant differences in TAA, TPC, and/or TACbetween organic and conventional grapes were detected (Tables 3–5). For example, a studyby Tassoni et al. (2013, 2014) [21,34] reported significantly higher TAATEAC in organicwhite grapes of the variety Albana and organic red grapes of the variety Lambrusco, butalso in conventional red grapes of the variety Sangioves, while production system hadno significant effect on TAATEAC in white grapes of the variety Pignoletto (Tables 3–5).Similarly, a recent retail survey [15] reported significantly higher TPC in organic tablegrapes of the white variety Sugarlone, but also in conventional table grapes for the whitevariety Prime, while there was no significant effect of production system for the whitevarieties Early Sweet and Thompson (Table 3).
The reasons for the variable and sometimes contrasting effects of production systemson antioxidant activity, TPC, and TAC are poorly understood. Results from long-termfactorial field experiments with arable crops have suggested that higher nitrogen sup-ply/availability from mineral N-fertilisers results in lower phenolic and flavonoid con-centrations in conventional wheat grain and found no evidence for pesticides (herbicides,fungicides, and growth regulators) used in conventional farming contributing to the differ-ences in antioxidant levels between organic and conventional wheat grain [36]. However,increased expression of phenolic compounds and other secondary plant metabolites withantioxidant activity in plants may also be induced by biotic (pest and disease attack) andabiotic stress factors (e.g., drought, flooding, or heat stress) [36,39,41]. Differences in pestand disease pressure and/or the relative efficacy of crop protection methods used in or-ganic and conventional grape production may, therefore, also contributed to the variabilityof results reported in different studies (Tables 3–5).
There were differences in climatic conditions (e.g., total precipitation and amount ofrainfall prior to harvest) between the two growing seasons in which surveys were carriedout. The finding of differences in dry matter, sugar content, TPC, TAATEAC, and TAADPPHbetween growing season/years was, therefore, not surprising. This is consistent with theresults of previous studies that identified not only variety but also geographical locationand climatic conditions as important drivers for antioxidant activity and/or concentrationsin grapes [15,42,43]. It is, therefore, likely that the variable effects of production systemreported here and in previous studies (Table 4) were due to complex interactions amongclimatic conditions, variety choice, and production methods, as previously shown for

Foods 2021, 10, 476 15 of 20
cereals [36]. However, long-term controlled factorial experiments with grapes would berequired to identify and quantify such interactions.
Table 5. Total phenolic content (TPC) and total anthocyanin content (TAC) reported for different red/black grape varietiesgrown in organic and conventional production systems in different countries.
Parameter Assessed Production System CountryGrape Type
Grape Variety Organic Conventional ANOVAResults
or Region(Study Type) Reference
TPC (mg GAE·kg−1)Kotsifali 1938 ± 187 1903 ± 94 NS GR (FS) this studyAllison 1838 ± 83 1866 ± 87 NS SA (RS) [15] 1
Crimson 1416 ± 101 1296 ± 47 NS SA (RS) [15] 1
Flame 2083 ± 299 1784 ± 243 NS SA (RS) [15] 1
Sweet Celebration 1824 ± 104 1804 ± 219 NS SA (RS) [15] 1
Allison 1768 ± 676 2058 ± 29 NS MED (RS) [15] 1
Crimson 2012 ± 113 1876 ± 109 NS MED (RS) [15] 1
Flame 2769 ± 462 2511 ± 347 NS MED (RS) [15]2
Scarlotta 2159 ± 292 1494 ± 419 * MED (RS) [15] 1
Autumn Royal 2213 ± 559 1925 ± 535 NS MED (RS) [15] 1
Midnight Beauty 3173 ± 261 2435 ± 108 NS MED (RS) [15] 1
Allison 2154 ± 230 1914 ± 41 NS MED (RS) [15] 2
Crimson 1942 ± 188 2356 ± 178 NS MED (RS) [15] 2
Bord±sabel 3378 ± 50 2015 ± 22 * BR (RS) [44]Bordo 2724 ± 56 3636 ± 72 * BR (FS) [7]Bordo 3346 ± 17 1985 ± 56 * BR (RS) [13]Bordo 146 ± 1 126 ± 2 * BR (RS) [40]
Napoca 1341 ± 21 1231 ± 21 NS RO (FS) [37]Muscat Hamburg 978 ± 13 953 ± 10 NS RO (FS) [37]
TAC (mg cyan·L−1)Kotsifali 341 ± 48 372 ± 34 NS GR (FS) this studyAllison 109 ± 35 174 ± 15 NS SA (RS) [15] 1
Crimson 72 ± 12 131 ± 16 NS SA (RS) [15] 1
Flame 128 ± 28 75 ± 16 NS SA (RS) [15] 1
Sweet Celebration 97 ± 13 94 ± 8 NS SA (RS) [15] 1
Allison 49 ± 5 118 ± 58 NS MED (RS) [15] 1
Crimson 67 ± 12 91 ± 16 NS MED (RS) [15] 1
Flame 93 ± 14 77 ± 11 NS MED (RS) [15] 2
Scarlotta 43 ± 10 196 ± 139 * MED (RS) [15] 1
Autumn Royal 177 ± 36 97 ± 99 NS MED (RS) [15] 1
Midnight Beauty 851 ± 110 499 ± 64 * MED (RS) [15] 1
Allison 74 ± 21 208 ± 67 NS MED (RS) [15] 2
Crimson 81 ± 4 161 ± 58 NS MED (RS) [15] 2
Bordo 341 ± 1 255 ± 1 * BR (RS) [40]Monastrell 721 ± 35 518 ± 26 * SP (FS) [1]
Syrah 897 1277 NS FR (EX) [2]
Means ± SE for the production system which resulted in significantly higher values are shown in bold. 1 Grape retail survey carriedout in 2015; 2 grape retail survey carried out in 2016. Study type: EX, field experiment; FS, farm survey; RS, retail survey. TPC, totalphenolic concentration; TAC, total anthocyanin concentration. Asterisks within the same row denote that the mean for organic grapes issignificantly different from the mean for conventional grapes (p < 0.05); NS within the same row denotes that the mean for organic grape isnot significantly different from the mean for conventional grapes (p > 0.05). GR, Greece; BR, Brazil; TR, Turkey; RO, Romania; FR, France;IT, Italy; SA, South Africa; MED, Mediterranean countries.
The production of indigenous, traditional grape varieties in Crete (and other regionsof the Mediterranean) declined significantly between the 1960s and early 2000s, but hasincreased again more recently [18]. The reasons for this resurgence are largely unknown,but an agronomist in Crete (Dr Manolis Kabourakis; personal communication) and thefarmers included in the survey described that this was mainly due to the ability to marketindigenous varieties as table grapes and for wine-making, leading to increasing demand

Foods 2021, 10, 476 16 of 20
for table grapes and wine made from traditional varieties from both locals and tourists, aswell as the greater robustness/resistance of traditional varieties in low-input and organicproduction systems.
White grapes are well known to have significantly higher phenolic and antioxidantconcentrations than red and black grapes [15] (Tables 3–5). The finding that one traditionalwhite variety (Vidiano) produced similar total phenolic (TPC) and antioxidant activity(TAATEAC) levels to red grapes of the variety Kotsifali was, therefore, unexpected. Fur-thermore, both traditional Cretan white grape varieties had relatively high TPC and TAAlevels compared with other white grape varieties (e.g., those included in previous studiesthat compared the nutritional composition of organic and conventional grapes; Table 3).This may be significant in terms of increasing the use of traditional white grape varietiesby farmers/producers since high antioxidant/phenolic concentrations were linked to dis-ease resistance traits in plants and may facilitate the development of marketing strategiesfocused on “added nutritional value” to increase consumer demand [11,36].
By minimising confounding effects of variable environmental conditions in this study(the farms included in the survey were all in a region with very similar climatic conditions),we were also able to confirm results of a recent retail survey which suggested that thenutritional composition of grapes is determined by interactions between variety choiceand production system [15] (Tables 3–5). Specifically, in this study, organic white Vidianograpes had a higher TAATEAC content than both organic white Villana and organic redKotsifali grapes, while both conventional Vidiano and conventional Villana grapes had asignificantly lower TAATEAC content than conventional Kotsifali grapes.
White grapes are known to contain anthocyanins but at very low levels [45,46] and are,therefore, often thought to have a lower nutritional value than red and black grapes [15].The finding that organically produced Vidiano grapes had similar or higher antioxidantactivity (TAATEAC) and/or total phenolic levels when compared to many red/black grapevarieties examined in this and previous studies [1,2,7,13,15,21,34,44] is, therefore, important.Specifically, it demonstrates, for the first time, that it is possible to identify traditional whitevarieties that compensate for low anthocyanin content with higher expression of otherphenolics, thus providing similar levels of nutritionally desirable phenolics and antioxidantactivity.
Evidence from a recent retail survey [15] and the farm survey reported here, therefore,indicates that selection of grape varieties adapted to producing higher TPC and TAAcontents under specific production environments may be a suitable strategy to improve thenutritional quality in both organic and conventional grape products.
It should be pointed out that, although most previous studies reported in Tables 3–5used similar analytical methods, even small differences in sample preparation and ana-lytical protocols may have affected the results obtained for TPC, TAA, and TAC measure-ments [1,2,7,13,15,21,34,44]. Differences among varieties should, therefore, be confirmed infuture studies which use identical protocols for all varieties studied.
4.3. Potential Nutritional Impacts of Contrasting Antioxidant Levels in Grapes
There is increasing evidence that the antioxidant (mostly (poly)phenolic) compoundsin food crops have protective effects against a range of chronic diseases, but there is stilllimited information on the exact physiological mechanism underlying these effects [1,3,4].Consequently, whether these compounds act in the gastrointestinal environment, as “an-tioxidants” once metabolised in the intestine and absorbed, and/or as signalling moleculesrequires further investigation.
However, several epidemiological studies have linked the consumption of grapesand grape products to a reduced risk of various chronic diseases including cardiovascu-lar diseases, some cancers, and neurodegenerative diseases [3,4]. Selecting table grapevarieties and wines with high antioxidant, TPC, and TAC levels may, therefore, deliveradditional benefits, since this would allow an increased intake of nutritionally desirablephytochemicals without an increase in calorie and/or alcohol consumption.

Foods 2021, 10, 476 17 of 20
The finding that antioxidant activity and concentrations were broadly similar inorganic and conventional grapes samples may suggest that there is no nutritional benefitof switching to organic table grape consumption. However, to what extent organic tablegrape consumption may provide health benefits remains unclear from the results reportedhere. This is mainly because other nutritionally relevant compounds that are known tobe affected by production system (e.g., mineral micronutrient, cadmium, and pesticideresidue levels) were not assessed in this study, and there is limited information in theexisting literature on differences in mineral, toxic metal, and pesticide residues betweenorganic and conventional grapes [7,11].
4.4. Limitations of the Study
The main limitation of the study reported here was the inability to obtain detailedinformation on (a) crop protection protocols and (b) certain non-production system-specificmanagement parameters (e.g., amount of irrigation water used, tillage, and ripening stageof grapes at harvest), (c) foliar disease severity, and (d) processing methods and storageconditions used for wines included in the survey. More detailed recording of these factorsin farm surveys and additional assessment of mineral nutrients, toxic metal, and pesticideresidues should be considered for future comparative studies of yield and nutritional andsensory quality difference in organic and conventional table grapes.
5. Conclusions
Results reported here suggest that, in regions with relatively extensive grapevineproduction systems, organic and conventional agronomic protocols produce broadly similaryields and nutritional composition when traditional, local varieties are used. However, thefinding that organic grapes of one white grape variety (Vidiano) had higher antioxidantactivity than its conventional comparators suggests that production system can have aneffect on the nutritional composition for certain varieties.
Red and black grapes are often considered to have a higher nutritional value thanwhite grapes due to their higher anthocyanin content. The finding that organically pro-duced Vidiano grapes had similar antioxidant activity and higher phenolic levels than thegrapes of the red variety Kotsifali demonstrates the potential for identifying traditionalwhite varieties which compensate for the low anthocyanin content with higher expressionof other phenolics.
Supplementary Materials: The following are available online at https://www.mdpi.com/2304-8158/10/2/476/s1: Table S1. Farm/orchard characteristics and agronomic parameters used forredundancy analyses (RDA); Table S2. Interaction means ± SE for the effects of variety and year/production season on total antioxidant activity (DPPH) and anthocyanin concentrations in tablegrapes; Table S3. Effect of, and interaction between, production system and year on concentrationsof individual anthocyanins (delphinidin-3-O-glucoside, cyanidin-3-O-glucoside, petunidin-3-O-glucoside,peonidin-3-O-glucoside, malvidin-3-O-glucoside, peonidin-3-O-(6”-p-coumaroyl) glucoside, malvidin-3-O-(6”p-coumaroyl)glucoside) in table grapes of the red variety Kotsifali (two-factor ANOVA); Figure S1.Biplot derived from the redundancy analysis showing the relationship between variety, agronomic,and orchard site and soil explanatory variables/drivers and grape yield and quality parameters.
Author Contributions: Conceptualisation, data curation, formal analysis, investigation, method-ology, visualisation, writing—original draft, and writing—reviewing and editing, G.H.; formalanalysis, investigation, methodology, and supervision, E.C.; methodology and writing—reviewingand editing, J.W.; data curation, formal analysis, and validation, M.B.; conceptualisation, projectadministration, investigation, resources, and supervision, N.V.; investigation and supervision, P.P.;methodology, supervision, validation, and writing—reviewing and editing, C.S.; methodology andwriting—reviewing and editing, E.A.S.R.; writing—reviewing and editing, E.M.; validation andwriting—reviewing and editing, P.O.I.; writing—reviewing and editing, V.V.; writing—reviewingand editing, A.W.; validation and writing—reviewing and editing, B.B.; conceptualisation, fundingacquisition, project administration, resources, supervision, validation, writing—original draft, andwriting—reviewing and editing, C.L.; conceptualisation, data curation, formal analysis, supervision,
Foods 2021, 10, 476 18 of 20
validation, writing—original draft, and writing—reviewing and editing, L.R. All authors have readand agreed to the published version of the manuscript.
Funding: This work was supported by the Azerbaijan Ministry of Education, the Sheepdrove Trust,and the EU FP6 project QLIF (Grant number: 506-358).
Institutional Review Board Statement: The research program was reviewed and approved by theFaculty of Science, Agriculture and Engineering Postgraduate Research Committee. This was re-viewed annually as part of the University’s Postgraduate Annual Progression process. Ethical reviewand approval were waived for this study, because farmer were only asked to provide information onsoils, vineyards and crop performance.
Informed Consent Statement: Informed consent was obtained from all farmers involved in the study.
Data Availability Statement: Data will be made available upon reasonable request by author Gul-takin Hasanaliyeva.
Acknowledgments: This work was supported by the Azerbaijan Ministry of Education and theSheepdrove Trust. The authors would also like to express their gratitude to Emmanouil Garakis,Emmanouil Koukis, Emmanouil Antonopoulos, Nikolaos Gavalas, Georgos Vrachassotakis, PavlosKorpis, Evangelos Tzortzoulakis, Chara Fragoulaki, Emmanouil Verigos, Lyrarakis Wines, StylianouWines, Daskalakis Wines, Fragadoulakis Wines, and Tamiolaki Wines for participating in the surveyand making data, as well as grape and wine samples, available for the study.
Conflicts of Interest: The authors declare no conflict of interest.
References1. Mulero, J.; Pardo, F.; Zafrilla, P. Antioxidant activity and phenolic composition of organic and conventional grapes and wines.
J. Food Compost. Anal. 2010, 23, 569–574. [CrossRef]2. Vian, M.A.; Tomao, V.; Coulomb, P.O.; Lacombe, J.M.; Dangles, O. Comparison of the anthocyanin composition during ripening
of Syrah grapes grown using organic or conventional agricultural practices. J. Agric. Food Chem. 2006, 54, 5230–5235. [CrossRef][PubMed]
3. Nassiri-Asl, M.; Hosseinzadeh, H. Review of the pharmacological effects of Vitis vinifera (Grape) and its bioactive constituents:An update. Phytother. Res. 2016, 30, 1392–1403. [CrossRef]
4. Yang, J.; Xiao, Y.Y. Grape phytochemicals and associated health benefits. Crit. Rev. Food Sci. Nutr. 2013, 53, 1202–1225. [CrossRef]5. Bravo, L. Polyphenols: Chemistry, dietary sources, metabolism, and nutritional significance. Nutr. Rev. 1998, 56, 317–333.
[CrossRef] [PubMed]6. Belitz, H.D.; Grosch, W.; Schieberle, P. Fruits and fruit products. Food Chem. 2004, 806–861. [CrossRef]7. da Silva Haas, I.C.; Toaldo, I.M.; de Gois, J.S.; Borges, D.L.; de Oliveira Petkowicz, C.L.; Bordignon-Luiz, M.T. Phytochemicals,
monosaccharides and elemental composition of the non-pomace constituent of organic and conventional grape juices (Vitislabrusca L.): Effect of drying on the bioactive content. Plant Foods Hum. Nutr. 2016, 71, 422–428. [CrossRef] [PubMed]
8. Granato, D.; Margraf, T.; Brotzakis, I.; Capuano, E.; van Ruth, S.M. Characterization of conventional, biodynamic, and organicpurple grape juices by chemical markers, antioxidant capacity, and instrumental taste profile. J. Food Sci. 2015, 80, C55–C65.[CrossRef]
9. Lockshin, L.; Corsi, A.M. Consumer behaviour for wine 2.0: A review since 2003 and future directions. Wine Econ. Policy 2012, 1,2–23. [CrossRef]
10. Biasi, R.; Brunori, E. The on-farm conservation of grapevine (Vitis vinifera L.) landraces assures the habitat diversity in theviticultural agro-ecosystem. Vitis 2015, 54, 265–269.
11. Baranski, M.; Srednicka-Tober, D.; Volakakis, N.; Seal, C.; Sanderson, R.; Stewart, G.B.; Benbrook, C.; Biavati, B.; Markellou, E.;Giotis, C.; et al. Higher antioxidant and lower cadmium concentrations and lower incidence of pesticide residues in organicallygrown crops: A systematic literature review and meta-analyses. Br. J. Nutr. 2014, 112, 794–811. [CrossRef] [PubMed]
12. Seufert, V.; Ramankutty, N.; Foley, J.A. Comparing the yields of organic and conventional agriculture. Nature 2012, 485, 229–232.[CrossRef]
13. Dani, C.; Oliboni, L.; Vanderlinde, R.; Bonatto, D.; Salvador, M.; Henriques, J. Phenolic content and antioxidant activities of whiteand purple juices manufactured with organically-or conventionally-produced grapes. Food Chem. Toxicol. 2007, 45, 2574–2580.[CrossRef]
14. Laureati, M.; Gaeta, D.; Pagliarini, E. Qualitative and sensory evaluation of Sangiovese red wine obtained from organically andconventionally grown grapes. Ital. J. Food Sci. 2014, 26, 355–362.
15. Hasanaliyeva, G.; Chatzidimitrou, E.; Wang, J.; Baranski, M.; Volakakis, N.; Seal, C.; Rosa, E.A.S.; Iversen, P.O.; Vigar, V.; Barkla,B.; et al. Effects of Production Region, Production Systems and Grape Type/Variety on Nutritional Quality Parameters of TableGrapes; Results from a UK Retail Survey. Foods 2020, 9, 1874. [CrossRef] [PubMed]

Foods 2021, 10, 476 19 of 20
16. Bois, B.; Zito, S.; Calonnec, A. Climate vs grapevine pests and diseases worldwide: The first results of a global survey. OENO One2017, 51, 133–139. [CrossRef]
17. Gessler, C.; Pertot, I.; Perazzolli, M. Plasmopara viticola: A review of knowledge on downy mildew of grapevine and effectivedisease management. Phytopathol. Mediterr. 2011, 50, 3–44. [CrossRef]
18. Corrales, M.; Fernandez, A.; Pinto, M.G.V.; Butz, P.; Franz, C.M.; Schuele, E.; Tauscher, B. Characterization of phenolic content,in vitro biological activity, and pesticide loads of extracts from white grape skins from organic and conventional cultivars. FoodChem. Toxicol. 2010, 48, 3471–3476. [CrossRef]
19. Wines of Crete. Varieties. 2019. Available online: www.winesofcrete.gr (accessed on 19 February 2021).20. Cunniff, P. Official Methods of Analysis of AOAC International; Association of Official Analytical Chemists (AOAC): Washington DC,
USA, 1996.21. Singleton, V.L.; Orthofer, R.; Lamuela-Raventós, R.M. Analysis of total phenols and other oxidation substrates and antioxidants
by means of folin-ciocalteu reagent. Meth. Enzymol. 1999, 299, 152–178. [CrossRef]22. Tassoni, A.; Tango, N.; Ferri, M. Comparison of biogenic amine and polyphenol profiles of grape berries and wines obtained
following conventional, organic and biodynamic agricultural and oenological practices. Food Chem. 2013, 139, 405–413. [CrossRef][PubMed]
23. Thaipong, K.; Boonprakob, U.; Crosby, K.; Cisneros-Zevallos, L.; Byrne, D.H. Comparison of ABTS, DPPH, FRAP, and ORACassays for estimating antioxidant activity from guava fruit extracts. J. Food Compost. Anal. 2006, 19, 669–675. [CrossRef]
24. Re, R.; Pellegrini, N.; Proteggente, A.; Pannala, A.; Yang, M.; Rice-Evans, C. Antioxidant activity applying an improved ABTSradical cation decolorization assay. Free Radic. Biol. Med. 1999, 26, 1231–1237. [CrossRef]
25. Floegel, A.; Kim, D.O.; Chung, S.J.; Koo, S.I.; Chun, O.K. Comparison of ABTS/DPPH assays to measure antioxidnat capacity inpopular antioxidnat-rich US foods. J. Food Compost. Anal. 2011, 24, 1043–1048. [CrossRef]
26. Lee, J.; Durst, R.W.; Wrolstad, R.E. Determination of total monomeric anthocyanin pigment content of fruit juices, beverages,natural colorants, and wines by the pH differential method: Collaborative study. J. AOAC Intl. 2005, 88, 1269–1278. [CrossRef]
27. Kammerer, D.; Claus, A.; Carle, R.; Schieber, A. Polyphenol screening of pomace from red and white grape varieties (Vitis viniferaL.) by HPLC-DAD-MS/MS. J. Agric. Food Chem. 2004, 52, 4360–4367. [CrossRef] [PubMed]
28. Stalmach, A.; Edwards, C.A.; Wightman, J.D.; Crozier, A. Identification of (poly)phenolic compounds in concord grape juice andtheir metabolites in human plasma and urine after juice consumption. J. Agric. Food Chem. 2011, 59, 9512–9522. [CrossRef]
29. Revilla, I.; Pérez-Magariño, S.; González-SanJosé, M.L.; Beltrán, S. Identification of anthocyanin derivatives in grape skin extractsand red wines by liquid chromatography with diode array and mass spectrometric detection. J. Chromatogr. A 1999, 847, 83–90.[CrossRef]
30. Pinheiro, J.; Bates, D. Mixed-Effects Models in S and S-PLUS; Springer Science & Business Media: New York, NY, USA, 2006.31. R Core Team. R: A Language and Environment for Statistical Computing; R Core Team: Vienna, Austria, 2018; Available online:
www.gbif.org/tool/81287/r-a-language-and-environment-for-statistical-computing (accessed on 19 February 2021).32. Ter Braak, C.J.; Smilauer, P. Canoco Reference Manual and User’s Guide: Software for Ordination, Version 5.0; Microcomputer Power:
Ithaca, NY, USA, 2012.33. Anastasiadi, M.; Zira, A.; Magiatis, P.; Haroutounian, S.A.; Skaltsounis, A.L.; Mikros, E. 1H NMR-based metabonomics for the
classification of Greek wines according to variety, region, and vintage. Comparison with HPLC data. J. Agric. Food Chem. 2009, 57,11067–11074. [CrossRef]
34. Tassoni, A.; Tango, N.; Ferri, M. Polyphenol and biogenic amine profiles of Albana and Lambrusco grape berries and winesobtained following different agricultural and oenological practices. Food Sci. Nutr. 2014, 5, 8. [CrossRef]
35. Siminis, H. Vine and Wine Products. Georgia and Ktinotrofia (Crop and Livestock Production) Magazine (10(2012)). 2012.Available online: https://agrotypos.gr/magazine/ (accessed on 19 February 2021).
36. Rempelos, L.; Almuayrifi, A.M.; Baranski, M.; Tetard-Jones, C.; Eyre, M.; Shotton, P.; Cakmak, I.; Ozturk, L.; Cooper, J.; Volakakis,N.; et al. Effects of agronomic management and climate on leaf phenolic profiles, disease severity, and grain yield in organic andconventional wheat production systems. J. Agric. Food Chem. 2018, 66, 10369–10379. [CrossRef]
37. Bunea, C.I.; Pop, N.; Babes, A.C.; Matea, C.; Dulf, F.V.; Bunea, A. Carotenoids, total polyphenols and antioxidant activity ofgrapes (Vitis vinifera) cultivated in organic and conventional systems. Chem. Cent. J. 2012, 6, 66. [CrossRef]
38. Ongaratti, B.R.; Machado, F.D.S.; Medeiros, N.D.S.; Destri, C.; da Silva, E.R.; Quincozes-Santos, A.; Dani, C.; Funchal, C.Antioxidant and neuroprotective effect of organic and conventional white grape juices on oxidative stress induced by sodiumazide in cerebral cortex of rats. Eur. J. Nutr. Food Saf. 2014, 4, 592–603. [CrossRef]
39. Intrigliolo, D.S.; Castel, J.R. Response of grapevine cv. ‘Tempranillo’to timing and amount of irrigation: Water relations, vinegrowth, yield and berry and wine composition. Irrig. Sci. 2010, 28, 113. [CrossRef]
40. Rodrigues, A.D.; Scheffel, T.B.; Scola, G.; dos Santos, M.T.; Fank, B.; Dani, C.; Vanderlinde, R.; Henriques, J.A.; Coitinho, A.S.;Salvador, M. Purple grape juices prevent pentylenetetrazol-induced oxidative damage in the liver and serum of Wistar rats. Nutr.Res. 2013, 33, 120–125. [CrossRef] [PubMed]
41. Esteban, M.A.; Villanueva, M.J.; Lissarrague, J.R. Effect of irrigation on changes in the anthocyanin composition of the skin of cvTempranillo (Vitis vinifera L) grape berries during ripening. J. Sci. Food Agric. 2001, 81, 409–420. [CrossRef]

Foods 2021, 10, 476 20 of 20
42. Conradie, W.J.; Carey, V.A.; Bonnardot, V.; Saayman, D.; Schoor, L.H. Effect of different environmental factors on the performanceof Sauvignon blanc grapevines in the Stellenbosch/Durbanville districts of South Africa. I. Geology, soil, climate, phenology andgrape composition. S. Afr. J. Enol. Vitic. 2002, 23, 78–91.
43. Margraf, T.; Santos, É.N.T.; de Andrade, E.F.; van Ruth, S.M.; Granato, D. Effects of geographical origin, variety and farmingsystem on the chemical markers and in vitro antioxidant capacity of Brazilian purple grape juices. Food Res. Int. 2016, 82, 145–155.[CrossRef]
44. Toaldo, I.M.; Cruz, F.A.; de Lima Alves, T.; de Gois, J.S.; Borges, D.L.; Cunha, H.P.; da Silva, E.L.; Bordignon-Luiz, M.T. Bioactivepotential of Vitis labrusca L. grape juices from the Southern Region of Brazil: Phenolic and elemental composition and effect onlipid peroxidation in healthy subjects. Food Chem. 2015, 173, 527–535. [CrossRef] [PubMed]
45. Niu, S.; Hao, F.; Mo, H.; Jiang, J.; Wang, H.; Liu, C.; Fan, X.; Zhang, Y. Phenol profiles and antioxidant properties of white skinnedgrapes and their coloured genotypes during growth. Biotech. Biotechnol. Equip. 2017, 31, 58–67. [CrossRef]
46. Arapitsas, P.; Oliveira, J.; Mattivi, F. Do white grapes really exist? Food Res. Int. 2015, 69, 21–25. [CrossRef]