Edexcel GCSE Maths - Histograms (H) PhysicsAndMathsTutor ...
54
Edexcel Internal Review 1 1. The incomplete table and histogram give some information about the ages of the people who live in a village. Frequency density 0 10 20 30 40 50 60 70 Age in years (a) Use the information in the histogram to complete the frequency table below. Age (x) in years Frequency 0 < x ≤ 10 160 10 < x ≤ 25 25 < x ≤ 30 30 < x ≤ 40 100 40 < x ≤ 70 120 (2) (b) Complete the histogram. (2) (Total 4 marks) Edexcel GCSE Maths - Histograms (H) PhysicsAndMathsTutor.com
-
Upload
khangminh22 -
Category
Documents
-
view
2 -
download
0
Transcript of Edexcel GCSE Maths - Histograms (H) PhysicsAndMathsTutor ...
Edexcel Internal Review 1
1. The incomplete table and histogram give some information about the ages of the people who live in a village.
Frequencydensity
0 10 20 30 40 50 60 70Age in years
(a) Use the information in the histogram to complete the frequency table below.
Age (x) in years Frequency
0 < x ≤ 10 160
10 < x ≤ 25
25 < x ≤ 30
30 < x ≤ 40 100
40 < x ≤ 70 120 (2)
(b) Complete the histogram. (2)
(Total 4 marks)
Edexcel GCSE Maths - Histograms (H) PhysicsAndMathsTutor.com

Edexcel Internal Review 2
2. One Monday, Victoria measured the time, in seconds, that individual birds spent on her bird table.
She used this information to complete the frequency table.
Time (t seconds) Frequency
0 < t ≤ 10 8
10 < t ≤ 20 16
20 < t ≤ 25 15
25 < t ≤ 30 12
30 < t ≤ 50 6
(a) Use the table to complete the histogram.
Frequencydensity
0 10 20 30 40 50Time (seconds)
(3)
Edexcel GCSE Maths - Histograms (H) PhysicsAndMathsTutor.com

Edexcel Internal Review 3
On Tuesday she conducted a similar survey and drew the following histogram from her results.
Frequency density
Time (Seconds)
10 20 30 40 50
(b) Use the histogram for Tuesday to complete the table.
Time (t seconds) Frequency
0 < t ≤ 10 10
10 < t ≤ 20
20 < t ≤ 25
25 < t ≤ 30
30 < t ≤ 50
(2) (Total 5 marks)
Edexcel GCSE Maths - Histograms (H) PhysicsAndMathsTutor.com

Edexcel Internal Review 4
3. The histogram gives information about the times, in minutes, 135 students spent on the Internet last night.
10 20 30 40 50Time ( minutes)t
4
3
2
1
O
Frequencydensity(studentsperminute)
Use the histogram to complete the table.
Time (t minutes) Frequency
0 < t ≤ 10
10 < t ≤ 15
15 < t ≤ 30
30 < t ≤ 50
TOTAL 135 (Total 2 marks)
Edexcel GCSE Maths - Histograms (H) PhysicsAndMathsTutor.com

Edexcel Internal Review 5
4. This histogram gives information about the books sold in a bookshop one Saturday.
Price ( ) in pounds (£)P0 5 10 15 20 25 30 35 40
Frequencydensity(numberof booksper £)
20
16
12
8
4
0
(a) Use the histogram to complete the table.
Price (P) in pounds (£) Frequency
0 < P ≤ 5
5 < P ≤ 10
10 < P ≤ 20
20 < P ≤ 40 (2)
Edexcel GCSE Maths - Histograms (H) PhysicsAndMathsTutor.com

Edexcel Internal Review 6
The frequency table below gives information about the books sold in a second bookshop on the same Saturday.
Price (P) in pounds (£) Frequency
0 < P ≤ 5 80
5 < P ≤ 10 20
10 < P ≤ 20 24
20 < P ≤ 40 96
(b) On the grid below, draw a histogram to represent the information about the books sold in the second bookshop.
Price ( ) in pounds (£)P0 5 10 15 20 25 30 35 40
(3)
(Total 5 marks)
5. Fred did a survey on the areas of pictures in a newspaper. The table gives information about the areas.
Area (A cm2) Frequency
0< A ≤ 10 38
10 < A ≤ 25 36
25 < A ≤ 40 30
40 < A ≤ 60 46
Edexcel GCSE Maths - Histograms (H) PhysicsAndMathsTutor.com
Edexcel Internal Review 7
(a) Work out an estimate for the mean area of a picture.
.....................................cm2 (4)
(b) Draw a histogram for the information given in the table.
0 10 20 30 40 50 60
Area ( cm )A 2
(3) (Total 7 marks)
Edexcel GCSE Maths - Histograms (H) PhysicsAndMathsTutor.com

Edexcel Internal Review 8
6. The table and histogram show information about the length of time it took 165 adults to connect to the internet.
Time (t seconds) Frequency
0 < t ≤ 10 20
10 < t ≤ 15
15 < t ≤ 17.5 30
17.5 < t ≤ 20 40
20< t ≤ 25
25< t ≤ 40
None of the adults took more than 40 seconds to connect to the internet.
(a) Use the table to complete the histogram. (2)
(b) Use the histogram to complete the table. (2)
2003Frequency
density
O 5 10 15 20 25 30 35 40
Time (seconds)
Edexcel GCSE Maths - Histograms (H) PhysicsAndMathsTutor.com

Edexcel Internal Review 9
2004Frequency
density
O 5 10 15 20 25 30 35 40
Time (seconds)
The histogram shows information about the time it took some children to connect to the internet. None of the children took more than 40 seconds to connect to the internet.
110 children took up to 12.5 seconds to connect to the internet.
(c) work out an estimate for the number of children who took 21 seconds or more to connect to the internet.
..................................... (3)
(Total 7 marks)
Edexcel GCSE Maths - Histograms (H) PhysicsAndMathsTutor.com
Edexcel Internal Review 10
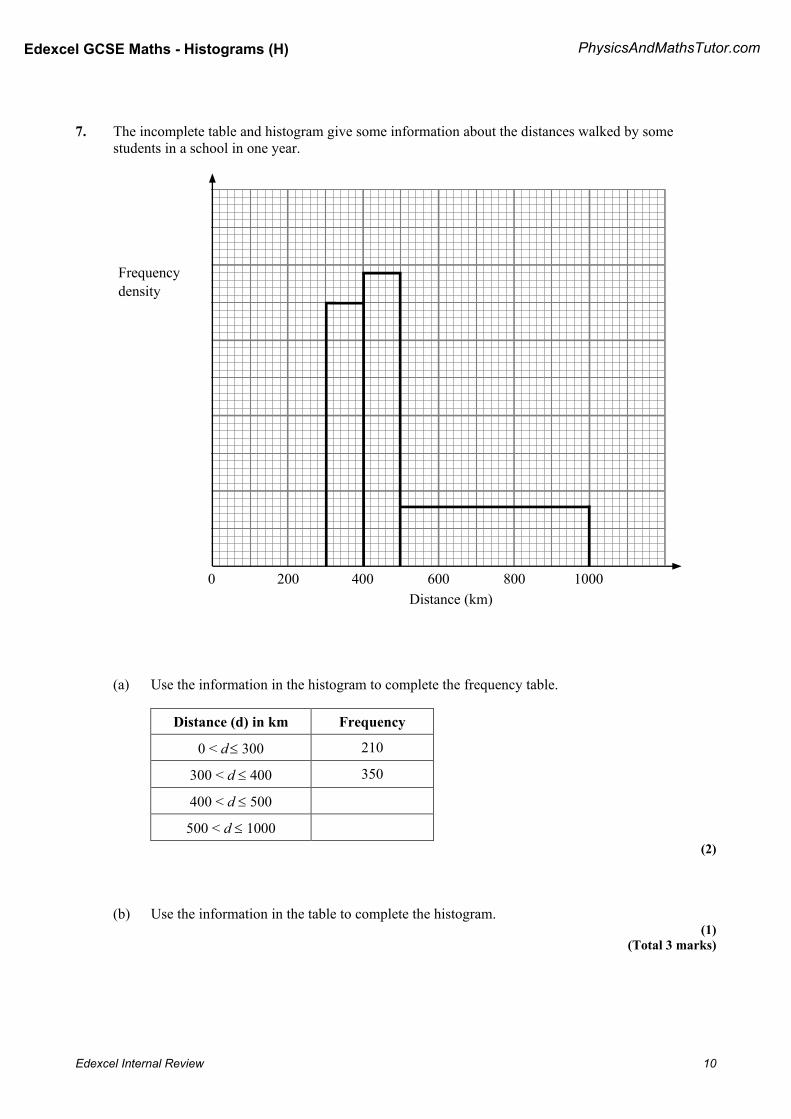
7. The incomplete table and histogram give some information about the distances walked by some students in a school in one year.
(a) Use the information in the histogram to complete the frequency table.
Distance (d) in km Frequency
0 < d ≤ 300 210
300 < d ≤ 400 350
400 < d ≤ 500
500 < d ≤ 1000 (2)
(b) Use the information in the table to complete the histogram. (1)
(Total 3 marks)
Edexcel GCSE Maths - Histograms (H) PhysicsAndMathsTutor.com

Edexcel Internal Review 11
8. The incomplete table and histogram give some information about the weights of people at a keep-fit session.
(a) Use the information in the histogram to complete the frequency table.
Weight (w) kg Frequency
40 ≤ w < 50 10
50 ≤ w < 55
55 ≤ w < 60
60 ≤ w < 75 15
75 ≤ w < 95 8 (2)
Edexcel GCSE Maths - Histograms (H) PhysicsAndMathsTutor.com

Edexcel Internal Review 12
(b) Complete the histogram. (2)
(Total 4 marks)
9. The unfinished table and histogram show information about the weight, w grams, of fish that Alan caught each day.
Weight (w grams) Frequency
0 < w ≤ 400 8
400 < w ≤ 600 5
600 < w ≤ 800 10
800 < w ≤ 1000
1000 < w ≤ 1400
Edexcel GCSE Maths - Histograms (H) PhysicsAndMathsTutor.com

Edexcel Internal Review 13
Weight of fish (w grams)
200 400 600 800 1000 1200 1400O
Freq
uenc
y de
nsity
(a) Use the information in the histogram to complete the table. (2)
(b) Use the information in the table to complete the histogram. (2)
(Total 4 marks)
10. The incomplete histogram and table show information about the weights of some containers.
Weight (w) in kg Frequency
0 < w ≤ 1000 16
1000 < w ≤ 2000
2000 < w ≤ 4000
4000 < w ≤ 6000 16
6000 < w ≤ 8000
8000 < w ≤ 12000 8
Edexcel GCSE Maths - Histograms (H) PhysicsAndMathsTutor.com

Edexcel Internal Review 14
(a) Use the information in the histogram to complete the table. (2)
(b) Use the information in the table to complete the histogram.
0
Frequencydensity
Weight (w) in kg
2000 4000 6000 8000 10000 12000
(2)
(Total 4 marks)
Edexcel GCSE Maths - Histograms (H) PhysicsAndMathsTutor.com

Edexcel Internal Review 15
11. The incomplete histogram and table give some information about the distances some teachers travel to school.
100 20 30
Distance ( km)d
Frequencydensity
40 50 60
(a) Use the information in the histogram to complete the frequency table.
Distance (dkm) Frequency
0 < d ≤ 5 15
5 < d ≤ 10 20
10 < d ≤ 20
20 < d ≤ 40
40 < d ≤ 60 10 (2)
(b) Use the information in the table to complete the histogram. (1)
(Total 3 marks)
Edexcel GCSE Maths - Histograms (H) PhysicsAndMathsTutor.com

Edexcel Internal Review 16
12. A call centre receives 64 telephone calls one morning. The table gives information about the lengths, in minutes, of these telephone calls.
Length (x) minutes Frequency
0 < x ≤ 5 4
5 < x ≤ 15 10
15 < x ≤ 30 24
30 < x ≤ 40 20
40 < x ≤ 45 6
Draw a histogram for this information.
Length (minutes)
10 20 30 40 50
(Total 4 marks)
Edexcel GCSE Maths - Histograms (H) PhysicsAndMathsTutor.com

Edexcel Internal Review 17
13. The table gives information about the heights, in centimetres, of some 15 year old students.
Height (h cm) 145 < h ≤ 155 155 < h ≤ 175 175 < h ≤ 190
Frequency 10 80 24
Use the table to draw a histogram.
140 145 150 155 160 165 170 175 180 185 190Height ( cm)h
(Total 3 marks)
14. The table shows the distribution of the ages of passengers travelling on a plane from London to Belfast.
Age (x years) Frequency
0 < x ≤ 20 28
20 < x ≤ 35 36
35 < x ≤ 45 20
45 < x ≤ 65 30
On the grid below, draw a histogram to show this distribution.
Edexcel GCSE Maths - Histograms (H) PhysicsAndMathsTutor.com

Edexcel Internal Review 18
0 10 20 30 40 50 60 70Age ( years)x
(Total 3 marks)
Edexcel GCSE Maths - Histograms (H) PhysicsAndMathsTutor.com

Edexcel Internal Review 19
15. A teacher asked some year 10 students how long they spent doing homework each night. The histogram was drawn from this information.
Frequencydensity
2
1
00 10 20 30 40 50 60 70
Time ( minutes)t
Use the histogram to complete the table.
Time (t minutes) Frequency
10 ≤ t < 15 10
15 ≤ t < 30
30 ≤ t < 40
40 ≤ t < 50
50 ≤ t < 70 (Total 2 marks)
Edexcel GCSE Maths - Histograms (H) PhysicsAndMathsTutor.com

Edexcel Internal Review 20
16. Some students at Highfliers School took a mathematics examination. The unfinished table and histogram show some information about their marks.
Mark (x%) Frequency
0 < x ≤ 40 10
40 < x ≤ 60 40
60 < x ≤ 75 45
75 < x ≤ 85 60
85 < x ≤ 95
95 < x ≤ 100 25
6
5
4
3
2
1
00 20 40 60 80 100
Mark ( %)x
Frequencydensity
(a) Use the information in the table to complete the histogram. (1)
Edexcel GCSE Maths - Histograms (H) PhysicsAndMathsTutor.com
Edexcel Internal Review 21
(b) Use the information in the histogram to complete the table. (1)
(Total 2 marks)
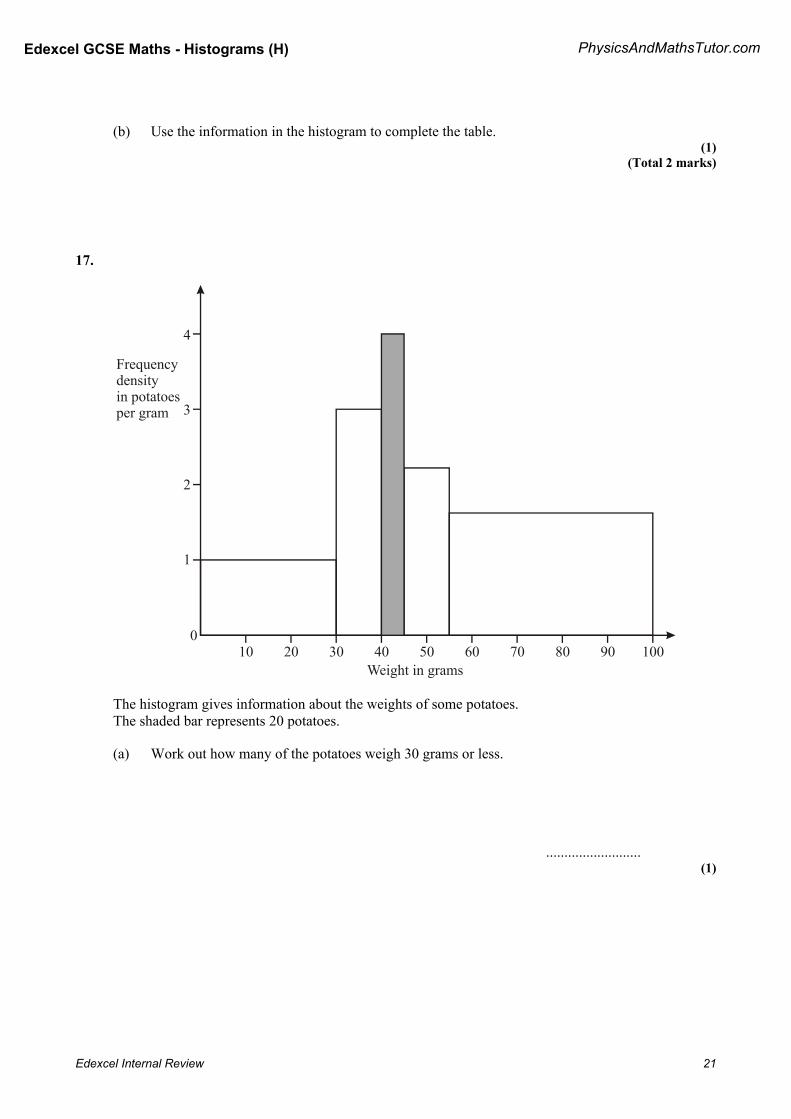
17.
4
3
2
1
010 20 30 40 50 60 70 80 90 100
Weight in grams
Frequencydensityin potatoesper gram
The histogram gives information about the weights of some potatoes. The shaded bar represents 20 potatoes.
(a) Work out how many of the potatoes weigh 30 grams or less.
.......................... (1)
Edexcel GCSE Maths - Histograms (H) PhysicsAndMathsTutor.com

Edexcel Internal Review 22
(b) Work out how many of the potatoes weigh more than 45 grams.
.......................... (2)
(Total 3 marks)
Edexcel GCSE Maths - Histograms (H) PhysicsAndMathsTutor.com

Edexcel Internal Review 23
18. The table gives information about the times, in hours, some students took to complete a piece of coursework.
Time (t) in hours Frequency
0 < t ≤ 20 30
20 < t ≤ 30 40
30 < t ≤ 55 25
Use this information to draw a histogram.
0 10 20 30 40 50 60Time ( ) in hourst
(Total 3 marks)
Edexcel GCSE Maths - Histograms (H) PhysicsAndMathsTutor.com

Edexcel Internal Review 24
19. A teacher asked some students how much time they spent using a mobile phone one week. The histogram was drawn from this information.
Frequencydensity
(studentsper
hour)
30
20
10
0
Time(hours)
1 2 3 4 5
Use the histogram to complete the table.
Time (t) hours Frequency
0 ≤ t < 21
21 ≤ t < 1
1 ≤ t < 2 30
2 ≤ t < 3
3 ≤ t < 5 (Total 2 marks)
Edexcel GCSE Maths - Histograms (H) PhysicsAndMathsTutor.com

Edexcel Internal Review 25
20. Kath recorded the times, in minutes, taken by 170 students to travel to school. The table gives information about her results.
Time (t minutes) Frequency
0 ≤ t < 20 70
20 ≤ t < 35 45
35 ≤ t < 45 44
45 ≤ t < 50 11
Use the information in the table to draw a histogram.
5
4
3
2
1
010 20 30 40 50 60
Time ( minutes)t
Frequencydensity
(Total 3 marks)
Edexcel GCSE Maths - Histograms (H) PhysicsAndMathsTutor.com

Edexcel Internal Review 26
21. The histogram gives information about the weights, in kilograms, of some boxes.
4
3
2
1
2 4 6 8 10 12 14Weight ( kg)w
Frequencydensity
Use the histogram to complete the table.
Weight (w kg) Frequency
2 ≤ w < 4 20
4 ≤ w < 7
7 ≤ w < 9
9 ≤ w < 10
10 ≤ w < 14 (Total 2 marks)
Edexcel GCSE Maths - Histograms (H) PhysicsAndMathsTutor.com

Edexcel Internal Review 27
22. The table gives information about the number of hours worked by some factory workers.
Number of hours (n) worked Frequency
0 < n ≤ 5 15
5 < n ≤ 15 42
15 < n ≤ 35 40
35 < n ≤ 50 6
Use the table to draw a histogram.
5
4
3
2
1
10 20 30 40 500
Frequencydensity
Number of hours ( ) workedn (Total 3 marks)
Edexcel GCSE Maths - Histograms (H) PhysicsAndMathsTutor.com

Edexcel Internal Review 28
23. The histogram and table show information about the number of emails received by each of the students in a school.
10
8
6
4
2
10 20 30 40 50 600
Number of emails ( )x
FrequencyDensity
Number of emails (x) Frequency
0 < x ≤ 5
5 < x ≤ 10 20
10 < x ≤ 25
25 < x ≤ 35
35 < x ≤ 60
Use the information in the histogram to complete the table. (Total 2 marks)
Edexcel GCSE Maths - Histograms (H) PhysicsAndMathsTutor.com

Edexcel Internal Review 29
24. The table and histogram show information about the length of time it took 165 adults to connect to the internet.
Time (t seconds) Frequency
0 < t ≤ 10 20
10 < t ≤ 15
15 < t ≤ 17.5 30
17.5 < t ≤ 20 40
20 < t ≤ 25
25 < z ≤ 40
None of the adults took more than 40 seconds to connect to the internet.
(a) Use the table to complete the histogram. (2)
(b) Use the histogram to complete the table.
O 5 10 15 20 25 30 35 40
Frequency density
Time (seconds)
Edexcel GCSE Maths - Histograms (H) PhysicsAndMathsTutor.com

Edexcel Internal Review 30
(2)
(Total 4 marks)
25. Munir measured the heights of some walls.
The table and histogram show information about these heights.
Height (h metres) Frequency
0 < h ≤ 1.0 9
1.0 < h ≤ 1.5 10
1.5 < h ≤ 2.5 12
2.5 < h ≤ 3.0
0 0.5 1.0 1.5 2.0 2.5 3.0
Frequencydensity
Edexcel GCSE Maths - Histograms (H) PhysicsAndMathsTutor.com

Edexcel Internal Review 31
(a) Use the histogram to complete the table. (1)
(b) Use the table to complete the histogram. (1)
(Total 2 marks)
26. Sam asks some students how long they took to finish their science homework. The table and histogram show some of this information.
Time (minutes) Frequency
5 < x ≤ 10
10 < x ≤ 15 20
15 < x ≤ 25
25 < x ≤ 35 50
35 < x ≤ 50 15
Time (minutes)
Frequency Density
0 10 20 30 40 50
Edexcel GCSE Maths - Histograms (H) PhysicsAndMathsTutor.com

Edexcel Internal Review 32
(a) Use the information in the histogram to complete the table. (2)
(b) Use the information in the table to complete the histogram. (2)
(Total 4 marks)
27. The table and histogram show some information about the area of some carpets.
Carpet area (A m2)
Frequency
10 < A ≤ 12
12 < A ≤ 15 15
15 < A ≤ 20 12
20 < A ≤ 25 10
Edexcel GCSE Maths - Histograms (H) PhysicsAndMathsTutor.com

Edexcel Internal Review 33
10 11 12 13 14 15 16 17 18 19 20 21 22 23 24 25
Carpet area (A m2)
Frequencydensity
(a) Use the histogram to complete the table. (1)
(b) Use the table to complete the histogram. (2)
(Total 3 marks)
Edexcel GCSE Maths - Histograms (H) PhysicsAndMathsTutor.com

Edexcel Internal Review 34
28. The histogram and table show information about the number of hours some adults used their mobile phones last month.
FrequencyDensity
Number of hours ( )h
50403020100
Number of hours (h) Frequency
0 ≤ h < 10
10 ≤ h < 15 30
15 ≤ h < 25
25 ≤ h < 40
40 ≤ h < 50
Use the information in the histogram to complete the table.
Edexcel GCSE Maths - Histograms (H) PhysicsAndMathsTutor.com

Edexcel Internal Review 35
(Total 2 marks)
29. The histogram shows information about the lifetime of some batteries.
1.5 2 2.5 3 3.5 4 4.5 5
Frequencydensity
Two of the batteries had a lifetime of between 1.5 and 2.5 years.
Find the total number of batteries.
..................................... (Total 2 marks)
Edexcel GCSE Maths - Histograms (H) PhysicsAndMathsTutor.com

Edexcel Internal Review 36
30. The table and histogram show some information about the weights, in grams, of some tomatoes.
Weight (w grams) Frequency
30 < w ≤ 40 4
40 < w ≤ 50 6
50 < w ≤ 65 15
65 < w ≤ 80 9
80 < w ≤ 100 4
1009080706050403020100
Frequencydensity
Weight (grams)
Use the table to complete the histogram.
(Total 2 marks)
Edexcel GCSE Maths - Histograms (H) PhysicsAndMathsTutor.com

Edexcel Internal Review 37
31. The table gives some information about the lengths of time some boys took to run a race.
Time (t minutes) Frequency
40 ≤ t < 50 16
50 ≤ t < 55 18
55 ≤ t < 65 32
65 ≤ t < 80 30
80 ≤ t < 100 24
Draw a histogram for the information in the table.
70 80 9040 50 60 100 110
Time ( minutes) t
Frequency density
(Total 3 marks)
Edexcel GCSE Maths - Histograms (H) PhysicsAndMathsTutor.com

Edexcel Internal Review 38
32. The table shows some information about the weights of some packets of crisps.
Weight (w grams) Frequency
20 < w ≤ 25 4
25 < w ≤ 35 12
35 < w ≤ 45 14
45 < w ≤ 50 8
50 < w ≤ 70 6
20 30 40
Frequencydensity
50 60 70 10
Weight ( grams) w
Use the information in the table to draw a histogram. (Total 3 marks)
01. (a) 60 40 2
B1 cao B1 cao
Edexcel GCSE Maths - Histograms (H) PhysicsAndMathsTutor.com

Edexcel Internal Review 39
(b) correct bars 2 B1 for 30 < x ≤ 40 with an area of 2½ squares B1 for 40 < x ≤ 70 with an area of 3 squares
SC: 40 give M1 if clearly using area or frequency density
[4]
02. (a) Frequency densities of 8 ÷ 10 = 0.8 16 ÷ 10 = 1.6, 15 ÷ 5 = 3, 12 ÷ 5 = 2.4 6 ÷ 20 = 0.3 3
B1+ B1 + B1 for each correct column shown on histogram If B0, then M1 for clear attempt to use frequency density or area
(b) 18, 14, 10, 8 2
1.8 × 10 = 18, 2.8 × 5 = 14, 2 × 5 = 10, 0.4 × 20 = 8
B2 all correct B1 2 or 3 correct 5 � 5 =
80
25= 2.5 birds
[5]
03. Reading top to bottom frequencies are 20; 18; 45; 52 2 B2 all correct (B1 for one frequency correct)
[2]
04. (a) 40, 60, 56, 32 2 B2 for all frequencies correct (B1 for any 1 frequency correct)
(b) 3 B1 for Frequency density label or appropriate units
B2 for 4 correct histogram bars 21
± sq
(B1 for 2 bars correct) [5]
Edexcel GCSE Maths - Histograms (H) PhysicsAndMathsTutor.com

Edexcel Internal Review 40
05. (a) 38 × 5, 36 × 17.5, 30 × 32.5, 46 × 50 (= 190, 630, 975, 2300)
Σfx = 190 + 630 + 975 + 2300 = 4095 Mean Σfx / Σf = 4095/150 27.3 4
M1 for fx with x within intervals (including ends) at least two consistently M1 (dep) for fx consistently using midpoints M1 (dep on 1st M) for use of Σfx / Σf A1 for 27.3 cao
(b) Frequency density (number of pictures per cm2) e.g. Width 0 to 10 height of rectangle 3.8(k) Width 10 to 25 height of rectangle 2.4(k) Width 25 to 40 height of rectangle 2(k) Width 40 to 60 height of rectangle 2.3(k) Bars with correct heights, widths, label and scaling 3
B2 for 4 rectangles with correct widths and heights (B1 for 3 rectangles with correct widths and heights) B1 for correct label or key and consistent scaling (SC if 0/3 award M1 if clearly using area or freq. density)
[7]
06. (a) Heights 24, 32 2 B1 cao for bar from 15 – 17.5, height 24 × 2mm squares B1 cao for bar from 17.5 – 20, height 32 × 2mm square
(b) Freqs 40, 20, 15 2 B2 cao for all 3 correct (B1 for any 1 or 2 correct)
Edexcel GCSE Maths - Histograms (H) PhysicsAndMathsTutor.com

Edexcel Internal Review 41
(c) Area up to 12.5 = 220x Area above 21 = 156x
Frequency 110220156
×=xx
78 3 M1 for attempt to find area up to 12.5 and area above 21 consistently
M1 for 110220156
× or 1108.8
6.24× or
220110156 × oe
A1 78 cao SC: If no marks earned B1 for 2mm2 = 1 person oe
[7]
07. (a) 390 2 B1cao
400 B1 cao
(b) Correct bar 1 B1 for correct bar
[3]
08. (a) 24 = 30 2
B1 24 cao B1 30 cao
(b) Column 60 ≤ w < 75 at 10 Column 75 ≤ w < 95 at 4 10 = 4 2
B1 10 and correct width (tol ± 21 small square)
B1 4 and correct width (tol 21 small square)
[4]
Edexcel GCSE Maths - Histograms (H) PhysicsAndMathsTutor.com

Edexcel Internal Review 42
09. (a) 8, 6 2 B1 cao B1 cao
(b) Bars of ht 4cm, 5cm 2 B1 for height = 4 ± 1 mm B1 for height = 5 ± 1 mm
[4]
10. (a) Freq = FD × int width = 0.018 × 1000 = 18 Or = 18 × 1 = 18
= 0 .010 × 2000 = 20 or 10 × 2 = 20
= 0.006 × 2000 = 12 or 6 × 2 = 12 OR No of small squares = 200 Total freq = 16
So 1 small square = 16 ÷ 200 = 0.08 9 × 25 × 0.08 = 18 10 × 25 × 0.08 = 20 6 × 25 × 0.08 = 12 OR 8 cm2 = 16 so 1 cm2 = 2 etc 18, 20, 12 2
M1 use of Freq = FD × int width or attempt to find freq of 1 standard square (or one answer correct) A1 cao: all three
(b) FD = Freq ÷ int width = 16 ÷ 2000 = 0. 008 so 4 sqs up 4000-6000 4 cm high
= 8 ÷ 4000 = 0.002 so 1 sq up OR 16 ÷ 0.08 = 200 200 ÷ 25 = 8 so 4 sqs up 8 ÷ 0.08 = 100 100 ÷ 25 = 4 so 1 square up OR 16 ÷ 2 = 8 so 4 sqs up etc 8000-12000 1 cm high 2
B1 4000-6000; 4 cm high B1 8000-12000; 1 cm high or if B0, M1 use of Freq = FD × int width or attempt to find freq of 1 standard square
[4]
Edexcel GCSE Maths - Histograms (H) PhysicsAndMathsTutor.com

Edexcel Internal Review 43
11. (a) 25
16 2 M1 for correct use of frequency density to find a unit of area (for example 1cm2 = 2.5 or 1 small square = 0.1) or the area of one block. A1 cao
(b) Correct black (1 cm high between 40 and 60) 1 B1 for correct black
[3]
12. F 4 10 24 20 6
Fd 0.8 1 1.6 2 1.2
or F 4 10 24 20 6
Fd 4 5 8 10 6
Correct histogram 4 M1 use of frequency density as frequency ÷ width (can be implied by two correct frequency densities or two correct bars with different widths) or area (can be implied by one correct bar) to represent frequency A2 for all 5 histogram bars correct ±½ square (A1 at least 3 correct histogram bars ±½ square) A1 for correct label and scale numbered appropriately or for key and consistent scaling
Edexcel GCSE Maths - Histograms (H) PhysicsAndMathsTutor.com

Edexcel Internal Review 44
Examples
Freq
uenc
y de
nsity
repr
esen
ts 2
cal
ls
1234
1020
3040
500
1020
3040
500
[4]
Edexcel GCSE Maths - Histograms (H) PhysicsAndMathsTutor.com

Edexcel Internal Review 45
13. Correct histogram 3
Heights in proportion 5 : 20 : 8 B3 for fully correct histogram with axes scaled OR labelled (B2: fully correct but one error) (B1: fully correct but two errors)
[3]
14. Heights 1.4, 2.4, 2, 1.5 3 B1 for correct labelling (frequency density) B1 for at least 2 columns of at least 2 different widths correct B1 for all columns correct [SC: If no marks earned then M1 for clear attempt to use frequency density or area]
[3]
15. (10), 36, 18, 22, 16 2 B2 for all 4 answers correct (B1 for any 2 correct answers)
[2]
16. (a) bar to 3 1
Bar 6cm high … (to 3) in correct place B1 cao
(b) 45 1 B1 cao
[2]
17. (a) 30 1
30 × 1 B1 cao
(b) 94 2
10 × 2.2 + 45 × 1.6 = 22 + 72 M1 for 10 × 2.2 or 45 × 1.6 A1 cao
[3]
Edexcel GCSE Maths - Histograms (H) PhysicsAndMathsTutor.com

Edexcel Internal Review 46
18. bars 1.5, 4, 1 high 3
2030 ,
1040 ,
2525
B1 for correct labelling (frequency density) B1 for at least 2 columns correct B1 for correct all columns correct SC: If no marks earned then B1 for clear attempt to use frequency density or area
[3]
19. 4, 16, 21, 8 2 B2 for 4 correct (B1 for 2 or 3 correct)
[2]
20. Column heights of: 3.5 3 4.4 2.2 Histogram 3
M1 for use of frequency density A1 correct width of 3 or 4 bars A1 fully correct histogram
[3]
21. (20), 90, 50, 40, 20 2 B2 for all 4 correct (B1 for 2 or 3 correct) Alternative Scheme B2 for 9, 5, 4, 2 (B1 for 2 or 3 of 9, 5, 4, 2)
[2]
22. Bars of heights 3, 4.2, 2, 0.4 3
B3 for all 4 bars fully correct ± ½ square (B2 for 3 bars fully correct) (B1 for 2 bars fully correct) SC: If no marks scored then B1 for use of frequency density: at least one correct result must be seen
[3]
Edexcel GCSE Maths - Histograms (H) PhysicsAndMathsTutor.com

Edexcel Internal Review 47
23. 40, 20, 75, 30, 50 2 B2 for all values correct (B1 for 2 or 3 correct values)
[2]
24. (a) Heights 24, 32 2 B1 cao for bar from 15 – 17.5, height 24 × 2 mm squares B1 cao for bar from 17.5 – 20, height 32 × 2 mm square
(b) Freqs 40, 20, 15 2 B2 cao for all 3 correct (B1 for any 1 or 2 correct)
[4]
25. (a) 3 1 B1 cao
(b) Frequency density of 9 1 B1 cao (4.25 cm high column; allow any line from 4.2 to 4.3 cm high, inclusive).
[2]
26. (a) 15, 60 2 B2 (B1 for 1 correct)
(b) 10 – 15 = 4 high, 2 35 – 50 = 1 high
B2 (B1 for 1 correct) [4]
Edexcel GCSE Maths - Histograms (H) PhysicsAndMathsTutor.com

Edexcel Internal Review 48
27. (a) 16 1 B1 cao
(b) Frequency density of 5 2 (for 12 < A ≤ 15) and 2.4 (for 15 < A ≤ 20)
B2 for a correctly completed histogram ± ½ sq in height (numbers are not needed on f.d. axis) (B1 for one correct block. NOTE: If only 15 < A ≤ 20 block correct, the correct scale must be shown on the fd axis.) B1 for 5 and 2.4 calculated but not drawn correctly
[3]
28. 140, (30), 100, 105, 20 2 M1 for Frequency = frequency density × column width, implied by one frequency correct or frequency density correctly marked on the vertical axis 1 cm = 1 unit A1 for all frequencies correct For area method M1 for identifying 1 cm² as a frequency of 5 A1 for all frequencies correct
[2]
29. 2cm² = 1 battery 20 2
M1 for use of frequency density or area Sight of 2 × 1, 6 × 0.5, 14 × 0.5, 8 × 0.5, 4 × 1 OR 4 ÷ 2, 6 ÷ 2, 14 ÷ 2, 8 ÷ 2, 8 ÷ 2 OR 2, 3, 7, 4, 4 (condone 1 error or omission) A1 cao
[2]
30. frequency densities 0.4, 0.6, 1.0, 0.6, 0.2
bars 3cm, 1cm high respectively 2 M1 for consistent correct use of fd or 1cm2 = 2 (may be implied by one correct bar) A1 for 2 correct bars
[2]
Edexcel GCSE Maths - Histograms (H) PhysicsAndMathsTutor.com

Edexcel Internal Review 49
31. 40 ≤ t <50 fd 1.6 50 ≤ t < 55 fd 3.6 55 ≤ t < 65 fd 3.2 65 ≤ t < 80 fd 2 80 ≤ t < 100 fd 1.2 3
B3 for 5 correct histogram bars ± ½`square AND frequency density numbered appropriately or key and consistent scaling (B2 for 5 correct histogram bars ± ½ square or all heights correct with frequency density numbered appropriately with one error in numbering or 3 or 4 histogram bars correct AND frequency density numbered appropriately or key and consistent scaling) (B1 for 4 histogram bars in correct proportion, no numbering or 2 or more frequency densities correctly or 2 or more histogram bars in correct proportion with appropriate numbering on the f.d. axis)
[3]
32. Bars at 4cm, 6cm, 7cm, 8 cm and 1.5 cm in height oe with fd axis labeled correctly 3 M1 for dividing frequency by group size or sight of 0.8, 1.2, 1.4, 1.6, 0.3 (minimum 2 seen) A1 for bars of consistent areas for all given frequencies B1 for fd axis labeled correctly and consistently Alternative scheme B3 for bars at 4cm, 6cm, 7cm, 8 cm and 1.5 cm in height oe with fd axis labeled correctly and consistently (e.g. 1 cm fd 0.2) [B2 for bars at 4cm, 6cm, 7cm, 8cm and 1.5cm in height oe with no labeling or incorrect labeling on the fd axis OR fully and correctly labeled fd axis with one bar error] [B1 for 4th bar twice as high as 1st bar] [B0 for bar chart with unequal bars] NB apply the same mark-scheme if a different frequency density is used e.g. bars at 1.6 cm, 2.4 cm, 2.8 cm, 3.2 cm, 0.6 cm
[3]
01. Many candidates gained full marks for this question. All but the very weakest generally drew the first bar correctly. The common wrong values in the table were 40 and 80.
02. The improvement in the success with which candidates answer questions such as this has been maintained. Many candidates had a clear idea of the concept of frequency density and were able to relate the diagram to the table in both parts.
Edexcel GCSE Maths - Histograms (H) PhysicsAndMathsTutor.com

Edexcel Internal Review 50
03. This histogram question was answered well with even many below grade A gaining at least one of the two marks. Candidates whose only error was to make an arithmetical slip in calculating “3.6 × 5” displayed poor examination technique as they failed to make use of the total “135” given in the table.
04. The performance in this very straightforward histogram question was very disappointing. Only 25% of candidates could correctly calculate the area of the bars and so the frequencies in part (a) and in part (b) only 20% of candidates gained all the marks. Frequently the vertical axis was left with no label even though an example was given in part (a).
05. Many candidates were able to use a value from within each class interval to calculate ∑fx, but multiplications and additions were often careless. Some were confused about the midpoints 17.5 and 32.5 and these were often rounded to an integer. Having calculated ∑fx correctly, some went on to divide by 4, whilst others divided by the sum of the midpoints. In part (b), a significant proportion of candidates did not know how to draw a histogram. This was usually given as a bar chart or frequency polygon. A large number of candidates did not gain the mark for labelling the vertical axis or giving a key.
06. Candidates were much more successful at completing the table in part (b) than they were at completing the histogram in part (a). Common errors in part (a) were to have the bars the wrong way round, or just to have a single bar across the width. About half the candidates were able to get full marks in part (b). Some common errors in the table were 40, 20, 30 or 80, 40, 10 or 32, 16, 12. Only the best candidates were able to do part (c). The majority did not attempt to compare the two areas, typically working only with area up to 12.5. Some candidates were able to gain credit for identifying One person = One 2 mm square
07. An increasing number of candidates are showing that they are able to work with frequency density. In part (a), many were able to complete the table correctly, but a common incorrect answer for the interval 500 < d 1000 was 4000. Part (b) was generally less successful than part (a), as some candidates reverted to a bar chart approach for the height of the bar.
08. There were many good answers to this question. It was straightforward for those candidates that had an understanding of frequency density or of the fact that it is the area under the bars that determines the frequency.
Edexcel GCSE Maths - Histograms (H) PhysicsAndMathsTutor.com

Edexcel Internal Review 51
09. Only the best candidates were able to achieve full marks for this question. Many did not appreciate that they were dealing with a histogram rather than a bar chart, and consequently related the height of each bar to the frequency and visa versa.
In part (a), most candidates were able to write down the frequency 8, but many gave 3 as the frequency for the final interval. In part (b), most candidates were able to score a mark for drawing the second bar with height 5, but many drew the first bar with height 8.
10. Many candidates were well prepared for this histogram question and were able to score full marks. Both frequency density methods and area methods were in evidence, but often there was little sign of any working. Some otherwise competent candidates lost a mark on part (b) by drawing their rectangle to the right hand end of the given axis.
11. The great majority of candidates treated the histogram as a simple bar chart, equating frequencies to the height of each bar. 12.5 and 4 in part (a) and a ‘bar’ at height 2 cm in part (b) were therefore the most common answer s seen. Very few candidates showed any understanding of frequency density. Those who did clearly understand what was required often found the correct frequency of 25 in (a) but then gave an answer of 15 in part (ii) as some candidates read the scale at 0.75 instead of 0.8
12. This question was very poorly attempted with many candidates displaying a lack of understanding of histograms. The majority used the given frequencies to draw bars of different widths and some drew frequency polygons. Very few candidates gained full marks.
Candidates who showed understanding of frequency density often made mistakes carrying out the divisions involved. Some wrote down no calculations at all and went straight to drawing the histogram, often with errors. The final bar was frequently drawn with an incorrect width. Even when correct histograms were seen the candidates often failed to gain full marks because they did not label the vertical axis or provide a key. Some candidates used frequency × class width as frequency density.
13. It was clear that this topic had not been covered by some centres. Of those candidates who understood how to draw a histogram, a number clearly struggled to evaluate 24 ÷ 15 without a calculator. The majority of candidates used the frequencies given for the heights of their bars.
14. Generally well answered but there were still a number of candidates who used the frequency as the heights of the columns. A number of candidates failed to label the y axis.
Edexcel GCSE Maths - Histograms (H) PhysicsAndMathsTutor.com

Edexcel Internal Review 52
15. This was mostly answered well. Candidates who had a clear understanding of histograms generally gave the four correct answers. Most weaker candidates just wrote down the heights of the bars.
16. This question was answered correctly by about 75% of the candidates.
17. A significant number of candidates just looked at the height of the bars and gave these as incorrect answers. The majority of candidates were able to appreciate the fact that the given diagram was a histogram.
18. Just over 45% of candidates were able to gain some marks for drawing a histogram. Of those 55% of candidates who failed to gain any marks in this question, the vast majority simply drew a bar chart using the frequency as the height of the bars rather than taking frequency density and area into consideration. Some candidates multiplied the frequency Those candidates who knew to divide the frequency by the class width generally went onto score some marks. The most common error was the omission of labelling the vertical axis. In otherwise correct work 25 ÷ 25 evaluated as 0 led to the final time interval being omitted.
19. Just under 50% of candidates were unable to gain any marks on this question. The most common error was to read the heights of the bars from the y axis and not to take the area of the histogram into account. Of those candidates who understood the concept of frequency density the majority scored full marks; just over a third of all candidates.
20. Many correct histograms were seen. Candidates should, however, be advised to show their division and write down the proposed heights of their bars before drawing the histogram. Some evidence of poor arithmetic was seen. The most common error was to give 11 ÷5 as 2.1 rather than 2.2. A small minority of candidates drew the final bar with a width of 15 rather than 5 and so failed to gain full credit.
21. This question was well answered with approximately 70% of candidates scoring full marks. Once again, there was evidence of poor arithmetic with 30 × 3 being evaluated as 60 being the most common error.
Edexcel GCSE Maths - Histograms (H) PhysicsAndMathsTutor.com

Edexcel Internal Review 53
22. A fully correct histogram was drawn by approximately 30% of candidates. The most common error was to evaluate the height of the final bar incorrectly. Many candidates were unable to deal with the division of 6 ÷15. This calculation was generally done correctly by those candidates who wrote it down as a fraction. Many candidates calculated 15 ÷ 6 and obtained the commonly seen incorrect height of 2.5
23. Approximately 70% of candidates were able to give all the correct frequencies. The most common error was for candidates to read off the y axis as they would for a bar chart.
24. Approximately 35% of candidates were able to complete the histogram correctly while just over 50% of candidates were able to complete the table correctly.
25. This was not well answered. Candidates who knew something about frequency density were able to obtain the correct missing response in the table, but even fewer were able to draw the missing column on the grid.
26. No Report available for this question.
27. It was clear that many candidates were unfamiliar with histograms of unequal width with answers of 40 in part (a) followed by bars of heights 3 cm and 2.4 cm (15 small blocks and 12 small blocks) being extremely common in (b). As the frequency density of the 15 < A ≤ 25 interval was 2.4, the vertical axis had to be numbered correctly if only this bar had the correct height to score any marks. 46% of the candidates were able to provide the correct answer of 16 in part (a) with a similar percentage scoring a mark in (b). 27% scored both marks in (b).
28. Even though this question is regularly tested on these modular tests many candidates failed to recognise the true nature of a histogram and treated it as though the different bar widths were irrelevant. Hence they thought the frequencies related to the height of the bars. As a result answers of : 70 50, 35, 10 were the most commonly seen response in about 50% of cases. 9% of candidates were able relate frequency, class width and frequency density or managed to show the correct frequency density scale and gained 1 mark. Fully correct solutions were seen in 41% of cases
Edexcel GCSE Maths - Histograms (H) PhysicsAndMathsTutor.com

Edexcel Internal Review 54
29. More able candidates with a good understanding of histograms found this question straightforward. Over 40% of candidates were awarded full marks. However many candidates cited “34” as their answer suggesting that they had used the height of the bars as proportional to the frequencies. Incorrect answers of 17, and 7 (from adding how many 2 block bar widths there were), were also often seen.
30. More than half the candidates were able to score at least 1 mark for this question. The most popular approach was to do a calculation of the frequency densities, e.g. 4/10 = 0.4, etc and then to write down an appropriate scaling on the vertical axis. A common error here was to use frequencies on the vertical axis. Examiners reported that it was sometimes difficult to see the bars in students’ responses. Candidates should be advised to draw bold lines in their diagrams.
31. 57% of the candidates scored no marks on this question, generally for drawing a histogram with heights 16, 18, 32, 30 and 24, clearly having no understanding of a histogram with bars of unequal width. Those that did often correctly calculated some of the frequency density values. Many of those that did know what they were doing tended to not number the Frequency Density axis whilst others made errors in the proportion of the bars by starting their numbering at 0.5 or 1 rather than 0 losing a mark. Quite a few candidates did everything correctly but extended the last bar to 110. Many who constructed the histogram accurately using “blocks” then failed to show a key. Nearly a quarter of the candidates scored all 3 available marks.
32. Candidates did not perform very well on this histogram question. Only 31% of candidates
scored all 3 marks for a fully correct histogram with correctly labelled and scaled frequency density axis. For this question they needed to work out the frequency density for each of the groups and then draw appropriate bars. Many candidates (about 40%) drew a bar chart and they received no marks. Marks for partial success were awarded to those candidates that could work out the frequency density or who could draw bars of correct the height but omitted the scaling on the frequency density axis. Insufficient heed was paid to the x-axis values with some candidates extending the first and last bars to cover values outside of the ranges given. There was a disappointing tendency for candidates to simply multiply or divide various values given, finding mid points etc, indicating that they were trying to apply poorly remembered rules rather than demonstrating understanding.
Edexcel GCSE Maths - Histograms (H) PhysicsAndMathsTutor.com