ED 206 368 EDES PRICE JC 810 536 A Study of Non-Native ...
19
ED 206 368 AUTHOR TITLE INSTITUTION PUB DATE' NOTP EDES PRICE DESCRITTOPS DOCUMENT RESUME JC 810 536 Sla.rk, Julie: Bateman, Harold A Study of Non-Native English Speakers' Academic Performance at Santa Ana, College. Santa Ana Coll., Calif. Aug 81 19p- ME61/PC0i Plus Postage. *Academic Achievement: Asian Americans: Community Colleges: Correlation: *English (Second Language): Grades (Scholastic): Hispanic Americans; *Language Proficiency: Language Tests: Minority Groups: *Native Speakers: Tw.o Year Colleges: *Two Year College Students: Vietnamese People ABSTRACT A study was conducted in 1980 81 at Santa Ana College (SAC) to collect data on the English communication skills of non-native English speakers and to determine if a relationship existed between these skills and student's educational success. A .sample of 22 cll.sses, with an enrollment of at least 50% non-native English speakers and representing a variety of disciplines and . i*structional methods, was selected. The Nelson -Danny vocabulary and .7( comprehension tests and the Comprehensive English Language test (CELT) of listening were 'used to measure English ability. Study' findi.us, based on test scores and grades of 53% of all students enrolled in the sample classes at census week (N=503), included the followina: (1) Vietnamese and Spanish were the most commonly spoken non-English languages: (2) overall, fewer A's and more B's, C's, and D's were earned in the sample classes than at SAC as a whole, however, these classes had lower-withdrawal rates: (3) Anthropology 101 and Sociology 100 showed significant positive correlations, between test scores and grades,. -While Chemistry 219, Math 180, and Music 161 showed consistently negative coefficients: (4) as a whole the grades of English and non-native English speakers were comparable: and (5) success rates tended to favor students who had completed English courses. The study report discusses methodology, statistical findings; and limitations and is appended by statistical data tables. (0), ***********44*************ic********************************************* Reproductions supplied by TDRS are the best that can be made from the original document. * ************01********************************,************************* IF
-
Upload
khangminh22 -
Category
Documents
-
view
4 -
download
0
Transcript of ED 206 368 EDES PRICE JC 810 536 A Study of Non-Native ...

ED 206 368
AUTHORTITLE
INSTITUTIONPUB DATE'NOTP
EDES PRICEDESCRITTOPS
DOCUMENT RESUME
JC 810 536
Sla.rk, Julie: Bateman, HaroldA Study of Non-Native English Speakers' AcademicPerformance at Santa Ana, College.Santa Ana Coll., Calif.Aug 8119p-
ME61/PC0i Plus Postage.*Academic Achievement: Asian Americans: CommunityColleges: Correlation: *English (Second Language):Grades (Scholastic): Hispanic Americans; *LanguageProficiency: Language Tests: Minority Groups: *NativeSpeakers: Tw.o Year Colleges: *Two Year CollegeStudents: Vietnamese People
ABSTRACTA study was conducted in 1980 81 at Santa Ana College
(SAC) to collect data on the English communication skills ofnon-native English speakers and to determine if a relationshipexisted between these skills and student's educational success. A.sample of 22 cll.sses, with an enrollment of at least 50% non-nativeEnglish speakers and representing a variety of disciplines and
. i*structional methods, was selected. The Nelson -Danny vocabulary and.7( comprehension tests and the Comprehensive English Language test
(CELT) of listening were 'used to measure English ability. Study'findi.us, based on test scores and grades of 53% of all studentsenrolled in the sample classes at census week (N=503), included the
followina: (1) Vietnamese and Spanish were the most commonly spokennon-English languages: (2) overall, fewer A's and more B's, C's, andD's were earned in the sample classes than at SAC as a whole,however, these classes had lower-withdrawal rates: (3) Anthropology101 and Sociology 100 showed significant positive correlations,between test scores and grades,. -While Chemistry 219, Math 180, and
Music 161 showed consistently negative coefficients: (4) as a wholethe grades of English and non-native English speakers werecomparable: and (5) success rates tended to favor students who hadcompleted English courses. The study report discusses methodology,statistical findings; and limitations and is appended by statisticaldata tables. (0),
***********44*************ic*********************************************Reproductions supplied by TDRS are the best that can be made
from the original document. *
************01********************************,*************************IF

aRANCHO SANTIAGO COMMUNITY COLLEGE DISTRICT
A STUDY OF NON-NATIVE4SPEAKERS ACADEMIC PERFORMANCE
SANTA ANA COLLEGE
V.S. DEPARTMENT OF EDUCATIONNATIONAL INSTITUTE OF EDUCATION
EDUCATIONAL RESOURCES INFORMATIONCENTER (ERIC)
XThe document has been reproduced asreceived from the person or organorahonoriginating n
NIreproduction qualityMinor changes have been made to improve
Points of view or opinions stated in this docu-ment do not necessanty represent official NIE
position or policy
U
\.)"PERMISSION TO REPRODUCE THISMATERIAL HAS BEEN GRANTED BY
Jul ie S1 ark
TO THE EDUCATIONAL RESOURCESINFORMATION CENTER (ERIC)."
a

cf
A
A Study ofNon-Native English Speakers'
Academic Performanceat
Santa Ana College
Julie StarkInstitutional Research Office
Harold Bateman, Titan of ResearchAug 4st 1981
Av.
ft

INTRODUCTI&N).
With the-increase in the number of non native English speakers enrolled
at Santa Ana College, impacts>on college programs hdve become evident.
Concern has .mounted re.garding the ability ofnon-native speakers to sufeted
in cdmmunity college 'courtes. Consequently, a task force was established in.1980-81."to insure that the non-native speaker student population be given
every opportdnity to benefit from instruction." To aid them in this purduit,
the task force i-equested information from the Institutional Research Office.I
411 Specifically, a study wds designed to collect data about the English comniun-
ication skills of this group of stude4nts and to determ' ine if a relationship exists
bet*een Jhose skills and their educational success.
METHOD
The task force selected a samM of 22 Spriik<1.981 clfs,ses to study.
Classes were selected by the following criteria: 1) enrollment included.at
least 50% non-native speakers, 2) classes represented a variety of disciplines,kf
and 3) classes. represented various teaching methods and learning medes:,
For the purposes of this study, edUcational success' is defiriedi,14 students'
final class grades. The primary instruments used to pleasure English ability
were the Nelson-Denny vocabulary qnd comprehensionfests..and the.
-,r- .Comprehensive English Language Test (CELT) of listening, selected by the
4
task force. Additionally, relevant student backgroUnd information including
previous CELT scores and English classes completed was collected.
The English tests were administered td the tudents'in each of the 22. -
classes during the thirteenth week of the semes (StUdeht piirticipation was
voluntary and anonymous. ) Native language wits identified at the time tests
were taken. Descrfptive and bivariate correlation analyses wdre then pdrfdrined.
j .0.00
A -,1

FINDINGS
Tables,1 through 5 describe the sample students and clases, and tables
through-8 present relationships between students' grades and communication
skills.
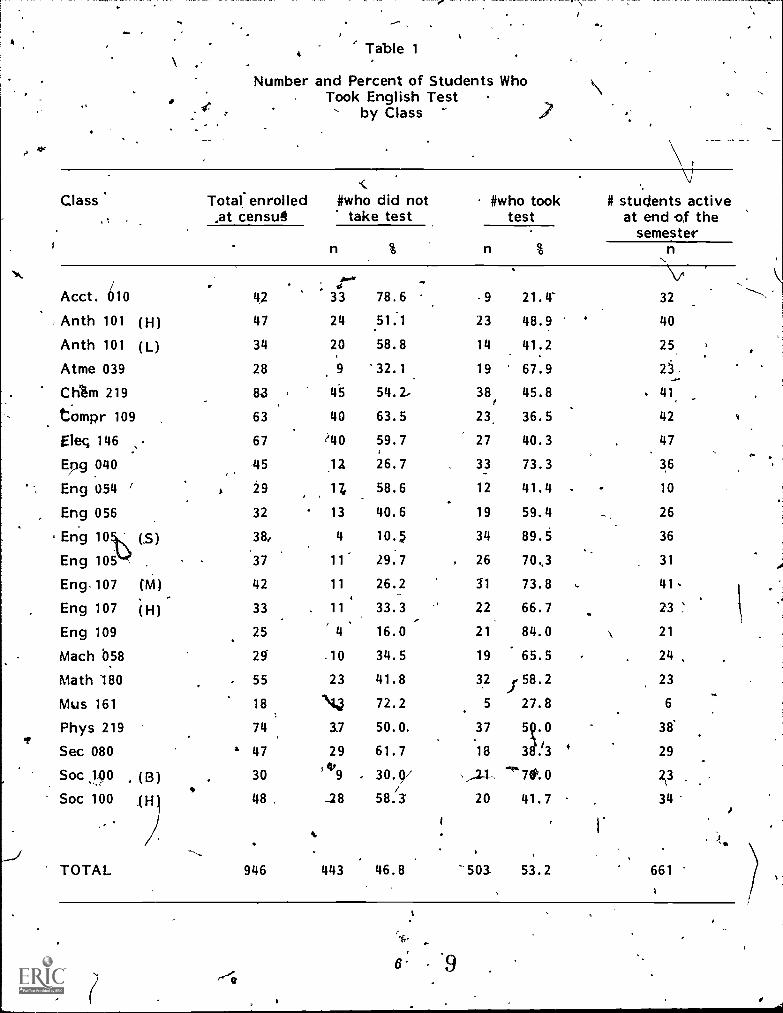
The number of students enrolled in each class at cens s week and at the
end of.the semester, and the number of studgnts who co leteci the English
tests are shown in Table 1. Fifty-three percent, .or 503, of all students
'enrolled in sample classes at census week voluntarily completed the tests.
The range of participation by class was 21$ to 89%; 'therefore, correlation
coefficients for some classes will be more valid than 'for others.
The distributions of native languages of students who completed the
English tests are shown'in Table 2. Vietnamese is the most common non-native
language and Spanish second most common. The percentage of native English
speakers in about one third of the classes is over 50%; because of sample
selection criteria, this suggests that a larger percentage of non-natives
either dropped the class before the thirteenth week,', or did not take the
English tests.44,
Table 3 provides distributions of students' previoUs CeLfsoores, where
available. Some scores may, however, be out ofdate; they are'provided for
-in-formation, to describe students, and to help -determine if student's have been
properly placed accorilingto the school's prerequisites polities.
The distribution of students' grades by class is shown in Table 4. It
can be seen that, overall, fewer A's and more B's, C's, and D's were earned
than by all students at SAC. However, a lower Overall drop rate for these,
daises heavily populated by non-native speakers is evident (although he range
is large).
2

Table 5 provides average EngliSh test %scores by class as well as the.
. ." .,rarige of scdra-within classes. The range of stores between and within classes
is great. Presumably, by the time a student enrolls in courses such as, say,
Chem 219 he has completed college courses which may have imparted some
English ability.,' Conversely, a Mach 058 student may hazxerno prior college
experience.
Spearmans rho correlation coefficients* were computed .on six variable pairs
per class to determine relationships between grades and each of four' English
teSt scores, grades and previous CELT scor s and,grades and English courses'
completed; and those coefficients are shown in Table 6. Included in the analysis
were students who completed the course with A through, F grades. An asterisk
on the table indicates that a coefficient represents cr statistically significant
.relationship at the .05 Of the six variable pairs analyzed forvach
of 22 courses, the-following significance pattern emerged:
Correlatioh of gradeawith:Courses Where significant correlation exists
17/
'Listaing test scoreVocabulary test scoreComprehension. test scoreTotal Nelson -Denny scorePrevious CELT scoresEnglish courses completed
9 (1.negative), 41%6 2'78 .. 364 a 181 5
4 (1 negative) 18
Of the six variable pair0 Anth 101 and Soc 100 (B) courses most often
shOwed significant, positive correlation. "That is, as English test scores inccduse,
so do success rates. While not always significant, it is intere4linti le not('
consistently negative coefficients for Chem 219, Math 180, and Music 161. (The7
native language distribution of these classes see Table ,2 is varied.")
*A positively signed coefficient means that the variables lend to increaseor decrease to gether, and a negatively signed coefficient Means that an inverserelationship exists between sets of variables.
, As coefficients approaCh ± 1, amount of relationship between variablesincredses; a. coefficient Of zero represents no-correlation.
A significance level of 05 indicats that this relationship would existby -chance in only 5,.or less, out of.100 c. ses. 1
To comaute Spearman Rank -older correlation coefficients, each variablescbre is assigned a ranking score, 'Coefficients were computed by class, indepen-dent of other classes'-scores, and test score ranges vary from class to class.Consequently, relationship& between classes' coefficients for English test scorescannot b4 assumed.. Table 5, showing average test scores by class, is an importantresource, therefore-, in interpreting .5pearmans rho's,.
3 6

Table 7 provides the percent distribution of students' final grades for
each class by native language. Again', statistically significant differences in
,distributions, measured by Chi square and Fisher's exact tests, are indicated
by lasteriskr. Significant differences are found in three classes, Eng 040,9
Anth 1-01*(L) and Eng 107 (M). Non-native speakers do not generally reive
lower grades than natives, according to this table.
A further goal of the study was to compare-the success of non-native
students who have completed English courses with those who have not, and
thosereSults are shown in Table 8. Successful and non successful completion
rates for non-natives who were enrolled at census week and who completed the
English tests are provided. (Successful completion = A, B, C, & Clfgrades.
Non-successful completion = D, F, W, & NCR.) While, differences in distributions
existed, usually favoring success rates for those who completed English classes,
statistical significance was, found in only one case, ,Eng 105.
LIMITATIONS
The limitations of studies which attempt to correlate grades with other. %.
a.
t.;''suskilleor, factors are outstanding Several uch studies have been completed , <
....., -
retently in regard to English ability, and results have varied. It is important
to note that correlation 45e& not imply,-causation, only degree and direction of.
-77relationship. In the case of grades, numerous variables,such as dptit4de,
intelligence, motivation, and teachers' grading practices, tqcriame a few,.
clutter the correlation and causation picture further. Instruments used to
measure communication ability also affect results.
A limitation Unique and important to this study is the fact that the English
tests were not administered until the thirteenth week of the semester, making it
impossible to measure'the English communication skills of those' who dropped
the course prior' to that time. And statistics show .that many non-natives did
drop out. Many could have dropped due tq poor communication skills and,
resultant academic performance, leaving a group biased in achievers.
4

e.
CONCLUSIONS
Significant relationships were found,for 32 of 132, or 20, correlation
coefficients computed on grades and English ability.( The- validity of those found
for the two Anth 101 courses must be qualified because less than 50% of their3
active students completed the English tests.. Those found for Soc 100 (B) appear
valid and consistent; however, fewer than 25% non-natives took the English
tests and were included.in the analyses. Findings of significant positive co-.
efficients for Mach 058 are supported by grade distributions by native language,
and programeplanners should be alerted to this.
While not always sta tically sigrlificant,, grade distributions 1:), native
language and class sometimes favor natives and sometimes non-natives. Non-
natives excel noticeably in Chem 219, Math 180, and Mus 161 Language does
not seem to be a barrier to success in those classes, as- supported by bivariate
analysis.
In regard to students who have completed English lasses and those who
have not, the former group has `a slight edge, overall, on success rates. However,
results on this are not conclusive due to lack of statistical sibificanIce and variance.
Finally, the of this study imply that, in most arc**, further study
is required to investigate the suggestions of these findings. In many cases,
however, the findings e confirmed what has heretofore been suspected or
known intuitively by involved faculty. The empirical descriptive information
provided is the firstof its kind at Santa Ana College and will be helpful to
debision-makers.
The ,following two recommendations emerge from the study's findings:
1) Further study using the present one as groundwork, by the Research
Office and Task Force, should be conducted beginning Fall 1981.
2) Enrollment in English classes for non natives should be encourage
and the effects further studied.
o
5
4
4 Table 1
Number and Percent of Students WhoTook English Test
by ClassN
Class. Total enrolled,at censu4
.Acct. 010 4.2
Anth 101 (H) 47
Anth 101 (L) 34
Atme 039 28
Ch%m 219 83
tompr 109 63
Elec. 146 .s 67
Epg 040 45
Eng 054 ' 29
Eng 056 32
Eng 19\ (5) 38,
Eng 105Va 37
Eng 107 (N1) 42
Eng 107 (H) 33
Eng 109 25
Mach '058 25
Math 180 55
Mus 161 18
Phys 219 74
Sec 080 ' 47
Soc J90 (B)..
30
Soc 100 LH 48
S
#who did nottake test
4..
33 78.6
24 51.1
20 58.8
9 32.1
45 54.2-
40 63.5
'40 59.7
.12 26.7
17, 58.6
13 40.6
4 10.5
11' 29.7
11 26.2
11 33.3-
4 16.0
.10 34.5
23 41.8
N 72.2
17 50.0.
29 61.75 41
9 . 30.9//
_28 58.3
TOTAL 946 443 46.8
#who tooktest
# students activeat end of the
semester
9 21.4-
\J"32
23 48.9 40
14 41:2 25.
19 67.9 2'
38,
45.8 . 41.
23 36.5 42
27 40.3 47
33_
73.3 36
12 41.4 - 10
19 59.4 26
34 89.5 36
26 70,3 31
31 73.8 ,. 41.
22 66.7 23 '
21 84.0 \ 21
19 65.5 24 ,
32 f 58.2 23
5 27.8 6
37 5t.0 38
18 3e.13 ' 29
,,..2A- "`70.020 41.7 34'
-503 53.2 661
a
6' 9
t
em.

Table 2 ---'4.
Distribution of Native ..ariguages of Students Who Took English Test by Class, . percents
Class English . Vietnatnese Vpanish' Other1 Totaln
Acct'010 :°-' 66.6% 0 22,2% 1.1.1%1 9t
Anth 101 (H) 40.0 55.0 5.0 0 20°.,--
Anth 101 (L) ._ 0 16.6 ,16.6 12
Atme 019
/69.033.3 ,) 38.8 27.7 t, 0 18
Chem 219 47.3. 21.0 15.7 15.7 38
Comp- 1b9 39.1, 431 4 4.3 13.0 23
Elgc 146 29.6 70.3.' 01 0
Eng-040 0 42.4 45,4- 7 12.1 33
Eng 054 ,75-.0 16.6 0, 8.3 12
Eng 056 57.1 14.2 28.5 0 14
Eng 105 (S) 0 96:4 0 3.5' 28
Eng, 105 -AO' 55.5 29.6 14.8 27
Eng 107 (M) 0 66.6 16.6 16.6 30
Eng 107 (H) . 0 68.1 ,., 18.1 13.6 22o
Eng 109 4.7 28.5 28.5 38.0 21
,Mach 058 21".0 117.3 21.0 10.5 19
Math 180 51.6 -, 35.4 6.4 6.4 31
Mus 161 20.0 80.O Q 0 5
Phys 219 13 .'8 63.8 0 / 22.2 36
Sec 080 31.2 37.5 12.5 18.7 16
Soc 100 (B) 78.9 5.2 ." 0 ' 15.7 19
'Soc 100 (S) . 65.0d
35.0 't.,14 0 0 20
1 "Otherii includes: Chinese, Korean, Portugtiese, Swahili, Turkic, Arabic, Laotian, French,Tagalog, Hindi,, Lebamese, Samoan, Japanese, Ghantri, Greek,Cambodian, Farsi, Filipino.
gkt* °
-
7 1 0

I,.
Table 3.
Distribution of CELT Scores-by classpercents
Eng 107 (H) 9.5
Eng 109 20.0
Mach 058 )40.0
_Math 180, 6.7 .
Mus 161 0
Phys 219. 5.6
Sec 080 40.0
Class . 0-29 %
Acct 010 50.0%a.
Anth 101 (h) 25.9
Anth 101 (L) 0
Atme 039 50.0
Chem 219- kCompr 109 7.)Elec 146 17.9
Eng 040 20.8
Eng 054 0
- Eng 056 0
,Eng 105 (S) -8.3Eng 105 5.0
Eng 107 .(M) 3.4
30 -44
0%
50.0
0
50.0
38.5
14.3.
53.6'
66.7
,100.0
50.0
Celt Score
% 45-59V 60-'74
50.0% 0%
16.7 0.
0 0
0 0
38.5 15.4
28.6 28.6
17.9 10.7
12..5 0
a0 0
) 0 0
45.8 41.7-
40.0 55.0
34.5 41.4 17.2
42.9 28.6 29.0
20.0 30.0 30.04 .
20.0%
20.0 20.0
60.0 33.3 -0"
100.0 0 0
. 33.3 55.6 '5.640.0 20.0 \ Ot
Soc 100 (H) 91127..) .
36,4 . 27.3
0 21
i 0 10,
0 5
0 15
0 3
0 -18.
0a
5
0 11
% 75-10,0% Total
0% 2
8.3, 12
100.0 ,. 1
, 0 6
7.7 13"21.4 14
0d
28
0 24
.- 0
50.0 2
0
0
24
20'3.4 29
. , .,.TOTAL 12.5 43..0 31.3 10.2 3.0 265
8'

..,
TaA4 , -
Distribution of Final Grades of All Students Enrolled at Census by Class.!
. percents
Classr
A ,. C
M.1
.... .
Acct 010 .''' 21.4% 31.0% 9.5%
Anth 101 '(H) 19/4 21.2 34.0
Anth 101 (L) ...- 17.6 29.4 26.5.Atme 039 .- 17.9 17.9 46.4
Chem 219 6.0 18.1 16.9
Compr 109 30.2 15.9 14.3
Elec 146 13'.4 28.4 14.9
Eng 040 8.9 37. 17.8
,Erig 054 13.'8 3.4 17.2
Eng 056 3.1 25.0 46.9
Eng 105 (S) 21.1 34.2 28.9
Eng 105 0 21.6 45.9
Eng 107 (M) 915 66.7 21.4
Ein 107 (H) 6.1 21.1 24.2
riEng 109 54.2 '24.0-., 32.0
Mah).058 r) 10.3 6.1 24.1
Math 180 12.7. 1).9 30.9
Mus 161 16.7 16:7 0 .
Phy's 219 5.4 21.6' 21.6
,Sec 080 - 17.0. .27,7 0 . 14.9
Soc 100 (B) 6.7 26..7 -, 3.7Soc 100 (H) 6.3 20.8 39.6,
7.,I
l
TOTAL 12.8 24.>1 23.9
f.
',a
_D F 1V I CR Total
0
2.1
'0
0
8t4
6.3
4.5
11.1
0
6.36
7.9
13.5
,$) ,
3.0
4.0
27.6
7.'3
0I
EL
..0
0
0
23.8%
14.9
26.5
.,
14.3%
0
0
. 0
" 8.S
0
' 42
.47
34
0 17.9 0-A
0 28
0 50.6 O . 0 83
0 33.3 0 0.,
63
9.0 29.9 0 0 67
2.2 20.0 Z.2 0 45:
0 65:5' 0 0 29
g418.8 0 0 32
2.6 5.3 0 0 ,38 4' 1
2.7 -'16.2 0 0 . 37
0 2.4 0 ;0 42
3.0, 30.3. 0 . 12.1 33
.0 16.0 . 0 -I iii -
13.8 17.2 . 0, . 0' 29
0 38.2 0 0 55
0 66.7 0 -0 , 19 '''
0. 48.6 / 0, 2.7 474
ii) ..,. 47
6'0 23.3 1Q 0 '30
0 29.2 0 2.1. 48.
f '
\ i e o
n 1.5 30.0- .i 1.5 1.2 . 546 / ,.'
15-. r
"' .,
. 4k .
TOTAL COLLEOB 18 11 , 2 1 36 /1 11. 52;21f
,
/ . *
4
10
t.
)
49
1
1 3
it!.
. :
- \
12
h.'
'-i. "
. ..-:---
mli

Q
Table 5
Average English Test Scores(Administered Thirteenth Week)
By Class
Class psten.CELT
Vocabulary,
Test
omprehenskin Total
Nelson-Denny
Acct 01083.140.0
.10.0%.
0
8.70
9.70
MeanMinimumMaximum 100.0 11.0 , 13.8 14.0
,.Anth 101 (H) <. ' .Man 74.1 10.4 9.6 . 9.4
Minimum . 24.0 7.0 0 0
Maximum 99.0 14.0 13.8 14.01
Anth 101 -(L)4
Mean 93.4 12.7 11.1 12.2
Minimum 62.0 10.4 0 8.4Maximum 100.0 14.0 13.8 14.0
Atme 039
Mean 68.7 8.2 5.9 6.5Minimuth 8.0
-0 0 0
Maximum 96.0 13.7 13.8 13.8 .
Chem 219 I
Mean 87.5 10.3 10.3 10.5
Minimum 44.0. 0 0 0 .
Maximum , 100.0 14.0 13.8 14.0
Compr 109
Mean 80.0 10.6 10.3 ) 10.1
Minimum .. 32.0 7.3 7.0 0,E.
Maximum 100:0 14.0 13.8 14;0.
Elec 146
Man 53.6 6.1 7.1 6.5Minimum 16.0 0 0 c 0 ,Maximim 100.0 14.0 13.8 14.0
Eng 040
Mean 41.3 6.4 ,- 2.8 3.8Minimum 16.0 0 0 0
Maximum 68.0 10.7 9.8 9.9
Enq 054 ,
Mean 82.7 11.2 9.8Minimum 36.0 7.0 0
Maximum 100.0 14.0 13.8 . 14.0
Eng 056 . )Mean 86.1 9.6 8.6 9.1Minimum 44.0 0 0 0
Maximum '4,100.0 13.1 13.5 13.2
. . .Eng 105 (S)
Mean 51.3 6.4 6.9 6.2Minimum 32.0 0 0 0
Maximum 76.0 11.9 11.1 11.3 1) . r
to13,
.

11Table 5 (Cont'd)
11,.4t
Class Listen. Vocabulary
Test
Comprehension Total
CELT Nelson-Denny
Eng. 105
Mean . 47.d 5.9 4.5 4.6Minimum 24.0 0 0 0
Maximum 96.0 11.6 10.7 9.7
Enq 107 (M) IMean 59.7 7.5 4.1 4.7Minimum 0 0 0 0
Maximum 88.0 12.2 , 11.9 12.1
Enq 107 (H) ...
' Mean 64.2 7.4 4.7 6.4Minimum 28.0 0 0 0
Maximum 88.0 13.1 13.8 14.0 t
Eng 109 lik,
Mean. 80.6 4.4 7.5 8.4Minimum 52.0 7.3 0 0
Maximum KO. 0 12.9 10.7 i 11:6
Mach 058 /
Mean 52.5 8.6' 6.1 6.9Minimum 12.0 0 0 0
Maximum 96.0 14.0 13.8 14.0
Math 180 ('''
Mean 80.9 10.4 \ 9.4 10.2Minimum 44.0 7.0 - . - 0 7.0Maximum 100.0 1440 13.8 14.0
Mus 161t '
Mean 69.6 e 8.8 7.9 7.5Minimum 40.0 7.0 0 , 0
Maximum 100.0 13.5 13.5 13.6 rp
Phys 219
Mean 71.2 8.1' 8.3 8.3Minimum 36.0 0 0 N 0
Maximum 96.0 14.0 13.8 14.0
Sec 0800. Mean 64:3 8.7 6.2 7.4
---'4))4 Minimum 24.0 0 0 0
1-"'
Maximum
Soc 100 (B)
;, 100.0 14.0 13.1 13.1
Mean 93.2 12.4 11.5 12,2'Minimbm 72.0 8.3 ' 0 8.3
aMaximum 100.0 14.0 13.8 14.0
IN Soc 100 (H)Mean 77.7 9.7 9. lax 9.4Minimum 28.0 0 " . 0 ''.4 0
Maximum 96,0 13.9 13.8 14.0
11
IF
14
tP
11111111111011111111

Table 6
Correlation Coefficients of Grades with English Test ScoresCELT Scores, & English Class Completed
by Class'
Class
Test ScoreCELT
Score pairsEnglishclass pairs
Listen. Vocab: Compre. TotalpairsCELT Nelson-Denny
Acct 010.
.552 .660* .275 .403 9 .386 7
Anth 101 (H) .532* .507* .490* .490* 21 -.443 8 .307 20
Anth 101 (L) .418 .755* .560* .560* 14 .560* 9
Atme 039 .201 .087 .222 .157 18' -0.270 6 .182 8
Chem 219 -.297* -.228 -.130 -.187 31 .115 9 -.408* 20
K.;..ompr 109 .394 .396 .314 .241 21 .186 13 -.073 15
Elec 146.. ,
.401* .107 .318* .294 27 .120 22 .072 11
"Eng 040 .453* -.114 .439* ,..066 '29 .429* 18 .340 5
Eng 054 .805* .581* .604* :517 10
Eng 056t -.044 .226 .499* ..388* 19 .316 4
`Eng 105 i(S) .640* .065 .138 .000 34 ..076 , 23 -.219 17
,Eng 105 .525* .029 .140 .152 26 .489 19
Eng'107 (M) .119 .175 .038 .234 30 .089 28 .349 33
Eng 107 (H),, .499* .032 .380 .316 15 .060 11 .185 17
Eng 109 .114 -.049 .335 .183 19 0 7 -.046 12
Mach 058 .387 .740* .661* .791 17 .500. 3 1. 2
Math 180 -.035 -.158 -.036 -.074 28 .373 11 -.045 13
Mus 161 -.578 -.296 -.577 -.577 5
Phys 219 .058 .102 .155 .154 31 .154 11 .126 18
Sec 080 ;571 .240 .647, .437 15 .775 4 .083 7
Soc 100 (B) .424* 0 4* .512* .590* 21 4 .789* 6
Soc 100 (H) - .185 -.18,1 -.224 -.311 "19 .274 8 .562* 11., .
1 Spearmans rho correlations computed on students who completed class with a letter gradeNand who had test scores. umber of pairs for each case is indicated,
*Significant at < .05 level.
12 15

Table 7Distribution of Final Grades of Students Who Took Test-by Class and Native Language
percents
Class/Whgage Grade
n A B . C
Acct 101English 6 33.3 66.7Vietnamese 0Spanish 2 50.0 50.0Other 1 100.0
Anth 10,1 (H)English 8 50.0 25.0 25.0Vietnamese 11 9.1 27.3 45.5Spanish 1 100.0Other
Anth 101 (L) *'English 8 37.5 50.0 12.5Vietnamese 0
Spanish 2 100.0Other
?..
100.0
Atme 039English 6 33.3 66.7Vietnamese 7 14.3 28.6 57.1Spanish 5 40.0 40.0 20.0Other 0
Chem 219 #EngiTig 18 5.6 22.2 27.,8Vietnamese 8 25.0 62.5Spanish 6 16.7 33.3Other 6 33.3 50.0 16.7
Compr 109English 9 44.4 22.2 22.2Vietnamese 10 10.0 40.0 30.0Spanish 1
Other 3 66.6 33.3
Elec 146English 8 37.5 37.5 12.5Vietnamese 19 21.1 47 . tt 26.3Spanish 0
Other 0
Enql 040English 0
Vietnamese. 14 14.3 64.3Spanish 15 6.7 26.7 33.3Other a 25.0
En I 054E h 9 44.4 11.1 22.2Vietnamese 2 100.0Apish 0
Other 1 100.0'
.Engl 056English 8 50.0 37.5Vietnamese 2 100.0Spanish 14 25.0 75.0Other 0
Engl 105 (S)English 0Vietnamese 27 25.9 33.3 25.9Spanish 0
Others 1 100.0
1.:----.....Engl 105
English 0Vietnamese 15 13.3 73.3Spanish 8 50.0 25.0Other a 25.0 25.0
D F CR W
,9.1
16.7
33.3
-,
;27.812.516.7
11.110.0 10.0
100.0
.
12.5m
5.3 0 I
14.3 7.113.3 6.7 13.3
25.0
22.2
12,,5
11.1 3.7
-,
13.312.5 12.550.0
13 16

MN,
i
)
Table 7 (Cont'd)
percents
Class/languager n c\/wA B C
GradeD F CR W I
Engl 107 (M)*0English
Vietnamese, , 20 15.0 65.0 15.0 5.0'Spanish 5 60.0' 40.0Other 5 100.0
Engl 107 (6) 4
English < 0
Vietnamese , 15 6.7 33.3 .. 13.3 6.7 26.7 13.3 rSpanish' 4 25.0 25.0 25.0 25.0.Other 3 1 33.3 ,66.6
Engl 109 --,English 1 100.0Vidtnamese 6 16.7 16.7 16.7 16.7 33.3Spanish 6, 33.3 16.7 50.0Other 6 33.3 66.6 33.3
Mach 058English 4 50.0 25.0 25:0 PVietnamese 9 44.4 33.3 22.2Spanish 4^ 50.0 25.0 25.0Other 2 50.0 50.0 11
- Math 180 *
English 16 12.5 18.8 31.3 12.5 25.0Vietnamese 11 18.2 18.2 54.5 9.1Spanish 2 ' 100.0Other 2 100.0
---4Mus 161
Eng ish 1 100.0Vietnamese 4 75.0 25.0Spanish 0
Other 0
Physics 219English 5 60.0 20.0 20.0Vietnamese 23 13.0 39.1 39.1 8.7Spanish 0
t Other 48 12.4 .25.0 25.0 37.5
Sec 080English 5 40.0 40.0 20.0Vietnamese 6 16.7 83.3 1Spanish 2 50.0 50.0Other 3 66.6 33.,3
Soc 100 (B)15 13.3 40.0 40.0 6.'7riglish
Vietnamese 1 100.0Spanish 0
Other 3 33.3 66.6
Soc 100 (H) tEnglish 13 15.4 23.1 53.8 7.7VietnameseSpanish
7
0
14.3 43.9 42.9 IOther 0
i
* Significant Chi square scores exist at the j :05 level.*
141 7
..

Table 8 fSuccessful and Non-successful Completion Rates
For Non-Native Speakers Who Did 6 Did Not Complete English Classes
by Class
Class % receivedSuccessful grade
% receivedUnsuccessful grade ' n
,
Acct 10i
Completed English class 100.0% 0%
Did not complete 100.0 0 1
Anth 101 (H)
100.0 0 6'Completed English classDid not complete 83.3 16.7 6
Anth 101 (L)
Completed English class 100.0 0 2
Did not complete 100.0 0 2
Atme 039
Completed English class 100.0 0 6
Did not complete 100.0 0 6
Chem 219
Completed English class 84,6 0;15.4 13
Did not complete t 71,,,4 . 28.6 7% I
Compr 109Completed Englifsh class 100.0 0 Li
.,, Did not complete 70.0 30.0 , 10
." Elec 146 7*P''Completed English class 100.0 0 3
Did not complete ',* 93.8 0 6.3 16
Eng 040 ' .c,.
Compleltd English classDid not;,complkte
...,
66.773.3
'..,._.
33.326.07
3
30
Enq 054
Completed English class 100.0 0 2
Did not complete : 100.0 0 1
Eng 056
Completed English class 100.0 .0 1
Did not complete 100.0 d 5
Enq 105 (S)
Completed English class 100.0 0 12
Did not complete 75.0 25.0 16
Eng 105 *
Completed English class 00.0 15
Did not complete, 100 . 0 0 12
Eng 107, (M)
Completed English classDid not complete
96.31000
3.Ya
273
fi
Eng 107 (H)
Completed English class 83.3 16.7 18
`Did not complete 75.0 25.0 4
15 18

t. 1
Table 8 (Cont'd)
Class I received % receivedSuccessful grade Unsuccessful grade
Mach 058
100.0Completed English classDid not complete 50.0 50.0 14
Math 180
100.0 0 8Completed English classDid not complete 85.7 14.3 7
Music 161
C(ompleted English class 0 0 0Did not complete 100.0 0 4
Phys 219
Completed English class * 93.3 6.7 15Did not complete
Sec 080
75.0
t.
25.0 y16
Completed English class 100.0 0 5Did not complete 50.0 50.0 6
Soc 100 (B)Completed English class 100.0 0 2Did not complete 100.0 2
Soc 100 (H)Completed English class 100.0 0 4Did not complete 100.. 0 0 3
"SignifIcantithi Square or Fisher's exact scores exist at -""*...05 level.
OCT1 6 1981
ERIC Clearinghouse for Junior Colleges96 Rowe!' Library Building
University-of California
Los Angeles, California 90024
1916
P.1