Economic perceptions and vote choice: Disentangling the endogeneity
11
Political Behavior, Vol. 19, No. 1, 1997 ECONOMIC PERCEPTIONS AND VOTE CHOICE: Disentangling the Endogeneity Christopher Wlezien, Mark Franklin, and Daniel Twiggs Much previous research shows that variation in vote choice closely follows variation in economic perceptions over time. A number of scholars argue that the pattern is rooted in cross-sectional effects and have found apparent evidence of such effects. However, most of these studies do not take into account the possibility that economic perceptions are themselves structured by vote choice, which poses potentially serious implications. We begin to address this endogeneity, focusing specifically on Lewis- Beck's (1988) analysis of economic voting. The results suggest that the cross-sectional effects of the economy on vote choice have been substantially overstated. A growing body of literature shows that changes over time in government approval, party identification, and election outcomes are structured by per- ceptions of the economy (see, e.g., Hibbs, 1987; Fair, 1988; Lewis-Beck, 1988; Brody, 1991; MacKuen, Erikson, and Stimson, 1992; Erikson and Wlezien, 1996). Precisely how this structuring comes about is less clear. The time-serial connection between the economy and political behavior might be rooted in cross-sectional effects. Indeed, researchers have found evidence of effects of economic perceptions on vote choice at the individual level (Fiorina, 1978; Kinder and Kiewiet, 1979, 1981; Lewis-Beck, 1988; Marlcus, 1988). The effects appear strong, especially those that are sociotropic, pro- spective, and mediated by a focus on government policies. Indeed, the mea- sured effects are so strong that, if everyone were to vote on the basis of correct perceptions of economic conditions, up to half the electorate could be expected to swing from support of one party to support of another in appro- priate economic circumstances (see Lewis-Beck, 1988, Table 6.2). Needless to say, such swings would be far greater than occur in practice. But perhaps the magnitude of the individual-level effects have been over- stated. Ignored in most of these studies has been the possibility that percep- 0190-9320/97/0300-0007SO]2.5<yO © 1997 Plenum PublishingCorporation 7 Department of Political Science, University of Houston, Houston, TX 77204-3474.
-
Upload
independent -
Category
Documents
-
view
1 -
download
0
Transcript of Economic perceptions and vote choice: Disentangling the endogeneity

Political Behavior, Vol. 19, No. 1, 1997
ECONOMIC PERCEPTIONS ANDVOTE CHOICE:Disentangling the Endogeneity
Christopher Wlezien, Mark Franklin, and Daniel Twiggs
Much previous research shows that variation in vote choice closely follows variationin economic perceptions over time. A number of scholars argue that the pattern isrooted in cross-sectional effects and have found apparent evidence of such effects.However, most of these studies do not take into account the possibility that economicperceptions are themselves structured by vote choice, which poses potentially seriousimplications. We begin to address this endogeneity, focusing specifically on Lewis-Beck's (1988) analysis of economic voting. The results suggest that the cross-sectionaleffects of the economy on vote choice have been substantially overstated.
A growing body of literature shows that changes over time in governmentapproval, party identification, and election outcomes are structured by per-ceptions of the economy (see, e.g., Hibbs, 1987; Fair, 1988; Lewis-Beck,1988; Brody, 1991; MacKuen, Erikson, and Stimson, 1992; Erikson andWlezien, 1996). Precisely how this structuring comes about is less clear. Thetime-serial connection between the economy and political behavior might berooted in cross-sectional effects. Indeed, researchers have found evidenceof effects of economic perceptions on vote choice at the individual level(Fiorina, 1978; Kinder and Kiewiet, 1979, 1981; Lewis-Beck, 1988; Marlcus,1988). The effects appear strong, especially those that are sociotropic, pro-spective, and mediated by a focus on government policies. Indeed, the mea-sured effects are so strong that, if everyone were to vote on the basis ofcorrect perceptions of economic conditions, up to half the electorate could beexpected to swing from support of one party to support of another in appro-priate economic circumstances (see Lewis-Beck, 1988, Table 6.2). Needlessto say, such swings would be far greater than occur in practice.
But perhaps the magnitude of the individual-level effects have been over-stated. Ignored in most of these studies has been the possibility that percep-
0190-9320/97/0300-0007SO]2.5<yO © 1997 Plenum Publishing Corporation
7
Department of Political Science, University of Houston, Houston, TX 77204-3474.

tions of economic conditions might in many cases themselves be determinedby what Campbell et al. (1960) called the "perceptual screen," where voterstake a favorable view of policies pursued by (or the policy outcomes associ-ated with) candidates or parties that they support. To the extent that votersassociate economic performance with the incumbent government (the ques-tion that lies behind all these studies) a government they liked (disliked)might be deemed to be performing well (poorly), irrespective of real eco-nomic conditions. Scholars who fail to take this connection into account willtend to exaggerate the cross-sectional effects of economic assessments onvote choice.
There is some evidence that political factors structure economic percep-tions (Conover, Feldman, and Knight, 1987). Moreover, it appears that theconsequences of such endogeneity may be rather substantial, at least if wejudge by analysis of experimental survey data (Wilcox and Wlezien, 1996). Inthis paper we begin to address the endogeneity of economic perceptions andits implications, focusing specifically on Lewis-Beck's (1988) analysis, whichprovides what may be the strongest evidence of cross-sectional economic vot-ing in the literature.
LEWIS-BECK'S MODEL OF ECONOMIC VOTING
In his book Economics and Elections: The Major Western Democracies(1988), which builds on an earlier article (1986), Lewis-Beck develops anelaborate model of economic voting. This model takes into account all themajor effects of economic evaluations: pocketbook, sociotropic, retrospec-tive, prospective, simple, and mediated.' The model, as depicted by Lewis-Beck, is reproduced in Figure 1. Here we see that vote choice (technically,the likely vote for the incumbent party) represents a function of retrospec-tive and prospective evaluations of the government s economic performance(and other factors, including ideology and social class).2 These "complex," ormediated, economic evaluations represent a function of other retrospectiveeconomic evaluations, including the national economic situation, four spe-cific aspects of the governments effect on the economy (household fi-nances, job prospects, unemployment, and inflation), and anger over gov-ernment economic policies in general. The latter variable also is modeled asdirectly influencing the vote.
Lewis-Becks analyses support the model described in Figure 1; indeed, themodel effectively summarizes his analyses. Let us consider his analysis ofincumbent party vote, which we replicate here. We rely on data from Euro-barometer #21,3 which was fielded in the Spring of 1984, and employ OLSregression techniques following Lewis-Beck—logit analysis yields substan-tively identical results. All of the measures used in the analysis are the same
8 WLEZIEN, FRANKLIN, AND TWIGGS

ECONOMIC PERCEPTIONS AND VOTE CHOICE 9
FIG. 1. Lewis-Beck's model of economic voting.
as, or as close as is possible to, those used by Lewis-Beck (see the tables foroperational definitions). The results of the vote choice regressions for the fourcountries investigated by Lewis-Beck that were included in Eurobarometer#21 (Britain, France, Germany, and Italy) are presented in Table 1.4
It is clear in the table that the two primary economic measures do power-fully predict vote choice in the four countries. Consistent with Lewis-Becksown analyses, all of the coefficients are positive and seven out of eight arestatistically significant (p < .05, one-tailed). Moreover, prospective economicevaluations have larger and consistently more reliable effects. As Lewis-Beckconcludes, the economics of individual vote choice seem to be much moreprospective than retrospective.
Note, however, that neither Lewis-Beck's analysis of vote choice nor ourreplication takes account of the possible operations of the perceptual screen.Lewis-Beck does indirectly consider this screen when he introduces ideologyand social class into his models of economic perceptions. Still, he does notdirectly address the endogeneity of these perceptions, which biases his anal-ysis toward finding economic effects.5 The problem boils down to the conse-quences of ignoring causal feedback from vote choice to economic evalua-tions themselves.
Consider the model in Figure 2. This model is exactly the same as Lewis-Beck's, depicted in Figure 1, with two important exceptions; the arrows con-necting the two primary economic variables and vote choice run in both di-rections. That is, the relationships are modeled as reciprocal, where economicevaluations influence vote choice and vote choice influences economic eval-

10 WLEZIEN, FRANKLIN, AND TWIGGS
TABLE 1. A Replication of Lewis-Beck's Analysis of Vote Intention —OLS Results
Independent Variable
Future government effect on thenational economy
Government effect on the nationaleconomy
Anger over government policies
Ideology
Social class
Intercept
R2
Number of cases
Britain
.19"(.02).14"
(.02).07"
(.01).05"
(.01)-.10"
(.03)-.71"
(.05).55
690
France
.09"(.02).02
(.03).04"
(.01)-.15"
(.01).03
(.03).92"
(.08).55
658
Germany
.12"(-03).13"
(.02).05"
(.02).10"
(-01)- .08"
(.03)-.70"
(.06).47
687
Italy
.08"(.03).06"
(.03).02
(-02).10"
(.01)- .07"
(.03)-.06
(.07).32
519
"p<.01><.05 (one-tailed)Note: Standard errors are in parentheses.The variables are defined as follows:
Vote = the party the respondent would support if the general election were held tomorrow,which requires country-specific coding but generally is coded so that 1 = the incumbentparty and 0 = the opposition.
Future Government Effect on the National Economy = the effect the government's policieswill make on the country's general economic situation a year from now, where 1 = madeworse, 2 = not much difference, and 3 = improved.
Government Effect on the National Economy = the effect the government's policies havehad on the country's general economic situation during the last year, where 1 = badeffect, 2 = not much difference, and 3 = good effect.
Anger Over Government Policies = whether the respondent feels angry about the way thegovernment is handling the economy, where 1 = always, 2 = often, 3 = sometimes, 4 =seldom, 5 = never.
Ideology = self-placement on a left-right scale, where 1 = left and 10 = right.Social Class = a measure based on occupation of head of household, where 0 = middle
class and 1 = working class.
uations. We can represent these effects by outlining the system of three equa-tions described in Figure 2, as follows:
where the superscripts R and p correspond to Retrospective and Prospectiveassessments of the government s effect on the economy, and the superscriptv

ECONOMIC PERCEPTIONS AND VOTE CHOICE 11
FIG. 2. Lewis-Beck's model of economic voting, with reciprocal effects.
designates incumbent party Vote. Notice that Vote is included in each of thetwo economic evaluations equations, numbered 1 and 2, and the two eco-nomic variables are included in the vote choice equation, numbered 3.
Now, if Vote influences either of the two economic variables (that is, if Bjor B7 is greater than 0), then directly estimating the vote choice equation, aswe did in Table 1, will yield biased and inconsistent parameter estimates(Pindyck and Rubinfeld, 1991). Consider, for example, a movement of thedisturbance term ve in equation (3). Clearly any movement in this term willcause an equivalent movement in Vote, but notice that, if REconomy orpEconomy is partially determined by movement in Vote, the movement inVote will lead to movement in REconomy or pEconomy. Thus, either or bothof these economic variables will necessarily be correlated with the distur-bance term, ve. Given these circumstances, directly employing either OLS orlogit estimation with equation 3 will inflate the effects of the economic vari-ables on vote choice, just as directly estimating equations 1 or 2 may inflatethe effects of vote choice on economic evaluations. In order to assess therelationships between economic evaluations and vote choice, therefore, otherestimation techniques are required.
A REANALYSIS OF ECONOMIC VOTING
One way to estimate the model in Figure 2 is to employ two-stage tech-niques. Another is to employ structural equation modeling techniques of thesort used in the LISREL computer program (Joreskog, 1973, 1977). We em-ploy an elaboration of the Joreskog method implemented in EQS, which pro-duces full-information maximum likelihood (FIML) solutions (Bentler, 1985;Bentler and Weeks, 1980). Though two-stage least squares and logit estima-tion procedures both yield similar findings, the FIML procedure has the ad-
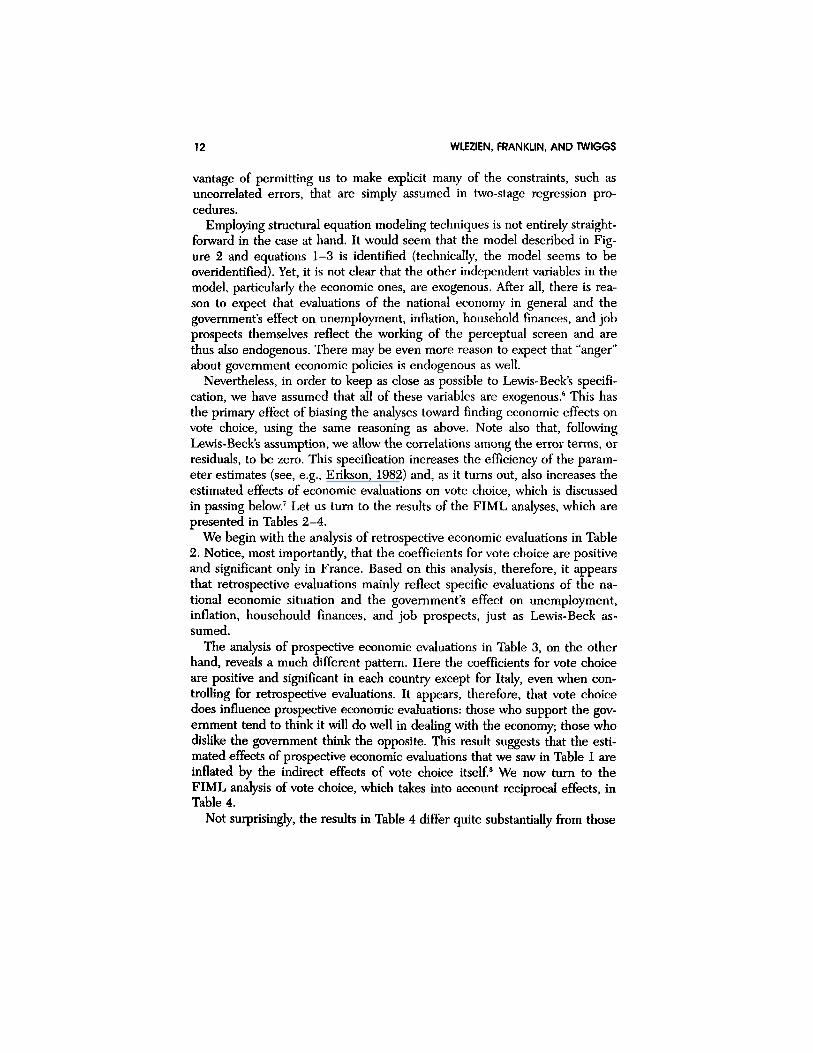
vantage of permitting us to make explicit many of the constraints, such asuncorrelated errors, that are simply assumed in two-stage regression pro-cedures.
Employing structural equation modeling techniques is not entirely straight-forward in the case at hand. It would seem that the model described in Fig-ure 2 and equations 1-3 is identified (technically, the model seems to beoveridentified). Yet, it is not clear that the other independent variables in themodel, particularly the economic ones, are exogenous. After all, there is rea-son to expect that evaluations of the national economy in general and thegovernments effect on unemployment, inflation, household finances, and jobprospects themselves reflect the working of the perceptual screen and arethus also endogenous. There may be even more reason to expect that "anger"about government economic policies is endogenous as well.
Nevertheless, in order to keep as close as possible to Lewis-Beck's specifi-cation, we have assumed that all of these variables are exogenous.6 This hasthe primary effect of biasing the analyses toward finding economic effects onvote choice, using the same reasoning as above. Note also that, followingLewis-Beck's assumption, we allow the correlations among the error terms, orresiduals, to be zero. This specification increases the efficiency of the param-eter estimates (see, e.g., Erikson, 1982) and, as it turns out, also increases theestimated effects of economic evaluations on vote choice, which is discussedin passing below.7 Let us turn to the results of the FIML analyses, which arepresented in Tables 2-4.
We begin with the analysis of retrospective economic evaluations in Table2. Notice, most importantly, that the coefficients for vote choice are positiveand significant only in France. Based on this analysis, therefore, it appearsthat retrospective evaluations mainly reflect specific evaluations of the na-tional economic situation and the government's effect on unemployment,inflation, househould finances, and job prospects, just as Lewis-Beck as-sumed.
The analysis of prospective economic evaluations in Table 3, on the otherhand, reveals a much different pattern. Here the coefficients for vote choiceare positive and significant in each country except for Italy, even when con-trolling for retrospective evaluations. It appears, therefore, that vote choicedoes influence prospective economic evaluations: those who support the gov-ernment tend to think it will do well in dealing with the economy; those whodislike the government think the opposite. This result suggests that the esti-mated effects of prospective economic evaluations that we saw in Table 1 areinflated by the indirect effects of vote choice itself.8 We now turn to theFIML analysis of vote choice, which takes into account reciprocal effects, inTable 4.
Not surprisingly, the results in Table 4 differ quite substantially from those
12 WLEZIEN, FRANKLIN, AND TWIGGS

ECONOMIC PERCEPTIONS AND VOTE CHOICE 13
TABLE 2. An Analysis of Retrospective Economic Evaluationsa —FIML Results
Independent Variable
Vote
National economic situation
Government effect on unemployment
Government effect on inflation
Government effect on household finances
Government effect on own job
Number of cases
Britain
-.15(.10).28"
(.03).27"
(.05).10"
(.04).15"
(.05).12"
(-05)589
France
.27"(.06).17"
(.03).25"
(.04).02
(.04).09°
(.04).11"
(.04)499
Germany
-.01(-07).25°°
(.03).36"
(.04).15"
(-04).03
(-04).22"
(.05)567
Italy
.01(.10).21"
(.03).35"
(.06).21"
(-06).06
(.06).06
(.05)432
°°p <.01°p < .05 (one-tailed)Note: Standard errors are in parentheses.The dependent variable is the Government Effect on the National Economy.The variables that are original to thisi analysis are defined as follows:
National Economic Situation = how the economy has changed over the last year, where 1= a lot worse and 5 = a lot better.
Government Effect on Unemployment = effect of the governments policies on unemploy-ment, were 1 = bad effect, 2 = not much difference, and 3 = good effect.
Government Effect on Inflation = effect of the governments policies on prices, where 1 =bad effect, 2 = not much difference, and 3 = good effect.
Government Effect on Household Finances = effect of the governments policies on therespondent's household finances, where 1 = bad effect, 2 = not much difference, and 3= good effect.
Government Effect on Own Job = effect of the government's policies on the respondent'sprospects of keeping (or getting) a job, where 1 = bad effect, 2 = not much difference,and 3 = good effect.
in Table I.9 Although the effects of the noneconomic variables remain muchthe same, the effects of the retrospective and prospective economic variablesdiffer in two important ways. First, the overall effects of these variables onvote choice are diminished: only three of the seven coefficients that werepositive and significant (p < .05, one-tailed) in Table 1 remain so in Table 4.Second, the nature of the effects differs substantially: only one of the fourprospective coefficients is positive and significant (not surprisingly this is truein Italy, where vote had no effect on prospective evaluations). Two of the fourretrospective coefficients, however, are positive and significant. Even to theextent that economics do influence vote choice, therefore, the effects appearto be mostly retrospective.10

14 WLEZIEN, FRANKLIN. AND TWIGGS
TABLE 3. An Analysis of Prospective Economic Evaluationsa — FIML
Independent Variable
Vote
Government effect on the nationaleconomy
National economic situation
Government effect on householdfinances
Anger over government policies
Number of cases
Britain
.28°(.15).31"
(.06).11"
(.03).09"
(.04).10"
(.03)589
France
.40"(.08).26"
(.05).06°
(.03).15"
(.04).10"
(.03)499
Germany
.27"(.08.).24"
(.03).15"
(.03).09"
(.03).09"
(.03)567
Results
Italy
-.13(-14).24"
(.05).16"
(.03).07
(-06).12"
(-03)432
"p < .01°p < .05 (one-tailed)Note: Standard errors are in parentheses.The dependent variable is the Future Government Effect on the National Economy.
DISCUSSION
It is clear, based on our analysis, that vote choice structures economic per-ceptions. More importantly, when we begin to account for this structuring,the estimated effects of economic perceptions on vote choice are substantiallyreduced. Put simply, Lewis-Beck's (1988) analyses overstate the cross-sec-
TABLE 4. A Reanalysis of Vote Intention— FIML Results
Independent Variable
Future government effect on thenational economy
Government effect on the nationaleconomy
Anger over government policies
Ideology
Social class
Number of cases
Britain
.08(.07).23"
(-05).08"
(.02).06"
(.01)-.11"
(.03)589
France
-.10(.05)
-.05(.04).09"
(.02)-.17"
(-01).02
(.03)499
Germany
-.05(.06).19"
(.04).07"
(.02).11"
(.01)-.14"
(.03)567
Italy
.12°(-05).04
(.04).02
(.02).11"
(.01)-.07°
(-03)432
°°p < .01°p < .05 (one-tailed)Note: Standard errors are in parentheses.

tional effects of these perceptions. In adoption, the nature of the effects dif-fer: based on our analysis, the remaining effects of economic perceptions arelargely retrospective, not prospective." Even these effects, however, may beoverstated, for we treat many economic perceptions as exogenous when thereis good reason to think that they (particularly the "complex" economic instru-ments) are not. Accounting for such endogeneity can only further attenuatethe connection between economic perceptions and vote choice. Unfortu-nately, this accounting requires correctly specified structural models of eco-nomic perceptions. Fully disentangling the endogeneity between economicperceptions and vote choice must therefore await future research.
It ultimately may turn out that the cross-sectional variation in economicperceptions matters little for the voting decision. Such a finding would notimply that economics does not matter for political behavior. After all, we doknow that the variation in vote choice, party identification, and other politicalvariables closely follows the variation in economic conditions (and perceptionsof those conditions) over time. And, as Kramer (1983) has shown, this patterndoes not require a cross-sectional relationship; people may respond over timeto the variation in economic performance even though the cross-sectionaldistribution of political judgments reflects other, noneconomic factors. Theeffect of economic performance may simply take the form of an intercept atany point in time.
Acknowledgments. We thank Lauren McLaren, Michaell Taylor, and Toshi Yuasa forassistance with data analysis, and Richard Brody, Raymond Duch, Bradford Jones,Kathleen Knight, Michael Palumbo, Marianne Stewart, Kent Tedin, Nat Wilcox, and,especially, Robert Erikson for critical comments and suggestions.
ECONOMIC PERCEPTIONS AND VOTE CHOICE 15
NOTES
1. The important distinctions are between assessments that focus on the voter's own "pocket-book" as opposed to wider, "sociotropic" concerns; assessments that look to past "retrospec-tive" economic performance as opposed to future "prospective" performance; and assess-ments that are "simple" as opposed to those that are "complex," mediated by a specific focuson government policies. Note that we use the words "perceptions" and "evaluations" inter-changeably throughout the article to describe the various economic assessments peoplemake.
2. Ideology and social class are not included in Lewis-Beck's figure, but they are included in hisanalysis. To clarify his model specification we have included the variables in our Figure 1.We have excluded "religiosity," which only influences vote choice in Italy and has no effecton economic perceptions in Lewis-Beck's analyses. Including the variable does not alter anyof the findings described herein.
3. These are the data that Lewis-Beck used for his 1986 article, though in his book he givesprimacy to data collected six months earlier. Note, however, that his own analysis and oursindicate that the data yield quite similar results.
4. Lewis-Beck also produces results for Spain, but those data are not readily available—Spain

was not a member of the European Community in 1984 and so was not included in theEurobaromoter study.
5. Lewis-Beck's focus on perceptions of the "government s effect" on the economy makes suchan assessment particularly urgent (Wilcox and Wlezien, 1996).
6. Specifically, the "exogenous" variables are National Economy, Household, Job Prospects,Unemployment, Inflation, Anger, Ideology, and Social Class, as described in Figure 2 andequations 1-3. The variables are defined in Tables 1 and 2.
7. The specification actually requires full-information maximum likelihood (FIML) solutions.8. The finding also makes electoral cycles in economic expectations (Suzuki, 1992) much more
understandable—see Ladner (1996).9. As was mentioned above, two-stage least squares and logit estimation techniques produce
similar results.10. It is worth noting that when we allow the error terms in the three equations to be correlated,
economic effects on vote choice are even less evident: only one of the eight coefficients ispositive and significant, and just barely so.
11. This finding may make sense, even in the context of prospective effects on other politicalvariables such as government or presidential approval. That is, vote choice is much more"consequential" to respondents.
REFERENCES
Bender, P. M. (1985). Theory and Implementation of EQS, A Structural EquationsProgram. Los Angeles: BMDP Statistical Software.
Bentler, P. M., and D. G. Weeks (1980). Linear structural equations with latent vari-ables. Psychometrika 45: 289-308.
Brody, Richard (1991). Asessing the President: The Media, Elite Opinion, and PublicSupport. Stanford, CA: Stanford University Press.
Campbell, Angus, Philip E. Converse, Warren E. Miller, and Donald E. Stokes (1960).The American Voter. New York: Wiley.
Conover, Pamela, Stanley Feldman, and Kathleen Knight (1987). The personal andpolitical underpinnings of economic forecasts. American Journal of Political Science31: 559-583.
Erikson, Robert S. (1982). The "uncorrelated errors" approach to the problem ofcausal feedback Journal of Politics 44: 863-881.
Erikson, Robert S., and Christopher Wlezien (1966). Of time and presidential electionforecasts. PS: Political Science and Politics 29: 37-39.
Fair, Ray (1988). The effect of economic events on the vote for president: A 1984update. Political Behavior 10: 168-179.
Fiorina, Morris P. (1978). Economic retrospective voting in American national elec-tions: A micro-analysis. American Journal of Political Science 22: 426-443.
Hibbs, Doublas A. (1987). The American Political Economy. Cambridge, MA: HarvardUniversity Press.
Joreskog, K. G. (1973). A general method for estimating a linear structural equationsystem. In A. S. Goldberger and O. D. Duncan (eds.), Structural Equation Modelsin the Social Sciences (pp. 85-112). New York: Seminar.
Joreskog, K. G. (1977). Structural equation models in the social sciences: Specification,estimation and testing. In P. R. Krishnaiah (ed.), Applications of Statistics (pp. 265-287). Amsterdam: North Holland.
16 WLEZIEN. FRANKLIN, AND TWIGGS

Kiewiet, D. Roderick (1983). Macroeconomics and Micropolitics: The Electoral Effectsof Economic Issues. Chicago: University of Chicago Press.
Kinder, Donald R., and D. Roderick Kiewiet (1979). Economic discontent and politi-cal behavior: The role of personal grievances and collective economic judgments incongressional voting. American Journal of Political Science 23; 495-527.
Kinder, Donald R., and D. Roderick Kiewiet (1981). Sociotropic politics. British Jour-nal of Political Science 11: 129-161.
Kramer, Gerald H. (1971). Short-term fluctuations in U.S. voting behavior, 1896-1964.American Political Science Review 65: 131-143.
Kramer, Gerald H. (1983). The ecological fallacy revisited: Aggregate- versus individ-ual-level findings on economics and elections, and sociotropic voting. American Po-litical Science Review 77: 92-111.
Ladner, Matthew (1996). Economic Expectations and the Political Business Cycle.Ph.D. Dissertation, University of Houston.
Lewis-Beck, Michael S. (1986). Comparative economic voting: Britain, France, Ger-many, Italy. American Journal of Political Science 30: 315-346.
Lewis-Beck, Michael S. (1988). Economics and Elections. Ann Arbor: University ofMichigan Press.
Mackuen, Michael B., Robert S. Erikson, and James A. Stimson (1992). Peasants orbankers? The American electorate and the U.S. economy. American Political Sci-ence Review 86: 597-611.
Markus, Gregory (1988). The impact of personal and national economic conditions oncandidate evaluation: A pooled analysis. American Journal of Political Science 32:137-154.
Pindyck, Robert S., and Daniel L. Rubinfeld (1991). Econometric Models and Eco-nomic Forecasts. New York: McGraw-Hill.
Suzuki, Motoshi (1992). Political business cycles in the public's mind. American Politi-cal Science Review 86: 989-996.
Wilcox, Nathaniel T., and Christopher Wlezien (1996). The contamination of re-sponses to survey items: Economic perceptions and political judgments. PoliticalAnalysis 5: 181-213.
ECONOMIC PERCEPTIONS AND VOTE CHOICE 17