Economic crises and electoral responses in Latin América
252
-
Upload
independent -
Category
Documents
-
view
1 -
download
0
Transcript of Economic crises and electoral responses in Latin América


3
Chapter 1: Introduction
“When you think economics, think elections; when you think elections, think
economics.” (Tufte, 1978: 65)
“The fact that economic conditions influence voters is a leading commonplace of
conversation in election years. The question is: is this fact in fact a fact?” (Stigler,
1973: 160)
“[T]hose politicians or political commentators who concentrate on the president’s
ability to provide economic prosperity may be underestimating the dramaturgical
element in politics. The public wants both bread and circuses, and it wants each equally
badly.” (MacKuen, 1983: 191)
The conventional wisdom that economic conditions and popular satisfaction with the
economy drive people’s decisions at the ballot box might have found no better test than in Latin
America from the 1980s through the mid-1990s. After all, if governments are expected to gain
support in good times and lose it in bad times, the regional economic crisis of the 1980s and the
strong recovery in the 1990s should have provided plenty of room to evaluate both sides of that
proposition.
Yet, between 1982 and 1989, as most economies in the region recorded negative growth
rates and double- and triple-digit inflation, as well as a regression to the standards of living of the
1970s, about a third of the incumbent parties managed to win a plurality of votes large enough to
stay in office. Between 1990 and 1995, on the other hand, as inflation was drastically cut,

4
consumption recouped and production grew, over half of the parties-in-government ended up
being voted out of office. Why did the most severe collapse of postwar Latin American
economies not result in a more extended pattern of incumbent turnover? And why did electoral
gratitude reveal itself only half-heartedly once prosperity arrived?
Answering such questions involves first examining the issue of voter rationality and the
assumptions that underlie electoral choice. But before these can be addressed, a more
fundamental question must be answered: Do elections matter? While many scholars conceive of
voters as the sole king-makers of democratic politics and ballots as the effective instrument of
popular control (e.g., King 1981), others contend that elections are symbolic rituals that
legitimize structural inequalities and the political grip of a power elite (Ginsberg and Stone
1991). Some point out that elections do not change the fundamental structure of power in Latin
America, which is dominated by business and landed elites, the Catholic Church, the military,
and foreign governments (Drake and Silva 1986: 1–7; Petras and Morley 1992: Chapter 1).
Others argue that elections rarely modify the presence of clientelistic networks, powerful rural
and urban structures and machine-type party organizations who, ultimately, define who will rule
(Özbudun 1987: 394). Likewise, as the policies of elected governments are perceived in greater
consonance with the demands of elites than with the needs and wants of the masses, elections are
sometimes deemed not as an instrument for the advancement of popular sovereignty but as an
asset of conservative forces (Weffort 1989). Finally, some scholars dismiss elections because of
the insincere nature of electoral politics, crafted mainly as “demonstration elections” (Herman
and Brodhead 1984).
More obvious, empirical reasons for downplaying the role of elections in Latin America
have been the regularity of fraud-ridden elections (e.g., in México til year 2000), military vetoes
against unwelcome victors (e.g., in Argentina, Perú and Ecuador in the 1960s, and in Guatemala
and Panamá throughout the 1970s and 1980s), and the use of elections and plebiscites by

5
authoritarian regimes for self-legitimating purposes (e.g., in Dominican Republic, Nicaragua and
Paraguay since the 1960s, Guatemala and El Salvador since the late 1970s, Chile and Uruguay in
1980). Yet it is clear that the region is characterized by a massive turnout in election after
election (Nohlen 1993) and a high rate of incumbency turnover (Dix 1984), two occurrences that
among advanced democracies indicate a deep-seated predisposition to participate and to hold
governments accountable. As well, as Seligson and Booth (1995) point out, elections have finally
become the accepted mechanism of democratic legitimation.
Despite the limitations of the electoral method and the outcomes of many Latin
American elections over the past twenty-five years, it is my firm belief—and a central
assumption of this work—that elections in the region do indeed matter. As Eulau and Lewis-
Beck argue (1985: 3), elections “make a difference [because] at periodic intervals they set the
limits or constraints within which capitalist as well as anticapitalist elites pursue their economic
and political goals.” Thus, the question of the determinants of electoral outcomes remains
central, if only to know “how and why popular electorates respond as they do to more or less
elite-managed economies,” and “how and why elites in turn take account of or are responsive to
whatever messages they may receive from the electorate” (Eulau and Lewis-Beck 1985: 3). What
drives voters’ decisions, what substantive mandate underlies electoral majorities, and how
changes in the incumbents’ electoral fortunes should be understood are issues crucial to the
understanding of Latin American politics and society.
Presidential elections have become a central feature of Latin American politics since the
early 1980s, as most countries traveled the road from authoritarianism to democracy. In contrast
to the political past of the region, free and competitive contests for the highest office have come
to represent the main occasion for regular collective action and selection of political authorities
by citizens. The current predominance of electoral procedures to perform these functions stands
in contrast to the traditional plurality of “praetorian” means such as military coups, revolutions,
6
guerrillas activism, etc. (see Anderson 1967; Huntington 1968). Accordingly, as is the case for
the group of advanced industrial democracies, Latin Americans expect to find in elections a
significant form of popular input, an opportunity for demanding political accountability from
elected authorities, and a crucial means of political equalization of economically unequal
citizens. As Butler et al. (1981: 1) state, “the electoral process lies at the heart of democratic
government, and the critical difference between democratic and non-democratic regimes is to be
found in whether or not they hold elections.”
The general tendency to dismiss elections as significant political events has directly
affected our knowledge of the voting behavior of Latin Americans. The nature of citizens’ voting
rationality, the impact exerted by different conditions over voters’ calculations, and the
determinants of political continuity in the electoral arena have received little attention. As a
result, many questions have gone unanswered. For example, what are the forces that shape
electoral results in Latin America? Do incumbents’ electoral fortunes in the region hinge
exclusively on the state of the economy and their citizens’ financial satisfaction, or do they
depend more on accomplishments in the political domain? Do Latin American voters look only
after their own economic satisfaction, or are psycho-social considerations, such as partisan
attachments, candidates’ attributes, or the president’s popularity, also a part of their decision
process? Which are the dimensions of the economy that matter the most to the average voter:
inflation, unemployment, or growth? How do economic and political factors interact in the voting
decision, and how do their effects vary by social class? Does institutional development and the
type of party system make a difference in how economic and non-economic forces shape the
vote? Do periods of economic decline and crisis motivate voters to rely on sources of decision
that are different from those on which they rely during periods of prosperity?
These questions are anything but original; for decades, students of advanced democracies
in North America and Western Europe perused electoral results and voters’ decisions and
7
estimated the extent to which they were functions of economic conditions, political events,
psychological tendencies or sociological forces. However, the relative novelty of electoral
politics after decades of authoritarian rule and the brutality of macro-economic transformations
undergone since the early 1980s initially suggest a peculiar pattern of responses for the Latin
American experience with voting. Thus, a complementary question to those already stated is how
does the average Latin American voter behave compared to his or her fellow citizen in the
advanced democracies.
In addressing these questions, I will be directly tackling the issues of the political
rationality of Latin American citizens and the bases upon which support for political continuity is
built in situations of democratization—two topics that have been generally limited either to
impressionistic or historical accounts of the “national character” of the region, or to single-
country empirical tests of the correlates of support for democracy. It is one of my contentions
that Latin American voters rely on certain decisional clues when going to the polls, and that the
choice boils down to a binary decision of supporting the incumbent or voting for change. An
investigation of the decisional clues that determine voter behavior is at the heart of this study. It
is my firm belief that by knowing why voters systematically rely on certain determinants, we can
gain deeper insight into the substance that nurtures individual decision-making in the political
arena, the extent to which voters may actually become victims of politicians’ manipulations of
the economic environment and/or authoritarian drives in the face of public dissent, and—
indirectly—the degree to which effective political support becomes contingent upon economic
success.
This last questions brings us back to the main topic of this study. As the quotations
opening this chapter illustrate, there exists a common assumption that it is satisfaction or
dissatisfaction with the existing economic conditions that drives the citizens’ decisions at the
ballot box. Yet, as mentioned at the outset, Latin American reality often contradicts this theory.
8
Approaching the complex process of voters’ decision-making from a view that emphasizes the
economic underpinnings of individual voting rationality does not provide a realistic response to
the conundrum of electoral choice. What, then, lies at the heart of electoral choice in Latin
America?
A thorough examination of data from forty-one competitive presidential elections held in
Latin America between 1982 and 1995 reveals that the results of elections depend on certain key
factors—both economic and political—that vary with the context and milieu in which these
elections take place. The patterns that can be observed both at the macro (aggregate) and micro
(individual) levels can shed light on the results of past and future elections in Latin America, as
well as provide insights into elections elsewhere. Indeed, the very same peculiarities that
distinguish Latin America from the group of advanced democracies—such as its profound
economic crisis amidst a process of political democratization—make the investigation of Latin
American elections likely to offer valuable contributions to the study of other regions undergoing
somewhat similar experiences, such as Eastern Europe. In this regard, the Latin American voting
experience of the 1980s and 1990s constitutes an unparalleled laboratory in which to check the
extent to which, under adversarial conditions, political support builds itself upon economic or
extra-economic motivations.
Overview
I begin this study by presenting common theories of electoral choice developed in the
context of advanced industrial democracies. I then summarize the empirical research done to date
on Latin American elections, pointing out gaps and erroneous assumptions and highlighting the
tension between the emphasis on economic factors and non-economic factors. Then, in Chapter
3, I examine the assumptions that undergird the model of economic voting and the extent to
which these match the available evidence of how the average Latin American voter approaches

9
the voting decision. I challenge some of these assumptions and sketch the premises upon which a
discussion of voting rationality in Latin America should be developed. I go on to survey the
conditions that structure the environment of electoral choice, arguing that given cognitive
limitations, ordinary citizens in Latin America rely heavily on certain decisional clues that guide
their choice. In addressing this issue, I scrutinize the opportunities and circumstances that favor
or diminish the effective influence of diverse sources of decisions over the individual’s process
of political learning and decision-making.
In Chapter 4, I emphasize the complementary nature of macro and micro perspectives
and the importance of context. I then build on the preceding discussion to introduce six models
of choice: affirmative voting, party voting, economic voting, democratic preference voting,
political referendum voting, and candidate voting. These models are then used as the basis of
analysis at both the macro and micro levels.
I begin Chapter 5 by explaining the methodology used to analyze data from forty-one
competitive presidential elections held in Latin America between 1982 and 1995. Then I inspect
those features of the economic sphere that are more influential in shaping the electoral outcomes,
that is, whether voters react mostly to inflation, recession or unemployment, and the time-frame
of these reactions, that is, whether voters behave in a myopic fashion reacting to short-term
changes, or are more sensitive to long-term patterns. I also explore the impact of economic
variables after controlling for the effect of non-economic factors such as party identification,
candidates’ attributes, government performance on democratic issues, etc. This discussion
provides an initial view of the relative weight of each major model of voting and offers clues as
to which variable best represents the argument embedded in each particular model. Finally, I
introduce a variable tapping the public evaluations of presidential performance in non-economic
matters to assess the relative importance of the political referendum model.
Chapter 6 is a follow-up to the previous discussion. Here I estimate the extent to which

10
those factors modelling the vote behave differently under dissimilar contextual scenarios in terms
of levels of political institutionalization, types of party systems, and macro-economic profiles.
The underlying belief is that contextual differences provide dissimilar stimuli and opportunities
for the familiarization of individuals with the factors shaping the vote. I contrast electoral
scenario characterized by a high level of institutional development against one characterized by a
poor level, one characterized by a two-party system against one with a multiparty system, and
one characterized by a recent past of economic prosperity against one of economic collapse.
In Chapter 7, I shift to a level of analysis centered on individuals’ behavior, focusing on
survey data of voters’ reactions to the economic situation for three particular presidential
elections: the election in Uruguay in November 1994, the election in Perú in April 1995, and the
election in Argentina in May 1995. I argue that these three scenarios reproduce on a smaller scale
the variation in contextual conditions previously reviewed. The micro focus offers a closer look
at the process of economic reasoning that supposedly underlies most voting decisions, thus
addressing elementary questions such as how dependent voting choice is on economic promises,
whether voters follow their pocketbooks or not, and whether individuals with different social
backgrounds pay attention to the same economic cues. Thus, this new analytical perspective
based on micro-level data complements the aggregate-level discussion by offering a window
through which analyze the way individuals organize their choice at the ballot box.
Finally, in Chapter 8, I summarize the major findings of this study and discuss the
lessons one might infer from the theory, data and findings presented in this work.

11
Chapter 2: Theories of Electoral Choice and Empirical Research on Elections in Latin
America
Latin Americanists have not placed the study of electoral phenomena at the top of their
agendas. Nonetheless, the questions of what moves the decisions of voters and what shapes the
results of presidential elections in the region have not passed unnoticed. Hunches and
rationalizations were voiced after democratic institutions were reestablished through elections.
Politicians generally attempted to appeal to the voters by emphasizing liberal values of
pluralism and tolerance, invoking pocketbook concerns, raising issues of public morality, and
underscoring the need for tough leadership. Such variation in the focus of elections is illustrated by
president Raúl Alfonsín’s call for a vote for democracy in the 1989 Argentinean elections,
candidate Ernesto Zedillo’s motto promising Mexicans “well-being for everyone” (“bienestar para
todos”) in 1994, candidate Fernando Collor’s pledge to become the “hunter of privilege” (“caçador
de marajás”) in the public administration of Brazil, candidate Alberto Fujimori’s slogan
emphasizing “work, honesty and technology” in 1990s Perú, and the pleas of former president
Efrain Ríos Montt in Guatemala and incumbent president Joaquín Balaguer in Dominican Republic
to exert a strong, authoritative leadership in the 1990 elections of each country, respectively.
Newsmakers have made their own contributions to the examination of elections, explaining
the electoral public mood variously as resulting from economic conservatism and material
satisfaction, fascination with the political will of strongmen, divisions anchored in societal
cleavages such as race or class or region, and divisions based on group loyalties and ideological
conceptions. For example, in the Brazilian election of 1994, the media agreed on the diagnosis that
“Brazilians ... voted for stability and continuity rather than the uncertainties offered by the
opposition candidates” (Latin American Weekly Report, October 13, 1994: 457). In the case of Perú
in 1995, the local newspaper Expreso (April 10, 1995: 2) stated that “Fujimori’s success is a

12
consequence of his determination in coping with terrorism and the boldness and courage to put in
motion a liberal program that stabilized the economy.” In contrast, in the 1994 Dominican
elections, “candidates have spent the greater part of the time trading insults and accusations,
touching on personalities, religious beliefs, age, race and ethnicity” (RC-94-04, May 19, 1994: 3),
which underscores the saliency of candidates’ attributes before the eyes of the media.
Analysts and observers presented their own insights, pointing from economic grievances to
personal qualities of the candidates and from longstanding partisan attachments to overt exchanges
of support for particularistic benefits in classical patron–client molds. For example, in my personal
interviews with pollsters Ana Cristina Covarrubias and Ricardo de la Peña, they explained the 1988
results in México by citing economic grievances, the 1994 elections in terms of partisanship and
political leadership reasons, as well as personal benefits from pork-barrels politics, and the 2000
outcomes as a result of all the above, plus the allegiance to renewed democratic feelings. A similar
emphasis on the economy nurtured the views of most pollsters of Argentina for the 1989 and 1995
elections (see El Cronista Comercial, May 19, 1995: 14), though new factors such as claims for
public morality entered the equation in the interpretation of 1999 results. In contrast, after years of
experience in the Gran Colombian and Andean areas, U.S. pollster Joseph Napolitan stated that
“the single most important determinant of voting behavior is party affiliation” (personal
communication, March 10, 1995).
All these postulates have enriched the landscape of possible answers in regard to the
question of the forces driving the vote in Latin America. Yet, however provocative and insightful
many of these educated guesses may have been, they could hardly serve as a valuable substitute for
systematic research on the subject. Rather than leading to the creation of an orderly source of
knowledge and debate, they have left the topic looking like an anarchical patchwork of responses
and interpretations where everything is likely to fit depending on which election, which country, or
which contending party one is focusing upon.
13
To make sense of presidential elections in Latin America, a more systematic and
theoretically sound approach is needed. Thus, before analyzing the available election data for
possible patterns, it is necessary to understand how elections can be explained theoretically, so that
theoretically significant parameters for analysis can be set.
Approaches to Electoral Choice Modelled on Western Democracies
As discussed above, the process of electoral choice has received relatively little attention
in Latin America. Its theoretical underpinnings have been particularly neglected, as Latin
Americanists tended to follow mainstream theoretical approaches based on the study of Western
democracies. These approaches can in fact be useful tools for analyzing elections in Latin
America, if they are adapted to suit the Latin American milieu. But before examining why and
how such adaptations can be made, it is necessary to understand the theoretical debates on
electoral choice that have emerged from the North American and Western European experiences
with elections.
A Historical View of the Sociological and Socio-psychological Approaches.
Three major disciplinary paths—sociological, socio-psychological, and economic—have
defined the evolution of electoral behavior research in Western literature, each one basing its
conclusions upon a specific set of assumptions, methods and empirical evidence. Detailed
accounts of each one of these paths have been developed elsewhere (see Beck 1986; Dalton and
Wattenberg 1993), and it makes no sense to reproduce them in capsule form here. Rather, a
summary review of the major approaches, as modelled after each path, can provide a functional
overview whose aim is to introduce the Latin American polemic on the topic and put in
perspective the methodological decisions made in this study.
Focusing on the social cleavages cutting across society and on the social origins of party
14
policy profiles, the sociological perspective, predominant in the 1940s, started from the notion
that voters make choices depending on their social standing. Political behavior was said to reflect
social group-based identities (Berelson et al. 1954), which in aggregate terms meant that voting
alignments represented the ongoing demographic divisions of the social structure. Class
cleavages emerged as the primordial force explaining voting patterns, along with other structural
forces such as religious divisions and regional origins (Lipset and Rokkan 1967).
However, as this perspective was taking roots in the academic community, challenging
evidence mounted. To begin with, the vote-share of political parties varied from one election to
the next beyond what could be reasonably attributed to changes in the social structure. In
addition, the very phenomenon of social mobility conspired against the premise of stable group-
based identities. Furthermore, parties approached contests increasingly as organizations aiming at
“catching” all sorts of interests and themes, seeking to represent a space of political convergence
rather than a class-specific interest (Kirschheimer 1966). Finally, cross-national data made
explicit the decline in class-voting (see Franklin et al. 1992).
Significantly, the sociological approach revealed an important degree of heterogeneity in
the way social forces shape the vote. Admittedly, the development of group consciousness and an
explicit cognitive connection between the group’s social interests and its political preferences
shaped many voters’ decisions, but others constructed their political choices upon a simple, often
unpoliticized, linkage between group and party. Thus, while situations of class identity,
described in the first place, presupposed the vote to be a consequential tool of ongoing social
divisions, the latter situation presented a model of a voter whose social position was devoid of
explicit political content and who merely reacted to habitual ties with specific groups in the
society. If this plurality in sociological profiles of voters helped to make this argument more
flexible and comprehensive, it also disappointed those scholars seeking to build upon the social
background of individuals a parsimonious explanation of why people voted the way they did.
15
A socio-psychological perspective on voting gained support when sample surveys
superseded aggregate statistics as the main source of evidence about electoral behavior, around
the early 1960s. The focus now shifted from the group to the individual. Still, this change did not
mean that the voter was going to become a self-oriented decision-maker or that long-term forces
were bound to be discarded for more immediate and contingent reasons. In actuality, the
emphasis on partisanship conveyed by this new perspective did not attempt to establish a
theoretical discontinuity with the social group-based approach. Rather, it meant to qualify the
order by which different long-term forces shape the vote. Accordingly, since party loyalties
entailed a more explicit political meaning than social class or religious groupings, they were
considered as more proximate to the voting decision and, therefore, more salient to its analysis.
Implicit in this approach, party attachments were viewed as political expressions of the major
social cleavages structuring the society; it naturally followed that class divisions would be
translated into contrasting party ties of the different social categories.
Assuming that political preferences originate in an individual’s lifetime process of
socialization, partisanship became the archetypical answer of the literature during the 1960s and
1970s (Campbell et al. 1960). Because political attitudes developed in response to the
individual’s exposure to parental values and other personal learning experiences related to
politics, as much as to group considerations and policy orientations, partisanship stood out as an
enduring and long-term force structuring people’s electoral decisions. Even if conceived as part
of a series of factors sequentially affecting the vote, as wonderfully captured by the notion of a
“funnel of causality” (Campbell et al. 1960), the effects of partisan attachments remained largely
responsible for directly molding individuals’ choice, as well as for an indirect impact through
short-term forces like candidates’ appeal and assessments of government performance.
However, even as the explanatory leverage of party identification became established,
empirical evidence began to challenge this picture. To begin with, cross-national data showed

16
that publics could rapidly become unattached to parties and prefer independence rather than
remaining even weakly identified (Abramowitz 1982; Dalton 1988). Partisan dealignments
followed these trends, and under presidential systems they sometimes inclined voters to turn
elections into presidential plebiscites (Ladd 1981), where voting was based on retrospective
evaluations of presidential performance whenever an incumbent stood for reelection. Likewise,
multiparty systems could mean a public more willing to define their political identity according
to specific issue standings or ideological schemas rather than allegiance to a particular political
organization (Dalton 1988). On the other hand, short-term forces were both increasingly
detached from the effect of partisanship and more independently molding the electoral results
(Jackson 1975; Page and Jones 1978). Some scholars even preferred to reverse the causal order,
or at least consider reciprocal effects, and assume party identification as equally likely to become
a consequence of short-term forces (Fiorina 1981).
In a similar vein, as candidates became independent of modal party positions and rallied
around extreme interpretations of some key issues (e.g., Wallace and Goldwater on civil rights,
McGovern on the Vietnam war, Reagan on traditional moralism), with the subsequent effect of
heightening issue voting and mobilizing issue publics, or as candidates rallied in defense of
topics excluded from the traditional partisan agenda (e.g., environmentalism, nuclear policy, gay
rights), partisanship receded to a second-order position. Candidates and issues were now placed
as primary motivations of the electorates.
Utility, Candidates’ Attributes, Accountability Models and the Economic Voting Approach.
All these changes brought under fire the premise that political socialization based upon
parental transmission of values could still generate the basic impulse for voting behavior. For
some scholars, however, such criticisms offered an opportunity to broaden the notion of political
socialization rather than to get rid of it. These scholars saw the need to include in it larger-scale

17
experiential forces politicizing the individual, such as those associated with the levels of material
and physical security contextualizing the individual’s political learning process. Concomitantly,
this revised notion of political socialization demanded acknowledgement of the presence of
generational effects as age cohorts overlapped different lifetime experiences (Inglehart 1990). In
accordance, scholars postulated that different socialization experiences raise different issues
priorities. Also, some argued that in view of the rising standards of material well-being and
education, the absence of war and the lassitude of collective experiences of physical insecurity,
together with the opportunities for self-actualization provided by a democratic state and market-
based economy, fundamental changes in the process of political learning were set in motion that
ultimately enabled larger portions of the electorate to become autonomous decision-makers
(Dalton 1988).
As a result, partisanship has lost considerable ascendancy as the single determinant of
the political behavior of the individuals. The generally accepted picture of the voter is now one in
which citizens build their own choices autonomously from one election to the next, remaining
sensitive to candidates’ profiles, the issues of the day, and the ways in which government handle
economic and non-economic matters while in office.
An alternative explanation to a somewhat similar diagnosis is conveyed by those
challenging the principle of political socialization and assuming that the exclusive rule followed
by voters in every election is what their natural drive toward utility maximization dictates.
Usually, that notion of utility is ultimately defined by the individual’s income or material interest
(see Simon 1957; Downs 1957). For this economically oriented path, voters are rational agents
acting upon costs-benefit calculations. In procedural terms, this behavior may take different
contours. For example, voters may seek to optimize the distance between their own issue
positions and the candidates’ and/or parties’ standings, and choose the one that on average gets
closer to their views. This picture represents the standard model of spatial voting, which holds

18
voters as attentive scrutinizers of politics driven by the goal of maximizing utility contained in
issues and policies, and assumes a partisan world clearly differentiated in policy terms (see
Enelow and Hinich 1982). According to another version, voters may strive for a less demanding
process of pondering the pros and cons of former and current administrations before coming up
with a decision and—occasionally—project this analysis to the future and take it into account as
well when voting. This view represents the classic interpretation of the retrospective-prospective
voter, which holds voters as reacting to varying levels of satisfaction with the government
outputs without paying much attention to policy instruments or to non-economic results (Key
1966; Downs 1957). One final variant is captured by the notion of policy voting, which contends
that voters define their party choice considering the policy standings of each party and the
ideological implications of each position. Obviously, this view presupposes that voters are able
to make sense of politics in ideological terms and that parties have stuck to a number of policy
proposals that clearly differentiates one from another (Downs 1957; see also Kiewiet 1983).
At the center of these arguments lies the concept of utility. Scholars have seen utility as
defined by values relevant to the individual’s experience and information ; thus utility can vary
over time and is amenable to both instrumental and symbolic objectives (Lau and Sears 1986). At
one point, individuals may find utility in pursuing values more closely associated with their class
status. At some other point, they may find utility by reacting to party traditional standings on
specific topics. On occasion, they may feel that basing their choices upon the candidates’
attributes and positions (independent of what party he or she is running for and whatever the
party’s traditional standing might have been) is the more satisfactory route to fulfill their utility.
Some other times, they may seek to fulfill utility by voting upon their impressions of
government’s handling of its public responsibilities, however diffusively or specifically that may
be summarized by the state of the economy, their sense of how the nation has fared socially and
politically in recent times, or the way the administration managed scandals or critical events.
19
The multiplicity of factors defining what moves the voter beyond social origins and
partisan attachments has taken the scholarly discussion on this topic into two different directions.
One emphasizes the value of accountability, where electorates’ decisions are seen as reactions to
recent occurrences (or expectations for future ones) according to the level of utility maximization
achieved—or, as the literature has conceded in a more realistic manner, according to the level of
relative satisfaction attained (see Bennet and Salisbury 1990). The other places the political
leadership of actual and would-be authorities (that is, candidates’ personal and political
attributes) at the center of the stage. Naturally, the acknowledgment of individuals’ emotional
and cognitive approaches to the political world and the moderate cognitive demands posed by
candidates and presidents as sources of decision in information-gathering terms make of
candidates’ and presidents’ qualities a natural object of study (see Sigelman 1990; Kelley 1995).
Considering the closeness between the central role of candidates and the way voting
operates in practice, and also taking into account the way the media and most politicians deal with
campaign topics during elections (Patterson 1984), a focus on personalized sources of decision such
as the president’s or the candidates’ attributes has become a parsimonious way of understanding
electoral choice. Among many scholars, it has been “partisanship and reactions to the candidates’
personas [that] generally have more influence than perceptions of the candidates’ stands on the
issues” (Luskin 1990: 353). Candidate voting thus represents the relevance of personal
characteristics (Campbell et al. 1960), but this is not to say that cosmetic traits or physical
attractiveness are what makes candidates matter (see Rosenberg et al. 1987). Candidates’ attributes
become relevant sources of the voting decision in view of the candidates’ personal values and the
political implications of holding such qualifications: such sources are composed of the public
perceptions of their degree of competence, integrity, leadership, and empathy (Kelley 1995).
In contrast, other scholars have tended to de-emphasize the role of candidates, since they
either run under specific party labels, market themselves upon single issues or policy commitments,
20
or ride upon the president’s coat-tails. In this view, candidates’ effects are a subproduct of the
individual’s politicization experience and of his or her approval of the instrumental and symbolic
goods delivered during the incumbent party’s tenure (see, for example, Markus and Converse
1979). Based on these assumptions, accountability models of voting choice make government
performance their focus of analysis.
In the view of many scholars today, although ruling parties and contending forces often
seek to underline achievements (and proposals) in matters of social policy, foreign policy,
moralization of public life, or civil rights, what usually captures the voters’ attention is what they
have done (or promised to do) for the economic well-being of the nation and its members. The
seminal work of Kramer (1971) on the impact of economic conditions at the national level on
U.S. electoral outcomes landmarked this new approach from an aggregate level perspective and
served to formalize the argument of economic voting, which has become so prevalent.
The basic contention of the economic voting approach is that citizens react to their
material environment, supporting the incumbent’s reelection when conditions are good and
endorsing the opposition in bad times. For some authors, this economic sensitivity has set the
basis for a view of electors as “responsibly” responding to their past experiences (Key 1966).
Some scholars have further refined this idea by presenting voters as rational agents able to
elaborate on these retrospective outcomes and project them into the future (Downs 1957), while
others, more skeptical of the voters’ abilities and power, have seen them as easy prey of
politicians’ ruses to ensure office-holding through the recreation of political business cycles
(Tufte 1978; Keech 1995). In any case, the fundamental questions of whether voters respond to
past or future conditions and whether they care for their own well-being or for that of their
society have constituted the major stimulus behind the controversy on economic voting (see
Kinder and Kiewiet 1981; Nannestadt and Paldam 1994).
After over twenty-five years of research, this economic voting hypothesis has proven

21
generalizable across time (Hibbs 1987; Markus 1988) and across nations (Eulau and Lewis-Beck
1985; Lewis-Beck 1988; Clarke et al. 1992). On the other hand, it has also unveiled a need for
theoretical revision and constant respecification (Paldam 1991). Thus, the corroboration of a
model of the economic voter at the national and cross-national levels depends of the form of
measuring variables (see Clarke et al. 1992), the level of analysis chosen (Paldam 1991), the
relaxation of key assumptions of the rational choice tenets underlying each model (Bennet and
Salisbury 1987), and/or the non-economic information that needs to be incorporated in order to
portray a realistic and unbiased image of the electoral decision process (see Lewis-Beck 1988).
Interestingly enough, the very same discussion of economic voting at the individual level
has called attention to the non-economic underpinnings of the economic models. For example,
whenever voters are found to be guided mostly by sociotropic considerations rather than by their
pocketbooks, cultural reasons are rapidly brought to the table (Kinder and Kieweit 1981;
Nannestadt and Paldam 1994; but see also Miller and Olshaug 1985). Whenever voters rely on
forward-looking orientations toward the economy instead of retrospective ones to reelect the
incumbents, candidate’s attributes and ideological inclinations emerge as “usual suspects” (Joslyn
1991; Lewis-Beck 1988). Whenever signals of macro-economic hardship get positively—and thus
counter-intuitively—correlated with support for the ruling party rather than for the opposition,
scholars end up turning to the political and cultural bases of the social fabric and admit that
clientelism and personalism may organize electoral choice even more strongly than pure economic
considerations can (Belluci 1985; 1991), or they assume high levels of economic tolerance (Mancha
Navarro 1995).1
1 Stokes refers to the phenomenon of publics reacting in a supportive manner to environments of economic deterioration as “intertemporal politics,” which involves a variant of rational expectations making of current grievances the “proof” that good times will be met around the corner. Naturally, this takes form against a context of economic ungovernability which makes people to put a premium on the political will of rulers to cope with the crisis no matter how. Thus, temporal inflation upsurges, transient recessions, or persistent unemployment rates may constitute not only some of the costs people would circumstantially tolerate but even the signs that the political will to restore economic governability is in motion (see Stokes 2001).
22
Similarly, whenever the effects of economic grievances on voting are blurred by the
incorporation of information on the president’s popularity, there is a need to broaden the concept of
competence in performance to include notions of political command and dramaturgical skills in the
public arena (MacKuen 1983). Whenever comparable economic complaints do not translate into
similar electoral responses across the board, class and education may offer better explanations
(Fiorina 1981; Sniderman et al. 1991). Whenever party choice remains stable over time in spite of
incumbent economic misperformance and voters’ acknowledgment of it, party images and partisan
leanings are pointed out as likely reasons (Kieweit 1983; Hibbs 1987). And last but not least,
whenever the background of vote-driving economic expectations is explored, partisan leanings are
usually discovered (Weatherford 1983).
A final caveat is posed by the question on the degree to which voters explicitly connect
their impressions of the economic environment with the worthiness of reelecting the incumbent. In
all likelihood, such a linkage depends of the intensity of the assignment of responsibility to the
government for the state of the economy. Unless voters hold the authorities liable for their current
situation, it makes no sense for them to rely on economic data to decide whether or not to support
political continuity at the ballot box (see Kramer 1983; Peffley 1985).
All these considerations serve as cautions about embracing the economic voting approach
without reservations. More importantly, they make clear the desirability of adding to the heuristic
and empirical strengths of the model other, non-economic forces present in the process of political
choice, either to evaluate competing theories or to improve the specification of the political and
institutional circumstances under which economic conditions come more decisively to shape
electoral support (Powell and Whitten 1993). It is obvious that the economic voting model cannot
by itself account for the wide range of electoral results in various contexts. Other major
explanations of choice must be considered, and their impact on the effect of the economic variables
should be controlled for if a complete, accurate picture of electoral choice is to emerge.

23
The corollary is that explanations centered on performance are not exhausted by
instrumental considerations of financial contentment or policy accomplishment. Non-economic
issues also critically define the management aptitudes of the party-in-office and thus shape its
electoral chances. According to the empirical evidence, electorates have been anything but
indifferent to domestic issues, political scandals, levels of corruption, or foreign policy events
when deciding for whom to vote (RePass 1971; Fiorina 1981; Budge and Farlie 1983; Lewis-
Beck 1988; Norpoth 1991; Fackler and Lin 1995). In the case of nations undergoing a process of
democratic consolidation, electorates are supposed to be anything but indifferent to the quality of
the democratic conduct of their rulers and to mold their vote accordingly (see Crewe 1994).
By the same token, judgment of government’s achievements may involve a broader
assessment of political leadership and the nation’s quality of life under the administration. As
authority gets inevitably personalized, especially in presidential systems, an appraisal of its
successes and failures can often be made based on the president’s popularity. How much this
assessment of the chief of government’s performance is uniquely instrumental or symbolic in nature
is an empirical question, one that involves finding out whether the president’s popularity is defined
by his or her efficacy on specific grounds that are materially consequential to the individuals or by
his or her ability to provide an overall sense of psychic and collective security through displays of
command over public affairs (see MacKuen 1983; Sigelman 1990; Edwards III 1995).
The current plurality of contentions explaining voting choice has proven adequate to
understand the longstanding electoral practices of voters in advanced democracies. But how well
does each argument fit the experience of Latin American voters during the last decade and half of
electoral politics?
Empirical Electoral Research on Latin America
Overall, there is plenty of heterogeneity in the responses substantiated in analyses of

24
aggregate and individual-level data available for Latin America. Regrettably, this variety is neither a
byproduct of empirical tests seeking to build upon previous findings or looking for answers beyond
simple bivariate correlations, nor the result of cross-national and longitudinal studies. In fact, most
Latin Americanists simply investigated what data permitted and common sense suggested. Thus, as
economic volatility struck the region during the 1980s and 1990s, a model of economic voting
prevailed. Such a choice tacitly incorporated all the underlying tenets of that model; what has
remained unclear is whether those assumptions actually fit the empirical evidence about the way
voters approach elections.
The reasons for the popularity of the economic voting model are manifold. Most
importantly, beginning in the 1980s, Latin America experienced a massive financial upheaval and
extensive socio-economic changes. Between 1981 and 1990, the accumulated decline in GDP per
capita amounted to
-7.9 percent, followed by an upturn between 1991 and 1994 of +6.1 percent. On average, this
yielded a weighted accumulated decrease rate of -3.9 percent for the whole period (CEPAL 1994).
The consequences of such a negative trend are not hard to imagine. Mainstream literature tended to
emphasize rational expectations, and the commonplace accounts of elections by local politicians,
pundits and journalists who put a premium on economic explanations helped to place economic
concerns in the spotlight. As a result of these trends, economic arguments gained a pivotal position
among those studying of the region (see Méndez 1983; Dietz, 1987; Nelson 1990; Panzer and
Paredes 1991; Anderson 1992). Some scholars have even gone so far as to suggest that no other
factor could offer as compelling an account as economics could for a particular election under
observation (Catterberg and Braun 1989; Meneguello 1995). Generalizing, Trindade claimed that
in Latin America, “the economic situation is increasingly tending to affect the lives of the
population to such an extent that it is becoming the central variable which determines attitudes in
elections” (1991: 308).
25
Yet other scholars have followed exactly the opposite path, emphasizing the role of non-
economic forces to the extent of positing an almost complete obliteration of economic reasons
(Domínguez and McCann 1992, 1995; Canzani 1995). Still others conjectured that electoral choice
makes more sense if understood from a class perspective (Mora y Araujo 1986; Dix 1989; Petras
and Morley 1992; Cameron 1994; Dugan and Dietz 1995), from the consideration of partisan
structures and traditions (Seligson 1987; Catterberg 1991; Remmer 1991; Ames 1994; Coppedge
1994; Domínguez and McCann 1995), or from a focus on the role of ideologies and broader
conceptualizations of politics (von Mettenheim 1995). On one hand, such a divergence is
intellectually stimulating. On the other, given the absence of a core line of argumentation against
which new evidence and different interpretations could be compared, this diversity of contentions
has contributed little to an orderly discussion of the subject and the possibility of cumulative
knowledge.
Not surprisingly, an examination of the empirical evidence, even when focusing on same
country-studies, shows mixed results. Take Brazil, for example. In discussing the 1994 presidential
elections, Meneguello (1995) echoes the widespread belief in economic considerations as critical
molders of people’s options; other factors such as partisan loyalties are overtly effaced from the
scene. And yet, following Ames’s (1994) account of the previous 1989 elections, one gains a sense
that, even if not equally critical, the role of party-related influences should not be dismissed.
For the researcher looking for a coherent answer, the difficulty resides in two distinct
problems. One is the qualitative difference in information provided by individual-level and
aggregate-level data. The other involves explanations that fail to control the favorite variable’s
effect that one author champions for the impact of the contending variable that another scholar
advocates. Missing control variables or overlooking counter-intuitive factors is a common error
made by analysts of elections in the region. All too often, it also implies adding (if not resting whole
arguments upon) irrelevant information. Emphasis on demographics is one instance that illustrates
26
this point. Anderson’s (1992) examination of the 1990 Sandinista defeat, for example, contains
page after page of cross-tabulations of votes and occupational categories of a sample of Nicaraguan
respondents without ever making a strong point on the vitality of such connection. In contrast,
Seligson’s (1987) analysis of Costa Rican electoral outcomes is explicit in dismissing demographics
as a causal factor and putting the accent on partisan ties.
Many single-country studies are fraught with problems. Studies of Mexican elections, for
example, are illuminating for the heterogeneity of explanations they provide as much as for the
types of methodological controversies they foment. For example, after studying the series of 1952
to 1988 presidential contests, Brophy-Baerman (1994) concludes that preelectoral economic
conditions have played no role in explaining the incumbents’ vote-share, although these have
greatly contributed to the fluctuations of the vote garnered by the left. If intuitively sound, this
conclusion raises other doubts. For example, can one expect electorates voting in non-competitive
elections such as those in pre-1988 México to be likely to use elections as opportunities to pass
judgment on the economy? In other words, if electoral outcomes are pre-determined, does it make
sense to voters to hold governments accountable for their performance in the voting booth? Brophy-
Baerman’s findings are only partially consonant with previous evidence linking support for the
right-wing opposition with economic advancement, and showing no association with support for
leftist forces (Ames 1970). Nor are they consistent with discussions of the recent 1988, 1991 and
1994 elections, which revealed a marginal role for economic grievances in general (Arroyo and
Morris 1993; Moreno and Yanner 1995).
On the other hand, Domínguez and McCann’s (1995) analysis of the 1988 and 1991
Mexican elections has been quite consistent with Brophy-Baerman’s basic point in relation to
support for the PRI. Testing most of the classical arguments about determinants of the voting
choice, these authors conclude that economic orientations were peripheral in comparison to the
effect of party-related considerations. Rather than voting their pocketbooks or submitting the
27
economic leadership of the government at the national level to a sort of electoral referendum, the
majority of Mexicans chose the party that had better prospects as a national force. If these
contentions are useful in the context of the lively controversy between economics and party-based
arguments, they suffer the risk of conceptual tautology. In other words, the dependent variable
(party choice) and the independent variable (perceptions of party future) are too close to comfort,
tapping very much the same phenomenon.
Perplexed by the contrast between their findings and what most studies conducted
elsewhere have revealed, Domínguez and McCann stressed the need to take into account the degree
of institutional competition as a crucial variable in determining the salience of economics in
appraising the ruling party’s electoral fortunes. To some other scholars, however, the lack of
statistical significance of the economic measures is not so much a byproduct of institutional
practices or the absence of instrumental motivations shaping the choice of Mexicans but of the poor
validity of the measures used (Buendía 2001).2 Thus, where standard measures of retrospective and
prospective evaluations of the economy are used, stronger indications of economic voting surface.
On top of this, Mexicanists as well as Latin Americanists in general have recognized the
importance of candidate voting. Indeed, the more the election involves a step forward in the
democratization of the country, the more significance candidates seem to have. This phenomenon
is a result of weak party systems and undeveloped opportunities for partisan socialization, both
of which dominate the Latin American scene, but it may also occur when highly institutionalized
systems open up to competition. The Mexican elections of 1988 and 1994 seem to fit the pattern
in which a more pluralistic juncture, immersed in a situation of economic decline, is
2 Buendía argues that given the authoritarian nature of the Mexican government til the end of 1990s, legitimacy could only be appraised through assessments of economic performance achievements rather than through regular tests of electoral support. Furthermore, after 60 years of single-party rule, whether citizens were able to hold the incumbent responsible for outcomes was no longer an issue; that is, for most people it should have been clear that good or bad news could only be attributed to the PRI rule. In my view, these points do not necessarily invalidate but rather qualify Domínguez and McCann’s contention that the type of institutional development matters.
28
accompanied by processes of partisan dealignment/realignment.3 Whatever the process that
underlies the detachment of big portions of the electorates from their longstanding party
identities, one consequence has been the increasing salience of candidates’ attributes: as of the
1994 Mexican election, candidates’ images ranked immediately after party-related effects in
determining the vote. The extent to which the contender exhibited political leadership qualities,
namely a “personality to govern,” was particularly important (see Moreno and Yanner (1995:
18).
In the case of Perú, Cameron’s (1994) ecological analyses illustrate the complex
relationship between class and vote by revealing high correlations among the right and left forces
but poor correlations with the ruling parties. In discussing the 1995 election, Dugan and Dietz’s
(1995) aggregate-level study suggests that a poor correlation may be the result of misspecifying a
nonlinear relationship between class and vote as a linear one, rather than of the inexistence of any
relationship at all. Having won reelection with the support of lower and upper classes, a linear
bivariate estimation of that connection underlying Fujimori’s support will simply miss the point.
But is class-analysis the appropriate tool to understand electoral politics in a society like Perú’s,
where all cleavages—class, ethnic, linguistic, racial, and educational—overlap dramatically, and
where radical changes in the conditions of living have taken place since the return of democracy?
Early work conducted by Dietz (1987) hinted at such a connection and focused on the sources of
electoral choice among the lower strata and impoverished residents of Lima. His conclusions
posited that the most economically disadvantaged sectors of the electorate chose based upon a
variety of stimuli, pocketbook concerns being a priority but leadership factors having a considerable
relevance as well.
3 Interestingly enough, while party-related attitudes remained the most important consideration of the Mexican voter, diachronical evidence revealed a substantial degree of preference volatility and rising partisan independency, which indicated that voters relied their future options on non-partisan clues such as candidates’ appeals (see Basañez 1990: 248–50, 277; Horcasitas et al. 1994: 66–67; Domínguez and McCann 1995).
29
If confusion surrounds the findings for single-country studies, it reigns when one attempts
to perform cross-national comparisons. Panzer and Paredes’s (1991) discussion of the 1988 Chilean
plebiscite suggests that only macro-economics molded the electorate’s choice, something that
represents quite a contrast with the seemingly economic insensitivity of Costa Rican voters, as
depicted by Seligson and Gómez (1989). In a like manner, Canache et al.’s (1994) study of the
electoral behavior of Hondureans leads to the conclusion that ideological orientations permeate the
calculus of decision, something that strongly defies traditional views of Hondurean politics and
voters as clientelistic and poorly sophisticated (see Rosenberg 1989). More surprisingly, it also
radically opposes the findings for electorates with higher levels of political mobilization and
cognitive capability, such as in the case of Argentina, characterized by a highly inconsistent
ideological view (Catterberg and Braun 1989).
The record of studies focusing on individual elections and individual countries opens the
door to accommodate almost any contention. Unfortunately, given the methodological and model
specification features of most of this research, this also means that what in one study looks like
solid evidence may vanish in the next. Time-series, multivariate, and better specified studies of the
determinants of choice are the natural paths to follow. Yet data unavailability or the paucity of
electoral contests themselves have prompted only a handful of truly comprehensive analyses.
Remmer’s (1991) examination of twenty-one Latin American competitive elections
between 1982 and 1990 stands out as the single exceptional piece complying with most of these
requirements. Unfortunately, for reasons of data unavailability and the restrictions imposed to the
statistical power of the author’s design, this work does not take into account all major approaches
present in the literature. Interestingly enough, when the author submits the notion of economic
voting to the empirical test, her data reveal that macro-economic indicators trail behind political
conditions in explaining the electoral support gathered by the incumbent party. Controlling for
aggregate measures of the nature of the party system, inflationary pressures—which stood out
30
among the economic factors—play a secondary role in undermining electoral support for political
continuity (as assessed by the proportion of votes gathered by the incumbents’ candidates).
According to these findings, one can expect aggregate-level measures of partisan influences and
other non-economic forces to exert a substantive influence in the context of Latin American
electoral politics, thus relativizing the incidence of economic-oriented decisions at the ballot box.
Remmer’s study also points to the salience of institutional factors in accounting for the
impact of economic forces. She concludes by saying that the “relationship between economic
conditions and aggregate electoral results was mediated principally by party system structure, which
insulated two-party democracies from the volatility experienced by their more politically
fragmented counterparts” (1991: 794). This conclusion suggests that variations in degrees of
political development constitute an important intervening variable when specifying the relative
effect of different determinants of electoral choice.
Despite the gains made by such studies, serious limitations still cut across the topic of
electoral choice in Latin America. Replication and validity tests of previous findings have been
absent. What is more, fundamental theoretical assumptions have often been ignored or developed
spuriously. In fact, scholars have barely undertaken the job of making explicit the postulates of
what they consider to be the nature of voters’ decision-making process and rationality—a topic that
lies at the heart of the study of electoral choice. When faced with such a vacuum, one can assume
that for the advocates of economic voting, all voters behave as self-interested utility maximizers,
whereas for the advocates of class voting, all voters hold conscious class-based identity links, and
for those advocating party voting, all voters move according to their socio-psychological
backgrounds.
In reality, many scholars have preferred either to avoid inquiries into the essentials of how
and why predictors of choice perform as they do, or to presuppose that these essentials are so
universalistic and context-free that they can be automatically inferred from the standard literature

31
developed for Western Europe and North America. To be sure, data unavaibility, non-standardized
measurements, and the singularity of the political process in Latin America conspired against such
convergence.
How realistic and accurate are the universal assumptions of voting rationality based on the
principle of utility maximization when applied to Latin American voters? Should one assume that
despite the recent experience of authoritarian politics and highly volatile economics, the average
voter of the region4 follows the same standards that orient Western publics, characterized by
decades of democratic experience, predominant market economies, and moderate levels of social
inequality?
It is my strong conviction that voters in Latin America cannot be assumed to make voting
decisions in the same way as do publics who learned to vote under conditions of political and
economic stability. Given the gulf of different experiences and opportunities, one can hardly
assume that Latin American electorates will behave like their counterparts in established Western
democracies. The question that remains is how differently these electorates approach elections and
what implications those differences have for a comprehensive view of voting behavior.
In the next chapter, I turn to the basic assumptions that have been made about voters, their
rationality and the ways in which they approach voting, out of a firm conviction that an accurate
picture of the voters’ decision-making processes will permit a better grasp of electoral choice in the
region and provide meaningful theoretical underpinnings to the analysis of data.
4 By average Latin American voter, I mean those individuals that concentrate at the typical median value of the attitudes and conducts reviewed, and that, by extension, constitute the majoritarian central tendency in terms of behaviors.
1
Chapter 3: Electoral Choice and Decisional Clues
Confronting the Common Assumptions about Voters
In theory, all individuals seek to maximize utility in the electoral arena following a cost-
benefit analysis of the consequences of their choices. Typically, such utility is defined in
economic or material terms, or by the economic consequences of holding specific values or issue
positions. The voters’ reasoning may take the form of a careful weighing of the payoffs received
in for past decisions and a projection of conclusions and implications thereby developed with
regards to eventual trade-offs involved in future choices (Downs 1957; Grofman 1987). Downs,
for example, assumes that voters perform these calculations as a conscientious evaluation of
candidates’ and/or parties’ platforms, thus getting involved in complex estimations of issue
proximity between platforms and their own positions, as well as an assessment of the likelihood
of a program’s fulfillment in office. Having weighted these elements, they vote for the candidate
or party whose expected policies are appraised, on balance, as the most desirable. As utility
optimizers, voters seek a perfect theoretical equilibrium between costs and benefits, according to
which their most critical demands are met.
This view implies that citizens are highly sophisticated actors who enjoy close to perfect
information on the parties’ achievements, candidates’ philosophical beliefs, and policy promises.
Moreover, it also assumes that they are able to hold clear-cut preferences on every issue of
relevance and a reasoned judgment of the secondary effects implicated in different issue
priorities becoming public policies. As a prerequisite, they therefore must exhibit a high level of
political engagement and exposure to political news, to enable the issues to acquire public
saliency and elicit opinion intensity. A further implication is that individuals perceive high
payoffs for becoming fully informed agents. Based on this picture, it would be logical to expect
minimal levels of political cynicism among voters, a monolithically high valorization of electoral

2
mechanisms, and a sizable belief in the autonomy of the electoral sphere from non-electorally
accountable actors.
Moreover, the idea of fully informed citizens presumes party policy profiles that are
unequivocally defined, publicly recognizable, and stable across time. This presupposes two
things: one, that parties, and candidates as well, have enjoyed the opportunity to develop a policy
identity and diffuse this across the public, and two, that not even the most volatile and pressing
economic conditions are able to subvert this policy expertise by forcing upon leaders a policy
direction radically different from the one traditionally associated with that political organization.
Finally, the underlying assumption is that citizens’ electoral preferences are authentic and not
merely subproducts of rationalizations from group considerations or projections of previous
political commitments.
Is this picture a realistic one? Does it accurately reflect the situation and characteristics
of voters in Latin America? It is clear that most of these presuppositions hardly match anything
experienced by most voters anywhere—and particularly in Latin America. Let us tackle the
major components of this theoretical view of voters one by one and attempt to provide a better
description to serve as the basis for tracking voters’ electoral behavior.
Voters Are Not Encyclopedic.
To begin with, perfect information is rarely found among the publics of most advanced
democracies, and this is the case even more in Latin America (see Converse 1964; Neuman
1986). Evidence collected by pollsters and scholars in different countries of the region shows
that knowledge of candidates, awareness of policy proposals, and even acquaintance with the
electoral schedule in electoral years is rather poor.1
1 Unfortunately, standard measures of political knowledge are hard to find for the whole region as cross-national public opinion studies are far more an exception than a rule. Still, preelectoral polls such as those conducted by CID-Gallup and Belden&Russonello in Central America throughout the 1980s, and the data

3
For example, the issue of economic liberalization embodied one of the major policy
cleavages among parties of the region since the mid-late 1980s, so familiarity with this topic
should have provided a valid measure of levels of information. As of June 1993, however, only
half of respondents in a study of eleven countries in the region were aware of economic
liberalization. In percentages, lack of knowledge ranged from 24 percent in Colombia to 71
percent in Bolivia (Barómetro Iberoamericano II 1993). In a similar vein, if TV news viewership
tells us something about levels of information and attentiveness, it is instructive to know that, on
average, 46 percent of urban residents in eight major Latin American nations did not follow any
political news at all, or admitted to pay almost no attention to them (as based on data from
LatinoBarómetro I 1995). An indication of even lower political inputs received by the average
voter in the region is reflected in the level of newspaper readership: less than four in every ten
followed the news in the paper (LatinoBarómetro I 1995). Political indifference is the other side
of the coin. Cross-national evidence collected around the 1994–95 wave of presidential contests
revealed that, on average, political interest was a virtue for less than four in every ten citizens
(Barómetro Iberoamericano IV 1994).
Moreover, political intelligence is a commodity tremendously skewed in its distribution
among electors. Being a function of education and educational opportunities, as well as of news
exposure (Sniderman et al. 1991), cognitive sophistication is limited by structural restrictions on
mass access to higher levels of formal schooling in the region and the increasing deterioration of
the educational system (see IADB 1995), as well as by the poor level of news attentiveness
displayed by the electorates.
These contentions support the claim that poor levels of information are not merely the
voters’ fault. After all, choosing political ignorance may be a rational strategy in a situation
reported in scholarly work like Cros Beras (1986) for the Dominican Republic, Alducin (1992) for México, and Meneguello (1993) sustain this assertion. Thereafter, for the sake of simplicity, all figures are presented
4
characterized by institutional weakness and policy fluidity. For various reasons, candidates’ issue
positions have been increasingly aimed at establishing closer rapport with special-interest groups
rather than with broader constituencies so as to warrant some minimum degree of governability
(O’Donnell 1992). Often, elected officials simply bury their campaign promises and choose
radically opposed policies in the hope that by the next electoral round citizens’ annoyance over
incumbents’ unresponsiveness will recede, the burden of policy choices will dissipate, and the
positive consequences of those policies could pave the road to a favorable business cycle (see
Geddes 1995; Stokes 1995, 2001). As a result, parties’ policy profiles remain pretty much
unsettled, adding more confusion to voters’ poor informational basis and thwarting policy-based
voting. All this makes the costs of being politically cognizant quite high and depresses the
prospects of identifying textbook versions of rational voters (that is, able to comply with the
requirement of scrutinizing the policy positions of candidates and parties, striving to maintain
issue consistency and ideological coherence in their choices over time and closely monitoring
party policy commitments and accomplishments across elections).
Voters Are Satisfaction-Oriented.
If most voters remain unaware of the political situation, doubts mount about their ability
to strive for an optimum electoral outcome in utility maximization terms. In principle, such
voting rationality would require surveying each alternative’s potential benefits, assessing its
corresponding costs and then coming up with a choice that optimizes the difference between
expected benefits and costs. Given a backdrop of faulty informational endowment and low
interest, can one still grant voters the capacity to engage in fully maximizing behaviors?
Cognitive limitations necessarily qualify the assumption that voters seek to maximize
utility. A more realistic view is that voters in Latin America react to the relative degree of
in rounded form unless otherwise noted. Also, all cross-national averaged figures are presented as

5
satisfaction derived from those pieces of information that are available regarding the major
electoral options. We should therefore think of voters as data scanners, likely to only skim
through the issues. Voters do indeed value results and react to the material or symbolic
gratification that these convey, but they simply skip policy considerations and instead put
emphasis on the instrumental and/or symbolic value of their leaders’ actions. They choose on the
basis of the relative satisfaction provided by government outputs and symbolic bonds with parties
and leaders of the polity, which makes pragmatism the essence of their approach to the electoral
arena (see Fiorina 1981).
Voters’ pragmatism is not merely an endogenous subproduct. It is also a natural response
to the conditions of institutional uncertainty surrounding each contest. In this sense, a second
supposition of the standard rational theory presumes that individuals can effectively pursue
maximizing strategies in the electoral arena, that is, that non-electorally accountable forces
would barely have any influence over electoral outcomes and the way electoral support translates
into policy outputs. Admittedly, this is not the case in Latin America, where the influence of non-
elected forces such as the military, business corporations, and international agencies over the
new civilian governments is explicit. As in most of the developing world, elected leaders seem
more sensitive to special interests than to “the whims of the voting majority” (Remmer 1991:
355). These factors limit the autonomy of electoral politics and introduce constraints on the
political responsiveness of elected officials. In turn, such constraints can only stimulate cynicism
among voters and thus pose reasonable doubts about the value of voting as a technique conducive
to reaching an optimum equilibrium.
A standard way of tapping this concern through survey research is asking people about
their perceptions of the fairness and responsiveness to be expected from the electoral process.
Asked in first place within a battery of questions about confidence in political institutions in
unweighted rates unless otherwise noted.
6
twelve Latin American nations, trust in the presidential elections elicited an average of 48
percent of negative responses. Aligned in a rather intuitive pattern, the highest confidence was
found in Uruguay and Chile, while the lowest confidence was found in Dominican Republic and
México (Barómetro Iberoamericano II 1993). A question with slightly changed wording about
confidence in the system “to elect authorities” asked four months later to a somewhat similar
pool of countries yielded an average of distrust of 54 percent. Again, Uruguayans displayed the
highest level of confidence while Venezuelans and Colombians showed the lowest trust feelings
(Barómetro Iberoamericano III 1993). Questions about electoral fairness asked to national
samples from eight countries revealed that half of the respondents view elections as fraud-ridden
(the figure reached 58 percent when no answers and no responses were included). Cross-national
variability could not be sharper, with Chileans, Uruguayans and Argentines at one end, and
Paraguayans and Mexicans at the other end, these firmly viewing their elections as fraud-ridden.
(LatinoBarómetro I 1995).
A widespread perception of the usefulness of voting and the conviction that voting
embodies an assertive action of positive consequences are two ubiquitous requirements for those
who hold that voters maximize their individual utility through the vote. If both rules are poorly
substantiated, one can hardly think that voters could believe the electoral process to be one
permitting the achievement of an optimum equilibrium of benefits and costs.
In a similar vein, if voters are cynical about elections and pessimistic about electoral
responsiveness, it would make no sense for them to spend their time learning about the issues and
voting accordingly. The panorama in Latin America clearly points to these flaws, considering
that 34 percent of the public, on average, approach elections with skepticism2. Turning to
electoral responsiveness, the landscape looks even less optimistic for the prospects of voters as
2 If no answers and no responses are pooled together with the overtly cynical views, altogether these yield an average of 43 percent.
7
utility optimizers, considering that, on average, 70 percent of voters agree that representatives do
not care much about the public interest (LatinoBarómetro I 1995). Even if the question does not
refer to how elected presidents are perceived in terms of responsiveness, it still communicates a
sense of the existing perceptual obstacles to the development of the conventional model of
rational voter. Accordingly, since the conditions to reap future benefits as a result of specific
choices are deemed to be grim in Latin America, an approach to voting founded in a rationality
of expected utilities is untenable.
Given this picture of individual voter capacities and the decision-making environment,
how then can we approach the voting decision? Is the notion of utility useless? Are voters not
rational? We need not go as far. The logical solution is to relax the requirements governing the
process of electoral choice and assume that citizens seek to achieve a “satisficing” (rather than
optimizing) equilibrium in terms of cost-benefit thinking before the voting booths (see Bennett
and Salisbury 1987). That is, voters limit themselves to choices that seem to be “good enough” or
satisfactory in view of their global objectives. Accordingly, they stick with the status quo if it
satisfies them, disregarding (at least to a certain degree) the possibility that they could do better
by changing; on the other hand, they tend to make changes when they are dissatisfied, even if the
existing situation is the least of all evils. This supposition is consistent not only with broader
patterns of political behavior under conditions of uncertainty characterized as risk-aversive, but
also with the very nature of the electoral choice as voters face it. (This point will be discussed in
more detail later on.)
In sum, individuals react to changes in their immediate environment and its effects on
their contingent notions of satisfaction; that is, they react to relative levels of contentment with
outputs and symbolic assets displayed by the incumbent force. Voters behave, therefore, as
specific value satisfiers rather than as maximizers of some hypothetical, abstract, and universal
notion of utility. In a milieu of institutional and economic uncertainty, predominant feelings of

8
political skepticism and unresponsiveness, and meager political engagement, the act of voting by
means of developing a carefully weighted assessment of past payoffs and future trade-offs that
each electoral option might represent (as the standard version of voting rationality would have it)
is hardly an option available for the majority of Latin American voters. Not just that, it is not
even a rational option.
Voters Hold an Economic and Non-economic Notion of Utility.
Utility has usually been defined in economic terms, with voters being seen as guided
only by their material concerns. Yet cross-national survey data show that this view of utility is
overly restrictive and does not take into account other important factors. First, instrumental
definitions of utility are not exhausted by goals of economic performance; rather, achievements
in the domain of collective security and public order also count. On average, in the early to mid-
1990s, about 40 to 46 percent defined a principle of utility in terms of economic performance (by
putting economic stability, growth and inflation control at the top of the list of government
priorities)3. Conversely, those doing so in non-economic terms amounted to 18 to 19 percent (by
giving priority to national defense, internal order and crime control). In a similar vein, the
evidence shows also the vitality of non-instrumental goals; those defining utility in expressive
and symbolically oriented terms amounted to 32 to 35 percent (by claiming as main concerns
political participation and civil liberties, as well as environmental issues).
These findings point to the need for a multidimensional notion of utility, one that lays the
foundation for the individual decision by encompassing not only a search for material values but
for emotional and symbolic goods as well (see Sears et al. 1981). Therefore the array of available
sources an individual uses to arrive at a decision about whom to support needs to be broadened
when studying voting behavior. These additional sources must be ones that do not demand high
3 World Values Study II (1991, 1992); LatinoBarómetro I (1995)

9
levels of information or rational sophistication and that, on the other hand, do allow resorting to
instrumental (e.g., material) as well as symbolic (e.g., emotional and identity-related) incentives
in the process of decision-making.
Studies of voting publics in Latin America substantiate this point. Exploring the basis of
lower-class political preferences and activities in México and Venezuela, Davis and Speer (1991:
335) conclude that “workers ... do not engage in politics simply because of economic needs.
Expressive orientations to politics also shape their political evaluations and behavior in
significant ways.” For these authors, expressive orientations involve ideological and value
dimensions of political conflict, attributes that may be relevant in relative terms but are far from
becoming major sources of behavior when considered in absolute terms. Other researchers claim
that among weakly ideological and issue-inconsistent publics, other symbolic goods come forth
as contents of people’s notion of utility. Some scholars view leadership qualities and the political
ability exhibited on the eve of dramatic events as crucial (MacKuen 1983); others contend that it
is partisan attachments as providers of political identity that count (Fiorina 1981). Government
outputs in general constitute an important source of reference, but many voters can be motivated
by a sense of utility fulfillment molded after the opportunities for political self-expression and
identification. Whatever the symbolic content, it is important to recall that political behavior
does not result solely from instrumental goals.
Voters Exercise Incumbent Voting.
The relaxation of the notion of utility, when seen in the context of actual cognitive and
environmental limitations imposed upon voters, demands a simplified view of the nature of
individual choice at the voting booth. Such simplified view entails centering the decision over
the destiny of incumbents. Reducing the scope of the decision to the incumbent odds dialogue
well with two other core predispositions of general publics: avoiding risks and the prevalent

10
cultural pattern to frame (and cope with) political options in plebiscitarian terms. It is my
contention that, to the average voter, electoral choice presents itself as essentially a binary
resolution: whether to support or repudiate the incumbent government.
The reason is simple: incumbency provides more visible and ready information to the
average voter than any other option. It represents the status quo, something that can be easily
grasped by voters whatever the type of outcomes they pick for guidelines. Any other option
represents change. Therefore, the basic frame of electoral choice faced by individuals is one of
continuity or change. For this very reason, incumbent rulers are usually regarded as less risky
than the challengers, who are often unknown and whose policies could drastically alter the
current trends, for better or for worse (see Quattrone and Tversky 1988: 724). From a perspective
of voting rationality structured by levels of relative satisfaction, however, the advantage of the
incumbent becomes contingent upon how positively or negatively his or her tenure is perceived.
In a situation characterized by high volatility in the economic and political spheres,
uncertainty about the application of procedures and officials’ policy intentions, and individuals’
own poor level of information, one should expect this “satisficing” rationality to “train” voters
not just to side automatically with the option that offers a less radical alteration with everyday
rules, but to develop a two-fold attitude towards risk. To wit, people should be expected to
become risk-averse in the domain of gains and risk-seeking in the domain of losses (Quattrone
and Tversky 1988: 723). This view presupposes that voters judge their levels of utility
satisfaction in relative, not absolute terms. It is relative not to suspicions or extrapolations of how
outcomes might have looked under a different administration, but relative to a subjective
threshold determining where discontent with outcomes translates into risk-seeking orientations at
the polls, that is, into repudiation of the incumbent party.
Empirical evidence seems to support these contentions. Regressing support for gradual
versus accelerated changes against measures of economic performance (e.g., inflation and per

11
capita income) reveals a clear pattern which shows that as the material scenario preceding the
interviews entails progress, support for gradualism becomes stronger, while the opposite trend
takes place if conditions involve retrogression.4 This shows that risk-seeking and risk-aversion
attitudes are conditioned by specific circumstances. Of course, how automatically this polarity
implies a withdrawal of votes from the incumbent is something empirically determined by the
position of that subjective threshold. Until that threshold is surpassed, it holds true that “if people
are risk-averse for gains and risk-seeking for losses, the less risky incumbent should fare better
when conditions are good than when they are bad” (Quattrone and Tversky 1988: 724).
This pro-incumbent bias contained in attitudes toward risk is further supported by the
data. As the standardized coefficient of inflation for predicting “gradual” changes is somewhat
larger than the one for “accelerated” changes (-.67 versus .63), it seems reasonable to assume that
publics are more sensitized by contextual conditions to avert potential losses than to pursue
uncertain gains, thus reacting more strongly in favor of gradualism than of radicalism. This
evidence further urges in favour of a perspective centered on the fortunes of the incumbents.
Given that Latin American voters reveal themselves as proportionally more conservative in the
face of acquired gains than audacious before the opportunity of reversing current losses, the
incumbent takes the natural lead.
The basic implication of such approach to the world of political choice is clear-cut:
voters go to the polls to make a decision which is fashioned as involving two “risks”—the risk of
4 The survey question asked read, “Would you say that changes in this country should be made in an accelerated or gradual manner?” and was asked of urban samples of thirteen Latin American countries (in seven of them twice) during 1993, thus amounting to a total number of twenty cases. Both predictors—one, a measure of the proportional difference in inflation rate relative to the previous year, and the other, a weighted-by-month-of-the-survey measure of per capita income growth rate—explain almost fifty percent of the variance of the net difference of proportions between those endorsing the “gradual” alternative minus those in favor of the “accelerated” option. Only the first predictor (inflation) achieved statistical significance at conventional levels greater than p < .05, with a negative unstandardized coefficient of -.20, which implied that as inflation was proportionally higher over time, less people were willing to prioritize gradualism over radicalism. By the same token, support for “accelerated changes” was bound to fall as inflation lowered and per capita income grew (although the effect of the latter was non-significant). These calculations are based on CEPAL (1995) and Barómetro Iberoamericano II and III (1993).

12
suffering eventual losses and the risk of harvesting uncertain gains—and each “risk” is contained
not in particular policies or issues but in the dichotomy between siding with continuity or opting
for change. The bottom line is, therefore, that elections embody a binary choice: they are about
continuity or change, that is, supporting or repudiating the incumbent. For the average voter, the
valid choice is to keep the “ins” in or throw them out.
A binary perspective on elections is also reinforced by the interplay between the
characteristics of the presidential office, cultural orientations toward leadership, the ways in
which leaders and the media frame the contests, and the way electoral outcomes are ultimately
interpreted by most analysts. For example, politicians and media analysts tend to describe
contests and results as matters of either conforming to the status quo or contesting it; as a
consequence, voters get used to thinking of them in similar terms.5 Institutional features such as
strong presidentialism also offer key incentives for the development of plebiscitarian orientations
at the time of electing a president. The presidential office, characterized by its independence of
power and direct mandate from the people, gives the incumbent a “sense of being the elected
representative of the whole people” and teaches him or her to rule accordingly (Linz 1994: 25,
see also 19–20). In turn, this sense of non-mediated identity between leader and people can only
nurture a plebiscitarian use and understanding of presidential authority and the stakes involved in
a presidential election.
In some countries, a plebiscitarian approach to national contests derives from the way
people have been practicing electoral politics previously, as well as from popular conceptions of
electoral choice. For example, survey data suggest that during the political liberalization period,
Brazilians conceptualized partisan support in terms of their sympathy towards the regime
5 For such an interpretation of the 1988 and 1994 Mexican elections, see Colosio (1993: 155), The Christian Science Monitor (8/15/1994: 14) and Proceso of México (“El Cambio, NO”: 8/23/1994); for the 1993 Venezuelan election, see The Christian Science Monitor (12/3/1993: 12); for the 1994 Brazilian election, see Jornal do Brasil (10/4/1994: 1–2) and Pinto (1994: 96–97); for the 1995 Peruvian election,
13
(Lamounier 1980; von Mettenheim 1995: Chapter 6). In the case of México, the longstanding
rule of the PRI has been interpreted as conditioning voters to approach elections through a two-
step process, starting with the decisive question of whether they will continue to support the
ruling party or not. As survey data gathered for the 1988 presidential elections confirm, “[f]irst
and foremost, [voters] asked themselves, Am I for or against the party of the state and its
leader?” (Domínguez and McCann 1995: 45). Similarly, electoral politics in post-Pinochet Chile
seems to follow the political divisions of the Pinochet era, with the electoral alignments of the
1990s correlating more strongly with the distribution of votes derived from the 1988 plebiscite
(which separated the political waters between those in favor and against military rule) than with
anything else (see Scully and Valenzuela 1993: 13, 23–24).
In addition, popular notions of what elections are about critically configure the call for
voting as an occasion for expressing political alignment with or against the incumbent. Thus,
individuals construct an electoral choice in very much the same way as they may “cheer for a
soccer team” (Reis 1988: 35). Of course, such notions derive from the structure of opportunities
presented to individuals. For example, among Brazilians, the “forced bipartism” of the post-1974
authoritarian period motivated “the[ir] political views ... to coalesce around new issues either in
opposition to or in support of the military government” (von Mettenheim 1995: 166). Among
Peruvians, political choice is contingent on the direct link forged between the mass and the
leader, with the incumbent authority structuring people’s reference set as the natural depository
of the collective destiny, the one able to impart a sense of justice and the source of patronage
benefits for everyone (Parodi and Twanama 1993).
Under democratic conditions, these plebiscitarian orientations hold the particular effect
of cutting across the different factors that shape the vote, each one bringing about a particular
electoral consequence in terms of the likelihood of supporting or dampening the “in” party at the
see DESCO Resumen Semanal of Perú (4/18/1995: Anexo 2); for the 1995 Argentine election, see El
14
ballot box. Considerations at play in the electoral scene pose themselves in dichotomous terms.
Thus, economic conditions become better or worse, the command over the political agenda is
perceived as strong or weak, the government helps “the rich” or “the poor”, the ruling party is
“ours” or “theirs,” one’s own class interests are favored or hurt. This means that voters may rely
on different sources but, in practical terms, their response is uniquely defined as voting in favor
or against the incumbent. Incumbency-oriented voting becomes the common ground upon which
everyone works out his or her own electoral decision.
Given the Latin American voters’ limited knowledge of and interest in political issues, their
tendency toward pragmatic “satisficing” based on a notion of utility that encompasses both
economic and non-economic factors, and their attitude toward elections as involving a binary
choice, how exactly are electoral decisions made? If voters do not spend countless hours weighing
the pros and cons of proposed policies and hoping to maximize material utility through their
decisions—as many theorists would have us believe—and if they see elections as, to a large degree,
contests involving voting for or against the incumbents, how exactly do they make up their minds at
the voting booths? What processes do they follow to come to their decision, given the limited
informational resources at their disposal and the rather low willingness to engage with the issues?
And are they, in fact, capable of making meaningful choices?
Decisional Clues to Electoral Choice
Voting does not occur in a vacuum. Nor does it reflect a random process of influences
chaotically dispersed by the socio-economic forces and political trends of society. Every
individual is engaged in some minimal consideration and follows some sort of rationale in
making up his or her mind at the voting booth. As we have already seen, Latin American voters
hardly ever choose based solely on individual will or cognitive capabilities. Rather, the electoral
Cronista Comercial of Argentina (5/19/1995: 14).
15
decision is constrained and fed by the presence of short-term and long-term forces, economic and
non-economic stimuli, and structural as well as idiosyncratic factors. But even if voters are
poorly informed and inattentive, they should not be dismissed as incapable of making meaningful
choices and acting cogently at the polls. After all, electoral outcomes are easily explained by
many conditions preceding the contests, in spite of citizens’ political ignorance. However, the
fact that one can interpret the electoral choice of the average voter in Latin America does not turn
her choice comparable to the way a fully informed elector would make it. The question that
remains is how the average voter, who is loosely connected with the political reality, becomes
capable of making meaningful decisions. How could it be possible that voters arrive at a
meaningful decision if they remain unaware and uninterested in politics? On what basis are their
choices made?
The response provided by most political psychologists is quite simple: since most voters
are minimally motivated to overcome—and actually can comfortably live with—their status of
cognitive misers before making electoral decisions, they can simply resort to the intensive use of
“decisional clues.” In due course, they may rely upon the guidance these supply and thus
articulate meaningful choices at the ballot box. By decisional clues scholars mean a series of
practical devices encompassing electorally consequential stimuli that a) work as information
shortcuts, b) help voters reduce the complexity of developing choices by making use of
“judgmental heuristics”6, and c) represent sources of motivation and guidance for political action.
The idea is as useful as it is simple, and many scholars have utilized it. However, certain
assumptions about how decisional clues function must first be examined—and potential
misunderstandings clarified—if this notion is to offer a useful, accurate way of examining voter
behavior. In narrowing the notion of information shortcuts, Lupia (1994), for example, includes
6 For an extended discussion of the concept of “judgmental heuristics,” see Sniderman, Glaser and Griffin (1991). For a partial rebuttal of the universality of this notion in light of the development of political skills by
16
influential personal acquaintances of the voter and highly credible sources from the world of
political experts she may be exposed to (see also Brady and Sniderman 1985). This
charcaterisation certainly suggests a parsimonious solution to the problem of how voters come up
with meaningful choices despite cognitive limitations, but it is flawed as fellow citizens
(however influential they might be) are rarely any more politically enlightened than the typical
voter. Moreover, the individual’s own political inattentiveness conspires against enabling
political experts to become influential cuegivers at a mass level.
Sniderman and his colleagues (1991) emphasize the notion of “judgmental heuristics,”
which are information cost-saving mechanisms contained in likability sources and group
identities through which voters can rapidly grasp the implications of choosing a particular
candidate or party. Yet in newly democratized regimes such cues are rarely available, since, as a
rule, political alignments of the elites and the masses are characterized by fluidity.7 Furthermore,
the rationality animating political parties’ standings on the eve of elections typically entails a
tactical propensity to seek centrist positions in order to enhance each party’s likelihood of getting
elected, a strategy that can only dilute any potential identity (see O’Donnell et al., 1986).
From a different perspective, Popkin (1991) traces information shortcuts to daily life
experiences of individuals, assuming that individuals make decisions exclusively upon matters of
personal relevance. The problem here is two-fold. On the one hand, this understanding of
information shortcuts makes matters of personal relevance contingent upon particularistic and
circumstantial forces, many of which are hardly politicized and only loosely connected to the
public sphere, where elections occur. On the other hand, Popkin’s assertion presupposes that
voters’ sensitivity to specific topics or dimensions solely defines the direction of their choices,
Western electorates, see Dalton and Wattenberg (1993). For a critique of views assuming that reliance on decisional clues permits uninformed voters to behave like fully informed electors, see Bartels (1996). 7 Even in those few cases like Brazil, where authoritarian rule allowed party politics to evolve and motivate people to count on judgmental heuristics (e.g., MDB as the “party of the poor,” ARENA as the “party of the

17
discarding the possibility that politicians and the media may manipulate the agenda—a factor
leading the public to choose, occasionally, on matters beyond personal relevance.
In light of such shortcomings, there is a need to specify in more contextual terms how ill-
informed voters tend to be guided in their choice-making by decisional clues. This task is to map
the types of conditions surrounding the act of voting and review empirically the extent to which
decisional clues are effectively available as well as the circumstances that condition such
availability. Focus should be directed to the interplay of cultural, institutional and economic
conditions, and the way they structure the opportunities for political socialization and heighten
the eventual effect held by contextual and short-term events.
Background Conditions and Decisional Clues.
If decisional clues are to provide the key to understanding voter behavior, one of the key
questions to answer is: How do generally inattentive voters find clues that are politically
consequential and that serve to compensate for information shortfalls? At this point, the focus of
attention switches from the individual’s attributes to his or her broader context and background.
In other words, the answer lies not so much in asking how voters personally overcome their
cognitive limitations but what conditions and motivations make some clues more easily and
readily accessible to them than others. Put succinctly, to the extent that the availability of these
decisional clues depends on the cultural, institutional and economic backgrounds of voters, as
well as on the political contingencies surrounding the elections, the examination of these
backgrounds and contingencies will yield knowledge about the opportunities and channels
through which voters elaborate their choices.
In determining which clues might become electorally salient, a few key principles should
be borne in mind. To begin with, clues must have the chance to develop and become a visible
rich,” see Lamounier 1980), the stability of these developments was crumbled by successive changes in the

18
component of the political context. Unless some minimum prerequisites of development and
stability are satisfied, a clue cannot have any considerable effect upon voters. For example, since
partisanship takes time to evolve, this clue tends to be underdeveloped in post-authoritarian
settings. Likewise, the more highly visible a clue becomes because of some inherent drama in its
content, the more likely it is to become a reference for voters. For example, the hyperinflation
upsurges of the mid and late 1980s with its major disordering of people’s everyday lifes,
facilitated the salience of economic conditions as a principal clue contouring electoral processes.
Second, the correspondence with longstanding cultural or institutional characteristics of
the region is likely to help a clue become more relevant at election time. Thus, caudillismo and
the strong personification of presidentialism, described as central components of political
behavior and the political systems in Latin America (Dealy 1992; Linz 1994), can enhance the
electoral conspicuousness of clues such as presidential leadership and the candidates’ appeal.
Conversely, the corporatist and antipluralistic ethos associated with the Latin American character
(Wiarda 1992), along with the weak institutionalization of most party systems (McDonald and
Ruhl 1989; Mainwaring and Scully 1995), suggest very little room for the emergence of partisan
clues.
Third, the more explicitly political the content of the decisional clue, the more likely it is
to become a source of guidance for voters. In other words, those forces providing cues to voters
should intrinsically carry an understanding of the political responsibilities involved. Inflation
might have been cut or unemployment might have swollen, but only after identifying a clear
attribution of responsibility to the government’s policies for both can that economic performance
become politically salient. Thus, if voters cannot automatically attribute political meaning to the
available clues in terms of prescribing responsibilities for the levels of satisfaction attained, these
clues can hardly become electorally consequential.
electoral legislation and party system.

19
Finally, if it is true that to become a relevant guideline for electoral behavior a clue
should be closer in meaning and consequence to the realm of the electoral scene, it should not be
too distant from the voter’s own experience either. As personal experience is a more material
yardstick than abstract speculation, conditions that effect personal life—assuming that this effect
has a political meaning—are more likely to help articulate voters’ choice. In this sense,
pocketbook drives may become salient clues only if government actions are seen as at least partly
responsible for variations in a voter’s personal finances.
Following these principles, let us now review the conditions surrounding elections and
examine how these raise or lower the probability that different decisional clues will shape the
electoral choice of the average Latin American voter. I distinguish and comment six types of
available and politically mobilizing hints: ideological, class-based, partisan, performance
related, leadership connected, and candidate sources. The identification of these clues resume the
shortcuts elicited by both the post-authoritarian environment and/or the literature on electoral
choice, which seem appropriate for discussion within the Latin American context.
Ideological Clues.
Ideological thinking has been traditionally conceived as the individual’s capacity to think
of political objects, policies and philosophical orientations in terms of an overarching continuum
going from left to right, or from liberal to conservative. This conceptual continuum summarizes
the abstract principles structuring people’s positions in the political world and, as such,
represents a judgmental shortcut likely to guide individuals’ decisions (see Converse 1964). The
question at stake, then, is: How readily do Latin American voters rely on these clues?
Ideological battles between left and right that animated the region’s electoral and extra-
electoral politics in the past tempted analysts to place ideology among the most influential
factors in voters’ choice. For some, the rhetorical clashes of the interrupted electoral experiences

20
of the 1970s signified the power of ideology to shape electoral cleavages (see Valenzuela and
Constable 1992). In the post-authoritarian decades of the 1980s and 1990s, some observers
pinpointed ideological disputes as the ones nurturing people’s decisions at the polls, as in the
cases of Perú in 1985 and 1990, Brazil in 1989 and 1998, and Uruguay and Venezuela in 2000
(see Cameron 1994; Dugan and Dietz 1995). However, these references to ideology came more
as supplementary observations than as core explanations of the voting decision.
The assessment of ideology as a salient electoral clue necessarily raises the question of
how central ideological thinking is to the average Latin American voter and how familiar he or
she is with those particular ideological labels that may convey decisional clues. Scattered public
opinion data show that, on average, standard ideological clues do not motivate voters in the
region. Concepts such as “left” or “right” do not ring any bell for one out of three of them (i.e.,
32 percent). As expected, there are significant variations in responses depending on the country:
labels are more meaningful among Chileans and Uruguayans, while Venezuelans and
Paraguayans seem more unable to make sense of them (LatinoBarómetro I 1995).
Moreover, if ideological self-placement is a pre-condition for using ideological labels in
selecting a political choice, the fact that an average of 41 percent of respondents that face
electoral tests fail to identify those labels or to locate themselves along some point of the
continuum points out the limited relevance of ideology as an information shortcut.8 Besides, the
ability to identify ideological labels does not necessarily mean that the individual makes a
consistent use of them. In Argentina, for example, there is a notable mismatch between the
8 This evidence comes from an incomplete set of countries where publics were unable, or unwilling, to place themselves on a standard seven or ten-point scale of ideological self-identification. Due to the data incompleteness, the evidence has an illustrative rather than a representative value. The percentage ranges of “non-ideologues” (defined as those who were unable to identify ideological concepts and place themselves at some point of the continuum) was 46-47 percent in Argentina (1989-1995), 45-69 percent in Brazil (1989-1994), 30 percent in Chile (1993), 41 percent in Colombia (1982), 56 percent in México (1994), 43-52 percent in Perú (1990-1995), 14-25 percent in Uruguay (1989-1994), and 19-24 percent in Venezuela (1983-1988). Sources are Catterberg (1991); LatinoBarómetro I (1995); CEDEC/Datafolha (March 1990)
21
individuals’ self-placement on a left–right scale and the position attributed to their party of
choice (see Catterberg and Braun 1989).
Another approach to the topic is Converse’s (1964) levels of political conceptualization,
but the meager number of cases examined under this lens does not leave much hope for
ideological clues either. The breadth of the public’s political conceptualization capabilities in the
context of the 1989 and 1994 Brazilian elections, for example, reveals a fraction of “ideologues”
as tiny as the one Converse found among Americans in the late 1950s (see von Mettenheim
1995).
All this suggests that Latin American mass publics make limited use of ideological labels
and only a marginal portion of them may find ideological concepts instrumental to compensate
for low levels of information and attentiveness. The notion of elections as serving as the scenario
of a combat between alternative ideologies, and voters constructing their choices based on their
appeal, can hardly be sustained.
Class-Based Clues.
The irrelevance of ideology and issues as sources of guidance means that other factors
must have the explanatory upper hand. Two “usual suspects” are class position and partisanship,
the first through the orientational function of class interests—as developed through personal
experience or as transmitted generationally—and the second through the work of party labels—
as comprehended through parental socialization and governmental and campaign-related
experiences. To be sure, one cannot be seen as totally independent of the other, since the
electoral relevance of party attachments is critically linked to the persistence of basic social
cleavages (Lipset and Rokkan 1967).
Class-based clues in Latin America face many of the same challenges that led analysts of
of Brazil; CNC of Colombia; Apoyo of Peru; Equipos Consultores of Uruguay; Batoba Survey (1983); and

22
most advanced democracies to disregard them as critical determinants of the vote. Social
mobility, an economy increasingly based on the service sector, and rising structural
unemployment all suggest a less salient role for class positions in elections. On top of this, the
Latin American economic crisis of the 1980s shifted the political consequences likely to be
expected from class alignments.
Since the early 1980s, there has been a wave of changes in the social composition of
Latin America. In 1991, all but one country holding competitive elections revealed a per capita
income level below that of 1980. The picture of negative growth was not a mild one: the slump
reached almost ten percent, affecting dramatically the overall well-being of voters and deepening
poverty (see CEPAL 1994). As a result, class positions were drastically redefined, a phenomenon
with strong consequences in the electoral arena.
Along with vast alterations in the well-being of citizens, the demographic reduction of
the industrial belt of most countries also had repercussions for the class composition of the
society. Compared to twenty years ago, a conservative calculation of changes in the production
structure in Latin America yields an increase in the share of the services sector of about 6
percent, most of which happened at the expense of the manufacturing sector (see World
Development Report 1993). Between 1981 and 1990, a shift of almost 8 percentage points (from
51.5 to 59.3 percent) occurred in the proportion of people employed in the services sector within
the largest electorate of the region, Brazil’s, while the proportion of workers in agricultural
activities shrank almost 6 points (see Urani 1995: 17). The national outlooks on these
developments and their consequences for the characteristics of the social class structure (as well
as for the potential demobilization of class-based clues by labor unions) is already well recorded
(see Schatan et al. 1991; Rakowsky 1994).
The evolution of income inequality and poverty levels are two other indicators that
Welsch (1993).
23
illustrate the limited effectiveness of social class as source of information. As conditions
deteriorated in steady and massive numbers, social class lines eroded.9 One result of this
deterioration was income concentration at the top. For example, in Argentina, between 1980 and
1989, the distribution of family income for the highest quintile went up from 45.4 to 57.6
percent, while the joint share of the three lower quintiles of the population decreased from 32.3
to 23.2 percent (see LoVuolo 1995: 49). This income concentration was complemented by an
experience of massive pauperization between 1980 and 1989. If the statistics for poverty and
extreme poverty are added, the following increases in the percentage of the population living in
poverty can be observed: in Argentina, from 3.2 to 8 percent; in Bolivia, from 73.6 to 77.2
percent; in Brazil, from 46.3 to 59.6 percent; in Honduras, from 70.3 to 77.1 percent; in México,
from 19.1 to 29.9 percent; in Perú, from 34.4 to 50.6 percent; and in Venezuela, from 4.7 to 16
percent (Edwards 1995: 258). Stunned by the brutality of these changes, one observer asserted
that “during the 1980s ... Latin America generated twice as many poor people as it procreated
Latin Americans” (Vilas 1995: 326).
Naturally, such exceptional experience could not pass lightly noticed by individuals
themselves. Even after the strong recovery of the 1990s, survey respondents in a 1995 multi-
country study still perceived increased pauperization as a major reality in their recent lives. On
average, 55 percent of the respondents perceived that poverty has gotten much worse in the last
half decade. Adding those deeming poverty as having increased a little, the average proportion
reached 75 percent (LatinoBarómetro I 1995).
Objectively, the social landscape of Latin America has been dramatically affected by
severe transformations in the overall levels of well-being, the structure of production, the degree
of income inequality, and the proportion of population slipping into poverty. The consequences
9 Looking at the changes in the Gini index during the 1980s for some of the larger electorates of the region, the trend was towards greater inequality: Argentina switched from .389 to .461, Bolivia from .479 to .515,
24
for the instability of class status and the corresponding downplaying of social class as an
effective decisional clue are not hard to deduce.
Finally, if class-based clues were to exert any influence as information shortcuts, a
relatively clear picture of collective interests and identity would need to be present. A critical
consequence of the economic reshuffle in the region was precisely the formidable atomization of
the individuals and, consequently, the pulverization of any class consciousness or structurally
rooted group identity (Zermeño 1989). Changes in the economy gave way to social fragmentation
and weakened the social basis of electoral behavior. In its place emerged a sequence of “anomic
individualism” and “defensive survivalism” likely to entice short-term and pocketbook-oriented
forces in electoral decision-making (Zermeño 1989: 137; Weffort 1991: 10–20).
Partisan Clues.
One of the conventions commonly accepted by political scientists is that voting choice
reflects mainly the individual’s party allegiances. This belief takes for granted a prior history of
stable partisan politics, where there are opportunities for parties to “socialize” individuals and for
the individuals to make first-hand acquaintance with the pros and cons of each major political
force during a reasonable period of time. It also assumes a relatively smooth intergenerational
transmission of partisan allegiances, a gradual (if any) transformation of partisan policy expertise
and identity, and a set of clearly defined partisan myths and rituals easily retrieved by candidates
and national leaders during the campaigns. Furthermore, it presupposes a relatively strong and
stable party system; otherwise, the acceptance of parties as legitimate institutions of
representation and government is challenged, party organizations become exclusively
subordinated to transient personal leadership and the distribution of patronage, and party rooting
in society is hard to accomplish (Mainswaring and Scully 1995). Finally, this conventional view
Brazil from .574 to .625, and Perú from .427 to .438 (Edwards 1995: 257). Interestingly enough, exceptions

25
presumes the absence of strong de-socializing forces counteracting the partisan education of
citizens, such as those conveyed by an antiparty sentiment or a widespread lack of credibility of
such institutions.
The Latin American experience with party politics contradicts these assumptions. First,
skepticism with the level of partisan institutionalization still predominates (McDonald and Ruhl
1989; but see Dix 1992). Under poorly developed party systems, many politicians have more
incentives to play personal politics rather than partisan politics. When exacerbated, this situation
leads to a practice of party-switching by congressmen, candidates and even presidents—a
practice known as camisetazo or fisiologismo. The personalization of political loyalties and a
reliance on an exchange of favors between leader and follower become the rule.
Secondly, the erosion of the class basis of politics, as previously reviewed, tends to
dilute the very same sources of long-term partisan support (see Dix 1989).
Moreover, democratic breakdowns interrupted the work of partisan socialization, in
cases where they did not openly reverse it. To be sure, many authoritarian experiments preceding
the period under consideration sought to “re-socialize” the political identities of individuals (see
Brockman Machado 1978; Valenzuela and Constable 1991). Even if not fully successful,
dictatorships were very effective in diluting previous identities and legitimizing an antiparty
rhetoric.
In addition to the newness of democratic politics in most countries, political parties have
to overcome a series of challenges coming from the economic pressures that followed
democratization, the scant antecedents of institutional robustness, and the anti-institutional mores
of the modal political culture of the region. The extent to which economic hardship during the
1980s and the effective implementation of policy reforms throughout the 1990s constituted a
challenge to politicians’ survival has been documented at length (Nelson 1990; Conaghan 1992;
to this rule are found among longstanding democracies like Colombia and Costa Rica.
26
Smith et al. 1994). Quite often, when reaching office, parties chose to adopt a path of economic
policies radically different from campaign promises or their policy traditions, which only added
more confusion and, occasionally, shifted the balance of party loyalties (see Stokes 1995).
Finally, a measure of confidence in political parties provides another indication of the
institutional robustness of party systems and the likelihood of political forces to become sources
of mass electoral orientation. On average, 61 percent of the publics judged political parties as
essential to democracy, with Venezuelans and Brazilians exposing the lowest degree of
agreement with that vision and Uruguayans displaying the highest10. This means that over a third
of the electorates had reservations about the role of parties in electoral politics.
This assertion is further reinforced by the poor credibility of political parties in pre-
electoral times. An average estimate of 26 percent signaled “a lot” and “some” confidence in
parties in thirty-one cases. (For percentages for individual countries, see Table 3.1.) This
negative view of parties is consistent with features of the political culture of the region such as
the tendency to develop notions of political solidarity based upon organicistic arrangements or
clientelistic compromises, and people’s fascination with individual personalities rather than with
institutions.11
Table 3.1
Public Opinion Indicators of Partisanship and Confidence in Political Parties
(in %)
10 See Consorcio Polis 1988; Informes CNC 1982, 1994; Encuestas&Estudios 1989, 1993; Batoba Survey 1983; Harris-Doxa Venezuela 1993; CERC 1993; LatinoBarómetro I 1995 11 See, for example, Wiarda (1992: 324–27) on the belief in the natural hierarchy of social or functional groups and the overall importance of these groups; Eisenstadt and Roniger (1984: Chapter 6) and Roniger (1990) on patron–client relationships and exchange of particularistic benefits; and Morse (1992: 88–90), McDonald and Ruhl (1989: 341–344) and others on personalism embodied in the figure of the “Machiavellian leader” or caudillo.
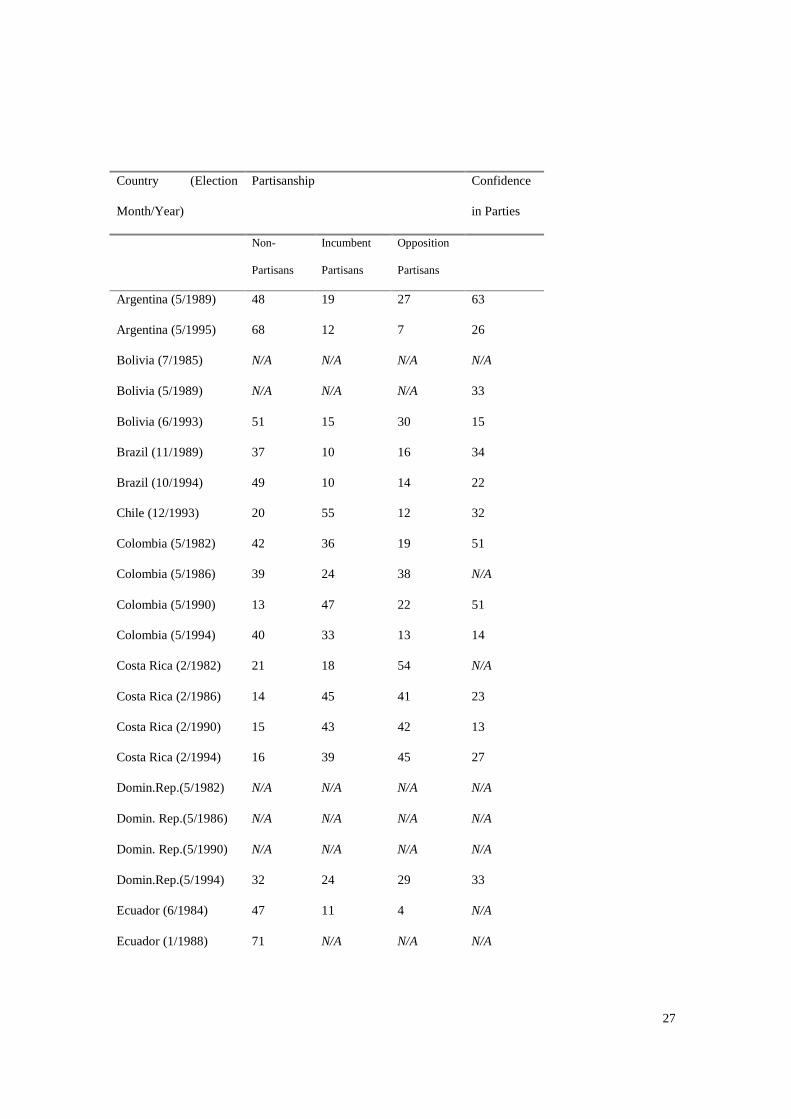
27
Country (Election
Month/Year)
Partisanship Confidence
in Parties
Non-
Partisans
Incumbent
Partisans
Opposition
Partisans
Argentina (5/1989) 48 19 27 63
Argentina (5/1995) 68 12 7 26
Bolivia (7/1985) N/A N/A N/A N/A
Bolivia (5/1989) N/A N/A N/A 33
Bolivia (6/1993) 51 15 30 15
Brazil (11/1989) 37 10 16 34
Brazil (10/1994) 49 10 14 22
Chile (12/1993) 20 55 12 32
Colombia (5/1982) 42 36 19 51
Colombia (5/1986) 39 24 38 N/A
Colombia (5/1990) 13 47 22 51
Colombia (5/1994) 40 33 13 14
Costa Rica (2/1982) 21 18 54 N/A
Costa Rica (2/1986) 14 45 41 23
Costa Rica (2/1990) 15 43 42 13
Costa Rica (2/1994) 16 39 45 27
Domin.Rep.(5/1982) N/A N/A N/A N/A
Domin. Rep.(5/1986) N/A N/A N/A N/A
Domin. Rep.(5/1990) N/A N/A N/A N/A
Domin.Rep.(5/1994) 32 24 29 33
Ecuador (6/1984) 47 11 4 N/A
Ecuador (1/1988) 71 N/A N/A N/A
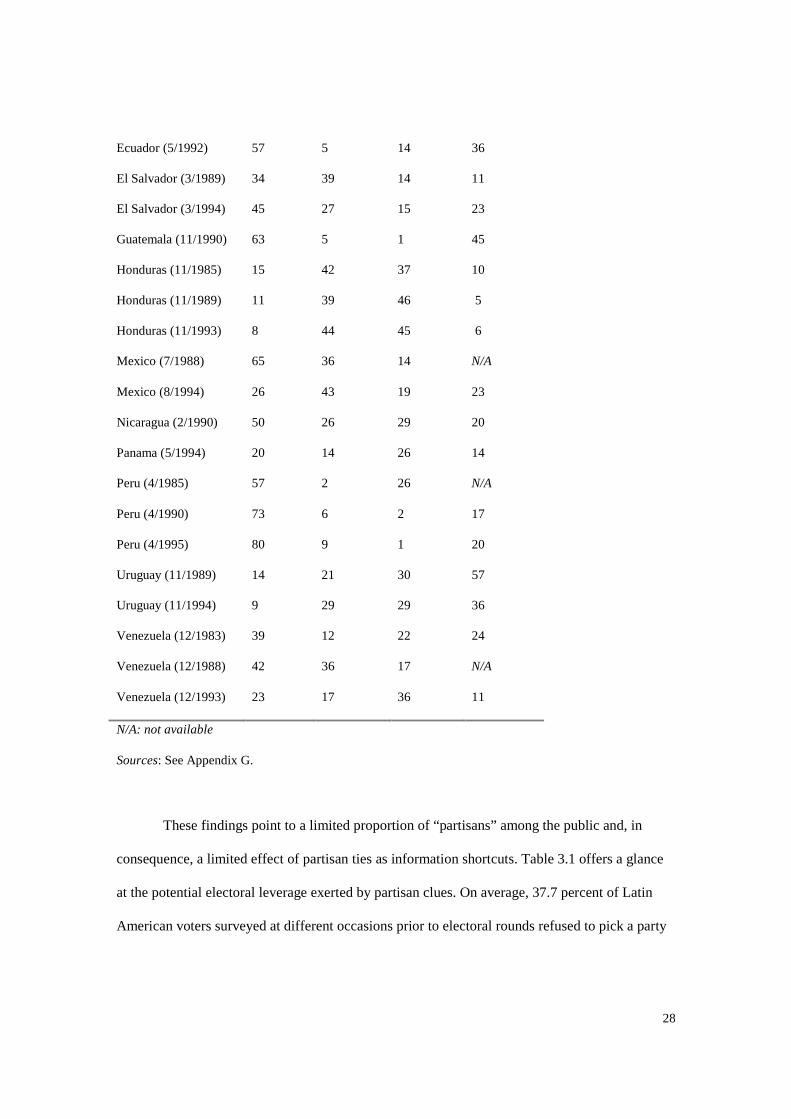
28
Ecuador (5/1992) 57 5 14 36
El Salvador (3/1989) 34 39 14 11
El Salvador (3/1994) 45 27 15 23
Guatemala (11/1990) 63 5 1 45
Honduras (11/1985) 15 42 37 10
Honduras (11/1989) 11 39 46 5
Honduras (11/1993) 8 44 45 6
Mexico (7/1988) 65 36 14 N/A
Mexico (8/1994) 26 43 19 23
Nicaragua (2/1990) 50 26 29 20
Panama (5/1994) 20 14 26 14
Peru (4/1985) 57 2 26 N/A
Peru (4/1990) 73 6 2 17
Peru (4/1995) 80 9 1 20
Uruguay (11/1989) 14 21 30 57
Uruguay (11/1994) 9 29 29 36
Venezuela (12/1983) 39 12 22 24
Venezuela (12/1988) 42 36 17 N/A
Venezuela (12/1993) 23 17 36 11
N/A: not available
Sources: See Appendix G.
These findings point to a limited proportion of “partisans” among the public and, in
consequence, a limited effect of partisan ties as information shortcuts. Table 3.1 offers a glance
at the potential electoral leverage exerted by partisan clues. On average, 37.7 percent of Latin
American voters surveyed at different occasions prior to electoral rounds refused to pick a party

29
label as a significant source of attachment or identification.12 Moreover, a comparison of the
degree of non-partisanship (that is, the percentage that lacks partisan allegiances) across
countries with different levels of party institutionalization reveals that partisan independence
follows systematic lines. The average value of non-partisanship for Costa Rica, Uruguay and
Venezuela (countries characterized in the mid-1990s as holding a high degree of party
institutionalization) was 20.3 percent; in contrast, the average value for Brazil, Ecuador and Perú
(all of them charcaterized as holding a low degree of party institutionalization) was 53.8 percent.
This speaks of a 33.5 percentage points difference which demonstrates the degree to which
partisanship is constrained by the institutional context.
On the whole, a review of the conditions contextualizing the relationship between
electorates and political parties in the region shows limited opportunities for the emergence of
partisan attachments and the crystallization of party labels as important decisional clues at
electoral times. This situation is a byproduct not merely of the structural or political weakness of
partisan effects, but also of the way partisan ties themselves have been forged. In this sense, their
heavy reliance on the exchange of material benefits and strong personalities has been of extreme
importance. Thus, as parties themselves become less reliable clues, voters are ready to turn to
other sources of information, such as performance evaluations and leadership appeals.
Performance Clues.
In the worst of all worlds, voters may arrive at the polls without a clear notion of class
positions, having developed no partisan ties, too ignorant of the issues to choose on a policy
basis, and too unsophisticated to choose according ideological worldviews. Still, as Fiorina
12 Interestingly, comparing non-partisanship over time renders very weak support for the argument that sees effective partisan socialization as a function of the temporal opportunities for party development offered by continuous democratic governance. Considering the average proportions of non-identifiers for the first and last election held in each country for which data are available (38.5 and 37.6 percent, respectively), there seems to be a null effect, or, if anything, a slight party dealignment effect as party politics endures.

30
(1981: 5) reminds us, citizens “typically have one comparatively hard bit of data [at hand]: they
know what life has been like during the incumbent’s administration.” Performance clues, either
economic or political in content, constitute the most widely available source of information. In a
context of weak partisanship, weak class consciousness and weak ideological commitments,
performance may represent the most efficient source of decision.
Performance considerations are connected to the vote in three basic ways. First, they take
the lead in shaping the priority lists of individuals. As preoccupations with broader economic and
social issues rank high in the public’s list of national concerns, one may expect an important
degree of voters’ sensitivity to what the government is able to accomplish in those areas. Second,
performance clues surface in the context of the quality of the environment and the type of
conjunctural challenges faced by the incumbents. If electoral decisions take place in times of
unusual economic and political hazards, voters tend to articulate their choices around topics of
government performance; in particular, two topics of performance have stood out across the past
twenty-five years: the need to advance and consolidate democracy and the need to make the
economy governable. Third, performance considerations depend on the extent to which the
government is perceived as responsible for economic and non-economic outcomes. Naturally,
unless individuals can establish an explicit connection between results and the administration’s
actions and omissions, performance considerations will rarely play any role as electoral clues.
Priority Lists and Performance Clues.
Priority lists measure the most salient or problematic contemporary themes facing the
nation, as perceived by the public. They are compiled using open-ended questions related to
people’s current concerns (see RePass 1971). They provide an overall view of the types of
contents and decisional clues most likely to shape people’s choice, such as, for example,
inflation, poverty, corruption, law-and-order considerations, etc.
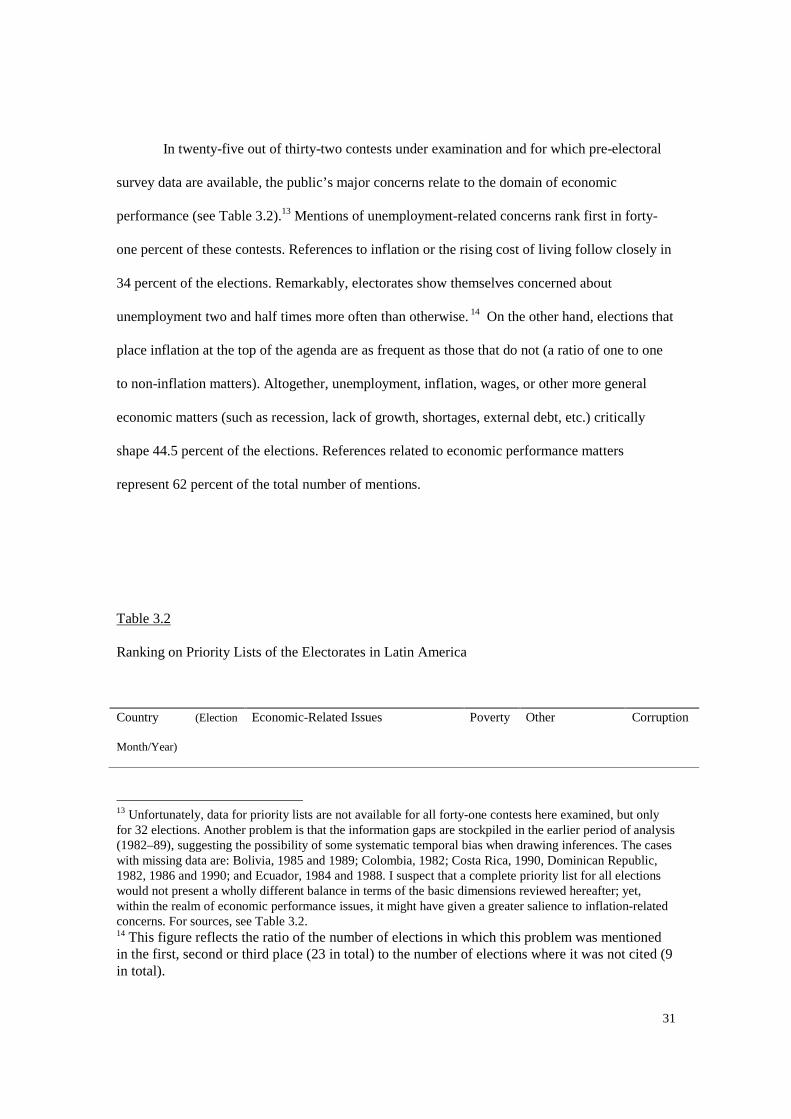
31
In twenty-five out of thirty-two contests under examination and for which pre-electoral
survey data are available, the public’s major concerns relate to the domain of economic
performance (see Table 3.2).13 Mentions of unemployment-related concerns rank first in forty-
one percent of these contests. References to inflation or the rising cost of living follow closely in
34 percent of the elections. Remarkably, electorates show themselves concerned about
unemployment two and half times more often than otherwise. 14 On the other hand, elections that
place inflation at the top of the agenda are as frequent as those that do not (a ratio of one to one
to non-inflation matters). Altogether, unemployment, inflation, wages, or other more general
economic matters (such as recession, lack of growth, shortages, external debt, etc.) critically
shape 44.5 percent of the elections. References related to economic performance matters
represent 62 percent of the total number of mentions.
Table 3.2
Ranking on Priority Lists of the Electorates in Latin America
Country (Election
Month/Year)
Economic-Related Issues Poverty Other Corruption
13 Unfortunately, data for priority lists are not available for all forty-one contests here examined, but only for 32 elections. Another problem is that the information gaps are stockpiled in the earlier period of analysis (1982–89), suggesting the possibility of some systematic temporal bias when drawing inferences. The cases with missing data are: Bolivia, 1985 and 1989; Colombia, 1982; Costa Rica, 1990, Dominican Republic, 1982, 1986 and 1990; and Ecuador, 1984 and 1988. I suspect that a complete priority list for all elections would not present a wholly different balance in terms of the basic dimensions reviewed hereafter; yet, within the realm of economic performance issues, it might have given a greater salience to inflation-related concerns. For sources, see Table 3.2. 14 This figure reflects the ratio of the number of elections in which this problem was mentioned in the first, second or third place (23 in total) to the number of elections where it was not cited (9 in total).

32
Inflation Unemploy
ment
Wages Crisis
Crime Social
Policy
Argentina (5/1989) 1 0 2 0 0 3 0 0
Argentina (5/1995) 0 1 0 0 0 0 2 0
Bolivia (7/1985) N/A N/A N/A N/A N/A N/A N/A N/A
Bolivia (5/1989) N/A N/A N/A N/A N/A N/A N/A N/A
Bolivia (6/1993) 0 1 2 0 0 0 3 0
Brazil (11/1989) 1 0 2 0 0 0 3 0
Brazil (10/1994) 3 1 0 0 2 0 0 0
Chile (12/1993) 0 0 0 0 3 1 0 0
Colombia (5/1982) N/A N/A N/A N/A N/A N/A N/A N/A
Colombia (5/1986) 0 1 0 2 0 3 0 0
Colombia (5/1990) 0 1 0 2 0 3 0 0
Colombia (5/1994) 0 3 0 0 0 2 0 1
Costa Rica (2/1982) 1 2 0 0 0 0 3 0
Costa Rica (2/1986) 1 3 0 0 0 0 2 0
Costa Rica (2/1990) N/A N/A N/A N/A N/A N/A N/A N/A
Costa Rica (2/1994) 1 0 0 0 0 0 2 0
Domin.Rep.(5/1982) N/A N/A N/A N/A N/A N/A N/A N/A
Domin.Rep.(5/1986) N/A N/A N/A N/A N/A N/A N/A N/A
Domin.Rep.(5/1990) N/A N/A N/A N/A N/A N/A N/A N/A
Domin.Rep.(5/1994) 1 0 0 0 0 0 2 0
Ecuador (6/1984) N/A N/A N/A N/A N/A N/A N/A N/A
Ecuador (1/1988) N/A N/A N/A N/A N/A N/A N/A N/A
Ecuador (5/1992) 1 3 0 2 0 0 0 0
El Salvador (3/1989) 0 3 0 2 0 1 0 0
El Salvador (3/1994) 2 3 0 2 2 1 0 0
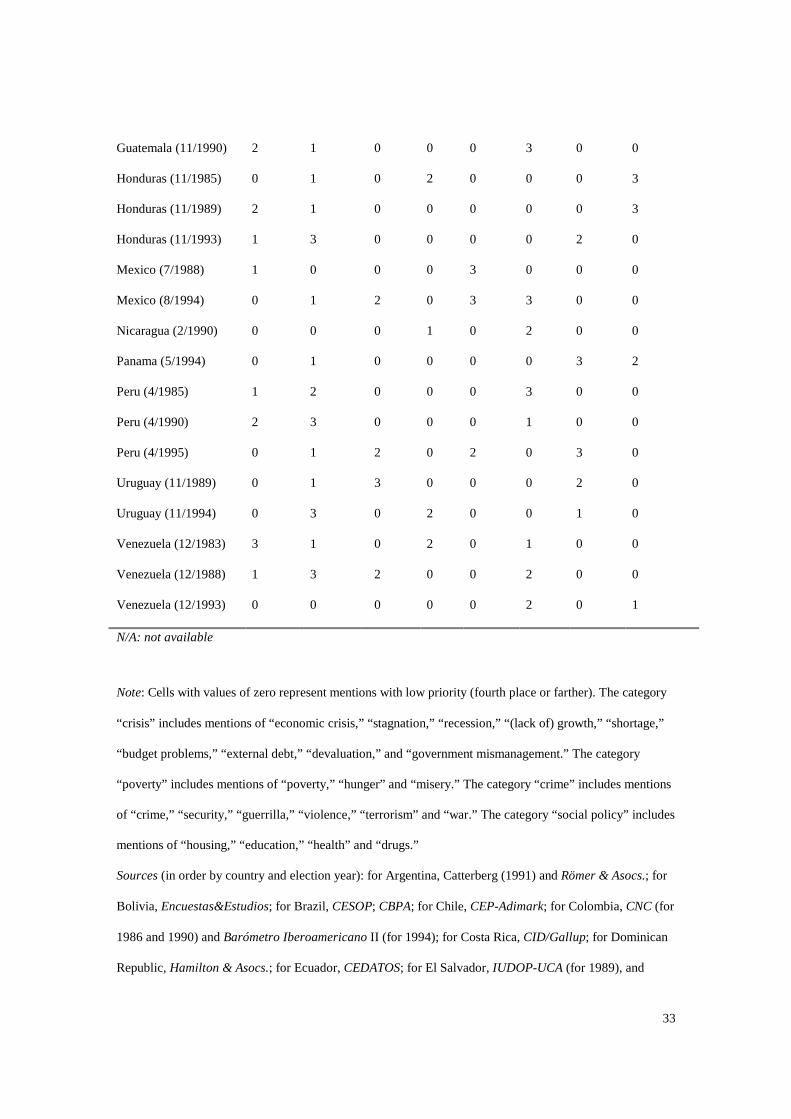
33
Guatemala (11/1990) 2 1 0 0 0 3 0 0
Honduras (11/1985) 0 1 0 2 0 0 0 3
Honduras (11/1989) 2 1 0 0 0 0 0 3
Honduras (11/1993) 1 3 0 0 0 0 2 0
Mexico (7/1988) 1 0 0 0 3 0 0 0
Mexico (8/1994) 0 1 2 0 3 3 0 0
Nicaragua (2/1990) 0 0 0 1 0 2 0 0
Panama (5/1994) 0 1 0 0 0 0 3 2
Peru (4/1985) 1 2 0 0 0 3 0 0
Peru (4/1990) 2 3 0 0 0 1 0 0
Peru (4/1995) 0 1 2 0 2 0 3 0
Uruguay (11/1989) 0 1 3 0 0 0 2 0
Uruguay (11/1994) 0 3 0 2 0 0 1 0
Venezuela (12/1983) 3 1 0 2 0 1 0 0
Venezuela (12/1988) 1 3 2 0 0 2 0 0
Venezuela (12/1993) 0 0 0 0 0 2 0 1
N/A: not available
Note: Cells with values of zero represent mentions with low priority (fourth place or farther). The category
“crisis” includes mentions of “economic crisis,” “stagnation,” “recession,” “(lack of) growth,” “shortage,”
“budget problems,” “external debt,” “devaluation,” and “government mismanagement.” The category
“poverty” includes mentions of “poverty,” “hunger” and “misery.” The category “crime” includes mentions
of “crime,” “security,” “guerrilla,” “violence,” “terrorism” and “war.” The category “social policy” includes
mentions of “housing,” “education,” “health” and “drugs.”
Sources (in order by country and election year): for Argentina, Catterberg (1991) and Römer & Asocs.; for
Bolivia, Encuestas&Estudios; for Brazil, CESOP; CBPA; for Chile, CEP-Adimark; for Colombia, CNC (for
1986 and 1990) and Barómetro Iberoamericano II (for 1994); for Costa Rica, CID/Gallup; for Dominican
Republic, Hamilton & Asocs.; for Ecuador, CEDATOS; for El Salvador, IUDOP-UCA (for 1989), and
34
CID/Gallup (for 1994); for Guatemala, CID/Gallup; for Honduras, Belden&Russonello (for 1985) and
CID/Gallup (for 1989 and 1993); for México, IMOP/Gallup (for 1988) and Ciencia Aplicada-
Belden&Russonello (for 1994); for Nicaragua, SOCMERC; for Panamá, CID/Gallup; for Perú, Bendixen-
Law (for 1985) and Apoyo S.A. (for 1990 and 1995); for Uruguay, Equipos Consultores; for Venezuela,
Batoba Survey (for 1983), Carrasquero (1995) (for 1988), and Barómetro Iberoamericano II (for 1993).
While economic issues are of great importance, they do not exhaust the list of voters’
pre-electoral concerns, nor do they absorb all considerations about government performance.
Social issues such as poverty, education, health, and housing elicit important reactions from
voters in different elections. Twelve percent of the electoral contests are conditioned by these
issues. If one adds drug-related issues to this dimension, the ratio becomes one mention of social
topics out of every five mentions. Voters do also react to issues of physical insecurity (e.g., crime
and urban violence) and system survival (e.g., civil or external war, terrorism, and guerrillas). In
relative terms, twenty percent of the elections are preceded by publics placing these issues at the
top of the national agenda. Likewise, electorates have been sensitive to the impact of corruption,
capable of rallying the public’s attention in five contests out of thirty-two.
The message conveyed by these figures is that voters may be open to follow performance
assessments as decisional clues in relation to what they deem to be national priorities. A
heightened concern for economic matters translates into decisions shaped by voters’ impressions
of government’s management of the economy. Still, since priority lists also convey a verdict on
extra-economic areas of performance, a performance-centered voting may evoke the use of other
clues, such as presidential leadership. Likewise, if concerns with corruption occupy a central
position, other decisional clues, such as candidates’ image and past record, are likely to be
influential.

35
Economic Performance Clues.
The habituation of Latin American publics to the routines of electoral politics took place
in extraordinary economic times. Throughout the 1980s, the region experienced the most
devastating depression in the postwar era. Output growth per capita fell almost ten percent
(CEPAL 1994); in 1990, the level of income per capita was placed below the 1975 standard. In
1994, the per capita income was still below the 1980 one, at about $2,200 (IADB 1995). From an
economic point of view, the decade was “lost.”
Reports from international agencies described the economic landscape with dismay, as
characterized by “an absolute reduction in investment levels and [as a result] a setback of living
standards not experienced by the region’s population for half a century” (CEPAL 1991: 1). Latin
America experienced more and deeper recessions than advanced industrial economies, and as a
result suffered “lower economic growth, reduced educational progress, a worsened distribution
of income and more poverty” (Hausmann and Gavin 1995: 1). Even if some national differences
remained in other dimensions, the general economic background unified the region in decay. As
one leading scholar pointed out, “[Latin] America is unified by crisis, foreign debt, economic
stagnation, inflation, rising unemployment and growing inequalities” (Weffort 1989: 93).
Recessions during the 1980s did not come alone. Their material impact was immensely
magnified by all-time high inflation levels, deterioration of real wages, rising unemployment, and
the exhaustion of monetary resources, which heavily constrained public investment and social
spending (CEPAL 1991; 1994). For example, between 1986 and 1989, a weighted average rate of
inflation for the six largest electorates of the region reached the figure of 1,494.3 percent. During
the same period, mean real wages equalled, on average, 84 percent of the 1980 remunerations,
and urban unemployment levels rose to 7.7 percent of the economically active population.
Furthermore, between 1982 and 1990, the region suffered an all-time negative net transference of
36
resources, which amounted close to $220 billions (CEPAL 1995). It is hard to overemphasize the
potential of such a crisis to disorganize the economic life of Latin American societies and turn
electoral tests into referenda on the coping abilities and rhetoric of governments confronting such
critical conditions.
In a like manner, the strong economic stabilization and recovery of the 1990s, based on
massive spending cuts, orthodox anti-inflationary policies, radical changes in the property
structure, and the consolidation of high unemployment levels (see CEPAL 1995; Edwards 1995),
could only tend to keep electorates highly sensitive to performance clues of a financial nature.
Sudden rises in per capita income and mean real wages followed during the 1990s. Between
1991 and 1994, an average accumulation of eight percentage points in per capita income reversed
the downward trend in material well-being and social mobility. In five of the seventeen countries
under study, the output growth per person surpassed the single-digit figure. Exhibiting a similar
effect, mean real wages in most of the largest electoral markets inverted the negative trend and
overtook the 1980 baseline, reaching an average value of 103 (1991–94). This change
represented an amelioration of about 25 percent in the paychecks of the wage-earning public vis-
à-vis the 1986–89 situation (CEPAL 1994).
The dramatic and radical nature of economic developments in Latin America during the
1980s through to the mid-1990s constituted a unique setting for the flourishing of economic
performance clues. Scholars such as Calvert and Calvert (1989: Chapter 7), for example, have
interpreted the tendency on the part of voters to look for state economic protection, combined
with irresponsible economic individualism, as likely to grant natural primacy to economic
performance in defining political choices.
What is important to remember here is that electoral responsiveness to government’s
economic leadership is not solely a product of extraordinary economic circumstances; cultural
factors also play a key part. It is important to pay attention to the way the interplay between

37
economic situations and cultural legacies predisposes voters to identify office holders as
politically liable for any amelioration or misfortunes undergone under their administration, a
linkage that is critical in validating the role of economic performance as decisional clue. As well,
the content of economic clues must not be limited to those of national scope, since proximity is
likely to make personal financial conditions an important information shortcut. To the extent that
individuals’ attitudes toward national economics and their own personal fortunes are based on
deep-seated notions of the role of the state and the government’s responsibility, electoral
reactions to pocketbook situations are as likely to occur as reactions to larger societal realities.
On average, 61.2 percent of voters hold the incumbent accountable for the country’s
financial situation. This figure is based on eleven observations for which data are available, with
a range between 48 (Perú in 1985) to 79 percent (Uruguay in 1994). (Comparability between
observations is somewhat conditional due to slight differences in question wordings; for sources
and wordings, see Appendix F.) Alternative sources of attribution, such as the opposition, fellow
citizens, or external actors, constitute, on average, less than a third of the responses. Attribution
of responsibility for personal financial conditions is also directed to the government. Data
available for only five observations render an average of 71.5 percent of the public holding the
incumbents liable for personal fortunes (Batoba Survey 1983; Datos S.A. 1988). Altogether,
surveys reveal a public sensitive to and likely to rely on certain economic clues in order to pass
judgments on the merits of the administration in power.
Non-Economic and Democratic Performance Clues.
A lasting situation of economic disarray, with the disorganization of everyday life it
carries, also influences the extra-economic dimensions of government performance. As galloping
price increases rapidly drain budget allocations, fiscal revenues of the state collapse with
recession, and monetary reserves evaporate with rising debt payments, the government is left

38
with minimal resources with which to govern. At the same time, high inflation, recession and
unemployment represent a direct threat to people’s own material well-being, making their
dependence upon the social intervention of the state more critical (see Nelson 1990). As high
inflation speeds up the devaluation of money, it also depreciates power among rulers and
political confidence among voters (Portantiero 1985). Accordingly, under extraordinary
economic conditions, the quality of government performance in extra-economic domains, such as
social policy-making and the consolidation of the political order, becomes highly constrained.
This does not mean, however, that extra-economic concerns are mere projections of what
occurs in the realm of personal or national financial states, or that they become peripheral to
voters’ concerns. Rather, heightened by the economic crisis, they may become even more central
to voters, since they may now appear closer to the practical notion of what effective government
is. If due to macro-economic constraints social policy cannot be effective, voters may choose to
react electorally to such incapacity rather than to the original structural limitations, since the
ineffectiveness of social policy is closer to the perceptions and actual needs of individuals and
therefore more likely to be translated into key decisional clues. Similarly, if economic adversity
becomes so critical that takes the form of citizens waking up to news of looting, food riots,
wildcat strikes, and urban violence, the ability of the incumbent to create order out of chaos and
thus ensure social and political stability is bound to take precedence as a decisional clue vis-à-vis
the more distant macro-economic antecedents of those problems.
Government performance presents as many opportunities for the creation of decisional
clues as there are roles inherent in public office and standards for judging administrations. In the
non-economic domain, social policy and political stability are two critical dimensions. The first
concerns ordinary matters related to government’s management of non-economic issues. The
second dimension relates to matters that involve a test of the governance capabilities of those in
office, in light of events connected to the existence and survivability of the socio-political order

39
(e.g., violence, wars, democratic consolidation) or events that can serve as an opportunity to
dramatize the incumbent’s political commitment to maintaining the order (e.g., corruption, crime,
foreign events). Both matters are interlocked in the notion of political leadership, which
constitutes another critical decisional clue that voters are able to rely upon.
There is another aspect of government performance that, although in permanent dialogue
with the notion of political leadership, entails a specific dimension of management: the extent to
which the administration promoted democratization. The results obtained in this area are relevant
in light of the original post-authoritarian agenda. On the other hand, the very event of re-
democratization in the region under inauspicious structural conditions has generalized the belief
among scholars that political choices involved a change in political values, with new priorities
focused on the advancement of political rights and civil liberties (see Flisfisch 1983; Mainwaring
and Viola 1984). Thus, privileging democratic performance as a decisional clue, Remmer
concludes that “democratic goods may factor heavily into the calculus of voters, allowing elected
leaders, particularly those emerging from a background of dictatorship, to maintain popular
support despite acute economic crisis” (1991: 779).
While this argument suggests that voters’ notion of utility may include an interest in
deepening the democratic quality of the political system, it cannot rule out the fact that
cumulative expressions of socio-economic disorder have usually gave way to demands for
strong-handed responses by the government. This balance was illustrated by cross-national data that
placed both democratic deepening preferences such as expanded freedom of speech and people’s
involvement in public affairs, and authority consolidating leanings interpreted as order maintainance, within
close range of each other as the top public preference across time (World Values Study II, 1990-1;
LatinoBarómetro I, 1995).15
15 The information available for Argentina, Brazil, Chile and Mexico pointed out that, on average, 35.5 percent gave exclusive priority to the democratic deepening preferences in 1990-1 and 33 percent priviledged order maintainance. Five years later, the balance for the same group of countries was 36.5 and 28 percent, respectively.

40
As a result, one has to admit the unfolding of a trade-off of priorities in the public mind
between the promotion of political rights and freedoms and the imperative of governability and
maintenance of the public order. This last tendency takes on a particular connotation when set
against the broad picture of the political culture of Latin Americans. If it is true that democratic
transitions were paralleled by growing mass conformity with the idea of a democratic order, this
commitment has revealed itself both greater at the abstract level than in regards to specific
principles and situations, and conditional to the practical challenges faced by the public order.16
A tension raises between the inclination to put a premium on democratic deepening and a
willingness to reward strong political authority when confronting public turbulence, which
usually takes the actual form of a confrontation between a style of popular leadership based on
democratic-spiritedness and another one based on the goal of order preservation. Conciling both
highly demanded qualities yields the ideal notion of political leadership; however the region
history too often demonstrated that the goal of strengthening political authority substracted,
rather than co-existed with, opportunities to deepening democratic guidance (Torre 1993).
Consequently, the issue is not whether Latin Americans endorse democratic or authoritarian
regimes, but rather whether their notion of democracy encompasses a claim for liberties and
freedoms as great as that for order and authority. Whether democratic performance becomes a
relevant decisional clue, as a result of either progress in a pluralistic and liberal direction or
against this to accomplish goals of law-and-order by authoritarian means, remains an empirical
matter needing investigation.
Leadership Clues.
Leadership considerations have always been granted a privileged place with regards to
the political behavior of Latin Americans, with both cultural and institutional factors pointing to
16 Empirical evidence for particular countries is found in Booth and Seligson (1984), Torres (1985), Cros-

41
its significance. Morse suggests that under the circumstances such as those found in Latin
America in the 1980s, “given conditions of political inexperience and social disorder, only strong
personalist leadership could institutionalize government” (1992: 89; italics in original). This
formula has consolidated itself around a leader-centered rule and highly personalistic politics,
taking the form of a strong presidential system. Rooted in the caudillista legacy of post-
independence times and the blessing of hierarchical authority by Catholicism, personalized
leadership remains a key element to understanding mass political behavior in the region (see
Dealy 1992). The president’s management of non-economic matters is, in fact, the most visible
shortcut to inform individuals about existing leadership qualities.
The pragmatic use of leadership clues in voting is far from being solely the product of
cultural legacies and institutional formulas. Nor is it merely the result of the president’s actions
or omissions when confronting the challenge of economic uncertainty and instability. Even
though it was stressed earlier that extraordinary economic times rapidly raise demands for strong
leadership, this does not mean that voters turn only to this clue in the face of turmoil. Since
leadership qualities involve a plurality of expressions, such as policy initiatives, audacious
projects, law-and-order accomplishments, and approval-boosting events by the president—all, of
course, conducive to the belief that power is being exercised and governability is being forcefully
sought—presidential popularity should be seen as a variable construct based in multiple sources
(see Table 3.1).
An initial look at survey data17 reveals that, regardless how much economic
disorganization and socio-political instability beset society, there has been a tendency to put a
premium on strong leadership. Measured in net scores, those privileging a heavy-handed rule
outpaced those opposed to it in most countries. In 1988 in Argentina, there were almost two
Beras (1986), Catterberg (1991), Seligson and Booth (1993). 17 The question reads: “There are people who say that some heavy-handed government is necessary; others say that there is no need for a heavy-handed government. What opinion comes closer to yours?”

42
people in favor of heavy-handed government for each person against it; in 1995, the ratio was
tied, and pretty much the same happened in México in that same year. In Brazil in 1988, the ratio
for tough government was sixteen in favor for each one opposed, but in 1995, the ratio shrunk to
less than two to one. In Chile and Uruguay in 1988, there were fewer people in favor of strong
leadership than otherwise, something like six for every ten opposed. By 1995, the situation
reversed: among Chileans, more than two were supportive of a heavy-handed government for
every one who was not; among Uruguayans, both positions were tied. Among Peruvians and
Venezuelans in 1995, the preference was clearly pro strong leadership: about six and four were
pro authoritarians for each individual who was not, respectively (Consorcio Polis 1988;
LatinoBarómetro I 1995).
As the data suggest, there is nothing like a linear relationship between popular leadership
and democratic leadership. Trade-offs are always present. Popular leadership may result from
problem-solving abilities of the incumbent or progress accomplished towards political stability,
but it may also result from mere theatrical displays of authority by the president. The logic
followed by the public in assessing the popularity of their presidents resembles the one depicted
by Huntington about the dilemma of societies in transition: leadership is endorsed not so much
for its quality as it is for its quantity. What matters, especially after the experience of economic
chaos and socio-political instability, is how much governability and ability to rule the incumbent
is able to impose.
Carrión’s (1998) empirical analysis of the basis of presidential popularity in Perú clearly
suggests this is the case for people’s reaction to Fujimori’s leadership. While the economy was
still in dire straits, poverty was on the rise, and terrorism remained active, the president’s
approval rating started to rise steadily. The appreciation of his leadership did not derive from
performance records but from matters exogenous to the management of the ordinary policy-
making process, namely, Fujimori’s furious attack on highly discredited institutions such as the

43
Congress and the judiciary, both of which he accused of being a hindrance to the development of
the country and the source of political iniquity (see Carrión 1998: 10–12). This example brings
attention to the extra-economic nature of presidential popularity. In fact, it is very telling that the
handful quantitative studies of popularity functions conducted for Latin American countries have
all been puzzled by the same paradox: why the president’s approval increased (or decreased) if
economic improvements (or failures) did not take place (see Canzani 1995: 8–9; Carrión 1998:
11; Villareal 1995: 2–3, 8–9). The answer is simple: presidential leadership does not depend
solely on economic performance. And in actuality, this extra-economic dimension of the
president’s popularity has always been there to be detected whenever exploring sources of public
approval other than merely economic outcomes (see Rius 1992; Villareal 1995; Stokes 2001).
In the case of Perú, Carrión (1998: Table 2) shows that between late 1980 and mid-1993,
the largest partial effect on popularity is due to “honeymoon” influences involving considerations
of political legitimacy and trust. Stokes (2001), who studies Fujimori’s first administration
(1990–95), concludes that political events such as the self-coup holds the largest impact on
explaining mass approval. Analyzing presidential approval in Uruguay between 1986 through
mid-1992, Rius (1992: 30–31) concludes that “honeymoon” cycles as well as the partisan origin
of the government account better than economic indicators for the fluctuations in public support.
In conclusion, one can say that leadership clues are likely to articulate people’s choice as
a result of cultural predispositions, enhanced by the personalistic features embedded in the strong
presidential system that characterizes the region. Voting by following such clues involves a
“political referendum” on the leadership abilities of the incumbent. At the heart of that
referendum is not a decision between policies or economic performances. Instead, the
referendum is based on the ruling abilities of the incumbent force as personified in the president,
abilities that are extra-economic in nature, since they are about making decisions and providing a
sense of control and initiative. How efficient the incumbent has been in providing this general

44
feeling of public reassurance is what reinforces the popularity of the president and identifies his
or her political leadership, which, in turn, is what shapes the electors’ decisions at the polls.
Candidate Clues.
Whatever information shortcut that long-term forces (such as class positions and parties)
or short-term ones (such as performance and leadership) fail to provide may be compensated by
the personal and political attributes of the contending candidates. To begin with, candidates are
more easily identifiable than parties, which helps in the process of developing empathy or
aversion. In the period under study here, while verbalizations of party identification (with either
the incumbent or its major opposition) rendered a median value of 26.5 percent, those embodying
positive views of the top two rivaling candidates (the incumbent and his or her major contender)
prompted a median response by 38 percent.18 Contrasting the median proportions of survey
respondents identifying themselves with the incumbent party (24 percent) and expressing
supporting views of the incumbent candidate (45 percent) points in the same direction.
Indeed, since candidates remain untouched by longer structural trends, show a limited
dependency on socialization processes (only to the extent that some of their attributes could
acquire political meaning), and are capable of weathering the changes in performance, they
represent one of the less cognitively demanding and more readily available clues upon which
voters may orient their decisions. Candidates further benefit from the personalistic features of
political competition, since electioneering practices and media coverage of campaigns in Latin
America increasingly tend to place the candidate’s persona at the center of the contest (see
Skidmore 1993).
18 These results, however, should be taken cautiously, since multiple responses were possible in some of the surveys these data come from. A comparison of incumbent party sympathy and incumbent candidate sympathy should offer a more accurate description of the existing gap between the two in terms of identifiability and, as a consequence, practical utility as decisional clues. For sources of both measures, see Table 4.2.
45
Most importantly, the cultural traits and the nature of the presidential office lead voters
to highlight leadership attributes and personal biographies. Candidate-centered elections are
congenial to presidential systems since “the presidential candidates do not need and often do not
have any prior record as political leaders” (Linz 1994: 11). In Linz’s view, candidates “may not
be identified with a party with an ideology or program and record .... The choice is often based
on an opinion about one individual, a personality, promises, and—let’s be honest—an image a
candidate projects” (1994: 11; italics in original). If this interaction of institutional design and
campaigning style is extremely functional in eliciting voters’ candidate-centered calculations, it
is even more so under conditions of financial distress. Generalizing to the whole region,
O’Donnell describes presidential elections as contests where “presidents get elected promising
that they—strong, courageous, above parties and interests, machos—will save the country.
Theirs [will be] a ‘government of saviors’ (salvadores de la patria)” (O’Donnell 1992: 12; italics
in original). Voters are therefore asked to choose the individual who is most fit to take charge of
the country’s destiny, leaving considerations such as party affiliation or class identity aside.
The peculiar advantage of candidates’ attributes as decisional clues is expressed, for
example, by the fact that candidates outperform political parties as factors explicitly motivating
the choice of electors. Survey data in seven different contests show that candidates are often the
primary criterion of decision of voters vis-à-vis political parties: on average, voters are twice as
likely to refer to candidates than to parties as sources of decision.19 Interestingly enough, if at
first the data may suggest a correlation between the magnitude of this ratio and the persistence of
electoral politics (with the sole exception of Panamá), longitudinal data from Brazil leaves this
19 The values were as follows: in Argentina in 1989, 55 percent for candidates and 38 percent for parties; in Brazil in 1989, 30 and 5; in Chile in 1993, 43 and 11; in Colombia in 1982, 22 and 14; in Costa Rica in 1994, 45 and 28; in Guatemala in 1985, 44 and 17; in México in 1994, 19 and 38; in Panamá in 1994, 16 and 23; and in Venezuela in 1993, 40 and 36, respectively. The sources are A&C of Argentina (March 1989); Opinião Pública (1993, 1: 20); CEP of Chile (October 1993); CNC of Colombia (November 1981); CID/Gallup of Costa Rica (November 1993); Belden&Russonello (October 1985); Asesoría Técnica de la

46
impression unsettled. From the opening elections of 1982 to the 1989 presidential elections,
national samples of Brazilians were asked to explain their choice as based on parties or
candidates. The pattern is rather clear: in 1982, the pro-candidate ratio stood at 1.2; in 1985, it
went up to 3.8; by 1988, it was 3.2; and by 1989, it picked up to 5.7 (Opinião Pública 1993, 1:
20). As a corollary, one could say that rather than materializing the influence of partisan cues, the
development of democratic politics created a more beneficial landscape for the consolidation of
candidates’ attributes as key sources of decision.
Also, candidates can be expected to remain more salient not just as a result of the
absence or weak presence of factors such as parties, but ironically by virtue of their very
presence. If it is true that presidential elections, by their very nature, are contests centered on the
quality of political individuals, a focus on personalistic features does not necessarily imply open
hostility to political parties. Candidates may benefit from exploiting their public persona, as well
as from relying on their linkages to partisan structures. In some ways, this duality qualifies the
tendency to associate rising partisan independence with the emergence of political outsiders as
candidates, illustrating how some strong candidacies are built by stressing “anti-party”
sentiments (e.g., Collor in Brazil, Fujimori in Perú, Chávez in Venezuela). But one should not
miss how other strong candidacies may successfully compete by free-riding on the additional
recognition effect provided by parties (e.g., Menem in Argentina, Caldera in Venezuela). Parties
may provide a “surplus” benefit in making candidates the core decisional clue of voters.
One way of providing empirical evidence for such relationships is using Pearson’s
correlation coefficient which measures the degree of co-dependence between our available
measures of candidates evaluations and partisanship20. According to the data, sympathetic views
Presidencia de México (August 1994); CID/Gallup of Costa Rica (February 1994); and Universidad de Zulia of Venezuela (June 1993). 20 The coefficient ranges between +1 to –1, with values close to either extreme meaning that the variation in the first measure (say, opinions about candidates) is highly dependent of the variation observed in the

47
of the incumbent candidate achieve a rather high Pearson’s correlation of .67 with the personal
identification with the ruling party, and a somewhat moderate correlation of .43 with an
aggregate measure of incumbent party strength (see Chapter 4). Conversely, Pearson’s
correlation between appraisals of the major opposition contender and partisan identification with
the opposition hits a coefficient of .73, while the correlation of the former with the party strength
measure for the major opposition force reaches a coefficient of .62. A summary portrait of the
connectedness between candidate-centered guidelines and partisan clues is achieved by
correlating the net differences of each variable: the Pearson’s coefficient reaches .75 with the
subjective measure of net partisanship and .45 with the aggregate measure of net party strength.21
The basic message conveyed by these correlations is that candidates and parties are far
from always competing in a zero-sum game as decisional clues. They may live together as
relevant sources of electoral guidance, although considering the higher visibility of the former,
this can only help candidate clues to become even more accessible and instrumental to voters.
It is clear from the discussion above that voters and electorates can resort to a plurality of
decisional clues upon which to nurture their political choice and that certain decisional clues are
more influential than others in shaping the voting decisions of citizens in Latin America. The
key question is how these clues fare when considering their effects at the same time and what
dynamics can be distinguished under different electoral scenarios. Addressing these issues
requires to shift focus from voter rationality and decisional clues to methodology and theoretical
models of electoral choice, which are discussed in the next chapter.
second measure (say, feelings towards parties). A value close to zero means that both measures are independent of each other, therefore, they lack any significant relationship. 21 In the first two cases the number of observations adds to twenty-three; in the comparison of net differences the number is twenty-two. All coefficients in the range of the .40s are significant at the level of .05; all other estimates showing higher coefficients are significant at the level of .01.

1
Chapter 4: Models of Electoral Choice: Measurement and Empirical Description
Using Models of Electoral Choice to Analyze Elections Data
Electorates confront the moment of decision in a context of opportunities and conditions,
but acknowledging the variety of decisional clues available to them is only one step in helping us
to understand what governing rules trigger their process of electoral choice. It is also necessary to
uncover the structure of the competing explanations derived from a situation of multiple
available sources which is done by modelling the simultaneous influences of decisional clues on
the final decision.
The use of models entail the belief that specific hypothesis underlie the way we make
sense of voting results. Six models of electoral choice can be offered as organized explanations
of the determinants shaping the public verdict at the polls. I refer to these as affirmative voting,
party voting, economic voting, democratic performance voting, political referendum voting, and
candidate voting. These models are then used as the basis of analysis at both the macro and micro
levels. Accordingly, focus will shift to how each model is composed and what empirical
measures are used.
Methodological Considerations
Level of Analysis.
Before specific models of choice can be addressed, certain more fundamental questions
with regard to methodology must be settled. For one, what level of analysis is appropriate when
studying elections? Each of the decisional clues that voters use to make electoral choices not
only reflects special characteristics of the electoral environment, but also permits the articulation
of fairly cogent responses at the aggregate and individual levels. Which of these levels is more
2
useful? Fortunately, the answer is simple: it is only by studying both the aggregate and individual
data—by looking both at the macro and the micro picture—that we can form a clear, accurate
view of elections in the region.
Examining voting choice from both perspectives, macro and micro, has advantages not
afforded by either of the approaches alone. It serves as an occasion to learn about the impact of
objective conditions on political behavior and, at the same time, about the reasoning process
through which individuals make a final decision at the ballot box. This is an extremely useful
strategy in light of the shortcomings of each approach. The great advantage of a macro-level
specification is that it can ignore the idiosyncrasies of individuals and, as a result, offer a
patterned description of the determinants and consequences of the choices undertaken by
collective entities. On the other hand, such analysis supplies half-answers to the question of how
the individual voter reacts to changing circumstances and why people vote the way they do, since
the data do not provide information at the level of the individual. In turn, emphasizing only
micro-level data exposes the analysis to problems of spuriousness and rationalization. Although
these may not be entirely avoided in aggregate analysis either, they can at least be partially
checked by the degree of correspondence one encounters between micro and macro level
findings. Furthermore, in view of the recentness of survey research in Latin America, a
concentration on individual-level studies could only provide very limited information for the
region as a whole. Thus, aggregate and individual analyses must complement each other and help
determine the extent to which decision processes at both levels bring together a consistent
illustration of voting choice in Latin America.
Aggregate-level examination offers insights into the major voting trends and the extent to
which objective conditions and developments influence the electoral fortunes of the incumbent,
as well as the ways in which different institutional and macro-economic contexts interact with
those main effects. In this study, in Chapter 5, I focus on the patterns of voting choice

3
substantiated in forty-one different presidential elections during the period between February
1982 and May 1995. Only competitive presidential elections are considered for analysis. Each
election qualifies as competitive if it allows the effective presence of more than one candidate
and party in the race, no significant social or political majority are formally excluded (Dahl
1971), at least thirty percent of the votes are allocated to the opposition, and it does not represent
a “founding election” (O’Donnell et al., 1986), that is, the election by which democracy itself
was restored. The elections analyzed here satisfy these requirements, though partial exceptions
should be acknowledged for the cases of the 1989 Salvadorean and 1990 Guatemalan elections,
where facilities for left-of-the-center organizations to participate were considerably restricted.
For Colombia, Costa Rica, Dominican Republic and Venezuela, the first contest considered is the
one closest to January 1982.
On the other hand, an examination of the individual-level effects provides an opportunity
to assess the extent to which macro-level motivations are effectively translated into the voter’s
calculus of choice and allows direct observation of how individuals weigh the major factors
structuring their decision. In Chapter 7, I examine the individual process of electoral decision-
making that occurred in three different presidential contests held in Argentina, Perú and Uruguay
between November 1994 and May 1995, each taking place in a distinct context in terms of both
levels of political institutionalization and economic stability.
Context.
Indeed, context is a key factor that must be taken into account. Voters are likely to
follow one particular decisional clue more than another as a result of the structure of
opportunities and incentives provided by the institutional and macro-economic contexts of their
action. But one can hardly assume that everyone will react in the same way under different
political and economic environments. The specific effects of political socialization, party systems

4
and macro-economic circumstances must be considered, as they may influence the voting
decision in radically different ways in different milieu. I examine the impact of context on
electoral behavior and results in Chapter 6.
Incumbent Voting.
As discussed in previous chapters, electoral choice in the region essentially boils down
to voting for or against the incumbent. Accordingly, the focus of our empirical study is
explaining the variation of the fortunes of the incumbent party –thus, the percentage of votes
gathered by the incumbent party will be our dependent variable across this research. Keeping this
in mind, the general model of choice on which all specific models are based, regardless of the
level of analysis chosen, can be stated as follows:
Incumbent Vote=ƒ(Economic Clues, Non-Economic Clues)
which indicates that the incumbent vote-share is a function of the effect exerted by economic and
non-economic clues over voters.
Six Models of Electoral Choice
Considering the discussion in the previous chapter about how, and to what extent,
decisional clues may be effectively present, six models of electoral choice can be distinguished.
These models are derived both from previous discussion by literature and my review of the
performance and leverage of the decisional clues.
Arrayed according to their embodiment of long-term and short-term factors, the models
can be labeled as affirmative voting, party voting, economic voting, democratic voting, political
referendum voting, and candidate voting. Each of these models offers an explanation of voting
behavior that can be tested empirically, either at the aggregate or individual level or both. By
examining elections data through the prism of these models, while at the same time taking

5
context and the basic assumption of incumbent voting into account, we can arrive at
parsimonious explanations of electoral behavior in Latin America. The models presented below
form the basis of the discussion in the following chapters, as data from the elections under study
are examined and the theoretical constructs are put to the test to see which of them can—and to
what degree—account for election results in Latin America. First, however, we must look closely
at the models of electoral choice and the different sets of variables and measurements they entail.
It is these variables that lend themselves to empirical testing and will be examined in subsequent
chapters.
Affirmative Voting.
Voters may define their electoral options by simply repeating prior choices, that is,
deciding their vote “affirmatively” (see McDonald and Ruhl 1989: 14), or rather contrarily,
purposely choosing the alternative to the one in office. Motives are numerous: the high costs of
acquiring and updating political information, the incidence of cultural predispositions favoring
inertial and ritualistic behavior which result from either “a desire not to alienate the powerful”
(McDonald and Ruhl 1989: 14) or a deep-seated adversarial attitude towards government.1 Prior
voting is the variable that, at the aggregate level, captures more substantially the effects of
longer-term factors over the magnitude of public endorsement to incumbents.
The affirmative voting model assumes that electorates as a whole possess some political
memory regardless of the gap between electoral schedules. Also, it takes for granted some
minimal inertia in how generations are politically socialized as a result of their class and other
group positions, even in the face of dramatic and rapid changes in the social structure.
Occasionally, the voter may not be directly moved by class clues or by any other collective
1 For a preliminary discussion of “negative voting” in Brazil and Venezuela, see Guilhon Albuquerque (1992) and Torres (1985). Curiously, rather than interpreted as the other side of the same coin, McDonald

6
attachment or culturally derived source of affirmative or negative electoral conduct, but these
elements may indirectly help to make other considerations, such as economic matters,
candidates’ personal attributes or partisan linkages, more salient. In this case, after controlling
for the effects of other factors, one can expect a reduction in the influence of the affirmative
model.
This model, therefore, represents the success of basic organizations of society in
structuring electoral choice and keeping aggregated cultural orientations in balance, thus
equalizing, if not offsetting, the impact of short-term forces. For grouped data, the model is
empirically described by the proportion of valid votes obtained by the incumbent party in the
previous presidential contest (i.e., prior vote). Therefore, the model represents a temporal, stable
baseline against which to measure the changes wrought by the other short- and long-term effects.
For individual data, this model is assessed by social class of the survey respondent. This
means that it takes the specific form of a class voting model, one which taps the degree to which
electoral preferences covary with individuals’ socio-economic status. The implicit understanding
here is that social class position constitutes a particular variant of long-term factors that entail a
strong stabilization, therefore, highly repeatable, of individual political choices. This variable is
built as a summated index of income, household appliances, and home and car property.
Party Voting.
Since electoral decisions take place in situations where political parties seek to politicize
collective identities, mobilize voting loyalties and conceptualize the basic issue controversies, the
magnitude of support for political continuity depends on the strength to which partisan ties with
the incumbent have developed over time. The more support gathered by the party-in-office over
time, the higher the return in votes that the incumbent group should be able to obtain. A similar
and Ruhl see “protest voting” as an entirely different concept of voting behavior (see McDonald and Ruhl

7
dynamics is granted for the parties in the opposition.
This model posits partisan attachments as long-term, stable, structurally founded political
trends that back up individual political choices. Of course, there is an assumption here that the
opportunity for parties to politicize electorates has been present—a situation that is somewhat
uncommon for countries under review, since most of them held elections against a backdrop of
longstanding authoritarian experiences and a social structure drastically affected by the economic
crisis of the 1980s, which further revamped previous partisan alignments. Moreover, matters
such as how entrenched in the existing political culture political parties are, how publicly
crystallized and stable their policy profiles are, and how seriously they are taken by the very
same politicians running for office are critical in anticipating variations in the efficacy of the
party model.
The model is assessed by a single variable named party strength, which represents a
measure of the aggregate level of partisanship as expressed by a weighted average of the partisan
vote gathered by the incumbents at the congressional level, prior and coincidental to the
presidential contest, adjusted for turnout and null and blank votes (see Table 4.1). In principle,
this measure seems to tap more closely a dimension of the structural stability of alignments revealed
in terms of enduring party potency in the electoral arena, rather than an indication of individual
attachments to the incumbent force. Nonetheless, its content validity is confirmed by a Pearson’s
correlation of .55 (significant at p < .01) with an aggregate measure of the partisan sympathies
and leanings expressed by the electorate in pre-electoral public opinion studies (this later
information is available for only thirty-five contests, see Table 3.1).2
A variable called party leanings summarizes the argument of party voting at the individual
1989: 14). 2 A further proof of validity is rendered by another moderate-to-high r= .53 Pearson’s correlation (significant at p < .01) between a measurement of net party strength (i.e., incumbent’s minus major opposition’s) and an homologous measure of net party identification. Obviously, this denotes that the respective values for major opposition party are importantly correlated as well (r= .66, p < .01).

8
level. Admittedly, it does so somewhat poorly, since it is built upon a different measure in each
country. In the Argentinean case, the question asked in surveys directly taps the issue of party
identification. In the case of Perú, however, party voting is estimated by a question about prior
alignments in the 1993 plebiscite on the constitutional reform set forth by the incumbent. Since the
centerpiece of the reform was about allowing the president’s reelection and that position was
only endorsed by the president’s party, this is considered as a valid proxy measure of party
leanings. In the case of Uruguay, the measurement of the degree of party voting is based on the
recall of the voting preferences for the 1989 presidential election. Considering the stability of
partisan alignments in the city of Montevideo for the post-authoritarian period (González 1992),
this variable is taken as a fairly accurate proxy of party leanings. (For survey question wordings
for this and all other individual measures, see Appendix E.)
Economic Voting.
Voters’ sense of satisfaction is critically determined by the economic performance of the
ruling party. Since a good deal of their notion of utility is closely tied to how their individual
and/or collective material situations have fared under a specific administration, and since voters
tend to project past experiences to the future, economic forces can be expected to draw the line
between the worthiness of choosing government continuity or shifting towards a political change.
Thus, in the economic model, voters make their choices as if the election were a referendum on
the incumbent’s economic results.
A basic assumption underlying this model is that electorates are candid in their
appraisals of the economic situation; that is, they hold perceptions which replicate as correctly as
possible the actual situation. However appraised, economic trends serve as a low-cost mechanism
for judging the value of supporting political continuity by means of providing voters with a
partial sense of the “nature of the times” under the incumbent’s tenure. Of course, one has to

9
believe that economic information is easily and accurately available through the media, and that
the media coverage of news ends up being, on average, neither fully adversarial nor fully
deferential.
A more critical assumption for the correct validation of this model is that the state of the
economy is connected to the realm of authorities’ responsibilities. Understandably, unless
officials are viewed as responsible for economic conditions, they can hardly be held accountable
for them. In principle, the traditional importance of the state-centered model of economic
development and well-being provisions, along with the prevalence of a populist mode of income
distribution and material progress in the region (see Harrison 1985; Calvert and Calvert 1989) is
quite likely to secure such connection. Besides the consequences of this upon the region’s economic
culture, the recurrence of hermetic and top-down practices of launching stabilization shocks and the
exercise of strong presidentialism may also help to render this linkage obvious in most people’s
minds. Concomitantly, in view of the cognitive limitations and political traditions of most Latin
American voters, one can argue in favor of a second feature: the development of particularistic ties
based on the exchange of votes for public goods and access to patronage resources of the state in a
context of high information costs. Therefore, one may expect even among some of the least
informed and inattentive members of the electorate, the maturation of a straightforward connection
between private material conditions and a view of the government as responsible for these.
To explore the economic voting hypothesis at the aggregate level, four key variables, all
weighted by the month of the election, can be used.3 Given the high skeweness of most of the
3 Initially, I considered twelve measures for economic activity: real average wages, quarterly, yearly and biannually average inflation rates, hyper-inflation occurrences, inflation rate of change over the year prior to election, economic growth measured on same year as election, as a two-year average and as rate fo change, per capita economic activity rates measured both as levels or rates of change, and the unemployment rate. However, the effects of many of them were poor or problems of collinearity between indicators systematically appeared. Besides, it did not make sense from a conceptual point of view to include all of them. I therefore settled on the four variables discussed here. These variables remain non-collinear to each other, except for the moderate collinearity between both measures of inflation (r= .45, p=.001) and between the biannual average measures of economic activity and inflation (r= .43, p=.002). The decision the weigh them by the month of election follows Remmer’s (1991) strategy, in order to build upon her initial work and to make

10
economic measures, these measures are recoded as categorical variables in order to achieve
distributional normality (coding values in parenthesis)4.
The first variable is the average GDP growth, measured as a weighted average level of
growth of the gross domestic product during the two years preceding the election, which aims to
summarize a long-term measure of economic activity. It is measured as composed of five
possible values, as follows: (1) “high growth” (whenever growth reached 4.5 percent or more), (2)
“slow growth” (between 2.3 and 4.4 percent), (3) “stagnation” (between 0.1 and 2.2 percent)5, (4)
“recession” (between 0.0 and -1.9 percent), and (5) “depression” (-2.0 percent or lower). In
interpreting the statistical correlation between this measure and electoral outcomes, a negative sign
should be read: as GDP rate increases, so does the proportion of votes gathered by the incumbent
party, and vice versa.
The second variable is the average inflation, measured as a weighted average level of
inflation during the two years preceding the election, which aims to capture the effects of price
hikes over the relative long-term. It is also measured as composed of five values, as follows: (1)
“low inflation” (whenever inflation remained at 9.9 percent or lower)6, (2) “medium-level inflation”
(between 10 and 25 percent), (3) “Latin inflation” (between 25.1 and 40 percent), (4) “high
inflation” (40.1 and 180 percent), and (5) “hyperinflation” (180.1 percent or more). At the moment
of examining the impact of this variable upon electoral choice, a negative sign should be read: as
consistent gains in the empirical findings over time and across different number of cases. Sources: The Economist Intelligence Unit for the quarterly assessments of inflation; and the Economic Comission for Latin America and the Caribbean (CEPAL) and the Inter-American Development Bank (IADB) annual reports for all other variables. 4 Square root and logarithmic transformations did not yield much more symmetrical distributions, while other more powerful transformations were avoided given their less intuitive interpretability. 5 The cut-off point around two percent fits the region’s average population growth during the period under consideration, therefore if economic activity adds up to about two percentual points, it means that the per capita rate of growth remained zero. 6 The reader should remind that the economy in Latin America of the 1980s and 1990s was characterized by far higher levels of inflation compared to the rates of today, as well as to the standards of Europeand and North American countries. As a result, cut-off points across values for this measure tend to follow the variable’s natural breaks in its cumulative distribution during this period.

11
inflation lowers, the vote-share of incumbents increases, and vice versa.
The third variable is the level of unemployment, measured as a weighted level of
unemployment during the year preceding the election, which appraises both social policy–related
and individual pocketbook effects. It is also coded in five values, as follows: (1) “low
unemployment” (a rate of 5.9 percent or lower). (2) “moderate unemployment” (between 6 and 8.9
percent), (3) “high unemployment” (between 9 and 11.9 percent), (4) “very high unemployment”
(between 12 and 14.9 percent), and (5) “hyper-unemployment” (15 percent or more). A negative
sign should be read: as the jobless rate remains low, the vote-share of the incumbent increases, and
vice versa. Cut-off points tend to follow the variable’s natural breaks in its cumulative distribution
during these years.
The fourth variable is the inflation rate of change, measured as the difference in
weighted annual inflation rates between the year of the election and the previous one, which
should inform about how dynamic and retrospective-oriented public economic reflexes are. Its
coding is based in seven values and goes as follows: (1) “extreme deflation” (a difference in
inflation across time of -50 percent or more), (2) “strong deflation” (a decrease between -49.9 and -
2.6 percent), (3) “moderate deflation” (between -2.5 and -0.1 percent), (4) “price stability” (between
0 and 2 percent), (5) “moderate inflation increase” (between 2.1 and 10 percent), (6) “strong
inflation increase” (between 10.1 and 49.9 percent), and (7) “extreme inflation increase” (50
percent or higher). A negative sign should be read: as governments succeed in reducing the inflation
rate from the year prior to elections to the electoral year, they can be expected to collect votes, and
vice versa. Cut-off points tend to follow the variable’s natural breaks in its cumulative distribution.
At the individual level, the analysis uses the respondents’ evaluations of the economic
situation, both at the personal and national level, and in relation to the past as much as to the future.
These measures are contained in an almost identical set of questions in the polls for the three
countries considered here. By making explicit the “locus” of reference and the “time frame” to
12
which the economic variables refer, one minimizes problems of spuriousness and temporal
projection (i.e., rationalization) of responses. Each particular question can, then, be viewed as
addressing different dimensions of financial states, namely, retrospective personal, retrospective
national, prospective personal and prospective national. Scholars have shown that these distinctions
involve different types of individual calculations, as well as interactions between cultural frames
and economic orientations emphasizing dissimilar aspects of choice (see Kinder and Kiewiet 1981;
Paldam 1991). This diversity of responses is also a result of different motivating environments;
accordingly, important differences in the effects of each specific version of the economic argument
can be expected as a result of particular properties of the context such as the level of macro-
economic stability preceding the contest. In addition, these distinctions provide an illustration of
how voters actually process economic clues into electoral decisions.
The validity of the economic voting hypothesis is further elaborated by taking into account
people’s evaluation of government’s economic responsibility. As already suggested, unless
fluctuations in the financial states are explicitly politicized in a way that makes voters hold the
party-in-office accountable for them, the effects that impressions about the economy may reveal
about the electoral decision are virtually spurious (see Kramer 1983; Peffley 1985). Thus, one
should observe the kind of interaction between financial considerations and responsibility
attribution that substantiates a connection of the economy to the arena of electoral preferences. This
is done by asking each respondent the extent to which he or she considers the government’s policies
liable for their own and the nation’s economic fortunes. This two-step strategy of assessing the
effectiveness of a model of economic voting looks, first, to determine to what extent individuals
find it necessary to hold the incumbent accountable for economic records before reacting electorally
to these. Second, it offers a description of individual differences in relation to the temporal and
political dimensions that articulate the vote under the premise that different levels of responsibility
affect differently the intensity to which individual may resort to reward or punishment when voting.
13
Democratic Performance Voting.
Transitions from authoritarian rule to electoral democracy in Latin America might have
been the product of elites’ interactions (O’Donnell et al. 1986); nevertheless, they were also
paralleled by growing mass acceptance of the idea of democracy. Some authors even suggest that
democratization of the political culture took precedence over the democratization of the political
systems (see Flisfisch 1983; Mainwaring and Viola 1984). Accordingly, given the context of
collective reconstruction of democratic routines and the regained salience of political and civil
liberties, one should in principle expect that electoral outcomes would reflect a response to how
successfully the ruling party has made progress towards deepening citizenship. This suggests that
the freer and more pluralistic the environment in which a government holds the ongoing election,
the greater the support it will receive.
Nevertheless, support may not be conditioned by the extent to which the average voter
qualifies the incumbent government as democratic or authoritarian, since these values are not
upheld as a clear-cut polarity at the mass level. A critical premise is therefore that voters may
still vindicate deepening democratization as a value but, in the face of seriously perceived
challenges to the survivability of the public order, reward more strongly a government that
displays authority, even if this entails some degree of authoritarian reversals in the sphere of
rights and liberties. By the same token, voters who face successful incumbents in the realm of
democratization may still turn their backs on them in response to an unmet demand for stronger
authority, often elicited in the face of accumulating threats to political governability.
In assessing the effects of democratic performance, three variables are considered. One is
the political climate during the year of the election, measured by an additive index of the
assessments on political rights and civil liberties as reported by The Freedom House annual
reports (Gastil 1978–91; Karatnycky 1992–95). This index ranges between 1 (high respect for

14
freedoms and liberties) to 10 (low respect for freedoms and liberties). In interpreting correlation
results between this measure and voting outcomes , a negative coefficient implies that the more
free, pluralistic and inclusive the political order is in the electoral year, the more votes are
harvested by the incumbent.
The second variable is the change in the political climate between the year preceding the
election and the first year of the incumbent in office, measured as the change in the additive
index of the political freedoms and civil liberties as reported by The Freedom Forum annual
reports (Gastil 1978–91; Karatnycky 1992–95). The higher the negative values, the greater the
steps in a democratic direction; the higher the positive values, the more authoritarian the
performance of the government. In interpreting results, a negative sign implies that as
governments deepen democratization (compared to the level they inherited), political support
increases; conversely, a positive sign means that the public reacts favorably as governments get
tougher.
The third variable is the level of ideological polarization between major parties
contending for office, as ascertained by Dix (1989) and Mainwaring and Scully (1995). This
indicator is measured by four values: (1) “low polarization” (i.e., Costa Rica across the 1980s-
1990s); (2) “moderate to low polarization” (i.e., Argentina, Colombia, and Honduras, mainly);
(3) “moderate to high polarization” (i.e., Bolivia, Dominican Republic, Ecuador, Mexico, and
Venezuela); and (4) “high polarization” (i.e., Brazil, Perú, El Salvador and Nicaragua) (see Table
4.1). In interpreting results, a negative sign suggests that as the level of polarization increases,
electoral ratification of the incumbent shrivels.
Due to the lack of appropriate data, this model cannot be tested at the individual level at
this time.
Table 4.1

15
Aggregate Measurement of Party Strength and Party Polarization
COUNTRY
(Election Month/Year)
PARTY STRENGTH
(%)*
POLITICAL
POLARIZATION**
Argentina (5/1989) 46.1 2
Argentina (5/1995) 47.5 2
Bolivia (7/1985) 36.2 3
Bolivia (5/1989) 33.1 3
Bolivia (6/1993) 54.6 3
Brazil (11/1989) 77.4 4
Brazil (10/1994) 31.2 4
Chile (12/1993) 56.7 3
Colombia (5/1982) 55.7 2
Colombia (5/1986) 41.2 2
Colombia (5/1990) 49.2 2
Colombia (5/1994) 54.0 2
Costa Rica (2/1982) 47.3 1
Costa Rica (2/1986) 57.9 1
Costa Rica (2/1990) 50.9 1
Costa Rica (2/1994) 50.9 1
DominicanRep(5/1982) 52.7 3
DominicanRep(5/1986) 51.7 3
DominicanRep(5/1990) 46.6 3
DominicanRep(5/1994) 34.2 4
Ecuador (6/1984) 42.0 3
Ecuador (1/1988) 19.7 3
Ecuador (5/1992) 19.4 3

16
El Salvador (3/1989) 36.7 4
El Salvador (3/1994) 46.4 4
Guatemala (11/1990) 51.0 2
Honduras (11/1985) 53.7 2
Honduras (11/1989) 50.0 2
Honduras (11/1993) 55.5 2
México (7/1988) 73.0 3
México (8/1994) 52.0 3
Nicaragua (2/1990) 63.5 4
Panamá (5/1994) 40.3 2
Perú (4/1985) 54.4 4
Perú (4/1990) 59.4 4
Perú (4/1995) 55.0 4
Uruguay (11/1989) 41.4 3
Uruguay (11/1994) 39.4 3
Venezuela (12/1983) 42.2 3
Venezuela (12/1988) 56.5 3
Venezuela (12/1993) 48.3 3
* The party strength represents a weighted average of partisan support obtained by the incumbent party (or
coalition) in the previous two congressional contests. It represents the percentage of valid votes going to the
ruling party for the lower house, weighted by turnout. For a few cases without data available and holding a
proportional representation system (for example, Brazil from 1990 onward), I use the proportion of partisan
seat-share which should denote a very close approximation to the actual percentage of votes received.
**Scores for political polarization follow Dix’s (1992) and Mainwaring and Scully’s (1995) classifications.
Sources: Nohlen (1993); Keesing’s Record of World Events (various years); Dix (1992); Mainwaring and
Scully (1995).
17
Political Referendum Voting.
Voters do not only seek (and react to) material results. They also pursue the fulfillment
of expressive and symbolic goals, and an important portion of these consists of people’s
fascination with the qualities of political leadership exhibited by the heads of government.
Through their displays of commanding authority before domestic and international conflicts,
problem-solving qualifications in the realm of social policy and state affairs, and political
dramatization of daily events, presidents convey an impression of ability to rule. In this way, they
transmit a sense of psychic security about where the country is heading and suggest what
assurances people may have if they (or their “heirs”) stay in office for the coming term.
This makes of the election a political referendum, that is, a contest on the political
leadership revealed by the incumbent and the impressions transmitted in regards to the overall
national quality of life achieved during the incumbent’s tenure. Accordingly, such elections are
not a contests based solely on personal charisma, issue mobilization, or isolated policy. The
assumption is that cultural factors (already discussed in Chapter 3) facilitate the relevance of
leadership clues and, heightened by moments of economic and political instability, may create a
climate conducive to rewarding political dramatization, bold institutional and international
initiatives, and/or a caudillista style of rulership.
The impact of the political referendum model is measured by a single variable:
presidential popularity (see Table 4.2). In order to avoid problems of endogeneity and
simultaneity bias, the variable to be used in the aggregate level analysis is the residualized
version of the approval of the president’s performance after being regressed against the four
macro-economic indicators previously described. In the elections studied here, economic factors
explained thirty-three percent of the variance of presidential popularity. (The only significant
effect was accounted by the inflation rate of change.)
18
For the individual data, presidential approval is first regressed against the set of basic
economic evaluations, and then the “economics-free” residualized values of the variable are used
as predictors. For Perú, the economic variables accounted for twenty-eight percent of the
variance of presidential popularity; for Argentina, for forty-three percent of the variance; and for
Uruguay, for only twelve percent.
It is important to note that presidents sought reelection in only five of the contests
reviewed here (and data for presidential popularity is available for only four of these), which
minimizes the problems of concept overlapping between support for the president and electoral
endorsement. Also, since most measures of presidential popularity were taken in a period
between three and six months from the elections, one can safely regard these data as estimating
the long-term governmental leadership aspects with a minimal distortion produced by short-term
events or campaign-related effects.
Candidate Voting.
Since elections are contests between individual politicians who tend to dramatize their
public persona as a global synthesis of the major controversies of the time, the personal attributes
of candidates play an important role in determining electoral outcomes. The media’s focus on
personal character and the “horse-race” aspects of the election only reinforces candidates as
decisional clues. Furthermore, cultural traditions of fascination with charismatic personages
permit candidates’ personal attributes to become a major source of decision.
All things considered, the more visible the candidate is, the higher will be his or her
electoral advantage over the party’s, and the more votes he or she can be expected to collect.
Still, this does not indicate a zero-sum kind of tension between candidates and partisan clues,
since the former’s effect can only anticipate greater support in votes to the incumbent if some
degree of party ties are already developed.

19
To assess candidate-related influences two measures can be used. One is an index of net
candidate salience, which measures the net difference (between the incumbent and the principal
opposition) of an additive index assessing the historical timing of the candidate’s party (that is,
whether the party was created as an institutional vehicle for personal electoral purposes or had an
institutional history traceable years before the election), the extent to which the candidate’s
leadership has been contested in primaries (or whether it emerged undisputed), and the nature of
the candidate’s previous personal and professional records (that is, whether he or she could resort
to some reservoir of prestige based on family or office-holding backgrounds). The basic
candidate salience index ranges for incumbent and opposition between 0 (“no salience,” as when
(a) the candidate’s party had a history prior to the restoration of democracy or 1982, (b) the
candidate had to go through a process of primary selection or double simultaneous vote, and (c)
he or she could not ride upon any extraordinary personal or professional antecedents) and 3
(“high salience,” as when (a) the candidate’s party was created exclusively for the current
electoral race, (b) he or she did not have to test his or her leadership credentials against other
would-be candidates within the same political force, and (c) the candidate could take advantage
of public knowledge of him or her as former president of the country).7 The net candidate
salience index can range from +3 (“high salience” for the incumbent candidate8) to -3 (“high
salience” for the opposition candidate). (See Appendix H for full results.) As such, this index
attempts to tackle the extent to which personality-related and charismatic forces were present
and, if they were, whether they had any influence at all. In interpreting results correlating this
index with electoral outcomes, a positive score means that the ruling party benefited electorally
7 Whenever the candidate was son or daughter of any previous president or he or she has held a key ministerial or internationally prestigious office during the period immediately prior to the administration voted in, the score assigned was equivalent to 0.5. A similar score was given to candidates facing only one competitor at the intra-party level, and whenever the party’s historical life dated from the post-authoritarian period onwards, yet preceded the election in progress. 8 This situation is not verified in this sample since it would suppose that the party or coalition in government has been completely dismantled and a wholly new force had been created for the specific electoral occasion.

20
from having a highly candidate-centered strategy of competition, compared to the one displayed
by the opposition; conversely, a negative value shows that the opposition successfully ran the
contest upon a candidate-centered campaign.
Table 4.2
Public Opinion Indicators of Presidential Popularity and Measures of Net Candidate Advantage
and Net Candidate Evaluation, In %
COUNTRY (Election
Month/Year)
Presidential
Popularity
Net Candidate
Advantage
Net Candidate
Evaluation
Argentina (5/1989) 44 -5.9 -8
Argentina (5/1995) 42 6.6 N/A
Bolivia (7/1985) N/A -16.6 N/A
Bolivia (5/1989) N/A 0.9 N/A
Bolivia (6/1993) 21 -25.8 -18
Brazil (11/1989) 8 -54.6 N/A
Brazil (10/1994) 40 13.2 N/A
Chile (12/1993) 58 17.1 42
Colombia (5/1982) 48 -11.8 N/A
Colombia (5/1986) 13 -16.4 -11
Colombia (5/1990) 51 14.3 N/A
Colombia (5/1994) 54 -12.2 N/A
Costa Rica (2/1982) 4 -17.2 -21
Costa Rica (2/1986) 51 -6.0 1
Costa Rica (2/1990) 75 -5.2 2
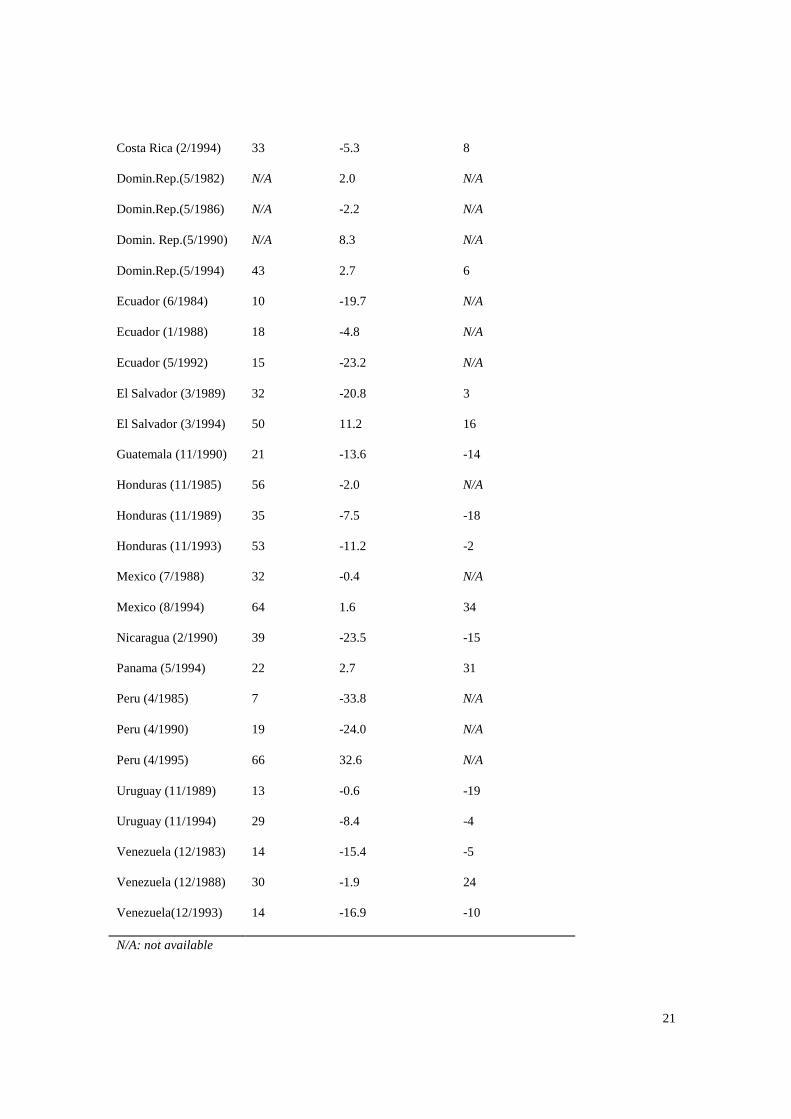
21
Costa Rica (2/1994) 33 -5.3 8
Domin.Rep.(5/1982) N/A 2.0 N/A
Domin.Rep.(5/1986) N/A -2.2 N/A
Domin. Rep.(5/1990) N/A 8.3 N/A
Domin.Rep.(5/1994) 43 2.7 6
Ecuador (6/1984) 10 -19.7 N/A
Ecuador (1/1988) 18 -4.8 N/A
Ecuador (5/1992) 15 -23.2 N/A
El Salvador (3/1989) 32 -20.8 3
El Salvador (3/1994) 50 11.2 16
Guatemala (11/1990) 21 -13.6 -14
Honduras (11/1985) 56 -2.0 N/A
Honduras (11/1989) 35 -7.5 -18
Honduras (11/1993) 53 -11.2 -2
Mexico (7/1988) 32 -0.4 N/A
Mexico (8/1994) 64 1.6 34
Nicaragua (2/1990) 39 -23.5 -15
Panama (5/1994) 22 2.7 31
Peru (4/1985) 7 -33.8 N/A
Peru (4/1990) 19 -24.0 N/A
Peru (4/1995) 66 32.6 N/A
Uruguay (11/1989) 13 -0.6 -19
Uruguay (11/1994) 29 -8.4 -4
Venezuela (12/1983) 14 -15.4 -5
Venezuela (12/1988) 30 -1.9 24
Venezuela(12/1993) 14 -16.9 -10
N/A: not available
22
Sources: See Appendix G; Nohlen (1993); Keesing’s Record of World Events (various years).
The other measure is the net candidate advantage of the incumbent, which assesses the
net difference (between the incumbent and the principal opposition) in terms of the vote
difference obtained at the congressional level (as measured by a weighted average like the one
described for party strength) and at the presidential level. This second index assumes, then, that
the edge in votes obtained by the presidential ticket compared to the same party’s congressional
ticket represents the existence of unambiguous candidate-related effects linked to the individual
biography or political position. Thus, if positive, the higher the scores of the correlation between
this measure and the vote percentage received by the ruling ticket, the greater the incumbent
candidate’s effect; if negative, the higher the scores, the greater the opposition candidate’s effect.
In Chapter 5, I assess this variable in two forms: initially, for all forty-one cases, I use the
original values. When I replicate the analysis testing the political referendum model (for a
smaller number of cases), in order to remove collinearity with presidential popularity and
inflation rate of change,9 I use the residualized version of the net candidate advantage measure,
after it has been regressed against these two variables.10
As an indirect way of probing for this measure’s content validity I tested a correlation
with an aggregate indicator of net candidates’ evaluation drawn from public opinion studies for
twenty-two electoral occasions. Coefficients indicate that each of the two indexes used (net
candidate saliency and net candidate advantage) entails different meanings.11 Thus, whereas net
9 Pearson’s correlation coefficients stood at .57 (p < .01) and -.37 (p < .01), respectively for a total number of thirty-six cases. 10 These two variables accounted for over thirty-four percent of the variance of the original variable. In standardized coefficients, presidential popularity and the differenced inflation rate yielded values of .41 and -.38, respectively (both significant at p < .01). 11 Pearson’s correlation between the net difference in candidates evaluation and net candidate advantage stood at an impressive r= .74 (significant at p < .01). Conversely, correlation with net candidate salience was merely r= .08 (not significant even at p < .10). In both cases, coefficients were calculated upon a total

23
candidate advantage seems to identify the extra-partisan appeal of a ticket (i.e., how much
candidates are preferred over parties), net candidate salience seems to ascertain what it takes for
an individual to reach the position of candidate of a party.
At the individual level, I skip this test, because in two of the contests the presidents
sought reelection (which would have made this measure highly collinear with any evaluation of
candidates), but also because of lack of data availability.
Each of the models of electoral choice presented above offer a potential argument to
explaining why people—at both the aggregate and individual levels—vote the way they do. In
order to make a transition from the theoretical discussion of electoral determinants to the
empirical analysis of the underpinnings of results at the ballots, focus was placed on how each
model is likely to affect the voting outcomes and, specially, how each model can be observed and
identified in the context of Latin American politics and the available data.
The questions arising, now, shift to the capabilities of each of these models to account
for the electoral outcomes recorded in the region since the process of democratization unfolded.
What is the prevalent order of their mutual relationships? In what way or ways do they interact
with different contextual conditions? To answer these questions, we must test each of the six
models in absolute and relative terms, probing their explanatory power under various politico-
institutional and macro-economic environments.
number of twenty-two cases. Pearson’s correlation between both aggregate measures, for all forty-one cases stood at low r= .26 (significant at p < .06).


25
Chapter 5: Aggregate-Level Analysis of Electoral Outcomes in Latin America
From the early 1980 to the mid-1990s, hopes remained high in the new democracies of
Latin America that elected leaders could help the economy become stronger, governments could
behave more democratically, societies could get better organized across party lines, and the
quality of political outcomes would more closely resemble people’s preferences. However, as the
road towards regularization of electoral rule and democratic consolidation often deviated from
this ideal path, building political support was not an easy task. What accounts for the differences
in support achieved by the incumbent forces? Which models of voting behavior are most
efficient in capturing the variety of motivations and clues guiding electorates in Latin America?
In this chapter, I analyze data from forty-one competitive presidential elections to
address the question of what forces determine the voters’ choices for political continuity. After
explaining my methodology, I look at the general characteristics of the elections under
examination. I then examine the effectiveness of each major argument of voting in explaining
electoral outcomes. In particular, I focus on the issue of whether voters articulate their decisions
around what the economy dictates or whether they resort to other explanations of non-economic
nature. In the next chapter, I present a follow-up discussion of how voting patterns behave under
dissimilar contexts.
Methodology
At the aggregate level, the dependent variable is assessed by the share of the valid votes
received by the incumbent party or coalition. (In all cases with run-off elections, the data refers
to the first round; similarly, whenever a coalition of parties constitute the incumbent force, the
summed proportion of votes obtained by each single party is considered. See Appendix A) This
method offers a direct measurement of the degree to which electorates back up an option for

26
political continuity or change, and it is one of the most standard ways in which the study of
voting functions has been operationalized. If, as argued, voters exert only incumbency-oriented
voting, it will suffice to know what leads them to endorse the party in office or reject it.
Forty-one competitive presidential elections held in seventeen different Latin American
countries between February 1982 and May 1995 constitute the units of analysis (see Appendix
A). This period comprises the largest number of regularly free and competitive contests for the
top office of government ever held in the region. It is also unique in its economic and social
contours after the late-1981 default of México on its external debt payments, which spurred the
most critical times that Latin America has had to face since the 1930s.
Aggregate models of choice allow detection of the overall patterns underlying electoral
support for political continuity in the region, and ordinary least squares (OLS) technique enables
the statistical testing of those patterns behind the incumbent vote-share. This statistical tool will
permit both to ascertain the explanatory power of each model of the varying percentage of votes
collected by the incumbent in the region, as well as the assessment of the simultaneous interplay
of all models replicating real-life situations of electorates being submitted to multiple and
concurrent sources of choice (the reader interested in in-depth discussion of this methodological
approach can refer to Appendix C).
Eleven variables are initially used to explain variations in support for the incumbent
across the forty-one elections held between 1982 and 1995 in Latin America. This selection of
independent variables follows the arguments developed when inferring the different electoral
models. Unfortunately, the choice is in itself a controversial matter, since a good deal of the
disagreement on the subject comes from the idiosyncratic manner by which scholars have
specified their models in each analysis. As Miller (1989), Paldam (1991) and others have
acknowledged, much of the diversity in results about voting functions springs from using
different indicators, using different lags, weighting data diversely, appraising complex political

27
phenomena through
simplistic dummy variables, or overtly ignoring some critical variable.1
In formal terms, the influence of the eleven variables can be summarized with the
following general model structure:
VS=α + β1(Prior Vote) + β2(Party Strength) + β3(GDP growth) − β4(Inflation level) −
− β5(Inflation Change-Rate) − β6(Unemployment) − β7(Political Climate) −
− β8(Political Climate Change-Rate) − β9(Political Polarization) +
+ β10(Net Candidate Salience) + β11(Net Candidate Advantage) + ε
where VS represents the incumbent’s vote-share in terms of the percentage of valid votes cast in
favor of the ruling party or coalition. The coefficient α represents the value of the intercept, and
the concept labeled ε symbolizes the unmeasured influences not included in the equation.
Coefficient β1 represents the impact of the affirmative voting argument, β2 reflects the effect of
the party voting model, β3 through β6 indicate the impact of the economic model in their different
expressions, β7 through β9 illustrate the relevance of the democratic performance model, and β10
and β11 indicate the impact of the two indexes feeding the candidate voting model.
A further exploration, however, reveals that a trimmed version of the major hypothetical
explanatory models seems not only to fit better the numerical evidence and the empirical patterns
of relationships thereby unfolded, but also contributes to a more parsimonious understanding of
the phenomenon under study. Thus, after reviewing the impact that this initial set of variables
1 Of course, there are many others sources of error in aggregate analysis. Among those related to the specification aspect, one can also point out to the proportionally higher measurement error involved in non-economic variables (generally assessed through dummy variables that model specific political events) compared to those estimating economic conditions and performance, something that in principle should benefit a higher effect of the latter by comparison with the former. Paradoxically, one may suspect that, given some of the flaws and biases present in the way macro-economic data is collected in less developed countries, the gap in measurement error between economic and non-economic variables should be smaller, thus permitting the latter to reveal a more substantial impact.

28
had upon the forty-one electoral results, I use more compact version of the previous models with
only
five major explanatory variables (namely, prior vote, inflation change, political climate change,
party strength, and net candidate advantage), each summarizing one particular argument to be
tested. Finally, a sixth variable, presidential popularity, is entered for a subset of cases, to sketch
the effect of a political referendum explanation of voting.
In formal terms, the aggregate model takes the following shape:
VS=α + β1(Prior Vote) + β2(Party Strength) − β3(Inflation Change-Rate) −
− β4(Political Climate Change-Rate) + β5(Presidential Popularity) +
+ β6(Net Candidate Advantage) + ε
where each coefficient symbolizes a different model. It is important to note that once presidential
popularity is included, the measure of net candidate advantage is entered as a “residualized”
variable (that is, with the partial effects of presidential popularity and change in the inflation rate
removed). These two modifications are referred to in the text as the extended trimmed version of
the models.
For all variables in the tables presented in this and next chapters, three pieces of
information are offered: the parameter estimate, b, which is the unstandardized OLS regression
coefficient; the statistics, SEb, which stands for the standard error of the parameter estimate; and
β, which is the standardized OLS regression coefficient. Summary statistics concerning how well
the theoretical models fit the data are discussed in the text. In addition, let be said that no major
collinearity problem exists at the level of either the trimmed version of the models for the whole
sample or its extended restatement for the subsample already specified. As Table 5.1 shows,
except for the moderate correlation between party strength and prior vote (r=.50, p < .01 for

29
n=41; r=.48, p < .01 for n=36),2 all other coefficients remain below .40. This assures that
whatever the effect a model holds, this impact is authentic and not a product of the projected
impact of other contending arguments.
Table 5.1
Matrix of Product–Moment Correlations between Aggregate Independent Variables
PRIOR
VOTE
PARTY
STRENGTH
∆ INFLATION
RATE
∆ POLITICAL
CLIMATE
CANDIDATE
ADVANTAGE
PRIOR
VOTE
1.00 .501 .15
-.11 -.14
PARTY
STRENGTH
.481 1.00 -.213 .06 -.01
∆ INFLATION
RATE
.233 -.16 1.00 -.19 -.372
∆ POLITICAL
CLIMATE
-.12 .06 -.20 1.00 .203
CANDIDATE
ADVANTAGE
-.20 -.223 .00 .08 1.00
2 I would contend, though, that this level of correlation does not involve a severe problem. Actually, these coefficients are, according to conventional standards, well below any serious risk of collinearity. Furthermore, when controlled for all other arguments, each one behaves very independently of the other.

30
PRIOR
VOTE
PARTY
STRENGTH
∆ INFLATION
RATE
∆ POLITICAL
CLIMATE
CANDIDATE
ADVANTAGE
PRESIDENTIAL
POPULARITY
.292 .312 .00 .18 .00
Note:
1 Coefficients are significant at p < .01
2 Coefficients are significant at p < .05
3 Coefficients are significant at p < .10
Coefficients located above the main (greyed) diagonal refer to the estimates for the original trimmed version
of the models (N=41); coefficients located below the main diagonal refer to the extended trimmed version
(N=36).
31
Describing the Elections Profiles
Latin American voters have been, on average, mild supporters of political continuity in
an electoral sense. As a whole, voters granted thirty-six percent of the valid votes to the
incumbent forces at the presidential level, a figure that on special occasions could grant to office-
holders the largest minority, or at least an opportunity for a run-off election. The incumbent vote-
share reveals a standard deviation of 15.3 percent, which means that there was plenty of room for
dramatic demonstrations of both support and repudiation of political continuity. As it stands, that
dispersion value means that in almost seven of every ten elections (i.e., 68 percent of cases
comprehended within one standard deviation) results could have fallen between 11 and 51
percent3—that is, between a humiliating expression of voters’ anger and a gratifying assurance of
reelection.
Table 5.2 summarizes how other forces behave, on average, across all these presidential
races. For example, a look at the electoral background in terms of prior votes shows the extent to
which a phenomenon of “swing votes” prevailed. Furthermore, when observed in conjunction
with the level of party strength, it hints at the fact that incumbents reach office blessed by an
inflated amount of electoral support.4 It seems logical that after getting elected with a margin of
votes that greatly exceeded their partisan strength, authorities had nowhere to go but down,
unless short-term factors heavily discount the natural trend towards re-equilibrium. This view of
events is further reinforced by the magnitude of the dispersion of the prior vote variable.
The average value of party strength suggests that almost one in every three voters (28.05
percent) leans towards the incumbent force in a regular manner. This reveals that some degree of
partisan continuity has articulated the distribution of preferences. Also, as its dispersion is lower
3 That is, fifteen percentual points below the average value of 36 percent, equalling eleven percent, or above the average value, thus equalling fifty-one percent of votes. 4 This is suggested by the greater distance between prior vote and party strength (over 18 percentage points) compared to the differences between prior vote and incumbent support (less than 8 points) and party strength and incumbent support (close to 8 points).
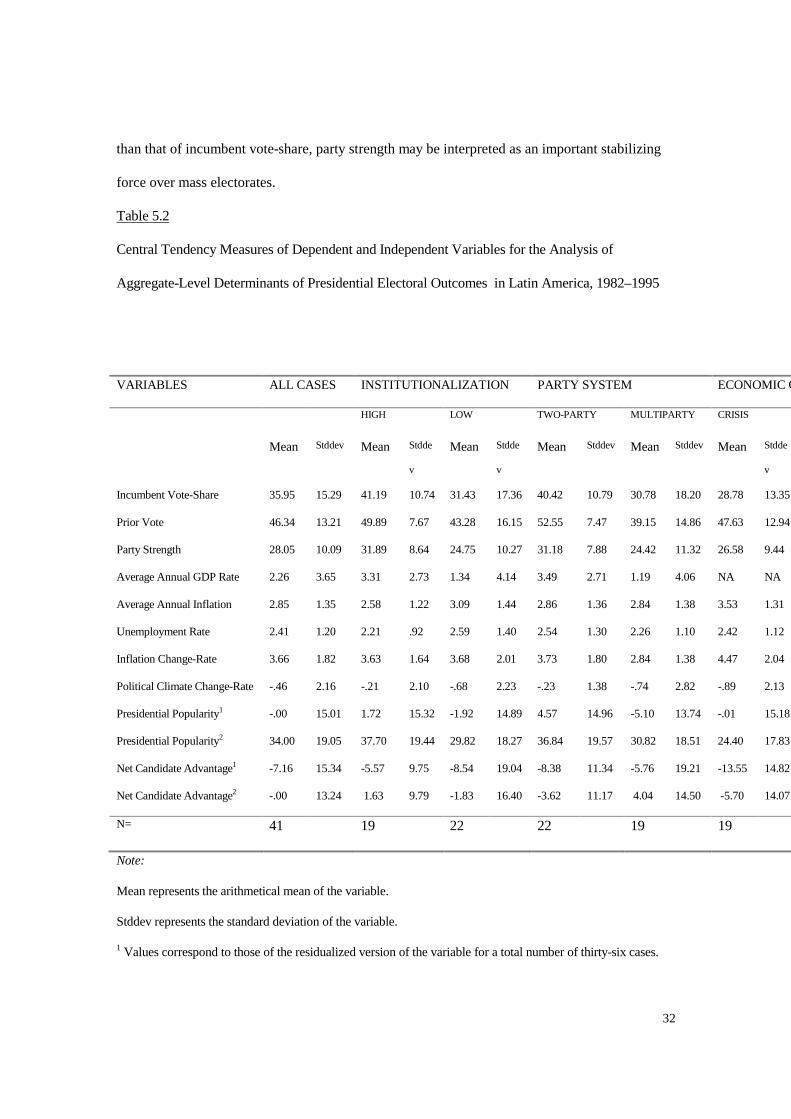
32
than that of incumbent vote-share, party strength may be interpreted as an important stabilizing
force over mass electorates.
Table 5.2
Central Tendency Measures of Dependent and Independent Variables for the Analysis of
Aggregate-Level Determinants of Presidential Electoral Outcomes in Latin America, 1982–1995
VARIABLES ALL CASES INSTITUTIONALIZATION PARTY SYSTEM ECONOMIC CONTEXT
HIGH LOW TWO-PARTY MULTIPARTY CRISIS
Mean Stddev Mean Stdde
v
Mean Stdde
v
Mean Stddev Mean Stddev Mean Stdde
v
Incumbent Vote-Share 35.95 15.29 41.19 10.74 31.43 17.36 40.42 10.79 30.78 18.20 28.78 13.35
Prior Vote 46.34 13.21 49.89 7.67 43.28 16.15 52.55 7.47 39.15 14.86 47.63 12.94
Party Strength 28.05 10.09 31.89 8.64 24.75 10.27 31.18 7.88 24.42 11.32 26.58 9.44
Average Annual GDP Rate 2.26 3.65 3.31 2.73 1.34 4.14 3.49 2.71 1.19 4.06 NA NA
Average Annual Inflation 2.85 1.35 2.58 1.22 3.09 1.44 2.86 1.36 2.84 1.38 3.53 1.31
Unemployment Rate 2.41 1.20 2.21 .92 2.59 1.40 2.54 1.30 2.26 1.10 2.42 1.12
Inflation Change-Rate 3.66 1.82 3.63 1.64 3.68 2.01 3.73 1.80 2.84 1.38 4.47 2.04
Political Climate Change-Rate -.46 2.16 -.21 2.10 -.68 2.23 -.23 1.38 -.74 2.82 -.89 2.13
Presidential Popularity1 -.00 15.01 1.72 15.32 -1.92 14.89 4.57 14.96 -5.10 13.74 -.01 15.18
Presidential Popularity2 34.00 19.05 37.70 19.44 29.82 18.27 36.84 19.57 30.82 18.51 24.40 17.83
Net Candidate Advantage1 -7.16 15.34 -5.57 9.75 -8.54 19.04 -8.38 11.34 -5.76 19.21 -13.55 14.82
Net Candidate Advantage2 -.00 13.24 1.63 9.79 -1.83 16.40 -3.62 11.17 4.04 14.50 -5.70 14.07
N= 41 19 22 22 19 19
Note:
Mean represents the arithmetical mean of the variable.
Stddev represents the standard deviation of the variable.
1 Values correspond to those of the residualized version of the variable for a total number of thirty-six cases.

33
Cases add up to nineteen for the group of highly institutionalized and bipartisan systems (which in the latter
group leaves three cases as missing), and seventeen for the group of poorly institutionalized and multiparty
systems (which in the former leaves five missing cases and in the latter two). Among the groups of economic
crisis and prosperity, this variable amounts fifteen and twenty-one cases, respectively.
2 Values correspond to those of the original variable for a total number of thirty-six cases.

34
Short-term forces undermine such stability. Take democratic performance, for example. Bearing
in mind that a negative sign signifies that democratic progress took place when comparing the
year preceding the election and the first year of the incumbent in office, the average value for the
rate of change in the region’s political climate (i.e., -0.46) indicates that –as a whole- electorates
have seen advances in democratization, and authorities have been for the most part responsive to
the post-authoritarian plea for political amelioration. Yet, as I will discuss later, this is not to say
that emphasis on democratization constituted a strong vote-getting strategy. Whereas the overall
trend worked in a direction towards improvement of conditions for pluralism and citizenship,
considerable heterogeneity (as measured by the standard deviation) also showed up. Thus,
considering only sixty-eight percent of the cases (i.e., one standard deviation) would yield
situations with some governments sliding into mild authoritarian regressions (i.e., a value of
1.70) and others going forward down the road to full democracy (i.e., a value of -2.62).
Another major short-term force driving results, the president’s appeal, also shows an
intuitive pattern. In its original values, the percentage of popularity of the president gets
extremely close to the proportion of votes collected by the incumbent. However, as its variance is
larger, the emphasis on presidential leadership can only introduce an additional measure of
incertitude to the inherent volatility in political support.5
Economic performance has not been a stabilizing force either. In broader terms, the
grouping of elections held under both unfavorable and auspicious economic conditions shows a
somewhat distorted picture of what average voters were undergoing at election time. This picture
becomes evident when contrasting the behavior of the economy, especially inflation-related
measures, in times of growth against times of economic slump. When all contests are aggregated,
the indicator of economic activity positions itself half-way between “slow growth” and
5 As expected from the assumption of homoscedasticy, the residualized version of presidential popularity (after regressed against economic variables) presents a zero mean value. Still, as indicated by the size of its
35
“stagnation,” leaning more heavily towards the latter. The long-term measure of inflation falls
closer to the category labeled as “Latin inflation,” that is, between an annual index of 25 and 40
percent. Efficacy in fighting prices hikes over time (as measured by the difference in annual
inflation rates) cancels itself out as a byproduct of the aggregation, placing its mean value half-
way between a “moderate deflation” and “price stability.” Finally, unemployment levels before
elections remain between moderate and high.
Lastly, the arithmetic mean of candidate-related forces for all competitions shows that
the basic strategy of the major opposition parties to unsettle incumbents has consisted in relying
on a strong candidate-oriented campaign. This is how I interpret the average negative values for
this variable which means that presidential tickets of the party-in-office have been systematically
outpaced by a greater candidate appeal of the challenger.
Testing Economic and Non-Economic Voting
Let us now turn to the reasons why Latin American electorates have chosen to endorse
the ruling party with the intensity they did. In assessing properly the relative importance of each
voting model, it is appropriate to focus on three summary sources of the goodness of fit: 1) the
amount and statistical significance of the increase in coefficient of determination (the adjusted
R2, which informs us about the proportion of the variation of the votes going to the incumbent
explained by each model); 2) the extent to which each model contributes to diminishing the
spread of errors relative to the predictive power of the mean (standard error of the estimate or
SEE); and 3) the extent to which each argument helps to shrink the average absolute error in
predicting the percentage of votes obtained by the party-in-government.
As a way of organizing the tests of the comparative explanatory power of each voting
hypothesis, we can check the systematic effect displayed by each individual set of variables
standard deviation, the new variable retains quite a bit of its original variability, which confirms the
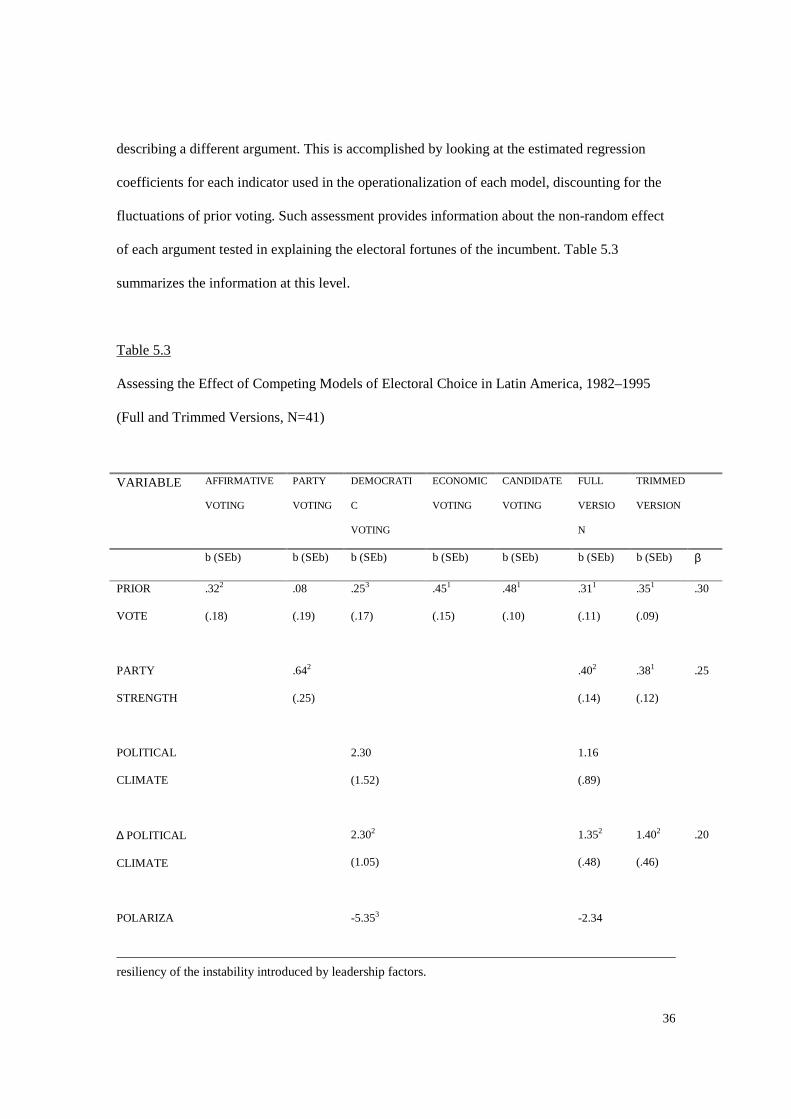
36
describing a different argument. This is accomplished by looking at the estimated regression
coefficients for each indicator used in the operationalization of each model, discounting for the
fluctuations of prior voting. Such assessment provides information about the non-random effect
of each argument tested in explaining the electoral fortunes of the incumbent. Table 5.3
summarizes the information at this level.
Table 5.3
Assessing the Effect of Competing Models of Electoral Choice in Latin America, 1982–1995
(Full and Trimmed Versions, N=41)
VARIABLE AFFIRMATIVE
VOTING
PARTY
VOTING
DEMOCRATI
C
VOTING
ECONOMIC
VOTING
CANDIDATE
VOTING
FULL
VERSIO
N
TRIMMED
VERSION
b (SEb) b (SEb) b (SEb) b (SEb) b (SEb) b (SEb) b (SEb) β
PRIOR
VOTE
.322
(.18)
.08
(.19)
.253
(.17)
.451
(.15)
.481
(.10)
.311
(.11)
.351
(.09)
.30
PARTY
STRENGTH
.642
(.25)
.402
(.14)
.381
(.12)
.25
POLITICAL
CLIMATE
2.30
(1.52)
1.16
(.89)
∆ POLITICAL
CLIMATE
2.302
(1.05)
1.352
(.48)
1.402
(.46)
.20
POLARIZA -5.353 -2.34
resiliency of the instability introduced by leadership factors.

37
VARIABLE AFFIRMATIVE
VOTING
PARTY
VOTING
DEMOCRATI
C
VOTING
ECONOMIC
VOTING
CANDIDATE
VOTING
FULL
VERSIO
N
TRIMMED
VERSION
b (SEb) b (SEb) b (SEb) b (SEb) b (SEb) b (SEb) b (SEb) β
TION (2.87) (1.59)
INFLATION
RATE
-.10
(1.84)
.51
(.99)
GDP
RATE
1.352
(.62)
.13
(.36)
UNEMPLOY
MENT
1.53
(1.64)
.18
(.95)
∆ INFLATION
RATE
-3.741
(1.19)
-1.562
(.73)
-1.841
(.61)
-.22
CANDIDATE
SALIENCE
2.883
(1.66)
2.982
(1.33)
CANDIDATE
ADVANTAGE
.741
(.09)
.582
(.08)
.651
(.07)
.65
Intercept 20.872
(8.56)
14.253
(8.44)
28.442
(11.37)
22.303
(11.41)
19.821
(4.96)
19.742
(7.81)
21.111
(4.24)
Adjusted R2 .05
(.05)
.17
(.19)
.22
(.20)
.41
(.28)
.68
(.52)
.84 .84
Standard 14.86 13.93 13.45 11.69 8.58 6.08 6.13

38
VARIABLE AFFIRMATIVE
VOTING
PARTY
VOTING
DEMOCRATI
C
VOTING
ECONOMIC
VOTING
CANDIDATE
VOTING
FULL
VERSIO
N
TRIMMED
VERSION
b (SEb) b (SEb) b (SEb) b (SEb) b (SEb) b (SEb) b (SEb) β
Error (14.68) (13.78) (13.63) (13.00) (10.58)
Prediction
Error
11.64
(11.64)
10.44
(10.63)
9.94
(10.34)
8.38
(9.99)
6.69
(8.47)
4.02 4.39
Note: Goodness of fit measures in parenthesis stand for the respective models without adjusting for the
prior vote baseline.
1 Coefficients significant at p < .01
2 Coefficients significant at p < .05
3 Coefficients significant at p < .10
A preliminary assessment of this model’s effects, as described by the adjusted coefficient
of determination, indicates that only five percent of the variance in the incumbent vote-share is
accounted by prior vote. In other words, the unexplained variance between prior vote and the
incumbent vote-share is substantially large and can be left to be explained by the other factors of
interest. This is good news for the practical relevance of a study like this. Incidentally, it suggests
that the alarm over recurrent incumbency turnover in the region may have reflected a pattern of
consistent deviation between the large margins by which governments originally reached office
and the large “swing” votes by which they were removed from power in the next round, rather
than an intrinsic weakness of democracy.
Looking at the comparative performance of the other models points out the explanatory
edge held by the argument for candidate voting. This hypothesis accounts for almost seventy
percent of the fluctuation in political support going to the incumbents, while cutting almost by

39
half its error dispersion (i.e., from an original standard deviation of 15.29 to one of 8.58). In
terms of prediction, this argument alone foretells an average absolute error of less than seven
percentage points (i.e., 6.69) in relation to the actual results. A quick look at the dynamics of
candidate effects over voting shows that electoral outcomes do not tribute to the historical or
prestige salience of competitors (as captured by the net candidate salience indicator), which
displays a poor statistically significant influence. Indeed, the impact of the candidate-related
hypothesis comes from the net candidate advantage variable alone, which works in favour of
gathering votes to the ruling party inasmuch as the party’s candidate has the upper hand.
Second in importance is the economic voting hypothesis. Its salience may partially result
from the higher number of explanatory variables used, but it nonetheless is capable of reducing
the uncertainty on the overall spread of the incumbent vote-share by 3.6 percentage points. Of the
four measures encompassing this model, only two display statistically significant effects: the
evolution of inflation and the level of growth for the national economy. Looking at the signs of
coefficients proves that the incumbent ticket may expect to collect votes only when the prices
have lowered and the economy shows expansion.
The option for continuity expressed in the number of votes for the party-in-government is
also significantly shaped by factors of political nature like party strength and the political climate
surrounding the election. Individually, the effect of aggregate party alignment suggests that for
every three percentage points the ruling party received in subpresidential elections, it can expect
to add almost two percentage points of support in presidential contests (3∗.64=1.92). However,
the overall explanatory power of this argument is rather weak compared to that of others (only
likely to explain 17 percent of the votes gathered by the ruling party), which falls in line with the
lack of opportunities for full partisan socialization among most electorates of the region.
On the other hand, ambiguous effects are found in relation to the impact of democratic
performance clues. Its explanatory power is mild (22 percent of the variance in incumbent vote)

40
and is mainly attributable to changes in the political climate of each country. Moreover, this
variable’s coefficient sign suggests that the tougher (rather than democratic) the government has
become, the more votes its presidential ticket is likely to harvest. Surprising as this might sound,
there is a consistent pattern of incumbents who, after deepening democracy, lose people’s
support at the voting booths; after all, one expects voters to have become sensitized electorates
about the value of democracy. (I shall return to this point later.) Ideological polarization is the
only other variable of this model with some additional influence on voting. One would expect a
pre-electoral scene of high polarization to serve against the incumbent’s best interest, since this
may be interpreted as signal of incapability to ensure full-scale governability. This hypothesis is
confirmed by the negative sign of the coefficient.
As a preliminary approach to the patterns underlying popular choice, the data presented
in Table 5.3 reveal that decisional clues hold distinctive effects for each model. Yet no single
argument can summarize the complex multiplicity of forces shaping the vote. This simple
revelation must serve as a warning against reducing voting results to unidimensional factors.
Moreover, it can help to make visible the limitations of single-minded views of elections for
contexts comprising more than one country, one election and one temporal point. For example,
although conventional wisdom holds both the 1989 and 1995 electoral results in Argentina as
reflections of retrospective economic voting alone (the former in the form of “punishing” the
incumbent, the latter in the form of “rewarding” it; see Catterberg and Braun 1989; Clarín 1995), a
look at the difference between the incumbent vote-share that a pure economic model would predict
and the actual proportion of votes obtained should underscore the curtailed leverage of such
argument. Whereas the 1995 contest could be very closely predicted by paying attention only to the
macro-economic performance (a difference of less than one percent with the actual results), the
predicted fortunes of the ruling party in 1989 were over fifteen percentage points off the mark. In
other words, while a voting model solely based on macro-economic performance predicted 17.4
41
percent of votes, the Radicals were able to pool 32.5 percent.
Such examples speak to the need to contemplate other explanations when circumscribing
the analysis at the aggregate level. Notably, the 1989 outcomes in Argentina are closer to the
percentage forecast provided by the party strength model or the candidate effects model (a
difference to actual results of less than four and six percentage points, respectively), which clearly
points to the importance that party and candidate-related factors had in determining the outcomes of
that particular election. As this case illustrates, reliance on unidimensional factors can lead to
grossly erroneous results. And if such approach cannot offer accurate predictions in one country,
it is not hard to imagine how the errors could be compounded when dealing with many countries
and elections.
Assessing the Relative Importance of Competing Explanations
A more compelling way to test for the relative incidence of each explanation of electoral
returns is to have all hypotheses be controlled for each other. By analyzing them in this way, we
can gain a broader sense of the actual weight of each argument as well as of the ways in which
these arguments affect each other’s impact on the vote.
Table 5.3 shows the changes experienced by the estimates of one particular argument
when the variables representing a rival argument are incorporated as controls. The column titled
Full Version condenses the relative importance of each variable within each model after being
controlled for all other factors’ presence altogether. Among other findings, this analysis shows
that, even when other economic and non-economic influences are present, the effects of prior
alignments expressed by past election choices and partisan connections retain considerable
influence in explaining the percentage of votes going to the incumbent ticket. The estimates show
that votes obtained in the previous presidential election are positively and significatively
correlated with the current vote-share of the incumbent, as is also the case for the measure of

42
aggregate partisan strength.
Results also show that the better the economic outlook in terms of high growth, low
inflation, and greater reduction in the cost of living, the more votes the party-in-office may
expect to collect. However, the data retain some unexpected patterns of influence. For example,
no one of the economic effects reach statistical significance when other factors are also included.
What is more, whereas one may have expected a negative relationship with increases in
unemployment dragging electoral support away from government, the situation is just the
opposite. This latter characteristic, of course, lowers any theoretical concern about the role of
unemployment in this discussion; however, this should not excuse one from making sense of its
possible meanings. An immediate interpretation for such a case calls to mind the Italian example
in which a similar pattern was verified (Belluci 1985), and which simply reflected the hidden
potential of clientelistic voting underneath economic voting explanations. Similarly, when
electorates have undergone situations of repeated and/or enduring high inflation manifested in
real-life scenes of economic ungovernability, and realized that economic stability and social
peace can be restored by means of harsh stabilization policies, tolerance for the joblessness side
of the equation may increase and endure. Such a pattern may represent a collective preference for
a particular equilibrium point in the Phillips curve: a tendency to ignore unemployment if
accompanied by price stability (see Stokes 2001).6
Rather unexpectedly, governments less committed to an amelioration of the political
climate seemed rewarded with votes rather than punished. This finding contradicts the rationale
positing that electorates see utility satisfaction in democracy-deepening efforts. Some scholars,
however, might not be surprised, since such effects hint at the trade-offs encountered by
6 An alternative interpretation could have resorted to the argument of distinctive “party policy expertise” (see Hibbs 1987), that is, that the incumbent party still receive votes, even if confronting negative economic results in unemployment, as a result of their perceived expertise on some other economic area (for example, control of inflation). However, a background of citizens cognitive limitations in appraising party policy expertise, poorly

43
electorates facing contexts of economy-driven tensions and social upheaval (Acuña 1994;
Gamarra 1994a).
Others may interpret them as tapping hidden cultural trends rewarding some authoritarian
behaviors of leaders (see Conaghan 1995; Carrión 1998). In this view, elections are plebiscites of
the incumbent’s capacity to assure public order and to keep social uncertainty at a minimum,
rather than to advance political and citizenship-related goals of collective self-actualization (see
Torre 1993; Payne 1995). In sum, Latin American electorates judge civilian authorities upon
their aptitude to resolve the old dilemma of how much democracy and how much government are
needed, and proceed to vote accordingly.
The negative (and non-significant) coefficient of ideological polarization seems
consistent with the inherent conservatism of the above view: as political confrontation skyrockets
in pre-electoral times, the incumbent is likely to be blamed and thereby punished, reinforcing the
notion that there is an electoral premium on maintaining public order as a good in itself; yet, such
effect seems better captured by the longterm evaluation of how the overall political climate of the
country has evolved during the ruling party’s tenure.
Finally, candidate-related influences also nurture the ultimate outcome of presidential
elections, but only the net candidate advantage measure does so with statistical significance.
In addition to pointing to these specific insights, the data also illustrate the prevailing
heterogeneity within each particular argument. We learn, for instance, that when adjusted for the
inflation rate of change and the level of economic activity, plus the long-term alignments
captured by the prior vote measure, the jobless rate and the average biannual inflation rate do not
help to reveal any significant effect on the electoral fortunes of incumbents. This confirms that,
during the early stages of democratic development throughout the 1980s and 1990s, the
economic sensitivity of electorates was meaningfully captured by over-time comparisons of
developed partisan profiles, and the dominance of incumbent-oriented voting suggests to discard this

44
economic performance related to the cost of living.
In a like manner, the relative importance of the candidates’ salience variable suggests
that there is room to think of personality-driven politics as domestic developments somewhat
hostile to the institutional background surrounding the elections. Not surprisingly, then, the net
candidate advantage stands out as highly significant and strong.7 Having said that, the
institutional aspects of Latin American elections are safeguarded by the role that over-time
partisan alignments held upon voting results.
How do the general arguments rival one another? To what extent is each model
relativized or reinforced by the broadening of the explanations of electoral results? Comparing
columns 1 and 3 of Table 5.3, for example, shows that the economic voting hypothesis not only
contributes significantly to a better understanding of why electoral results vary but also helps to
strengthen the type of affirmative voting effect (by enhancing the statistical significance of the
prior vote’s coefficient). In so doing, it also provides more substantive significance to the overall
relationship: as one would expect, if affirmative voting results from both structurally determined
alignments and cultural trends of political inertia and conformism, then the macro-economic
conditions can only reinforce such a pattern by introducing government performance as a cost-
saving source of decision for electors looking for additional clues of how to vote. Electoral
conformism may, then, be turned into some sort of economic conformism. A different way to
state this is to say that unless economic conditions are so obviously worse that they succeed in
deviating electorates from their regular choices, one can expect outcomes to be significantly
driven by inertia.8
explanation. 7 Interestingly, the “net candidate salience,” which holds a more obviously personalistic and antiparty content, projects itself rather weakly onto the “net candidate advantage” variable (i.e., product-moment correlation of .26, significant at p=.05). 8 For example, if one leaves out those economic variables with non-significant effects and assumes zero growth (“recession”) and no major improvement in anti-inflationary policy (zero change) preceding the election, the
45
Once other political forces are incorporated as joint explanations, as in the Full Version
model, the effects of all previous economic influences attenuate, as their impact is shared with
(when not made viable through) these other variables. After indicators of democratic
performance, partisanship and candidate voting are incorporated, economic influences are
considerably moderated. Indeed, holding all other arguments constant, the impact of economic
voting is limited to the administration’s success in fighting inflation. On average, incumbents can
expect a decrease in over three percent of the valid votes whenever inflation performance
deteriorates from levels of “price stability” to “strong inflation increase” (that is, to the point of
jumping two categories and bringing price indexes up by a range between 10.1 and 49.9
percentage points).
Consistent with historical patterns and contextual conditions during the 1980s and 1990s,
Latin American electorates show high sensitivity to the inflation-related efficacy of governments;
less obviously, they seem relatively immune to how much economic activity precedes the
election or how collective a problem unemployment becomes. Still, an important caveat
suggested by a country-level inspection of the way pieces of the economic argument perform
seems to indicate that there may be different thresholds of economic tolerance across national
electorates. Thus, even if economic indicators get below certain levels their electoral influences
may remain innocuous (for example, in Argentina and Uruguay, this occurs with lower levels of
growth across time). Conversely, once economic factors reach certain levels their electoral effect
may become explosively important (for example, a boost in inflation during the year preceding
the contest). Thus, while two situations of economic activity, one characterized as “recession” and
the other as “depression,” may not necessarily lead to different electoral outcomes (as suggested by
the lack of statistical significance of the GDP growth coefficient), a similar comparison of inflation
performance over time between a situation of “price stability” (a price hike between zero and two
party-in-office may still be likely to harvest, on average, over 22 percent of the votes (see the intercept) plus

46
percent) and “extreme inflation increase” (a rise of fifty percent or more) is bound to provoke an
erosion of almost five percent of the valid votes (3 ∗ -1.56= -4.68), all other conditions held
constant.
Unlike economic variables, all other factors in the Full Version are modestly changed in
size and significance. Prior vote (which seems to be encompassed by party strength to the point
of
ecoming non-significant in the Party Voting model) remains at the very same level it started,
anticipating one percentage point of valid votes for every three percentage points harvested by
the incumbent in the previous contest. As such, it represents an important stabilizing force amidst
the marked changes in policy profiles and political coalitions by the parties-in-office, as well as
given the fluctuations in how satisfied the public is with incumbents’ performance.
In spite of the pervasive sense of partisan malaise in Latin American (already
documented), party effects on voting persist and succesfully compete with the alternative
explanations of electoral choice. In the Full Version model, the regression coefficient indicates
that, on average, aggregate party loyalty contributes substantively to the electoral performance of
the incumbent, thus further reassuring the impact of political, long-term forces upon elections
results.
From Table 5.3, the candidates’ appeal emerges as the decisional clue voters rely most
heavily upon. In the Candidate Voting model, both indicators remain significant. More so,
compared to the performance of the Economic Voting model, the introduction of candidate
effects into the Full Version model doubles the explanatory power of vote outcomes: a highly
significant adjusted R2 increase from .41 to .84, while it improves the overall fit of the model by
reducing the standard error to plus or minus six percent.9 As expected, the greater the incumbent
slightly less than half the proportion of votes that brought it to incumbency (see prior vote). 9 In terms of average prediction error, the Full Version model reduces by more than half the proportion of incumbent votes missed by the model of Economic Voting (from 8.38% to 4.02%).

47
candidate’s margin of votes over his or her party’s compared to the major opposition candidate’s,
the greater the electoral support for the government’s presidential ticket. The coefficient for net
candidate advantage clearly speaks of the importance of personality-related factors. This
importance is further confirmed by the role that candidate salience plays in explaining electoral
results: for every situation in which the incumbent candidate enjoyed some charismatic latitude
over the major competitor, one could predict an increase of about three percentage points in
votes10.
In brief, the complex matrix of forces instrumentalizing support for political continuity
reveals candidate-related factors to be the ones of major relevance. This picture seems consistent
with the limited informational resources and socialization opportunities that impair the
development of long-term and issue performance clues in the region. It is also consistent with
traditional insights from political culture theory stating that Latin American collectivities are
fascinated with charismatic and highly personalistic leadership in the realization of their political
decisions.
A Parsimonious Look at Competing Explanations
The picture presented above successfully synthesizes the hidden nuances behind any
interpretation of electoral outcomes in the region, except that it fails to provide a truly
parsimonious view of the phenomenon. On the one hand, the cases-by-predictors ratio is too low
to become a functional and statistically appropriate summary of the relative impact of each
model; on the other hand, several variables simply fail to play any role in furthering our
knowledge about what moves the fortunes of the government at the ballot box. Both
considerations are addressed in the last column of Table 5.3, where a Trimmed Version model is
10 This evidence somewhat attenuates the extended belief that independent newcomers, political entrepreneurs and showbizz personalities emphasizing their lack of political past as a virtue had the electoral upper hand across the region since the mid-1980s.
48
presented. In view of previous information obtained, only the relevant variables are kept. The
basic rule followed was to drop all variables that did not achieve statistical significance (at p < .10)
in the full multivariate model presented in Table 5.3-Full Version model. The only exception was
made with the “net candidate salience” variable, which was dropped due to a) its comparatively less
straightforward interpretation relative to “net candidate advantage”; b) its previous statistical
behavior when entered into a Candidate Voting model alone (revealing a non-significant impact);
and c) the need to keep each model explained in the simplest form possible. The resulting five
models are reproduced in a way that brings about a simpler and clearer view of the forces
shaping the election.
This Trimmed Version keeps the single variable-based arguments of affirmative and
party voting as they have already been presented, and qualifies the measurement of the economic,
democratic performance, and candidate voting hypotheses by representing them with the most
statistically and substantively significant variables: the change in the inflation rate, the change in
the index of the political climate, and the net candidate advantage for the incumbent,
respectively. This revision affords a neater overview and more efficient understanding of the
main effects at work without a loss of either much information or explanatory power.11 Also, it
reveals that no dramatic changes occurred in the strength of each estimate after eliminating all
redundant information.
In terms of competing arguments, the information conveyed by the beta weights of the
Trimmed Version model clearly points out the explanatory edge of the candidate voting
hypothesis, which more than doubles the impact exerted by any other argument. The conclusion
that follows is that electoral outcomes in Latin America throughout the 1980s and up to mid-
11 Actually, this version provides a picture very similar to the original one: it explains the variability in outcomes at an identical rate (84 percent), while contributing to a similar improvement in the fit as measured by the minimization of the spread of errors (down to an average error of +/-6.13 percent). Furthermore, its average prediction accuracy remains very high, over 95 percent (e.g., 100-4.39=95.61) in absolute terms.

49
1990s outlined first and foremost a model of choice structured around the personality assets of
the candidates.
The institutional drawbacks of a candidate-centered decision-making are somewhat
balanced by the significant and positive effects of longterm factors such as prior vote and party
strength. Both influences acted upon electorates as stabilizing forces that contributed to
maintaining the pace of institutional development despite the strong economic oscillations and
continuous social tensions of the 1982-1995 period. As important as that, the resiliency in voting
patterns across elections captured by prior vote represents something more than mere partisan
rationalization. Rather, it may be understood as a cultural trait of the electorates of the region that
raises the odds of aggregate inertial responses when voters decide whether to favor political
continuity or change.
The model of economic voting plays an important role in explaining ballot outcomes in
Latin America. However, contrary to much speculation, it is neither the sole cause of voting nor
the most relevant factor. Controlled for the effects of all other arguments, its estimate endorses
the notion that poor performance on a matter very sensitive to electorates, such as inflation
fighting, can only drag support away from the incumbent.12 A number of examples illustrate this
rationale: Argentina in 1989 and 1995, Brazil in 1989 and 1994, Bolivia in 1985 and 1993. These
results show that electorates hold their governments accountable for their economic efficacy, and
that the loss of votes for mismanagement in inflation policy may be lethal for the incumbent’s
12 Such downscaled effect is not a methodological artifact coming from the different levels of measurement used for the economic and non-economic variables (i.e., categorical among the former but interval among the latter). If, in principle, these measurement features of the first constructs might have resulted in a reduced variance (and, therefore, a lower statistical effect) relative to the latter, this proved to be inconsequential in practice. After reordering all variables presented in the trimmed version (see Appendix D) into five categories to match the scale of the economic variables measured as biannual averages, and including both annual inflation and annual GDP levels, the same picture remains: neither the average yearly inflation rate nor the average yearly GDP rate are significant at conventional levels, while all other variables remain statistically and substantively important. Furthermore, comparing standardized coefficients, the edge of candidate effects remains intact, the relevant though secondary role of the inflation change-rate continues, the relative trailing of the democratic issues in regards to the other arguments is confirmed, and minor variations of order are verified

50
aspirations to reelection. Still, other determinants of choice also do come decisively into play,
attenuating the economy’s electoral consequences.
The way governments have handled the political environment—that is, the extent to
which they have promoted or restricted democratic development—also provides a relevant
decision rule at the aggregate level, although one operating in a rather anti-political fashion:
briefly stated, as incumbents become tougher over time, they are more likely to obtain more
votes.13 References to Colombia in 1990, Venezuela in 1993, Peru in 1994, or Dominican
Republic in 1994 are certain. Interpreting this pattern from a cultural perspective seems
inevitable; yet, the conditions among which many elections were held (civil wars, presence of
guerrilla and narcoterrorism, popular uprisings and food riots, swelling poverty and high crime
rates, poorly checked military forces and tutelage over the civilians, etc.) may point out a
complex situation in which authoritarian moves by civilian authorities may indicate to the
electorates a strong will for political governability and regime survival rather than the opposite.
One can therefore speculate that under these specific conditions, insofar as there is some
tendency to reward uncivic initiatives with votes, the deployment of a series of de-democratizing
actions in pre-electoral times may prove to be a successful (although contingent) model of
political capitalization.
Testing Interaction Effects between Competing Explanations
Since the aim of this study is not just to come up with a parsimonious understanding of
for the party strength and prior vote effects. This examination confirms the reliability of the findings already discussed. 13 It is important, however, to bear in mind that the mode for this variable falls in the “no change” value, concentrating 29.3 percent of the cases. Those elections held on the eve of any sort of democratic improvement over the previous period comprise 39 percent of the sample, whereas those surrounded by a worsening of the political conditions make up the remaining 31.7 percent. In a like manner, linear readings of this variable’s impact may sometimes be misleading, as illustrated by the Honduran election of 1985. On that occasion, the incumbent party successfully harvested enough votes to stay in power in spite of President Suazo Cordova’s authoritarian drives; but the election of liberal José Azcona to the presidency rather than Suazo’s protegé,

51
the subject but to achieve a realistic general model of electoral choice, interaction between
competing explanations must be investigated, to see if voting effects by one model are sharpened
or downplayed when considering the interplay of this factor across specific categories of a
second competing model. I test four interaction terms.
The first one is computed for the inflation rate of change and the political climate rate of
change. The expectation is that different rates of success (or failure) in controlling inflation over
time might encourage lower (or higher) uses of politically repressive devices (for example,
inflationary upsurges may be followed by food riots and looting, which in turn may naturally
drive governments to impose restrictions upon civil liberties). The use of these devices may then
project distinctive effects over the electoral fortunes of incumbents.
The second interaction term, between party strength and the differenced rate of inflation,
relies on the assumption that a meaningful presence of partisan alignments in society might pave
the way to the enhancement of government’s performance in key economic matters such as
inflation reduction, anticipating political benefits at the voting booths. Conversely, different
degrees of economic deterioration might be suspected of intensifying partisan dealignment trends
which, in time, might also affect the distribution of electoral support.
The third interaction term assumes that the distribution of the incumbent candidate
advantage might vary for the different levels of governmental success in controlling inflation
over time, the reasoning being that success in the economic field might become a party’s
commodity and thus make unnecessary the nomination of a strong personality candidate (unless,
of course, the president were seeking reelection). Conversely, under adversarial economic
conditions, the party-in-office might bet upon a charismatic leader to stage a strong candidate-
centered campaign as an attempt to offset its poor record. This reasoning may collide with the
standard “strategic politician” hypothesis (see Jacobson and Kernell 1981), which postulates that
Mejía Arellano, in the context of an electoral system of double simultaneous vote, actually looked more like a
52
strong candidates enter only in electoral races after concluding that economic conditions, among
other factors, would eventually become an asset rather than a liability. Although this argument
may have been at work in Latin America, it has cohabited with another, more folkloric version of
“strategic politicians.” This home-grown version sees office-seeking leaders as charismatic riders
of people’s expectations for the arrival of a “savior of the country,” an expectation that becomes
particularly acute as economic hardship increases and ethical criticisms of the political class
escalate.
Finally, the last interaction between partisan support and candidate advantage is built
upon the supposition that the weaker the party’s aggregate endorsement over time, the higher the
incentives to appeal to strong personality candidates to mobilize extra votes.
None of these terms prove to be significantly related to the dependent variable when
controlled for the main effects. The huge bivariate correlations at the .90 or higher level between
the last two interaction terms and the share of votes going to incumbents are pulverized after
adjusting for the effects of the original variables. What it is even more substantial, no
interactions produce major alterations in the way each original variable influences electoral
outcomes—except for the drastic reduction to non-significance of the political climate measure
after introducing the first two multiplicative terms.14 The minimal alterations brought by the
inclusion of the interaction terms speak, again, of the robustness of the findings discussed above.
Testing the Political Referendum Model
choice for change than for continuity (see Rosenberg 1989). 14 Pearson’s correlations of political climate rate of change with the interaction terms between inflation and political climate, and inflation and party strength stand at .93 and .89, respectively, revealing collinearity problems which depressed the impact of the main effect on the vote. Quite interestingly, the latter value suggests a pattern by which whenever party support remains low, inflation-reduction efforts are bound to fail, a situation that when repeated over time may complicate governability and the administration’s survival in office, thus prompting the incumbent to resort to increasing coercion. This may become even more true if, as revealed by the non-significant impact of the interaction term and the significant effect of the political climate variable,

53
The inclusion in the equation of the variable assessing the extra-economic leadership
provided by the incumbent helps to paint a broader picture of the forces determining electoral
outcomes. This new description results from both the direct effect of presidential approval on the
incumbent vote-share and the changes it forces in the way candidate effects should be
appraised.15 As data availability remains limited to only thirty-six of the forty-one elections so far
reviewed, a separate discussion is provided, as a sample-based extension of the Trimmed Version
model already discussed (see Table 5.4).
In this new examination, the variability of the incumbent vote-share gets slightly higher
than for the original universe of forty-one elections (std.dev.36=15.76 versus std.dev.41=15.29),
which makes logical to find some light increase in the standard error estimate of this revised
model (SE36=6.34 versus SE41=6.13). Nonetheless, the model’s goodness of fit measure remains
at exactly the same point, adjusted R2=.84, which suggests that the main contribution of this
extended Trimmed Version is to better illustrate the complexities underlying fluctuations in
political support.
Overall, improving the general model specification by incorporating the political
referendum hypothesis (measured by presidential popularity) offers a qualitatively more refined
sense of the cross-pressures confronted by electorates (see Table 5.4)
such a move may pass unnoticed to voters and the “showing toughness” tactic may end up being handsomely rewarded with votes. 15 As discussed in Chapter 4, conceptual and statistical reasons suggest “decontaminating” the “net candidate advantage” variable from the influences of presidential political popularity and inflation performance over time, rendering a new variable with new values.
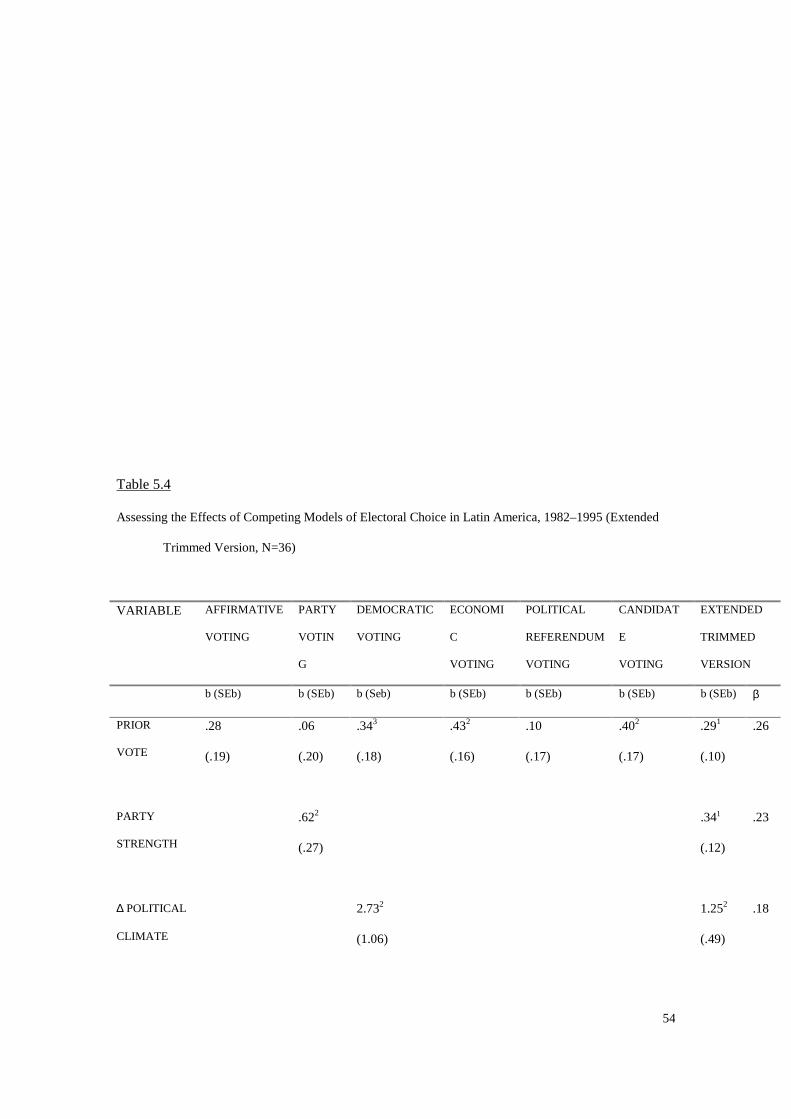
54
Table 5.4
Assessing the Effects of Competing Models of Electoral Choice in Latin America, 1982–1995 (Extended
Trimmed Version, N=36)
VARIABLE AFFIRMATIVE
VOTING
PARTY
VOTIN
G
DEMOCRATIC
VOTING
ECONOMI
C
VOTING
POLITICAL
REFERENDUM
VOTING
CANDIDAT
E
VOTING
EXTENDED
TRIMMED
VERSION
b (SEb) b (SEb) b (Seb) b (SEb) b (SEb) b (SEb) b (SEb) β
PRIOR
VOTE
.28
(.19)
.06
(.20)
.343
(.18)
.432
(.16)
.10
(.17)
.402
(.17)
.291
(.10)
.26
PARTY
STRENGTH
.622
(.27)
.341
(.12)
.23
∆ POLITICAL
CLIMATE
2.732
(1.06)
1.252
(.49)
.18
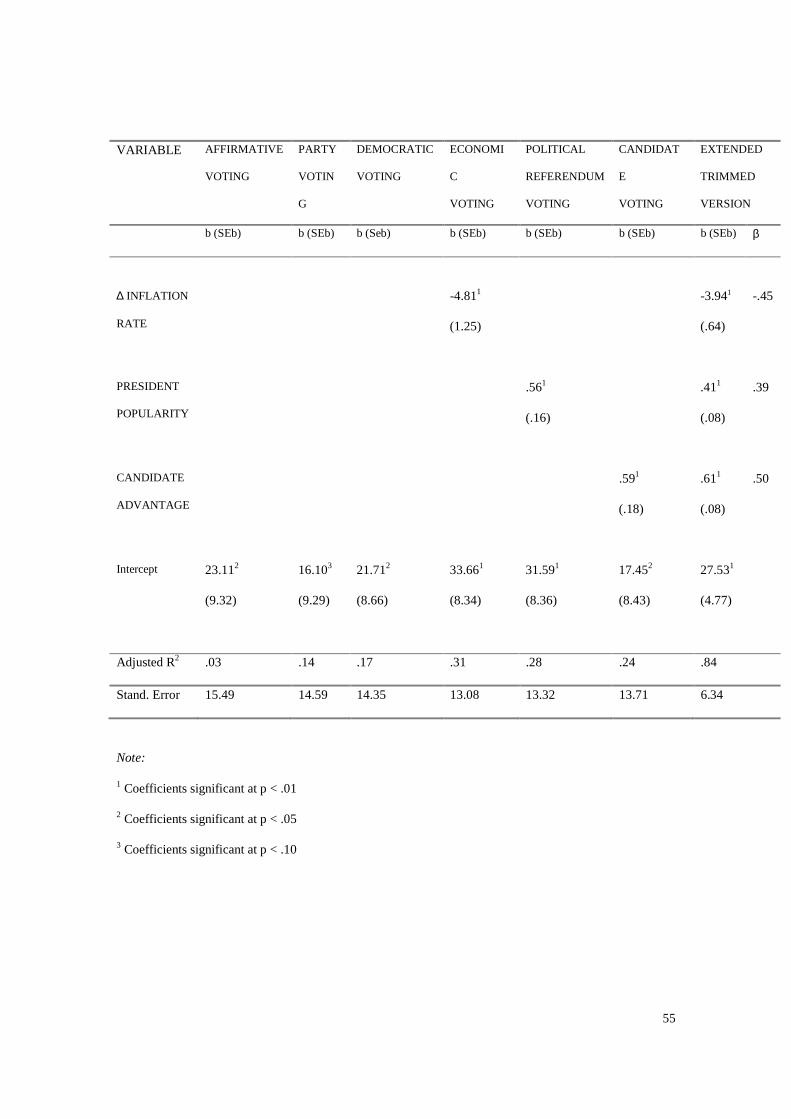
55
VARIABLE AFFIRMATIVE
VOTING
PARTY
VOTIN
G
DEMOCRATIC
VOTING
ECONOMI
C
VOTING
POLITICAL
REFERENDUM
VOTING
CANDIDAT
E
VOTING
EXTENDED
TRIMMED
VERSION
b (SEb) b (SEb) b (Seb) b (SEb) b (SEb) b (SEb) b (SEb) β
∆ INFLATION
RATE
-4.811
(1.25)
-3.941
(.64)
-.45
PRESIDENT
POPULARITY
.561
(.16)
.411
(.08)
.39
CANDIDATE
ADVANTAGE
.591
(.18)
.611
(.08)
.50
Intercept 23.112
(9.32)
16.103
(9.29)
21.712
(8.66)
33.661
(8.34)
31.591
(8.36)
17.452
(8.43)
27.531
(4.77)
Adjusted R2 .03 .14 .17 .31 .28 .24 .84
Stand. Error 15.49 14.59 14.35 13.08 13.32 13.71 6.34
Note:
1 Coefficients significant at p < .01
2 Coefficients significant at p < .05
3 Coefficients significant at p < .10
56
On the one hand, the patterns articulating voting results remain very similar to those for the forty-
one elections in relation to each major predictor’s estimates (after discounting for prior vote
effects).16 This result tells us that for all the modifications involved, the broader argument
remains fairly robust. On the other hand, as the gap in the strength of the coefficients reveals, this
re-specified version suggests that the heuristic approach to voting behavior in Latin America can
be better served by first separating long- and short-term forces, and then distinguishing between
economic and non-economic effects. Thus the first cut separates those influences that involve a
time-intensive prerequisite to develop (i.e., the socialization opportunity for partisanship to
emerge, the crystallization of cultural trends and political traditions involved in the prior vote
measure, or the comparison for democratic achievements between administrations) from those of
a short-term nature (economic achievements, political leadership and candidates’ attributes). In
fact, a comparison of standardized coefficients shows a cut between long-term forces (ranging
between .18 and .26) and short-term forces (ranging between .39 and .50). The second cut
distinguishes between reliance on economic performance and dependence on symbolic utilities
embodied in manifestations of political leadership or the attractiveness of candidates’
biographical and political personas.
The extended Trimmed Version of the models also helps the economic explanation to
57
gain more ground, although this argument still falls behind the candidate-related effects.
Interpreting the values of this version, one can say that, with everything else held constant, for
every ten points of incumbent’s net candidate advantage over his or her opponent’s, there is an
expected average return of six percent more votes for the ruling party ticket (10∗.61=6.1). In a
like manner, when comparing one election held under a situation of “strong inflation increase” in
the annual price rate to another of “price stability,” there is an average expectation that the
incumbent vote loss for the
first scenario will be almost eight percentage points higher than for the second scenario (2∗-
3.94=-7.88). Similarly, for every five percent rise in the non-economic popularity of the
president, the party-in-office can expect, on average, to harvest an additional two percentage
points in votes (5∗.41=2.05).
The relative strength of these estimates means that electoral results are not shaped by
decisions of either instrumental or symbolic nature alone. Electorates react in relation to data
they receive (i.e., an urgency to stabilize the economy, a need for a strong-willed authority,
impressionistic information about candidates, a declining politicization of group and class
identities) and in relation to the sources of decision they lack (i.e., poor socialization experiences
of partisanship, consistent preferences for democratic performance). This implies that a plurality
of reasons articulates the final voting decision with different intensity. Thus, electorates do not
ignore material clues when they consider using the election as a referendum on the political
leadership of the government. Nor do they disregard perceptions of the nation’s quality of life (as
captured by the political leadership indicator) merely because they show susceptibility to
economic circumstances. Likewise, one should not expect that voters’ attention to candidate’s
appeals would make outcomes less dependent on financial states.
16 This similarity is remarkable considering that, due to data unavailability, the sample of 36 elections analyzed here misses cases mostly from the pre-1990 period, thus posing a potential problem of period-related biases for the findings. Fortunately, all in all, this seems not to be the case.
58
Such multidimensional sensitivity reflects the plurality of sources of political
capitalization available for incumbents. This diversity can be illustrated by simulating electoral
scenarios. In theory, setting all variables to their mean values would yield an incumbent vote-
share of 31.3 percent. This value underestimates by less than five percentage points the grand
mean reached for the whole sample (that is, corresponds to an average absolute prediction error
of 4.68). There may be multiple reasons for this, such as unmeasured factors not included in the
general model (e.g., issue proximity), the trimmed nature of each specific model (which left aside
some variables of interest for the sake of parsimony), and the measurement errors of some of the
predictors included. All these effects are, therefore, contained in the error term. In a situation of
strong inflation increase, one can anticipate an average proportion of incumbent votes of 21.9
percent, with all other variables held constant.17 Naturally, such a downturn in relation to the
average pattern—9.4 percent—seems to justify the popularity of economic explanations.
On the other hand, this dramatic “free fall” in support for the ruling party is not doomed
to happen if incumbents motivate electorates to ponder other decisional clues. For example, an
energetic display of initiative and commanding authority by the president in the realm of
domestic and foreign policy (especially if it echoes matters that the public judges to be of high
priority) would make people trust that, despite the dire state of the economy, the public order is
assured and the party-in-office has the capacity to make decisions. Then, whenever events allow
the president’s approval to reach, for example, 58 percent (that is, 14 percentage points above its
average level), one can expect a cancellation of the negative effects provoked by the economic
crisis (a predicted incumbent vote-share of 31.5 percent).18
17 This value comes from adding the values for the following equation: 21.9%=27.53+.29(47)+.34(28.5)+1.25(-.42)-3.94(6)+.41(.00)+.61(-7.95) 18 Fifty eight percent of approval corresponds to roughly twenty units in residual scores. The resulting average electoral outcome is a product of the following structure, where the left-hand side value represents the resulting incumbent vote-share and the right-hand side of the equation corresponds, in order, to the addition of the intercept value and the estimates for prior vote (set to its mean), party strength (set to its mean), the change in the rate of the political climate variable (set to its mean), the change in the annual rate

59
If it is true that such levels of popularity are hard to accomplish when financial distress
abounds, it is also true that presidents and their parties count on numerous opportunities and
resources to strengthen their political leadership (e.g., nationalism, fight against crime or
terrorism, party mobilization, etc.) . In a similar way, incumbents may attempt to offset negative
economic trends by relying heavily on a candidate-centered campaign, likely to produce a
reasonable advantage over their major contenders. Thus, for example, whenever the net
advantage for the incumbent candidate exceeds by 7 percentage points the opposition’s, those
negative effects coming
from a poor economic situation can be overcome (that is, vote-share of 31 percent is again
attained).
Typically, incumbents resort to more than one asset to enhance their chances of
reelection. Even if financial conditions seriously worsen before elections, incumbents can still
hope to compensate by relying on a partisan fidelity higher than average (say, 33 percent rather
than just 28.5), staging a series of politically bold, approval-boosting decisions (say, raising
popularity to 40 percent, which corresponds to about 7 residual unit scores), and nominating a
candidate able to match up his or her opponent’s advantage (say, to reduce the difference to
zero). In such circumstances, incumbents can still expect to obtain about 31.1 percent of the valid
votes, on average.19
In summary, both economic and non-economic variables are key in shaping support for
the incumbent party at the ballot box. To contend that economics is all that matters is to set up
the wrong assumptions about how average electorates produce decisions and to ignore the actual
of inflation (set to the “strong inflation increase” category), presidential popularity (set to 20 residual units score), and net candidate advantage (set to its mean). In figures: 31.3%=27.53+.29(47)+.34(28.5)+1.25(-.42)-3.94(6)+.41(20)+.61(-7.95) 19 This results from adding the corresponding estimates with the following values: 31.1%=27.53+.29(47)+.34(33)+1.25(-.42)-3.94(6)+.41(7)+.61(0)

60
voting experience of Latin America. Given the fact that elections convey, ultimately, a decision
about support or rejection of political continuity, the presence of important non-economic factors
does not come as a surprise.
Economy is a critical variable for understanding fluctuations in incumbent support at the
polls. But the evidence so far analyzed also shows that once the impact of the economy is
controlled for other determinants that are non-economic in nature and scope, it fails to lead the
explanatory race. Moreover, not all forms of measuring economic effects are equally important:
the rate of change of inflation over time stands out as the most salient. These conclusions are in
fact pretty consistent with the scattered substantiation produced by other Latin Americanists who
place
inflation as the most efficient measure of economic voting and underscore the limited influence of
this approach after adjusting for the impact of political forces (see Remmer 1991; Rius 1992;
Carrión 1998). Conversely, the electoral fortunes of ruling parties are highly responsive to the
political leadership displayed by the head of the government. This indicates that a general sense
of the quality of life achieved by the nation, beyond economics, as captured by the president’s
popularity, is an important yardstick against which voters decide whether or not to grant a new
chance to the current authorities.
Candidate effects emerge as the strongest explanatory argument. The importance of these
effects underscores the weight of cultural traditions that make personalistic traits the most
effective vehicles of politicization. It is also consistent with a picture of poor partisan
socialization resulting from the resiliency of authoritarian politics in the region. In this regard, as
long-term forces are structurally handicapped in influencing voters (although they are still
capable of having limited influences on voting), the prevalent reasons for choice reside in short-
term factors.
These findings defy a good deal of conventional wisdom about economic voting in Latin

61
America. However, several limitations in the assessment of the economic voting argument have
to be acknowledged. First, there may perception gaps with regards to objective conditions and
that cannot be appraised using aggregate-level analysis. Second, the effect of macro-economic
performance tackles only retrospective forces, while one may speculate that electorates may be
more prone to react to promises and the prospective performance. Third, individualistic
pocketbook-oriented reasoning may be at play, which is missed by the intrinsically sociotropic
nature of the macro-economic indicators.20 Fourth, electorates may actually have an economic
memory extending longer than the two-year period assumed here, judging performance across
administrations rather than only intra-administration successes or failures. Finally, there may be
obstacles to holding governments fully responsible for the economic performance, resulting from
factors as varied as acknowledged dependency on external powers or international market
instability, the institutional structure of the country, lack of trust in elections, and low confidence
in the economic responsiveness of parties.
All these eventualities may handicap a more substantive salience for the economic voting
argument. Yet they must not conceal the fact that macro-economic conditions surveyed by
conventional standards fare but second when compared to other non-economic effects. In order
to narrow down the discussion of effects in a manner that is both theoretically sound and
empirically feasible, the next chapter examines how each of the models of electoral choice
behaves under different institutional and macro-economic conditions.
20 Unfortunately, measures which might come closer to the individual economic experience, such as purchasing power parity or real wages, were either not available for the whole range of years here studied or were measured at wholly different levels in each country (e.g., in some countries covering urban areas, in others only the manufacturing sector, in others only the service sector of one of several major urban centers), all of which would have made comparisons unmeaningful.

62
Chapter 6: Taking Contextual Differences into Account
Different institutional and macro-economic environments furnish different structures of
opportunity for the effective development of the decisional clues triggering the vote. It is
therefore safe to assume that electorates voting under dissimilar contextual conditions will find
available, will be motivated to follow, and will make use of divergent informational shortcuts
and sources of decision. Put succinctly, people voting under different conditions make their
choices differently. This view is shared by a number of scholars, such as Powell and Whitten
(1993), who insist that contextual distinctions must be taken into account when attempting to
make sense of the inconsistency of effects in cross-national studies of voting, particularly of
those focusing on economic arguments.
In this chapter, I explore how the models of electoral results perform under varied
situations of political institutionalization, party systems and macro-economic activity. After
reviewing theoretical and methodological considerations, I examine the way in which each
argument interacts with the major features of the institutional context surrounding forty-one
presidential contests. I then replicate the analysis for the subsample of cases for which
information about the political leadership of the incumbent can be added. A second review of
contextual effects focuses on how situations of recession and growth furnish different
opportunities for the electorate. This analysis aims at discovering whether or not the
conventional wisdom about the presence of “protest” voting (as illustrated by asymmetrical
responses to circumstances) is verifiable.
Contextual Effects: Theoretical Underpinnings and Methodology
People´s political life does not unfold in a vaccum. The stimuli that develop their voting
preferences, the availability or saliency of decisional clues to use, the constraints to use elections
63
to reveal a deep-seated value (or to substitute the lack of core beliefs for narrower and shallower
orientations) refer to outcomes related to their environment of decision. Three spheres represent
the key environmental influences present in Latin America throughout the years here examined:
the level of economic stability or instability upon which electorates lived, the structure of the
party systems that articulated the electoral disputes, and the degree to which political life in each
country followed clear-cut institutional lines, that is, predictable and formal rules of political
organization and control. These three contextual effects summarized the critically different
scenarios observed across the region, submitting different national electorates to somewhat
dissimilar opportunities and conditions1.
The Effect of Political Institutionalization.
Highly institutionalized contexts facilitate a clear division of roles and responsibilities
among incumbent parties, opposition forces and the remaining branches of power. This explicit
division makes it easier, at least in theory, for voters to glimpse the extent to which attribution of
responsibility should fall into governments’ hands or not and, consequently, hold the incumbent
accountable for all major developments (Mainwaring and Scully 1995). In this way, a connection
between economic performance and electoral decision can easily develop.
Economic voting is also likely to occur under institutionalized systems because of the
greater chances that parties may develop stable policy profiles that voters can identify. Also, as
in the case of advanced democracies, political independence may push voters to structure their
choice around government outcomes. Party voting can be expected to exert an unambiguous and
substantive effect, since this type of context provides opportunities for partisan socialization.
Candidate voting, on the other hand, is likely to play a relatively marginal role, since room for
1 Occasionally, changes at any of these three contextual spheres in one country during this period of 1982-1995 resulted in one same electorate subject to markedly different environmental influences from one election to another one.

64
personalistic politics is limited and a practice of collegial, consensual and highly
professionalized
paths of selecting party candidates usually dominates. In principle, these circumstances should
keep the role of presidential prestige in time of election fairly limited; on the other hand, given
the intrinsically greater expediency in keeping the president liable for achievements in the extra-
economic domain, some systematic leadership effect may show.
In relation to democratic performance, highly institutionalized regimes do not leave
much space for further advancement of civil liberties and political rights. On the other hand,
these regimes do certainly shut down any attempt at reversing such liberties and rights.
Therefore, in contexts characterized by high institutionalization, these matters can be expected to
look more like constants than variables.
Situations characterized by inchoate party systems offer a different array of effects.
Since rules and formal procedures are less binding between leaders, the public and party
organizations, and political linkages are forged through personal contacts and material benefits,
candidate voting gains primacy. Frequently, its pivotal role is a consequence of the existence of
parties as exclusive instruments for the advancement of the political will of individual leaders.
Party voting, on the other hand, is marginal to the process of decision, not merely as a result of
the poor conditions for the development of partisan identities among the people, but also because
of the structural difficulties in converting social cleavages into partisan alignments.
Economic voting may work rather ambiguously in such situations. Given the fact that
responsibility attribution is difficult to achieve, economic performance may remain without
political overtones. On the other hand, since the general characteristics of poorly institutionalized
systems do not leave many other clues to voters besides short-term forces, one should grant the
existence of some degree of reaction to accomplishments in the realm of finances. Still, the
prevalence of clientelistic arrangements may hinder the presence of straightforward effects of the

65
economy, since numerous individuals may rely more heavily upon particularistic channels of
assuring material benefits in exchange of votes, ignoring the trends at the national level.
Finally, people’s receptivity to charismatic authority and the relative easiness of deciding
the vote according to the commanding ability of the president is likely to confer a central position
to the model of political referendum. Also, one can expect considerable sensitivity to successes
on the road of democratization as a result of the rhetorical salience of democratic issues among
the media, partisan factions, and the anti-authoritarian social movements that pushed forward the
transition.
To explore these interactions empirically, I split the sample of pre-electoral contexts into
two groups according to levels of partisan institutionalization. Those with a score of 1 comprise
situations characterized by “high institutionalization”, while all others are considered to be
“weakly institutionalized.”2 The list of all countries appears in Table 6.1. For the individual level
discussion, to be developed in Chapter 7, each country under study is taken to represent a
different situation, with Uruguay of 1994 at one pole, Perú of 1995 at the other, and Argentina of
1995 placed half-way of each pole (see Appendix B).
Table 6.1
Descriptive Values of Political Institutionalization and Party System Format
COUNTRY
(Election Month/Year)
POLITICAL
INSTITUTIONALIZATION*
NUMBER OF
EFFECTIVE PARTIES**
Argentina (5/1989) 1 2.57
Argentina (5/1995) .5 4.54
2 The sources are Dix (1992) and Mainwaring and Scully (1995: Chapter 1). Levels of institutionalization result from a composite index accounting for the stability of interparty competition, the social rootedness of partisan forces, the salience of party organizations in structuring the electoral process, and the continuity in party policy identity.

66
Bolivia (7/1985) 0 4.15
Bolivia (5/1989) 0 4.36
Bolivia (6/1993) 0 3.92
Brazil (11/1989) 0 2.78
Brazil (10/1994) 0 8.68
Chile (12/1993) 1 5.06
Colombia (5/1982) 1 2.06
Colombia (5/1986) 1 1.98
Colombia (5/1990) 1 2.45
Colombia (5/1994) 1 2.97
Costa Rica (2/1982) 1 2.38
Costa Rica (2/1986) 1 2.27
Costa Rica (2/1990) 1 2.21
Costa Rica (2/1994) 1 2.21
DominicanRep(5/1982) .5 1.99
DominicanRep(5/1986) .5 2.25
DominicanRep(5/1990) .5 2.53
DominicanRep(5/1994) .5 3.05
Ecuador (6/1984) 0 3.97
Ecuador (1/1988) 0 7.63
Ecuador (5/1992) 0 6.99
El Salvador (3/1989) .5 2.40
El Salvador (3/1994) .5 3.03
Guatemala (11/1990) 0 2.98
Honduras (11/1985) 1 2.17
Honduras (11/1989) 1 2.12
Honduras (11/1993) 1 2.00

67
México (7/1988) .5 1.82
México (8/1994) .5 2.22
Nicaragua (2/1990) 0 2.28
Panamá (5/1994) 0 3.79
Perú (4/1985) 0 2.46
Perú (4/1990) 0 2.32
Perú (4/1995) 0 2.99
Uruguay (11/1989) 1 2.93
Uruguay (11/1994) 1 3.35
Venezuela (12/1983) 1 2.65
Venezuela (12/1988) 1 2.42
Venezuela (12/1993) 1 2.83
* Scores for political institutionalization follow Mainwaring and Scully’s (1995) classification. For the first
construct, a value of 1.00 means high institutionalization or political development, a value of .5 represents
an intermediate level, and a value of 0 signifies a poorly institutionalized or inchoate party system.
** The number of effective parties is computed according to the Laakso-Taagepera index for an adjusted-
by-valid votes averaged measure of electoral support at the congressional level over time (e.g., lower
house). It is derived by squaring each party’s (or coalition) share of seats, adding all of these squares, and
dividing 1.00 by this number: Ns=1/Σρi2, where Ns is the effective number of parties expressed in seats and
ρi is the fractional share of seats of the i-th party. An index of 2.57, like in the case of Argentina in 1989, for
example, means that the number of effective parties exceeds two but remains below three.
Sources: Nohlen (1993); Keesing’s Record of World Events (various years); Dix (1992); Mainwaring and
Scully (1995).
The Effect of Party Systems.
68
Since systems that are predominantly organized in two-party formats allow for a better
identification of the incumbent’s responsibility for performance in general, macro-economic and
democratic outcomes can be expected to be influential in these contexts. To the extent that the
president’s approval is founded on the management of extra-economic matters, it is also likely to
play an important role in shaping voters’ choice. These conditions tend to limit the variance of
the partisan influences, so low party voting can be expected. Actually, much of the effect of party
voting is likely to be captured by prior vote record, rendering the affirmative voting argument
very effective. In addition, candidate voting should present attenuated effects.
On the other hand, multipartism makes it harder for electorates to assign responsibility
for performance, since the sources to blame or credit are multiple. Accordingly, economic voting,
along with democratic and leadership performance voting, is likely to be deflated. Furthermore,
given the higher costs involved for voters in terms of following each party’s standings on the
issues of the day, defaulting on affirmative voting clues can be expected to be important. By the
same token, partisan forces may be diminished, leaving the door open to candidate-related
influences, although at a moderate level.
I identify party systems following the Laakso-Tagaapera index of the number of effective
parties in the Lower House previous to each presidential contest and dividing the index into two
groups. One group comprises those elections held within a predominantly two-party system,
holding an index equal to 2.75 or lower (ranging from 1.82 before the 1988 Mexican elections to
2.65 before the Venezuelan elections of 1983). The second group includes those elections held
within a predominantly multiparty system, holding an index equal to 2.76 or larger (ranging from
2.78 before the 1989 Brazilian elections to 8.68 before the 1994 contests in that same country).
For the complete list, see Table 6.1.
The Effect of Macro-Economic Circumstances.
69
Good and bad economic times are not only expected to enhance or deflate different
arguments of voting behavior but also to predispose individuals differently in the way they
appraise economic information as a decisional clue. Times of recession and/or economic
discontinuity are likely to increase individuals’ sensitivity to respond electorally based on how
they might have done financially. Therefore, pocketbook and retrospective reactions should
prevail in light of the minimal attention and predictability of policy programs under situations of
downward instability, as well as the trauma that hyperinflation upsurges created in few of the
countries with the larger electorates of the region. In theory, the policy unpredictability blurs the
chances of prospective economic voting. Concomitantly, hyperinflation experiences impair
considerations of sociotropic nature, given the priority attained by considerations of personal
survival. On top of this, economic distress under inchoate party systems may induce voters to
rally against the incumbent to a greater extent than would be normally the case, since no partisan
anchoring sentiments are developed. The political translation of economic grievances does not
become merely an option for punishment, but may reflect a skewed orientation against the ruling
party.
Situations of economic ungovernability leave room for the active intervention of the
incumbent through economic plans and stabilization shocks. Often, when interacting with poorly
institutionalized systems, presidents develop these programs autonomously, bypassing party and
congressional authorities. Since economic policy becomes personalized, the attribution
connection is greatly simplified. Furthermore, this situation reinforces the centrality of the
president’s political leadership and the candidates’ attributes.
When prosperity reigns, the urgency to choose a government on the basis of economic
criteria depends on the recent record of the country. Incumbents naturally seek to politicize the
economy. Since voters’ personal conditions are not immediately threatened, their voting decision
is more likely to be based on the financial state of the country. For the same reason, forward-

70
looking orientations may take place. But citizens are risk-averse, which inclines them to ponder
the past as
well and reward the incumbent party for its achievements in this area.
Economic circumstances do not guarantee a symmetrical certification of the ruling party
for its positive and negative attainments in the economic field. Even if prosperity is moderate
among conditions of economic stability, one may speculate that voters may react to material
conditions in light of the adroitness to which they can link financial states to government politics.
Since in Latin America economic continuity presupposes the maintenance of the major features
of a state-centered model of development, we may assume that public perception of economic
fortunes is a result of the incumbent party’s actions, both at the personal and societal levels.
I assess the overall macro-economic situation according to the behavior of the average
annual rate of the gross domestic product. The sample is split in two: elections held in times of
“crisis” (a weighted GDP rate between +2.9 and -9.5 percent, that is, situations ranging from
stagnation to depression in per capita terms) and in times of “prosperity” (a weighted GDP rate
between +3.1 and +8.4 percent, that is, situations ranging from small progress to economic
expansion in per capita terms).3 By proceeding in this way, I am also able to explore the
existence of asymmetric responses to the incumbent economic performance. At the individual
level analysis of Chapter 7, countries are aligned according to the level of economic
discontinuity (see Appendix B).
Contextual Cleavages and Models of Electoral Choice
The notion that electorates who make decisions under dissimilar institutional and macro-
3 Of course, this implies pooling cases with different degrees of crisis and prosperity. However, since the cut-off point (3 percent) remains highly proximate to the average population growth rate (2.2 percent) and leaves out an equivalent number of cases in each group, it makes sense to set the division in this way. The average GDP growth rate for the first group stands at -.70 (n=19) and for the second group the mean stands at 4.81 (n=22).

71
economic settings do not operate in the same way is confirmed by the data. A look at Table 5.2
reveals that each milieu yields a particular scenario of electoral choice in terms of the intensity of
support for political continuity or change. To begin with, highly institutionalized contexts offer a
greater solace for incumbents compared to inchoate party systems, as two-party systems do
relative to multiparty structures. The difference reaches ten percentage points. Divergence further
extends to the degree of fluidity in pro-incumbent support: weakly institutionalized and
multiparty systems show close to double the dispersion displayed by politically developed and
bipartisan regimes.4
Different institutional configurations also yield different magnitudes of political habits
(such as prior vote) and partisan traditions. As a rule, long-term sources of political support are
stronger among institutionally advanced and bipartisan orders. A pattern of affirmative voting
seems particularly stronger among two-party systems. Naturally, then, as prior vote and party
support seem consistently associated with institutional characteristics, as does incumbent vote-
share, it is reasonable to speculate that some pattern of systematic covariation may be present for
these three sets of variables. Also, as expected, volatility across elections is greater among less
politically developed and more pluralistic systems—almost twice as large as the one observed
among opposite circumstances.
In the area of democratic performance, highly institutionalized systems, by definition,
fully warrant political rights and freedoms to their citizens, thereby offering almost no room for
improvements. Both the lower amount of positive change and the lower dispersion of this
variable illustrates this situation. Conversely, most inchoate party structures are coincidental with
newly democratized regimes, that is, political orders still in the process of consolidating
citizenship entitlements and liberties. These different structures of opportunity are highly
4 Reasons explaining this may vary for each feature, however. Among weakly institutionalized systems, the intrinsic character of non-consolidated democracy makes it reasonable to find more electoral volatility. On

72
consequential for the subsequent variability in government performance in deepening democracy
across situations. Interestingly enough, the same pattern is reproduced across different party
systems.
Table 5.2 also makes obvious that institutional contexts are not neutral in terms of the
economic conditions they house or promote. Highly institutionalized and bipartisan regimes are
more effective in securing growth. Elections held in inchoate party systems, in turn, are more
prone to be encircled by greater inflation rates and levels of unemployment. Multiparty systems,
on the other hand, are more effective in keeping prices low by the time of elections. The question
of whether this entails an inherently greater efficacy of multiparty systems to deal with inflation
or the presence of greater political constraints over authorities in two-party systems to generate
efficient deflationary political cycles, however, still remains to be answered.
Profiles of incumbent political leadership and candidates’ appeal also present systematic
differences across institutional conditions. The ruling authorities benefit more under high
institutionalization, but the pattern in terms of the party systems is ambiguous. Whereas two-
party formats give to political leadership a greater saliency, they assure the incumbent nominee a
lower advantage over his or her rival relative to that he or she might have in a multiparty system.
The different effects imposed by institutional conditions on the way determinants of
electoral decision perform in the region are replicated by macro-economic circumstances.
Distinguishing contests by the level of economic crisis or prosperity that surrounds them
illustrates another gap in how models of choice behave. The abyss across economic contexts is
remarkably seized by the 13 percentage points that separate the political endorsement of the
incumbent whenever good times precede the election, compared to a situation of economic
downturn.
The data reveal several differences. For one, presidents ruling under prosperity can
the other hand, the reason leading to vote instability among multiparty regimes may be found in the inherent
73
expect a sort of “honeymoon” effect, which extends popularity for economic reasons to
performance in extra-economic arenas, as suggested by the average presidential approval of 41
percent. That bonus rarely exists for presidents ruling in times of economic slump, forced to
“administer the crisis” (average approval of 24 percent). After removing the effect of economic
factors on the president’s popularity, the residual scores show a consistent pattern of positive
values in times of growth and negative values in time of decay. In addition, each environment
evokes a different reaction to candidates’ attributes. Bad times pave the way to a greater
advantage for the challenger, whereas times of progress reduce such edge to almost zero.
Interestingly enough, situations of crisis and prosperity do not leave room for the
articulation of specific trade-offs in terms of policy outcomes. Economic slowdowns in pre-
electoral moments are usually accompanied by greater, not lower, rates of inflation in the short
and long run, compared to situations of economic advancement. Furthermore, levels of
unemployment remain pretty much the same across situations. Indirectly, this picture hints at the
limited opportunities that Latin American leaders have had to stage efficacious political business
cycles prior to presidential elections. These policy constraints co-exist with a lack of clear-cut
differences between macro-economic backgrounds and the magnitude of prior votes and party
strength. Since the latter are measures with a temporal lag that precedes the assessment of
economic activity, whatever the intensity of political traditions and alignments may be, they are
unlikely to grant a differential leverage to incumbents in terms of their abilities to manage the
economy to their favor.
Finally, it appears that times of crisis—not prosperity—are more prone to coincide with
greater democratic achievements. One reason for this is the overlap of regimes that face relative
prosperity and that are highly institutionalized, a quality which by definition does not allow
much progress on democratic matters. Another plausible reason is the electoral strategy followed
need to build different electoral and ruling coalitions for every new electoral occasion.

74
by incumbents. Oftentimes, economic downfall is accompanied by social turmoil and
ungovernability, but in electoral circumstances heavy-handed initiatives are withheld until the
ballots are counted. Not rarely is it left to the winner of the elections to straighten things out,
often by resorting to authoritarian means.
Taking Account of Different Institutional Contexts
Table 6.2 summarizes the interplay between environmental conditions and the initial and
extended trimmed versions of the models. For the initial trimmed versions, the interaction
between models and specific institutional features largely enhances the explanatory power of
voting outcomes. (This is presented at each column of the Table with the indication initial in
parenthesis.)
As a rule, electoral arguments respond differently to institutional cleavages. Both
bipartisan and highly institutionalized regimes are able to offer a more precise understanding of
electoral choice than situations of multipartism and poor political development with regards to
how well the arguments summarized by the trimmed versions fit plausible explanations of
electoral support. Comparing summary statistics across the board, highly developed and two-
party systems reduce the amount of uncertainty to an average of plus or minus 4.9 and 4.8 against
an average proportion of uncertainty of plus or minus 5.2 and 6.8 for poorly developed and
multiparty systems, respectively. (In terms of mean prediction error, bipartisan and highly
institutionalized systems exceed in accuracy multiparty and inchoate party systems: in percentage
points, 3.18 and 3.36 versus 3.39 and 4.27, respectively.)
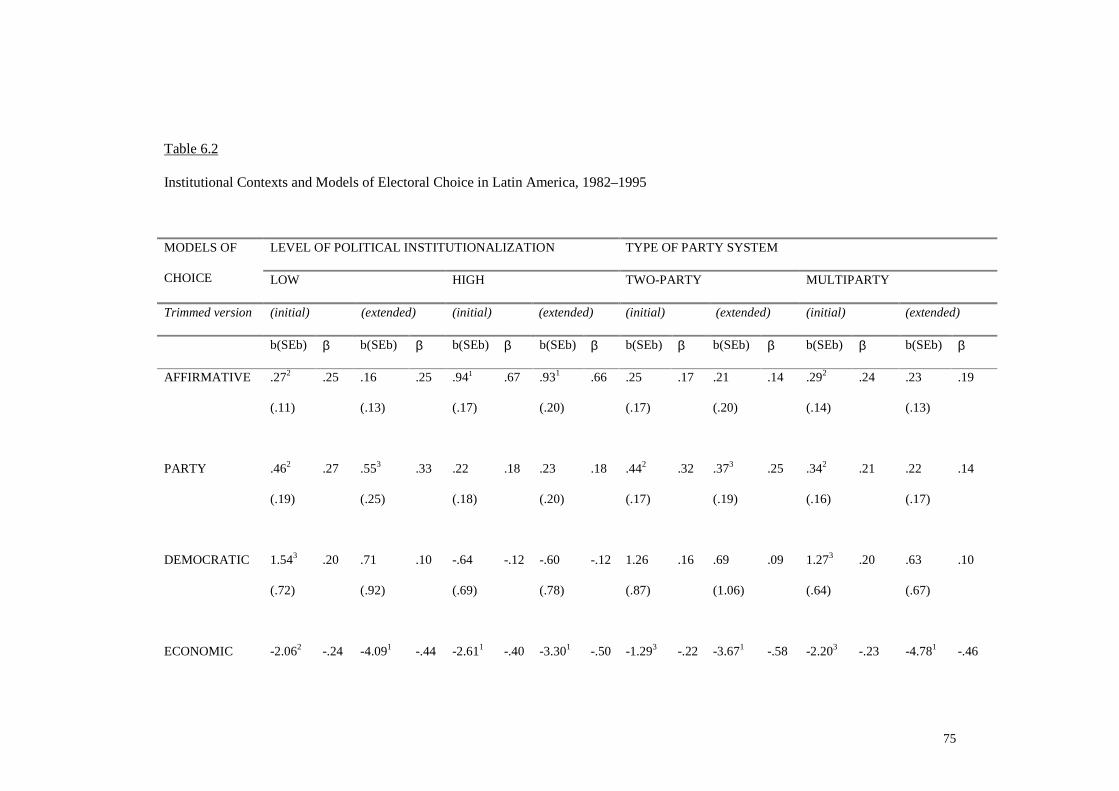
75
Table 6.2
Institutional Contexts and Models of Electoral Choice in Latin America, 1982–1995
MODELS OF
CHOICE
LEVEL OF POLITICAL INSTITUTIONALIZATION TYPE OF PARTY SYSTEM
LOW HIGH TWO-PARTY MULTIPARTY
Trimmed version (initial) (extended) (initial) (extended) (initial) (extended) (initial) (extended)
b(SEb) β b(SEb) β b(SEb) β b(SEb) β b(SEb) β b(SEb) β b(SEb) β b(SEb) β
AFFIRMATIVE .272
(.11)
.25 .16
(.13)
.25 .941
(.17)
.67 .931
(.20)
.66 .25
(.17)
.17 .21
(.20)
.14 .292
(.14)
.24 .23
(.13)
.19
PARTY .462
(.19)
.27 .553
(.25)
.33 .22
(.18)
.18 .23
(.20)
.18 .442
(.17)
.32 .373
(.19)
.25 .342
(.16)
.21 .22
(.17)
.14
DEMOCRATIC 1.543
(.72)
.20 .71
(.92)
.10 -.64
(.69)
-.12 -.60
(.78)
-.12 1.26
(.87)
.16 .69
(1.06)
.09 1.273
(.64)
.20 .63
(.67)
.10
ECONOMIC -2.062 -.24 -4.091 -.44 -2.611 -.40 -3.301 -.50 -1.293 -.22 -3.671 -.58 -2.203 -.23 -4.781 -.46

76
(.86) (.81) (.75) (1.01) (.67) (.90) (1.07) (1.03)
POLITICAL
REFERENDUM
.442
(.14)
.34 .10
(.10)
.15 .222
(.09)
.29 .651
(.17)
.45
CANDIDATE .691
(.09)
.75 .721
(.13)
.62 .22
(.14)
.20 .21
(.16)
.19 .511
(.10)
.53 .651
(.14)
.63 .711
(.10)
.75 .491
(.15)
.38
Intercept 23.041
(4.55)
27.861
(6.25)
22.601
(9.23)
-1.08
(10.08)
22.942
(8.44)
32.712
(10.92)
23.871
(6.11)
35.561
(6.96)
Adjusted R2 .92 .92 .80 .79 .81 .82 .85 .87
Standard Error 5.01 5.44 4.78 4.97 4.72 4.93 7.08 6.63
N= 22 17 19 19 22 19 19 17
Note:
1 Coefficients are significant at p < .01
2 Coefficients are significant at p < .05
3 Coefficients are significant at p < .10

77
Institutionalization.
The various arguments presented in the trimmed versions perform differently under each
particular context. Highly institutionalized regimes, for example, prove to be an island of specific effects.
First, candidates’ appeals have a negligible influence. Second, the political referendum argument reverses
the modal effect, which defies the “toughness rewarded” hypothesis (although it does not achieve
statistical significance). Finally, there is a high incidence of economic performance on people’s choice.
All this suggests that societies whose political systems are highly developed permit both a higher degree
of economic accountability and a lower tolerance for any authoritarian deviation undergone by their
governments.
In addition, under highly institutionalized regimes, patterns of voting achieve greater stability,
which reflects the larger impact of the affirmative model. Actually, a look at the beta weights confirms
that prior vote is the leading force behind the outcomes, whereas the unstandardized coefficient points
out a close to one-to-one ratio in the votes collected by the incumbent party over time. Furthermore,
given the more intensive loading of partisan contents in the measurement of affirmative voting, the
former is likely to show a high collinearity with the latter, thus depressing the effects of party strength.
Incumbents in less institutionalized systems are subject to a different combination of models of
voting. Since by definition parties are poorly structured, the slightest difference in partisan stability
within this group has a greater impact than among highly institutionalized systems. Consequently, party
alignments can produce significant differences in the odds for political continuity. Still, this may entail
some puzzlement: after all, why should partisan support play any role over time in a situation
characterized by inchoate political organizations? A tentative answer is that, in contexts of poor
institutionalization, party strength should be thought of less in terms of structural partisanship and more
as a proxy of patron–client ties that are formally channeled through an enduring pattern of exchange of
electoral support for private access to
78
patronage and individual or group benefits. For examples of this pattern in Latin America, see Rosenberg
(1989), and Conaghan (1994).
Still, among inchoate party regimes, no matter how much greater the comparable sensitivity to
partisan forces might be, the core influence in voting is borne by candidates’ attributes. Candidate-related
clues account for the twelve points difference in the explanatory power of the general model when
contrasted to the fit attained under politically developed orders (an adjusted R2 of .92 for the former
versus one of .80 for the latter).
Among elections held in poorly institutionalized systems, incumbents are held accountable for
performance, but neither to the extent nor in the direction that their counterparts in highly
institutionalized regimes are. If economic performance is a relevant decisional clue for voters, it is so
even more strongly in politically developed contexts, as a comparison of beta weights reveals (-.24 in the
group of low institutionalization versus -.40 in the group of high institutionalization). On the other hand,
democratic performance achieves some statistically significant effect over vote, but in a way that assures
electoral compensation for tough leadership. Lower levels of institutionalization help governments to
diffuse blame for policy inefficacy while raising the stakes for the display of unambiguous signs of
authoritative rulership. This explains in part why the effect of economic management may appear weaker
and why incumbents may expect to lose votes, rather than to win them, if the only sign of progress they
exhibit is limited to the democratic arena.
These conclusions above illustrate the substantial implications contained in institutionalization
differences for the debate on the degree of effective accountability in new democracies. Generally
speaking, performance may be a more indeterminate source of decision among politically
underdeveloped systems. This situation makes incumbent’s political survival contingent upon the
presence of other sources, such as the character of the contending candidates or the displays of political
leadership by the president. As expected, fewer opportunities for partisan socialization and a less clear
attribution of responsibility for performance leave voters to
79
rely upon highly personalistic references. Given the circumstances, these clues become the sole sources
that can effectively provide order amidst the uncertainty of who is capable of assuring some basic degree
of satisfaction. Quite likely, a vicious cycle may derive from this situation, since “where personalistic
disputes reign supreme and party labels are insignificant, those who win elections feel less restrained in
how they govern” (Mainwaring and Scully 1995: 25). Accountability thus achieves a different
operational meaning when it depends on candidates’ charisma and weighs not what the government has
done for democracy but what it has done for law and order.
Party Systems.
Let us now turn to the interplay between models of choice and the predominant types of party
system. A common supposition holds that two-party systems facilitate the identification and attribution of
responsibility for good and bad performance (Downs 1957), whereas multipartism helps diffuse this kind
of linkage (Lewis-Beck 1988). However, Table 6.2 shows that there is hardly any evidence of differential
economic voting effects across party systems. In either case, for the initial trimmed version of the
models, the efficacy in fighting price fluctuations over time reveals a statistically dubious impact upon
the distribution of political support. Some differences of degree are, nonetheless, worth noting. If we
compare two elections held under a multiparty system, one preceded by a “moderate deflation” and
another one by a “strong inflation increase,” and keep everything else constant, we can expect an average
loss of 9 percentage points in the second situation (4∗ -2.20= -8.8). The same comparison for bipartisan
systems would yield a smaller loss of about 5 points (4∗ -1.29= -5.16). The resulting 3.6 percent
difference does not always seem innocuous, if we recall that on many occasions this gap forced run-off
elections (for example, in El
Salvador in 1994) or signified the incumbent’s defeat (for example, in Uruguay in 1994). Consequently,
such disparity of effects reveals that economic sensitivity among electorates is not totally indifferent to
the predominant type of party system.
80
The influence held by candidates’ attributes transcends the specifications of party formats, in the
sense that, when contrasted with other arguments, they still lead the explanatory race. On the other hand,
the effect of contenders’ appeal is greater in multiparty structures, first, because its estimate is larger, and
second, because its size is much bigger compared to the next influential source of decision than it is
among bipartisan regimes. Differences exist in the expected direction: two-party systems are slightly less
driven by personalistic forces in comparison with multiparty settings. These differences are better
understood when taking into account the estimates for the affirmative and party models. Wherever two-
party systems dominate, aggregate party support naturally becomes the second largest effect shaping the
incumbent’s fortunes, foretelling nearly one additional percent in votes for every two points of
continuous support over time (2∗.44=.88). Less salient is the comparative role of this argument within
multiparty contexts.
Another contrast is present in relation to governments’ performance on issues of citizenship
advancement: among two-party systems a non-significant estimate is the rule, whereas multiparty orders
show an inclination to accept manifestations of authoritarianism. As speculated earlier, accumulated
social tensions and governability-menacing conflicts resulting from anti-inflationary policies may push
rulers to increase their reliance on heavy-handed tactics to assure social peace and public order. This kind
of pattern may ultimately find a lukewarm reception for the poor quality of democratic accomplishments
among voters. An exemplary case is the Bolivian election of 1989, where stabilization policies made of
economic governability a precious good but also ignited social unrest and widespread crime. This led, in
turn, to placing law-and-order considerations as top priorities of large majorities, thus helping to
legitimize the subsequent coercive response of the government. To be sure, the high return of votes to
Paz Estenssoro’s party
may speak loudly of the success in bringing inflation down, but also of the favorable image of “tough
leadership” conveyed by the official team (see Conaghan 1992; Gamarra 1994b).
Finally, the intensity of candidate voting reveals a clear-cut covariation with the nature of the
81
party system. Clearly, multiparty systems are more likely to be subject to candidate effects than two-party
regimes. Among the former, the ratio of the impact of candidate attributes to the next effect of
importance (i.e., prior vote) measured in beta weights stands at 3.1 to 1. In bipartisan contexts, such a
ratio stands at only 1.6 to 1 (with party strength as the next effect of importance). This pattern clearly
reflects the particular overtones of multiparty systems in presidential regimes characterized by weak
organizational capabilities and a heavy dependence upon a style of politics based on caudillismo.
No serious changes are recorded after improving the specification of the models. These results
are illustrated by the respective columns labeled “extended” in Table 6.2. The inclusion of the political
referendum model and the revised version of the candidate voting does not produce major fluctuations in
the estimated coefficients, except for the enhancement of the impact of economic voting in all situations
and the partial weakening in the relative effect of candidate voting within multiparty systems.
Economic performance gets stronger as more “economic-free” information, such as presidential
popularity and candidates’ attractiveness, is incorporated into the general model. Within poorly
institutionalized systems, economics becomes second to candidate-related considerations as a source of
electoral decision, doubling its original impact (from -2.06 to -4.09). Within highly institutionalized
systems, there is also an improvement of the effect of economic outputs over voting, but it takes place in
a more attenuated fashion (from -2.61 to -3.30). These nuances are ignored by the differences across
party systems. In both two-party and multiparty contexts, the effect of government efficacy in fighting
inflation more than duplicates in relative terms compared to its impact in the initial trimmed version.
Furthermore, among multiparty systems the effect of economic voting unsettles the leading role of
candidate voting (-.46 versus .38), whereas under two-party regimes it closely follows the influence of
the personalistic appeals of the runners (-.58 versus .63).
The inclusion of political leadership considerations also affects the way in which democratic
performance clues shape the vote. Among inchoate party systems, the drop of the estimate for political
climate rate of change to statistical non-significance suggests that the effects originally attributed to the

82
conduct of the government in the field of political rights and civil freedoms are somehow captured by the
presidential popularity variable. Elections held under these circumstances predict an additional three
percentage points in valid votes for the incumbents for every extra seven percentage points in the
approval of the president (7∗.44=3.08), holding everything else at mean values. Conversely, political
leadership considerations are ineffectual among highly institutionalized contexts. Moreover, the
resemblance of effects across all models of voting with the initial trimmed version is remarkable. Here,
both longstanding group alignments captured by prior vote and economic performance views remain the
critical decisional clues affecting people’s choice.
In a like manner, political leadership weighs more heavily on electoral outcomes whenever many
political parties, rather than few, structure the political scene. An increase in ten percentage points in the
popularity of the president assures and additional 6.5 percent in valid votes in multiparty contexts,
against only 2.2 percent in two-party structures. In the case of multiparty politics, the extra-economic
aptitude of the incumbent force matches its economic qualifications, as shown by the standardized
coefficients (-.46 for the change in the inflation rate relative to .45 in the approval of the president). This
combined effect deflates the relevance of candidate clues. It also drives toward statistical non-
significance the effects of other elements requiring a long-term temporal dimension to become effective
(that is, prior vote, party strength and attainments in the political climate of the nation).
This combination of effects has not passed unnoticed; some Latin Americanists studying the less
institutionalized systems in the region have keenly emphasized the linkages between strong political
leadership and developments in the economic sphere. As Gamarra (1994b: 7) suggests,
the [economic] “threshold of crisis” [in Latin America] was successfully transcended by leaders who
exerted an uncommon capacity to govern. Their feats were accomplished not by altering the rules or
changing institutions..., but by using their command over the institutional features of a given system,
concentrating power at the executive level, and deploying enough strength to implement policy.
In two-party systems, in contrast, leadership considerations are far from challenging the

83
economic and candidate arguments. Rather, these considerations stand as a second-rate factor, with a
statistical effect proximate to that of party voting. This means that bipartisan orders are, first of all,
domains of economic accountability and personal character; yet, if those two attributes become relevant
they accomplish so not at the expense of making the effect of partisan factors insignificant.
In sum, as the data in Table 6.2 conclusively demonstrate, electoral choice is not indifferent to
the type of institutional order that predominates in society. Under each specific regime, some models
achieve greater salience than others. Furthermore, when improving the specification of the measurement
model by including political leadership effects and decontaminating candidates’ attributes from economic
influences, different arguments prevail for the different statuses of political development and partisan
organization. The question to be addressed now is whether different macro-economic circumstances
reproduce such an heterogeneous pattern of influences.
Electoral Outcomes under Crisis and Prosperity: Testing for Voting Asymmetries
A tacit assumption of aggregate models is that electorates behave similarly under situations of
economic distress and prosperity, even though common sense would indicate otherwise. In reality, the
empirical evidence for countries of the region yields ambiguous results (see Seligson and Gómez B. 1989;
Pacek and Radcliff 1995).
A look at the interplay between macro-economic environments and both the initial and extended
trimmed versions of the models points out the existence of serious asymmetries in the way people articulate
their electoral choices and, in particular, the way they make use of economic clues. As Table 6.3 reveals,
there is a systematic contrast between the highly significant effect of economic performance in contexts of
crisis and the lack of statistical significance under conditions of growth. This dissimilarity indicates that
Latin American publics hold a different sensitivity to economic matters depending on the circumstances.
Whenever bad times precede the election, voters take serious note of the ability of the rulers to manage
inflation and, if government fails, they tend to punish it mercilessly. A comparison of estimates reveals that

84
the average loss in votes for increases in the inflation rate over time amounts to almost 5 percentage
points in situations of crisis versus 2.5 percentage points in situations of economic expansion. This also
means that if changes take place in a deflationary direction, incumbents will be rewarded with
comparatively fewer votes when financial conditions improve. On the other hand, as good times arrive
before an election, voters stop reacting with an eye on the economy, shifting their focus to other matters.
These findings support the notion that electorates behave ungratefully, responding unevenly to the
government’s economic performance. In other words, voters appear biased in the direction of ignoring the
incumbent’s anti-inflationary progress in good times, but they do not miss the chance of throwing the rascals
out at the first sign of economic ineptitude during periods of recession. This behavior falls in line with
McDonald and Ruhl’s (1989: 14) contentions that “protest voting,” that is, the tendency to sanction
governments harder than to reward them, is a generalized practice in Latin America. It also matches Pacek
and Radcliff’s (1995: 753) findings on the existence of asymmetric reactions to the economy in Third
World electorates.
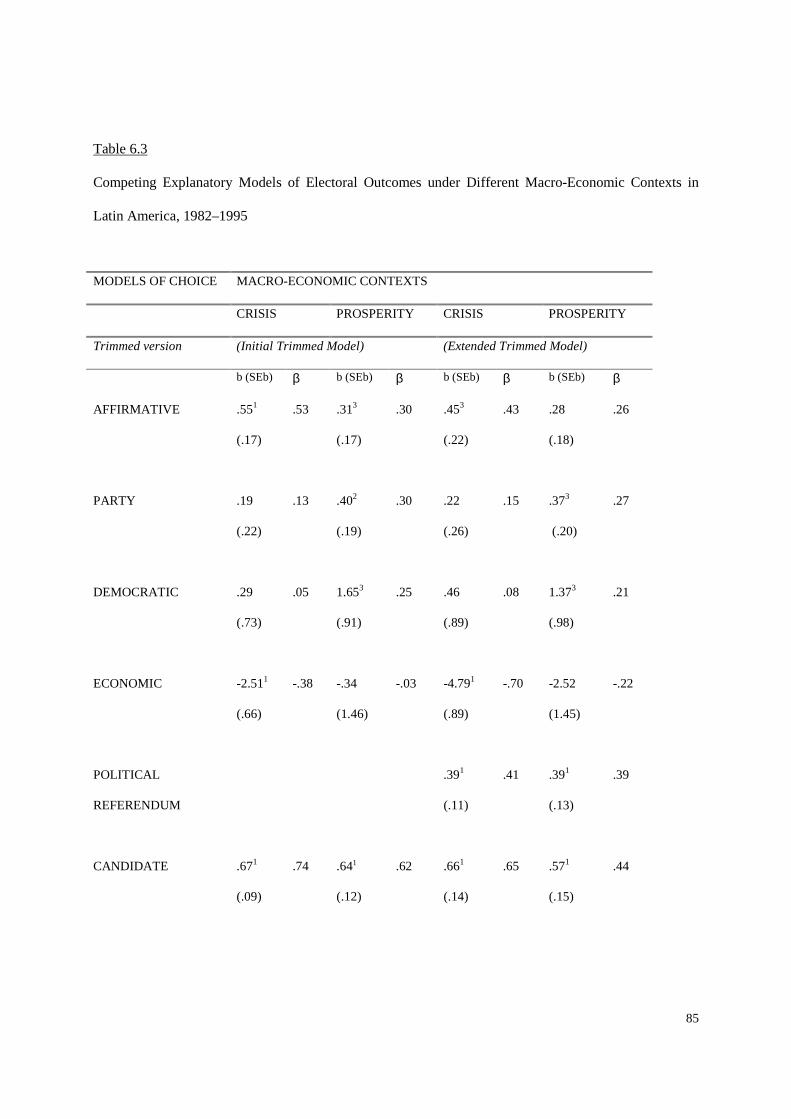
85
Table 6.3
Competing Explanatory Models of Electoral Outcomes under Different Macro-Economic Contexts in
Latin America, 1982–1995
MODELS OF CHOICE MACRO-ECONOMIC CONTEXTS
CRISIS PROSPERITY CRISIS PROSPERITY
Trimmed version (Initial Trimmed Model) (Extended Trimmed Model)
b (SEb) β b (SEb) β b (SEb) β b (SEb) β
AFFIRMATIVE
.551
(.17)
.53 .313
(.17)
.30 .453
(.22)
.43 .28
(.18)
.26
PARTY
.19
(.22)
.13 .402
(.19)
.30 .22
(.26)
.15 .373
(.20)
.27
DEMOCRATIC .29
(.73)
.05 1.653
(.91)
.25 .46
(.89)
.08 1.373
(.98)
.21
ECONOMIC
-2.511
(.66)
-.38 -.34
(1.46)
-.03 -4.791
(.89)
-.70 -2.52
(1.45)
-.22
POLITICAL
REFERENDUM
.391
(.11)
.41 .391
(.13)
.39
CANDIDATE .671
(.09)
.74 .641
(.12)
.62 .661
(.14)
.65 .571
(.15)
.44
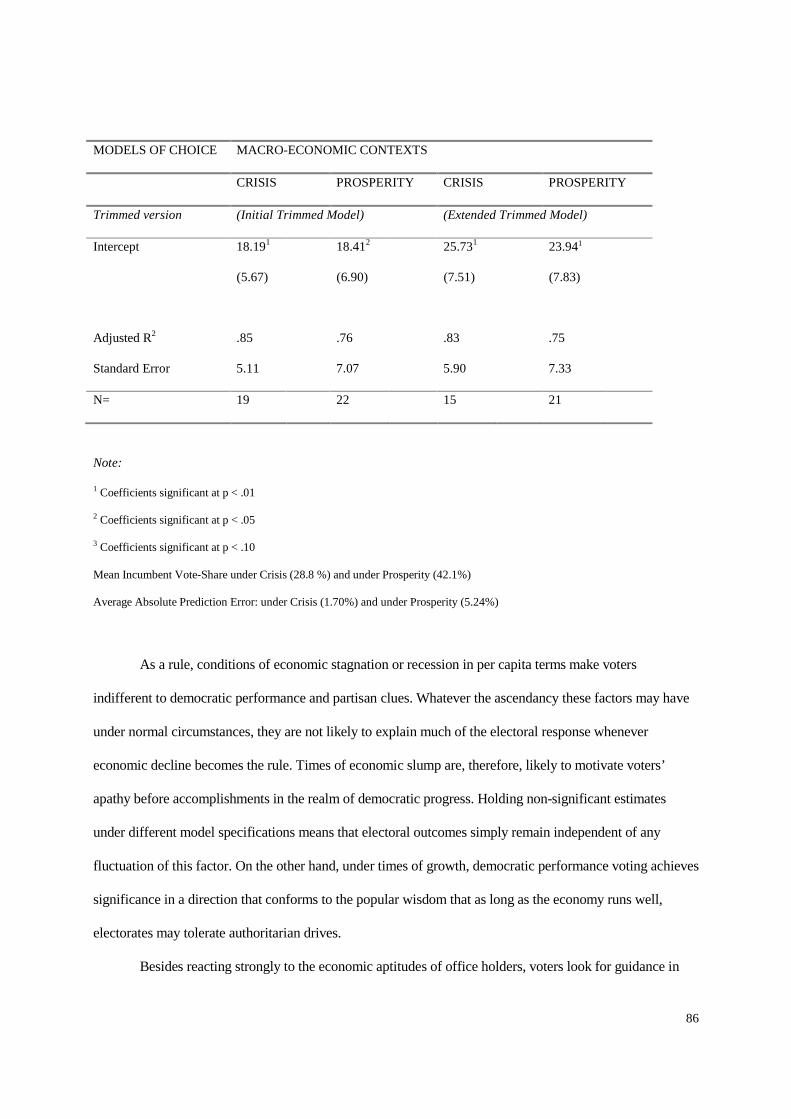
86
MODELS OF CHOICE MACRO-ECONOMIC CONTEXTS
CRISIS PROSPERITY CRISIS PROSPERITY
Trimmed version (Initial Trimmed Model) (Extended Trimmed Model)
Intercept 18.191
(5.67)
18.412
(6.90)
25.731
(7.51)
23.941
(7.83)
Adjusted R2 .85 .76 .83 .75
Standard Error 5.11 7.07 5.90 7.33
N= 19 22 15 21
Note:
1 Coefficients significant at p < .01
2 Coefficients significant at p < .05
3 Coefficients significant at p < .10
Mean Incumbent Vote-Share under Crisis (28.8 %) and under Prosperity (42.1%)
Average Absolute Prediction Error: under Crisis (1.70%) and under Prosperity (5.24%)
As a rule, conditions of economic stagnation or recession in per capita terms make voters
indifferent to democratic performance and partisan clues. Whatever the ascendancy these factors may have
under normal circumstances, they are not likely to explain much of the electoral response whenever
economic decline becomes the rule. Times of economic slump are, therefore, likely to motivate voters’
apathy before accomplishments in the realm of democratic progress. Holding non-significant estimates
under different model specifications means that electoral outcomes simply remain independent of any
fluctuation of this factor. On the other hand, under times of growth, democratic performance voting achieves
significance in a direction that conforms to the popular wisdom that as long as the economy runs well,
electorates may tolerate authoritarian drives.
Besides reacting strongly to the economic aptitudes of office holders, voters look for guidance in

87
the personality of the candidates or in the longstanding political traditions captured by prior voting
alignments. The data confirm theoretical suppositions about the political strategy of leaders in presidential
elections. The evidence of candidate voting effects that are stronger under troubling financial conditions
than when good times prevail contradicts the standard argument of “strategic politicians” as developed by
Jacobson and Kernell (1981). Instead, it sustains the notion that a situation of economic downturn is capable
of arousing people’s expectations for a “savior of the country,” thus leaving the door open to the rise of
strong candidates.
It is interesting to note that the inclusion of presidential popularity considerations does not reveal a
divergent impact across situations. This effect indicates that no matter what the financial circumstances,
political leadership is always a valuable resource to which voters resort. Concurrently, after one takes the
model of political referendum into account, substantive modifications occur in regards to other decisional
clues. For example, in times of crisis, economic performance ends up surpassing candidate voting. In
addition, affirmative model type of reactions become less important which witness to the force of political
circumstances to erode past alignments whenever hardships persist. By the same token, when prosperity is
the rule, the acknowledgment of political leadership weakens the effect of long-term forces such as prior
vote and partisan alignments. It also raises the relative impact of economic matters, but not to the point of
making these factors statistically significant. Last but not least, as one takes into account political leadership
considerations during good times, one can expect a substantial reduction in the relative influence of
candidate voting. Even though incumbents’ fortunes still respond primarily to character attributes of the
contenders (a beta weight of .44), those fortunes are very likely to depend on the popularity of the president
as well (a beta weight of .39).
In summary, the data confirm that voters are affected by contextual conditions in developing their electoral
choices. Differences in the environment imply different opportunities and information
availability to the public. For example, economic performance becomes more salient under situations where
88
attributing economic responsibility to government is easier or whenever financial grievances make of the
economy a critical point of reference. On the other hand, as the institutional framework allows the
incumbents to diffuse responsibility, or as prosperity alleviates pressures for material security and stability,
economic arguments weaken substantially.
The same diversity of interactions between contexts and models of choice occurs when political
leadership considerations are observed. When partisan pluralism and weak political development prevail,
voters are quite likely to approach contests as a referendum on the quality of the political situation the
country achieved under the current administration. Under such situations, leadership clues simplify the
complexity of politics to voters in a very efficient manner. Similarly, as financial conditions improve,
presidential popularity may also become a more relevant decisional clue, as a result of the secondary role
economic considerations play. A comparable dynamic extends to those forces involving long-term effects,
such as party strength and prior alignments. These factors covary more intensely with political support as
environmental conditions permit, first, some degree of variability in the values of these measures and,
second, an opportunity for a process of political socialization by social groups and parties to become
effective and autonomous from economic emergencies.
Analysis of the institutional and macro-economic contexts within which presidential contests take
place allows us to fine-tune our understanding of the different voting arguments and the ways in which they
relate to electoral choice in the region. But to form a complete picture of voting behavior, we need to
explore how specific arguments of voting mobilize not only national electorates but also individual voters
under heterogeneous contexts.

89
Chapter 7: Individual-Level Analysis of Voting Behavior in Three Latin American Countries
Electoral outcomes are aggregate products of what collective entities decide. From an aggregate-
level perspective, a focus on electoral choice illustrates the patterns structuring the way electoral masses
respond. But aggregate analysis can hardly be satisfying to one who want to explore the mystery of political
behavior, since it only conveys oblique information about how individual voters undergo a process of
reasoning and decision-making before making a political choice explicit.
This chapter complements the previous discussion of aggregate voting patterns with an analysis of
three instances of electoral behavior at the individual level, based on electoral survey data collected in
Argentina, Perú and Uruguay. Individual-level data supply the evidence about the specific processes voters
work through before deciding whom to support. More obviously, this approach provides clues about how
people actually perceive objective reality and how their perceptions become politically consequential.
An analysis centered on individual level data offers important benefits in dealing with models of
choice, particularly when considering the impact of economics, given the multiplicity of calculations that
might orient the individual’s decision. How sensitive are individuals to economic matters relative to non-
economic affairs in deciding whom to support? Do citizens more closely resemble the figure of the
pocketbook voter, relying solely on personal experiences, or do they ponder the national situation more
heavily? Are economic expectations the basis of the elector’s decision, as Downs conjectured, or do
individuals conform more to a type of voter described by Key, choosing based upon “past events, past
performance, and past actions” (1966: 61)? Individual-level analysis allows us to answer such questions.
Methodology
At the individual level, the dependent variable is measured by the voting intention (or reported
vote) verbalized by survey respondents. In order to evaluate the individual-level determinants of the vote
choice, particularly the connection between economic perceptions and support for the incumbent, relative to
90
other influential forces, the analysis is based upon electoral survey data collected in Argentina, Perú and
Uruguay. Although three different national elections can hardly take account of the variety of nuances
underlying the process of vote choice during the span of time for all contests and countries covered in the
aggregate analysis, these cases can be at least illustrate some of the major behaviors exhibited by Latin
Americans in making up their minds at the polls.
These three countries are thus relevant because of they dissimilarities in both economic
backgrounds and profiles of political institutionalization in the post-authoritarian period following the ten
years after each country returned to democracy (see Smith et al. 1994; Mainwaring and Scully 1995).
Furthermore, such picture of variations crystallize at a moment of simultaneous presidential elections across
the three nations, which replicates a controlled experience while makes it safe to assume that the major
controversies striking the region’s electoral experiences are reasonably contained (see Appendix B).
In all cases, samples were drawn from the voting-age population (that is, 18 years old or older) of
the major urban centers—Capital and Greater Buenos Aires, Lima and Greater Lima, and the city of
Montevideo—following a random selection of sampling areas, blocks and households, with quota
adjustments for sex and age at the respondent level. (It is worth noting that Federal Capital and Greater
Buenos Aires areas comprise about thirty-eight percent of the national electorate of Argentina. Similarly,
Lima and Greater Lima comprise slightly over thirty-five percent. The city of Montevideo hosts almost
fifty percent of the Uruguayan national electorate.) The number of cases (weighted number of cases in
parenthesis) for Argentina was 245 (265); for Perú, 519 (537); and for Uruguay, 191 (187). In Perú and
Uruguay, fieldwork was conducted prior to election day, twenty days before the April 1995 contests in Lima
and five weeks before the November 1994 elections in Montevideo. In Argentina, fieldwork was conducted
within two weeks after the presidential elections of
May 1995 were held.1 In each country, a local polling institute implemented the study, including a specific
1 Differences between the proportion of votes going to the incumbent party in the pre and post-electoral studies are rather small and fall within the reported margins of error, making of the first a reliable measure. In the Buenos Aires sample, for which a ± 5.2 percent margin of error was reported, 44.2 percent of the interviewed reported to have voted
91
battery of questions upon personal request of the author.2
Individual sources of information originating in different countries but obtained with similar
research instruments and designs for a relatively homogeneous time-period allow for invaluable
comparisons at the individual level, since the same analytical technique can be used to assess the relative
impact of each major voting model. In such analysis, it is also possible to test multiple arguments of
explaining voting by means of multivariate statistical models, thus assuring that whatever cross-national
variations are found are not a result of methodological artifacts but of substantive differences.
Since the criterion for how individuals process their electoral decisions rests on the assumption
that they approach the ballots as a binary choice between supporting or opposing the incumbent, the
dependent variable takes the form of a dichotomous variable. The premise of linearity, therefore, must be
discarded and logistic regression techniques should be employed. Considering these givens and the
multivariate approach here pursued, Pearson’s product–moment correlation and binomial logistic regression
techniques are used here.
In discussing the multivariate data, two pieces of information are used: the partial correlation
coefficient (named CORREL in the tables in this chapter), which summarizes the pure effect of each
variable upon the vote holding constant the impact of all other variables over both the dependent and the
independent measures; and the estimated chances of supporting the incumbent party (versus dumping it) for
every one category change in the explanatory variable (named CHANCE in the tables). The statistical
significance of all coefficients is indicated in superscripts in all the tables. Furthermore, two other measures
for the incumbent Peronist party, whereas the actual proportion reached 48.6 percent, thus dismissing any possibility of serious post-facto rationalization of electoral preferences. In the Lima sample, with a reported margin of error of ± 4.5 percent, 63.3 percent of the respondents (66.6 percent after proportional reallocation of undecideds) intended to support Fujimori’s bid for reelection; his actual vote-share was 63.7 percent. In the Montevideo sample, with a reported ± 6 percent margin of error, the sum of votes manifested in favor of the different subtickets of the Blanco party added 21.2 percent (23.4 percent after proportional reallocation of undecideds), a figure almost matching the 21.1 percent of actual votes received. All margins of error were calculated for samples designed with a 95 % confidence interval. 2 In Argentina, it was the survey research unit of the University of Buenos Aires, CEDOP (Centro de Estudios de Opinión Pública). In Perú, it was APOYO S.A., a commercial firm with a long tradition of public opinion and marketing studies. In Uruguay, it was Marketing Investigadores S.A., a firm devoted mainly to marketing research, although with a strong interest in public opinion subjects as evidenced by their active participation in the Barómetro Iberoamericano project since 1992. All three firms adhere to AAPOR/WAPOR standards and code of ethics.

92
are presented to assess the fit of the data to the model: the percentage of votes gathered by the incumbent
party and by all forces in competition that were correctly predicted by the model; and the chi-square–based
goodness-of-fit measure, with its respective probability value, which informs the extent to which the model
significatively departures from a perfect fit.
In formal terms, the individual-level model takes the following theoretical shape:
e(Ζ)
π(VS=1)=
1 + e(Ζ)
where Ζ=∝ + β1(Personal Retrospective) + β2(Personal Prospective) +
+ β3(National Retrospective) + β4(National Prospective) +
+ β5(Personal Retrospective ∗ Responsibility Attribution) +
+ β6(Personal Prospective ∗ Responsibility Attribution) +
+ β7(National Retrospective ∗ Responsibility Attribution) +
+ β8(National Prospective ∗ Responsibility Attribution) +
+ β9(Presidential Approval) + β10(Partisanship) + β11(Social Class) + ε
and where π(VS=1) refers to the probability of voting in favor of the incumbent party rather than the
against it, and e(Ζ) represents the exponential function of the linear combination of independent variables
disaggregated in the previous equation. When exponentiated, each coefficient β represents the factor by
which the odds of supporting the incumbent party rather than the opposition should be multiplied and
thus estimated.

93
A discussion of the underpinnings of responsibility attribution can offer a window for exploring
the actual mental process connecting economic perceptions and electoral choices at the individual level.
Below, I discuss responsibility attribution in the hope of illuminating the issue of how much asymmetry
is present in reacting to economic conditions.
In this context, I will first address the issue of fairness in the politicization of economic matters
by appraising the degree of blame or credit ascribed to office-holders, given the particular way of judging
the economy. In theory, negative coefficients among those evaluating conditions as “worse” imply that as
financial states are perceived with more pessimism, the government will be exempted from
responsibility. Negative coefficients among those having a positive impression (“better”) mean that
financial betterment will not be credited to the government either. On the other hand, positive
coefficients for those seeing things as “worse” mean that as states go downhill, blame rises, whereas for
those appraising circumstances as “better,” they mean that these people are more inclined to credit the
government for the improvement.
Furthermore, whenever the coefficient for those holding pessimistic views is greater than the one
among the optimists, it implies that governments are more harshly blamed under dire straits
circumstances than credited under prosperity. Conversely, if coefficients are larger among those
perceiving things as getting “better,” it means that governments will enjoy proportionally more praise for
good performance than reproach for mismanagement. If coefficients remain about the same magnitude,
voters are willing to condemn the authorities in the face of economic distress as
intensively as to trust them for improvements.
A second issue assessed is the extent to which conditions perceived as “good” or “bad” elicit
cogent responses such as approving or sanctioning the incumbent regardless of government liabilities.
Theoretically, negative coefficients among those evaluating conditions as “worse” indicate that as
financial states are perceived with more pessimism, incumbents will be increasingly contested.
Conversely, among those appraising circumstances optimistically, positive coefficients anticipate more
94
votes for the government.
Let it be said, as well, that whenever coefficients among pessimists exceed in magnitude those
recorded among optimists, incumbents will suffer more for poor results or prospects than they can expect
to enjoy for economic betterments. On the contrary, if coefficients are larger among those perceiving
things as improving, the party-in-office can count on more votes from the group of electors content with
the economic situation than what it may expect to lose from those dissatisfied with it.
The last issue discussed is the extent to which economic satisfaction (or dissatisfaction) gets
translated into electoral rewards (or sanctions) for different levels of government responsibility. Negative
coefficients among those judging the situation as “worse” can be expected to indicate that pessimism
forewarns incumbent losses. On the other hand, positive coefficients among those holding an optimistic
view of the economy entail a greater predisposition to make explicit the electoral gratitude to the
government.
Finally, coefficients among pessimists that exceed in magnitude those recorded among optimists
point to a negative asymmetry, that is, a greater loss of votes among those perceiving reality negatively
than gains among those with a positive view of the economy. On the other hand, if coefficients are larger
among those perceiving things as improving, it means that positive asymmetry prevails, that is, the ruling
party will be rewarded for good results to a greater proportion than it will be punished for bad results.
Lastly, as in all previous cases, a case of similar
magnitude coefficients should be interpreted as one of symmetry between conditions, liability and
electoral choices. If coefficients remain non-significant, other arguments than economic voting must be
pursued.
Assessing Individual Economic Voting
A cursory survey of the scholarly debate on the determinants of voting in Argentina, Perú and
Uruguay reveals how central economic voting arguments have become. In reviewing the contests held in

95
Perú throughout the 1980s, Dietz concludes that “voting their pocketbooks has been clearly at work” (1987:
157–158). For Catterberg and Braun, the 1989 presidential elections in Argentina are also best illustrated by
the economic voting argument:
the electorate evaluated the Radicals performance on a strictly economic basis ... two months before
the elections, the people demanded a change in the economic policy of the government, while at the
same time they regarded their vote as a way of achieving such a change (1989: 366–367).
Rial, on the other hand, discussing Uruguayan elections during the 1980s, argues that the clientelist
version of economic voting, that is, the exchange of electoral support for private benefits, “has suffered a
serious reversal” (1986: 261–262). Echoing Rial’s conclusions for the 1989 presidential contest, Canzani
contends that
[if] the evolution of the economy seemed to be a key element in the political scene [of other
countries], this element seemed absent in Uruguay, where five years ago a party in government that
had improved some aspects of the economic situation was defeated at the ballots. This event could
be interpreted as a defense of the relative autonomy of politics in relation to economics (1995: 8).
These evaluations uncover the multidimensional character of the economic voting argument. Do
voters who structure their choices upon their views of the economy weigh their personal situations more
heavily than the nation’s, as Dietz implies, or is it more the opposite case, as one may infer from Rial’s
argument? Moreover, are voters resting their decision only upon retrospective views, as the first part of
Catterberg and Braun’s statement suggests, or should one also consider voters’ expectations, as these
authors later propose?
Heterogeneity is intrinsic to notions of economic voting and encompasses part of the reasoning that
motivates voters to rely on economic clues. At certain times, voters may react to their pocketbook situations,
while at others, they may respond to the economic situation of the country. Occasionally, voters may look
96
backward in deciding whom to vote for; other times, they may be inclined to ponder who will do better in
the future and forget about the past, which is impossible to remedy. Acknowledging this diversity of frames
of reference is also a first step toward recognizing the flexibility of the economic voting argument.
Still, one needs to validate the electoral consequences of such heterogeneity of views through
verifying the extent to which economic impressions are actually politicized. To what extent is the party-in-
government judged responsible for the progresses or relapses in the different economic spheres? Answering
this question becomes essential, since only a clear attribution of responsibility can make economic
orientations a logical parameter upon which to base the decision to endorse or not to endorse the incumbents
at the voting booths. The bottom line is that in any circumstance, voters are assumed to follow a decision
rule which consists of attributing—or not—economic responsibility to the government before imbuing their
choice with their impressions of financial reality.
Beyond these considerations, electoral preferences in Argentina, Perú and Uruguay have also been
understood in light of extra-economic forces. In Uruguay, the relevance of partisanship and the president’s
personal prestige are decisive (González 1992). Among Peruvians, leadership considerations have a strong
response, as revealed by citizen approval of Fujimori’s counter-insurgency policy, presidential acts to
discipline the political establishment, and the “rally around the flag” effect provoked
by the short-timed war against Ecuador in 1994-95 (Carrión 1998; Caretas 1995). Finally, in Argentina,
candidate and leadership effects are of key importance. Mainwaring, reviewing the 1989 Argentine
presidential elections, underlines their saliency in concluding that “Radicals were so discredited [for their
economic failures] that it was only because of the ability of their candidate, [Eduardo] Angeloz, to run a
good campaign that he was able to pull in thirty-seven percent versus Menem’s forty-seven percent of the
votes” (1995: 157).
Individual-Level Versions of Economic Voting
Individual voters of specific nations replicate the trends seen for the region at two levels: they
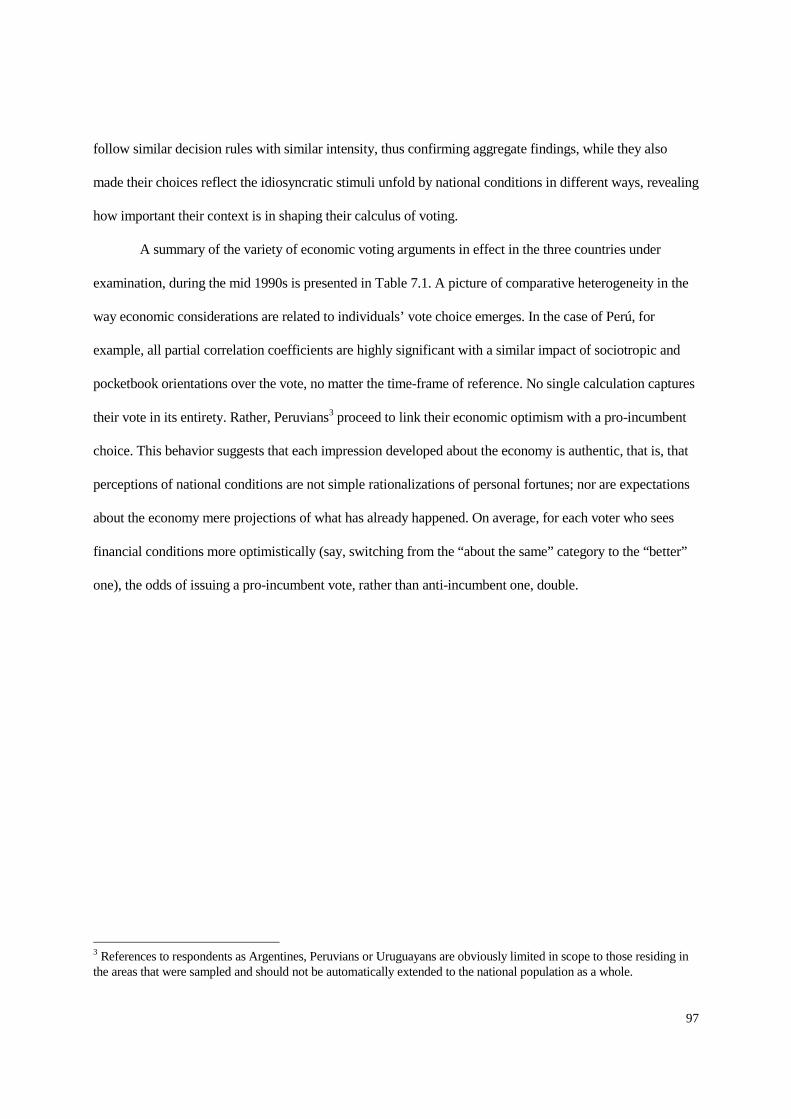
97
follow similar decision rules with similar intensity, thus confirming aggregate findings, while they also
made their choices reflect the idiosyncratic stimuli unfold by national conditions in different ways, revealing
how important their context is in shaping their calculus of voting.
A summary of the variety of economic voting arguments in effect in the three countries under
examination, during the mid 1990s is presented in Table 7.1. A picture of comparative heterogeneity in the
way economic considerations are related to individuals’ vote choice emerges. In the case of Perú, for
example, all partial correlation coefficients are highly significant with a similar impact of sociotropic and
pocketbook orientations over the vote, no matter the time-frame of reference. No single calculation captures
their vote in its entirety. Rather, Peruvians3 proceed to link their economic optimism with a pro-incumbent
choice. This behavior suggests that each impression developed about the economy is authentic, that is, that
perceptions of national conditions are not simple rationalizations of personal fortunes; nor are expectations
about the economy mere projections of what has already happened. On average, for each voter who sees
financial conditions more optimistically (say, switching from the “about the same” category to the “better”
one), the odds of issuing a pro-incumbent vote, rather than anti-incumbent one, double.
3 References to respondents as Argentines, Peruvians or Uruguayans are obviously limited in scope to those residing in the areas that were sampled and should not be automatically extended to the national population as a whole.

98
Table 7.1
Individual-Level Versions of the Economic Voting Model in Perú, Argentina and Uruguay
MODEL VERSIONS PERÚ ARGENTINA URUGUAY
Simple Version CORREL CHANCE CORREL CHANCE CORREL CHANCE
Retrospective Personal .141 1.92 .03 1.63 .102 1.82
Retrospective National .171 2.18 .112 1.96 .00 1.36
Prospective Personal .082 1.67 .131 2.76 .00 1.15
Prospective National .151 2.47 .231 4.51 .00 .72
% Incumbent Votes
Correctly Predicted
92.6 85.4 5.0
% Total Votes Correctly
Predicted
79.7 84.9 77.8
Goodness of Fit 495.93 p=.58 275.48 p=.09 175.03 p=.03
Complex Version CORREL CHANCE CORREL CHANCE CORREL CHANCE
Retrospective Personal .082 1.57 .03 1.67 .00 1.29
Retrospective National .151 2.01 .092 2.18 .00 1.44
Prospective Personal .082 1.69 .06 2.01 .00 1.19
Prospective National .151 2.65 .191 3.45 .00 .82
Responsibility ∗
Retrospective Personal
.04 1.27 .00 1.14 .102 1.73
Responsibility ∗
Retrospective National
.00 1.05 .00 .94 .00 1.04
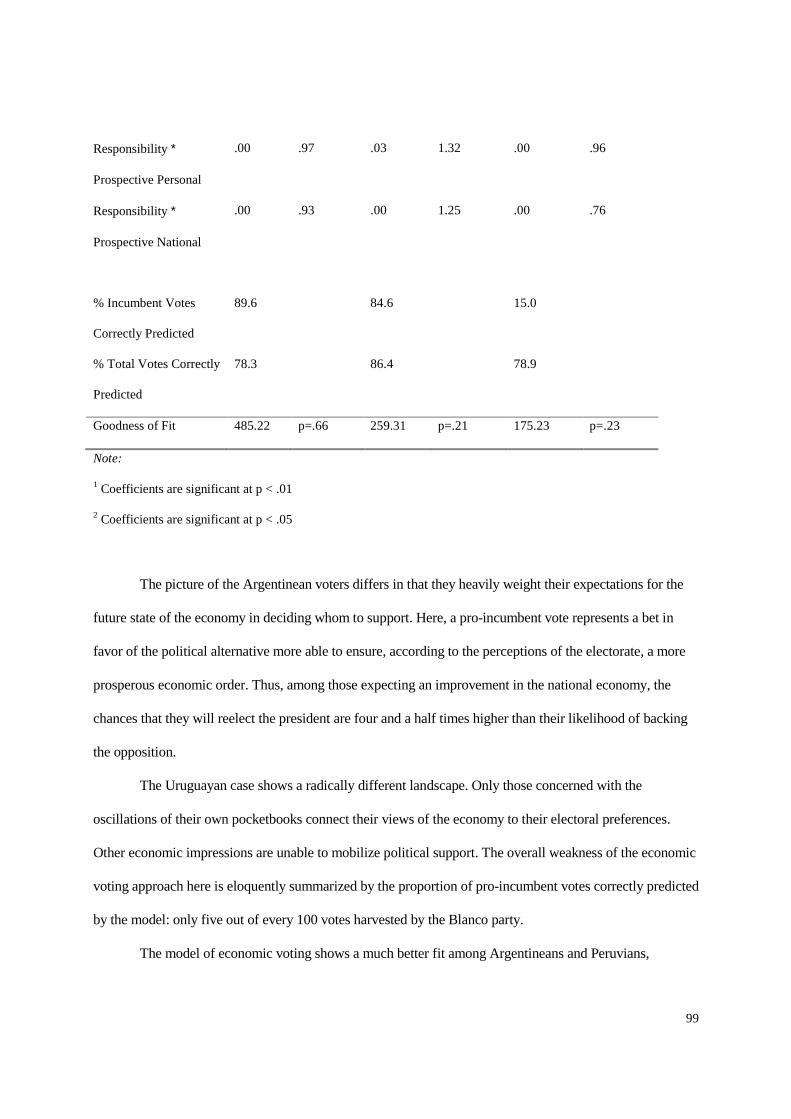
99
Responsibility ∗
Prospective Personal
.00 .97 .03 1.32 .00 .96
Responsibility ∗
Prospective National
.00 .93 .00 1.25 .00 .76
% Incumbent Votes
Correctly Predicted
89.6 84.6 15.0
% Total Votes Correctly
Predicted
78.3 86.4 78.9
Goodness of Fit 485.22 p=.66 259.31 p=.21 175.23 p=.23
Note:
1 Coefficients are significant at p < .01
2 Coefficients are significant at p < .05
The picture of the Argentinean voters differs in that they heavily weight their expectations for the
future state of the economy in deciding whom to support. Here, a pro-incumbent vote represents a bet in
favor of the political alternative more able to ensure, according to the perceptions of the electorate, a more
prosperous economic order. Thus, among those expecting an improvement in the national economy, the
chances that they will reelect the president are four and a half times higher than their likelihood of backing
the opposition.
The Uruguayan case shows a radically different landscape. Only those concerned with the
oscillations of their own pocketbooks connect their views of the economy to their electoral preferences.
Other economic impressions are unable to mobilize political support. The overall weakness of the economic
voting approach here is eloquently summarized by the proportion of pro-incumbent votes correctly predicted
by the model: only five out of every 100 votes harvested by the Blanco party.
The model of economic voting shows a much better fit among Argentineans and Peruvians,
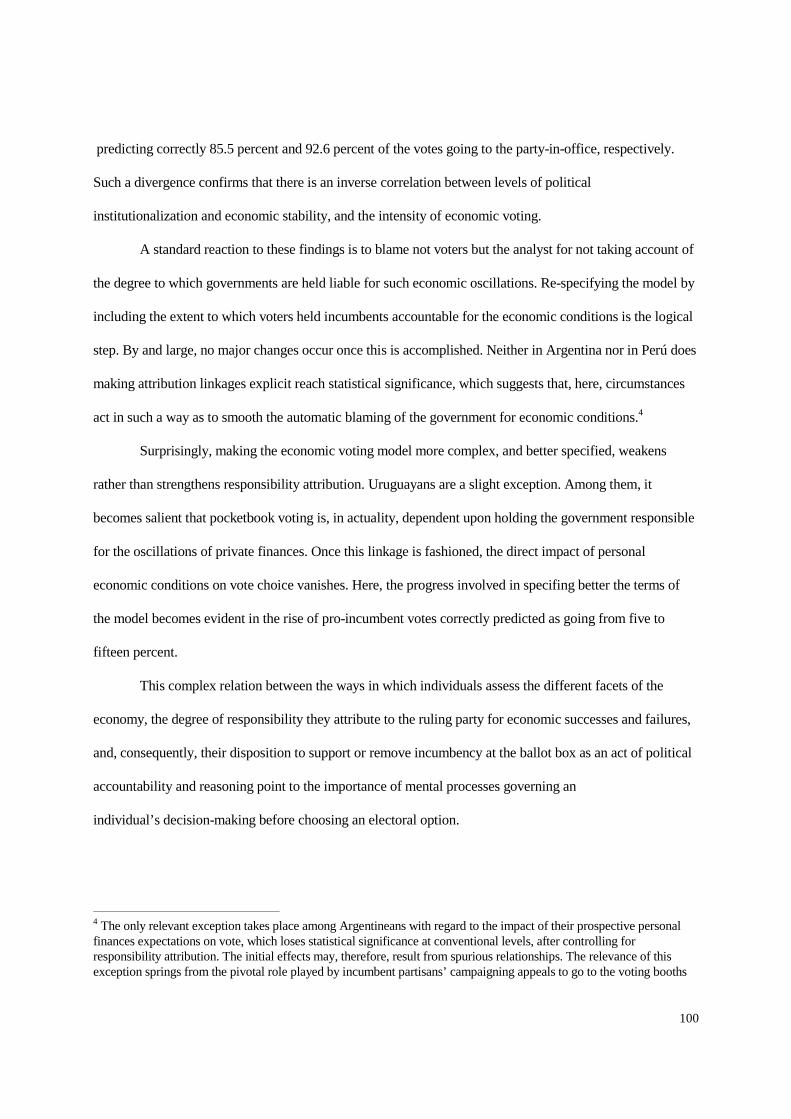
100
predicting correctly 85.5 percent and 92.6 percent of the votes going to the party-in-office, respectively.
Such a divergence confirms that there is an inverse correlation between levels of political
institutionalization and economic stability, and the intensity of economic voting.
A standard reaction to these findings is to blame not voters but the analyst for not taking account of
the degree to which governments are held liable for such economic oscillations. Re-specifying the model by
including the extent to which voters held incumbents accountable for the economic conditions is the logical
step. By and large, no major changes occur once this is accomplished. Neither in Argentina nor in Perú does
making attribution linkages explicit reach statistical significance, which suggests that, here, circumstances
act in such a way as to smooth the automatic blaming of the government for economic conditions.4
Surprisingly, making the economic voting model more complex, and better specified, weakens
rather than strengthens responsibility attribution. Uruguayans are a slight exception. Among them, it
becomes salient that pocketbook voting is, in actuality, dependent upon holding the government responsible
for the oscillations of private finances. Once this linkage is fashioned, the direct impact of personal
economic conditions on vote choice vanishes. Here, the progress involved in specifing better the terms of
the model becomes evident in the rise of pro-incumbent votes correctly predicted as going from five to
fifteen percent.
This complex relation between the ways in which individuals assess the different facets of the
economy, the degree of responsibility they attribute to the ruling party for economic successes and failures,
and, consequently, their disposition to support or remove incumbency at the ballot box as an act of political
accountability and reasoning point to the importance of mental processes governing an
individual’s decision-making before choosing an electoral option.
4 The only relevant exception takes place among Argentineans with regard to the impact of their prospective personal finances expectations on vote, which loses statistical significance at conventional levels, after controlling for responsibility attribution. The initial effects may, therefore, result from spurious relationships. The relevance of this exception springs from the pivotal role played by incumbent partisans’ campaigning appeals to go to the voting booths

101
bearing in mind that only the president’s reelection could warrant positive pocketbook prospects (so-called “voto cuota”). This point is discussed later.

102
Linking Economic Grievances to Political Decisions
When attempting to discern the decision rules followed by individuals in relation to the economy,
three key questions should be answered. First, to what extent do voters hold governments equally
responsible for their own positive and negative impressions about the economy? Second, do voters tend to
turn against incumbents when the economy is bad more readily than they become supportive in good times?
Third, to what extent does the acknowledgment of government’s responsibility for the economy make a
“punishment” vote during bad times more likely than a “reward” vote in good ones?
Table 7.2 (a) provides clues to the first question. Overall, diversity reigns among the national
publics. Peruvians, for example, tend to look at government benevolently, or at least exonerate it for
economic downturns, as the lack of statistical significance of their coefficients suggests. At the same time,
signals of economic progress, whether backward or forward-looking, personal or collective in scope, are
automatically credited to the incumbent’s performance. In contrast, Uruguayans follow a more pessimistic
pattern of behavior: while they tend to personalize the motives behind financial success at the private level,
they are prone to condemn the government for the failures perceived at the national level. Thus, the ruling
party can expect to get only a partial vindication from those holding positive expectations for the collective
situation in the near future.
Table 7.2 (a)
Individual-Level Linkages between Economic Perceptions and Government Responsibility
(Do voters tend to blame their governments for grievances in the same proportion that credit them for prosperity?)
COUNTRIES RETROSPECTIVE EVALUATIONS PROSPECTIVE EVALUATIONS
PERSONAL NATIONAL PERSONAL NATIONAL
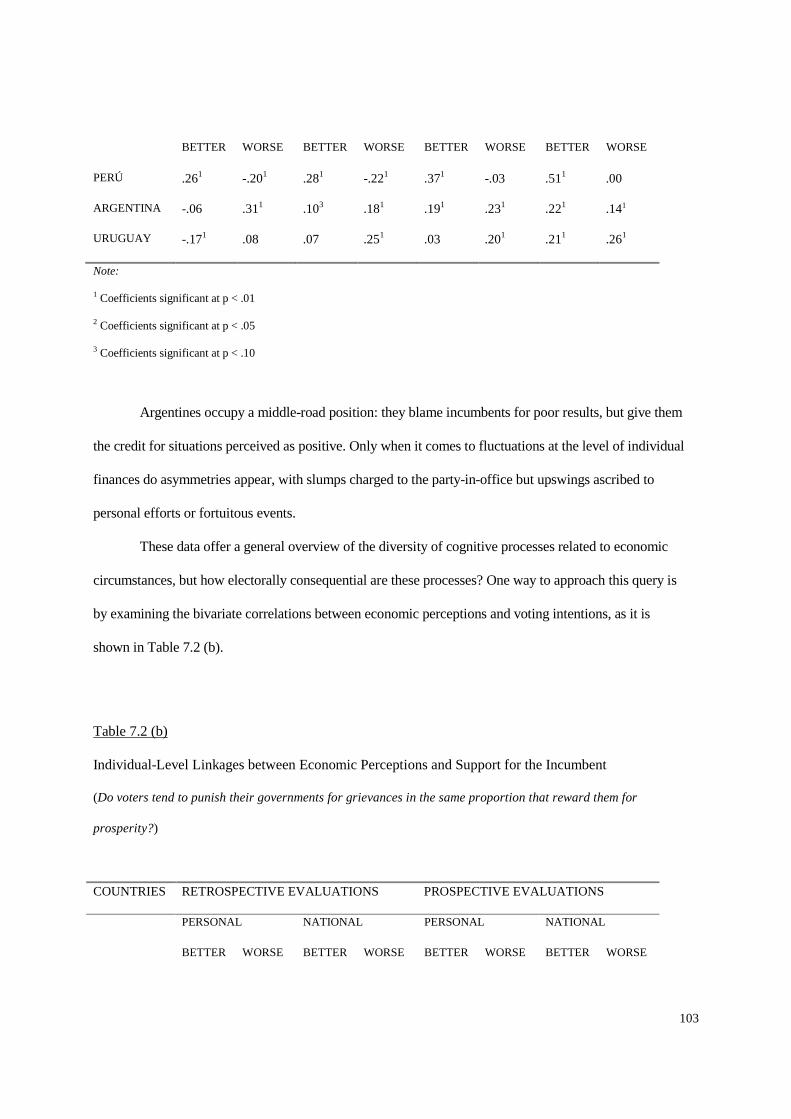
103
BETTER WORSE BETTER WORSE BETTER WORSE BETTER WORSE
PERÚ .261 -.201 .281 -.221 .371 -.03 .511 .00
ARGENTINA -.06 .311 .103 .181 .191 .231 .221 .141
URUGUAY -.171 .08 .07 .251 .03 .201 .211 .261
Note:
1 Coefficients significant at p < .01
2 Coefficients significant at p < .05
3 Coefficients significant at p < .10
Argentines occupy a middle-road position: they blame incumbents for poor results, but give them
the credit for situations perceived as positive. Only when it comes to fluctuations at the level of individual
finances do asymmetries appear, with slumps charged to the party-in-office but upswings ascribed to
personal efforts or fortuitous events.
These data offer a general overview of the diversity of cognitive processes related to economic circumstances, but how electorally consequential are these processes? One way to approach this query is by examining the bivariate correlations between economic perceptions and voting intentions, as it is shown in Table 7.2 (b).
Table 7.2 (b)
Individual-Level Linkages between Economic Perceptions and Support for the Incumbent
(Do voters tend to punish their governments for grievances in the same proportion that reward them for
prosperity?)
COUNTRIES RETROSPECTIVE EVALUATIONS PROSPECTIVE EVALUATIONS
PERSONAL NATIONAL PERSONAL NATIONAL
BETTER WORSE BETTER WORSE BETTER WORSE BETTER WORSE
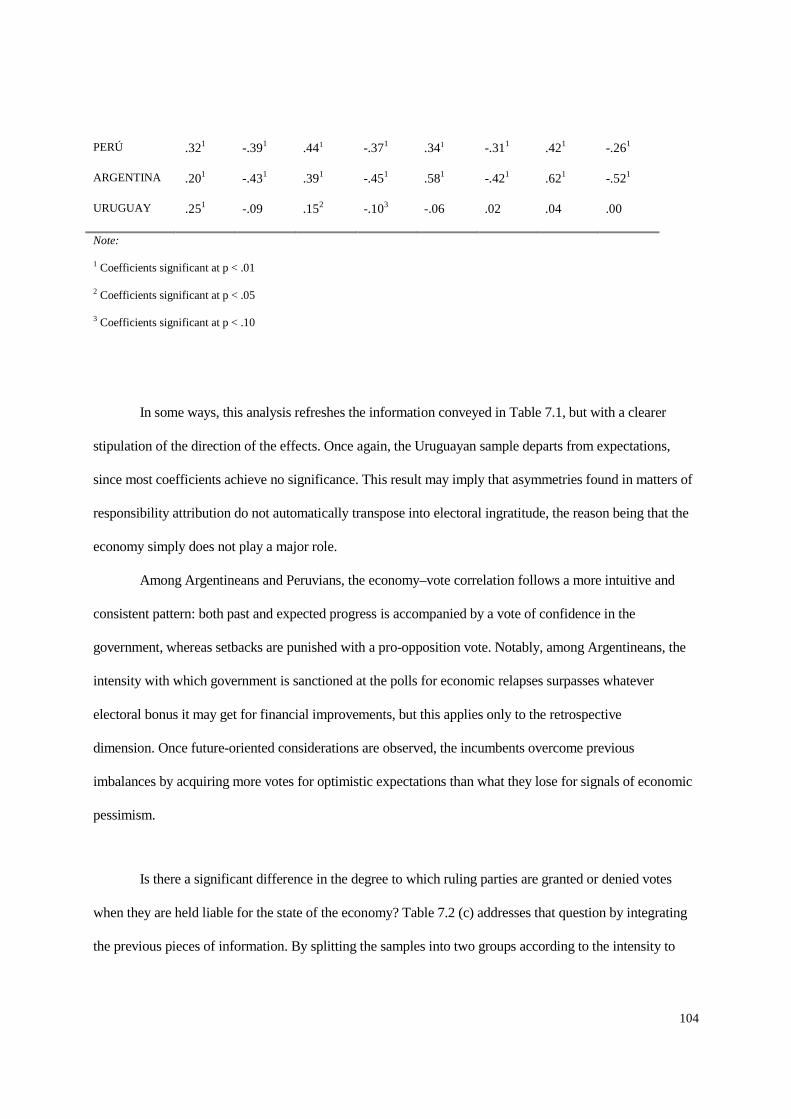
104
PERÚ .321 -.391 .441 -.371 .341 -.311 .421 -.261
ARGENTINA .201 -.431 .391 -.451 .581 -.421 .621 -.521
URUGUAY .251 -.09 .152 -.103 -.06 .02 .04 .00
Note:
1 Coefficients significant at p < .01
2 Coefficients significant at p < .05
3 Coefficients significant at p < .10
In some ways, this analysis refreshes the information conveyed in Table 7.1, but with a clearer
stipulation of the direction of the effects. Once again, the Uruguayan sample departs from expectations,
since most coefficients achieve no significance. This result may imply that asymmetries found in matters of
responsibility attribution do not automatically transpose into electoral ingratitude, the reason being that the
economy simply does not play a major role.
Among Argentineans and Peruvians, the economy–vote correlation follows a more intuitive and
consistent pattern: both past and expected progress is accompanied by a vote of confidence in the
government, whereas setbacks are punished with a pro-opposition vote. Notably, among Argentineans, the
intensity with which government is sanctioned at the polls for economic relapses surpasses whatever
electoral bonus it may get for financial improvements, but this applies only to the retrospective
dimension. Once future-oriented considerations are observed, the incumbents overcome previous
imbalances by acquiring more votes for optimistic expectations than what they lose for signals of economic
pessimism.
Is there a significant difference in the degree to which ruling parties are granted or denied votes
when they are held liable for the state of the economy? Table 7.2 (c) addresses that question by integrating
the previous pieces of information. By splitting the samples into two groups according to the intensity to

105
which government is held economically responsible, previously found relationships can be further tested for
robustness.
Table 7.2 (c)
Individual-Level Linkages between Economic Perceptions and Support for the Incumbent across Levels
of Government Responsibility
(Does responsibility attribution make voters more willing to punish their governments for grievances than to
reward them for prosperity?)
LOW ECONOMIC RESPONSIBILITY OF GOVERNMENT
COUNTRIES RETROSPECTIVE EVALUATIONS PROSPECTIVE EVALUATIONS
PERSONAL NATIONAL PERSONAL NATIONAL
BETTER WORSE BETTER WORSE BETTER WORSE BETTER WORSE
PERÚ -.05 -.271 .02 -.23 .04 -.201 .06 -.121
ARGENTINA .08 .093 .103 -.02 .03 -.083 -.08 -.103
URUGUAY -.01 -.04 .01 -.08 .04 -.01 .122 .03
HIGH ECONOMIC RESPONSIBILITY OF GOVERNMENT
COUNTRIES RETROSPECTIVE EVALUATIONS PROSPECTIVE EVALUATIONS
PERSONAL NATIONAL PERSONAL NATIONAL
BETTER WORSE BETTER WORSE BETTER WORSE BETTER WORSE
PERÚ .351 -.251 .421 -.261 .321 -.231 .401 -.221
ARGENTINA .181 -.471 .381 -.441 .581 -.411 .651 -.501
URUGUAY .321 -.07 .162 -.06 -.00 -.06 -.01 -.01

106
Note:
1 Coefficients significant at p < .01
2 Coefficients significant at p < .05
3 Coefficients significant at p < .10
107
Among those attributing virtually no responsibility to the authorities, the rationale is straightforward: if
oscillations in the economy are not seen as a byproduct of governmental policies, it makes no sense to
employ this criterion to reward or punish the party-in-office. This is what the picture of coefficients below
conventional levels of statistical significance suggests. Conversely, among those holding incumbents liable
for economic records, the voting connection is undeniable. Among Uruguayans, the strength of the
association between betterment in the private finances and inclinations to reelect the ruling force triples,
while also disclosing a relationship between sociotropic optimism and pro-incumbent vote. Among
Peruvians, this specification considerably attenuates a “punishment” vote, as illustrated by the reduction in
the negative coefficient between “worsening” evaluations and voting intention. Finally, a rather balanced
judgment can be found among Argentineans, although one can say that the importance of prospective
visions outweighs retrospective views. As these data reveal, voters put a premium on economic
predictability. In this sense, future-oriented optimism is a more powerful predictor of a pro-incumbent vote
than pessimism about past conditions is of a pro-opposition choice.
Generally speaking, voters tend to think first whether the government is responsible or not for the
different facets of the economy before deciding for whom to vote. If they believe that the official
intervention in the economy has been negligible, they resort to other considerations, extra-economic in
nature, that also shape the vote. If, on the other hand, voters perceive that the government has played a
pivotal role in the state of the economy, they remain open to accommodating their choice to the
punishment–reward rationale.
The only partial exception to this rule is found among the Lima residents whose marked pro-
incumbency bias somewhat contradicts the previous statements. Here, correlations between economic
evaluations and electoral preferences systematically exhibit a pro-incumbency asymmetry, furnishing the
party-in-office many more votes for positive impressions than otherwise for negative opinions. Among these
electors, the prevailing reasoning is one of inertial benevolence: if conditions have improved, reelecting the
president follows naturally; if conditions have worsened, there is still hope that by
108
reelecting the government voters will find economic satisfaction.5
Specifying Non-Economic Effects
If substantial sectors of the public in Argentina, Perú and Uruguay ponder their electoral
calculations with economic considerations in mind and handle their voting decision through some of the
rules of reasoning described above, economic voting is still not necessarily the only explanatory model to
account for how individuals make up their minds at the ballot box. Some electoral effects accounted for by
economic factors might in fact spring from other variables indirectly acting upon those evaluations. In order
to control for eventual spuriousness and achieve a more complete view of the forces shaping individual
voting behavior, it is necessary to introduce other explanatory variables. In Table 7.3, economic voting
arguments are measured against the impact of other, non-economic theories.
5 Obviously, this thinking brings into effect non-economic factors, such as the perception of a poorly endowed opposition in matters of economic policy, the conviction that leadership qualities displayed in other arenas (e.g., the fight against terrorism) would also result in economic betterments if given a chance, or an intrinsic cultural conformism like the one reviewed at the aggregate level under the hypothesis of affirmative voting.

109
Table 7.3
Individual-Level Models of Electoral Choice in Perú, Argentina and Uruguay
REVISED FULL MODEL PERÚ ARGENTINA URUGUAY
CORREL CHANCE CORREL CHANCE CORREL CHANCE
Retrospective Personal .082 1.74 .131 2.59 .00 1.17
Retrospective National .151 2.53 .00 1.42 .00 1.15
Prospective Personal .092 1.89 .073 2.34 .00 1.13
Prospective National .151 2.89 .241 6.26 .00 .77
Responsibility ∗
Retrospective Personal
.00 1.31 .00 1.01 .06 1.79
Responsibility ∗
Retrospective National
.00 1.16 .00 1.06 .00 1.45
Responsibility ∗
Prospective Personal
.00 1.14 .00 1.22 .00 1.06
Responsibility ∗
Prospective National
.00 .89 .00 1.08 .00 .74
Partisan Leanings .161 2.74 .191 4.93 .171 3.68
Lower Class .053 .45 -.073 .16 .00 .39
Middle-Lower Class .00 .71 -.161 .07 .00 .34
Middle Class .00 .77 -.151 .06 .00 .28
Presidential Popularity .541 6.41 .321 4.29 .381 4.46
% Incumbent Votes
Correctly Predicted
94.1 90.6 57.5
% Total Votes Correctly
Predicted
89.2 89.2 85.9

110
REVISED FULL MODEL PERÚ ARGENTINA URUGUAY
CORREL CHANCE CORREL CHANCE CORREL CHANCE
Goodness of Fit 467.17 p=.81 203.74 p=.94 191.33 p=.03
Note:
1 Coefficients are significant at p < .01
2 Coefficients are significant at p < .05
3 Coefficients are significant at p < .10
After comparing the proportion of cases correctly predicted in each country, it becomes evident that
specification improvements translate into better predictions. The Uruguayan case offers by far the best
illustration of this phenomenon: from predicting correctly 15 percent of cases supporting the incumbent
under an economic voting model, the forecast jumps to an accuracy of 57.5 percent of cases when other
extra-economic information is incorporated into the picture of voting behavior. Such improvement is also
verified, although in much more moderate terms, among Argentineans and Peruvians. Once non-economic
effects are included, an examination of the goodness of fit measure places the cases of Argentina and Perú
close to a model of perfect prediction. In the case of Uruguay, however, the counter-intuitive increase in the
value and statistical significance of the chi-square measure suggest that the more complete model should
undergo further revision. In fact, a more careful inspection of the data reveals that once the social class and
government responsibility variables are removed from the model (since they introduce “noise”), the overall
gains in fit are preserved.
After controlling for the individual’s socio-economic origins, his or her partisan inclinations, and
his or her overall estimation of the non-economic leadership exhibited by the president, the effects of
economic considerations on electoral preferences present some variations. In Uruguay, for instance, this
strategy makes the already weak economic effects vanish. In Argentina, adding these controls helps to better

111
qualify the economic influences on voting: retrospective pocketbook orientations surface, whereas the
impact of expectations for personal finances evaporates. In striking contrast, the Peruvian case illustrates a
situation in which the electoral leverage of economic perceptions manifests itself as authentically robust;
with other effects also taken into consideration, the degree to which the economy shapes voting intentions
remains essentially unchanged.
The data from all three countries show how important partisan inclinations and extra-economic
leadership are in the minds of voters. Moreover, variations in the intensity of these effects match
expectations related to the different levels of political institutionalization. In Perú, for each voter who leans
towards Cambio 95 (instead of leaning towards the opposition or remaining politically independent), there is
an average expectation that he or she will be almost three times more likely to vote for the incumbent ticket
than to vote for the opposition. In Uruguay and Argentina, the corresponding chances of sympathizing with
Blancos and Peronists and voting accordingly (rather than for other parties) are about four to one and five to
one, respectively.
Similarly, the effect of presidential popularity on voting is much higher under contexts of low
institutionalization, like the Peruvian one, which are naturally more exposed to personalistic politics. Here,
among individuals holding a favorable view of the president’s non-economic leadership, their likelihood to
judge the incumbent candidate in positive terms raises by a factor of almost 6.5. Notably, in addition to the
remarkable effect of economic optimism on voting, Fujimori’s triumph at the polls seemed even more
strongly inspired by a political referendum model. In comparison, the other two countries show a more
moderate disposition to support the party-in-office based upon a presidential approval criterion. Yet this
does not belittle its influence. Both Argentineans and Uruguayans rely on their views of non-economic
performance to a much greater extent than on economic considerations when deciding for whom to vote.
Curiously, for all the changes that occurred in the social structure of Argentina in the last two
decades, this country is the only one to offer some tinges of class-based voting in relation to the incumbent
party: compared to upper class individuals, those belonging to middle and lower-middle classes are more
112
reluctant to endorse Peronism.6 Moreover, the lack of statistical significance at conventional levels in the
way lower class voters behave compared to the way their upper class counterparts behave confirms the
policlassistic nature of president Menem’s social coalition, based on the two extremes of the social pyramid.
Social class also affects voting behavior in other ways among Argentineans. If economic
explanations reveal two different profiles at play, one oriented towards how the voter’s own pocketbook has
fared in the past and the other one towards how the nation’s economic health may look in the future, the
inspection of the demographic background of each type of economic voter reveals that these two profiles are
also socially different.
The first profile, characterized as the model of “peasant” voting in the literature (McKuen et al.
1992), actually encloses the predominant way through which lower class sectors make use of economic
information when deciding how to vote. This representation, in turn, is consistent with collected evidence
on the higher sensitivity of the members of this group to relative changes in their incomes, which shows that
every minor improvement is capable of making a major marginal difference in their living conditions,
compared to other social sectors (see Hirschman 1987). Thus, economic optimism among lower classes
relative to personal finances in the recent past emerges as an important force assuring the loyalty of this
group to the Peronist candidates.7
The second profile, characterized as the model of “banker” voting (McKuen et al. 1992), matches
the rationale used by upper class voters to support the party-in-office. Holding partisan feelings
constant among other variables, the electoral choice of this sector gets nurtured upon their members’
association of national economic prosperity in the future with the reelection of president Menem. This class
contrast might be interpreted as indicating selfish voting behavior for the lower classes and altruistic voting
behavior for the upper classes, but three reasons refute this interpretation. First, forward-looking sociotropic
6 The exponential function of the log odds (chance=.06 and .07) reveals that the probability of voters belonging to middle and middle-lower classes of supporting the Peronist ticket, compared to the upper classes, is less than a tenth of their inclinations to vote against it.

113
considerations are also present among lower class voters.8 Second, many of the optimistic expectations of
the upper class at the collective level spring from positive assessments at the personal level. In other words,
those expectations increase in anticipation of considerable private benefits.9 Finally, as aggregate evidence
reveals, for every additional percentage point of increase in the GDP, there is a differential marginal rise in
the wealth of upper-income sectors that is several times higher than the one received by other social groups
(see IEERAL-Mediterrranea 1995; Cardoso and Helwege 1992). Accordingly, it can only seem logical for
members of the upper class to endorse governments in relation to their expectations for the national
situation, since positive returns at this level will rapidly translate into an additional bonus for their personal
welfare.
A Comprehensive Picture of Voting Behavior in Argentina, Perú and Uruguay
The data examined above reveal that, as a rule, citizens of Argentina, Perú and Uruguay react in a
rational manner, pretty much as their fellow voters in advanced democracies, rewarding the incumbent with
votes for what is perceived as good performance and punishing it when economic circumstances are grim.
As illustrated by the contrast between Uruguayans and Peruvians, however, variations in intensity and
direction exist across electorates. Among Peruvians, as among Argentineans, responsibility
attribution is almost a tacit rule, barely functioning as a screening mechanism through which economic
evaluations affect voting decisions. Quite likely, this results, among other reasons, from the recent
experience of active presidential intervention in stabilizing the economy and redefining the model of
development. On the other hand, Uruguayans are willing to tinge their vote with economic impressions only
7 The partial correlation coefficient of retrospective pocketbook effects on vote for this class reaches .30, which yields an estimated odds that voters with these characteristics will be 41 times more likely to vote for the incumbent than against it. 8 Controlled for all other factors, this variable presents the only other significant effect at p < .10, with a partial correlation coefficient of .20 (significant at p < .07). This yields an odds ratio of 14.3, that is, it makes those being optimistic for the nation’s economic future over fourteen times more likely to vote for continuity than for change. 9 Indeed, among this group, forward-looking pocketbook considerations stand out as the only significant predictor of prospective orientations for the nation, holding constant all other economic and non-economic variables (the only exception being the measure of government’s responsibility for the future financial situation of the country which

114
if it is clear that the government deserves the credit (or the blame). The consensual mode of economic
policy-making here reduces the incentives to make government automatically accountable for financial
fortunes at all levels, leaving room for the acknowledgment of exogenous (or particularistic) forces shaping
the economic situation.
Diversity also exists in regards to how economic information is used. Some voters, for example
Argentineans, behave on average somewhat ungratefully, blaming and punishing the government more
strongly for dire straits than praising and rewarding it for prosperity. Conversely, Peruvians are markedly
generous and willing to credit the incumbents for whatever positive perception they may have and vote
accordingly, while absolving them for financial misdemeanors and minimizing protest votes. Finally, some
voters, such as the Uruguayans, reproduce the standard pattern of advanced democracies, where symmetric
attitudes prevail (Kiewiet 1983: 49; Lewis-Beck 1988: 78–79). These findings imply that the notion of
protest voting based on the economy cannot be generalized. All depends on the additional political
incentives that are able to mobilize people’s decisions and color their subjective impressions of the
economy, as well as on the degree of economic turmoil and discontinuity recently experienced.
Interestingly enough, in the election of 1995, Argentineans did not accept the major argument
pushed forward by the incumbent authorities during the electoral campaign based on the notion of an
“installment loan” vote (“voto cuota”). The basic message contained in this proposition was that only a
pro-incumbent vote would assure those with credit-card installment loans for the purchase of
home appliances the financial tranquility in the future that would permit them to honor their debts. In
principle, this argument should have yielded a strong partial correlation coefficient between personal
expectations and choice, something that has not been found when considering the whole sample. But this
does not imply that Menem’s campaigners failed in their proselytizing offensive. After disaggregating the
effects of economic perceptions on the vote by social class, controlling for all other factors, the “voto cuota”
emerges boldly among the lower classes. Considering those who assign high responsibility to authorities for
also reaches statistical significance). The standardized beta coefficient reaches .37 (p < .01). When entered alone, the

115
their future personal economic situation, the group of lower class voters awaiting better times show
themselves 4.6 times more likely to support the incumbent than to vote otherwise (partial correlation
coefficient of .25, significant at p < .05). In a like manner, if we remove the evaluation of the president from
the equation, the “voto cuota” also shows up among those with a middle-lower class background. Among
them, prospects for personal well-being were strongly associated with a pro-incumbent vote; in fact, chances
of supporting the Peronist government were eight times higher than of taking the opposite path. For all the
tangible consequences these short-termed influences on voting may involve, one should not dismiss the
importance that partisan traditions have in electoral decisions among Argentineans. In spite of the steady
increase in political independence, electoral volatility and partisan dealignment (see De Riz and Adrogué
1993), partisan identities still command an important effect (partial correlation coefficient of .19, significant
at p < .01).
The case of Uruguay exemplifies most clearly the constraints surrounding the model of economic
voting in Latin America. Here the chances of endorsing political continuity resulting from economic
satisfaction are as likely as those of siding with change. In the 1994 elections, the economy was far from
dividing the political waters in the view of voters. To make sense of Uruguayans’ choices, one should look
elsewhere—for example, at the impressions developed of the overall managerial qualities of the incumbent
party or the endurance of partisan allegiances. Moreover, as a byproduct of the social homogeneity of
Montevideo, no class effects are found.
As prior discussions revealed, contextual factors are essential to understanding economic and
non-economic effects. Wherever inchoate party systems are accompanied by a record of economic
instability, the intensity of economic voting is larger (e.g., in Perú). Indeed, such a context can hardly
provide the opportunity for mass socialization that partisanship requires to affect the vote, while it subverts
the social basis of most electoral alignments. Under such circumstances, perceptions of economic reality
and political leadership considerations prevail.
former variable explains 47 percent of the fluctuations in the later.

116
The popularity of the president is, in all three countries discussed here, a highly significant force. In
Perú, it reveals itself as the strongest single predictor of vote, reflecting the leadership provided by domestic
and foreign policy accomplishments personally conducted by president Fujimori, such as the decline in
guerrilla activism, the sanctions against members of the old political class, and the “rally around the flag”
effect due to the war against Ecuador. In Argentina, the image of the president in relation to a variety of
factors, such as administrative corruption, flamboyant style of governance, handling of military
subordination and human rights issues, and active foreign policy, among others, heavily structure electoral
preferences for continuity or change.10 In this sense, each presidential contest represents a plebiscite on the
political leadership of the ruling authorities.
In sum, based on the data from the elections of 1994-1995, Argentineans, Peruvians and
Uruguayans articulate their choices—with different degrees of intensity—around economic perceptions.
Intuitively, the intensity in economic voting covaries with levels of institutionalization and macro-economic
stability. To a greater extent, and in a more homogeneous fashion, voters face the elections as opportunities
to stage political referendums of the incumbent’s performance. Also, the data show that partisanship is
partially present. Less obvious is the influence of class voting, only visible among Argentineans. Still, a
closer inspection of class interactions with economic considerations yields some positive results. All this
means that, as revealed by the aggregate data and by the scholarly literature
from advanced democracies, the argument for economic voting is salient for Latin Americans, but it does
not exhaust the intrinsic diversity of effects underlying voting choice.
10 Open-ended questions of a probabilistic exit poll revealed that, among the top reasons for supporting president Menem’s reelection, 20.2 percent claimed “the political performance of Menem” and “Menem’s style.” On the other side, 48.2 percent admitted to have voted “to support the continuity of the economic program and stability” and 13.1 percent for reasons of “partisan traditions.” Source: CEOP in Clarín (May 21, 1995: 2).
117
Chapter 8: Understanding the Basis of Electoral Support in Latin America
Times of crisis or sudden changes in economic life invoke different calculations among
individuals and constituencies of nascent democracies. Electoral results in Latin America reflect a
process of decision-making that is complex and multidimensional, and that even under conditions of
financial distress may escape from simple economic-content reactions. Macro-level and survey data for
the period of 1982-1995 reveal that political considerations, as much as economic opinions, move the
expectations and choices of the average Latin American voter, and variations in her living structures of
opportunities, as summarized by different institutional and macro-economic contexts, turn that plurality
of influences even more salient.
As such, the basis that feed the political capital of governments spring not from demanding pre-
requisites of civic knowledge or difficult reasoning but from incumbents’ aptitudes to favorably colour
voting cues used by the majority at the moment of arriving at an electoral decision, by effectively
touching both the hearts and the stomachs of Latin American voters. Certain clear patterns in how
decisional clues affect the voting decision can be discerned.
Reassessing Economic Voting in Latin America
Despite the economic difficulties experienced during the 1980s and 1990s, Latin American
voters did not permit economic factors to outshine the diversity of competing appeals mobilized by
candidate attractiveness or partisan attachments, nor did they remain alien to longstanding cultural trends
that traditionally assign priority to leadership and personality considerations. Voters were sensitive to the
heterogeneity of stimuli received and, indeed, placed economic factors in an important position before
developing choices, but that did not make these the sole determinants of voting.
Economic factors did play a crucial effect in determining the electoral fortunes of
incumbent governments. Indeed, regardless of the level of analysis selected, individual or aggregate,
118
performance in the economic arena had a considerable impact on voting choices. In broader terms, voters
reacted rationally, rewarding effectiveness and punishing failure. Similarly, Latin Americans were not
oriented by myopic reactions to recent economic performance but by relative long-term considerations.
Nonetheless, some interesting gaps remained compared to the voting rationality of citizens of most
advanced democracies.
Among individuals, retrospective and prospective views of the economy summarize the effects of
financial forces. Less clear is the degree to which voters reacted to personal finances, except when
segmented by social class, when the lower strata seemed more prone to follow their pocketbooks. Among
electorates, on the other hand, the government’s efficacy in dealing with the issue of inflation condenses
the effect of economics. As incumbents demonstrated ability to keep prices under control, voters
rewarded them with votes; if they failed to do so, voters’ reproach was unavoidable. These findings are
mostly consonant with other scholars’ description of Western electorates, but exceptions to the general
reward–punishment rule are present. At the micro level, voters economically dissatisfied with the
government were not always willing to choose change over continuity. At the macro level, electorates
seemed indifferent to unemployment fluctuations, despite its relative increase over time. Obviously, other
considerations were mediating these anomalies, such as the perceived economic incompetence of the
opposition or the informal job opportunities through which governments diffuse concern over
unemployment.
I found economic factors to account for a third of the fluctuation in the support for political
continuity, as expressed in votes going to the incumbents over time. This figure confirms that many
voters confront elections as plebiscites on the economic capabilities of the government. However, when
considering other pieces of information that voters make use of during elections, it becomes apparent that
extra-economic factors are present, varied and important.
The Political Determinants of Electoral Support

119
Extraordinary economic circumstances such as those experienced by Latin Americans between
1982 and 1995 were as essential for the salience of economic clues in electoral decisions as they were for
the outpacing of the latter by non-economic factors. The volatile financial conditions that prevailed, in
combination with people’s poor level of information and longstanding cultural predispositions,
highlighted voters’ reliance on those decisional clues emerging as short-term forces. Thus, for example,
as times of prosperity arrived, the influence of economics over electoral choice decreased and the effects
of political leadership, partisanship, democratic performance and candidate appeals became more salient.
While theoretically one might expect partisan clues to be irrelevant in the Latin American
context, in view of the limited opportunities for partisan socialization inherent to post-authoritarian
settings and the diluted policy identity of political parties resulting from the economic crisis, the findings
show that these clues did play a role. As good times superseded bad times, and a few extra years of
democratic rule accumulated along the way, electorates became more prone to rely on partisan clues.
The data also revealed an interesting trade-off between what occurred in the economic and
political arenas. As the economy collapsed, resulting in social turmoil and political unrest, voters did not
tend to reward heavy-handed governments, nor did they support incumbents’ efforts to improve the
quality of democratic conditions as compensation for dire economic circumstances. In the face of
recession, voters simply became indifferent to the democratic accomplishments of the incumbent.
Circumstances changed, however, as the economic environment improved: in the face of prosperity in per
capita terms, tolerance for authoritarian deviations rose, thus revealing a pattern of behavior that linked
the notion of losses to economic performance alone (keeping the notion of democratic governance away
from a domain of potential losses) and that posited economic attitudes as risk-averse for gains more
strongly than for losses.
In a similar vein, no matter whether good or bad economic times prevailed, the reliance on
political leadership clues to make decisions remained, on the aggregate, equally strong. This means that
voters’ sensitivity to government performance in extra-economic domains remained significant and
120
intense regardless of economic circumstances. Voters did not need special incentives like a recession or
depression to turn elections into political referendums on the incumbent’s leadership. Indeed, given that
presidential actions and omissions were the visible parameter of government effectiveness and the focus
of the public’s general expectations in issues that go beyond the economic realm (such as peace,
domestic tranquillity, honest government, etc.), political leadership considerations constituted a core
element of decision across the years.
Incidentally, this evidence also challenges the conventional wisdom about the role of popular
presidents in Latin American elections. Considering the predominance of term limits and the principle of
no reelection in the region, scholars have argued that Latin American political systems are extraordinarily
compelled to produce capable and popular chieftains periodically and to forfeit the political capital
accumulated by a successful leader, since it cannot be used beyond the leader’s term of office (Linz
1994: 17). But the evidence demonstrates that the argument of political leadership remained very
compelling, even though incumbents sought reelection only in five out of the forty-one contests here
analyzed. This means that an effective transfer of presidential leadership to the ruling party took place,
and that such political capital became accumulated as part of the party’s political stock. Moreover, it is
apparent that such transfer occurred with equal likelihood in both highly and poorly developed systems.
Scholars have also rejected the possibility that strong presidents and strong candidates can
coexist in harmony without tearing apart their political organizations and, along the way, seriously
affecting the party’s appeal among voters (for example, see Linz 1994). However, electoral outcomes in
Latin America show that political leadership and candidate voting may coexist and grow stronger
together. The evidence is conclusive in discarding the hypothesis that between a
president’s popularity and candidates’ appeals there is room for only a type of zero-sum relationship. It
seems apparent, then, that electoral politics in the region develops more strongly as a game of political
teams, in which retiring presidents and office-seeking candidates of the same party end up cooperating
beyond circumstantial differences, than a game of isolated political entrepreneurs.
121
The Bases of Political Support
Symbolic aspects are at the heart of electoral politics and are as important as the instrumental
aspects represented by economic performance. Whatever the contingent differences among contests
might be, it is the sense of ruling abilities and psychic security conveyed by the president’s popularity
and the candidates’ appeal that become archetypal determinants of the public’s electoral considerations.
Similarly, the substantive importance of candidates’ attributes in molding electoral outcomes reveals the
resilience of entrenched cultural tendencies favorable to the development of personalist politics.
A fundamental lesson of this analysis is that, in spite of all its intuitive logic, the argument of
economic voting cannot be uncritically transplanted to new democracies. A careful assessment of the
validity of the assumptions underlying such model of voting is, therefore, necessary. In operational terms,
one needs to control for the influences of other contending explanations to assess economic voting
effectively. At the same time, it is necessary to look at the effects of shifts in financial states from a
socialization perspective to understand what causes voters to be economically sensitive. In this line of
argument, fluctuations in wellbeing conditions may generate reactions among some publics, but, unless
these oscillations surpass some critical threshold, they may encounter public tolerance, other issue
priorities in the public mind, or competing influences by non-economic forces, all of which may result in
a lessening of economic voting.
This admission of powerful extra-economic influences has direct implications for the
broader debate over the economic bases of political support, especially considering that the newness of
democratic governments in the region heightens the link between incumbents and political regimes. Since
a central tenet of classical political research on democratic instability highlights economic efficiency as a
causal factor, many observers have inferred that the systematic electoral turnover of ruling parties
throughout the 1980s produced by economic mismanagement may, sooner than later, result in a wave of
democratic breakdowns (Inter-American Dialogue 1989). The alert was clear: “Economic crisis
122
represents one of the most common threats to democratic stability” (Diamond et al. 1989: 17). Moreover,
prior efforts to underscore political factors in shaping the odds of regime survivability (Linz 1978) were
ignored in view of the breadth of the economic emergency. The data reviewed have demonstrate that
claims of economic robustness and political impotence in shaping the fortunes of governments and
political systems were exaggerated. Neither political forces such as the president’s leadership,
partisanship, or candidates’ attributes were so irrelevant nor was the economy so uniquely important. The
obvious implication for studies of political stability is that support for democracy originated in something
else than mere economic efficacy.1
Why was this the case? Although answering this question is beyond the scope of this study, one
may gain insight by looking closely at the way different forces that guide voters and structure the
electoral arena may ultimately work at a meta-electoral level. The relevance of the political leadership of
presidents and the charismatic quality of candidates in shaping the calculus of support, amidst a scenario
of economic uncertainty, demonstrates how important consequential interventions or carefully staged
acts become in letting people know that someone is taking care of the nation and something is being
done.
Examples abound to illustrate the diversity of expressions by which political leadership
becomes salient. Pact-making efforts like the ones forged between government and opposition in Bolivia
throughout the 1980s and in El Salvador since 1992 are one instance. Another is the search for
governability consensus dramatized by office-seeking leaders in Brazil in 1989 and 1994 and Venezuela
in 1988 and 1993. Yet, another case in point is provided by the spectacle of regular endeavors for
concertación social (social pacts) engineered by Argentinean and Mexican presidents between
government, labor and capital in the 1980s and early 1990s, or their frequent recourse to a politics of
decretazos (executive decrees) in the face of congressional paralysis.
In sum, concerning the basis of popular support, economic fragility was effectively
1 Furthermore, the empirical evidence makes apparent that elections helped to keep reactions to office-holders and

123
counterbalanced by a muscular exercise of presidential leadership and an electoral offer of strong
candidates. Conversely, if governments were perceived as weak, presidents remained unpopular, or if
candidates were unable to captivate majorities, incumbents were doomed to perish, the implications for
the political system being that, in the face of continuous economic distress and poor political leadership,
democratic rule might perish as well.
The Controversy over Political Accountability
The plurality of decision clues shaping electoral results also implies that voters did not hold their
leaders accountable merely over economic matters. In fact, the data demonstrate that, under some
circumstances, voters may care less than expected about the incumbent party’s economic responsiveness
and weigh more heavily its capacity to provide effective leadership in social and political matters, while
remaining indifferent to the government’s conduct in the domain of democratic achievements.
Such response has important implications for the ongoing pessimism over the feasibility of
consolidating representative democracies in Latin America, which sees elected leaders failing to become
responsible and accountable to the public concerning economic policies (see O’Donnell
1992; Stokes 1995). For the most part, this criticism reflects the scholarly disappointment with three
assumptions concerning elite and mass behavior, not yet submitted to the empirical test. The first
assumption is that democratic regimes should warrant a clear-cut correspondence between promises and
actions of elected leaders. It follows then, as a second assumption, that citizens pay attention to
instrumental aspects of policies. Finally, the third assumption is that voters follow and decide upon
economic clues exclusively. Since the recent experience of some countries reveals the manifest
irresponsiveness of elected politicians regarding their original economic plans, Latin American regimes
are judged not to fit the model of representative democracy but one labeled as “delegative democracy”
(O’Donnell 1992; Stokes 1995).
political regimes apart, allowing citizens to “throw the rascals out” without inevitably overthrowing their systems.

124
My analysis demonstrates, however, that these assumptions are largely misguided, which raises
questions about the diagnosis of leaders’ irresponsiveness and unaccountability as the modal pattern of
political development in the region. On the one hand, the average Latin American voter is not concerned
about promises but results, nor is the merit of reelection of a president solely judged upon economic
factors. In fact, leadership considerations founded in the political performance of incumbents or the
personal attractiveness of candidates constitute the essential cuegivers of mass publics, along with
economic factors, which implies a public tolerance for a change in past pledges or original plans as long
as results become pleasing. Although salient, economic incentives do not command voters’ preferences in
isolation, which means that they do not exhaust the opinion linkage between citizens and leaders. Voters’
notions of political representation and public responsiveness are in fact broader.
On the other hand, if the apparent rule was a deficit of accountability, why did six out of ten
incumbents fail in seeking reelection, that is, in successfully securing their electoral impunity? If scholars
have deemed electoral democracy in Latin America to fall short as a mechanism of effective
representation, why did most office-holders, even those who abided by their initial promises, failed to be
exonerated at the voting booths? My view is that a systematic pattern of
removal of ruling parties from government means that electoral mechanisms of accountability are alive
and well. Elections effectively allow voters to sanction incumbents whose past performance they do not
approve of and favor those who have served them well. The view that elections are expected to do more
than this, such as serve a planning function by allowing citizens to appraise alternative programs, is
misguided, as it fails to recognize that electoral campaigns in Latin America are far from educating the
public in the region or that the levels of political information of the average Latin American voter
remained rather poor.
Electoral choice cannot be viewed only through economic lenses. Even under the exceptional
material conditions experienced by the citizens of Latin America in the 1980s and 1990s, extra-economic
forces were as relevant, if not more, as economic ones in explaining the voting behavior of Latin

125
Americans in their passage towards mature democracy.

126
References
Acuña, Carlos (1994). “Politics and Economics in the Argentina of the Nineties,” in: William C. Smith et
al., eds. Democracy, Markets, and Structural Reform in Latin America (New Brunswick: North-
South Center/Transaction).
Ames, Barry (1970) "Bases of Support for Mexico's Dominant Party." American Political Science
Review, 64, 1 (March): 153-67.
Ames, Barry (1994): “The Reverse Co-Attail Effect: Local Party Organizations in the 1989 Brazilian
Presidential Election,” American Political Science Review, 88: 95–111.
Anderson, Charles (1968; reprinted in 1992). “Towards a Theory of Latin American Politics,” in: Howard
Wiarda, ed. (1992) Politics and Social Change in Latin America (Boulder: Westview Press).
Anderson, Leslie (1994). “Surprises and Secrets: Lessons from the 1990 Nicaraguan Election,” Studies in
Comparative International Development, vol. 27, 3: 93–119.
Arroyo, Jesus A., and Stephen Morris (1993). “The Electoral Recovery of the PRI in Guadalajara, Mexico:
1988–1992,” Bulletin of Latin American Research, 1: 91–102.
Bartels, Larry (1996). “Uninformed Votes: Information Effects in Presidential Elections,” American
Journal of Political Science, 1: 194–230.
Beck, Paul Allen (1986). “Choice, Context, and Consequence: Beaten and Unbeaten Paths toward a
Science of Electoral Behavior,” in: Herbert Weisberg, ed. Political Science: The Science of
Politics (New York: Agathon Press): 241–283.
Belluci, Paolo (1985). “Economic Concerns in Italian Electoral Behavior: Toward a Rational Electorate?,”
in: Eulau, Heinz and Michael Lewis-Beck, eds. (1985) Economic Conditions and Electoral
Outcomes. The United States and Western Europe. (New York. Agathon).
Belluci, Paolo (1991).”Italian Economic Voting: a Deviant Case or Making a Case for a Better Theory?”
in: Norpoth, Helmut et al., ed. Economics and Politics: The Calculus of Support (Ann Arbor:

127
University of Michigan Press): 63–84.
Bennett, Lance W., and Bart Salisbury (1987). “Rational Choice: the Emerging Paradigms in Electoral
Studies,” Research in Micropolitics II: 1–30.
Berelson, Bernard et al. (1954). Voting (Chicago: University of Chicago Press).
Booth, John, and Mitchell Seligson (1994). “Paths to Democracy and the Political Culture of Costa Rica,
Mexico, and Nicaragua,” in: Larry Diamond, ed. Political Culture and Democracy in Developing
Countries (Boulder: Lynne Rienner).
Brady, Henry E., and Paul M. Sniderman. (1985). “Attitude Attribution: A Group Basis for Political
Reasoning.” American Political Science Review 79:1061-1078.
Brophy-Baermann, Michelle (1994). “Economics and Elections: The Mexican Case.” Social Science
Quarterly, 75, 1 (March): 125–135.
Budge, Ian, and Dennis Farlie (1983). Explaining and Predicting Elections: Issue Effects and Party
Strategies in 23 Democracies (London: Allen & Unilwin).
Buendía, Jorge (2001) “Economic Reform and Political Support in Mexico,1988–1997), in: Susan Stokes
(ed.), Public Support for Market Reforms in New Democracies. (New York: Cambridge University
Press).
Butler, David et al., eds. (1981). Democracy at the Polls: A Comparative Study of Competitive National
Elections. (Washington, DC: American Enterprise Institute).
Butler, Edgar, and Jorge Bustamante, eds. (1991). Sucesión Presidencial. The 1988 Mexican Presidential
Election (Boulder: Westview Press).
Calvert, Susan, and Peter Calvert (1989). Argentina. Political Culture and Instability. (Pittsburgh:
University of Pittsburgh Press).
Cameron, Maxwell (1994). Democracy and Authoritarianism in Peru: Political Coalitions and Social
Change (New York: St Martin’s Press)
Campbell, Angus et al. (1960). The American Voter (New York: Wiley Press).
128
Canzani, Agustin (1995). “Minorities Democracy. The Uruguayan Elections of 1994,” Paper presented at
the WAPOR Regional Meeting, Margarita Is., Venezuela.
Carrasquero, José (1995). “Legitimacy and Popular Support for the Democratic Political System in
Venezuela,” Ph.D. dissertation. Storrs: University of Connecticut.
Carrión, Julio (1998). “Partisan Decline and Presidential Popularity. The Politics and Economics of
Representation in Peru, 1980–1993,” in: Kurt von Mettenheim and James Malloy (eds.),
Deepening Democracy and Representation in Latin America (Pittsburgh: University of
Pittsburgh Press).
Catterberg, Edgardo, and Maria Braun (1989). “Las Elecciones Presidenciales Argentinas del 14 de Mayo
de 1989: la Ruta a la Normalidad.” Desarrollo Económico, 115: 361–374.
Catterberg, Edgardo (1991). Argentina Confronts Politics: Political Culture and Public Opinion in the
Argentine Transition to Democracy (Boulder: Lynne Rienner Publishers).
CEPAL (Comisión Económica para América Latina) (1989–95) Preliminary Overview of the Economy of
Latin America and the Caribbean. (Santiago de Chile: United Nations).
Chalmers, Douglas (1973). “Parties and Society in Latin America,” Studies in Comparative International
Development, 7: 102–128.
Clarín. (1995). “El Mandato de las Urnas.” (Mayo 16): 12.
Clarke et al., ed. (1989). Economic Decline and Political Change (Pittsburgh: University of Pittsburgh
Press).
Colosio, Luis (1993). “Why the PRI Won the 1991 Elections,” in: Riordan Riott ed., Political and
Economic Liberalization in Mexico (Boulder: Lynne Rienner).
Conaghan, Catherine (1992). “Capitalists, Technocrats, and Politicians: Economic Policy-Making and
Democracy in the Central Andes,” in: Scott Mainwaring, ed. Issues in Democratic Consolidation
(Notre Dame: University of Notre Dame Press).
Conaghan, Catherine (1994). “‘Loose Parties,’ ‘Floating’ Politicians, and Institutional Stress:
129
Presidentialism in Ecuador, 1979–1988,” in: Juan Linz and Arturo Valenzuela, ed. The Failure of
Presidential Democracy (Baltimore: The Johns Hopkins University Press).
Conaghan, Catherine (1995). “Polls, Political Discourse, and the Public Sphere: The Spin on Peru’s Fuji-
golpe,” in: Peter H. Smith, ed. Latin America in Comparative Perspective. (Boulder: Westview).
Converse, Philip (1964) “The Nature of Belief Systems in Mass Publics”, in: Apter, David. Ed. Ideology
and Discontent. (New York: Free Press):206-261.
Converse, Philip (1975). “Public Opinion and Voting Behavior,” in: Greenstein, Fred and Nelson Polsby,
Handbook of Political Science (San Francisco: Addison-Wesley).
Coppedge, Michael (1994). “Venezuela: Democratic despite Presidentialism,” in: Juan Linz and Arturo
Valenzuela, eds. The Failure of Presidential Democracy (Baltimore: The Johns Hopkins
University Press).
Crewe, Ivor (1994). “Voters, Parties and Leaders Thirty Years on: Western Electoral Studies and the
New Democracies of Eastern Europe,” in: Ian Budge and David McKay, eds. Developing
Democracy. Comparative Research in Honour of J.F.P. Blondel (London: Sage), 56–78.
Dahl, Robert (1971). Polyarchy (New Haven: Yale University Press).
Dalton, Russell (1988). Citizen Politics in Western Democracies (New York: Chatham House).
Dalton, Russell, and Wattenberg, Martin (1993) “The Not So Simple Act of Voting,” in: Finifter, Ada, ed.
The State of the Discipline II (Chicago: APSA).
Davis, Charles, and John Speer (1991). “The Psychological Basis of Regime Support among Mexican and
Venezuelan Workers: Insttumental or Expressive? “ Comparative Political Studies. 24. 3 (October):
319-343.
Dealy, Glen (1974: reprinted in 1992). “The Tradition of Monistic Democracy in Latin America,” in:
Howard Wiarda, ed. Politics and Social Change in Latin America: Still a Distinct Tradition?
(Boulder: Westview Press).
Diamond, Larry, Juan Linz, and Seymour M. Lipset, eds. (1989). Democracy in Developing Countries:

130
Latin America (Boulder: Rienner).
Dietz, Henry (1987). “Electoral Politics in Peru, 1978–1986.” Journal of Interamerican Studies and World
Affairs, 4l: 139–163.
Dix, Robert (1984). “Incumbency and Electoral Turnover in Latin America,” Journal of Interamerican
Studies and World Affairs, 4: 435–448.
Dix, Robert (1989). “Cleavage Structure and Party Systems in Latin America,” Comparative Politics, 3: 23–
37.
Dix, Robert (1992). “Democratization and the Institutionalization of Latin American Political Parties,”
Comparative Political Studies, 24: 488–511.
Domínguez, Jorge, and James McCann (1992). “Whither the PRI? Explaining Voter Defection in the 1988
Mexican Presidential Election,” Electoral Studies, 11: 207–222.
Domínguez, Jorge, and James McCann (1995). “Shaping Mexico’s Electoral Arena: The Construction of
Partisan Cleavages in the 1988 and 1991 National Elections.” American Political Science Review,
1: 34–48.
Downs, Anthony (1957). An Economic Theory of Democracy (Harper & Row).
Drake, Paul, and Eduardo Silva (1986). Elections and Democratization in Latin America, 1980–1985. (San
Diego: CILAS-CUSMS, UCSD).
Dugan, William, and Henry Dietz (1995). “Urban Social Classes and Voting Behavior in Lima,” Paper
presented at the Latin American Studies Association Congress, Washington, DC., September 28–
30.
Edwards, Sebastian (1995). Crisis and Reform in Latin America. From Despair to Hope (New York:
Oxford University Press).
Edwards III, George et al. (1995). “Explaining Presidential Approval: The Significance of Issue
Salience,” American Journal of Political Science, 1: 108–134.
Enelow, James, and Melvin Hinich (1982). “Ideology, Issues and the Spatial Theory of Elections,”

131
American Political Science Review, 76: 493–501.
Eulau, Heinz and Michael Lewis-Beck, eds. (1985). Economic Conditions and Electoral Outcomes. The
United States and Western Europe (New York: Agathon).
Fackle, Tim, and Tse-min Lin (1995). “Political Corruption and Presidential Elections, 1929–1992,”
Journal of Politics, 4: 971–993.
Fiorina, Morris (1981). Retrospective Voting in American National Elections (New Haven: Yale
University Press).
Flisfisch, Angel (1983). “El Surgimiento de una Nueva Ideología Democrática,” Crítica&Utopía, 8: 13–35.
Gamarra, Eduardo (1994a). “Crafting Political Support for Stabilization: Political Pacts and the New
Economic Policy in Bolivia,” in: William C. Smith et al., eds. Democracy, Markets, and Structural
Reform in Latin America (New Brunswick: North-South Center/Transaction).
Gamarra, Eduardo (1994b). “Market-Oriented Reforms and Democratization in Latin America: Challenges
of the 1990s,” in: William C. Smith et al., eds. Latin American Political Economy in the Age of
Neoliberal Reform (New Brunswick: North-South Center/Transaction).
Gastil, Raymond, coord. (1978–1991). Freedom in the World. The Annual Survey of Political Rights and
Civil Liberties (Westport: Greenwood Press).
Geddes, Barbara (1995). “The Politics of Economic Liberalization,” Latin American Research Review, 2:
195–214.
Guilhon de Albuquerque, José (1992). “Identidade, Oposição e Pragmatismo: Um Teoria Política do
Voto,” Lua Nova, 26: 53–79.
Ginsberg, Benjamin, and Alan Stone, ed. (1991). Do Elections Matter? (New York: Sharpe).
Grofman, Bernard (1987). “Models of Voting,” in: Bernard Grofman, ed. Research in Micropolitics
(Greenwich: JAI Press).
Harrison, Lawrence (1985). Underdevelopment is a State of Mind. The Latin American Case. (Lanham:
Madison Books).

132
Hausmann, Ricardo, and Michael Gavin (1995).”Overcoming Volatility in Latin America,” Development
Policy, (September): 1–3.
Hibbs, Douglas (1987). The American Political Economy. Macroeconomics and Electoral Politics.
(Cambridge: Harvard University Press).
Inter-American Development Bank (1982–1994). Economic and Social Progress in Latin America.
(Washington, DC: IADB).
Jackson, John (1975). “Issues, Party Choices, and Presidential Votes,” American Journal of Political
Science, 2: 161–186.
Jacobson, Gary, and Samuel Kernell (1981). Strategy and Choice in Congressional Elections. (New Haven:
Yale University Press).
Joslyn, Richard (1991). “Candidate Appeals and the Meaning of Elections,” in: Benjamin Ginsberg and
Alan Stone, ed., Do Elections Matter? (New York: Sharpe), 9–31.
Karatnycky, Adrian, coord. (1992–1995). Freedom in the World: The Annual Survey of Political Rights and
Civil Liberties (London: Freedom House).
Keech, William R. (1995). Economic Politics: The Costs of Democracy. (New York: Cambridge
University Press.)
Keesing’s Record of World Events (1992–1994). (London: Longman).
Kelley, Jonathan (1995). “Public Images of Foreign and Domestic Political Leaders,” International Social
Science Journal:
Key, V.O. (1966). The Responsible Electorate (New York: Belnap Press).
Kieweit, Roderick (1983). Macroeconomics and Micropolitics (Chicago: University of Chicago Press).
Kinder, Donald, and Roderick Kiewiet (1981). “Sociotropic Politics,” British Journal of Political
Science, 11: 129–161.
Kramer, Gerald (1971). “Short-term Fluctuations in U.S. Voting Behavior, 1896–1964,” American Political
Science Review, 65: 131–143.

133
Kramer, Gerald (1983). “The Ecological Fallacy Revisited: Aggregate vs. Individual-Level Findings on
Election, and Sociotropic Voting,” American Political Science Review 23: 92–111.
LatinoBarómetro I (May–June 1995).
Lamounier, Bolívar (1980). “O Voto em São Paulo, 1970–1978,” in: Bolívar Lamounier, org. Voto de
Desconfiança: Eleições e Mudança Política no Brasil, 1970–1978 (São Paulo: Vozes-Cebrap), 15–
80.
LASA (1990). The 1990 Nicaragua Election: Observation Commission Report (Pittsburgh: Latin American
Studies Association).
LASA (1995). The 1995 Electoral Process in Peru (Miami: Latin American Studies Association/North-
South Center, University of Miami).
Lau, Robert, and David O. Sears, eds. (1986). Political Cognition. (Hillsdale, NJ: Lawrence Erlbaum
Associates)
Lewis-Beck, Michael (1988). Economics and Elections: The Major Western Democracies (Ann Arbor:
University of Michigan Press).
Lewis-Beck, Michael, and Tom Rice (1992). Forecasting Elections (Washington, D.C.: CQ Press).
LoVuolo, Ruben (1995). “The Welfare State in Contemporary Argentina,” Kellogg Institute Working
Paper-Democracy and Social Policy Series, 2.
Linz, Juan J. (1978). “Crisis, Breakdown, and Reequilibration,” in: Juan Linz and Alfred Stepan, eds. The
Breakdown of Democratic Regimes (Baltimore: The Johns Hopkins University Press): 3–111.
Linz, Juan J. (1994). “Presidential or Parliamentary Democracy: Does it Make a Difference?,” in: Juan Linz
and Arturo Valenzuela, ed. The Failure of Presidential Democracy (Baltimore: The Johns Hopkins
University Press).
Lipset, Seymour, and Stein Rokkan (1967). “Cleavages Structures, Party Systems, and Voter Alignments:
An Introduction,” in: Seymour M. Lipset and Stein Rokkan, ed. Party Systems and Voter
Alignments (New York: The Free Press).
134
Lupia, Arthur (1994). " Shortcuts Versus Encyclopedias: Information and Voting Behavior in California
Insurance Reform Elections." American Political Science Review. 88:63-76.
MacKuen, Michael (1983). “Political Drama, Economic Conditions, and the Dynamics of Presidential
Popularity,” American Journal of Political Science, 2: 165–192.
Mainwaring, Scott, and Eduardo Viola (1984). “New Social Movements, Political Culture and
Democracy: Brazil and Argentina in the 1980s,” Telos, 61: 17–54.
Mainwaring, Scott (1995). “Democracy in Brazil and the Southern Cone: Achievements and Problems,”
Journal of Interamerican Studies and World Affairs, 1: 113–179.
Mainwaring, Scott, and Timothy Scully (1995). Building Democratic Institutions: Party Systems in Latin
America (Standford: Standford University Press).
Mancha Navarro, Tomás (1995). Economía y Votos en España (Madrid: Instituto de Estudios
Económicos).
Markus, Gregory, and Philip Converse (1979). “A Dynamic Simultaneous Equation Model of Electoral
Choice,” American Political Studies Review, 73: 1055–1070.
Martz, John (1994). “Problems of Conceptualization and Comparability in Latin America,” in: Mattei
Dogan and Ali Kazancigil, Comparing Nations (Oxford: Blackwell).
McDonald, Ronald and Mark Ruhl (1989). Party Politics and Elections in Latin America (Boulder:
Westview).
Meneguello, Rachel (1995). “Electoral Behaviour in Brazil: The 1994 Presidential Elections.” International
Social Science Journal, 146: 67–79.
Méndez, Gustavo (1983). “Actitudes y Comportamiento de la Opinión Pública,” in; Conciencia 21,
Sistema Político y Campañas Electorales (Caracas: Conciencia 21).
Miller, Arthur, and Ola Listhaug (1985). “Economic Effects on the Vote in Norway,” in: Helmut Eulau
and Michael Lewis-Beck, ed. Economic Conditions and Electoral Outcomes: The United States
and Western Europe (New York: Agathon): 125–143.

135
Miller, William (1989). “Studying How the Economy Affects Attitudes and Behavior: Problems and
Prospects:, in: Harold Clarke et al., ed. Economic Decline and Political Change (Pittsburgh:
University of Pittsburgh Press).
Mora y Araujo, Manuel (1986). “The Nature of the Alfonsín Coalition,” in: Paul Drake, and Eduardo Silva,
eds. Elections and Democratization in Latin America, 1980–1985 (San Diego:CILAS-CUSMS,
UCSD).
Moreno, Alejandro, and Keith Yanner (1995). “Predictors of Voter Preferences in Mexico’s 1994
Presidential Election,” Paper presented at the 1995 Latin American Studies Association, The
Sheraton Washington, September 28–30.
Nannestadt, Peter, and Martin Paldam (1994). “The VP-Function: A Survey of the Literature on Vote and
Popularity Functions after 25 Years,” Public Choice, 79: 213–245.
Nelson, Joan ,ed. (1990). Economic Crisis and Policy Choice. The Politics of Adjustment in the Thirld
World (Princeton: Princeton University Press).
Neuman, W. Russell (1986). The Paradox of Mass Politics: Knowledge and Opinion in the American
Electorate (Cambridge: Harvard University Press).
Nohlen, Dieter. ed. (1993). Enciclopedia Electoral Latinoamericana y del Caribe. (San José: Instituto
Interamericano de Derechos Humanos).
Norpoth, Helmut et al., ed. (1991). Economics and Politics: The Calculus of Support (Ann Arbor:
University of Michigan Press).
O’Donnell, Guillermo et al. (1986). Transition from Authoritarian Rule (Baltimore: John Hopkins
University Press).
O’Donnell, Guillermo (1992). “Delegative Democracy,” Kellogg Institute Working Paper, 172 (March)
Pacek, Alexander, and Benjamin Radcliff (1995). “The Political Economy of Competitive Elections in the
Developing World,” American Journal of Political Science, 3: 745–759.
Paldam, Martin (1991). “How Robust is the Vote Function?” in: Helmut Norpoth et al., Economics and

136
Politics: The Calculus of Support (Ann Arbor: University of Michigan Press).
Panzer, John, and Ricardo Paredes (1991). “The Role of Economic Issues in Elections. The Case of 1988
Chilean Plebiscite”. Public Choice 71: 51-59.
Parodi, Jorge, and Walter Twanama (1993). “Los Pobladores, la Ciudad y la Política: Un Estudio de
Actitudes,” in: Jorge Parodi, ed., Los Pobres, la Ciudad y la Política (Lima: CEDYS).
Payne, Douglas (1995). “Latin America: Ballots, Neo-Strongmen, Narcos and Impunity,” in: Karatnycky,
Adrian, coord., Freedom in the World: The Annual Survey of Political Rights and Civil Liberties
(London: Freedom House).
Peffley, Mark (1985). “The Voter as Juror: Attributing Responsibility for Economic Conditions,” in:
Eulau, Heinz, and Michael Lewis-Beck, eds. Economic Conditions and Electoral Outcomes. The
United States and Western Europe. (New York: Agathon).
Petras, James, and Morris Morley (1992). Latin America in the Time of Cholera: Electoral Politics,
Market Economics, and Permanent Crisis (New York: Routledge).
Pinto, Celia R.J. (1994). “Tendências do Discurso Brasileiro Atual: os Limites dos Discursos das
Soluções Milagrosas,” in: Marcello Baquero, org., Cultura Política e Democracia (Porto Alegre:
Editora da Universidade).
Popkin, Samuel (1991). The Reasoning Voter: Communication and Persuasion in Presidential
Campaigns. (Chicago: University of Chicago Press).
Portantiero, Juan Carlos (1985). “Democracia y la Creación de Rutinas Institucionales,” Presentation at
the Third World Foundation International Congress, Buenos Aires.
Powell, G. Bingham, and Guy Whitten (1993). “A Cross-National Analysis of Economic Voting: Taking
Account of the Political Context,” American Journal of Political Science, 2: 394–414.
Quattrone, George, and Amos Tversky (1988). “Contrasting Rational and Psychological Analyses of
Political Choice,” American Political Science Review, 82: 719–736.
Rakowski, Cathy, ed. (1994). Contrapunto: The Informal Sector Debate in Latin America (Albany:
137
SUNY Press).
Remmer, Karen. (1991). “The Political Impact of Economic Crisis in Latin America in the 1980s.”
American Political Science Review, 3: 777–800.
RePass, David (1971). “Issue Saliency and Party Choice,” American Political Science Review 65: 389–
400.
Rial, Juan (1986).”The Uruguayan Elections of 1984: A Triumph of the Center,” in: Paul Drake, and
Eduardo Silva, eds. Elections and Democratization in Latin America, 1980–1985 (San Diego:
CILAS-CUSMS, UCSD).
Rius, Andrés (1992). “El Gobierno, la Economía, y el Hombre de la Calle,” Suma, 7: 17–35.
Rose, Richard, and Thomas Mackie (1983). “Incumbency in Government: Asset or Liability?,” in: Hans
Daalder and Peter Mair, eds., Western European Party Systems: Continuity and Change (Beverly
Hills: Sage): 115–137.
Rosenberg, Mark B. (1987). "Honduras." Latin America and Caribbean contemporary record VI:B317-
B340 (1986-1987).
Rosenberg, Mark B. (1989). "Can democracy survive the Democrats? From transition to consolidation in
Honduras." In: Booth, John A. and Mitchell A. Seligson, eds. 1989. Elections and democracy in
Central America. (Chapel Hill: The University of North Carolina Press): 40-59.
Rosenberg, Shawn, with Patrick McCafferty (1987). “The Image and the Vote. Manipulating Voters’
Preferences,” Public Opinion Quarterly, 51: 31–47.
Schatan, Jacobo et al., comp. (1991). El Sector Informal en América Latina (México, D.F.: CIDE).
Scully, Timothy, and J. Samuel Valenzuela (1993). “From Democracy to Democracy: Continuities and
Changes of Electoral Choices and the Party System in Chile,” Kellogg Institute Working Paper,
199 (July).
Sears, David et al. (1981). “Self-Interest vs. Symbolic Politics in Policy Attitudes and Presidential
Voting,” American Political Science Review, 74: 670–684.
138
Seligson, Mitchell (1987). “Costa Rica and Jamaica,” in: Myron Weiner and Ergun Özbudun, eds.
Competitive Elections in Developing Countries (Raleigh: Duke University Press).
Seligson, Mitchell, and Miguel Gómez B. (1989). “Ordinary Elections in Extraordinary Times: The Political
Economy of Voting in Costa Rica,” in: John Booth and Mitchell Seligson, eds. Elections and
Democracy in Central America (Chapel Hill: The University of North Carolina Press): 158–184.
Seligson, Mitchell, and John Booth, eds. (1995) Elections and Democracy in Central America. Revisited
(Chapel Hill: The University of North Carolina Press).
Sigelman, Lee (1990). “Answering the 1,000,000-Person Question: the Measurement and Meaning of
Presidential Popularity,” Research in Micropolitics, 3: 209–226.
Simon, Herbert (1957). Models of Man: Social and Rational (New York: Wiley).
Skidmore, Thomas, ed. (1993). Television, Politics, and the Transition to Democracy in Latin America
(Washington, D.C.: Woodrow Wilson Center Press).
Smith, William et al., eds. (1994). Latin American Political Economy in the Age of Neoliberal Reform
(New Brunswick: Transaction).
Sniderman, Paul et al. (1991). Reasoning and Choice. (Cambridge: Cambridge University Press).
Sniderman, Paul (1993). “The New Look in Public Opinion Research,” in: Ada Finifter, ed. Political
Science: The State of the Discipline II (Washington, D.C.: APSA).
Stein, Ernesto, and Jorge Steb (1994).”Political Stabilization Cycles in High Inflation Economies,”
Development Policy, 3 (September): 9–10.
Stigler, Gerald (1973). “General Economic Conditions and National Elections,” American Economic
Review, 63: 160–167.
Stimson, James (1985). “Regression in Space and Time: A Statistical Essay,” American Journal of Political
Science, 4: 914–947.
Stokes, Susan (1995). “Democracy and the Limits of Popular Sovereignty in South America,” in: Joseph
Tulchin with Bernice Romero, eds., The Consolidation of Democracy in Latin America (Boulder:

139
Lynne Rienner).
Stokes, Susan, ed. (2001). Public Support for Market Reforms in New Democracies. (New York:
Cambridge University Press).
The Economist Intelligence Unit (1987–1995). Country Reports (several countries). (London: The
Economist).
Torre, Juan Carlos (1993). “América Latina: El Gobierno de la Democracia en Tiempos Difíciles,” Instituto
Di Tella Working Paper, 13.
Torres, Arístides (1985). “Fe y Desencanto Democrático en Venezuela,” Nueva Sociedad, 77: 28–45.
Trindade, Hélgio, org. (1991) América Latina: Eleições e Governabilidade Democrática (Porto Alegre:
UFRGS).
Tufte, Edward (1978). Political Control of the Economy (Princeton: Princeton University Press).
Urani, Andre (1995). “Crescimento e Geração de Emprego e Renda no Brasil,” Lua Nova, 35: 5–38.
Weffort, Francisco (1989). “Incertezas da Democracia...,” in: José G. Albuquerque and José Moisés,
Dilemas da Democracia no Brasil (São Paulo: Vértice).
Weffort, Francisco (1991). “America Astray,” Kellogg Institute Working Paper, 162 (July).
World Values Study I (1980-1995) (ICPSR-University of Michigan).
Vilas, Carlos (1995). “Entre la Democracia y el Neoliberalismo: Los Caudillos Electorales de la
Postmodernidad,” in: Silvia Dtrenit and Leonardo Valdés, comp. El Fin de Siglo y los Partidos
Políticos en América Latina (México D.F.: Instituto Mora): 323–340.
von Mettenheim, Kurt (1995) The Brazilian Voter. Mass Politics in Democratic Transition, 1974–1986
(Pittsburgh: University of Pittsburgh Press).
Weatherford, Stephen (1983). “Economic Voting and the “Symbolic Politics” Argument: A Reinterpretation
and Synthesis,” American Political Science Review, 23: 158–174.
Wiarda, Howard (1992). “Social Change, Political Development, and the Latin American Tradition” in:
Howard Wiarda, ed., Politics and Social Change in Latin America: Still a Distinct Tradition?

140
(Boulder: Westview Press).
Zermeño, Sergio (1989). “El regreso del líder, neoliberalismo y desorden”. Revista Mexicana de
Sociología, 4: 115-150.
141
NOTES
CHAPTER 1: Theories of Electoral Choice and Empirical Research on Elections in Latin America -
Utility, Candidates’ Attributes, Accountability Models and the Economic Voting Approach
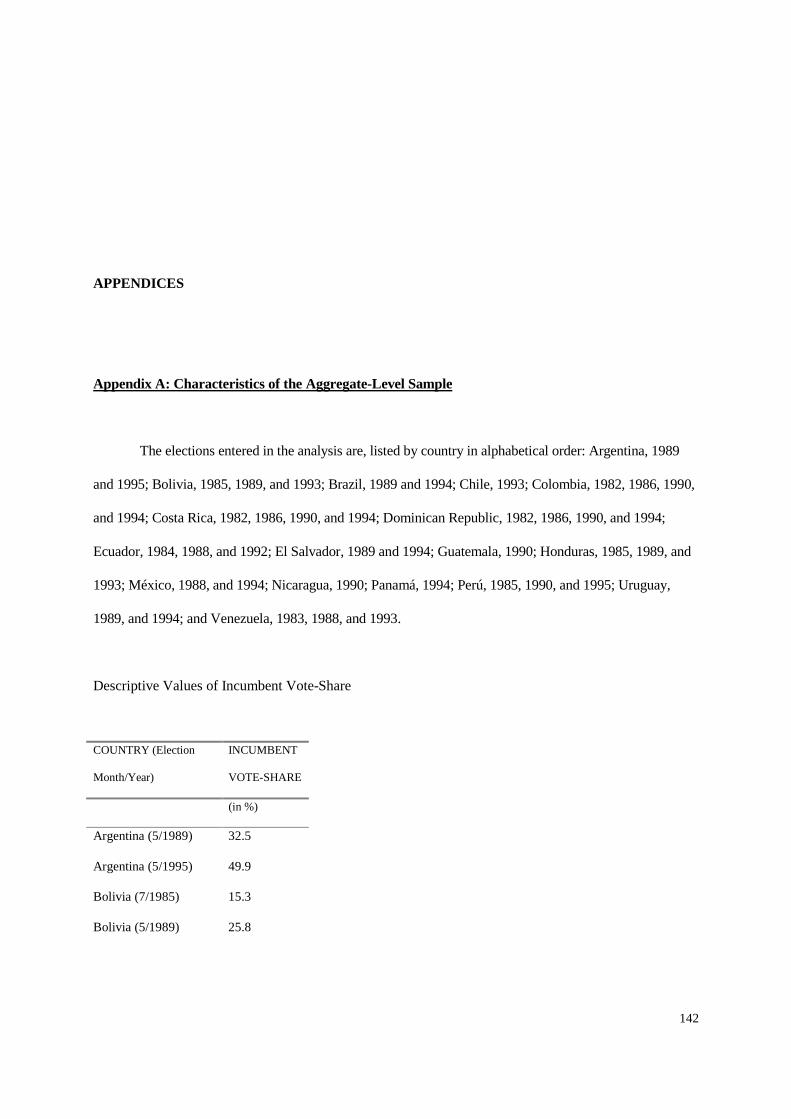
142
APPENDICES
Appendix A: Characteristics of the Aggregate-Level Sample
The elections entered in the analysis are, listed by country in alphabetical order: Argentina, 1989
and 1995; Bolivia, 1985, 1989, and 1993; Brazil, 1989 and 1994; Chile, 1993; Colombia, 1982, 1986, 1990,
and 1994; Costa Rica, 1982, 1986, 1990, and 1994; Dominican Republic, 1982, 1986, 1990, and 1994;
Ecuador, 1984, 1988, and 1992; El Salvador, 1989 and 1994; Guatemala, 1990; Honduras, 1985, 1989, and
1993; México, 1988, and 1994; Nicaragua, 1990; Panamá, 1994; Perú, 1985, 1990, and 1995; Uruguay,
1989, and 1994; and Venezuela, 1983, 1988, and 1993.
Descriptive Values of Incumbent Vote-Share
COUNTRY (Election
Month/Year)
INCUMBENT
VOTE-SHARE
(in %)
Argentina (5/1989) 32.5
Argentina (5/1995) 49.9
Bolivia (7/1985) 15.3
Bolivia (5/1989) 25.8
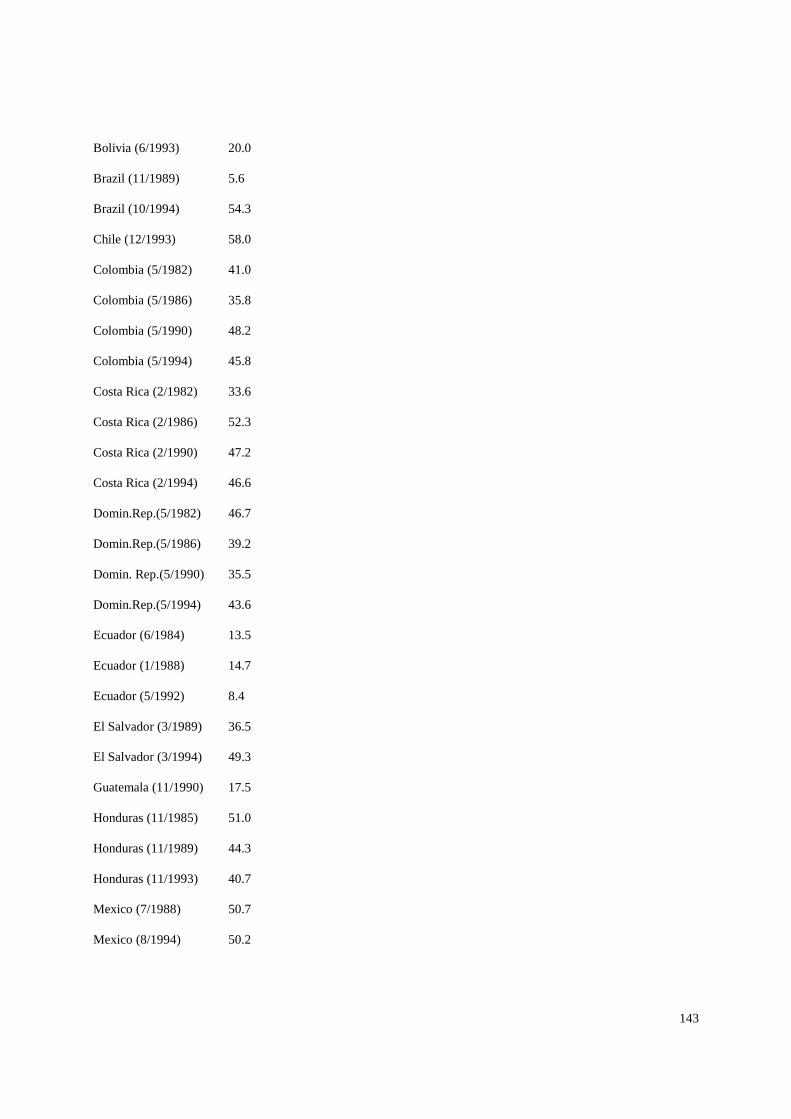
143
Bolivia (6/1993) 20.0
Brazil (11/1989) 5.6
Brazil (10/1994) 54.3
Chile (12/1993) 58.0
Colombia (5/1982) 41.0
Colombia (5/1986) 35.8
Colombia (5/1990) 48.2
Colombia (5/1994) 45.8
Costa Rica (2/1982) 33.6
Costa Rica (2/1986) 52.3
Costa Rica (2/1990) 47.2
Costa Rica (2/1994) 46.6
Domin.Rep.(5/1982) 46.7
Domin.Rep.(5/1986) 39.2
Domin. Rep.(5/1990) 35.5
Domin.Rep.(5/1994) 43.6
Ecuador (6/1984) 13.5
Ecuador (1/1988) 14.7
Ecuador (5/1992) 8.4
El Salvador (3/1989) 36.5
El Salvador (3/1994) 49.3
Guatemala (11/1990) 17.5
Honduras (11/1985) 51.0
Honduras (11/1989) 44.3
Honduras (11/1993) 40.7
Mexico (7/1988) 50.7
Mexico (8/1994) 50.2
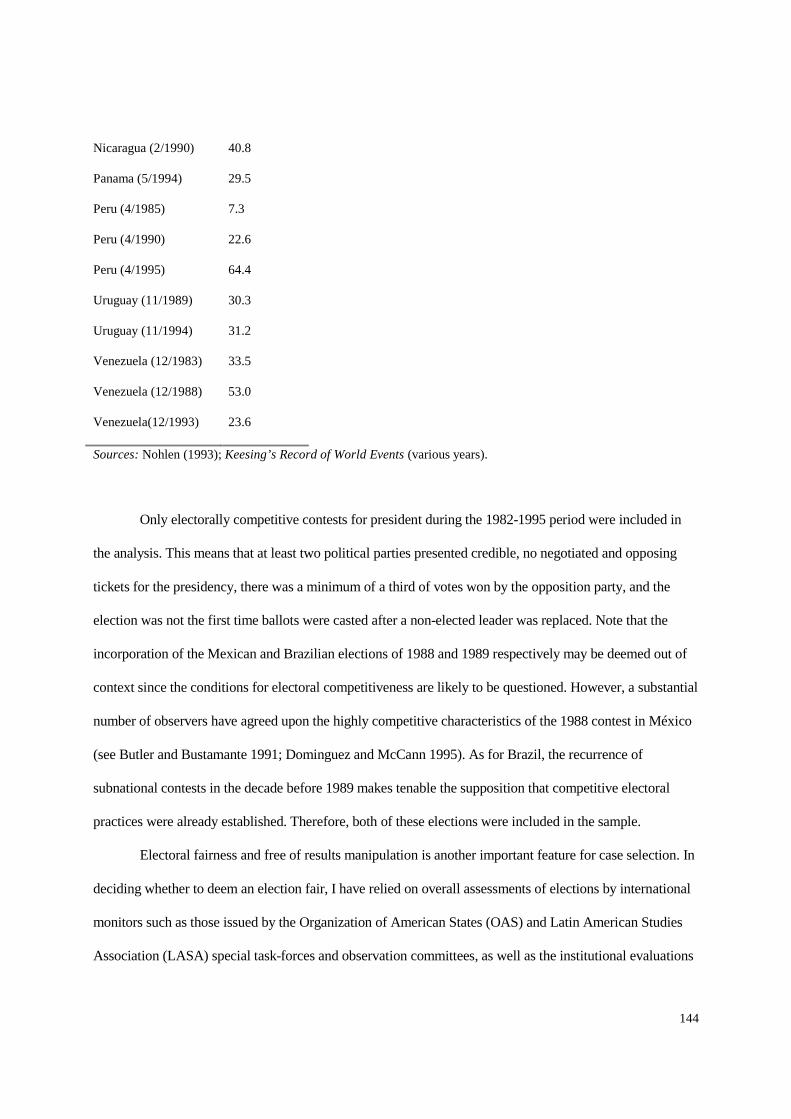
144
Nicaragua (2/1990) 40.8
Panama (5/1994) 29.5
Peru (4/1985) 7.3
Peru (4/1990) 22.6
Peru (4/1995) 64.4
Uruguay (11/1989) 30.3
Uruguay (11/1994) 31.2
Venezuela (12/1983) 33.5
Venezuela (12/1988) 53.0
Venezuela(12/1993) 23.6
Sources: Nohlen (1993); Keesing’s Record of World Events (various years).
Only electorally competitive contests for president during the 1982-1995 period were included in
the analysis. This means that at least two political parties presented credible, no negotiated and opposing
tickets for the presidency, there was a minimum of a third of votes won by the opposition party, and the
election was not the first time ballots were casted after a non-elected leader was replaced. Note that the
incorporation of the Mexican and Brazilian elections of 1988 and 1989 respectively may be deemed out of
context since the conditions for electoral competitiveness are likely to be questioned. However, a substantial
number of observers have agreed upon the highly competitive characteristics of the 1988 contest in México
(see Butler and Bustamante 1991; Dominguez and McCann 1995). As for Brazil, the recurrence of
subnational contests in the decade before 1989 makes tenable the supposition that competitive electoral
practices were already established. Therefore, both of these elections were included in the sample.
Electoral fairness and free of results manipulation is another important feature for case selection. In
deciding whether to deem an election fair, I have relied on overall assessments of elections by international
monitors such as those issued by the Organization of American States (OAS) and Latin American Studies
Association (LASA) special task-forces and observation committees, as well as the institutional evaluations
145
by the region’s most authoritative agency, Comisión de Asesoramiento y Promoción Electoral de
Latinoamérica (CAPEL) (see LASA 1990, 1995; Nohlen 1993). Of course, one
cannot be fully certain of the absolute fairness of the electoral processes and their results, since a) there has
not been international monitoring for every single contest in which malpractices have been alleged; b)
whenever monitoring was made possible, it has been limited to urban areas; c) monitoring could provide
only an inconsequential assessment on the skewed possession of resources (e.g., money, access to the
media, campaign workers) among the contenders, a factor that has also affected electoral results without
resorting to overt manipulation of the vote-count; and d) monitoring could also offer an overall description
of the political climate surrounding elections and how much confidence in elections this may have instilled
in voters, a fact that could only influence the final outcomes without resorting to fraudulent arrangements.
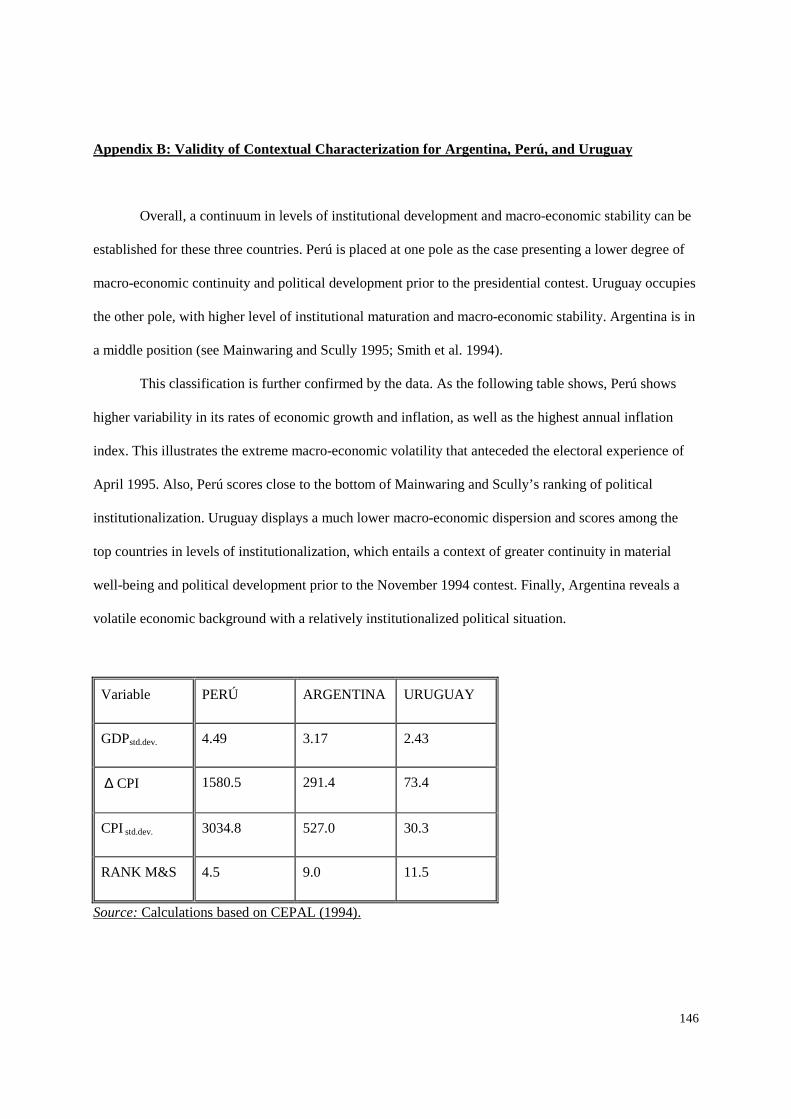
146
Appendix B: Validity of Contextual Characterization for Argentina, Perú, and Uruguay
Overall, a continuum in levels of institutional development and macro-economic stability can be
established for these three countries. Perú is placed at one pole as the case presenting a lower degree of
macro-economic continuity and political development prior to the presidential contest. Uruguay occupies
the other pole, with higher level of institutional maturation and macro-economic stability. Argentina is in
a middle position (see Mainwaring and Scully 1995; Smith et al. 1994).
This classification is further confirmed by the data. As the following table shows, Perú shows
higher variability in its rates of economic growth and inflation, as well as the highest annual inflation
index. This illustrates the extreme macro-economic volatility that anteceded the electoral experience of
April 1995. Also, Perú scores close to the bottom of Mainwaring and Scully’s ranking of political
institutionalization. Uruguay displays a much lower macro-economic dispersion and scores among the
top countries in levels of institutionalization, which entails a context of greater continuity in material
well-being and political development prior to the November 1994 contest. Finally, Argentina reveals a
volatile economic background with a relatively institutionalized political situation.
Variable PERÚ ARGENTINA URUGUAY
GDPstd.dev. 4.49 3.17 2.43
∆ CPI 1580.5 291.4 73.4
CPI std.dev. 3034.8 527.0 30.3
RANK M&S 4.5 9.0 11.5
Source: Calculations based on CEPAL (1994).
147
Codes:
GDP std.dev.: represents the standard deviation of the annual rate of change in the gross domestic product
(at prices of 1980) between 1990 and 1994.
∆ CPI: represents the arithmetic mean in the annual rate of change in the consumer prices index between
1990 and 1994.
CPI std.dev.: represents the standard deviation of the annual rate of change in the consumer prices index
between 1990 and 1994.
RANK M&S: represents the country’s ranking in the classification of levels of partisan
institutionalization elaborated by Mainwaring and Scully (1995: 17), where the top possible value is 12,
indicating “high” institutionalization, and the bottom is 4, indicating “low” institutionalization.
148
Appendix C: Caveats about the Research Design.
Although this research design resembles a pooled cross-sectional time-series format, its numerous
peculiarities still make it amenable to OLS estimation. The caveat is far from minor if one recalls all the
implications a pooled cross-sectional time-series format would involve in terms of statistical techniques to
be used and problems to be corrected (see Stimson 1985). The basic admonition is that OLS can neither take
account of the country variation affecting the dependent variable (with the resulting problems of
heteroscedasticity) nor control for the eventual serial correlation of errors over time. However, two
characteristics of the sample in use and the way explanations of electoral choice are finally modelled make a
case for a consideration of this design as a quasi-pooled cross-sectional time-series and for a legitimate use
of OLS.
One, since the maximum number of electoral events per country is four, the study just barely
accommodates the standards of a pooled time-series design; moreover, the variation in the sample between
countries for which the event at stake is measured only once (e.g., Chile, Guatemala, Nicaragua, Panamá)
and those for which is measured four times (e.g., Colombia, Costa Rica, Dominican Republic) further
assures that problems related to time-series designs would barely show up. Actually, checking for the
possibility of time-driven autocorrelation problems by regressing the residuals of the trimmed model on
their lagged values rendered an R-squared value of .018 (significant only at p=.40), that is, barely
representing any serious trouble for the subsequent analysis. In addition, analyses correlating the residuals
of the full and initial trimmed models against time show no significant relationship. Ultimately, problems of
autocorrelation are controlled by the inclusion of a lagged version of the dependent variable incidentally
modelling the argument of affirmative voting.
A second characteristic of this pooled sample has to do with differences in the sequence, timing,
and nature of the observed elections in each country. Whereas the mode is one election every four years,
many observations for specific countries are spaced every five or six years, involving a different effect in

149
terms of unmeasured variables such as, for example, general publics’ feelings that “it’s-time-for-a-change”.
Besides, some of these contests could be located on an equal footing with those experienced by the
advanced democracies of Western Europe and North America, in the sense of being mass-level routines
within a highly regularized democratic system (e.g., Costa Rica, Uruguay, Venezuela in 1983 and 1988),
while other elections are placed under ill-defined circumstances from the perspective of consolidated
democracy, which, in turn, brings distinctive factors into play as determinants of electoral outcomes. These
unmeasured effects are likely to pre-announce some misspecification of the model; yet, in this particular
context, they also may represent an asset in holding in check any major problem of heteroscedasticity by
assuring a pretty much randomized distribution of values.
In practice, I verify the absence of serious problems of unequal variance distribution and correlated
errors with predictors through visual inspection of plots of residuals and their standard errors with the actual
and predicted variables, as well as with specially created variables assessing population and income level
distributions of the countries. Both full and initial trimmed versions of the models show no significant
correlation at all.2
The trimmed version of the models seeks to provide a parsimonious and realistic specification of
the factors determining electoral choice at an aggregate level. This clarification is relevant since another
standard critique to OLS estimation in pooled cross-sectional designs is that it does not take into account the
pooled structure of the data (see Stimson 1985). This argument makes sense in any muti-national research
enterprise in light of the enormous heterogeneity underlying the variability of electoral choice. Naturally,
this heterogeneity results from the very fact of dealing with countries which, in spite of regional, cultural or
institutional commonalities, still possess their own idiosyncrasies that may
ultimately affect the outcomes. A common solution has been to use dummy variables representing each
2 The only exception occurred with political climate change, which presented a somewhat triangular distribution of values around the residuals, thus raising suspicions about its inclusion as an irrelevant variable. Yet, after performing three different standard tests, no evidence of significant heteroscedasticity was found. The Glejser test rendered an R-square of .042 (significant at p=.196) with no evidence of non-linear relationship according to further plot inspection,

150
country in the sample (except one used as reference-category) to control for the cross-sectional unit effects,
that is, to apply least squares with dummy variables (LSDV) estimation. However, three reasons may make
this an inappropriate strategy: 1) some of the observations refer to single events that occurred at the country
level (such as in the cases of Chile, Guatemala, Nicaragua and Panamá, each one with a single election
fulfilling the conceptual frame proposed, thus making redundant any dummy variable approach); 2) given
the general characteristics of the sample, applying LSDV can only exhaust rapidly the degrees of freedom
and compromise most inferences; and 3) LSDV may underestimate the global context of macro-economic
and macro-political change taken place throughout the 1980s and 1990s by fixing time-invariant variables
into the general model, one that, as measurement in levels and rates of change should suggest, attempts to
gauge the sensitivity of electorates to fluctuations among and within countries.3
All these considerations boil down to a single conclusion: any potential problem concerning the
pooled structure of the data not being accounted for should be handled more meaningfully and conveniently
by improving the specification of the general model rather than appealing to alternative LSDV. Specifying
the model better means including all factors considered directly relevant to a comprehensive explanation of
electoral choice, as well as including their interactions with the major features of the institutional and
macro-economic contexts. Taking all this into account, the OLS technique is found to meet appropriately
the goal of estimating the relative explanatory power of the
major arguments about electoral choice.
the Spearman Rank’s test presented a coefficient of .076 (significant at p=.634), and the Likelihood Ratio’s test yielded a value of 1.74 (significant at .50<p<.25). In consequence, this variable was kept for subsequent analyses. 3 The probity of this later criticism becomes obvious when comparing same country elections over time, as one can do, for example, for Perú in 1990 and 1995. A legitimate question in this regard would be: what does the electoral context of the first have to do with the one surrounding the second? The hyperinflation and depression conditions of the first were absent in the second, the institutional frameworks preceding each election were clearly different, the composition and direction of party strength were changed, the political climate conditioning each contest were far from equal, the salience of the incumbent candidate leadership could not be more distinct, and, as it is known, the fortunes of the incumbents differed absolutely. A dummy variable approach would ignore all these radical differences over the course of merely two presidential elections and lead one to believe that the country in both situations remained pretty much the same.

151
Appendix D: Testing Coding Reliability for Variables Explaining Electoral Outcomes at the
Aggregate Level (N=41)
To test coding reliability, all non-economic variables are recoded into five categories. Means and
standard deviations for each type are presented. Major economic variables, except for the differenced rate of
inflation, are kept with their original values.
VARIABLES Unstandardized
Regression
Coefficient
Probability of
Statistical
Significance
Standardized
Regression
Coefficient
PRIOR VOTEi 3.59 .03 .25
PARTY STRENGTHii 3.46 .02 .27
∆ POLITICAL CLIMATE iii 2.16 .07 .87
GDP GROWTH -1.38 .26 -.12
CPI RATE -0.43 .73 -.04
∆ INFLATION iv -3.36 .02 -.27
CANDIDATE ADVANTAGE v 4.99 .00 .44
Adjusted R2 .67
Standard Error 8.73
i Prior Vote is recoded as (1) “weak prior vote” (20.9 percent or less), (2) “moderate” (between 21 and 33.9 percent), (3)
“high” (between 34 and 45.9 percent), (4) “very high” (between 46 and 55.9 percent), and (5) “prior landslide” (56
percent or more). Cut-off points tend to follow the variable’s natural breaks in its cumulative distribution. In both cases,
a positive sign should be read: as the background in prior votes obtained by the incumbent is larger, so is its current
vote-share. Mean value is 3.58 with a standard deviation of 1.05.
ii Party Strength is recoded as (1) “small partisanship” (15.9 percent or less), (2) “small-to-medium” (between 16 and
152
24.9 percent), (3) “medium-to-large” (between 25 and 32.9 percent), (4) “large” (between 33 and 45.9 percent), and (5)
“very large” (46 percent or more). Cut-off points tend to follow the variable’s natural breaks in its cumulative
distribution. In both cases, a positive sign should be read: as the amount of structural party-vote obtained by the
incumbent is larger, so is its current vote-share.
iii Political Climate Rate of Change is recoded as (1) “large progress” (a negative difference between 2 and 7 points), (2)
“small progress” (an amelioration of the amount of one point difference), (3) “no change” (no difference overtime), (4)
“small regression” (of the amount of one point difference in a worsening direction), and (5) “large regression” (a
positive difference of 2 point scores). Cut-off points tend to follow the variable’s natural breaks in its cumulative
distribution. In both cases, a negative sign should be read: as the incumbent’s performance on issues of political rights
and civil liberties shows an improvement overtime, the more votes is able to collect. Its mean value is 2.76, with a
standard deviation of 1.26.
iv Inflation Rate of Change is recoded into five categories, collapsing values 3 and 4, and 6 and 7. This yields a mean
value of 3.07 and a standard deviation of 1.21.
v Candidate Advantage is recoded as (1) “great disadvantage” (a negative difference favorable to the challenger of 20
percentage points or higher), (2) “some disadvantage” (between 5 and 19.9 percent below the opposition party’s
candidate edge), (3) “marginal disadvantage” (a difference between 0 and -4.9 percent), (4) “marginal advantage”
(between 0.1 and 4.9 percent in favor of the incumbent), and (5) “some advantage” (5 percent or more). Cut-off points
tend to follow the variable’s natural breaks in its cumulative distribution. In both cases, a positive sign should be read: as
the edge in candidate advantage favors the incumbent party, a higher share of the votes it is expected to collect. Mean
value is 2.73, with a standard deviation of 1.36.

153
Appendix E: Survey Question Wordings of Variables Used for the Individual-Level Analysis
Codes for countries are: AR=Argentina, PE=Perú, and UR=Uruguay
Voting Intention:
AR= “Para comenzar, y antes de continuar, podría decirme por qué partido o candidato votó Ud. para
Presidente el 14 de mayo?” (First of all, could you tell me which party or candidate did you vote for
president last May 14?)
PE= “Si quedaran en una segunda vuelta presidencial: Alberto Fujimori y Javier Pérez de Cuéllar, por
quién votaría Ud.? (If there were a run-off election for president and Alberto Fujimori and Javier Pérez
de Cuéllar were the candidates, whom would you vote for?)
UR= “Si mañana fueran las elecciones para elegir presidente, por qué lema o candidato votaría?” (If
presidential elections were held tomorrow, which party or candidate would you vote for?)
Evaluation of the Personal Retrospective Economic Situation:
AR= “Pasando a temas que tienen que ver con la economía: si comparamos su situación financiera actual
y la de su familia con la de hace un año, diría Ud. que la misma ha: mejorado, empeorado, o permanecido
igual?” (Talking about the economy: if you compared your and your family’s financial situation with that
of a year ago, would you say that it has improved, worsened, or remained the same?) [Categories for
“don’t know/no answer” were taken only if volunteered and, in the analysis, were collapsed with
category “same.”]
PE= “Cómo está su situación económica familiar en relación a hace un año: mejor, igual o peor?” (How
is your family’s economic situation compared to that one year ago: better, worse, or the same?)
[Categories for “don’t know/no answer” were taken only if volunteered and, in the analysis, were
collapsed with category “same.”]

154
UR= “Pensando en su situación económica personal, Ud. diría que en los últimos 6 meses ha cambiado
para: mucho mejor, algo mejor, algo peor, mucho peor o ha permanecido igual?” (Thinking of your
personal economic situation, would you say that in the last 6 months it has become: a lot better,
somewhat better, somewhat worse, a lot worse, or stayed the same?) [The first and last two categories
were collapsed as “better” and “worse,” respectively; the “don’t know/no answer” were taken only if
volunteered and, in the analysis, were collapsed with category “same.”]
Evaluation of the Personal Prospective Economic Situation:
AR= “Mirando hacia adelante, cree Ud. que dentro de un año su situación financiera y la de su familia va
a ser: mejor, igual, o peor?” (Looking ahead, do you think that in a year your own and family’s financial
situation will be better, worse, or will remain the same?) [Categories for “don’t know/no answer” were
taken only if volunteered and, in the analysis, were collapsed with category “same.”]
PE= “Cómo cree que estará su situación económica familiar dentro de un año: mejor, igual o peor?”
(How do you think your family financial situation is going to be a year from now: better, worse, or the
same?) [Categories for “don’t know/no answer” were taken only if volunteered and, in the analysis, were
collapsed with category “same.”]
UR= “Y cómo cree que será su situación económica personal en los próximos 6 meses, diría Ud. que
cambiará para: mucho mejor, algo mejor, algo peor, mucho peor o permanecerá igual?” (How do you
think your financial situation will be in the next 6 months: a lot better, somewhat better, somewhat
worse, a lot worse, or will remain the same?) [The first and last two categories were collapsed as “better”
and “worse,” respectively; the “don’t know/no answer” were taken only if volunteered and, in the
analysis, were collapsed with category “same.”]
Evaluation of the National Retrospective Economic Situation:
AR= “Comparando la situación económica del país hoy con la de un año atrás, diría Ud. que la misma ha:

155
mejorado, empeorado, o permanecido igual?” (Compared to a year ago, would you say the country’s
economic situation has: improved, worsened, or remained the same?) [Categories for “don’t know/no
answer” were taken only if volunteered and, in the analysis, were collapsed with category “same.”]
PE= “Cómo está la situación económica del país en relación a hace un año: mejor, igual o peor?”
(Compared to a year ago, would you say the country’s economic situation has: improved, worsened, or
remained the same?) [Categories for “don’t know/no answer” were taken only if volunteered and, in the
analysis, were collapsed with category “same.”]
UR= “Y pensando en la situación económica del país, Ud. diría que en los últimos 6 meses ha cambiado
para: mucho mejor, algo mejor, algo peor, mucho peor o ha permanecido igual?” (Thinking of the
country’s economic situation, would you say that in the last 6 months it has become: a lot better,
somewhat better, somewhat worse, a lot worse, or remained the same?) [The first and last two categories
were collapsed as “better” and “worse,” respectively; the “don’t know/no answer” were taken only if
volunteered and, in the analysis, were collapsed with category “same.”]
Evaluation of the National Prospective Economic Situation:
AR= “Pensando en la situación económica del país dentro de un año, diría Ud. que la misma va
a: mejorar, permanecer igual, o empeorar?” (A year from now, do you think the economic situation of the
country is going to be: better, worse, or stay the same?) [Categories for “don’t know/no answer” were
taken only if volunteered and, in the analysis, were collapsed with category “same.”]
PE= “Cómo cree que estará la situación económica del país dentro de un año: mejor, igual o peor?” (How
do you think the country’s economic situation will be in a year: better, worse, or the same?) [Categories
for “don’t know/no answer” were taken only if volunteered and, in the analysis, were
collapsed with category “same.”]
UR= “Y cómo cree que será la situación económica del país en los próximos 6 meses, diría Ud. que
cambiará para: mucho mejor, algo mejor, algo peor, mucho peor o permanecerá igual?” (How do you

156
think the country’s economic situation is going to be in the next 6 months: a lot better, somewhat better,
somewhat worse, a lot worse, or will remain the same?) [The first and last two categories were collapsed
as “better” and “worse,” respectively; the “don’t know/ no answer” were taken only if volunteered and, in
the analysis, were collapsed with category “same.”]
Government-Attributed Economic Responsibility (it applies to both personal and national, retrospective
and prospective assessments):
AR= “En cuanto a su respuesta anterior, diría Ud. que la política económica del gobierno tuvo (tendrá):
mucho que ver, bastante que ver, poco que ver, o nada que ver?” (In relation to your previous answer,
would you say that the economic policy of the government had [will have]: a lot, quite, little, or nothing
to do with it?) [The first two categories were collapsed, resulting in two categories: “high responsibility”
and “low responsibility”; categories “don’t know/no answer” and answers for those who didn’t reply to
the original questions on economic situation [that is, “does not apply”] were considered only if
volunteered and collapsed as “low responsibility.”]
PE= “Al referirse a su [la] situación económica familiar [del país] con relación a hace un año atrás
[dentro de un año] Ud. dijo que [LEER RESP.]; Ud. diría que la política económica del gobierno ha sido
[va a ser] muy importante, algo importante, poco importante o nada importante para que ello sea así?” (In
reference to your [the] personal [country’s] economic situation compared to a year ago [a year from
now], you said that it has [will be] [read answer]; would you say that the economic policy of the
government has been [will be] very, somewhat, little, or not important at all for that to happen?) [The
first two categories were collapsed, resulting in two categories: “high responsibility” and “low
responsibility”; categories “don’t know/no answer” and answers for those who didn’t reply to the original
questions on economic situation [that is, “does not apply”] were considered only if volunteered and
collapsed as “low responsibility.”]
UR= “Cuán importante cree Ud. que ha sido [será] la política económica del gobierno respecto a su [la]
157
situación económica personal [del país] en relación a los últimos 6 meses [en los próximos 6 meses]:
muy importante, algo importante, poco importante, o nada importante?” (How important do you think the
government’s economic policy has been [will be] in regards to your [the] personal [country’s] economic
situation in the last [next] 6 months: very, somewhat, a little, or not important at all?) [The first two
categories were collapsed, resulting in two categories: “high responsibility” and “low responsibility”;
categories “don’t know/no answer” and answers for those who didn’t reply to the original questions on
economic situation [that is, “does not apply”] were considered only if volunteered and collapsed as “low
responsibility.”]
Presidential Popularity:
AR= “Y cómo evalúa Ud. la forma en que Menem estuvo manjeando su tarea general como
Presidente? aprueba fuertemente; aprueba, pero con reservas; más bien desaprueba; desaprueba
fuertemente?” (How do you approve the way [Carlos] Menem is handling his job as president: strongly
approve, approve with reserve, rather disapprove than approve, strongly disapprove?)
PE= “En general, diría Ud. que aprueba o desaprueba la gestión de ... El presidente Alberto Fujimori?”
(Overall, would you say you approve or disapprove the performance of ... president Fujimori?)
UR= “Qué opinión tiene Ud. de la gestión de Luis Lacalle, diría Ud. que aprueba totalmente la misma,
aprueba parcialmente, ni aprueba ni desaprueba, desaprueba parcialmente, o desaprueba totalmente?”
(What is your opinion of [president] Lacalle’s performance, would you say you strongly approve,
approve somewhat, neither approve nor disapprove, disapprove somewhat, or strongly disapprove?)
Partisan Leanings:
AR= “Por tradición política, se considera Ud. a sí mismo como: Peronista, Radical, Socialista,
Liberal, Conservador, Nacionalista, Otro, Independiente/Ninguno, No sabe/no contesta?” (By political
tradition, do you think of yourself as: Peronist, Radical, Socialist, Liberal, Conservador, Nacionalist,

158
Other, Independent/None, don’t know/no answer?) [Category “Peronista” represented leanings for the
incumbent party; all other categories were collapsed representing leaning for the opposition.]
PE= “Cómo votó Ud. en el referéndum constitucional de 1993: por sí, por no, no recuerda, no votó?”
(How did you vote in the constitutional referendum of 1993: yes, no, don’t recall, didn’t vote?) [Category
“Yes” represented leanings for the incumbent party; all other categories were collapsed representing
leaning for the opposition.]
UR= “Por qué partido o lema votó Ud. en las elecciones presidenciales de 1989?” (What party or lema
did you vote for in the presidential elections of 1989?) [References to subgroups, candidates, or the
Blanco party represented leanings for the incumbent party; other categories were collapsed representing
leaning for the opposition.]

159
Appendix F: Attribution of Government Responsibility for Economic Conditions in Latin
America: Data, Question Wordings, and Sources
Data correspond to the following eleven observations: Argentina, 1988 and 1995; Brazil, 1988,
Chile, 1988; Costa Rica, 1981, México, 1994; Perú, 1985 and 1995; Uruguay, 1988 and 1994; and
Venezuela, 1988.
The 1988 data comes from the multi-country survey coordinated by Consorcio Polis in mid-
1988. In that survey, pollsters asked respondents to assign responsibilities for the country’s situation to
the government, the opposition, and fellow citizens in a 3-point scale (“a lot,” “little,” “none”). Fifty-
three percent of Argentineans and Chileans, sixty percent of Uruguayans, and seventy-three percent of
Brazilians picked the government. The ratio of blame government to opposition (and to citizens) was 1.8
(1.2) among Argentines, 2.1 (3.5) among Brazilians, 3.3 (2.7) among Uruguayans, and 4.5 (3.6) among
Chileans.
The 1988 Venezuelan data asked individuals to assign responsibility for the current situation to
several alternatives: the Venezuelan people (9 percent), politicians (8 percent), AD partisans (5 percent),
Copey partisans (3 percent), and the economy (3.5 percent). Source: Datanalysis (May–June 1988).
The 1994–95 studies of Uruguay and Argentina are partially comparable to the 1988 study, since
the former are based upon metropolitan samples (although comprising over 40 percent of the national
electorates). In each sample, after questions about the perceptions of economic conditions were
introduced, individuals were asked to rate the responsibility of government for that matter in a 4 point
scale (“a lot,” “some,” “little,” “none”). Fifty-eight percent of Argentineans and Seventy-nine percent of
Uruguayans were concentrated in the first two categories. For a more detailed account of these findings,
see Chapter 7. Sources: Marketing Investigadores & Asocs. of Uruguay (September 1994) and CEDOP-
UBA of Argentina (May 1995).
In Perú, a 1985 pre-electoral study asked (results in parenthesis): “Do you think the economic
160
crisis has been direct responsibility of the government? Yes (48 percent), Only partially (37 percent), No
(13 percent).” Source: Debate vol. 7, 32 (May 1985: 24). For the 1995 study, 77 percent held the
government responsible for the economic situation. See Chapter 7. Source: Apoyo of Perú (March 1995).
For the case of Costa Rica, the question and results read: “Which is the principal reason for the
current economic situation of the country? the Executive power (57 percent), the oil prices (22 percent),
the Legislative power (18 percent), the Central Bank (1 percent).” Source: CID-Gallup of Costa Rica
(November 1981).
In México of 1994, the question read (results in parenthesis): “Who do you think it is to blame
for the current national situation of the economy? all Mexicans (20 percent), the economic policies of the
government (56 percent), Both (15 percent).” Source: Asesoría Técnica de la Presidencia de México
(August-September 1994).

161
Appendix G: Sources and References for Public Opinion Indicators of Partisanship, Confidence in
Political Parties, and Presidential Popularity
Country (Election
Month/Year)
Partisanship Confidence in
Parties
Presidential
Popularity
Sources
Incumbent
Party
Opposition
Party
Sources Sources
Argentina (5/1989) Catterberg-Braun,1989 UCR PJ Catterberg, 1991 Catterberg, 1991
Argentina (5/1995) Mansilla,Delich&Asocs. PJ Frepaso LatinoBarómetr.I Romer&Asocs.
Bolivia (7/1985) UDP MNR
Bolivia (5/1989) MNR ADN ILDIS
Bolivia (6/1993) Encuestas&Estudios MIR-ADN MNR B.Iberoameric.II Encuestas&Estudio
s
Brazil (11/1989) CEDEC/Datafolha PMDB-PFL PT Consorcio Polis Ibope
Brazil (10/1994) Datafolha PSDB-PFL PT CBPA Datafolha
Chile (12/1993) CEP-Adimark Convergenci
a
UDI-PRN LatinoBarómetr.I CEP-Adimark
Colombia (5/1982) CNC PL PC CNC CNC
Colombia (5/1986) CNC PC PL CNC
Colombia (5/1990) CNC PL PC CNC Bendixen-Law
Colombia (5/1994) CNC PL PC B.Iberoameric.III CNC
Costa Rica (2/1982) CID/Gallup PUSC PLN CID/Gallup
Costa Rica (2/1986) CID/Gallup PLN PUSC USIA CID/Gallup
Costa Rica (2/1990) CID/Gallup PLN PUSC USIA CID/Gallup
Costa Rica (2/1994) CID/Gallup PUSC PLN B.Iberoameric.III CID/Gallup
Domin.Rep.(5/1982) PRD PR
Domin.Rep.(5/1986) PRD PR

162
Domin.Rep.(5/1990) PR PLD
Domin.Rep.(5/1994) Roper/Rumbo PRSC PRD B.Iberoameric.II Hamilton&Asocs.
Ecuador (6/1984) CEDATOS CFP-DP PUSC CEDATOS
Ecuador (1/1988) CEDATOS PUSC ID CEDATOS
Ecuador (5/1992) CEDATOS ID PUR CEDATOS CEDATOS
El Salvador(3/1989) CID/Gallup PDC ARENA USIA CID/Gallup
El Salvador(3/1994) CID/Gallup ARENA FMLN B.Iberoameric.III CID/Gallup
Guatemala 11/1990) CID/Gallup PDCG MAS Aragon&Asocs. CID/Gallup
Honduras (11/1985) CID/Gallup PLH PNH USIA Belden&Russonello
Honduras (11/1989) CID/Gallup PNH PLH USIA CID/Gallup
Honduras (11/1993) CID/Gallup PLH PNH USIA CID/Gallup
Mexico (7/1988) IMOP/Gallup PRI PRD IMOP/Gallup
Mexico (8/1994) Asesoria Tecnica PRI PAN B.Iberoameric.III Asesoria Tecnica
Nicaragua (2/1990) CID/Gallup FSLN UNO Socmerc CID/Gallup
Panama (5/1994) CID/Gallup Arnulfista PRD CID/Gallup CID/Gallup
Peru (4/1985) Debate (1985,31) AP APRA Bendixen-Law
Peru (4/1990) Apoyo APRA FREDEMO Apoyo Apoyo
Peru (4/1995) Apoyo Cambio90 UPP Apoyo Apoyo
Uruguay (11/1989) Equipos Consultores Colorados Blancos Consorcio Polis Equipos
Consultores
Uruguay (11/1994) Equipos Consultores Blancos Colorados Equipos Consult Equipos
Consultores
Venezuela(12/1983) Batoba Survey COPEY AD Batoba Survey Batoba Survey
Venezuela(12/1988) Datanalysis AD COPEY Carrasquero, 1995
Venezuela(12/1993) Doxa AD Convergencia B.Iberoameric.
III
Carrasquero, 1995

163
Appendix H: Aggregate Measures of Candidate Saliency
COUNTRY (Election
Month/Year)
INCUMBENT CANDIDATE
SALIENCY
OPPOSITION CANDIDATE
SALIENCY
Party
Age
Contes
ted?
Presti
ge
Final
Score
Party
Age
Conte
sted?
Presti
ge
Final
Score
Argentina (5/1989) 0 1 0 1 0 .5 0 .5
Argentina (5/1995) 0 1 1 2 1 .5 0 1.5
Bolivia (7/1985) 0 .5 0 .5 0 1 1 2
Bolivia (5/1989) 0 1 .5 1.5 0 1 .5 1.5
Bolivia (6/1993) 0 1 .5 1.5 0 1 .5 1.5
Brazil (11/1989) 0 .5 .5 1 .5 1 0 1.5
Brazil (10/1994) .5 1 .5 2 .5 1 0 1.5
Chile (12/1993) 0 .5 .5 1 0 0 .5 .5
Colombia (5/1982) 0 .5 1 1.5 0 1 0 1
Colombia (5/1986) 0 1 0 1 0 1 0 1
Colombia (5/1990) 0 .5 0 .5 0 .5 0 .5
Colombia (5/1994) 0 1 0 1 0 .5 .5 1
Costa Rica (2/1982) 0 1 .5 1.5 0 1 0 1
Costa Rica (2/1986) 0 .5 0 .5 0 .5 .5 1
Costa Rica (2/1990) 0 1 0 1 0 1 .5 1.5
Costa Rica (2/1994) 0 1 0 1 0 .5 .5 1
Domin.Rep.(5/1982) 0 .5 0 .5 0 1 1 2
Domin.Rep.(5/1986) 0 .5 0 .5 0 1 1 2
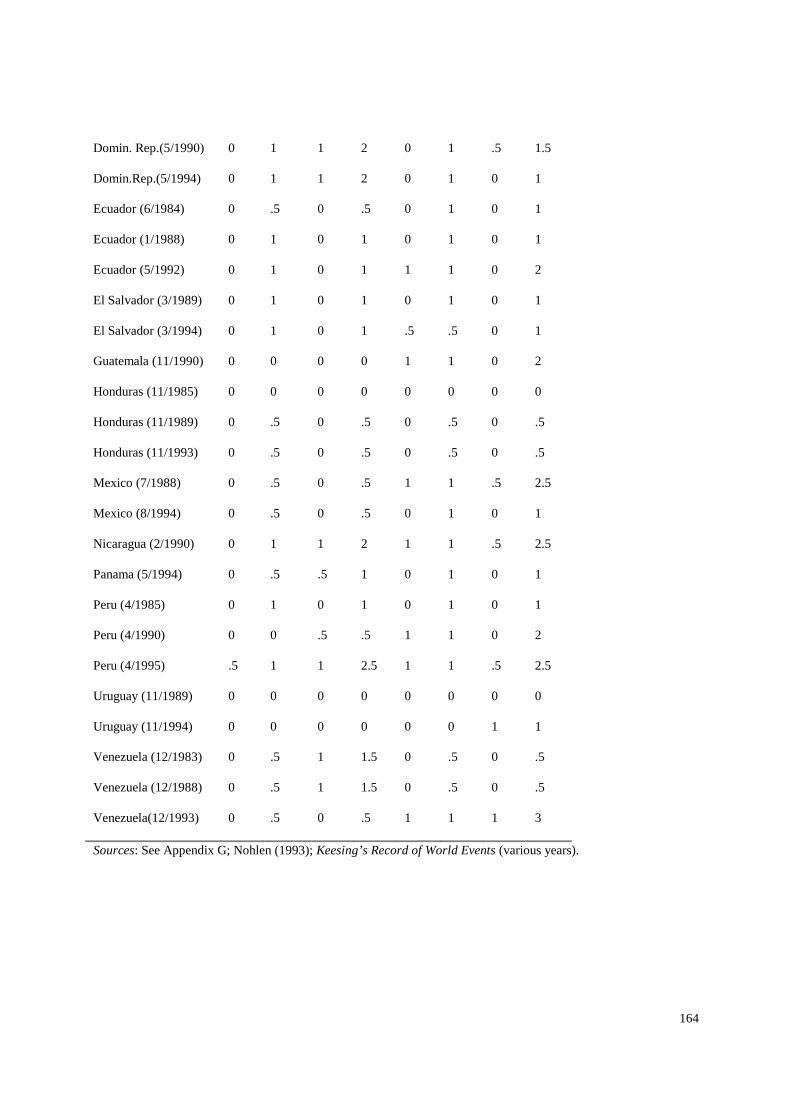
164
Domin. Rep.(5/1990) 0 1 1 2 0 1 .5 1.5
Domin.Rep.(5/1994) 0 1 1 2 0 1 0 1
Ecuador (6/1984) 0 .5 0 .5 0 1 0 1
Ecuador (1/1988) 0 1 0 1 0 1 0 1
Ecuador (5/1992) 0 1 0 1 1 1 0 2
El Salvador (3/1989) 0 1 0 1 0 1 0 1
El Salvador (3/1994) 0 1 0 1 .5 .5 0 1
Guatemala (11/1990) 0 0 0 0 1 1 0 2
Honduras (11/1985) 0 0 0 0 0 0 0 0
Honduras (11/1989) 0 .5 0 .5 0 .5 0 .5
Honduras (11/1993) 0 .5 0 .5 0 .5 0 .5
Mexico (7/1988) 0 .5 0 .5 1 1 .5 2.5
Mexico (8/1994) 0 .5 0 .5 0 1 0 1
Nicaragua (2/1990) 0 1 1 2 1 1 .5 2.5
Panama (5/1994) 0 .5 .5 1 0 1 0 1
Peru (4/1985) 0 1 0 1 0 1 0 1
Peru (4/1990) 0 0 .5 .5 1 1 0 2
Peru (4/1995) .5 1 1 2.5 1 1 .5 2.5
Uruguay (11/1989) 0 0 0 0 0 0 0 0
Uruguay (11/1994) 0 0 0 0 0 0 1 1
Venezuela (12/1983) 0 .5 1 1.5 0 .5 0 .5
Venezuela (12/1988) 0 .5 1 1.5 0 .5 0 .5
Venezuela(12/1993) 0 .5 0 .5 1 1 1 3
Sources: See Appendix G; Nohlen (1993); Keesing’s Record of World Events (various years).