DYNAMIC AND STATIC STRENGTHS OF WHOLE BODY ...
444
n u n mi i ii iiiiiiiiiiiiiii i i i 2807400639 DYNAMIC AND STATIC STRENGTHS OF WHOLE BODY EXERTIONS m tV'V'c. vaumah by David Mark Fothergill B.Sc. (Hons), Liverpool Polytechnic, 1985 M.Sc. (Kines), Simon Fraser University, 1988 A THESIS SUBMITTED IN PARTIAL FULFILMENT OF THE REQUIREMENTS FOR THE DEGREE OF DOCTOR OF PHILOSOPHY IN THE UNIVERSITY OF LONDON Human Performance Laboratory Department of Anatomy Royal Free Hospital School of Medicine London, NW3 December 1991 The copyright of this thesis rests with the author and no quotation from it or information derived from it may be published without the prior written consent of the author. I
-
Upload
khangminh22 -
Category
Documents
-
view
2 -
download
0
Transcript of DYNAMIC AND STATIC STRENGTHS OF WHOLE BODY ...

n u n m i i i i i i i i i i i i i i i i i i i i i i2807400639
DYNAMIC AND STATIC STRENGTHS OF
WHOLE BODY EXERTIONSm tV'V'c. v a u m a h
by
David Mark Fothergill
B.Sc. (Hons), Liverpool Polytechnic, 1985
M.Sc. (Kines), Simon Fraser University, 1988
A THESIS SUBMITTED IN PARTIAL FULFILMENT OF THE
REQUIREMENTS FOR THE DEGREE OF DOCTOR OF PHILOSOPHY IN
THE UNIVERSITY OF LONDON
Human Performance Laboratory
Department of Anatomy
Royal Free Hospital School of Medicine
London, NW3
December 1991
The copyright of this thesis rests with the author and no quotation from it or
information derived from it may be published without the prior written consent of
the author.
I

ProQuest Number: 10797893
All rights reserved
INFORMATION TO ALL USERS The quality of this reproduction is dependent upon the quality of the copy submitted.
In the unlikely event that the author did not send a com p le te manuscript and there are missing pages, these will be noted. Also, if material had to be removed,
a note will indicate the deletion.
uestProQuest 10797893
Published by ProQuest LLC(2018). Copyright of the Dissertation is held by the Author.
All rights reserved.This work is protected against unauthorized copying under Title 17, United States C ode
Microform Edition © ProQuest LLC.
ProQuest LLC.789 East Eisenhower Parkway
P.O. Box 1346 Ann Arbor, Ml 48106- 1346

II
ABSTRACT
The characteristics of whole body manual exertions were investigated in
both males and females under a wide range of conditions of posture, hand height,
direction of exertion and task resistance. Many of these conditions were novel.
The many factors which influence force exertion were reviewed and a
computerized bibliography on human strength was prepared. Two experimental
studies investigated the influence and interrelationships of hand/handle interface,
gravitational and musculo-skeletal limitations on the ability to produce maximal
static forces. A third study introduced novel strength testing equipment, protocol,
data processing and display techniques in order to extend the measurement and
analysis into three dimensions. A final study compared static lifting strength with
maximal one and two-handed dynamic lifting performance against a range of
resistances on an isoresistive hydrodynamometer.
A good association was found between dynamic and static measures of
whole body strength. However, different relationships between the two were
observed in one and two-handed, and in male and female exertions. It was further
concluded that dynamic and static measures of whole body strength cannot reliably
be predicted on the basis of body weight and stature alone when the exerted force
is directed along the line joining the foot and hand centroids. In other directions of
exertion, where gravitational limitations play a more dominant role in the strength
of exertion, reasonable predictions of whole body static strength may be obtained
using a simple linear regression model with body weight and stature as
independent variables.
Extension of the Postural Stability Diagram into three dimensions and
dynamic models of lifting strength based on the results are discussed as possible
aids for task analysis in manual materials handling.
Ill
ACKNOWLEDGMENTS
I would like to thank the following people for their contributions and
invaluable assistance during the composition of this thesis:-
Professor D.W. Grieve for guidance and advice throughout the course of
this thesis;
Mr. A. Pinder for his technical expertise and valuable assistance in
designing the hardware and software for the 3D dynamometer;
Members of the Royal Free Technical Workshop, particularly Mr. A.
Snook and Mr. P. Oliver, for their superb craftsmanship in the construction of the
3D dynamometer;
Dr. S.T. Pheasant for his comments and suggestions on the first two
experimental studies;
Mr. M. Gysbers, who produced the photographs illustrating this thesis;
Ms. A. Chaplin for editing the annotated bibliography;
and all my subjects for their maximal voluntary exertions.
I also wish to thank my wife Janice, whose role as informal chief editor
and supporter was vital in ensuring the successful completion of this thesis. This
work was also carried out with the support of the U.K. Ministry of Defence under
an extramural research agreement with the Army Personnel Research
Establishment.
IV

TABLE OF CONTENTS
ABSTRACT ..............................................................................................................HI
ACKNOWLEDGMENTS ........................................................................................IV
LIST OF TABLES ............................................................................................. XII
LIST OF FIGURES............................................................................................. XVIII
CHAPTER 1
INTRODUCTION................................................................................................ 1
General Aims of the S tu d y....................................................................... 4
Definition of Human Strength.................................................................. 5
Conventions and Definition of Terms .................................................... 8
CHAPTER 2
A SUMMARY OF THE LITERATURE ON HUMAN STRENG TH 13
Introduction................................................................................................ 14
PART Is A COMPUTERIZED BIBLIOGRAPHY OF HUMANSTRENGTH .................................................................................. 15
Content and Source Material of the Bibliography...................... 16
Data Base Structure....................................................................... 20
Input of Data into the Data B a se ................................................. 21
A Customized Classification System for BibliographicMaterial on Human Strength............................................ 22
Summary Remarks on the Literature on Human Strength . . . . 25
PART H: LITERATURE REVIEW ....................................................... 29
Approaches to Biomechanical Modelling of Whole BodyStrength: Whole Body vs the Sum of the P arts............... 30
V

Prediction of Whole Body Strength from the Strength of Individual Joints: Michigan Type Biomechanical Models ......................................... 30
Biomechanical Models of Human Strength Based onWhole Body Static Strength D ata......................... 37
Summary Comments on Static Whole Body StrengthPrediction............................................................... 44
Body Weight as a Predictor of Whole Body StrengthCapability ......................................................................... 46
Static Analysis of Whole Body Exertion .................................... 54
Dynamic Measures of Whole body Strength.............................. 64
Methods and Techniques for Dynamic StrengthAssessm ent............................................................ 64
Isoresistive Measures of Whole Body Strength............... 69
Relationships Amongst Dynamic and Static Measures ofStrength ............................................................................ 72
The Subject-Environmental Interface and Manual Exertions . . . 76
Sex Differences in Strength......................................................... 81
Introduction to Experimental W ork......................................................... 88
H ypotheses.................................................................................... 88
CHAPTER 3
STUDY I
THE INFLUENCE OF SOME HANDLE DESIGNS AND HANDLE HEIGHT ON THE STRENGTH OF THE HORIZONTAL PULLING ACTION . . . 90
Introduction...................................................................................................91
Methods ........................................................................................................ 91
Subjects............................................................................................. 91
Apparatus...........................................................................................92
VI

Procedure 94
A nalysis..............................................................................................95
Results ........................................................................................................... 96
D iscussion.................................................................................................... 101
Conclusions ................................................................................................. 106
CHAPTER 4
STUDYH
HUMAN STRENGTH CAPABILITIES DURING ONE-HANDED MAXIMUM VOLUNTARY EXERTIONS IN THE FORE AND AFT PLANE....................107
Introduction................................................................................................. 108
Methods .......................................................................................................108
Subjects............................................................................................ 108
Apparatus......................................................................................... 109
Procedure......................................................................................... 109
A nalysis............................................................................................ 110
R esu lts..........................................................................................................I l l
Sex Differences in the Strength of One-Handed Exertions . . . I l l
The Maximum Advantage of Using a Component of Exertion(MACE) for One-Handed Exertions..................................... 116
One-Handed Versus Two-Handed Exertions.................................120
Relationships between Body Weight, Strength and theDirection and Height of Exertion ...................................... 122
D iscussion.................................................................................................... 125
Sex Differences in the Strength of One-Handed Exertions. . . . 125
Advantages of Using a Component of E xertion........................... 127
VII

One-handed Versus Two-handed Exertions....................................128
Relationships Between Body Weight, Strength and theDirection and Height of Exertion ...................................... 131
Summary and Conclusions ......................................................................... 134
CHAPTERS
STUDY m
WHOLE BODY STATIC STRENGTH MEASUREMENT IN THREE DIMENSIONS .......................................................................................................136
Introduction................................................................................................. 137
Hardware Development.............................................................................. 138
Dynamometer D esign...................................................................... 138
Force Measurement and Computer Interface.................................143
Dynamometer Calibration .............................................................. 144
The Redesigned Dynamometer...................................................... 151
Software Design and Development ........................................................... 158
Early Approaches to Data Collection and Presentation ofForces in Three D im ensions.............................................. 158
Software Redesign................ 159
On-line Data Presentation .................................................159
Off-line Data Presentation................................................... 162
Experimental W ork...................................................................................... 166
Objectives......................................................................................... 166
M ethods............................................................................................167
Subjects................................................................................. 167
Apparatus ............................................................................168
vm

Procedure ................................................................................168
Data A nalysis...................................................................... 171
Results...............................................................................................172
Three Dimensional Static Strength Measurements atthe 1.0 metre Handle Height .................................172
Static Strength in Three Dimensions at the 1.75 metreHandle H eig h t......................................................... 179
Subjective Responses, Fatigue and Grip Strength 183
Coefficient of Friction Requirements.................................188
Discussion......................................................................................... 191
Coefficient of Friction......................................................... 199
Future Development of the Hardware and Software . . 200
Future Research................................................................... 201
Summary and Conclusions.............................................................. 207
CHAPTER 6
STUDY IV
THE CHARACTERISTICS OF MAXIMAL DYNAMIC LIFTING EXERTIONS ON AN ISORESISTJVEHYDRODYNAMOMETER...................................................................... 209
Introduction.................................................................................................210
Methods ...................................................................................................... 211
Apparatus.........................................................................................211
Subjects............................................................................................214
Protocol............................................................................................216
Data Analysis................................................................................... 218
R esu lts......................................................................................................... 219
IX

1
Repeatability................................................................................... 219
Physical Characteristics of the Hydrodynamometer......................222
Detailed Analysis of Dynamic Lifting Exertions........................... 227
Postural Analysis of Dynamic L iftin g ........................................... 233
Group Data for Maximal One and Two-Handed Dynamic andStatic L ifts ........................................................................... 239
Dynamic L iftin g.............................................................................. 239
Power of Dynamic L ifting.............................................................. 250
A Comparison of Dynamic and Static Lifting Strength................ 253
Generality versus Specificity between Dynamic and StaticMeasures of Lifting Strength..............................................255
D iscussion....................................................................................................261
Physical Characteristics of the Hydrodynamometer......................261
The Kinematics and Impedance of Dynamic Lifting ................... 263
Force, Velocity and Power Characteristics of Whole BodyLifting Exertions .................................................................266
Generality Versus Specificity of Whole Body Lifting StrengthAgainst Different Task Resistances................................... 273
Future Studies .................................................................................277
Conclusions .................................................................................................280
X

CHAPTER 7
GENERAL SUMMARY AND CONCLUSIONS..............................................283
REFERENCES...................................................................................................... 288
APPENDIX A: SUBJECT INFORMATION PACKAGE ANDINFORMED CONSENT FORMS.............................................................. 300
Subject Information Package ................................................................... 301
Informed Consent ...................................................................................... 303
APPENDIX B: SUMMARY DATA FOR CHAPTER 4 ................................... 306
APPENDIX C: SUMMARY DATA FOR CHAPTER 5 ................................... 317
Mean Force and Friction Data over the Sphere of Exertion for One- handed Maximal Static Exertions at the 1.0 m (initial and repeat) and 1.75 m Handle Heights..................................................318
Two Dimensional Postural Stability Diagrams Encompassing theSphere of Exertion .........................................................................319
Mean Force and Friction Data over the Sphere of Exertion for One- handed Maximal Static Exertions at the 0.5 m, 1.0 m and 1 .5 m Handle Heights..................................................................... 360
APPENDIX D: SUMMARY DATA FOR CHAPTER 6 ................................... 377
APPENDIX E: RELATED PUBLICATIONS......................................................404
XI

LIST OF TABLES
Table 2.1: A search strategy used to interogate the MEDLINE data basefor literature on human strength............................................................... 17
Table 2.2: The data base structure of the DBASE IV file C:\dbase\mod\strength 21
Table 2.3: Zero Order Correlations of Body Weight and Height with VariousStrength Measures Reported in the Published literature ....................... 47
Table 2.4: Advantages and Disadvantages of various approaches to dynamicstrength assessment...................................................................................... 68
Table 2.5: Sex Differences in Strength Reported in the Literature ................. 84
Table 3.1: Physical Characteristics of Subject Population Values are mean plus or minus SD ..................................................................................................... 91
Table 3.2: Peak and steady maximal horizontal pulling strengths on 4different handle designs at 2 different heights from the ground (values are means + S D )...................................................................................................99
Table 3.3: Test-retest reliability of peak and steady maximal strength values forhorizontal pulling on a variety of handle types placed at two different levels from the floor.................................................................................................100
Table 3.4: Summary statistics for Tukeys HSD post-hoc analysis of steadymaximum pulling strength on 4 different handle types placed 1.0m and 1.75m from the floor .................................................................................100
Table 4.1: Physical Characteristics of Subjects (Values are means (±SD) . . . 108
Table 4.2: MACE values for Pulls (90°), Presses (180*), Pushes (270°) and Lifts (360*) and the angular deviations, D, of the force vectors from the vertical or horizontal which give a greater component than forces generated exactly in those directions. Positive and negative values refer to anticlockwise and clockwise deviations respectively. . . 119
Table 4.3: Analysis of variance summary statistics for the main effectshandle height, direction of exertion and type of regression model on the proportion of the total variance in strength accounted for solely by the variance in body weight or body weight and height combined........................................................................................................ 123
XII

Table 5.1: Summary of Multiple Regression Analysis for determination of the X, Y and Z force components following calibration of the redesigned left-handed dynamometer. (Units = ADVAL’ s/Newton) . . 155
Table 5.2: Anthropometric characteristics of the subjects.....................................167
Table 5.3: Mean forces over the sphere of exertion (n = 614 force vectors per subject), averaged over the 4 subjects, for static one-handed exertions with the handle set at 1.0 m and 1.75 m above the ground.............................................................................................................179
Table 5.4: Analysis of variance summary statistics for the fatigue ratings taken after each successive two minutes of data collection (variable C) during the four trials (variable B) at the 1.0 m and 1.75 m handle heights (variable A)............................................................................184
Table 5.5: Summary statistics following analysis of variance on the grip strength data measured before and after (variable C) each of the four trials (variable B) at the 1.0 m and 1.75 m handle heights (variable A).................................................................................................... 186
Table 5.6: Summary statistics following analysis of variance on the amount of time taken for rest pauses between successive two minutes of data collection (variable C) during experiments (variable B) at the 1.0 m and 1.75 m handle heights (variable A)....................................................... 187
Table 6.1: The physical characteristics of the subjects........................................ 215
Table 6.2: Test-retest reliability coefficients for subjects DF and CB for one and two-handed dynamic lifting exertions against the heavy, medium and light resistances........................................................................ 220
Table 6.3: Analysis of variance results on the position of maximum forcesduring dynamic lifts on the hydrodynamometer......................................248
Table 6.4: Analysis of variance summary statistics for normalised liftingforces on the hydrodynamometer ..............................................................249
Table 6.5: Analysis of variance summary statistics of normalised power fordynamic lifts on the hydrodynamometer................................................... 252
Table 6.6: Analysis of variance summary statistics for normalised isometriclifting strength ................................................................................... 258
Table 6.7: One/two-handed strength ratios for maximal static and dynamic lifting exertions. The ratios for the dynamic exertions were derived from the pooled results for exertions against the low, medium and heavy resistances............................................................................................258
XIII

Table 6.8: Correlations of static and dynamic lifting strength with bodyweight at different heights above the ground (n=18) ..............................259
Table 6.9: Partial correlation coefficients (with body weight held constant) between dynamic lifting strength against the three resistances and static lifting strength (n=18) for one and two-handed exertions 260
Table 6.10: Proportion of generality between dynamic and static measuresof one and two-handed lifting strength......................................................260
Table 6.11: Correlation coefficients and the generality component between performance on the hydrodynamometer and selected anthropometric variables and a number of dynamic and static tests of strength. Data from an unpublished study carried out by the Army Personnel Research Establishment..............................................................................276
Table B l: Group one-handed PSD data at the 1.0 m bar height................... 307
Table B2: Group one-handed PSD data at the 1.75 m bar height................ 307
Table B3: Male one-handed PSD data at the 1.0 ro bar height ................. 308
Table B4: Male one-handed PSD data at the 1.75 m bar height..................308
Table B5: Female one-handed PSD data at the 1.0 m bar h eigh t..................309
Table B6: Female one-handed PSD data at the 1.75 m bar h e ig h t 309
Table B7: Group one-handed PSD data at the 1.0 m bar height (usedfor comparison with two-handed exertions at the same bar height). . . 310
Table B8: Group two-handed PSD data at the 1.0 m . bar height....................310
Table B9: Group one-handed PSD data at the 1.75 m bar height (usedfor comparison with two handed exertions performed at the same bar height)......................................................................................................311
Table B10: Group two-handed PSD data at the 1.75 m . bar h eigh t 311
Table B ll: Static strength capabilities when the maximum advantage of using components of deviated forces are calculated for one-handed exertions at the 1.0 m bar height (Group data).....................................312
Table B12: Static strength capabilities when the maximum advantage of using components of deviated forces are calculated for one-handed exertions at the 1.75 m bar height (Group data)...................................312
XIV

Table B13: Mean static strength of male subjects when the maximumadvantage of using components of deviated forces are calculated for one-handed exertions at the 1.0 m ; bar height..................................... 313
Table B14: Mean static strength of male subjects when the maximumadvantage of using components of deviated forces are calculated for one-handed exertions at the 1.75 meter bar height.................................. 313
Table B15: Mean static strength of female subjects when the maximumadvantage of using components of deviated forces are calculated for one-handed exertions at the 1.0 m bar height......................................314
Table B16: Mean static strength of female subjects when the maximumadvantage of using components of deviated forces are calculated for one-handed exertions at the 1.75 m bar height.................................. 314
Table B17: Ratio files and MACE data for one and two-handed staticexertions performed at a bar height of 1.0 and 1.75 m eters...................315
Table Cl: Strength data for one-handed exertions at a hand height of 1.0 m. The values are the means and standard deviations over the entire sphere of exertion for the four males subjects following the fifth session............................................................................................................ 318
Table C2: Summary data for one-handed exertions (repeat trials) at a hand height of 1.0 m. The values are the means and standard deviations over the entire sphere of exertion for the four males subjects following the fourth session.......................................................................... 318
Table C3: Summary data for one-handed exertions at the 1.75m handheight. The values are the means and standard deviations over the entire sphere of exertion for the four males subjects following the fourth session................................................................................................318
Table C4: The following data is based on semi-freestyle exertionsperformed at a handle height of 0.5 m by 11 military personnel 360
Table C5: The following data is based on semi-freestyle exertionsperformed at a handle height of 1.0 m by 11 military personnel 366
Table C6: The following data is based on semi-freestyle exertionsperformed at a handle height of 1.5 m by 11 military personnel 371
Table C7: Strength data for one-handed exertions at a hand height of 0.5 m. The values are the means and standard deviations over the entire sphere of exertion for 11 military male subjects......................................... 376
XV

Table C8: Strength data for one-handed exertions at a hand height of 1.0 m. The values are the means and standard deviations over the entire sphere of exertion for 11 military male subjects..........................................376
Table C9: Strength data for one-handed exertions at a hand height of 1.5 m. The values are the means and standard deviations over the entire sphere of exertion for 11 military male subjects..........................................376
Table D l: Dynamic and Static Lifting strength at Shoulder Height. (Datain Newtons)....................................................................................................378
Table D2: Dynamic and Static Lifting Strength at Elbow Height. (Data inNewtons)........................................................................................................ 378
Table D3: Dynamic and Static Lifting Strength at Hip Height. (Data inNewtons)........................................................................................................ 379
Table D4: Dynamic and Static Lifting Strength at Knuckle Height. (Data inNewtons)........................................................................................................ 379
Table D5: Dynamic and Static Lifting Strength at Knee Height. (Data inNewtons)........................................................................................................ 380
Table D6: Velocity of Dynamic Lift at Shoulder Height against the Low,Medium and Heavy Resistances. (All data in mm/s)................................... 381
Table D7: Velocity of Dynamic Lift at Elbow Height against the Low,Medium and Heavy Resistances. (All data in mm/s)................................... 381
Table D8: Velocity of Dynamic Lift at Hip Height against the Low,Medium and Heavy Resistances. (All data in mm/s)......................... 382
Table D9: Velocity of Dynamic Lift at Knuckle Height against the Low,Medium and Heavy Resistances. (All data in mm/s)...................................382
Table DIO: Velocity of Dynamic Lift at Knee Height against the Low,Medium and Heavy Resistances. (All data in mm/s)......................... 383
Table D ll: Power of Dynamic Lift at Shoulder Height against the Low,Medium and Heavy Resistances. (All data in Watts)......................... 383
Table D12: Power of Dynamic Lift at Elbow Height against the Low,Medium and Heavy Resistances. (All data in Watts)...................................384
Table D13: Power of Dynamic Lift at Hip Height against the Low,Medium and Heavy Resistances. (All data in Watts)......................... 384
XVI
Table D14: Power of Dynamic Lift at Knuckle Height against the Low,Medium and Heavy Resistances. (All data in Watts)................................. 385
Table D15: Power of Dynamic Lift at Knee Height against the Low,Medium and Heavy Resistances. (All data in Watts)................................. 385
Table D16: Peak Dynamic Lifting Strength against the Light, Medium andHeavy Resistances. (All data in Newtons).................................................386
Table D17: Hand Height Position for Peak Dynamic Lifting Strength against the Light, Medium and Heavy Resistances. (All data expressed as a % of stature)...................................................................... 386
Table D18: Peak Velocity of Lift against the Light, Medium and HeavyResistances. (All data in mm/s) .................................................................387
Table D19: Peak Power of Lift against the Light, Medium and HeavyResistances. (All data in W atts).................................................................387
Table D20: Anthropometry and strength measures of male militatrypersonnel involved in the maximal lifting trials at Woolwich and Winchester......................................................................................................403
xvn

LIST OF FIGURES
Figure 1.1: Conventions used to denote the sign of manual forces (A), directions of exertion (B), and movement actions of whole body exertions in three dimensions (C). The location of the subject with respect to these axes is shown in the centre figure................................... 12
Figure 2.1: Number of articles by year contained in the computerizedbibliography on human strength. The data is presented as a % of the total number of references in the data base at the time of writing. . . . 19
Figure 2.2: Classification schema for bibliographic material on humanstrength........................................................................................................... 23
Figure 2.3: The six main areas that combine to influence human strengthcapabilities and the ability to exert manual forces.................................... 26
Figure 2.4: A schema of the main factors influencing force exertion.............. 27
Figure 2.5: Physiological and biomechanical influences on force exertion . . . 28
Figure 2.6: Left: A Freebody diagram illustrating the quantities which appear in the Equation of Static Exertion (ESE). Right: The ESE plotted as line EE’ on the PSD. The vectors OD and DP depict the components of the resultant force vector OP along the dead axis and live axis respectively. See text for further details. From Grieve &Pheasant (1981a), and reproduced with kind permission of theprimary author.............................................................................................. 56
Figure 2.7: The Postural Stability Diagram on which static forces at the hands (zero at the centre) and feet (zero at centre base) are represented. The scale, /*’, around the periphery refers to the apparent coefficient of friction (see text for further details). From Grieve 1979b and reproduced with kind permission of the author. . . . 58
Figure 2.8: PSD data for static exertions performed at five handle heights with freestyle foot placement. The inner envelopes represent mean strength/weight ratios for ten males and the outer envelopes the advantages of using components of deviated forces (see text for further details). From Grieve & Pheasant (1981b) and reproduced with kind permission of the primary author.............................................. 62
Figure 2.9: The ’Slip Chart’ proposed by Grieve (1983) for exploring the interaction between manual forces, body weight and the minimum coefficient of friction required to prevent slip during static exertions. The dashed lines refer to the example described in the text. Reproduced with kind permission of the author............................... 77
XVIII

Figure 3.1: Side views of the four handles used in the study (the frontview for handle 1 is also shown). Handles 1 and 2 were cast alloy, handle 3 was made of bakelite and handle 4 was a mild steel bar. . . . 93
Figure 3.2: 1.75m/1.0m pulling strength ratios for each handle, as afunction of their respective average values of pulling strength overthe two conditions of handle placement (1.0m and 1.75m)..................... 98
Figure 3.3: Typical grips employed on the four different handles by four subjects with mean hand dimensions corresponding to a 50 percentile female and 40, 50 and 90 percentile male (from left to right respectively). For each handle the upper figures are for pulling exertions at 1.75m and the lower ones for exertions at 1.0m.................... 103
Figure 4.1: Postural Stability Diagrams (PSD’s) for one-handed exertions, in the fore and aft plane, at handle placements of 1.0m and 1.75 m above the floor. The data are average maximal strengths (+ one standard deviation) as a percentage of body weight. The centre of each diagram represents zero manual exertion and the edges represent forces equal in magnitude to body weight. The posture adopted was freestyle.....................................................................................113
Figure 4.2: Female/male strength ratios in all directions in the fore and aft plane, for one-handed maximal exertions, under two conditions of handle placement (1.0 m and 1.75 m). The centre of each plot represents a f/m strength ratio of zero, the inner circle an f/m strength ratio of 0.5 and the outer circle an f/m strength ratio equal to unity. The hatched areas represent directions in the fore and aft plane where males were significantly stronger than females (p<0.05). All data calculated from strengths expressed as a percentage of body weight.............................................................................115
Figure 4.3: Upper diagrams: PSD plots of subject DS for one-handedmaximal exertions in the fore and aft plane at bar heights of 1.0 and1.75 m above the ground (inner envelopes). The advantages of using components of deviated forces are shown by the outer envelopes.Lower diagrams: PSD plots illustrating the average maximal forces (+ one standard deviation) which may be obtained by using components of deviated forces at the two bar heights (n=22).Presentation of data is as described in Figure 4.1........................................ 118
«
Figure 4.4: MACE values for one-handed freestyle static exertionsperformed at bar heights of 1.75 m (solid line) and 1.0 m (dashed line). The origin corresponds to a MACE value of 1.0, and the inner and outer circles to MACE values of 1.5 and 2.0 respectively........................................................................................................................ 119
XIX

Figure 4.5: Upper diagrams: PSD plots of two-handed maximal exertions in the fore and aft plane with the force bar placed at 1.0 m and 1.75 m above the floor (n=12). Presentation of the data is as described for Figure 4.1. Lower diagrams: Plots showing the mean 1 handed/mean 2 handed strength ratios for all directions in the fore and aft plane at the 1.0 m and 1.75 m bar heights. Scaling of the strength ratios is the same as that described in Figure 4.2. The hatch areas represent directions in the fore and aft plane where two- handed exertions are significantly stronger than one-handed exertions (p<0.05)........................................................................................121
Figure 4.6: The proportion of the total variance in one-handed staticstrength explained by the regression models WHReg (solid line),WReg (dashed line) and WbReg (dotted line) at the 1.0 m and 1.75 m bar heights................................................................................................. 124
Figure 4.7: Tracings from photographic records of one subject showing the change in freestyle posture permitted by releasing one hand from the bar during a maximal exertion directed in the Pull/Press quadrant ofthe PSD. Bar height = 1.75 m. (See text for further details)..................... 130
Figure 5.1a and b: A photograph of the dynamometer (Figure 5.1a) and its component parts (Figure 5.1b). A = Connector box for ring transducer output. B = ring transducers and strain gauges. C = the handle enclosed within the ring bearing. D = Horizontal supports containing self centring bearings and universal joints. E = Rotational bearing. F = Universal joints............................................................................................................... 140
Figure 5.2: Predicted and observed resultant forces (with 95 % confidence intervals for predictions) following regression analysis of the calibration data for the right handle (see text for details)........................... 146
Figure 5.3: The experimental set up used to calibrate the 3D dynamometerstrength testing device................................................................................... 149
Figure 5.4: The redesigned dynamometer...............................................................153
Figure 5.5: Predicted and observed forces (with 95% confidence intervals for predictions) for the X and Y component forces (top and bottom figure respectively) from calibration data on the left-handed dynamometer..................................................................................................156
Figure 5.6: Predicted and observed forces (with 95 % intervals forpredictions) for the Z component forces during calibration of the redesigned handle...........................................................................................157
XX

Figure 5.7: The on-line screen display for presentation of the direction and intensity of static manual forces measured by the three dimensional strength testing dynamometer........................................................................160
Figure 5.8: The user defined character set used for indicating forceintensity in the on-line display. Forces equal to 0% and 100 % of body weight are represented by the solid white and solid black characters respectively. The 30 other characters, ranging from the lightest to the darkest, represent increasing levels of force in steps of approximately 3% of body weight........................................................... 161
Figure 5.9: Graphical output showing an exgmple of how the forcesexerted in a given vertical plane may represented in PSD format.The arrows of the smaller circle indicate the vertical plane or ’slice* through the sphere of exertion presented on the Postural Stability Diagram.......................................................................................................... 164
Figure 5.10: Mean increase in force added to the sphere of exertionfollowing successive experiments at the 1.0 m bar height. Solid line = raw force data, dashed line = force data after 1 smoothing pass, dotted line = force data after 10 smoothing passes. Bars represent standard deviations.........................................................................................173
Figure 5.11a and b: Contour maps showing the unsmoothed (this page) and smoothed forces (next page) over the sphere of exertion for subject 2 after 4 experiments at the 1.75 m handle height......................... 175
Figure 5.11b: A contour map of the smoothed forces over the sphere of exertion for subject 2 after 4 experiments at the 1.75 m handle height.............................................................................................................. 176
Figure 5.12: A contour map representing the mean static strength of 4 subjects over the sphere of exertion for right-handed exertions performed at the 1.0 m handle height. The data was collected over 5 experiments and is presented as a percentage of body weight....................177
Figure 5.13: A contour map representing the mean static strength of 4subjects over the sphere of exertion for the repeat experiments at the1.0 m handle height. The data was collected over 4 experiments and is presented as a percentage of body weight................................................178
Figure 5.14: Mean (and standard deviations) of the increases in force between successive experiments at the 1.0 m bar height (repeat experiment), (□ data points) and the 1.75 m bar height (star data points)............................................................................................................. 180
XXI

Figure 5.15: A contour map representing the mean static strength of 4 subjects in three dimensional space for left-handed exertions performed at the 1.75 m handle height (data collected over 4 experiments)................................................................................................... 182
Figure 5.16: Mean and standard deviations of fatigue ratings reported after each two minutes of data collection (data combined over the two handle heights). Zero fatigue rating = no fatigue, 100 = absolute exhaustion.......................................................................................................185
Figure 5.17: A contour map showing the minimum value for the coefficient of friction required to prevent slip for exertions performed at the 1.0 m bar height. The coefficients of friction were calculated from smoothed force data averaged over the four subjects........................................................................................................... 189
Figure 5.18: A contour map showing the minimum value for the coefficient of friction required to prevent slip for exertions performed at the 1.75 m bar height. The coefficients of friction were calculated from smoothed force data averaged over the four subjects........................................................................................................... 190
Figure 5.19: A contour map of the static one-handed forces generated over the sphere of exertion at a handle height of 0.5 m. The strength data represents the mean of 11 male subjects performing exertions in pseudo freestyle postures (see text for explanation)..................................... 196
Figure 5.20: A contour map of the static one-handed forces generated over the sphere of exertion at a handle height of 1.0 m. The data represents the mean strength of the same 11 male subjects as in Figure 5.19. The posture adopted was pseudo freestyle (see text for explanation)................................................ ................................................. 197
Figure 5.21: A contour map of the static one-handed forces generated over the sphere of exertion at a handle height of 1.5 m. The data represents the mean strength of the same 11 male subjects as in Figure 5.19. The posture adopted was pseudo freestyle (see text for explanation).................................................................................................... 198
Figure 5.22: A flow chart showing the basic structure of a samplingroutine for collection of strength and postural data using input fromthe 3D dynamometer and electrogoniometers..............................................203
Figure 6.1: A photograph of the hydrodynamometer and the experimentalset up..............................................................................................................213
XXII

Figure 6.2: Force versus hand height above the ground for the initial and repeat trials of maximal lifting exertions against the hard, medium and light piston resistances for subjects DF and CB...................................221
Figure 6.3: Force-velocity characteristics of subject DF lifting against the very light resistance. The contribution of the viscous force to the total force measured at the hands is also illustrated. The numbers presented at various points on the force-velocity curve represent different stages in the time course of the lift (see text for further explanation)....................................................................................................224
Figure 6.4: A logarithmic plot showing the relationship between the viscous force and velocity of lift for exertions on the hydrodynamometer against the very heavy, heavy, medium, light and very light resistances (from the extreme left hand curve to the extreme right hand curve respectively). The mean value of the slopes was 1.5 Ns/mm. The curves were derived using the data from subject DF............................................................................................ 225
Figure 6.5: Resistance-displacement characteristics for the heavy, medium and light resistances (top, middle and lower curves respectively) on the hydrodynamometer. The resistance at a given hand height’d’ was calculated from the mean force and velocity data averaged over the one and two-handed exertions for the 18 subjects using the formula resistance,, = Viscous Force-velocity155d..................................... 226
Figure 6.6: Force versus hand height for lifting exertions against the very heavy and very light piston resistances by subjects DF (Figure A) and CB (Figure B). Note the erratic nature of the force-displacement curve against the very heavy resistance. For comparison isometric lifting forces measured at knee, knuckle, hip, elbow, shoulder and head height are shown by the upper curve in each figure.......................... 229
Figure 6.7: Velocity versus hand height for lifting exertions against the five different piston resistances by subjects DF (Figure A) and CB (Figure B). The largest velocities are observed against the very light resistance and the lowest against the very heavy resistance....................... 230
Figure 6.8: Power versus hand height for lifting exertions against the five different piston resistances by subjects DF (Figure A) and CB (Figure B). Taken over the entire lifting range the largest mean power is observed against the very light resistance and is shown to decrease as the piston resistance increases...................................................231
XXIII
Figure 6.9: Displacement-time curves for lifting exertions against the five different piston resistances by subjects DF (Figure A) and CB (Figure B). The time course of lift from 21% of stature to head height increases as the piston resistance increases and ranges from less than 1 second for the very light resistance to almost 20 seconds for the very heavy resistance........................................................................232
Figure 6.10: Tracings from 16 mm cine film of subject DF performing lifting exertions on the hydrodynamometer against five different resistances ranging from very light to very heavy.........................................................235
Figure 6.11: Displacement traces of the hand with respect to the floor and the position of the C7 spine during two-handed lifts against the five different resistances by subjects DF and CB. The envelopes encompass the data points for exertions against the very light, light, medium and heavy resistances. The dotted trace shows the data for the very heavy resistance.............................................................................. 236
Figure 6.12: Displacement traces of the hip and C7 with respect to theground and of the hip with respect to C7 during two-handed lifts by subject DF against the five different resistances......................................... 237
Figure 6.13: Displacement traces of the hip and C7 with respect to theground and of the hip with respect to C7 during two-handed lifts by subject CB against the five different resistances......................................... 238
Figure 6.14: Dynamic characteristics for one-handed (top figure) and two- handed (lower figure) lifting against the heavy resistance. The data are mean values for the 18 subjects. SEM have been omitted for clarity............................................................................................................. 242
Figure 6.15: Dynamic characteristics for one-handed (top figure) and two- handed (Lower figure) lifting against the medium resistance. The data are mean values for the 18 subjects. SEM have been omitted for clarity....................................................................................................... 243
Figure 6.16: Dynamic characteristics for one-handed (top figure) and two- handed (Lower figure) lifting against the light resistance. The dataare mean values for the 18 subjects. SEM have been omitted forclarity. ................................................................................................... 244
Figure 6.17: Absolute and normalized female/male strength ratios over the dynamic lifting range. The ratios were derived from force data averaged over the three resistances and the one and two-handed exertions for the 9 male and 9 female subjects........................................... 245
XXIV
Figure 6.18: Male and female one/two-handed strength ratios over the dynamic lifting range. The ratios were derived from force data averaged over the three resistances for the 9 male and 9 female subjects........................................................................................................... 246
Figure 6.19: One/two-handed strength ratios over the dynamic lifting range for the heavy, medium and light resistances. The ratios were derived from force data averaged over the 18 subjects..............................247
Figure 6.20: Power versus hand height for dynamic lifts against the heavy, medium and light resistances (top middle and lower figures respectively). The data are mean values for the 18 subjects (+SEM). In each figure the top curve is for two-handed lifting and the lower curve for one-handed lifting.........................................................251
Figure 6.21: Force versus height above the ground for one-handed andtwo-handed lifting (top and bottom figures respectively) against the heavy, medium and light resistances. The data are mean forces for the 18 subjects (SEM have been omitted for clarity). The top curve in each figure represents the mean (+SEM) of isometric lifting strength measured at knee, knuckle, hip, elbow, shoulder and head height..............................................................................................................257
Figure 6.22: A surface plot representing the dynamic characteristics of two-handed lifting. The surface is based on the mean forces and velocities observed at knee, knuckle, hip and shoulder height during static lifts (Po) and dynamic lifts against the light (L), medium (M) and heavy resistances (H). The grid was created using Surfer software (Golden Software Inc. 1987)................................................. 271
Figure 6.23: A surface plot representing the dynamic characteristics of one-handed lifting. The surface is based on the mean forces and velocities observed at knee, knuckle, hip and shoulder height during static lifts (Po) and dynamic lifts against the light (L), medium (M) and heavy resistances (H). The grid was created using Surfer software (Golden Software Inc. 1987)................................................. 272
Figure 6.24: Force versus height of lift for maximal two-handed dynamic lifting exertions against the medium resistance by subjects DF and CB under different initial starting heights. The three starting heights shown for each subject were 400, 600 and 1000 cm above the ground respectively........................................................................................279
XXV
Figure Cl: The following graphs represent PSD’s of normalized forces for each 10° vertical plane in the sphere of exertion (as well as for one horizontal plane when the vertical force is zero) for one-handed maximal whole body static exertions on the 3D dynamometer. On each page the upper and lower figures represent exertions at the1.75 m and 1.0 m handle height respectively. The plane of exertion viewed is indicated in each case by the arrows on the smaller circle.The data is based on the mean and SD of the forces recorded onfour male subjects with horizontal foot placements 0.5 m from thehandle............................................................................................................. 319
Figure C2: The following graphs represent PSD’s of the minimum value of the coefficient of friction (at the foot floor interface) for each 10° vertical plane in the sphere of exertion (as well as for one horizontal plane when the vertical force is zero) for one-handed maximal whole body static exertions on the 3D dynamometer. On each page the upper and lower figures represent exertions at the 1.75 m and1.0 m handle height respectively. The plane of exertion viewed is indicated in each case by the arrows on the smaller circle. The data is based on the mean and SD of the forces recorded on four male subjects with horizontal foot placements 0.5 m from the handle. . . . 339
Figure D l: Force - displacement curves for one-handed dynamic lifts against the heavy, medium and light resistances (top, centre and lower figures respectively) on the hydrodynamometer. The top curve in each Figure represents the male data (mean +. SEM) and the lower curve the female data................................................................... 388
Figure D2: Force - displacement curves for two-handed dynamic lifts against the heavy, medium and light resistances (top, centre and lower figures respectively) on the hydrodynamometer. The top curve in each Figure represents the male data (mean +. SEM) andthe lower curve the female data................................................................. 389
Figure D3: Velocity - displacement curves for one-handed dynamic lifts against the heavy, medium and light resistances (top, centre and lower figures respectively) on the hydrodynamometer. The top curve in each Figure represents the male data (mean +. SEM) andthe lower curve the female data................................................................... 390
Figure D4: Velocity - displacement curves for two-handed dynamic lifts against the heavy, medium and light resistances (top, centre and lower figures respectively) on the hydrodynamometer. The top curve in each Figure represents the male data (mean +. SEM) andthe lower curve the female data................................................................... 391
XXVI
Figure D5: Power - displacement curves for one-handed dynamic lifts against the heavy, medium and light resistances (top, centre and lower figures respectively) on the hydrodynamometer. The top curve in each Figure represents the male data (mean +_ SEM) and the lower curve the female data. .............................................................. 392
Figure D6: Power - displacement curves for two-handed dynamic lifts against the heavy, medium and light resistances (top, centre and lower figures respectively) on the hydrodynamometer. The top curve in each Figure represents the male data (mean +. SEM) and the lower curve the female data....................................................................393
Figure D7: Force - displacement curves for dynamic lifts against theheavy, medium and light resistances on the hydrodynamometer. The curves were derived from force data averaged over the one and two- handed conditions for the 18 subjects.......................................................... 394
Figure D8: Force - displacement curves for the one and two handeddynamic lifts on the hydrodynamometer. Each of the curves were derived from force data averaged over the three piston resistances. . . 395
xxvn

xxvrn

CHAPTER 1
INTRODUCTION
In order for a person to live a functionally independent life, he or she must
be able to perform coordinated and forceful physical actions. The degree of
forceful effort required depends on the type of task to be accomplished, and ranges
from that needed to simply move a particular joint, to the maximum possible force
which may be demanded under extreme circumstances.
The largest forces that an unaided individual may exhibit are most likely to
occur during whole body exertions. These type of exertions are not confined to an
isolated muscle group but require the active involvement of both the upper and
lower limbs and trunk to retain postural stability and effect a desired action. The
capacity of an individual to perform these type of exertions will influence not only
their proficiency in recreational/sporting activities but also their ability to carry out
daily routines at home and work.
Although modernisation has reduced the burden of many physically
demanding tasks, numerous occupations still entail some form of manual materials
handling. The whole body strength capability of the human is therefore a key
element in dictating whether heavy manual tasks can be performed efficiently and
safely.
With increasing legislation enforcing safe work practises in the occupational
environment, various organisations concerned with health and safety have
developed guidelines and regulations for manual handling activities (e.g. Health
and Safety Executive 19S8, NIOSH 1981, British Coal Ergonomics Group 1990).
Although complex models exist, which predict the amount of physical stress on the
human body for a given manual handling task (e.g. Garg & Chaffin 1975, NIOSH
1981), these models can only provide the roughest guidelines on the safety of
1

manual exertions. This is partly due to the limited amount of epidemiological data
available, linking given levels of exertion to risk of injury, and partly due to the
limited number of conditions and many assumptions on which the human strength
data has been derived to formulate these models. One class of activity for which
there is a particular lack of information is that of single-handed whole body
exertions.
In comparison to the large array of literature covering vertical two-handed
lifting and horizontal pushing and pulling activities, only a handjiill of studies
have investigated the strength of single-handed whole body exertions (McConville
& Hertzberg 1968, Davis and Stubbs 1980, Warwick et al., 1980).
It may be hypothesised that the lack of data on one-handed whole body
strength capabilities may be the result of an assumption that heavy manual
materials handling tasks will wherever possible be performed with two-hands.
In contrast to this assumption, it is easy to envisage many situations in
which manual handling activities necessitate or preferentially dictate that a task, or
a portion of a task, be performed one-handed rather than two-handed (e.g. airport
luggage handling). Even if most heavy manual handling tasks are performed two-
handed it does not necessarily follow that the load is shared equally between both
hands. For example, an imbalance in load between the left and right hands may
occur during manual handling of irregular shaped objects or those with uneven
mass distribution. Consequently, there may be situations during two-handed
exertions when the majority of the load may be moved or borne singleJiandedly.
In order to examine the likelihood of injury or the possibility of dropping
the object during manovering of heavy loads, a logical first step would be to
obtain information on the strength of single-handed exertions. Unfortunately,
application of currently available one-handed whole body strength data to general
situations encountered in the working environment is somewhat restricted.
2

A common feature of most studies on whole body exertions is that of
rigidly defining foot and hand placement thereby limiting the choice of posture
available to the subject. In addition, few researchers apart from Grieve and
coworkers (Grieve 1979a, 1979b, Grieve & Pheasant 1981; Pheasant & Grieve
1981; Pheasant et al., 1982) have explored directions of exertion beyond the
purely vertical or horizontal. As a consequence, whole body strength data have
been more representative of the conditions imposed by experimental constraints
than of the real strength capabilities of human beings in freely chosen postures and
directions of exertion they would normally use in real world working tasks.
Experimental procedure and strength testing protocol are therefore
important factors to consider when interpreting and applying the various data on
human strength. Because of the use of different apparatus, techniques and
conditions under which human strength has been measured much of the data in the
literature can not be directly compared. Furthermore, the absolute strength of an
individual performing a given task can vary widely according to the exercise
conditions under which the individual is tested.
In order to appreciate the general attributes of strength of an individual,
rather than that specifically attributable to the nature of the task involved, direct
comparisons of strength tests performed under different exercise modes are
needed. Experiments of this nature are particularly required to assess the reliability
of using static measures of whole body strength to predict dynamic capabilities.
In summary, there are a multitude of factors which may limit an
individuals capacity for forceful effort. The primary concern of the present work,
however, is directed towards the role of a number of anthropometric and
biomechanical factors in the determination of maximal whole body exertions in the
healthy human. The main objective of the thesis was to investigate the influence of
these factors on whole body strength capabilities under conditions and directions of
exertion that have been previously unexplored.
3

General Aims of the Study
The main aims of the thesis were to:
(1) Describe and compare the dynamic and static strengths of single-handed
and two-handed whole body exertions in the human.
(2) Determine the influence and relative importance of sex and a number of
anthropometric, interfacial and musculoskeletal factors on force exertion.
The thesis approaches these general aims in several stages. The first stage
involves a review of the literature and presentation of the theoretical framework
used in the analysis of whole body exertions. The second stage involves the
experimental work and is comprised of four studies which incorporate and develop
the theoretical analysis through the complexities of one, two and three dimensional
analysis of whole body static strength, to the dynamics of whole body lifting
strength. Concluding remarks summarizing the findings of the experimental work
are provided in the final Chapter of the thesis.
4

Definition of Human Strength
As "strength" is a term that is used in many different ways in everyday
life, it is necessary to define its precise meaning in the context of the present
work.i
In the past several authors have reviewed the literature on human strength
and presented some of the many definitions that have been proposed (Kroemer
1970, Atha 1982, Kulig et al., 1984). Three examples illustrating the general
form of these definitions have described strength as:
"the maximal force muscles can exert isometrically in a single voluntary
effort" (Kroemer 1970).
"the ability to develop force against an unyielding resistance in a single
contraction of unrestricted duration" (Kulig et al., 1984).
"the strength of a muscle or homogeneous muscle group (i.e. a group of
muscles that have neighbouring attachment sites, share a functional role,
and act simultaneously) is the magnitude of the variable force that this
contractile entity exerts on the skeletal system at the attachment sites of
interest" (Kulig et al., 1984).
A common failing of these definitions are that they are too restrictive to be
of general use considering the wide variety of present-day strength testing
environments.
In the first and the third definitions the action of muscles is given primary
importance in force production. As shown by Dempster (1958) and more recently
by Pheasant (1977) and Grieve (1979) there are many situations in which a
subject’s effective strength is not primarily dependent on the capacity of muscles
to develop forces. According to Dempster (1958) the strength of * static* whole
5

body pulling actions are predominantly dictated by the distribution of body mass
and postural stability. Under these circumstances the action of muscles simply
maintain joint postures in order to allow body weight to be effectively deployed
(Pheasant 1977).
Although the second definition avoids this problem by omitting any
reference to "muscular" force, its application is limited as in the first definition to
a particular state of muscle activity, namely static contractions. In comparison, the
third definition defines strength as a scalar variable which may change with time
and is not associated solely with one particular state of muscle activity (e.g.
isometric, concentric or eccentric contractions) (Kulig et al., , 1984).
Unfortunately, this latter definition is only applicable to localized single joint
actions, and requires either a quantitative knowledge of the internal geometry of
the particular joint of interest, or a direct measure of force at the muscle
attachment site.
As direct measures of muscle force in the human are rarely performed
(Komi 1990 is one example), the quantity actually measured is usually a net torque
about a given articulation. In most measures of strength the nature of the testing
device and the point of attachment of the force sensor to the limb/body (relative to
the axis of rotation of the limb or task in question) plays an important role in the
subsequent output of a given action.
In view of the above issues it was decided to adopt a revised version of the
definition of strength originally proposed by Pheasant (1977). In his PhD thesis
Pheasant defines the strength of an action as "the maximal steady force or torque
which an individual can voluntarily exert on an external test object under given
conditions". In order for this definition to be applicable to the present work, slight
modifications are required to demphasise static exertions and include a reference to
other exercise conditions. The following def inition of strength is therefore
proposed.
6

THE STRENGTH OF AN ACTION IS THE MAXIMAL FORCE OR
TORQUE WHICH AN INDIVIDUAL CAN VOLUNTARY EXERT ON
AN EXTERNAL TEST OBJECT UNDER A PARTICULAR SET OF
ENVIRONMENTAL AND EXERCISE CONDITIONS.
As pointed out by Pheasant (1977) the above statement is a purely
operational definition which makes no prior assumptions about the biomechanical
or physiological determinates of human strength. However, as the current work
deals with both static and dynamic activities further clarification is required to
define strength under these different exercise conditions. The following section
therefore deals with conventions and definition of terms which are referred to
throughout the various chapters of this thesis.
7

Conventions and Definition of Terms
Static Strength: Refers to the steady maximum voluntary force or torque an
individual can exert on an external test object when no apparent observable
movement or external work occurs. Also termed isometric strength, these
exertions involve muscular contractions in which the overall length of the
active muscles remain fairly constant.
As static strength may be measured over varying time periods several
authors have proposed a standardized protocol (Caldwell et al., 1974, Chaffin
1975) for its measurement. For the purpose of the present work steady maximum
strength is defined as the mean force observed over the last few seconds of a
maximum effort maintained over a five second duration. The largest force
observed over this time period, (excluding observations clearly attributable to
jerking actions) is termed the peak strength. All observations of whole body static
strength reported in Chapters 4 and 5 of this thesis conform to this latter strength
measurement.
Dynamic Strength: Refers to the maximum force or torque an individual can
exert on an external test object during a single voluntary effort when some
overt movement can be observed and measurable work is performed.
During dynamic exertions the muscles may contract concentrically (i.e. the
overall length of the muscle shortens during contraction) to produce
positive work, or contract eccentrically (i.e. the overall length of the
muscle becomes longer while contracting) to produce negative work.
Because of the large array of strength testing devices currently available,
dynamic strength has been assessed in many different ways. Listed below are the
various measures of dynamic strength classified according to the type of task
resistance.
Isokinetic Strength: The maximum force or torque an individual can exert
8

during a single voluntary effort against an external test object constrained
to move at a preset constant velocity.
Isoinertial Strength: Measures the ability of a person to overcome the
inertia of a freely movable mass by measuring the maximum amount of
weight he or she can handle and move to an assigned point at a freely
chosen speed (Ayoub & Mital 1989).
Isoresistive Strength: The maximum force or torque an individual can
exert during a single voluntary effort against an external test object
constrained to operate at a preset resistance, in which the ratio of the
measured force/velocity is constant.1
One other class of strength measurement that has been employed by early
investigators is that of the breaking strength (Lovett & Martin 1916, Hunsicher &
Donelly 1955, Rasch & Pierson 1960). Breaking strength refers to the maximum
amount of force or torque which an individual can exert in order to resist a
forceable extension of the limb or muscle group in question. Due to the limited
application of this particular measure of strength to everyday activities, current
practice has been to measure actively exerted forces rather than actively resisted
forces. Consequently, measures of breaking strength have fallen from general use
in the literature.
1 By using an analogy with electronic theory, the ratio of force/velocity may be considered as a measure of the resistance of an exertion. The power to which the velocity is raised will depend on the particular physical characteristics of the strength testing device. If the resistance to motion is provided by the movement of a piston through a fluid, the main factor on which the value of X is dependant will be the viscosity of the fluid contained in the device.
9
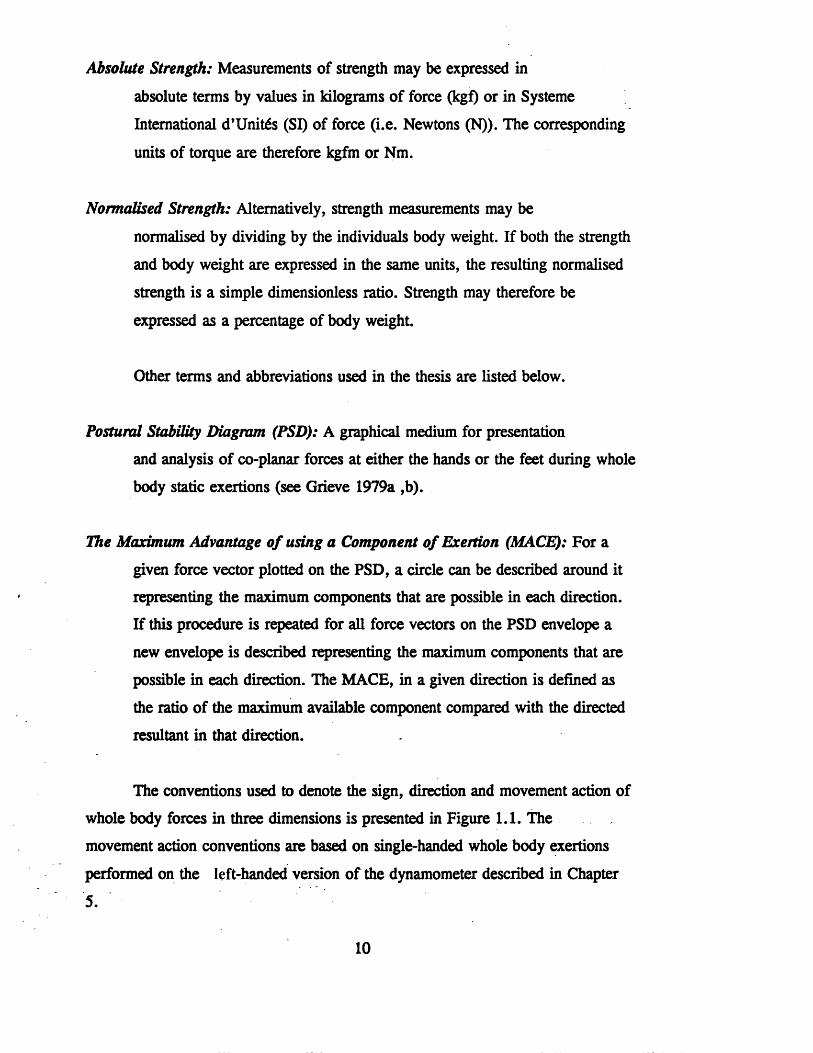
Absolute Strength: Measurements of strength may be expressed in
absolute terms by values in kilograms of force (kgf) or in Systeme
International d’Unitds (SI) of force (i.e. Newtons (N)). The corresponding
units of torque are therefore kgfm or Nm.
Normalised Strength: Alternatively, strength measurements may be
normalised by dividing by the individuals body weight. If both the strength
and body weight are expressed in the same units, the resulting normalised
strength is a simple dimensionless ratio. Strength may therefore be
expressed as a percentage of body weight.
Other terms and abbreviations used in the thesis are listed below.
Postural Stability Diagram (PSD): A graphical medium for presentation
and analysis of co-planar forces at either the hands or the feet during whole
body static exertions (see Grieve 1979a ,b).
The Maximum Advantage o f using a Component o f Exertion (MACE): For a
given force vector plotted on the PSD, a circle can be described around it
representing the maximum components that are possible in each direction.
If this procedure is repeated for all force vectors on the PSD envelope a
new envelope is described representing the maximum components that are
possible in each direction. The MACE, in a given direction is defined as
the ratio of the maximum available component compared with the directed
resultant in that direction.
The conventions used to denote the sign, direction and movement action of
whole body forces in three dimensions is presented in Figure 1.1. The
movement action conventions are based on single-handed whole body exertions
performed on the left-handed version of the dynamometer described in Chapter
5.
10

The terms medial-lateral and lateral-medial exertions refer to movement
actions in the transverse plane performed away and towards the midline of the
body respectively. The labelling of these terms in Figure 1.1C
will of course be reversed whenright-handed exertions are measured.
11

A. Sign Conventions for Force Components
+ 2
■X
+y■2
B. Conventions for Direction of Exertion
Back
Left Right
FrontDown
C. Conventions for Movement Actions
Lift
Medial-laterai exertion
Push
PuliPress
Lateral-medial exertion
Figure 1.1: Conventions used to denote the sign of manual forces (A), directions of exertion (B), and movement actions of whole body exertions in three dimensions (C). The location of the subject with respect to these axes is shown in the centre figure.
12

CHAPTER 2
A SUMMARY OF THE LITERATURE ON HUMAN
STRENGTH
13

Introduction
Research into human strength has been carried out not only within the
traditional disciplines of anatomy, physiology, medicine, psychology, engineering,
but also among the more recent multi-disciplinary areas of biomechanics,
psychophysics, ergonomics and kinesiology. Even within the relatively new field
of biomechanics, subdisciplines are developing (i.e. sports biomechanics,
orthopaedics and occupational biomechanics) which approach the study of human
strength with different concerns and objectives. Consequently, the scientific
literature on human strength is spread across a cornucopia of books and journals.
In the field of manual materials handling, the growing need to collate this
information has been recognised by several authors. As a result, several
comprehensive texts have been published covering much of the scientific literature
on human strength in this field (Brown 1972, Chaffin and Andersson 1984, Ayoub
and Mital 1989).
The above texts are specifically directed towards the problems and hazards
of manual materials handling and to providing ergonomic solutions for alleviating
them. Consequently, there is minimal reference to work on human strength
published in other fields. It was intended therefore, that the literature on human
strength be collated from a broader base so that different perspectives and
emphases on performance measures of human strength may be represented.
In order to satisfy this objective, the literature review was divided into two
sections. The first section deals with the design, and implementation of a
computerized bibliography in which much of the current knowledge on human
strength is contained. The second section of the literature review focuses on the
literature directly relevant to the issues of the current thesis.
14

PARTI:A COMPUTERIZED BIBLIOGRAPHY OF HUMAN
STRENGTH
15
Content and Source Material of the Bibliography
The bibliography was primarily designed towards the needs of the
researcher, task designer, or ergonomist who may wish to research a particular
problem on human strength. The content of the data base was constructed with
these users in mind. The medical practitioner wishing to find out more about how
a particular course of treatment (e.g. drugs or surgery) or medical condition (e.g.
myasthenia gravis) influences human strength may find the bibliography of
marginal use.
Epidemiological and performance studies associated with manual handling
activities are covered comprehensively. In particular much of the recent literature
concerning back problems in manual handling has been included. The bibliography
also contains selected references related to human strength from the sports science
literature. Typical topics covered include training regimens, the influence of drugs
(e.g. steroids) and biomechanical analysis of performance.
The source material for the bibliography was derived not only from papers
published in journals and books, but also from theses, legislation, government
reports and conference proceedings. During collation of the material several large
computer and optical disk data bases were searched. These included MEDLINE,
NIOSHTTC (National Institute for Occupational Safety and Health (U.S.)),
HSEUNE (Health and Safety Executive (U.K.)), CISDOC (International Labour
Organisation) and SPOR (Data-Star Sport data base). A typical search strategy
16

used to interrogate the MEDLINE data base is outlined in Table 2.1.
Table 2.1:A search strategy used to interogate the MEDLINE data base for literature on
human strength
No. Records Request
1: 40 LIFT2: 11 LIFTS3: 69 LIFTING4: 106 LIFT or LIFTS or LIFTING5: 97 PULL6: 21 PULLING7: 55 PUSH8: 13 PUSHING9: 157 PULL or PULLING or PUSH or PUSHING10: 1210 STRENGTH11: 135 STRENGTHS12: 1304 STRENGTH or STRENGTHS13: 368 MANUAL14: 938 HANDLING15: 3966 CAPACITY16: 325 CAPABILITY17: 4265 CAPACITY or CAPABILITY18: 3593 WORK19: 6212 MOOEL20: 7708 MODELS21: 11510 MOOEL or MODELS22: 1326 MUSCULAR23: 1028 POSTURE24: 189 POSTURAL25: 1103 POSTURE or POSTURAL26: 803 LOAD27: 583 LOADING28: 1317 LOAD or LOADING29: 781 BIOMECHANICS30: 135 BIOMECHANICAL31: 826 BIOMECHANICS or BIOMECHANICAL32: 142 INTRA-ABDOMINAL33: 11696 PRESSURE34: 18 INTRA-ABDOMINAL and PRESSURE35: 898 FORCE36: 426 FORCES37: 1241 FORCE or FORCES38: 112 PSYCHOPHYSICS39: 109 PSYCHOPHYSICAL40: 13 (PSYCHOPHYSICS or PSYCHOPHYSICAL) and (#37 or41: 28 #4 and (#12 or #17 or #28 or #18)42: 9 #9 and (#12 or #17 or #18 or #28)43: 43 #13 and (#14 or #4 or #12 or #18 or #37)44: 83 #25 and (#28 or #37 or #18)45: 62 #22 and (#37 or #12)46: 50 #31 and #21 and (#25 or #37 or #12)47: 280 #34 or #40 or #41 or #42 or #43 or #44 or #4548: 202896 LA=ENGLISH49: 236 #47 and LA=ENGLISH50: 180026 HUMAN51: 191 #49 and (HUMAN in MESH)
The selection of key words and combinations of key words used in the
searches were designed to locate as wide a range of literature on human strength
17

as possible. The search strategy in Table 2.1 was based on combinations of key
words found in the titles of relevant papers on human strength reported in the last
25 years of the Ergonomics journal. This particular journal was selected because
of the availability of a full complement of back issues and the fact that it was
highly likely to contain a large number of relevant papers. In order to ensure that
the majority of relevant papers were identified, this latter search was performed
manually.
A break down of the number of articles in the data base for each year of
publication from 1960 to 1990 is shown in Figure 2.1.
18

Number
of Re
fere
nces
C%
of to
tal} 12
10
8
6
4
2
□
<69 71 9185 87
Year
Figure 2.1: Number of articles by year contained in the computerized bibliography on human strength. The data is presented as a % of the total number of references in the data base at the time of writing.

Data Base Structure
In order for the collated material to be accessed quickly and efficiently, all
references were entered into a large data base on an IBM PC. Initially a
commercial software package called DBASE IV (Ashton Tate Corporation) was
used to structure the information and provide an interface to search the data base.
For detailed information concerning the operation of this software the reader is
referred to the comprehensive set of manuals (Ashton Tate Corporation, 1990).
This particular software enables the user to design and structure the data
base according to individual requirements. For the purpose of the bibliography the
12 fields illustrated in Table 2.2 were created. Most fields are self explanatory and
refer to the individual elements of information included in standard reference
formats. The NUMBER field may be used to associate a given reference with a
particular filing code. The ABSTRACT field is a separate but related text file
containing an abstract or notes on the particular reference. A description of the
contents in the CLASSNO field is provided in a later section.
The field type and field width indicate the size and type of information
contained in a particular field. Since it was expected that some references may
contain a large number of authors or keywords these fields were allocated the
maximum field width of 250 characters. The ABSTRACT field however, is not
restricted by this limitation.
The various field sizes were chosen to optimize the balance between; (1) a
complete coding of all the information contained in the majority of references and,
(2) the amount of computer time and memory that would be required to process
and store this information. It should be noted that any subsequent changes to the
field width or type once they have been defined may corrupt existing data
contained in the data base.
20

Table 2.2:The data base structure of the DBASE IV file C:\dbase\mod\strength
Field Name Field Type Width Dec Index
NUMBER Numeric 6 0 N
AUTHORS Character 100 Y
TITLE Character 250 N
SOURCE Character 200 N
YEAR Numeric 4 0 Y
VOLUME Character 15 N
PAGES Character 10 N
KEYWORDS Character 250 N
BOOKEDS Character 50 Y
PUBLISHER Character 25 N
CLASSNO Character 50 N
ABSTRACT Memo 10 N
Input of Data into the Data Base
Data may be entered into the database manually via the keyboard, or
imported directly from other databases via transfer of. information on floppy
diskette. Before information from other computer data bases can be imported, the
incoming data must be in a format compatible with the file structure in Table 2.2.
As a large proportion of the data was derived from the MEDLINE
database, a specially designed computer program, written in PASCAL, was used
to convert a file created from a MEDLINE search into a format suitable for import
into the DBASE IV database. Due to the nature of the Memo field, abstracts could
not be imported directly and therefore had to be entered manually.
21

As considerable time and effort was required to enter the abstracts
manually, the data was also incorporated into a commercial software package
specifically designed for management of bibliographic material (Reference
Manager (version 5), Research Information Systems Inc.). This software permitted
downloaded MEDLINE searches, including the abstract field, to be directly
imported into a Reference Manager formatted database. Import from other on-line
facilities is possible, although some editing of files is necessary before and after
importing files from the NIOSHTTC, SPOR and HSELINE databases. Full details
on the operation of the Reference Manager software are provided in their manual.
A Customized Classification System for Bibliographic Material on Human
Strength
The bibliographic material may be interrogated by author, source
(journal/book name), year or by key words in the title, notes or key words field,
as well as by using a combination of these fields. If however the objective is to
find information relating to a specific practical problem (say for example a given
manual handling task), search procedures become lengthy and complicated, and
often tend to retrieve irrelevant or miss relevant references. The objective of
developing a classification system for bibliographic material on human strength
was to simplify and make more efficient searches requiring this latter approach.
Figure 2.2 shows the various categories which were used to classify the
content of any given paper. These categories were organised and developed to
enable the task designer or ergonomist to customise his search to the problem at
hand, by selecting appropriate elements of concern. This is best explained by
example.
22

(1) Lifting & Handling (object is freely mobile)
APPLICATION (A)(2) Controls (e.g. levers
pedals)(3) Fixtures (e.g. doors)
(4) Tools
TASK (B)(1) Lift (2) Lower/ (3) Push (4) Pull (5) Carry (6) Torque
Place Twist(7) Combination of 3 or more tasks
MUSCLE ACTION (C)(1) Single (2) Single (3) Repeated (4) Repeated (5) Sustained
static dynamic static dynamic exertion(6) Combination of 3 or more muscle actions
BODY PART & ASSOCIATED MUSCLES (D)(1) Whole
body(2) Lower
appendages(.1) Ankle (.2) Knee (.3) Hip
(3) Torso
(.1) Neck (.2) Trunk
(4) Upperappendages
(.1) Shoulder (. 2) Elbow (.3) Wrist (.4) Grip (.5) Fingers
(5) Combination of 3 or more body parts
INDEPENDENT VARIABLES AFFECTING FORCE OUTCOME (E)(1) 1 or 2 (2) Handgrip (3) Footing (4) Posture (5) Spacial
hands constraints
(.1) 1 hand (. 2) 2 hands
(6) Injury/disability
(.1) Symmetrical (.2) Asymmetrical
(7) Combination of 3 or more variables
POPULATION FOR STANDARDS, NORMS AND EXPERIMENTAL DATA (F)(1) Military (2) Military (3.) Civilian (4) Civilian (5) Age
males females males females 16-19
TECHNIQUES FOR EXERTION ASSESSMENT (G)(1) Force (2) IAP (3) Psycho/ (4) Physiological (5) Predictive
meas't IDC physical models(6) Combination of 3 or more techniques
Figure 2.2: Classification schema for bibliographic material on human strength
23

Suppose an ergonomist is interested in investigating a task involving the
manual handling of ammunition boxes from the floor into the back of a truck. The
first step in obtaining relevant references related to this problem is to recognise the
key elements in this task which are of primary concern. If the problem is
considered as a two-handed whole body dynamic lift of a freely movable object by
military personnel, it would be given the classification A l, B l, C2, D l, E1.2, FI,
F2.
In a similar manner, various papers entered in the computerized
bibliography are classified according to the key elements shown in Figure 2.2.
These classification codes (i.e. A l, B l, C2 etc) relating to content of each paper
are located in the CLASSNO field of the DBASE IV database, or in the KEY
WORDS field of the Reference Manager database. Thus, if a search is performed
using the classification codes as in the above example, only papers previously
classified with all these elements will be retrieved.
The computer search may be made as specific or general as required by
appropriate selection of classification codes. Thus someone concerned with
pushing tasks in general may search the data base for any paper containing the
classification code B3. Alternatively, relevant papers relating whole body static
lifting exertions with intra abdominal pressure (LAP) or intra discal pressure
measurements (IDC) may be retrieved by searching with the combination of
classification codings C l, D l, G2.
24

Summary Remarks on the Literature on Human Strength
Summarising the literature in the data base, the many factors shown to
influence human strength may be broadly categorized into the six main areas
illustrated in Figure 2.3. However, this simple schema belies the true nature of
human strength, which only begins to be appreciated when the many individual
factors known to affect force exertion are put in perspective.
Figure 2.4 elaborates on the main areas presented in Figure 2.3 to include
the direct and indirect influences of only a few of the main factors which have
received study in the literature concerning their influence on force exertion. Some
of the individual factors shown in Figure 2.4 are themselves affected by a complex
array of variables. This is illustrated further by Figure 2.5 in which the dominant
physiological/biomechanical factors affecting force exertion are illustrated. The
arrangement of Figure 2.5 shows the main mechanical factors which influence
force exertion on the left, task and musculoskeletal factors down the centre, and
fatigue down the right hand side of the schema. Although the requirements of a
given task may be shown to influence one or more of the variables in these
catagories, the ultimate effect on force exertion depends on a complex interaction
among many of these factors.
Some of the elements in Figure 2.5 are investigated in detail in relation to
whole body exertions in the following literature review and experimental work. As
the present thesis is directed towards a biomechanical study of human whole body
manual strength, it is beyond the scope of the current work to provide all but a
brief reference to material peripheral to the main analysis. The bulk of the
following literature review thus concentrates mainly on biomechanical determinates
of human whole body manual strength. For material on other aspects of human
strength the reader is directed to the computerized database.
25

PHYSIOLOGICAL BIOMECHANICAL
PSYCHOLOGICALENVIRONMENTAL FORCE EXERTION
SOCIOLOGICALGENETIC
Figure 2.3: The six main areas that combine to influence human strength capabilities and the ability to exert manual forces.

PHYS
IOLO
GICA
L/BIO
mECH
fllllCR
L FR
CTOR
S ,
PSYCH
OLOG
ICAL
TYPE
or TAS
K RQD
|
FACT
ORS
mUSC
ULRR
CO
nTRR
CTIO
n '
7’
DURR
TIOn
/REP
ETlT
IOn
Figure 2.4 : A schema of the main factors influencing force exertion
27

INTRINSIC PROPERTIES OF MUSCULOSKELETAL SYSTEM
PREVIOUS HISTORY FIBRE TYPE ACTIVATION
POSTURE
MUSCULAR FATIGUE
DEPLOYMENT OF BODY WEIGHT
HUMAN / OBJECTINTERFACE
MUSCULAR FATIGUE
FORCE EXERTION
TYPE OF TASK & DURATION / REPETITION OF EXERTION
ISOKINETIC
MOVEMENT ACTION / TYPE OF TASK RESISTANCE
ISORESISTIVEi! ISOINERTIAL BALLISTIC
ISOMETRIC
MUSCLE/ JOTSCLE GROUP INVOLVEp
MUSCULAR CONTRACTION
CONCENTRIC ECCENTRIC
Figure 2.5: Physiological and biomechanical influences on force exertion
28

p a r t n
LITERATURE REVIEW
29

Approaches to Biomechanical Modelling of Whole Body Strength: Whole Body
vs the Sum of the Parts
Prediction of Whole Body Strength from the Strength of Individual Joints:
Michigan Type Biomechanical Models
It is well known that a muscle’s ability to develop force is dependent on:
(1) The activation or stimulation level (Rack & Westbury 1969);
(2) The length, and rate of change in length, of the active muscle fibres (i.e
length-tension and force-velocity characteristics) (Pringle 1960; Hill 1970; Gordon
et al., 1966; Asmussen et al., 1965)
(3) The muscle’s previous history (i.e whether or not the muscle has been
prestreched immediately before contraction), (Abbott & Aubert 1952; Hill &
Howarth 1959);
(4) The level of fatigue in the muscle induced by a sustained exertion or previous
contractions (i.e the strength-endurance relationship) (Monod & Sherrer 1965;
Monod 1972);
(5) The physiological cross-sectional area of the muscle2 (defined as the total area
of a set of sections cut perpendicular to the direction of the muscle fibres such that
no fibre is included in two sections and no fibre is excluded (Pheasant 1977))
(Morris 1948).
2 In order to account for the effects of lengthening or shortening the muscle on the calculation of physiological cross section, as well as problems in identifying the physiological cross section of multipennate muscles, most researchers have adopted the concept of an average cross-sectional area (Crowninshield & Brand 1981). This latter quantity is calculated by dividing a muscles volume by its length.
30

(6) The structure and architecture of the muscle (i.e. fibre type and orientation)
(Bourne 1972; Dons et al., 1979).
Although the nature of the above relationships are well understood and
documented for isolated muscle preparations, the application of this knowledge to
the living human remains a problem.
Firstly, most muscles involved in performing external movement act across
one or more articulations. The force output is therefore also dependent on: (1) the
leverage of the muscle (which is related to the distance of insertion of the muscle
relative to the centre of joint rotation) and; (2) the point of application or
measurement of the force relative to the centre of joint rotation (i.e. leverage of
load).
The leverage of the muscle will vary according to the anatomical nature of
the particular muscle/joint unit in question, whereas the leverage of the load will
vary according to the posture of the joint. Consequently, the force output is a
complex interaction between changes in leverage and the physiological
characteristics of the muscle.
Secondly, there are very few human actions performed by a single muscle.
The contribution of different muscles each having different leverages therefore
add to the complexity of analyzing and predicting the force output, of even single
joint actions, based on first principles. In comparison, actual measurements of the
external torque output for a given joint action in the living human is elementary.
As a result there are numerous studies which have investigated the torque-
angle and torque-velocity relationships of various muscles/muscle groups in the
human. Comprehensive reviews of these data, particularly with respect to torque-
angle relationships, have been provided by Kulig et al., (1984) and Svensson
(1987). The terminology used in many of these studies has subsequently been
31

adopted from those of the early theoretical papers on muscle mechanics and
physiology.
Although the torque-angle and torque-velocity relationships for some single
joint exertions look remarkably similar to the theoretical relationships derived from
Isolated muscle preparations, this agreement is likely to be coincidental for the
reasons outlined above. Indeed, Kulig et al., (1984) showed that the form of
torque-angle curves for single joint exercises varies widely across the different
joints of the body.
Even considering a given single joint action, large discrepancies in the
form of these relationships exists in the literature. These discrepancies are due to a
number of factors related partly to the population studied, partly to psychological
factors (i.e. subject motivation, or pain or discomfort associated with the exertion)
and partly to the exercise conditions and experimental protocol under which the
subjects were tested. The usefulness of these published results is therefore limited
by the absence of a standardized experimental protocol.
Despite the above problems, researchers at the University of Michigan,
have developed computerized biomechanical models of human strength in which
they compare the resultant joint moments at the major articulations of the body, to
that capable of being produced by maximum voluntary whole body exertions
(Chaffin 1969; Martin & Chaffin 1972; Garg & Chaffin 1975). The input required
by these models are: subject anthropometry (sex, height, weight); the direction of
force exertion at the hands; and the posture of the subject (i.e. joint angles at the
elbow, shoulder, hip, knee, and ankle).
The anthropometric input data is used to predict segment lengths and
weights based on the scaling techniques described by Dempster et al., (1964) and
Dempster & Graughhran (1967), and to determine a "subject strength coefficient"
for each muscle group. This latter variable attempts to account for individual
characteristics in maximum voluntary torque production. It is defmed as the
32

maximum measured strength of a given muscle group for a selected body position
of the particular individual, divided by the predicted mean strength of the same
muscle group for the same body position over all subjects considered in the
population (Martin & Chaffin 1972).
These data are combined with population data on the static strength torque-
angle relationships of the ankle, knee, hip, back, shoulder and elbow, to determine
the maximum hand force that the subject will be able to exert for a given posture
and direction of exertion. The specific muscle group responsible for limiting these
hand forces is also provided.
The most complex of these biomechanical models is that of the Three-
Dimensional Strength Prediction Model described by Garg and Chaffin (1975).
The authors validated their model using static strength data from 71 male air force
personnel who performed seated maximal static exertions in 38 different positions
(Thordsen et al., 1972). Most of these exertions were performed one-handed.
The model predictions were compared with the measured forces using a
simple linear regression analysis. When all conditions were grouped together the
correlation coefficients and the coefficient of variation (ratio of the standard
deviation of the residuals to the mean value of the measured hand force strength)
for the regression analysis were approximately 0.85 and 0.60 respectively. These
values are at odds with those in their abstract in which they quote "error
coefficients of variation averaged from 0.27 to 0.49 and correlation coefficients
between the measured and predicted hand forces averaged from 0.93 to 0.97"
(Garg & Chaffin 1975). It would seem that these latter figures were derived from
the mean of the individual analyses performed on each of the 38 positions.
These results are surprisingly good when one considers the models
assumptions and limitations. Firstly, it is assumed that the strength of a particular
muscle group is not dependent on the level of loading on adjacent articulations.
There is very little evidence however to suggest that this assumption is valid. It is
33

well known that some muscles act about more than one joint and therefore will
simultaneously exert torques about two adjacent joints. In these cases the posture
adopted and the subsequent loading of one of the joints will influence the torque-
angle relationship at the other joint.
Secondly, the model ignores the effects of co-contraction of muscles and
their contribution to whole body exertions. Co-contractions (i.e. simultaneous
contraction of the agonist and antagonist muscles) act to stabilize joints during
whole body exertions so that effective moments can be applied without dislocation
or injury to the joints.
Grieve (1987) has investigated muscle activity across the major joints of the
body during whole body exertions and has demonstrated the importance of co-
contractions during these activities. He concludes that some means of modelling
the dual function of muscles, in terms of their role in creating moments and
stabilizing joints under the conditions discussed above, would greatly enhance the
reliability of the Michigan models.
Thirdly, when one considers the complexity of for example the shoulder
joint, which has three rotational degrees of freedom and can exhibit six distinct
muscular actions (flexion, extension, adduction, abduction, inward rotation,
outward rotation), it is recognized that at least six torque-angle curves are required
to accurately predict torque capacity at this particular joint. Kulig et a l , (1984)
points out that two of these six motions (inward and outward rotation) have not
been studied at all from the strength standpoint, and that very few studies have
described the torque-angle relationships for the other four motions. One point that
is not made clear in the paper by Garg and Chaffin (1975) is the source of data
and the number and status of subjects (age, weight, training level etc.) used to
derive the torque-angle curves of each individual joint in the model.
Considering the lack of biomechanical strength data on the shoulder it is
therefore not surprising that Garg and Chaffin’s model was found to under predict
34

or over predict the forces at the hand, dependent on the direction of the force and
the height of the handle. In order to account for these errors the authors included
an additional, empirically derived, correction factor into the prediction model.
An additional source of error which may have contributed to the magnitude
of the coefficients of variation is associated with their calculation of the subject
strength coefficient. As specific strength coefficients for the different muscle
groups were unavailable for the air force personnel, all strength coefficients were
determined on the basis of body weight. This meant that the model was "forced to
treat subjects of similar body weight (resulting in similar strengths) and stature
(resulting in similar link lengths) as exactly alike, when in reality the measured
force data indicates that there is a significant strength variation among these
subjects" (Garg & Chaffin 1975). The assumptions involved in predicting the
strength of whole body exertions based on body weight is discussed in a later
section and explored in detail in Chapter 4.
Because of the above procedures for determining the strength coefficient,
Garg and Chaffin (1975) stated that the validation study was "more to determine if
the model was consistent for groups of people performing various tasks rather than
for testing the inter-subject predictability of the model." In the light of this, their
conclusion that "the model can be used to predict human strength on an individual
and population basis", is unfounded and requires further validation studies. It may
also be argued that this model can not be used on a population basis in conditions
other than for exertions performed while sitting. This is based on the likelihood
that a different set of empirically derived constants may be required to adjust the
model predictions to accurately represent forces for standing exertions.
With respect to this latter point, Chaffin et a l , (1987) eventually published
a report validating the Three-Dimensional Static Strength Prediction Model using
the strength data of Warwick et al., (1980) and Rohmert (1966). This study
revealed that when used to predict forces at the hands for one-handed sagital plane
35

exertions and during two-handed asymmetric postures, the model could only
account for between 50% and 74% of the variance in the measured strength.
It would seem therefore, that the Three-Dimensional Strength Prediction
Model is not a very accurate predictor of whole body strength for exertions
performed one-handed or in asymmetrical postures. If the model is used strictly in
the sagittal plane for two-handed exertions, much better correlations between
actual force values for the strength of a given percentile of the population and that
predicted by the model are achieved (r2 between 0.85 and 0.88) (Chaffin et a l,
1987).
In addition to computer models, researchers at the University of
Nottingham have developed a biomechanical puppet for simple determination of
the loads on the body during symmetrical exertions about the sagittal plane (Tracy
& Munro 1989). Although presented in a novel medium, the results obtained from
this type of model need to be compared with population data on the maximum
voluntary moments about the various joints of interest to provide appropriate
assessment of the strength requirements for a given set of conditions. The
usefulness of the biomechanical puppet for modelling whole body exertions is
therefore dependent on the same underlying assumptions and limitations as the
Michigan computerized strength prediction models.
It was felt necessary to provide extensive criticism of the Michigan type of
biomechanical models because of; (1) their wide spread use (over 250 different
organizations and individuals have purchased Strength Prediction Programs from
the University of Michigan (Chaffin 1987)) and, (2) the many reports referring to
these models which have appeared in the literature (Martin & Chaffin 1972;
Chaffin & Park 1973; Ayoub & McDaniel 1974; Park & Chaffin 1975; Garg &
Ayoub 1980; Yates et al., 1980; Chaffin et al., 1983; Pedersen et al., 1989). In
addition, the Two-Dimensional Static Strength Prediction Program is a major
component of the NIOSH (1981) guidelines for manual handling activities.
36
Biomechanical Models of Human Strength Based on Whole Body Static
Strength Data
An alternative approach to the prediction of whole body strength has been
to derive multiple regression models based on anthropometric measures and/or
selected strength tests. Using this approach, data on whole body strength is
collected in different postures and compared through various statistical models to
the task variables of interest usually related to the posture adopted (i.e., position
of the hands relative to the feet), the size and nature of the load, the
anthropometry of the population tested and/or static strength of key muscle groups
involved in the whole body actions.
In order to provide a direct comparison of the above approach with the
Michigan models, the following discussion concentrates on those models of whole
body strength which were directly determined from static strength measures. A
comparison of the dynamic and static methods of whole body strength assessment
is provided in a later section.
As the majority of research on whole body strength has concentrated on
lifting exertions, most whole body strength prediction models have been concerned
with this task. Early work by Poulson (1970) suggested that isometric back
strength may be a good predictor of lifting strength. This was based on the
assumption that "the weakest link in the structural system that supports the burden
in a lift from the floor, is presumably the spine" (Poulson 1970). Although
Poulson reported significant correlations between isometric back strength and
dynamic lifting from the floor his model only accounted for between 53% and
57% of the variance in the measured lifting strength (r=0.73 and 0.76 for men
and women respectively). The model was also restricted to the lifting range from
20cm above the floor to knuckle height.
More recently Yates et al., (1980) have derived multiple regression models
of whole body lifting strength using maximal isometric tray-lifting strength as the
37

dependent variable and five isometric strength measures (back extension strength,
elbow flexion strength, grip strength and shoulder flexion strength at 45* and
135*) as well as anthropometric data as independent variables. A total of 12
different lifting postures were investigated with nine male and nine female college
students as subjects. Their results suggested that arm and shoulder strengths were
limiting factors in lifting due to their appearance in 19 of the 24 regression
equations (12 each for men and women). Isometric back extension strength
appeared in ten of the equations. The i2 values for the regression equations ranged
from 0.68 to 0.98.
When this data was compared with lifting strength data derived using the
Two-Dimensional Static Strength Prediction model (Martin & Chaffin 1972)
considerable differences were found in both the absolute values and the overall
relationship. Considering that the gripping surface was stated to be "somewhat
limiting" in Yates et al’s study, it was surprising to find that in four positions for
the men, and all the positions below the waist for the women, the Michigan
biomechanical model underestimated isometric lifting strength. In contrast, the
biomechanical model tended to overpredict the strength of lifting exertions
performed above waist height for both sexes. Some of the discrepancies between
the two models were attributed to variations in grasp on the test object, as well as
differences in the subject populations.
The data of Yates et al., (1980) lends some support to the above findings
of Poulson (1970) of a significant linear relationship between back strength and
whole body lifting strength. The correlation coefficients for the linear regression
of back muscle strength with lifting ability were however somewhat lower (r=0.69
and 0.67 for men and women respectively). Even though the results were
compared over the same lifting range as that reported by Poulson (1970), the data
of Yates et al., (1980) suggests that arm and shoulder strength play a significant
role in lifting exertions performed below waist height. The assumption that the
strength of the back is the weak link in these type of exertions may therefore not
necessarily be true. It is likely however, that differences in experimental
38

conditions between the two studies may have played a significant role in the
amount of loading across the different joints during lifting.
Possibly the most comprehensive computerized prediction model of whole
body static lifting strength to date has been developed by Sanchez (1991) and
Sanchez and Grieve (1991). Predictive equations for vertical lifting strength were
derived for one and two-handed exertions in 96 different postures both symmetric
and asymmetric. "The conditions investigated encompassed 6 heights above the
ground, 2 horizontal reaches from mid-ankles and 5 vertical planes, 45’ apart,
from 90’ to the left and 90* to the right of the forward facing positions" (Sanchez
1991). For each of the 96 postures linear regression models were derived with
vertical isometric lifting strength as the dependent variable and body weight as the
independent variable. A total of nine male and nine female medical students or
staff of the institute contributed to the subject population for these regression
equations. A further 16 subjects contributed anthropometric data for the prediction
of maximum reach at the different planes and heights. The strength of lifting
exertions at maximum reach were considered to approach zero lift force.
By using computerized linear interpolation procedures these authors were
able to predict isometric lifting strength at any height, plane and reach in the work
space. A surprising finding from this study was the fact that there was no
difference in vertical isometric lifting strength between males and females when
strength was expressed relative to body weight and when posture (height and reach
of the hands) was expressed as a percentage of stature. Their prediction equations
were therefore gender-free.
Validation of this model was performed using another 18 subjects who
executed lifting exertions in 60 intermediary postures to those initially used. When
the mean predicted strength over the 18 subjects for each of these 60 postures was
compared with the observed mean strengths, a remarkably high correlation
coefficient was obtained (r=0.99). In addition, the standard error of the predicted
mean strength was found to be very low (15 N). On examination of this data the
39

results of Sanchez (1991) indicate that the model slightly underpredicts lifting
strength in those postures in which the lowest forces were recorded (i.e < 100
N), but overpredicts lifting strength in those postures which high forces were
observed (i.e. > 150 N). Unfortunately no explanation was provided for this
phenomenon.
When compared with the Michigan 3D Static Strength Prediction model it
would seem that the above approach affords a more accurate prediction of whole
body lifting strength, especially for one-handed and asymmetrical postures. This is
presumably because the Sanchez model is based on actual measures of whole body
lifting strength rather than on a composite measure of whole body strength derived
from the torque-angle relationships of the crucial muscles involved in lifting. The
whole body modelling approach therefore does not have to rely on the many
assumptions inherent in the Michigan models.
The Sanchez model is however limited in a number of ways. Firstly, the
prediction equations are only valid for purely vertical static lifting exertions in
postures where the feet are maintained in a single standardized position. Secondly,
the handle on which exertions were performed was rigidly mounted. As normal
lifting exertions require some stabilization of both the load and the body, strength
data collected with a rigid handle may be different from that obtained against a test
object which has one or more degrees of freedom (e.g., static exertions performed
on a handle connected to a force transducer via a chain).
Thirdly, the validation study was carried out on a subject population of
almost identical stature, weight, age and of similar social background to the initial
subject group. Further validation is therefore required to test this model against
other populations with different levels of fitness.
A similar approach to that by Sanchez (1991) was incorporated by Rohmert
(1975) for the determination of maximal isometric forces during standing exertions
performed within the zone of movement for the arms. The strength data was
40
collected on five male subjects who performed both lifting, pulling and pushing
exertions in all six coordinate directions (see figure 1.1). Instead of deriving
regression equations from the strength data the mean absolute forces were
presented in graphical format as isodynes (lines of equal force) in the zone of
movement.
A common limitation of all of the above models is the relatively low
number of subjects involved in their development. Strength predictions calculated
for a given percentile of the population using these models should therefore be
treated with care until larger data sets are available for comparison.
Possibly one of the largest data sets on maximal whole body isometric
forces is currently being developed in West Germany (Ruhmann & Schmidtke
1989). Preliminary group results on the measurements of isometric forces for
selected kinds of load manipulations commonly found in industry have recently
been reported by Ruhmann & Schmidtke (1989). Their data is based on 408
female and 837 male subjects with the ultimate aim of obtaining strength measures
on 3,600 subjects. When completed this research will afford a useful data base that
could provide standardization of percentiles for maximum forces in a number of
selected postures.
Other isometric lifting strength data sets have been reported in the literature
(e.g. Chaffin 1974; Davis & Stubbs 1977; Garg & Ayoub 1980) although these
have been more concerned with predicting safe lifting loads than of maximum
lifting strength.
41
Chaffin (1974) compared the weights of loads lifted in various industrial
tasks to the predicted lifting strength of a large strong male (i.e., the strengths of
97.5 percentile population), to produce a Lifting Strength Rating (LSR) for any
given task. The LSR was defined as:
Load Lifted on JobL SR = -------------------------
Predicted Strength in same position
Predicted lifting strength was obtained from a graph depicting isodynes of
lifting force for the sagittal plane. The isodynes were derived from the Two-
Dimensional Static Strength Prediction Program of Martin & Chaffin (1972).
The studies by Chaffin (1974) and Chaffin et al., (1977) have been one of
the few attempts to link biomechanical stresses resulting from manual materials
handling jobs to the risk of musculoskeletal injury. Although high LSR ratios were
found to correlate with low-back pain incident rates (Chaffin 1974) it was admitted
that the physical stresses of many jobs are not easily described by this simplistic
lifting strength rating (Chaffin et al., 1977).
An alternative approach used to provide guidance on acceptable levels of
force exertion has been employed by Davis & Stubbs (1977). These authors make
use of the relationship which exists between the forces acting on the lower back
and the pressures generated in the abdominal cavity (LAP) (Davis 1981). Based on
observations on 700 male British subjects, Davis and Stubbs found that workers in
occupations where their abdominal pressures were frequently in excess of 100
mmHg had significantly higher incidents of back pain than other workers. The
high incidence of back pain in the military forces prompted the British Army to
adopt this approach in a study on the human capabilities in the carriage of heavy
loads published by the Ministry of Defence in 1975.
Davis and Stubbs (1977) presented their data for strength limits as isodynes
of force about the zone of movement of the arms in a similar manner to that
42
described by Rohmert (1975). The isodynes indicate the forces which should result
in an IAP of 90 mmHg in a worker whose height and weight coincide with the
fifth percentile limits of the British population. It should be noted, however, that
the measurement of IAP is a skilled procedure which is fraught with
methodological problems (i.e., radio pills for IAP measurement are sensitive to
changes in body temperature) and is also dependant on the type of exertion
performed (i.e., dynamic or static).
43

Summary Comments on Static Whole Body Strength Prediction
In summarizing the different approaches to whole body strength prediction,
the advantage of the Michigan models is that they may be used to consider any
novel posture without requiring human experimentation. In contrast, models based
on whole body strength data are limited to the postures in which the models were
developed and tested. A way ahead for these latter models has been provided by
Sanchez & Grieve (1991). These authors have shown that linear interpolation of
both posture and strength, using data collected from a limited number of
experiments, can provide an indication of the maximum static strength for vertical
lifting actions performed anywhere within the reach envelope.
Regardless of which type of model is used, there are a number of points
which need to be considered when applying the results to real life. Firstly, all the
models and strength data reviewed so far have been based on static measures of
strength. These strength data are therefore only applicable to either static
conditions or slow dynamic exertions in which inertial or accelerative effects are
negligible.
In order to determine the usefulness of this strength data, static and
dynamic measures of whole body strength need to be compared. In addition, more
research is needed to discover the forms of relationship which exist between the
velocity and force of exertion for maximal whole body actions. Some of these
issues are reviewed in a following section of the literature review and investigated
for whole body lifting actions in Chapter 6.
Secondly, the above models of human whole body strength recognise only
two limitations to force output. These are either musculoskeletal, in which a given
element of the body is tested to its limit, or gravitational, in which strength is
limited by the weight and mass distribution of the body (Pheasant 1977). A third
type of limitation, which is often ignored, occurs when "man's capacity to exert a
measurable force is limited by the nature of the interfaces between the outside
44

world and himself' (Pheasant 1977, p.61). These type of limitations have been
termed "interface" limitations by Pheasant (1977). The importance of this type of
limitation on whole body static pulling strength is investigated for the hand/handle
interface in Chapter 3.
Thirdly, when direct strength measures are unavailable or not included in
the above biomechanical models, inter-subject differences in whole body strength
under a given set of conditions are predicted entirely from an individual's
anthropometry. The most common anthropometric measures used for predicting
whole body strength have been body weight and stature. Indeed, the predictive
regression equations of Sanchez (1991) were derived from exertions performed at
heights and reaches which were given percentages of stature, and with individual
variances in strength accounted for by body weight.
This latter point raises several questions about the nature of the relationship
between body weight and strength.
(1) How good are body weight and stature as predictors of whole body strength?
(2) Is whole body strength linearly related to body weight, as commonly assumed
in the above biomechanical models? Or does a different relationship with body
weight provide a more accurate prediction of whole body strength?
These issues are discussed in the next section and investigated
experimentally in Chapter 4.
45
Body Weight as a Predictor of Whole Body Strength Capability
Body weight and stature have long been attractive as predictors of strength
because of their simplicity and convenience of measurement. Unfortunately,
individual variability in strength is, amongst other things, also a function of the
state of training, motivation, skill, practice and familiarity with the strength test.
Consequently, the published literature has reported a wide range of correlations
between body anthropometry and various strength measures (see Table 2.3).
A tentative observation from the studies reported in Table 2.3 suggest that
correlations between body weight and strength are greatest for whole body strength
measures than for the strengths of individual muscle groups, and for trained
subjects compared with untrained subjects. The data of Pheasant (1977) and
Kroemer (1971) also indicate that the strength of this relationship for whole body
exertions may also depend on the direction of exertion and the quality of the foot
floor interface.
As it is well known that height and weight are themselves significantly
correlated it is not surprising to find that stature also occasionally shows a
significant correlation with strength. However, the correlation between stature and
strength is frequently non significant and much lower than that observed between
body weight and strength. This difference may be attributed to the large amount of
variance in body size and shape which exists in the population when stature is held
constant.
Thus correlations between stature and strength are likely to be lowest in
studies where there is a large degree of diversity in body shape, size and
composition of the subject population tested.
46

Table 2.3Zero Order Correlations of Body Weight and Height with Various Strength
Measures Reported in the Published literature
SOURCE STRENGTH MEASURE CORRELAT ION WITH BODY WEIGHT
CORRELAT ION WITH BODY HEIGHT
Tappen (1950) Isoinertial
Bench Press 0.85
Rasch & Pierson Isoinertial(1963)
Combination of two hands press, two hands curl, supine bench press and two hands reverse curl
0.45 0.11 (NS)
Tomvall (1963) Isometric
Standardized muscle factor3 0.56 0.11 (NS)
Laubach & IsometricMcConville(1969) Hip Flexion 0.30 0.17 (NS)
Hip Extension 0.18 (NS) 0.20 (NS)
Trunk Flexion 0.34 0.13 (NS)
Trunk Extension 0.53 0.20 (NS)
Elbow Flexion 0.50 0.29
Shoulder Flexion 0.40 0.17 (NS)
Knee Flexion 0.33 0.13 (NS)
3 Derived from the mean Z score (calculated using the formula below) of strength tests performed on 22 muscle groups.
S t a n d a r d i z e d m u s c l e f a c t o r -
Where:
x = a single value of muscle strength for a given muscle group.X = mean strength value of the same muscle group for the population tested, s = standard deviation associated with X. n = number of muscle groups included in the test.
(x -X ) 4* S
47

Knee Extension 0.19 (NS) 0.00 (NS)
Shoulder Inward Rotation 0.43 0.11 (NS)
Ankle Plantar Flexion 0.28 0.15 (NS)
Ankle Dorsi Flexion 0.29 0.26
Grip 0.41 0.31
Mean Total Strength 0.49 0.22 (NS)
Poulson (1970) Isoinertial
Lift from floor to knuckle height
males 0.06 (NS)Females 0.28
Kroemer (1971) Isometric
Forward Push with various coefficients of friction at foot floor interface
II o u> 0.70
H = 0.6 0.76
fJL = 1.0 0.51
Footrest 0.34
Lateral Push (using the shoulder) with various coefficients of friction at foot floor interface
fi = 0.3 0.62
fi = 0.6 0.67
fJL = 1.0 0.43
Footrest 0.43
Backward Push with various coefficients of friction at the foot floor interface
H = 0.3 0.62
fi = 0.6 0.58
p — 1.0 0.49
Footrest 0.51
48

Wall 0.57
Garg & Chaffin Isometric(1975) Seated single handed
exertions in various directions
0.41
Pheasant (1977) Isometric
Horizontal Pull strength using freestyle postures at a bar height of:
1.5 m 0.82 0.79
1.0 m 0.80 0.76
0.5 m 0.68 0.68
Vertical Lifting at a bar height of 0.5 m
Mean correlation coefficient over 3 foot placements
0.57 0.62
Forearm Pronation 0.58 0.61
Forearm Supination 0.66 0.67
McDaniel et al., Isoinertial(1983)
Weight lifted to 6 ft males = 0.49females = 0.36
0.21
0.20
Weight lifted to elbow height males = 0.47females = 0.40
0.19
0.23
Viitasalo et al., Isometric(1985) Grip 0.23 0.52
Elbow Flexion 0.43 0.33
Knee Extension 0.26 0.32
Trunk Extension 0.34 0.20
Trunk Flexion 0.47 0.31
Hortobagyi et al., (1989)
Isokinetic supine bench press (0.013 m/s)
0.52 0.30
49

Isoinertial supine bench press
0.56 0.18 (NS)
Slow Isoresistive seated bench press (mean vel. 0.37 m/s)
0.59 0.29
Fast Isoresistive seated bench press (mean vel. 1.26 m/s)
0.54 0.26 (NS)
Notes:Unless otherwise indicated all correlations are significant at a = 0.05.
50

In order to minimize the confounding effects of motivation, body type and
conditioning which exist in large heterogeneous populations, several studies have
concentrated on the relationship between body weight and lifting performance in
highly trained athletes (Keeney 1955; Lietzke 1956; O’Carrol 1968; Ross et al.,
1984). These studies have analyzed either world or Olympic records of various
weight lifting events and body weight classes, in an attempt to match documented
performances with theoretically derived relationships between body weight and lifting
performance.
These studies have revealed that the strength/weight ratio decreases with
increasing body weight, suggesting the relationship between lifting performance and
body weight is not one of direct proportionality. This finding may partly explain some
of the low correlations reported in Table 2.3 in which body weight and strength were
assumed to be directly proportional.
Both Lietzke (1956) and Ross et al., (1984) found that the observed
relationship between lifting performance and body weight was very close to that
derived from dimensional theory. If body mass can be ascribed the dimension L3, and
strength the dimension L2, the expected relationship for weight-lifting ability per unit
of mass (i.e., L2/L3 or M0667) would be described by the allometric equation
P = aM0667where:
P = maximum weight lifted
M = the individuals body weight
a = a constant
In logarithmic form this equation may be expressed as;
log P = 0.667 log M _+ log a
51
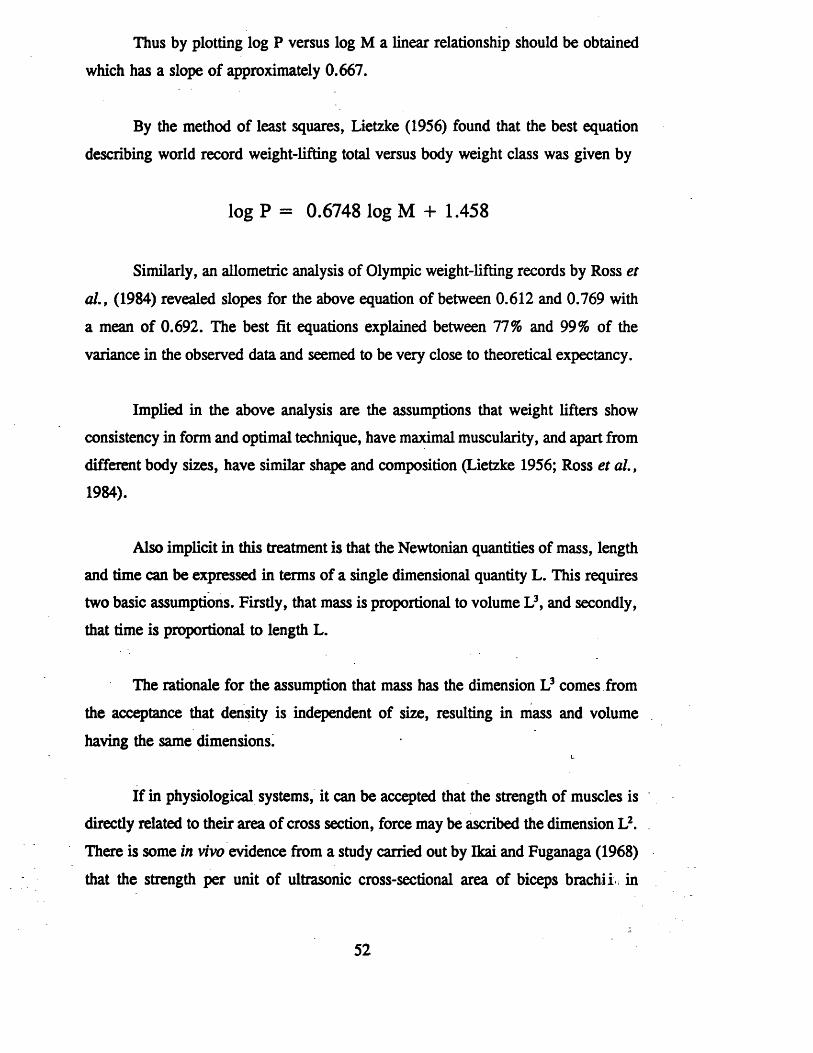
Thus by plotting log P versus log M a linear relationship should be obtained
which has a slope of approximately 0.667.
By the method of least squares, Lietzke (1956) found that the best equation
describing world record weight-lifting total versus body weight class was given by
log P = 0.6748 log M + 1.458
Similarly, an allometric analysis of Olympic weight-lifting records by Ross et
al., (1984) revealed slopes for the above equation of between 0.612 and 0.769 with
a mean of 0.692. The best fit equations explained between 77% and 99% of the
variance in the observed data and seemed to be very close to theoretical expectancy.
Implied in the above analysis are the assumptions that weight lifters show
consistency in form and optimal technique, have maximal muscularity, and apart from
different body sizes, have similar shape and composition (Lietzke 1956; Ross et al.,
1984).
Also implicit in this treatment is that the Newtonian quantities of mass, length
and time can be expressed in terms of a single dimensional quantity L. This requires
two basic assumptions. Firstly, that mass is proportional to volume L3, and secondly,
that time is proportional to length L.
The rationale for the assumption that mass has the dimension L3 comes from
the acceptance that density is independent of size, resulting in mass and volume
having the same dimensions.L
If in physiological systems, it can be accepted that the strength of muscles is
directly related to their area of cross section, force may be ascribed the dimension L2.
There is some in vivo evidence from a study carried out by Ikai and Fuganaga (1968)
that the strength per unit of ultrasonic cross-sectional area of biceps brachli in
52

forearm flexion, is approximately constant and independent of sex, age, and level of
training.
Hence by substituting the dimensions L2 and L3 for force and mass
respectively in the Newtonian equation F=ma (where: F=force, m=mass,
a= acceleration) it may be seen that the second assumption (i.e., that time is
proportional to L1) is satisfied.
Applying this analysis to other types of whole body exertions (i.e., pulling and
pushing) may however produce different results. The theoretical analysis derived
above will only be appropriate when the strength of muscle is the primary limitation
to force exertion. One would expect the value of the exponent to tend towards 1.0 in
directions of exertion where force output is limited by the effective distribution of
body weight (i.e., gravitational limitations). Studies investigating the role of
musculoskeletal and gravitational factors in whole body exertions are reviewed in the
next section.
It is also recognized that the above allometric equation is not the only way to
describe or predict strength from anthropometric measures. Complex power functions
and polynomials have been employed by several authors (Mital & Manivasagan 1982,
1984; Mital 1984; Mital et al., 1985). Although these functions tend to provide a
better fit to the data than simpler lower order regression models, physical meaning
of the parameters is lost in the complexity of the equations.
53
Static Analysis of Whole Body Exertion
Up until the mid 1950’s most studies on whole body strength had been
predominantly descriptive in nature and provided purely empirical data. Using a
force bar similar to that described in Chapter 3 Gaughran and Dempster (1956),
Dempster (1958) and Whitney (1957), were the first investigators to formally
elucidate the mechanical factors operating during whole body exertions.
Based on the principles of statics, these authors derived mathematical
equations for describing the strength of symmetrical two-handed pulling, pushing
and lifting actions in the sagittal plane. Using free body diagrams, the maximum
possible horizontal forces in the sagittal plane, capable by a given individual in
any known and defined posture, could be determined on theoretical grounds.
The mathematical principles for static exertion derived by Gaughran &
Dempster (1956) were confirmed by experimental observations and proved that
"the magnitude of the horizontal force is proportional to the moment arm of the
vertical couple of a given body weight irrespective of the body posture or the type
of muscular action put into the effort." This finding was however confined to the
particular conditions studied by Gaughran and Dempster (1956). In their
experiments manual forces were performed in a truly horizontal direction and the
horizontal distance from the point of effective seat contact to the hands was fairly
small in comparison to the vertical distance from the point of seat contact to the
hands.
As shown by Pheasant (1977) and discussed below, the above statement by
Gaughran and Dempster (1956) does not hold true under the majority of conditions
of manual exertion.
A similar observation to that of Gaughran and Dempster (1956) was found
for lifting actions by Whitney (1957), who concluded that the maximum steady
lifting force which man can exert is largely determined by the magnitude of the
54

counterbalancing couple available during the lifting effort. This he points out, is
directly proportional to body weight and to the effective moment arm of the centre
of gravity of the body in the posture adopted. However, when the position of the
foot pivot approaches coincidence with the axis of the lift, Whitney comments that
"the maximum lift force is limited entirely by the muscular capacity for body
extension”. In this latter case the strength of exertion could not be reliably
predicted from theoretical considerations based purely on mechanical principles.
Whitney’s observations were later confirmed by Pheasant (1977) who
introduced the concepts of a ”live" and "dead" axis in the biomechanical theory of
whole body exertions. These concepts are best explained by example.
Let us consider the static equilibrium of the man represented in free body
diagram form in Figure 2.6. If moments are taken about the centre of foot
pressure (F), the Equation of Static Exertion (ESE) may be expressed as:
LIFTAV = (h/b).PUSH/W - (a/b) - (TWIST/b.W)
The above equation can be presented graphically as a straight line EE' with
the slope h/b (see Fig 2.6). This line intercepts the base of the graph in Fig 2.6
(i.e., when LIFTAV = -1) at a distance equal to the horizontal displacement of the
centre of gravity expressed as a fraction of handle height. By definition the slope
of the line EE’ is the same as that of a line connecting the point of action of the
force at the hands H, to the centre of foot pressure F.
If the man exerts a maximal force (for example in the direction OP), which
is not limited by any physiological or frictional constraints and does not
compromise postural stability, the head of the resultant force vector will lie
somewhere along the line EE'. The component of the force vector OP resolved in
the same direction as the ESE (i.e., vector DP) represents the live axis
component. The component vector OD acting perpendicular to the ESE is known
as the dead axis component.
55

o
Ll_
slope h/b
(a-b)/h
Figure 2.6: Left: A Freebody diagram illustrating the quantities which appear in the Equation of Static Exertion (ESE). Right: The ESE plotted as line EE’ on the PSD. The vectors OD and DP depict the components of the resultant force vector OP along the dead axis and live axis respectively. See text for further details. From Grieve & Pheasant (1981a), and reproduced with kind permission of the primary author.
\ 56

Pheasant (1977) showed that the magnitude and sign of forces acting along
the live axis were indeterminate by the application of statics, and wholly dependant
on the muscular effort applied by the individual. In comparison, forces acting
along the dead axis could be predicted entirely on the basis of statics and were
completely specified by the weight and distribution of mass of the body."
These theoretical based statements were subsequently verified from
experimental observations on two-handed maximal static lifting and pulling
exertions, with various placements of the hands and feet. It was found that on
average, 80% of the variance in force was accounted for by the weight and height
of the subjects when strength measurements were close to the dead axis (i.e.,
during horizontal pulling), but only 48% when they were close to the live axis
(i.e., during vertical lifting) (Pheasant 1977).
In 1979 Grieve introduced a graphical medium called the Postural Stability
Diagram (PSD) for presenting co-planar forces exerted at the hands or the feet
during static exertions. The PSD is essentially a plot of the vertical components of
static manual forces against the horizontal components. Forces on the PSD may be
expressed as fractions of body weight as shown on the scales in Figure 2.7 or in
absolute units. The nomenclature referred to in Figure 2.7 correspond to that
defined in section 1.4.
The PSD provides a useful means for discussing 'personal statements'
(concerning human strength, body weight and the mobility of the centre of gravity
(see Grieve 1979a)) as well as 'environmental statements' (concerning task
demands and the frictional quality of the floor (see Grieve 1979b)) on the static
exertion of forces. An example of how personal constraints may be presented on
the PSD is shown in Figure 2.6.
57

\o>\
\
\
\
\\\\
i
*o\ H-
i /«*> /
5<NI
+W-H -
-W
£i
,-wl+w
8 — A— C -K■F—0 — R— W—A— R— D
/<o
// '
. //
</
<
/
/
// N*
PSDPOSTURALSTABILITYDIAGRAM
Figure 2.7: The Postural Stability Diagram on which static forces at the hands (zero at the centre) and feet (zero at centre base) are represented. The scale, around the periphery refers to the apparent coefficient of friction (see text for further details). From Grieve 1979b and reproduced with kind permission of the author.
58

Since forces at the feet are represented on the PSD it is possible to present
isodynes of the limiting coefficient of static friction, /x, on the same diagram (see
Figure 2.7). In order to avoid slip during static exertions the maximal tangential
force at the feet must be less than the product of the normal force and the limiting
coefficient of static friction. If this is applied to the PSD we get;
H o r z n t l f o r c e co m p n t / „ / n ^ Wt_ Wrrh1. . V e r t l f o r c e c o m p n t \€ PULL/PUSH d i r c t n ' \ a o a y w g n z e LIFT/PUSH d i r c t n }
According to the sign conventions defined in the introduction, lifting
exertions will contribute positive vertical force components, and presses negative
ones. Normal forces at the foot/floor interface will therefore be greater than body
weight for lifting exertions but less than body weight for pressing exertions.
When exertions are performed on a sloping ground both the vertical and
horizontal force vectors at the feet will contribute component forces tangential
and normal to the surface. Under these conditions an apparent coefficient of
friction, /x’, may be calculated using the equation
/*’ = ( j x - tan0)/(l + tan0)where
0 = The angle of slope of the ground from the horizontal
The derivation of the above equation is provided in Grieve (1979b) and
demonstrates that when pushing exertions are performed on a gradient, the
apparent coefficient of friction is dependent on both the angle of slope of the
ground as well as the coefficient of static friction. In the case of pulling exertions,
the signs of tan0 in the above equation are reversed. Thus, in the general case
when exertions are performed on sloping ground, the horizontal force component
must be less than the product of /x’ and the vertical force component in order to
prevent slip. If exertions are performed on level ground (i.e 0 = 0) the coefficient
59

of limiting static friction, p, and the apparent coefficient of friction, /*’, are by
definition equivalent.
The apparent coefficients of friction may be represented as a series of lines
on the PSD passing through the centre base. These lines are illustrated by the scale
around the periphery of the PSD in Figure 2.7, and provide a useful framework to
assess environmental statements on the static exertion of forces.
Both environmental and personal statements on the static exertion of forces
have been explored by Grieve and co-workers and reported in a number of
publications (Grieve & Pheasant 1981, 1982; Pheasant & Grieve 1981; Pheasant et
al., 1982; Grieve 1983). Some of the variables investigated in these studies
include the influence of posture (foot and hand placement), confined work spaces,
and friction requirements on the ability to exert manual static forces. All these
factors along with sex and the direction of exertion have been shown to be
important determinates of whole body strength.
Some of the early observations of Gaughran and Dempster (1956),
Dempster (1958) and Whitney (1957) were subsequently confirmed by these
studies. Pheasant and Grieve (1981) did however, suggest that the contribution of
purely mechanical factors to the personal statement of whole body strength had, in
the past, been assigned undue importance. These authors provided evidence to
show that the "centres of foot pressure were rarely located at the posterior limits
of a subject’s anatomical footbase" during whole body static exertions. This
finding indicted that there was only a small number of directions of exertion in
which strength was limited by the distribution of body weight and the extent of the
foot base.
In most of the above studies foot placement has been formally defined in
order to elucidate the underlying mechanisms of whole body exertion. These
restrictions are however, artificial when one considers the real life situation in
which workers have the freedom to choose their own foot placements. The only
60
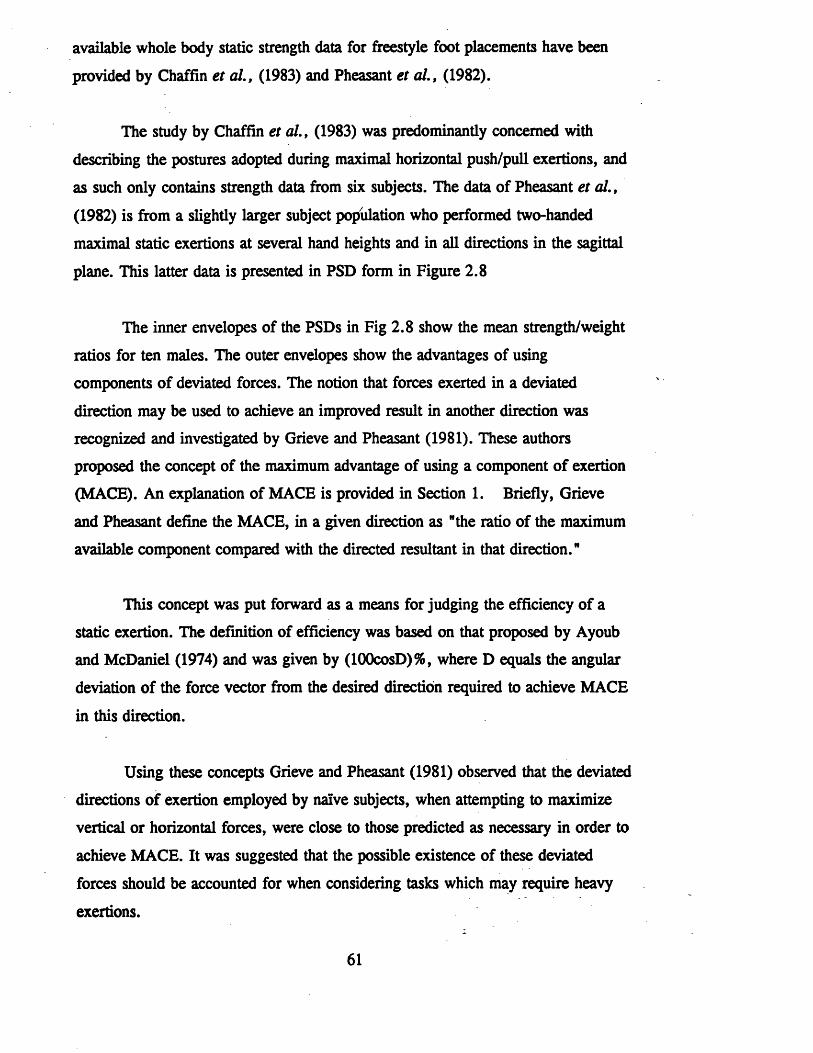
available whole body static strength data for freestyle foot placements have been
provided by Chaffin et al., (1983) and Pheasant et al., (1982).
The study by Chaffin et al., (1983) was predominantly concerned with
describing the postures adopted during maximal horizontal push/pull exertions, and
as such only contains strength data from six subjects. The data of Pheasant et al.,
(1982) is from a slightly larger subject population who performed two-handed
maximal static exertions at several hand heights and in all directions in the sagittal
plane. This latter data is presented in PSD form in Figure 2.8
The inner envelopes of the PSDs in Fig 2.8 show the mean strength/weight
ratios for ten males. The outer envelopes show the advantages of using
components of deviated forces. The notion that forces exerted in a deviated
direction may be used to achieve an improved result in another direction was
recognized and investigated by Grieve and Pheasant (1981). These authors
proposed the concept of the maximum advantage of using a component of exertion
(MACE). An explanation of MACE is provided in Section 1. Briefly, Grieve
and Pheasant define the MACE, in a given direction as "the ratio of the maximum
available component compared with the directed resultant in that direction.”
This concept was put forward as a means for judging the efficiency of a
static exertion. The definition of efficiency was based on that proposed by Ayoub
and McDaniel (1974) and was given by (100cosD)%, where D equals the angular
deviation of the force vector from the desired direction required to achieve MACE
in this direction.
Using these concepts Grieve and Pheasant (1981) observed that the deviated
directions of exertion employed by naive subjects, when attempting to maximize
vertical or horizontal forces, were close to those predicted as necessary in order to
achieve MACE. It was suggested that the possible existence of these deviated
forces should be accounted for when considering tasks which may require heavy
exertions.
61

ISHPULL
UJ
B=0-25
Figure 2.8: PSD data for static exertions performed at five handle heights with freestyle foot placement. The inner envelopes represent mean strength/weight ratios for ten males and the outer envelopes the advantages of using components of deviated forces (see text for further details). From Grieve & Pheasant (1981b) and reproduced with kind permission of the primary author.
62

A noticeable omission in the literature is the absence of strength data on
one-handed exertions suitable for PSD analysis. One of the aims of the current
thesis was therefore to rectify this oversight. The importance of considering these
type of exertions has been attested to in the introduction. If maximal one-handed
strength data is available in PSD format it may provide a starting point for
estimating the effects of environmental factors on these type of exertions.
63

Dynamic Measures of Whole body Strength
Methods and Techniques for Dynamic Strength Assessment
The need for regulations governing safe limits for manual materials
handling have incited a plethora of research into human strength capabilities. As
discussed above, much of the early research concentrated chiefly on static
measures of strength as a means of predicting and assessing human strength for
activities in the work place. However, more recent studies have revealed static
strength tests to be poor determiners of dynamic performance (Garg et al., 1980;
Kamon et a l , 1982; Marras 1982; McDaniel et a l , 1983; Kroemer 1983;
Aghazadeh & Ayoub 1985).
Since most manual materials handling tasks consist of dynamic rather than
static efforts, many researchers now believe that strength prediction based on
dynamic strength measures may hold a more fruitful future than a static approach
(Mital et al., 1986; Aghazadeh & Ayoub 1985). Consequently, in the last 10
years there has been a shift to dynamic strength evaluation, with reports in the
literature citing a variety of strength testing devices and methodological
techniques. The majority of studies concerned with whole body strength have
again predominantly concentrated on lifting activities.
In the United States the ’Mini-Gym’ has tended to be the instrument of
choice for measuring dynamic lifting strength (Kamon et al., 1982; Pytel &
Kamon 1981; Mital & Vinayagamoorhty 1984; Mital et a l , 1986; Karwowski &
Mital 1986; Karwowski & Pongpatanasuegsa 1988). An adapted version of the
CYBEX (Aghazadeh & Ayoub 1985) as well as other commercial devices (e.g. the
Ariel Computerized Exercise System Multi-Functional Unit (ACE) (Jacobs & Pope
1986; Jacobs et a l , 1988)) have also been used to assess dynamic lifting strength.
Apart from the Mini-Gym, the majority of isokinetic strength testing
devices have been expensive and restricted to laboratory use. This has prompted
development of an alternative procedure for dynamic strength testing based on an
64

isoinertial technique (Kroemer 1983; Dales et al., 1986; Jacobs et al., 1988;
Mayer et al., 1988).
Isoinertial measures of strength usually require the subject to lift a
predetermined mass to a given height. If lifted successfully, the amount of this
mass is increased in stages to the maximum that the individual can lift. This type
of dynamic strength test has been found to be cheap, reliable and easily applied
both in a laboratory and an occupational setting (Kroemer 1983; Dales et al.,
1986; Jacobs et al., 1988).
A variation of this latter protocol has been used to describe the maximum
acceptable strength of whole body actions (e.g. Snook 1978; Ayoub et al., 1979;
Jiang & Ayoub 1987). Measures of maximum acceptable strength, however, are
based on psychophysical criteria and are more concerned with capacity rather than
the strength of whole body exertions.
The capacity of whole body exertions is usually assessed by asking the
individual to gauge the maximum load he/she is willing to handle repetitively at a
given rate over a specified time frame. As this measure digresses from the
definition of strength previously described, only those papers which conform to the
definitions of strength in Chapter 1 will be reviewed.
Apart from isokinetic and isoinertial measures of strength, a limited
number of studies have also assessed dynamic strength using testing apparatus
designed to operate at a preset resistance (Ainscough-Potts 1984; Grieve 1984;
Grieve & van der Linden 1986; Hortobagyi et al., 1989). As there is no currently
accepted terminology to describe the strength measures derived using this type of
apparatus, it is proposed that these type of strength measures be termed
ISORESISTIVE4.
4 See Chapter 1 for a definition of isoresistive strength.
65

Isoresistive strength testing devices differ fundamentally from isokinetic
dynamometry in that the speed of movement is not controlled but effort dependant.
When operated upon, the resistance to motion is usually provided by a viscous
fluid which is constrained to pass through an opening of given cross section.
Different resistance settings may be obtained by altering the effective cross
sectional area through which the viscous fluid must pass. Under very high
resistances the velocity of movement capable against these devices may be so
constrained as to approach that of isokinetic conditions.
Unlike isoinertial strength measures, which provide only a single value of
maximum dynamic strength based on a pass/fail basis, most computerized
isoresistive dynamometers provide a profile of both the velocity and force of
exertion over the entire movement range.
In addition, isoresistive devices may offer an advantage over isokinetic
devices when assessing dynamic strength at high velocities. Although designed to
operate at a preset constant velocity the reliability of isokinetic devices during the
initial acceleration phase and at high speeds are of question. This has been shown
to be particularly the case for the Mini-Gym.
Described in detail by Mital and Vinayagamoorty (1984) the authors
skilfully avoid quoting the measurement reliability of this device. In the hands of
other authors however, the speed of motion during a dynamic strength test on the
Mini-Gym has been shown to vary by as much as 20% from a preset velocity of
0.75 m/s (Pytel & Kamon 1981).
At fast velocities the reliability and accuracy of force measurement from
isokinetic devices will depend on the subject being able to reach the preset
velocity. Due to the initial acceleration phase the amount of force data for a
particular movement profile will diminish as the preset testing velocity is
increased. In comparison, isoresistive devices provide an accurate measure of both
force and velocity throughout the entire movement profile irrespective of the speed
66

of motion. Other advantages and disadvantages of the various dynamic measures
of strength are summarised in Table 2.4.
67

Table 2.4:Advantages and Disadvantages of various approaches to dynamic strength
assessment.
STRENGTH TEST ADVANTAGES DISADVANTAGES
Isokinetic e.g. Biodex,
Cybex, Mini Gym
* Can stop in mid test* Relatively safe* Max force obtained over
whole range of movement* Good correlations with
operational tasks
* Few tasks in real life are isokinetic
* Not good for measuring forces of fast velocity movements
* Most measuring devices expensive
Isoinertial e.g. Progressive Lifting Test, Maximum Acceptable lift, Inertial Flywheel
* Directly related to real life tasks
* Easy to administer* Can be used as a field
test* Inexpensive apparatus
* Performance influenced by fatigue, technique and skill
* Strength determined on the basis of pass/fail criteria
* Could be dangerous if weight dropped
Isoresistivee.g.Hydrodynamometer Omnitron hydrolic Dynamometer
* Can stop in mid test* Relatively safe to conduct* Large range of velocities
can be tested reliably* Records both force and
velocity over whole range of movement
* Has yet to be validated against other strength tests
* Novel type of resistance to motion
68

Isoresistive Measures of Whole Body Strength
There has been virtually no published literature citing isoresistive strength
capabilities of whole body exertions. The only references of which the present
author is aware, are by Grieve (1984) and Garg et al., (1988).
In the study by Grieve (1984) a device similar to the one described in
Chapter 6 was used to measure the power output of nine male subjects performing
braced standing pulls at 1.0 meter above the ground. A mean peak power output
of 500 Watts was observed when the hand velocity and force output reached 2.5
m/s and 230 N respectively.
Analysis of the force, speed and power output of seated horizontal pulls in
a subsequent study by Grieve and van der Linden (1986) revealed a peak power
output of 220 Watts under optimum conditions. Although based on a different
subject population to that in the 1984 study, both studies showed that peak power
output for these type of dynamic actions was obtained against a resistance of 50 kg
nr1.
The study by Garg et al., (1988) measured the isoresistive strength of
standing one-handed pulling actions using a Biokinetic ergometer. Unlike the
apparatus used by Grieve and van der Linden (1986), the accommodating
resistance was provided by an electromagnetic dynamometer operating in a quasi
velocity regulated mode (Garg et al., 1988). During operation of the device,
velocity changed in proportion to the magnitude of the applied force according to
the regulation constant of the generator..
Pulling exertions on the Biokinetic ergometer were performed in various
postures and in unspecified directions by 50 male and 49 female subjects. Peak
and average isoresisitive strengths were approximately 300 N and 160 N, and 195
N and 100 N for males and females respectively. These values were 55% and
34% of the peak and average static pulling strengths. Average velocities ranged
69

between 1.37 m/s and 1.45 m/s for the males and 1.25 m/s and 1.32 m/s for the
females.
Using the peak isoresistive strength and upper range of the average velocity
of the males in Garg et al’s., study and comparing it with the data of Grieve
(1984), we find that the power outputs (435 Watts and 500 Watts) are comparable
between the two studies. Both of these studies provided practical applications for
their data.
Grieve (1984) illustrates the ergonomic value of his methodology by
showing how the results may be used to provide an assessment of the match
between the dynamic strength of the user and that required to start outboard
motors. In a similar manner Garg et al., (1988) designed their methodology to
determine the best match between location of the starter handle for lawn mowersof
and the dynamic strength the user.
In comparison to the studies on isoresistive pulling strength the present
author is unaware of any published literature describing isoresistive lifting
strengths. Although, the direction of force application in the study of Garg et al.,
(1988) may have significantly deviated from the horizontal in some of the
conditions, isoresistive strength data for lifting actions may have a wider
application to activities in the work place.
Unpublished work by Ainscough-Potts (1984) has indicated that power
outputs of over 1,000 Watts may be achieved during dynamic lifting. In these
exertions lifting velocity approached 1.0 m/s and force output 1.5 KN. Force-
velocity data collected in the laboratory was compared with that obtained from
cine film of industrial workers lifting a box of 15.5 kg. This comparison indicated
that the subjects in industry were, at certain stages in the lift, very close to their
maximum capacity. Unfortunately the study was limited in that the laboratory
experiment utilized only four subjects and had to be discontinued when one of the
subjects sustained a back injury during one of the trials.
70

A study investigating the isoresistive strength of the lifting action in a
larger subject population, and including both males and females, may provide
valuable data on dynamic strength profiles throughout the lifting range.
Furthermore, as the velocity of movement is effort dependent rather than fixed
these dynamic strength data may be more applicable to conditions in the working
environment than isokinetic strength measures. Consequently, one of the objectives
of this thesis was to provide an indication of the isoresistive strength capabilities of
a healthy adult population performing maximal lifting exertions at mean velocities
commonly observed in the industrial environment.
71

Relationships Amongst Dynamic and Static Measures of Strength
One of the important issues of strength assessment is whether strength
measured under one set of conditions (e.g. static) is significantly related to
strength obtained under a different set of conditions (e.g. dynamic). It is
commonly assumed that strength is a general physiological capacity and that all
strength tests measure a similar phenomenon (Knapik et al., 1983).
If there is such a thing as a general strength component, then individuals
who perform well (or poorly) should achieve the same relative level of
performance, independent of test mode or type of strength being evaluated
(Hortobagyi et al., 1989).
Clearly absolute values of force output for a given muscle/movement action
differ dependant on the type of strength measurement involved. Variation in
neurophysiological, biomechanical and metabolic factors between dynamic and
static exertion will no doubt contribute to these absolute strength differences
(Asmussen 1981).
However, evidence for a general strength component would be suggested if
strong relationships exist between isometric, isokinetic, isoinertial and isoresistive
measures of strength. Given that these various measures of strength are performed
on the same muscle groups and the same subject population, intercorrelations that
exceed r = 0.71 would indicate a greater proportion of generality than specificity
between the different strength measures (Clarke & Clarke 1970)
In other words, if the proportion of common variance in force output on
two strength tests exceeds 50% (i.e. r2 X 100 = 50%) then it can be said that the
two methods of strength testing assess a similar component of performance. On
the other hand, if r2 X 100 < 50% then the measures of strength obtained are
more specific to the type of strength test used.
72

Evidence of a general strength component between different methods of
strength testing has been somewhat equivocal. Some investigators have reported
correlations of r=0.74 to r=0.99 between various measures of strength, thus
supporting the concept of generality (Rasch 1957; Rasch & Pierson 1960;
Asmussen et ah, 1965; Carlson 1970; Otis 1976; Otis et al., 1981; Knapik &
Ramos 1980), while others have reported correlations less than r=0.71 (Clarke
1960; Clarke & Henry 1961; Henry & Whitley 1960; Smith 1961; Rasch &
Pierson 1963; Olson et ah, 1972; Ostemig et ah, 1977) suggesting that
performance on the different strength tests show a greater level of specificity than
generality.
However, in some of the above studies, which found poor relationships
among the different strength tests, correlations were performed between strength
and speed of movement rather than maximum voluntary strength. In addition,
many of these studies compared strength measures in different postures and
through different ranges of motion on the different strength tests.
Using more controlled methodological procedures, Knapik et al., (1983)
compared torque measurement at three isokinetic speeds with isometric and
isoinertial strengths of knee and elbow extension and flexion at comparable joint
angles. Their results showed an average common variance of 72%, 62%, 53% and
48% among (1) the 3 isokinetic modes, (2) the 3 isokinetic and isometric modes,
(3) the 3 isokinetic and isoinertial modes, and (4) the isoinertial and isometric
modes respectively.
It was also found that as either the isokinetic velocities or joint angles
became more widely separated the magnitude of the intercorrelations decreased.
The lower correlations observed between strength at the higher isokinetic velocities
and performance on the other strength tests may have been the consequence of the
subjects not having had time to reach the maximum force possible at high
movement velocities.
73

More recently, Hortobagyi et al., (1989) investigated the interrelationships
amongst various measures of bench press strength. In this study comparisons were
made between a free weight supine bench press (1 repetition maximum), the peak
force during a maximum isokinetic supine bench press (at a test velocity of 0.013
m/s), and the peak torque during a seated bench press performed on an isoresistive
hydraulic dynamometer at two test resistances (average linear movement velocity
0.37 m/s (slow) and 1.26 m/s (fast)).
The average correlation between these four bench press tests was r=0.84,
which was reduced to 0.78 when the influence of body weight was factored out
using the technique of partial correlations. These results, along with those of
Knapik et al’s (1983), provide evidence to suggest that different types of strength
test measure a common or general strength component.
The above studies however have only investigated either single joint or two
joint actions. The few studies comparing the generality versus specificity of whole
body dynamic and static measures have been reported in the occupational
physiology and ergonomics literature.
Using the Mini-Gym, Pytel and Kamon (1981) and Kamon et al., (1982)
found peak isokinetic lifting strength at a velocity of 0.75 m/s to be a good
predictor of the maximum weight that subjects could lift to a shelf height of 1.13
m (r between 0.75 and 0.92). Similarly, Jacobs et al., (1988) reported that the
average isokinetic force, performed on the ACE at velocities ranging from 0.024
m/s to 0.110 m/s, correlated highly with the isoinertial progressive lift test (see
Kroemer 1983) (r=0.97) and an isoinertial operational lifting test (i.e., lifting a
tote box from the floor to a 1.3 m high shelf) (r>0.93).
From the studies reviewed above, it would seem that there is a high degree
of generality between various measures of strength, suggesting an intrinsic
similarity of muscular function across the different testing modes (Hortobagyi et
74

al., 1989). This is especially noticeable between the different measures of dynamic
lifting strength.
However, there is evidence to suggest that the relationship between static
and dynamic measures of strength is lower than that between the different dynamic
strength measures. This conclusion is somewhat confounded by the fact that some
studies have failed to ensure that the isokinetic and isometric strength measures
were determined at comparable points in the range of motion or at similar joint
angles. Furthermore, the unreliability of some isokinetic devices at high velocities
may have contributed to the lower correlations.
In the light of this, there seems to be a clear need to reassess the
relationship between dynamic and static measures of strength taking the above
points into account. It is particularly important to assess the relationship between
whole body dynamic and static exertions, as the data has significant implications
for the applicability of static models of human strength to the world involving
dynamic exertions. Chapter 6 investigates this issue by comparing isometric with
dynamic lifting strength against various resistive loads on an isoresistive strength
testing device. The study also serves to fill the gap in the literature concerning the
comparison of performance on isoresistive devices with that obtained from other
dynamic and static measures of whole body strength.
75

The Subject-Environmental Interface and Manual Exertions
One of the most prominent factors that will influence the ability of a person
to transmit forces to the external environment, is the nature of the interface
between the person and the outside world. A brief discussion on the interactions of
manual force, body weight and friction at the foot-floor interface is provided
above. These interactions were further explored by Grieve (1983) who extended
the concepts of the PSD and developed the ’Slip Chart’ shown in Figure 2.9.
The dotted lines on the ’Slip Chart’ provide an example of how the chart
may be used to assess the minimal coefficient of static friction ( f t j required to
prevent slip for an individual of given body weight (i.e., a woman of 95th
percentile weight (690 N)) exerting a known manual force (300 N) in a particular
direction (45* in the PUSH-PRESS sector). In this example = 0.47 is found
by comparing the slope of the line which intercepts the Y axis at a value
equivalent to the person’s body weight, with the slopes of the radiating set of lines
in the upper comers of the chart (Grieve 1983). The valije for the minimum
coefficient of friction shown for these radiating lines is given by the reciprocal of
their slopes.
Once Unn for a specific task is known, the risk of slipping may be assessed
by comparing this value with frictional conditions expected in the workplace.
Specific data on the coefficients of friction for a large variety of floor-Sho*
combinations have been provided by Kroemer (1974).
The other point of contact between a person and the outside world is
usually at the hands. During everyday tasks, both at work and home, an individual
may be required to manipulate or carry heavy loads manually. The ability to
perform these tasks effectively and safely may often depend on the quality of the
interface between the hand and the external object.
76

S L I P CHART 1 S.I. UNITSt
/PU S HPULL
Example I VWoman. 95%ile body weight exertsapush & press of300N at 15* Requires p min=0C7
BODY WEIGHTS
P R E S S1 0 0 pound force*4A5N: 100 k i log ram force=981N
Figure 2.9: The ’Slip Chart’ proposed by Grieve (1983) for exploring the interaction between manual forces, body weight and the minimum coefficient of friction required to prevent slip during static exertions. The dashed lines refer to the example described in the text. Reproduced with kind permission of the author.
77

The importance of the hand/object interface as a major factor in industrial
handling accidents, was known by the Ministry of Labour in Great Britain as long
ago as 1946. Out of 2,000 reported handling accidents, for the first two weeks in
December 1946, over one quarter were due to loads which were dropped or
allowed to slip from the hands (Brown 1972). While the nature of the hand/object
interface may not have been the principal cause of these accidents, it seems
reasonable to argue that the ability of the individual to transmit forces from his (or
her) musculoskeletal system to the load, must have been a major contributory
factor in many cases.
The conditions at the hand-object interface which will determine the
effectiveness of the coupling include:
(1) The type of grip adopted (Pheasant 1977).
(2) The object shape, size and surface texture (Pheasant & O’Neill
1975; Drury 1980; Cochran & Riley 1986).
(3) The presence or absence of gloves (Riley et a l , 1985).
The different types of handgripping postures which may be adopted have
been classified by several authors (Taylor and Schwartz 1955, Napier 1956,
Roebuck et al.t 1975). The simplest classification is that described by Napier
(1956) in which gripping actions are subdivided into three types:
(1) A power grip in which the object is clamped between the partly flexed digits
and palm.
(2) A hook grip in which the fingers are flexed around the object and the thumb is
not used for gripping.
(3) A precision grip in which the object is pinched between the flexor aspect of
the fingers and opposing thumb.
78

For ergonomic purposes however, Grieve and Pheasant (1982) found this
classification inadequate. These authors have presented an alternative classification
in which both hand posture and function is described according to the degree of
hand/object contact and the extent to which the hand is used in a closed or open
chain configuration.
Often, in manual materials handling, there is a conflict between the design
of the handle and the type of grip required to perform a desired function (i.e.,
whether to move, steady or control the particular object).
Drury (1985) reports that in one survey of manufacturers of handles for
luggage and portable equipment, the main factors in handle design considered were
visual appearance and cost. Furthermore, Woodson (1981) noted that off the shelf
handles tend to be designed as ’decorative appointments’ and often have
insufficient hand clearance, sharp cutting edges and too small a handle diameter.
For most heavy manual work, handles, handholds and gripping aids on
various containers force the worker to adopt a hook or a power grip (Drury 1985).
While the power grip permits large gripping forces to be used it may not be the
most efficient form of grip for fme control of the container. In addition, force
output and manipulation of a load using hook or power grips may be restricted
under certain conditions (e.g. when the wrist posture adopted is constrained by the
design of the handle or handholds of the container and results in excessive stress
on the wrist joint) (Hazelton et a l , 1975).
The majority of studies that have investigated hand-handle design, and the
maximum torques or forces which may be applied to a handle, have permitted
power grips to be employed. Less data is available in the literature comparing the
strength of exertions on commercial type handles (that demand gripping actions
other than the power grip) with forces capable when the handgrip is optimal. In
summarising the data presented by Drury (1985), it is suggested that for tasks
79

requiring maximal pull/push forces a cylindrical handle of between 31 and 44 mm
in diameter is about optimum.
Chapter 3 of this thesis investigates the effects of several different handle
designs and the corresponding gripping actions on them on the ability to exert
horizontal pulling forces. In addition, the experimental work aims to illustrate the
interaction of handle placement and handle effectiveness on these type of manual
exertions.
80
Sex Differences in Strength
In the last few decades, the introduction of the Equal Employment
Opportunities Act, has meant that more women have been entering vocations
traditionally occupied by males. Particularly in North America, physically
demanding vocations such as law enforcement, Ere fighting and the military have
seen an increasing proportion of the workforce occupied by female personnel
(Bishop et a l , 1987). The ability to perform some of these jobs effectively often
requires substantial physical strength. Consequently, there has been considerable
interest in the nature and extent of the sex difference in strength.
Table 2.5 summarises the findings of some of the more recent studies that
have appeared in the literature concerning sex differences in strength. The
differences in strength between males and females in this Table are given as the
ratio of the mean female strength over the mean male strength expressed as a
percentage. Except where indicated all the ratios were calculated from absolute
strength measures. It is seen that the ratio of the means can range from 29% to
almost 100%, dependent on the subject populations compared, the muscle groups
tested and the type of strength test performed.
Several studies have shown that larger sex differences in strength are
observed for the upper body compared to the lower body (Laubach 1976; Pheasant
1983). In addition, whole body strength tests performed up to approximately
knuckle height tend to show smaller sex differences in strength than those tests
performed beyond knuckle height. This latter finding presumably reflects theu
predominant action of the upper body musclature during lifting exertions above
knuckle height.
Some of the sex differences in strength have been attributed to, (1) genetic
differences in muscle mass and/or neuromuscular function (ability to recruit,
stimulate, and synchronize motor units), (2) culturally linked behavioral
differences in the amount of participation in strength developing activities at work
81

or during recreation, and, (3) experience in producing maximal voluntary efforts
or the motivation to perform (Bishop et al., 1987).
The variability in sex differences in strength is however confounded by
sampling differences in the male and female subject population compared. Several
studies comparing males and females of similar physical activity backgrounds and
levels of training have shown that the sex difference in strength can almost entirely
be accounted for by the difference in muscle size (Falkel et a l , 1985; Bishop et
al., 1987). This evidence supports the findings of Ikai & Fukunaga (1968), Davies
et al., (1983) and Schantz et al., (1983) who showed that the strength per unit
cross-sectional area is not significantly different in males and females, thus
suggesting that sex differences in strength can be entirely attributed to differences
in muscle cross-sectional area.
Consequently, when male and female strength measures are normalised by
dividing by either the muscle cross section, fat-free weight or total body weight,
sex differences in strength become much less marked. Wilmore (1974) found that
when absolute strength differences between genders were expressed relative to
body weight or lean body weight, the women's lower extremity strength was equal
to or exceeded that of the men. Sanchez (1991) also found that when vertical
lifting strength was expressed as a fraction of body weight and the lifting exertions
performed at heights and reaches corresponding to given percentages of stature,
there was no significant difference in lifting strength between males and females.
In this latter study the mean female/male ratio for normalized strength was 0.93.
Although normalisation of the data shows that men and women of
equivalent size, shape and body composition have similar strengths, a certain
amount of variability in strength between genders still exists (see Falkel et al.,
1985). This variability is likely to reflect differences between the male and female
population in the level of training of the specific muscle group tested, and in
differences in their skill and motivation when performing the strength tests.
82

The evidence presented above clearly indicates that the commonly held
view that women are two thirds as strong as men is of little practical significance.
Task designers who use biomechanical models of human strength, or strength data
derived from male populations to predict female strength should therefore be very
wary of making simplistic assumptions about sex differences in strength.
83

Table 2.5:Sex Differences in Strength Reported in the Literature
SOURCE STRENGTH MEASURE
MEANFEMALElMALESTRENGTHRATIO(%)
RANGE
Martin & Chaffin (1972) Based on data derived from the 2D Static Strength Prediction Model
Vertical isometric lifting strength at 3 heights above the ground and at 3 foot placements
33 29 -4 1
Laubach (1976) Based on data from 9 studies reporting both dynamic and static strength
Strength of Lower Extremities 72 5 7 - 8 6
Strength of Upper Extremities 56 3 5 -7 9
Trunk Strength 64 3 7 - 7 0
Dynamic Whole Body Strength 69 5 9 - 8 4
Total Body Strength (mean of above measures)
64 3 5 - 8 6
Pheasant (1977) Two-handed static horizontal pulling exertions at 3 grasp heights and 2 foot placements
71 69-73
Two-handed static horizontal pulling exertions at 3 grasp heights with freestyle foot placement
67, 6 2 - 7 0
Two-handed static vertical lifting exertions at 0.5 m grasp height and 3 foot placements
67 61 -71
Yates et al. , (1980)
Vertical isometric lifting strength at same 3 grasp heights and foot placements as for Martin & Chaffin (1972)
40 30 -5 3
84

Pheasant & Grieve (1981)
Two-handed static exertions performed in all directions in the sagittal plane at 3 bar heights and 2 foot placements
Absolute strength 74 6 0 -9 5
Strength/body weight 86 SD 10
Pytel & Kamon (1981)
Max weight lifted to a 1.13 m shelf
46
Peak isokinetic lift force using mini-gym at 0.73 m/s
63
As above but with a lifting velocity of 0.97 m/s
65
Kroemer (1983) Isoinertial lift test to overhead height
47
Isoinertial lift test to knuckle height
79
McDaniel et al (1983)
Isoinertial lift test to 6 feet 50
Isoinertial lift test to elbow height
52
Pheasant (1983) Data based on a selection of 112 data sets
Lower limb strength (including action of thrusting on a peddle)
66 50 -81
Standing Push/Pull/Lifting exertions
65 3 8 - 9 0
Trunk Strength 62 3 7 - 6 8
Upper limb strength (including grip strength)
58 4 4 - 8 6
Miscellaneous 53 4 3 - 6 1
All tests 61 3 7 - 9 0
Falkel et al., (1985)
Mean absolute and normalised (strength /lean body mass (in brackets)) isokinetic torque at 307s for:
Elbow extension 63 (80)
Elbow flexion 56 (77)
Knee extension 66(91)
85

Knee flexion 68 (95)
Mital &Sanghavi(1986)
Peak isometric torque capability on various hand tools exerted in a variety of postures
66 59 -97
Jacobs et a l, (1988)
Max weight of medical supply box lifted to 1.52 m (Operational Lift Test)
50
Isoinertial progressive lift test to a height of 1.52 m
51
Mean isokinetic lift force at a lift velocity of 0.024 m/s
59
lift velocity 0.073 m/s 55
lift velocity 0.110 m/s 54
Ruhmann &Schmidtke(1989)
Isometric lifting strength at various heights above the ground
30-80
Stevenson et a l , (1990)
Max weight of box lifted to 1.33 m using 3 different lifting techniques
57 52-63
Isoinertial lift test to 1.5 m using 3 different lifting techniques
53 52 -54
Isoinertial lift test to 1.8 m using 3 different lifting techniques
49 47-51
86
Summary Comments on the Review of Literature
In summary, the above literature review emphasizes the multi-faceted
nature involved in the expression of human strength. It is therefore not surprising
that strength measures, even when performed under fairly standardized conditions,
show a large degree of variance between individual subjects. The aim of most
experimental studies is to minimise the variance associated with those factors not
directly relevant to the study, so that the relationships under investigation can be
interpreted with confidence. This may be achieved by careful experimental design
(e.g. randomization of experimental conditions) and by attempting to control
extraneous variables or vary them in a known and systematic manner.
In contrast, although it is recognised that standardized conditions are
required to elucidate the theoretical basis of human strength, often the
experimental constraints severely restrict the use and applicability of the data to
real life conditions. In order for task designers to apply this research to a wide
variety of situations, strength data needs to be collected and presented in a way
that is less bound by the formal conditions of testing and more relevant to a wider
range of circumstances. Throughout the experimental sections of this thesis an
holistic approach to data collection and presentation has been attempted in an
effort to provide this balance.
87

Introduction to Experimental Work
Hypotheses
The specific hypotheses which the experimental work aims to investigate
are outlined below.
1. Handle placement has a significant influence on horizontal pulling strength
when there is a good coupling between the hand and handle, but assumes a
reduced importance in the strength of an exertion when there is a poor coupling
between the hand and handle.
2. Strength differences between males and females and between one and two-
handed exertions vary widely according to direction, height and task resistance
under which whole body exertions are performed.
3. There are many directions of exertion in which the static strength of one-handed
whole body exertions may benefit by employing components of deviated forces (if
the task permits).
4. The proportion of the total variance in one-handed whole body static strength
attributable to body mass is not constant, but is a function of; (a) the direction of
exertion and, (b) the gravitational, musculoskeletal or interfacial factors which
may limit force output under the given test conditions.
5. Through development of appropriate hardware, software and experimental
techniques it is possible to accurately measure and analyze the forces at the hands
and feet during static exertions performed in any direction in the sphere of
exertion.

6. The variation in strength with height above the ground for maximal whole body
lifting exertions is similar under dynamic and static conditions. Lifting strength is
greatest under isometric conditions and declines with decreasing task resistance
and increasing mean lifting velocity.
7. Individuals who perform well (or poorly) achieve the same relative level of
performance independent of the test mode (dynamic or static) and velocity under
which maximal lifting exertions are evaluated.
Hypothesis 1 is tested exclusively in study I and aims to illustrate the
importance of interface limitations on the determination of whole body strength.
Study n was designed to test hypotheses 2, 3, and 4 with the general aim of
describing personal constraints on freestyle one-handed static exertions in the fore
and aft plane. Hypothesis 5 is tested in study m with the objective of developing
the PSD concept from two dimensions into three dimensions. Hypotheses 2, 6 and
7 are tested in the final study (study IV) with the purpose of investigating the
similarity of performance between dynamic lifting strength (as performed under
different resistive loads on a hydrodynamometer) and static lifting strength.
As the latter two studies required extensive instrumentation (involving
development of novel methods and techniques for measurement of human strength)
it was felt necessary to provide a full description and analysis of the strength
testing devices. This analysis provided the necessary back-ground information for
the interpretation of the strength measurements collected using these devices.
89
CHAPTER 3
STUDY I
THE INFLUENCE OF SOME HANDLE DESIGNS ANDHANDLE HEIGHT
ON THE STRENGTH OF THE HORIZONTAL PULLINGACTION
90

Introduction
Although handle placement or height and handle design have been
investigated independently with respect to manual exertion (see literature review)
less is known about their interactions and the conditions in which one of these
particular variables becomes the limiting factor during manual exertions. The
present study investigated the interaction between these two variables during one-
handed maximum pulling exertions.
Methods
Subjects
Sixteen female and 14 male volunteer staff or students of this institute
participated in the study. Their physical characteristics are described in Table 3.1.
Twenty seven subjects were right-hand dominant and three were left-hand
dominant.
Table 3.1:Physical Characteristics of Subject Population
Values are mean plus or minus SD
HaleMean
(n=14)(SD) %ile5
Female (n= Mean (SD)
16)%ile
Total (n=30)
Age (yrs) 30.4 (9.9) 29.7 (6.6) 30.0 (8.2)Weight (kg) 71.3 (8.2) 39 64.2 (9.4) 56 67.5 (9.4)Height (cm) 177.9 (6.4) 71 163.8 (6.7) 67 170.4 (9.6)Grip Strength (N) 465 (88) 330 (44) 393 (96)
5 Percentile values for height and weight were derived from the data of Pheasant (1986) and show how the current subject population compare with anthropometric estimates of British adults aged 19-65 years.
91

Apparatus
The apparatus for measurement of maximum pulling strength consisted of a
modification of the force bar described by Whitney (1957) and Pheasant and
Grieve (1981). Three handles/knobs, of contrasting design (see Figure 3.1) were
mounted on a square piece of wood and secured firmly to the horizontal force bar.
The force bar itself was used as a fourth ’handle’ for comparison with the other
three. Output from foil strain gauges, mounted on vertical and horizontal
cantilevers at the ends of the bar, were first amplified by Medelec AD6 amplifiers
before being passed to the A/D converter of a 64k BBC microcomputer (Acorn
Computers Limited).
Custom designed software, written in BASIC language, sampled and then
plotted both an analogue and digital display of the force/time data permitting peak
horizontal pull forces and mean horizontal pull forces to be determined.
Grip strength was measured using an adjustable handgrip dynamometer
(Takei and Company Ltd). The dynamometer was adjusted to the subject’s own
comfort.
The floor on which the subjects stood was covered with a coarse emery
paper to prevent slipping. Subjects wore their normal everyday footwear in which
they entered the laboratory. The majority wore rubber soled shoes or trainers. The
coefficient of limiting friction between the above surface and rubber-soled shoes
has been previously reported as 0.99 (Pheasant and Grieve 1981). None of the
subjects exhibited problems with slippage throughout the experiment, irrespective
of footwear worn or the extreme postures adopted during exertion.
92

5 cm
1
dl O
figure 3.1: Side views of the four handles used in the study (the front view for handle 1 is also shown). Handles 1 and 2 were cast alloy, handle 3 was made of bakelite and handle 4 was a mild steel bar.
93

Procedure
On entering the laboratory, the subjects’ grip strength, unshod weight and
stature were measured. Grip strength was determined from the best of two efforts
with the dominant hand. Peak and mean maximum horizontal pull strengths were
then collected for the three handle types plus the bar, with the force bar set at a
height of 1.0 and 1.75m above the ground. Half the subjects completed exertions
at the 1.0m bar height first, while the other half completed the 1.75m condition
first. The order of presentation of the different handle types plus the bar was
randomized for both bar heights. Successive exertions were performed following a
minimum rest period of one minute.
Subjects were instructed to exert a steady maximal pull on each handle for
five seconds, in a direction as close to the horizontal plane as possible. Trials in
which the subject clearly ’jerked’ on the handle were repeated.
The type of grip on each handle and the posture adopted during the
exertion were freely chosen, provided that, (1) only the dominant hand was used
on the handle/bar, (2) only the feet made contact with the floor and, (3) the
leading foot was not placed in front of the handle.
Peak horizontal pull forces were determined from the maximal horizontal
force vector of the force/time data during exertions on each handle. Steady
maximal pull strengths were calculated from a 3 second average of the horizontal
force vector time trace in accordance with the suggestions of Caldwell et al.,
(1974) for the measurement of static strength. The reliability of the test procedures
was checked by retesting seven male and 11 female subjects two weeks following
the initial experiment.
94

Analysis
The effects of handle type and bar height on maximum horizontal pulling
strength were determined according to a two-way repeated measures ANOVA
design. Subsequent post hoc analysis was conducted using Tukeys HSD test. All
correlation coefficients were calculated according to the Pearson product-moment
method.
95

Results
The peak and steady maximum pull forces observed on each handle at the
two placement heights are summarized in Table 3.2. Test-retest reliability of the
measurement of peak and steady maximum horizontal pulling forces were found to
be satisfactory (see Table 3.3). The test-retest statistics shown in Table 3.3 were
calculated from average strength values for each subject for all test conditions
combined.
tDifferences in strength values between the first experiment and the retest
were not significant (p>0.05). As steady maximal pulling strength gave a slightly
higher test-retest correlation coefficient than peak pulling strength, this former
measure was used in all subsequent analysis and discussion.
The ratio of female strengths per kg of body weight to male strength per kg
of body weight (normalized f/m strength ratio), combined over all experimental
conditions, was 0.80. When expressed in absolute terms the f/m strength ratio
decreased to 0.72, a value which was almost identical to that found for the f/m
grip strength ratio (0.71). However, when the normalized f/m strength ratio was
determined for the various handles individually, the normalized f/m strength ratio
for handle 3 was found to differ from those on the other handles. Handles 1, 2 and
4 produced identical normalized f/m strength ratios (0.78), whereas, handle 3
exhibited an f/m strength ratio of 0.90.
Since both male and female data demonstrated the same overall pattern of
results, the two data sets were combined for the final analysis. Pulling strength
was significantly affected by both handle type (F=105, df=3,87, p<0.01) and
handle position above the ground (F = 147, d f= l,29, p<0.01). On average pulling
strength was reduced by 37% when the handle height was raised from 1.0m to
1.75m. Analysis of variance, however, detected a significant interaction between
the two independent variables (F=48, df=3,87, p<0.01), indicating that pulling
96

strength on the different handles was not equally affected across all handles by the
change in bar height.
At the bar height of 1.75m, pulling strength was most affected using
handles 1 and 4. Least affected was handle 3 which demonstrated very little
change in horizontal pulling strength at the different bar heights. Performance on
handles 1, 2, 3 and 4 at 1.75m was 45%, 66%, 95% and 47% of the respective
performances at 1.0m. Table 3.4 shows summary statistics for pairwise
comparisons of steady maximal pulling strengths across the different handle types
at both bar heights.
The largest pulling forces were recorded on handles 1 and 4, with the
lowest generated using handle 3. Post hoc analysis showed that pulling strengths
using handle 3 were significantly lower than for handles 1, 2 and 4 at the 1.0m
bar height (p<0.05), but only significantly different from handles 1 and 4 at the
1.75m bar height (p<0.05).
Figure 3.2 shows the 1.75m bar height pulling strength/l.Om bar height
pulling strength ratio (1.75/1.0 m strength ratio) as a function of the average force
data over the two bar heights, for each handle. The data presented in this Figure
reveals that pulling strength tended to be most affected by handle placement when
using handles which permitted the largest pulling forces to be exerted.
97

l„75n1.0nStrengthRatio(X)
100
90
80
70 H
60
50 -J
HANDLE 3
HANDLE 2
HANDLE 4
Hf
HANDLE 1
95 135 175 215 245Mean pull force over the two bar heights (N)
Figure 3.2: 1.75m/1.0m pulling strength ratios for each handle, as a function of their respective average values of pulling strength over the two conditions of handle placement (1.0m and 1.75m).
98

Tabl
e 3.
2:Pe
ak
and
stead
y m
axim
al ho
rizon
tal
pullin
g str
engt
hs
on 4
diffe
rent
han
dle
desig
ns
at 2
diffe
rent
heig
hts
from
the
grou
nd
(valu
es
are
mea
ns ±
SD)

Table 3.3:Test-retest reliability of peak and steady maximal strength values for horizontal
pulling on a variety of handle types placed at two different levels from the floor.
Peak Pulling Strength
Steady MaximalStrength
n 18 18Test Mean (SD) (N) 199 (45) 170 (39)Retest Mean (SO) (N) 202 (47) 178 (45)
t 0.52 (NS) 1.72(NS)
r 0.88 0.91
p = significance level NS = Not Significant (p>0.05) n = number of subjects t = Student’s t-test valuer = Pearsons product-moment correlation coefficient
Table 3.4:Summary statistics for Tukeys HSD post-hoc analysis of steady maximum pulling
strength on 4 different handle types placed 1.0m and 1.75m from the floor
Bar Height lm Bar HeightHandle Number*
1 2 3 4 1 2 3
0.05 0.05 NS0.05 0.05
0.05
0.05 NS -NS 0.05 NS
0.05 NS NS 0.05 -
NS = Not significant0.05 = p<0.05* The handle numbers correspond to the handle types shown in Figure 3.1.
Handle 1Bar Handle 2Height Handle 3lm Handle 4
Handle 1Bar Handle 2Height Handle 31.75m Handle 4
100

Discussion
The four handles investigated in this study were chosen to illustrate how
the coupling at the hand influences the ability of a person to exert maximal
horizontal pulling forces in different postures.
The contrasting dimensions and designs of the handles clearly dictated the
type of grip which could be employed and the subsequent effectiveness of pulling
exertions on them.
The most common grips employed on the different handles by subjects with
different hand sizes6 are shown with each handle in Figure 3.3. In virtually all
cases the bar (handle 4) encouraged an overarm power grip. This particular grip
produced the greatest degree of hand/handle contact over all other grips observed,
and was considered optimum for pulling exertions.
A similar grip to that shown for the bar, tended to be employed on handle
1. However, due to the limited knuckle clearance this type of grip was less closed
chained than for the power grip, and approximated a hook grip, with the thumb, in
some cases, pressed against the upper anterior aspect of the handle. Hand/handle
contact was much less than on the bar, leading to a certain amount of discomfort
during exertions. Despite contrasting grips and handle designs, there was no
significant difference (p>0.05) for maximal pulling forces between the bar and
handle 1 at the two bar heights.
Handles 2 and 3 evoked various forms of precision grip in which the
handle was pinched between the side and/or flexor aspects of the fingers and
opposing thumb. Pulling strengths using this type of grip on the above handles
were lower than those recorded for the power grip or hook grips employed on the
6 Hand size was determined from seventeen hand dimensions each converted to percentiles using the data of Pheasant (1986). Mean hand size was estimated from the average percentile value of these 17 dimensions.
101

bar and handle 1. The differences in maximum pulling strengths between handle 2
and 3 were most likely due to the fact that handle 2 allowed for a better grip
purchase by providing an edge on which to hook the distal aspects of the
phalanges. In comparison, the small spherical surface of handle 3 made gripping
extremely difficult, resulting in much lower pulling strengths. The hand/handle
contact area for handle 3 was also less than that for handle 2 especially when a
pinch grip (see Figure 3.3) was used.
102

cm
M I S
£ T u C O
«* <§ B p OD c3
.S v» *o ft c taI#8 v8 IV i "3a <v .2 5vte o4) =2i i3 JS "O JGI §3 *-■c3 o ft &
5 ^*5 «* •5 - «8 &S1 s3 «- v i < _ ,u 3 3 0 0 i® *C«4—•>»S -• ■£ ** o3 g 3
I t a1^1| 1 8•—» m *0 ,23 V*
3
<2 § i J S .gI s ?.z *® .2^ § <Do ' o B0410 *0
S s “ Sco g 04*0 VOC S oo ra •
* 3 4)3 U t3*p £ «o5 * § v.-sre 5 ' g sfo S « ft c opi&iS O 3 «0 P«
COo

Figure 3.3 also shows that orientation of the hand on handles 2 and 3
changed between exertions performed at 1.0 and 1.75m. Perhaps this reflected an
attempt on behalf of the subjects to avoid excessive ulnar deviation and reduce
stress on the wrist during exertions at the higher bar height. In comparison, the
design of handle 1 did not permit such changes in posture, thereby resulting in a
large degree of ulnar deviation at the 1.75m bar height.
Although the results indicated no significant difference in pulling strength
between handles 1 and 4 at 1.75m, it is likely that exertions on the former handle
resulted in much larger stresses on the wrist. In other studies on manual handling,
excessive wrist deviation has been found to significantly reduce force capability
and be related to well known pathologies and worker complaints (Drury 1985).
Design parameters of handles for manual materials handling have been
reviewed by Drury (1980). Both handle size and handle diameter have been shown
to affect pull force (Bobbert 1960, Ayoub and LoPresti 1971, HEDGE 1974).
Other features of handle design known to affect force capability are surface
texture and the presence of sharp edges (Pheasant and O’Neill 1975). Prominent
comers or ridges on the handles create high pressure point loadings on the hand
during exertion, leading to pain and discomfort. This was a common complaint
following exertions using handles 1 and 2. In contrast the frictional properties and
smooth shape of handle 3 provided a poor grip purchase.
An example of how handle design and hand anthropometry can interact in
an unexpected way is demonstrated by the small difference in normalized pulling
strength between males and females on handle 3. Only the smallest fingers could
fully occupy the space at the rear of handle 3. Under these conditions, the pulling
force depends more upon compression of the finger against the handle rather than
upon friction at the interface. Subjects with large finger and thumb dimensions
were forced to adopt a pinch grip nearer the outside edge of the handle where a
tangent on the curved edge approaches horizontal. In this case frictional limitations
104

become more critical when exerting a pulling force. Consequently, for a given
coefficient of friction and horizontal pulling strength, the pinch force required to
prevent slip on the handle for a women of 5th percentile finger dimensions was
considerably less than for a male with 95th percentile finger dimensions.
Differences in pulling strength capabilities at the two handle placements
depend, in part, on the way in which body weight may be deployed in the
different postures. ’Weak links’ in force transmission between regions of force
production within the human body and the point of force application on the
external object will also limit maximum strength capabilities. These weak links
may occur at or across an articulation of the musculoskeletal system, or at the
hand/handle interface. Factors determining where the weak link will reside in the
overall system, for a given condition, will include handle placement and design
and those variables dependent on these elements.
Figure 3.2 showed that the poorer the handle design, the less effect its
location had upon the force which could be exerted. In other words, in the case of
handle 3, the limiting factor, or weak link in force transmission, was at the
hand/handle interface; whereas for well designed handles the force was more
strongly dependent on posture and the weak link must therefore have been
elsewhere.
Evidence from the current study indicated that horizontal pulling strength
may be reduced by as much as 65% when performing exertions against a poor
hand/object interface. In contrast, current manual handling guidelines (NIOSH,
1981) and biomechanical models (e.g. Martin & Chaffin, 1972) assume that the
hand/object interface is close to optimal and does not limit the strength of
exertion. There seems to be a clear need to classify couplings between hand and
object as "strong" or "weak links" in these models to enable a better prediction for
safe manual handling.
105

Conclusions
Maximum pulling strength was influenced by both the hand/handle interface
and by handle position. Factors which distinguished a good hand/handle interface
from a poor one, for maximal pulling exertions, included the handle design (size
and shape) and the type of grip encouraged by the particular handle.
Handle placement had a significant effect on whole body pulling strength
when exertions were performed using a good handle, but showed little effect on
the strength of exertions with poorly designed handles. It was inferred that in the
latter condition the hand/handle interface was the ’weak link’ in force transmission
between the human and external object.
106

CHAPTER 4
STUDY H
HUMAN STRENGTH CAPABILITIES DURING ONE-HANDED MAXIMUM VOLUNTARY EXERTIONS IN THE FORE AND
AIT PLANE.
107

Introduction
The main objective of this study was to describe human strength
capabilities during one-handed maximal voluntary exertions in the fore and aft
plane in freestyle postures. In order for the strength data to be potentially useful as
an aid in task design and in the recognition of hazards during manual exertion,
forces are presented in vector form as a Postural Stability Diagram (see literature
review).
Further objectives of the present study were to investigate the influence and
interactions of sex, body weight, handle height and direction of exertion on one-
handed strength; and to compare the strength of one and two-handed exertions.
Methods
Subjects
The 22 subjects (18 right handed, 4 left handed) were unpaid volunteer
staff or students of this institute. Their physical characteristics are summarized in
Table 4.1.
Table 4.1Physical Characteristics of Subjects (Values are means (±SD)
nMalg12
Female10
Group22
Age (yre) 32.9 (10.7) 28.0 (5.5) 30.7 (8.9)Weight (kg) 76.3 (13.6) 62.2 (5.3) 69.9 (12.7)Height (cm) 178.4 (8.6) 167.4 (7.0) 173.3 (9.5)Grip (N) 493 (71) 348 (53) 427 (97)
108

Apparatus
The same force bar described in Chapter 3 was used to measure vertical
and horizontal components of static exertions. Using a 64k BBC microcomputer,
customized software was designed to sample and then plot the maximal horizontal
and vertical components of the force vectors applied to the bar in all possible
directions in the fore and aft plane. A plot of these force vectors on a VDU screen
presented the strength data in the form of a Postural Stability Diagram (PSD) (see
Grieve 1979a, b).
A combination of emery cloth floor and rubber soled shoes provided a
unity coefficient of limiting friction (Pheasant and Grieve 1981). Despite some of
the extreme postures adopted during exertions, slippage did not occur.
Grip strengths were measured with a handgrip dynamometer (Takei and
Company Ltd) where grip size was adjusted to the preference of the subjects.
Procedure
The subjects’ unshod weight and stature were measured. Grip strength was
determined from the best of two efforts with the dominant hand. Free style manual
strengths, with the dominant hand, were measured on the force bar while standing.
The only limitation placed on the subject’s posture was that the leading foot should
not be placed anterior to the handle. Subjects performed steady maximal exertions
in all possible directions in the fore and aft plane with the force bar set at 1.0 or
1.75 m above the ground,. No ’jerking’ or ’swinging’ on the force bar was
allowed. The procedure for obtaining a Postural Stability Diagram (PSD) has been
described previously (Pheasant and Grieve 1981). At least one day separated tests
at the two heights. Half the subjects started with the 1.0 m bar height, the
remainder started at 1.75 m. One month later, twelve subjects who had completed
109

the one-handed exertions followed the same procedures and protocol using two
hands.
Analysis
Strength data were stored on disc as sets of 36 force vectors 10* apart.
Group mean strengths and standard deviations in each condition were calculated.
Prior to plotting all charts, the data were fitted with a cubic spline function as
described by Pheasant and Grieve (1981).
The Maximum Advantage of using a Component of Exertion (MACE) was
also calculated from the PSD data for each subject at each bar height and in all
directions in the fore and aft plane (Grieve and Pheasant 1981).
The proportion of variance in strength that could be accounted for by the
variance in body weight alone, or body height and weight in combination, was
calculated for each direction at both bar heights using 3 different regression
models. Two were simple linear regression models in which the strength of
exertion was regressed against (a) body weight (WReg) and (b) body weight and
height in combination (WHReg), and the third was a multiplicative regression
model of the form Y=aXb (W*Reg) (see literature review). A two-way repeated
measures ANOVA followed by a Tukeys HSD test post hoc test for all pairwise
comparisons was performed on the variances obtained from these three models to
ascertain which of the models explained the greatest amount of variance in strength
over the two bar heights.
110

Results
Sex Differences in the Strength of One-Handed Exertions
PSD plots for one-handed exertions at the two bar heights (1.0 m and 1.75
m) are shown in Figure 4.1. The data are presented as strength/weight ratios and
show the group means ± one standard deviation.
A comparison of the PSD’s in Figure 4.1, between male and female
subjects, show almost identical shapes for the vector diagrams with only small
differences in their normalized strengths for exertion at the two bar heights. When
the female/male (f/m) strength ratios were calculated, for the normalized data in
each of the 36 directions at the two bar heights, a mean value of 0.79 (SD =
0.09) was obtained (n=72). This f/m strength ratio decreased to 0.65 (SD = 0.08)
when absolute strength values were considered.
Female/male strength ratios (calculated from the normalized strength data)
for all 36 force vectors at the two bar heights are presented in Figure 4.2.
Although the mean f/m strength ratio at the two bar heights were very similar,
(Bar=1.0 m, ratio=0.78 (SD=0.08); Bar =1.75 m, ratio=0.80 (SD=0.11);
n=36) Figure 4.2 clearly shows that the magnitude of this ratio varies according
to direction of exertion and bar height.
At the 1.0 m bar height males were significantly stronger (p<0.05) than
females in most directions, except for exertions performed in the Pull/Press
quadrant. In this latter quadrant the normalized f/m strength ratio averaged 0.86
(SD=0.07, n=9) with a peak ratio of 0.93 occurring between 120 and 130
degrees. Over a large area of this quadrant there was no significant difference in
strength (p>0.05) between males and females when forces were normalized
against body weight.
I l l

At the 1.75 m bar height, normalized female strength approached that of
the males in many more directions. Figure 4.2 indicates large areas in the fore and
aft plane where there were no significant differences (p>0.05) in normalized
strength between males and females. Large strength differences between males and
females were observed in the directions of horizontal Pulling/Pushing and most of
the Pull/Lift quadrant.
112

Figure 4.1: Postural Stability Diagrams (PSD’s) for one-handed exertions, in the
fore and aft plane, at handle placements of 1.0m and 1.75 m above the floor. The
data are average maximal strengths (± one standard deviation) as a percentage of
body weight. The centre of each diagram represents zero manual exertion and the
edges represent forces equal in magnitude to body weight. The posture adopted
was freestyle.
113

BAR = 10 m BAR = 1.75 m
M A L E S
F E M A L E S
GROUP
PULI
lESS
LI FT
PUSH£UL1m
IESS
•USHPUL
IESS
PUSHPULL
ESS
PUSH1PULL
ESS
IFT
PUSHPULL
ESS

BAR =1-75 m
^ ^
[PULL I s L pu sh !
PR
BAR =10 m
Figure 4.2: Female/male strength ratios in all directions in the fore and aft plane, for one-handed maximal exertions, under two conditions of handle placement (1.0 m and 1.75 m). The centre of each plot represents a f/m strength ratio of zero, the inner circle an f/m strength ratio of 0.5 and the outer circle an f/m strength ratio equal to unity. The hatched areas represent directions in the fore and aft plane where males were significantly stronger than females (p<0.05). All data calculated from strengths expressed as a percentage of body weight.
115

The M a xim um Advantage of Using a Component of Exertion (MACE) for
One-Handed Exertions.
Using individual PSD data, advantages of using components of deviated
forces were calculated for all directions in the fore and aft plane, at both bar
heights. An example of the plot obtained for one subject is shown in the upper
diagrams of Figure 4.3. In these two diagrams the advantage of using the
components of deviated forces (outer envelope) is superimposed on the raw PSD
data (inner envelope). A plot of the average maximal forces (as well as standard
deviations), which may be obtained by employing components of deviated forces,
for the subject population (n=22) at the two bar heights is shown in the lower two
diagrams of Figure 4.3.
Figure 4.4 presents the average MACE values for the group (n=22) for all
directions in the fore and aft plane. The centre of the plot in Figure 4.4
corresponds to a MACE value of 1.0 and is the point where the actual resultant
force observed is equivalent to the maximum available component. The inner and
outer circles represent MACE values of 1.5 and 2.0 respectively. MACE data at
the 1.75 m and 1.0 m bar heights are shown by the solid and dashed lines
respectively.
At the 1.75 m bar height Figure 4.4 indicates that forces exerted in certain
directions (i.e. the upper LIFT/PULL and the lower LIFT/PUSH quadrants) may
be more than doubled if a person chooses and is able to, take advantage of
deviated forces. In contrast, there are other directions of exertion at both bar
heights, (i.e. vertical pressing and the upper LIFT/PUSH quadrant) which gain no
benefit from deviated force components. These latter directions of exertion
naturally correspond to areas on the PSD’s where the largest manual forces were
observed.
116

The average MACE value over the 36 directions of exertion for the 1.75 m
bar height was 1.63 and was significantly greater (t=6.73, df=35, p<0.001) than
the average MACE value at the 1.0 m bar height (MACE10m=1.18).
For the purpose of discussion, Table 4.2 presents the MACE values for the
90*, 180*,270* and 360’ force vectors at both bar heights, along with their
angular deviations from the maximum horizontal or vertical force vectors.
117

BAR - t-0 m BAR = 175 m
PUSH
ESS
PULL PUSH
PRESS
PUS;
ESS
rUSH
ESS
Figure 4.3: Upper diagrams: PSD plots of subject DS for one-handed maximal exertions in the fore and aft plane at bar heights of 1.0 and 1.75 m above the ground (inner envelopes). The advantages of using components of deviated forces are shown by the outer envelopes. Lower diagrams: PSD plots illustrating the average maximal forces (+ one standard deviation) which may be obtained by using components of deviated forces at the two bar heights (n=22). Presentation of data is as described in Figure 4.1.
118

Table 4.2:
MACE values for Pulls (90’), Presses (180’), Pushes (270*) and Lifts (360*) and the angular deviations, D, of the force vectors from the vertical or horizontal which give a greater component than forces generated exactly in those directions. Positive and negative values refer to anticlockwise and clockwise deviations respectively.
BarHeight
LIFT PULL PRESS PUSH
1.75 m MACE 1.42 1.76 1.03 2.12D (’) -20 +40 -10 +40
1.0 m MACE 1.16 1.03 1.06 1.26D Q -10 0 -10 +20
> V li f T "—-s.
Cn/ \ \** / X IIpul( 1 pusJhi / -S 1in , c- /V ' /
V /
">------ PRESS^^—
Figure 4.4: MACE values for one-handed freestyle static exertions performed at bar heights of 1.75 m (solid line) and 1.0 m (dashed line). The origin corresponds to a MACE value of 1.0, and the inner and outer circles to MACE values of 1.5 and 2.0 respectively.
119

One-Handed Versus Two-Handed Exertions
PSD plots showing the average maximal strength (± 1.0 SD) of twelve
subjects who performed two-handed exertions at the 1.0 and 1.75 m bar height
are shown in the upper portion of Figure 4.5 The PSDs are displayed relative to
body weight. These data were compared with their one-handed exertions to
produce one-handed/two-handed strength ratios for all 36 directions at each bar
height. The resulting mean one-hand/two-hand strength ratios are presented in the
lower portion of Figure 4.5 in the same format as that described for the f/m
strength ratios in Figure 4.2.
At the 1.0 m bar height one-handed exertions were significantly weaker
(p<0.05) than two-handed exertions over most directions in the fore and aft plane.
Exertions performed in the lower half of the Pull/Lift quadrant were however the
exception. For force vectors between 30* and 100’ one-handed and two-handed
exertions were virtually equivalent, with one-handed/two-handed strength ratios
approaching and actually exceeding unity.
Fewer significant differences between one and two-handed exertions were found
at 1.75 m. The main strength differences (Fig. 4.5, lower right) resided in the
Lift/Push quadrant and the lower portions of the Pull/Press-Push/Press quadrants.
Outside of these regions strength differences between one and two-handed
exertions were largely insignificant (p>0.05).
120

BAR = 1-0 m BAR = 1-75 m
PUL
FT
PULL PUSH
PULL
ESS
Figure 4.5: Upper diagrams: PSD plots of two-handed maximal exertions in the fore and aft plane with the force bar placed at 1.0 m and 1.75 m above the floor (n=12). Presentation of the data is as described for Figure 4.1. Lower diagrams: Plots showing the mean 1 handed/mean 2 handed strength ratios for all directions in the fore and aft plane at the 1.0 m and 1.75 m bar heights. Scaling of the strength ratios is the same as that described in Figure 4.2. The hatch areas represent directions in the fore and aft plane where two-handed exertions are significantly stronger than one-handed exertions (p<0.05).
121

Relationships between Body Weight, Strength and the Direction and Height of
Exertion
Figure 4.6 shows the proportion of total variance in strength which may be
accounted for by the variance in body weight or body weight and height combined
for all directions of exertion in the fore and aft plane at the 1.0 m and 1.75 m bar
heights. The centre of this plot represents an r2 of zero and the inner and outer
circles an r2 of 50% and 100% respectively. The proportion of the total variance
in strength explained by the three regression models WReg, WHReg and WbReg
are shown by the dashed, solid and dotted lines respectively. The results of the
two-way ANOVA are presented in Table 4.3 and show that the proportion of total
variance in strength explained by these regression models changes significantly
according to the direction of exertion (p< 0 .001), but differs little in their mean r2
values between the two bar heights (p>0.05).
A significant F ratio was also found for the regression model type
(p< 0.001). This indicated that there were significant differences in the overall
proportion of the total variance in strength accounted for by the different models.
A post hoc comparison of the three regression models using the Tukey’s HSD test
for significance revealed that the WHReg model (mean 1^=63%, SD=18%),
explained a significantly greater proportion of the total variance in strength than
either the WReg or W*Reg models (p<0.05). There was no significant difference
in the mean r2 values observed between the WReg (mean r2=57%, SD=17%) and
WbReg models (mean 1 =5 5 %, SD=16%) (p>0.05).
122

Table 4.3
Analysis of variance summary statistics for the main effects handle height, direction of exertion and type of regression model on the proportion of the total variance in strength accounted for solely by the variance in body weight or body weight and height combined.
FACTOR SOS DF MS F P
Bar Height (A)
2327 1 2327 3.95 p>0.05(NS)
Error A S 20642 35 590
Regression Model (B)
2886 2 1443 134.04 p < 0.001
Error B S 754 70 11
Interaction A B
43 2 21 1.51 p>0.05(NS)
ErrorA B S
996 70 14
Angle (S) 37853 35 1082 76.02 p < 0.001
Total 65501 215
Notes:
SOS = Sums of squares DF = Degrees of freedom MS = Mean square NS = Not significant
123

Figure 4.6: The proportion of the total variance in one-handed static strength explained by the regression models WHReg (solid line), WReg (dashed line) and WbReg (dotted line) at the 1.0 m and 1.75 m bar heights.
124

Discussion
Sex Differences in the Strength of One-Handed Exertions.
Part of the variation in f/m strength ratios (shown in Fig. 4.2) is likely to
reflect differences in stature between the male and female subject population. In
addition, sex differences in the strength of the principal muscle groups involved
during exertions in different postures are likely to add to this variance.
In those regions where sex differences were small it may be assumed that
the physical strength of the individual played only a minor role in the force of
exertion. Under these circumstances the deployment of body weight may therefore
be the predominant factor dictating force output.
The above argument does not explain the similarity of forces produced by
males and females in the Lift/Push quadrant at the 1.75 m bar height. It was in
this region of the PSD that the largest forces were recorded by both sexes. As
described by Pheasant and Grieve (1981) these peak forces arise from postural
configurations in which muscular torque required about the major articulations is
minimized. This occurs when the trunk, upper and lower limbs approximate a
straight line and the whole body is brought as close as possible to the line of
thrust. One reason for the similarity of strengths between the sexes under the
above conditions may be that the postures adopted employed muscle groups with
minimal sex differences in strength.
Based on 112 data sets Pheasant (1983) noted that the ratio of female/male
average strengths can vary from 0.37 to 0.90 depending on a number of factors
including the direction of exertion and muscle group tested. Upper and lower
extremity strength of women were reported to be on average 58 and 66% of men’s
respectively (Pheasant 1983). In view of this fact it may be hypothesised that sex
differences in whole body strength will be greatest in directions of exertion that
require mainly upper body strength. Alternatively, sex differences in whole body
.125

strength will be minimized where the force produced is limited predominantly by
leg strength.
As discussed in the literature review some of the variability in strength
between the sexes are likely to be due to differences in their skill and motivation
when performing the strength tests. As the current experiment permitted freestyle
postures to be adopted, it would be reasonable to assume that these conditions
would entail a greater element of skill to produce maximal exertions than would be
required if formal foot placements were investigated. Unfortunately it is difficult
to isolate and quantify skill level. Nevertheless, the freedom of choice of posture,
and the subjects ability to adopt the optimum or most efficient posture for force
exertion in a given direction, will no doubt have played a significant contribution
to the sex differences in strength, and indeed to the overall variability in strength.
In general, the present data illustrate the large variability in strength
between the sexes under different conditions. The findings also depict the complex
interactions between angle of exertion and handle height (implying changes in
posture and the use of different muscle groups) as well as body weight in the
determination of strength.
It is interesting to note that the mean f/m strength ratio (based on absolute
strength data) over all conditions investigated was close to the commonly quoted
rule of thumb that in general, women are two thirds as strong as men.
Although this absolute strength difference between the sexes provides a
strong argument for separate load limits for men and women in the field of manual
handling; the current results indicate that it would be inappropriate to use a single
mean ratio to predict female strength from male data.
126

Advantages of Using a Component of Exertion
The closer the MACE values are to unity, the smaller the benefit that can
be obtained by using the component of a deviated force vector. Consequently, the
data in Figure 4.4 clearly indicate that substantial advantages may be gained by
employing deviated force components at the 1.75 m bar height, but little benefit
may be gained by employing them at the 1.0 m bar height. The amount of benefit
which may theoretically be derived from these deviated forces does however
depend on the intended direction of exertion.
If only the truly horizontal or vertical directions are considered as shown
in Table 4.2, it is seen that there is little to be gained by using a deviated
component in horizontal pulling, vertical lifting or vertical pressing actions at 1.0
m. The MACE value shown for horizontal pushing, however, shows that if a
subject exerts a maximal one-handed push at this height it is likely that a small
vertical lifting component of force will also be exhibited (providing the subject
chooses to take advantage of the deviated resultant force).
At 1.75 m, aside from vertical pressing, the MACE values indicated that a
substantial advantage may be gained by utilizing a deviated resultant force during
exertions. For example, if the objective is to produce a maximal horizontal push at
this particular height it is best to direct the resultant force at approximately 40*
above the horizontal rather than directly along the horizontal plane. Similarly, if
the goal is to produce maximal horizontal pulling at 1.75 m, the resultant force
should be directed approximately 40* below the horizontal plane of the handle.
In practice the individual will only benefit from the above resultant forces
in tasks where the vertical component of the force is unimportant. Similarly, for
deviated forces to be useful in lifting tasks their horizontal components must not
compromise any frictional or task limitations. The possible use of deviated
resultants should therefore be accounted for when designing equipment or
considering tasks which may require heavy exertions.
127
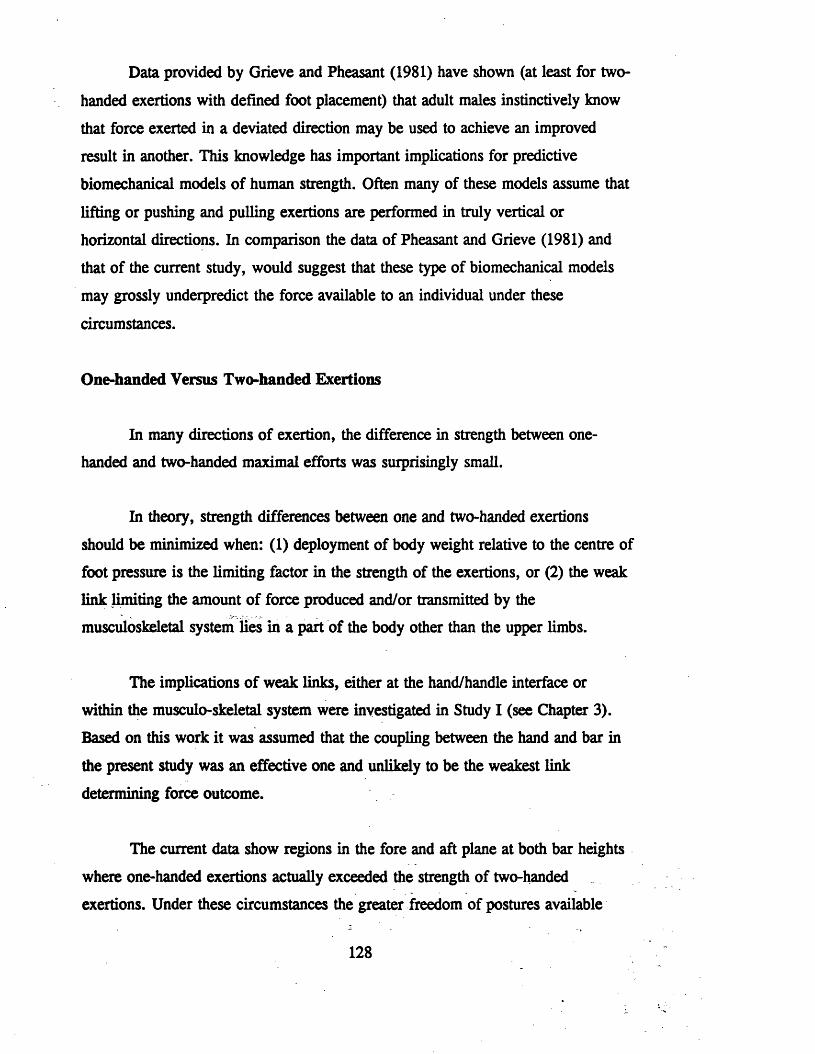
Data provided by Grieve and Pheasant (1981) have shown (at least for two-
handed exertions with defined foot placement) that adult males instinctively know
that force exerted in a deviated direction may be used to achieve an improved
result in another. This knowledge has important implications for predictive
biomechanical models of human strength. Often many of these models assume that
lifting or pushing and pulling exertions are performed in truly vertical or
horizontal directions. In comparison the data of Pheasant and Grieve (1981) and
that of the current study, would suggest that these type of biomechanical models
may grossly underpredict the force available to an individual under these
circumstances.
One-handed Versus Two-handed Exertions
In many directions of exertion, the difference in strength between one-
handed and two-handed maximal efforts was surprisingly small.
In theory, strength differences between one and two-handed exertions
should be minimized when: (1) deployment of body weight relative to the centre of
foot pressure is the limiting factor in the strength of the exertions, or (2) the weak
link limiting the amount of force produced and/or transmitted by the
musculoskeletal system lies in a part of the body other than the upper limbs.
The implications of weak links, either at the hand/handle interface or
within the musculo-skeletal system were investigated in Study I (see Chapter 3).
Based on this work it was assumed that the coupling between the hand and bar in
the present study was an effective one and unlikely to be the weakest link
determining force outcome.
The current data show regions in the fore and aft plane at both bar heights
where one-handed exertions actually exceeded the strength of two-handed
exertions. Under these circumstances the greater freedom of postures available
128

under the one-handed condition permitted the subject a more advantageous use of
the body’s centre of gravity. For example, in the case of exertions directed in the
Pull/Press quadrant at 1.75 m, releasing one hand from the bar permits the subject
to rotate about an axis connecting the leading foot and the hand grasping the bar.
If the body is rotated about this axis until perpendicular to the bar, and the free leg
and arm splayed out as far as possible from the axis in the direction of the exerted
force, (as shown in Fig. 4.7) displacement of the body’s centre of gravity away
from the bar will be maximized. Thus for a given force vector the moment arms
about which the horizontal and vertical components of the body weight act will be
optimal. Consequently, in exertions where deployment of body weight is the
predominant factor limiting force production, postures possible under one-handed
conditions may permit greater forces to be applied than when performed using two
hands.
As one-handed exertions performed in certain directions can approach the
strength of two-handed exertions, the stress on the load bearing shoulder and arm
may reach close to double that found during two-handed efforts. Due to the
anatomical nature of the shoulder joint and the inherent instability of the
articulation as a consequence of its degrees of freedom, the high stresses possible
during one-handed efforts may lead to an increased risk of injury. Further
epidemiological studies on upper limb injuries incurred during heavy manual
exertion may provide evidence to support this hypothesis.
129
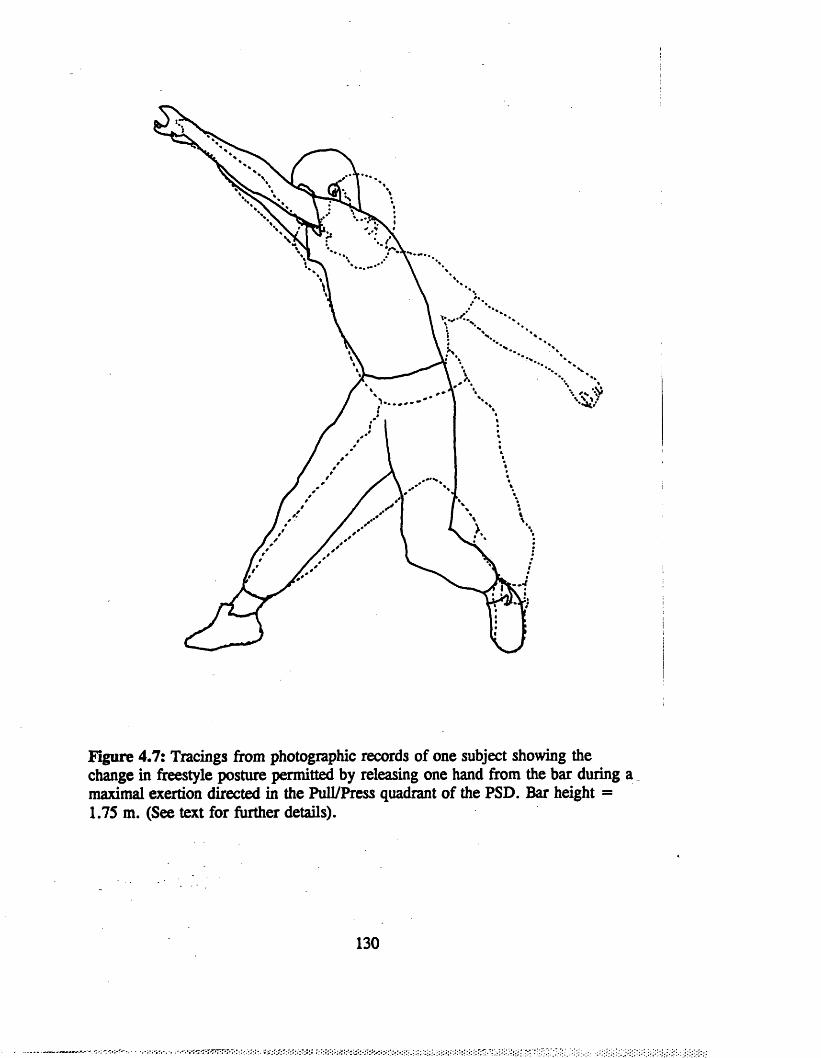
Figure 4.7: Tracings from photographic records of one subject showing the change in freestyle posture permitted by releasing one hand from the bar during maximal exertion directed in the Pull/Press quadrant of the PSD. Bar height = 1.75 m. (See text for further details).

Relationships Between Body Weight, Strength and the Direction and Height of
Exertion
The three regression models WHReg, WReg and WbReg were chosen for
comparison because of their common use in the literature. The regression model
WbReg (of the form Y=aXb) was used by Lietzke (1956) and Ross et a l , (1984)
in their analyses of the relationship between weight lifting performance and body
weight. Their rational for using this type of regression model was based on
dimensional theory and is explored in detail in the literature review.
The present results illustrate that the W ^eg model was no better at
predicting one-handed freestyle whole body strength from body weight than a
simple linear regression model (i.e. WReg). The value of the exponent, b, for the
WhReg models, averaged over the 36 directions and combined over both bar
heights, was 1.67 (SD=0.43). This was greater than the 0.667 derived from
theoretical expectancy and is likely to reflect the predominating influence of body
weight rather than muscular strength per se in the determination of whole body
strength when the data is averaged over all directions in the fore and aft plane.
In directions where the strength of exertion is limited solely by the weight
and mass distribution of the body (i.e. gravitational limitations) it would be
expected that strength would be linearly related body weight. In these cases the
value of b in the regression model of the form Y=aXb would be 1.0 and not
0.667. However, it was found that the b value for many directions of exertion was
greater than 1.0 and that, apart for a few individual directions, rarely approached
the value of 0.667. This observation is likely to reflect the freestyle nature of the
experiment and the diversity of the subject population.
Compared to the world class weight lifters in the studies of Lietzke (1956)
and Ross et al., (1984), it is reasonable to assume that the current subject
population was far less homogeneous in their technique, ability, and body type. In
addition, the current experimental design relied upon the intrinsic motivation of the
131

subjects to produce maximum exertions, and for individuals to choose their own
"optimum" or best posture for the different directions of exertion. This is far
removed from the well trained skills and high motivation required of elite weight
lifters for optimum performance in world class competition. It is therefore not
surprising that the current subject population displayed somewhat different results
than would have been predicted from theoretical expectancy.
The proportion of the total variance in strength accounted for by the
WHReg model has been termed by Pheasant (1977) as the dead weight factor (D-
W.F.). Pheasant (1977) defines the D-W.F. as the sum of the squares of the zero
order correlation of strength against weight and the first order partial correlation
of strength against stature with weight held constant. The same quantity is found
from the r2 value obtained for a simple linear regression analysis performed using
strength as the dependent variable and height and weight as the independent
variables.
Because of the freestyle nature of the conditions and the fact that only a
few photographic records of the postures were taken, it is not possible to describe
the exact orientation of the live and dead axes in the fore and aft plane at the two
bar heights (see literature review). It may be anticipated however, that the
extensive postures, and foot placements available under the current conditions
would permit the orientation of the live axis (and hence dead axis) to vary over a
wide range of angles. The extent of this range will be dependent on both the bar
height and the location of the centre of foot pressure while performing exertions in
the different directions. Clearly one limit is set by experimental constraints and
will occur when the centre of foot pressure is directly beneath the bar. In this case
the live axis is exactly vertical. The other limit will depend on the subjects choice
of foot placement and optimum use of his or her body weight.
Despite the above problems in determining the orientation of the live axis,
exertions at both bar heights demonstrated distinct regions where the D-W.F
dramatically dipped below an r2 of 50%. It is of note that these low D-W.F.
132
\

occurred predominantly in the upper portion of the LIFT/PUSH quadrant where
the direction of exertion would be expected to be close to the live axis (i.e when
exertions are directed along the line connecting the centre of foot pressure to the
position of the hand). In these directions of exertion it may be deduced that
factors other than body weight, such as muscular limitations, skill and motivation,
play the main role in determining force outcome.
In contrast, body weight and stature explained a large proportion of the
total variance in strength over the majority of directions of exertion at both bar
heights. Under the present set of experimental conditions these data would suggest
that on average, two thirds of the total variance in strength of freestyle one-handed
whole body exertions performed in the fore and aft plane may be explained by
individual variation in body weight and stature. Although the proportion of total
variance in strength accounted for by the D-W.F. does not change with bar height
(when averaged over all directions of exertion), the relationship between strength
and body weight does change significantly with the direction of exertion.
The above findings again have important implications for biomechanical
models of whole body strength. As discussed in the literature review many
biomechanical models use body weight to predict individual variation in strength.
In addition, some biomechanical models also assume that muscular factors (i.e.
torque-angle relationships) are the main limitations for whole body exertions (e.g.
Garg & Chaffin 1975). The current findings suggest that in certain directions these
models may be unreliable unless they account for the changing contribution of
body weight over the different directions of exertion.
133

Summary and Conclusions
The current data give some indication of whole body strength capabilities
of one-handed exertions in the fore and aft plane. These data may be more
applicable to the working environment than previous research as exertions were
performed using freestyle rather than experimentally defined postures.
The main conclusions emerging from the study were:
(1) Sex differences in static one-handed maximum voluntary strength varied
substantially according to the direction of exertion and bar height. This served to
illustrate the complex interactions occurring between the underlying variables (e.g.
body weight, posture and the sex differences in strength of the muscle groups
involved).
(2) Considerable strength advantages (in a given direction) may be gained by
employing components of deviated forces during one-handed exertions at 1.75 m.
Relatively little benefit may be obtained by using these deviated forces at 1.0 m.
(3) It was more common to find two-handed strengths exceeding one-handed
strengths at the 1.0 m bar height. There were, however, a number of directions of
exertion at both 1.0 and 1.75 m bar heights where one-handed strengths
approached and even exceeded two-handed strengths.
(4) On average almost two thirds of the total variance in the strength of one-
handed static exertions may be explained by individual variation in body weight
and stature (i.e the dead weight factor). The amount of the total variance in one-
handed static strength accounted for by the dead weight factor did not on average
change with bar height, but did change significantly with the direction of exertion.
(5) A comparison of the three different regression models WReg, WHReg and
WbReg revealed the best overall predictor for one-handed static strength was the
134

WHReg model (i.e. a linear regression model using body weight and stature as
predictors of static strength).
When considering the current strength data, it should be kept in mind that
the values given are for ideal conditions. This assumes posture is unrestricted by
work space and force output is essentially unaffected by conditions at the foot and
hand interfaces. While such conditions are unrealistic for a typical working
environment, the data provide a starting point for estimating the effects of
environmental factors on one-handed exertions.
Finally, due to the widely differing postures available, use of the strength
data in biomechanical models of strength (e.g. Garg and Chaffin 1975) is
problematic unless detailed anthropometric and postural analysis is performed.
Nevertheless, data from the present experiment may enhance the reliability of such
models in areas of interpolation where there have previously been few data.
135

CHAPTERS
STUDY m
WHOLE BODY STATIC STRENGTH MEASUREMENT INTHREE DIMENSIONS
136

Introduction
In the area of manual materials handling most studies of human whole body
strength have been limited to exertions performed in either a purely vertical or
horizontal direction. In reality, however, the human interacts with the environment
unhindered by these experimental constraints. Our knowledge of human whole
body strength capabilities is therefore somewhat limited, with strength
measurements in many directions of exertion yet to be explored.
In Chapters 2 and 4 the Postural Stability Diagram (PSD) was presented as
a method for analyzing whole body static strength in a single plane. This approach
required a two dimensional analysis and was suitable for the simultaneous
evaluation of multiple factors on the static exertion of force. In keeping with this
holistic approach to task evaluation, the current chapter extends the analysis of
human strength into three dimensions.
Extending the concept of the PSD into three dimensions introduces a new
set of problems relating to equipment design, experimental protocol, data
processing and presentation of experimental results. This chapter addresses these
problems with the aim of providing a reliable and effective means for measuring
and presenting the forces at the hands and feet during static exertions performed in
any direction in the sphere of exertion.
137

Hardware Development
The first problem to be solved was to design a suitable dynamometer to
accurately and reliably measure single handed manual forces in three dimensions.
Dynamometer Design
The dynamometer was constructed around a handle that was free to rotate
about the three perpendicular axes (X, Y and Z). This ensured that manual forces
could only be applied to the dynamometer when the resultant force was directed
exactly through the handle’s centre. By fixing the force vector through this known
point the direction and magnitude of a force on the handle could be measured
without the confounding influence of torques. This greatly simplified data
collection by minimizing the number of transducers required to decode forces in
three dimensional space. The completed dynamometer and its component parts are
shown in Figures 5.1a and b.
The dynamometer consisted of a 127 mm long cylindrical handle of 36 mm
diameter which was free to rotate about its long central axis. The ends of the
central axis of the handle were mounted within an annulus consisting of a ring
bearing with an inside diameter of 132 mm. This ring bearing permitted free
rotation about the horizontal axis perpendicular to the long axis of the handle. The
outer casing of the annulus was connected to a rigid metal framework through self
centring bearing mounts that allowed the annulus free rotation about a vertical axis
directed through the centre of the handle.
Between the top and bottom bearing mounts and the outer metal framework
were three ring transducers. One ring transducer was located beneath a
"shimmying" bearing directly under the annulus on the vertical axis (i.e. Z axis).
The other two transducers were located perpendicular to each other in the
horizontal plane. The first of these was positioned between the top of the annulus
138

and the outer framework along the X axis. The second was placed between the
bottom edge of the annulus and the metal frame work along the Y axis.
Universal joints were used to connect the X and Y ring transducers and
their perpendicular horizontal supports to the outer framework. These universal
joints along with the "shimmying" bearing were introduced to ensure component
forces were directed exactly along the central axis of each ring transducer. Forces
transmitted to each transducer were therefore proportional to the magnitude of the
respective component forces acting at the centre of the handle and directed along
the appropriate axes.
139

Figure 5.1a and b: A photograph of the dynamometer (Figure 5.1a) and its component parts (Figure 5.1b). A = Connector box for ring transducer output. B = ring transducers and strain gauges. C = the handle enclosed within the ring bearing. D = Horizontal supports containing self centring bearings and universal joints. E = Rotational bearing. F = Universal joints.
140

Figure 5.1a:
141
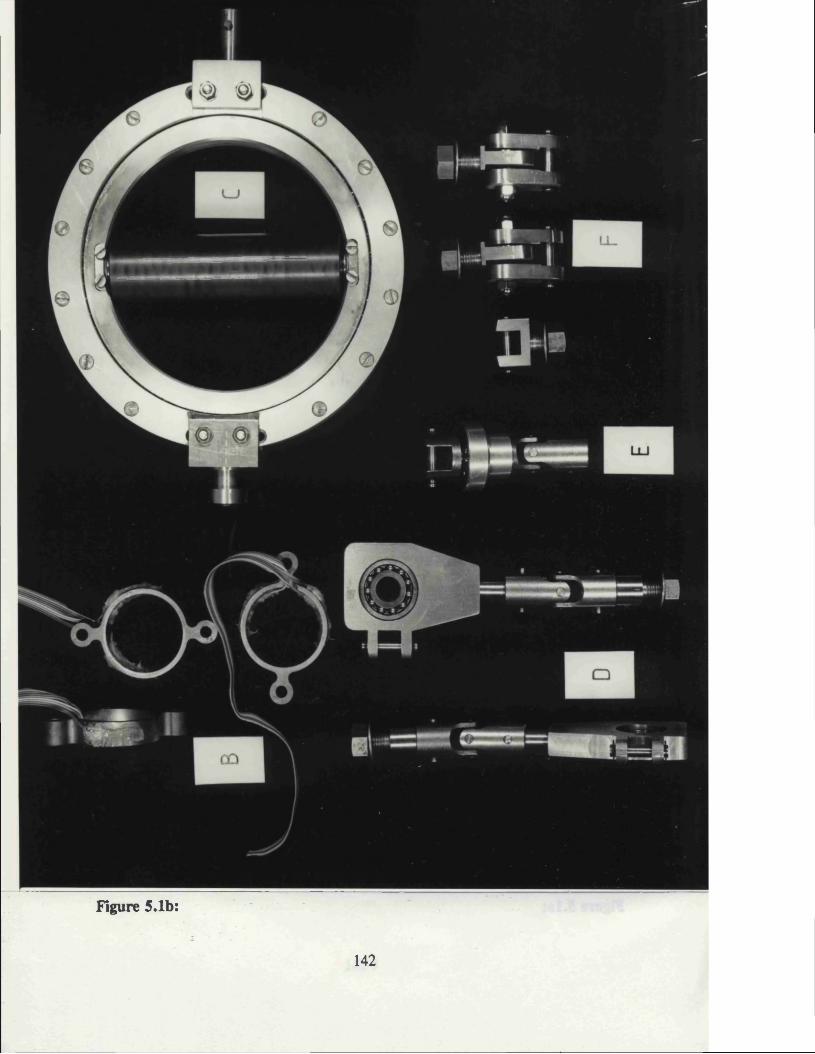
Figure 5.1b:
142

Force M easurement and Computer Interface
Compressive and tensile forces transmitted to each ring were measured by
foil strain gauges bonded to the inner and outer surface of the ring transducers in
Wheatstone Bridge configurations. Forces tending to compress the transducers
were given a negative sign and tensile forces a positive sign. These sign
conventions are summarized for the three dimensions in Figure 1.1.
Output from the strain gauges was amplified by operational amplifier
circuits (RS Components, strain gauge amplifier 308-815 and PCB 435-692) before
being passed to the analogue inputs of a CED 1401 Intelligent Interface
(Cambridge Electronic Design Ltd).
The CED 1401 converted the analogue voltage signals from the ring
transducer into 12 bit digital format. Each transducer was sampled at 500 Hz over
successive 100 ms time intervals. The average digital value over each time interval
was calculated for each channel and passed to a host computer (BBC B computer
with a 6502 second processor, Acorn Ltd) for further processing and display.
Processing this data and updating the display took 280 ms thereby giving an
overall sampling frequency of 3.6 Hz.
143

Dynamometer Calibration
Each ring transducer was calibrated independently before being
incorporated into the framework of the dynamometer. The transducers were hung
vertically and loaded in tension by attaching known masses on the free end.
Regression lines, of the analogue to digital conversion of the transducers voltage
output (ADVAL) on force, were found to be linear with r2 values of 100% and
standard errors of the slopes less than 0.003 ADVALS/Newton. Ring transducers
showing hysteresis changes greater than 0.5% between loading and unloading
conditions were reinstrumented with new strain gauges.
Once each ring transducer was considered satisfactory the dynamometer
was assembled and mounted on a rigid scaffolding frame. Calibration constants for
the X, Y and Z ring transducers in the completed dynamometer were determined
using the equation below. This equation assumed that each force transducer was
independent and was unaffected by forces acting perpendicular to its measuring
axis.
R2 = (Vxa)2 + (Vyb)2 + (V,c)2 (5.1)
where;
R = resultant force in Newtons
Vx = ADVAL value measured on the X force transducer/ X cal. deflection
Vy = ADVAL value measured on the Y force transducer/ Y cal. deflection
Vz = ADVAL value measured on the Z force transducer/ Z cal. deflection
a = calibration constant for X force transducer
b = calibration constant for Y force transducer
C = calibration constant for Z force transducer
Calibration deflections for the CED were obtained by activating a
calibration resistor located in parallel with the Wheatstone Bridge circuit of each
144

transducer. Base-line values were recorded and used to adjust these calibration
deflections and the ADVAL values of the component forces for each channel.
The calibration constants a, b and c were determined by solving a set of
three simultaneous equations. Data for these equations were obtained by loading
the dynamometer in three different directions. This was achieved by hanging
known masses on the handle with the dynamometer orientated at different angles
on the scaffolding rig. A total of eight loads between 0 and 80 kg were applied in
each orientation. Data collected from a fourth orientation was then used to test the
reliability of these calibration constants.
Although the dynamometer gave linear output when loaded in a given
direction, the derived calibration constants did not provide an accurate measure of
the forces recorded in other directions. Forces calculated for the fourth orientation
gave errors of 7%, 16%, 12%, and 4% for the resultant force and the X, Y, and
Z components respectively.)
In order to obtain the best estimate of the calibration constants, data
collected from a total of eight different orientations were subjected to a multiple
regression analysis. Figure 5.2 shows the results of this analysis in which a linear
regression of the form presented in equation 5.1 has been fitted to the applied
resultant forces. It is clear from Figure 5.2 that for a given resultant force applied
to the handle there was at least one direction in which the actual forces fell outside
the 95% confidence intervals for the model.
The root mean square (RMS) error of the predicted resultant force was 15
N indicating the measurement accuracy of the system using these calibration
constants was +. 7.5 N.
145

cx 1000}7 5 0
— F i t t e d a O b s e r v e dr \
CM
z 5 5 0wCM
( i l
- 5 0
6 0 8 00 20 4 0CX 1 0 0 0 0 }
P r e d i c t e d F o r c e ~ 2 C N ~ 2 }
Figure 5.2: Predicted and observed resultant forces (with 95 % confidence intervals for predictions) following regression analysis of the calibration data for the right handle (see text for details).
146

The initial calibration results suggested the assumption of independence of
the three force transducers was incorrect. A second set of calibration equations
was therefore constructed to account for the possibility of cross talk between the
transducers.
The assumptions were made that each of the force components would produce
outputs in each of the three transducers, and each of the components would be
equal to the sum of the outputs multiplied by appropriate constants. This was
expressed by the following set of simultaneous equations.
Fx = Vxa + Vyb + V zc (5.2)
Fy = Vxd + Vye + Vzf (5.3)
Fz = Vxg + Vyh + Vzi (5.4)
where;
F x = Force component along the X axis
FY = Force component along the Y axis
Fz = Force component along the Z axis
V x = ADVAL value measured on the X force transducer/ X cal. deflection
Vy = ADVAL value measured on the Y force transducer/ Y cal. deflection
Vz = ADVAL value measured on the Z force transducer/ Z cal. deflection
a, b , C = calibration constants for X force transducer
d, e , f = calibration constants for Y force transducer
g , h , i = calibration constants for Z force transducer
The nine calibration constants in the above equations were again obtained
by solving a set of three simultaneous equations for each force component. Data
147
for these equations were collected by loading the handle in three different
directions using the apparatus and procedures outlined below. The reliability of
these calibration constants was tested using data collected from loading the
dynamometer in a fourth direction.
The apparatus used to measure the magnitude and direction of applied force
is shown in Figure 5.3. This consisted of:
(1) A precalibrated ring transducer connected in series between the
dynamometer handle and the applied load;
(2) Two plumb lines to determine the angle of applied force in the vertical
and horizontal planes;
(3) A stable scaffolding rig to enable the handle to be loaded in any desired
direction.
148

Figure 5.3: The experimental set up used to calibrate the 3D dynamometer strength testing device.
149
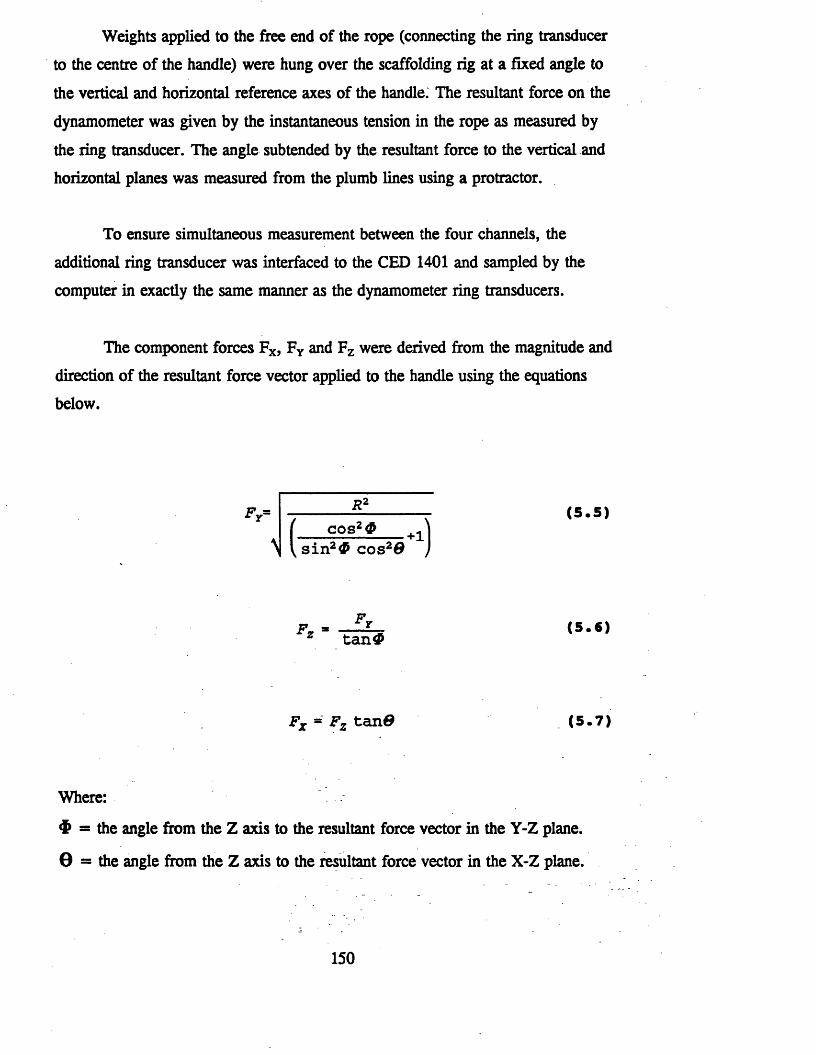
Weights applied to the free end of the rope (connecting the ring transducer
to the centre of the handle) were hung over the scaffolding rig at a fixed angle to
the vertical and horizontal reference axes of the handle. The resultant force on the
dynamometer was given by the instantaneous tension in the rope as measured by
the ring transducer. The angle subtended by the resultant force to the vertical and
horizontal planes was measured from the plumb lines using a protractor.
To ensure simultaneous measurement between the four channels, the
additional ring transducer was interfaced to the CED 1401 and sampled by the
computer in exactly the same manner as the dynamometer ring transducers.
The component forces Fx,F y and Fz were derived from the magnitude and
direction of the resultant force vector applied to the handle using the equations
below.
(5 . 5 )
■ _ Y
z ta n #(5 . 6)
Fx = Fz tan 9 (5 . 7 )
Where:
# as the angle from the Z axis to the resultant force vector in the Y-Z plane.
0 = the angle from the Z axis to the resultant force vector in the X-Z plane.

The results of these calibration trials did not however provide a satisfactory
improvement over the previous calibration attempts. Errors between the measured
and predicted forces were as large as 4% (12 N), 26% (17 N), 47% (49 N) and
2% 10 N) for the resultant force and the X, Y and Z components respectively.
Maximum errors calculated between the measured and predicted angles theta and
phi were in the order of 7 degrees.
It was thought that these errors were due to the unpredictable way in which
forces were transmitted to the framework as a result of the complex nature of the
system of universal joints and supporting links. This hypothesis was tested by
loading the dynamometer in the Z-Y plane with the ring transducer and supporting
arm in the X axis removed.
Calibration of the dynamometer under these conditions resulted in much
lower errors of 1% (8 N), 1% (8 N) and 3% (5 N) between measured and
predicted values for the resultant force and Y and Z force components
respectively. The angle of force application in the vertical plane was predicted to
within 1 degree. The remaining errors were attributed to measurement errors in
the angle and resultant force, and errors introduced by the self-centring and
shimmy bearings.
In view of these results it was decided to simplify the system of links in the
dynamometer so that forces applied to the handle could only be transmitted to the
outer framework via the three ring transducers.
The Redesigned Dynamometer
The dynamometer’s structure was simplified by removal of the shimmy
bearing, universal joints and the two horizontal supporting links, and then rigidly
mounting the X, Y and Z ring transducers between the outer framework and
annulus. In addition, the self-centring bearings were replaced by thrust bearings to
ensure an entirely rigid and statically determinate structure. The redesigned
151

dynamometer thus consisted of the original annulus suspended via three rigid
perpendicular arms linking the X, Y and Z ring transducers to thrust bearings and
the outer framework. Both the X-axis and Y-axis ring transducers were connected
to the top thrust bearing while the Z-axis ring transducer retained its original
position between the bottom thrust bearing and the framework. The redesigned
dynamometer is shown complete in Figure 5.4.
152

Figure 5.4: The redesigned dynamometer.
153
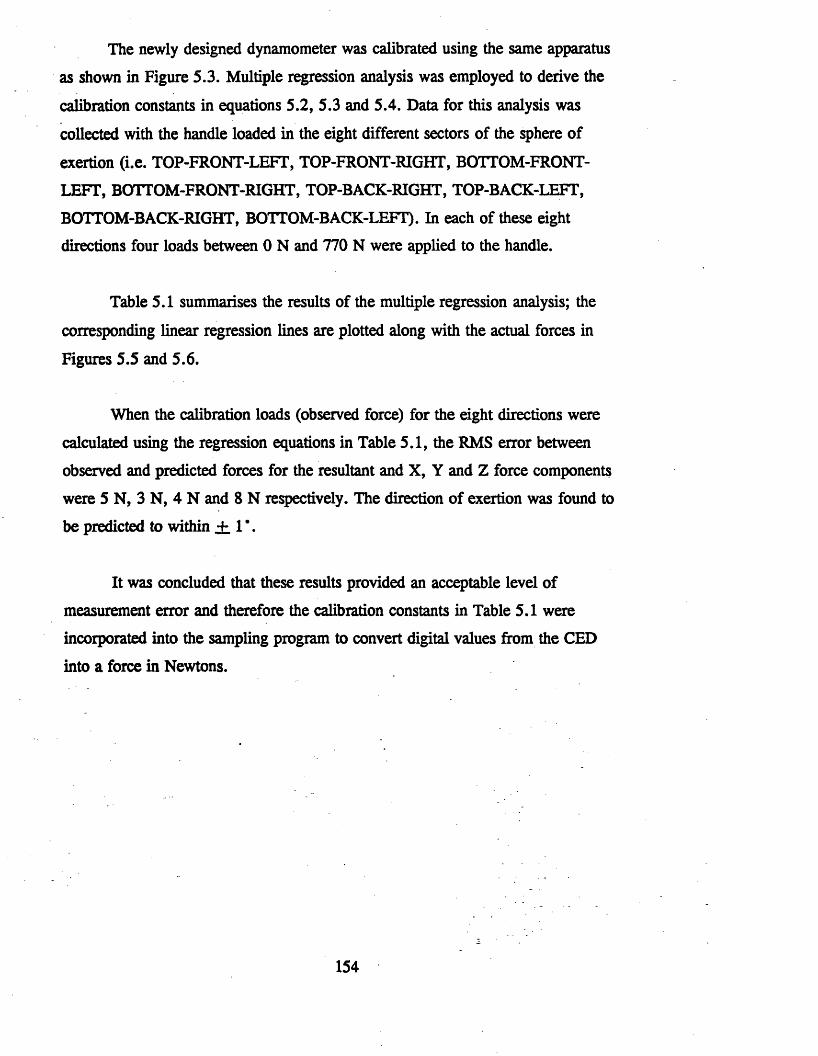
The newly designed dynamometer was calibrated using the same apparatus
as shown in Figure 5.3. Multiple regression analysis was employed to derive the
calibration constants in equations 5.2, 5.3 and 5.4. Data for this analysis was
collected with the handle loaded in the eight different sectors of the sphere of
exertion (i.e. TOP-FRONT-LEFT, TOP-FRONT-RIGHT, BOTTOM-FRONT-
LEFT, BOTTOM-FRONT-RIGHT, TOP-BACK-RIGHT, TOP-BACK-LEFT,
BOTTOM-BACK-RIGHT, BOTTOM-BACK-LEFT). In each of these eight
directions four loads between 0 N and 770 N were applied to the handle.
Table 5.1 summarises the results of the multiple regression analysis; the
corresponding linear regression lines are plotted along with the actual forces in
Figures 5.5 and 5.6.
When the calibration loads (observed force) for the eight directions were
calculated using the regression equations in Table 5.1, the RMS error between
observed and predicted forces for the resultant and X, Y and Z force components
were 5 N, 3 N, 4 N and 8 N respectively. The direction of exertion was found to
be predicted to within ± . 1 ’ .
It was concluded that these results provided an acceptable level of
measurement error and therefore the calibration constants in Table 5.1 were
incorporated into the sampling program to convert digital values from the CED
into a force in Newtons.
154

Table 5.1Summary of Multiple Regression Analysis for determination of the X, Y and Z force
components following calibration of the redesigned left-handed dynamometer. Units = Newtons.
ForceComponent
CalibrationConstant
Value ofCalibrationConstant
StandardError
R 2 For fit of Model Results
a -1763.99 6.99
b -27.91 2.46
F , c -97.31 3.46 1.00
constant -2.74 3.46
d 580.88 9.06
e 1249.67 3.19
F , f 151.88 4.48 1.00
constant -8.13 0.77
g -250.45 19.99
h -139.02 7.05
F , i 1187.58 9.89 1.00
constant -10.09 1.69
155
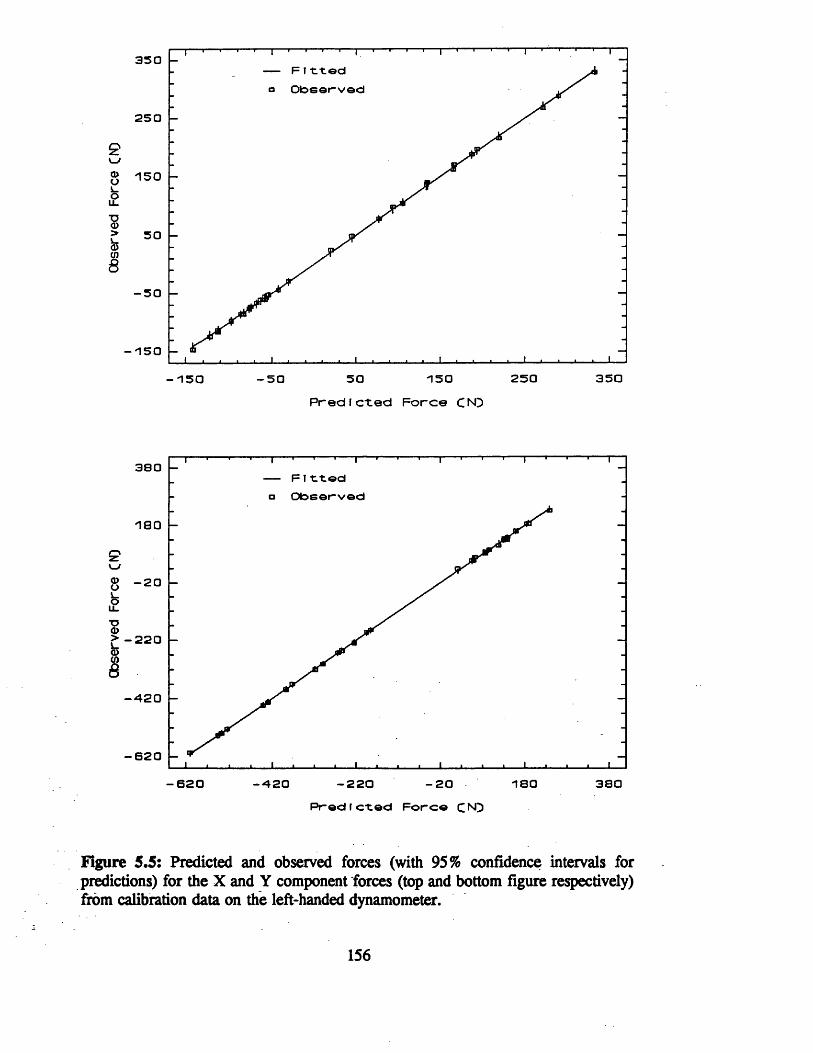
Obs
erve
d Fo
rce
CN}
Obs
erve
d F
orce
CN
D
330
a Observed250
30
-50
35025050-50
Predicted Force CND
390
Observed
-20
-420
620
-620 380-220 -20
PredIcted Force C^O
Figure 5.5: Predicted and observed forces (with 95% confidence intervals for predictions) for the X and Y component forces (top and bottom figure respectively) from calibration data on the left-handed dynamometer.

Observed
Force
CN}
680Fitted
□ Observed
480
280
80
120
-320
300-300 - 1 0 0 100 500 700
Predicted Force CN}
Figure 5.6: Predicted and observed forces (with 95% intervals for predictions) for the Z component forces during calibration of the redesigned handle.
157
Software Design and Development
Early Approaches to Data Collection and Presentation of Forces in Three
Dimensions
In addition to developement of the hardware it was necessery to design
appropriate software to provide an effective and efficient means for collecting,
storing and displaying the three dimensional force data.
Presentation of an individual’s static strength in three dimensions was
constructed from a series of vertical slices or planes about a central vertical axis,
where each vertical plane was comprised of a single PSD containing 36 force
vectors 10* apart. With the original PSD (see Chapter 4), as the vertical plane
directly in line with the Y axis as 0*, the complete sphere of exertion (i.e. a 3D
PSD) was described by 18 successive PSD’s at 10’ intervals about the Z axis.
Data collection procedures required the subject to explore one of the 18
vertical planes at a time. If the subject produced resultant forces which deviated by
more than 5* either side of the chosen vertical plane then the computer provided
feedback via a beeping sound.
Visual feedback of the direction and magnitude of the resultant force was
also presented to the subject on a VDU screen. Angular deviations of the resultant
force in the XY plane were displayed on a circle indicating which of the 18 planes
of exertion was being explored.
The procedure for collecting and displaying forces exerted in the chosen
vertical plane followed the same methodology as that described for the PSD in
Chapter 4. Once the subject had completed the chosen plane, the force data was
stored on floppy disc for later analysis. An option was then provided to continue
data collection in another vertical plane or to cease testing. This allowed data
collection on an individual subject to be spread over different testing sessions.
158

Initial trials revealed that the above approach to data collection was
inefficient and time consuming. Forces directed outside the limits of the chosen
plane were not recorded, and directing exertions only in the chosen plane was
found to be difficult. This resulted in a substantial "wastage of effort" by the
subject which inevitably contributed to fatigue and increased the time required for
rest pauses during data collection.
Based on the time required to produce a single PSD it was estimated that
the complete sphere of exertion may take over 6 hours to complete. Although data
collection could be spread over several sessions to minimise fatigue effects, a
more efficient approach to data collection was clearly required.
Software Redesign
On-line Data Presentation
On-line presentation and collection of data was modified so that forces
were sampled and recorded irrespective of their direction of exertion. An example
of the on-line screen display is shown in Figure 5.7. In this figure the sphere of
exertion is divided into 10* sectors in "latitude" and "longitude" and presented
onto a 36 by 19 rectangular matrix in a similar manner to that of a Mercator’s
projection. The darkness of the character printed at each location on this matrix
indicates the intensity of the maximum force exerted in each sector.
A total of 32 user defined characters were designed and used to represent
the intensity forces as a percentage of body weight from 0% to 100%. The full
character set and their corresponding force levels are shown in Figure 5.8.
As the subject explores different directions of exertion the display becomes
gradually filled with these characters. The direction of a resultant force at any
instant is indicated by projecting the displayed character in the appropriate sector
in a contrasting colour. If the subject reenters a sector in which a force has been
159

previously recorded the displayed character is only updated if the new resultant
force is greater than the previous.
SUBJECT NO. 2 27/Mar/91 16:51:0340 MINUTES ELRPSED
RIGHT HRNDLEPUSH LEFT PULL RIGHT PUSH
UP—T-
HZ-
DN
r if. r r * r r » ■. ’. > ■> .'x
■.;/. <•_ i. . i . . ' . • . * . ' .■ /. i , . . . . .. •,rv.r> ^ ^ ../
r V Vr / i r or irVx.. *7 .
PUSH LEFT PULL RIGHT PUSH
Figure 5.7: The on-line screen display for presentation of the direction and intensity of static manual forces measured by the three dimensional strength testing dynamometer.

I
Figure 5.8: The user defined character set used for indicating force intensity in the on-line display. Forces equal to 0% and 100 % of body weight are represented by the solid white and solid black characters respectively. The 30 other characters, ranging from the lightest to the darkest, represent increasing levels of force in steps of approximately 3% of body weight.
161

After every 2 minutes of exertion, data collection ceases and the computer
provides an audible cue for the subject to take a rest pause. During the rest pause
an update procedure identifies those sectors in which no force had been exerted. If
these sectors are bordered by 4 sectors containing forces then the average value of
the forces in the bordering sectors is used to determine the character to fill the
middle sector. In addition, the top and bottom rows of the display (which represent
a Vertical lift and vertical press respectively) are filled in with characters
representing the highest resultant force recorded at each pole. It was assumed that
this update procedure would reduce the time and effort required to complete the
sphere of exertion on the basis that these isolated empty sectors would be difficult
to target.
At the end of an experiment the subject data (i.e height and weight) as
well as the unsmoothed resultant forces and their X, Y and Z components for each
sector may be saved to disc. This data can then be retrieved and added to at a later
date or be transferred to an Archimedes microcomputer for off-line data analysis.
Off-line Data Presentation
Individual or group mean data are smoothed in a similar manner as
described above. The off-line smoothing algorithm is based on the premise that
peak forces in an individual sector were unlikely to be lower than peak forces in
the four immediately adjacent sectors. During one smoothing operation a forward
and backward pass is made on the force data locating those 10* sectors which are
immediately bordered by sectors containing larger forces. During each pass these
"troughs" are smoothed by being replaced with the mean value of the forces in the
four adjacent sectors. Although multiple passes may be performed the smoothing
process is self limiting. As soon as a smoothed sector becomes equal to, or greater
than one of the surrounding sectors, that sector will no longer smooth.
Smoothed or raw force data can be presented as a set of 18 PSD’s or as a
contour map. The former format presents the data in the same manner as that
162

described in section 5.4. An additional nineteenth PSD is also presented to show
the pattern of forces exerted in the horizontal (XY) plane when the vertical (Z)
force component was zero.
An example of the output for one vertical plane of exertion is shown in
Figure 5.9. The plane of exertion is for the -70* PSD and is indicated by the
arrows on the smaller circle. The arrows also show the side from which the plane
of exertion is viewed. The data represent average one-handed maximal static
strengths (+ one standard deviation), as a fraction of body weight, for four male
subjects. Exertions were performed with a horizontal foot placement of 0.5 m
from the handle, and at a handle height of 1.75 m. A cubic spline function was
fitted through the data points as described in Chapter 4.
An overall representation of the sphere of exertion was obtained from a
contour map of the strength data. The presentation is similar to that of the on-line
display except that intensity of exertion is represented by different coloured
contour regions. Various shades of blue, green, yellow and brown indicate regions
of increasing force from 0% to 100% body weight in 5% body weight intervals. A
key showing the 20 different colours used and their corresponding levels of force
is shown below the contour map. (See the results section for examples of the off
line screen display showing contour maps of static strength for the sphere of
exertion).
163
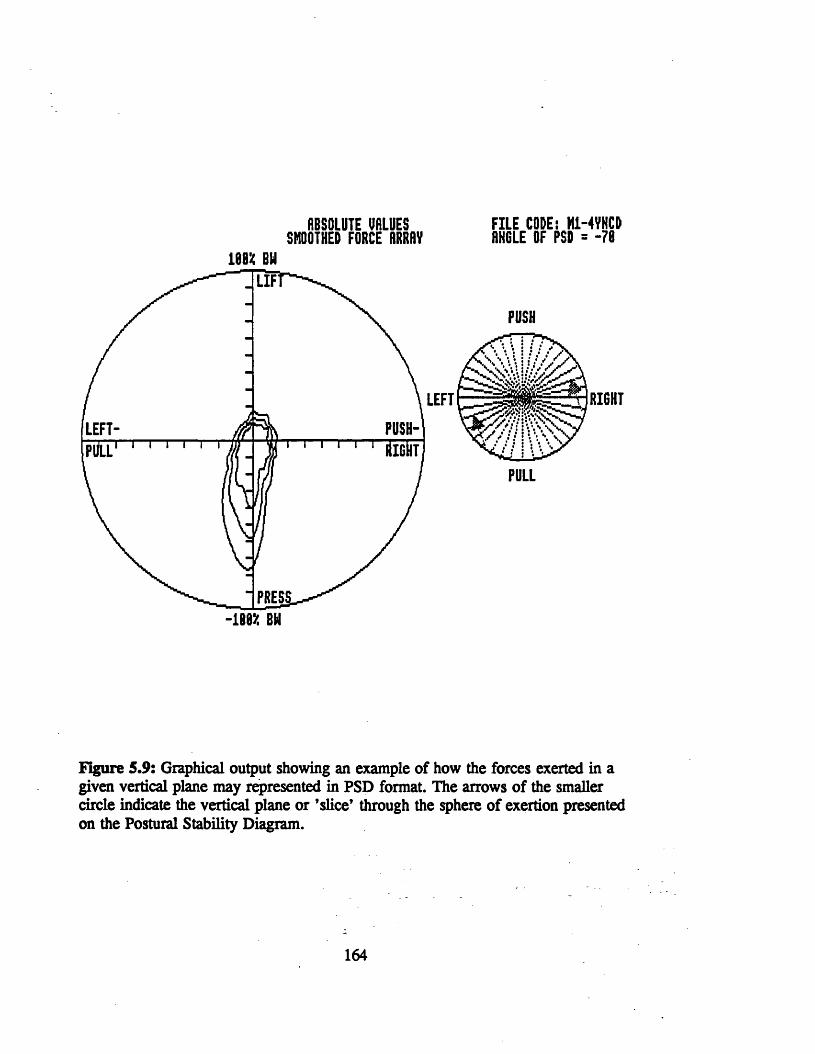
ABSOLUTE VALUES SMOOTHED FORCE ARRAY100* BU
LEFT
FILE CODE: M1-4YHCD ANGLE OF PSD = -78
PUSH
jRIGHT
PULL
-1005! BU
Figure 5.9: Graphical output showing an example of how the forces exerted in a given vertical plane may represented in PSD format. The arrows of the smaller circle indicate the vertical plane or ’slice* through the sphere of exertion presented on the Postural Stability Diagram.
164

In order to produce the relatively smooth contour lines for the contour plot,
linear interpolation was used to calculate resultant forces for every 1 * sector in
"latitude" and "longitude". This effectively resolved the sphere of exertion into
64,442 individual resultant force vectors.
Using the same form of display it was also possible to generate a map of
the minimum coefficient of friction, p, required to prevent slip for all directions in
the sphere of exertion. This was calculated from the horizontal and vertical force
vectors (Fx, Fy and FJ using the formula below.
The same colour scale as that used for presentation of forces was used to
denote increasing values of coefficients of friction from 0.0 to 1.0 in steps of
5.8Fz + B o d y W e ig h t
0.05.
165

Experimental Work
Objectives
The experimental work aimed to address the final problem of
development, namely that of designing a suitable protocol for data collection. The
main objectives were to:
(1) Devise a testing protocol which would enable an individuals one-handed
whole body static strength capabilities to be assessed in all directions in
three dimensional space with the minimum influence of fatigue;
(2) Given the conditions in (1), to determine the minimum time required
for an individual subject to produce a completed sphere of exertion;
(3) Assess the reproducibility of the strength data under given experimental
conditions;
(4) Test the validity of the proposed testing protocol under different
postural constraints.
166
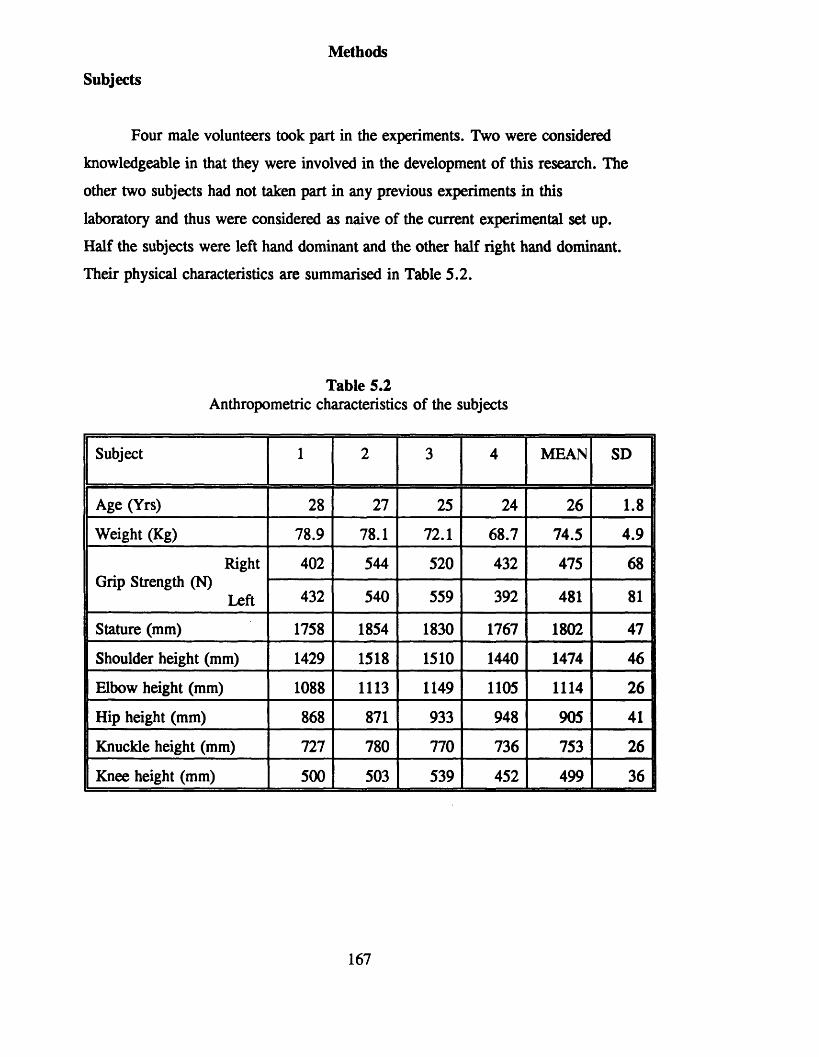
Subjects
Methods
Four male volunteers took part in the experiments. Two were considered
knowledgeable in that they were involved in the development of this research. The
other two subjects had not taken part in any previous experiments in this
laboratory and thus were considered as naive of the current experimental set up.
Half the subjects were left hand dominant and the other half right hand dominant.
Their physical characteristics are summarised in Table 5.2.
Table 5.2Anthropometric characteristics of the subjects
Subject 1 2 3 4 MEAN SD
Age (Yrs) 28 27 25 24 26
oo
Weight (Kg) 78.9 78.1 72.1 68.7 74.5 4.9
RightGrip Strength (N)
Left
402 544 520 432 475 68
432 540 559 392 481 81
Stature (mm) 1758 1854 1830 1767 1802 47
Shoulder height (mm) 1429 1518 1510 1440 1474 46
Elbow height (mm) 1088 1113 1149 1105 1114 26
Hip height (mm) 868 871 933 948 905 41
Knuckle height (mm) 727 780 770 736 753 26
Knee height (mm) 500 503 539 452 499 36
167

Apparatus
Early experiments were carried out using the initial right-handed version of
the dynamometer while the left-handed version was reconstructed according to the
new design. It was assumed that there was no cross-talk between the transducers
and mid-range values (derived from the initial calibration trials) were used for the
calibration constants. The accuracy of the dynamometer under these conditions is
given in section 5.3.
Experiments performed at the 1.75 m handle height were conducted using
the redesigned left-handed dynamometer in which cross-talk between the
transducers was assumed to be present. The calibration constants and accuracy of
the dynamometer for this design are given in section 5.4.
The outer frame of the dynamometer was mounted securely to a wall via a
scaffolding structure so that the centre of the handle was 1.0 metre above the
ground. Slippage was prevented using the same shoe/floor combination as
described in previous chapters.
Grip strength of the hand to be used in the exertion was measured with a
hand grip dynamometer (Takei and Company Ltd) with grip size adjusted to the
preference of the subjects.
Procedure
Subjects’ unshod weight and stature were measured and entered into the
computer. Before starting each experiment grip strength was determined from the
best of two efforts. The subjects were then positioned in front of the dynamometer
so that the centre of the handle was aligned with the mid-line of the body at a
horizontal distance of 0.5 metres from the toes.
168

Experimental conditions were the same as those employed for the PSD in
Chapter 4. The only additional constraints were; (1) that toe-heel alignment was
parallel to the Y axis and no wider than shoulder width apart and (2) that the toes
remained on the floor and 0.5 metres from the handle at all times.
Instructions to subjects required them to perform steady maximum
exertions on the dynamometer handle in all possible directions in three
dimensional space. The initial direction of exertion was chosen at random by the
subject. As the experiment progressed the subject was encouraged to explore other
directions of exertion and to take frequent rest pauses. A compulsory rest pause
was however introduced after every two minutes of sampling. The duration of this
rest pause was dictated by the individual subjects and was recorded using a stop
watch.
During each compulsory rest period the subject was asked to report any
discomfort and to indicate their present level of fatigue on a 100 mm line. The
extreme left-hand of the line was labelled as "no fatigue" and the extreme right-
hand as "absolute exhaustion". Their level of fatigue was scored as the distance in
millimetres from the left-hand extreme. The left-hand extreme was considered as a
base line for the level of fatigue at the start of the experiment. Successive reports
of fatigue were recorded on separate 100 mm lines with previous responses hidden
from view.
In order to avoid excessive fatigue, experiments were limited to one session
involving 10 minutes of data collection during any one day. A direct measure of
fatigue was made by comparing grip strength at the start of the experiment with
that obtained immediately after the fifth two minute period of data collection.
Successive experiments were performed a minimum of one day apart. In
subsequent trials, the subject was presented with the force data obtained from the
previous session and instructed to complete the sphere of exertion, or attempt to
better the forces already recorded.
169

The full sphere of exertion was considered complete when; (1) all sectors
contained some level of force (whether actual data or interpolated data) and, (2)
the mean difference in force added between successive sessions (over the whole
sphere of exertion) was less than 1 % of body weight. This criterion was chosen as
a compromise between (1) providing an accurate and reliable measure of an
individuals static strength in all directions and (2), the amount of time that could
be reasonably expected for the subject to complete a full experiment.
Statistical criteria for determining the end point of the experiment were
investigated and discarded. Due to the nature of data collection, the difference
between absolute forces recorded in successive experiments is never negative.
Thus when each resultant force vector is subtracted from its corresponding force
vector recorded on a subsequent occasion, the distribution curve observed for the
force differences is not normal but forms an extremely skewed J-distribution.
Under these conditions using statistical analysis as a criterion for completion of the
sphere of exertion would be inappropriate.
Reproducibility of the data, collected using the right-handed dynamometer,
was investigated by retesting the subjects under the same conditions three weeks
after completion of the initial sphere of exertion. Validation of the methodology
was performed under different postural constraints by testing the same four
subjects one month after the repeat trials at a bar height of 1.75 m. The latter
experiments followed the same instructions and protocol as for the 1.0 m bar
height except that exertions were performed with the left hand.
170

Data Analysis
A comparison of fatigue responses, duration of rest pauses and changes in
grip strength within testing sessions, between testing sessions and between handle
heights were analyzed using a three way repeated measures analysis of variance
(ANOVA). The test-retest reliability coefficient7 was used as a measure of the
repeatability of the force data over the sphere of exertion (Ferguson 1976).
Analysis of the strength data between the 1.0 m and 1.75 m conditions was
limited to simple descriptive statistics due to the small number of subjects.
Individual subjects’ strength data were smoothed before combining the data to
produce group mean plots for the contour maps and the PSD slices.
7 The reliability coefficient is determined from the formula
_ E <*ii - - 1*)
where
r„ = the reliability coefficient Xa = the ith force value on the initial trailXjj = the ith force value on the repeat trialNp = the total number of data pairs
= the standard deviation of strength measurements for the initial trial.<j2 = the standard deviation of strength measurements for the repeat trial.H = the grand mean of the force measurements over the initial and repeat trials.
171

Results
Three Dimensional Static Strength Measurements at the 1.0 metre Handle
Height
During the initial trials at the 1.0 m bar height all four subjects completed
five 10 minute sessions of data collection. The two experienced subjects managed
to satisfy the criterion for successful completion of the sphere of exertion after
four 10 minute sessions. In comparison the two naive subjects showed an average
increase in force of 1.6% and 2.9% of body weight over the sphere of exertion
between the fourth and fifth 10 minute sessions.
During the repeat trials four 10 minute sessions were completed by each
subject. The number of 10 minute sessions required to satisfy the criterion for
successful completion of the sphere of exertion was reduced to three for the two
experienced subjects and four for one of the naive subjects. The remaining naive
subject produced an average increase in force of 2.6% of body weight over the
sphere of exertion between the third and fourth 10 minute sessions.
Figure 5.10 shows the mean increase in force (as a percentage of body
weight), averaged over the four subjects, that was added to the sphere of exertion
following each successive experiment during the initial trials at the 1.0 m bar
height. After the first experiment, the mean force added over the sphere of
exertion was approximately 18% of body weight. During subsequent experiments
the amount of force added to the sphere of exertion declined exponentially. By the
time the subjects had completed the fifth experiment, the mean increase in force
between successive experiments had reached the 1% of body weight criterion for
completion of the sphere of exertion.
172

r\
9
4
1(0
□ 1 2 3 4 5Exper i ment Number
Figure 5.10: Mean increase in force added to the sphere of exertion following successive experiments at the 1.0 m bar height. Solid line = raw force data, dashed line = force data after 1 smoothing pass, dotted line = force data after 10 smoothing passes. Bars represent standard deviations.
173

Also shown in Figure 5.10 are the effects of the smoothing algorithm on
the mean force data. The largest change in the mean force was observed after 1
smoothing pass (i.e. one forward and one backward pass) with very little change
in the mean force occurring with subsequent passes. A more obvious effect of the
smoothing algorithm is observed when the unsmoothed and smoothed contour plots
are compared. In Figure 5.11 several sectors on the unsmoothed contour plot are
clearly visible due to the fact that they contain considerably lower levels of force
than their immediately surrounding sectors. In comparison these sectors are less
distinguishable in the smoothed contour plot.
Figure 5.12 shows a contour map of the forces (as a percentage of body
weight), averaged over the four subjects, following 5 experiments at the 1.0 m bar
height. The repeat data at this height is shown in Figure 5.13. Mean forces over
the sphere of exertion (averaged over the four subjects) were found to be almost
identical for the initial and repeat trials (see Table 5.3). Although there are slight
differences between Figures 5.12 and 5.13, on the whole, the general pattern of
the contour lines and their force intensities are very similar. This observation was
confirmed statistically by the high reliability coefficient (0.96) calculated from theof
test-retest forces taken over the entire sphere exertion. The above reliability
coefficient indicates that less than 4% of the variation in strength shown over the
sphere of exertion in Figures 5.12 and 5.13 was attributable to error or test-retest
unreliability.
174

0 10 20 30 40 50 60 70 60 90 100* BODV UEI6HT
Figure 5.11a and b: Contour maps showing the unsmoothed (this page) and smoothed forces (next page) over the sphere of exertion for subject 2 after 4 experiments at the 1.75 m handle height.
175

0 10 20 30 40 50 60 70 80 90 100X BODY WEIGHT
Figure 5.11b: A contour map of the smoothed forces over the sphere of exertion for subject 2 after 4 experiments at the 1.75 m handle height.
176

Figure 5.12: A contour map representing the mean static strength of 4 subjects over the sphere of exertion for right-handed exertions performed at the 1.0 m handle height. The data was collected over 5 experiments and is presented as a percentage of body weight.
177

Figure 5.13: A contour map representing the mean static strength of 4 subjects over the sphere of exertion for the repeat experiments at the 1.0 m handle height. The data was collected over 4 experiments and is presented as a percentage of body weight.
178
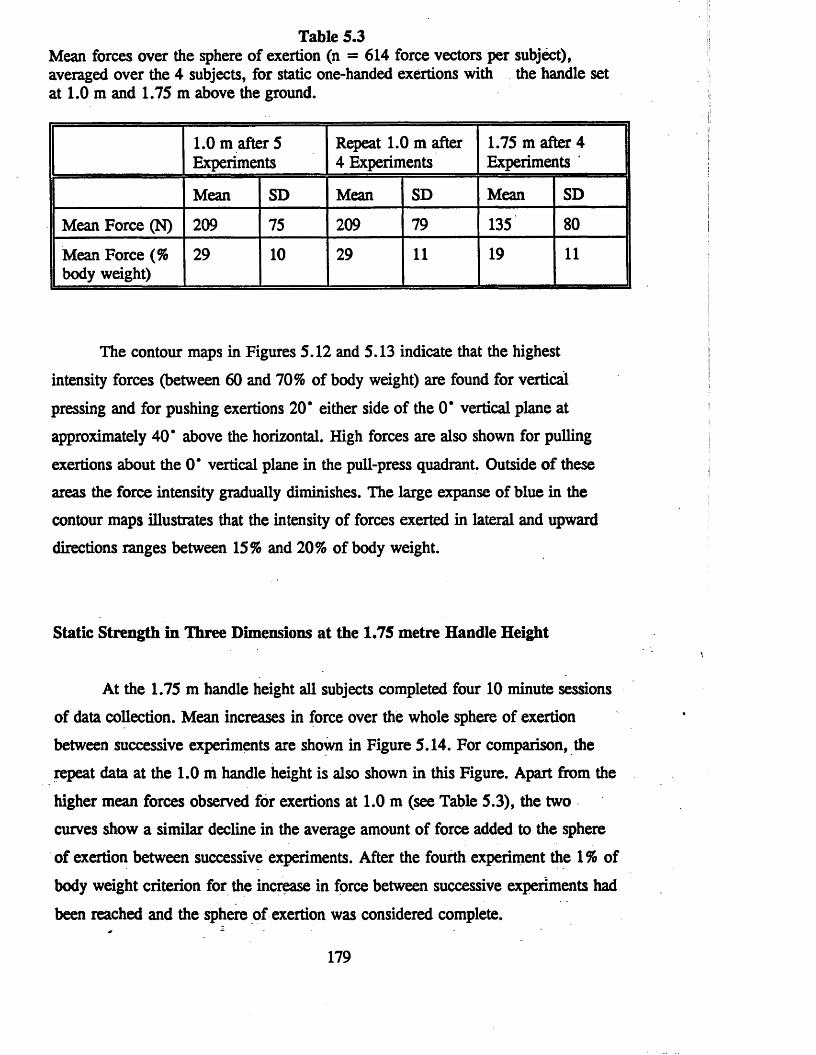
Table 5.3Mean forces over the sphere of exertion (n = 614 force vectors per subject), averaged over the 4 subjects, for static one-handed exertions with the handle set at 1.0 m and 1.75 m above the ground.
1.0 m after 5 Experiments
Repeat 1.0 m after 4 Experiments
1.75 m after 4 Experiments
Mean SD Mean SD Mean SD
Mean Force (N) 209 75 209 79 135 80
Mean Force (% body weight)
29 10 29 11 19 11
The contour maps in Figures 5.12 and 5.13 indicate that the highest
intensity forces (between 60 and 70% of body weight) are found for vertical
pressing and for pushing exertions 20* either side of the 0* vertical plane at
approximately 40’ above the horizontal. High forces are also shown for pulling
exertions about the 0* vertical plane in the pull-press quadrant. Outside of these
areas the force intensity gradually diminishes. The large expanse of blue in the
contour maps illustrates that the intensity of forces exerted in lateral and upward
directions ranges between 15% and 20% of body weight.
Static Strength in Three Dimensions at the 1.75 metre Handle Height
At the 1.75 m handle height all subjects completed four 10 minute sessions
of data collection. Mean increases in force over the whole sphere of exertion
between successive experiments are shown in Figure 5.14. For comparison, the
repeat data at the 1.0 m handle height is also shown in this Figure. Apart from the
higher mean forces observed for exertions at 1.0 m (see Table 5.3), the two
curves show a similar decline in the average amount of force added to the sphere
of exertion between successive experiments. After the fourth experiment the 1% of
body weight criterion for the increase in force between successive experiments had
been reached and the sphere of exertion was considered complete.
179

r\
0> 30<u* 26*0E 2 2
^ 18CDUL AA 0 LLC
Q)Ul(0<DL.UC
3 4□ 1 2ExperIment Number
Figure 5.14: Mean (and standard deviations) of the increases in force between successive experiments at the 1.0 m bar height (repeat experiment), (□ data points) and the 1.75 m bar height (star data points).
180

A contour map of the forces exhibited over the sphere of exertion at the
1.75 m handle height, averaged over the four subjects, is presented in Figure
5.15. The highest forces were observed for vertical pressing and for pushing
exertions directed within 10° of the fore and aft plane (i.e. 0° vertical plane) at
approximately 60° above the horizontal. In comparison with forces at the 1.0 m
handle height, the sphere of exertion at the 1.75 m handle height featured a large
number of directions in which forces ranged between 5% to 15% of body weight.
In appendix C the data in Figures 5.13 and 5.15 are presented in the form
of PSDs to afford a more detailed comparison of the mean and standard deviations
of the forces over the sphere of exertion at the two handle heights.

9 10 20 30 40 50 60 70 80 90 108X BOOV WEIGHT
Figure 5.15: A contour map representing the mean static strength of 4 subjects in three dimensional space for left-handed exertions performed at the 1.75 m handle height (data collected over 4 experiments).
182

Subjective Responses, Fatigue and Grip Strength
Reports by the subjects following each two minute data collection period
revealed that the main area of discomfort was localised to the lower part of the
upper limb involved in the exertion. During trials at both bar heights subjects
consistently reported discomfort in the forearm, wrist and hand or grip. The other
main area of discomfort was the deltoid region of the active shoulder.
The visual analogue scale of fatigue was intended to provide a more
objective evaluation of general fatigue experienced by the subjects following each
two minute data collection period. An analysis of variance of this data (see Table
5.4) indicated that there was no significant difference in the subjects reported
levels of fatigue for exertions performed on different days (p>0.05), or at the
different handle heights (p>0.05). There was however, a significant change
(p< 0.001) in the reported level of fatigue between each two minute data collection
period.
183

Table 5.4Analysis of variance summary statistics for the fatigue ratings taken after each successive two minutes of data collection (variable C) during the four trials (variable B) at the 1.0 m and 1.75 m handle heights (variable A).
SOURCE OF VARIANCE
SUM OF SQUARES
DEO OF FREEDOM
MEANSQUARES
F—RATIO PROB
A (HANDLE) 102.40 1 102.40 2.029 NSB (DAY) 333.23 3 111.08 0.682 NSC (TIME) 21272.46 4 5318.12 11.471 P<0.001S 2291.28 3 763.76 13.724 P<0.0001AB 699.65 3 233.22 0.937 NSAC 958.41 4 239.60 3.885 P<0.05BC 278.34 12 23.20 0.487 NSABC 396.29 12 33.02 0.593 NSERROR AS 151.40 3 50.47ERROR BS 1464.88 9 162.76ERROR CS 5563.29 12 463.61ERROR ABS 2239.35 9 248.82ERROR ACS 740.04 12 61.67ERROR BCS 1715.31 36 47.65ERROR ABCS 2003.46 36 55.65
TOTAL 40209.78 159
Figure 5.16 shows that over the course of an experiment the subjects
reported level of general fatigue increased gradually after each two minute session
in almost a linear fashion. By the end of the final two minutes of data collection of
each experiment, the subjects on average felt they were approximately mid way
between the conditions of "No Fatigue" and "Absolute Exhaustion".
Similar results to the above analysis on the general fatigue were found
following an analysis of variance on the changes in grip strength (see Table 5.5).
There were no significant changes in grip strength between experiments performed
on different days or at the different handle heights (p>0.05). Grip strength did
however drop significantly (p< 0.0001), by an average of 18%, between pre-trial
measurements and measurements taken immediately after the fifth two minute data
collection period of each experiment.
184
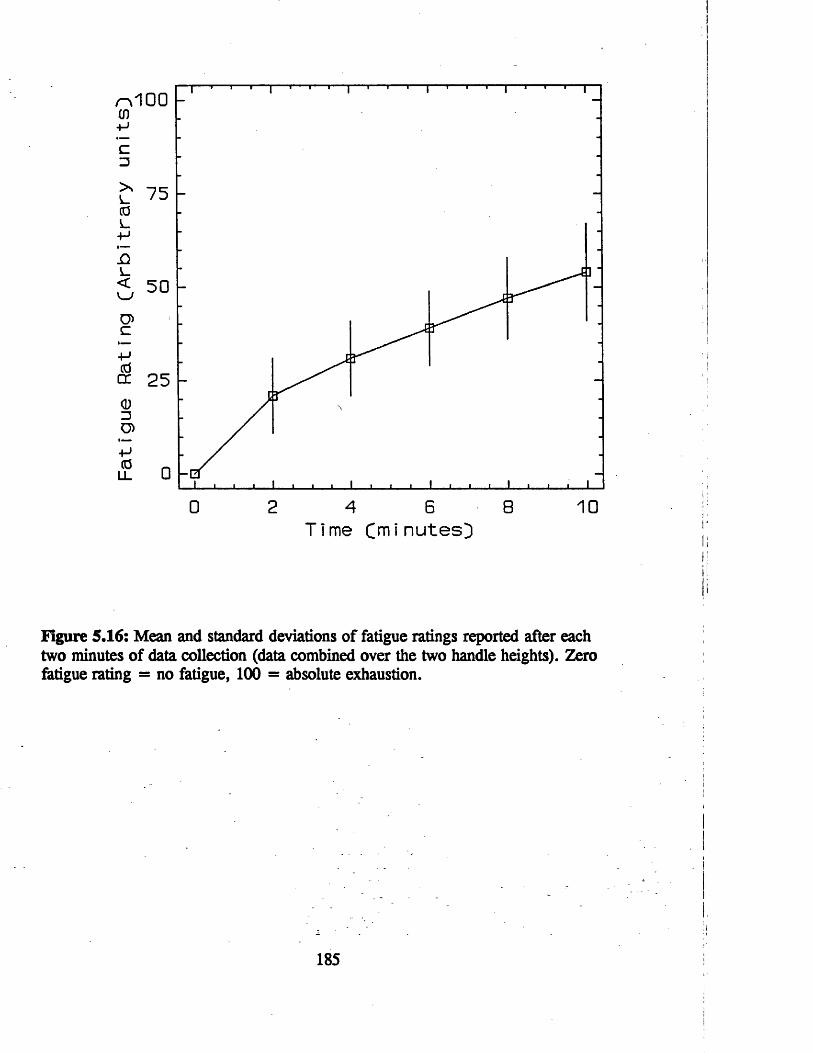
75
50
25
0 2 8 1064Time Cminutes}
Figure 5.16: Mean and standard deviations of fatigue ratings reported after each two minutes o f data collection (data combined over the two handle heights). Zero fatigue rating = no fatigue, 100 = absolute exhaustion.
185
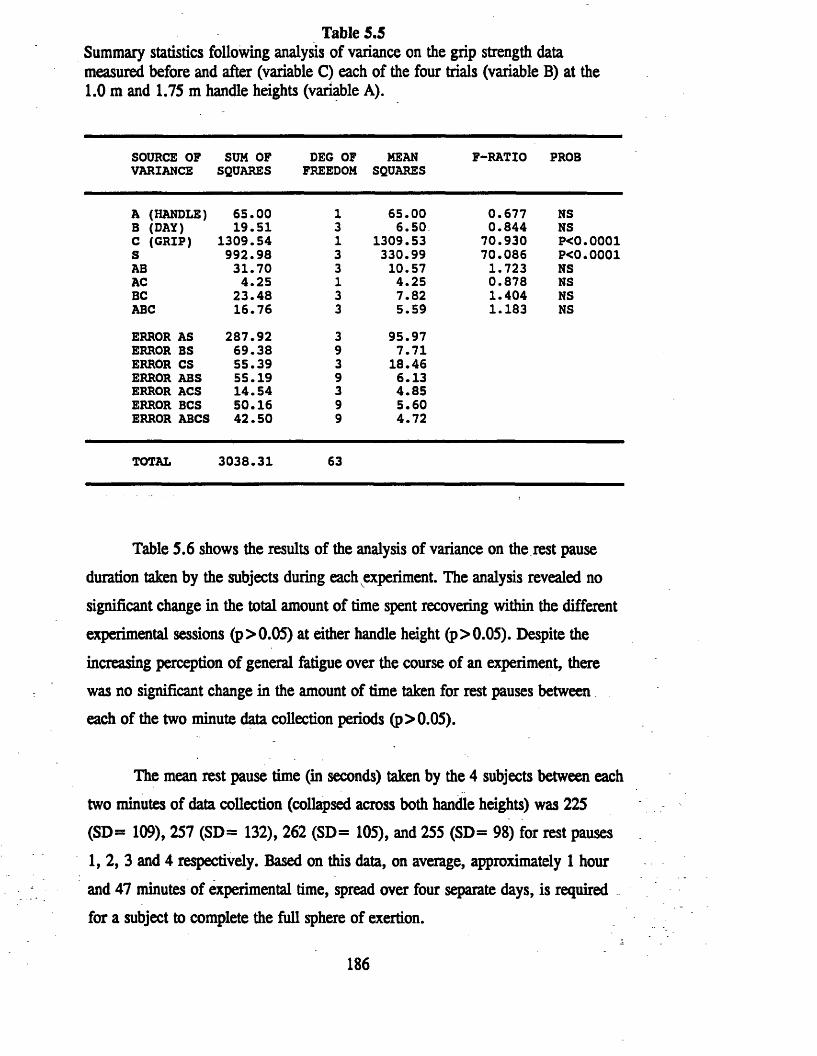
Table 5.5Summary statistics following analysis of variance on the grip strength data measured before and after (variable C) each of the four trials (variable B) at the 1.0 m and 1.75 m handle heights (variable A).
SOURCE OF VARIANCE
SUM OF SQUARES
DEG OF FREEDOM
MEANSQUARES
F-RATIO PROB
A (HANDLE) 65.00 1 65.00 0.677 NSB (DAY) 19.51 3 6.50 0.844 NSC (GRIP) 1309.54 1 1309.53 70.930 P<0.0001S 992.98 3 330.99 70.086 P<0.0001AB 31.70 3 10.57 1.723 NSAC 4.25 1 4.25 0.878 NSBC 23.48 3 7.82 1.404 NSABC 16.76 3 5.59 1.183 NSERROR AS 287.92 3 95.97ERROR BS 69.38 9 7.71ERROR CS 55.39 3 18.46ERROR ABS 55.19 9 6.13ERROR ACS 14.54 3 4.85ERROR BCS 50.16 9 5.60ERROR ABCS 42.50 9 4.72
TOTAL 3038.31 63
Table 5.6 shows the results of the analysis of variance on the rest pause
duration taken by the subjects during each experiment. The analysis revealed no
significant change in the total amount of time spent recovering within the different
experimental sessions (p>0.05) at either handle height (p>0.05). Despite the
increasing perception of general fatigue over the course of an experiment, there
was no significant change in the amount of time taken for rest pauses between
each of the two minute data collection periods (p>0.05).
The mean rest pause time (in seconds) taken by the 4 subjects between each
two minutes of data collection (collapsed across both handle heights) was 225
(SD= 109), 257 (SD= 132), 262 (SD= 105), and 255 (SD= 98) for rest pauses
1, 2, 3 and 4 respectively. Based on this data, on average, approximately 1 hour
and 47 minutes of experimental time, spread over four separate days, is required
for a subject to complete the full sphere of exertion.
186
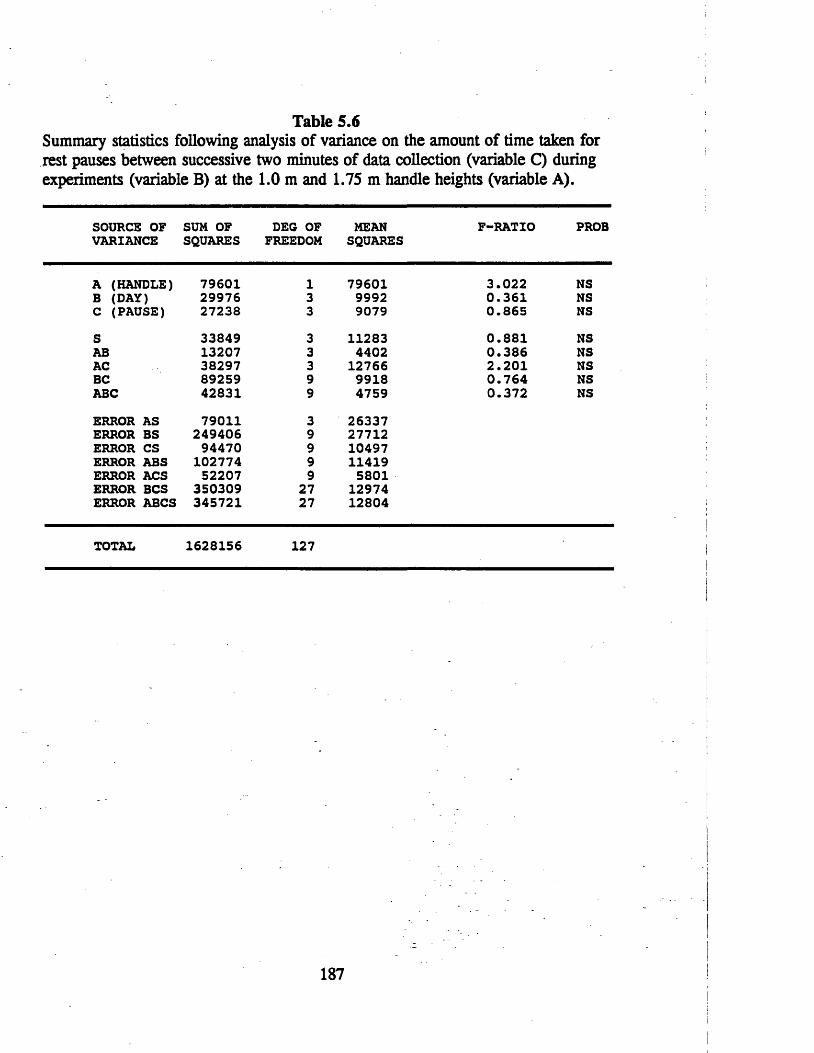
Table 5.6Summary statistics following analysis of variance on the amount of time taken for rest pauses between successive two minutes of data collection (variable C) during experiments (variable B) at the 1.0 m and 1.75 m handle heights (variable A).
SOURCE OF VARIANCE
SUM OF SQUARES
DEG OF FREEDOM
MEANSQUARES
F-RATIO PROB
A (HANDLE) 79601 1 79601 3.022 NSB (DAY) 29976 3 9992 0.361 NSC (PAUSE) 27238 3 9079 0.865 NSS 33849 3 11283 0.881 NSAB 13207 3 4402 0.386 NSAC 38297 3 12766 2.201 NSBC 89259 9 9918 0.764 NSABC 42831 9 4759 0.372 NSERROR AS 79011 3 26337ERROR BS 249406 9 27712ERROR CS 94470 9 10497ERROR ABS 102774 9 11419ERROR ACS 52207 9 5801ERROR BCS 350309 27 12974ERROR ABCS 345721 27 12804
TOTAL 1628156 127
187
Coefficient of Friction Requirements
Contour plots showing the minimum coefficients of friction required to
prevent slip for exertions at the 1.0 and 1.75 m handle heights are shown in
Figures 5.17 and 5.18. For each contour plot the coefficients of friction were
calculated from the mean smoothed component forces of the four subjects for each
of the 614 force vectors over the sphere of exertion. The same linear interpolation
procedures, as used for the force data, enabled the coefficients of friction to be
determined for every 1" sector in "latitude" and "longitude". The data in Figures
5.18 and 5.17 are also presented in PSD format in Appendix C.
The highest coefficients of friction were required for horizontal pullingand below
exertions and pushing exertions directed 20* above the horizontal in the fore and
aft plane at the 1.0 m handle height. In these directions /i values of between 0.4
and 0.6 were required to prevent slip. In comparison, the lesser horizontal forces
applied at the 1.75 m handle height resulted in much lower requirements for the
minimum coefficient of friction over the majority of directions o f exertion.
The mean value for the coefficient of friction over the 614 directions of
exertion was 0.21 (SD = 0.11) and 0.13 (SD = 0.07) at the 1.0 and 1.75 m
handle heights respectively. ■
188

9 . 9 9 . 1 9 . 2 9 . 3 9 . 4 9 . 5 9 . 6 9 . 7 9 . 3 9 . 9 1 . 9 COEFFICIENT OF FRICTION
Figure 5.17: A contour map showing the minimum value for the coefficient of friction required to prevent slip for exertions performed at the 1.0 m bar height. The coefficients of friction were calculated from smoothed force data averaged over the four subjects.
189

9 . 8 9 . 1 9 . 2 9 . 3 9 . 4 9 . 5 9 . 6 9 . 7 9 . 9 9 . 9 1 . 6 COEFFICIENT OF FRICTION
Figure 5.18: A contour map showing the minimum value for the coefficient of friction required to prevent slip for exertions performed at the 1.75 m bar height. The coefficients of friction were calculated from smoothed force data averaged over the four subjects.
190

Discussion
The results illustrate that the dynamometer and current protocol provide an
accurate and reliable way of assessing an individual’s one-handed whole body
static strength in all directions in three dimensional space. Frequent rest pauses
during data collection, as well as additional experiments performed on different
days, are required to ensure that fatigue has minimal influence on the strength of
exertions.
Although the design of the handle made it inherently unstable, subjects
found little difficulty in applying maximal forces in the desired directions. Indeed,
the freedom to rotate the handle about the three perpendicular axes allowed
subjects to position their hand in a preferred orientation for any direction of force
exertion. This ensured that stresses on the wrist joint were minimised and that
maximum forces were not constrained by the posture of the wrist.
Subjective reports did however indicate that the grip, wrist joint and hand
suffered most discomfort during the single handed exertions. As the hand is the
sole area o f contact between the body and the dynamometer it has to transmit
considerable forces during the exertions. Consequently, it is hardly surprising to
find that, by the end of an experiment grip strength declined significantly
indicating signs of fatigue in the forearm musculature. In some cases fatigue in the
grip may have limited the strength of exertion in directions where the strength of
the grip was important in the effective transmission of particularly large forces.
Since the strength of exertions in all directions depends on an effective
coupling between the hand and handle, any fatigue in the grip has important
implications in the safe handling of heavy objects in the work place. In the current
experiments the handle was considered optimal for heavy exertions. Unfortunately,
as discussed in Chapters 2 and 3, hand/object interfaces commonly found in the
workplace are likely to be less than ideal, increasing the likelihood of the object
slipping from the hands, and preventing full use of the strength available.
191

One interesting finding was that the subject’s level of general fatigue, as
measured by self report on the visual analogue scale, increased almost linearly
throughout the course of an experiment. This observation is similar to that found
in a study by Vecchiet et al. , (1983) who observed a similar linear relationship
between the duration of hold of an isometric contraction and muscular pain. It
would seem that individuals perceive general fatigue and localised pain induced
through forceful isometric contractions in a similar manner. This suggests that in
the context of the current experiment the concepts of pain and fatigue may be
closely related. Alternatively, it may have been that the subjects in the current
study were basing their perceptions of general fatigue on somatic sensations of
pain.
Extrapolation of the fatigue responses suggests that continuing exertions
beyond the fifth 2 minute collection period would result in substantial levels of
fatigue. Since it is expected that subjects would add very little additional force
over the sphere of exertion when fatigued, it is suggested that future experiments
should not continue beyond a total of 10 minutes of data collection during any one
testing session.
It was clear from the experimental trials that there was a learning effect as
the subjects gained experience in using the handle and recognised the most
effective postural configurations for the different directions of exertion. This
presumably reflected an initial unfamiliarity in matching the direction of force
exertion with the visual feedback of the on-line display, as well as, inexperience in
selecting the most appropriate posture for a given direction of exertion.
With appropriate instruction the subjects learned quickly and by the fourth
experiment were able to direct forces into given 10* sectors of the on-line display.
The repeat experiments at the 1.0 m handle height showed that the subjects were
able to reproduce their performance successfully on a different occasion. The
experimental protocol used for data collection at the 1.0 m handle height was also
found to be satisfactory for data collection at the higher handle height of 1.75 m.
192

The on- and off-line displays were designed to be an effective way of
presenting the three dimensional measures of strength over the whole sphere of
exertion at once. Because of memory, screen resolution and colour mode
limitations of the BBC microcomputer, the on-line display was limited to using a
four colour mode to portray the direction and intensity of forces. However, once
the data was transferred to the Archimedes the additional processing power and
range of colour modes available permitted extensive use of colour in the
development of the off-line presentations.
Careful consideration was given to the choice of colours to represent the
intensity of forces in the off-line display. The colours chosen were modelled on
those used in cartography to represent elevation on maps of the world. Thus
shades of blue were used to represent low forces, and yellows and browns to
represent the higher levels of force.
As shown in Figures 5.13 and 5.15 the contour maps illustrate quite clearly
the unique pattern and intensities of the forces exerted over the sphere of exertion
at the two handle heights. If finer detail is required the data in these contour plots
may be presented in PSD format for any desired vertical plane and for the
horizontal plane in which the vertical force is zero (see appendix C).
Similar shapes in the PSDs (for the fore and aft plane) were found between
the current results and those observed by Grieve and Pheasant (1981). The
strength data reported by Grieve and Pheasant (1981) was for 10 male subjects
performing two-handed exertions under the same postural constraints as in the
current experiment. The similarity in the data serves to illustrate the importance of
postural constraints on human strength capabilities regardless of whether exertions
are performed one or two-handed.
In order for the three dimensional strength data to have as wide an
application to real life as possible it is necessary to measure strength under less
restrictive conditions than those involved in the current experiments. However, if
193
freestyle conditions of foot placement are allowed, the direction of exertion
relative to the body should still have meaning. Thus adoption of complete freestyle
postures would convey little correspondence with the directions of exertion defined
in Chapter 1 unless certain constraints on foot placement were maintained.
Three dimensional static strength in pseudo freestyle postures may be
investigated in conditions where the feet are required to be placed parallel to, and
equidistant either side of, a line on the floor representing a projection of the Y
axis passing beneath the centroid of the handle. With these provisos it would be
possible to collect three dimensional strength data under pseudo free style
conditions of posture and yet retain the same conventions for directions of exertion
as described in Chapter 1.
Experiments performed under pseudo freestyle conditions are currently in
progress. Figures 5.19, 5.20 and 5.21 illustrate provisional results collected on 11
male subjects of mean age, height and weight o f 26.7 yrs (SD = 3.5 yrs), 1752
mm (SD = 66 mm) and 75.1 kg (SD = 10.1 kg) respectively. The handle heights
investigated were 0.5 m, 1.0 m and 1.5 m above the ground and the data was
collected over four experiments at each handle height (Pinder & Wilkinson, unpublished results).
If the 1.0 m bar heights are compared with the present results it can be
seen that the freestyle exertions exhibit substantially greater forces in many
directions. This presumably reflects the fact that subjects were able to adopt more
favourable postures enabling them to either make greater use of their muscular
capacity, or deploy their body weight to better effect.
The contour maps of the forces presented in Figures 5.19, 5.20 and 5.21
show directions of exertion common to all three heights in which high force values
were recorded. These areas of high forces occurred most notably in the vertical lift
(UP) and vertical press directions (DN) and for push exertions (BACK) 10* to the
right o f the fore and aft plane at approximately 40* above the horizontal. Although
results of the postural data taken during this study have yet to be analyzed, it is
194

hypothesized that these large forces occur when exertions are directed along the
line of the live axis.
195
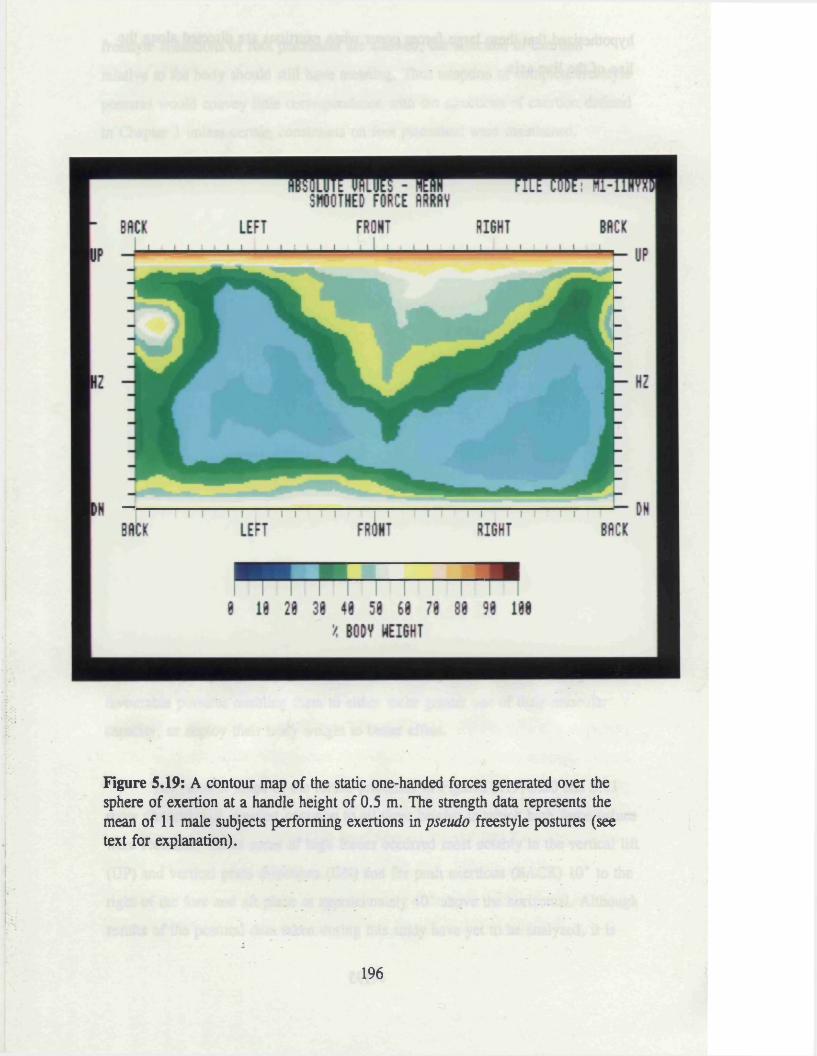
Figure 5.19: A contour map of the static one-handed forces generated over the sphere of exertion at a handle height of 0.5 m. The strength data represents the mean of 11 male subjects performing exertions in pseudo freestyle postures (see text for explanation).
■ * ■ -
196

Figure 5.20: A contour map of the static one-handed forces generated over the sphere of exertion at a handle height of 1.0 m. The data represents the mean strength of the same 11 male subjects as in Figure 5.19. The posture adopted was pseudo freestyle (see text for explanation).
197
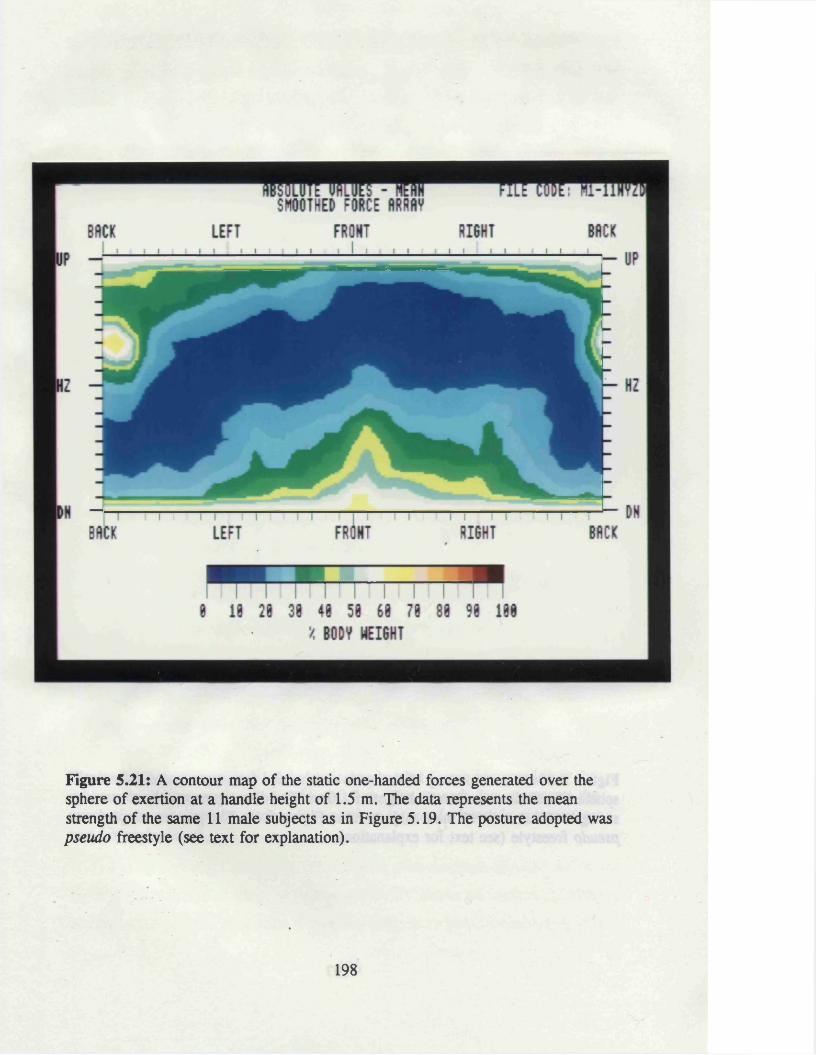
Figure 5.21: A contour map of the static one-handed forces generated over the sphere of exertion at a handle height of 1.5 m. The data represents the mean strength of the same 11 male subjects as in Figure 5.19. The posture adopted was pseudo freestyle (see text for explanation).
198

Coefficient o f Friction
Apart from assessing human strength capabilities in three dimensions the
strength data may also be used to calculate the minimum coefficient of friction
required to prevent slip for maximal exertions performed in any direction. The
contour maps of friction shown in Figures 5.17 an 5.18 illustrate clearly those
directions at both bar heights in which maximal exertions are most likely to result
in slip of the feet if there is a poor foot/floor interface.
The coefficients of limiting friction apply to a single point on the floor
representing the centre of foot pressure. As most exertions are performed with
both feet on the ground the horizontal and vertical reaction forces will be divided
between the two feet. In many cases it is likely that the reaction forces are
unevenly divided between the feet, leading to the possibility that one foot may
slip. Although it is not possible to generate torques at the hand/handle interface
during one-handed exertions, it is possible for the individual to generate a torque
at the feet in the horizontal plane.
In order to separate out the individual component forces acting at each foot
it would be necessary to measure three dimensional forces at one of the feet.
Forces at the other foot may then be calculated by subtraction of these component
vectors from those measured at the hand. Once the forces at each foot are known
it would then be possible to determine which of the feet are likely to slip during
exertions performed in a given direction and posture.
199

Future Development of the Hardware and Software
Most of the improvements which may be made to the current experimental
setup involve the host computer.
The BBC B microcomputer, which runs the sampling and data collection
programs and controls the CED 1401, is currently required to operate at the limit
of its memory and processing capacity. Virtually all the available RAM is used by
the sampling program and any further extension of this program would require
extra memory boards to be added to the BBC. In addition if the sampling rate is to
be increased, the BASIC program needs to be either compiled or a different
computer used as host for the CED 1401.
Ideally the Archimedes would act as the host computer. As the Archimedes
has an improved version of BBC BASIC, very few programming changes in the
sampling program would be required. The additional RAM of the Archimedes
would provide the necessary memory requirements while the superior central
processing unit and operating system would considerably increase the sampling
rate and reduce processing time.
The fact that data may be stored directly onto hard disk in the Archimedes
would also reduce the need for transfer of the data for off-line analysis. Indeed, if
the Archimedes were used for data collection the sampling program could be
altered to incorporate or call up the off-line analysis program at any point during
an experiment.
Other changes which may improve the current experimental set up include
designing a wall mounting for the handle so that it can be easily moved and fixed
at any height above the ground. The wall mounting would need to be secure
enough to ensure that the transducers retain their positions in the vertical or
horizontal planes at all times.
200
Future Research
One possible avenue for future research would be in the development of a
three dimensional static strength prediction program. Unlike currently available
strength prediction programs (e.g. Garg and Chaffin 1975), strength predictions
would be generated from actual observations of whole body strength rather than
from strengths calculated from individual joint torque-angle relationships.
Such a model would however require postural data to be collected in
addition to the strength measurements. As photographic or video methods for
recording postures in three dimensions would be very labour intensive, alternative
procedures would be required to develop the necessary posture library.
One feasible approach to postural data collection would be to use
electrogoniometers to measure the angles across the major joints. Penny and Giles
Biometrics currently market twin axial electrogoniometers for measuring joint
angles in two planes and are about to introduce a tri-axial version for three
dimensional angle measurements. Goniometers of this type permit postural
information to be directly coded and stored in computer memory in ’real’ time. In
comparison, postural data obtained through processing of film or digitization of
video images are likely to be prone to more measurement error (e.g. parallax and
digitization errors) and to take substantially more time to process.
If both strength and postural data are sampled under the control of a
computer program a large library of postures could be built up very quickly. This
posture library would represent the most common postures adopted during
maximal exertions in all of the 614 directions in three dimensional space at a given
handle height. A simple flow chart showing the basic structure of the sampling
routine for a computer program to collect this data is shown in Figure 5.22
In order to describe a posture in three dimensions, the minimum number of
electrogoniometers needed for input of joint angles would be 4 single axis
201

goniometers for the elbow and knee joints, 4 tri-axial goniometers for the hip and
shoulder joints and 1 tri-axial goniometer for the L5/S1 joint of the lower back.
Data from these electrogoniometers may then be input via A/D ports directly into
a computer and used to create a simple 9 segmental model for computerized
representation of the posture.
As the magnitude, direction and point of force application in three
dimensions is known from the output of the 3D dynamometer, and the posture is
known from the electrogoniometer output, it would be possible to determine the
moments in three dimensions about the individual joints, and the back. Link
lengths, their weights, and locations of centre of gravity, would of course need to
be scaled relative to stature and body weight for a given individual or percentile of
the population.
One disadvantage of creating a 9 segmental model based only on
electrogoniometer output is that complex changes in the shape of the trunk as well
as movements of the shoulder girdle are not indicated. While the model may be
sufficient to compute the demands on the low back, detailed analysis of the upper
torso would require additional data on the relative positions of landmarks such as
the acromion, the seventh cervical and eleventh thoracic vertebrae of the spine.
This returns the problem of postural analysis back to either film analysis,
or to one of the more sophisticated optoelectronic computerised motion analysis
systems such as CODA (Chamwood Dynamics Ltd., Loughborough, UK) or
VICON (Oxford Metrics Ltd., Oxford, UK). Which ever method is used the basic
technique for posture analysis in three dimensions is the same. This includes
placing markers on the subject so that the X, Y and Z co-ordinates of various
landmarks may be determined.
202

ENO SAMPUNG ROUTINE
SAMPLE AND PERFORM A/D CONVERSION OF RING TRANSDUCER OUTPUT
CALCULATE RESULTANT FORCE AND DIRECTION OF EXERTION
' *DISPLAY FORCE INTENSITY AND
DIRECTION ON THE ON-LINE DISPLAY
NO / | S RESULTANT FORCE > FORCE PREVIOUS LY
7RECORDED IN THIS DIRECTION
STORE FORCE COMPONENTS IN ARRAY
hSAMPLE AND PERFORM Afl) CONVERSION
OF ELECTROGONIOMETER OUTPUT
STORE JOINT ANGLES IN ARRAY ASSOCIATED WITH THE DIRECTION OF EXERTION
Figure 5.22: A flow chart showing the basic structure of a sampling routine for collection of strength and postural data using input from the 3D dynamometer and electrogoniometers.
203

With film analysis the markers need to be visible in at least two
perpendicular views to define the X, Y and Z coordinates. This necessitates the
use of either dual cameras or a mirror system. A detailed account of the
methodology and techniques used in stereophotogrammetry is provided in Grieve
and Pheasant (1982). Although relatively cheap, stereophotogrammetry requires a
considerable amount of time to process, especially if manual digitization of the.
film images is performed.
The advantages of more expensive computerized optoelectronic systems like
CODA and VICON is that sampling, processing and display of the coordinate data
is done by computer in real time. In addition, some systems (e.g. Orthotrak,
Motion Analysis Corporation, Santa Rosa, CA, USA) also permit force or EMG
data to be measured and presented simultaneously with the postural data. Accuracy
of the posture data will however be dependent on the sensors being able to locate
the position of the markers in space. With some postures it is highly likely that
one or more of the markers will be hidden from the camera or sensors of the
motion analysis system.
Thus in order to provide a comprehensive and accurate description of any
adopted posture in three dimensions in combination with three dimensional
strength measurement, it may be necessary to combine electrogoniometer data with
postural data collected from either film or one of the optoelectronic motion
analysis systems.
Strength and postural data collected in such a way may afford a useful
comparison with the Three Dimensional Static Strength Prediction Program
marketed by the Regents of the University of Michigan, Centre for Ergonomics. In
light of the assumptions of the above model (see Chapter 2), such a comparison
would provide a worthwhile validation of the Three Dimensional Static Strength
Prediction Program in many more directions of exertion than has previously been
studied.
204

If however, three dimensional postural and strength data is collected over a
larger number of subjects and over a range of handle heights, it may be possible to
develop a comprehensive three dimensional static strength prediction program
based on actual observations of whole body strength in real postures. Strength data
would have to be collected at handle heights relative to stature, and the postures
adopted must allow the directions of exertion to be described accurately by the
conventions in Chapter 1.
Linear regression equations of strength on body weight could then be
created for each of the 614 directions of exertion for each handle height. These
equations along with their associated postural data would be incorporated into a
computer prediction program. Using the linear interpolation procedures described
by Sanchez (1991) to predict both posture and strength between the nodes of data
collection (i.e. different handle heights) for the different directions of exertion, it
may then be possible to predict static strength for any direction and at any height
in the work space.
Such a model would have significant relevance to industrial safety and
work place design. Appropriate use of the strength data would enable the
Ergonomist to make better judgements on whether task-demands are within a
workers* physical ability. The posture library would also be useful in determining
the space requirements for manual handling tasks.
The measurement of static strength in three dimensions also opens up
possibilities for testing the Equations of Static Exertion (ESE) and exploring the
MACE concept in three dimensions. The ESE for exertions performed in the fore
and aft plane (YZ plane) is derived in Chapter 2. By the same principle, if the free
body diagram is extended into three dimensions and moments are taken about the
centre of foot pressure, it is possible to describe the ESE for the other two planesf - -
(i.e. the XY and XZ planes). Future experiments measuring posture and static
strength in three dimensions may be devised to explore these personal constraints
on static exertion beyond the fore and aft plane.
205

Similarly, the concept of MACE may also be extended into three
dimensions. Consider a single force vector of magnitude, X Newtons, representing
a maximal, static, manual exertion in a given direction. This force vector has
components in other directions in three dimensions which lie on the surface of a
sphere whose diameter is X Newtons. If the maximal resultant vectors are known
for all possible directions, and the spheres representing the components of each
vector in the other directions are drawn, they would generate a new outer envelope
of forces covering the sphere of exertion. This outer envelope represents the
maximum components in each direction that are possible by employing resultant
forces in other directions. Using the same definition of MACE as in Chapter 1 the
maximum advantage of using a component of exertion may be calculated for any
chosen direction in the sphere of exertion.
As two versions of the dynamometer have been constructed (one for the left
and one for the right hand) it is possible to investigate two-handed static exertions
in three dimensions. The fact that forces at the hand are measured independently
permits the investigator to break into the closed loop system of two-handed manual
exertions. Analysis of these forces may be useful in determining weaknesses in, or
the favouring of, one side of the body or arm during two-handed exertions.
Use of both handles for two-handed exertions would also make it possible
to measure an individual’s capacity to exert whole body torques at the hands in
any plane. The ability to produce whole body torques has relevance to turning
large knobs or handles (e.g. wheel type control valves) and to any exertion that
requires active force to be exerted with one arm while the other acts as a brace.
Some of the questions which may be posed in future studies include:
• Is there an optimal handle separation for development of maximal whole body
torque?
• What effect does handle placement have oh the strength of whole body
torques?
• In which plane of exertion are the largest whole body torques observed?
206

Summary and Conclusions
To the author’s knowledge, a comprehensive description of whole body
strength beyond two dimensions has not been previously attempted. This study
therefore set out to develop appropriate hardware, software and experimental
techniques for measuring static forces in three dimensions. A dynamometer
permitting forces but not torques to be applied to a handle was designed and
constructed for the measurement of forces in three dimensions. The dynamometer
was calibrated and found to give an accuracy of ± 4 N for the resultant force and
± 1 * for the direction of exertion.
Both on and off-line computer displays were developed to present the
direction and intensity of the forces over the whole sphere of exertion. The
component forces at the hands were also used to calculate the minimum value of
the coefficient of friction required to prevent slip at the feet for any direction of
exertion.
Experimental trials were carried out on four male subjects with the handle
of the dynamometer placed at 1.0 and 1.75 m above the ground and with foot
placements at a horizontal distance of 0.5 m from the handle. After an initial
learning period most of the subjects completed the sphere of exertion after 4
experiments performed on separate days. Each experiment consisted of 5 two
minute sessions of data collection interspersed with rest periods of the subject’s
own duration. The strength testing protocol adopted was found to be suitable for
both handle heights and subjects were able to repeat their performance
satisfactorily at the 1.0 m handle height.
In conclusion the apparatus and methodology proved to be accurate and
reliable for measuring static strength over the entire sphere of exertion. The
current work thus provides the basis on which to develop future studies
investigating human strength capabilities in all or any chosen direction in three
dimensions.
207

Possibilities for future research are discussed and include investigation of
both environmental and personal constraints on the static exertion of forces in
three dimensions. The combination of both postural and three dimensional strength
data also has a potential application in the development of a comprehensive
___ biomechanical model for prediction of static strength in three
dimensions. Unlike previous biomechanical models the new model would be based
on observation rather than on measures of whole body strength derived from the
torque-angle relationships across the major joints.
208

CHAPTER 6
STUDY IV
THE CHARACTERISTICS OF MAXIMAL DYNAMIC
LIFTING EXERTIONS ON AN ISORESISTIVE
HYDRODYNAMOMETER
209

Introduction
The objective o f this study was to describe the dynamic characteristics of
maximal lifting exertions under conditions in which the velocity of lift is effort-
dependant. This objective was aided by the instrumentation of a novel strength
testing device called a hydrodynamometer.
The resistance to motion during a lift on the hydrodynamometer is
determined by the rate at which a piston with holes in is drawn through a water-
filled tube. Since the resistance (i.e force at the hands / velocity3*) is constant,
when exertions are performed against a piston of given cross sectional area
moving through a fluid of given viscosity, these type of exertions were termed
isoresistive (see definition in Chapter 1).
By using pistons with different numbers of holes (and hence different cross
sectional areas), in addition to isometric lifting strengths, it was proposed to
measure the strength of lifting exertions performed at velocities ranging from 0 to
2.0 m/s. To the author’s knowledge, this is the first attempt to describe the
characteristics of lifting over such a wide range of velocities.
A further objective of the study was to compare performances on the
hydrodynamometer with isometric lifting strength in comparable postures
throughout the lifting range. It was expected that individuals who perform well (
or poorly) would achieve the same relative performance independent of the test
mode (dynamic or static), posture, or velocity under which maximal lifting
exertions are evaluated.
210

Apparatus
Methods
A photograph of the hydrodynamometer and the experimental set up is
shown in Figure 6.1. The main body of the hydrodynamometer consisted of a flat
cylindrical piston of 20 cm diameter, located in a water-filled tube. The piston was
connected to a handle over a series of pulleys by inextensible wire cable.
Resistance to motion was provided by the viscous drag on the piston. This has
been previously calculated to vary in proportion to approximately the square of the
velocity (Grieve 1991). Large changes in the magnitude of the viscous resistance
offered by the hydrodynamometer could be altered by opening one or more of 48
individual 1.7 cm diameter holes in the cylindrical piston. The five resistances
used were labelled as very heavy (0 holes), heavy (12 holes), medium (20 holes),
light (28 holes) and very light (48 holes). These piston resistances were chosen to
cover the extreme conditions expected for dynamic lifting.
The moving parts of the hydrodynamometer had an equivalent inertial mass
of 6.8 kg.
A force transducer (Ether Ltd, Dynamometer type UF2) determined the
force of the lift by measuring the instantaneous tension in the cable connecting the
handle to the piston. Rotational motion of the hydrodynamometer pulley system
was transmitted via a gearing mechanism to additional pulleys connected to a
velocity and a displacement transducer (JLT Group, Displacement transducer type
PD).
The force transducer was calibrated by clamping the wire cable at the
piston end and then hanging weights of known mass on the handle end. A
calibration curve for the displacement transducer was determined from output
recorded at 16 handle positions between 390 mm and 1855 mm from the floor.
Both transducers gave linear signals over their full range to an accuracy of 1 N
and 1 mm for force and displacement respectively.
211

The velocity transducer operated on the principle of magnetic induction and
consisted of a closely wound wire coil located in a strong magnetic field. The rate
at which this coil was drawn through the magnetic field induced a voltage in the
coil which was proportional to the velocity of lift. During a calibration lift, output
from the velocity transducer was integrated and then compared with the
displacement output. The regression of integrated velocity on displacement was
linear i f — 0.99) and provided calibration constants with a coefficient of variation
of 0.67% over sampling frequencies ranging from 30 to 300 Hz.
Output from the various transducers were amplified using a four channel
amplifier (Racal Instruments Ltd) before being digitized to 12-bit resolution by the
analogue to digital converter (ADC) ports of a CED 1401 intelligent interface
(Cambridge Electronic Design Ltd). Each transducer channel was sampled at 30
Hz under the very heavy condition, 150 Hz under the heavy, medium and light
conditions and 300 Hz under the very light condition. Operation of the CED 1401
was under the control of a BBC B microcomputer (Acorn Ltd.) which was
connected via the 1 MHz bus interface to the CED 1401. Specifically designed
software written in BASIC language was used to perform the calibration and
sampling procedures and present time derivative data (i.e. force-time, velocity
time and displacement-time plots) on a VDU.
Isometric strength was measured using a handle which was connected via a
metal chain to a strain gauge transducer (Model 1269F, Takei KiKi Kogyo Co.,
Ltd) secured firmly to the floor.
Recordings of experimental trials on the hydrodynamometer were filmed
with a 16 mm cine camera (Bolex H 16). The horizontal optical axis was aligned
1.0 m from the floor at a distance of 9.07 m from the sagittal plane of the subject.
Filming speed was set at 32 frames/sec for all lifts except for the very heavy
resistance (12 frames/sec).
212

is himan. *'£££? Wn«* «4%:
Figure 6.1: A photograph of the hydrodynamometer and the experimental set up
213

Subjects
Nine males and nine females at the Royal Free Hospital School of
Medicine volunteered to perform one and two-handed dynamic exertions against
the light, medium and heavy resistances as well as isometric exertions at several
heights above the ground. Most of the subjects were either staff or students with
no specific background or training in strength related sports or activities.
Detailed analysis of two-handed dynamic lifting (which included exertions
against the very heavy and very light resistances) was carried out on one male
(DF) and one female subject (CB). All subjects received information packages
describing the purpose of the experiments and signed informed consent releases.
The physical characteristics of the subjects are shown in Table 6.1.
One particular feature of note is the fact that the male and female groups
were matched very closely for age.
214

Table 6.1The physical characteristics of the subjects
SubjDF
SubjCB
Males(n=9)Mean SD
Females(n=9)Mean SD
Group (n=18) Mean SD
Age (Yrs) 26 24 29.1 11.7 29.1 7.4 29.1 9.5
Weight (kg) 78.1 62.6 74.4 8.7 58.4 5.3 66.4 10.8
Grip (N) 540 353 492 96 301 66 397 127
Stature(mm)
1854 1668 1785 98 1669 55 1727 97
Shoulder height (% stature)
81.9 81.8 82.3 1.0 81.4 1.4 81.9 1.3
Elbow height ( % stature)
60.0 63.2 62.1 1.3 62.8 1.8 62.5 1.6
Hip height (% stature)
47.0 51.9 50.6 1.9 50.2 1.7 50.4 1.8
Knuckle Height (% stature)
42.1 43.5 41.9 1.0 43.0 1.4 42.5 1.3
Knee height (% stature)
27.1 26.4 29.1 1.4 27.9 1.5 28.5 1.6
215

Protocol
On entering the laboratory, the subject’s anthropometry and grip strength
were measured. The hydrodynamometer was then calibrated and the subjects
performed maximal one and two-handed exertions against the high, medium and
low piston resistances. Half the subjects completed the one-handed exertions first
and the other half the two-handed exertions first. The order of presentation of the
piston resistances was fully randomised for both the one and two-handed exertions.
Lifting technique was free style, with foot placement parallel to and directly
beneath the hydrodynamometer handle. The instructions required the subject to
lift as forcefully and as fast as possible from the starting position (390 mm from
the floor) to just above head height. Exertions were performed at intervals not less
than 5 minutes apart. An over arm grip was employed on the dynamometer handle
at the start of each lift.
One and two-handed isometric lifting strength at knee, knuckle, hip, elbow,
shoulder and head height was assessed on a separate day. The protocol followed
that described by Caldwell et al. , (1974) in which strength measurements were
determined from the average force recorded over the final three seconds of a five
second maximal exertion. Foot placement with respect to handle position and type
of grip on the handle was the same as for the dynamic experiments. The order of
presentation of the one and two-handed exertions at the different heights was
randomized in a similar manner to that described above.
For detailed analysis of dynamic lifting, subjects DF and CB wore bathing
costumes so that markers could be placed on the skin to indicate the ankle, knee,
hip (head of femur), wrist, elbow, and shoulder joints and C7, T il and L5
positions of the spine. With the Bolex camera set up as described above, each
subject was filmed performing two-handed exertions against the light, medium,
heavy, very light, and very heavy piston resistances.
216

Reliability of the hydrodynamometer data were tested by comparing the
performance of subjects CB and DF against the heavy, medium and light
resistances with repeated trials performed against the same piston resistances one
month later.
217

Data Analysis
The time derivative data (i.e., force, velocity and power) collected on
subjects DF and CB were smoothed using an unweighted 11 point moving average
before presentation. The force, velocity and power data for each subject was
converted from time derivative data into distributions corresponding with 0.25%
intervals of stature before being combined for group analysis.
The influences and interactions of sex, handle height, number of hands and
piston resistance on force and power output and on the position of maximum force
were analyzed using split plot repeated measures analysis of variance. The same
form of statistical analysis was performed on the isometric lifting strength data.
Pearson product-moment correlations were used to examine the
relationships between dynamic and static tests of lifting strength. The partial
correlation technique was used to determine the net relationship between measures
of strength without the confounding effect of body mass. Intercorrelations that
exceeded r = 0.71 (i.e. r2 x 100 = 50%) were judged to indicate a greater
proportion of generality than specificity between the different strength tests
(dynamic or static) and different task resistances. In order to remove the effects of
error variance, the correction for attenuation was applied to the intercorrelations
using estimates of the reliability coefficients for the various strength measures
(Ferguson 1976). The relation between the correlation of true and obtained scores
is given by
where rrxTy = correlation between true scores rn = reliability of X in = reliability of Y
218

Repeatability
RESULTS
Force-displacement traces for the test-retest exertions against the heavy,
medium and light piston resistances are shown for both subjects in Figure 6.2.
Repeatability of the exertions were assessed by calculating the root mean squares
of the differences (RMSD) in the force trace for the first and second trials against
the mean for each piston resistance. The overall mean RMSD for all conditions
and both subjects combined was 15 N for forces recorded between 21% and 99%
of stature.
The largest absolute force differences between trials were recorded against
the heavy piston resistance for both subjects and the light piston resistance in the
case of subject CB. The main force differences between trials for these lifts
occurred between the start of the lift and knuckle height with the remainder of the
lift, above knuckle height, showing no significant difference between trial 1 and
trial 2 (p>0.05). In the remaining exertions there was no significant difference
(p>0.05) between trials throughout the entire lifting range.
Reliability coefficients calculated from the test-retest data of both subjects
for one and two-handed lifting against the three resistances are presented in Table
6.2. All reliability coefficients were greater than 0.92 indicating that less than 8%
of the variation in dynamic strength over the entire lifting range was attributable to
error or differences in performance between the test and retest exertions.
219

Table 6.2Test-retest reliability coefficients for subjects DF and CB for one and two-handed
dynamic lifting exertions against the heavy, medium and light resistances.
RESISTANCE SUBJECT DF SUBJECT CB
ONE-HANDED
HEAVY 0.99 0.95
MEDIUM 0.97 0.94
LIGHT 0.98 0.97
TWO-HANDED
HEAVY 0.98 0.97
MEDIUM 0.99 0.92
LIGHT 0.98 0.96
220

Hard Resistance CDF) Hard Resistance (CB)
900
0 20 40 60 80 100Displ (ft of stat)
Medium Resistance (DF)800
0 20 40 60 80 100Displ (ft of stat)
Light Resistance (DF)
<d300ufe200LI-
100
900
k300
00 20 40 60 80 100
Displ (ft of sta t)
Medium Resistance (CB)800
n600u©400
00 20 40 60 80 100
Displ (ft of sta t)
Light Resistance (CB)
0 20 40 60 80 100Displ (ft of stature)
20 40 60 80 100Displ (ft of sta t)
Figure 6.2: Force versus hand height above the ground for the initial and repeat trials of maximal lifting exertions against the hard, medium and light piston resistances for subjects DF and CB.
221

Physical Characteristics of the Hydrodynamometer
When the force due to the weight and the acceleration of the
hydrodynamometer’s moving parts are subtracted from the force measured at the
hands, the resultant force-velocity curve describes the viscous force characteristics
of the particular piston. Figure 6.3 gives an example of both the measured and
viscous force-velocity characteristics for subject DF against the very light piston
resistance.
After 50 ms into the lift, the total force reaches a peak of approximately
380 N. Ten milliseconds after this initial impulse the force-velocity curve of the
viscous force begins to follow a particular resistance characteristic. At this point in
time, the proportion of the total force at the hands due to the weight and
acceleration of the system’s inertial mass is approximately equal to the viscous
force. After 110 ms the force observed at the hands is used almost entirely to
overcome the viscous resistance. The total time course of the lift from just below
knee height to head height took 900 ms.
The viscous characteristics of each piston resistance is more clearly
illustrated by plotting the viscous force and velocity on logarithmic axes as shown
in Figure 6.4. Linear regression analysis of these log transformations for the 5
piston resistances revealed mean slopes of 1.56 Ns/mm (SD=.+0.16) and 1.50
Ns/mm (SD=jf0.06) for subjects CB and DF respectively. R2 values for the
regression lines were all 0.99 except for the very heavy piston resistance (R2 =
0.90 and 0.94 for subjects CB and DF respectively).
Using a slope value of 1.55 (derived from the log-log graphs of force and
velocity for lifting exertions of CB and DF against the heavy, medium and light
piston resistances) it was possible to test the isoresistive nature of the
hydrodynamometer. For each resistance and for every 0.25% of stature above the
ground the force data (averaged over the one and two-handed conditions for the 18
subjects) was divided by the corresponding velocity raised to the power 1.55. The
222

resulting values expressed in units of Ns1,55/m1,55 are plotted against displacement
in Figure 6.5.
Apart from at the very start of the lift, resistance over the operating range
of the hydrodynamometer was relatively constant against a given piston. Mean lift
resistance (in units of Ns155/m155) for the heavy, medium and light piston
conditions was 1180 (SE = 2.0), 535 (SE = 1.0) and 306 (SE = 0.9)
respectively.
223

500
0.05 sec400 0.11 sec
z 3 0 0w
0.06 secO200
-e- Tota I force1 0 0Viscous frc0.90 sec
D
□ 3 6 9 12 15 18 21 24CX 1003
V e l o c i t y Cnnm/s}
Figure 6.3: Force-velocity characteristics of subject DF lifting against the very light resistance. The contribution of the viscous force to the total force measured at the hands is also illustrated. The numbers presented at various points on the force-velocity curve represent different stages in the time course of the lift (see text for further explanation).
224

r \z"UQ)ULOLL
(n15Ou(n>t-oo
o>o_i
3
8
6
2.4
.2
2
.81 .7 2.5 2 .9 3.31 . 3 2 . 1
Log 10 of Velocity Cmm/s}
Figure 6.4: A logarithmic plot showing the relationship between the viscous force and velocity of lift for exertions on the hydrodynamometer against the very heavy, heavy, medium, light and very light resistances (from the extreme left hand curve to the extreme right hand curve respectively). The mean value of the slopes was 1.5 Ns/mm. The curves were derived using the data from subject DF.
225

1 4 0 0r \inin
-1120<£Nin
840r*<cn z^ 5600) v ccd0)0)Q)cr
V280
25
« |A y g « M ' •Sim*
x x
40 55 70 85
Displacement C% °f stature}100
F igure 6 .5: Resistance-displacement characteristics for theheavy,medium and Ught resistances (top, middle and lower ^ es re^ : h y?d, „ calculated from
one and ^ ^ o n s for the 18 subjects using the formula resistance, = Viscous Force-velocity
226

Detailed Analysis of Dynamic Lifting Exertions
Force-displacement characteristics under the extreme conditions (very light
and very heavy piston resistances) are shown along with the isometric strength at
various fractions of stature in Figure 6.6. Large differences in the magnitude of
the force are observed between the curves in the initial stages of the lift.
Differences in the strength of lift between isometric exertions and the dynamic
resistances tended to decrease in magnitude as the lift progressed towards head
height.
Isometric strength was found to be on average 58% (SD=+37% ) greater
than dynamic strength recorded against the very heavy piston resistance and 206%
(SD=+.80%) greater than the strength recorded with the very light piston
resistance.
Velocity and power-displacement curves against the different piston
resistances are shown in Figures 6.7 and 6.8. The general form for these curves
and the force-displacement curves (Figure 6.2) show a sharp rise during the initial
stages of the lift to a peak, in most cases, at around knuckle height. From this
point the curves declined with a gradient which became less marked as the lift
progressed towards head height. The time course of the lifts from the start position
(400 mm above the ground) to 90% of stature ranged from 80 ms for the very
light resistance to 18 seconds for the very heavy re&sTantir^see Figure 6.9).
Although peak power against the light resistance was larger than against the
very light resistance for subject DF, overall mean power output was greatest
against the very light resistance and decreased with increasing piston resistance for
both subjects.
Lifting against the very heavy piston resistance was notably more erratic
than any of the other exertions with both subjects demonstrating large
perturbations in the force trace between 65% and 75% of stature (see Figure 6.6).
227

These perturbations were investigated further by analyzing the cine film of the
lifting exertions.
228
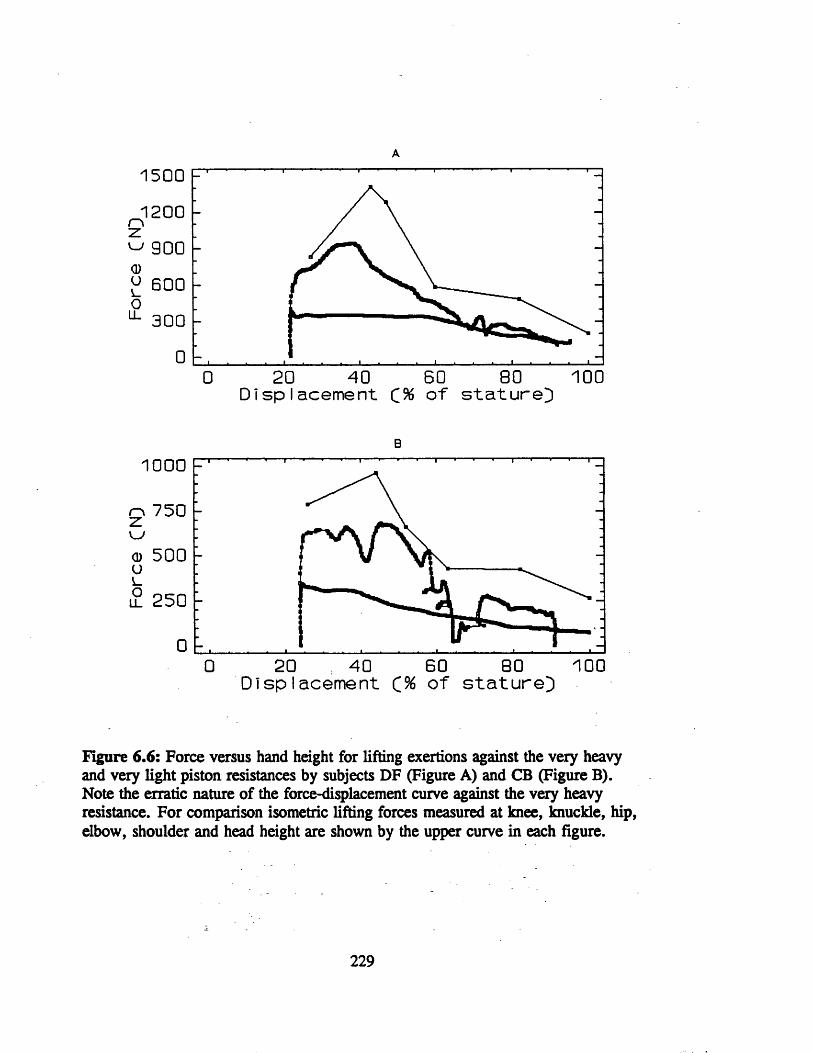
1500 12 0 0 n\
2 :^ 900<Du 600o^ 3 0 0
□D 20 40 60 80 100Displacement C% of stature}
1 0 0 0
2 750 w0 500 u
£ 2500
0 20 . 40 60 80 100Displacement of stature}
figure 6.6: Force versus hand height for lifting exertions against the very heavy and very light piston resistances by subjects DF (Figure A) and CB (Figure B). Note the erratic nature of the force-displacement curve against the very heavy resistance. For comparison isometric lifting forces measured at knee, knuckle, hip, elbow, shoulder and head height are shown by the upper curve in each figure.
B
JLX
A
xx
229

88
44□
80 1 0 0602 0 400 Displacement {% of stature}
88
440
8060 1000 20 40Displacement C% of stature}
Figure 6.7: Velocity versus hand height for lifting exertions against the five different piston resistances by subjects DF (Figure A) and CB (Figure B). The largest velocities are observed against the very light resistance and the lowest against the very heavy resistance.
230

A
800r \
2 0 40 80 1 0 0□ 60Displacement C% of stature}
B800
□ 20 60 80 10040Displacement C% of stature}
Figure 6.8: Power versus hand height for lifting exertions against the five different piston resistances by subjects DF (Figure A) and CB (Figure B). Taken over the entire lifting range the largest mean power is observed against the very light resistance and is shown to decrease as the piston resistance increases.
231

A
8060402 0
0 2 4 6 8 10 12 14 16 18 20Time Cs}
B
80604020
0 2 . 4 6 8 10 12 14 16 18 20Time Qs'}
Figure 6.9: Displacement-time curves for lifting exertions against the five different piston resistances by subjects DF (Figure A) and CB (Figure B). The time course of lift from 21 % of stature to head height increases as the piston resistance increases and ranges from less than 1 second for the very light resistance to almost 20 seconds for the very heavy resistance.
232

Postural Analysis of Dynamic Lifting
Figure 6.10 shows tracings of the postures adopted by subject DF during
lifting exertions against the five resistances. Also marked on these tracings are the
locations of the hip and Cl. The tracings illustrate very similar lifting techniques
against all but the very heavy resistance. A similar phenomenon was also observed
with subject CB.
Differences in the movement pattern against the various resistances is
shown quite clearly when the distance between the hand and C7 is plotted as a
function of the hand height above the ground as shown in Figure 6.11. In this
Figure the data obtained from analysis of the postures adopted against the very
light to the heavy resistance are bounded by the envelopes. The dotted traces
indicate the substantial difference in lifting technique adopted by both subjects
when lifting against the very heavy resistance. The arrows show the point at which
the slope of the curve becomes 1. In other words, after this point the trunk is fully
erect and any further lifting action is performed entirely by the displacement of the
upper limbs.
Similar observations are noted when the height of the hip and C7 and the
difference between C7 and the hip is plotted against hand height (see Figures 6.12
and 6.13). Again the arrows indicate that extension of the hip and torso are
completed by the time the hands have reached hip height.
When lifting against the very heavy resistance both subjects demonstrated a
marked drop in the hips as the hands were brought towards shoulder height. The
drop in the hips was a result of the subject flexing the knees in an attempt to bring
the body underneath the handle and continue the lift with a thrust upwards. This
required a change in grip from an over arm to an under arm posture. In the case
of subject CB several attempts were made throughout the lift against the very
heavy resistance to change from an overarm lift to an upward thrust. These sudden
233

changes in posture resulted in the erratic nature of the force-displacement trace
seen for the very heavy resistance in Figure 6.6.
234

VERY HEAVY«c■4-JCOC
*e3
»
<u£o£ojg.■s
a » p * »M -M
«oCOCS
S iS£ =5

DFhand - C7
350r
0
SLOPE = 1o.
-800l i l i ■ i i i i i i i 1 i 1 i !— I— I— I— I— I— I— I— I— 1— 1— 1— 1— 1 L 1
400 f 19501080
hand height relative to ground (mm)
hand - C7350
0
SLOPE = 1Q.
I-800
. i » . . i i . ■ > i i ■ t i i i i i i i i « i i i i i > t i i i400 t 1 9 5 0
900hand height relative to ground (mm)
Figure 6.11: Displacement traces of the hand with respect to the floor and the position of the C7 spine during two-handed lifts against the five different resistances by subjects DF and CB. The envelopes encompass the data points for exertions against the very light, light, medium and heavy resistances. The dotted trace shows the data for the very heavy resistance.
236

Hip-Ground
950
A
i i i i i i i i i i i i i i i i i i i i
400 1950
I i I I I I I I I I I 1--1---L I I i I ■ I I I I I I I !__ 1-1 I . . J400 1950
Iwft 8 * ft
700
1_400
I i i i i i i i i i i i » i i i i » I I I__!— !— I— I— I—I— I1950
(■■>
Figure 6,12: Displacement traces of the hip and C7 with respect to the ground and of the hip with respect to C7 during two-handed lifts by subject DF against the five different resistances.
237

Hip-Cround
750
400 1050
1_400
A
V
«)s9I9
9aB* n o o fi
1050
700
250
Hand height relative to tha ground (i
Figure 6.13: Displacement traces of the hip and C7 with respect to the ground and of the hip with respect to C7 during two-handed lifts by subject CB against the five different resistances.
238

Group Data for Maximal One and Two-Handed Dynamic and Static Lifts
During lifting exertions on the hydrodynamometer the position of the feet
were raised by 8 cm for the one-handed lifts to ensure the same relative starting
position when using the one- and two-handed handle attachments. In the case of
several taller male subjects this resulted in the displacement transducer reaching
the end of its measuring range by the time the one-handed lifts had reached head
height. In addition, as the starting height of the handle was fixed at 39 cm from
the floor for all subjects, the starting height expressed as a percentage of stature
was different for each subject. The following data analysis and presentation of
results were only performed with data sets comprising of a full complement of
data points (i.e. n=18). Consequently, data for the first 2 or 3 % of stature from
the start of the lift, and those data at hand heights in excess of 95% of stature have
been omitted.
Dynamic Lifting
The dynamic characteristics for one and two-handed lifting exertions
against the heavy, medium and light resistances on the hydrodynamometer are
illustrated in Figures 6.14 to 6.16. The data presented are mean values of force
and velocity at 0.25 % intervals of stature for the 18 subjects. Standard errors
have been omitted from these Figures for clarity. Despite differences in the
magnitudes of the forces and velocities between the different resistances the
general shape of the curves over the lifting range are very similar.
The highest lift forces were recorded for two-handed exertions against the
heavy resistance and the lowest for one-handed exertions against the light
resistance. The smaller changes in lift velocity against the heavy resistance when
compared with the light resistance are reflected by the flatter velocity-displacement
curves of the former.
239

An analysis of variance of the dynamic lifts revealed that peak force
occurred at the same height above the ground irrespective of the lift resistance and
of the sex of the subjects (see Table 6.3). There was however a significant
difference (p< 0.005) in the position of peak force between one and two-handed
lifts. The position of peak force was slightly lower for one-handed lifts (mean
value over the three resistances = 35.9% of stature) than that observed for two-
handed lifts (mean value over the three resistances = 38.4% of stature).
An analysis of variance of the normalized force data collected at knee,
knuckle, hip, elbow and shoulder height, with sex, resistance, number of hands,
and hand height as independent variables is presented in Table 6.4. This analysis
revealed that dynamic lifting strength differs significantly between, (a) males and
females, (b) the number of hands used (i.e. one or two-handed exertions), (c) the
task resistance, and (d) the height of the hands above the ground. A full
complement of Figures illustrating force, velocity and power output over the entire
lifting range for one and two-handed lifting and for males and females is presented
in Appendix D.
Averaged over the three resistances, two hand conditions and five heights,
the female/male normalized dynamic lifting strength ratio was 0.68. When
dynamic lifting strength was expressed in absolute units of force this ratio
decreased to 0.53. Figure 6.17 shows the female/male strength ratios calculated
for every 0.25% of stature over the lifting range. Although some changes in the
female/male strength ratio with displacement are evident in this Figure, the
interaction between sex and hand height above the ground was insignificant
(p>0.05).
The significant interaction between sex and hand condition (1 or 2 handed)
in Table 6.4 revealed that strength differences between one and two-handed lifts
were different for males and females. The mean one/two-handed strength ratio for
the males and females were 0.63 and 0.67 respectively. Thus males showed a
240

greater difference in dynamic lifting strength between one and two-handed
exertions than the females.
Figure 6.18 shows one/two-handed strength ratios for the males and
females over the entire lifting range. The insignificant three-way interaction
between sex, number of hands and hand height (p>0.05) indicate that the two
curves shown in Figure 6.18 follow a similar rate of decline.
The mean female/male normalized strength ratio for one and two-handed
exertions was 0.70, and 0.65 respectively. Analysis of variance indicated the
differences in normalized dynamic strength between males and females were
significantly greater for two-handed exertions than for one-handed lifting exertions
(p< 0.001).
Averaged over the 18 subjects, 5 heights and 3 resistances, two-handed
exertions were found to be 36% stronger than one-handed exertions (p< 0.0001).
However, the difference between one and two-handed exertions changed
significantly according to the height above the ground (p< 0.0001) and the task
resistance (p < 0.005). As shown in Figure 6.19 one/two-handed strength ratios
tended to decrease against all resistances as hand height (displacement) increased.
A slight increase in the one-handed/two-handed strength ratios was however
observed against all resistances when the hands approached shoulder height. The
interaction between hands and resistance is reflected in Figure 6.19 by the larger
differences in the one/two-handed strength ratios observed at the lower hand
heights between the medium and light and the heavy resistance in comparison to
their smaller differences at the higher hand heights. Thus as hand height above the
ground increases the difference in strength against the three task resistances tends
to become less.
241

600
500
® 300
200 — ^ ^ 0 0 — ”." ^ 900
— ,^ 7 0 0 500
>^300100 Ve l . (mm/s)
100
Dlsp l . (% of stature)
® 300 ub 200u.
100
35 45 55 65 75. 85Dlspl . C* of stature)
1100 900
700 500
300 100 Vel .
Figure 6.14: Dynamic characteristics for one-handed (top figure) and two-handed (lower figure) lifting against the heavy resistance. The data are mean values for the 18 subjects. SEM have been omitted for clarity.
242

® 300 ub 200u_
100
35 4 5 5 5 ~ ^33 65 75 85 95
Dlspl . Q% of stature)
1100 900
700 500
300100 Vel. (mm/s)
® 300 ub 200IL
100
55 65 75
Displ . C* of stature)
1100 900
700 500
300100 Vel . Cmm/s)
Figure 6.15: Dynamic characteristics for one-handed (top figure) and two-handed (lower figure) lifting against the medium resistance. The data are mean values for the 18 subjects. SEM have been omitted for clarity.
243

25 35 4 5 5 5 65 75 85 g5
Dlspl. ° f stature}
® 300 1100 900
y j S 700(~^4r 51
ZZI2iIZ21 vel. C"'m/S535 45 55 65 75 85 95
D l s p l • C* o f s t a t u r e }
Figure 6.16: Dynamic characteristics for one-handed (top figure) and two-handed (lower figure) lifting against the light resistance. The data are mean values for the18 subjects. SEM have been omitted for clarity.
244

Q)<0E<DLL
1 -
(0 0 . 8
® 0.4
0 .2 -
0 -
-e- Norma I i zed -|— AbsoIute
I l I l l I l I l i I l I l l I i l l » I t » l l I l l l l I
25 35 45 55 65 75 85Displacement (1% of stature])
Figure 6.17: Absolute and normalized female/male strength ratios over the dynamic lifting range. The ratios were derived from force data averaged over the three resistances and the one and two-handed exertions for the 9 male and 9 female subjects.
245

+->(0L-_Cvo>c<d
-M(/)
■QCD*0C(0nIo
CDcO
1
. 8
. 6
.4-eh F e m a l e s
M a l e s
. 2
0
857525 35 45 55 65Displacement £% of stature}
figure 6.18: Male and female one/two-handed strength ratios over the dynamic lifting range. The ratios were derived from force data averaged over the three resistances for the 9 male and 9 female subjects.
246

o-M(0
0n+jo>
S o+->CO■D<0 _ T5 □ C (0 x:io
£ 0N<DCO
1
8
6
— Heavy— Medium— Light2
0
65 7535 55 8525 45Displacement of stature}
Figure 6.19: One/two-handed strength ratios over the dynamic lifting range for the heavy, medium and light resistances. The ratios were derived from force data averaged over the 18 subjects.
247

Table 6.3Analysis of variance results on the position of maximum forces during dynamic
lifts on the hydrodynamometer
SOURCE OF VARIANCE
NO OF CONDS
SUM OF SQUARES
DEG OF FREEDOM
MEANSQUARES
F-RATIO PROB
A (SEX) 2 0.025 1 0.025 1.166 NSAS 0.348 16 0.022
B (HANDS) 2 0.016 1 0.016 11.234 P<0.005AB 0.000 1 0.000 0.184 NSABS 0.023 16 0.001
C (RESIST) 3 0.017 2 0.008 2.747 NSAC 0.001 2 0.001 0.165 NSACS 0.097 32 0.003BC 0.002 2 0.001 0.428 NSABC 0.000 2 0.000 0.000 NSABCS 0.059 32 0.002
TOTAL 0.588 107
248

Table 6.4Analysis of variance summary statistics for normalised lifting forces on the
hydrodynamometer
SOURCE OP VARIANCE
NO OF CONDS
SUM OP SQUARES
DEG OP FREEDOM
MEANSQUARES
F-RATIO PROB
A (SEX) 2 2.576 1 2.576 9.045 P<0.01AS 4.556 16 0.285
B (HANDS) 2 3.224 1 3.224 253.318 P<0.0001AB 0.227 1 0.227 17.834 P<0.001ABS 0.204 16 0.013
C (RESIST) 3 1.049 2 0.525 61.682 P<0.0001AC 0.022 2 0.011 1.282 NS
ACS 0.272 32 0.009E (HEIGHT) 5 8.731 4 2.183 49.770 P<0.0001AE 0.369 4 0.092 2.105 NS
AES 2.807 64 0.044BC 0.075 2 0.037 7.542 P<0.005ABC 0.015 2 0.008 1.523 NS
ABCS 0.159 32 0.005BE 0.174 4 0.044 9.712 P<0.0001
ABE 0.016 4 0.004 0.882 NSABES 0.287 64 0.004CE 0.388 8 0.049 11.856 P<0.0001
ACE 0.027 8 0.003 0.820 NSACES 0.524 128 0.004BCE 0.080 8 0.010 3.700 P<0.001ABCE 0.019 8 0.002 0.896 NSABCES ,-.5-348 128 0.003
TOTAL 26.151 539
249

Power of Dynamic Lifting
The way in which the power of lift changes with hand height above the
ground is shown for one and two-handed exertions against the three resistances in
Figure 6.20. At the start of the lift power rises quickly to a peak at around
knuckle height and then diminishes in an exponential manner as the lift progresses
beyond this point. The curves show a similar characteristic pattern to those of the
force and velocity-displacement traces.
Analysis of variance revealed that the position of peak power differed
significantly between one and two-handed lifts (F= 5.88; df= 1,16; p<0.05), but
was independent of the sex of the subjects (F= 1.06; df= 1,16; p>0.05). The
position of peak power for one and two-handed lifts occurred at the same point as
peak force. Peak power was greatest for two-handed exertions against the light
resistance and least for one-handed exertions against the heavy resistance. Mean
(and standard errors) of the absolute values of power at the five landmark heights
(knee, knuckle, hip, elbow and shoulder height) and peak power for one and two-
handed lifts against the three resistances are provided in Tables D ll - D15 and
D19 in Appendix D.
An analysis of variance of normalized power (i.e. power/body weight) on
data collected at the five landmark heights revealed similar results to that obtained
from the normalized force data. As summarized in Table 6.5 normalized power
output was found to change significantly between (a) males and females, (b) the
number of hands used (i.e. one or two-handed exertions), (c) the task resistance,
and (d) the height of the hands above the ground.
Average**over all conditions the female/male power ratio was 0.39, which
increased to 0.51 when power was normalized to body weight. The average
one/two-handed power ratio over the three resistances and five heights was 0.54.
250

n 400
| 200
a 100
35 45 55 65 75 85Displacement ( % of stature}
n 400
e 200
a 100
35 45 55 65 75 85Displacement ( % of stature}
® 20D
a 1 0 0
25 35 45 55 65 75 85 95Displacement Q% of stature}
Figure 6.20: Power versus hand height for dynamic lifts against the heavy, medium and light resistances (top middle and lower figures respectively). The data are mean values for the 18 subjects (+SEM). In each figure the top curve is for two-handed lifting and the lower curve for one-handed lifting.
251

Table 6.5Analysis of variance summary statistics of normalised power for dynamic lifts on
the hydrodynamometer
SOURCE OF VARIANCE
NO OF CONDS
SUM OF SQUARES
DEG OF FREEDOM
MEANSQUARES
F-RATIO PROB
A (SEX) 2 302.311 1 302.311 14.777 P<0.005AS 327.342 16 20.459
B (HANDS) 2 260.103 1 260.103 194.000 P<0.0001AB 38.659 1 38.659 28.835 P<0.0001ABS 21.452 16 1.341
C (BUNGS) 3 64.315 2 32.157 24.437 P<0.0001AC 13.175 2 6.587 5.006 P<0.025ACS 42.110 32 1.316
E (HEIGHT) 5 697.164 4 174.291 36.705 P<0.0001AE 63.044 4 15.761 3.319 P<0.05AES 303.897 64 4.748BC 3.738 2 1.869 2.378 NS
ABC 1.035 2 0.518 0.659 NSABCS 25.154 32 0.786BE 36.121 4 9.030 21.975 P<0.0001
ABE 4.844 4 1.211 2.947 P<0.05ABES 26.299 64 0.411CE 9.273 8 1.159 2.228 P<0.05
ACE 2.698 8 0.337 0.648 NSACES 66.584 128 0.520BCE 6.833 8 0.854 2.282 P<0.05ABCE 1.733 8 0.217 0.579 NSABCES 47.907 128 0.374
TOTAL 2365.790 539
252

A Comparison of Dynamic and Static Lifting Strength
The way in which dynamic one and two-handed lifting strength varies with
hand height above the ground is shown in Figure 6.21. During the initial part of
the lift the force rises rapidly to a peak at a point just before the hands reach
knuckle height. As the lift progresses beyond this point the force drops quickly at
first but then begins to level off as the hands approach shoulder height.
An analysis of variance of the normalized isometric lifting forces is
presented in Table 6 .6 . This Table reveals similar results to that found following
analysis of the normalized dynamic forces. Isometric lifting strength changed
significantly according to the number of hands used (p< 0 .0001) and hand height
above the ground (p< 0.0001). In addition, significant two-way interactions were
found between sex and hands (p<0.05) and between hands and hand height
(p<0.05). One major difference between the analysis of normalized dynamic and
static forces is the insignificant effect of sex on normalized static lifting strength.
The female/male normalized static strength ratio averaged over the six
heights and two hand conditions was 0.76, which decreased to 0.60 when
calculated from absolute values of force. The same values for the above ratios are
obtained when lifting strength at head height was omitted from the calculations.
When compared with the f/m ratios obtained with the dynamic strength data the
differences in strength between males and females were found to be less marked
for static exertions than for dynamic exertions.
The mean one/two-handed strength ratio over the six heights was 0.52. As
indicated by the significant two-way interaction between hands and height this
latter ratio was found to vary with hand height above the ground. A comparison of
the dynamic and isometric one/two-handed strength ratios over the five hand
heights above the ground is shown in Table 6.7. Apart from lifting exertions at
elbow height the difference between the strength of one and two-handed exertions
tends to be greater for static lifting than dynamic lifting.
253

When dynamic and static lifting strength were correlated with body weight
fairly low correlations were obtained (see Table 6 .8). Insignificant correlations
(p>0.05) between body weight and lifting strength were observed at shoulder
height. Although the correlations at the other heights were significant (p<0.05)
body weight accounted for less than 50% of the variance in dynamic and static
lifting strength over most of the lifting range. A power curve regression (of the
same form as described in Chapter 4) was also performed to determine if a
multiplicative model would provide a better fit to the data. This analysis did not
produce a better fit to the data than a simple linear regression and in some cases
demonstrated correlation coefficients lower than those in Table 6 .8 .
254

Generality versus Specificity between Dynamic and Static Measures of Lifting
Strength
In order to determine the degree of generality versus specificity between
dynamic and static measures of lifting strength first order partial correlation
coefficients (with body weight held constant) were calculated between the different
strength measures (see Table 6.9). The partial correlation coefficients shown in
Table 6.9 were derived using mean lifting strength values for each subject
combined over knee, knuckle, hip, elbow and shoulder heights. These
intercorrelations were then corrected for attenuation to account for any
unreliability in the strength measures due to error variance (Ferguson 1976). This
latter procedure utilized estimates of the reliability coefficients for dynamic lifting
based on the test-retest data of subject CB shown in Table 6.2.
Estimates of the reliability coefficient for static lifting were based on the
data of Asmussen et a l , (1959) and the test-retest measures for one-handed static
pulling exertions at 1.0 m described in Chapter 3. The strength testing protocol
used in Chapter 3 was very similar to that employed for the static lifting exertions
and revealed a reliability coefficient of 0.83 for freestyle static pulling exertions
against the bar at 1.0 m. It was however expected that the freestyle nature of the
experiments in Chapter 3 would have contributed to a greater amount of error
variance than would have been present with the more formal foot placements
required for the current static lifting exertions. In comparison, Asmussen et al.,
(1959) describes reliability coefficients of 0.92 and 0.91 for isometric trunk and
knee extension respectively. Consequently, a value of 0.90 was chosen as a best
guestimate for the reliability coefficient of static lifting strength.
Using the aforementioned reliability coefficients the intercorrelations in
Table 6.9 were adjusted to provide a true measure of the generality versus
specificity of the dynamic and static strength measures. The proportion of
generality between the different strength measures are given in Table 6 .10. The
255

values in Table 6 .10 are expressed as r2 x 100 for generality. Alternatively, the
degree of specificity between the strength measures is given by (1 - r2) x 100.
256

n 400 zw 300 0)o 200ou- 100
25 50 75 100Displacement (% of stature)
1000
n 800 zu 600 <Du 400 ou- 200
* ■ * ■ ■ 1 ■ ■ ■ ■ 1 ■ ■ « ■ 1 25 50 75 . 100
Displacement (% of stature)
Figure 6.21: Force versus height above the ground for one-handed and two- handed lifting (top and bottom figures respectively) against the heavy, medium and light resistances. The data are mean forces for the 18 subjects (SEM have been omitted for clarity). The top curve in each figure represents the mean (+SEM) of isometric lifting strength measured at knee, knuckle, hip, elbow, shoulder and head height.
257

Table 6.6Analysis of variance summary statistics for normalised isometric lifting strength
SOURCE OF VARIANCE
NO OF CONDS
SUM OF SQUARES
DEG OF FREEDOM
MEANSQUARES
F-RATIO PROB
A (SEX) 2 1.430 1 1.430 3.420 NSAS 6.691 16 0.418
B (HANDS) 2 7.632 1 7.632 189.889 P<0.0001AB 0.198 1 0.198 4.919 PC0.05ABS 0.643 16 0.040
C (HEIGHT) 6 17.417 5 3.483 104.793 P<0.0001AC 0.358 5 0.072 2.154 NSACS 2.659 80 0.033BC 1.707 5 0.341 38.031 PC0.0001
ABC 0.116 5 0.023 2.585 PC0.05ABCS 0.718 80 0.009
TOTAL 39.570 215
Table 6.7One/two-handed strength ratios for maximal static and dynamic lifting exertions.
The ratios for the dynamic exertions were derived from the pooled results for exertions against the low, medium and heavy resistances.
---Position of hands above the ground
Dynamic 1/2 handed strength ratio
Static 1/2 handed strength ratio
Knee height 0.75 0.62
Knuckle height 0.65 0.49
Hip height 0.64 0.48
Elbow height 0.53 0.54
Shoulder height 0.53 0.47
Head height 0.44
258

Table 6.8Correlations of static and dynamic lifting strength with body weight at different
heights above the ground (n=18)
HandHeight
StaticLifting
Dynamic Lifting
1Hand
2Hand
1 Handed 2 Handed
Lght Med Hvy Lght Med Hvy
Knee 0.59 0.51 0.53 0.57 0.56 0.71 0.58 0.60
Knuckle 0.53 0.67 0.55 0.56 0.46 0.56 0 .6 8 0.65
Hip 0.41 0.58 0.59 0.59 0.58 0.63 0.74 0.71
Elbow 0.49 0.62 0.65 0.60 0.61 0.72 0.71 0.70
Shoulder 0.41 0.44 0.43 0.16 0.26 0.53 0.39 0.69
Head 0 .12 0.40 *
Notes:
Correlations marked in bold type are not significant (i.e. p>0.05).
259

Table 6.9Partial correlation coefficients (with body weight held constant) between dynamic lifting strength against the three resistances and static lifting strength (n=18) for
one and two-handed exertions
Isometric Dynamic (Dyn)
Low (L) Med (M) Heavy (H)
1 2 1 2 1 2 1 2
1 0.74 1.0L
2 0.78 1.0
1 0.85 0.92 1.0
DynM
2 0.84 0.84 1.0
1 0.78 0.93 0.91 1.0H
2 0.87 0.87 0.91 1.0
Table 6.10Proportion of generality between dynamic and static measures of one and two-
handed lifting strength
Isometric Dynamic (Dyn)
Low (L) Medium(M)
Heavy (H)
1 2 1 2 1 2 1 2
1 63L
2 70
1 85 93
DynM
2 85 80
H1 70 94 93
2 87 81 93
260

Discussion
Physical Characteristics of the Hydrodynamometer
The current results provide an insight into the physical characteristics of the
hydrodynamometer. The predominant relationship between force and velocity over
the majority of the instruments measuring range is dictated by the viscous
characteristics of a particular piston resistance. Empirical observations using
maximal lifting exertions of two subjects against the five piston resistances
revealed that the force recorded at the hands was directly proportional to viscous
force raised to the power 1.55.
The exact nature of the relationship between velocity and the viscous force
will however depend on the viscosity of the water in the hydrodynamometer. Since
changes in water temperature affect the water’s density and thus viscosity the
above power function may change slightly in hot and cold environments. Despite
this fact, when the resistance of lift was calculated for a given piston condition
using the above empirically derived power function, it was found to be constant
over the majority of the instruments range. This finding thus confirms the
isoresisdve nature of the hydrodynamometer.
The hydrodynamometer does however contain a significant inertial
component and thus a certain amount of force is also required to accelerate the
moving parts of the hydrodynamometer. The clearest example showing the
contribution of the force attributable to acceleration of the systems inertial mass to
the total force measured at the hands was revealed for exertions against the very
light resistance. Under these conditions substantial changes in velocity occurred at
the start of the lift which resulted in a large proportion of the total force at the
hands comprising of forces required to accelerate the inertial mass. It was only
when these large accelerations subsided (at approximately 60 ms after the start of
the lift) that the hydrodynamometer approached an isoresisdve instrument.
261

The contribution of these accelerative forces to the total force at the hands
reduced as piston resistance increased. At the other extreme when exertions were
performed against a very heavy resistance , the physical characteristics of thean
hydrodynamometer approached that of isokinetic device.
262

The Kinematics and Impedance of Dynamic Lifting
A kinematic analysis of the subjects CB and DF performing maximal
dynamic lifts on the hydrodynamometer revealed very similar lifting techniques
against the very light, light, medium and heavy resistances. The initial stages of the
lifting action were characterized by an extension of the legs, hips and back. By the
time the hands had reached hip height the trunk had become fully erect and the
knees fully extended. Continuation of the lift beyond this point was completed
entirely by the displacement of the upper limbs.
Lifting technique did however change significantly when exertions were
performed against the very heavy resistance. The change in technique was
reflected by the erratic nature of the force and velocity curves and was the result
of sudden changes in posture.
These changes in posture were characterized by a marked drop in the hips
(relative to the ground) through flexion of the knees, in an attempt to bring the
body underneath the handle and continue the lift with an upward thrust. Lifting
beyond shoulder height also required rotation of the grip to occur at the handle
interface. Similar postural changes were noted in the other subjects, especially
when performing one-handed exertions against the heavy resistance.
It would seem that a critical point in the lifting action occurs when the
hands approach shoulder height. It is possible that the change in lifting technique
against heavy resistances is an attempt by the subject to adopt a more
advantageous posture for continuation of the lift above shoulder height. A more
advantageous posture would reduce the torque about the upper limbs and attempt
to involve the larger and stronger musculature of the lower limbs in the lifting
action. Cinematographic analysis of dynamic lifting provided evidence that such
changes in posture did occur against the very heavy resistance.
263

The above observations have particular relevance to manual handling
activities. The present findings suggests that lifting technique plays an important
role in the strength of dynamic exertions particularly when exertions are
performed against very heavy resistances. If for some reason the object lifted
prevents the individual from adopting a favourable lifting posture (i.e. when the
hand-object interface does not permit repositioning of the grip during the lift)
dynamic lifting strength may be severely impaired. The ability to adopt these
postures may be critical for the success of the lift when lifting very heavy
isoinertial loads above shoulder height.
The influence of lifting technique on the dynamic characteristics of lifting
has been investigated by Grieve (1974). In this study subjects were required to lift
loads weighing between 4 and 29 kg through a distance of 61 or 78 cm using
either a crouch or stoop technique. The results indicated considerable differences
in the way in which the upper and lower body contributed to the dynamics of the
lifts in the two lifting styles. However, since the lifts did not progress beyond 78
cm the dynamic nature of the lift at shoulder height was not investigated.
One major difference in the dynamic characteristics of lift between the
current study and that by Grieve (1974) was the substantial changes in lift
impedance observed when lifting isoinertial loads in comparison to the nature of
lifting exertions on the hydrodynamometer. For exertions against light loads (< 25
kg), lift impedance varied from a very large and almost infinite positive value as
the lift commenced to an infinite negative value as the load reached the top of its
trajectory. However, for inertial loads of 25 kg or more lift impedance remained
largely positive throughout the duration of the lift.
As the temporal patterns of lift impedance were found to be insensitive to
technique and the height to which the load was lifted, it was suggested by Grieve
(1974) that this quantity could be "developed as a relatively simple measure by
which performances in a variety of industrial lifting task might be classified.”
264
A comparison of the current results with those of Grieve (1974) illustrates
the differences between lifting an isoinertial load and dynamic exertions on the
hydrodynamometer. Unless the objective is to lift and project a heavy load as far
as possible (i.e. as in the case of caber tossing) most lifting activities will not
require full activation of all the muscles throughout the entire lifting range. In
many cases the load or object is required to be lifted and then placed at some
position above the ground. While maximal strength may be required during the
early stages of lifting a very heavy load, it is necessary at some point in time to
control and reduce muscular activation in order to place the load.
In comparison, exertions on the hydrodynamometer required the subjects to
maintain maximal activation of the muscles throughout the entire lifting range.
While this procedure may not be directly comparable with most real life situations,
the data affords a useful indication of the maximum forces capable at different
velocities of lift at any height within the lifting range. The force, velocity and
power data also provide an insight into the dynamic characteristics of whole body
lifting actions in an analogous way to that provided by early investigations of the
mechano-physiological properties of isolated muscle fibres.
265

Force, Velocity and Power Characteristics of Whole Body Lifting Exertions
The range of resistances under which the subject group was tested were
chosen following an initial pilot experiment. This pilot experiment investigated a
total of 13 different piston resistances in order to find the most appropriate
resistances that would result in expected maximum velocities close to those
velocities commonly observed for normal lifting activities.
Troup et al., (1983) observed peak velocities ranging from 1.0 m/s to 1.48
m/s during lifting of a 15 kg tote box from the floor to knuckle height. Similarly,
Aghazadeh and Ayoub (1985) and Mital et al., (1986) noted that the speed of lift
during actual manual lifting tasks averages approximately 75 cm/s. This average
lifting speed has commonly been used in isokinetic tests of lifting strength reported
in the literature. The 75 cm/s testing speed has been recommended because of the
finding that there is a close to one-to-one relationship between actual lifting
capacity8 and the peak force observed on an isokinetic lifting test (at 75 cm/s)
performed between ankle and chest height (Kamon et al., 1982).
According to the above observations the range of velocities recorded in the
present study correspond favourably with the velocities of lift found during actual
manual handling tasks. A summary of the dynamic characteristics for one and two-
handed lifting exertions derived from the results of the current study are illustrated
in Figures 6.22 and 6.23.
In Figures 6.22 and 6.23 surface plots have been generated from the mean
force and velocity data measured at knee, knuckle, hip, elbow and shoulder
heights under both the dynamic and static conditions. The shape of the surface
plots represent a mean view of the force-velodty, force-displacement and velocity-
8 In this context lifting capacity is defined as the maximum weight of a tote box which an individual can lift successfully from the floor to a shelf 113 cm high (Kamon et al., 1982).
266

displacement characteristics for maximal one and two-handed whole body lifting
exertions.
Although the dynamic characteristics of whole body lifting exertions closely
resemble the traditional theoretical relationships of muscle mechanics, this
similarity is likely to be a coincidental one. The whole body lifting action involves
the contraction of a large number of individual muscles each with different resting
lengths, architecture and mechanical advantages. Each muscle or muscle group
will follow its own torque-velocity and torque-angle relationship and may contract
concentrically, eccentrically or isometrically at different times throughout the lift.
In addition, the level of activation of the individual muscles will change
throughout the lift as they assume a greater or lesser role in the overall lifting
performance. Thus the surface plots in Figures 6.22 and 6.23 represent a mean
view of a complex set of interactions involving the physiological and mechanical
characteristics of many different muscles being activated and deactivated according
to the skill of the individual.
One of the more notable observations in Figures 6.22 and 6.23 is that peak
lifting force occurs between knee and knuckle height. The results indicated that the
position of peak force occurred at the same hand height above the ground
irrespective of the lift resistance and the sex of the subject. The position of peak
force did however occur at a slightly lower hand height during the one-handed
exertions than during the two-handed exertions. This latter finding presumably
reflects differences in lifting posture between one and two-handed exertions.
The current study also indicated that as hand height and lift resistance
increased the difference in strength between one and two-handed exertions became
greater. This observation may be explained on the basis that during the early
stages of the lift the strength of the upper limb musculature played only a minor
role in the force of exertion, whereas, in the upper region of the lift the force of
exertion was almost entirely due to the strength of the upper limbs. Thus, as the
upper limbs played a more dominant role in the lifting action the difference
267
between one and two-handed exertions became more pronounced. By the time the
lift had approached shoulder height the strength of one-handed exertions was half
that of the two-handed exertions.
The relationship between one and two-handed exertions was one of the
major differences between dynamic and static conditions. The larger strength
differences between one and two-handed static lifts in comparison to those for the
dynamic lifts possibly reflect slight differences in the postures adopted during the
dynamic and static exertions. It is possible that the postures adopted under
dynamic lifting conditions may have attempted to reduce the influence of muscular
limitations in the upper limbs.
A second fundamental difference between static and dynamic lifting was
illustrated by the similarity of the normalized static strengths of males and
females. This finding was contrary to the significant sex differences in lifting
performance observed under the dynamic conditions. The difference in
performance between males and females was even more pronounced when the
criterion measure of performance was power.
The similarity of normalized static lifting strengths of males and females
confirms the findings of Sanchez (1991). As discussed in Chapter 2, Sanchez
(1991) was able to generate gender free predictions for static lifting strength when
lift performance was measured at heights relative to stature and expressed as a
percentage of body weight. The reasons for the dramatic sex differences in
normalized performance under dynamic conditions in comparison to those
observed under static conditions is unclear. It is possible that the contribution of
the force-velodty characteristics of muscle in dynamic exertions accentuates the
difference in performance between males and females. Alternatively, there may be
significant differences in the skill of producing maximal lifts between males and
females that is more pronounced under dynamic than static conditions.
268

The power generated by dynamic lifting was found to decrease as the task
resistance increased. If the lift velocities observed in this study are a fair
representation of the velocities of lift for real industrial tasks, it would indicate
that most heavy manual handling tasks are performed at power outputs well below
the optimum. Unfortunately, the present study cannot provide a finite value for the
task resistance at which the optimal power of lifting actions is observed. Evidence
from the results of subject DF lifting against the light and very light resistances
indicated that power output in excess of 1 HP is possible. As the time course of
the lift producing this level of power was less than 1 .0 second over the distance
between knee and head height, it would seem that whole body power output for
this type of action would only reach optimal levels when performing fast dynamic
movements such as those involved in sporting activities.
The mechanical power developed during the snatch and the clean and jerk
lifting action of elite weight lifters has recently been reported by Funato and
Fukunaga (1989). In this study a purpose built inertial dynamometer was used to
record the dynamic force, velocity and power over the course of the lift against
different inertial loads. The authors mentioned that mean velocity decreased with
increasing mean force in a hyperbolic manner and that mean power showed a
peak. Unfortunately, they neglegted to report the magnitude of the inertial load at
which this peak in mean power was observed.
The mean power output produced by one of the Japanese international§
weightlifter was found to be in excess of 2 HP. When the mean power output over
the entire lifting range was correlated with total weights of individuals best records
in the snatch and clean and jerk a statistically significant positive linear correlation
(r= 0.838, p < 0.001) was observed. It was concluded from this observation that
mechanical power was a good indicator of weightlifting performance.
A final comment in this section of the discussion should also be made on
the ability to predict dynamic and static whole body lifting forces. As discussed in
Chapter 2 several biomechanical models of lifting (e.g. Sanchez 1991, Garg &
269

Chaffin 1975) utilize regression equations of body weight on strength to predict an
individuals strength in given postures. Evidence from the current study suggests
that body weight is a poor predictor of static and dynamic lifting strength. The low
correlations in Table 6 .8 illustrate that individual variation in body weight at best
accounts for only 50% of the total variance in lifting strength. In the worst case
(i.e. one-handed lifts at shoulder height) body weight only accounted for between
3 % and 18% of the total variance in strength.
The above observations support the findings of Pheasant (1977) who
showed that the strength of exertions are poorly correlated with body weight when
the axis of force measurement is close to the "live axis” (see Chapter 2). In the
current lifting experiments the axis of force measurement was directed through the
foot base thus corresponding very closely with the line of the live axis. Under
these conditions strength is predominantly limited by musculo-skeletal factors. This
latter statement presumes that all other conditions are optimal (i.e. that there is a
good hand/handle interface) and that the subject is fully motivated.
270

Po Kn uck I o
P o H/lp
Po
K n e e CM)
K n e e ( L) Kn u c k I e (
CL)
Figure 6.22: A surface plot representing the dynamic characteristics of two- handed lifting. The surface is based on the mean forces and velocities observed at knee, knuckle, hip and shoulder height during static lifts (Po) and dynamic lifts against the light (L), medium (M) and heavy resistances (H). The grid was created using Surfer software (Golden Software Inc. 1987).
271

Po Kno©Po Knuck
Po H
JJC
Mfcn e e CL)
3^9 ^^ Po Sktou I de,w 261 j /® ' As/0 : S>Wj
A Qu, ' A X A
( L )
<5“
Figure 6.23: A surface plot representing the dynamic characteristics of one- handed lifting. The surface is based on the mean forces and velocities observed at knee, knuckle, hip and shoulder height during static lifts (Po) and dynamic lifts against the light (L), medium (M) and heavy resistances (H). The grid was created using Surfer software (Golden Software Inc. 1987).
272

Generality Versus Specificity of Whole Body Lifting Strength Against
Different Task Resistances
The current results indicate a high degree of generality between dynamic
and static measures of lifting strength, and between dynamic lifting exertions
performed against the different resistances on the hydrodynamometer. This finding
suggests that
(1) Dynamic and static tests of lifting strength measure a common intrinsic ability
to produce maximal lifting forces.
(2) Individuals who perform well (or poorly) on static tests of strength attain the
same relative level of performance on dynamic tests of lifting strength.
(3) The same relative level of performance is achieved between individuals on tests
of whole body lifting strength irrespective of the task resistance and hence velocity
of lift.
Studies investigating the interrelationships amongst different measures of
strength have been discussed in Part n of Chapter 2. In light of the current
findings the present work supports those studies which showed a high degree of
generality between isometric and dynamic measures of strength. At this point it is
appropriate to mention an unpublished study conducted by the Army Personnel
Research Establishment (APRE) which compared lifting performance on a field
version of the hydrodynamometer with a range of different dynamic and static
measures of strength.
The study involved measuring the anthropometry and strength of 384 male
army recruits. A description of the physical characteristics of the subjects, the
experimental design, strength testing procedures and preliminary results are
provided in Appendix D. Table 6.11 summarizes the degree of generality between
performance on the hydrodynamometer (measured as the mean power over the
273

lifting range between 0.7 and 1.0 m above the ground) and the strength of
exertions on the other tests.
Unfortunately, the comparisons in Table 6.11 are complicated by the fact
that mean power over a fixed range, rather than force at a hand height relative to
stature, was taken as the performance measure on the hydrodynamometer for
comparison with measures of force on the other strength tests. As there was no
direct measure of the reliability of the different strength tests, including that for
the field version of the hydrodynamometer, estimates of the reliability coefficients
were determined from the literature. However, the studies in the literature often
employed a different protocol or tested a different set of muscle groups than those
measured in the APRE study.
The poor correlations obtained by some investigators (see Chapter 2) and
those of the APRE study between different measures of strength may be the result
of a number of factors related to methodological procedures. Firstly, as indicated
above many studies do not account for the error variance in the different strength
measures attributable to unreliability of the particular strength testing device or
strength testing protocol. One finding of the APRE study was that the Quasi-
isokinetic device was found to be particularly unreliable which may have
contributed to its low correlation with performance on the hydrodynamometer.
A second reason for the low intercorrelations in the APRE study is that
many of the strength tests compared performance over different lifting ranges and
postures. Unless dynamic strength is measured at the same relative hand height
which is also comparable with the other test conditions (i.e. isometric and dynamic
strength measured at the same hand height relative to stature) it is highly likely
that differences will exist in the active muscles involved in the different individuals
and between the different test conditions. In addition, if lifting strength is
measured at a fixed absolute height from the ground, individuals will perform the
lift in different regions of their force-displacement and force-velocity
characteristics. In this latter case it is impossible to make a realistic comparison
274

between individuals or accurate statement about the generality of performance on
different strength tests.
Care however should be taken when interpreting the results in the light of
other subject populations. While the current study attempted to employ a subject
group with a wide range of strengths, which was hopefully representative of the
general population, quite different results may have been obtained if groups of
athletes had been compared on the strength tests. One could hypothesize for
example that the generality of performance on the current strength tests in a mixed
group of strength and power trained athletes would be less clear.
In this latter case it would be expected that power athletes would show a
better performance on the fast dynamic measures of strength than the strength
trained athletes. On the other hand, the reverse would be true for the slow
dynamic or isometric tests where the strength trained athletes may be expected to
produce the better performance. The underlying phenomenon of this hypothetical
study revolves around the concept of specificity of strength training. Issues
surrounding this topic are addressed at length by Atha (1981) and will not be
commented upon further in this discussion.
275

Table 6.11Correlation coefficients and the generality component between performance on the
hydrodynamometer and selected anthropometric variables and a number of dynamic and static tests of strength. Data from an unpublished study carried out
by the Army Personnel Research Establishment
VARIABLE CorrelationCoefficient
Proportion of Generality
Age 0.28
Weight 0.70
Height 0.56
Body Fat 0.28
Fat Free Weight 0.74
Isometric Elbow Flexion 0 .6 6 51%
Isometric Knee Extension1 0.28 9%
Isometric Trunk Extension1 0.51 30%
Handgrip1 0.63 42%
Static Lift at 38 cm 0 .6 6 51%
Static Lift at 85 cm 0 .6 6 51%
Isokinetic Lift2 at 8 cm/s 0.61 41%
Isokinetic Lift2 at 47 cm/s 0.73 58%
Quasi-isokinetic lift 0.45 23%
Isoinertial lift2 0.67 51%
Notes:
Correction for attenuation was performed using reliability coefficients based on1 Asmussen et al. , (1965)2 Hortobagyi et al., (1989)
In the absence of quotable values the remainder of the strength tests were assigned a notional reliability coefficient of 0.90. A value of 0.95 was used for the reliability coefficient of the hydrodynamometer.
276

Future Studies
The next stage in the development of the current work would be to
formulate a model of whole body maximal dynamic lifting strength based on the
observations. Clearly the major elements of the model would include the force-
displacement and force-velocity relationships shown graphically in the surface plots
of Figures 6.22 and 6.23. Since males and females demonstrated considerable
differences in dynamic lifting performance the model should also take into account
these sex differences.
If the current findings truly represent the characteristics of dynamic lifting
under maximal conditions it would be expected that the force of lift would be
governed by the three dimensional activation surfaces shown in Figs. 6.22 and
6.23. It would therefore be expected that maximal dynamic exertions commencing
at different starting heights would attain the same level of force against a given
resistance at all subsequent heights in the lifting range.
Evidence supporting the above assumption is provided in Figure 6.24. In
this Figure, force versus hand height is shown for two-handed maximal lifting
exertions by subjects CB and DF performing against the medium resistance on the
hydrodynamometer, with the lifts commencing at starting heights of 400, 600 and
1000 cm. In all cases the lifts involved an initial activation phase where the force
rose quickly to a maximum value at a given hand displacement. After this initial
rise in force further changes in lifting strength with hand height above the ground
followed very similar characteristics for the three starting conditions.
The observation of an initial activation phase is an important element that
should be included in the model of dynamic lifting. Research by Bell and Jacobs
(1986) has shown that the time to reach 100% of a maximal voluntary isometric
contraction of the elbow flexors ranges between 275 and 375 ms and is unaffected
by the strength or sex of the subject. For dynamic exertions against very light
resistances a substantial portion of the lift may therefore have already been

completed by the time the musculature had been fully activated (see Figure 6.9).
In view of this, the majority of the lift against the very light resistance by subjects
DF and CB is likely to have been performed under submaximal levels of muscle
activation.
If the model of dynamic lifting is to be extended to explore lifting of
isoinerdal loads, input regarding the deactivation of muscles is also required. An
insight into the way in which different muscles are activated and deactivated
throughout the lifting action may be provided through EMG analysis of the major
muscle groups involved. Alternatively, the study by Grieve (1974) provides a
useful indication of how the force and velocity at the hands changes during the
lifting and placing of various inertial loads. Evidence of this nature will be
required before an accurate model of dynamic lifting can be developed to simulate
lifting tasks involved in actual manual handling activities.
278

Subject DF
r\Zw
<D(JL_0u_
700600500400300200100
x X X X0 400 800 1200 1600 2000
D is p la c e m e n t Cmm}
Subject CB
r \zw
Q)OLOLL
700600500400300200100
V*
J , I
□ 400 800 1200 1600 2000D is p la c e m e n t CmmD
Figure 6.24: Force versus height of lift for maximal two-handed dynamic lifting exertions against the medium resistance by subjects DF and CB under different initial starting heights. The three starting heights shown for each subject were 400, 600 and 1000 cm above the ground respectively.
279

Conclusions
The main conclusions emerging from the study were:
(1) Lifting strength changed significantly according to the number of hands
employed (i.e. one or two-handed) (p< 0 .0001), hand height above the
ground (p< 0 .0001) and the task resistance (and hence velocity of lift)
(p < 0 .0001).
(2) The greatest forces were observed for two-handed static exertions and the least
lifting forces for one-handed dynamic exertions against the light resistance.
(3) The power output of whole body lifting exertions decreased as the task
resistance increased. Based on the observations of power output and the
corresponding velocities of lift, it was concluded that most heavy manuals
handling tasks fall well below the optimal conditions that would permit
peak power output to be generated.
(4) When lifting strength was measured at a hand height relative to stature and
normalized by dividing by body weight, sex differences in the strength of
static exertions were insignificant (p>0.05). Under dynamic conditions the
same performance criterion illustrated significant differences between males
and females (p < 0 .01).
(5) When sex differences in dynamic lifting performance were expressed in terms
of female/male ratios (f/m), the f/m ratios for power output were found to
be much smaller than the f/m ratios for static lifting strength.
(6) Based on points 4 and 5 above it was concluded that sex differences in lifting
performance are more pronounced under dynamic conditions than under
static conditions.
280

(7) Sex differences in normalized dynamic and static lifting strength were largely
independent of the height of the lift (p>0.05).
(8) Strength differences between one and two-handed lifting exertions increased
significantly, and in an almost linear fashion, as hand height increased
(p < 0 .0001).
(9) Strength differences between one and two-handed lifting exertions changed
significantly with task resistance (p< 0.005), with the largest strength
differences between one and two-handed exertions occurring under static
conditions.
(10) A critical point in the performance of dynamic lifts occurred as the hands
approached shoulder height. This point was reflected by large perturbations
in the force trace, particularly against very heavy resistances, that were due
to a change in lifting posture from an overhand lift to an upward thrust.
(11) Body weight was found to be a poor predictor of dynamic and static lifting
strength. At shoulder height and above the correlations between body
weight and dynamic and static lifting strength were largely insignificant
(p>0.05). At other heights above the ground the proportion of the total
variance in lifting strength which could be explained by the variance in
body weight was less than 50%.
281

(12) There is a high degree of generality between dynamic and static measures of
lifting strength when maximal dynamic and static lifting exertions are
compared in similar postures (i.e. at the same hand heights relative to
stature). Measures of dynamic strength performed against different levels of
resistance and hence at different lifting velocities also demonstrated high
correlations and hence a high degree of generality. These observations
suggest that
(i) Dynamic and static tests of lifting strength measure a common intrinsic ability
of a given individual to produce maximal lifting forces.
(ii) Individuals who perform well (or poorly) on static tests of lifting strength
attain the same relative level of performance on dynamic tests of lifting
strength. In addition, the relative level of performance of individuals on
dynamic tests of lifting strength is unaffected by the level of task resistance
and hence velocity of lift.
282

CHAPTER 7
GENERAL SUMMARY AND CONCLUSIONS
283

The present work provides a detailed analysis of whole body strength
capabilities of humans under a wide range of conditions of posture, hand height,
direction of exertion and task resistance. Many of the conditions in which whole
body strength was measured had not previously been investigated.
In studies I and n the influence and interrelationships of interface,
gravitational and musculo-skeletal limitations on the ability of healthy male and
female adults to produce maximal static forces were investigated. Study m
introduced novel strength testing equipment, protocol, data processing and display
techniques in order to extend the measurement and analysis of human static
strength into three dimensions. The final study (IV) compared maximal dynamic
lifting performance against a range of resistances on an isoresistive
hydrodynamometer with static lifting strength.
Conclusions emerging from these studies (relating to the specific
hypotheses stated in Chapter 2) are provided at the end of each Chapter. The
objective of this section was to assimilate the findings with respect to the general
aims of the thesis.
One of the main aims of the thesis was to determine the influence and
relative importance of the hand/handle interface, as well as, sex, anthropometric,
and musculo-skeletal factors on dynamic and static whole body strength.
The relative importance of the hand/handle interface on the ability to
produce maximal whole body strength has often been overlooked. Study I showed
that with poor conditions at the hand/handle interface whole body static pulling
strength may be reduced by as much as 50% when compared with the same
exertion performed against a good hand/handle interface. Under these adverse
conditions whole body strength becomes completely dominated by interface
limitations, with gravitational factors (i.e. the effective deployment of body
weight) and musculo-skeletal factors (i.e. intrinsic muscular strength) playing a
minor role in the strength of the exertion.
284

The findings of study I have important implications for models of human
whole body strength (e.g. NIOSH 1981) that have up until the present assumed the
hand/object interface to be optimal for most purposes. Clearly such models need to
classify couplings between hand and object as strong or weak links to improve the
accuracy and reliability of strength prediction for real life tasks.
Studies n and IV revealed that sex differences in strength varied widely
with the direction and height of exertion and the task resistance. One of the more
interesting findings however was that of the lack of a significant sex difference in
strength when whole body static lifting strength was measured at hand heights
relative to stature and normalized to body weight. In comparison, differences in
normalized maximal lifting performance between males and females were
statistically significant and much more pronounced under dynamic conditions.
Although reasons for the above finding are unclear, one possible
explanation is that males and females exhibit different levels of skill in their ability
to produce maximal lifting forces. It is these differences in skill between males
and females that possibly become more pronounced under dynamic compared to
static conditions and lead to much greater sex differences in strength. Quantifying
and studying the skill element involved in producing maximal voluntary exertions
is one avenue of future research that may prove useful in explaining part of the
variance in strength between individuals.
rOne concept that has long been attractive to many researches in the field of
manual handling has been the prediction of individual strength capabilities from
simple measures of their anthropometry. Many studies have explored this area of
research with varying degrees of success. The findings of the current thesis
suggest that dynamic and static whole body strength cannot be reliably predicted
from body weight and stature alone (for the general population) when exertions are
performed along or close to the live axis (i.e. along an axis connecting the centre
of foot pressure to the centre of manual force application). In other directions of
exertion, where gravitational limitations play a more dominant role on
285

performance, the strength of static exertions may be more reliably predicted using
a simple linear regression model with body weight and stature as independent
variables.
A further aim of the thesis was to describe and compare maximal dynamic
and static whole body exertions performed both one and two-handed. As in the
case of sex differences in strength, the differences in strength between one and
two-handed exertions varied widely according to the task resistance and the height
and direction of exertion. Under certain circumstances one-handed exertions
approached and even exceeded the strength of two-handed exertions. In other
situations the strength of one-handed exertions was half that of two-handed whole
body exertions.
As pointed out in Chapter 1 few studies have investigated one-handed
whole body strength capabilities, and yet, there are many manual handling tasks
which may require all or part of the task to be performed one-handed. The current
work thus fills the gap of knowledge in this area by providing some indication of
how strength demands of a given task may change, when, during the manoeuvring
and handling of a load, part or all of the task is performed single handedly.
Study IV revealed that there is a high degree of association between static
and dynamic measures of whole body strength. While the actual magnitude of
maximal performance differed considerably against different task resistances, the
high degree of association between dynamic and static strengths suggests that
individuals achieve the same relative level of performance, irrespective of the
mode of strength testing. This finding may provide some comfort to those
investigators attempting to predict dynamic performance from static measures of
strength. It is however pointed out that a high degree of association between
dynamic and static strength is obtained only when strength measures on the
different tests are compared under similar postures.
286

Finally, the current work provides some indication of the principles and
characteristics governing whole body exertions in the human. Although the data in
this thesis may afford a rough guide to the whole body strength capabilities of the
"average" human under the different conditions studied, further research
employing much larger subject populations are required before estimations of
percentiles for whole body strength can be made.
If these studies are performed, and the suggestions and new approaches to
whole body strength assessment described in this thesis are adopted, significant
improvements to existing biomechanical models of human whole body strength, or
new and more reliable models may be achieved. Such models of human whole
body strength will provide the ergonomist with a powerful tool to aid in task
design and analysis in the area of manual materials handling.
287
REFERENCES
Abbott, B.C. and Aubert, X.M. (1952) The force exerted by active striated muscle during and after change of length. J. Physiol. 117, 77-86.
Aghazadeh, F. and Ayoub, M.M. (1985) A comparison of dynamic- and static-strength models for prediction of lifting capacity. Ergonomics, 28, 1409-1417.
Ainscough-Potts, A.M. (1984) An investigation of the problems associated with lifting when the dimensions of the object restric the foot placement available to the subject, MSc. (Ergonomics) (University of London).
Anonymous, (1988) Handling loads at work. Proposals for Regulations and Guidance. Health and Safety Executive, 1-40.
Anonymous, (1990) Guidlines for Manual Handling in the Coal Industry. Bureau of Information and Coordination of Community Ergonomics Action, Rep No. 14,
Anonymous, (1981) Work Practices Guide for Manual Lifting. US Dept of Health and Human Services, PHS, Centre for Disease and Control, Division of Bomedical Behavior, NIOSH', Cincinnati, OH.
Asmussen, E., Heeboll-Nielsen, K., and Molbech, S.V. (1959) Methods for evaluation of muscle strength. In: Communications from the Testing and Observation Institute o f the Danish National Association for Infantile Paralysis, Nr.5, 1-13. Edited by Asmussen, E., Fredsted, A., and Ryge, E., Hellerup, Denmark,
Asmussen, E., Hansen, O., and Lammert, O. (1965) The relation between isometric and dynamic muscle strength in man. Communications of the Danish National Association for Infantile Paralysis, No. 20, 1-11
Asmussen, E. (1981) Similarities and dissimilarities between static and dynamic exercise. Supp. I. , Circ. Res. , 4 8 ,1-3-I-10.
Atha, J. (1982) Strengthening muscle. In: Exercise and Sport Science Reviews, Volume 9, 1-74. Edited by Miller, D.I., U.S.A., American College of Sports Medicine Series.
Ayoub, M.M., Dryden, R., McDaniel, J., Knipfer, R., and Dixon, D. (1979) Predicting lifting capacity. Am. Ind. Hyg. Assoc. J. 40, 1075-1084.
Ayoub, M.M. and LoPresti, P. (1971) The determination of optimum size cylindrical handle by use of EMG. Ergonomics, 14, 509-518.
288

Ayoub, M.M. and McDaniel, J.W. (1974) Effects of operator stance on pushing and pulling tasks. A. I. /. E. Trans. 6 , 185-195.
Ayoub, M.M. and Mital, A. (1989) Manual Materials Handling, London, Taylor & Francis.
Bell, D.G. and Jacobs, I. (1986) Electro-mechanical response times and rate of force development in males and females. Med. Sci. Sports. Exerc. 18, 31-36.
Bishop, P., Cureton, K., and Collins, M. (1987) Sex difference in muscular strength in equally-trained men and women. Ergonomics, 30, 675-687.
Bobbert, A.C. (1960) Optimal form and dimensions of hand grips on certain concrete building blocks. Ergonomics, 2, 141-147.
Bourne G.H. (Ed) (1972) The Structure and Function o f Muscle, Volume i , 2nd Ed., London, Academic Press.
Brown, J.R. (1972) Manual Lifting and Related Fields an Annotated Bibliography, Ontario, Labour Safety Council of Ontario.
Caldwell, L.S., Chaffin, D.B., Dukes-Dobos, F.N ., Kroemer, K.H.E., Laubach, L.L., Snook, S.N ., and Wasserman, D.E. (1974) A proposed standard procedure for static muscle strength testing. American Industrial Hygiene Association Journal, 35, 201-206.
Carlson, R.B. (1970) Relationship between isometric and isotonic strength. Arch. Phys. Med. Rehabil. 51, 176-179.
Chaffin, D.B. (1969) A computerized biomechanical model-development of and use in studying gross body actions. J. Biomech. 2, 429-441.
Chaffin, D.B. (1974) Human Strength Capability and Low-Back Pain. Journal o f Occupational Medicine, 16, 248-254.
Chaffin, D.B. (1975) Ergonomics guide for the assessment of human static strength. Amer. Ind. Hyg. Ass. J. 35, 505-511.
Chaffin, D.B., Herrin, G.D., Keyserling, W.M., and Garg, A. (1977) A method for evaluating the biomechanical stresses resulting from manual materials handling jobs. Am. Ind. Hyg. Assoc. J. 38, 662-675.
Chaffin, D .B., Andres, R.O., and Garg, A. (1983) Volitional postures during maximal push/pull exertions in the sagittal plane. Human Factors, 25, 541-550.
289

Chaffin, D.B. (1987) Validation and sensitivity analysis of the University of Michigan static strength prediction model. In Biomechanics XI-A, XI International Congress o f Biomechanics, International Series on Biomechanics, Vol. 7-A, 439-444, Amsterdam, Free University Press. Edited by de Groot, G., Hollander, A.P. Huijing, P.A. & Schenau, G.J.V.I.
Chaffin, D.B., Freivalds, A., and Evans, S.M. (1987) On the validity of an isometric biomechanical model of worker strengths. 7. 7. E. Transactions, 19,280-288.
Chaffin, D.B. and Andersson, G.B.J (1984) Occupational Biomechanics, New York, John Wiley & Sons.
Chaffin, D.B. and Park, K.S. (1973) A longitudinal study of low back pain as associated with occupational weight lifting factors. Am. Ind. Hyg.Assoc. J. 34, 513-525.
Clarke, D.H. and Clarke, H.H. (1970) Research processes in physical education, recreation and health, Englewood Cliffs, New Jersey, Prentice-Hall.
Clarke, D.H. and Henry, F.M. (1961) Neuromotor specificity and increased speed from strength development. Res. Quart. 32, 315-325.
Cochran, D.J. and Riley, M. W. (1986) The Effects of Handle Shape and Size on Exerted Forces. Human Factors 28, 253-265.
Crowninshield, R.D. and Brand, R.A. (1981) A physiologically based criterion of muscle force prediction in locomotion. J. Biomech. 14, 793-801.
Dales, J.L., Macdonald, E.B., and Anderson, J.A.D. (1986) The ’Liftest’ strength test - an accurate method of dynamic strength assessement? Clin. Biomech. 1, 11-13.
Davies, C.T.M., White, M.J., and Young, K. (1983) Muscle function in children. J. Appl. Physiol. 521, 111-114.
Davis, P.R. (1981) The use of intra-abdominal pressure in evaluating stresses on the lumbar spine. Spine 6, 90-92.
Davis, P.R. and Stubbs, D.A. (1977) Safe levels of manual forces for young males. Applied Ergonomics, 8 , 141-150.
Davis, P.R. and Stubbs, D.A. (1980) Force Limits in Manual Work, Guilford, IPC Science and Technology Press.
Dempster, W.T. (1958) Analysis of two-handed pulls using free body diagrams. Journal o f Applied Physiology, 13, 469-480.
290
Dempster, W.T., Sheer, L.A., and Priest, J.F. (1964) Conversion scales for estimating humeral and femoral lengths of functional segments in the limbs of American caucasoid males. Human Biology, 36, 246-261.
Dempster, W.T. and Gaughran, G.R.L. (1967) Properties of body segments based on size and weight. Amer. J. Anat 120,
Dons, B., Bollerup, K., Bonde Petersen, F., and Hancke, S. (1979) The effect of weight-lifting exercise related to muscle fiber composition and muscle cross-sectional area in humans. Eur. J. Appl. Physiol. 40, 95-106.
Drury, C.G. (1980) Handles for manual materials handing. Applied Ergonomics, 11, 35-42.
Drury, C.G. (1985) The role of the hand in manual materials handling. Ergonomics. 28, 213-227.
Falkel, J.E., Sawka, M.N., Levine, L., and Pandolf, K.B. (1985) Upper to lower body muscular strength and endurance ratios for women and men. Ergonomics. 28, 1661-1670.
Ferguson, G.H. (1976) Statistical Analysis in Psychology and Education, 4th Ed., 1-529, New York, McGraw-Hill Book Company.
Funato, K. and Fukunaga, T. (1989) Mechanical power developed during pull movement in weightlifting. In: XII International Congress o f Biomechanics Congress Proceedings, Abstract N-429. Edited by Gregor, R.J., Zemicke, R.F., and Whiting, W.C., Los Angeles, University of California.
Garg, A., Mital, A., and Asfour, S.S. (1980) A comparison of isometric strength and dynamic lifting capability. Ergonomics, 23, 13-27.
Garg, A ., Funke, S., and Janisch, D. (1988) One-handed dynamic pulling strength with special application to lawn mowers. Ergonomics, 31, 1139-1153.
Garg, A. and Chaffin, D.B. (1975) A biomechanical computerized simulation of human strength. A. I. I. E. Trans. 7, 1-15.
Garg, A ., and Ayoub, M.M. (1980) What Criteria Exist for Determining How Much Load Can Be Lifted Safely? Human Factors, 22, 475-486.
Gaughran, G.R.L. and Dempster, W.T. (1956) Force analyses of horizontal two-handed pushes and pulls in the sagittal plane. Human Biology, 28, 67-92.
Gordon, A.M ., Huxley, A.F., and Julian, F. (1966) The variation in isometric tension with sarcomere length in vertibrate muscle fibres. J. Physiol. 184, 170-192.
291
Grieve, D.W. (1974) Dynamic characteristics of man during crouch and stoop lifting. In: Biomechanics TV, International Series on Sport Sciences, Vol. 1, Proceedings of the fourth international seminar on biomechanics, University Park, Pennsylvania, 19-29. Edited by Nelson, R.C. and Morehouse, C.A., Baltimore, University Park Press.
Grieve, D.W. (1979a) Environmental constraints on the static exertion of force: PSD analysis in task-design. Ergonomics, 22, 1165-1175.
Grieve, D.W. (1979b) The postural stability diagram (PSD): personal constraints on the static exertion of force. Ergonomics, 22, 1155-1164.
Grieve, D.W. (1984) The influence of posture on power output generated in single pulling movements. Applied Ergonomics, 15, 115-117.
Grieve, D.W. (1987) Demands on the back during maximal exertion. Clin. Biomech. 2, 34-42.
Grieve, D.W. and Pheasant, S.T. (1981a) Naturally preferred directions for the exertion of maximal manual forces. Ergonomics, 24, 685-693.
Grieve, D.W. and Pheasant, S.T. (1981b) Postural considerations in maximum voluntary exertion. In: Anthropometry and Biomechanics: Theory and Application, 135-144. Edited by Easterby, R. and Kroemer, K.H.E., Plenum Publishing Corporation.
Grieve, D.W. and Pheasant, S.T. (1982) Biomechanics. In: The Body at Work: Biological Ergonomics, 71-200. Edited by Singleton, W.T., Cambridge, Cambridge University Press.
Grieve, D.W. and van der Linden, J. (1986) Force, speed and power output of the human upper limb during horizontal pulls. Eur. J. Appl. Physiol. 55,425-430.
Grieve, D.W. (1983) Slipping due to manual exertion. Ergonomics 26, 61-72.
Grieve, D.W. (1991) Personal communication.
Hazelton, F.T., Smidt, G.L., Flatt, A.E., and Stephens, R.I. (1975) The influence of wrist position on the force produced by the finger flexors. J. Biomechanics, 8 , 301-306.
HEDGE, (1974) Human Factors Data Guide for Evaluation, Aberdeen Proving Grounds, MD, US Army Test and Evaluation Command.
292

Henry, F.M. and Whitley, J.D. (1960) Relationships between individual differences in strength, speed and mass in arm movement. Res. Quart. 31, 24-33.
Hill, A.V. (1970) First and last experiments in muscle mechanics, Cambridge, University Press.
Hill, A.V. and Howarth, J.V. (1959) The reversal of chemical reactions in contracting muscle during an applied stretch. Proc. Roy. Soc. 151B, 169-193.
Hortobagyi, T., Katch, F.I., and LaChance, P.F. (1989) Interrelationships among various measures of upper body strength assessed by different contraction modes. Evidence for a general strength component. Eur. J. Appl. Physiol. 58, 749-755.
Hunsicker, P. and Donelly, R. (1955) Instruments to measure strength. Res. Quart. 26, 408-420.
Ikai, M. and Fuganaga, T. (1968) Calculation of muscle strength per unit of cross-sectional area of human muscle by means of ultrasonic measurement. Int. Z. angew. Physiol, einschl. Arbeitsphysiol. 16, 26-32.
Jacobs, I., Bell, D.G., Pope, J., Johansson, R.S., and Westling, G. (1988) Comparison of isokinetic and isoinertial lifting tests as predictors of maximal lifting capacity. Eur. J. Appl. Physiol. 57,146-153.
Jacobs, I. and Pope, J. (1986) A computerized system for muscle strength evaluation: measurement reproducibility, validity and some normative data. Nat. Strength Condition. Assoc. J. 8 , 28-33.
Jiang, B.C. and Ayoub, M.M. (1987) Modelling of maximum acceptable load of lifting by physical factors. Ergonomics, 30, 529-538.
Kamon, E., Kiser, D ., and Pytel, J.L. (1982) Dynamic and static lifting capacity and muscular strength of steelmill workers. Am. Ind. Hyg. Assoc. J. 43, 853-857.
Karwowski, W. and Mital, A. (1986) Isometric and isokinetic testing of lifting strength of males in teamwork. Ergonomics, 29, 869-878.
Karwowski, W. and Pongpatanasuegsa, N. (1988) Testing of isometric and isokinetic lifting strengths of untrained females in teamwork. Ergonomics, 31,291-301.
Keeney, C.E. (1955) Relationship of body weight to strength weight ratio in championship weightlifters. Res. Quart. 26, 54-59.
Knapik, J.J., Wright, J.E., Mawdsley, R.H., and Braun, J. (1983) Isometric, isotonic, and isokinetic torque variations in four muscle groups through a range of joint motion. Phys. Ther. 63, 938-947.
293

Knapik, J.J. and Ramos, M.U. (1980) Isokinetic and isometric torque relationships in the human body. Arch. Phys. Med. Rehabil. 61, 64-67.
Komi, P. V. (1990) Relevance of in vivo force measurements to human biomechanics. Journal o f Biomechanics, 23, 23-34.
Kroemer, K.H. (1983) An isoinertial technique to assess individual lifting capability. Human Factors, 25, 493-506.
Kroemer, K.H.E. (1970) Human strength: terminology, measurement and interpretation of data. Human Factors, 12, 297-313.
Kroemer, K.H.E. (1971) Static forces exerted by men standing in common working positions on surfaces of various tractions. AMRL-TR- 70-114, Wright Pat erson air force base, OH.
Kroemer, K.H.E. (1974) Horizontal Push and Pull Forces Exertable when Standing in Working Positions on Various Surfaces. Applied Ergonomics, 5, 94-102.
Kulig, K., Andrews, J.G., and Hay, J.G. (1984) Human strength curves. In: Exercise and Sport Science Reviews, Volume 12, 417-466. U.S.A, American College of Sports Medicine Series.
Laubach, L.L. (1976) Comparative muscular strength of men and women: a review of the literature. Aviat. Space. Environ. Med. 47, 534-542.
Laubach, L.L. and McConville, J.T. (1969) The relationship of body strength to body size and typology. Med. and Sci. in Sports 1, 189-194.
Lietzke, M.H. (1956) Relation between weight-lifting totals and body weight. Science, 4, 486-487.
Martin, J.B. and Chaffin, D.B. (1972) Biomechanical computerized simulation of human strength in sagittal-plane activities. A. I. I. E. Trans. 4, 19-28.
McConville, J.T. and Hertzberg, H.T.E. (1968) A study of one handed lifting: Final report. Ergonomics, 11, 297.
McDaniel, J.W., Skandis, R.J., and Madole, S.W. (1983) Weight lift capabilities of air force basic trainees. AFAMRL-TR-83-0001, Wright-Pa terson Air Force Base, OH.
Mital, A. (1984) Prediction of human static and dynamic strength by modified basic GMDH algorithm. 7. E. E. E. Transactions on Systems, Man and Cybernetics* SMC-14, 773-776.
294

Mital, A., Aghazadeh, F., and Ramanan, S. (1985) Use of GMDH to predict dynamic strengths. Int. J. of Comp, and Ind. Eng. 9, 371-377.
Mital, A., Karwowski, W., Mazouz, A.K., and Orsarh, E. (1986) Prediction of maximum acceptable weight of lift in the horizontal and vertical planes using simulated job dynamic strengths. Am. Ind. Hyg. Assoc. J. 47, 288-292.
Mital, A. and Manivasagan, I. (1982) Application of a heuristic technique in polynomial identification. Proceedings in the IEEE Systems,Man and Cybernetics Society International Conference, 347-353.
Mital, A. and Manivasagan, I. (1984) Development of non-linear polynomials in identifying human isometric strength behaviour. Int. J. o f Comp, and Ind. Eng. 8 , 1-9.
Mital, A. and Sanghavi, N. (1986) Comparison of maximal volitional torque exertion capabilities of males and females using common hand tools. Human Factors, 28, 283-294.
Mital, A. and Vinayagamoorhty, R. (1984) Three-dimensional dynamic strength measuring device: a prototype. Am. Ind. Hyg. Assoc. J. 45, B9-10, B12.
Monod, H. (1972) How muscles are used in the body. In: The Structure and Function of Muscle, Vol.l, 2nd Ed., 24-74. Edited by Bourne, G.H., London, Academic Press.
Monod, H. and Scherrer, J. (1965) The work capacity of a synergic muscle group. Ergonomics, 8 , 329-338.
Morris, C.B. (1948) The measurement of the strength of muscle relative to the cross-section. Res. Quart. 19, 295-303.
Napier, J.R. (1956) The prehensile movements of the hand. J. Bone. Joint. Surg. 38B, 902-913.
O’Carrol, M.J. (1968) On the relation between strength and body weight. Res. Phys. Educ. 1, 6-11.
Olson, V.L., Smidt, G.L., and Johnston, R.C. (1972) The maximum torque generated by eccentric, isometric, and concentric contractions of the hip abductor muscles. Phys. Ther. 52, 149-157.
Ostemig, L.R., Bates, B.T., and James, S.T. (1977) Isokinetic and isometric torque force relationships. Arch. Phys. Med. Rehabil. 58, 254-257.
Otis, J.C. (1976) Relationship of isometric and isokinetic torques. J. Biomech. 9, 488.
295

Otis, J.C., Warren, R., and Deland, J. (1981) Relationship between isometric and isokinetic muscle torques. Med. Sci. Sports. 13, 128.
Park, K.S. and Chaffin, D.B. (1974) A biomechanical evaluation of two methods of manual load lifting. A. I. I. E. Trans. 6 , 105-113.
Pedersen, D.M., Clark, J.A., Johns, R.E.,Jr., White, G.L., and Hoffman, S. (1989) Quantitative muscle strength testing: a comparison of job strength requirements and actual worker strength among military technicians. Milit. Med. 154, 14-18.
Pheasant, S.T. (1977) A biomechanical analysis of human strength, Ph.D Thesis (University of London).
Pheasant, S.T., Grieve, D.W., Rubin, T., and Thompson, S.J. (1982) Vector representations of human strength in whole body exertion. Applied Ergonomics, 13, 139-144.
Pheasant, S.T. (1983) Sex differences in strength - some observations on their variability. Applied Ergonomics, 14, 205-211.
Pheasant, S.T. (1986)Body Space: Anthropometry, Ergonomics and Design, London, Taylor & Francis.
Pheasant, S.T. and Grieve, D.W. (1981) The principle features of maximal exertion in the sagittal plane. Ergonomics, 24, 327-338.
Pheasant, S.T. and O’Neill, D. (1975) Performance in gripping and turning - A study in hand/handle effectiveness. Applied Ergonomics 6 , 205-208.
Poulsen, E. (1970) Prediction of maximum loads in lifting from measurement of back muscle strength. Prog. Phys. Ther. 1, 146-149.
Pytel, J.L. and Kamon, E. (1981) Dynamic strength test as a predictor for maximal and acceptable lifting. Ergonomics, 24, 663-672.
Rack, P.M.H. and Westbury, D.R. (1969) The effects of length and stimulus rate on tension in the isometric cat soleus muscle. J. Physiol. 204, 443-460.
Rasch, P. J. (1957) Relationship between maximium isometric tension and maximum isotonic elbow flexion. Res. Quart. 28, 85.
Rasch, P.J. and Pierson, W.R. (1960) Relationship between maximal isometric tension and breaking strength of forearm flexors. Res. Quart. 31, 534-535.
296

Rasch, P.J. and Pierson, W.R. (1963) Some relationships of isometric strength, isotonic strength and anthropometric measures. Ergonomics, 6 , 211-216.
Rash, P.J. and Pierson, W.R. (1960) Relationship between maximum isometric tension and breaking strength of forearm flexors. Res. Quart. 31, 534-535.
Riley, M.W., Cochran, D.J., and Schanbacher, C.A. (1985) Force capability differences due to gloves. Ergonomics, 28, 441-447.
Roebuck, J.A.Jr., Kroemer, K.H.E., and Thomson, W.G. (1975) Engineering Anthropometry Methods, New York, Wiley.
Rohmert, W. (1966) Maximalkrafte von Mannem im Bewegungstraum derArme und Beine, Koln, Germany, Westerdeutscher Verlag.
Rohmert, W. (1975) Maximum Forces Exerted by Men in the Tone o f Movement of the Arms and Legs. Library Translation No. 1839, Famborough, Hants, Procurement Executive, Ministry of Defence.
Ross, W .D., Grand, T.I., Marshall, G.R., and Martin, A.D. (1984) On human and animal geometry. In: Proceedings of VII Commonwealth and International Conference on Sporty Physical Educationy Recreation and Dance. Kinesiological Sciences, Vol. 7, 77-97. Edited by Howell, M.L. and Wilson, B.D., Brisbane, Dept. Human Movement Studies, University of Queensland.
Ruhmann-H;, and Schmidtke, H. (1989) Human Strength: Measurements of Maximum Isometric Forces in Industry. Ergonomics, 32, 865-879.
Sanchez, D. (1991) The analysis of manual exertions in asymmetrical working postures and its ergonomic application, Ph.D Thesis (University of London).
Sanchez, D. & Grieve, D.W. (1991) The measurement and prediction of isometric lifting strength in symmetrical and asymmetrical postures. Ergonomics, (In Press)
Schantz, P., Randall-Fox, E., Hutchinson, W., Tyden, W., and Astrand, P.O. (1983) Muscle fibre type distribution, muscle cross-sectional area and maximal voluntary strength in humans. Acta Physiol. Scand. 117, 219-226.
Smith, L.E. (1961) Individual differences in strength, reaction latency, mass and length of limbs, and their relation to maximum speed of movement. Res. Quart. 32, 208-220.
Snook, S.H. (1978) The design of manual handling tasks. Ergonomics, 21,963-985.
297

Stevenson, J., Bryant, T., Greenhorn, D ., Smith, T., Deakin, J., and Surgenor, B. (1990) The effect of lifting protocol on comparisons with isoinertial lifting performance. Ergonomics, 33, 1455-1470.
Svensson, O.K. (1987) On quantification of muscular load during standing work, a biomechanical study t Stockholm, Ph.D Thesis (Karolinska Institute).
Tappen, N.C. (1950) An anthropometric and constitutional study of championship weight lifters. Amer. J. phys. Aruhrop. (N. S.) 8 , 49-64.
Taylor, C.R. and Schwarz, R.J. (1955) The anatomy and mechanics of the human hand. Artif. Limbs, 2, 22-35.
Thordsen, M.L., Kroemer, K.H.E., and Laubach, L.L. (1972) Human Force Exertions in Aircraft Control Locations, Wright-Paterson Air Force Base, Ohio, Aerospace Medical Research Laboratory.
Tomvall, G. (1963) Assessment of physical capabilities with special reference to the evaluation of maximal isometric muscle strength and maximal working capacity. An experimental study on civilian and military subject groups. Acta Physiol. Scand. 58, Sup. 201,
Tracy, M.F. and Munro, S.H. (1989) Simple biomechanical calculations with a manakin: The MOIRON. In: Contemporary Ergonomics, Proceedings o f the Ergonomics Society's 1989Annual Conference, Reading, England, 361-363. Edited by Megaw, E.D., London, Taylor & Francis.
Troup, J.D.G., Leskinen, T.P.J., Stalhammar, H.R., and Kuorinka, I.A.A. (1983) Comparison of intra-abdominal pressure increases, hip torque, and lumbar vertebral compression in different lifting techniques. Human Factors, 25, 517-525.
Vecchiet, L., Marini, I., and Feroldi, P. (1983) Muscular pain caused by isometric contraction: evaluation of pain through visual analog scale. Clin. Therapeutics, 5, 504-508.
Viitasalo, J.T., Era, P., Leskinen, A.-L., and Heikkinen, E. (1985) Muscular strength profiles and anthropometry in random samples of men aged 31-35, 51-55 and 71-75 years. Ergonomics, 28, 1563-1574.
Warwick, D ., Novak, G., Schultz, A ., and Berkson, M. (1980) Maximum voluntary strengths of male adults in some lifting, pushing and pulling activities. Ergonomics, 23, 49-54.
Whitney, R.J. (1957) The strength of the lifting action in man. Ergonomics, 1, 101-128.
298

Wilmore, J.H. (1974) Alterations in strength, body composition and anthropometric measurements consequent to a 10-week training program. Medicine and Science in Sports and Exercise, 6 , 133-138.
Woodson, W.E. (1981) Human Factors Design Handbook, New York, McGraw-Hill.
299

APPENDIX A
SUBJECT INFORMATION PACKAGE AND INFORMEDCONSENT FORMS
300
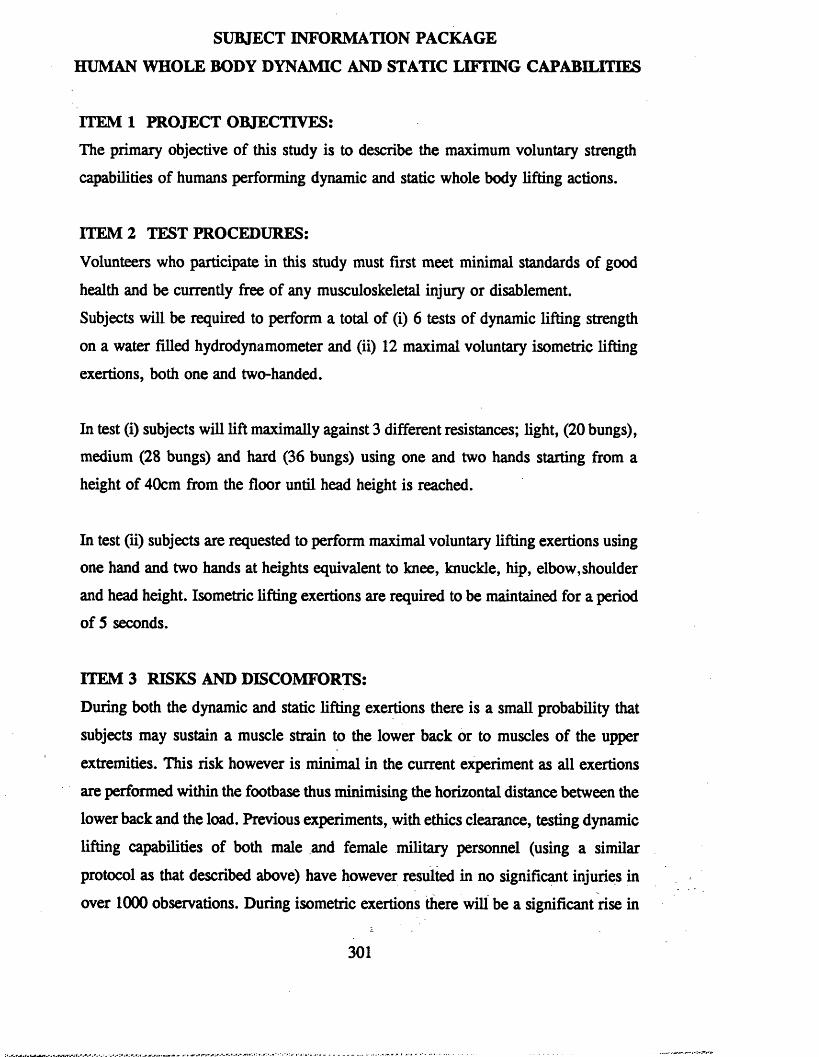
SUBJECT INFORMATION PACKAGE
HUMAN WHOLE BODY DYNAMIC AND STATIC LIFTING CAPABILITIES
ITEM 1 PROJECT OBJECTIVES:
The primary objective of this study is to describe the maximum voluntary strength
capabilities of humans performing dynamic and static whole body lifting actions.
ITEM 2 TEST PROCEDURES:
Volunteers who participate in this study must first meet minimal standards of good
health and be currently free of any musculoskeletal injury or disablement.
Subjects will be required to perform a total of (i) 6 tests of dynamic lifting strength
on a water filled hydrodynamometer and (ii) 12 maximal voluntary isometric lifting
exertions, both one and two-handed.
In test (i) subjects will lift maximally against 3 different resistances; light, (20 bungs),
medium (28 bungs) and hard (36 bungs) using one and two hands starting from a
height of 40cm from the floor until head height is reached.
In test (ii) subjects are requested to perform maximal voluntary lifting exertions using
one hand and two hands at heights equivalent to knee, knuckle, hip, elbow, shoulder
and head height. Isometric lifting exertions are required to be maintained for a period
of 5 seconds.
ITEM 3 RISKS AND DISCOMFORTS:
During both the dynamic and static lifting exertions there is a small probability that
subjects may sustain a muscle strain to the lower back or to muscles of the upper
extremities. This risk however is minimal in the current experiment as all exertions
are performed within the footbase thus minimising the horizontal distance between the
lower back and the load. Previous experiments, with ethics clearance, testing dynamic
lifting capabilities of both male and female military personnel (using a similar
protocol as that described above) have however resulted in no significant injuries in
over 1000 observations. During isometric exertions there will be a significant rise in
301

blood pressure, which in a small number of persons (particularly those who suffer
from hypertension) may lead to temporary dizziness. Some muscle stiffness may be
apparent one to two days following the isometric exertions. This however is only
temporary and should be unnoticeable within 4 days.
ITEM 4 INQUIRIES:
Questions concerning the procedures used are welcome. If you have any doubts please
ask for further explanations.
ITEM 5 FREEDOM OF CONSENT:
Participation is on a voluntary basis. You are free to deny consent, if you so desire,
at any time during or between trials.
ITEM 6 CONFIDENTIALITY:
All questions, answers and results from this study will be treated with absolute
confidentiality. Subjects will be identified in the resultant manuscript and/or
publications by use of subject codes only.
302

INFORMED CONSENT
University of London
Royal Free Hospital School of Medicine
Dept, of Anatomy.
The university and those conducting this project subscribe to the ethical conduct of
research and to the protection at all times of the interests, comfort, and safety of
subjects. This form and the information it contains are given to you for your own
protection and full understanding of the procedures, risks and benefits involved. Your
signature on this form will signify that you have received the document described
below regarding this project, that you have received adequate opportunity to consider
the information in the document, and that you voluntarily agree to participate in the
project.
Having been asked by D. Fothergill of the Dept, of Anatomy of The Royal
Free Hospital School of Medicine, University of London, to participate in a research
project experiment, I have read the procedures specified in the document entitled:
SUBJECT INFORMATION PACKAGE:
HUMAN WHOLE BODY DYNAMIC AND STATIC LUTING CAPABILITIES
I understand the procedures to be used in this experiment and the personal risks to
me in taking part.
I understand that I may withdraw my participation in this experiment at any time.
I also understand that I may register any complaint I might have about the experiment
with the chief researcher named above or with Prof. D.W. Grieve, in the Dept of
Anatomy, Royal Free Hospital.
I may obtain a copy of the results of this study, upon its completion, by contacting
Prof. Don Grieve or David Fothergill.
I agree to participate by performing the isometric and dynamic lifting strength tests
(as explained to me by the principle investigator and referred to in the document
named above).
303

SURNAME_____
GIVEN N A M E _
DATE OF BIRTH
ADDRESS______
SIGNATURE,____________
DATE__________________
SIGNATURE OF WITNESS
304

305

APPENDIX B SUMMARY DATA FOR CHAPTER 4
306

Zable Bl:Group one-handed PSD data at the 1.0 meter bar height
ANG MXU SDXW MN SON ANG MXU SDXW MN SDN0 67 18.1 464 171 10 61 16.2 425 15720 55 14.3 387 152 30 55 12.8 384 13640 57 13.1 393 131 50 56 12.1 384 12360 56 12.7 388 128 70 59 10.8 407 12580 64 12.5 444 151 90 67 10.4 458 115100 63 8.98 429 103 110 63 10 434 99120 60 8.23 412 98 130 58 10.3 395 83140 54 8.920 368 89 150 54 11.1 370 112160 56 11.8 387 116 170 67 16.5 463 163180 64 15.4 446 160 190 56 10.7 386 126200 49 8.670 333 91 210 45 9.129 309 103220 45 8.289 309 98 230 43 9.07 295 93240 45 9.48 311 109 250 48 12.9 332 127260 51 12.7 349 126 270 57 13.3 393 128280 63 17.79 440 170 290 72 20.2 498 190300 76 20.8 529 206 310 80 27.9 565 278320 73 25.7 513 236 330 69 24.6 475 200340 68 26.2 474 217 350 71 26.4 494 215
n.b. 0=LIFT 90='PULL 180=PRESS 270==PUSHFiles read <n=22> are DG1M DF1M DS1M MS1M CG1M JG1N CB1N DP1M SM1M ZH1N P01M JN1M AB1M AP1M JW1M
KA1M KL1N LM1M MH1M PA1M RB1M TIMEOUT BOOT WEIGHT (KG>=69.65 S.D.-12.7
T a b le B2tGroup one-handed PSD data at the 1.75 meter bar height
ANG MXU SDXW MN SDN ANG MXW SDXW MN SDN0 49 27.5 335 200 10 33 7.92 230 8220 26 7.689 185 77 30 22 6.390 156 6540 19 4.98 135 57 50 18 6.01 125 5760 16 5.17 116 51 70 17 4.960 119 5180 17 6.119 118 57 90 21 6.970 148 67100 26 8.850 186 91 110 31 11.4 225 110120 35 9.850 250 103 130 44 11 308 115140 50 11.4 345 115 150 58 10.6 403 105160 61 11.5 418 109 170 68 14.9 465 127180 67 16.6 460 141 190 55 17.9 376 136200 48 17.29 329 134 210 38 13.5 260 103220 31 10.7 218 89 230 28 10.3 193 83240 24 7.68 167 73 250 22 7.810 155 71260 22 7.24 154 69 270 25 8.300 174 81280 26 9.030 187 89 290 31 11.8 223 112300 43 20.5 307 187 310 62 28.7 439 251320 72 27.2 498 241 330 70 27.5 481 219340 65 29.7 446 228 350 54 27.4 376 217
n.b. 0=LIFT 90=PULL 180-PRESS 270=PUSH Files read (n=22) are 0G17 DF17 DS17 MS17 CG17 JG17 CB17 DP17 SM17 ZH17 P017 JM17 AB17 AP17 JU17
KA17 KL17 LM17 MH17 PA17 RB17 TC17 BODY WEIGHT (ICG)s69.9 S.D.=12.7
307
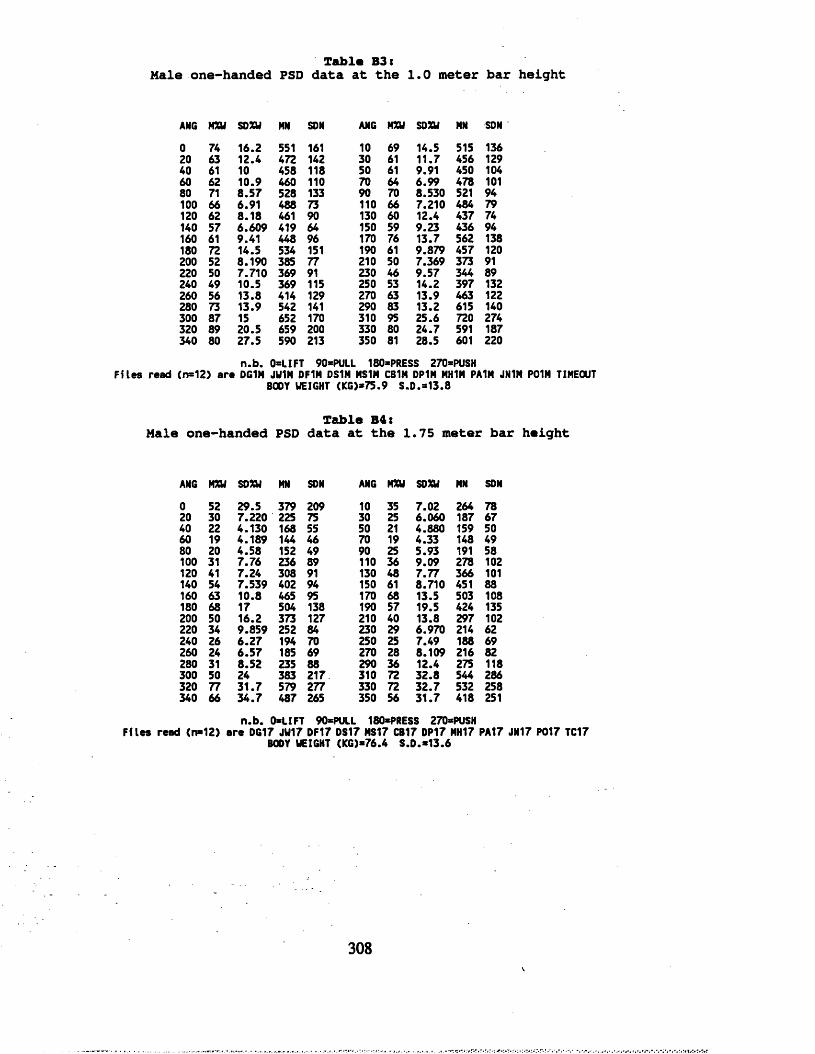
Table B3iMale one-handed PSD data at the 1.0 meter bar height
ANG MXU SDXW MN SDN ANG MXU SO XU MN SDN0 74 16.2 551 161 10 69 14.5 515 13620 63 12.4 472 142 30 61 11.7 456 12940 61 10 458 118 50 61 9.91 450 10460 62 10.9 460 110 70 64 6.99 478 10180 71 8.57 528 133 90 70 8.530 521 94100 66 6.91 488 73 110 66 7.210 484 79120 62 8.18 461 90 130 60 12.4 437 74140 57 6.609 419 64 150 59 9.23 436 94160 61 9.41 448 96 170 76 13.7 562 138180 72 14.5 534 151 190 61 9.879 457 120200 52 8.190 385 77 210 50 7.369 373 91220 50 7.710 369 91 230 46 9.57 344 89240 49 10.5 369 115 250 53 14.2 397 132260 56 13.8 414 129 270 63 13.9 463 122280 73 13.9 542 141 290 83 13.2 615 140300 87 15 652 170 310 95 25.6 720 274320 89 20.5 659 200 330 80 24.7 591 187340 80 27.5 590 213 350 81 28.5 601 220
n.b. 0*LIFT 90=PULL 180■PRESS 270:‘PUSHFiles read (n=12) are 0G1N JW1M 0F1N DS1N MS1M CB1M DP1N MH1M PA1M JN1M P01N TIMEOUT
BODY WEIGHT (ICG)*75.9 S.D.*13.8
Table B4:Male one-handed PSD data at the 1.75 meter bar height
ANG MXU SDXW MN SDN ANG MXU SDXW MN SDN0 52 29.5 379 209 10 35 7.02 264 7820 30 7.220 225 75 30 25 6.060 187 6740 22 4.130 168 55 50 21 4.880 159 5060 19 4.189 144 46 70 19 4.33 148 4980 20 4.58 152 49 90 25 5.93 191 58100 31 7.76 236 89 110 36 9.09 278 102120 41 7.24 308 91 130 48 7.77 366 101140 54 7.539 402 94 150 61 8.710 451 88160 63 10.8 465 95 170 68 13.5 503 108180 68 17 504 138 190 57 19.5 424 135200 50 16.2 373 127 210 40 13.8 297 102220 34 9.859 252 84 230 29 6.970 214 62240 26 6.27 194 70 250 25 7.49 188 69260 24 6.57 185 69 270 28 8.109 216 82280 31 8.52 235 88 290 36 12.4 275 118300 50 24 383 217 310 72 32.8 544 286320 77 31.7 579 277 330 72 32.7 532 258340 66 34.7 487 265 350 56 31.7 418 251
n.b. 0*1.1 FT 90=PULL 180*PRESS 270=PUSH Files read <n*12) are 0G17 JU17 DF17 DS17 MS17 CB17 DP17 MH17 PA 17 JN17 P017 TC17
BOOT WEIGHT (KG)*76.4 S.D.*13.6
308V

Table B5:Female one-handed PSD data at the 1.0 meter bar height
ANG MXU SDXW MN SDN ANG MXU SDXW MN SDN0 58 17.5 359 120 10 51 12.7 317 10420 46 11.3 285 89 30 48 10.9 296 85AO 51 14.8 314 104 50 50 12.2 305 9660 49 11.4 301 91 70 52 11.1 322 9680 56 12 344 103 90 63 11.3 384 92100 58 9.48 358 89 110 61 12.5 373 89120 58 7.939 353 74 130 56 7.380 345 65140 50 10.2 307 78 150 47 10.3 291 76160 51 12.7 312 94 170 56 13.1 343 100180 55 11.3 340 93 190 49 7.76 300 68200 44 7.58 272 65 210 38 6.41 233 51220 39 4.130 237 42 230 38 6.48 237 58240 40 4.189 242 45 250 41 7.609 254 63260 44 7.82 271 64 270 51 9.41 310 76280 51 15 318 113 290 58 18.9 358 141300 62 18.29 382 138 310 62 18.4 380 136320 55 18.7 338 134 330 55 16.79 337 108340 54 16.9 335 122 350 60 18.79 366 124
n.b. 0=LIFT 90=PULL 180sPRESS 270:-PUSHFiles read (n=10) are CG1M JG1M SN1M ZH1H AB1M AP1M KA1M KL1M LM1M RB1M
BODY WEIGHT (KG)=62.2 S.D.=5.3
T a b le B6:Female one-handed PSD data at the 1.75 meter bar height
ANG MXU SDXU MN SDN ANG MXU SDXU MN SON0 45 26.1 283 186 10 31 8.550 189 6820 22 6.35 137 48 30 19 5.73 118 4040 16 3.62 97 28 50 14 4.6 84 3460 13 4.66 82 35 70 14 3.83 85 2980 13 5.42 78 37 90 16 3.71 96 30100 20 6.75 127 51 110 26 11.7 161 86120 29 9.23 180 68 130 38 12.2 237 90140 45 13.8 277 103 150 56 12.6 344 97160 59 12.4 362 101 170 68 17.2 419 137180 66 16.9 408 132 190 52 16.2 318 118200 45 18.9 276 128 210 35 13.5 217 90220 29 11.6 177 82 230 27 13.7 168 101240 22 8.93 134 65 250 19 7.09 115 51260 19 7.17 116 50 270 20 6.27 124 46280 21 6.4 129 47 290 26 8.359 159 64300 35 11.6 215 85 310 51 18.4 313 122320 65 20.29 401 150 330 68 21.2 420 150340 64 24.1 398 176 350 52 22.7 326 167
n.b. OsLIFT 90=PULL 180=PRESS 270=PUSH Files read <n*10> are CG17 JG17 SM17 ZH17 AB17 AP17 KA17 ICL17 LM17 RB17
BODY WEIGHT <KG>=62.2 S.D.=5.3

Z a b le B7:Group one-handed PSD data at the 1.0 meter bar height (used for comparison with two-handed exertions at the same bar height).
ANG MXU SDXU MN SDN ANG MXU SDXU MN SDN0 72 20.7 519 190 10 64 18.7 464 17220 58 13.7 419 142 30 58 12.1 417 11940 59 13.1 422 127 50 58 13.3 416 12260 60 13.6 426 124 70 61 10.2 440 11580 66 11 477 138 90 68 10.5 485 126100 63 9.120 451 107 110 63 8.390 448 107120 61 7.939 433 102 130 58 8.039 414 86140 54 7.52 381 80 150 54 9.190 391 115160 56 10.8 401 122 170 68 16.1 489 167180 64 14.8 465 154 190 57 9.59 410 111200 50 9.129 354 90 210 47 8.850 336 106220 47 8.16 335 91 230 43 9.210 308 84240 45 7.439 321 83 250 50 11.2 353 98260 49 9.98 351 93 270 57 12.6 406 117280 64 15.2 463 152 290 73 17.79 531 183300 76 18.1 560 216 310 89 26.3 663 308320 81 25.8 595 259 330 75 24.6 536 206340 72 30.1 520 249 350 77 31 557 258
n.b. 0«LIFT 90*PULL 180=PRESS 270=PUSH Files read (n=12) are DG1M DF1M DS1M MS1M CG1M JG1N CB1N 0P1N SM1M ZH1M P01M JN1M
BODY WEIGHT (KG)»72.7 S.D.=13.8
Z a b le B8:Group two-handed PSD data at the 1.0 meter bar height
ANG MXU SDXU MN SDN ANG MXU SDXU MN SDN0 96 24.1 690 221 10 82 15 586 16220 71 11.9 512 143 30 70 11 505 16840 63 7.359 456 121 50 62 6.5 446 11260 61 6.25 439 105 70 61 5.73 438 10080 63 6.050 450 93 90 70 8.190 494 94100 68 8.050 484 94 110 66 8.030 465 88120 66 7.16 464 83 130 66 8.27 472 96140 67 5.74 479 85 150 68 4.939 483 8216a 72 6.98 515 106 170 82 8.949 588 154180 90 8.690 644 135 190 68 9.32 488 111200 61 8.260 442 120 210 57 8.620 406 104220 54 6.140 387 92 230 54 6.23 386 80240 54 7.67 387 91 250 56 8.879 396 90260 63 9.32 449 111 270 74 13 527 139280 84 17.2 600 174 290 98 22.9 697 199300 105 33.2 742 256 310 111 31.6 781 223320 111 38.40 777 257 330 91 21 645 161340 92 19.2 655 184 350 97 24 697 230
n.b. 0*LIFT 90-PULL 180=PRESS 270=PUSH Files read <n*12> are 2DG1N 2DF1M 2DS1M 2MS1M 2CG1N 2JG1M 2CB1M 2DP1N 2SM1M 2ZH1H 2P01M 2JN1M
BODY WEIGHT <ICG)»72.6 S.D.*12.9
310

Table B 9 :Group one-handed PSD data at the 1.75 meter bar height (used for comparison with two handed exertions performed at the same bar
height).
ANG MXU SDXU MN SDN ANG MXU SDXU MN SDN0 37 9.609 267 102 10 33 6.93 242 8320 27 7.32 197 72 30 23 6 167 6140 21 4.710 152 56 50 19 6.140 143 5860 18 5.07 132 52 70 19 5.24 141 5680 19 5.529 140 54 90 23 6.560 168 59100 28 9.460 210 99 110 34 12.5 255 121120 39 10.8 285 110 130 48 12.3 350 122140 52 12.9 375 126 150 57 12.7 414 127160 59 12.6 425 123 170 63 11.6 454 129180 63 14.8 457 150 190 51 13.2 370 128200 45 15.3 326 138 210 36 12.4 259 102220 31 10.2 228 88 230 27 6.65 195 62240 25 6.84 180 74 250 22 6.869 164 66260 23 6.68 169 68 270 25 6.960 185 70280 28 8.010 202 74 290 33 10.8 238 91300 43 18.4 311 149 310 64 32.09 464 255320 73 32 524 267 330 67 30.4 479 235340 59 29.2 424 229 350 45 15.1 333 175
n.b. 0=LIFT 90=PULL 180*PRESS 270=PUSH Files read <n*12) are DG17 DF17 0S17 MS17 CG17 JG17 CB17 DP17 SM17 ZH17 P017 JM17
BODY WEIGHT <KG)*73.0 S.D.=13.7
Table BIO:Group two-handed PSD data at the 1.75 meter bar height
ANG MXU SDXU MN SDN ANG MXU SDXU MN SDN0 51 15.2 376 149 10 35 9.09 254 10320 27 6.99 196 81 30 24 6.310 174 7240 22 5.279 158 58 50 21 5.289 156 5860 21 4.27 153 46 70 22 5.33 159 4780 24 7.75 171 67 90 27 5.779 192 57100 30 7.93 217 74 110 33 6.029 237 59120 41 10.7 298 129 130 46 6.99 334 95140 57 8.210 414 111 150 67 9.91 487 132160 72 8.699 520 121 170 86 6.67 614 106180 90 7.42 638 95 190 69 12.6 490 104200 51 13.3 363 112 210 38 9.210 272 76220 30 9.07 217 75 230 28 7.75 199 71240 25 6.279 184 64 250 25 6.1 178 56260 27 6.300 199 70 270 29 6.060 208 67280 33 6.550 243 75 290 40 7.939 288 93300 54 14.6 399 159 310 78 32.8 575 302320 95 36.09 693 316 330 96 34.8 6 77 266340 91 25.2 640 196 350 63 18.79 454 143
n.b. 0*LIFT 90=PUll 180=PRESS 270*PUSH Files read (n*12> are 2DG17 2DF17 2DS17 2HS17 2CG17 2JG17 2CB17 2DP17 2SH17 2ZH17 2P017 2JN17
BODY WEIGHT (KG)=72.7 S.D.=12.9
311

Zable Bll:Static strength capabilities when the maximum advantage of using
components of deviated forces are calculated for one-handed exertions at the 1.0 meter bar height (Group data).
ANG MXW SDXW MN SDN ANG MXW SDXW MN SDN0 78 23 538 207 10 74 21.8 510 19220 70 19.29 485 176 30 65 16.79 452 15840 62 13.8 427 138 50 62 11.5 429 13160 64 11.4 446 138 70 67 11.4 463 14080 68 11 473 136 ' 90 69 11.1 475 132100 68 10.6 470 123 110 67 10.3 458 111120 65 10.6 442 101 130 63 10.3 429 97140 64 11 439 114 150 66 12.2 457 134160 68 14.6 470 153 170 68 16.1 475 165180 68 16.1 471 166 190 66 15.4 458 160200 63 13.9 434 147 210 58 12.2 400 133220 53 10.1 365 117 230 51 9.73 354 113240 55 11.8 381 122 250 61 13.6 421 141260 67 16.7 467 176 270 72 19.79 508 207280 77 22.3 543 234 290 81 24.1 571 253300 84 25 590 264 310 85 25.8 601 269320 86 26.6 602 272 330 85 26.2 594 263340 83 25.2 582 247 350 81 23.9 566 227
n.b. 0-LIFT 90=PULL 180=PRESS 270=PUSH Files read (n=22) are DG1N KA1M AB1N DF1N DS1M NS1M CG1M JG1M CB1M DP1M JU1M KL1H MH1M PA1M SM1H
ZH1M AP1N JN1M LM1M P01M TIMEOUT RB1M BODY WEIGHT <KG)*69.7 S.D.=12.7
Zable B12:Static strength capabilities when the maximum advantage of using
components of deviated forces are calculated for one-handed exertions at the 1.75 meter bar height (Group data).
ANG MXW SDXW MN SDN ANG MXW SDXW MN SDN0 69 27.6 474 218 10 63 26.8 432 21120 56 25.6 389 201 30 50 23.2 344 18140 43 19.9 296 155 50 35 16.1 243 12560 30 11.8 209 94 70 29 7.99 201 8180 31 7.98 220 87 90 37 7.73 256 89100 42 8.300 291 91 110 47 8.82 325 93120 52 9.359 359 94 130 57 10.3 393 99140 62 11.8 424 106 150 66 13.3 449 116160 68 14.6 467 124 170 70 15.3 476 131180 69 15.8 475 133 190 67 16 463 134200 64 16 438 131 210 59 15.3 403 123220 53 14 360 110 230 46 12.7 313 100240 40 11.7 275 97 250 38 14 264 126260 43 17.2 305 157 270 53 20.4 369 185280 61 23 426 208 290 68 25.2 475 226300 73 26.3 511 234 310 77 26.8 533 237320 79 27.6 545 238 330 79 28.2 544 234340 77 28.1 528 224 350 74 28.2 506 223
n.b. 0=LIFT 90=PULL 180*PRESS 270=PUSH Files read <n*22) are DG17 KA17 AB17 DF17 DS17 MS 17 CG17 JG17 CB17 DP17 JW17 KL17 MH17 PA17 SM17
ZH17 AP17 JN17 LM17 P017 TC17 RB17 BODY WEIGHT (KG)*69.9 S.D.=12.7
312

T a b le B131Mean static strength of male subjects when the maximum advantage of using components of deviated forces are calculated for one-handed
exertions at the 1.0 meter bar height
ANG MXW SDXU MN SON ANG MXU SDXU MN SDN0 87 23.8 645 206 10 82 23.6 606 19720 78 20.2 577 175 30 72 16.5 536 15240 67 12 501 127 50 67 8.600 501 11660 70 8.879 523 125 70 72 9.140 538 12980 73 9.100 545 127 90 73 9.27 543 122100 72 8.260 536 109 110 70 7.68 518 91120 68 8.550 497 75 130 65 9.23 481 75140 69 10.9 506 99 150 72 11.8 537 123160 75 13.3 561 139 170 77 14.6 572 151180 76 15 567 154 190 74 14.6 548 151200 69 13.3 516 139 210 64 11.7 475 127220 58 9.460 433 109 230 56 9.699 420 108240 62 10.7 455 104 250 69 10 511 110260 77 10.7 577 141 270 85 13.4 635 177280 91 15.7 684 206 290 96 18.2 721 231300 99 19.7 747 245 310 101 21.7 759 255320 101 23.4 762 260 330 99 25.1 743 261340 96 25.3 718 248 350 92 24 689 224
n.b. 0=LIFT 90*'PULL 180IMPRESS 270*'PUSHFiles read (n»12) are DG1N DF1M DS1M MS1M CB1H DP1M JU1H MH1M PA1H JN1M P01H TIMEOUT
B00Y WEIGHT (KG)*75.9 S.D.»13.8293331
T a b le B14:Mean static strength of male subjects when the m aximum advantage of using components of deviated forces are calculated for one-handed
exertions at the 1.75 meter bar height
ANG MXU SDXU MN SDN ANG MXU SDXU MN SDN0 73 31.4 541 240 10 66 31 491 23820 59 30 441 230 30 52 27 388 20640 45 22.6 336 172 50 37 17.6 277 13360 33 11.3 244 87 70 33 4.779 245 6680 35 5.08 266 78 90 40 4.1 303 75100 45 5.220 336 76 110 49 6.77 367 82120 53 7.65 397 81 130 58 8.75 428 84140 62 10.6 458 88 150 66 12.5 485 99160 68 14.2 505 111 170 70 15 517 119180 70 16.1 517 125 190 68 16.79 507 128200 65 17 481 126 210 60 16.29 444 119220 54 15.1 398 107 230 47 13.8 349 98240 41 12 309 96 250 42 14.9 314 134260 50 19.29 376 173 270 59 23.3 448 207280 68 26.6 513 233 290 76 28.9 567 253300 81 30 606 260 310 84 30.3 629 262320 86 30.8 638 259 330 85 31.4 632 253340 82 31.5 608 240 350 78 31.9 580 242
n.b. 0»LIFT 90''PULL 180=PRESS 270=PUSHFiles read (n*12) are 0G17 DF17 DS17 MS17 CB17 DP17 JU17 MH17 PA17 JN17 P017 TC17
BODY WEIGHT (KG)*76.4 S.D.*13.6
313

Table B15:Mean static strength of female subjects when the maximum advantage of
using components of deviated forces are calculated for one-handed exertions at the 1.0 meter bar height
ANG MXU SDXW MN SON ANG MXU SDXW MN SDN0 67 17.29 409 119 10 65 16 396 11020 61 14.5 374 100 30 57 13.8 350 9540 55 13.3 339 95 50 56 11.9 343 9160 58 10.8 354 89 70 61 11 372 9380 63 10.9 385 91 90 64 11.5 393 93100 64 11.7 391 91 110 63 12.1 387 92120 62 12.3 377 91 130 60 11.1 366 83140 59 8.93 359 72 150 59 8.59 362 73160 59 10.8 362 85 170 58 11.8 359 92180 58 11.5 356 90 190 57 11 349 88200 54 9.91 334 81 210 51 8.59 310 72220 46 6.640 282 60 230 45 5.34 276 54240 47 7.939 292 72 250 51 10.2 312 88260 54 13.8 335 111 270 58 15.8 356 123280 61 17.4 375 133 290 63 17.7 390 134300 65 17.29 402 130 310 67 16.7 411 126320 67 16.5 410 122 330 68 15.6 415 116340 68 15.8 419 113 350 68 16.9 417 118
n.b. 0-LIFT 90-PULL 180-PRESS 270-PUSH Files read (n»10) are KA1M AB1N C61N JG1M KL1M SM1M ZH1M AP1N LN1N RB1N
B00Y WEIGHT (KG)-62.2 S.0.-5.3
Table Bl6tMean static strength of female subjects when the maximum advantage of
using components of deviated forces are calculated for one-handed exertions at the 1.75 meter bar height
ANG MXW SDXU MN SDN ANG MXU SDXU MN SDN0 64 22.7 395 164 10 59 21.4 361 15420 53 20 326 146 30 47 18.6 290 13740 40 16.9 249 124 50 32 14.5 201 10760 27 12 167 89 70 24 8.550 147 6580 27 8.600 164 64 90 32 8.920 199 70100 38 10 236 79 110 45 10.6 275 84120 51 11.3 314 92 130 57 12.4 351 103140 62 13.7 382 114 150 66 14.9 407 124160 68 15.8 421 130 170 69 16.4 427 133180 69 16.29 424 131 190 66 15.8 409 126200 63 15.5 386 122 210 57 14.7 354 114220 51 13.2 316 101 230 44 11.8 270 88240 38 11.6 235 86 250 33 11.8 203 87260 36 11 220 79 270 44 13 273 95280 52 14.7 321 109 290 59 17 363 124300 64 18.7 396 134 310 68 19.9 418 141320 70 21.9 433 157 330 71 22.9 438 165340 70 23.2 432 168 350 68 23.2 418 168
n.b. 0-LIFT 90-PULL 180-PRESS 270*=PUSHFiles read (n-10) are KA17 AB17 CG17 JG17 KL17 SM17 ZH17 AP17 LM17 RB17
B00Y WEIGHT <KG)»62.2 S.D.-5.3
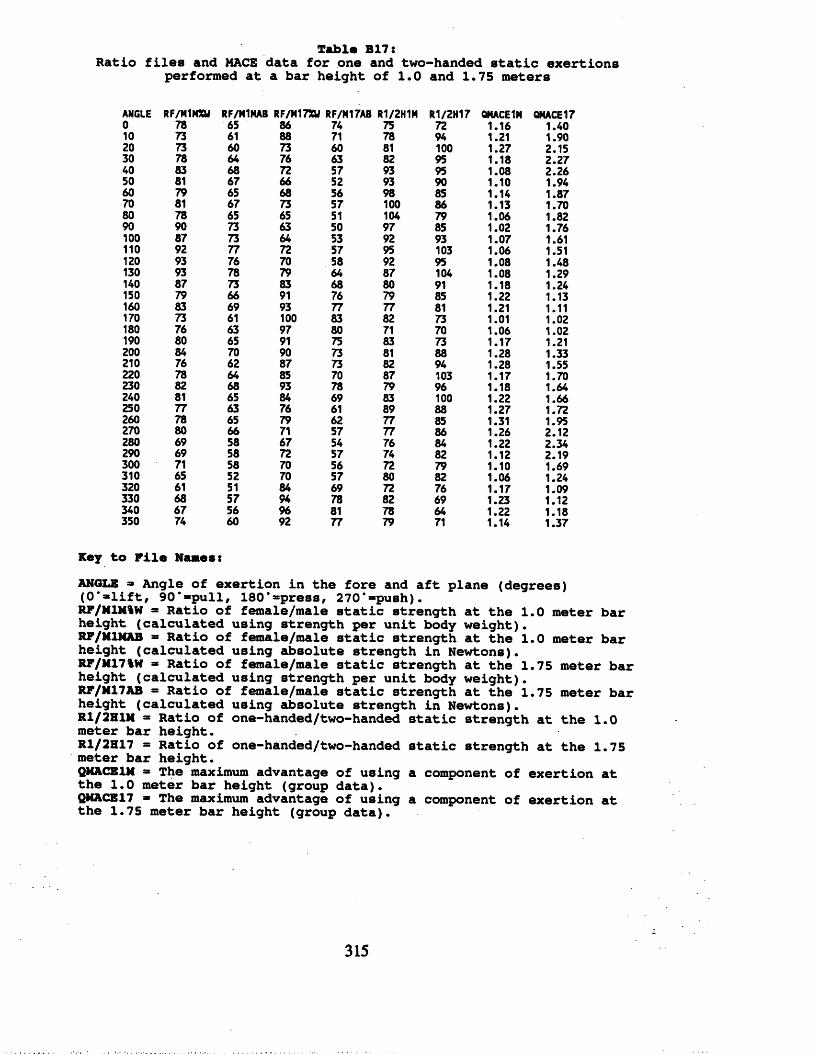
Table B17:Ratio files and MACE data for one and two-handed static exertions
performed at a bar height of 1.0 and 1.75 meters
ANGLE RF/M1MXU RF/M1MAB RF/M17XU RF/N17AB R1/2H1M R1/2H17 QMACE1M QMACE170 78 65 86 74 75 72 1.16 1.4010 73 61 88 71 78 94 1.21 1.9020 73 60 73 60 81 100 1.27 2.1530 78 64 76 63 82 95 1.18 2.2740 83 68 72 57 93 95 1.08 2.2650 81 67 66 52 93 90 1.10 1.9460 79 65 68 56 98 85 1.14 1.8770 81 67 73 57 100 86 1.13 1.7080 78 65 65 51 104 79 1.06 1.8290 90 73 63 50 97 85 1.02 1.76100 87 73 64 53 92 93 1.07 1.61110 92 77 72 57 95 103 1.06 1.51120 93 76 70 58 92 95 1.08 1.48130 93 78 79 64 87 104 1.08 1.29140 87 73 83 68 80 91 1.18 1.24150 79 66 91 76 79 85 1.22 1.13160 83 69 93 77 77 81 1.21 1.11170 73 61 100 83 82 73 1.01 1.02180 76 63 97 80 71 70 1.06 1.02190 80 65 91 75 83 73 1.17 1.21200 84 70 90 73 81 88 1.28 1.33210 76 62 87 73 82 94 1.28 1.55220 78 64 85 70 87 103 1.17 1.70230 82 68 93 78 79 96 1.18 1.64240 81 65 84 69 83 100 1.22 1.66250 77 63 76 61 89 88 1.27 1.72260 78 65 79 62 77 85 1.31 1.95270 80 66 71 57 77 86 1.26 2.12280 69 58 67 54 76 84 1.22 2.34290 69 58 72 57 74 82 1.12 2.19300 71 58 70 56 72 79 1.10 1.69310 65 52 70 57 80 82 1.06 1.24320 61 51 84 69 72 76 1.17 1.09330 68 57 94 78 82 69 1.23 1.12340 67 56 96 81 78 64 1.22 1.18350 74 60 92 77 79 71 1.14 1.37
Key to F i l e Names:
ANGLE » Angle of exertion in the fore and aft plane (degrees)(0*»lift, 90**pull, 180*“press, 270*=push).RF/M1M%W = Ratio of female/male static strength at the 1.0 meter bar height (calculated using strength per unit body weight).RF/M1MAB * Ratio of female/male static strength at the 1.0 meter bar height (calculated using absolute strength in Newtons).RF/M17%W =* Ratio of female/male static strength at the 1.75 meter bar height (calculated using strength per unit body weight).RF/M17AB = Ratio of female/male static strength at the 1.75 meter bar height (calculated using absolute strength in Newtons).R1/2H1M = Ratio of one-handed/two-handed static strength at the 1.0 meter bar height.R1/2H17 = Ratio of one-handed/two-handed static strength at the 1.75 meter bar height.QMACE1M * The maximum advantage of using a component of exertion atthe 1.0 meter bar height (group data).QMACE17 * The maximum advantage of using a component of exertion atthe 1.75 meter bar height (group data).
315

316

APPENDIX C
SUMMARY DATA FOR CHAPTER 5

Mean Force and Friction Data over the Sphere of Exertion for One-handed Maximal Static Exertions at the 1.0 m (initial and repeat) and 1.75 m Handle
Heights.
Table Cl:Strength data for one-handed exertions at a hand height of 1.0 m. The
values are the means and standard deviations over the entire sphere of exertion for the four males subjects following the fifth session.
NEWTONS % BODY WEIGHT FRICTION COEFFICIENTUNSMOOTHED SMOOTHED UNSMOOTHED SMOOTHED UNSMOOTHED SMOOTHED
ABSOLUTE VALUES MEAN 209 209.3 28.58 28.64 0.2055 0.2085SD 75.6 75.4 10.27 10.23 0.1117 0.1098
TIME DIFFERENCE9 MEAN 5 4.8 0.67 0.69 5.5E-3 4.7E-3SD 8.6 8.5 1.18 1.18 0.0112 0.0124
Table C2:Summary data for one-handed exertions (repeat trials) at a hand height
of 1.0 m. The values are the means and standard deviations over the entire sphere of exertion for the four males subjects following the fourth session.
ABSOLUTE VALUES MEANUNSMOOTHED
208.9
NEWTONS X B00Y WEIGHT FRICTION COEFFICIENT SMOOTHED UNSMOOTHED SMOOTHED UNSMOOTHED SMOOTHED
209.5 28.54 28.62 0.2041 0.2068SD 78.9 78.4 10.71 10.66 0.1095 0.1078
TIME DIFFERENCE MEAN 8.4 8.3 1.15 1.13 9.4E-3 9E-3SD 14.1 14.2 1.96 1.98 0.0139 0.0144
Table C3:Summary data for one-handed exertions at the 1.75m hand height. The
values are the means and standard deviations over the entire sphere of exertion for the four males subjects following the fourth session .
NEWTONS X B00Y WEIGHT FRICTION COEFFICIENTUNSMOOTHED SMOOTHED UNSMOOTHED SMOOTHED UNSMOOTHED SMOOTHED
ABSOLUTE VALUES MEAN 134.7 134.8 18.83 18.84 0.1234 0.125SD 79.8 79.7 11.16 11.16 0.0712 0.0706
TIME DIFFERENCE MEAN 5.3 5.2 0.74 0.72 5.4E-3 5.6E-3SD 9.1 9.1 1.32 1.33 9.4E-3 9.8E-3
9 This value represents the difference in force (or value for the coefficient of limiting friction) between the final and penultimate 20 minute session.
318

Two Dimensional Postural Stability Diagrams Encompassing the Sphere ofExertion
Figure C l: The following graphs represent PSD’s of normalized forces for each 10° vertical plane in the sphere of exertion (as well as for one horizontal plane when the vertical force is zero) for one-handed maximal whole body static exertions on the 3D dynamometer. On each page the upper and lower figures represent exertions at the 1.75 m and 1.0 m handle height respectively. The plane of exertion viewed is indicated in each case by the arrows on the smaller circle. The data is based on the mean and SD of the forces recorded on four male subjects with horizontal foot placements 0.5 m from the handle.
NOTES
In the following PSDs the mean and SD for the pole values are slightly overestimated due to a computational error. The true values are
For 1.0 mNEWTONS % Body WtMn SD Mn SD
LIFT 143 13 19.5 2.7PRESS 445 54 60.7 8.2
For 1.75 mNEWTONS % Body WtMn SD Mn SD
LIFT 90 17 12.6 2.7PRESS 358 101 50.0 14.5
319

SMOOTHED FORCE ARRAY I A b b V V V b I I I * T l l l V l fANGLE OF PSD = 0100% BU
LIF
LEFTPUSHPULL
PUSH
PULL
RIGHT
SMOOTHED FORCE RRRRV100% BU
LEFT
FILE CODE: M1-4NYBD ANGLE OF PSD = 0
PUSH
PULL
RIGHT
-100% BU
3 2 0
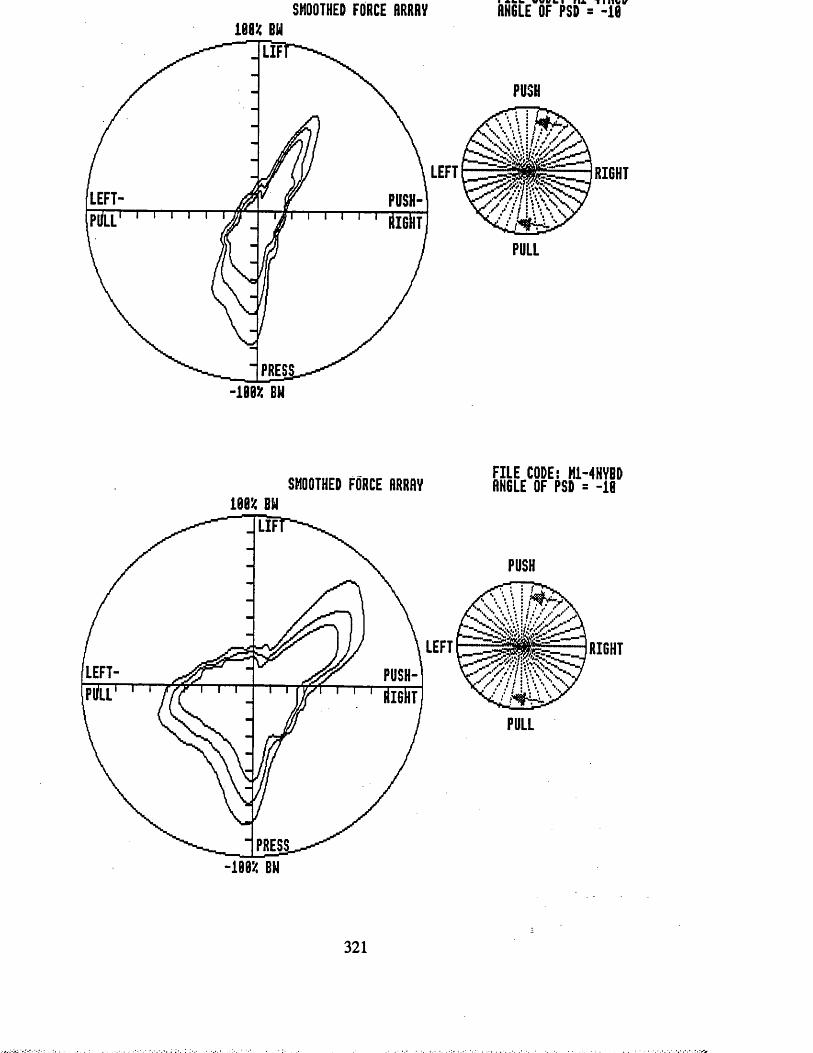
SMOOTHED FORCE RRRRV ANGLE OF PSD = -10180* BULIF
PUSH
LEFT RIGHTPUSHRIGHT
PULL
SMOOTHED FORCE RRRRV100* BU
FILE CODE: M1-4HVBD ANGLE OF PSD = -10LIF
PUSH
f v ' v • : ! \ \ V
LEFT RIGHTPUSH
PULL
321

SMOOTHED FORCE RRRRV100* BU
LEFT- ff
l i fT ^ ^ ^
^ jjf PUSH-PllLL' 1 , 1 , 1 W . . . . . RIGHT
PRES
LEFT
FILE CODE: M1-4YHCDRHGLE OF PSD = -26
PUSH
RIGHT
PULL
-180* BU
SMOOTHED FORCE RRRRY188* BU
LIF
LEFTLEFT-pOll
FILE CODE: M1-4HYBD RH6LE OF PSD = -28
PUSH
PULL
RIGHT
322

SMOOTHED FORCE ARRAY108* BU
LIF
LEFTLEFT-PliLL'
PUSH-riiGhr
FILE CODE: M1-4YHCDANGLE OF PSD = -38
PUSH
PULL
RIGHT
SMOOTHED FORCE ARRAY188* BU
LIF
LEFTPUSH-KigSt
FILE CODE: M1-4HYBD ANGLE OF PSD = -38
RI6HT
PULL
323

SMOOTHED FORCE RRRRY108V: BU
LIF
LEFTPUSH-LEFT-■ffiGliTPULL
FILE CODE: H1-4YHCD RN6LE OF PSD = -48
PUSH
RIGHT
SMOOTHED FORCE RRRRYim BU
LIF
LEFTLEFT-PULL
1 PRES]-180'/. BU
FILE CODE: M1-4HYBD ANGLE OF PSD = -48
PUSH
RIGHT
PULL
324

SMOOTHED FORCE RRRRY108% BU
LEFT- J
LIFl—
lll PUSH-Pl/LL' 1 1 ‘ ' 1 ' _ %. . . . . . . SIGHT
PRES-188% BU
r i l l r u - t i n u yANGLE OF PSD = -58
PUSH
PULL
SMOOTHED FORCE RRRRY108% BU
FILE CODE: M1-4NYBD ANGLE OF PSD = -58LIF
\ LEFTPUSH-RIGHT
RIGHT
PULLUSE + RHD - KEYS TO CHANGE PLANE
325

SMOOTHED FORCE RRRRV180% BU
LIF
LEFTPUSH-LEFT-liolii
FILE CODE: M1-4YNCDRHGLE OF PSD = -60
PUSH
PULL
SMOOTHED FORCE RRRRY180% BU
LIF
LEFTPUSH-® T
LEFT-PULL
_JPREJ -108% BU
FILE CODE: M1-4HYBD RN6LE OF PSD = -60
PUSH
PULL
3 2 6

SMOOTHED FORCE ARRAY108* BU
LIF
LEFTPUSH-ftlGhT
PRES:-1003C BU
FILE CODE: M1-4YNCDANGLE OF PSD = -70
PUSH
PULL
RIGHT
SMOOTHED FORCE RRRRY180* BU
LIF
LEFTPUSH-
FILE CODE: M1-4HYBD ANGLE OF PSD = -70
PULL
RIGHT
327
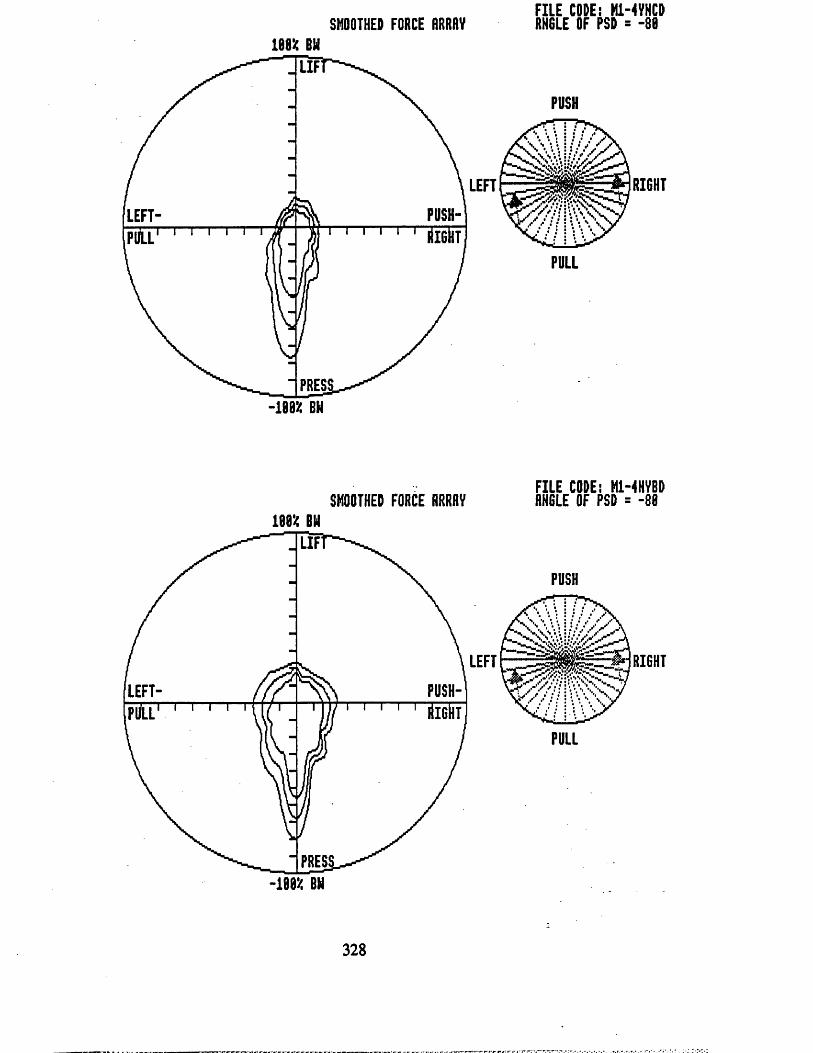
SMOOTHED FORCE RRRRV108% BU
LIF
LEFTLEFT-M l
FILE CODE: H1-4YNCDRHGLE OF PSD = -80
PUSH
PULL
RI6HT
SMOOTHED FORCE RRRRY180% BU
LEFT- / / ^
l i f T ^ ^
PUSH-'']JJ 1 1 1 1 1 Right,
P R E S J . ^ ^-108% BU
FILE CODE: M1-4HVBD ANGLE OF PSD = -80
PUSH
PULL
3 28

SMOOTHED FOHCE ARRAY100* BU
LIF
LEFTLEFT RIGHT
FILE CODE: M1-4YNCDANGLE OF PSD = -98
PUSH
RIGHT
SMOOTHED FORCE RRRRY100* BULIF
LEFTLEFT RIGHT
PRES:-180* BU
FILE CODE: M1-4HYBD RNGLE OF PSD = -98
PUSH
PULL
RIGHT
329

SMOOTHED FORCE flRRRV188* BU
LIF
LEFTFULL-RiGHf
LEFT-
FILE CODE: M1-4YNCD RN6LE OF PSD = 18
PUSH
PULL
RIGHT
SMOOTHED FORCE RRRRV100* BULIF
LEFTPULL- LEFT-RlGHt m
PRES:-188* BU
FILE CODE: M1-4HVBD RHGLE OF PSD = 18
PUSH
PULL
RIGHT
330

SMOOTHED FORCE RRRRV100* BU
LIF
LEFTPULL-RfGHt
FILE CODE: M1-4YNCDflHGLE OF PSD = 20
PUSH
PULL
RIGHT
SMOOTHED FORCE RRRRY100* BU
PULL-
lifT - ^ ^
m left-RtGHt ' 1 r n 1 ' ' . 1 1 )V 1 1 1 Mf/ur
_PRES~100* BU
FILE CODE: M1-4HYBD RHGLE OF PSD = 20
PUSH
PULL
331

SMOOTHED FORCE RRRRY108% BU
LIF
LEFTLEFT-PULL-
RioilF ?usiF
FILE CODE: M1-4YNCDANGLE OF PSD = 30
PUSH
PULL
SMOOTHED FORCE RRRRY100% BU
LIF
LEFTPULL-
FILE CODE: M1-4HYBD ANGLE OF PSD = 30
PUSH
RIGHT
PULL
332

SMOOTHED FORCE ARRAY FILE CODE: M1-4YNCDANGLE OF PSD = 48100* BU
LIF
LEFTLEFT-PUSH
PUSH
PULL
RIGHT
SMOOTHED FORCE ARRAY108% BU
LIF
LEFTLEFT-PUSH
FILE CODE: M1-4HYBD ANGLE OF PSD = 48
PUSH
PULL
RIGHT
333

FILE CODE: M1-4YNCDSMOOTHED FORCE RRRRY RH6LE OF PSD = 58180* BU
LIFPUSH
l e f t T RIGHTLEFT-PULL-WRIGHT
PULL
SMOOTHED FORCE RRRRY188% BU
LIF
LEFTLEFT-fu sT
PULL-RIGHT
^JPRES:-188* BU
FILE CODE: M1-4NYBD RNGLE OF PSD = 58
PUSH
PULL
RIGHT
334

FILE CODE: M1-4YHCDSMOOTHED FORCE HRRAY RN6LE OF PSD = 68100* BU
LIFPUSH
LEFT RIGHTLEFTPUSH
PULL
SMOOTHED FORCE RRRRY188* BU
FILE CODE: M1-4HYBD RHGLE OF PSD = 68LIF
PUSH
• **f« *, • • I *wVW/iLEFT RIGHTPULL LEFT
PUSHPULL
335

SMOOTHED FORCE RRRRY100* BU
LIF
LEFTPULL- LEFT-RIGHT
FILE CODE: M1-4YNCDRN6LE OF PSD = 78
PUSH
PULL
RIGHT
SMOOTHED FORCE RRRRY188* BU
LIF
LEFTPULL- LEFT-RIGHT PUSH
FILE CODE: M1-4NYBD RHGLE OF PSD = 78
PUSH
RIGHT
336

SMOOTHED FORCE RRRRV188% BU
LIF
LEFTPULL-RIGHT
r u t tuut: ni-iYNiuRH6LE OF PSD = 88
PUSH
PULL
RIGHT
SMOOTHED FORCE RRRRV188% BU
LIF
LEFTPULL-RIGHT
~|PRgl-188% BU
FILE CODE: M1-4HVBD RN6LE OF PSD = 88
PUSH
PULL
RIGHT
3 3 7

SMOOTHED FORCE RRRRV FILE CODE: MI-4YHCD
RIGHTLEFT
PULL-100* BU
PUSH
r
LEFT f RIGHT/
PULL
SMOOTHED FORCE RRRRV180* BU
FILE CODE: M1-4HVBD
PUSI
LEFTRIGHTLEFT
PULL
PUSH
! RIGHTV s
PULL
338
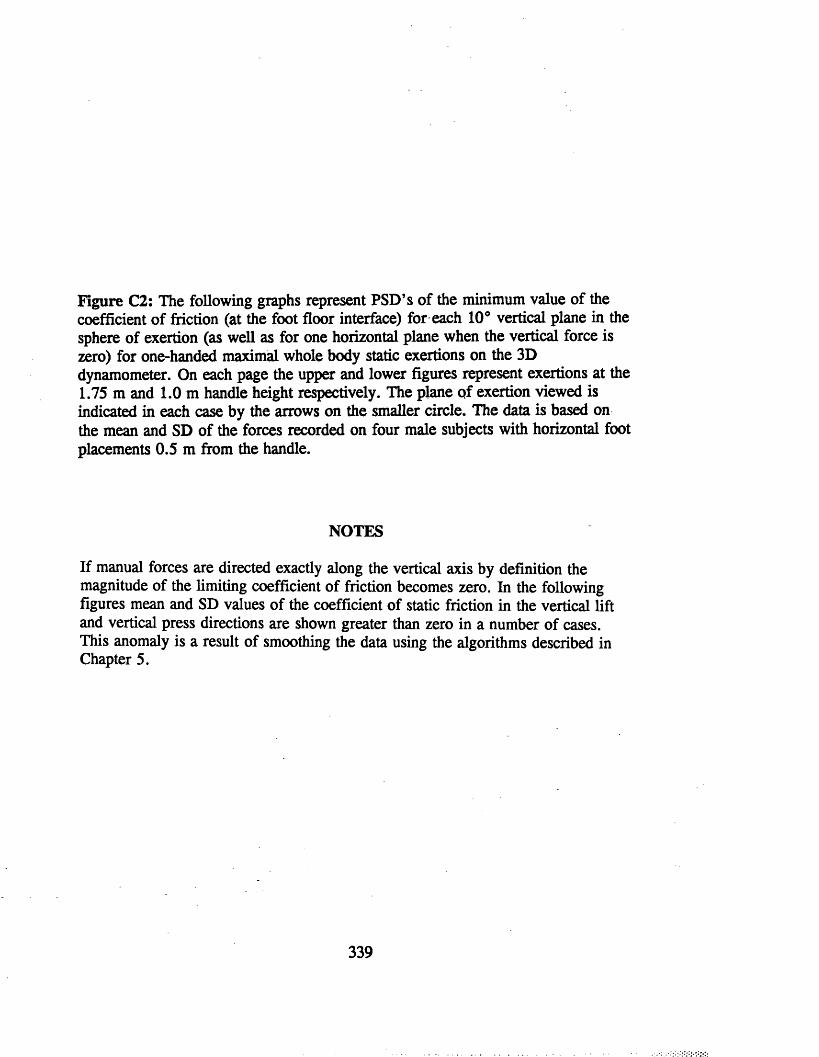
Figure C2: The following graphs represent PSD’s of the minimum value of the coefficient of friction (at the foot floor interface) for each 10° vertical plane in the sphere of exertion (as well as for one horizontal plane when the vertical force is zero) for one-handed maximal whole body static exertions on the 3D dynamometer. On each page the upper and lower figures represent exertions at the 1.75 m and 1.0 m handle height respectively. The plane Qf exertion viewed is indicated in each case by the arrows on the smaller circle. The data is based on the mean and SD of the forces recorded on four male subjects with horizontal foot placements 0.5 m from the handle.
NOTES
If manual forces are directed exactly along the vertical axis by definition the magnitude of the limiting coefficient of friction becomes zero. In the following figures mean and SD values of the coefficient of static friction in the vertical lift and vertical press directions are shown greater than zero in a number of cases. This anomaly is a result of smoothing the data using the algorithms described in Chapter 5.
339
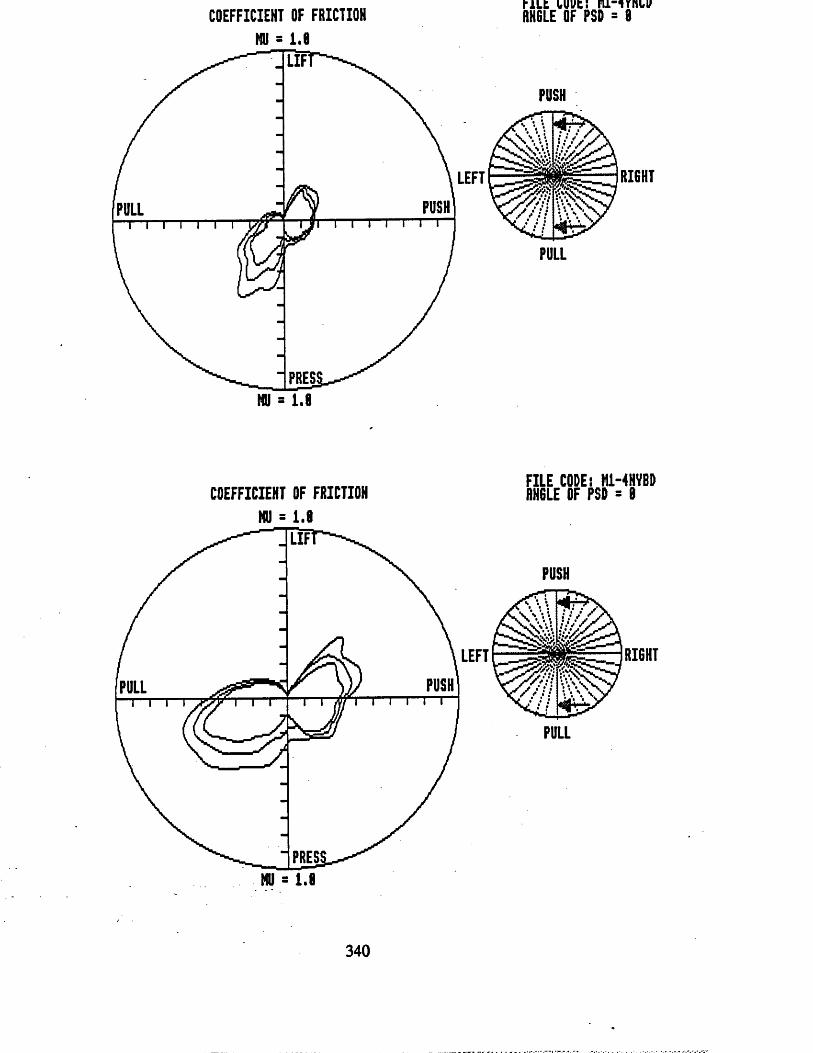
COEFFICIENT OF FRICTIONMU = 1.6
1-iLt iuvt: ni-irnu;ANGLE OF PSD = 8LIF
PUSH
RI6HTLEFTPUSHPULL
PULL
COEFFICIENT OF FRICTION MU = 1.8
LIF
LEFTPUSHPULL
PRES:
FILE CODE: M1-4NYBD ANGLE OF PSD - 8
PUSH
S==ri RIGHT
PULL
3 4 0

FILE CODE: M1-4YNCDCOEFFICIENT OF FRICTION RNGLE OF PSD = -18MU = 1.8
LIFPUSH
LEFT RIGHTLEFT-PULL
PULL
COEFFICIENT OF FRICTION MU - 1.8
FILE CODE: M1-4NYBD RNGLE OF PSD = -18LIF
PUSHA w l
LEFT h -z g M g l l J RIGHTLEFT- PUSH-PULL
PULL
341

COEFFICIENT OF FRICTIONMU 5 1.8
LIF
LEFTPUSH-fllckTLEFT-
PULL
PRES:MU = 1.8
FILE CODE: M1-4YNC0RNGLE OF PSD - -20
PUSH
PULL
RIGHT
COEFFICIENT OF FRICTION MU - 1.8
LIF
LEFTLEFT-
PRESMU = 1.8
FILE CODE.* M1-4HYBD RNGLE OF PSD = -20
PUSH
PULL
RIGHT
342

COEFFICIENT OF FRICTIONMU = 1.0
FILE CODE: M1-4VNCDAN6LE OF PSD = -38LIF
PUSH
RIGHTLEFTLEFT-PULL
PULL
COEFFICIENT OF FRICTION MU = 1.8
LIF
LEFTPUSH-NlGklT
LEFT-PuLL
FILE CODE: M1-4NV8D RNGLE OF PSD = -38
PUSH
PULL
RIGHT
343

COEFFICIENT OF FRICTIONMU = 1.0
t u t Luut: fu-iyniu RN6LE OF PSD = -40LIF
PUSH
RIGHTPUSH
PULL
PRES:
pflcrrTPTCiiT nr CDTrTTnu FILE CODE* M1“4NVBDCOEFFICIENT OF FRICTION flfjgLE OF PSD = -40MU = 1.0

COEFFICIENT OF FRICTIONMU = 1.8
FILE CODE: M1-4VNCDANGLE OF PSD = -58LIF
LEFTLEFT-PULL
PRES:MU - 1.8
RIGHT
COEFFICIENT OF FRICTION MU = 1.8
LIF
LEFTPUSH-H gEt
LEFT-PULL
PRES:MU = 1.8
FILE CODE: M1-4NV8D RNGLE OF PSD = -58
PUSH
RIGHT
345

COEFFICIENT OF FRICTIONMU = 1.8
LEFT- ^
lifT ' ^ ^ ^
m PUSH-pi/ll1 ' 1 1 1 ' 1 dr ' 1 ' 1 ' 1 SIGHT
PRES
LEFT
FILE CODE! M1-4YNCD RNGLE OF PSD = -68
PUSH
PULL
RIGHT
= 1.8
mccctptcut nr roTPTTnu ™ CODE: M1"4NVBDCOEFFICIENT OF FRICTION RN6LE OF PSD = -68MU = 1.8

COEFFICIENT OF FRICTIONMU = 1.8
l e f t - ^ ^ PUSH-p Ul l ' 1 1 1 ' 1 1 . . . . . . RI6|,T
M E S J U ^
LEFT
FILE CODE: M1-4YNCDRN6LE OF PSD = -78
PUSH
PULL
RIGHT
MU = 1.8
COEFFICIENT OF FRICTION MU = 1.8
LIF
LEFTPUSH-LEFT-RlGhTPULL
PRES:MU = 1.8
FILE CODE: M1-4NVBD ANGLE OF PSD = -78
PUSH
PULL
RIGHT
347

COEFFICIENT OF FRICTIONMU = 1.8
FILE CODE: M1-4YNCDRN6LE OF PSD = -88LIF
PUSH
^ # 7/ -vX'-sS ;Vnii \V\W7RIGHTLEFT
PUSH-M n
LEFT-p3ll
PULL
COEFFICIENT OF FRICTION MU = 1.8
FILE CODE: M1-4NYBD ANGLE OF PSD = -88
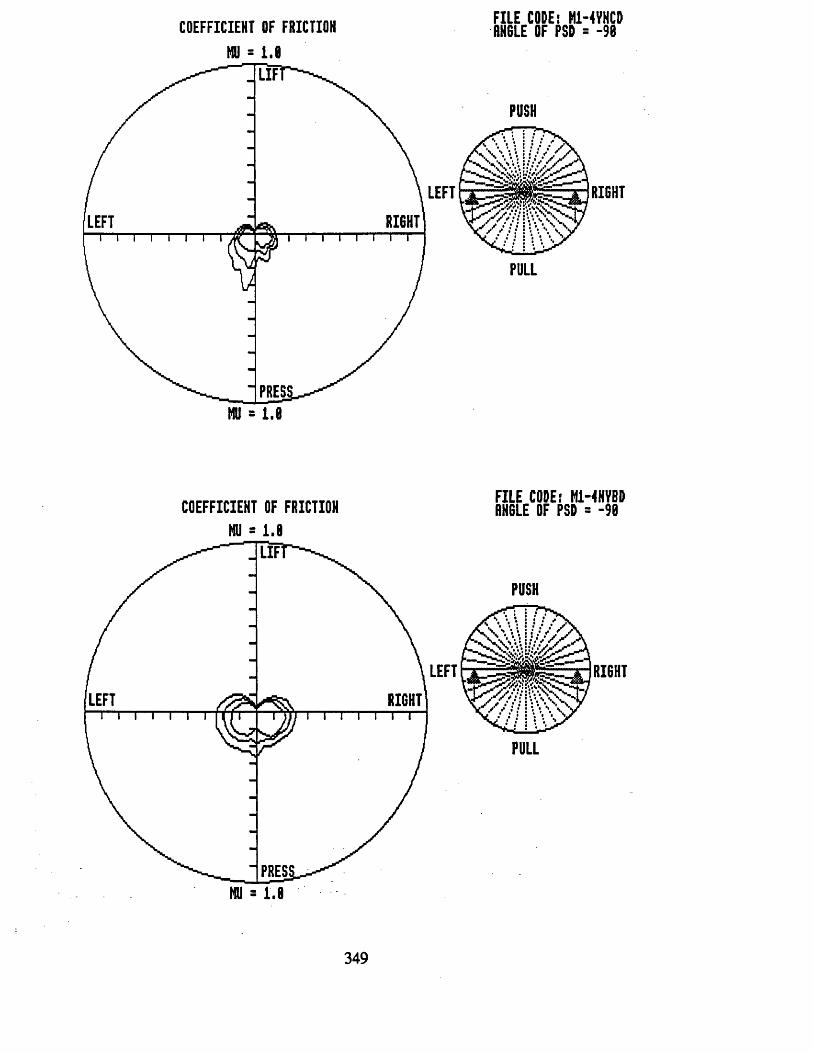
COEFFICIENT OF FRICTIONMU = 1.0
FILE CODE: M1-4YNCDANGLE OF PSD = -98LIF
PUSH
■S.. S. S *,»# •
RI6HTLEFTRIGHTLEFT
PULL
PRES:
COEFFICIENT OF FRICTION MU = 1.0
FILE CODE: M1-4NYBD ANGLE OF PSD = -90LIF
PUSH
LEFT RIGHTLEFT RIGHT
PULL
PRES:MU = 1.8
349

FILE CODE: M1-4YNCDCOEFFICIENT OF FRICTION ANGLE OF PSD = 10MU = 1.8
LIF
RIGHTLEFTLEFT-PULL-mrT g hT
PULL
PRES:MU = 1.8
COEFFICIENT OF FRICTION MU = 1.8
FILE CODE: M1-4NYBD ANGLE OF PSD = 18LIF
PUSH
RIGHTLEFTLEFT-PULL-
rT g hT
PRES:
3 5 0

FILE CODE: M1-4YNCDCOEFFICIENT OF FRICTION RN6LE OF PSD = 20MU = 1.0
LIFPUSH
illls RIGHTLEFTLEFT?usff
PULLrTghT
PULL
PRES:1.0MU
COEFFICIENT OF FRICTION MU = 1.0
FILE CODE: M1-4NYBD ANGLE OF PSD = 20

COEFFICIENT OF FRICTIONMU = 1.0
FILE CODE: M1-4YNCDRN6LE OF PSD = 38LIF
PUSH1 3 %
RI6HTLEFTLEFT-PULL-m
PULL
_ "IPRES: MU - 1.0
COEFFICIENT OF FRICTIOH MU = 1.0
FILE CODE: H1-4NYBD RN6LE OF PSD = 30LIF
PUSH
LEFT RI6HT
mPULL
352

COEFFICIENT OF FRICTIONMU = 1.8
LEFT-FusB
LEFT
I i k k v v v b i r u ■ i I I v vANGLE OF PSD = 48
PUSH
PULL
RIGHT
COEFFICIENT OF FRICTION MU = 1.0
LIF
LEFTPULL- LEFT-
PRESMU = 1.8
FILE CODE; M1-4NVBD ANGLE OF PSD = 48
PUSH
S m z j RIGHT
PULL
353

UUbrrlUltn 1 Ur N U U 1 U H HNBLt Ut VW = 30MU - 1.0
LIFPUSH
HRIGHTLEFTLEFTPULLM
PULL
PRES:MU = 1.0
_nprPT.TP1)T np rnTPTTflu FILE CODEs M1-4HYBDCOEFFICIENT OF FRICTION flHGLE OF PSD = 58MU = 1.0

COEFFICIENT OF FRICTIONMU = 1.8
FILE CODE: M1-4YNCDANGLE OF PSD = 68
LEFTLEFT-?iisiF
PUSH
RIGHT
COEFFICIENT OF FRICTION MU = 1.8
LIF
LEFTLEFT-
PRESMU = 1.8
FILE CODE: M1-4NVBD ANGLE OF PSD = 68
PUSH
PULL
RIGHT
355
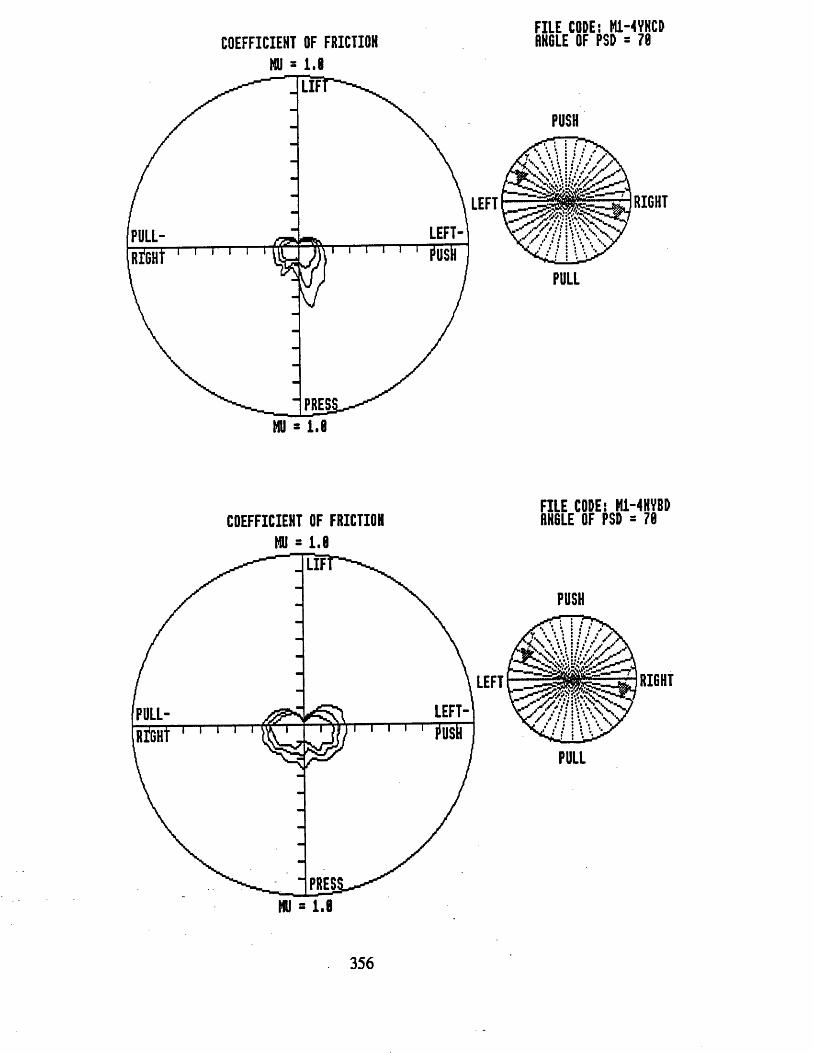
FILE CODE: M1-4VNCDCOEFFICIENT OF FRICTION RNBLE OF PSD = 70NO * 1.0
LIFPUSH
LEFT BIGHTLEFT-PULL-
PULL
COEFFICIENT OF FRICTION MU = i.e
FILE CODE: M1-4NYBD RN6LE OF PSD = 70LIF
PUSH
H RIGHTLEFT
PULLPULL-RIGHT
| PRES] MU = 1.0
3 5 6

COEFFICIENT OF FRICTIONMU - 1.8
FILE CODE: M1-4YNCDANGLE OF PSD = 88LIF
PUSH
LEFT RIGHTLEFT?usir
PULL
COEFFICIENT OF FRICTION MU = 1.8
FILE CODE: M1-4NYBD ANGLE OF PSD = 88LIF
PUSH
LEFT RIGHTLEFT-Tusff
PULL
357
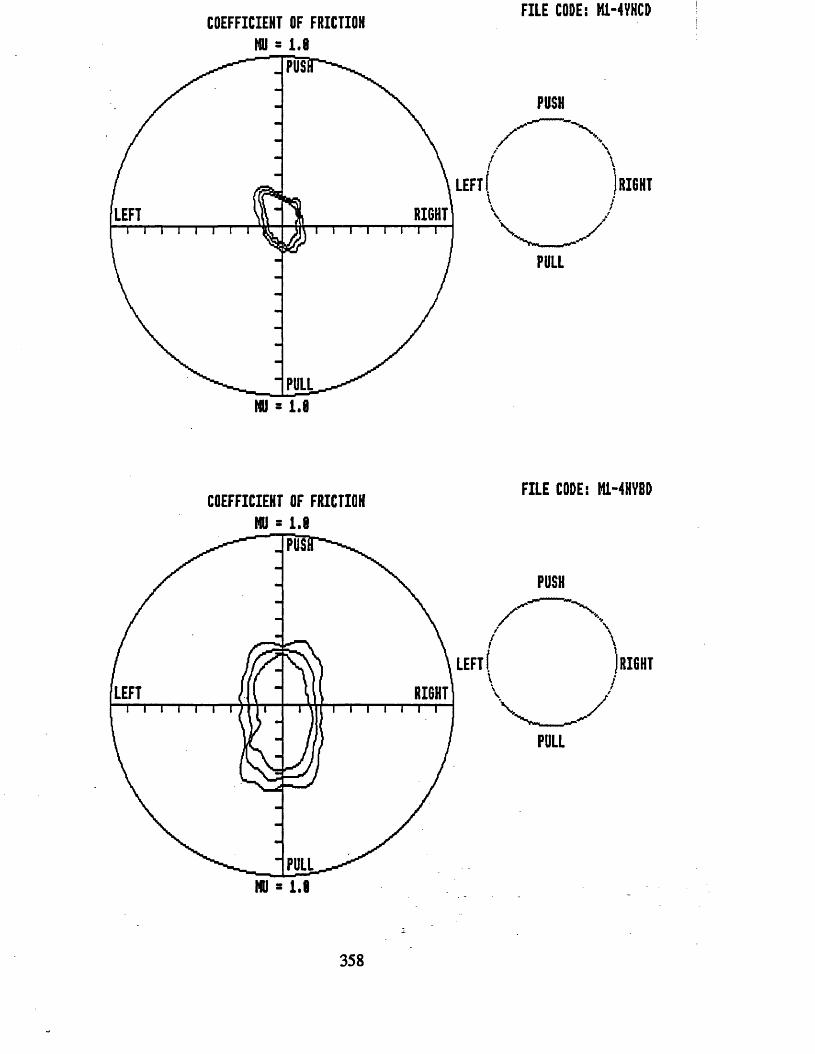
COEFFICIENT OF FRICTION- 1.8
FILE CODE: M1-4VHCD
RIGHT
COEFFICIENT OF FRICTION HU - 1.8
FILE CODE: M1-4NYBD
NOTES
In Tables C4-C6 strength as a % of body weight and the coefficients of static friction have been multiplied by 10 and 100 respectively in order to express the values as integers.
359

Mea
n Fo
rce
and
Frict
ion
Data
over
the
Sp
here
of
Exer
tion
for
One-h
ande
d M
axim
al St
atic
Exer
tions
at
the
0.5
m,
1.0
m and
1.
m Ha
ndle
Hei
ghts
.i/o
<uai&
^^^^^^^^^^ ^^^ ^^ ^^ ^^ ^^ ^^^ ^^ ^^ ^^ ^^ ^^ o
rC* o r - c > ' $ c \ i e o « - f ' - * - f O i - * - e o c o o e o % i - © . o . r ^ o c g O ' f c \ j o - ^ f n « - N - f n ' O C * s r• o ( M > > s c a ' 0 ' / > / i n i M i n 4 « f ( M r 0 ( M i n ' « < o > - i n n ' 0 ( M < o i O ' 0 i n < 0 ' 0 ' 0 ' 0 S S a
. rO *** (M C M C M C M C M C M C M C M C M C M C M C M C M C M C M C Mc
( O K ) e o « / i O N < - i n N ' * o t o i f l i n i n r > c o < / N < / o o < o i n < o s s t f t ( a ( M N » e O ' / ^. k ( M O < o * - ' 0 0 > ' / e a i f l K i n < o « / M M N N K 4 e o ^ c o i n c o i n o < / o i n o i n n c o
Q N N N r r ^ r r r r r r ^ r N N I M
O K i K K h - < C M N » > 0 f ' i o < ' 0 < M 0 * - c M * - i n ' 0 n 0 r M < ' Q i ' 0 i n ' 0 C 0 ^ c g < K K > 0 N 'i n a > r s i ' 0 0 ' O e o i n ' O i n m > j - i r \ r o f , f M P » - < M ' O r o r > f O ' 0 ' i - S . r o r ^ » o c O M O > » - o > T
J q ( M t M ( M T - » - » - r - « - < - r - » - < - i - r - T - r - T -
.£?" 3 ■ r f N t e 0 O « # i n ' 0 O 0 0 ' 0 ( M i n M ' 0 M C M M e 0 Q N i n « - ' 0 ' 0 C > C > i n M ' t » - ' i ’ S 0 > r -J S > < ^ ( 0 < r < o d < o N 4 i A ^ i n n i n N « T - « ( M « i M < O K i < O K ) N n S « / S ' f s n e o i n" < ( M N r r - T - r i - r - r i - r i - T - < - t - ^ r -o £td * O M 4 ’/mSK<Otnm40SNKiin^mn>/ionN04N!ON OinK)K)N<oioSr-sKin'0<d<o<oin^inio«)0«iO'Ome9inco^c9^(Mnoino><«r-in
•o&0c• H £ o<o
s
^ 5Ctf LU y ) I A T * T < ^ m » N ( 0 « t 0 4 l ( M O > < / K « K 4 0 < O m u > S « ^ S * - Q ( O I O a N Oz K | S O ' O S i n ' 0 < o « ' 0 ' f l ' t ' O i o ^ m S ^ o o i n O ' O O i n ( > i f i O ' O a i n o i n r - ' 0
cd i(A f p N O g ' O O O O O ' O l f l S ' - ' O ^ ' O ' O i n i n K O l f l O q e O s f
n d _ | | M N f * - T - ^ r * < - » - t - I M ( M N N N N NW B LU
« S U« 5 —I K ) O 4 M ( M 0 " 0 N ' 0 * f p > N - i « 0 S « - O N t n ' 0 K » ' 0 g ' 0 W S i n S C 0 ^ e 0 r P r C OJ 3 b < n N o i n ( 0 4 H ) i o < o i o S ' / a ^ « i n » < « o > / o n o i n N ' 0 ' t < O i n ( M n o > S 9 > '
<U 3 N N i - r - i - < - « - t - « - ( M N N N N N N N
& I s52 ■— x o o o o r M > o r o i n s > o > « ’ ( M o O ' t c o c o « - o » t e O ' j s p o i n i O ' 0 [ o ^ r e o o > i ' 0 « tC a o n « o « n ' O S ' / N n c a n o s o > 4 o i n K ) ' O K i N > / » i n o > K j S s o » o r - NQ X CM CM [ M « - r - * - « - ( M * - ( M ( M ( \ i N ( M N CM i - C M » - K1 «“
tn K SQJ o X M f l O K I O * - q « / ( M » - S O > N i r n - C M C M « 0 0 ' O M M e O M S < / r - 1 0 P t , " , ® M S Ou . M ? O N - 0 0 5 S i n » > C 0 > « O S < - ' 0 ' - S ^ C 0 ' 0 O ' 0 0 0 ' 0 S S - N M 0 > O 0 « » - ( M
?5 C M C M « - * - « - * - C M C M C M C M C M C M C M C M C M C M M « “U wi nu 31-1 —I « - U > N C O ( M N S « C i n O > S ' O i n f l O i n O N S ' O N » - O i n O ' O N S O O O ' 0 ^ ' C S>* < coinM»oKeOin&i«c(hinO'0 »-N>t»incoScOSeoooo^Nr-^0'^T-
> CM « - CM CM « - • - » - CM CM CM CM CM CM CM CM M * * M Kl «~C/3
8C 0» « ^ > 0S p i * - « - m ' # » - N 0i W ^ ) K K O i n i n S O M O > O 4 fl0N i n < M i n - * ' 0N
t C s K ) a 4 * / < - N < - < o < - i n ( M ' O i o a < / o > K > O i o o t o o i M » i A O ( M ( M n o K ) O i n O i, K I « - C M « - C M CM CM CM CM CM CM m 1 - fO M 1 - CO r - M• H 5S 2Jr? x < / c o s ) i n « y ) 0 ' / n o i c o i M N o n ! n < o i M T - ( M n N i A K N 4 i n < - i n ^ » M ' 0 { 0S N . » - o 5 ' O M » - f M ' O r O ' O i n o K i - o O & . « - i - i n i n > * - f M ^ - o i n o o > T i - ' 4 ’ O i n O ' > O N -w K» CM CM« - CM» - CM CM CM CM * - CM CO « - CO K> « - CO M K»g° i O ' - o < O c O i n < O c a i n i n N N i n » K N > i n » » n p i A t O N N O ^ o o i N ' O c o p r o
m i n o o s * - ' / o c M S M « K C h o o o i ^ o i o o i n M a i n K i n c o - ^ N « / « / » - i n r - N O >^ CO ^ CM « - CM « - CM CM CM CM K»
S f - O S O l A 4 ' f V t ( O ^ K m < f l N I O « « - O O i - N ! A n i 0 ^ m ( Q « * ! A K I i n ' O M NM CM«- CM«- CM CM CMi-fO«-CO«-fO»-IOi-fOi-fO •-N N . K C O « p Q ^ i - » - < > O ^ K I K > O f O e O C O ' 0 > » ' J ’ N - N - C M * - ^ > » - ^ « 0 > # O O C > C M ^ ) i -•*3 M K S O 4 O < 0 T > » K I C M O M i - t n O i n < - N C M » « - C 9 0 > a O ( 0 * - I M i n O M N i n,2 CM CM<-IM<-CM*-IMvCn«-nvn»-n<-n«*Kli-K)
N N o < / O i o « i A O i O t c o c M < o n i A « c o < 9 a m o > » M S i n o o « o < a M e o c M » t f t ( M o a i A i / n i n i n i o i M i M > > - a o o i o ( M 4 t - i o o i n K i i O T > < f < « 4 a i A » < / » C O i - C O i - f O i - f O i - f O i - f O < « - < i -------
' O M M » K t « O K t > O K » ' O r O M » K » M » M M » M < O r O ^ K I ' O M ' P M M » r p M > K » ' O K » ' O K » M » K »
J2 X X X X X X X ^ E X X X Z X X X X Zc < < < < < < < < < < < < < < < < <P u i a i i i o uj q -u i g u i p u i g i u a i i i q u a i i i Q U i Q u i a u i Q U i Q U j q u j Q i i i QXUXMZMZMXUXMZMXMSHXUXMZMSUZWZMZMXM
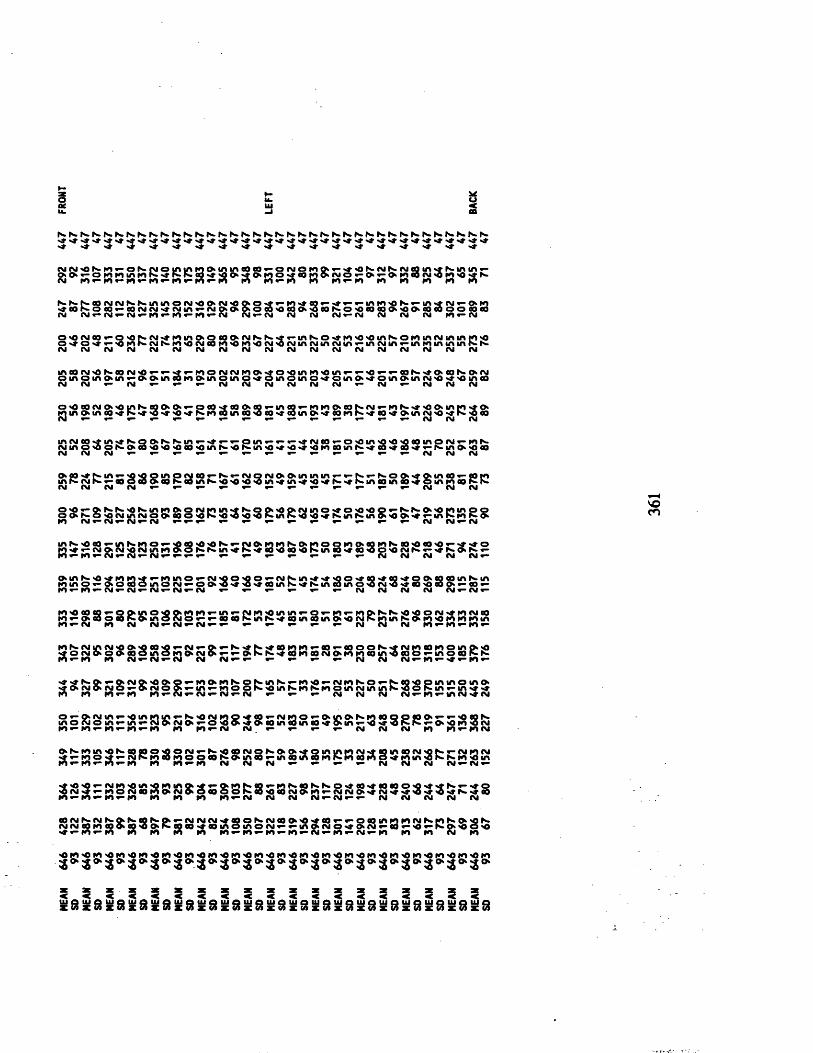
MEAN
646
428
364
349
350
344
343
333
339
335
300
259
225
230
205
200
247
292
447
FRONT
SO 93
122
126
117
101
94 107
116
155
147
96 78
52 56
58 46
87 92
47
< o s m * > o N N O i n i n m ( M f l i A ( O e o < - o N o n Q > T > « t < o K ( M M M Q i n « t K i f l i n > - K I » - K I « - K I « - K I « - K I « - K I « - K I K» M « - M Kl K l « - Kl Kl Kl Kl Kl Kl
N e O I M ( M S N i n i f l O I M ' 0 0 > N > 0 0 * 0 ' r f » - n * » ( 0 « - > t » - « - i n K I ' O N ^ i n ^ ( M » - < > M K > o e a « - c a N < M < 4 N i A r > ( M 0 > » « o n ' 0 ( 0 0 k « e 0 K o « a a 0 i < 0 0 > ( 0 « 0 o o a 0 ( 0C M « - C M » - C M « - K I « - K I « - K I « - r M CM*-CM N CM CM * - CM CM CM CM Kl » - CM
C M c o < - g < O N ( M ^ m n o > p a > » n i N > K M « * i n S o < f i 0 ' 0 * 0 i n N > o m i n i M i n i n t n ' 0O M < r * ^ K i K c M N K i < o c M a K i < O K i ' O C M ' 0 ( M i n i M i n i M i c i < - i n N i n i - i n r o i f i i n i n K sC M C M C M C M C M C M C M C M C M C M C M C M C M C M C M C M C M C M
I M ' O S a i M < 0 < - * > M T > m O I M ( M | C | » M O < O i n K I < O i n < - r > < O i ' v a K M O > « ) N » ( Mo u i ( M n r * X M n a n i M n o i / i o < « o i n o i / i O M O i n » 4 0 i n ( M n c M < 0 ' C ' O i n c aC M « - C M * - * - * - C M C M C M C M C M C M * - C M « - C M C M C M
o o f M O ' O i n ^ c Q ^ o « - p e o > t o o o > e Q < r - i n e g » - K i K i o e o f - c M « - K i N - ' * ' O O i n t o > j oo > i n c 9 M K ^ 4 M ' O M N K i n i n c a M O O M a i n » M C O i < i N M c O M ( M n < M ^ ) M K < o a
C O < t l A M K P » N N i n ^ M ^ ^ p i n T > v < - M C M C O « - 0 ' O i n 4 < 0 4 C O i n O C M T > K l S o < d o N » a < 0 ' 0 ^ ) e a ' 0 i n N « S i n < 0 M < 0 M ' 0 K i c a i n N M ' a M a M « - S i n 0 > « a C M C M * - * - * - * - * - » - « - * - » - * - » - « - » - C M C M C M
M S l A » « 4 O i n p N t 0 ^ K > - N Q N » I M n i n i n < > r - ^ r * K O 0 > M « U i a r ' M mc M l w ^ a o a » c o s a i A S 4 > < o y ) 4 i A s r i n M < O M S M K i n a i n a M O i n K i e a K N >
^ » S N > 0 K l f l M » g N K I i n « # N Q C K « 0 { > N i n O ' T O > 0 ' 0 O « - N . S a ' 0 K H n p O K O < 0 N i A ( M O » a o < 0 K ' 0 < 0 < 0 4 S i n F » ' 0 < 0 M K i n N i n » < 0 » M ^ i n K n K > CM t- CM * - CM » - CM * - * - * - « - > - » - < - r - ^ r - ^ » - ( M CM « - CM
' O c o r m M l o ^ 4 « 4 « K « > N » n M N o > K i o g n i M O K i K a ! p e o « r ^ ^ 0T - C M O > ( M < O N i n K I » O N K U I ^ K M a ^ i c O < O k i n S M e o 9 0 ' O C M S * - M N » N < - K I » - C M » - C M * - C M » - » - * - » - * - » - * - » - « - » - » - C M C M C M C M ( M r >
K < O M K i n M * - | O U I O < - C M < 0 0 < d O * - ( \ I N i n M M ' Q O M a M U M O » c g c O i n K i n O f O > o t o o i n o i M « * o » < O M ' 8 M ( O i A K M N i n a i n o 4 N « M a o a » > > o a v K I * - C M « - C M » - C M * - C M « - C M v < - < - « > r - * * I M C M C M C M CM « - CM « -
S P S r S M P O i ^ W K I ^ d N M ^ W U J ^ Q T - W c - K l p i N S M B ' O O C M M K H M O O » a o a F > O k i n O N O < ^ ^ a c o K > i A N < t c a i n a i n » ' O N K i o i n K O > K i < O K i K i K i i n CM K l CM CM * - CM « - CM « - « - * - * - » - « - « - C M C M C M K l « - K l « - K l * -
I M l A I M « » 4 C 0 4 ' ’ I M ' * 9 > ' ‘ N ' t N M a n K I ' > a * * a O O K M N K i a i c | O t f l O i < 0 c M » o o > f l O o i n o K i » c M O i ^ * * o > N S M c o K i c o i M O > K i K i a i n ' O c o b > - i n o c o s s Kl Kl CM * - CM * - CM CM CM » - « - « - * - « - « - CM CM ( M « - K I « - M » - K I * -
K » ^ » C M » < 0 0 > 0 * ‘ K I » K l S O K i n K v | i | < 0 « * N n N O r - t > - C 9 « p i A i n O i n O i ( M O > ( \ i O f « c M O » v u i r * m o o K ' O i A K K i M < i o i n c M i n i A N 4 0 S i n i - i n M > r Kl Kl * - Kl K l r > N < - N i - N * > ( M « - « - * - CM CM CM N f - K l r * i n i M M I M
» ( M i n r < o i n n « * * K < 0 ( M m o 4 a < - i M n o f M A > N n c o o o a o > < - < - < o q sN O l / l « * i n * * N 0 > N 0 > ^ O ' 0 0 > M 0 > C 0 i n C 0 i n O M 0 > i n v N a M ^ ) S > N r > 0 i i 0 K I « N K I « * K I * - K I » - K I Kl K I * “ CM CM « - * - * - * - C M C M C M K I Kl »“ Kl CM
K l t f l ' O K C O « S 0 4 e i M < p > K 4 C O N Q N f t » M Q i n i n K I I M M n i A C O C M ' O N « - N K I N K i O M > - N S K i t O K i o o c o K » i n a « - i n e o i A a i < i S K i t O K i O M K i i n ' d K > N K i ^ ) i n n » - M * - K I Kl Kl * - Kl C M C M C M « - * - * - » - C M C M C M CM « - CM * -
' 0 « - N m < O l A ' O K I I A « ^ < - » f « l N a < - m N a N N O M f l O « t C O a O « M ' t S < - ' « 0 M f K I O N C O K I ( M M 6 o n O O K a < O l O C M O > n < - O I I M » M C M M M ' « M 4 M K M f l O n « “ K l f Kl Kl Kl Kl Kl «“ CM CM CM CM * - CM * - * - CM CM CM CM CM
^ C M ^ 9 ^ < 9 ^ ^ ^ I M I M C M M a O K C M C O O > < O M < O < * r > O 0 i n ! g K I I M N K l K O k < K i o n c o o > f l 0 4 » N a a M a i n o i n o i M T > T * i A « i M o < ( > i M ^ a ' ' < o < * K » « o < o M » * K I r n Kl m Kl K I » * K I « - K H » K l * - N » » K I » * N » * K I Kl Kl N Kl
' O K l ' O f O M I f p ' O r p ' O K I M J K l ' O M ' O K l ' O K l ' O K I M I K l ' O K l ' O K l ' P K I M J K l ' O K l ' O K l M J K I
VOcn

MEAN
/ SO
VALUES
FOR IND
IVIDUA
L CEL
LS OF
X BODY
WEIGHT
ARRAY
2 0 4 0 < c 0 < 0 0 < 0 0 < 0 0 ' 0 0 < 0 0 < 0 0 « 0 > 0 0 < 0 0 < 0 0 < 0 0 < 0 0 < 0 0 « 0 « 0 ' 0 0 < 0 0 < 0 0 < 0 0 < 0 0 < 0 ScMCMCMCMCMCMCMCMCMCMCMCMCMfMCMCMCMCMCMCMCMCMCMCMCMCMCMCMCMCMCMCMCMCMCMCMCMCMCMCMCMCMCMCMCMCM O «0 M} >0 r * 'O *“ vO v - >Q i— *0 t* nO f >0 *— 'O -O >0 ^ M> r “ >0 *“ 'O «*■ r> >0 t " *0 i " 'O r* >0 ^ 'O r 'O «■ '■O 1" O
m o o o > 4 e ( i ' O O t o > m i n < - f l O p « f l O i n ^ « ( 0 ‘> t N k o e o i o N < O i / M n ^ a o r * o N i n r o ^ ' O N N . i M n m n oi n i n O > I O ' 0 0 > ( O O i O O « t O I O r - S O O > f N O O n O N O N O i n r > « ( M « I O » i n < - < 0 ' t N < 0 0 « 0 < - 0 « - N
m m rn m m » - K i « - m « - K i « — k i « - k i « — k i t - k i » — m « — r n » - ' a , »—>*•«— ' 4 , c M > r t M i n r M i n « M
S OMao«in>torO'OorMO«-KNtroiniflO(M(M(MnnS't(Mhif— i-«-»-eoeo c ro -f epincocoo>'.*- ■ < t m 4 0 > > ' S 0 « i n n ' * ( 0 i M N K t i n < f ' 0 ^ < 0 i n ( 0 i n » ' 0 » N » e 0 0 « 0 > < r i 0 i n < t i n f l 0 n O ' 0 » c 0 ^ o i 0 O
K» «-* K) « - CM « - CM N N N N N I M N I M N N N
N # l f l O Q « » N K « 0 « - ^ M » * O K O > S O f » - O t O « M N ^ p O # N W ^ * - g i ^ » S N « i r i r y ) > » N ^ l f t O O i n K 1 < - < - ( 3 « - 4 ) » N e 0 ' ’ k N 4 K t < « m i n n « 0 4 ' ' 0 n N > 4 ’ N « t < 0 ' 0 N N c a S < 0 N N N S » « N O O 0 i > > 0 > K ) f K | v N > * N N N I M I M N N N I M N N N N N I M N I M M
m i M O < - i n r * « t f - N ( 0 ^ < 0 < ~ i n N ^ N i n N i n i M i n n ' 0 > f s ^ a « 4 >K ' t s y ) S a o s c Q N N e o < ,' ' o a i n ^ K t f K t T ' I M f N ^ N N N N N N N N N I V I N N N N N N ( V l ^ - f t l CM
i A < o o i M i M n * * i n ^ ( M < « s o « t c o p M a a B i n a K i ^ Q ! f i n ' O f 0 9 < 9 h ' 0 9 >' 0 ! : ^ P > , ; t 9 (>< ^ 0 ‘ 0 > , ' Nf - » O T - ^ o > i n O K i o * - < O N < O N S N 4 N 9 i A a i f l a 4 o 9 K > » s « 4 K o > o > < - < O N N < o « m i n < M i n K ( i A m K ) * - N I M » - N « - < M N N N I M N N I M I M N N N I O N N I V i N N
m i n Q < 0 K t n n » i n 4 i v « « 4 i M ( 0 p m i n ' 0 4 y > i n ' t N ^ < 0 4 m S 4 » a ) Q t S ' - a ! n 4 < r o p m 0 > » < » o N O > a o « < « a K ) t a N a i M S N S N N < t F > i n a s * - N O N o > ( o O ( o a s s o « o o « - s a e i c o o K > > N S i M » l O N N N N N N N N f M CM CM CM CM fO CM CM« - CM « - CM CM
s « 0 e B ^ « g i n i n - # K j ' 0 j 9 « N N N O N N g c ! < i n » ^ p ; K W i s g 2 » M ' 0 ' 0 2 * t i ! 2 N O « » 0 ; M i M » a N K t a i M K i M < o m N i o < o n N i n n K > a a o > a o > » a ( M O O o > o M c M O i n o o p » o a r - i n o N » K) CM« - CM C M C M C M C M C M C M C M C M C M C M C M m m M » - M » - M « - ( M » ’ N » " ( M « - ( M
M > « - « n i n ' O o c M p * - ' O e o f M i n N . » “ ^ M g M J ' O r 3 o o ^ ^ ' 0 ^ ' 0 4 ' 4 ' 0 9 i r » N . u j o i n » - j - M ) K } C M O » N . o » - N . O ; C M N a » i n o > m N n ^ ^ c o i n K < o c O ' 0 5 c 5 a c o R n a o o a n a i A < - u > r - c o n < - « * N < » ' < j ' 0 ' t i n t o i M i n i M r O «“ CM C M C M C M C M C M C M C M C M C M C M C O r O
_ l<8 <-^f»Nain4<t<OCM<aNN^iANiOKifCOK>iMCM4<ON(MOin<oo<oiA»o»»coinMCMeoiM«><dea
c M * - c 0 O ' 0 5 ' f Q > t ' « i n ' 0 a ^ N 0 t K a i 0 ^ N o < t ( M M « - K ^ N C M 0 > c M C M i n i n c 0 C M i n o i n ' 0 ' f M N < d n IM m * - CM « - CM * - CM CM CM CM « - CM CM m « - Kl * - M « - W «“ Kl « - M « - CO « - * ♦ t - **’ «-«<• « - Kl « - M « - Kl « - CM * -
l c o < « s n i n i n ' O ^ o > p s s ( M i n < - » r > N C M < o » > « n r > i n « o 0 i o » i n i n m > t i Q c o c M » n ' ’ » a < o » e o i n N N a « - i n O < * 0 > « O t ) w O C O O » t O O O M l n i n N « N < O O C a » 0 > 0 0 < - | 0 > t 4 ( M M I A O ^ C O ^ ' * M O « » K l « - CM « - CM « - CM CM N < - ( M < - N
' O O f l O O ^ O I O i p f M l f t M C O l Q N ^ C O l O * - ' * O N ( > N * t » * ' 0 * " ^ O I 0 ^ » “ P ' 0 C 0 » - * - ' 0 ' 4 N » 4 < M ' »r n cm k i « - cm « - cm cm cm cm » - cm
9 « P 4 f 0 4 O M n » a S v v m < M M n ^ 0 t » 4 i - i M r ’ m p < <> i n i n 0 t < t i n » K 4 < 0 < 0 N » ^ a s K o < 0 »s » K N O K i » o » » o o i o ^ m K ) a i o ^ K ) < O i n i n < 0 ' p s < o < o < o < * < o < « a N K i n 4 M t - < « » ^ i n i n T > * *
• * N < O K ) n O C O N K 4 I M « P Q l A S t 9 l A P > 0 < t O S N K < « Q < Q P > O l A r * ^ 0 > | n N N ^ K ) » O m C 0 4 t f t ^ r 0 ' r O i n m c 0 O O ( M » - ' 0 M ' 0 0 3 0 ' « » m ' 0 f > - 0 > N s K - ' t 0 0 M e 0 ' 0 S - ' 0 » ' > r o * - K > r i f l ' r « r i n m M , M ' i n 0 > n m M ^ C M M » - M « - r O * - K I » - | 0 » - I O » * M * - M « - ' » < --
o o Q 4 a < 4 0 > « n K n < t 4 n e o » e a M 4 n N 4 ( M 4 i M S N < o o cm n -o c o a a ' f 4 * * i n s r K i « i 4 5 M > t i n i A 4 3 i n ^ K o N ( M S ^ K > a ' « 5 < o o N O ^ i n < « $ i n » ' 0 4 m < ^ K i
• 9 N N 4 * * ( M O » ^ Q < 0 O » f < 0 ^ N N » K N l M N < f a a i A 4 K < 0 N Q C 0 N P » i - < t S n m N m M m ^ Z o > K > a m 4 n i n a a n r > n o ‘« i n o > ' O a n o r > » n f r t o s i n i n < o « « f K a i n < o i n K ' O i n ^ i A t - i n n
i n i n o « j i f t » < M n K N < > M s r ' 0 ' 0 ’f 8 4 ® C M r * i n < 0 N . ; ( N r - r f j p i r t O j p ^ ^ ^ p p » B ' 0 < > « ^ N ' 0 ! n> # N a 4 y ) < f l ' O c O v c a i n < O S i n a M a i n O M ' t K ) i M N n ^ i < i M S e o i n S f O o s S i n i n < « ^ r - i A v < f cm
K i ' O i n n Q < o p f t i n e < i - i n < - ^ ( O O N f n « ' - n K » s i n « > n o i M « a a ^ K q i o i n N C M m i M i A 4 ' O ai f l i n c « * 8 y ) 5 o » ’ O i n i n s ^ i n i n q N » * ^ q ' # C M N ( K « » q « d i o > p « - » * 3 N « 9 3 n e o M ' # M O « » o ( M ^■ ^ » - i n » - ' ^ » - ' ^ c M i n i M i n r - t n » , i n r - M T ‘ ' 0 T - M T " ' 0 * - i n » " ' 0 » - ' < > i ' J ' 0 i M ' 0 N i n T - i n r * i r t T - i f l » - i n » - i f l r "
C M » - C M » - C M » - C M « - f M » - C M « r - C M « - f M » - C M » - C M » - C M » - C M » “ C M « - C M » - C M » - C M » - r M « - C M * - C M » - C M T - C M » - r M » - f M » -o . o > a » a » a o > e s o > c 9 » a » c o o > « o > a » c o » c o » a o > a o > a » a « e o » a o » f l 9 » a » a » i o » a » < o3 o o « - o o « - e Q « - e o < r - o o « - c o < - e o < - c a « - c a < - c o < - o o « - G O < - e o < - o o « - c o < - c o * - c o « - c o * - e o < - o o < - c o « - o o < - c o v -
S s s a i S s s a s a i a i a S a i a S a l a s a S a i a s a J a l a l a l s s s a i s a s a s i s a
<NVOCO

0 < 0 0 < 0 0 < 0 0 < 0 0 < 0 0 < 0 0 ' 0 0 < 0 0 < 0 0 0 0 4 0 < 0 0 < 0 C M C M C M C M C M C M C M C M C M C M C M C M C M C M C M C M C M C M C M C M C M C M C M C M C M C M
^ 'O t * 9 v* r* f* v* *0 9 9 9 v*kn0 in (MN> KteoQkinooiaorocMeO'O )'O )inN>ineO'ONaoineo< inK) o>inKKK>io(MNNin 40><o NT*
i n o a ( M O N m i O N * > n i n f 4 ' - N O i n ( M O ' 4 N i n n » * *« - ( M N O N O < - » O N < * F > < - a O » t - < 0 » O X M ( O i n O S N
k i k i k i k i k i cm k i
S tg9Q2porpgrurnM3o«-$in'0«-a»|n^<Me0'0M0>» ( O S K c o K a k ( O N a o N a a < o a K N S < o < - o < « < * i n < *
C M C M C M C M C M C M C M C M C M C M
i n < o < 4 ’ 9 « - * * ( o a s v ^ < f f M ^ u M X M r o ^ o ^ a v o m i A i o < O i n a ' 0 0 « f i n i n ' 0 ' 0 « ' 0 ' 0 ' J ’ 4 i n K > N > < - d « r i M ^ > i o fVI CM CM«-CM (M (M (M (M (M (M
9 > N I A S i n ^ N N K t ' a ^ O N 4 l f l t n Q ' « 0 > a < 0 Q 0 > > * ^ I A T - ' O t n ( O K ) a ( M < O N ' O i M < o i n a ' t k i n N i n K O > 5 ^ n < o « - C M C M I M C M C M C M C M C M C M C M fM * - fO « - Kl * -
^ i n N T > ^ K O t o » K < o m K i / M n p n « t r > o > O t o < * m ! Q O' - ^ ■ i o o > ( M a < - K « - < O N < o m ' 0 > f o i n N < o < o e o » m i o i o « -N N O I I M I M N N N N N I M
< 0 ' p m » « t o > o > i - a N a < M O > ( M < * K ^ o r - p < # m n 4 c o i o < - K N K n » ^ O k ' * ( M M « m s « t a < o n s K o O k a * - K i n N N I M N N I M N I M N I M I O Kl CM Kl «—
» a « t » e o ( M n < - « - K o < o « a i n i M < - a i A a p > v N v * > m ' 0 m a < r < f n s m o < o o 4 S 4 < 0 ' O o K a o s o K a « a sCM CM CM CM «-CM «-CM CM CM« - CM Kl Kl Kl « - Kl « -
sr(M09KeocMvin<OinNins«t«-M'M>o>>meao«ONCMCMN< cMincM<ouico4iS^flOi<isa»oscMaK*-r>cooaCM ■ - CM CM CM CM CM CM CM
S Kivcoa»Kito<ONOS)(>e»<M<»NKiiMinS'C) in» (Min(MoSM’S>mcoina'OOoiM(MS>S>o n«o<OKi CM *- CM CM CM CM CM CM «- Kl «- Kl Kl *- «- «♦ CM CMOotinin^aoKKiQoaoiAeiMncMCM^oiniviON^o ov-oOKi'00>rKirt'Oin><’'ON-v-cMineoeocMKieoin'«’CM'4' Kl «- CM «- CM »- CM CM CM CM Kl •“ Kl Kl '#»“lftCMlftCMM}M) oincMeoh>inincM(M»v-'Oin inea«oo>ocM»KiM> ^^fK)N.ocMKm^otMsa<-aoto^^OfOONK Kl *- Kl «- CM «- CM CM CM CM Kl Kl *“ Kl *- Ul CM Kl M) Klui»Kis<ocoorKi^co<a»so>ain<t»<>iMina^^4 KIKI'0(MKlKlinKinS»*<0 )(06>c9MOS<«M<«OIMCMin »C»-KI«-M*-N CM CM CM Rl Kl «- Kl «-«**- Ul CM Ifl Klinin s»KiO>iAiMKO>4 iMCMinnino«t|n(0 4«**''* •-(MeOKI 'r'»a'OCOMinMIAiniAaF>Kl»K<faCMKM Kl *- Kl «- CM CM CM CM CM CM Kl Kl «- Kl CM Kl CMNKl^'-PB»:K» <>0 ft«BpN<Oul»»NKl*- OkON. <-T-cMHr«0O'PCM<->*-cM'00>'0Kin<-e0Ki*-NrcM>j’<- cM >#«-«»»-Klt-M»-KH-Kl<-N*-CM Kl K1»*K1»*M»*M«-K^tftsoiMinNincseo«K<Qo^ain«-4^Naainin'0<-flO>roa<C 'OK100>N-OCO <4KlrOK10«CK100>NCM
CM w- &!!;(VI<;CI N CMv CM«>CM<-CMt-CMo-CM*> (M«>CM<-»co»a»a»ca»e9»eo«co»aoo>ao>ao>co»ao>(ocor*co**a**a«*aT*cova<-co«-«)<-ava<>avcor>
COVOCO
< < ~ < < < < < < < < < ' * 31 aaaassassaaasssassaasiasiasia

MEAN
/ SO
VALUES
FOR IND
IVIDUA
L CEL
LS OF
FRICTI
ON COEFFICIENT
ARRAY
U X zu o o< — ocgo at u.
z S i n S i n K i n K i n K i A S i n S i n N t n S i n S i n K i n N i n N i n N i n N i n S i n S i n N i n N i n K i n S i n S i n N i ng i n o i n o i n o i n o i n o i n o i n o i n o i f l o m o i A O i n o i n o i n o i n o i n O i n o i n o i n o i n o i n o i f l O i n oo
4 i n a N N N O > i n » » h > N S o > > a K ( M i n o c a < o o i n i M i n > t a o > ^ o t o « » N ^ i n ^ < O N ( K i n O | n i M oi n < - o < o o < o n ^ s n N m c o ^ a > f ( 0 « i M n e 3 4 e o ^ o > i n o > ^ » « N o o n * - i n i M ( 0 ^ i n ( M S N i f l a S < - r ** - « - » - * - * - « - « - » - c m c m c m c m c m c m k i k i
« t N N N O n ( M m O N i n O i n i M > 0 ' t e O K < ' 0 ' 0 0 » < 0 > « i n < - f N N I O ' t O O r - ( K < ^ 0 > a e O i n < t l O K K O > N * - N O O > i n e O N i n « - > t o ^ o > t o i o o M O K i » - > » > - i n * - ^ ) M ' O M ' 0 ' t 0 0 o o o > i ' > o i r \ N O > j i o w o f r i n N ^ N r > « - r - » - T - T - T - ^ r - ^ r - ^ ^ ^ r - CM « - CM CM CM CM CM t-CM CM Kl Kl CM CM
< o n i - N v i i n a ! n c o < M n n < o e o o i o o o < o » ( M M O > » o > t » N < > N K | n » m » ( M o m N e 9 » T > 4 i n y ) ' *» * i - r - r - i - r - r - » - i - r - r - r - r - « - T - ( M CM • — CM CM
N f t ^ a i n » K i n o N K i c o i o t - » o « t » O t > f n t n N < i « 9 « f O K i n < Q S i n r > Q > « « o < o i n < o » » » p > o o O ( \ l ' 0 « - T " « - O ( M S . N . ^ m ' O i n ' 0 > 4 , N M - ' 0 i n 0 ) i n C 0 S O N O « 0 0 > C 0 0 > ' 0 » - 0 > M O K I < M M N ' t l 0 O N . O i n K ) « - C M » - C M » - t M » - « - t- . — « - « - « - « - T - * - C M * - « - C M CM * - CM CM CM « - CM CM
o > o N t - « o » n N T - ' O i n o > ( M i o a ' 0 4 < o < > c o s 4 a N ( M i n < f i n < * ^ N < - < - o . i o c M O > - r - ^ ^ 0 ' M > ' i o « o o N O S M O r o O v c o i n T - ' O O s c c S » ( M O O i n e o ^ K ^ > f i o < o o i f i M f ( M » - ( M * - ( M « - ( M « - « - « - CM CM CM CM« - CM CM CM « - CM CM CM *— KI CM CM CM CM CM
^ ) < 0 4 « ’ N < - o « - ' « t a > o p r > < - ^ O f - U ' 0 » n K i N » » i n c M M M n n s a m o r > < - e a i n N < O N < o q v > Q K i i - a ^ ' f » r o o ^ a r > a i M c o c M c a < * a i n » a 4 c o c M K < ' p > o o > o > a o e o o o c M O > » o > c o ^ N i o c M a c M OKl « - CM « - CM CM » - CM CM CM CM CM CM CM«-CM<r-CM«-CM»-CM CM K1 «r- Kl CM CM « - CM « - CM CM «—
a < o i n i n < « » a K i i f i < a c M 4 a ^ c M < - K ' « n c M v i c M » S r - n ^ < o ^ M i n c M O > ( n m c o N . c M S 0 4 ' 0 0 < u i M ' 9 M « - O M ' * C O N e O C M < 0 « t Q K l N < « < O i n O k C O O O > ^ » ^ > - 0 * - 0 > C M r - r > O i < f C M C O C M I M n O C M 9 > I M < O I M M O K 1 « - K 1 » - C M CM CM CM CM CM CM C M « -C M « -C M t- K 1 » - K 1 Kl « - Kl r O » - K l « - K l » - K l » - C M » - C M » - C M « -
o i n v i M « * ! ( i | n K i < O N i n o c M m c o o o N K i A C M ^ < o s < o « > < o « - c g N * > < o S i n K i » c M ^ ( V O ' 4 i n < M i n i n o 4 i o o > 0 ' 0 » K i K i o K i n » < o a 4 » N c o a « » a » c o « - o > > ( » 4 < M S c M O M < 4 u i o > M c o a 4 S f t K i ' 0 < # K l r - f t l t - C M C M C M C M C M C M C M N C M C M K 1 K 1 K l * * K I » * ' * ^ M « * K l f M « - l * l « - N » - C M « -
<
go u i » a c a i M v m ( M K ( M n » > - m s ^ g » u i < M o < o i M A < O f N ' a » > - u i K « ) < t M < o < # < o q i O N C Q N N i n N * - S O i n O » t « B « C ' 0 « C ' O N < - k » K B N O ( M O M f ' t f N * - ' O f O > » ’ » * « # i n # ( M i n » « ' f l i n M S ' 0 * #
IM K 1 " -C M « -C M » - C M CM CM CM« - CM CM K l * - K l « - M » - K l « - K l * - K l r ' K l » - ' * < - ^ * - M « - n « - r < l < f K l * - C M t -
sX t - 0 ( M K l < O K 1 0 4 C O C M C O C O < - U i e a < O K 1 9 l A I M N C M O < - < O I M O O N » C Q ( O N K 1 0 ^ S C M N ( > q < f O k K I IA C O
O r > 4 O K I I M 0 a - « « l i l » < 0 > 4 I M K > a ' - * - N O > « r - K I ( M n 0 > l l l 0 « « 0 t > C M I M ' C ) C 0 « t K > C M M n r - n a N Kl *“ CM t- CM CM CM CM CM CM CM Kl « - Kl * - Kl « - Kl Kl Kl Kl K H - - # t - K I « - K l » * M » - K l * - N « -
c O K i c O M ' a » K i m i M c o K i O K i i n a K i » M K ) < o ^ 4 ' - K i n i n o i c ) i M t n > * a N a N o < o c o i n ! n < * » m ^ » K i o i n ' 0 « - m o o N S . K i ^ M S > t e O ' t S S o o o . o e o o o O K i O " » o u i o i n O ' C O * - ' O f M K i O K i c O t - 6 > M O i n ( > Kl « - CM « - CM CM CM CM CM CM CM * - CM K1 Kl Kl K l « - Kl « - Kl Kl « - K l »“ Kl Kl Kl CM« - CM
i n a < o < * < * K » r K > P M Q i o ^ c o c o | n ! 044M N < > > « c o i o i n c o i o a m i n i f i N « * - a « Q i M n N Q C M O » O K I i n i M C M « 0 « ' M M S C M M I O N < O K a d > a ^ C O * - » r ‘ O r > O i * * a ^ < 0 ' t M C M O > O a Q t » C O O > M O K l N K I * - C M * - C M C M C M C M C M C M C M N K I K 1 Kl * - Kl Kl Kl Kl Kl Kl CM CM« - CM
< P K i a 4 4 o « O t N N » N i n N V > c o o « f c o K q 4 < A o > « t N i n o s m c g m i n M ; i n o i M N K i » < O i n N > t c o < - M n i M e o » > i A » u i O N i M a c M 4 i n a M < O M c o < 4 i f l n 4 N c o K > k a K » i n S N < o N . « N * « < o u i < O K i N CM « - CM « - CM v - v - C M C M C M C M C M C M C M C M C M C M C M N C M C M C M C M C M C M
N K l ^ * - » - ' 0 0 ' O M « O C M O C M » - ^ ' f ( M O O i n « O N O ' O S N y j i - O l C l N ' O S ^ i n C 3 K l * - ' O q i A > t S . ' ^ t - C M C M O « ^ ' O M > i n k m n N > i n N > ' O O M } o < o o i f i K i M > K t ^ K i k n K i i n K i ' O C M M } C M ' O C M < « c M ^ v - ^ C M ^ c M ' O o i n « - i n C M « - w - » - » - « - « — c m c m c m c M c m c m c m c m c m c m c m c m c m c m c m c m
4 K i S N K i ^ ^ i M e o » i n c M i n i A N C M r » t f t K i « o r K i n ' * o > > r ^ ^ ! $ ^ ' $ Q i A > 9 ^ e 9 i n i n < f N « - M i M n m r 2 i n N i c i N i n N 4 u i < o ^ i n < o ^ s n K M N ^ N m k 4 M ^ K K i i 0 n S i n M ^ i 9 < t u i ' t u i m M M v i ' f
h ? & ^ ^ K i e s a < o ^ < o s o > i n c K i 4 0 |A ' O v i M o < o < - i n < * i M O K i ^ a o 4 ^ r > < o s < o r i » i M i n c M « (a N a n a n » m » n o n o N ^ m ^ ( M ^ i M < 2 N < p n ^ m ^ m N i < i N K ) O K ) ^ n o N ^ n ^ N T * N o n
« t n s < t » » o < 0 4 « - c D « > p i n < o < o i n o ' a ' 0 » a M e 9 « » i M ^ K i « i n a a N ' O N ^ S K Q o u i » n o > r oI C l » - i n C M M . i n ^ i n C M M C M N l M l i l C M ' 0 C M ' 4 ^ ,0 * * N * * N C M N C M S N M l M N C M ' 0 N i n N v C M ' 0 < ^ ' 0 ^ N C M
& K 1 K I K I K I K I K I K I K I K I K I K I K I K I K I K I K I K I K I K I K I K I K I K I
3 < < < < < < ■< * < " * < ~ 5 ~ < * 5 " <■ ■ * < * < * ^
sCO

S i n N i n S i n N i n S i A N i n S i n N i n K i n K i n N i A K i n S i ni n o i n o i n O i A O i n o i n o i n o i n o i n o i n o i n o i n o i n o
i - f i M < | S o > N K i n « t < Q O K t < a i n a i n i n v ) ' * i n ( 0 ' O N ^ • * N o < O t f 2 o a ^ u i a « 0 4 a r 2 S j n o > K o « a j n o « « < o
N > f - < M a o i n a m ' O i n o > ( M O t N » o * f N » ( n m K < lt ( M f i n i n < O T - a N O > » K o O c a N O O > 0 > m « » N K N O > l f l * « K I I M CM • - CM CM * - CM • - « - « - r - f - r - * • CM CM « - CM »—
r o m N r - N n o ^ e O ' j N M O ' Q O i —K l i n N O M t - N O O ' f l Q ' 0 ( M c 5 » - e 0 O N 0 » 0 0 N f > - ' 0 O 0 0 ( M CM T - CM « - CM « - CM CM CM CM CM CM « - CM CM « - CM « -
> O N o « T - N } O i n M N O v t O M ' t O ' q « i n c M e g < — *• >0 <o o r - » C M a K ) I O K ) N m k l O S « f < > < - < O n N N » < I I M I M l f l C n ' « C M C M C M C M C M C M C M C M C M C M CM « - Kl « - Kl « -
N O i n m i n m c o c Q o o i n m * * < - > t h > o > o s a o > o > K i N ( M g < - N m o ^ n c M 4 i o K « t K > * * s c M K i o S i n o o i n < « i n a « 5 CM CM« - CM» - CM CM CM CM CM CM ( M f - t O » - m » * M » -
» - e O M ( M M O » ' # » - e O ' O O K C M M » - O e O M O N O M S [ 0 ( M < ^ » - ,O f 0 o i 0 0 ' * - N » - N > c M ' 0 m O M < 0 i n e o ' 0 « 0 * - M K ' K - O M ' CM CM « - CM CM CM CM CM CM CM CM Kl »*• Kl » - Kl «—
< O i n N i n e o o i K ) N C M { o > - c o ^ { M ' * C M n N q s > t i n a o t t o o «— o o k » o c m o » » — o o c M S . r O ' O ' ^ K - m c O ' O o O ' o K . o o i n ' O i — tCM CM« - CM CM CM CM CM CM CM CM Kl • - Kl « - N* « -
i M n ' * t n » 4 K < - ' t Q > m S i n N o m N u } N ^ < * C M r > < O r > a( M c a m c a m o i n o i n « m < o ^ K i n o > < o c o K N r * o ^ « r o sCM CM CM « - CM « - CM CM CM CM CM CM Kl «“ CM > f »—
i n U J < t M 0 N K < 0 » K N < t < 0 S q m ^ M « ^ O N 2 P < 0 : > I Mm n i n o i n o K ) N > f ' 0 ^ o K a o c o o K > K i n K < o
CM CM CM CM « - CM « - CM CM CM « - CM Kl K» Kl * - K l * -
•oVOiMn'*tn»4K<-'tQ>mSinNomNu}N <*CMr><Or>a m(MCOMeoMOinoin(>iM'OvjkinO'0«K.S»-Of->»oK
in^Kioin«0 inaiM0t'0 NKC0CM<4 inp *><Qom<0 N>0> i A O « * m r - i n n S K i < O N K i c i 4 ,o n « S o s n o K i n < O i n CM «-C M C M C M C M C M C M C M C M K I K I » - M * * K l r -
»S<-inCMi>>oicicoNincMaoinM»Oiici>*inococa»«-K i a * ‘ K o i n o i n T - < 0 ' * k K i c o i f l a < O i A O N ^ ( \ i 4 4 i n i AC M C M C M C M C M C M C M C M C M K I
i n N O O t K I « - 4 N > ' O ' O N i n 0 N i n v ' O < O » N v f a i M < O C OT * ^ * * e o o S n i n » ^ o > K l o > 4 n a i A i n S K > o « - i n n i n i oC M C M C M » - « - « - « - C M C M C M K l • - K l » - K l »—
O ^ N ' 0 l C I ( M > K O * t ^ ( M Q ( > O ^ ' t M M Q 4 C M O N O ( M^ ■ f l O » h > ^ > i n « « ' ^ ^ ’ C M ' O r M c O K i o i n v - i n c M c o f l o o i n c M « - ( MC M « - » - » - » - » - « - C M C M C M C M K l * - K l « -
° < - i n ^ p S 00 < 0 ' 0 » 0 « I A O K I Q S s t * * < N O < 0 * - f O ' 0 C M » " » - » - t - » - » - « - » - i - ( M ( M CM « -
« * » * K I ( M i n O K I e O ' O ' O Q t C M l A O t K t O K I O O K ' O ' ^ v C M C M * - * - M ' f K I ^ K I ^ a - N O N O M M O x - O f
» I M O N » N a < - M M a K l K > I M S * * C 0 < - a < ' M I M » N I 9 K I
in>an»<ONininin'O4^<o«)0<-<>n<-iMO«tnsoinv*iniMinr*<«CMiniM N«#viniMincMin iciiMM incM
OM>SOtS»SO>K»K»KO>SO>N»S»N»NO>K KI K I K I K I K I K I K I K I K I K I K I K I K I
< < < < < < < < < < < < 5

Tabl
e C
5:Th
e fo
llowi
ng
data
is ba
sed
on se
mi-f
rees
tyle
exer
tions
pe
rform
ed
at a
hand
le he
ight
of 1.0
m
by 11
milit
ary
pers
onne
l CDN>eoNiflOh-flOKflON-flON.«ON.aoh>oeh-eoN.eoN>eoN>eoi >eoN.coN>eoNieoN-u.N.ooN>
'^••'O^MnmfNaNNxtmioo^NintoinnQxtoeoeomanKNinNxfOi^oN i n a « - x t N ^ i o n < f i n i n < O x t o > o c o S . > o o e o o o o o K . o e o o c o « - e o co«- ON N N N N N N IM CM x-CM CM x - K l K l K) K l Kl
3 CM OS xO oN < M * t ! 9 N N N « S a p M » a ( M C M U I < 0 ' ^ i n S C 0 0 i a ( > x - O C M K I I M C M C M C 0 K i a i M T > N - o x o e o i n o O K i r x - ' » , O x N . O x o « - c o ox k » o cm r o « - xo k i k » cm eo cm co x- eo o * - o > ^
CM ^ f IM CM CM x - CMx- CMx- CM x - CM • - CMx- CMx- CMx- « - C M » *JO xo i nr , cor s , x - K | C M K l N - K I ' 0 « O x - » » e O e O P > - C M O l M l M * » e O N . C M t n O x a , K l x - e O l M e O * f * a >x - K > C M x - K I O
< o k i n « K i < O K i N N o o > o a x > o > c* c m o c m ^ x* c m i a c m o x c m c o « - c o o o ' - k i k i *»CM CM CM C M ^ l M x - l M x - C M x - C M x - l M x - l M x - l
R
R
>*,OKi«j,Oxoeocoeoo»-inpo»-mcMCMflOincoo>xOKiinfMinoornx— eO'j’Kx.Kiin -o i n i n i n i n i n k i i n i n co N* o ^ cm oo O x < c o K i c O x c o i n o ^ O K a o x a o ( ^ cm x— cm
X— X— t— »— X— cm CM CM CM CM X- CM X- CM CM CM Kl « - K I » -N.CMincotOinOxinNMMOKiMinNx}CMinNocoso<o«-Ki inocM(MciKi'Oininino x O in inx^M x«^x tin< o inO xxa«-co o < c o K i < M < i O i n o s o s o e o o K i o x- ki x—
x - x - x - x - x - x - CM CM x - CM CM CM x - CM CM CM x - Kl x - r * K H "O i n
i n K I ' O K I ' O x - e O N - K - r ,» C O p x - C O v Q C M x - v O C » i n K I O ' Q C M x - x - C O ' O C M C M C M ' O i n K l x - O e O~ - M < « i n K ) M x f O x x f C O ' f O x C M G O i n O x x O O x r x . C O O x C O C M C O O K l o
C M C M C M C M C M C M C M K I X- Kl X-
u S OxCMCMOxOxminxororMinxo cocM»co «$v-» oxg>xoinh»«?cQCh<>>cMK)M)-x*'x4- • c i n x c < c K i i n x C x f < o < o o a K i N ^ ^ c o xo o k i co ^ h> i n ^ K c o N> ox co o k i cm
^ N cil CM CMx-CM cm cm cm cm cm x- k i x-K.XO
______________ • O x t S C M O O N i n p i x t i n ' O K I x t O K I O C M OOx i n co O x i n o x > « K > M a x t c o < o s < o c O N O x c M t - x— x - cm
CMI xo 00 CM CM CO N> Ox m . _ ___ __
N CM N IM IM N <M K l X - x - Kl X-[Jx X— QQ
k ! 2 xO cm
3 5 > W r i K I » * » * N N M S K I x O « « » i n C M ^ C M M i n » - i n » - O C M x » O x p « K I « C N < » K I N p i » - O x x o K > M x O x « < o i n 'O O x « ( M S i n a a x O c i ) x o o x o o x i n o x i n O x S o x K > * * o x < > cm K- o
N x - x - x - x - x - CM CM CM CM X- CM CM CM CM CM x-CM x> x - CM x -
g « o $ gS , “ ( M l / l O C M x t t “ N T * x O O x O ^ C O { M ' O C M C M I A O x J C M C O ' O x O ’O O x “ S S B ) ^ O x O K l O > i n O
i n o x c o i n < d > r ' 0 ' O i n < - i n K | x O S . o » ' O c o i n c O x t O ^ O i n « - x » o > i n o S r - n j i n x—r - r - x - x - x - CM CM CM X - CM CM CM CM CM x - CM CM x - CM x - x— CM x -
™ Kx- XOCO |slN K l i n r x K I S O M O x O < 0 ( M x r ^ K K N x - O i n « x n i M 4 N O O x O K O C O i n > * a i M i n < M ^
c M c o o o i n x O x 4 - i n x o N > r ; ^ - ^ i | i f i o i O x ^ r « o ^ c o i Q a N O i n K i s r * * s r * * ! n > - o k i o xr - X- X- « - r - (M CM X- CM X- CM CM2 N.S « XTN 0 - « « - O C O N a K I ' O O x a O p x O a i M 4 < O Q t - ^ C M ^ < # M i n O C O K I K I i n T > i n C M 4 i n x t
« - o N « x t i n K > ' C ) a ' O t - S x t o Ox k i c o ^ c o k j c o c m c q c m o * - o x c m o c m o «— cm o
CM C M < - C M f l M * * I M < - x - CM
XO
CM CM x - CM CM X- CM x - x - CM
e$ t9|nx9*«i9't<#QinaSK|nxONiMxoiM«xOK<oKinaiciNOx|naoxxKicMO»<M i n N M N < 4 i n i n M x O N N ( M S x t o " ♦ x* o k i > x- K . x- S x- K x- s S o x c m o k i n »X- CM X- X- X- X- x - CM CM X- x - CM x - CM CM CM CM CM CM CM X— * - CM
i S n'inaNinopxOxSviNinoNxxinNOSxf xocOxO OiruifiiinoxSmingciix-Ka > t O K > 0 » S < O N C O ( > O x K I O < 0 ( M x t x O K I K I O x x * S v S x * K x - x O x - a i M a Ox X- 0 0x - K l X- CM x - x - x - CM x - CM X- x - CM X- CM CM CM CM CM CM CM CM
VOVOm
K l x # x ^ x O K . x - K . ^ t f l C M h > r M i n C M « O x - C M K I M > N . C M K I p x C M C M O x C M i n e O i n i n { M x - K I C M x » « O p x “ 1 0 O C M ' O C M ' O ( M ' O x - k . * » C M 0» X— N.
x # x # x O S x * S x # i p N S K i n ( M O O ^ C M K | x O M M K I O l x - O x O C M O O O O O x - x - C M x - i n C M Kl Kx. Kl m X- Cm ICM CM X- CM x - x - x - C M x - C M x - C M x - X- CM X- CM X- CM CM CM CM CM CM x -
n 4 o o o m o c a o K i i M i n « » o o » i M < f ^ o ^ » N K i a 4 x O x o e o « x o o . o i o o i M K N «0 < # 0 > C M K . » * « x - O K 1 x - K l x - x t x - n N n i W x - x O O x C $ K I S x C O < C & i n x * o> Kl OxCM CM CM CM C M x - C M x - C M x -C M x - x - C M x - C M x - C M x - C M CM CM X- CM CM X- CM
2 3 t nr n O x > Q « M x - r n x Q C M x - x - i n K l N . K - x O ^ C M x - ^ O x - C O O x ^ i n i n O x x - » » e O K | x # K x . x * C M ' « » e O x -K i o O c M O e o e O c o o x - o c M O K i o K ! i n k i k i * ♦ cm n i o m Ox i n i n o k i o k i cm x - x - k ix - CM X- K l CM Kl X - K l X - K l X - K l X- X- Kl X- Kl X- K l X- I I X— Kl X- Kl X* Kl X— X- K l X-
N «M x - x O x » x O x x x O x * x O x < O x * x O x » < O x “ K | x * x O x » x a » * x O » - x O x » x O x < 0 ^ ' O x < O x x M x - O x *
O. { 0 2 R 3 R 3 R 3 R 3 R 3 R 3 R 2 ! o ! r x O x ! o I r ! o 2 I o ? ! o x ! o 5 3 x K l CM CO
§ " s r . . '
.sitsisitsiasaia^s a^a^a^asasasaniaia asa 2 5 <* * 2

corx.ao ooN-«oK>coN>coN.eoN>-Jr»«OK>aoN.eor»eoN>eoN.aoK>coN>flON>fiall»co co
'OtnN inxt^n«'OxC^S5>'*iininQOinO'OMinMSMin4^P'* xO>Nx^lM^Ndx(MO>«tO> O ' O C O m O x ^ x K O ' O K I I B x o O N <0K l K | x - K 1 x - K l x - K l x - K I K l K l K l X - K l K l K l K l K l CM
sCM .■ ^ K i p O K I K I ^ - > 0 f M N . > t m > Q P ‘ ' 0 C M N > K | C M ' 0 0 > > 0 O i n i n x i p K i e 0 C M r « ; ‘ ' , NjeocMK-x-od'4-K-CMinO'OoooS. <4coinK> S'ON4co<OMCOin4 '0 *o
CM X-CM X-CM X-CM x - C M X-fM x -CM C M C M C M C M C M C M C M C M
r aM N N N M O x i n x * C O < O I M « n N M < O i n O ' O K I M i n K I U I O O K I S K I C O O n l O O X- xO O I / I O O K l Ox X- CO K l CO m C M M N K ) C M ^ N M I M M x > M x i n O i n I / I
I x - C M x - C M x - C M x - C M CM CM C M C M C M C M C M C M C M C MCMCMCM,COKN NO'COOOOiOO'C 'O'O't'OlAKINxNftKHOxKl'l'OQ O
o x - c o o K - x - i n cm x - c o Ox <o o o i n « c o > c o i o o < / o k i » k i o m , ( M O O '0 i nK l X- CM X- CM x - CM x - CM X— X— C M C M C M C M x - C M x - x -
S 0 4 0 4 0 4 0 4 0 CM O CM O m O CM O CM f" >0 «■* •• 'O 1“ 'O
^ x - N i n x - K x - x - C M O K I 0 > M 0 > O C 0 x C 0 C M a < «
M K l K l K l K l
O't'-eOKih'CMKiinfMeo0 > K > a i n K i n ' 0 « c c o N
CM CM CM CM CM
'vJCOvtinN-'Ox-COCONQC 0 K l N > C M i n C M ' 0 > « O C 0
CM CM CM CM x - CM
O O j B K I N O N x ' O i n S x - S x " K x— S CM O i n
CM CM CM CM CM
v C K I < - s » 0 ' O C M i n ( M K ) « t » S i n ' ^ ' O x - » S C O x ( M C > K 1 « - C O O S s t K 1 ' O M x N O O x < O O k C O x ( O x S O « ) > C C 0 K I C 0 K | C 0 > C e 0 K I O K I O > K I O ' O O 0 0 M>K l x - K l x - CM CM x - CM CM CM x - x - x - x - x - x — x - x —
R 3>ooeocox-*/^(MSKieos^o>'"^>0'OpiiicMKco«/cMSO'Ooo>'0(M,“in o o n o i n o > < c » x 8 ) o N ( M n x t > O K i S K i o a « c s m c O M c o ^ o i n o » < aK l x - CM x - CM CM CM CM x - x - x - x - x - x - x - C M C M
R RSKi'05>NinLnSoo^)eO'»ST'S'OxooSinoeoinMOM-xtxCKiinr*N O O O O N O i n C O « f O x S > i n x t ' O M N ' t K ^ C O K l S K i e O U K M n O O KCM x - CM CM CM CM x - CM x - x - x - x - x - x - x - x - C M
o ^ S ^ ® , ' O x " ® , m x - N N N ! O ^ K i m ^ > S N K i o N C M g ' O i n o > e o i n o > c o ^ M 2 f' i e o x - c o c M s Q O ' 0 0 ' f e oc o Ox c o Ox o » cm e o x - m j k i i n x - x - c o i n K > < c K > i n K < « K < c a M O i n x > o o x - x x e o 2 C M x - o o > c 5 0 c 3 x > O M iCM CM CMx—CMx—CMx-CMx—CM X- x - x - x - x - CM CM CM x - ? — »■ — — “ • “ ■
N O K O » - i n x - r - i n S l A O x - c O O S - O K - O C O C M
CM CM CM CM CM
e s c s K g g g t sCM x - x - x - CM
'inKneopixc^xxmKo > o a » s o a o k c M
CM x - x - CM CM
x - CM x - x - CM CM
i n k i x - k i x - m p x k i **• c o k i i n h - k i i n o » i n w k i c o cm Ox x - o » o o ^ cm i n i n * z N i n N « c Q > < 0 ' O Q > O K i | nF » O S ( M O O K O O > « - i n x - ( M O i S C O i n c d ^ N ^ K K I O K I K i a < f O ^ K I o » O ^ N > - 0 > 0 > 0 » N O F .CM CM C M x - C M x - C M x - C M x - C M x - x - x - x - x - CM CM x - CM x -
w w' O C M C M « # i n i n K I ' t O > f M K | x - M j p k <' i O C M x J ' i n O x O C M 4 N - N . i n x - Q C O C M > # r « - ,' J M ' O o < c N x t a m Q ' O O i n < * x * s 4 c o < c S 4 ’ N 4 a K i o > < C ’ ^ a S K i N i n k iCM x - CM CM CM CM x - CM x - CM x - x - x - x - x - CM CM x - CM x - x -
CM CMOx i ninincMnixOfM'Ox*in«fO*eo»co'’*KiK>x-inco*iiO CMK>CMininN>N-K>in<>lin
( m o n K x - K - n s c m c O o o > o o > i n K ' f N ' f c o ^ c O ' ^ o i n i n c O N O N O cmCM CM CM CM CM CM CM x - x - x - x - CM CM CM x - K l CM x -
3 RN 4 < # { O x - s s o i n i n i n K i x t i n , ' c o M C M n « O x - M M * c c M M ^ > o > 4 M o o , ' l x * x - c o < ^ K x > K x - a x - c o o » c o s i n N > i n K > < # c o M O < « x » i n i n c o a x * K i ^ cmCM CM CM CM CM CM X - X - X - X - x - CM CM CM x - K l X - x -
O OxCO CO
x - t n N 4 » < C N K i a S i n < * x t O T’ < O K I i n O K I x C i n < 0 < O x > K C M S U K I r n N K c m o x x > o x - o k i o x ^ x * o o x O x O > • ' O S . i n e o i n o m x - m c M ' j ' v i - ' O o i n N - o <oCM CM CM CM CM x— CM x - x - x - x - CM CM CM K l x - K l CM x -
R 5C M x - i M p » r n o x p x x > N . c M C 0 i n x > v~ M i n ' O ^ i n N > C M i n i n N . x O x O x - K i x - x - K i K t x # ^ O x x * o o c o x - S x - c o o x S c o s a c o i n c o i n Ox i n ^ m> cm i n m Ox Qx k i Ox x » mCM CM CM CM CM x - x - x - x - x - CM CM CM n j x - K l CM X -
8 R^ r : 4 ^ K K i P « J M > ^ c o o r n o » n * " p x x O K N . x » c O K i C M i n c O £ M - ^ i n i n n j ^ c o K > i n ocoocooKxOKOKonoKi soKoxinoxmr>inKiKmaaoKi<* KCM CM CM CM CM CM CM CM x - x - CM CM CM CM x - K l X - x -
i n i nO XO
C O C M C M i n O C O i n « ^ K I C g K i r * . ' O O x r s J C M C O O C M x - O x K . C M x - K l N . O x O x O x i ’ x O ' J i , 0 >*- C M O x # ^ C M M ( M N C M C 0 K 1 O x t x “ O x O N O x O O x t K l i n K I I A x f < O a O x C M N OCM CM CM CM CM CM x - CM x - CM CM CM IM CM CM CM K l x - CM
R R’F , ^ K I N N s « p « x t 0 . 0 4 K | x O l ' , S ! n S K I O » ^ x - » - O M S » * i n ^ i n C O K , S X- O K» O 0 0 Ox CO « - O* CM CO CM ox Ox C O K . O N - C O M < - ' O I M < O O C O o- O x K I O x k iK l X - K i K l n j K l K l K l C M K I C M K I K I K I K I K I X -
O <Co i n
x 0 ^ x 0 » “ x 0 x * x 0 x “ ' 0 » “ ' 0 * " x 0 » " ^ ' " ' 0 » * ' 0 * " ’0 * * ' 0 » ’ ' 0 ^ ' 0 x “ x 0 » « ' 0 » ’ ^ ' * ’ C M K I C M K I C M K I C M K I C M K I C M K I C M K I K I C M K I C M K I C M K I C M K I C M K I C M K I C M K I C M K I K l
2E 3xOIMxO
XOCMM>
8 ix - CM x - x - x— CM x - CM
a uj Q UJ Q 2 Q |5 Q Iu Q IU o pUQUQUOtSauOUOUOUO Q z m z m S m z u x m z m s m 2 m z u 2 u z u x m s m z m z m x u
- < <2 2
X^^x-OxNNxONinKlN c o N- K l X- Ox l > r --
aR » C Q x - i A N < ) o i n c M e o
K i i v i o o o o i n x - i n o x t x - o i n K i x - o o x > * - x - i n CM K l X - CM X - CM CM X - CM
^ O K i x - i n i n x o ^ O x i n ^ K I O x ' O x J ' O x - O x l M x - i n CM K l CM CM X - CM CM x - IM
M i n N i n o > x - - O x - S x -( M K i ' O e o n i i n o m K i a oC M x ^ C M C M x - C M x - I M x - I M
inoinxtOxtN^x-xtI M O K I x - K I N M ’ S ^ OK I > n M K | x - | M x - C M x - K I
inKiOKiinxtS^omO K I N O O O x K I O x m i MK I K I x - K l x - C M x - n j x - K I
x * K l x x x # * " x C ^ x C ^ » C
CM CO CM CO IM CO CM CO CM
< < < < <
gU I Q U I O I i l O U I Q U I Z C I Z M Z U Z W Z
VOco

S0 4 0 4 « 4 0 4 0 4 0 < 0 4 0 < 0 0 4 0 < 0 0 < 0 i k « 0 < 0 0 < 0 0 « 0 4 0 < 0 0 4 0 < 0 0 4 ' 0 0 « 0 « 0 «CM O CM O O N O I M O N O I M O N O I M O I M O N O O N O N O N O I M O N O N O N O N O O N O N O N O
x— ^ x“ ^ x™ ^ xQ xr™ xO X“ xO x™ <0 x“ «0 t “ ' O X“ X“ > 0 XT“ . r “ NO '13 x— xO X™ xO X™ xO »“ x O r * x O r x x O ^ x“ NO r " >0 » * xO X™
o o 2OJ *3< 0 4 e O ' « N x O Q c o * * ( M N N O x t i n N a M > N x r i n i n « K o « N x O i n ( M p > i n i n S K ^ > x o a ) x « m ' O o N > o o m ( M M o m x—* m ««mS'Ooino<ONx‘NNNnniM MxKOMxfin«scoso(MS>#MMo »o>ooxxiooxKl X- Kl X - x - K l x - K l x - x J ’ x - x J - x - x J ’ x J- X - N* x X------- I------- ---------------------------------------------------- -- x f " / x - x f
M N o e o o M i f l O O > o ( M ( M L n « - ' f l S o e g o > o N r j o x j [ 0 ( M m i M O ( M ( > ( M M O N a o i n c O ' / o ^ M O ' S ^ j g o i f \NcoiMOxt i n ro i n K - k i F » N - co N - < o co i n co o* M ) k o o o N N m c o c o c o K ^ i n x O x t o x x - o co eo N . co co O xX - CXJ X - Kl X - X— K l x - K | x - K | x - K l x - K | x - K l x - K 1 x - K | x - x - x J ’ x - K l x - K l x - K l x - K l x - K l x - K l x - K l x - X - Kl Kl Kl
< § O xCMKicooii«KicorMininxo*-inx»niK>niiMxnKixS,inKiKirMKixOKi*-xt(Mn*“»-cMN.Kioh.^oxK,inx»p>N.N.(>oo i n O x K i O x t x f x - i n ^ i f l x t S . i n c o o e o O ' 0 0 > * x - i f l < M n S » - x # ' O N i n x t K i ' # » ' i o O N N O S x - S » - x O O NX - <M X - K l X - x - K | x - K | x - K | x - K | x 4 - X — K | x - K l x - > * - x - x - x 4 - x - x C x - K | x - K | x - K | x - K | x - K l x - K | x - K l K l K l
x - i n qo «!■ 2K I O x O x K I O K | x # ^ N O O x « O e O K I i n O x t » - 0 > O O x N ^ x # » - x - x - ^ | ( M O O x O ^ « K I » - K 1 i n x » x - x - ^ x f l 4 r M n K I K I | n CM 0 0 CM X - x » x t K I K I N m n i n ^ C O I M N O O r - x - I M x O I M ^ r > K I O N x O ^ < « ^ O t l M S O x O C O x O c o x O CO i n CO N -X— OJ X— K l X— x - K l x - K l x - K l x - K l x - K l x - K l x - x ^ x x - ^ x - ^ x - K l x - K l x - K l x - C M x - C M x - C M CM CM CM
R U °Kix#iniMinmao^'«cacao>'Ox^(MrMinoNxo^xtxo^oxxoOxCxo^in«cooaiMin^KimcoN x-MMinMoy) OxNf-OIM NMKIIMNIM(MMKlKlMNx-0>ninin KlinKl>VCMx-KlinCMKIC\ll»x-0>x-COO <OMUIinMxtmCM X - K l X - x- K ! x- K | x- K | x- K | ' - K | x- K | x- K | x- ' J ’ x- x - > a - x - ^ - x - ^ J - x - K l x - K 1 x - C M x - C M x - C M x - CM CM CM
» 15'0'Ox-inx-Ki(Mx-Kic0(MM0xininoe0p0>M(0O0>Mx-ox-0>Sin(MKic0C0x0S(Min*j>0'>tN x-0iinin»toin K- >0 X- x- CM n«CnmCMr*Oxtf iniMQOOfinrx Klin«4-x-KIO>KI>l-x-CMx-Ox-COOxOCO CM in Kl in in x OCM x- Kl X- x-K|x-KIx-K|x-K1x-K|x-K|x-xJ-x-x4-x- x-xJ-x-xM'T-Klx-Klx-Klx-CMx-rMx-CM CM CM CM8 3 £»>Qx-N.inKixC,KimtnKicomcM>4’x— x- cm^ k)x— x— ON*'incMc00‘O0>tnKiCx.0«m0xc0iriKie0xg, Ki0>'tinK5x4-xg
Ox CO Kl CM x - x - M x x x O M I M O M O i n O C O x - l d x x x - 1- C M i n K I O K I O K l h - x - x t x - I M K I O x O ^ a K CM <0 Kl Ml *4" MlCM x - Kl x - x - K l x - r n x - K | x - K | x - K | x - m x - K | x - > r x - x - x ^ x - x » x - > * - x - K | x - K | x - K | x - C M x - C M CM CM CM
v i a S
x - > * - . 4 - c o f x . K | x o i n o x « o - :j K i i n c M e O ' f c O K i e o c * t n i n x O ' M - K i c M x - « o e o N - f x - e o r ' x - x » c M e o o c M O x e o i n r ^ x o o x x - i n c o o x - t-OMin(M KlmKIMOMOMO'iO'Ox-SlMMin K1NxCOr‘Ox“OMCOinininxtKIO>x- S m S M S x C OX - Kl X - Kl X - x - K | x - K | x - K | x - K | x - K | x - K | x - K V x - > r x - x - * 4 ' x - K l x - K | x - > » x - K l x - K l x - K 1 x - C M x - CM CM CM
2 K|x-x--OK|NinO'00«CCOMMKO(MK|x-MKI'OMCMO'OinO(MinoOOOKIOp>Ox-Clix-,'linx-MOOinC|Jx- x- in CM CMyOCM'O'V'dx *■ x ■/■CMr'-Klfx-KlOKI x»M)x-Sr-fxN«KIOxinx-K>f inx-KI OxOSin<OM<0x - K l x - K l x - * - r O x - K | x - K | ~ - K | x - r n x - K ! x - K | x - > J - x - x- K | x- K I x- K | x- K I x- K | x - x# x - K | x- K 1 x- x- CM CM CM
3 £ 8K^a(MUIKINauiOQOxNNxCIMcaNlMCMKICaOxCCMin^CMNOKIOxinONminOinSCMN N^OxKlinKINO x C M O K m K | x O K I « X f O K | x - K | x t ’ K l K I C M i n C M x O x V ' O M ’ K l ' O x - K I O K I x - i n x - t x . ^ i n i n O x - O * m M l > » M l x * M i
K l X - K l X - x - i n x - K | x — K | x - K | x - r O x - K | x - K | x - K | x - X - K l X - K l X - K l K | x - K | x - K l x - K | x - C M x - CM CM CM
8 R ®KIOKlSOKICOOCMx>K|xOCO»mxOSKIxtinOCOSVIOinx-M)OxCVI<OMx-<fl»«4COinxqN N(Mnx#x-VIKIO I M M x t M ( M x t x - M O x - O O O K I M K K M K I K I K I K I K | x - x - O x - 0 0 > O O x - O x O O C O r M e O C M CO xf K M CO i n KX - K l X - K l X - x - r O X - K l X - K l K l x - K l x - K | x - K | x - K | x - x - K l X - K l X - K l CM K l K l X - CM X - CM X - CM CM CM
3 Kl 3K i x - M j i n K i K i i n i n 0 x K i K i ^ - e 0 i n x - K i O x 0 x g x - o x - e 0 K i N > i n « * i n > * K i o ^ x - 0 x e 0 x 0 x - x - i n x 0 C M f v l , * C M N . C M x f » » x ix - O O x K K l i x - r M ^ K | x - x — O O O O x - O x O O C M O C M K l O O x O O x O « 0 O O x O O x x - CO CM i n x - O x xx f 0 0 CO i n COx - Kl Kl x - x - | ix- K | x- C M x- K | x- K | x- x - K l x - C M x — C M x - C M x - C M x -C M x -C M x - C M x - CM CM CM
^ ^ lAx>mr>iQO>rt<aoaxtx#<ocavi<ONO»otx$ox-on<o<«ooMin<ooxcox-NxtMKio>NN KiNnKim^x- K l x - x - Ki K l x 2 c M I M C M I M O x O > O x O x O x O x O x C O a x - O K I i n x - C M O x - O x - O C M x - C M > r i n e 0 K l M l K I O M O x i n O x S Ox - K l x - K l x - x - K l x - K l x - CM CM CM CM CM x - K l x - x - K | x - K 1 x - C M x - K 1 x - K | x - K | x - C M x - C M x - x - CM CM CM x -
! n c m *» x ( i n N » K I | n i n » ^ I M 4 c x - K l x O K > C 4 < # x > O O I O O M M » < - O ^ O O x > i n O C M x { M x O O i N O x O O M f t N M m K ix f lx o s s o i n c M i M » o o o x o x O « O x a o x o o i M i - 0' « - c o » - o > < - « o o o o > » - '0 0 i n » i m o o o o x K o xx - K l X - K l X - x - r O x - K | x ~ R j x - K I CM CM CM X - K l X - x - C M x - f M x - R j x - C M x - K | x - C M x - C M x - C M X - CM CM CM
00VOCO
e 2 3 S C ” Sli5SSftgSS:S3^R SgSSf"^?:3a85Sa5:R :S§SgSgg~5aSIC 5Rx - K l x - K l x - x - K | x - K | x - K l x - K I K l K l CM K l x - x - K j x - CM x - CM CM CM CM CM x - CM x - CM CM CM
S oa<o<>^o»inKiMoonx-Mx04aioxo»ioMiococMino»»in<ca«-MiniMNB)xOxtNingioMMx-vi K I N M S 0 > K » M ) O k " O 3 K l CM CM O r O CM I O x - i n > * x - C M x - x - O C J C O x - C O x - O O x - x - C M K l i n N CO O CO O > CO
x - K l xx - J O x - x - K l x - K | x - r O x - r O x - K | x - K | x - K | x - K | x - x - K l x - K l x - K l K l K l x - K l » • K l » • K l x - x - CM x - CM x - C J
^O'xfCMxOKI^N-inx-x-x-xpC.OxOIMCOOpx-QxrKip^x-KlN.cgrMKlC-^COeOKIKICMxfCM'^KINxOrMKIN.p O K I O K I x - © x Q CO h - 00 m x* CO CM OI CO m K l MJ x #M I i n 4 N < O N C M 4 0 > I M f * > i O I M K I ^ I < l < i < C Kl Ox Kl CM CM C M ^x * « C N x # (M ( M > } i “ « C x « x # x » < C x , ' C * - ' # x “ x 5 x « x C x " f x x I x x x C ^ x C < C ^ x f r x x # » » « C ^ ^ x * x— Kl *” *— Kl
8» c a » c s » 4 » c a o > c o » c o » c o » c a A c s o > c a » c o » 3 » c Q » c a » q o > e g « c a » e a » o o » c a o , , » e o o c a » c a » N«CM M N N j N j N 4 N 4 N M N M < M 3 N 4 l M Rl 3 Cl 4 Cl 3 CM 3 Cl 4 CM 3 CM 3 CM 3 CM Rl 3 CM 3 Kl 3 RlCM CO CM CO CM CM CO CM CO CM CO CM CO CM CO CM CO CM c3 CM CO CM CM CO CM CO CM CO CM A CM CO CM CO CM CO CM CO CM CM CO CM CO CM CO CM
3 3 3 3 3 3 * 3 3 3 3 3 3 3 3 ” 3 3 3 3 2 3 2 3 2 3 2 3 2 3 2 3 3 2 3 2 3 2 3 2 3 2 3 2 3 2 3 2 3 ,3 2 3 2 3 2 3
1 1

O ' O O ' O O ' O O ' O O ' O “ >o N O N O N O N O N O © *0 *0 >0 ^ 'O ^ V) t»
o
ifl'ONpq<ooinMflO'^co o f t x - n M i O K i o o a s
fx»
N p > B M » g M p « o » ' n »k N Q N i n a « * K i M S <0 ro ro ro Ki Kl
coO O K I O M O « N x » 'O lO S , n N 0 < O O N O > M O I A O O <0 P*.ro ro cm cm cm
» x t u i S i n K M « > ' < i a n i N S ' O S - u i o o i / i ' O ' C ' O ' O m CM CM CM CM CM
x f S x t K C M x t M N i n x t N <0 'O 'O 'O 'O 'O 'O 'O S 'O C K n> CM CM CM CM CM
CM CM CM CM CM x -•O■*»CMN < d * * in o x > g » |n o ra4M i n x t i n < o c o « S S x > o
CM CM CM CM CM x - x -
M’ Q < O O x * a Q > I M » C M r v » s r ^ i n ' O c o S 6 > « - ©CM CM CM CM X - CM X - r -
e o c o i o i n < * M l o r o Q t r M N o M i n ' O i n C M x - K I K I N ' O CMCM CM K l x - K l x - K l x - x -
R°0 r o in C > 'O 'O fM in ?»’ i n r g p in 'OSNroiM Q 'O S» «CM CM K l X - K l X - r o X - X -
5x ? ' » 4 N K i n 4 0 » » x - | , ’ ca ' O N - c o o > i n r o o O ' 4 - r o i n > oCM CM K l X - r o X CM x -
r i n N - o o i n ' O x - s r o r,' os a o » ' O x * f r ' O i n > «CM Rl Kl X - ro X - X* CM x -
O * * K t 0 x-C 0 « fP O x - 0 > K I O K I K I O « # in
^ M M p > x * M x t p i p > N . N S ~< « i n i n N > o K > N K K > o co oe
3
3
co 2W rvi S• t o o o x - K c o x - c o ^ a ^ c M 1 0 x - » K I 0 K IK I0 «# in I x - Kl Kl x - >r CM m CM CM
RC M C M O x K I C O K I O x C O N - i n ^ r OO x - f o m x i o N i M N roK |x -K |x -r O x -x # x -» n C M CM
Ox
« x - x t x t K I O N x - 0 > N , n f O Ox o k i cm i n r o O x i n x o o sr g x - K lx - K |x - K |x - x # C M CM
* £< I“ i n r o i n r o i n K i i n r o i n K i i n r o i n K i i n o i i n r o i n r o i n r o i n r o i n r o i n r o i n r o i n r o SKlPxKlKrOSWKKlKlOKKIN SioSioSKlSKlNKlStONIOSKIKl M5 ro^••noaoxacon<Oxxoxpmo(Mt-»ncMxico»ocMNx-^cMnx>»q
i n o i n c o r o c o x r c o r o o x x f x - c o o c o R i o x o ^ x - i n x - r o o x < t S x t K ^ s 4
x-x»T-x»ox©c**»CMin^*CMx»x»xo*-o©x*-incMeOx-Oxrnx-N.xo©toOx«o 'O C M in x - x f O K i o x O 'V K i m O 'O x - ro co in o in Ox in ro co K. ro ^ cm **•
x - » - X- x - X- x - x - x - x - * - x - x - x - C M x - x - x - C M x - C M x - C M x - C M x - C M
ro < ^ 3x - t n K i N c o « o i n « 0 ' O i n o > x - o x - x i r w N x C x * N C M ^ i n c o o S N o e o r x > i n m r o M m m <0 x - o i n » - K i C M ' 0 < d N i n x t x d c o o c o o < i ' O i M O ( M x i « oX- X- X- x-x-C M x-C M x-C M x- x-CMx-CMx-CMCMCMCMK1 CMK1 CM K|x-K 1
^ ro— *- xp fM p x-xO C M r«.fM C M x-eO K lN .r> xin C N lx-x-C M O O x»C M rO x-x-fM eO K IC M xO xl-u . < S N R ' 0 '0 'O < O N 0 x ^ N i n > c K > y ) xo cm<o o i n « - -o r o o m x * ro c o »» ox - x - x - x - CM X— CM x - CM x— x -K 1 x -K |x -r O x -K I C M r O x -K |x -K |x -x » -
S8 «S*“ c M K i» # in c M h -r o io c M K iK ix - in in o x c M C M O O ‘ 0 >cM'0 'O x-ror^coP«>xj-cM C M ro
o o > G a S K K x K c a o > o o < o i o O x t in in m» cm in cm in mi co in K. to cm K- x -x - x - X- x - x - CM x - CM X- CM x - ? x - in
^ 4 ^ ,M O ( M ^ < ^ ^ e o i n O ' i c M x t r o o > g i n O O N - e Q i n o e o o c o < o » t o c M c o o s o > n » o c o a o c o < o r o K i x i i n < o < o i n x t i M N ' O x t c 3 ' O O i o x i i n x -CM x— x— x - x— x— CM x - Kl x— x—K |x—K |x—K |x—K |x—K |x -x J -x —x * -x -m
R 'o<v> in‘ ' O O x - o S x / i n c M O C M i n c M K i O ' O K i ' t c g e o i n ' t x - K i i n x r u i o s c M i n c M C MO x - o > o c o » o > o c o K i x > o i n i n r o ro >o ro o* P» m cm mj cm R. * - « - m x - ro inx-CM CM x - CM CM x - Kl x - Kl x - x - r n x - K |x - K |x - K |x - K |x - > # x - > * - x --
8 COR m™ «0 '0 ^ i / i x - r » . r o r o p ' 0 ' O c o o > « » o r o N N x - o . N e O ' O i n * » > t x - r n o o o r > . K i x - o o o c o o x - o i n c M x - i n K m m K i n « » x - x r x - i n x - M ( M c o i o o x t KX- CM X- X- X- CM CM X- Kl X- ro X- x - K l x - K |x - K |x - K |x - r O x - K |x - x 4-x -v C
8 N «<Oin«4Mx-cocMin»x-inxxMO'OCM4CMinMcax-xtfO>rninx>o>« « l ( M x - * S o > 0 « - O F » O x - x . | n ( M I M * O C M ' O K I ' 4 x > « C x - < C x - | x > l o N r O O
IM X - CM X - X - x -x -C M x -C M x -K lx -K |x - x - K |x - K |x - K 1 x - K |x - K |x - K |x - K |x - n * -
i g £x rain<Oinco»rvN*x4McatfiiM>f*>nMOOnoinMMroiMMCoeox-coK i n M x > o . a ) S o ^ n ^ a o > O M N x - k i x - c m o x —o x - o x - c m o o c m o k ix - CM x - x - x - x - CM CM CM Kl x - x - K l x - K |x - K |x - K |x - K l x - K l x - K |x - K I
8 &n K S M i n 7 ’ c a M ' x x f t < o a c Q ^ p > s i ! | f t g 4 a a i n g o p > C M N S O i n ' O M
^ ^ O C O » 4 K O S M N « O S O > $ > « a S S < O C O i n K C O x - N O > S O i ax - CM x - x - CM CM CM CM CM CM CM CM CM x - CM CM CM
co sN eox-»N««avi2pm^Mn<OMio<ONinx-r>M'Ocap(MNCMpr>iin<o x ’ I M » 0O N i n 4 C O N » N C M 4 M a Ml CO Ml N -K l Ml CM K-CM K CM ^ CM CO CM x - CM X - X - X - X - CM CM C M C M C M C M C M C M C M C M
R 5N c o c O f * ^ ^ x > m in ^ K O O K i^ N N > t^ M c iS N O K 4 iMx*ox*rxSin
r - t - x > < d < O M i n < / ' a i n K O > i n O N N o < o o ' O c o i n < o m c o i n o > i n K i n c oC M C M x - x - x - x - x - x -
^ 4 a ,-roo>B)Mrox-^rn>gP-iniMro^)KroNOx-<oox»eOKi(M>ox- conOMinN^Nin^r'0|0«<0'0 KNinMx#vi<#in^tfixtinro^xrMi2iMKin<co4'>OKiKi'ON(vixxiMfins«cioox-<onmx>inoicorricoo
< O ^ N N ^ O i n O x t c i n f i n K i i n i n « 4 - m c M > » c M r o x - K i x - c M x - c M x - c M C M
ONVOm
in ' 0 « i n e o e o » x C x - o I A x - CM o» CM O X- CO in Ml ok i m » * K i x - r o * * « # x - ro
> f ' j , o » 4 - > » ' 0 > x - x - i n c M i n i n K i ^ x - o o * ^ e o « 4 ' x - x - x - M i r o K ! ' t P ^ m r o e g
I O C M C O C M M M M O C O 4 0 4 O I O x C O N O K X M O C O I M C O N O N O N a
m x - « o x - e o N - » # x - Q c o , n in ro cm ro cm ro ro ro ^ •*» o*x C x x ^ x - ^ v ^ x - ^ x - x -
CO»CpO>COOxCO»COOx'*Oo4 RimRi4 im4 Rimn RjCO CM CO CM CO CM CO IM CO CM CM
13 3 3 3 3 *2 3 2 3 2 3 2 3 2 3 , 3
^ » x > < O » x t N N Q x - M « ( 0 M » ^ 9 > x > O ^ i n r 0 O I 0 <0 < tlM in < 0 KICM q Kj in cm in x - m cm ^ ro Ml cm cm >* cm x -M lC M 'O C M in cM in x -« o cM in x -in cM M i
S $O S O S O N O N O N O S O S O O N O S O K O K O K O K O K O N
L x - r O x - K | x - K l x - r O x - K | x - K | x - K | x - x > K l x - K | x - I O x - K | x > t O x > | O x > K l x - | 0
ft
a l a s a i a i a l a s a l a a a a l a l a l a i a l a l a l

i n i ^ « r n i n K » ^ K t i n r n | n K i i n K > i n r n i n r o i n J i n K i i n K i i n i n i n i n i n r n | n r n i n K i i n r n i n “ i n N- N M N M N fO N (O N CO N Kl N Kl N r o N N Kl N Kl N Kl N K l N Kl N Kl N Kl N Kl N N
Kl K lr o Kl Kl•♦«-inui'<>COOKNO'OSi-(M«OKinO'fl,“KlinKOKN'OlA^'0'#«tK«-Kll/lO'’'0
n c o ^ S u i ^ » » | O N O > a « t o > ^ u i « ,o m u i i n a ' O u i < « « £ u i ^ ^ < t ^ « - ^ o > K i r o
. o s ki t ^pt<-**oKiN<o«-»«taNtoaa<M4oa^o»KiiMONT-(MinsinntoaKiKioi N- o><Oin<rin<fa<Or-KiS(Moo NS »o>Sainoscouico^NSmifiin<r >*■3 in (Ko ro
P>IM»-»-Kl»*eO»-»tOin'OSf »-»-(M4 N»*(Mr-«<OinNOinOO»-IMK1 0<MIMO s <oiMKi«r'O»<0 'OiA't'OKiKiv*iMNO «o<ooifloy)ouiv‘no<ro>4a<o s«- N«r(MKl»-('l»-N N (\l»-(M»*('J«- ( MN( M( MN( \ J > - r -8 § R
o > > j - r > . ' O o g e o ^ p » i n r « . ( M o o s . o < j - r o ^ - o i n r j K i O Q « - > » o o p « ' O N - t M > O K n r \ > i - o o s - o > * - ' » ’ in (MNnoSSSincQNOtin^Kiv^S '0 fMr0 inmKfM>0 fMinr0 '0 «->i-«-'0 in«— CM "J- « I M N N N N N N I V I* n ' ♦ *>J2 O O
s<«’O K i s » * « K i s o i n v « » < O N S < o o N M M u i o s i n i M N t o N t o a « - a o K i s N (M o «t*’C0a<o<ra'O<OKimSKiaKiNKi 'ONinKi<«N«^N<rSKiS'raino co(M CM «M CM CM CM CM CM * -
i n i n c g ' O i n e g y ) « 4 - r o i n i n s . ' 0 ' 0 ^ « M t M S . > » (>ir o K i O ' O O o ^ - « - « - r o n j e o « - [ O f O ' n c o <' l s . <o i o * - ( > 4 N K i s < 0 ' r < « « t o K i o > N > o o co c\l mj cm ^ i n K m> m o» i n co K co co cm O '« - « - l r t » * ^ » - ^ * - K l » * K l * - I O » - N T » ( M CM (M CM (M IM fM CM N » -
10 Kl M>ro
c o i n c o h > S » i o Q r o i n f M O " 4 >i n r o c o o K c o K (>1N f M r M c o ^ o r o r M i M ' 0 « - o « - h > a N - 0 ' N 0 ' ro in o S in 'O io 'O O K iS K n n 'f l« -» -M > c o K iS K iS in S in ^ )* « 'O N O > S a c o N *-i - »-in*-N f«->r«->r«-ro«-fn«-K !"-«M i v ni n m n in n <m»- *-fj 3 fi
a ^ s « - ( M M i n ' O i n f t ' t ' O S 2 P ^ i n r > « K i N ! r K i M ’ o n < « > { O i n ' t i n e a n c o o > o > < o N co S i n i n < O N K i N K i N 4 0 < O S 4 i n i n O N c O ' * S i n c d > « M i n < o « ' O a o o > - o i n •—» - v # ^ t - * # v - v - I O « - K l ** Kl (M (M n i (M (M (M K 1 * - K 1 » * « -
g R 8O ^ S N K l r d t ' I V i g « C i n S O ' t l M N N N ( v l N 0 > S » T * ^ ' C < 0 N I M > C ' t » « O » N N K ro 'C S N N o S ( M a '» c o < r O '4 < < t4 v K i o in s ^ < o < c < 0 4 in < o in N > * N to N K »-« - » - K H - r O * * K l * * K l » * I O * ‘ < C » - I O » * K l f f ( M fM fM CM CM K I < - K 1 « - K 1 * * « -
5 8 SO M i n u i ' r N ^ s ^ i n ^ ' * a ^ K i < i* u i ^ o N a i n m u i « i n « o > » N O Q a K i o i M N N qfM M » - « - r o o o w « - O N O i o K i K i ' r s o o K i ' O f M i n f M i n K i i n i n < o o o < f ' ^ K i ' 0 n• - « - K ! * > K l « - r O K l » - K l « - K l * - K l » - ( M » - rvi CM CM CM CM m «- Kl «- Kl «- T-
3 S £• - r o f M i n « g c o i n ' 0 ^ ' O j M c g f M o o f M O « - K i f M (>Jc O ' O i o e g i n c o » - > o « - c o » - s . f M f M O « - c g , 0 » - «- o MJ co m co m s -K co in co o o 'OfM'Oros-eoo»-»->T'0 cm« - « - CM CM CM CM CM OJ CM« - CM» - CM CM CM CM CM CM « - fO « - IO « - « -
3 S S4 N r o o n O i p S N r > » K i N N N S < - O ! r N < 4 0 > c o N i n o > a o i n r o o < a < M c o i M N f - < o K , N co a } N S ^ S ' * S N < O N S N S o c o O ' N <4SincoinooinO'ON'9'00'eoo<-M’ «—
C M C M C M C M C M C M C M v - » - « - • - CM CM CM CM * - IO «“ «~
O K! Ci^ 00O f M r O ' O r O ' t s » r g c M S ; e g m r M * # N . o o t * . i n i n * - 0 ' m o c o m « - ^ o o f M ' O T - « f M M > o e o r s J ' 0 <4 «00"0 «0ine0'0 C0 '0 o S o S S S '0'0 'tinm4 insin»<oo>moininr- '00 «—
T - « - r f C M C M « - * - CM CM « - CM « - « -
S S 8• O N N S ' 0 » < C C O O a ' r Q v O > K l i n N K I O > , ' m M O O N l M » v N n K I N N S U l ^ K I N ' « in i n ' t M ^ u i M i n ^ i n ^ i n 'C i n ^ i n K i 'r 'O K i< C 'r^^K iin '* 'O < cK in0«N K iO t N.
c o « - « - 0 ' S > ' O r o N > m » « - o o i n ( M ' O c O ' 0 ( M * <‘ ' O o r o o o i> » r M ^ > c o ^ O ' i n i n « # o o K r o (><« -Kl K l » - K 1 0 K 1 0 K 1 0 K 1 * - K l « - K 1 0 K 1 0 K 1 r t r * K | v ’ N O K I > * n N K I K I 4 ' r i n < 0 ' d S
or-co
ro ro *” cmO « - ( M K * - ^ N g i n N K l O O v ( M I M » N C 0 , * i n | r i a < - « a K l N » Q < - f - N » O f - I M , * r '
e o r o c o c M c o r M c o c M c o c M c o r o c o c M C O C M c M S « - c o N S C M e o « - a t o i M o » t O T ' K i i n
o r > c a < c i M i n o > K i n i n o c o K i < o i M K i i n < * r n N . i n « - m o c M i n M > s . ^ o » » # 0 ' 0 ' Q i n * ” M>cm ( M i f « - < t f « - i i i r - ^ * - » j r - i n T - i n c i i i n c M c \ i > * * - i n « - i n f M i n » - i n * - i n c M i n « - O c M cm
N. o K.K i n i n
e O S O S O S O N O S O N O N O N O O S O S O K O N O N O N O S O S O O*■ *-ro»*Ki», io»'Ki*‘Ki»-tOi-to»-io»* »-ro»-ro»-KiT-Ki«-to»-ro«-ro«-ro*- «-N>roz z Z ag z z z z ^ a r z z
a s a s a g a g a g a i a s a - a s a K a x a g a g a g a g a g a .a< <

Tabl
e C
6:
The
follo
wing
da
ta is
based
on
sem
i-fre
esty
le
exer
tions
pe
rform
ed
at a
hand
le he
ight
of
1.5
m by
11 m
ilitar
y pe
rson
nel
o , * ,l3 3 S 3 3 3 S 3 3 3 S 3 S 3 S “ S 3 £ 3 2 3 * 3 £ 3 $ 3 £ 3 S 3 S u’3 3 £ 3 S 3 S
3 3» i n M M i P ' O ^ S K r 4 ' t ' * ' # o m o > 9 > s m N S i g ' O S O N ^ n ' t S ' # W ’4e0J»K- > ^ Ki ' O o c docONN*fQNnnN t - N f - N O K i o n S i n ^ a a a a a a o>moNr-ina CM CM CM CM CM CM N « - K t n K l Kl • ♦ • - K H - K I
;*€► I Q K II*.
in^NO<-OKINNr-»>KnKN4K'tKlrONKI4inS»9>0|>^PN^vniOO^fQKIinm'0in'0in>0ino»'0»-in«-'0'^'0 « - * - « — »— cm cm r o
S N.o •-I w- CM * - CM
i>oocabSroo<mS«t»«#o OO'OOIM od o ea3!
£ K?
3 fcl i n K l N N ' O K I i - ^ I O ' j p i i n O *
^ o i n o < 0 0 > « 0 « o S N N e o ( 0N r N f N (M (M (M (M
O)
OxO<^O^KI<OONinOy)IAKIOtN'OinKlNIMS>KI<>4|n«tNinO>00<-KlinO<-tO«-OKIN « o i n o < d o > « o a S N K « o e o c a N O > o > N O K « i n i n
i » - ( M r o(M
E 5UJzII. ®°o(A
in*><-KI'ONK»N<tK)o-'‘N O k N O ’K'0<t<-«00>NinOkKIKI^igeaOMOT*inNO>NOO K i ^ K i K i K i K i K i * # « # N i n < M n » - i f t S r - > 9 K i o > K i o ^ e a o < M n a a S r - a o> o * - i n <o i n <o
fM C M C M C M f M C M C M C M K I K I « - < M CM
K l i n O i n p * a i n N < t i n K I < t K l i n O N * * I A N ( M K I < ^ K I O O > r > i n N ' O i n C O ' O ^ K ) t - * - { M . ___k i (m k i n k i k i k i o O ' O i a c o <O t * ,o N o i n i - 4 N < O N S K i o > K i N m i n C K a oo o a K- r o i n r o 03
C M C M C M C M C M C M C M C MCM «—
CM ■CM CM ro
K I N O i n < - ' 0 ' 0 « * I A i n M O K ) N » N K I > - ' 0 C 0 0 i N > p r > M K I M ' « - i n i 0 0 i p * * K ) O ' 0 i r > K K I ' 0 e 0 K i c M K l i M K l K i K l i n i n m i n S i n o o o c o r * i n o i n o S o K > f K r - < o i M « M a N- i n >0 o <o «— >o
« - » - r - r * C M C M C M C M C M C M C M C M C M C M C M
u r lI O e O K I M M K ) ' O r > O N O I M i n O M I M N a « * < O M O i O | n C O < - M ( M < O C O N O t a K I O i < - O i < - K i a K < 0 N K I N K l r 2 K I O O U I i n 4 O O l A « O a N K < O S M K M M M S M O i O K j O i ' O O ' O C O ' O N ' O
2 3 g £> r*m<OS<-<*»N<fCOUlKCOKIO>ONrMr«>IOOONIAIO»K)aNKlNON^>KII9f*4'*'<0 •— kKiKiKiKiCMKiM’MinomKiuiKl KSNinoinoinM'OoinN'OK)K>in in 'O'O'fioroO r - t - i - r * r » r * r - • » r * r * t - f - ^ • —
2 £$ t: 5M N O ’ C M T * O M K I N O * > N C O I M U > « - N C M » < - i O i n O > ( O C O < - O K M O > K I K I O i < - < - N a i n i O M S N M K I K I K I K I K I K I M M M K 1 N O K I M M U I M M M K I K I K I M M K I C M K I I M O Kl M M C M K I C M C M N
g o9 CM
<o i nO 03_ 'a»-Ki'rKisoKi»'0'OKi*->oooo'0»-»-y)'teoin»»irto0 < d M K I K I C M K I N C M K I C M I M C M K I K I O K I i n l M O K I K I K I K I K I K I C M C M K I C M O ’ M I C IM M K l K l CM Kl
t o i no i n
™ N » * - K 1 O 0 0 O M ( M ( \ j T - 0 > M M ( M » * f M O 0 0 » ( M < I O » - C M M O N O ( M n i n » « - T - O N ' 0 » « - O O N O M O ’ I M K I I M C M N I M K I K I K I M «*• CM Kl « - Kl CM *«■ K l K l CM CM CM CM * - CM CM CM M C M K I N N I M K I
3( O * ■ r - r - r * • - r - i -
(M4ONM4inui^r-p-N»C04<'CMa^MKain0iSSMinKI'0'04Kl^aO!Aa<0KIKI N M j f l M K I N C M N N K I I M M K I N K I | M ^ N ^ M N N N ^ N N K I
o o»O O i n O M C M < - < Q C M K I < O e O ' 0 ' O I M ^ N N O i > 0 « O N K I O i n < O O M K I O M O i O i ^ 4 i n K I ' O e O < O i n K j O O j A O K J I M M K l M M N r O M K I M N K I N K I N M N M N M ^ N r - C M O N CM CM » - CM ^ KI
m o o > * ' 0 ‘ K j r o i n f M C M f M i n o o » - e o K i K i » - v t ( M K i « - e g c M C M » - » - C M O N . e o c M K i N - f M » - i n C M ' O i n i n i n > * K J » « O j O K K I I M M K I M K I M m M K I M M O K I M N M N M N M • ; CM r * ( V I ^ N CM CM Kl JO f o
3 o<NIO i n « - « - ^ O i n « - a O K l C M K l O i O K > T > M > O K l O i i n C O e O K > C O ^ M > K . N . ' O K l C M i n « - ’ e O K l O i N - M } r » C O
» I M N » a < 0 0 | 0 0 | O M J f l K l ^ K l K l * # K l K l K i ™ « * J O ' 4 ’ J 4 K l » ^ C M ^ C M M C M C M N N N M W j ;
3 CO "Orv J o Q ' O o o i n c M K i o g » i n > O i n p . ' 0 > a , * - » - h > . i n « - r - f M i n c o ^ r ,> - > j - « o o K i i n » - K i ' P « - f M » - ' O K i K i t o i n
4 O O S 0 > i n 4 O « - N i n S i n N i n M < 0 M 4 O I C I O M M K l m K l N K l K l K i n O M n M O k O i« - K l f M C M « - f M « - C M « - « ~ « - » - I - * - r -
K . S . n . m o * - ' S o o o o n ^ » - o o > 0>Kic0M O iM 0i a i n < 0 i n t0N n i n o i i 0 <oK<oaoONO>» - K I » - K l » - K l « - K l » - K I » - f M » - ( M CM CM» - CM < - f - N
S 5 3K i i n K i i n K i i n K i i n K i i n r o i n K i i n r o c M K i i n K i i n K i i n K i i n K i i n r o i n m i n K l i n K i * - K i m K i i n K i m K i & Kl CM Kl CM K l CM Kl CM K l CM Kl CM Kl CM Kl Kl CM Kl CM Kl CM Kl CM K l CM K l CM Kl CM K l CM Kl Kl CM K l CM K l CM Kl3 « - m ^ - m » - i n * - i n « - i n « - i n « - i n « - *—m « - i n ^ - i n ^ - i n ^ - i n » - i n * - i n « - i n « - f m « * i n * > m « -
|Q in infjf r o cmu' s z z x z z x m z z s s z x a s i n x z z < < < < < < < < < < < < < < < < < <
Q H I Q U i Q U I Q U I Q I U Q U I Q I U Q O U l Q U J Q I U Q U J Q I U P U I Q I i i Q U I Q Q U J Q Ul Q I U Q- M Z M S M X M X M Z U Z M Z M H X W S U I U I U X M S U X H X U U Z W I U Z U

' 0 ' 0 ' 0 ' Q y > ' 0 ' 0 ' 0 ' 0 ' 0 ' 0 < 0 ' 0 ' 0 ' 0 %0 ' 0 ' 0 ' 0 ' 0 < 0 < 0 ' O >0 *0 'O ,0 ' 0t o o m o r o o m ^ t o o o*
m §^«OrOinN(MO«OM'# NCONiftlM^^OSinMt-0»Qi-'0,#'0 ^ T - N e a r ’ e a S ( d n o > c o m o i n o > T - o » - ' 0 0 > r * * « - ' O P ' 0 » - ^ <o
l «- in w I M r - N CM CM « - CM CM CM
3CJ.O«00*S<M'00*K>(M8»™N(>K}0»fUMN-"f«0'4lAM'tm'00iin^ON > > i n N S S i n o > i n o > C0'‘ a o s c o < 0 ' 0 ^ ' 0 i n 4 i n i n n < f i n in
CM CM CM CM CM C M C M « - « - » - » — «“ «“<*■ min in
’O O C O N l O ' O ’ » S O N v t N i n N ' 0 ( M O ' 0 » - M O ( M i n i O ( > ( M O r ' » -i n CM CM MJ *— i n « - N» CM O B O O N ' O i n i n » t M I O * ^ > # i n ' J ' # < M K I I M MCM« - CM CM CM CM« -
m OO' s#O M M M i n M « C M N ' t ' -S«'tMCOCO*tKON«MMi»«-inNM*‘eO
cm eo cm co o m 0 " 0 cm o n . in <o in •>* cm in cm in in in in in cm mCM CM CM r - CM«-
coO ' i n o i n o i n o m O ' i n O ' i n & » i n ' O O ' O O 'O O 'O O 'O Q 'O O 'O O «— >0«— M}*— >0"— "O*— <0^ ( M e o i n i n T - ( M O « - ( M M O ' N ' - o o ocM^comom*-'— i m S ' i o
« - m ( M » - < M « - t n « - i n « - r n * - i n
N r - o » c o i n 4 ^ « i n i n « # i n « 0 ' 0O O N M M e O l M B ' O O O O O r - r O
CM
CM
cS
CM CM CM CM CM M • - M
' O m i n ^ ' O S m ' O i n i n K i n m ' t inO'00><ocsincMKinK>>ooin CM *- ^ CM CM CM K1
'O'OmmeocgfM-^N.oeominin■ n o > i n c o i n c o i n o i n K i S < o F > o >
CM CM CM CM
r^M»
i n o c o c o i M c O M i n o i n r ' o m N n i r * i n i n < o y ) ( M S o > o n ( X N i n r *m t » < o » « a m 4 N » o > N ^ < o ^ « N K ) r > N N ( M N i n i n m f o i M m g
S M» o > o o > s c o o i M < > a r* S i n N i n ^ a i n o M M i n c M i M < t i M < o a <r*4 ' a in c o in K > 3 so > co o » «o i n K m ^ m « - m < -cm cmki m rn cm m 5
« t CM MN. >!■ _l
m o » to * o > o > M ) > N > o , ' ^ * * i n i n ' 0 « o i n ^ * t « 0 ' O i o > * o ; i n N « o ," i n nj 5> «# in cm >* •* m> m> c* ^5 m m jn m> » - in • - in *-■•» cm rn nc in cm in gM> in - j•* in <
co o» «#cm ^ < o •* cmms ^ « o ■- a ^ 00 o ■>»cmo •» msin «o*» *-«o *" in 2in cm m cm cm m in in k w i n n « * p w ^ ^ ^ w N i n N i n i o i n s i n m “
£» Sin o o o » » in c M O h -» -« o , - f^»-o*cooN.N.M>cMrnin-^> « 4' » - o p j * " < r *N K i N N ^ N ^ N N n n j o j in ^ in ^ in cm in in in in *r cm S. <o
a §< M n ^ N » n i 4 i n o o ,"o«“inoinc8«fiMinNKooMNo«of*lo M r - C M ^ I M O N O N N K ) < N M N M J ^ M N i n n ' C jf t ^ B t f t Oj JO j ; 2
cm eo 3CM » <
s o i n M o o o m « - o ' " i n n « # o > o s - f ' » i n * - e o f M ' O o g > 5 i n (' J *- >«-m«—cm ocm o cm *—m m n i » n » ; i n n i i n i n ^ c n i n K M » » Q c o » ^ ni a2 ck ^
S o » - i o ^ N O K ' O c o , ‘ ( M O n < e O ' O c o i M i f t ' O i M p » - o ^ < > « i ' , p> _ »-fo«-in«-rn*-CM^<M • t N K i n i M n i n M i n « » i n N i n j c o o j ^ s 5O ' O XCM «-
a 0 ' O * ‘ A < 0 < 0 * - ^ i n * * < « i n t - 6 ^ > * c 0 c a 0 " 0 O < 0 C 0 '0 0 ' i n i n i n <-i M ' t N ' t o i M r - i n N i n '3- > £ > c i n > # ^ i n ^ ' O i ^ r ^ o e o j 4ifMOjf^ cmN. OJm co
v ' t O ' t < - 0 ' N K o o * ’ i n O ' a ^ i n o i M K n i M 4 N 0 0 2 r m c a m in m cm'O • - m m m ^ m inin>*-'0 'C, coinO ' '0«M O»in«-puN.m '0 -4»- r - t r r -1 - •— «— ^ <r~ ^ t- CM CM *■ CM CM•«»in>ccMinh-'00>0'Q>t'0*-h-in^>inoincMin^r*:(>.e0fMO«“ ^ « fv,tM i n f « o s o i n « 4 i n '0wcuoe0K)n-ir\O'0«- '0»- '0»_f0O »-
< - r - r - r - r > * - « - « - CM CM C M « -C M « -C M « -C M « -C M « -
c O f n e o c M i n o r « - * - 0 ' O i n « - ' i e o' « K ^ N ' r c O ' t o o c M F > i n c o oT— <r— »— CM CM CM CM
incom<-M)NiCMor^^O'incoo ^ M ' t S ' # e o i n * - K » - s m f » i n
t- « - * - CM CM CM CM
StCSEESXSSSSoKlSlC« - * - * - CM CM CM
N M ' } M p > S f O O O O ' O N « 0 0 > k « * c S ^ S i n o c o * - N » > u j i -
r - » - * - CM CM CM CM
i <#J*CM
8 t - S ‘ 0 « - i n e o c M * » * - m p « 9 f M i n K > 0 4 c o < c S i n a N O ' N c o < « o >
N r - r - r -
st S* N » o o o N N C M O i n ^ i n s r ' O s t
o i o i n r a > r K - i n £ » > t e o > » , ^ i n c o
', (MCMcooSin^inMMO'Qicifn
^ K R & S S S S S S aiiS SmCM w-CM » - t - » - r - r -
N.m
•n O » N « C O S K O ' O M f b l i 2n ' O n n o c 5 ' C O > ' O o s » ' O o CM CM • “ CM « - « - CM « - CM
m < O K K o c O ' t N O « K { c m m o « - O ' 4 i M10'CMK>CMC0CMN.«- '0CM CM m «“ CM CM CM CM CM CM
CO
Ncsiflin^'O9'Oino''oin^iv**ino>NNS9 4ioO'O0«-(vlmg s g a l s S a s * s s s i a s a s a ,,’a 0's^ f5 s a s s
» 8S 2 S S S ~ S 3 a S ~ 2 !S S S 8 :S S 3 3 ? S S S 2 S K S 3N * -N « -N * * N « -C M V «- CM »- CM ni N r N » - M in in *-
N <0in ini n m i n m i n m i n i n i n i n * Nli n i n i n i n » n i n » n i n » n i n » n i n i n i n i n i n i n K’ rn cm m cm m cm m cm m cm m KicMineMincMincMincMincMincMincMin m m » - i n « - i n * - i n * - i n * - » - in » * in * - in » " i f t* * i f t* * in » * in » ' in » *
N » * ' O I » M M O ' 9 ' I O ' C O ' C W M 'cm ^ cm in ni in «- ni »■* cm cm cm
s o o m ^ M i n ^ r o ^ P s r weomN-'OCMin-^cMN-in'Oi'^N-'icMincM^rM-^cM^cM-'fCMinv-ina < f « 0 ' f a ' # O ' c n < # a M C 0 MC M t n C M M C M M C M in C M r n C M K S C M |ncmN>cmK>cmS>cmK>cmS-cmK-cmK>
5 2 < << <
X X X X X X X
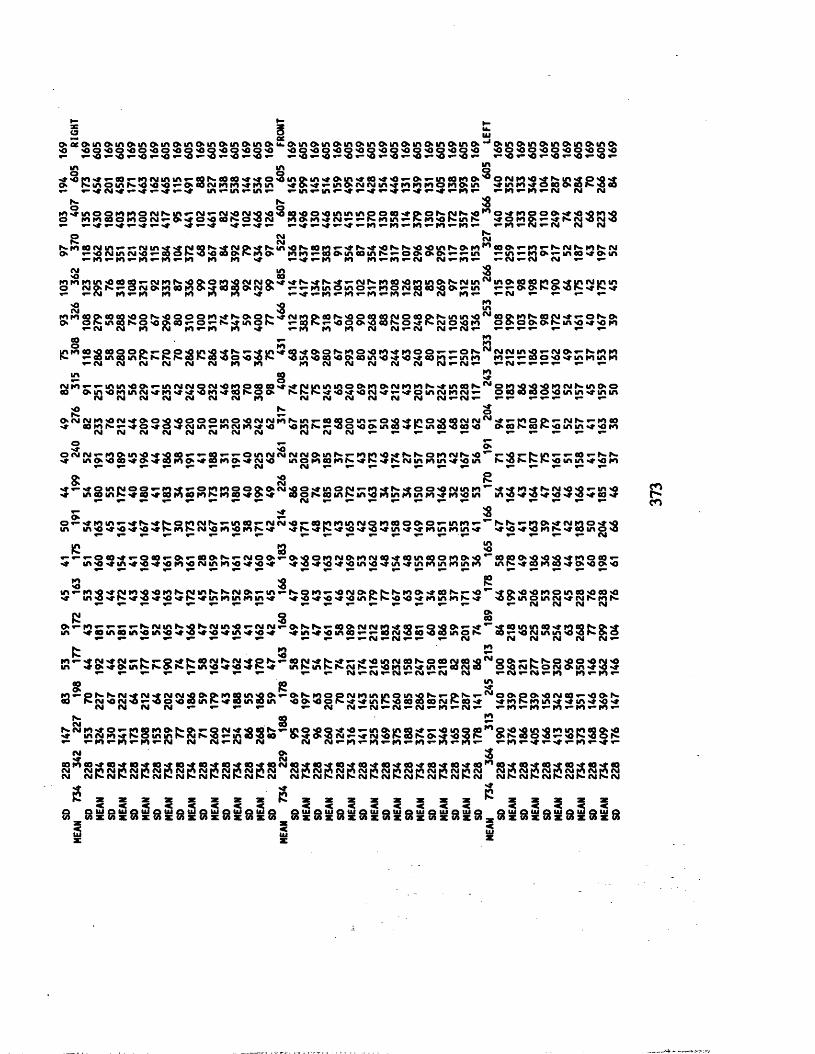
« g 2O c x O ' i n O ' i n O ' i n O ' i n O i n O ' i n O ' i n O ' i n O ' U . O ' i n O ' i n O ' i n O ' i n O ' i n ^ i n C M n O ' i n O ‘ *J C M n O ' i n O > i n C M n O ' i n o ><0 < 0 0 < 0 0 < 0 0 ' 0 0 < O Q ' O Q < 0 0 < 0 0 < 0 ' O O ' O O ' O O ' O O ' O O ' O O ' O O ' O O ' O ' O O ' O O ' O O ' O O ' O O ' O
^ ^ ^ ^ v* ^ ^ ^ ^ ^ ' O ^ %0 v1* «■ ^ ^ » • >0 ^ «0 • “ >0 ^ ' O ^ ' O *C v** r * >0 ^ >0 ^ >0 ^i n i n 5Q
' » S M ' » » ’ M , ’ *!),M i n i n « - e o s e o e O M M o S i n ( > . i n M O ! n M « M ' 0 » - o » ’ i n e O M O > ^ o ( M M ' q M N ! n M p ' 9 M O' K - in o in s» mj <o m i » - O 'e o cm in in in in ' » 0' M < - m O ' C M N i n ' c m i n i n o i n O ' i n < c i n m M o e o o > o S ' f l e o» • ^ m c m m » * M ' - ' C • - « # m * - i n » - m «— ^ m f i n r M ^ M * , < c » > M * ’ > c ^ i i n - » - i n ■ - m » - cm cm cm
N> K $m M i n o o m i n o c M K ! A > > N « - c M ' O i M < o < o S a < o o < o i n i n i n o o a < » P ' a N N K < o n o « t i n q o « M < o < o i n < q O m n C O O i n O C M f O ' M O ' O e S N O ’OlM M O n O ' - M K N ' O N M* - * -•> # — t m » - > 5 'C < - 'C • - » - > r « - ' s * « - ' * » - m « - m « - f n » - r n « - i n » - » - i n « - n i » - cm cm cm
g CM ~r ^ m t o c M i n » - * - C M i n » t ' » f M e o r ^ ^ c M p » * f N . i n ' O N > e o c n « - ^ N . ' * ' ' O N - N - ' 0 ' O i n N . O ' r n r n e o O ' « - r n » - N - C M ^ i n ^ - c M O' « - < o i M i n N < O r - c o o K 4 ,o a » S n o > i O M « - e o o > i n « o i n S » - o o > 0 > p > ' - ' - i n •—i n ^ - f n O » » —in o o >4’ 0>m
r n « - i n « - m i n i n *4- « - « * « - i n cn m » - i n ■ - cm cm * - i n » - « - cm « - cm cm « - « -
3> eo ^n m K i i n ' O c 9 Q * * i M i n N ' O Q ' O n 4 ( M C M Q > M ' M N ' t S ‘« < * N N i n c O ' O m i n O ' N C M i n N i n » c o a m o > » | n c M i n i n o cm o> N> v - o cm O ' m eo m O ' e o a O ' cm O ' w - t n i n o i n o « - m o c M c o c O ' 0 0 ' * - i n « - f 0 ' 0 * K 0 ' i s « c N < c* - * - c m m *-m rn m in m >» in • - m « -in * -in » - cm cm m *- « - c m
3 3 3m m a { M o g ' O o S ' 0 0 o o i n > t N O ' O S ' C i M i o p ' C O N ' O a c g q ! M o e o p ' S i n i n < o N a » i n N a N ' t r > o N O 'o> o S i n a N O ' 00> c o < - o < - S ' f i n o K > < - e o N r - < o o O ' 4 a K O ' t S N O i o i n O 0' 00' 0' k i n ' 0> c < o i n
« - cm cm i n cm m « - m i n m « - i n i n i n cm cm « - cm cm * - cm « - * - « - » - « - » - « - « -
5 ‘ w "I O M e 0 4 « g o p i « - p 0 4 i n 4 > t N » * ' f V I ' C « 8 M O O N M O < O M M M O O » - « “ O S ,' l N I M ,f t « » - I M O ' « - M i » M N- • - c o i n a i n S N S S a S e S ' O O ' O ' O S ^ m m> eo MS O' eo in m> »» M> ^ eo in «“ m in n > * i * t o o < 0 ' i i n i n i n i n
w- CM CM CM CM CM CM m K l m CM CM CM CM CM CM ■ - CM » - « - CM ■ - « - « - « - « - « -
£ 8 3( M i n T > ' > i n i n < o o < - i n c M N Q i M O i n p a c O ' C M f M i n i n i n o o m c M M i n i n S M i n c o s N o m 4 4 < o i n i M S i n o > o oo 0' i n < O K i m c M ' i m M ' t M i n M e o N o o > S h . S M ' 0 ' t ' 0N ' # * - ' » o i n c M m c M ^ o e o o o e o o < o i n i n « c i n i n
m cm cm cm m m cm m cm cm cm cm cm cm cm « - cm « - » - « - « - « - * - * - * -
j 2 I ; o» ( M i M i n « c M < c o > o « < q o o o i n O ' O C M C M i n K i n < - o o q o i n f O « M | n o 4 C 9 C M C M N ' * < - m o p > f - N N c i n c o >c « n h . » - M O ^ O ' i ( M i n T - K » < M K » M '0 < o K > s < - < 3 o < o o > i n a > # S i n a o e O ' 0 o> eo K> eo n>'O in in <o m
C M C M C M C M C M C M C M C M C M C M C M » - » - w - « — » -
3 3 £o i M i M < - n o > i n o M o a ) * - * > a i * f - o i n c M i M i M i M O > i n S r n p ,O M N N O K ) i M S < o ^ r ' 9 r ^ V ' * * , ~ ( o < - N N <« i n O ' C i a M O M a i n o M a i n o M N ' O i n o m c a i n N * c h > < c i . < M j n i n u i ' C « i n K 4 N K S o i f t « « » M M
6 3 ^< i ^ ' t o i n N o q ^ m ' i n o t o i o p o q ' 0 ' ( M ' O o > « i n o N < - n M S M O O ' O N i n i n ^ M M i O M N i M ' 0 < o * - i n < o m i n a i n K ^ a « n n 0 i n K i n a < * o > 4 c o o N o o i n S i n ' O i n i n i n i n i o * c i n < o i n i f l ' O ' C M ' t ' O ' C ' d M C O ' C p -( M r - r - r - r - * - r - r - i - r - r - r - r -
5 * 2o « - ' # m m » - ' * N . ^ ' t » o i n c M i w » - i n o o * - c M C M ' 0 » - o o i n i n i n c M o i n o o o O ' 0 « - i n i n « - N > r ^ « - i n O " » c M i n o * * ' ' Q i n i n < 0 4 < 0 M M 4 N i n N i M « n | 0 i n N < c ' t N M N ' i M M « ' * v i ' r s r i n j n i n i r | M < « | 0 ' t | d i n N M a i n o < 0
|C S 3* > < p r > o a ' C f O c o r - 0 ' t - « ) O N r > c M o o « - 0 " O o i n i M O ' i n c M i o < « a i n c o o i n » ' 0 , ' c o a o 4 ' 0 0 ' * i n o c o < - M1 i n ' 0 ' t i n M ' 0 ' t ' 0 i n ' 0 i M i n i n < 0 M ' 0 ' f ' C 0 ' C 4 < « M i n < 0 ' i i n ' C i n i n i n i n i n i n i n S ^ c o m a M O ' O O O
3 8 ?i n « - i n ' 0 ' j - C M i n ' 0 ' 0 i n N . r M i n N . N . C M 0 ' » - i n » - N . Q i n « - ' 0 f M 0 ‘ P ' N . N . i n O v i - 0 0 f ^ * - ' 0 ' f 0 ' ' 0 ' 0 i n o i n 0 0 ' 0 0 0 ' 0 •c i n 4 4 K 4 ' 0 ^ « ' i N ' i i n i n i n i n i n < « ' C « ' i « * c < o i n F > k « < 0 ' t m i n i n K < f ' O & ' i n o i n N ' C i M M o s
r - ^ » - ^ T - t - r - T - «— CM CM CM CM
{M O g
• - s c M i n K ' Q M M i n ' 0 » * ( M i M « - 0 ' K N * * o o o » ( M i M M M e g i - q ' q O ' » * ' t , - ' i o o i n i n e o M M « N O > M i n ' t O i n t t i n ' O i n O ' C M ' t ' O M i n M ' O M ' C i n M O i n c O ' - ^ a N ^ e o o a m o K e o « - <o cm i n i n «o >o K> o> o
* - * - * - « - CM « - CM « - « - « - CM CM CM CM CM CM « -
fc 3 -m «-* ?C M >* C M » -S .; -O sf£ w e O C M N .C M * * p N -« -e O C M > » N .; y»-»*M >inCM CON .oeOCM eO vgrs lO O ' » - £ » I ^ O ' 0 0 > O C M ' P in < e O ' M O ' i n K s o ' N K i n ' O M ' O M K ' * in S . in K. ^ cm s . «- «o in in ^ in *- eo cm a 0 4 C M K o N O > i n < ? < o M
» • « - n < - c m « - n t > c m < - cm cm T > iM ' - i M < - i n t n « - m « -
8 R 38v O K M M ' t l M ' t l M C M O 0 > » K i a i n O O r * O K i q o p i M i n i n | n Q i n < q S r > P ' N r ' N O 0 ' O 0 " 0 I M e 0 v ’ < 0 0 ' S
N C M ' O N ' 0 ^ ' 0 0 ' O c o i n N * e n i n e o i n ' O O ' O O S ^ ' t i n S ^ e o a e o N K e O ' t ' C i n M n i n M ' i i n ' C M ^C M C M C M C M » - « - * - « - * - CM CM * - CM *“ CM « - CM * - Kl * - CM « - • - « « - M • - M » - « « - M » -
K . eo J 2cm e o H
K i M i n M O i > m a K i o > N » r Q N ' * 4 ( 9 ^ * * ! f | 0 4 Q ' f ' 4 « - i n O ' | A a M < > o i n o e o , n O ' 0 4 i A ' Q i o i n i n e a » < o ' I i n C M m M k 3 i n i n K N N O * - i n a o a 0 " C » « N > - M I M ' O K O K O > ‘? 0 < q S O ' N C O O ' O ' - ' O k ? O S• * » - m * - i n « - i n « - cm cm cm « - cm cm cm cm v - m « - m « - m v - i n « - i n i n « - » - i n » * ' # » - M » - i n « - M ' -
CM O' ^M CM S
e o i n c O ' C e Q M a ^ c O ' t e o M e o < « c o < f a ' f e o i M c o < f e O ' t e O ' i e o ^ a M a ' t a ' t o o < t f e o , n e o * | a M e O M e O ' C a ' C c o cm (Mm c m m c m m i m k i cm m i m m i m m c m m cm cm m c m m c m m c m m n m i m m c m m cm in cm cMMCMMCMMCMMmincMcm c m S - c m S - c m S - c m S - c m S - c m S - c m S - c m S - cm cm K> cm K cm K cm K cm K cm K cm K - cm K cm cm K cm K. cm K» cm fc- cm S - cm
^ x a e z s s s s a c ^ x z z x s z z z ^ s z x z s < < < < < < < < < < < < < < < < < < < < <S Q U i p i U Q I U Q I U Q U I O I i l O U I O l U O O U I O U I O U I Q U I O Z O U I O I I J Q U J O O Ul Q U J Q III O 111 O Ul O
M Z W X M S W Z M Z C A Z M X W Z U M X W S U X W Z M X U Z W X W X W v W Z U X U Z M Z W E W

mo iA inon(in
*38885! SCM«-CM CM
3NBOa4IAN» ( M ' O ' - M O M <0 CM CM CM O'OSin«*ocM,'lM 0 >tOM(MO <♦ CM « - * -
CMO'
'ON.fM'OO'N. '# •OrOOOM^IM «♦
0BO J900«* <03 m SKIOIO r - »“ CM
S T- T- 00 S- N- CMM I M O C O I M i n u .
« • u W*"(M « *”
^OSONNr’lOK.MeoMcoN n3
! 1> K O ' K O ' N O ' S O ' K O > S O ' N O ' S K N O i M > S O N I > S O K O N ( X N » K u. N »o i n o i n o i n o i n o i n o i n o i n o o i n o i n o i n o i n o i n o i n o i n o i n o o i n
Si O O'm in m« * f . T > ^ m K N o i o N i n m Q t N M ' 0 ' - P ' S O > o ^ i M O > c o r i n o < o i n o S K i O ' T * i n M MSKi'OM'OMO*KieomoinKi> (C^in'0e0'0e0'»S'0'tp'0O»*oS
T- T“ (M ^ T- T— ^ T— CM T— CM ^ CM T- fn
3 *“ CMm ro o
S 0 ‘ e 0 « - M e M o i n < j 0 ' N i n N M p > » - ' C ' Q r - N i n ' - N i n 0 < 0 > > 0 ' 0 » t v i M » - ’- m i n ( >MO''»ooo»mioMMin«»eoNs r*|H r : M T”jr!0 r:'0 !n,,“;5*,,H ^ fc1” r.zz.«■ ^ ^ fM (VI CM CM t* CM CM CO3 8 £
t- « - * - t- ^ T- CM t- t—CMt—CMt- C M t—CMt—CM CM» - CM Kl T- CMM
eo *n IS.3MinNO'OMS'tinT>MNN<oiMiMCOMininin<o«-ininoMeoM>es<oiM^ml'> 't*t'tMin*tMininO'eo»*eoincM insrcaS.(\iscMO>»-'-MO>«-'ON«—i- eo ot— t— t— t— i— CM CM t- «- CM CM«-IM*-IM«-K|t-IMt-M»-'4,t- t-
3« c j— •”(
m e o s - ' 0 » - r n » - f M » - M ' » » - ' O e g N . c M » a ' 0 ' > o - 4 - 0 > s - i n i n ' j - T - T - T - > o o i n c M e O ' 4 - ' 0 ' 0 ' t ' C M M M ' O i n S « o n M O > a o < e < 0 4 S c o e a e o e a o o M O » M S i - o e o o
f " r r *■ cm N CM» - T - CM CM CM CM T - K l T - K l M >*• t - t- K lS O
'Oe 0 i n c M i ^ r » 0 * ' ^ > > t o 0 » 0 ' r ^ 0 » r - M e 0 0 ' T - T - T - o e g 0 ' i n « - « - 0 > O ' 0 > 4 - i n ' 0 > * ' S . c M
m M ' O M ' K - i n o a T - e o c M C O M e o in co s» eo eo eo m> eo o* o» eo eo *- s - eo o O' S-CM CM CM CM T- CM CM CM CM INI CM M M T- M
o i nM i t
2 t m n O ' ^ v O < O N N a m i n ^ $ M M N ^ e o M N i n e o a S K N f M N ' O i M ^ q N K N ' # ' O i n c o i n o > S i M O > ( M S e o O ' *- i n N ki MS m *4 in -4 -4 M» m in O' eo cm cm O 'co» - t- t- « - CM CM CM «— CM CM CM CM CM CM n i Kl T- CM
*-0'«o»-eoNss n a M K j i n - 4
s-MOMO"0 <0 »- CM CM
N Q i n MNO'cm k i t- i
i n ,
3
inaopQOrin cm cm i n » - « -
IMO'CMCMeO'O CM M'0 »-ON<# in cm m «- in t- t-Rm s» o> s> ^ m >*■ cm «-in CM CMN.
p'C M O 'N O »N ^K S. o cm rn O' in o>CM t- m t- m *- CMm
b o o c m O ' OCM4Mo8>I$S n«-M m»-
sNNirt«aoo<oK>'# 'O Kl in in cm cm m f n ^ m t- k i t- r *
r n
SKSS8S 8m«-*4'r-rn«- «-8coinmN«sn O'
CM 4 M >4 S K K lcm
CM
S. CM K» CM K. CM CM
sz s s N, 8
l p > 'Q in « - 0 > P 'C M K I 't » - f M O K I K |T - C M O O f n 'O S - T - C M e O e O '4 ' ' 4 - K lS - « 4 0 > e O N .K I K IO S . eO <4 co *4 s » i n o eo cm eo cm i n cm i n e 0 M e a « - 4 < - 4 O 4 ( M i n T - K i N K i ' t ' 0i— »- »- CM CM CM CM CMCMCMCMCMCMCMCM CM
2
3 =
8
3 r'Jvnepoea«4'0»-infM>i-fMN-CMT-ocM»-0.T-eg«0'0*0'»iS-»-ms;T-po'0incMCM»- n s»4S'CNinaKftSio<e»4 ■na<on'C»'CaKi04«9K)»4N'0 in oS 3 00 in0» O' CMs (M4'4’CMinfMh>0 '0«-tnminintnO'T-0'OCMtnco^eO'4«-r~eoinT-v>eopincMCMO (0**inS<#<Oin<0 '»K4 'OIOKKI 'tNlCl'OMSMNMSCM'OMNMO eo O'
§ § CMo
n p T > 4 ' r O ' - 4 0 " - ' t < 0 0 4 i - < O i n O ' - K < O S 4 I M K I O » K « n N « N M V inONinn4uin4Ki«icijn'« 4jt'»4Kij£nujiMtfj(Mj£(M4Minn ki in■4- rnin 'O
l o n ^ O ' M e o i n K 4 n e o i n p i n O ' T - e o N v ) K i o s i n S N c o O ' n K O « - < o < o * * K N Njg04'}MKIKlrn4N4MfnN IO N Kl NKI N KINCM N r* NIM NK) NKI Kl rneo CM
l m i n p o ' < J C M N . ' 4 i n - 4 S - T - » - o s - T - T - » - p > e o W ' » T - K i e o e O ' » e o p ' ' 4 ' ' O K i o R o « — CM fc. O* >4 «4 CM CM CM W CM KS CM 4 Kl CM K|T-CMT-CM«-KI»-fMT-fMOnjOfMOfM m T -
4 CMK o < o e o ( M T - N O S 4 » 4 o e o i n ^ T - » - i n o r n m e o 4 e o N « O f n K ' - N N ^ s o K > 4 m T - 4 0 i M O i o < - K i o i n o i M c m o c m o c m o >c m o c m O'Cm o c m o o c m o >cm cm eo
8 8 ' O n O ' O i n S 4 * - ( M N 0 4 S ' - T - c o p ' K i o K N 4 m S N K i e a K i n 4 ' * 0 ' eo egI A < - 4 0 ' N e O N O > m » m C O N » N i - S * > C 0 < - K I m K ' N K > C M 9 * > ' O ' > S « - t-
! fc RS ' t f l ' O i M u i c M N m Q i n m ' - ' t ' O *- o «o O' in eo o in o cms» rn m cMin o mi «- cm
0 4 S m S K i ' 0 ( M M » * ' 0 ( M ' f i ' “ C M i n » - i n » - i n c M i n « - i n » - i n « - i n T - i n « - cm in
1 S uiC M C M O > < -rn 'O e0 K i< p T -N .s .K i 'P 'O m m m « « i n n s N *• » i n a i M i M < q o > i m ncm mi n i in cm in cm in in in cm in « - 4 «- ^ m * - M * - i n « “ m « - r n n » * i n » ’ 4 ' - t - cm
: ’.........................f c ................................................ a
- s s s i a i s i s i s s s i a a g s ^ a s a i a l a s s s a g a 322 3 3* £ 2
CO

I - XU- UUl <
S O S » S « N » S » N » M ) i S - i N » N » N O t M > N O > N » K » N » N a N o i n o u i o i n o i n o i n o i n o i n o o i n o i n o i n o i n o i n a i n o i n o i n o o
O' O'i n i n
v Q K i n i e p « - » - f n c p i n i n S . » - f v i n 4 * - m n i 4 e o O ' i n 0 4 i n p o e o o w - « - ' O i n * “ ' 0 n K J ^ M a 4 O 4 a 4 < 0 K J 0 > r 2 n ^ 0 > m 0 > 4 C 9 4 S N 4 n K i n M 0 K N 4eo r*M K
< o » o s ; N O N N o n n « K o , ’ S N o e o 4 i n o n o i 0 4 < - n n 4 S 4 n« # S K I » " 0 > O f K K f ' 0 » * 0 > 0 > 0 r > i n O K ) n 0 4 0 ' N O n O K I O O N a N Kl
S N O K i 4 0 r o < o o u j ' - N e o a ^ n e o K i n i n e o < o e o o ' 0 ' 0 < - o i n i n ( M O 4 C T O > O O K l S ( \ J » - O C O » - * - i n S O ^ O i n e O N K I O K l T - K I I M K I ^ N O N Kl
IM t* I M < - »—»—»— r* r* 1-
S3 4N ^
' O O I M i n O S 4 » - e O K I ( M « - < J ( M > 0 * " M » - ' O e O O ( M M M f - 0 4 ' - 4 N 4 K t S , * < 0 O K I K I ' - K i e O O e O a i O O N O ' e O S N S 0 4 < 0 4 i n N n N m 4 K I 4 l 0 4 N 4t - K I » " K I « - ( M ( M ( M « - C M » * ( M CM « - «— T- f r * < - cM> S-
» - Kle 0 4 h > 4 e 0 N > m e 0 4 C 0 » o e 0 ' 0 S > (NI0 ' C M 4 S > 4 i n i n i n S > e 0 m < - N > s > M } O ' 0 * ~ m o o S > 0 4 0 i n i M ( M e o o c i n ' 0 * - o o » - N - « — 4 i n K i K i K i K i i n K i i n K i M 3 f M k i» * K I CM t - ( \ | i - (VI r - f\J CM t - (M i— r - t— f - * - t— r - »— p> r— t - «—
Ml OM3b P >? 9 $ 4 4 0|n|n4iMoeoinN ino«-N'Om(Meocoi04<osmK'-op'<o coSNOO>inN4SKiO>iOKiin'0 in«—Kieo«-ininKiKi4KimKiKKiOKl 4CM CM CM CM CM CM f " (\J r - T— (M t - T— i - t- r * • • r - «“ t »k eo4 eo
SO 4 i n * 4 M W S 4 M 4 Q M 0 N » - 4 ' 0 O M ( M i n 4 S M < l < 0 C M ' 0 « - « - W , ' » i n N 4 N C M i n ^ 4 0 ' O M M K I K I • * I O O O N < O i n i n 4 i n i n ' 0 4 S 4 0 I O 4CM CM CM CM CM CM « - CM « — f « - T - t - 1 - r - CM
>OCM44pnifM»s-NOKiS>T-inin(Nleornh*(M4CMinS>CMmO'rMoeocMincM( s c M N o s o > i n e 0 4 N i n e o K e O ' 0 o > e o K - e o e o ^ m i n 4 M 3 K i h - 4 e o 4 K i M 3CM CM t- »— » - r - i - t - r - » - T - ( M
4 CMO 4e04e00'CM«-*'Ctn mv-iMCM'P'0*~«-4«-M)S>0'O'0T-inh>ocMe04«-r0rv<4
i o e 0 i n < 4 4 S 4 S i M i n m i n 4 < o i n N> Ml S» s. N » i n i n i n 4 Ml ki eo 4 o 4 0"0 <oo oM3 OSuieOKJ'0<OKIO(MNO» KCM,~<-NOin4IOIM4eOniMOCMO>04KmO' 'OS4<04inn4Ki4iMnininin in in 4 in 4 m 4 m ki K. 4 o» 4 cm m> 4 o eo
K r * * - ^ i - » • I M Kl » -eo O'in in« - K i i n i n M 3 C M ' p » - 4 » - i n K i « - S . S . ’- o e o i n K i » - » - i n S - O M 3 » - e o c M e O ' - ' P 4 K , 0 ' 4 i n K I 4 K I 4 r 0 4 K I K I C M K I K I K I K I 4 4 Kl 4 Kl in Kl in 4 N in O' in in eo © O' eo
inCM
< - » O K l S 4 K I O K l T * C 0 0 " 0 4 S , ~ m 0 > e 0 S e 0 C M < - i n S < 0 i n ' 0 ' - < 0 * - < - 0 ' ' t <0 Kl CM Kl Kl Kl CM Kl CM Kl CM CM « - CM CM CM 4 Kl Kl 4 CM 4 Kl 4 Kl i n 4 K> 4 Kl Ml S» * - O^ ^ t- t— •— *— ( M K | T - » —
eo S-Kl Kl
s > e 0 ' 0 e 0 ' 0 0 ' f w K i r ^ K i c M N > K i i n o * ' e 0 0 ' C M 4 0 ' O N > K i « - c M C M 4 « ~ 4 ( M C M « - ' * e 0 C M O C M O K I * - 4 ' - K I O C M O C M « - K I Kl CM Kl Kl CM 4 CM 4 4 Ml 4 ^ Ul O S - 4 S» CM
^ T— W— T— T— T— CM CM T—e o i ncm o
e O r n S 4 K I O K . ' O p e O ( M O O C M ' ‘ K l l M O O M ) O M l » - e O K 1 4 e O M l K l N » - i n (' , 0* N » K I 0 4 0 i n O i n O I M O K 1 0 K l Kl «- Kl CM CM Kl CM Kl CM m 4 Ml in m Kl Ml Kl CO
r ^ ! f ! 2 ! ' 2 S 9 S ' » 2 N S 9 : r N , “ ,n N « i v i o e o S 4 K o o s e O K i ^ c M ^ , ‘ Ki N S N 0 4 O M I O i n O 4 a N O K l K l CM » - Kl • - CM CM Kl Kl 4 Kl Kl Kl 4 CM 4 4
eo k iO' CM
K K l M O | O K e O i n 4 » * 4 p i K l r i n i n 4 ^ i n 4 N . O ' i n e 0 4 4 0 * K 1 0 C M ^ * i n * " ' 0T -m r - M lK lM lK lM lK lS - K lS - K lN - f M CM eO Kl 60 Kl eO CM O' Kl O' Kl 00 Kl O 4 O' Kl Kl
M3 O'rw eo
» - i n S - o n j » - i n K i M 3 e o ^ M l c M » - i n O ' Kl ^ k i m 4 k i 4 i n o eo k i M3 O ' M l e o K l»*K 1 w 4 CM 4 C M tfl CM K1 * - 4 CM 4 CM » * 4 ^ 4 » * 4 i “ 4 ^ i n » - i n ^ , 4 ^ ' 0 » - CM
«nCO
< <
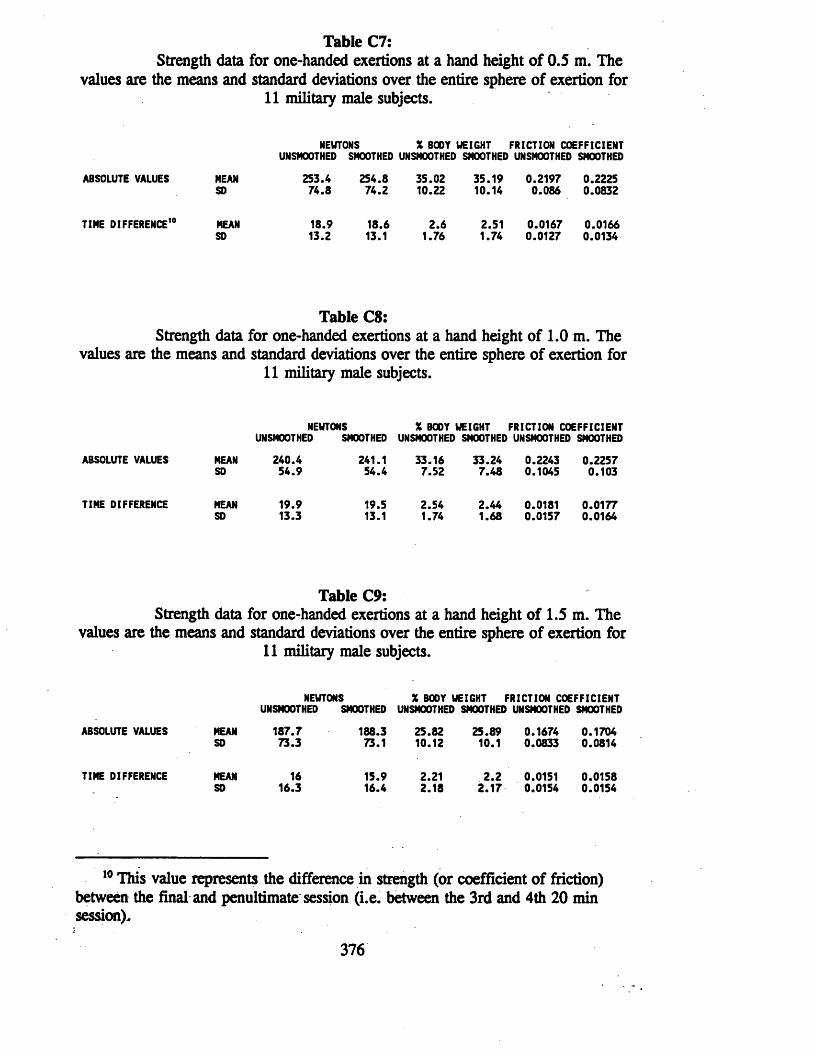
Table C7:Strength data for one-handed exertions at a hand height of 0.5 m. The
values are the means and standard deviations over the entire sphere of exertion for 11 military male subjects.
NEWTONS X BODY WEIGHT FRICTION COEFFICIENTUNSMOOTHED SMOOTHED UNSMOOTHED SMOOTHED UNSMOOTHED SMOOTHED
ABSOLUTE VALUES MEAN 253.4 254.8 35.02 35.19 0.2197 0.2225SO 74.8 74.2 10.22 10.14 0.086 0.0832
TIME DIFFERENCE10 MEAN 18.9 18.6 2.6 2.51 0.0167 0.0166SD 13.2 13.1 1.76 1.74 0.0127 0.0134
Table C8:Strength data for one-handed exertions at a hand height of 1.0 m. The
values are the means and standard deviations over the entire sphere of exertion for 11 military male subjects.
NEWTONS X BOOT WEIGHT FRICTION COEFFICIENTUNSMOOTHED SMOOTHED UNSMOOTHED SMOOTHED UNSMOOTHED SMOOTHED
ABSOLUTE VALUES MEAN 240.4 241.1 33.16 33.24 0.2243 0.2257SD 54.9 54.4 7.52 7.48 0.1045 0.103
TIME DIFFERENCE MEAN 19.9 19.5 2.54 2.44 0.0181 0.0177SD 13.3 13.1 1.74 1.68 0.0157 0.0164
Table C9:Strength data for one-handed exertions at a hand height of 1.5 m. The
values are the means and standard deviations over the entire sphere of exertion for 11 military male subjects.
NEWTONS
ABSOLUTE VALUES
TIME DIFFERENCE
X BODY WEIGHT FRICTION COEFFICIENTUNSMOOTHED SMOOTHED UNSMOOTHED SMOOTHED UNSMOOTHED SMOOTHED
MEAN 187.7 188.3 25.82 25.89 0.1674 0.1704SD 73.3 73.1 10.12 10.1 0.0833 0.0814
MEAN 16 15.9 2.21 2.2 0.0151 0.0158SD 16.3 16.4 2.18 2.17 0.0154 0.0154
10 This value represents the difference in strength (or coefficient of friction) between the final and penultimate session (i.e. between the 3rd and 4th 20 min session),
376

APPENDIX D
SUMMARY DATA FOR CHAPTER 6

Zable Dl:Dynamic and Static Lifting strength at Shoulder Height. (Data in
Newtons).
Hands Resistance Male<n=9)
Female<n=9)
Group<n=18)
Mean SE Mean SE Mean SE
ONE-HANDED
Low 64 7 41 9 53 6Medium 89 15 68 13 79 10Heavy 89 11 70 12 80 8Isometric 185 26 118 17 152 17
TWO-HANDED
Low 164 21 85 11 125 15Medium 164 23 106 15 134 15Heavy 193 21 98 14 146 17Isometric 386 37 257 39 322 30
Zable D2tDynamic and Static Lifting Strength at Elbow Height. (Data in
Newtons).
Hands Resistance Male<n=9)
Female<n=9)
Group<n*18)
Mean SE Mean SE Mean SE
ONE-HANDED
Low 162 11 72 10 117 13Medium 163 14 81 8 122 13Heavy 173 10 90 8 132 12Isometric 280 31 162 24 221 24
TWO-HANDED
Low 298 15 128 26 213 25Medium 329 24 159 21 244 26Heavy 330 27 170 18 250 25Isometric 521 47 299 34 410 39
378

T a b le D 3:Dynamic and Static Lifting Strength at Hip Height. (Data in Newtons).
Hands R e s i s t a n c e II H e F em ale<n=9)
Group<n*18)
Mean SE Mean SE Mean SE
ONE-HANDED
Low 229 17 115 18 172 18Medium 260 19 134 23 197 21H eavy 300 22 156 20 228 23I s o m e t r ic 378 48 238 42 308 35
TWO-HANDED
Low 375 26 180 27 278 30Medium 420 30 202 23 311 32H eavy 495 28 223 30 359 38I s o m e t r ic 844 77 447 68 646 69
T a b le D4:Dynamic and Static Lifting Strength at Knuckle Height. (Data in
Newtons).
Hands R e s i s t a n c e
a? II H e F em ale
(n =9)Group<n=18)
Mean SE Mean SE Mean SE
ONE-HANDED
Low 285 24 150 28 217 24Medium 323 27 181 32 252 27H eavy 371 26 218 28 294 26I s o m e t r ic 530 36 312 51 425 40
TWO-HANDED
Low 423 28 229 36 326 32Medium 484 33 269 32 377 34H eavy 604 35 321 38 463 42I s o m e t r ic 1101 70 648 79 874 75
379

Table D5:Dynamic and Static Lifting Strength at Knee Height. (Data in
Newtons).
Hands R e s i s t a n c e M ale<n=9)
F esu ile(n=9)
Group<n=18)
Mean SE Mean SE Mean SE
ONE-HANDED
Low 301 40 159 38 230 32Medium 356 55 189 39 272 38H eavy 396 42 226 36 311 34I s o m e t r ic 536 32 320 51 427 39
TWO-HANDED
Low 401 40 184 37 292 37Medium 421 54 251 41 336 39Heavy 594 64 331 53 463 51I s o m e t r ic 862 78 506 74 684 68
380

Zable D6:Velocity of Dynamic Lift at Shoulder Height against the Low, Medium
and Heavy Resistances. (All data in mm/s).
Hands R e s i s t a n c e M ale(n -9 )
F em ale<n=9)
Group<n=18)
Mean SE Mean SE Mean SE
ONE-HANDED
Low 403 29 307 32 355 24Medium 337 33 299 30 318 22H eavy 195 17 182 18 189 12
TWO-HANDED
Low 645 44 457 43 551 38Medium 455 32 355 32 405 25H eavy 302 16 204 19 253 17
T a b le D7tVelocity of Dynamic Lift at Elbow Height against the Low, Medium and
Heavy Resistances. (All data in mm/s).
Hands R e s i s t a n c e M ale(n =9)
Fem ale(n =9 )
Group<n=18)
Mean SE Mean SE Mean SE
ONE-HANDED
Low 680 24 461 37 571 34Medium 475 24 346 19 410 22H eavy 299 10 222 16 260 13
TWO-HANDED
Low 917 29 579 78 748 57Medium 684 26 480 35 582 33Heavy 420 18 301 21 360 20
381
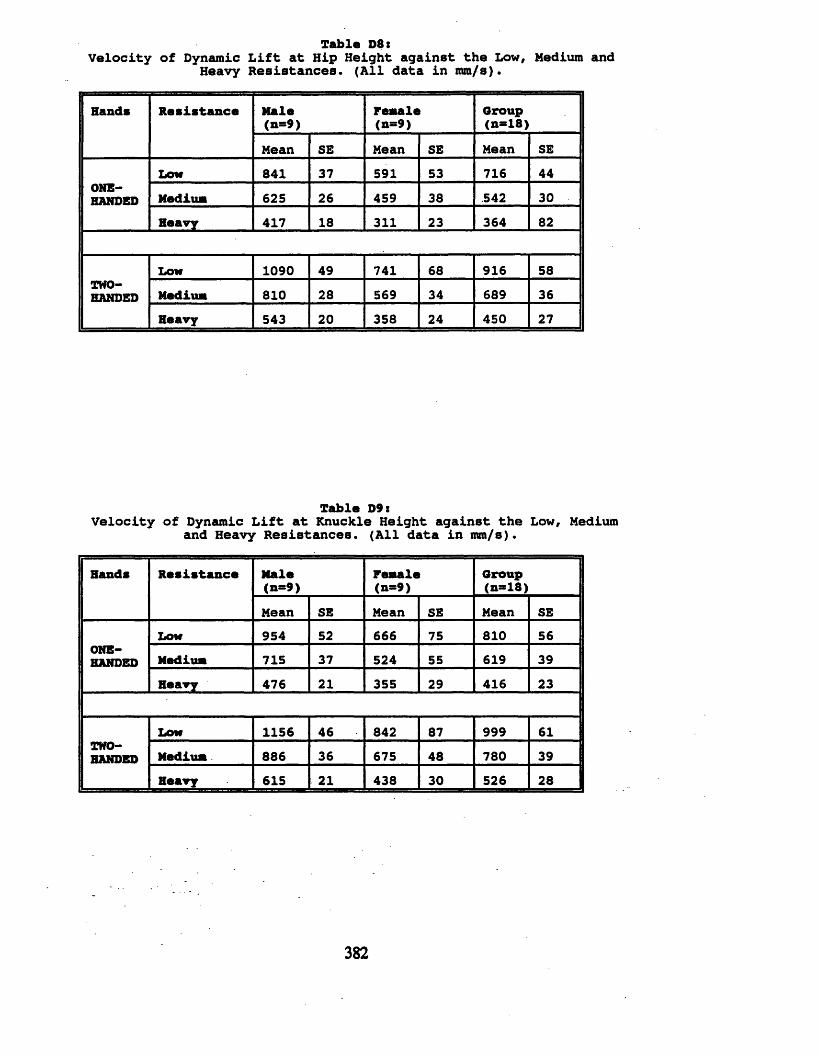
Table D8:Velocity of Dynamic Lift at Hip Height against the Low, Medium and
Heavy Resistances. (All data in mm/s).
Hands Resistance Male<n=9)
Female(n—9)Group<n»18)
Mean SE Mean SE Mean SE
ONE-HANDEDLow 841 37 591 53 716 44Medium 625 26 459 38 542 30Heavy 417 18 311 23 364 82
TWO-HANDED
Low 1090 49 741 68 916 58Medium 810 28 569 34 689 36Heavy 543 20 358 24 450 27
Zable D9:Velocity of Dynamic Lift at Knuckle Height against the Low, Medium
and Heavy Resistances. (All data in mm/s).
Hands Resistance Male(n=9) Female(n=9)Group(n»18)
Mean SE Mean SE Mean SE
ONE-HANDED
Low 954 52 666 75 810 56Medium 715 37 524 55 619 39Heavy 476 21 355 29 416 23
TWO-HANDED
Low 1156 46 842 87 999 61Medium. 886 36 675 48 780 39Heavy 615 21 438 30 526 28
382
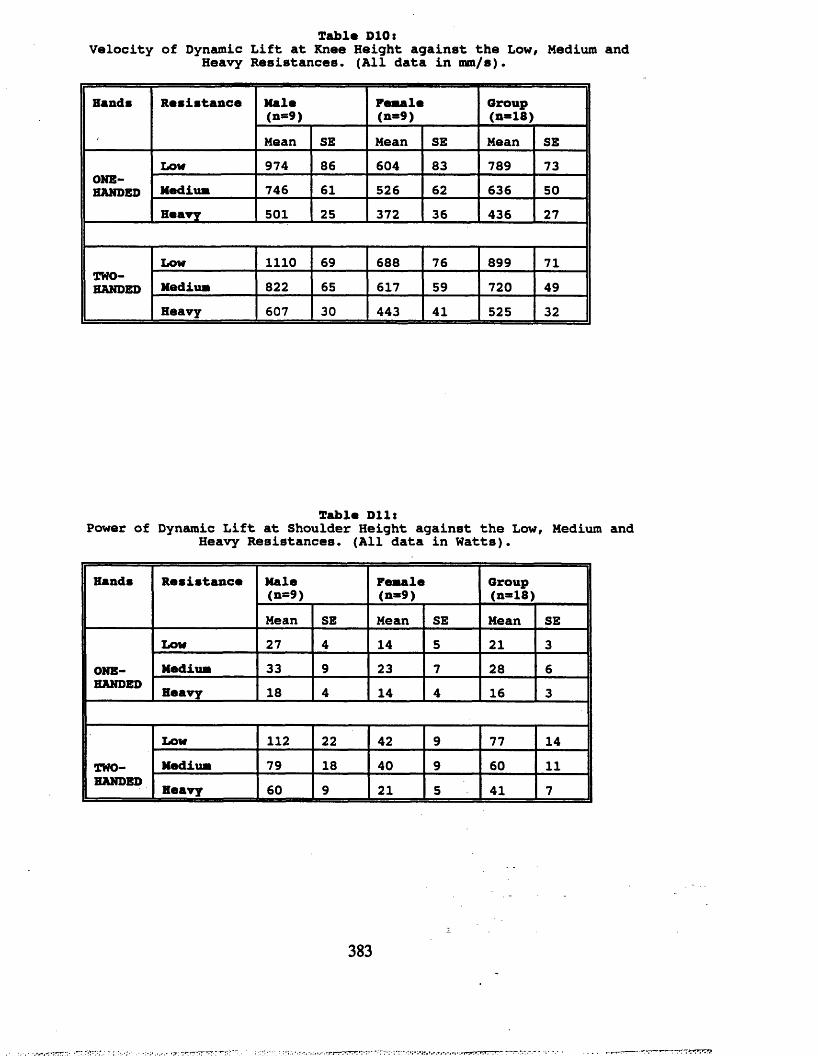
Table DIO<Velocity of Dynamic Lift at Knee Height against the Low, Medium and
Heavy Resistances. (All data in mm/s).
Hands R e s i s t a n c e M ale<n*9)
F t s a l t<n=9)
Group<n*18)
Mean SE Mean SE Mean SE
ONE-HANDED
Low 974 86 604 83 789 73Medium 746 61 526 62 636 50H eavy 501 25 372 36 436 27
TWO-HANDED
Low 1110 69 688 76 899 71Medium 822 65 617 59 720 49Heavy 607 30 443 41 525 32
Z a b le D l l :Power of Dynamic Lift at Shoulder Height against the Low, Medium and
Heavy Resistances. (All data in Watts).
Hands R e s i s t a n c e M ale<n=9)
F em ale( n -9 )
Group<n=18)
Mean SE Mean SE Mean SE
ONE-HANDED
Low 27 4 14 5 21 3Medium 33 9 23 7 28 6H eavy 18 4 14 4 16 3
TWO-HANDED
Low 112 22 42 9 77 14Medium 79 18 40 9 60 11H eavy 60 9 21 5 41 7
383

Table D12:Power of Dynamic Lift at Elbow Height against the Low, Medium and
Heavy Resistances. (All data in Watts).
Hands R e s i s t a n c e M ale<n=9)
Fem ale(0 * 9 )
Group(n =18)
Mean SE Mean SE Mean SE
ONE-HANDED
Low 112 11 36 8 74 11Medium 79 11 28 5 54 8Heavy 52 4 21 3 36 5
TWO-HANDED
Low 275 20 90 23 183 27Medium 228 23 82 16 155 22Heavy 141 15 54 8 97 13
T a b le D 13:Power of Dynamic Lift at Hip Height against the Low, Medium and Heavy
Resistances. (All data in Watts).
Hands R e s i s t a n c e M ale(n =9)
Fem ale<n*9)
Group<n=18)
Mean SE Mean SE Mean SE
ONE-HANDED
Low 196 21 75 17 136 20Medium 165 17 68 18 117 17H eavy 127 13 52 11 89 12
TWO-HANDED
Low 417 46 147 29 282 42Medium 344 35 120 20 232 34H eavy 271 22 85 16 178 26
384

Table D14:Power of Dynamic Lift at Knuckle Height against the Low, Medium and
Heavy Resistances. (All data in Watts).
Hands R e s is t a n c e M ale<n=9)
Fem ale(n -9 )
Group(n=i8)
Mean SE Mean SE Mean SE
ONE-HANDED
Low 281 33 116 31 198 30Medium 237 28 108 28 173 25Heavy 180 19 84 17 132 17
TWO-HANDED
Low 498 48 217 46 358 47Medium 436 47 193 34 315 41Heavy 375 31 149 25 262 34
andT a b le D15:
Power of Dynamic Lift at Knee Height against the Low, Medium Heavy Resistances. (All data in Watts).
Hands R e s is t a n c e M ale(n * 9 )
Fem ale(n * 9 )
Group(n a l8 )
Mean SE Mean SE Mean SE
ONE-HANDED
Low 320 60 121 38 220 42Medium 289 60 118 34 203 40Heavy 205 29 94 21 149 22
TWO-HANDED
Low 465 64 147 38 306 53Medium 373 67 174 42 273 45Heavy 374 55 163 34 269 41
385
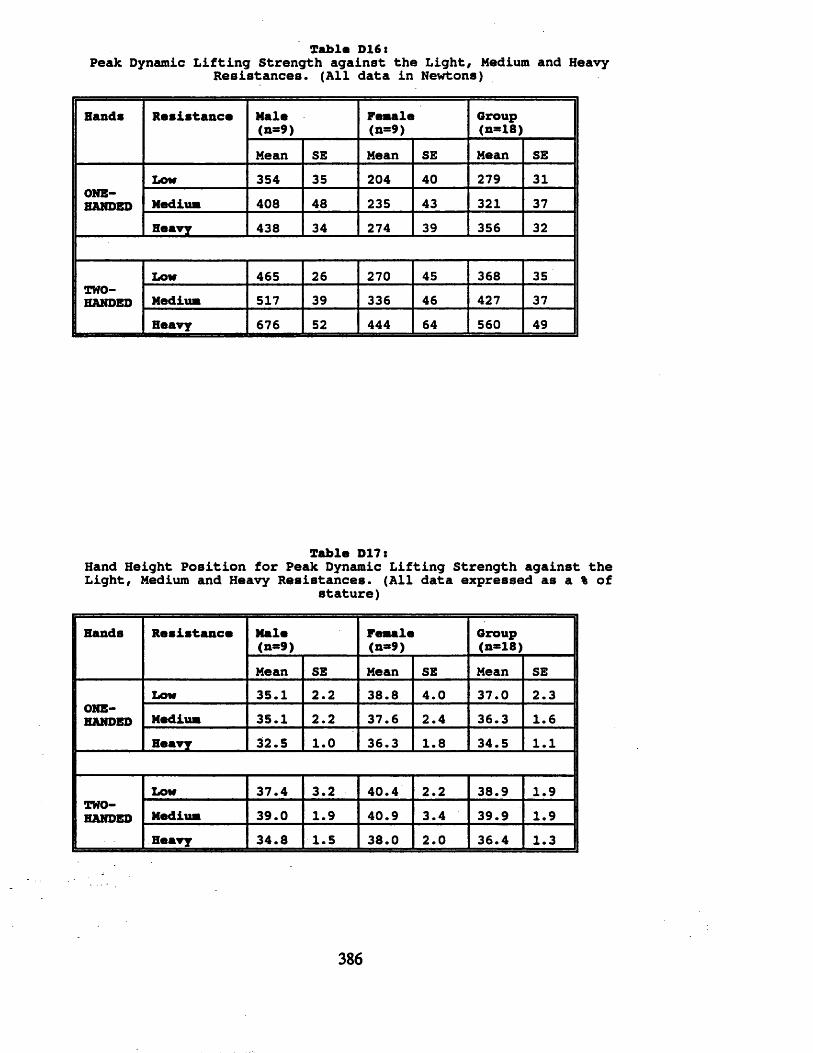
Zable D16tPeak Dynamic Lifting Strength against the Light, Medium and Heavy
Resistances. (All data in Newtons)
Hands Resistance Male<n=9)
Female<n=9)
Oroup<n=18)
Mean SE Mean SE Mean SE
ONE-HANDED
Low 354 35 204 40 279 31Medium 408 48 235 43 321 37Heavy 438 34 274 39 356 32
ZWO-HANDED
Low 465 26 270 45 368 35Medium 517 39 336 46 427 37Heavy 676 52 444 64 560 49
Zable D17:Hand Height Position for Peak Dynamic Lifting Strength against the Light, Medium and Heavy Resistances. (All data expressed as a % of
stature)
Hands Resistance Male(n*9)
Female<n=9)
Oroup<n=18)
Mean SE Mean SE Mean SE
ONE-HANDED
Low 35.1 2.2 38.8 4.0 37.0 2.3Medium 35.1 2.2 37.6 2.4 36.3 1.6Heavy 32.5 1.0 36.3 1.8 34.5 1.1
Low 37.4 3.2 40.4 2.2 38.9 1.9I ZWO- | HANDED Medium 39.0 1.9 40.9 3.4 39.9 1.9
Heavy 34.8 1.5 38.0 2.0 36.4 1.3
386

Table D18:Peak Velocity of Lift against the Light, Medium and Heavy
Resistances. (All data in ran/s)
Hands R e s i s t a n c e II H e F em ale<n»9)
Oroup< n -18)
Mean SE Mean SE Mean SE
ONE-HANDED
Low 1090 66 784 96 937 68Medium 819 49 620 66 719 46H eavy 539 22 419 38 479 26
TWO-HANDED
Low 1243 47 921 98 1082 66Medium 940 40 763 65 852 43H eavy 675 28 534 45 604 31
T a b le D19:Peak Power of Lift against the Light, Medium and Heavy Resistances.
(All data in Watts)
Hands R e s i s t a n c e M ale(n=9)
Fem ale(n =9)
Oroup<n=18)
Mean SE Mean SE Mean SE
ONE-HANDED
Low 394 54 186 48 290 43Medium 348 55 164 43 256 41H eavy 236 25 124 26 180 22
TWO-HANDED
Low 582 48 281 62 432 53Medium 492 58 277 54 384 47H eavy 460 51 256 52 358 43
387

500
n 400 zw 300 (DU 200 0
“ ■ 100
85 957555 654525 35Displacement of stature}
500
n 400 Zu 300<Du 200oLL 100
75 85 956545 5525 35Displacement ( % of stature}
500
400nzu 300<uuL0IL
200
100
9565 75 8535 45 5525Displacement C% o f stature}
Figure Dl: Force - displacement curves for one-handed dynamic lifts against the heavy, medium and light resistances (top, centre and lower figures respectively) on the hydrodynamometer. The top curve in each Figure represents the male data (mean +. SEM) and the lower curve the female data.
388

800
£ 600\ j<D 400 uL£ 200
55 9535 45 65 75 8525Displacement C* of s ta tu r e }
800
600r\Z\J
400d)uL0IL 200
45 55 75 9525 35 65 85Displacement (% o f s ta tu r e }
800
£ 600 \ j<D 400 uL£ 200
85 957525 45 55 6535Displacement C9S o f s ta tu r e }
Figure D2: Force - displacement curves for two-handed dynamic lifts against the heavy, medium and light resistances (top, centre and lower figures respectively) on the hydrodynamometer. The top curve in each Figure represents the male data (mean +. SEM) and the lower curve the female data.
389

25 35 45 55 65 75 85 95Displacement C& of s ta t .}
C><r\tn\ 10
5 8
* 6-Mo 4° 20> 0
9575 856525 35 45 55D isplacem ent £% o f s t a t )
CX 1003nin\ 10
E 8 kj
x 6
“ 4
2
075 85 9555 6535 4525
Displacem ent (fc o f s t a t O
Figure D3: Velocity - displacement curves for one-handed dynamic lifts against the heavy, medium and light resistances (top, centre and lower figures respectively) on th& hydrodynamometer. The top curve in each Figure represents the male data (mean +. SEM) and the lower curve the female data.

25 35 45 55 65 75 85 95Displacement of s ta t .}
Cx loo;r\™ 1 2
| 1 0
u 8 2 6
u 4- 2 0)> 0
958565 7535 45 5525Displacement C& of statO
CX 100^ n " 12§ 10w 8x c +J 6
U 4- 2<D> 0
958535 45 55 65 7525Displacement ( % o f statO
Figure D4: Velocity - displacement curves for two-handed dynamic lifts against the heavy, medium and light resistances (top, centre and lower figures respectively) on the hydrodynamometer. The top curve in each Figure represents the male data (mean ± SEM) and the lower curve the female data.

500
n 40° £u 300L® 200 0H 100
8575 9555 65453525Displacement Q% o f s t a t O
500
n ^00 £u 300L® 200 ocl 100
75 8555 65 95453525Displacement C* of s t a t O
500
n 400 £u 300L® 200 0CL 100
85 957545 55 6525 35Displacement C* of s t a t O
Figure DS: Power - displacement curves for one-handed dynamic lifts against the heavy, medium and light resistances (top, centre and lower figures respectively) on the hydrodynamometer. The top curve in each Figure represents the male data (mean +. SEM) and the lower curve the female data.
392

600
500
8 400
l 300 <DI 200 a 100
45 55 65 75 85 9525 35Displacement Q% o f s t a t O
600
500
8 400l 300 (DI 200 a 100
4525 35 55 65 75 85 95Displacement C& o f s t a t O
35 45 55 65 75 85 95Displacement {% o f s t a t O
Figure D6: Power - displacement curves for two-handed dynamic lifts against the heavy, medium and light resistances (top, centre and lower figures respectively) on the hydrodynamometer. The top curve in each Figure represents the male data (mean +. SEM) and the lower curve the female data.
393

50D
40D
z 300LJ0Oo 200UL
Heavy Med I um Light100
25 35 45 55 65 75 85 95Displacement (i% of stature}
figure D7: Force - displacement curves for dynamic lifts against the heavy, medium and light resistances on the hydrodynamometer. The curves were derived from force data averaged over the one and two-handed conditions for the 18 subjects.
394
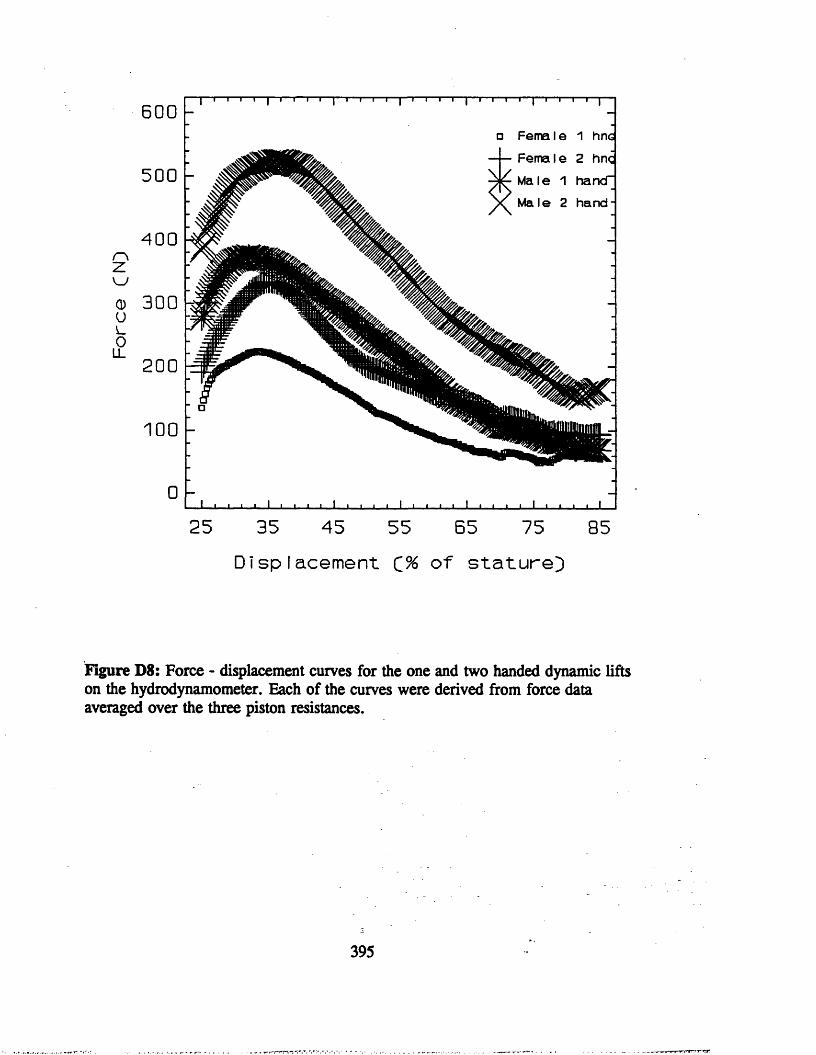
□ F e m a l e 1 h n G
F e m a l e 2 hnc
M a l e 1 h a n c T
M a l e 2 h a n d -
0 300
25 35 45 55 65 75 85D isp lacem ent (% o f s t a t u r e }
Figure D8: Force - displacement curves for the one and two handed dynamic lifts on the hydrodynamometer. Each of the curves were derived from force data averaged over the three piston resistances.
395

PREDICTION OF MAXIMAL LIFTING CAPABILITY
IN MALE ARMY RECRUITS
by
A Duggan and S J Legg
The following is a description of subjects and methods employed in a study
of the prediction of maximal lifting capability in male armyrecruits. The study was
carried out by the Army Personel Research Establishment and presented as a draft
report to APRE by A Duggan and S.J. Legg.
METHODS
Subjects
The subjects were 384 Artillery and Infantry recruits to the British Army who
were within one week of the commencement of their basic military training. They
all gave informed consent to participation in the study. The recruits were of mean
(SD) age 19.8 (1.9) y, weight 66.5 (8.8) kg and height 1.74 (0.07) m.
Experimental Design
The following test battery was performed in the following order within a period of
approximately 20 minutes: isometric strength of the elbow flexors, knee extensors
and trunk extensors, grip strength, isometric upright pulls on bars 0.38 m and 0.85
m above ground level, isokinetic upright pulls at 30 and 180 degrees/s, quasi-
isokinetic upright pull, isoresistive upright pull, and the IDL(1.52). On all of the
above tests with the exception of the IDL(1.52) subjects made a submaximal
practice effort followed by two maximal efforts separated by a rest of
approximately 30-60 seconds; the test score was taken as the higher of the two
maximal efforts. Within a few days of the above tests, simple anthropometric and
body composition measurements were made and subjects performed the
396

gymnasium tests from the current Army Physical Fitness Assessment ie a standing
vertical jump, trunk curls, heaves and dips.
Procedures
Isometric Elbow Flexion, Knee Extension and Trunk Extension Strengths
Strengths in these muscle groups were measured by strain gauge dynamometry
using apparatus described by Hermansen et al (1974). Elbow flexion strength was
measured on the right side of the body. The subject was seated with his elbow
resting on a metal plate and the elbow angle at 90 degrees. The pronated hand
gripped a horizontal handle against which the subject made a maximal pull. For
the knee extension test the subject sat with his arms folded and his knees at an
angle of 90 degrees with the middle of the arches of his feet (whilst wearing
training shoes) pushing against a horizontal bar attached to a strain gauge. He sat
back as far as possible in the seat and leant forward slightly prior to and during
application of maximal force to the bar. For the trunk extension test, the subject
stood upright with knees locked straight and he pushed back against a strap around
his thorax at a height 2-3 cm above the nipples.
Grip Strength
Grip strength of the right hand was measured using a handgrip dynamometer (MIE
Co Ltd). The gap between the bars was 3 cm. The measurement was made with
the subject standing with his arm hanging by his side.
397
0.38 m Upright Pull
This test was based upon that described by Knapik et al (1981). The equipment
comprised a 0.32 m long horizontal handlebar connected by a vertical chain to an
isometric dynamometer (Takei back muscle dynamometer) which was bolted to a
metal baseplate. The handlebar was 0.38 m above the baseplate. The subject
stood on the baseplate with his feet apart and to either side of the dynamometer.
He adopted a squatting posture with his knees and hips flexed, back straight and
head looking straight forward. With elbows fully extended and using a double
overhand grip he held the handlebar. The subject was instructed to pull vertically
on the handlebar and, without jerking, to build up to maximal force after 2-3
seconds. The highest force developed during the pull was displayed on the
dynamometer’s digital display.
0.85 m Upright Pull
Using an overhand grip the subject pulled vertically upwards on a straight
horizontal handlebar fixed immediately in front of him at a height of 0.85 m above
ground level. The handlebar was attached by a shaft to one end of a lever arm.
The other end of the lever arm exerted a force onto the pan of a man-weighing
balance when the subject pulled upwards on the handlebar. The subject was
instructed to pull up without jerking and to maintain maximum force for 5
seconds. The test administrator monitored the display on the balance and took the
test score as the maximum force that was sustained on the balance over the 5
second period.
Isokinetic Upright Pulls
These tests used an isokinetic dynamometer (Cybex II) which had been modified in
a manner similar to that described by Aghazadeh and Ayoub (1985) to enable it to
398

be used for the measurement of upright pull strength. Thus, a drum (0.3 m
diameter) was attached to the shaft of the dynamometer. A steel rope was
attached to and wound around the drum at one end and passed via 2 pulleys to a
horizontal handlebar to which it was connected at the other end. This allowed the
isokinetic dynamometer, normally employed for measuring activity in a circular
path, to be used to measure the dynamic force exerted in a linear vertical upright
pull. The modified dynamometer was calibrated by the application of known loads
to the handlebar and the unit of measurement used was the kilogramme.
Initially the handlebar was positioned on a rest 0.25 m above ground level. The
subject held the handlebar having adopted the posture described above for the
0.38 m upright pull and was instructed to make a maximal upright pull on the
handlebar until it reached chest height. In performing this manoeuvre the subject
extended both the knees and hips and by the end of the pull was standing up
straight with elbows flexed. The peak force developed during the pull was
displayed on a digital peak hold display and recorded.
The above procedure was carried out for 2 separate tests: the first with the drum
rotating at 30 degrees/second (giving a lifting speed of 0.08 m/s) and the second
with it rotating at 180 degrees/second (lifting speed of 0.47 m/s).
The utilisation of an isokinetic dynamometer for these lifting tests led to them
being described as "isokinetic upright pulls". It should be noted, however, that
the term "isokinetic” is usually used to describe contractions in which the angular
velocity of the joint is constant. In these pull tests the isokinetic dynamometer
was used in such a manner that the speed at which the metal rope uncoiled and
hence speed at which the lift took place were constant but the angular velocities of
the various joints involved varied during the course of the lifts.
399

Quasi-isokinetic lift test (QjLI)
This test utilised an ergometer (H&M Engineering, Brynmawr, Gwent) in which a
length of rope was uncoiled from a drum by pulling on one end of the rope. The
rate at which the rope uncoiled during the pull was restricted by a centrifugal
clutch mechanism. The ergometer measured the force exerted on the rope during
uncoiling.
A peak hold digital display was constructed to enable easy measurement of the
peak force developed during a pull. The ergometer was mounted on a baseplate
and the rope was fed over a pulley wheel on this. Above the pulley wheel was a
stand upon which a horizontal handlebar attached to the end of the rope rested at a
height of 0.25 m above the baseplate. The subject performed an upright pull test
on this device in the same manner as the isokinetic upright pulls described above.
The ergometer was not, however, truly isokinetic in nature and lifting speed was
found to increase to some extent with the force on the rope (eg at the setting used
in this study lift speed increased from approximately 0.75 m/s with an applied load
of 15 kg to approximately 1.0 m/s at a load of 50 kg).
Isoresistive Lift Test
This test utilised a Grieve dynamometer (Royal Free Hospital, London) in which
resistance to a single dynamic lifting action was provided by a leaky piston as it
was drawn through a column of water. A length of pre-stretched nylon rope was
attached to the piston at one end and passed through a pulley system to a
horizontal handlebar to which it was attached at the other end. The subject
performed a maximal upright pull on the handlebar as described above for the
isokinetic lift tests except that the initial height of the handlebar was in this case
0.4 m. A timer was triggered by optical sensors such that it started when the
400

handle reached a height of 0.7 m and stopped when the handlebar reached 1.0 m.
This allowed the calculation of lift velocity over that part of the lift.
The characteristic of the dynamometer has been described in Chapter 6. At 20
degrees C, the resistance of lift was 2 kN((m/s>2) but, because the viscosity of
water varies with temperature, the resistance varied slightly during the study. The
actual resistance was obtained for the measured water temperature by using the
manufacturer’s calibration table which had been derived by timing the fall of
known weights at different water temperature (Grieve, 1987). Power output was
calculated for each subject from velocity and resistance (including that arising
from the weight of the handle and apparent weight of the piston in water).
IDL(1.52)
The device used was based upon the weight lift machine described by McDaniel et
al (1983). It was a free standing machine with a weight carriage which rode
vertically between upright support channels on low friction teflon rollers. The
carried assembly weighed 18.2 kg (40 lb) and up to sixteen 4.5 kg (10 lb) weights
could be added by inserting a pin into a weight stack at the back of the carriage.
There was also the facility to add one 2.3 kg (5 lb) weight to the weight carriage.
There were horizontal handles to the front of the weight stack with which the stack
could be lifted. On the ends of the handles were knurled handgrips which rotated
on the shafts of the handles. The handgrips were separated by a 0.46 m gap to
allow room for the subjects knees. A mark was made on the upright support
channel and the carriage to indicate a weight carriage handle height above floor
level of 1.52 m.
The subject adopted a crouching posture with knees bent, back straight, toes on a
line below the carriage handgrips, hands holding the handgrips with an overhand
grip and arms straight. He then proceeded to lift the weight carriage by the
handles to the 1.52 m mark. On completing the lift, 2 supervisors assisted the
401

subject to lower the carriage. The initial lift of 18.2 kg (i.e. the carriage assembly
alone) was followed by lifts of 27.3 kg (60 lb) and 36.4 kg (80 lb), after which the
load was increased by 4.5 kg for each lift until the subject was unable to lift the
required height; the load was then reduced by 2.3 kg for the subject’s final lift.
The test score was the highest load lifted to the 1.52 m mark.
402
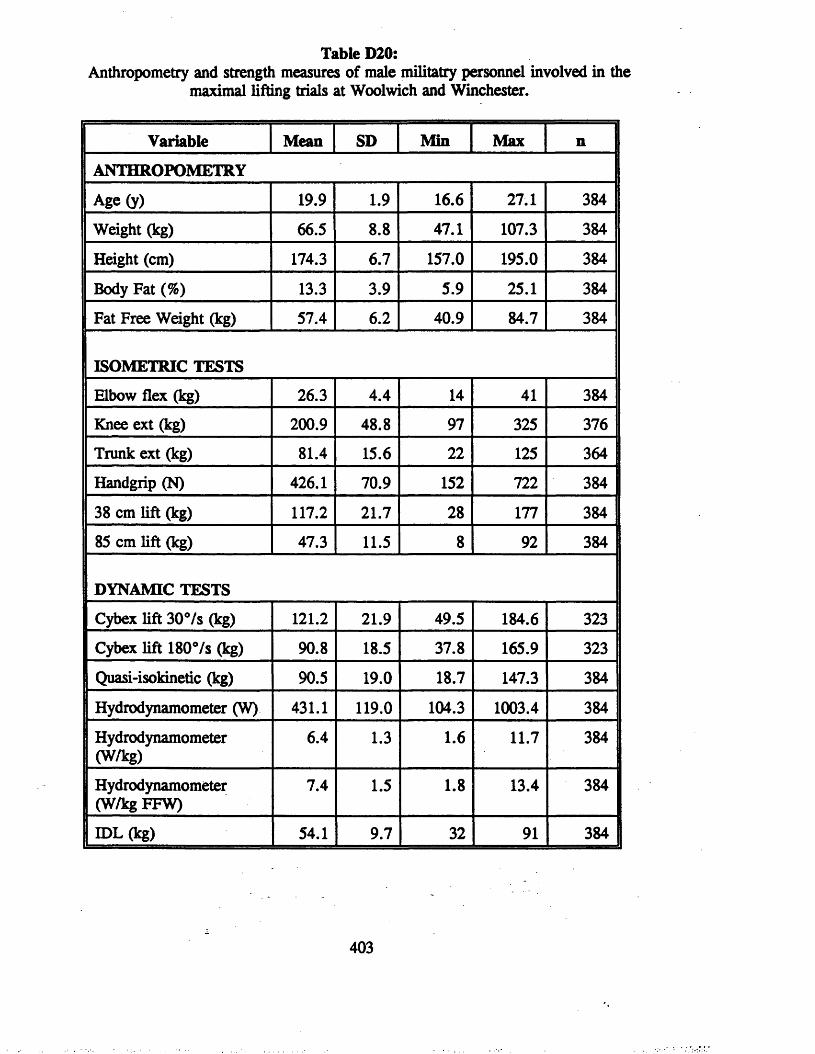
Table D20:Anthropometry and strength measures of male militatry personnel involved in the
maximal lifting trials at Woolwich and Winchester.
Variable Mean SD Min Max n
ANTHROPOMETRY
Age (y) 19.9 1.9 16.6 27.1 384
Weight (kg) 66.5 8.8 47.1 107.3 384
Height (cm) 174.3 6.7 157.0 195.0 384
Body Fat (%) 13.3 3.9 5.9 25.1 384
Fat Free Weight (kg) 57.4 6.2 40.9 84.7 384
ISOMETRIC TESTS
Elbow flex (kg) 26.3 4.4 14 41 384
Knee ext (kg) 200.9 48.8 97 325 376
Trunk ext (kg) 81.4 15.6 22 125 364
Handgrip (N) 426.1 70.9 152 722 384
38 cm lift (kg) 117.2 21.7 28 177 384
85 cm lift (kg) 47.3 11.5 8 92 384
DYNAMIC TESTS
Cybex lift 30°/s (kg) 121.2 21.9 49.5 184.6 323
Cybex lift 180°/s (kg) 90.8 18.5 37.8 165.9 323
Quasi-isokinetic (kg) 90.5 19.0 18.7 147.3 384
Hydrodynamometer (W) 431.1 119.0 104.3 1003.4 384
Hydrodynamometer(W/kg)
6.4 1.3 1.6 11.7 384
Hydrodynamometer (W/kg FFW)
7.4 1.5 1.8 13.4 384
IDL (kg) 54.1 9.7 32 91 384 |
403

APPENDIX E RELATED PUBLICATIONS
404

LKUUINUM 1C5, i ^ l , VUL. D**, JNU. D, D V J - J I D
Human strength capabilities during one-handed maximum voluntary exertions in the fore and aft plane
D a v id M . Foth erg ill , D o n a ld W. G rieve and St eph en T . P h ea san t
Human Performance Laboratory, Department of Anatomy, Royal Free Hospital School of Medicine, Rowland Hill Street, London NW3 2PF, UK
Keywords: One-handed whole body strength; Direction of exertion; Sex differences; Isometrics.
Maximal static strengths were determined for one-handed exertions in all directions in the fore and aft plane. Data from 12 males and 10 females (mean age 30*7 yrs, standard deviation (SD)=8-9 yrs, n = 22) were obtained with handle heights of 1-0 and 1-75 m. Twelve of the subjects also performed two-handed exertions at the same handle heights. The ratio of mean strengths of females to that of males ranged from 0-50 to 0-83 (for absolute forces) and from 0-63 to 1-00 for forces normalized to body weight. The ratios of one-handed to two-handed strengths ranged from 0-64 to 1*04. Two-handed strengths commonly exceeded one-handed strengths at the lower handle height, but showed fewer significant strength differences (/?<0-05) according to direction at 1-75 m. Both female/male and one-handed/two-handed strength ratios were found to be dependent on direction of exertion and handle height. The observed strength dependencies upon number of hands (one or two-handed), direction of exertion, handle height and sex are discussed. The strength data have implications for use in biomechanical models and task analysis.
1. IntroductionAlthough musculoskeletal injuries incurred as a result of manual materials handling have stimulated extensive research into the capacities and limitations of the human, gaps in our knowledge still exist in many areas associated with work-related activities.
One area where data are scarce is in whole-body human strength capabilities during tasks requiring one-handed exertions. Most studies of whole-body exertion have been concerned with vertical two-handed lifting or horizontal pushing and pulling (Whitney 1957, Chaffin 1974, Yates et a l 1980, Kroemer 1974, Ayoub and MacDaniel 1974), with very few reports on one-handed strengths (Davis and Stubbs 1980, Warwick et al. 1980, Chaffin et al. 1983). In all but one of these papers (i.e., Chaffin et al. 1983) foot and hand placement have been rigidly defined, thereby limiting the choice of posture available to the subject. In addition, few investigators have explored human strength capabilities in the more general case involving exertions in all directions in the fore and aft plane. As a consequence, whole-body static strength data have been more representative of the conditions imposed by experimental constraints than of the real strength capabilities of human beings in the freely chosen postures that they would normally use in real-world working tasks.
The first objective of the current study was therefore to describe human strength capabilities during one-handed maximal voluntary exertions in the fore and aft plane in free-style postures. In order for the strength data to be potentially useful as an aid in task design and in the recognition of hazards during manual exertion, forces are
0014-0139/91 $3-00 © 1991 Taylor & Francis Ltd.

564 D. M . F o therg ill et al.
presented in vector form as a Postural Stability Diagram (PSD) (see Grieve and Pheasant 1982).
Further objectives of the present study were to investigate the influence and interactions of sex, handle height and direction of exertion on one-handed strength; and to compare the strength of one- and two-handed exertions.
2. Methods2.1. SubjectsThe 22 subjects (18 right-handed, 4 left-handed) were unpaid volunteer staff or students of this institute. Their physical characteristics are summarized in table 1.
Table 1. Physical characteristics of subjects (values are means (±SD)).
Male Femalen 12 10 22
Age (yrs) 32-9 (10-7) 28-0 (5-5) 30-7 (8-9)Weight (kg) 76-3 (13-6) 62-2 (5-3) 69-9 (12-7)Height (cm) 178-4 (8-6) 167-4 (7-0) 173-3 (19-5)Grip (N) 493 (71) 348 (53) 427 (97)
2.2. ApparatusA force bar, which measured vertical and horizontal components of static exertions, was used (see Whitney 1957, Grieve 1979a). Using a 64 kbyte BBC microcomputer, customized software was designed to sample and then plot the maximal horizontal and vertical components of the force vectors applied to the bar in all possible directions in the fore and aft plane. A plot of these force vectors on a VDU screen presented the strength data in the form of a Postural Stability Diagram (see Grieve 1979a, b).
A combination of emery-cloth floor and rubber-soled shoes provided a unity coefficient of limiting friction (Pheasant and Grieve 1981). Despite some of the extreme postures adopted during exertions, slippage did not occur.
Grip strengths were measured with a hand grip dynamometer (Takei and Company Ltd) where grip size was adjusted to the preference of the subjects.
2.3. ProcedureThe subjects’ unshod weight and stature were measured. Grip strength was determined from the best of two efforts with the dominant hand. Free-style manual strengths, with the dominant hand, were measured on the force bar while standing. The only limitation placed on the subject’s posture was that the leading foot should not be placed anterior to the handle. Subjects performed steady maximal exertions in all possible directions in the fore and aft plane with the force bar set at 1 -0 or 1 -75 m above the ground. No ‘jerking’ or ‘swinging’ on the force bar was allowed. The procedure for obtaining a PSD has been described previously (Pheasant and Grieve 1981). At least one day separated tests at the two heights. Half the subjects started with the l*0m bar height, the remainder started at 1-75 m. One month later, 12

O ne-handed strength capabilities 565
subjects who had completed the one-handed exertions followed the same procedures and protocol using two hands.
2.4. AnalysisStrength data were stored on disc as sets of 36 force vectors 10° apart. Group mean strengths and standard deviations in each condition were calculated. Before being plotted on a PSD chart, the strength data were fitted with a cubic spline function as described by Pheasant and Grieve (1981).
The Maximum Advantage of using a Component of Exertion (MACE) was also calculated from the PSD data for each subject at each bar height (Grieve and Pheasant 1981). Briefly, for a given force vector plotted on the PSD, a circle can be described around it representing the components of that vector in other directions. If this procedure is repeated for all force vectors on the PSD envelope a new outer envelope is described representing the maximum components that are possible in each direction. The MACE, in a given direction, is defined as the ratio of the maximum available component compared with the directed resultant in that direction.
PSD and MACE were obtained based both on absolute strengths (in Newtons) and normalized strengths (as a percentage of body weight).
3. Results3.1. Sex differences in the strength of one-handed exertionsPSD plots for one-handed exertions at the two bar heights (1-Om and l-75m ) are shown in figure 1. The data are presented as strength/weight ratios and show the group means ± one standard deviation.
A comparison of the PSDs in figure 1, between male and female subjects, shows almost identical shapes for the vector diagrams with only small differences in their normalized strengths for exertion at the two bar heights. When the female/male (f/m) strength ratios were calculated, for the normalized data in each of the 36 directions at the two bar heights, a mean value of 0-79 (SD=0-09) was obtained (« = 72). This f/m strength ratio decreased to 0*65 (SD=0-08) when absolute strength values were considered.
Female/male strength ratios (calculated from the normalized strength data) for all 36 force vectors at the two bar heights are presented in figure 2. Although the mean f/m strength ratios at the two bar heights were very similar (Bar = 1*0 m, ratio=0*78 (SD=0*08); Bar = 1*75 m, ratio=0-80 (SD=0*11); n = 36), figure 2 clearly shows that the magnitude of this ratio varies according to direction of exertion and bar height.
At the 1-Om bar height, males were significantly stronger (p < 0-05) than females in most directions, except for exertions performed in the pull/press quadrant. In this latter quadrant the normalized f/m strength ratio averaged 0*86 (SD =O 07, n = 9) with a peak ratio of 0*93 occurring between 120° and 130°. Over a large area of this quadrant there was no significant difference in strength (/?>0*05) between males and females when forces were normalized against body weight.
At the l-75m bar height, normalized female strength approached that of the males in many more directions. Figure 2 indicates large areas in the fore and aft plane where there were no significant differences (p>0-05) in normalized strength between males and females. Large strength differences between males and females were observed in the directions of horizontal pulling/pushing and most of the pull/lift quadrant).

566 D. M . E otnerg iu et al.
BAR s 1-Om BAR = 1-75 m
ESS
LIFT
PUL PUSH1
ESS
PULL PUSH
ESS
PULL PUSHl
ESS
■USHIPUL
ESS
PULL PUSH1
ESS
Figure 1. PSDs for one-handed exertions, in the fore and aft plane, at handle placements of 1 -0 m and 1 -75 m above the floor. The data are average maximal strengths (± one SD) as a percentage of body weight for males, females and all subjects in the top, middle and lower figures respectively. The centre of each diagram represents zero manual exertion and the edges represent forces equal in magnitude to body weight. The posture adopted was freestyle.
3.2. MACE for one-handed exertionsUsing individual PSD data, advantages of using components of deviated forces were calculated for all directions in the fore and aft plane, at both bar heights. An example

1UCU Jll IgLtl f
BAR = 10 m BAR = 1*75 m
PULL
ESS
Figure 2. Female/male strength ratios in all directions in the fore and aft plane, for one- handed maximal exertions, under two conditions of handle placement (1-Om and 1 • 7 5 m). The centre of each plot represents a f/m strength ratio of zero, the inner circle an f/m strength ratio of 0-5 and the outer circle an f/m strength ratio equal to unity. The hatched areas represent directions in the fore and aft plane where males were significantly stronger than females (pcO-05). All data calculated from strengths expressed as a percentage of body weight.
of the plot obtained for one subject is shown in the upper diagrams of figure 3. In these two diagrams the advantage of using the components o f deviated forces (outer envelope) is superimposed on the raw PSD data (inner envelope). A plot of the average maximal forces (as well as standard deviations), which may be obtained by employing components of deviated forces for the subject population («=22) at the two bar heights, is shown in the lower two diagrams o f figure 3.
Using the group data in figures 1 and 3, MACE values were calculated for the 90°, 180°, 270° and 360° force vectors at both bar heights. These results, along with their angular deviations from the maximum horizontal or vertical force vectors, are presented in table 2.
Table 2. MACE values for pulls (90°), presses (180°), pushes (270°) and lifts (360°) and the angular deviations, D, of the force vectors from the vertical or horizontal which give a greater component than forces generated exactly in those directions. Positive and negative values refer to anticlockwise and clockwise deviations respectively.
Barheight Lift Pull Press Push
l-75m MACE 1-42 1-76 1-03 2-12D C) - 2 0 + 40 - 1 0 +40
l-00m MACE 1-16 1-03 1-06 1-26D C) - 1 0 0 - 1 0 + 20
3.3. One-handed versus two-handed exertionsPSD plots showing the average maximal strength (± 1-0 SD) of 12 subjects who performed two-handed exertions at the 1*0 and 1*75 m bar height are shown in the
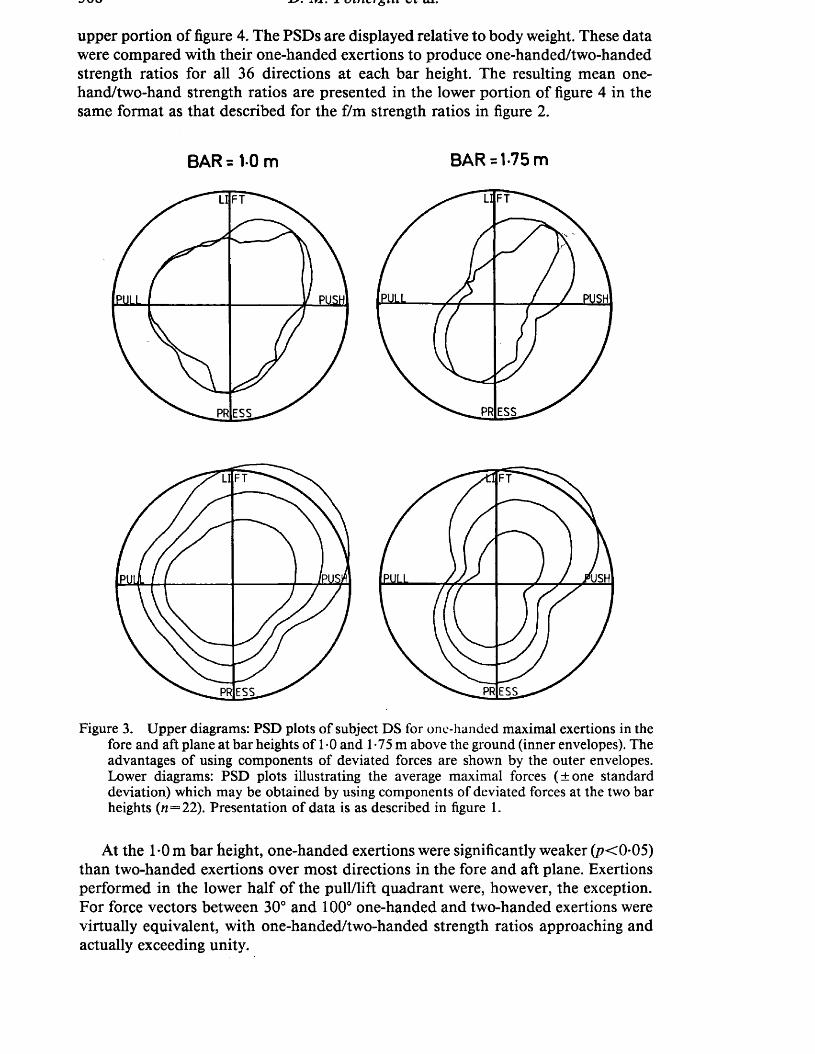
upper portion of figure 4. The PSDs are displayed relative to body weight. These data were compared with their one-handed exertions to produce one-handed/two-handed strength ratios for all 36 directions at each bar height. The resulting mean one- hand/two-hand strength ratios are presented in the lower portion of figure 4 in the same format as that described for the f/m strength ratios in figure 2.
BAR = 1-Om BAR = 1*75 m
PULL
E SS
FT
ML PUSH!
E SS
FT
[pusj
E SS
iill rUSHl
E SS
Figure 3. Upper diagrams: PSD plots of subject DS for one-handed maximal exertions in the fore and aft plane at bar heights of 1 - 0 and 1 *75 m above the ground (inner envelopes). The advantages of using components of deviated forces are shown by the outer envelopes. Lower diagrams: PSD plots illustrating the average maximal forces (±one standard deviation) which may be obtained by using components of deviated forces at the two bar heights (/i=22). Presentation of data is as described in figure 1.
At the 1-Om bar height, one-handed exertions were significantly weaker (p<0-05) than two-handed exertions over most directions in the fore and aft plane. Exertions performed in the lower half of the pull/lift quadrant were, however, the exception. For force vectors between 30° and 100° one-handed and two-handed exertions were virtually equivalent, with one-handed/two-handed strength ratios approaching and actually exceeding unity.

BAR = 10 m BAR =175 m
m £iiLL
Figure 4. Upper diagrams: PSD plots of two-handed maximal exertions in the fore and aft plane with the force bar placed at 1-Om and 1*75 m above the floor (n—12). Presentation of the data is as described for figure 1. Lower diagrams: plots showing the mean onehanded/mean two-handed strength ratios for all directions in the fore and aft plane at the 1-Om and 1 -75 m bar heights. Scaling of the strength ratios is the same as that described in figure 2. The hatch areas represent directions in the fore and aft plane where two-handed exertions are significantly stronger than one-handed exertions (p < 0-05).
Fewer significant differences between one- and two-handed exertions were found at 1 -75 m. The main strength differences (figure 4, lower right) resided in the lift/push quadrant and the lower portions of the pull/press-push/press quadrants. Outside these regions, strength differences between one- and two-handed exertions were largely insignificant (p > 0*05).
4. Discussion4.1. Sex differences in the strength of one-handed exertionsPart of the variation in f/m strength ratios (shown in figure 2) is likely to reflect differences in stature between the male and female subject population. In addition, sex differences in the strength of the principal muscle groups involved during exertions in different postures are likely to add to this variance.

In those regions where sex differences were small, it may be assumed that the physical strength of the individual played only a minor role in the force of exertion. Under these circumstances, the deployment of body weight may therefore be the predominant factor dictating force output.
The above argument does not explain the similarity of forces produced by males and females in the lift/push quadrant at the 1*75 m bar height. It was in this region of the PSD that the largest forces were recorded by both sexes. As described by Pheasant and Grieve (1981), these peak forces arise from postural configurations in which the muscular torque required about the major articulations is minimized. This occurs when the trunk, upper and lower limbs approximate a straight line and the whole body is brought as close as possible to the line of thrust. One reason for the similarity of strengths between the sexes under the above conditions may be that the postures adopted employed muscle groups with minimal sex differences in strength.
Based on 112 data sets, Pheasant (1983) noted that the ratio of f/m average strengths can vary from 0-37 to 0*90 depending on a number of factors including the direction of exertion and muscle group tested. Upper and lower extremity strengths of women were reported to be, on average, 58% and 66% of men’s respectively (Pheasant 1983). In view of this fact, it may be hypothesized that sex differences in whole-body strength will be greatest in directions of exertion that require mainly upper body strength. Alternatively, sex differences in whole-body strength will be minimized where the force produced is limited predominantly by leg strength.
In general, the present data illustrate the large variability in strength between the sexes under different conditions. The findings also depict the complex interactions between angle of exertion and handle height (implying changes in posture and the use of different muscle groups) as well as body weight in the determination of strength.
Although there is a strong argument for separate load limits for men and women in the field of manual handling; the current results indicate that it would be inappropriate to use a single mean ratio to predict female strength from male data.
4.2. Advantages of using a component o f exertionThe closer the MACE values are to unity, the smaller the benefit that can be obtained by using the component of a deviated force vector. Consequently, the data in table 2 indicate that there is little to be gained by using a deviated component in horizontal pulling, vertical lifting or vertical pressing actions at 1-Om. The MACE value shown for horizontal pushing, however, shows that if a subject exerts a maximal one-handed push at this height it is likely that a small vertical lifting component of force will also be exhibited (providing the subject chooses to take advantage of the deviated resultant force).
At 1-75 m, aside from vertical pressing, the MACE values indicated that a substantial advantage may be gained by using a deviated resultant force during exertions. For example, if the objective is to produce a maximal horizontal push at this particular height, it is best to direct the resultant force at approximately 40° above the horizontal, rather than directly along the horizontal plane. Similarly, if the goal is to produce maximal horizontal pulling at 1*75 m, the resultant force should be directed approximately 40° below the horizontal plane of the handle.
In practice, the individual will only benefit from the above resultant forces in tasks where the vertical component of the force is unimportant. Similarly, for deviated forces to be useful in lifting tasks, their horizontal components must not compromise any frictional or task limitations. The possible use of deviated resultants

O ne-h a n d ed s treng th capab ilities 571
should therefore be accounted for when designing equipment or considering tasks which may require heavy exertions.
Data provided by Grieve and Pheasant (1981) have shown (at least for two- handed exertions with defined foot placement) that adult males instinctively know that force exerted in a deviated direction may be used to achieve an improved result in another.
4.1. One-handed versus two-handed exertionsIn many directions of exertion, the difference in strength between one- and two- handed maximal efforts was surprisingly small.
In theory, strength differences between one and two-handed exertions should be minimized when: (1) deployment of body weight relative to the centre of foot pressure is the limiting factor in the strength of the exertions; or (2) the weak link limiting the amount of force produced and/or transm itted by the musculoskeletal system lies in a part of the body other than the upper limbs.
The implications of weak links, either at the hand-handle interface or within the musculoskeletal system were investigated in a related study. Based on this work, it was assumed that the coupling between the hand and bar in the present study was an effective one and unlikely to be the weakest link determining force outcome.
The current data show regions in the fore and aft plane at both bar heights where one-handed exertions actually exceeded the strength o f two-handed exertions. Under these circumstances, the greater freedom of postures available under the one-handed condition permitted the subject a more advantageous use of the body’s centre of gravity. For example, in the case of exertions directed in the pull/press quadrant at 1-75 m, releasing one hand from the bar permits the subject to rotate about an axis connecting the leading foot and the hand grasping the bar. If the body is rotated about this axis until perpendicular to the bar, and the free leg and arm splayed out as far as possible from the axis in the direction of the exerted force (as shown in figure 5), displacement of the body’s centre of gravity away from the bar will be maximized. Thus, for a given force vector, the moment arms about which the horizontal and vertical components of the body weight act will be optimal. Consequently, in exertions where deployment of body weight is the predom inant factor limiting force production, postures possible using one hand only may permit greater forces to be applied than when performed using two hands.
As one-handed exertions performed in certain directions can approach the strength of two-handed exertions, the stress on the load-bearing shoulder and arm may reach close to double that found during two-handed efforts. Due to the anatomical nature of the shoulder joint and the inherent instability of the articulation as a consequence o f its degrees of freedom, the high stresses possible during one-handed efforts may lead to an increased risk of injury. Further epidemiological studies on upper limb injuries incurred during heavy manual exertion may provide evidence to support this hypothesis.
4. Summary and conclusionsThe current data give some indication of whole-body strength capabilities of one- handed exertions in the fore and aft plane. These data may be more applicable to the working environment than previous research as exertions were performed using freestyle rather than experimentally defined postures.

J / z u . ivi. ruinergiu e i ai.
Figure 5. Tracings from photographic records of one subject showing the change in freestyle posture permitted by releasing one hand from the bar during a maximal exertion directed in the pull/press quadrant of the PSD. Bar height= l-75m. (See text for further details.)
The main conclusions emanating from the study were:
(1) Sex differences in static one-handed maximum voluntary exertions varied substantially according to the direction of exertion and bar height. This served to illustrate the complex interactions occurring between the underlying variables (e.g., body weight, posture and the sex differences in strength of the muscle groups involved).(2) Considerable strength advantages (in a given direction) may be gained by employing components of deviated forces during one-handed exertions at 1-75 m. Relatively little benefit may be obtained by using these deviated forces at 1-Om.(3) It was more common to find two-handed strengths exceeding one-handed strengths at the 1-Om bar height. There were, however, a number of directions at both 1*0 and l*75m bar heights where one-handed strengths approached, and even exceeded, two-handed strengths.

O n e-h a n d ed streng th capab ilities 573
When considering the current strength data, it should be kept in mind that the values given are for ideal conditions. This assumes posture is unrestricted by work space and force output is essentially unaffected by conditions at the foot and hand interfaces. While such conditions are unrealistic for a typical working environment, the data provide a starting point for estimating the effects of environmental factors on one-handed exertions.
Finally, due to the widely differing postures available, use of the strength data in biomechanical models of strength (e.g., Garg and Chaffin 1975) is problematic unless detailed anthropometric and postural analysis is performed. Nevertheless, data from the present experiment may enhance the reliability of such models in areas of interpolation where there have previously been few data.
AcknowledgementsThis work has been carried out with the support of the UK Ministry of Defence under an extramural research agreement with the Army Personnel Research Establishment.
ReferencesAyoub, M. M. and M cD aniel, J. W. 1974, Effects o f operator stance on pushing and pulling
tasks, American Institute o f Industrial Engineers Transactions, 6, 185-195.C h a f f in , D. B. 1974, Human strength capability and low-back pain, Journal o f Occupational
Medicine, 16, 248-254.Davis, P. R. and Stubbs, D. A. 1980, Safe Levels o f Manual Forces for Young Males, (IPC
Science and Technology Press, Guildford).G a r g , A. and C h a f f in , D. B, 1975. A Biomechanical computerized simulation of human
strength, American Institute o f Industrial Engineers Transactions, 7, 1-15.G r ie v e , D. W. 1979a, The postural stability diagram (PSD): personal constraints on the static
exertion of force, Ergonomics, 22, 1155-1164.G r ie v e , D. W. 1979b, Environmental constraints on the static exertion of force: PSD analysis
in task design, Ergonomics, 22, 1165-1175.G rieve, D. W. and Pheasant, S. T. 1981, Naturally preferred directions for the exertion o f
maximal manual forces, Ergonomics, 24, 685-693.G r ie v e , D. W. and P h e a s a n t , S. T. 1982, in W. T. Singleton (ed.) The Body at Work:
Biological Ergonomics (Cambridge University Press, Cambridge), 187-191.Kroem er, K. H. E. 1974, Horizontal push and pull forces when standing in working positions
on various surfaces, Applied Ergonomics, 5, 94-102.P h e a s a n t , S. T. 1983, Sex differences in strength— some observations on their variability,
Applied Ergonomics, 14, 205-211.Pheasant, S. T. and Grieve, D. W. 1981, The principle features of maximal exertion in the
sagittal plane, Ergonomics, 24, 327-338.W arwick, D., N ovak, G. and S ch u ltz , A. 1980, Maximum voluntary strengths o f male adults
in some lifting, pushing and pulling activities, Ergonomics, 23, 49-54.W h it n e y , R. J. 1957, The strength of the lifting action in man, Ergonomics, 1, 101-128.Y a t e s , J. W., K a m o n , E., R o d g e r s , S. H. and C h a m p n e y , P. C. 1980, Static lifting strength
and maximal isometric voluntary contractions of back, arm and shoulder muscles, Ergonomics, 23, 37-48.
Manuscript received 16 June 1990.Revised manuscript received 1 November 1990.