Does Plant Diversity Benefit Agroecosystems? A Synthetic Review
13
Ecological Applications, 21(1), 2011, pp. 9–21 Ó 2011 by the Ecological Society of America Does plant diversity benefit agroecosystems? A synthetic review DEBORAH K. LETOURNEAU, 1,2,5 INGE ARMBRECHT, 2 BEATRIZ SALGUERO RIVERA, 2 JAMES MONTOYA LERMA, 2 ELIZABETH JIME ´ NEZ CARMONA, 2 MARTHA CONSTANZA DAZA, 3 SELENE ESCOBAR, 2 VI ´ CTOR GALINDO, 2,6 CATALINA GUTIE ´ RREZ, 2,4 SEBASTIA ´ N DUQUE LO ´ PEZ, 2 JESSICA LO ´ PEZ MEJI ´ A, 2 ALEYDA MARITZA ACOSTA RANGEL, 2 JANINE HERRERA RANGEL, 2 LEONARDO RIVERA, 2 CARLOS ARTURO SAAVEDRA, 2,4 ALBA MARINA TORRES, 2 AND ALDEMAR REYES TRUJILLO 3 1 Environmental Studies Department, 1156 High Street, University of California, Santa Cruz, California 95064 USA 2 Department of Biological Sciences, Universidad del Valle, Cali, Colombia 3 Escuela de Ingenierı´a de Recursos Naturales y del Ambiente, Universidad del Valle, Cali, Colombia 4 Wildlife Conservation Society, Colombia Program, Calle 4A No. 35A-57, Cali, Columbia Abstract. Predictive theory on how plant diversity promotes herbivore suppression through movement patterns, host associations, and predation promises a potential alternative to pesticide-intensive monoculture crop production. We used meta-analysis on 552 experiments in 45 articles published over the last 10 years to test if plant diversification schemes reduce herbivores and/or increase the natural enemies of herbivores as predicted by associational resistance hypotheses, the enemies hypothesis, and attraction and repellency model applications in agriculture. We found extensive support for these models with intercropping schemes, inclusion of flowering plants, and use of plants that repel herbivores or attract them away from the crop. Overall, herbivore suppression, enemy enhancement, and crop damage suppression effects were significantly stronger on diversified crops than on crops with none or fewer associated plant species. However, a relatively small, but significantly negative, mean effect size for crop yield indicated that pest-suppressive diversification schemes interfered with production, in part because of reducing densities of the main crop by replacing it with intercrops or non-crop plants. This first use of meta-analysis to evaluate the effects of diversification schemes, a potentially more powerful tool than tallies of significant positive and negative outcomes (vote-counting), revealed stronger overall effects on all parameters measured compared to previous reviews. Our analysis of the same articles used in a recent review facilitates comparisons of vote-counting and meta-analysis, and shows that pronounced results of the meta-analysis are not well explained by a reduction in articles that met its stricter criteria. Rather, compared to outcome counts, effect sizes were rarely neutral (equal to zero), and a mean effect size value for mixed outcomes could be calculated. Problematic statistical properties of vote-counting were avoided with meta-analysis, thus providing a more precise test of the hypotheses. The unambiguous and encouraging results from this meta-analysis of previous research should motivate ecologists to conduct more mechanistic experiments to improve the odds of designing effective crop diversification schemes for improved pest regulation and enhanced crop yield. Key words: agroecosystems; crop damage; diversification; effect sizes; herbivores; intercropping; meta- analysis; natural enemies; pest regulation; statistical outcome vote-counting; yield. INTRODUCTION Since the advent of green revolution technologies in the 1960s, agricultural ecologists have explored the application of theory to alleviate unintended negative effects from the loss of biodiversity associated with high- yielding varieties grown in monocultures with fertilizers and pesticides (e.g., Altieri et al. 1983, Wilby and Thomas 2002, Butler et al. 2007, Hendrickx et al. 2007, Attwood et al. 2008). Vegetation management schemes are recommended to restore functional aspects of plant diversity lost through crop intensification (Letourneau 1998, Gurr et al. 2003, Tscharntke et al. 2005, Bianchi et al. 2006, Rey Benayas et al. 2009). Theory generated in the 1960s and 1970s (e.g., Pimentel 1961, Southwood and Way 1970, Root 1973, van Emden and Williams 1974) suggested that vegetation management techniques could serve multiple purposes, including regulating insect pest densities directly or through the action of their natural enemies (Barbosa 1998, Pickett and Bugg 1998). Using data extracted from articles published between 1998 and 2008 in a meta-analysis, we calculated the mean effect of crop diversification schemes on insect herbivores, their natural enemies, crop damage, and Manuscript received 29 October 2009; accepted 11 March 2010; final version received 12 April 2010. Corresponding Editor: E. A. Newell. 5 E-mail: [email protected] 6 Present address: Fundacio´n Centro para la Investigacio´n en Sistemas Sostenibles de Produccio´ n Agropecuaria, Cra. 25 No. 6-62, Cali, Colombia. 9
-
Upload
umb-investigaciones -
Category
Documents
-
view
0 -
download
0
Transcript of Does Plant Diversity Benefit Agroecosystems? A Synthetic Review
Ecological Applications, 21(1), 2011, pp. 9–21� 2011 by the Ecological Society of America
Does plant diversity benefit agroecosystems? A synthetic review
DEBORAH K. LETOURNEAU,1,2,5 INGE ARMBRECHT,2 BEATRIZ SALGUERO RIVERA,2 JAMES MONTOYA LERMA,2
ELIZABETH JIMENEZ CARMONA,2 MARTHA CONSTANZA DAZA,3 SELENE ESCOBAR,2 VICTOR GALINDO,2,6
CATALINA GUTIERREZ,2,4 SEBASTIAN DUQUE LOPEZ,2 JESSICA LOPEZ MEJIA,2 ALEYDA MARITZA ACOSTA RANGEL,2
JANINE HERRERA RANGEL,2 LEONARDO RIVERA,2 CARLOS ARTURO SAAVEDRA,2,4 ALBA MARINA TORRES,2
AND ALDEMAR REYES TRUJILLO3
1Environmental Studies Department, 1156 High Street, University of California, Santa Cruz, California 95064 USA2Department of Biological Sciences, Universidad del Valle, Cali, Colombia
3Escuela de Ingenierıa de Recursos Naturales y del Ambiente, Universidad del Valle, Cali, Colombia4Wildlife Conservation Society, Colombia Program, Calle 4A No. 35A-57, Cali, Columbia
Abstract. Predictive theory on how plant diversity promotes herbivore suppressionthrough movement patterns, host associations, and predation promises a potential alternativeto pesticide-intensive monoculture crop production. We used meta-analysis on 552experiments in 45 articles published over the last 10 years to test if plant diversificationschemes reduce herbivores and/or increase the natural enemies of herbivores as predicted byassociational resistance hypotheses, the enemies hypothesis, and attraction and repellencymodel applications in agriculture. We found extensive support for these models withintercropping schemes, inclusion of flowering plants, and use of plants that repel herbivores orattract them away from the crop. Overall, herbivore suppression, enemy enhancement, andcrop damage suppression effects were significantly stronger on diversified crops than on cropswith none or fewer associated plant species. However, a relatively small, but significantlynegative, mean effect size for crop yield indicated that pest-suppressive diversification schemesinterfered with production, in part because of reducing densities of the main crop by replacingit with intercrops or non-crop plants. This first use of meta-analysis to evaluate the effects ofdiversification schemes, a potentially more powerful tool than tallies of significant positive andnegative outcomes (vote-counting), revealed stronger overall effects on all parametersmeasured compared to previous reviews. Our analysis of the same articles used in a recentreview facilitates comparisons of vote-counting and meta-analysis, and shows thatpronounced results of the meta-analysis are not well explained by a reduction in articlesthat met its stricter criteria. Rather, compared to outcome counts, effect sizes were rarelyneutral (equal to zero), and a mean effect size value for mixed outcomes could be calculated.Problematic statistical properties of vote-counting were avoided with meta-analysis, thusproviding a more precise test of the hypotheses. The unambiguous and encouraging resultsfrom this meta-analysis of previous research should motivate ecologists to conduct moremechanistic experiments to improve the odds of designing effective crop diversificationschemes for improved pest regulation and enhanced crop yield.
Key words: agroecosystems; crop damage; diversification; effect sizes; herbivores; intercropping; meta-analysis; natural enemies; pest regulation; statistical outcome vote-counting; yield.
INTRODUCTION
Since the advent of green revolution technologies in
the 1960s, agricultural ecologists have explored the
application of theory to alleviate unintended negative
effects from the loss of biodiversity associated with high-
yielding varieties grown in monocultures with fertilizers
and pesticides (e.g., Altieri et al. 1983, Wilby and
Thomas 2002, Butler et al. 2007, Hendrickx et al. 2007,
Attwood et al. 2008). Vegetation management schemes
are recommended to restore functional aspects of plant
diversity lost through crop intensification (Letourneau
1998, Gurr et al. 2003, Tscharntke et al. 2005, Bianchi et
al. 2006, Rey Benayas et al. 2009). Theory generated in
the 1960s and 1970s (e.g., Pimentel 1961, Southwood
and Way 1970, Root 1973, van Emden and Williams
1974) suggested that vegetation management techniques
could serve multiple purposes, including regulating
insect pest densities directly or through the action of
their natural enemies (Barbosa 1998, Pickett and Bugg
1998). Using data extracted from articles published
between 1998 and 2008 in a meta-analysis, we calculated
the mean effect of crop diversification schemes on insect
herbivores, their natural enemies, crop damage, and
Manuscript received 29 October 2009; accepted 11 March2010; final version received 12 April 2010. CorrespondingEditor: E. A. Newell.
5 E-mail: [email protected] Present address: Fundacion Centro para la Investigacion
en Sistemas Sostenibles de Produccion Agropecuaria, Cra. 25No. 6-62, Cali, Colombia.
9
crop yield to determine if pest-suppressive schemes
provide overall benefits in agricultural systems.
Direct bottom-up effects of plant diversity involve the
disruption of herbivores, particularly specialized feeders,
from finding their host plant, causing the tendency for
crop-feeding insects to leave the field at greater rates
than when suitable hosts are concentrated in monocul-
tures (Root 1973, Vandermeer 1989). Related hypoth-
eses, compiled by Poveda et al. (2008), pose various
mechanisms for lower pest densities on mixed vegetation
than in monoculture, such as altered plant odor due to
physiological changes in the plant (Finch and Collier
2000), repellent properties of associated plants (Uvah
and Coaker 1984), masking of host plant odor by other
plants (Tahvanainen and Root 1972), or visual masking
of host plants by emergent, green non-crop plants
(Finch and Collier 2000). Plant diversity may also affect
belowground factors, such as microbial community
biomass (Zak et al. 2003), which, in turn, may lead to
higher levels of plant production (but see Wardle and
van der Putten 2002). Associational resistance hypoth-
eses focus on how other plants or crops that are
associated with a particular plant or crop might repel
or confuse host-seeking phytophagous insects (see
Barbosa et al. 2009). The trap crop hypothesis predicts
that some herbivores will be ‘‘attracted away from’’ a
target plant if a preferred host is in the vicinity
(Vandermeer 1989). Root’s (1973) enemies hypothesis
poses alternative or complementary mechanisms for
herbivore suppression in diversified crop habitats. These
mechanisms involve indirect, top-down effects of natural
enemies enhanced by alternate prey/hosts, pollen,
nectar, refugia, and microhabitats that are not available
in weed-free crop monocultures (Altieri and Whitcomb
1979) or large-scale cropping operations with little non-
crop vegetation (Altieri and Letourneau 1984,
Roschewitz et al. 2005). Alternatively, vegetational
diversification schemes in agriculture could increase
herbivore abundance or neutralize any pest suppression
benefits if weeds and other non-crop vegetation in and
surrounding cropping areas harbor serious crop pests
(Capinera 2005). Also, the searching efficiency of
parasitoids and predators could fall to low levels in
mixtures of plants that host different herbivore species,
vary in structure, and emit different sets of volatiles,
thus indirectly disrupting herbivore suppression (Andow
and Risch 1985, Sheehan 1986, Perfecto and Vet 2003,
Gols et al. 2005).
In a recent review, Poveda et al. (2008) found that
vegetational diversification schemes tested in agriculture
over the last decade serve to reduce herbivore densities
in approximately half of the cases. We reviewed the
same 62 papers used by Poveda et al. (2008), and applied
meta-analysis, an analytical tool for quantifying general
patterns across studies (Gurevitch and Hedges 1999).
Hedges and Olkin (1980) have shown that counts of
statistical test outcomes, or vote-counting techniques, as
conducted by Poveda et al. (2008) and all other reviews
of vegetational diversity and herbivore abundance, tend
to be overly conservative compared to meta-analysis,which takes into account the relative sizes of the
differences among treatments as well as their variance.Tallying the statistical outcomes of individual hypoth-
esis tests as significantly positive, significantly negative,or neutral (no significant effect of the treatment) mayunderestimate the magnitude of an overall effect if
nonsignificant outcomes share the same direction amongtreatments. In addition, because neutral findings can be
expected to outnumber significant positive or negativefindings, meta-analysts warn that the resulting reduction
in statistical power (Cooper 1998) may reduce detectionof real treatment effects (Hunter et al. 1982). For
instance, even with a relatively small number of articlesanalyzed, a recent meta-analysis demonstrated that
ecological restoration is likely to increase biodiversityand ecosystem services, including those supporting
nutrient cycling and primary production (Rey Benayaset al. 2009).
We used a series of meta-analyses to ask the followingquestions. Do specific types of diversification schemes
designed for associational resistance to herbivores,attraction of natural enemies, or moving herbivores
away from crops have the predicted effects? Do morediverse cropping schemes in general have an overallnegative effect on herbivores, a positive effect on natural
enemies, reduce crop damage and increase crop yield?Does the use of diversification schemes provide an
overall benefit in agroecosystems? If more plant diversitycreates the desired effects, are there any particularly
strong or conflicting results among different types ofdiversification schemes (intercropping vs. growing flow-
ers around the crop field, for example) or due to otherfactors such as scale or design of the experiment, type of
crop (annual or perennial), or geographic location(tropics vs. temperate zone)? We compared the results
of our meta-analyses to those of Poveda et al. (2008) todetermine if the two methods agree fundamentally, and
we report the level of agreement, article by article,between meta-analysis effect sizes vs. statistical outcome
counts of Poveda et al. (2008) to examine theconsequences of neutral outcomes on statistical power.Finally, we discuss the advantages and disadvantages of
using meta-analysis as an alternative tool to thecounting approach used by Poveda et al. (2008) and
others (e.g., Andow 1991a).
METHODS
Data sources and inclusion criteria
We reviewed the 62 publications (listed in Appendix
A) selected by Poveda et al. (2008) from their initial 279articles published between 1998 and 2008 addressing
insect pests, biological control, and plant diversificationin agroecosystems. Their criteria for selecting these 62articles were that the articles were available and reported
field experiments on vegetation diversification within orsurrounding crop fields, implemented simultaneously
DEBORAH K. LETOURNEAU ET AL.10 Ecological ApplicationsVol. 21, No. 1
with the crop production cycle. Our additional criteria
for the meta-analysis were that: (1) plant species richness
was quantified, described, or manipulated in a way that
could be construed as a relatively species-poor vs.
species-rich condition for crop production and (2)
researchers reported or were able to provide us with
means for arthropod herbivore response variables
(abundance of natural enemies, herbivore abundance,
herbivore mortality caused by natural enemies, crop
damage by herbivores, and/or crop yield), variance
around the means, and numbers of replicates. Because
most of the articles provided multiple experiments
involving different herbivores and/or different natural
enemy manipulations at different locations or in
different years, our general approach was to include
only tests that could not be logically dropped from the
analysis. For example, independent tests of monoculture
vs. polyculture in 2003 and 2004 would be equally valid
for our analysis, as would experiments in two or more
locations, or involving different species. However, we
excluded experiments that were confounded by differ-
ential insecticide applications on plant diversity treat-
ments or that used planting densities that were deemed
by the authors to be impractical for effective crop
production. Also, in cases where the tests were repeated
for all insect stages (e.g., eggs, larvae, pupae, adults), we
used only data for the most damaging stage (usually
nymphs or larvae). In following these practices, we
optimized data collection from these papers while
reducing undue representation of often small-scale
studies whose numerous repetitions of the test in the
same system would otherwise increase nonindependence
bias (Gurevitch and Hedges 1999).
Hypotheses tested with meta-analysis
To test different mechanisms by which plant diversity
can affect herbivores or natural enemies, we grouped
diversification schemes into three categories for the first
meta-analysis: (1) interplanting schemes that primarily
reduce resource concentration for herbivores and
enhance resources for enemies (infield diversification
with crops and non-crops); (2) flower addition (for
attracting natural enemies); and (3) herbivore movement
plantings (trap crops, repellent crops, around crops,
push–pull designs which combine repellant and trap
crops). The second meta-analysis tested the effects of all
diversification schemes on different dependent variables
(herbivores, natural enemies, crop damage, and yield).
We used a third meta-analysis to test if there was an
overall beneficial effect of increased plant diversity when
all dependent variables (herbivores, enemies, damage,
and yield) were included in the analysis, changing the
signs of the effect sizes for herbivores and damage so
that all beneficial outcomes had a positive value. In the
second and third meta-analyses, we further partitioned
the variance to examine possible effects of different
types of diversification schemes, scale (small-scale
experimental plots of 2–1000 m2 vs. large-scale plots .
1000 m2), geographic location (tropical vs. temperate),
type of crop (annual vs. perennial), and experimental
design (additive designs in which crop density is held
constant vs. substitutive designs in which additional
crops or plants replace the main crop).
Data extraction, analysis, and comparison
of vote-counting and meta-analysis
Means and measures of variance were estimated from
figures using Digi-Matic or Graph-Grabber when these
values were not reported in the text. In cases where
individual means and their standard errors were plotted
for repeated samples over the season, but no overall
seasonal mean was provided, we calculated the grand
mean for each level of plant diversity. To estimate the
standard deviation of the grand mean, we applied
Salguero-Rivera’s formula (Appendix B):
ðSDÞ2 ¼XðxiÞ2 � ðn1 þ n2 þ � � � þ nnÞX2
ðn1 þ n2 þ � � � þ nnÞ:
To calculate separate effect sizes for herbivores, enemies,
crop damage, and yield, we used raw effect sizes, with
these dependent variables used as categories to partition
the variance. That is, a negative effect size resulted if a
species-rich cropping scheme had fewer herbivores,
fewer natural enemies, lower damage, or lower yield
than the control (species-poor cropping scheme). A
positive effect size meant the opposite: that herbivores,
natural enemies, damage, or yield had a higher value in
species-rich cropping schemes compared to controls. To
allow for a test of the overall effect of plant diversity in
agriculture, we used a column reversal marker for
herbivores and crop damage in the meta-analysis
spreadsheet (Gurevitch and Hedges 1993) so that a
reduction in herbivores or crop damage became a
positive value for effect size. In this way, a positive
mean effect size would result if, on average, beneficial
outcomes of plant diversity prevailed (herbivores less
abundant in diverse vegetation, natural enemies more
abundant, crop damage lower, and/or greater yield).
To calculate the effect as a proportional change in
plant species diversity, we used bias-corrected Hedges’ d
to calculate the overall treatment effect size (dþ). We did
not include the precision of each study’s estimates in this
analysis (i.e., variance weighting). Instead, mean effect
sizes (dþ) were treated equally to remove biases against
small sample sizes (e.g., Hedges and Olkin 1985, Halaj
and Wise 2001). Hedges’ d is appropriate for small
sample sizes (n values), and allows for experimental and
control group means to have different signs, whereas
response ratios do not (Rosenberg et al. 2000).
Differences in effect sizes were calculated using mixed-
effects models (Gurevitch and Hedges 1993) performed
with MetaWin 2.0 statistical software (Rosenberg et al.
2000). Mixed-effects models potentially result in wider
(more conservative) confidence intervals around overall
effect size estimates as they assume differences in real
January 2011 11MIXED CROPPING, INSECTS, AND YIELD
effect sizes across studies conducted in widely differing
systems (Stram 1996, Schmidt et al. 2009). We used thebootstrap confidence intervals because resampling
methods are appropriate when data are not normallydistributed; our standardized effect sizes on the extreme
ends of the distribution did not all fall within a normaldistribution (Appendix C). Effect sizes were interpretedas being significantly positive or negative, depending on
the value, if the 95% bootstrap confidence intervalsexcluded zero.
Comparisons of the two methodologies (vote-count-ing vs. meta-analysis) were done in two ways. First, we
considered any difference in the number of articles usedin the two methods as part of the methodology. For this
comparison, we used the full sample of our Hedges’ dvalues to count the raw percentage of directional
outcomes (negative values, zero values as neutral effects,and positive values) and compared these percentages
with the percentage of positive, negative, and neutraloutcomes reported by Poveda et al. (2008). Second, we
controlled for article identity, such that we calculatedthe percentage of mean Hedges’ d outcomes per species/
parameter per article, using only the subset of articlesthat were included in our meta-analysis. In this
comparison, the voting categories of Poveda et al.(2008) for effect sizes of diversification schemes onherbivores, enemies, crop damage, and yields (þ,�,0 or a
mixed result category in which, for a given parameter,there were both significantly positive and significantly
negative outcomes) was compared with our result for thesame article, by herbivore, enemy, or crop taxon, using
their outcome designations as listed in their review. Ifindividual Hedges’ d values that made up our mean
value for the species and article varied in sign, we did not‘‘disagree’’ with their mixed-outcome category.
RESULTS
Range of cropping systems, herbivores,and natural enemies, and test for publication bias
in the synthetic review
Forty-five of the original 62 articles (Appendix A)
yielded 552 ‘‘experiments’’ comparing species-rich veg-etational diversification schemes with species-poor
cropping systems. These experiments involved ;50species of herbivores (including various Lepidoptera,
herbivorous bugs, beetles, aphids) and over 20 highertaxa of natural enemies (such as spiders, parasitic wasps,
and predacious bugs) on ;20 main crops (from apples,bananas, cassava and corn to vineyards and wheat).
Low-diversity treatments contained either one or twoplant species, and high plant diversity ranged from 2 to
15 species, except for one study on coffee having 200species of forest trees in the rustic, under-sown
treatment. In approximately half (272) of the experi-ments used in the analysis, a crop species grown alonewas compared with the same crop grown in association
with one additional plant species (crop or non-cropadded to the monoculture). Over 145 697 additional
nonsignificant or unpublished studies would need to be
added to change the results of the meta-analysis from
significance to nonsignificance, as calculated using
Rosenthal’s method for deriving a fail-safe value. This
implies that publication bias was not responsible for the
significant outcomes of our meta-analysis, because the
publication rate of larger effect sizes in one direction
(e.g., positive effects) was not significantly greater than
those reporting smaller effect sizes (Rosenthal et al.
2000).
Meta-analysis on categorical diversification schemes
to determine if mixed-plant associations met predicted
design goals
Interplanting schemes designed to reduce herbivores,
possibly through enhancing natural enemies, produced
strongly significant effect sizes in the predicted direction
for herbivores (negative) and natural enemies (positive)
(Hedges’ dþ¼�1.34, n ¼ 111, 95% CI ¼�1.92 to �0.81and Hedges’ dþ ¼ 2.20, n ¼ 52, 95% CI ¼ 1.01 to 3.57,
respectively), suggesting that, on average, these diversi-
fication schemes achieved the desired results. The
addition of flowering plants in or around the crop field
also significantly increased natural enemies (Hedges’ dþ¼ 1.12, n ¼ 31, 95% CI ¼ 0.45 to 2.01), and diversity
schemes designed to influence herbivore movement
through repelling herbivores or attracting them away
from the main crop were also effective at suppressing
herbivores (Hedges’ dþ¼�1.45, n¼ 93, 95% CI�2.05 to
�0.91).
Meta-analysis on all diversification schemes testing effects
on herbivores, enemies, damage, and crop yield
Herbivore abundance on crops was strongly sup-
pressed by plant diversification schemes in general,
based on the large and negative Hedges’ dþ value for all
221 experiments that measured treatment effects on
herbivorous insects (Fig. 1). That is, the mean effect size
for herbivores had bootstrap 95% confidence intervals
not overlapping zero, with no overlap being the criterion
for a significant effect of treatment on the response
variable. Overall, herbivores were suppressed by 23%,
when comparing the grand mean abundance or, in a few
cases, species richness, in cropping systems with higher
diversity plantings vs. the grand mean in lower diversity
crop systems. In contrast, natural enemies of herbivores
were significantly increased (Hedges’ dþ for measures of
enemy abundance and percentage mortality inflicted on
herbivores, with a few cases of enemy richness), with an
equally strong mean effect size (Fig. 1). The average
abundance (or rarely richness) of natural enemies was
44% greater and average herbivore mortality was 54%greater in high-diversity than low-diversity cropping
systems. The combined effects of direct bottom-up and
indirect top-down factors may explain an even stronger
negative effect size for crop damage (Fig. 1). The grand
mean for crop damage was 23% lower in more diverse
plant assemblages than in comparatively lower diversity
DEBORAH K. LETOURNEAU ET AL.12 Ecological ApplicationsVol. 21, No. 1

plantings. A relatively smaller number of studies
measured yield of the main crop, which was slightly,
but significantly reduced overall, in the diversified
cropping schemes compared to lower diversity cropping
arrangements (Fig. 1). A mean decrease in yield of 14%accompanied the high-diversity treatments compared to
low-diversity crop systems.
A more detailed assessment, calculating separate
effect sizes for each of eight diversification schemes,
showed that intercrops, nonspecific plants within the
field (in-other), and trap crops grown with the main crop
but used to attract herbivores away from the crop, had
the significant, suppressive effect on herbivores they
were designed to have, compared to their low plant
diversity controls (Table 1). Intercropping schemes were
also effective at increasing natural enemies significantly,
as was adding plant diversity around the crop and
adding flowers (Table 1). A significantly positive effect
size for natural enemies with push–pull schemes was less
expected, because these schemes are specifically designed
to influence the movement of herbivores (repel herbi-
vores from the crop and attract them elsewhere).
Positive effects of diversification schemes on natural
enemies were stronger in large-scale than in small-scale
experiments (Table 1).
With respect to crop damage levels, all well-replicated
types of diversification schemes in our analysis showed a
significant reduction in crop damage compared to
controls with lower plant diversity (Table 1), although
crop damage was only measured on studies with annual
crops in the tropics. Although yields were significantly
greater in push–pull studies than in their less-diverse
counterparts, diversification schemes using intercrop-
ping and plantings around the field resulted in signifi-
cantly lower crop yields than when crop plants were not
diversified (Table 1).
Partitioning the heterogeneity for tests on crop yield,
we found that when substitutive designs (secondary crop
or non-crop plants replacing main crop plants) were
used in diversification schemes, the mean effect size for
yield was significantly negative (Table 1). In contrast,
significantly positive mean effect sizes (increased yield
with diversification) were calculated for experimental
comparisons using additive designs (secondary crop or
non-crop plants were added to the number of main crop
plants). Negative effects of diversification on yield were
especially pronounced for the small subset of experi-
ments on perennial crops (n ¼ 11, Hedges’ dþ ¼ �3.0,95% bootstrap CI¼�4.8 to�1.3), with a broader array
of annual crops showing no significant mean effect of
plant diversification (n ¼ 76, Hedges’ dþ ¼�0.28, 95%bootstrap CI¼�0.87 to 0.30). Also, yield reduction due
to plant diversification was a strong outcome in small-
scale but not large-scale experiments (Table 1).
In most but not all cases, the direction and size of
mean effect sizes were in agreement with the narrative
interpretations of Poveda et al. (2008). They observed
that repellent plants, intercropping, nonspecific in-crop
diversity, and push–pull schemes were most effective at
suppressing herbivores. In contrast, the positive effects
of repellent plants or nonspecific infield diversification
that they observed were not shown in our study. One of
the articles that our study did not cover reported the
enhancement of herbivores on a crop in the presence of a
trap crop. Such a discrepancy would partially explain a
disagreement among the two methods if it dampened the
overall effects of trap crops on herbivore abundance in
the outcome tally used by Poveda et al. (2008).
Meta-analysis to measure overall effects of diversification
schemes on all parameters combined: is plant diversity
beneficial for agriculture?
Using the meta-analysis approach to calculate a
grand, overall effect of vegetational diversification on
agricultural outcomes, we found a large, significant, and
positive mean effect size (Hedges’ dþ ¼ 1.14; bootstrap
95% CI¼0.88 to 1.41) of increased plant diversity on the
combination of measured effects (with a positive overall
value for pest suppression, augmentation of natural
enemies, reduction of crop damage, and increased yield),
indicating an overall beneficial outcome of diversifica-
tion schemes in agriculture as compared to cropping
systems that incorporate fewer species or are simple crop
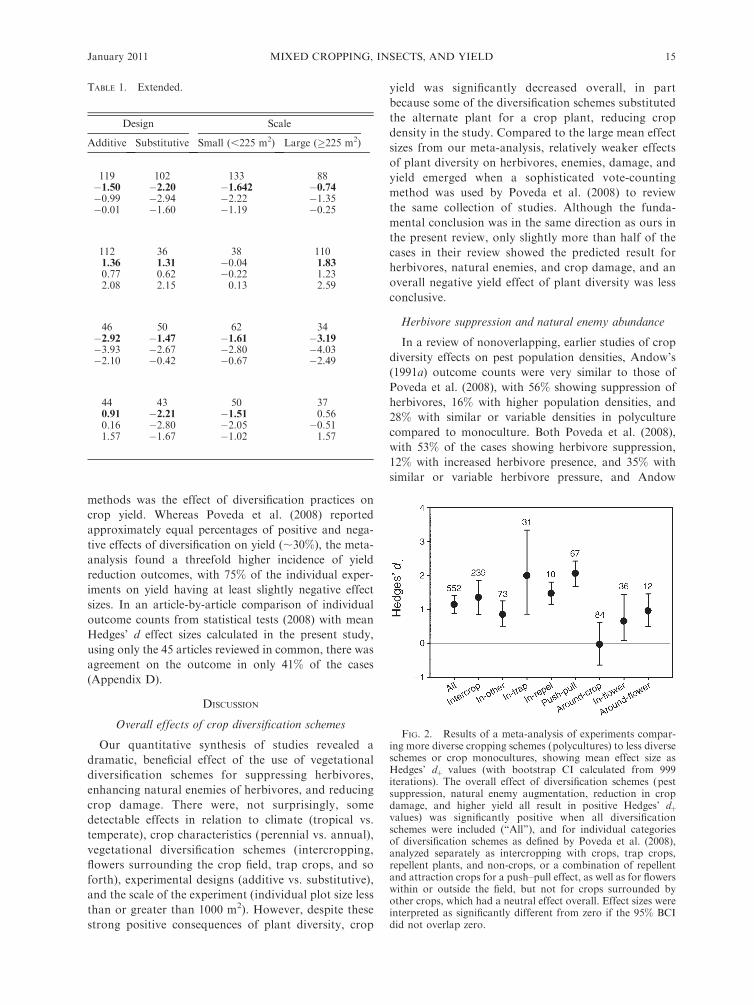
monocultures (Fig. 2). Partitioning the heterogeneity, we
found that experiments in our review were mainly
conducted with annual crops (475 annual vs. 77 on
perennial crops) and more often in tropical regions (413
tropical vs. 139 in the temperate zone). Mean effect size
(Hedges’ dþ value) was not significantly different from
zero for perennial crops alone (n ¼ 77, Hedges’ dþ ¼
FIG. 1. Results of our meta-analysis of experimentscomparing more diverse cropping schemes (polycultures) toless diverse schemes or crop monocultures, showing mean effectsize as Hedges’ dþ values (with bootstrap CI calculated from999 iterations). Pest (herbivores) abundance decreased signifi-cantly, natural enemy (predators and parasitoids) abundanceincreased significantly, and pest damage on crops decreasedsignificantly, but yield was significantly lower when vegetationaldiversity was increased in agricultural systems. Effect sizes wereinterpreted as significantly different from zero if the 95% BCIdid not overlap zero. Numbers of experiments for eachparameter are shown above the CI bars.
January 2011 13MIXED CROPPING, INSECTS, AND YIELD
�0.1, 95% bootstrap CI �0.8 to 0.6) and was relatively
small, but significantly positive, for temperate crops (n¼139, Hedges’ dþ ¼ 0.4, 95% bootstrap CI 0.1 to 0.6),
whereas mean effect sizes were large, significant, and
positive for annual crops and tropical studies (Hedges’
dþ . 1.3, lower 95% bootstrap CI . 1.0). All
diversification schemes had significantly positive effects
when all measures were combined, except for crop fields
surrounded by other crops (around-crop), which had no
measurable effect on the overall outcome of crop
diversification (Hedges’ dþ not significantly different
from zero).
Comparison of vote-counting method with meta-analysis
A basic difference between outcome (or vote-)
counting and our meta-analysis was that fewer articles
met the stricter criteria for calculating effect sizes (45
articles) than for counting the incidence of particular
outcomes (62 articles); see Table 2. However, using
original data allowed us to extract 552 individual
experiments from which to calculate effect sizes for the
effects of crop diversification schemes on herbivore
abundance, their natural enemies (abundance, parasit-
ism rate), feeding damage, or crop yield compared to the
171 statistical test outcomes reviewed by Poveda et al.
(2008).
The percentages of positive and negative outcome
counts were nearly always smaller for counting test
results than for counting the precise Hedges’ d values in
the meta-analysis (Table 2). For instance, the report of
52% cases of herbivore suppression and 53% enemy
increase reported in Fig. 1 of Poveda et al. (2008) differs
from 72% and 74% incidences, respectively, in our meta-
analysis approach. By controlling for the number and
identity of articles used by the two methods, the
discrepancy between counting percentages of negative
and positive outcomes (Poveda et al. 2008) vs. effect
sizes became evident. Effect sizes percentages (present
study) were nearly the same as when 62 vs. 45 studies
were used, if not more pronounced, with 48% of cases
reporting herbivore suppression vs. 78%, respectively
(Table 2). The largest difference between the two
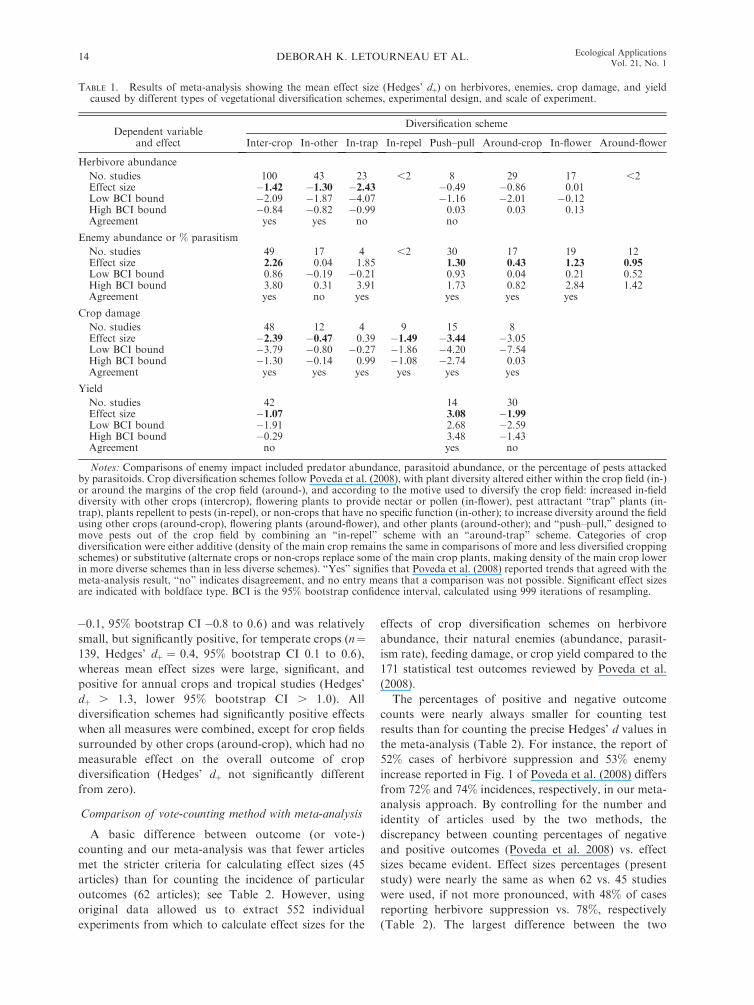
TABLE 1. Results of meta-analysis showing the mean effect size (Hedges’ dþ) on herbivores, enemies, crop damage, and yieldcaused by different types of vegetational diversification schemes, experimental design, and scale of experiment.
Dependent variableand effect
Diversification scheme
Inter-crop In-other In-trap In-repel Push–pull Around-crop In-flower Around-flower
Herbivore abundance
No. studies 100 43 23 ,2 8 29 17 ,2Effect size �1.42 �1.30 �2.43 �0.49 �0.86 0.01Low BCI bound �2.09 �1.87 �4.07 �1.16 �2.01 �0.12High BCI bound �0.84 �0.82 �0.99 0.03 0.03 0.13Agreement yes yes no no
Enemy abundance or % parasitism
No. studies 49 17 4 ,2 30 17 19 12Effect size 2.26 0.04 1.85 1.30 0.43 1.23 0.95Low BCI bound 0.86 �0.19 �0.21 0.93 0.04 0.21 0.52High BCI bound 3.80 0.31 3.91 1.73 0.82 2.84 1.42Agreement yes no yes yes yes yes
Crop damage
No. studies 48 12 4 9 15 8Effect size �2.39 �0.47 0.39 �1.49 �3.44 �3.05Low BCI bound �3.79 �0.80 �0.27 �1.86 �4.20 �7.54High BCI bound �1.30 �0.14 0.99 �1.08 �2.74 0.03Agreement yes yes yes yes yes yes
Yield
No. studies 42 14 30Effect size �1.07 3.08 �1.99Low BCI bound �1.91 2.68 �2.59High BCI bound �0.29 3.48 �1.43Agreement no yes no
Notes: Comparisons of enemy impact included predator abundance, parasitoid abundance, or the percentage of pests attackedby parasitoids. Crop diversification schemes follow Poveda et al. (2008), with plant diversity altered either within the crop field (in-)or around the margins of the crop field (around-), and according to the motive used to diversify the crop field: increased in-fielddiversity with other crops (intercrop), flowering plants to provide nectar or pollen (in-flower), pest attractant ‘‘trap’’ plants (in-trap), plants repellent to pests (in-repel), or non-crops that have no specific function (in-other); to increase diversity around the fieldusing other crops (around-crop), flowering plants (around-flower), and other plants (around-other); and ‘‘push–pull,’’ designed tomove pests out of the crop field by combining an ‘‘in-repel’’ scheme with an ‘‘around-trap’’ scheme. Categories of cropdiversification were either additive (density of the main crop remains the same in comparisons of more and less diversified croppingschemes) or substitutive (alternate crops or non-crops replace some of the main crop plants, making density of the main crop lowerin more diverse schemes than in less diverse schemes). ‘‘Yes’’ signifies that Poveda et al. (2008) reported trends that agreed with themeta-analysis result, ‘‘no’’ indicates disagreement, and no entry means that a comparison was not possible. Significant effect sizesare indicated with boldface type. BCI is the 95% bootstrap confidence interval, calculated using 999 iterations of resampling.
DEBORAH K. LETOURNEAU ET AL.14 Ecological ApplicationsVol. 21, No. 1
methods was the effect of diversification practices on
crop yield. Whereas Poveda et al. (2008) reported
approximately equal percentages of positive and nega-
tive effects of diversification on yield (;30%), the meta-
analysis found a threefold higher incidence of yield
reduction outcomes, with 75% of the individual exper-
iments on yield having at least slightly negative effect
sizes. In an article-by-article comparison of individual
outcome counts from statistical tests (2008) with mean
Hedges’ d effect sizes calculated in the present study,
using only the 45 articles reviewed in common, there was
agreement on the outcome in only 41% of the cases
(Appendix D).
DISCUSSION
Overall effects of crop diversification schemes
Our quantitative synthesis of studies revealed a
dramatic, beneficial effect of the use of vegetational
diversification schemes for suppressing herbivores,
enhancing natural enemies of herbivores, and reducing
crop damage. There were, not surprisingly, some
detectable effects in relation to climate (tropical vs.
temperate), crop characteristics (perennial vs. annual),
vegetational diversification schemes (intercropping,
flowers surrounding the crop field, trap crops, and so
forth), experimental designs (additive vs. substitutive),
and the scale of the experiment (individual plot size less
than or greater than 1000 m2). However, despite these
strong positive consequences of plant diversity, crop
yield was significantly decreased overall, in part
because some of the diversification schemes substituted
the alternate plant for a crop plant, reducing crop
density in the study. Compared to the large mean effect
sizes from our meta-analysis, relatively weaker effects
of plant diversity on herbivores, enemies, damage, and
yield emerged when a sophisticated vote-counting
method was used by Poveda et al. (2008) to review
the same collection of studies. Although the funda-
mental conclusion was in the same direction as ours in
the present review, only slightly more than half of the
cases in their review showed the predicted result for
herbivores, natural enemies, and crop damage, and an
overall negative yield effect of plant diversity was less
conclusive.
Herbivore suppression and natural enemy abundance
In a review of nonoverlapping, earlier studies of crop
diversity effects on pest population densities, Andow’s
(1991a) outcome counts were very similar to those of
Poveda et al. (2008), with 56% showing suppression of
herbivores, 16% with higher population densities, and
28% with similar or variable densities in polyculture
compared to monoculture. Both Poveda et al. (2008),
with 53% of the cases showing herbivore suppression,
12% with increased herbivore presence, and 35% with
similar or variable herbivore pressure, and Andow
TABLE 1. Extended.
Design Scale
Additive Substitutive Small (,225 m2) Large (�225 m2)
119 102 133 88�1.50 �2.20 �1.642 �0.74�0.99 �2.94 �2.22 �1.35�0.01 �1.60 �1.19 �0.25
112 36 38 1101.36 1.31 �0.04 1.830.77 0.62 �0.22 1.232.08 2.15 0.13 2.59
46 50 62 34�2.92 �1.47 �1.61 �3.19�3.93 �2.67 �2.80 �4.03�2.10 �0.42 �0.67 �2.49
44 43 50 370.91 �2.21 �1.51 0.560.16 �2.80 �2.05 �0.511.57 �1.67 �1.02 1.57
FIG. 2. Results of a meta-analysis of experiments compar-ing more diverse cropping schemes (polycultures) to less diverseschemes or crop monocultures, showing mean effect size asHedges’ dþ values (with bootstrap CI calculated from 999iterations). The overall effect of diversification schemes (pestsuppression, natural enemy augmentation, reduction in cropdamage, and higher yield all result in positive Hedges’ dþvalues) was significantly positive when all diversificationschemes were included (‘‘All’’), and for individual categoriesof diversification schemes as defined by Poveda et al. (2008),analyzed separately as intercropping with crops, trap crops,repellent plants, and non-crops, or a combination of repellentand attraction crops for a push–pull effect, as well as for flowerswithin or outside the field, but not for crops surrounded byother crops, which had a neutral effect overall. Effect sizes wereinterpreted as significantly different from zero if the 95% BCIdid not overlap zero.
January 2011 15MIXED CROPPING, INSECTS, AND YIELD
(1991a) showed a weaker effect of plant diversification in
cropping systems than did our meta-analysis approach.
However, Muriel and Velez (2004) reviewed 350 articles
published between 1998 and 2003 and found that 70% of
the articles documented improved pest control in diverse
agroecosystems. A more decisive outcome using meta-
analysis is expected if calculations using original data to
estimate the size of individual effects uncover a
directional trend, thus accumulating larger values
among significant or even nonsignificant test results. In
the case of such a directional trend, the actual
measurement of effect sizes may lead to a more robust
and powerful test of the hypothesis compared to
counting the number of results falling into various
categories (significantly positive, significantly negative,
no significant effect), as has been done in all previous
reviews of plant diversification effects in agriculture.
Vote-counting reviews of the literature lump nonsignif-
icant outcomes that result from a lack of power with
those in which there is a genuine absence of an effect due
to treatments, which can lead to the false conclusion that
a body of evidence does not support a treatment effect
when in fact it does (Cohn and Becker 2003). Cohn and
Becker (2003) estimated that relatively low power (less
than 0.50) across a review of experimental tests could
cause a tabulation of the number of significant outcomes
among those experiments to lead to the wrong
conclusion. Additionally, in such a case, the chance of
arriving at a wrong conclusion increases with the
number of outcomes counted (Hedges and Olkin
1985). Therefore, we are confident that meta-analysis,
and its support for theoretical predictions about direct
and indirect effects on herbivores and natural enemies, is
an appropriate approach and can be a more precise test
of these hypotheses. We caution, however, that many
ecological mechanisms may be responsible for varied
effects of diversification on insect pest regulation. These
include insect life history, indirect effects, and spatial
and temporal scales in the experimental designs, all of
which prevent simple extrapolations from general
outcomes to any particular case (Muriel and Velez
2004).
Crop damage and yield
To our knowledge, Poveda et al. (2008) were the first
reviewers of the responses of insects to pest-suppressive
diversification schemes who evaluated the cumulative
extension of pest and natural enemy effects on crop
yield across a wide variety of designs, including
substitution of crops with other crops or non-crop
plants. Andow’s (1991b) informative review of additive
designs for pest suppression in mixed and row
intercrops, cover crops, and weedy culture addresses
the confounding issue of competition among plants
when yield of the main crop is assessed. Whereas the
critical link between diversification schemes and crop
production is still made in only a handful of studies
among the many devoted to insect populations,
densities, or even crop damage, two important issues
are derived from it: (1) the type of plants used and the
design of the diversification scheme can determine
whether gains in pest regulation translate to higher or
more stable yields, and (2) multifactor cost–benefit
measures are needed to assess the net effects of crop
diversification schemes for growers. Certainly, the
combination of certain crops is not beneficial under
strong competition for light, water, or nutrients (e.g.,
Sastawa et al. 2004). In their case, the addition of two
crops to a soybean–millet intercrop reduced the
abundance and associated damage by three pest
species. However, the reduction in damage did not
compensate for yield decreases that were most likely
caused by crowding and shading. Also, our meta-
analysis results suggest that adding plant diversity
rather than substituting other plants such as trap crops
or repellent plants for the main crop will have positive
yield effects. As suggested by Andow (1991b), agro-
nomic considerations concerning crop–crop or crop–
noncrop compatibility and spatial arrangement of these
plants are important for designing successful pest-
suppressive diversification schemes that minimize crop
yield loss through plant–plant competition or plant
density effects (e.g., Sanchez 1981). Clearly, trade-off
effects for reducing herbivores at the expense of yield
can vary among crops. For example, Letourneau
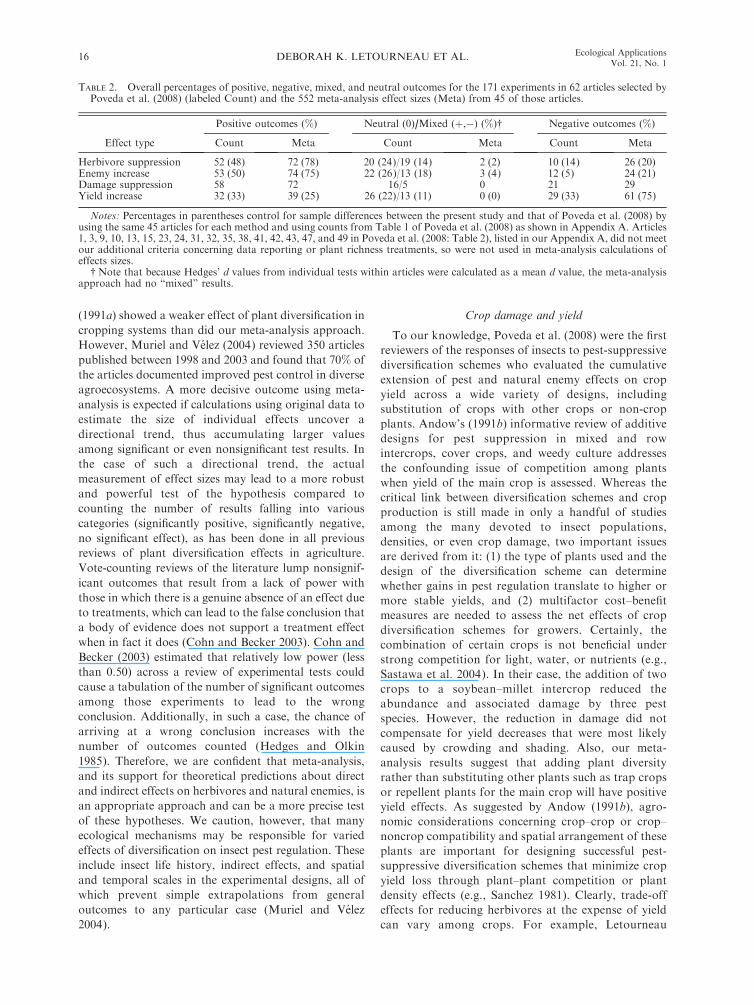
TABLE 2. Overall percentages of positive, negative, mixed, and neutral outcomes for the 171 experiments in 62 articles selected byPoveda et al. (2008) (labeled Count) and the 552 meta-analysis effect sizes (Meta) from 45 of those articles.
Effect type
Positive outcomes (%) Neutral (0)/Mixed (þ,�) (%)� Negative outcomes (%)
Count Meta Count Meta Count Meta
Herbivore suppression 52 (48) 72 (78) 20 (24)/19 (14) 2 (2) 10 (14) 26 (20)Enemy increase 53 (50) 74 (75) 22 (26)/13 (18) 3 (4) 12 (5) 24 (21)Damage suppression 58 72 16/5 0 21 29Yield increase 32 (33) 39 (25) 26 (22)/13 (11) 0 (0) 29 (33) 61 (75)
Notes: Percentages in parentheses control for sample differences between the present study and that of Poveda et al. (2008) byusing the same 45 articles for each method and using counts from Table 1 of Poveda et al. (2008) as shown in Appendix A. Articles1, 3, 9, 10, 13, 15, 23, 24, 31, 32, 35, 38, 41, 42, 43, 47, and 49 in Poveda et al. (2008: Table 2), listed in our Appendix A, did not meetour additional criteria concerning data reporting or plant richness treatments, so were not used in meta-analysis calculations ofeffects sizes.
� Note that because Hedges’ d values from individual tests within articles were calculated as a mean d value, the meta-analysisapproach had no ‘‘mixed’’ results.
DEBORAH K. LETOURNEAU ET AL.16 Ecological ApplicationsVol. 21, No. 1

(1986) found that the addition of maize intercrops to
squash monocultures increased parasitism rates and
reduced the abundance of most pest groups, decreased
squash yield, maintained maize yield, and increased
total production per unit land area. Lower yields in
intercropping systems using substitutive designs and
measuring yield only of the main crop, however, are
expected, because crop density is relatively lower in the
diversification scheme than in the control; thus, crop
yields in pest-suppressive schemes may be improved
simply by using an additive design. Increased crop yield
(positive mean effect size) in push–pull systems
incorporating repellent and attractive plants needs
further investigation because samples for individual
practices were relatively small and sometimes contra-
dictory. Even in the worst scenarios for crop yield loss
through diversification schemes aimed at reducing
herbivore pressure, we expect that environmental
benefits and input cost reduction are gained at the
expense of crop yield; these are parameters for which
speculations were offered, but not measured in most
studies. The assessment of ecosystem services resulting
from diversification schemes for pest regulation,
associated natural enemies, pollinators, crop damage,
and yield requires accumulation of quantitative data
through diagnostic on-farm assessments, especially
with farmer participation.
Sources of error and bias
There are at least three somewhat overlapping
primary explanations for a significant decrease in yield
with crop diversification in the studies that we reviewed.
First, the criteria used for the inclusion of studies in our
review limited the collection of articles on yield to those
that investigated aspects of herbivore abundance or
biological control of pests. Therefore, it is possible that
diversification schemes that are first and foremost pest-
suppressive designs have not undergone as strict an
agronomic analysis as is commonplace for experiments
conducted with the aim of increasing crop yield.
Whereas these studies are most appropriate for our
focus on insects, general reviews on intercropping have
found positive effects of plant diversification on yield
(e.g., Vandermeer 1989, Fukai and Trenbath 1993,
Sileshi et al. 2008), especially when the yields of all
crops are included in the analysis. Second, although we
excluded some experiments that were deemed by the
authors as experimental only, and not appropriate for
actual cropping schemes for production purposes, we
did not restrict our data to include only the optimal
diversity schemes designed for agronomic performance.
By including the wider range of ad hoc cropping
schemes for the diverse crop comparisons, we certainly
biased the results for main crop yields toward the less
favorable conclusion (Vandermeer 1998). These first two
sources of bias are conceptualized as a trade-off between
using vegetation diversity to control pests and taking up
space with that vegetation diversity, an issue that needs
to be taken into account in future planning (Fig. 3).
Assessment of this trade-off is a daunting task using
experimental approaches, requiring the development of
a theoretical framework (Vandermeer 1986).
A third source of bias with respect to outcomes on
crop yield is that we calculated mean effect sizes based
on yields from only the main crop (e.g., Adeniyi 2001).
That is, only the main crop yield was accounted for even
in intercrop systems, which are known to produce high
land-equivalent ratios (LER) or relative yield total
(RYT). Because LERs and RYTs take into account all
crop production on a unit of land, they often show a
total yield advantage (Vandermeer 1981, 1989).
Especially for additive designs of intercrops, push–pull
crop, or around-crop designs, pooling the yields of all
crops to calculate the LER or RYT probably would
have resulted in a more positive overall yield for the
diversification scheme than for a monoculture crop. In
addition to these three explanations, factors outside our
analysis include other ecosystem services such as
pollination, and compensatory factors such as pesticide
costs or land-use options, which have been shown to be
ecosystem services that are enhanced with plant
diversification through restoration practices (Rey
Benayas et al. 2009). Most of the articles in our review
reported on experiments conducted outside of the
context of working farms with integrative practices
supporting polycultures; diversification schemes in
isolation of other conservation or sustainability practic-
es may underestimate their potential.
FIG. 3. Conceptual figure of the trade-off between increasedcrop yield via herbivore suppression caused by vegetationaldiversity and decreased crop yield because of crop-plantcompetition with vegetational diversity, showing a negativerelationship, where diversification design decisions result inparticular points on the graph. The rapidly declining function,which may include substitutive designs that replace the cropitself with another plant or other highly competitive plants,coupled with less effective pest suppression characteristics, isnot likely to be a good strategy for controlling pests andincreasing net crop yield. However, the slowly decliningfunction shows the types of systems that are more favorable,and worthy of future research: those that minimize crop yieldloss through competition and substantially decrease cropdamage.
January 2011 17MIXED CROPPING, INSECTS, AND YIELD

A spin-off of the results indicating an overall slight,
but significant, decrease in crop yield within vegetational
diversification schemes concerns the potential for
unaccounted bias if herbivore response in some of the
experiments was confounded by crop quality.
Bukovinszky et al. (2004) used the ‘‘host-plant quality
hypothesis’’ to explain that plant stress through crowd-
ing and direct competition for light and nutrients may
cause consequent changes in the developmental rate and
nutritional quality of plants, which ultimately influences
herbivore population responses to intercropping. They
argued that such confounding effects of plant competi-
tion in intercropping designs can hamper the evaluation
of herbivore responses in pest-suppressive agroecosys-
tems. In some cases, that is, poor crop quality may be
associated with reduced herbivore density, but damage
to those crops may be greater, owing to more extensive
feeding by those herbivores that are utilizing a host plant
with lower nutrient content (Bukovinszky et al. 2004).
Although our overall result for crop damage was
indicative of a beneficial effect of added plant diversity,
it is not clear how many of the individual cases could
potentially be explained in this way. Because both
additive and substitutive designs showed significantly
suppressive effects of plant diversity on crop damage,
however, with the stronger effect for additive designs,
this potentially confounding factor was not operating
substantially in the overall results, at least for annual
crops tested in tropical agroecosystems.
In addition to the results presented in our review of
population processes that take place in and near crop
fields, recent research on processes occurring at larger
landscape scales highlights critical questions for the
conservation of biodiversity and ecological function in
agroecosystems (Roland and Taylor 1997, Thies et al.
2003, Tscharntke et al. 2005). Arable crop systems rely
on their surroundings more than other types of habitats
because they are highly disturbed habitats that depend
on recolonization from surrounding perennial habitats
(Wissinger 1997, Tscharntke et al. 1999, Roschewitz et
al. 2005). However, the results from large-scale studies
are equivocal. In a review of studies conducted in the
temperate zone, Bianchi et al. (2006) found no
significant effect of the complexity of the landscape on
pest pressure (in 45% of the articles, complexity reduced
pest pressure, but there was no effect in 40%, and
enhanced pest pressure in 15% of the articles). They
concluded that under certain conditions, and for certain
sets of pest species, non-crop habitats in the direct
vicinity of crops may attract generalist predators,
leading to reduced pest control in arable fields.
Vote-counting vs. meta-analysis
Is it worth the excruciating level of effort it takes to
extract data for a meta-analytic synthesis over the
simpler, and more intuitive method of outcome count-
ing? The original analysis was a sophisticated ‘‘count-
ing’’ method in which Poveda et al. (2008) derived a
categorical value (positive, negative, or mixed when the
effect of vegetational schemes were statistically signifi-
cant, or no effect) for each of 171 statistical tests
reported within the 62 papers. This approach is
straightforward, intuitive, and extremely common
(Rosenberg et al. 2000). Vote-counting reviews of the
effects of vegetational diversity on herbivore or pest
abundance have found that, in the majority or at least a
wide variety of cases, phytophagous insects occurred at
lower abundances on plants in mixed vegetation than on
plants in monoculture (Altieri and Letourneau 1984,
Andow 1991a, Muriel and Velez 2004). However, we
found that calculating effect sizes allowed for a stronger,
less ambiguous result for each of the hypotheses that we
tested as compared to the count-based review of Poveda
et al. (2008). A more decisive result is consistent with the
inability of counting methods to distinguish between
null findings that result from low power and null
findings that reflect a true absence of population effects
(Cohn and Becker 2003). Hedges and Olkin (1980)
showed that the statistical properties of this approach
(vote-counting) were problematic, in that more evidence
can lead to poorer decisions (Becker 2007). Although
Poveda et al. (2008) concluded that diversification
practices led to somewhat discouraging results, with
only half the cases reporting enhanced natural enemies
and reduced herbivores, we found unequivocal evidence
supporting the benefits of diversification practices on
suppressing herbivores and increasing natural enemies.
On the other hand, we also found stronger negative
results on crop production from diversification schemes.
Thus, rather than coming to wholly different conclu-
sions from the subset of articles we reviewed, we found
stronger support for the same proposed relationships
discovered by Poveda et al. (2008). The reduction in the
number of articles due to added criteria necessary for the
meta-analysis was compensated by the much greater
number of individual tests that were possible from those
articles using the meta-analysis. A larger data set
allowed for stronger statistical confidence, and the
ability to partition heterogeneity among the studies into
explanatory variables is an obvious advantage of meta-
analysis. That is, we were able to test more hypotheses
with greater confidence, test for publication bias, and
examine the structure of the underlying data with the
synthetic statistical approach.
Despite the stronger, quite positive conclusions about
cropping diversification schemes resulting from our
meta-analysis, we agree with the basic conclusions of
Poveda et al. (2008) that, on a case-by-case basis,
diversification schemes have variable results, even on the
parameters that showed the strongest overall effect sizes.
On the one hand, our quantitative synthesis showed that
plant diversification schemes designed to disrupt or
confuse herbivores and those designed to move herbi-
vores away from crops were effective, overall, in
achieving their goals. On the other hand, there were
many exceptions. For example, intercropping with
DEBORAH K. LETOURNEAU ET AL.18 Ecological ApplicationsVol. 21, No. 1
additional host plants of the pest caused an increase in
pest problems (Ngeve 2003); McIntyre et al. (2001) were
unable to detect a repellent effect of their intercropped
legumes on the banana pest that they had targeted for
control. Unlike some of the past reviews, which found
weaker effects of plant diversification on natural enemies
than on their herbivorous prey (Risch et al. 1983,
Andow 1991a), the potential for top-down control was
strongly enhanced with the provision of pollen and
nectar resources in these recent studies. However,
experimental field manipulation that provides insight
about the underlying mechanisms that lead to the small
and large, negative and positive, effect sizes such as
found in our analysis are generally lacking in studies of
plant diversity, herbivores, and their natural enemies
(see Bukovinszky and van Lenteren 2007). The relatively
few mechanistic manipulations or predictive modeling
approaches that dot the historical literature landscape
(e.g., Waage 1983, Letourneau 1990, Hamback et al.
2000, Potting et al. 2005, Frank et al. 2007, Haddad et
al. 2009, Winkler et al. 2009) help to move from
observational to predictive results in the application of
theory.
In conclusion, our analysis depicts strong evidence of
the positive impact of plant diversification on agricul-
tural systems, supporting theoretical predictions about
pest suppression effects (Tahvanainen and Root 1972,
Root 1973, Vandermeer 1989) and substantiating a gap
between employing crop-suppressive diversity schemes
and improving crop yields (Poveda et al. 2008). Meta-
analysis allowed for a stronger level of detection for
these effects than previous vote-counting methods (e.g.,
Andow 1991a, Poveda et al. 2008). The strong positive
results found in our meta-analysis for using diversifi-
cation schemes in agroecosystems shows that decades
of funding for this scientific research has been useful
and encouraging, but our work is not yet completed.
The variability in responses discussed by Poveda et al.
(2008) indicates that ecologists have an important role
to play in discerning which schemes deliver the desired
results for herbivore suppression and biological con-
trol, and what underlying mechanisms can be used to
predict the ‘‘right kind of diversity’’ for providing these
ecosystem services for pest regulation while maintain-
ing crop yield.
ACKNOWLEDGMENTS
K. Poveda kindly provided databases and materials, and theDepartment of Biology of the Universidad del Valle, Cali,Colombia provided logistical resources and facilities forconducting the meta-analysis. Excellent advice on meta-analysiswas offered by J. Gurevitch, and advice on calculatingcumulative variances was offered by D. Cardona-Salgado.Comments by J. Vandermeer, J. Jedlicka, T. Cornelisse, H.Briggs, and an anonymous reviewer improved earlier drafts.Funding was provided by the Fulbright Commission ofColombia and a U.S. Fulbright Fellowship to D. K.Letourneau, USDA-NRI grant #2005-0288 to D. K.Letourneau, and a University of California–Santa CruzFaculty Research grant.
LITERATURE CITED
Adeniyi, O. R. 2001. An economic evaluation of intercroppingwith tomato and okra in a rain forest zone of Nigeria.Journal of Horticultural Science and Biotechnology 76:347–349.
Altieri, M. A., and D. A. Letourneau. 1984. Vegetationaldiversity and insect pest outbreaks. Critical Reviews in PlantSciences 2:131–169.
Altieri, M. A., D. K. Letourneau, and J. R. Davis. 1983.Developing sustainable agroecosystems. BioScience 33:45–49.
Altieri, M. A., and W. H. Whitcomb. 1979. Potential use ofweeds in the manipulation of beneficial insects. Hortscience14:12–18.
Andow, D. A. 1991a. Vegetational diversity and arthropodpopulation response. Annual Review of Entomology 36:561–586.
Andow, D. A. 1991b. Yield loss to arthropods in vegetationallydiverse agroecosystems. Environmental Entomology 20:1228–1235.
Andow, D. A., and S. J. Risch. 1985. Predation in diversifiedagroecosystems: relations between a coccinellid predatorColeomegilla maculata and its food. Journal of AppliedEcology 22:357–372.
Attwood, S. J., M. Maron, A. P. N. House, and C. Zammit.2008. Do arthropod assemblages display globally consistentresponses to intensified agricultural land use and manage-ment? Global Ecology and Biogeography 17:585–599.
Barbosa, P. 1998. Conservation biological control. AcademicPress, New York, New York, USA.
Barbosa, P., J. Hines, I. Kaplan, H. Martinson, A. Szczepaniec,and Z. Szendrei. 2009. Associational resistance and associ-ational susceptibility: Having right or wrong neighbors.Annual Review of Ecology, Evolution, and Systematics 40:1–20.
Becker, B. J. 2007. Multivariate meta-analysis: Contributions ofIngram Olkin. Statistical Science 22:401–406.
Bianchi, F., C. J. H. Booij, and T. Tscharntke. 2006.Sustainable pest regulation in agricultural landscapes: areview on landscape composition, biodiversity and naturalpest control. Proceedings of the Royal Society B 273:1715–1727.
Bukovinszky, T., H. Trefas, J. C. van Lenteren, L. E. M. Vet,and J. Fremont. 2004. Plant competition in pest-suppressiveintercropping systems complicates evaluation of herbivoreresponses. Agriculture Ecosystems and Environment 102:185–196.
Bukovinszky, T., and J. C. van Lenteren. 2007. How to designpest-suppressing intercropping systems? EntomologischeBerichten (Amsterdam) 67:231–234.
Butler, S. J., J. A. Vickery, and K. Norris. 2007. Farmlandbiodiversity and the footprint of agriculture. Science 315:381–384.
Capinera, J. L. 2005. Relationships between insect pests andweeds: an evolutionary perspective. Weed Science 53:892–901.
Cohn, L. D., and B. J. Becker. 2003. How meta-analysisincreases statistical power. Psychological Methods 8:243–253.
Cooper, H. 1998. Synthesizing research: a guide for literaturereviews. Third edition. Sage, Thousand Oaks, California,USA.
Finch, S., and R. H. Collier. 2000. Host-plant selection byinsects: a theory based on ‘appropriate/inappropriate land-ings’ by pest insects of cruciferous plants. EntomologiaExperimentalis et Applicata 96:91–102.
Frank, S. D., S. D. Wratten, H. S. Sandhu, and P. M.Shrewsbury. 2007. Video analysis to determine how habitatstrata affects predator diversity and predation of Epiphyas
January 2011 19MIXED CROPPING, INSECTS, AND YIELD
postvittana (Lepidoptera: Tortricidae) in a vineyard. Biolog-ical Control 41:230–236.
Fukai, S., and B. R. Trenbath. 1993. Processes determiningintercrop productivity and yields of component crops. FieldCrops Research 34:247–271.
Gols, R., T. Bukovinszky, L. Hemerik, J. A. Harvey, J. C. vanLenteren, and L. E. M. Vet. 2005. Reduced foragingefficiency of a parasitoid under habitat complexity: implica-tions for population stability and species coexistence. Journalof Animal Ecology 74:1059–1068.
Gurevitch, J., and L. V. Hedges. 1993. Meta-analysis:combining the results of independent experiments. Pages378–398 in S. Scheiner and J. Gurevitch, editors. Design andanalysis of experiments. Chapman and Hall, New York, NewYork, USA.
Gurevitch, J., and L. V. Hedges. 1999. Statistical issues inecological meta-analyses. Ecology 80:1142–1149.
Gurr, G. M., S. D. Wratten, and J. M. Luna. 2003. Multi-function agricultural biodiversity: pest management andother benefits. Basic and Applied Ecology 4:107–116.
Haddad, N. M., G. M. Crutsinger, K. Gross, J. Haarstad,J. M. H. Knops, and D. Tilman. 2009. Plant species lossdecreases arthropod diversity and shifts trophic structure.Ecology Letters 12:1029–1039.
Halaj, J., and D. H. Wise. 2001. Terrestrial trophic cascades:How much do they trickle? American Naturalist 157:262–281.
Hamback, P. A., J. Agren, and L. Ericson. 2000. Associationalresistance: insect damage to purple loosestrife reduced inthickets of sweet gale. Ecology 81:1784–1794.
Hedges, L. V., and I. Olkin. 1980. Vote-counting methods inresearch synthesis. Psychological Bulletin 88:359–369.
Hedges, L. V., and I. Olkin. 1985. Statistical methods for meta-analysis. Academic Press, Orlando, Florida, USA.
Hendrickx, F., et al. 2007. How landscape structure, land-useintensity and habitat diversity affect components of totalarthropod diversity in agricultural landscapes. Journal ofApplied Ecology 44:340–351.
Hunter, J. E., F. L. Schmidt, and G. B. Jackson. 1982. Meta-analysis: cumulating research findings across studies. Sage,Beverly Hills, California, USA.
Letourneau, D. K. 1986. Associational resistance in squashmonocultures and polycultures in tropical Mexico. Environ-mental Entomology 15:285–292.
Letourneau, D. K. 1990. Abundance patterns of leafhopperenemies in pure and mixed stands. Environmental Entomol-ogy 19:505–509.
Letourneau, D. K. 1998. Conservation biology: Lessons forconserving natural enemies. Pages 9–37 in P. Barbosa, editor.Conservation biological control. Academic Press, New York,New York, USA.
McIntyre, B. D., C. S. Gold, I. N. Kashaija, H. Ssali, G. Night,and D. P. Bwamiki. 2001. Effects of legume intercrops onsoil-borne pests, biomass, nutrients and soil water in banana.Biology and Fertility of Soils 34:342–348.
Muriel, S. B., and L. D. Velez. 2004. Evaluando la diversidad deplantas en los agroecosistemas como estrategia para elcontrol de plagas. Manejo Integrado de Plagas y Agro-ecologıa (Costa Rica) 71:13–20.
Ngeve, J. M. 2003. The cassava root mealybug (Stictococcusvayssierei Richard) (Homoptera: Stictococcidae): a threat tocassava production and utilization in Cameroon. Interna-tional Journal of Pest Management 49:327–333.
Perfecto, I., and L. E. M. Vet. 2003. Effect of a nonhost planton the location behavior of two parasitoids: the tritrophicsystem of Cotesia spp. (Hymenoptera: Braconidae), Pierisrapae (Lepidoptera: Pieridae), and Brassica oleraceae. Envi-ronmental Entomology 32:163–174.
Pickett, C. H., and R. L. Bugg, editors. 1998. Enhancingbiological control: habitat management to promote natural
enemies of agricultural pests. University of California Press,Berkeley, California, USA.
Pimentel, D. 1961. Species diversity and insect populationoutbreaks. Annals of the Entomological Society of America54:76–86.
Potting, R. P. J., J. N. Perry, and W. Powell. 2005. Insectbehavioural ecology and other factors affecting the controlefficacy of agro-ecosystem diversification strategies. Ecolog-ical Modelling 182:199–216.
Poveda, K., M. I. Gomez, and E. Martinez. 2008. Diversifica-tion practices: their effect on pest regulation and production.Revista Colombiana de Entomologia 34:131–144.
Rey Benayas, J. M., A. C. Newton, A. Diaz, and J. M. Bullock.2009. Enhancement of biodiversity and ecosystem services byecological restoration: a meta-analysis. Science 325:1121–1124.
Risch, S. J., D. Andow, and M. A. Altieri. 1983. Agroecosystemdiversity and pest control: data, tentative conclusions, andnew research directions. Environmental Entomology 12:625–629.
Roland, J., and P. D. Taylor. 1997. Insect parasitoid speciesrespond to forest structure at different spatial scales. Nature386:710–713.
Root, R. B. 1973. Organization of a plant–arthropod associ-ation in simple and diverse habitats: fauna of collards(Brassica oleracea). Ecological Monographs 43:95–120.
Roschewitz, I., M. Hucker, T. Tscharntke, and C. Thies. 2005.The influence of landscape context and farming practices onparasitism of cereal aphids. Agriculture Ecosystems andEnvironment 108:218–227.
Rosenberg, M. S., D. C. Adams, and J. Gurevitch. 2000.MetaWin: statistical software for meta-analysis. Secondedition. Sinauer Associates, Sunderland, Massachusetts,USA.
Rosenthal, R., R. L. Rosnow, and D. B. Rubin. 2000.Contrasts and effect sizes in behavioral research: a correla-tional approach. Cambridge University Press, New York,New York, USA.
Sanchez, P. A. 1981. Suelos del Tropico, Caracterısticas yManejo. Instituto Interamericano de Cooperacion para laAgricultura (IICA), San Jose, Costa Rica.
Sastawa, B. M., M. Lawan, and Y. T. Maina. 2004.Management of insect pests of soybean: effects of sowingdate and intercropping on damage and grain yield in theNigerian Sudan savanna. Crop Protection 23:155–161.
Schmidt, F., I. Oh, and T. Hayes. 2009. Fixed- versus random-effects models in meta-analysis: model properties and anempirical comparison of differences in results. British Journalof Mathematical and Statistical Psychology 62:97–128.
Sheehan, W. 1986. Response by specialist and generalist naturalenemies to agroecosystem diversification: a selective review.Environmental Entomology 15:456–461.
Sileshi, G., F. K. Akinnifesi, O. C. Ajayi, and F. Place. 2008.Meta-analysis of maize yield response to woody andherbaceous legumes in sub-Saharan Africa. Plant and Soil307:1–19.
Southwood, T. R. E., and M. J. Way. 1970. Ecologicalbackground to pest management. Pages 6–29 in R. L. Rabband F. E. Guthrie, editors. Concepts of pest management.North Carolina State University, Raleigh, North Carolina,USA.
Stram, D. O. 1996. Meta-analysis of published data using alinear mixed-effects model. Biometrics 52:536–544.
Tahvanainen, J., and R. B. Root. 1972. Influence of vegeta-tional diversity on population ecology of a specializedherbivore, Phyllotreta cruciferae (Coleoptera, Chrysomeli-dae). Oecologia 10:321–346.
Thies, C., I. Steffan-Dewenter, and T. Tscharntke. 2003. Effectsof landscape context on herbivory and parasitism at differentspatial scales. Oikos 101:18–25.
DEBORAH K. LETOURNEAU ET AL.20 Ecological ApplicationsVol. 21, No. 1
Tscharntke, T., A. M. Klein, A. Kruess, I. Steffan-Dewenter,and C. Thies. 2005. Landscape perspectives on agriculturalintensification and biodiversity: ecosystem service manage-ment. Ecology Letters 8:857–874.
Tscharntke, T., A. Kruess, B. A. Hawkins, and H. V. Cornell.1999. Habitat fragmentation and biological control. Pages190–205 in B. A. Hawkins and H. V. Cornell, editors.Theoretical approaches to biological control. CambridgeUniversity Press, Cambridge, UK.
Uvah, I., and T. H. Coaker. 1984. Effect of mixed cropping onsome insect pests of carrots and onions. EntomologiaExperimentalis et Applicata 36:159–167.
Vandermeer, J. 1981. The interference production principle: anecological theory for agriculture. BioScience 31:361–364.
Vandermeer, J. 1986. A computer-based technique for rapidlyscreening intercropping designs. Experimental Agriculture22:215–232.
Vandermeer, J. H. 1989. The ecology of intercropping. Cam-bridge University Press, New York, New York, USA.
Vandermeer, J. 1998. Maximizing crop yield in alley crops.Agroforestry Systems 40:199–206.
van Emden, H. F., and G. F. Williams. 1974. Insect stabilityand diversity in agroecosystems. Annual Reviews of Ento-mology 19:455–475.
Waage, J. K. 1983. Aggregation in field parasitoid populations:foraging time allocation by a population of Diadegma(Hymenoptera, Ichneumonidae). Ecological Entomology 8:447–453.
Wardle, D. A., and W. H. van der Putten. 2002. Biodiversity,ecosystem functioning and above-ground–below-groundlinkages. Pages 155–168 in M. Loreau, S. Naeem, and P.Inchausti, editors. Biodiversity and ecosystem functioning:synthesis and perspectives. Oxford University Press, Oxford,UK.
Wilby, A., and M. B. Thomas. 2002. Natural enemy diversityand pest control: patterns of pest emergence with agriculturalintensification. Ecological Letters 5:353–360.
Winkler, K., F. L. Wackers, L. V. Kaufman, V. Larraz, andJ. C. van Lenteren. 2009. Nectar exploitation by herbivoresand their parasitoids is a function of flower species andrelative humidity. Biological Control 50:299–306.
Wissinger, S. A. 1997. Cyclic colonization in predictablyephemeral habitats: a template for biological control inannual crop systems. Biological Control 10:4–15.
Zak, D. R., W. E. Holmes, D. C. White, A. D. Peacock, and D.Tilman. 2003. Plant diversity, soil microbial communities,and ecosystem function: Are there any links? Ecology 84:2042–2050.
APPENDIX A
Numbered list of 62 articles used in a previous review (Poveda et al. 2008), including 45 articles used in the present meta-analysis(Ecological Archives A021-001-A1).
APPENDIX B
Salquero-Rivera method for calculating a grand standard deviation for a series of measurements each of which has an associatedstandard error or standard deviation (Ecological Archives A021-001-A2).
APPENDIX C
Normal plot of Hedges’ d values (Ecological Archives A021-001-A3).
APPENDIX D
An article-by-article comparison of individual outcome counts from statistical tests (Poveda et al. 2008) with mean or individualHedges’ d effect sizes calculated in the present study, using only the 45 articles reviewed in common (Ecological ArchivesA021-001-A4).
January 2011 21MIXED CROPPING, INSECTS, AND YIELD