The growth and development of project management in the United Kingdom construction industry
eScholarship provides open access, scholarly publishingservices to the University of California and delivers a dynamicresearch platform to scholars worldwide.
California Center for Population ResearchUC Los Angeles
Title:Does Education Improve Citizenship? Evidence from the U.S. and the U.K.
Author:Milligan, Kevin S, University of British ColumbiaMoretti, Enrico, UCLA and NBEROREOPOULOS, PHILIP, University of Toronto
Publication Date:03-01-2003
Series:On-Line Working Paper Series
Publication Info:On-Line Working Paper Series, California Center for Population Research, UC Los Angeles
Permalink:http://escholarship.org/uc/item/6qw5h964
Additional Info:Published in: Journal of Public Economics, 2004, Vol. 88, Issue 9-10, pp. 1667-1695
Abstract:Many economists and educators of diverse political beliefs favor public support for educationon the premise that a more educated electorate enhances the quality of democracy. Whilesome earlier studies document an association between schooling and citizenship, little attempthas been made to address the possibility that unobservable characteristics of citizens underliethis relationship. This paper explores the effect of extra schooling induced through compulsoryschooling laws on the likelihood of becoming politically involved in the US and the UK. We findthat educational attainment is related to several measures of political interest and involvementin both countries. For voter turnout, we find a strong and robust relationship between educationand voting for the US, but not for the UK. Using the information on validated voting, we find thatmisreporting of voter status can not explain our estimates. Our results suggest that the observeddrop in voter turnout in the US from 1964 to 2000 would have been 10.4 to 12.3 percentage pointsgreater if high school attainment had stayed at 1964 rates, holding all else constant. However,when we condition on registration, our US results approach the UK findings. This may indicatethat registration rules present a barrier to low-educated citizens' participation.
DDooeess EEdduuccaattiioonn IImmpprroovvee CCiittiizzeennsshhiipp?? EEvviiddeennccee ffrroomm tthhee UU..SS.. aanndd tthhee UU..KK.. Kevin Milligan Enrico Moretti Philip Oreopoulos CCPR-013-03 March 2003
California Center for Population Research
On-Line Working Paper Series
NBER WORKING PAPER SERIES
DOES EDUCATION IMPROVE CITIZENSHIP?EVIDENCE FROM THE U.S. AND THE U.K.
Kevin MilliganEnrico Moretti
Philip Oreopoulos
Working Paper 9584http://www.nber.org/papers/w9584
NATIONAL BUREAU OF ECONOMIC RESEARCH1050 Massachusetts Avenue
Cambridge, MA 02138March 2003
We are grateful to Joshua Angrist and Daron Acemoglu for providing their compulsory schooling data. Wethank participants of UBC’s empirical lunch workshop for many helpful comments. We also thank FredCutler, Sonia Laszlo and Michael Smart for their comments on an earlier draft. The views expressed hereinare those of the authors and not necessarily those of the National Bureau of Economic Research.
©2003 by Kevin Milligan, Enrico Moretti, and Philip Oreopoulos. All rights reserved. Short sections of textnot to exceed two paragraphs, may be quoted without explicit permission provided that full credit including©notice, is given to the source.
Does Education Improve Citizenship? Evidence from the U.S. and the U.K.Kevin Milligan, Enrico Moretti, and Philip OreopoulosNBER Working Paper No. 9584March 2003JEL No. I2
ABSTRACT
Many economists and educators of diverse political beliefs favor public support for education on thepremise that a more educated electorate enhances the quality of democracy. While some earlierstudies document an association between schooling and citizenship, little attempt has been made toaddress the possibility that unobservable characteristics of citizens underlie this relationship. Thispaper explores the effect of extra schooling induced through compulsory schooling laws on thelikelihood of becoming politically involved in the US and the UK. We find that educationalattainment is related to several measures of political interest and involvement in both countries. Forvoter turnout, we find a strong and robust relationship between education and voting for the US, butnot for the UK. Using the information on validated voting, we find that misreporting of voter statuscan not explain our estimates. Our results suggest that the observed drop in voter turnout in the USfrom 1964 to 2000 would have been 10.4 to 12.3 percentage points greater if high school attainmenthad stayed at 1964 rates, holding all else constant. However, when we condition on registration, ourUS results approach the UK findings. This may indicate that registration rules present a barrier tolow-educated citizens’ participation.
Kevin Milligan Enrico MorettiDepartment of Economics Department of EconomicsUniversity of British Columbia UCLA#997-1873 East Mall Los Angeles, CA 90095-1477Vancouver, B.C. and NBERCanada, V6T 1Z1 [email protected] [email protected]
Philip OreopoulosDepartment of EconomicsUniversity of Toronto150 St. George StreetToronto, ONCanada, M5S [email protected]
1 Introduction
The commonwealth requires the education of the people as the safeguard of order and
liberty.
— Inscription above the entrance to the Boston Public Library.
A large body of research in the last 30 years shows that schooling has a significant private
return in terms of increased earnings. Yet, it is possible that education creates other benefits to
society that are not reflected in the earnings of the educated. One potentially important example
of such positive externalities of education is enhanced political behaviour. Economists, educators
and politicians commonly argue that one of the benefits of education is that a more educated
electorate enhances the quality of democracy. If this is true, then education has social benefits over
and above the private return, and Pigouvian subsidies for education may produce more efficient
education acquisition decisions.
Interestingly, the argument that education generates positive externalities through its effects
on political behavior is not raised only by those who support a larger role for the government.1
The same argument resonates with noted advocates of a limited role for government, such as Adam
Smith and Milton Friedman.2 For example, Friedman (1962) argues that
“A stable and democratic society is impossible without a minimum degree of literacy
and knowledge on the part of most citizens and without widespread acceptance of some
common set of values. Education can contribute to both. In consequence, the gain from
education of a child accrues not only to the child or to his parents but also to other
members of the society. [...] Most of us would probably conclude that the gains are
sufficiently important to justify some government subsidy.”
Why might education affect political behavior? The benefit of education may accrue either
through the enhanced quality of participation by a given subset of citizens, or through broader1For example, the Center on Education Policy, a liberal think thank that promotes public schools, argues that
“The survival of a representative democracy like the United States ultimately depends on having a large group ofwell-educated citizens.” Schools prepare students to be good citizens in three ways: “(1) teach students about therole of government in the United States; (2) uphold civic values by teaching students to be good citizens; (3) equipstudents with the civic skills they need to be effective participants in a representative democracy”.
2Smith (1776) emphasizes the benefits of increased cognitive capacity among the “common people”, claiming that“They are more disposed to examine, and more capable of seeing through, the interested complaints of faction andsedition, and they are, upon that account, less apt to be misled into any wanton or unnecessary opposition to themeasures of government.”
2

participation among the citizenry. The first channel is important if education equips citizens with
the cognitive skills they need to be effective participants in a representative democracy. In this
case, education increases citizens’ ability to select able leaders, understand the issues upon which
they will vote, act as a check on the potential excesses of the government, and recognize corruption
in leaders.
The second channel is important if education improves citizens’ interest and knowledge of po-
litical issues, their involvement in the political process and, ultimately, the effectiveness of their
political participation. Economists commonly argue that education provides important social ben-
efits through enhanced civic participation. Hanushek (2002), among many others, makes this
argument in his survey of public education.3
In our paper, we focus on this second channel. Although establishing the link between schooling
and the quality of political choices would be potentially more interesting, such a topic is hard to
investigate empirically. We can think of no way to measure objectively the quality of decisions
made by the electorate.
We empirically test whether schooling improves civic participation in the United States and the
United Kingdom, as measured by the probability of voting.4 We also test whether more educated
voters have better information on candidates and campaigns.5 Finally, we test whether education
increases other measures of political participation, such as the probability of attending political or
community meetings, working on community issues, and more in general, being politically active.6
To account for unobserved characteristics of individuals that may affect both schooling and
political participation, we use an instrumental variable strategy. We measure the effects of schooling3There are several theoretical models that suggest a link between education and civic participation. Verba and
Nie (1972) argues that individuals with higher socioeconomic status may have higher cognitive skills, benefit fromthe higher effectiveness of their participation, possess more knowledge about the issues, or be influenced by peereffects from other high SES individuals. It is also possible that skills acquired from additional schooling may help anindividual overcome the bureaucratic inconveniences and difficulties in registering to vote (Wolfinger and Rosenstone(1980)). Feddersen and Pesendorfer (1996) develop a positive model in which low-education voters prefer to abstainso that the votes of better-informed voters will carry more weight. In their model the non-voting of the low-educatedis a result of their relative lack of education— providing more education to them will only increase voting if theeducation level of the rest of society stands still. This approach contrasts with the emphasis in Verba and Nie (1972)and Wolfinger and Rosenstone (1980)) on absolute levels of education.
4Our focus on the United States and the United Kingdom derives from two reasons. First, both countries offeradequate microdata surveys to study the questions we ask. Second, our instrumental variable strategy requires clear,identifiable, and binding changes in compulsory schooling laws.
5This evidence speaks, at least indirectly, to the issue of quality of political choice.6At a late stage in the preparation of our manuscript, we became aware of a similar paper to ours, Dee (2002).
Although the data sources and some outcome variables are different, the question addressed by the paper is similarto ours.
3
through changes in compulsory school laws across different regions at different times. The approach
identifies the effect of schooling on citizenship from extending duration in school for would-be-
dropouts.
We find a strong effect of education on voting in the US. The effect appears largely to be
accounted for by differences in voting registration across education groups. Results from the UK,
where persons are legally responsible and actively assisted to register, show little effect of education
on voting. We also find strong and persistent effects of education on civic behavior in both the
US and the UK. Better educated adults are more likely to follow election campaigns in the media,
discuss politics with others, associate with a political group, and work on community issues.
Misreporting is well known to be prevalent in voting turnout data. One concern is that our
finding could simply reflect an higher probability of over-reporting voting among educated individ-
uals. Using information on the validation of voting status of respondents based on official voting
records, we directly test whether misreporting by survey respondents affects our conclusions on the
relationship between voting and education. We conclude that misreporting is not systematically
correlated with education and therefore does not affect our estimates.
Overall, our results for the US lend support to the argument that education generates positive
externalities in the form of enhanced political behaviour. Our findings indicate that education
benefits a representative democracy both by increasing the quantity of citizens’ involvement in
the electoral process (increased probability of voting) as well as the quality of their involvement
(increased information on candidates and political parties).
Below, we begin by giving some background on registration and voting in the US and the UK
and describing the data sources we employ. Sections 4 and 5 provide the empirical results for
voting and for other civic outcomes, respectively. We conclude the paper with a discussion of the
implications of our results.
2 Voting and Registration
A vast body of empirical research in political science has studied civic participation. Verba and
Nie (1972) provides some of the first micro-empirical evidence of a strong link between socio-
economic status (SES) and political participation. Wolfinger and Rosenstone (1980) break down
SES into separate income and education effects and find the influence of education to be stronger
4
than income.7 Powell (1985) suggests that the SES-participation link is much stronger in the US
than in other industrialized countries. An important weakness of the existing evidence lies in the
treatment of causality. Lacking a strategy to address the potential endogeneity of schooling, the
evidence available in the existing literature offers little firm evidence on the causal nature of the
relationship.8
In order to understand the institutional context in which voting decisions are made, we provide
some detail on voting and registration for each of the two countries we study.
The responsibility of registering to vote in the US rests mainly with the individual. Each state
determines its own registration laws, subject to certain limitations imposed at the federal level.
At the time our data was collected, most states required registering directly at specific regional
offices, during particular hours. Some states required registering more than a month in advance
of an election, and some offices were open only during working hours (Wolfinger and Rosenstone
(1980)). Many states made it easier to register through the 1970s by allowing mail-in registration
and registration while renewing drivers’ licenses. In 1993, the National Voter Registration Act
(commonly called the ‘motor-voter law’) was passed federally, mandating mail-in and agency-based
registration in all states.
How does registration affect voting? Registration raises the costs of voting, and particularly
affects those who find it difficult to deal with bureaucratic hurdles associated with the process.
Procrastinators may also be affected by registration, as voters must plan to vote well in advance.
If the low-educated are less motivated or less able to overcome these barriers, then registration is
predicted to adversely affect their voting turnout behavior.
Empirical analysis of these reforms suggest a modest effect on voter turnout. Knack (1995)
analyzes the 1970s and 1980s variation in registration laws and finds a positive effect on registration,
and that about half of the new registrants vote. Martinez and Hill (1999) looks at the 1992 and 1996
elections, finding little evidence of an impact of the 1993 federal motor-voter law. Highton (1997)
compares states with high registration barriers to states with low barriers, finding that the effect of7Teixeira (1987), Leighley and Nagler (1992), and Weisberg and Box-Steffensmeier (1999) empirically demonstrate
the persistence of these effects through the 1980s and 1990s. Helliwell and Putnam (1999) study the effect of educationon various measures of social engagement, finding that individual education has a much stronger affect than aggregatemeasures of education.
8One exception is Brady et al. (1995), in which the authors examine the potential endogeneity of political interestusing religious engagement, parents’ education, and other variables as instrumental variables. However, it seemslikely that these instruments could be related to unobserved heterogeneity in political activity; that they are jointlydetermined.
5
the barriers is modest, but hits harder among low-educated voters. Finally, Flanigan and Zingale
(2002) argues that if registration expansions lead to low-interest citizens becoming registered, little
impact may be seen on voter turnout.
Unlike the United States, the responsibility to maintain the electoral register in Britain rests
with local government officials.9 As a consequence, only 5.9 percent of the British electorate are
currently not registered.10 The process for compiling the register explains this low fraction. Each
year, Electoral Registration Officers update the register. A form is sent to every household in a
region asking for the householder to indicate the names of all those in the household qualified to
be included on the list. If a reply is not received a reminder is delivered and then a personal visit
made to all households who have not returned at least one form. Although electors have the right
not to vote, they incur a fine for failing to return a completed form or for giving false information.
The penalty was first imposed in 1918, with the current fine for this offence not exceeding 1000
pounds (United Kingdom (2002)).
3 Data
We examine voting behavior and other citizenship outcomes in the United States using the annual
National Elections Studies and the November Current Population Surveys. We use the British
General Election Studies and the Eurobarometer Surveys for our UK analysis. Below, we describe
these datasets. We also discuss the issue of measurement error in citizenship variables, and describe
how we address this issue in the empirical analysis.
3.1 US Data sets
The two datasets we employ for the US complement each other in many ways. Our primary
source of data is the complete set of pooled biannual National Election Studies (NES) compiled
by Shapiro et al. (2001), spanning the period 1948 to 2000. These data are the premier source
for analysis of voting behavior in the United States, and are used regularly for empirical studies
by political scientists. The survey is collected with telephone and in-person interviews, before and
after the election. The dataset pulls together demographic information on the respondent with
a wide and deep variety of questions about political affiliations, voting behavior, knowledge, and9The responsibility dates back to the passage of the Representation of the People Act of 1918.
10This figured is based on verified reports in the 1997 British Election Study.
6

attitudes. Importantly for our instrumental variables strategy, the survey reports the state in which
the respondent received his or her education. The sample size for the survey ranges from 662 in
1948 up to 2485 in 1992. We select only those individuals with valid responses to the variables we
use. Since some questions weren’t asked in all years, the exact number of observations varies across
specifications.
The key voting turnout measure we employ is formed from a question in the NES about voting
in the November elections. From 1978 on, the question in the survey was: “In talking to people
about the election we often find that a lot of people weren’t able to vote because they weren’t
registered or they were sick or they just didn’t have time. How about you, did you vote in the
elections this November?” The wording of the question changed only slightly through the time
period we study. As well, no differentiation is made among votes for different offices that may be
up for election on election day. From this question we form a binary variable for self-reported voter
turnout.
We complement our use of the NES with the 1994 to 2000 waves of the November voting
supplement to the Current Population Survey (CPS). The CPS allows us to form variables for
being registered and having voted, but no broader citizenship measures. While it reports the
current state of residence, we do not observe the state in which the individual grew up. This means
that the assignment of school leaving laws must assume that there has been no migration since
childhood. We keep only those observations with valid responses to the variables we use. The
primary advantage of the CPS is its sample size, totalling 218,865 over the four waves we use.
3.2 UK Data sets
Two datasets comprise our sources for Great Britain. First, the British Election Studies (BES)
collect data for describing and explaining the outcome of general elections. The surveys have
been taken immediately after every general election in Britain since 1964, as well as during two
non-election years. We combine the survey years for 1964, 1974, 1979, 1983, 1987, 1992, and 1997.11
The combined dataset contains information on gender, age, age finished full-time education, and
voting behavior, with a total sample of 17,825 adults aged 18 or older, who reached age 14 between
1925 and 1990. The BES is the only study in the UK to ask a large sample of adults whether
they voted or not during the past general election. As with the NES, for most of the survey years,11We omit the 1969 study for lack of a comparable education attainment variable.
7
individuals were checked for the accuracy of their response on voting behavior by consulting actual
Electoral Register records. Verifying survey records with marked and unmarked Electoral Registers
provides a rare opportunity to investigate response bias and, importantly, whether misreporting
relates to education attainment or other observable characteristics.
Except for 1997, the BES is not a representative sample of the British population, but instead
a sample of those on the electoral register and eligible to vote. The sample is drawn from the
register itself. Thus, results from the combined datasets are conditional on being in the register.
An analysis using a nationally representative sample is possible using the 1997 BES. For 1997, the
sample was drawn from a household address list rather than from the electoral register. Using this
survey year only, however, reduces the total sample size to 3,390.
Our second source of UK data is the Eurobarometer survey. The Eurobarometers were first
assembled in 1970 by the Commission of the European Community, and are designed to track
opinions and attitudes among European citizens. Each nationally representative survey contains a
sample of about 1,000 individuals from Britain, and 300 individuals from Northern Ireland. Surveys
are carried out more than once a year, from 1973 to 1998. A total of 50 surveys are combined to
create a dataset with 63,858 individuals who reached age 14 at some point between 1925 and 1990.
The Eurobarometers contain many questions on voting preferences and political activity. Re-
spondents were interviewed and asked, “When you hold a strong opinion, do you ever find yourself
persuading your friends, relatives, or fellow workers to share your views?” and, “When you get to-
gether with friends, would you say you discuss political matters frequently, occasionally, or never?”
Interviewers also asked questions about how often respondents watch news on television or read a
newspaper, and whether they consider themselves close to any particular party. The Eurobarome-
ters also collect demographic information on age, age finished full time education, and gender.
The Eurobarometers do not contain information on voter turnout, but they do contain a mul-
titude of questions about political and citizenship activity. Another advantage is the inclusion of
Northern Ireland in the survey. Residents of Northern Ireland experienced the same changes in
the minimum school leaving law as did residents of Britain, but at different times. This allows
identification of education effects through differences in the timing of minimum school-leaving age
changes for the same birth cohort across the two parts of the United Kingdom. In contrast, with
the BES we identify the effects of education through school-leaving ages faced by different cohorts
in Britain.
8
3.3 The issue of misreporting
We explore the effect of education on citizenship within the following econometric framework:
Yit = β′Xit + γ′Qit + εit, (1)
where Yit represents an observed citizenship outcome (for example whether the respondent voted
in the last elections), Xit is a vector of observable characteristics, Qit is a vector of unobservable
characteristics, and εit is the error term. The observed citizenship outcome Yit can be further
decomposed as follows:
Yit = Y ∗it + uit. (2)
The true value of the citizenship outcome is Y ∗it and uit is a measurement error term. If the
measurement error is correlated with Xit, then the estimate of β will be biased. One source
of misreporting that could be correlated with schooling is the potential for embarrassment. For
example, an individual might not wish to admit not having voted to those conducting the survey,
so he or she offers an untruthful response in order to avoid embarrassment. If misreporting is
systematically related to educational attainment, then the estimate of β will be biased, as the
estimated β will pick up the propensity to misreport rather than the true effect of education on
Y ∗it .
While misreporting is a general problem for any empirical estimates based on survey data,
misreporting is well-known to be prevalent in voting turnout data.12 Although some degree of
misreporting is likely to plague many surveys, there are very few examples of datasets where some
form of exogenous data validation is available. One important feature of our data is the validation of
voting status of respondents using official voting records. With the information on validated voting,
we can provide a direct analysis of misreporting. Specifically, in section 4 we directly test whether
misreporting by survey respondents affects our conclusions on the relationship between voting and
education. We conclude that misreporting is not systematically correlated with education, and
therefore our results on voting are not affected.12The political science literature on the correlation between misreporting and schooling important issue is mixed.
Wolfinger and Rosenstone (1980) conclude (p. 118) that “. . . misreporting is not strongly related to demographiccharacteristics.” Burden (2000) presents a recent analysis of misreporting bias, noting that “. . . many researchersfind that replacing self-reported turnout with validated voter turnout in multivariate analyses does not change thesubstantive conclusion reached.” In contrast, Silver et al. (1986) and Leighley and Nagler (1992) find that amongthose not voting, misreporting is higher for high SES respondents.
9
A second type of misreporting may be a problem for our broader indicators of civic participation.
Some of these outcomes are not connected with a specific action (voted/not voted), but describe
subjective opinions of the respondent. For these outcomes, the absence of a pre-existing opinion may
be another source of measurement error. Bertrand and Mullainathan (2001) explain that individuals
may need to expend mental resources in order to form an opinion. Those who have not previously
thought about an issue may therefore truthfully report a ‘wrong’ opinion; an unconsidered opinion
that might change upon further reflection. Again, if this type of ‘soft opinion’ measurement error is
correlated with education, our estimate of the impact of education on citizenship outcomes would
be biased.
For the citizenship outcomes we study, we separate the results into the two categories of actions
and attitudes. We contend that soft-opinion bias is less likely to arise in response to questions about
past actions than to questions about attitudes. This holds if fewer mental resources need to be
expended in the recollection of past actions than in the formation of abstract opinions. To the extent
that the soft-opinion bias influences our estimates, we take greater caution in the interpretation of
the attitudes results.
4 The Effect of Education on Voting
We now turn to the empirical evidence. We begin by looking at differences in the average probability
of voting by educational attainment, and subsequently extend the analysis to control for observable
and unobservable heterogeneity across education groups. In general, we find that in the US, more
educated citizens appear to be more likely to vote, while this is not true in the UK. Furthermore,
we show that the difference in voting probability across education groups that we uncover in the
US is unlikely to be due to differential misreporting of voting status. Much of the estimated effect
of education on voting appears due to registration differences. We find that when we condition on
being registered to vote, the remaining effect of schooling on voting in the US drops to less than a
third of the estimated effect based on the whole sample.
Of course, the effect on citizenship may be through income if education increases lifetime earn-
ings. Any differences we uncover across educational attainment groups could be attributed to the
higher income that resulted from more education, rather than to some direct component of educa-
tion. Our approach does not have the power to test among competing mechanisms that potentially
10
explain how education affects civic behavior. Instead, we focus on quantifying the magnitude and
confirming the existence of the relationship, rather than identifying the exact mechanism.
4.1 Unconditional Means
Table 1 analyzes differences in the self-reported probability of voting across education groups. The
first column in the top panel indicates that, in the United States, individuals with more schooling
are more likely to report having voted in the last election. While only 52 percent of U.S. high
school dropouts report voting, this percentage increases to 67 percent for high school graduates, 74
percent for individuals with some college and 84 percent for college graduates. These results are
consistent with previous findings in the political science literature. Interestingly, when we include
only individuals who are registered to vote (column 2), the differences in voting rates across groups
significantly decline. For example the difference in the probability of voting between high school
drop outs and high school graduates is 15 percentage points in the full sample, but drops to 5
percentage points in the sample of registered voters. Similarly, the difference in the probability
of voting between high school drop outs and college graduates is 32 percentage points in the full
sample, but only 10 percentage points in the sample of registered voters.
The self-reported probabilities of voting in column 1 are higher than official turnout rates in
recent elections. There are two reasons why the self-reported voting probabilities appear to be so
high. First, they are based on every general election since 1948. While turnout rates are currently
low, they used to be significantly higher in the 1950s and 1960s. For example, the turnout rate in the
1960 presidential election was 63 percent, while the turn out rate in the 1996 presidential election
was only 49 percent. The second reason is misreporting. Some respondents may be reluctant to
admit that they did not vote. If the probability of misreporting is random across individuals, it
will reduce the precision of our estimates, but it will not bias our estimates. On the other hand,
it is possible that more educated individuals are more likely to feel the stigma of not having voted
and therefore are more likely to over-report voting. In this case, the strong relationship between
schooling and voting documented in column 1 could simply reflect differences across education
groups in the probability of misreporting.
One strength on the NES is that, for a selected number of years, the voting status of respondents
was validated using official voting records.13 Voting and registration records were checked in the13Specifically, vote validation studies were conducted in 1964, 1976, 1978, 1980, 1984, 1986, 1988, and 1990.
11
jurisdiction in which the respondent was living when the survey was conducted. For those who were
registered outside the current jurisdiction of residence, attempts to contact the proper jurisdiction
by phone were made.
With the vote validation variables, we are therefore in the rare position of being able to test
whether misreporting by survey respondents affects our conclusions. In particular, we can test
whether more educated individuals are more likely to over-report voting participation. Columns 3
and 4 show the validated probability of reporting, using the subsample of years in which responses
were validated. The same positive gradient of voting with education appears in the validated data.
This suggests that misreporting may not be correlated with education in our data. To examine this
more directly, we show in Columns 5 and 6 the probability of misreporting by education group.
We create a misreporting dummy, which is equal to 1 if the respondent reports having voted and
official records indicated that she did not vote, or if the respondent reports not having voted and
official records indicated that she did vote. The great majority of misreporting cases are cases
where respondents report having voted and official records indicate that they actually did not vote.
Column 5 shows that, if anything, more educated individuals are slightly less likely to misreport.
The probability of misreporting is between 18 to 20 percent for high school dropouts, high school
graduates, and individuals with some college. For college graduates, the misreporting rate drops to
14 percent. A similar finding emerges from column 6, where we show the probability of misreporting
for registered voters.
From this analysis, we conclude that, although misreporting is not uncommon in our sample,
it is unlikely to introduce any significant upward bias in our estimates of the effect of schooling
on voting participation. If validated information on voting were available for all the elections, we
would use the validated information instead of the self-reported data. However, validated voting
is available only for a limited number of years. For this reason, throughout the paper we use self-
reported voting as our preferred dependent variable, although later in the paper we also show that
our results don’t change much if validated voting is used instead.
The bottom panel in Table 1 shows similar conditional means for the UK. The comparison
between UK and US data is complicated by the fact that our UK data report the age when the
respondent finished school. This variable for educational achievement has the advantage, however,
that it can be matched closely with changes to the minimum school leaving age.
There is much less discrepancy in voting patterns between the population sample (using only the
12
1997 BES) and the registered sample (using the combined BES). The fraction voting is somewhat
U-shaped by education level. 85 percent of the British electorate who finished school at age 14
reports voting in the last general election survey. The proportion reporting they voted falls slightly
below 80 percent for those who finished school between ages 15 and 17, and the proportion of British
that finished school past age 17 increases to 84 percent. In the UK, like in most European countries,
all citizens are registered and required to vote. Conditioning on registration, therefore, does not
significantly change the fraction of the population voting. For registered voters who finished school
at age 14 or earlier, the voting rate is 88 percent. The corresponding figures for those who finished
school at 15, 16 17 and 18 or more are 85, 83, 87 and 88 percent, respectively.
Similar to the US, the probability of misreporting does not appear to be systematically corre-
lated with schooling achievement. The fraction misreporting ranges from 13 to 18 percent across
education categories for the full (1997) sample. The actual fraction of the British electorate that
vote is distributed about the same across education groups as the self-reported fraction, ranging
between 62 percent for those finishing school at age 16 and 69 percent for those finishing school at
age 14 or less.
Although we don’t report the figures in the table, a similar picture emerges if one looks at
Canadian data.14 In Canada, the probability of voting is 0.83 for high school drop outs, 0.84
for high school graduates, 0.86 for individuals with some post-high school education and 0.90 for
university graduates. The registration process resembles more closely that in Britain than the US,
adding to our suggestive evidence that the relationship between education and voting has most to
do with the relationship between education and electoral registration.15 In the remainder of the
paper, we focus on US and UK, as our instrumental variables work best in these two countries.
However, we do refer to OLS estimates for Canada below.
4.2 Evidence from the United States
In the previous section we showed that more educated individuals are more likely to vote in the US.
However, this documented correlation between schooling and voting might not be causal. There are14We pooled together the Canadian Election Studies from 1988, 1993, 1997, and 2000, using the same variables as
we used for the US. The total number of observations with valid variables was 8044.15Since 1982 Canadians can register to vote by checking a box on their individual tax return form (that almost
every adult must file each year). Prior to an election, a postcard is delivered to each household confirming registrationand showing where to vote. Electors who did not receive a card can phone to be placed on the list. Elections Canadaestablished a permanent register of electors in 1997.
13
many individual characteristics that affect both schooling achievement and political participation,
creating spurious correlation. In the next two sections, we turn to a more formal analysis of the
relationship between education and voting, and we try to account for observable and unobservable
individual characteristics that may be correlated with schooling and voting.
4.2.1 National Election Survey results
Table 2 shows OLS regressions based on NES data. The independent variable of primary interest
is a dummy equal to one if the respondent has a high school education or more. The first column
indicates that after conditioning on year effects and a fourth order polynomial in age, the difference
in the probability of voting between high school drop outs and individuals with 12 or more years
of schooling is 21 percentage points. When we include race and gender (column 2), this difference
increases to 28 percentage points. When we also control for state of birth effects (column 3) and
linearly for the year of birth of the respondent, the coefficient is 0.25.16
Columns 5 to 8 report estimates from similar models obtained by including only individuals
who are registered to vote. Consistent with our findings in Table 1, conditioning on registration
significantly reduces the coefficient for high school graduation. The most robust specification in
column 8 suggests that the difference in the probability of voting between high school dropouts
and individuals with 12 or more years of schooling is 9 percentage points, or about a third of the
corresponding coefficient in column 4. These results are consistent with existing evidence that finds
the effect of education on turnout diminishes among the registered (e.g. Highton (1997)) .
Note that the information on registration is missing in some years, so that the sample used
in columns 1 to 4 is different from the sample used in columns 5 to 8. To make sure that the
documented difference in results is not driven by differences in the sample, we re-estimate the
models in column 1 to 4 using only the years when information on registration is available. We
find results that are very similar to the ones reported in columns 1 to 4.17
It is possible that our OLS estimates are biased by unobserved characteristics that are associated
with schooling and outcomes. For example, parents who encourage their children to pursue more16For all regressions in the paper when we control for the year of birth, we use a linear term rather than year of
birth dummies. In the CPS, both the OLS and the IV results are robust to the inclusion of a set of year of birthdummy variables. However, in the NES, the small sample sizes weaken the power of the instruments in the presenceof a set of year of birth dummies. To maintain comparability, we control linearly for year of birth effects across allthe datasets we use.
17For example, the coefficient on high school graduation for the model in column 4 estimated using only the yearswhen information on registration is available is 0.28 (0.13).
14
education might also nurture strong civic values. If so, the unobserved parental influence could
lead to a positive bias in the estimate of the effect of schooling on voting.
One potential solution to this problem is to find a set of instrumental variables that are related
to voting only through their impact on schooling. We use mandatory schooling laws as instru-
ments.18 States changed their mandatory schooling laws at different times, generating variation
across cohorts and jurisdictions in exposure to the laws. If this variation leads to higher educa-
tional attainment, but is unrelated to citizenship outcomes, then mandatory schooling laws are
valid instruments.
Years of compulsory attendance are defined as the maximum between (i) the minimum number
of years that a child is required to stay in school and (ii) the difference between the earliest age
that he is required to be in school and the latest age he is required to enroll. Child labor laws are
defined as the earliest grade in which children are allowed to leave school to enter the labor market.
In the years relevant for our sample, 1914 to 1990, states changed compulsory attendance levels
and child labor laws several times, and not always upward.19 We assign compulsory attendance
laws and child labor laws to individuals on the basis of state of residence at age 14 and the year
when the individual was 14 years old.20
The effect of compulsory schooling laws and child labor laws on schooling is well documented (see
for example Acemoglu and Angrist (2000), Lochner and Moretti (2001) and Lleras-Muney (2002b)).
Increases in compulsory schooling and in child labor laws have been shown to affect educational
attainment, controlling for state and year of birth. Our first stage estimates are consistent with
findings in the existing literature. The top panel in Table 3 quantifies the effect of compulsory
attendance laws and child labor laws on educational achievement in the NES. For compulsory
attendance laws, we create four indicator variables, depending on whether years of compulsory18This type of instrument has been used previously by Acemoglu and Angrist (2000) to study the social return to
education, Lochner and Moretti (2001) to study crime, Lleras-Muney (2002a) to study adult mortality, Oreopoulos(2003) to study well-being, and in the study of labor market outcomes by Angrist and Krueger (1991), Harmon andWalker (1995), and Meghir and Palme (2001).
19The most dramatic examples of downward changes are South Carolina and Mississippi, who repealed theircompulsory attendance statutes following the forced integration of schools in order to avoid requiring white childrento attend racially mixed schools. Within the following decade, South Carolina re-enacted a compulsory attendancestatute, although it was weakened by provisions making the statute a mere enabling act which could be utilized atlocal option (Kotin and Aikman (1980)). See Lochner and Moretti (2001) for more details on changes in compulsoryschooling laws.
20The data sources for compulsory attendance laws are given in Appendix B of Acemoglu and Angrist (2000). Weuse the same cut off points as Acemoglu and Angrist (2000) and Lochner and Moretti (2001). We experimented witha matching based on the year the individual is age 16 or 17, and found qualitatively similar results.
15
attendance are 8 or less, 9, 10, and 11 or 12. For child labor laws, we create four indicator
variables, depending on whether the minimum number of years of school before work is permitted
is 6 or less, 7, 8, and 9 or more. All models include controls for age, election year, state of birth,
and year of birth.21
Identification of the estimates comes from changes over time in the number of years of compul-
sory education or child labor laws in any given state. The identifying assumption is that conditional
on state of birth, cohort of birth and election year, the timing of the changes in compulsory at-
tendance laws within each state is orthogonal to characteristics of individuals that affect voting,
like family background or tastes. Columns 1 to 3 indicate that, in general, the more stringent the
compulsory attendance legislation or the child labor law legislation, the higher is the probability
of high school graduation. For example, individuals who were 14 in states and years requiring 11
or more years of compulsory attendance, are 7.5 percentage points more likely to have at least
high school compared with individuals who were 14 in states/years requiring 8 years or less (the
excluded case). (The relationship between high school graduation and compulsory schooling is not
perfectly monotonic, possibly because there are few individuals in the state years where compulsory
schooling is equal to 10). Similarly, individuals who were 14 in states and years requiring 9 or more
years of schooling before work are 8.5 percentage points more likely to have at least high school
compared with individuals who were 14 in states/years requiring 6 years or less (the excluded case).
Are compulsory schooling laws valid instruments? We start to address this question by asking
whether increases in compulsory schooling ages are associated with changes in political attitudes
that may affect voter turnout. If increases in mandatory schooling correspond with increases
in political participation, IV estimates might be too large. Similarly, changes in schooling laws
may be correlated with civil rights changes that made registration easier. However, we do not
believe this to be a serious problem. In contrast to most studies using state policy changes as an
instrument, simultaneous changes in compulsory schooling laws and changes in political attitudes
are not necessarily problematic for the instrument in this study, since we examine voting behavior
among individuals many years after schooling laws. Recall that we assign compulsory attendance
based on the year an individual is age 14, and our sample only includes individuals ages 20 and
older. For the instrument to be invalid, changes in state political attitudes that take place when21More precisely, we include a dummy if the voter is female, a dummy if the respondent is black, a linear trend in
year of birth, a four term polynomial in age, dummies for each election year, and dummies for each state of birth.The standard errors we use allow for clustering at the state of birth and year of birth level.
16
an individual is age 14 must directly affect her voting behavior years later. In general, this does
not appear to be a likely scenario.
Another important concern with using compulsory attendance laws as an instrument is that
the cost of adopting more stringent versions of the laws may be lower for states that expect faster
increases in high school graduation rates. It is, therefore, possible that changes in compulsory atten-
dance laws simply reflect underlying state-specific trends in graduation rates. This issue has been
extensively examined by previous research, which has shown that changes in compulsory school-
ing laws do not appear to simply picking up underlying trends in education. Stricter compulsory
attendance laws appear to raise education, not vice versa. (See Lochner and Moretti (2001) and
Lleras-Muney (2002b).
The bottom of Table 3 reports instrumental variable estimates of the effect of high school
graduation on voting. Column 1 uses only compulsory schooling laws as instruments, column 2
uses only child labor laws, and column 3 uses both. Irrespective of the instruments used, the
IV estimates are very similar to OLS estimates. The IV coefficient on high school graduation is
between 0.28 and 0.30, statistically indistinguishable from the corresponding OLS coefficient.
Columns 4 to 6 report estimates for the sample of registered voters. Unfortunately, registration
information was not recorded for many of the national election surveys, and the sample is therefore
significantly smaller. IV estimates appear to be generally lower than the corresponding estimates
for the full sample, but the large standard errors make it hard to draw firm conclusions. In the
next section we show more precise results based on the larger sample available in the CPS. With
the CPS, we can confirm that IV estimates for registered voters is indistinguishable from zero.
Finally, when we re-estimate the models in column 1 to 3 using only the years when information
on registration is available, we find results similar to the ones reported in columns 1 to 3.
4.2.2 Current Population Survey results
We now turn to an alternative data source, the Current Population Survey (CPS). The CPS has
the advantage that its sample size is many times larger than the NES, and therefore can in theory
produce more precise estimates. The main disadvantage of the CPS is that it does not report the
state of residence at age 14, nor the state of birth. As a consequence, we need to rely on the current
state of residence to assign compulsory schooling laws and child labor laws. This may be a problem
if current state of residence is endogenous.
17
Results based on the CPS are reported in Table 4, and in general confirm those based on NES
data. Column 1 shows that OLS and IV estimates for the entire sample are, respectively, 0.29 and
0.34, only slightly larger than the corresponding NES estimates. When we condition on the sample
of registered voters, the IV coefficient drop to virtually 0. Because the sample here is larger, the
standard error for the IV estimates is half of the corresponding standard error in Table 3. This
result is strong and important, as it confirms the suggestions in the existing literature about the
effect of education among the registered.
4.3 Evidence from the UK
The US results seem to indicate that the positive effect of schooling on voting may be driven largely
by the effect of schooling on registration. The IV results, in particular, imply that youth obliged to
attain additional education are much more likely to register to vote, and somewhat more likely to
vote after becoming registered. As discussed in section 2, the responsibility of registering to vote in
the US, during the period when our data were collected, rests with the individual. In contrast, the
responsibility in Britain rests with regional electoral officers who send letters and visit households
in order to complete the electoral register. Given the substantial differences in the registration
process between the two countries, we may also expect to see differences in our estimates of the
effect from schooling on voting.
OLS estimates for Britain in column 2 in Table 5 indicate that an extra year of schooling has a
small but significant effect on probability of voting. Controlling for registration does not alter the
estimates by much, which is not surprising considering most British are registered and that there
exists little association between registration and education (see Table 1).
A comparison with US data is complicated by the fact that the UK data does not allow us
to create a dummy for high school graduation. If we assume that in the US the difference in the
number of years of schooling completed by those with less than high school and those with a high
school degree or more is about 4 years, the coefficient for the UK appears to be six times smaller
than the coefficient for the US.
The IV results for Britain are presented in Table 6. The first stage results are presented in the
upper part of the table. Although there were only two school-leaving age changes in Britain from
1920 to 1995, both changes were remarkably influential in raising school attainment (see Figures 1
and 2). A particularly large fraction of British leave school as soon as possible, relative to other
18
industrialized countries. The 1947 change in the school-leaving age, from 14 to 15, raised the
average age before leaving by 0.51, as indicated in column 2 (recall that a linear control for birth
cohort is also included in this regression). Relative to those who faced a drop out age of 14, the
coefficient of 0.93 on age 16 indicates British youth facing a minimum school leaving age of 16
attain almost a full year more of school, on average.
Similar to the OLS results, the IV estimates in Table 6 suggest a weak effect of schooling on
voting in Britain. The nationally representative sample is too small to derive precise conclusions
from the results in column 1. But the estimates from using the BES datasets that were compiled
from the electoral registry are very small and insignificant.
While not shown in a table, OLS estimates based on Canadian data are qualitatively closer
to UK estimates than US ones. In particular, we find that the difference in probability of voting
between high school drop outs and individuals with at least a high school diploma or more is only
9.1 percentage points, after controlling for a quartic in age, sex, language, year effects, province
effects, and year of birth effects. When this estimate is compared with the one in column 4 of Table
2, it indicates that the effect of high school graduation in Canada is about a third that of the US.
4.4 Misreporting of Voting Behavior
In Table 7 we provide more evidence that differential misreporting does not affect our estimates.
The first row reports for convenience our baseline estimates for the US, based on the full sample
of respondents (these coefficients are taken from Table 2, column 4 and Table 3, column 3). In
row 2 and 3, we re-estimate the same model including only individuals whose voting status has
been verified and confirmed using official voting records. Only a third of voting records have been
verified, so the sample used in row 1 differ from the sample used in row 2 and 3.
In row 2, the dependent variable is the self-reported probability of voting. In row 3, the
dependent variable is the verified probability of voting. The comparison between OLS estimates
in row 1 and 2 indicates that the coefficient on high school graduation is slightly smaller in the
smaller sample for which we have validated data. More importantly, the comparison between OLS
estimates in row 2 and 3 confirms that misreporting does not significantly bias OLS estimates.
They point estimates are similar: 0.021 for the self-reported voting and 0.18 for the verified voting.
In row 4, we regress a dummy variable equal to 1 if the respondent misreport her voting status
on the high school graduation dummy and all the other controls. Consistent with the results in
19

column 4 of Table 1, the estimate in row 4 confirm that misreporting is mostly orthogonal to high
school graduation. IV estimates in row 3 indicate that our results hold when verified voting status is
used instead of self-reported voting status. However, the reduced sample size results in less precise
estimates, making the comparison more difficult.
The bottom panel repeats the same exercise for the British data. The findings also confirm that
misreporting does not appear to introduce any measurable bias in the results.
5 The Effect of Education on Citizenship Outcomes
The empirical analysis so far has focused on participation in the political system as measured
by probability of voting. In this section, we extend our analysis to other measures of citizenship
outcomes. For example, we look at whether and how voters obtain information about the candi-
dates. One important potential channel through which education may improve citizenship is by
raising citizens’ ability and interest in obtaining information about candidates and campaigns. An-
other potential channel through which education may improve citizenship is by increasing citizens’
involvement in community issues and their participation in community meetings.
The NES provides information on two sets of citizenship outcomes for the US. First, respondents
were asked questions on actions that they have taken, such has whether they have followed the
campaign on newspapers or television, or whether they regularly attend community meetings.
Second, the NES collects more subjective data on respondent attitudes on the political system.
The top panel of Table 8 reports OLS and IV estimates of the effect of high school graduation
on action outcomes. Because not all the questions were asked in all years, the sample size varies
considerably across outcomes. As a consequence, IV estimates in some cases are not informative,
because there are simply too few observations for the first stage to be effective.
Generally, the effect of education on these outcomes is to improve citizenship, when citizenship
is measured by the available action outcomes. High school graduates, relative to dropouts, are more
likely to be registered, follow campaigns on television or newspapers, follow public affairs, attend
political meetings, volunteer for community issues and attend community meetings.
The bottom panel of Table 8 focuses on more subjective measures of the respondents’ attitudes.
More educated individuals are more likely to report that they are interested in elections, they don’t
mind jury duty, that they are more likely to trust the Federal government and less likely to think
20
that Federal officials are crooked.
Table 9 uses the combined Eurobarometer surveys to estimate similar effects of schooling on
citizenship outcomes for the UK (with samples from both Britain and Northern Ireland). As
with the BES results above, we find no relationship between registration and schooling. Among
respondents, 92 percent say their name is on the electoral list for the next general election. The
OLS and IV estimates of the effect of age left full-time education are insignificantly different from
zero.
Least squares estimates indicate a small association with more schooling and greater likelihood
of watching news in the media. Four additional years of school, for example raises the probability
of watching news every day by about 3 percentage points. The instrumental variables results are
not only insignificantly different from zero, but also insignificantly different from the least squares
results.
All 50 Eurobarometers ask questions about whether respondents discuss politics, try to persuade
people of their views, and consider themselves politically active. We find strong effects of schooling
on all these variables. For example, those compelled to take an extra year of school, because the
minimum school leaving age was raised, are about 7 percentage points more likely to report they
try to persuade others to share their views, 6 percentage points more likely to frequently discuss
political matters with friends, and 3 percentage points more likely to consider themselves politically
active.
These results suggest that education improves participation not only as measured by voter
turnout, but also in broader measures. As well, the evidence on education and political information
may provide support for models that focus on the lower cost of information acquisition for the more
highly educated. However, it may also be the case that voters who know they will not vote do not
bother investing in the acquisition of political information. We leave further investigation of the
channels through which education affects participation to future research.
6 Discussion
We find a strong and robust relationship between education and voting in the United States, but
not in the United Kingdom. When the US sample is restricted only to citizens who are registered,
the estimated effect of education on voting drops to less than a third of the effect for the full sample.
21
In addition, our evidence on broader outcomes indicates that education increases citizens’ attention
to public affairs and to following politics. More educated citizens appear to have more information
on candidates and campaigns. We find similar results across both countries. Overall, these results
lend support to the notion that education has social externalities through the production of a better
polity.
Our results on registration suggest an interesting counterfactual — what would happen if the
registration regime in the US were changed to resemble that of the UK? The answer depends on
which of two distinct cases holds. On one hand, if citizens don’t care about the costs of registration
or they do not suffer from procrastination, then anyone who plans to vote will register. In this case,
registration is a veil. Changes in the registration regime would have no impact on the education
gradient of voting.
On the other hand, if costs matter or if procrastination is a concern, then a liberalization of
registration could increase voting. To the extent that the registration barrier disproportionately
affects the low-educated, liberalizations of the registration regime could increase the turnout of
the low-educated and flatten the education gradient. As the empirical literature on the effects of
registration expansion is mixed, we cannot draw any strong conclusions.
However, holding the existing US registration regime constant, our results have clear implica-
tions for citizenship behavior under our main counterfactual of interest. Our estimates suggest that
an increase in educational attainment causes an increase in voter turnout in the US, but not in
the UK. For the US, the magnitude for a high school graduate on the self-reported probability of
voting is on the order of 28.8 to 34.2 percentage points. Given that the high school attainment
rate among those 25 and older increased by 36.1 percentage points from 1964 to 2000 (US Census
Bureau (2000)), our estimates suggest that the 2000 turnout rate would have been 10.4 to 12.3
percentage points lower if the high school completion rate had not changed from 1964, holding all
other factors constant. In other words, we predict that the observed drop in the turnout rate would
have been even sharper, if it were not for the large observed increase in high school attainment
between 1964 and 2000.
22
References
Acemoglu, Daron, and Joshua Angrist (2000) ‘How large are human capital externalities? evidence
from compulsory schooling laws.’ In NBER Macroannual 2000, ed. Ben S. Bernanke and Kenneth
Rogoff (Cambridge MA: MIT Press)
Angrist, Joshua D., and Alan B. Krueger (1991) ‘Does compulsory school attendance affect school-
ing and earnings?’ Quarterly Journal of Economics 106(4), 979–1014
Bertrand, Marianne, and Sendhil Mullainathan (2001) ‘Do people mean what they say? Implica-
tions for subjective survey data.’ AEA Papers and Proceedings 91(2), 67–72
Brady, Henry E., Sidney Verba, and Kay Kehman Schlozman (1995) ‘Beyond SES: A resource
allocation model of political participation.’ American Political Science Review 89(2), 271–294
Burden, Barry C. (2000) ‘Voter turnout and the National Election Studies.’ Political Analysis
8(4), 389–398
Dee, Thomas S. (2002) ‘Are there civic returns to education?’ Mimeo, Swathmore College
Feddersen, Timothy J., and Wolfgang Pesendorfer (1996) ‘The swing voter’s curse.’ American
Economic Review 86(3), 408–424
Flanigan, William H., and Nancy H. Zingale (2002) Political Behavior of the American Electorate,
10th edition (Washington, DC: CQ Press)
Friedman, Milton (1962) Capitalism and Freedom (Chicago: University of Chicago Press)
Hanushek, Eric (2002) ‘Publicly provided education.’ In The Handbook of Public Economics, ed.
Alan Auerbach and Martin Feldstein, vol. 3 (Amsterdam: Elsevier Science)
Harmon, Colm, and Ian Walker (1995) ‘Estimates of the economic return to schooling for the
United Kingdom.’ American Economic Review 85(5), 1278–1286
Helliwell, John, and John Putnam (1999) ‘Education and social capital.’ Working Paper 7121,
National Bureau of Economic Research
Highton, Benjamin (1997) ‘Easy registration and voter turnout.’ Journal of Politics 59(2), 565–575
23
Knack, Stephen (1995) ‘Does “motor voter” work? Evidence from state-level data.’ Journal of
Politics 57(3), 796–811
Kotin, Lawrence, and William F. Aikman (1980) Legal Foundations of Compulsory Schooling (Port
Washington, NY: Kennikat Press)
Leighley, Jan E., and Jonathan Nagler (1992) ‘Socioeconomic class bias in turnout, 1964–1988: The
voters remain the same.’ American Political Science Review 86(3), 725–736
Lleras-Muney, Adriana (2002a) ‘The relationship between education and adult mortality in the
United States.’ Working Paper 8986, National Bureau of Economic Research
(2002b) ‘Were compulsory attendance and child labor laws effective? An analysis from 1915 to
1939.’ Journal of Law and Economics 45(2), 401–435
Lochner, Lance, and Enrico Moretti (2001) ‘The effect of education on criminal activity: Evidence
from prison inmates, arrests and self-reports.’ Working Paper 8606, National Bureau of Economic
Research
Martinez, Michael D., and David Hill (1999) ‘Did motor voter work?’ American Politics Quarterly
27(3), 296–315
Meghir, Costas, and Marten Palme (2001) ‘The effect of a social experiment in education.’ Working
Paper WP01/11, Institute for Fiscal Studies
Moretti, Enrico (forthcoming) ‘Estimating the social return to higher education: Evidence from
longitudinal and repeated cross-sectional data.’ Journal of Econometrics
Oreopoulos, Philip (2003) ‘Do dropouts drop out too soon? evidence from changes in school-leaving
laws.’ Mimeo, University of Toronto
Powell, Jr., G. Bingham (1985) ‘American voter turnout in comparative perspective.’ American
Political Science Review 80(1), 17–43
Shapiro, Virginia, Stephen J. Rosenstone, and The National Election Studies (2001) ‘Cumulative
data file dataset.’ Ann Arbor, Michigan: University of Michigan Center for Political Studies
24
Silver, Brian D., Barbara A. Anderson, and Paul R. Abramson (1986) ‘Who overreports voting?’
American Political Science Review 80(2), 613–624
Smith, Adam (1776) The Wealth of Nations (New York: Penguin Books). (1982 reprint)
Teixeira, Ruy A. (1987) Why Americans don’t vote: Turnout decline in the United States 1960–1984
(New York: Greenwood Press)
United Kingdom (2002) ‘Electoral registration in Great Britain.’ The Electoral Commission Fact-
sheet 08-02. (Available at www.electoralcommission.org.uk. Last accessed: January 2003)
US Census Bureau (2000) ‘Educational attainment historical tables.’ Table A-2 (Available at
www.census.gov/population/www/socdemo/educ-attn.html. Last accessed: January 2003)
Verba, Sidney, and Norman H. Nie (1972) Participation in America: Political democracy and social
equality (New York: Harper and Row)
Weisberg, Herbert F., and Janet M. Box-Steffensmeier (1999) Reelection 1996: How Americans
voted (New York: Chatham House Publishers)
Wolfinger, Raymond E., and Steven J. Rosenstone (1980) Who Votes? (New Haven: Yale University
Press)
25
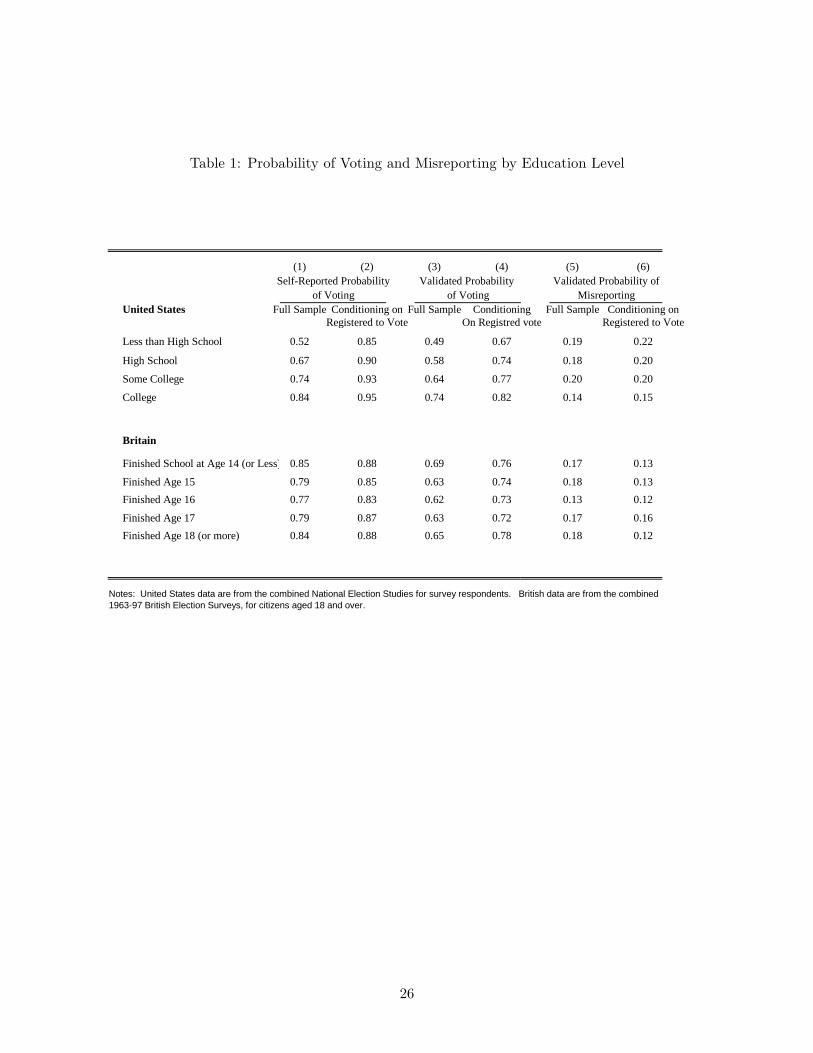
Table 1: Probability of Voting and Misreporting by Education Level
(1) (2) (3) (4) (5) (6)Self-Reported Probability Validated Probability Validated Probability of
of Voting of Voting MisreportingUnited States Full Sample Conditioning on Full Sample Conditioning Full Sample Conditioning on
Registered to Vote On Registred vote Registered to Vote
Less than High School 0.52 0.85 0.49 0.67 0.19 0.22
High School 0.67 0.90 0.58 0.74 0.18 0.20
Some College 0.74 0.93 0.64 0.77 0.20 0.20
College 0.84 0.95 0.74 0.82 0.14 0.15
Britain
Finished School at Age 14 (or Less) 0.85 0.88 0.69 0.76 0.17 0.13
Finished Age 15 0.79 0.85 0.63 0.74 0.18 0.13
Finished Age 16 0.77 0.83 0.62 0.73 0.13 0.12
Finished Age 17 0.79 0.87 0.63 0.72 0.17 0.16
Finished Age 18 (or more) 0.84 0.88 0.65 0.78 0.18 0.12
Notes: United States data are from the combined National Election Studies for survey respondents. British data are from the combined1963-97 British Election Surveys, for citizens aged 18 and over.
26
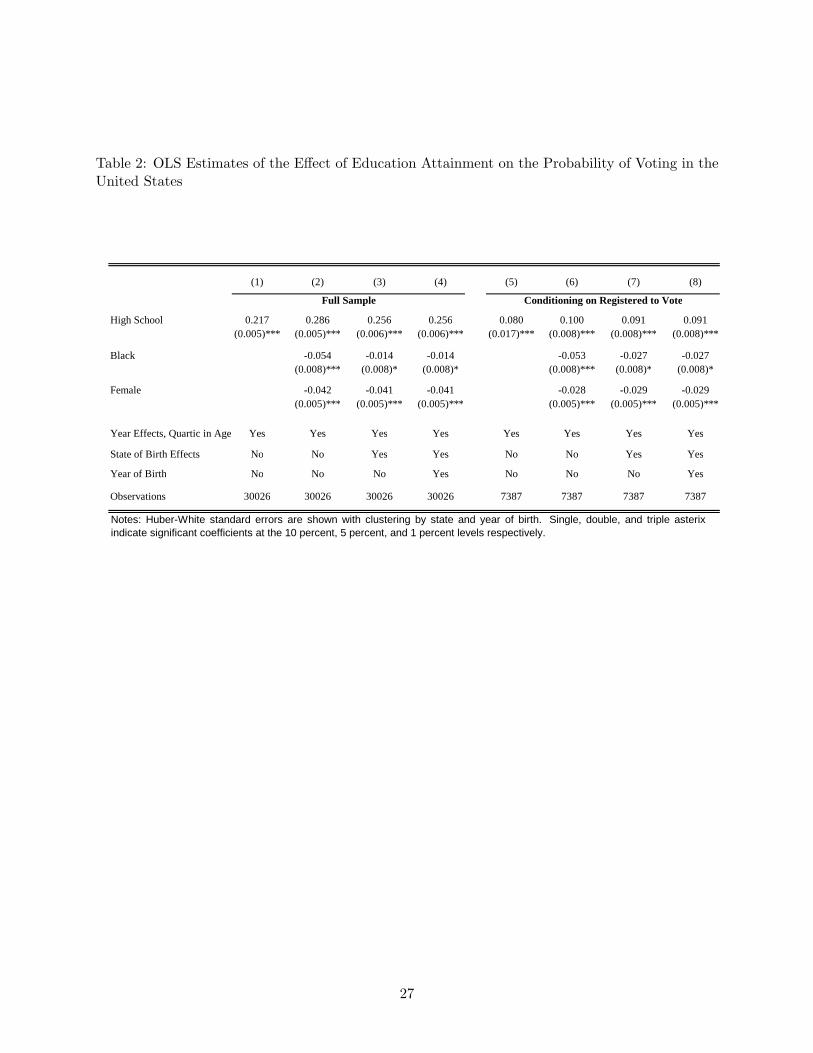
Table 2: OLS Estimates of the Effect of Education Attainment on the Probability of Voting in theUnited States
(1) (2) (3) (4) (5) (6) (7) (8)
Full Sample Conditioning on Registered to Vote
High School 0.217 0.286 0.256 0.256 0.080 0.100 0.091 0.091(0.005)*** (0.005)*** (0.006)*** (0.006)*** (0.017)*** (0.008)*** (0.008)*** (0.008)***
Black -0.054 -0.014 -0.014 -0.053 -0.027 -0.027(0.008)*** (0.008)* (0.008)* (0.008)*** (0.008)* (0.008)*
Female -0.042 -0.041 -0.041 -0.028 -0.029 -0.029(0.005)*** (0.005)*** (0.005)*** (0.005)*** (0.005)*** (0.005)***
Year Effects, Quartic in Age Yes Yes Yes Yes Yes Yes Yes Yes
State of Birth Effects No No Yes Yes No No Yes Yes
Year of Birth No No No Yes No No No Yes
Observations 30026 30026 30026 30026 7387 7387 7387 7387
Notes: Huber-White standard errors are shown with clustering by state and year of birth. Single, double, and triple asterixindicate significant coefficients at the 10 percent, 5 percent, and 1 percent levels respectively.
27
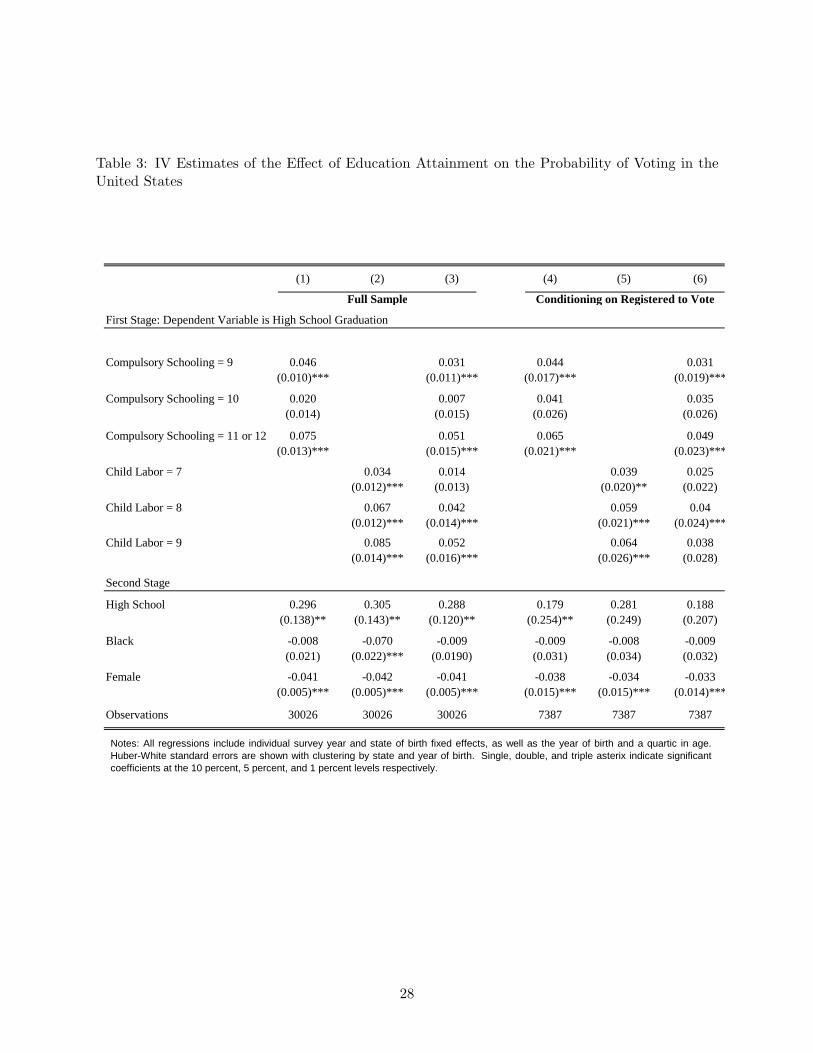
Table 3: IV Estimates of the Effect of Education Attainment on the Probability of Voting in theUnited States
(1) (2) (3) (4) (5) (6)
Full Sample Conditioning on Registered to Vote
First Stage: Dependent Variable is High School Graduation
Compulsory Schooling = 9 0.046 0.031 0.044 0.031(0.010)*** (0.011)*** (0.017)*** (0.019)***
Compulsory Schooling = 10 0.020 0.007 0.041 0.035(0.014) (0.015) (0.026) (0.026)
Compulsory Schooling = 11 or 12 0.075 0.051 0.065 0.049(0.013)*** (0.015)*** (0.021)*** (0.023)***
Child Labor = 7 0.034 0.014 0.039 0.025(0.012)*** (0.013) (0.020)** (0.022)
Child Labor = 8 0.067 0.042 0.059 0.04(0.012)*** (0.014)*** (0.021)*** (0.024)***
Child Labor = 9 0.085 0.052 0.064 0.038(0.014)*** (0.016)*** (0.026)*** (0.028)
Second Stage
High School 0.296 0.305 0.288 0.179 0.281 0.188(0.138)** (0.143)** (0.120)** (0.254)** (0.249) (0.207)
Black -0.008 -0.070 -0.009 -0.009 -0.008 -0.009(0.021) (0.022)*** (0.0190) (0.031) (0.034) (0.032)
Female -0.041 -0.042 -0.041 -0.038 -0.034 -0.033(0.005)*** (0.005)*** (0.005)*** (0.015)*** (0.015)*** (0.014)***
Observations 30026 30026 30026 7387 7387 7387
Notes: All regressions include individual survey year and state of birth fixed effects, as well as the year of birth and a quartic in age.Huber-White standard errors are shown with clustering by state and year of birth. Single, double, and triple asterix indicate significantcoefficients at the 10 percent, 5 percent, and 1 percent levels respectively.
28
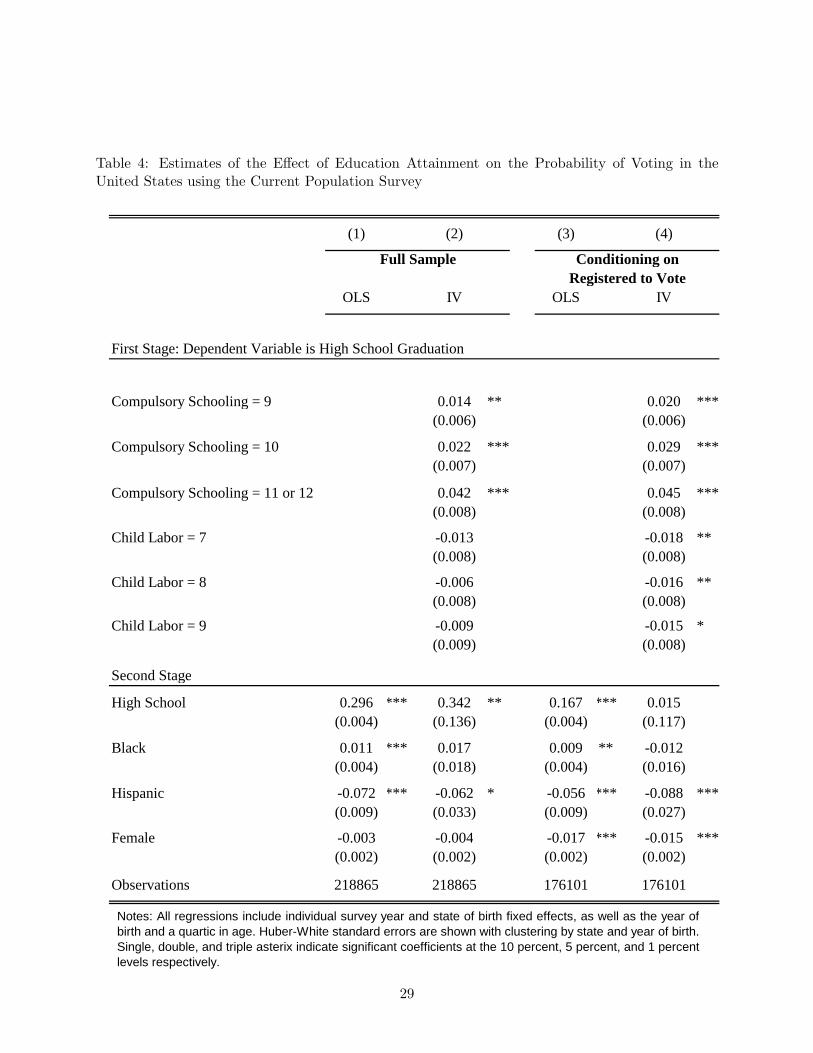
Table 4: Estimates of the Effect of Education Attainment on the Probability of Voting in theUnited States using the Current Population Survey
(1) (2) (3) (4)
Full Sample Conditioning onRegistered to Vote
OLS IV OLS IV
First Stage: Dependent Variable is High School Graduation
Compulsory Schooling = 9 0.014 ** 0.020 ***(0.006) (0.006)
Compulsory Schooling = 10 0.022 *** 0.029 ***(0.007) (0.007)
Compulsory Schooling = 11 or 12 0.042 *** 0.045 ***(0.008) (0.008)
Child Labor = 7 -0.013 -0.018 **(0.008) (0.008)
Child Labor = 8 -0.006 -0.016 **(0.008) (0.008)
Child Labor = 9 -0.009 -0.015 *(0.009) (0.008)
Second Stage
High School 0.296 *** 0.342 ** 0.167 *** 0.015(0.004) (0.136) (0.004) (0.117)
Black 0.011 *** 0.017 0.009 ** -0.012(0.004) (0.018) (0.004) (0.016)
Hispanic -0.072 *** -0.062 * -0.056 *** -0.088 ***(0.009) (0.033) (0.009) (0.027)
Female -0.003 -0.004 -0.017 *** -0.015 ***(0.002) (0.002) (0.002) (0.002)
Observations 218865 218865 176101 176101
Notes: All regressions include individual survey year and state of birth fixed effects, as well as the year ofbirth and a quartic in age. Huber-White standard errors are shown with clustering by state and year of birth.Single, double, and triple asterix indicate significant coefficients at the 10 percent, 5 percent, and 1 percentlevels respectively.
29
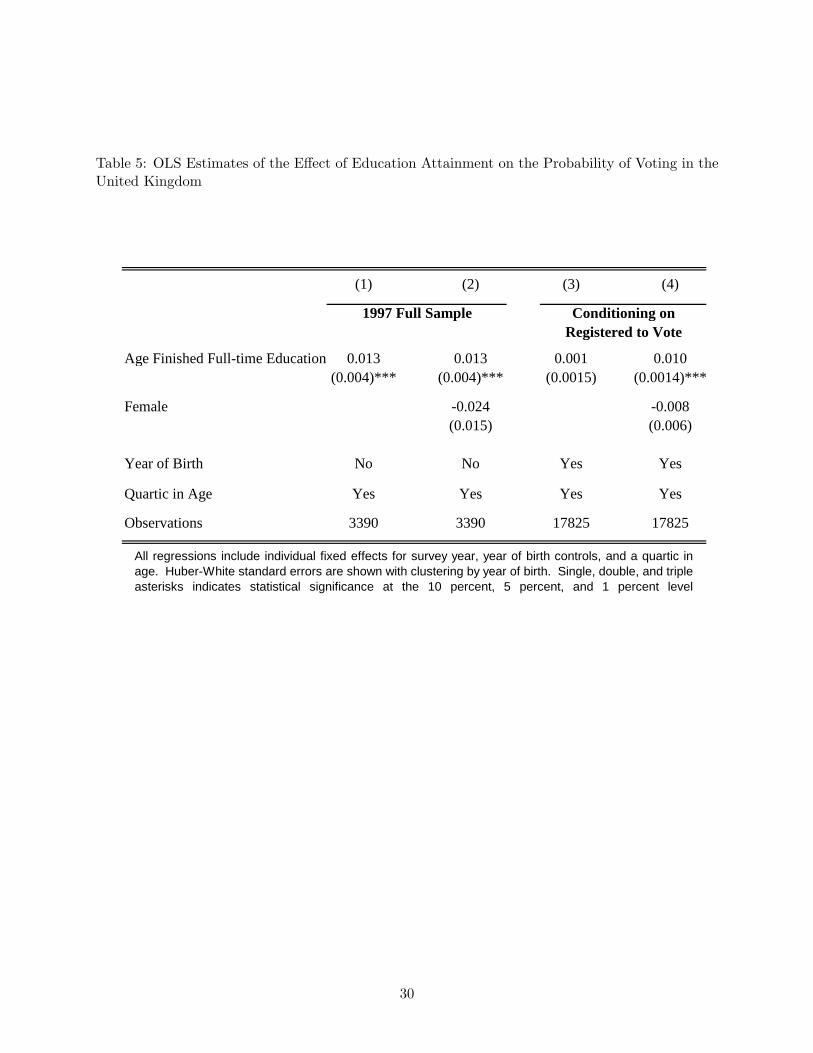
Table 5: OLS Estimates of the Effect of Education Attainment on the Probability of Voting in theUnited Kingdom
(1) (2) (3) (4)
1997 Full Sample Conditioning onRegistered to Vote
Age Finished Full-time Education 0.013 0.013 0.001 0.010(0.004)*** (0.004)*** (0.0015) (0.0014)***
Female -0.024 -0.008(0.015) (0.006)
Year of Birth No No Yes Yes
Quartic in Age Yes Yes Yes Yes
Observations 3390 3390 17825 17825
All regressions include individual fixed effects for survey year, year of birth controls, and a quartic inage. Huber-White standard errors are shown with clustering by year of birth. Single, double, and tripleasterisks indicates statistical significance at the 10 percent, 5 percent, and 1 percent level
30
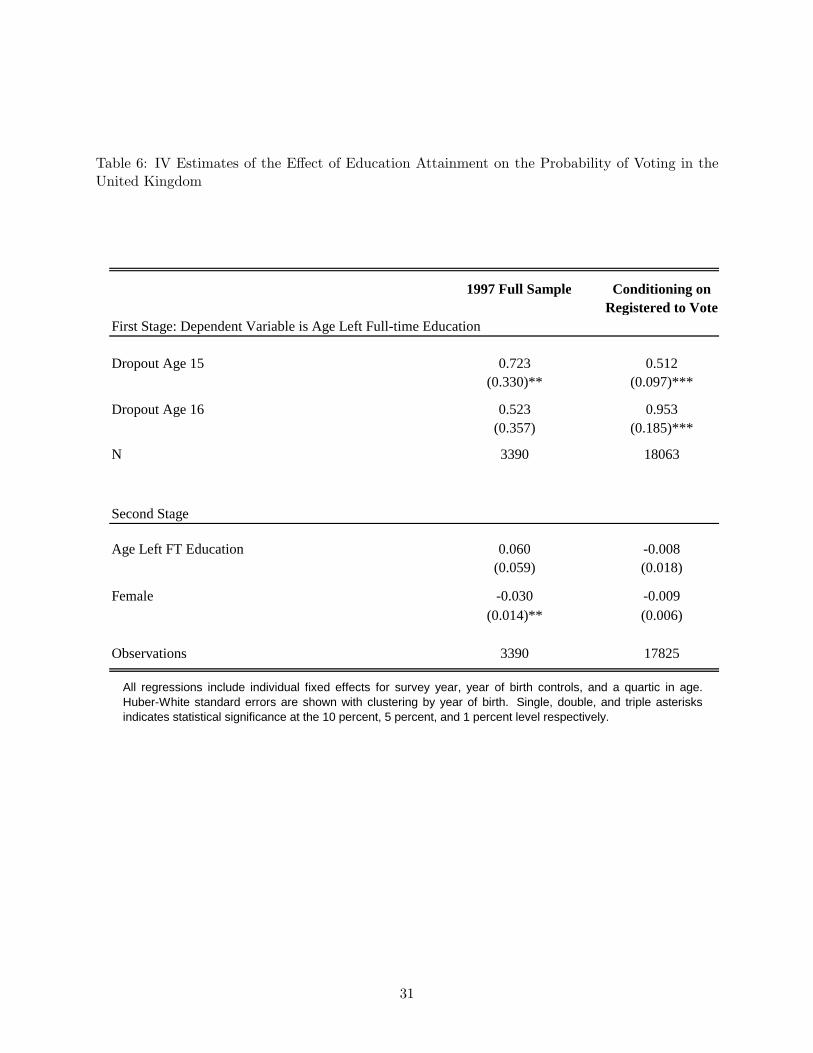
Table 6: IV Estimates of the Effect of Education Attainment on the Probability of Voting in theUnited Kingdom
1997 Full Sample Conditioning onRegistered to Vote
First Stage: Dependent Variable is Age Left Full-time Education
Dropout Age 15 0.723 0.512(0.330)** (0.097)***
Dropout Age 16 0.523 0.953(0.357) (0.185)***
N 3390 18063
Second Stage
Age Left FT Education 0.060 -0.008(0.059) (0.018)
Female -0.030 -0.009(0.014)** (0.006)
Observations 3390 17825
All regressions include individual fixed effects for survey year, year of birth controls, and a quartic in age.Huber-White standard errors are shown with clustering by year of birth. Single, double, and triple asterisksindicates statistical significance at the 10 percent, 5 percent, and 1 percent level respectively.
31
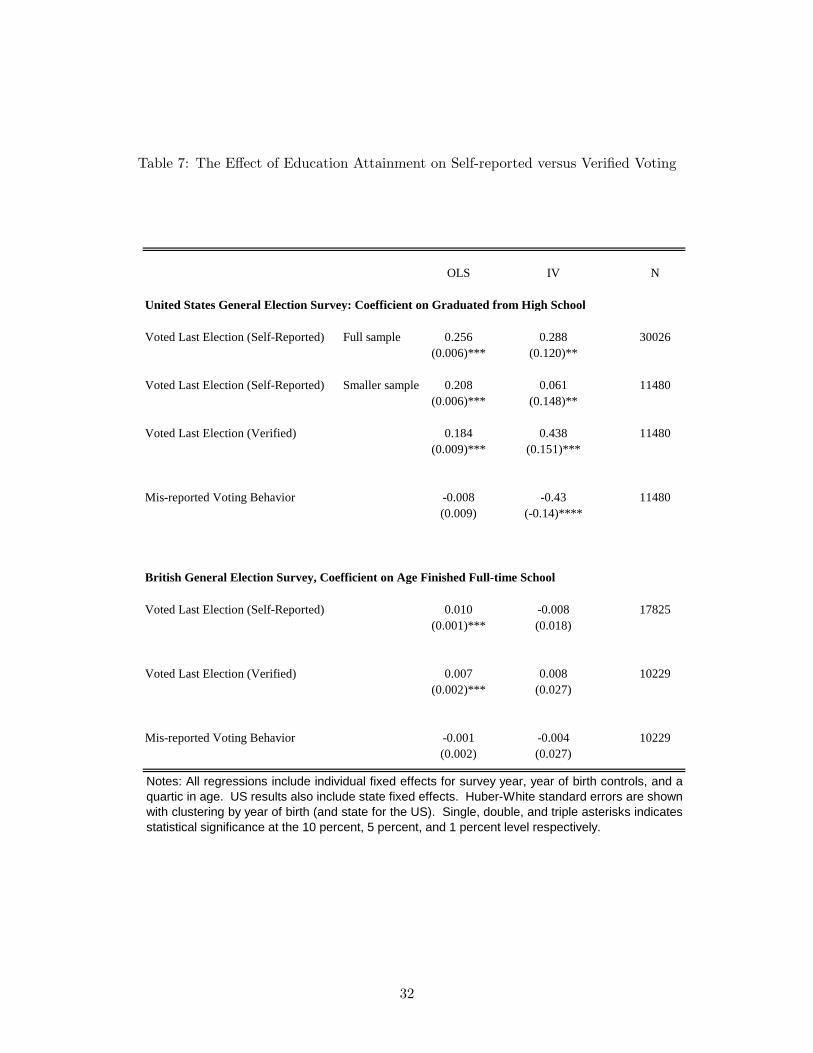
Table 7: The Effect of Education Attainment on Self-reported versus Verified Voting
OLS IV N
United States General Election Survey: Coefficient on Graduated from High School
Voted Last Election (Self-Reported) Full sample 0.256 0.288 30026(0.006)*** (0.120)**
Voted Last Election (Self-Reported) Smaller sample 0.208 0.061 11480(0.006)*** (0.148)**
Voted Last Election (Verified) 0.184 0.438 11480(0.009)*** (0.151)***
Mis-reported Voting Behavior -0.008 -0.43 11480(0.009) (-0.14)****
British General Election Survey, Coefficient on Age Finished Full-time School
Voted Last Election (Self-Reported) 0.010 -0.008 17825(0.001)*** (0.018)
Voted Last Election (Verified) 0.007 0.008 10229(0.002)*** (0.027)
Mis-reported Voting Behavior -0.001 -0.004 10229(0.002) (0.027)
Notes: All regressions include individual fixed effects for survey year, year of birth controls, and aquartic in age. US results also include state fixed effects. Huber-White standard errors are shownwith clustering by year of birth (and state for the US). Single, double, and triple asterisks indicatesstatistical significance at the 10 percent, 5 percent, and 1 percent level respectively.
32
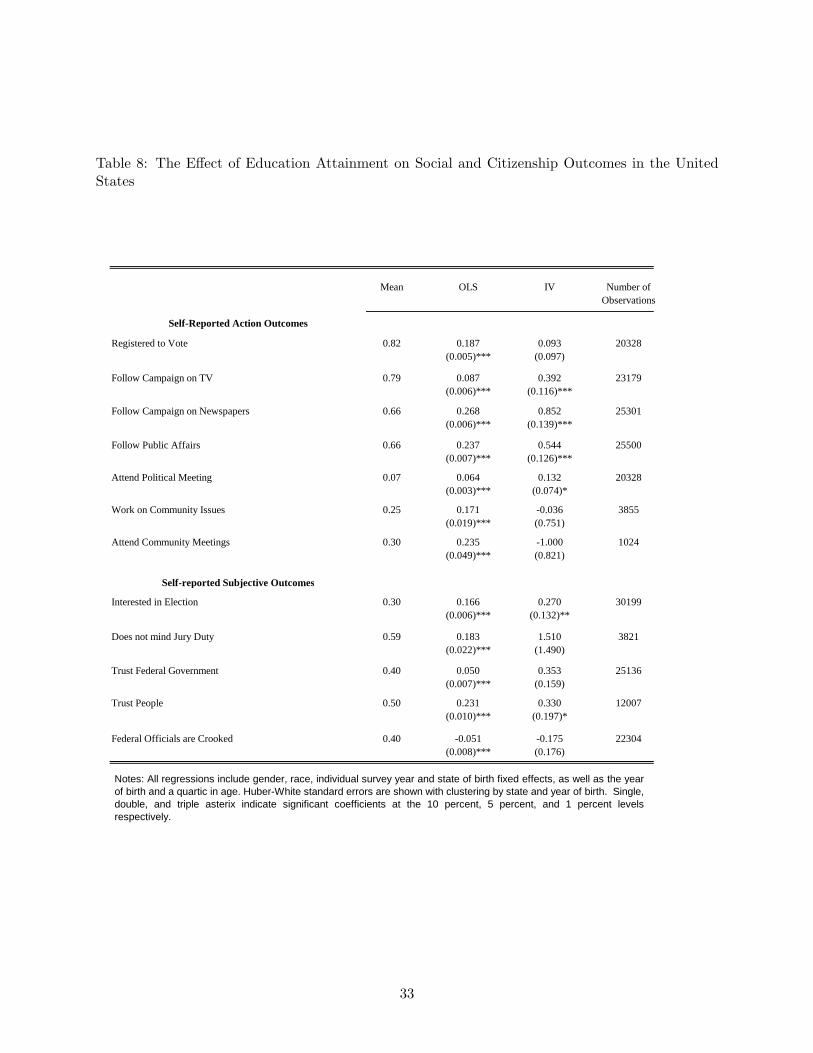
Table 8: The Effect of Education Attainment on Social and Citizenship Outcomes in the UnitedStates
Mean OLS IV Number ofObservations
Self-Reported Action Outcomes
Registered to Vote 0.82 0.187 0.093 20328(0.005)*** (0.097)
Follow Campaign on TV 0.79 0.087 0.392 23179(0.006)*** (0.116)***
Follow Campaign on Newspapers 0.66 0.268 0.852 25301(0.006)*** (0.139)***
Follow Public Affairs 0.66 0.237 0.544 25500(0.007)*** (0.126)***
Attend Political Meeting 0.07 0.064 0.132 20328(0.003)*** (0.074)*
Work on Community Issues 0.25 0.171 -0.036 3855(0.019)*** (0.751)
Attend Community Meetings 0.30 0.235 -1.000 1024(0.049)*** (0.821)
Self-reported Subjective Outcomes
Interested in Election 0.30 0.166 0.270 30199(0.006)*** (0.132)**
Does not mind Jury Duty 0.59 0.183 1.510 3821(0.022)*** (1.490)
Trust Federal Government 0.40 0.050 0.353 25136(0.007)*** (0.159)
Trust People 0.50 0.231 0.330 12007(0.010)*** (0.197)*
Federal Officials are Crooked 0.40 -0.051 -0.175 22304(0.008)*** (0.176)
Notes: All regressions include gender, race, individual survey year and state of birth fixed effects, as well as the yearof birth and a quartic in age. Huber-White standard errors are shown with clustering by state and year of birth. Single,double, and triple asterix indicate significant coefficients at the 10 percent, 5 percent, and 1 percent levelsrespectively.
33
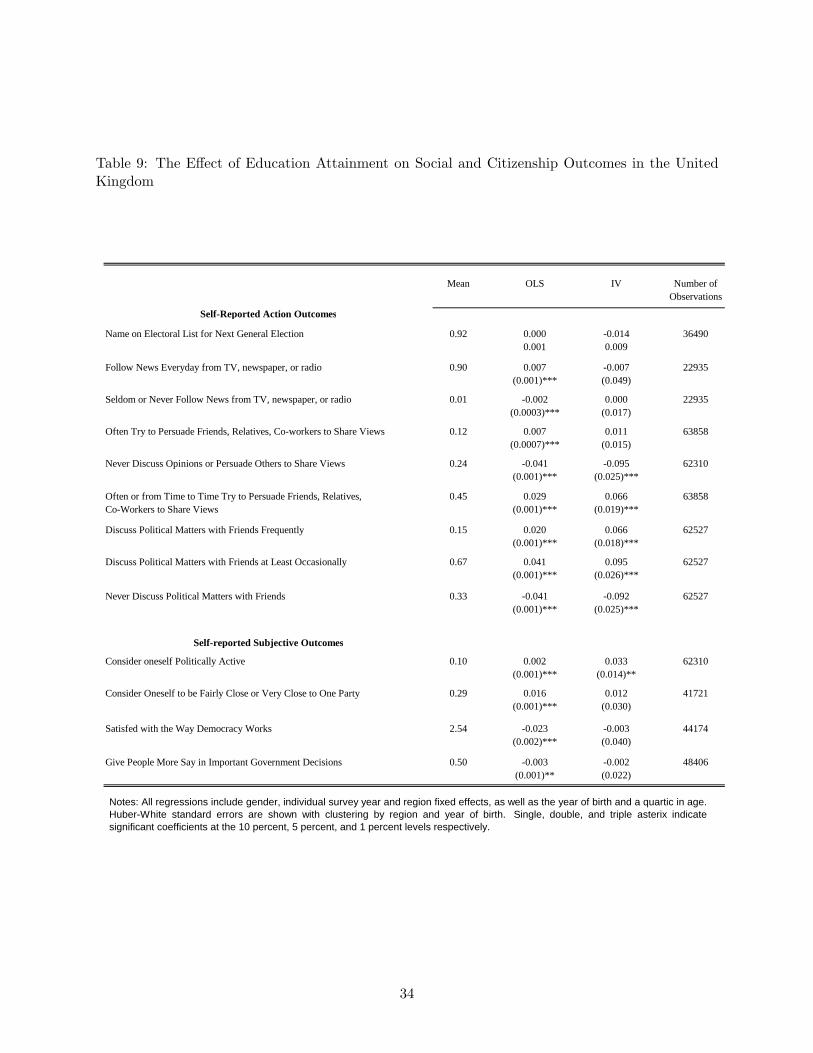
Table 9: The Effect of Education Attainment on Social and Citizenship Outcomes in the UnitedKingdom
Mean OLS IV Number ofObservations
Self-Reported Action Outcomes
Name on Electoral List for Next General Election 0.92 0.000 -0.014 364900.001 0.009
Follow News Everyday from TV, newspaper, or radio 0.90 0.007 -0.007 22935(0.001)*** (0.049)
Seldom or Never Follow News from TV, newspaper, or radio 0.01 -0.002 0.000 22935(0.0003)*** (0.017)
Often Try to Persuade Friends, Relatives, Co-workers to Share Views 0.12 0.007 0.011 63858(0.0007)*** (0.015)
Never Discuss Opinions or Persuade Others to Share Views 0.24 -0.041 -0.095 62310(0.001)*** (0.025)***
Often or from Time to Time Try to Persuade Friends, Relatives, 0.45 0.029 0.066 63858Co-Workers to Share Views (0.001)*** (0.019)***
Discuss Political Matters with Friends Frequently 0.15 0.020 0.066 62527(0.001)*** (0.018)***
Discuss Political Matters with Friends at Least Occasionally 0.67 0.041 0.095 62527(0.001)*** (0.026)***
Never Discuss Political Matters with Friends 0.33 -0.041 -0.092 62527(0.001)*** (0.025)***
Self-reported Subjective Outcomes
Consider oneself Politically Active 0.10 0.002 0.033 62310(0.001)*** (0.014)**
Consider Oneself to be Fairly Close or Very Close to One Party 0.29 0.016 0.012 41721(0.001)*** (0.030)
Satisfed with the Way Democracy Works 2.54 -0.023 -0.003 44174(0.002)*** (0.040)
Give People More Say in Important Government Decisions 0.50 -0.003 -0.002 48406(0.001)** (0.022)
Notes: All regressions include gender, individual survey year and region fixed effects, as well as the year of birth and a quartic in age.Huber-White standard errors are shown with clustering by region and year of birth. Single, double, and triple asterix indicatesignificant coefficients at the 10 percent, 5 percent, and 1 percent levels respectively.
34
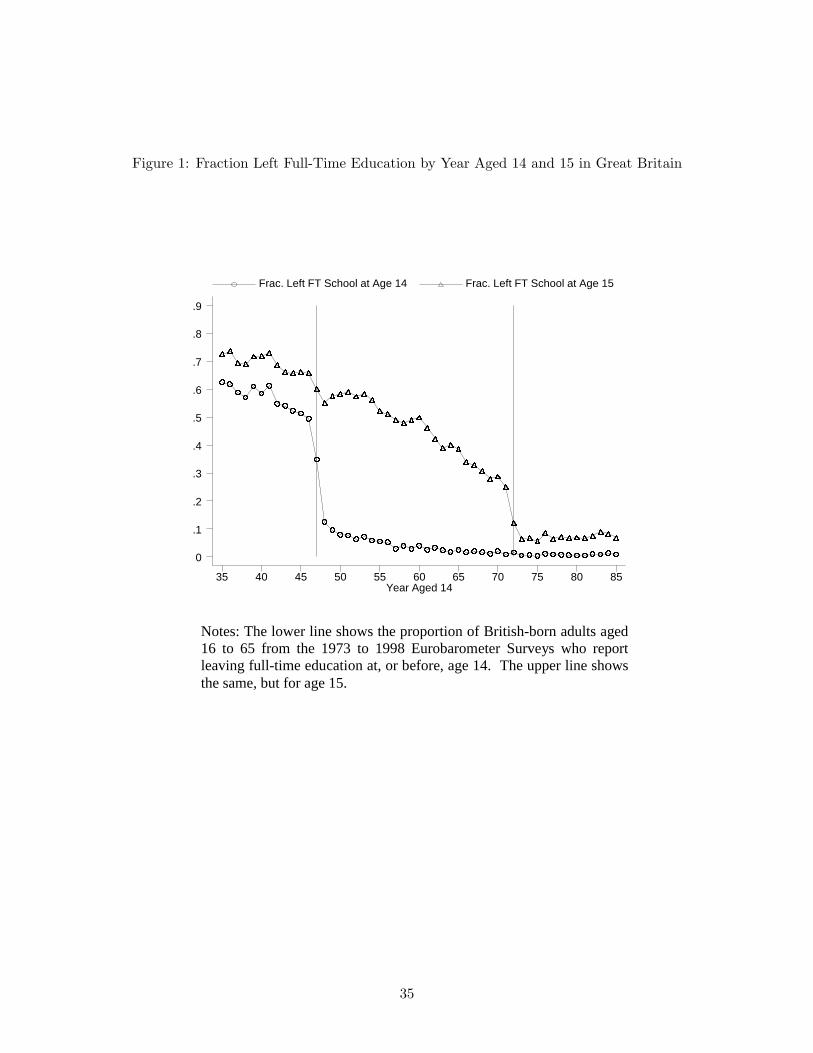
Figure 1: Fraction Left Full-Time Education by Year Aged 14 and 15 in Great Britain
Notes: The lower line shows the proportion of British-born adults aged16 to 65 from the 1973 to 1998 Eurobarometer Surveys who reportleaving full-time education at, or before, age 14. The upper line showsthe same, but for age 15.
Year Aged 14
Frac. Left FT School at Age 14 Frac. Left FT School at Age 15
35 40 45 50 55 60 65 70 75 80 85
0
.1
.2
.3
.4
.5
.6
.7
.8
.9
35
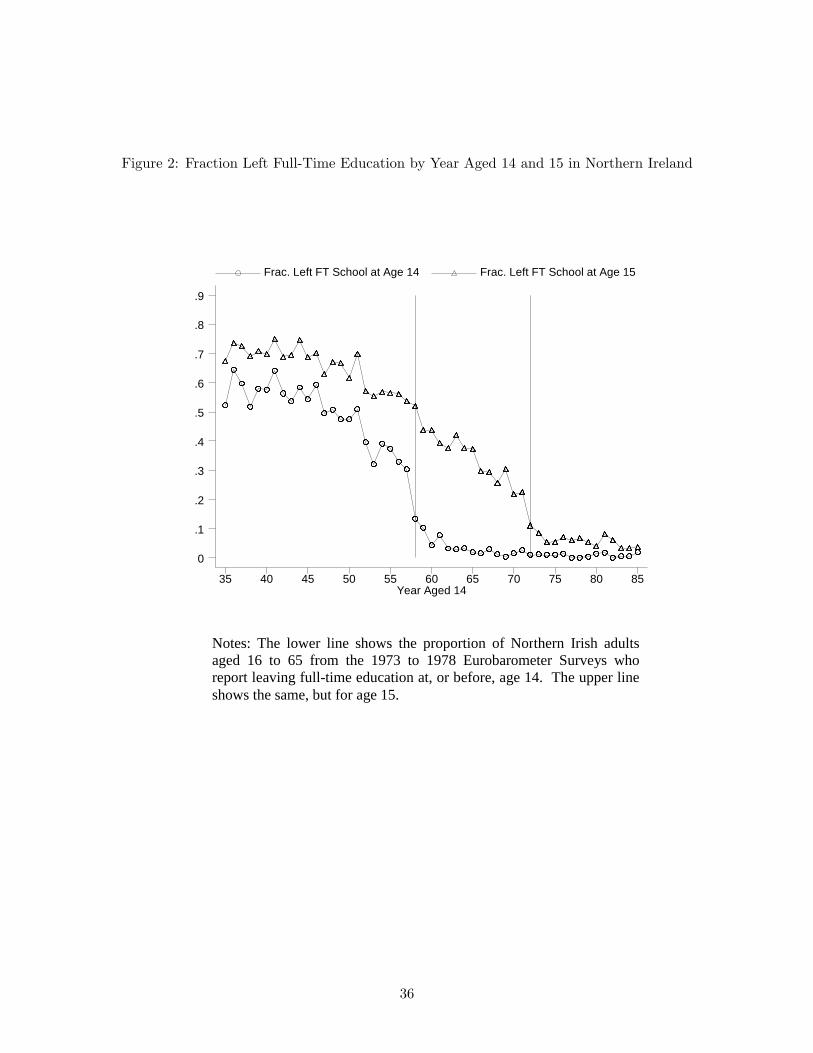
Figure 2: Fraction Left Full-Time Education by Year Aged 14 and 15 in Northern Ireland
Notes: The lower line shows the proportion of Northern Irish adultsaged 16 to 65 from the 1973 to 1978 Eurobarometer Surveys whoreport leaving full-time education at, or before, age 14. The upper lineshows the same, but for age 15.
Year Aged 14
Frac. Left FT School at Age 14 Frac. Left FT School at Age 15
35 40 45 50 55 60 65 70 75 80 85
0
.1
.2
.3
.4
.5
.6
.7
.8
.9
36
Copyright © 2022 FDOKUMEN