DO YOU NEED WINNERS TO WIN? AN ANALYSIS OF THE ...
131
DO YOU NEED WINNERS TO WIN? AN ANALYSIS OF THE EXPECTANCY THAT A WORLD SERIES-EXPERIENCED PLAYER IS NEEDED FOR FUTURE SUCCESS IN MAJOR LEAGUE BASEBALL A DISSERTATION SUBMITTED IN PARTIAL FULFILLMENT OF THE REQUIREMENTS FOR THE DEGREE OF DOCTOR OF PHILOSOPHY IN THE GRADUATE SCHOOL OF THE TEXAS WOMAN’S UNIVERSITY DEPARTMENT OF KINESIOLOGY COLLEGE OF HEALTH SCIENCES BY JAMES ALLEN TENNISON, B.B.A., M.ED. DENTON, TEXAS DECEMBER 2015
-
Upload
khangminh22 -
Category
Documents
-
view
2 -
download
0
Transcript of DO YOU NEED WINNERS TO WIN? AN ANALYSIS OF THE ...

DO YOU NEED WINNERS TO WIN? AN ANALYSIS OF THE EXPECTANCY
THAT A WORLD SERIES-EXPERIENCED PLAYER IS NEEDED
FOR FUTURE SUCCESS IN MAJOR LEAGUE BASEBALL
A DISSERTATION
SUBMITTED IN PARTIAL FULFILLMENT OF THE REQUIREMENTS
FOR THE DEGREE OF DOCTOR OF PHILOSOPHY
IN THE GRADUATE SCHOOL OF THE
TEXAS WOMAN’S UNIVERSITY
DEPARTMENT OF KINESIOLOGY
COLLEGE OF HEALTH SCIENCES
BY
JAMES ALLEN TENNISON, B.B.A., M.ED.
DENTON, TEXAS
DECEMBER 2015

iii
Copyright© James Allen Tennison. 2015 all rights reserved.

iv
DEDICATION
To my wife, daughters, and Dad,
This would not have been possible without you and the sacrifices that each of you made
along the way.
Dear, I still will not be watching all the cooking shows with you, but you will have to
share the TV a little bit more now. How about we watch a show that we both will like?
Girls, Daddy doesn’t have any homework to do now. I can finally just sit and play with
you! How about some dancing, dress-up, playing board games, and sports!
To my Dad, who was so proud to learn that I was going to begin this journey in the
summer of 2010. Sadly, he passed two weeks into me starting this degree but I could still
hear him cheering me on throughout. I know that if I told him I was finished today, he
would say, “How about that, sports fans? Pretty salty, Jimbob!”
v
ACKNOWLEDGMENTS
Thank the Lord for Dr. Leslie Graham! Thank you for your direction, keen eye, and for
constantly correcting me for leaving out the “Oxford Comma” (the last comma used in a
series before the word “and”) as it truly does change the meaning. You actually made the
editing part fun with your input and insightful baseball-themed comments such as: 1)
“You’re killing me, Smalls!” 2) “Don’t leave a runner stranded on base” (a reference
citation that bled over to another page), 3) “Gussy up”, 4)…I’ll add more, I’m sure.
Dr. David Nichols (statistics) and Dr. David Rylander (marketing), thank you for being
baseball fans who were willing to help me! I appreciate your time and devotion to my
process both in the classroom and on my committee.
Dr. Kimberly Miloch, a huge thank you for accepting me into your program and letting
me begin this process. Your influence as a professor and researcher has made a definite
improvement in who I am today. Thanks for kicking me in the tail when I needed it and
motivating me to be someone that is useful in sports research. I know you are not a
hugger, but this is my hug to you. Thank you!
Dr. Lindsay Pursglove, Dr. Sandy Shawver, Soon-To-Be Dr. Kristen Perry, and all the
other Sport Management doctoral students at TWU, thank you for answering the phone
vi
every time I called. Thank you for your guidance and going before me to pave the way
and tell me what the road looked like ahead.
Taft Rose, thank you for helping look up stats, listening, and thinking about this paper
more than you should have had to. The data collection days were fun with you and Josh
Duke. It was fun talking about all the names we were digging up. “I haven’t said that
name in a while!” We have more time to play ping-pong now!
Dr. Justin Gandy for listening and showing me how to format page numbers as i, ii, iii
and then change to 1, 2, 3 within the paper. This may seem trivial, but I include this
because it’s no small feat. Sandee Smith, thank you for all your help in formatting.
I cannot end this section without extending my deepest personal thanks to my dear friend,
and father-like figure, Jeff Brown. When my dad passed, I wasn’t expecting you to step
in like you did. You have looked out for me and my family, throughout this process, and
even this dissertation, as you too made sacrifices to help me get here. “I’m going to stay
with you until you finish, Big Boy,” you stated often and you never backed down from
your word, no matter what you faced. Thank you, my friend, and now we can enjoy life
without this little book report always on my mind. Next week, the enchiladas are on me!

vii
ABSTRACT
JAMES ALLEN TENNISON
DO YOU NEED WINNERS TO WIN? AN ANALYSIS OF THE EXPECTANCY THAT A WORLD SERIES-EXPERIENCED PLAYER IS NEEDED
FOR FUTURE SUCCESS IN MAJOR LEAGUE BASEBALL
DECEMBER 2015
In professional sports, winning is paramount to owners, general managers, and
coaches, and teams will look to any source possible as they seek to gain an advantage
over their competitors. A Major League Baseball (MLB) general manager (GM)
questioned the strategy of whether teams should seek to acquire personnel that are
already experienced at winning, or at least participating in, the World Series to help their
team excel, or if building and training a set of players that has not attained that goal is
preferable. As teams seek to add players with World Series experience, they are
employing the concept of experiential learning, or direct experience learning. Owners
and general managers then hold to the Expectancy Theory that their efforts will lead to
greater success than previously could be attained. This research seeks to answer the
question, using the sport of Major League Baseball as a backdrop, in order to aid teams as
they create a strategy for winning that will one day lead to a World Series Championship.
The purpose of this study was to test the effects of a team’s strategy of acquiring
players through a mid-season acquisition with previous World Series experience on their
winning percentage (WP%) and post-season success in an MLB season. Utilizing a One-

viii
Way Repeated Measures ANOVA, no significance was found in a team’s WP% after
acquiring the new player. An independent t-Test found no significance in the number of
World Series-experienced players (WSEP) on winning and losing teams. A Chi-Square
Goodness-of-Fit found no significance between the success of playoff teams from 1995-
2014.
MLB teams that employ the strategy of acquiring WSEPs are attempting to
bolster their team for better in-season performance as well as better post-season
performance but the data shows that this is not the case. The New York Yankees seem to
do this with frequency and success, and it encourages other teams to follow suit believing
that it displays commitment to fans. The results of this study encourage MLB teams to
seek to develop leadership, experience, and development.

ix
TABLE OF CONTENTS
Page COPYRIGHT .............................................................................................................. iii
DEDICATION ............................................................................................................ iv
ACKNOWLEDGMENTS ........................................................................................... v
ABSTRACT ............................................................................................................... vii
LIST OF TABLES ..................................................................................................... xii
Chapter
I. INTRODUCTION .................................................................................................... 1
Experiential Learning in Baseball ................................................................... 3 Expectancy Theory in Baseball ....................................................................... 7 Purpose ............................................................................................................. 8 Significance...................................................................................................... 8 Research Questions .......................................................................................... 9 Assumptions ................................................................................................... 10 Limitations ..................................................................................................... 12 Terms ............................................................................................................. 12 Summary ........................................................................................................ 13
II. REVIEW OF LITERATURE................................................................................ 15
Experiential Learning in Baseball .................................................................. 15 Expectancy Theory in Baseball ..................................................................... 18 Baseball is the Perfect Game to Study ........................................................... 20 Description of MLB Player Movement ......................................................... 25 A Potential Link Between Experience and Leadership in Baseball .............. 29 Summary ........................................................................................................ 32

x
III. METHOD ........................................................................................................... 33
Research Design............................................................................................. 33 Quantitative Analysis .............................................................................. 33 Independent Variable: the WSEP ................................................................ 34 Inclusion and Exclusion Factors for the Independent Variable .............. 34 Dependent Variable: MLB Team’s Winning Percentage ............................. 36 Inclusion and Exclusion Factors for the Dependent Variable ................ 37 Participants .................................................................................................... 38 Statistical Analysis ........................................................................................ 39 Instruments .................................................................................................... 42 Procedure ....................................................................................................... 42 Research Design ............................................................................................ 42 Statistical Analysis One: One-Way Repeated Measures ANOVA (Within Subjects Design) ........................................................................ 42 Statistical Analysis Two: Independent-Samples t-Test ......................... 44 Statistical Analysis Three: One-Way Chi-Square Goodness-of-Fit ...... 45 Validity .......................................................................................................... 45 Ethical Considerations .................................................................................. 47 Summary ........................................................................................................ 47
IV. RESULTS ............................................................................................................ 48
Overview ........................................................................................................ 48 The Independent Variable: Qualified WSEPs .............................................. 48 The Dependent Variable: MLB Team Winning Percentages ....................... 50 Analysis.......................................................................................................... 51 Research Questions One and Two: One-Way Repeated Measures ANOVA (Within Subjects Design) ........................................................ 51 Research Question Three: Independent-Samples t-Test ........................ 53 Research Question Four: One-Way Chi-Square Goodness-of-Fit ......... 55
V. SUMMARY, DISCUSSION, CONCLUSION, AND RECOMMENDATIONS FOR FURTHER STUDY .................................................................................... 61
Research Questions One and Two ................................................................. 61 Research Question Three ............................................................................... 66 Research Question Four ................................................................................. 66 Summary of Research Questions and Analyses............................................. 67 Implications for Personnel Strategies in MLB............................................... 67 Keeping up with the Jones’ ..................................................................... 67 Public Relations, Marketing, and Sales Benefits .................................... 69 Familiar Faces ......................................................................................... 71

xi
Leadership May be Different in Sport .................................................... 72 Potential Focus Shift from Mid-Season WSEP Acquisitions ................. 76 Implications for Theory Development ........................................................... 78 Experiential Learning in Baseball ........................................................... 78 Expectancy Theory in Baseball .............................................................. 79 Limitations ..................................................................................................... 80 Special Factors in the Game of Baseball Over 20 Years ............................... 81 Future Research ............................................................................................ 82 Conclusion ..................................................................................................... 83 Hope Springs Eternal .............................................................................. 84
REFERENCES .......................................................................................................... 88
APPENDICES
A. Data Output for One-Way Repeated-Measures ANOVA ...................... 100 B. Data Output for Independent-Samples t-Test......................................... 106 C. Data Output for Chi-Square Goodness-of-Fit ........................................ 109 D. Casey at the Bat by Earnest Lawrence Thayer ...................................... 112 E. Frequency of WSEP Acquisitions by Team and Year (1995-2014) ...... 116 F. Institutional Review Board Approval Letter .......................................... 119
xii
LIST OF TABLES
Table Page
2.1 Major League Franchise Developmental Teams and Season Length .............. 17
2.2 2012 NBA Escalated Luxury Tax and Penalties.............................................. 23
3.1 Winning Percentage Data Points for Repeated Measures ANOVA ................ 44
3.2 MLB Playoff Levels for Research Question 4 ................................................. 45
4.1 Descriptive Statistics for One-Way Repeated Measures ANOVA Comparing Day-of-Trade and End-of-Season Winning Percentages .............. 52
4.2 20-Year Comparison of Quantity of WSEPs on Winning and Losing Teams in the World Series ............................................................................... 54
4.3 Chart of Observed MLB Team Post-Season Performance .............................. 56
4.4 Chi-Square Goodness-of-Fit Data for Teams Completing a WSEP Transaction ....................................................................................................... 58
4.5 Chi-Square Goodness-of-Fit Output for Teams Completing a WSEP Transaction ....................................................................................................... 58
4.6 Chi-Square Goodness-of-Fit Data for Teams Not Completing a WSEP Transaction ....................................................................................................... 59
4.7 Chi-Square Goodness-of-Fit Output for Teams Not Completing a WSEP Transaction ........................................................................................................ 59
5.1 Player Acquisitions that Improved Mid-Season Performance From Sub .500 to .500 or Greater From 1995 to 2014 ............................................... 62
1
CHAPTER I
INTRODUCTION
The 2014 Major League Baseball (MLB) World Series saw two teams from very
different backgrounds take the field. The National League Champions, San Francisco
Giants, took on the American League Champions, Kansas City Royals. The Giants were
experiencing their third World Series in just a 5-year span while the Royals had not
participated in the Fall Classic in 29 years. A great deal of focus was placed on the
experience of the Giants players as six of the eight starting fielders were on the team that
won the World Series just two years prior (Gandy, 2014). The team in the opposite
clubhouse had earned their way with exceptionally talented youth, speed, and pitching
while fielding a team that consisted of only two players with experience in the World
Series. A topic that comes from these types of contests is if the winning team will be
decided by athleticism on the field or by experienced leadership in the dugout and
clubhouse.
In a conversation with an MLB assistant general manager (GM), it was stated that
approximately two-thirds of the teams in baseball believe they must have one or several
World Series-experienced players (WSEP) to lead their current team to the Fall Classic.
Conversely, he stated that one-third of the teams would rather attempt to win the
Championship with players who have not experienced that level of winning previously
(T. Levine, personal communication, 2014). The MLB assistant GM noted how teams
2
that were making an unexpected run to the playoffs would attempt to acquire WSEPs
through a mid-season trade just before the deadline, especially if the WSEP was currently
playing for teams with little hope of playoff success for their season. Teams believe
adding this WSEP player at the annual July 31st MLB trade deadline, even so late in the
season, can likely increase their team’s level of productivity.
MLB teams that have tasted recent victory and are hungry to excel furthe, will
cast away previous set budgets and long-term personnel strategies to continue to push
towards winning a World Series with a mid-season trade in order to win now. The 2014
Kansas City Royals fell short in the World Series after building a very young and talented
team and growing them into a contender. However, after losing the World Series in the
2014 season, an organization that is notorious for not making the mid-season trade pulled
the trigger for a deal in July 2015 as the bulk of their talent turns to free agency in the
next offseason (Passan, 2015). Equally as interesting is the example of the Houston
Astros. The Astros averaged 108 losses (in a 162 game season) from 2011 to 2013.
However, they completed a trade prior to the July 31st deadline for a pitcher, Scott
Kazmir (2008 WS), who had previously participated in the World Series, and another
impact outfielder in a move that was stated to show the team’s commitment to playing in
the postseason (Berg, 2015). It is interesting to note that the organization’s management
believes that the trade is an important commitment to winning as soon as possible.
The trade to a contending team is also welcomed by WSEPs as they would rather
have the opportunity to compete at the championship level previously enjoyed in their
career. For example, one WSEP, Jonathan Papelbon (2007 WS), while performing for a

3
non contender stated, “Some guys want to stay on a losing team? That’s mind boggling
to me.” (Zolecki, 2015). This exemplifies that the WSEP may apply pressure for the
trade from his current employer to a team that can likely return him to performing on
baseball’s largest stage
Experiential Learning in Baseball
In the field of education, there has been a growing movement over the last two
decades to place emphasis on Experiential Learning (Miettinen, 2000). David Kolb’s
(1984) book Experiential Learning is one of the landmark studies in the field (Jarvis,
1987; Weil & McGill, 1989; Dixon, 1994). Kolb champions the adult education concept
that experiential learning maintains faith in an individual’s innate capacity to grow and
learn over a lifetime (Kolb, 1984; Miettinen, 2000).
In considering Experiential Learning Theory one step further, it could potentially
exist in sport that an individual that is experientially-educated could also be looked to for
leadership. GMs may be seeking to acquire players in hopes that they are also receiving
leadership in the addition of a WSEP. Boyce, Jackson, and Neal (2010) stated that
relevant job-related credibility can positively impact leadership. Conversely, Sue-Chan
and Latham (2004) posit that the lack of sufficient professional credibility can negatively
impact an individual’s satisfaction with a leader. This leads to an assumption that GMs
may believe, in some instances, they are trading for an experientially-educated player that
could also offer some form of leadership that could increase team productivity. There is
a gap in the literature of assessing individuals in sport with valuable experience and the
4
potential that it could bring leadership to a team. This study will aim to aid practitioners
in the sport industry as they seek answers to this question.
MLB franchises have an elaborate training system, often referred to as the minor
leagues, in place to train and develop players to help them gain experience to be
productive Major Leaguers. Each year in the MLB First Year Player Draft, the 30
member teams select high school, collegiate, and amateur players over the course of 40
rounds (First Year Player Draft, 2015). In this draft, fresh, young players from the
United States, Canada, and Puerto Rico are selected to play on the MLB team that
selected them. The First Year Player Draft does not include players from other parts of
the world which are quickly becoming hot beds for new talent, such as Latin America and
Asia. Therefore, there are more than 1,200 players starting their professional baseball
career each season.
MLB franchises expend a great deal of time and resources to develop players
once they are acquired. If a team deems a player incapable of playing at the Major
League level, there is a multi-level farm system in place to develop his skills and create
an experiential learning process with the player. Based on a player’s skill level, he can be
placed with any of the franchise’s five minor league teams ranging from their beginning
level Rookie League team to their highest minor league option, the Triple A league team
(Minor League Baseball Affiliates, 2015). This system is in place specifically to help
players get the repetitions, development, training, and experience needed to play with the
Major League team.

5
The opportunity to play in and experience the World Series is a “higher
education” event that can transform and educate a player for the rest of his career, and
potentially lead them to be more sought after by other teams. With all of the new talent
donning a uniform in their team’s developmental system, GMs continually place high
value on experienced talent at the Major League level and will take drastic measures to
trade for WSEPs, as is evidenced in the recent case of Roy Oswalt (2005 WS). Oswalt
possessed the highly-coveted, contractual “no-trade clause” in his team contract with the
Houston Astros, a team he had played 10 consecutive years for, and was convinced by his
future suitor, the Philadelphia Phillies, to relinquish that right to be included in a trade
that would take them to a contender for the 2010 World Series (Stark, 2010). The
Phillies had lost in the 2009 World Series to the Yankees and were looking to bolster
their team with the addition of another WSEP to win the championship in 2010.
This action by MLB organizations exhibits their value of utilizing Experiential
Learning in their staffing and personnel strategies (Dewey, 1938; Kolb, 1984; Wurdinger
& Carlson, 2010). Rather than wait for a player to develop, and also gamble that the
developing player will meet their expectations, GMs will make monetary efforts, trades,
and future risks to acquire a proven player that they believe can lead their team in their
present situation. The MLB assistant GM noted how teams that were making an
unexpected run to the playoffs would attempt to acquire WSEPs through a mid-season
trade just before the deadline, especially if the WSEP was currently playing for teams
with little hope for playoff success for their season. Teams believe adding this WSEP
6
player at the annual July 31st MLB trade deadline, even so late in the season, will increase
their team’s level of productivity.
Each MLB off-season, just before the trade deadline (July 31st of each season),
there is a scramble for teams seeking the experience of veteran players, and especially for
those with prior World Series experience. There is an age-old concept in sports that is
voiced regularly in the media, and by GMs themselves, that for a team to experience the
success of winning in the playoffs, and especially the ultimate league championship, that
they must utilize players that have experienced success at the level they are trying to
attain (Keenan, 1999; Zolecki, 2013). However, it is of great speculation in baseball if
the acquisition of one particular group of experientially-educated players, the World
Series experienced players (WSEPs), can ferry their experience to a team so that they too
can achieve the goal of a post season trip to baseball’s Fall Classic. The difficulties faced
for the newly acquired WSEP are numerous. The time frame that they have to infuse
their experience and potential leadership from that experience, to produce a desired
outcome is usually only 60-90 days. The transition to a different owner, manager,
teammates, and culture can create a difficult adjustment period for the newly acquired
player. Secondly, it could be that the WSEP was previously in a situation that was “the
right mix, at the right time” as all the factors aligned to foster success for the player.
Kreiner-Phillips and Orlick (1993) posit that a great deal of attention is paid to
winning in sports, and the effects that success has on athletes, as it creates new demands
and roles for the athletes and is likely a predictor for experiencing future success. This
concept is certainly evident in MLB teams that value an experienced, successful player

7
and are willing to go to great lengths to trade for them, even for only a short period of the
season. It should come as no surprise that the ultimate goal of all MLB teams is to win
the World Series (Chen, Rhodes, Nail, & Salazar, 2008). In 2014, the 30 MLB teams
collectively spent over $3.3B in total payroll, with the average team in the league doling
out $111.3M in their attempts to achieve this goal (MLB Team Salaries, 2014). Teams
are paying for the talent and experience of the workers they put in uniform and ultimately
what they are seeking is experience that will lead to tangible results.
Expectancy Theory in Baseball
The field of consumer behavior holds to the concept that when potential
consumers perceive that an available good can aid in achieving desirable outcomes, then
the buyer is motivated to purchase the item to enjoy the positive consequences of the
purchase (Solomon, 1994). Before the purchase is even completed, the buyer begins to
develop expectations that the perception will become reality and begins to visualize
satisfaction with the good or service (Kopalle & Lehmann, 2006). Research has
indicated that expectations can be based on a variety of factors including advertising or
published quality ratings, trial, company promises, and word-of-mouth (Kopalle &
Lehmann, 1995; Zeithaml, Berry, & Parasuraman, 1988). This concept is easily
transferred to professional baseball as GMs consider enormous amounts of published
quality ratings (statistical data), trial (competing directly against a WSEP), and word-of-
mouth (broadcasters, other players and GMs conversing about the WSEP) when
considering whether to acquire a WSEP. For practitioners in the field of baseball, this

8
strategy that the team must “win with winners” displays an example of the behavioral
theory that Vroom created, the Expectancy Theory (1964).
Purpose
The sport of baseball provides an ideal canvas for conducting research on the
effects of player contributions to the team, in relation to attempting to isolate experiential
qualities, due to the nature of the game having a strong emphasis on individual
performance (Ahlstron, Si, & Kennelly, 1999). With MLB as the backdrop, the purpose
of this study is to test the effects of a team’s strategy of acquiring players through a mid-
season acquisition with previous World Series experience on their winning percentage
(WP%) and postseason success in an MLB season.
Significance
This study is aimed at aiding both practitioners and researchers. The question that
sparked this research was asked by a MLB Assistant GM that is looking for data to help
him decide the strategy that is most likely to help him as he builds a team. For
researchers, it gives a new use of the Expectancy Theory, while also providing a new
pallet for studying Experiential Learning. It could provide useful for psychological,
business, and educational fields with its blending of sociological, organizational
behavior, and life-long learning themes.
At first glance, the results of this study may appear to affect only a small number
of practitioners, the MLB GMs. However, these individuals are of great importance as
they are the most responsible for the outcome of their franchises’ performance. Their
player personnel decisions affect the attitudes of their entire fan base. The significance of
9
this study could potentially steer a team to winning a World Series, which could have
many short-term and long-term effects on the franchise and the market. A victory is
likely to broaden the size of the team’s fan base (Funk & James, 2001), deepen fan
loyalty (Tapp, 2004), increase brand and logo recognition (Portlock & Rose, 2009),
increase revenue from ticket and sponsorship demand (Carmon & Ariely, 2000; Drayer &
Rascher, 2013; Drayer, Irwin, & Martin, 2009) as well as generate a wave of success that
the team could build upon for the near future (Kreiner-Phillips & Orlick, 1993). Coates
and Humphrey’s (2002) research shows that hosting a Super Bowl may not have lasting
positive effects on the economy of the teams participating, but the World Series often
bucks that trend due to the number of games and the format of teams playing 2-4 games
in their home stadium in front of local fans. The effects felt from a franchise
participating in a World Series can ripple throughout the community for a short-term
economic boost. The proposed study will aim to be useful to practitioners and future
researchers in sport management, business, sociology, and education.
Research Questions
The utilization of this strategy leads researchers to several research questions for
examination:
Research Question 1: Is the addition of a WSEP to an MLB team in a mid-season
acquisition likely to produce a greater winning percentage in regular season play
from the date of the acquisition to the completion of the season?
10
Research Question 2: With the recent addition of a WSEP, is there an optimal period of
time, or tipping point, that it is likely the effects will be experienced in the team’s
WP%?
Research Question 3: Is there a significant difference between the numbers of WSEPs
utilized in teams that have won or lost the World Series?
Research Question 4: Is there a significant difference between observed and expected
frequencies of the levels of postseason success in teams after having completed an
acquisition of a WSEP?
Assumptions
This first assumption that this study is operating under is that every team in MLB
is playing to win the championship. Most importantly, the assumption is made that a
team that trades for a WSEP is attempting to improve itself in the short term and win
games. The WSEP is being added in a short-term situation to affect team performance
immediately, and to add playoff experience for the postseason.
There are occasions in which teams are seeking to reduce their salary load for
budgetary reasons, or simply to attain a lower end of season record to garner a higher
draft pick. However, it is commonly accepted that these teams are not trading for a
WSEP to begin a long-term rebuilding project, especially in a mid-season trade.
A second assumption is that teams that are trading away a WSEP, and are likely
receiving lesser skilled players, players with only minor league experience, a player to be
named later, or cash considerations are not seeking to improve and win in the short term

11
but rather take a longer approach to rebuilding. Only teams acquiring a WSEP will be
considered for the study.
A third assumption is that when a WSEP is added to a team in a mid-season trade,
a team is not likely to implement a change that would alter him from his previous roles
and responsibilities. It is assumed that he will be given the opportunity to lead and
perform as he is accustomed to. Under most normal circumstances, teams are acquiring a
WSEP for his production and experience. Therefore, it is not likely that they will change
his role, or negate or neuter his leadership style. It is his experience and potential
leadership that make him more valuable to the team.
The fourth assumption is that if the newly-acquired WSEP is injured during his
playing time with his new team, he is still able to affect the team’s situation even while
not participating on the field. Injured MLB players, unless severely injured, are likely to
stay with the team at home or on the road, to rehabilitate with the team training staff that
is also traveling with the team, go through daily drills at reduced speed or effort, and even
dress with the team and sit and watch from the dugout. Especially in the final two
months of the season, as teams are heading for playoff contention, the WSEP will most
certainly maintain activity with the team. Rehabilitation stints with minor league teams
are far less likely for minor injuries, or impossible as the minor league teams cease
playing the first week of September. Therefore, the WSEP will remain with the team and
can still affect the team through use of his leadership style.
While it is important that the WSEP play as much as possible, the most important
aspect is that the WSEP is present on and off the field, in the clubhouse, traveling, and

12
bringing his experience to the team. If a rising tide raises all ships, the addition of a
WSEP is the tide and his aim is to use this experience to raise the play of all his
teammates. The WSEP’s presence is the most significant aspect.
Limitations
In team sports where players interact together to achieve the goals of the entire
team, it will always be difficult to test if one person’s efforts are truly responsible for the
outcome of the group. While the point is made in this study that baseball is the most
ideal sport to test this, it still does not provide perfection. There are other factors at play,
such as injuries to other teammates that require personnel changes after the addition of
the WSEP. However, it is a short-term situational change, or testing period, and with
teams being late in their season after the July 31st trade deadline, many factors are
reduced. At this point in the season, the team has played between 100 and 110 games
together and most of the factors that could limit their productivity have been worked
through. A team that trades for a WSEP at the trade deadline is most likely to be doing
so because they believe the team can succeed in the short term.
Terms
Expectancy Theory – A motivational theory used in organizational behavior which states
that individuals will be motivated to perform based on two expectancies. The first
states that people will be motivated by the belief that effort exerted will lead to a
desired performance. The second is that a given performance will lead to desired
outcomes. (Vroom, 1964; Harder, 1991)

13
Experiential Learning – A cognitive field of study in education that is influential in
management training and adult education as it embodies an ideological faith in an
individual’s innate capacity to grow and learn (Kolb, 1984; Miettinen, 2000).
Leadership – In the industry of business, it is identified as behavior that has a significant
influence on an organization’s success (Burton & Welty Peachey, 2009).
Non-Waiver Traded Players (NWTP) – Major League Baseball players that are traded
prior to the July 31st trade deadline. These players do not need to clear waivers to
be included in a trade to another team.
Winning Percentage (WP%) – A calculation used in sports to relate the statistical
outcome of a team’s success based on the total of previous wins and losses. It is
calculated by dividing the number of games won by the number of games played.
World Series Experienced Players (WSEP) – A term created for this study that is used to
describe a player that has played in at least one Major League Baseball World
Series.
Waiver Traded Players (WTP) – Major League Baseball players that are traded
after the July 31st trade deadline and before the August 31st deadline. These
players must clear waivers to be included in a trade to another team.
Summary
Experiential Learning and Expectancy Theory are factors at play in the decision-
making process that GMs use when forming their teams and seeking the proper balance
of productivity and leadership that will garner their franchise success. GMs and owners
must often ask themselves if a player that has been to the World Series can provide
14
leadership after having gained valuable experience by participating in the event (T.
Levine, personal communication, 2014). The position of a GM is one of the most
scrutinized in sport, both by fans and the media (Hickey, 2014), and giving them a tool,
such as this research, can arm them in decision-making situations that occur with great
frequency in professional sport. The outcome of this research can mean the difference in
a general manager sitting at home in October and watching the World Series trophy being
hoisted by another team, or standing on the grass at his stadium and soaking in the roar of
his team’s fans as his players lift the trophy in the air.

15
CHAPTER II
REVIEW OF LITERATURE
Experiential Learning in Baseball
In the field of education, there has been a growing movement over the last two
decades to place emphasis on experiential learning (Miettinen, 2000). There are several
terms that are used to discuss and explain Experiential Learning (Olsen & Burk, 2014)
such as, learning through participation (Chambers & Lavery, 2012), student engagement
(Fried, 2012), experiential learning (Wurdinger & Carlson, 2010), direct experience
(Dewey, 1938), community engagement (Percy, Zimpher, & Brukardt, 2006) and service
learning (Butin, 2010). For the purpose of this research, the focus will be primarily on
the categories of experiential learning and direct experience.
David Kolb’s (1984) book Experiential Learning is one of the landmark studies in
the field (Dixon, 1994; Jarvis, 1987; Weil & McGill, 1989). Kolb champions the adult
education concept that experiential learning maintains faith in an individual’s innate
capacity to grow and learn over a lifetime (Kolb, 1984; Miettinen, 2000). Experiential
learning has a special nature as a cognitive field of study in education as it is viewed as
an opportunity to confront the challenges of adult education. Miettenen (2000) stated that
it is influential in management training and adult education as it embodies two important
concepts, experience, and reflection. One of its most important tenets is the ideological
faith in an individual’s innate capacity to grow and learn (Miettenen, 2000).
16
Kreiner-Phillips and Orlick (1993) posit that a great deal of attention is paid to
winning in sports and the effects that success has on athletes as it creates new demands
and roles for the athletes and is likely a predictor for experiencing future success. This
draws attention to the thought of the importance of experiential learning and its
importance in sport and hints at the potential that leadership may accompany an
experienced player as it indicates that they may be influential on their team’s future
success.
MLB franchises have an elaborate system in place to train and develop players to
help them gain experience to be productive Major Leaguers. As MLB GMs draft a
player, either from high school or college, they expect that the player will enter their
minor league training system and be open to an experiential learning process that will
enhance the player’s knowledge of the game and his ability to work with others and lead
them. However, one of the questions for each team is if the player is willing to learn and
grow and to what capacity. A player may learn to a level that can propel him to the
Major Leagues, or he may flounder in the minors and exit the system due to lack of
ability, or inability to learn and accumulate useful knowledge. In the case in which he
exits the system, direct experience and experiential learning were not proving beneficial
to the player.
Each year in the MLB First Year Player Draft, the 30 member teams select high
school, collegiate, and amateur players over the course of 40 rounds (First Year Player
Draft, 2015). In this draft, fresh, young players from the United States, Canada, and
Puerto Rico are selected to play on the MLB team that chose them. The First Year Player
17
Draft does not include players from other parts of the world that are becoming hot beds
for new talent, such as Latin America and Asia. Therefore, there are more than 1,200
players starting their professional baseball career each season.
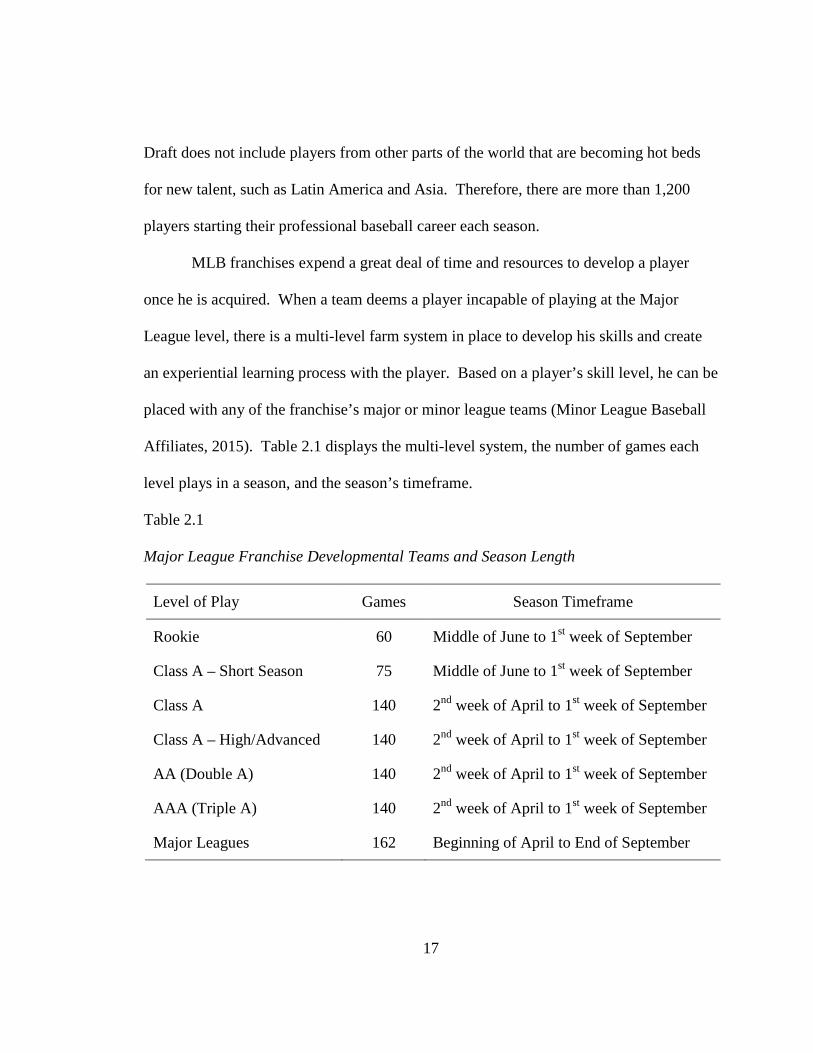
MLB franchises expend a great deal of time and resources to develop a player
once he is acquired. When a team deems a player incapable of playing at the Major
League level, there is a multi-level farm system in place to develop his skills and create
an experiential learning process with the player. Based on a player’s skill level, he can be
placed with any of the franchise’s major or minor league teams (Minor League Baseball
Affiliates, 2015). Table 2.1 displays the multi-level system, the number of games each
level plays in a season, and the season’s timeframe.
Table 2.1
Major League Franchise Developmental Teams and Season Length
Level of Play Games Season Timeframe
Rookie 60 Middle of June to 1st week of September
Class A – Short Season 75 Middle of June to 1st week of September
Class A 140 2nd week of April to 1st week of September
Class A – High/Advanced 140 2nd week of April to 1st week of September
AA (Double A) 140 2nd week of April to 1st week of September
AAA (Triple A) 140 2nd week of April to 1st week of September
Major Leagues 162 Beginning of April to End of September

18
This system is in place specifically to help players get the repetitions, development,
training, and experience needed to play with the Major League team.
With all of the new talent donning a uniform in their team’s developmental
system, GMs continually place high value on experienced talent at the Major League
level and will take drastic measures to trade for WSEPs, as is evidenced in the recent
cases of Jonathan Papelbon (2007 WS) and Roy Oswalt (2005 WS). Each of these
players possessed the highly-coveted, contractual “no-trade clause” in their team
contracts and were convinced by their future suitor to relinquish that right to be included
in a trade that would take them to a contender for the World Series (Zolecki, 2015). This
action by MLB organizations exhibits their value of utilizing experiential learning in their
staffing and personnel strategies (Dewey, 1938; Kolb, 1984; Wurdinger & Carlson,
2010). Rather than wait for a player to develop, and also gamble that the developing
player will meet their expectations, GM’s will make monetary efforts, trades, and future
risks for a proven player that they believe can lead their team in their present situation (T.
Levine, personal communication, 2014).
Expectancy Theory in Baseball
As MLB GMs oversee the progress of their season, they may see a need for equal or
greater output from a position on the field, and also an even greater need for leadership in
the dugout and clubhouse (T. Levine, personal communication, 2014). In consumer
behavioral theory, the GM is beginning the process in consumer decision-making.
Solomon (1994) details and lists the steps in the consumer decision-making model as: 1)
problem recognition, 2) information search, 3) evaluation of alternatives, 4) product
19
choice and, 5) outcomes. When potential consumers perceive that an available good can
aid in achieving desirable outcomes, then they are motivated to purchase the item to
enjoy the positive consequences of the purchase (Solomon, 1994). Before the purchase is
even completed, the buyer begins to develop expectations that the perception will become
reality and begins to visualize satisfaction with the good or service (Kopalle & Lehmann,
2006). General Managers that seek to acquire players with previous World Series
experience are in belief that the player’s previous experience will translate to success on
their current team. This is an example of the Expectancy Theory (Vroom, 1964) being
utilized in baseball.
According to the Expectancy Theory, individuals will be motivated to perform based
on two expectancies. The first states that people will be motivated by the belief that
effort exerted will lead to a desired performance. The second is that a given performance
will lead to desired outcomes (Harder, 1991; Alstrom et al., 1999). This is exemplified as
the GM believes that the effort exerted through manipulating a trade, or the steps taken in
acquiring a WSEP, along with the financial responsibility the personnel move entails,
will lead to the desired performance of the team playing well. Through these efforts, the
GM then believes that the team will enjoy the desired outcomes of a successful playoff
performance or World Series participation.
Research has indicated that expectations can be based on a variety of factors
including advertising or published quality ratings, trial, company promises, and word-of-
mouth (Kopalle & Lehmann, 1995; Zeithaml et al., 1988). This concept is easily
transferred to professional baseball as GMs consider enormous amounts of published
20
quality ratings (statistical data), trial (competing directly against a WSEP), and word-of-
mouth (broadcasters, other players and GMs conversing about the WSEP) when
considering whether to acquire a WSEP. For practitioners in the field of baseball, this
strategy that the team must “win with winners”, and the process to acquire one for their
team, displays an example of Vroom’s Expectancy Theory and Solomon’s Consumer
Decision-Making model.
Baseball is the Perfect Game to Study
When examining team sports to conduct this research, it is important to discuss
why baseball was selected as the backdrop for this study. Considering the five major
professional sports in North America (MLB baseball, NFL football, NBA basketball,
NHL hockey, and MLS soccer), professional baseball provides an excellent backdrop for
studying the effects of an individual’s experience in sport and how it can affect a team’s
productivity. The first factor that makes baseball the most ideal sport to study is that the
very nature of the game is a highly individualistic sport and player performance relies,
almost solely, on a collection of individual efforts on the field and in the batter’s box
(Ahlstrom, Si, & Kennelly, 1999). This characteristic of the game isolates the variables,
much like researchers attempt to do when assuring that only the independent variable is
affecting the dependent variable (Thomas, Nelson, & Silverman, 2011). Therefore, each
player’s efforts are not blended together and the chemistry of the performance on the
field blended together as in other team sports such as football, basketball, hockey, or
soccer.

21
In building the point that players are often interchangeable in baseball, based on
responsibility, Gould (1996, pp 127-128) eloquently hypothesizes, “systems manned by
best performers in competition, and working under the same rules through time, slowly
discover optimal procedures and reduce their variation as all personnel learn and master
the best ways.” This concept draws to light the discussion of comparing the efforts of
one performer against another and potentially finding an intangible that is different. For
instance, if the Texas Rangers utilized a player at First Base for three seasons who has
almost identical output to the incoming WSEP (e.g., hits, runs, batting average), but the
previous player was not a part of affecting the team’s outcome to a playoff or World
Series performance and the WSEP did participate in the team’s rise to success, it can
likely be concluded that the WSEP’s experience was a contributing factor. This draws
attention to the value of the leadership of the championship-experienced player as player
personnel experts are often quoted as stating that a “player’s talents may have diminished
but his toughness and leadership still makes him a valued presence in contending locker
rooms” (Wojnarowski, 2015, “Kendrick Perkins To Sign With Cavs”, para. 5 ).
The second factor is that essentially all players in baseball play their individual
positions identically to their counterparts on other teams all around the league. In a
majority of the North American professional team sports, almost all of the efforts of the
players participating are collectively placed together and it becomes more difficult to
determine which player made certain contributions. Unlike the nature of the game of
baseball and position responsibility, it should be considered that not all NBA point
guards, NFL quarterbacks, and NHL centers perform in the same manner as the

22
individuals holding the same position on other teams. One NBA guard may be more of a
“score first” mentality, while another is geared to pass first and run the offense in a more
team-oriented fashion. An NFL quarterback may be a more effective passer over another
that is more adept at scrambling and making plays with his running ability. An NHL
center may be more creative at puck movement, while another shoots and passes more
effectively. In MLB baseball, all first basemen perform essentially the same duties, in
the same fashion, each and every game.
The third factor that lends to baseball being an ideal sport for study is that it is
very easy for researchers to obtain accurate, and directly comparable, individual
performance measures from secondary sources (Ahlstrom et al., 1999). Of the major
North American professional sports leagues, baseball’s individual and team performance
data is the most reliable and measurable as statistics are taken on almost every aspect of a
player’s and team’s performance (Ahlstrom et al., 1999) and reported accurately through
numerous, easily attained sources.
A fourth factor that points to MLB being the proper testing ground is the
combination of a soft salary cap combined with a mildly punitive luxury tax in the sport
(MLB Collective Bargaining Agreement, 2012). With this system in place, teams are
able to acquire players more freely without the hindrance of a player being unable to be
acquired due to league financial constraints. The National Football League (NFL) and
National Hockey League (NHL) have a hard salary cap which absolutely does not allow
teams to spend above a league-set amount on player payroll in a given season (NFL
Collective Bargaining Agreement, 2010; NHL Collective Bargaining Agreement, 2013).

23
The National Basketball Association (NBA) utilizes a soft cap system which allows
teams to spend over the salary cap but incur a luxury tax (Table 2.2). The tax is an
escalated tax, based on total team spending, which escalates and takes extra punitive
measures for teams that have repeatedly spent over the cap, or “Repeat Offenders”, for
four of the last five years (NBA Collective Bargaining Agreement, 2012).
Table 2.2
2012 NBA Escalated Luxury Tax and Penalties
Amount over tax threshold Standard tax per
excess dollar
Repeat offender tax per
excess dollar
$4,999,999 or less $1.50 $2.50
$5 million to $9,999,999 $1.75 $2.75
$10 million to $14,999,999 $2.50 $3.50
$15 million to $19,999,999 $3.25 $4.25
Over $20 million $3.75 + $0.50 per
$5 million
$4.75 + $0.50 per
$5 million
Therefore, by NBA standards, a team spending over $20 million, that is also considered a
repeat offender, would be required to pay $4.75 for every $1 they are over the luxury tax
threshold. This is a deterrent for some teams looking to make a mid-season upgrade.
Major League Soccer (MLS) employs one of the most interesting salary systems
that are in use in North America. Each team is given a “Salary Budget” of $3.1million
for their first 20 roster slots, with 10 more roster slots available to teams that essentially

24
allow them to maintain a minor league developmental system. This salary budget gives
the appearance of a hard-capped league; however, it is not truly how business is
conducted. Based on the collective bargaining agreement in place for the 2014 season,
no single player in MLS is to receive a salary over $387,500, (MLS Roster Rules and
Regulations, 2014), however elite players are paid “marketing bonuses” that lift their
salaries into the $5M to $7M range (Goff, 2014). In the Spring of 2015, the MLS inked a
new collective bargaining agreement between the owners and players’ union with the
salary cap and the institution of free agency as major points of the new deal.
In comparison to the other professional leagues mentioned, MLB’s soft cap
system is employed but with far less punitive measures for over-spending. Teams that
exceed the tax threshold, or Competitive Balance Tax, are required to pay 17.5% of each
taxable $1 for amounts over the tax threshold, if they were not a repeat offender from the
previous year. They are required to pay 30% if they were over the threshold the previous
year, 40% if the previous two years and 50% if the previous 3 years (MLB Collective
Bargaining Agreement, 2012). At worst, in MLB, a team would have to pay 50 cents for
every dollar they were over the tax limit.
With this collective bargaining taxation system in place in MLB, teams are free to
spend openly on what they feel they need to lead their team to success, such as a player
that is a WSEP, with less thought to monetary barriers. The significance to this situation
is that a team may have a budgeted plan in place for their season and then feel the need to
acquire a WSEP halfway through the season that would over-step their initial budgetary
plans. In a hard-capped league, there is very little flexibility when making these mid-
25
season decisions. In a situation such as the NBA’s soft cap, the unbudgeted expense of a
WSEP player could change the team’s tax bracket dramatically. However, in MLB, such
players can be added with no effect to a salary cap and only a minor punishment in
consideration of the tax bracket since it will not change based on amount spent on current
payroll, but rather the previous year’s tax status. The salary cap and luxury tax system in
MLB is easily the least punitive of the North American professional sports leagues as it
fosters in-season player movement as teams seek to add a WSEP that they believe can
positively impact their situation. It also allows teams to reprioritize their budgeting
spending midseason. Therefore, it also lends to be the best situation for this study to
utilize.
The final discussion regarding player selection is to clarify why a WSEP is more
favorable over a player that was selected to participate in the MLB All Star game. An
“All Star” player is recognized as having been an outstanding performer, midway through
the season, for his team. There are two issues to consider in this discussion. First, the All
Star player was selected for only his first half production and may have faltered in
producing the second half. Secondly, as discussed previously, baseball performances are
very individualistic. An All Star may have played well for his team, but ultimately
cannot be qualified as having raised the level of his entire team to a greater team
performance.

26
Description of MLB Player Movement
When MLB GMs are seeking to add a WSEP to their roster, there are a number of
avenues for them to acquire a player from another team. Teams may acquire a player
through a:
a) Non-Waiver Trade - These are trades in which the transaction exists solely
between the two teams contracting to the trade and will have been traded in a
window of time starting November 11th, the conclusion of the previous season,
and ending at the non-waiver trade deadline of July 31st at 4pm ET (MLB Trade
Deadline, 2014).
b) Waiver Traded Players – Teams are still capable of completing a trade after the
formal Non-Waiver Trade Deadline (July 31st) and the before the end of the
Waiver Trade Deadline on August 31st at 11:59pm ET (MLB Trade Deadline,
2014). These are trades in which a team must place the player on a waiver list
that exposes him to be acquired by all teams, for a period of time determined by
the Commissioner’s office, before a formal trade can be completed (MLB
Collective Bargaining Agreement, 2012). This process is known as “clearing
waivers” and a player is available to all other teams for a period of 48 hours to
negotiate a trade. If no trade is completed by the end of three business days with
a team that has filed a claim, the player may be traded freely to another team,
assigned to the original team’s minor league system, or released outright (Center,
2011; MLB Trade Deadline, 2014).
27
c) Claimed Off Of Waivers – Players may be acquired when plucked from
another team’s waiver listing. MLB teams are allowed to protect players on their
40-man roster. They may have players in their system that are not protected
through this roster system and therefore must be posted on waivers if they are
ever removed from the 40-man roster, or sent to the minors. These names must
be posted to the Commissioner’s office by 3:00 p.m. each Friday for League-wide
announcement (MLB Collective Bargaining Agreement, 2012). Players can be
selected by any of the other 29 teams in the league. If there are competing waiver
claims, the team with the worst win-loss record in their League (e.g. American
League or National League) wins the waiver claim. Clubs claiming a player from
waivers must pay the original team that held the player’s rights a $20,000 waiver
fee, and pay the player a pro-rated salary of the MLB league minimum salary; any
remaining salary that was on the player’s contract is covered by the original team
holding his rights (Aberle, 2009; MLB Collective Bargaining Agreement, 2012).
There is a great deal of jockeying that is utilized in this system to protect teams
from losing players but this system is in place to allow a player to quickly transfer
to a Major League club that can utilize his services.
d) Purchased – Players that are acquired through a purchase situation had their
contract purchased from the originally held team. It signifies that there were no
other players involved in the transaction. The purchasing team often pays the
player’s team a fee to obtain the rights to the contract. This is seen many times
when MLB teams purchase the contracts of foreign players. Japanese baseball
28
teams often require a “posting fee” in order to purchase the contract of one of
their players. A Japanese League team, the Nippon Ham Fighters, received a
$51.7 million posting fee before allowing the Texas Rangers to acquire pitcher Yu
Darvish (Short, 2012). Players are also acquired from North American
independent teams that are not affiliated with a Major League club.
Acquired In A Conditional Deal – This is a trade situation between two
teams that is a delayed completion of a previous trade. Often times in a trade, one
team will acquire an actual player at the time of the trade and allow the other club
to acquire a “player to be named later”. There are generally two situations that
are occurring in these types of trades. The first is that the player being sought has
a current trade restriction that prevents him from being traded at the very moment
that a deal needs to be completed. The second situation is that one team may list
that they are interested in a pool of players and the two teams are agreeing to
allow a period of time to pass while the team receiving the potential player
completes their due diligence in evaluating all players within that pool. GMs
often put a great deal of weight on these types of transactions and are very
important to the deal being stuck (T. Levine, personal communication, 2015).
Therefore when the player is formally sent to the new club, and the open trade is
completed, this is the completion of a conditional deal.
Regardless of how the player is acquired, it is a significant event for a team to
place someone on their team that did not previously play for their club, especially if that
transaction occurs during the season. It can change the team dynamics on and off the

29
field. Players that are used to playing together for 100+ games are now getting used to
the slightly different movements of a new player. Personalities mesh differently in the
clubhouse and during team travel. The WSEPs that are added to a team may be taking
the place of a younger player that the team was grooming for future use. Players that are
traded away from the club can leave a void in the team’s future plans with their absence.
Teams are, in essence, mortgaging their future for the hope of a better, present situation.
A Potential Link between Experience and Leadership in Baseball
There is a saying that is attributed to President John F. Kennedy (1963) “a rising
tide lifts all boats.” A WSEP will likely bring experience, performance, and potentially
even ferry leadership to a team which, in turn, raises expectations and output of all his
other teammates to achieve greater goals, while an All Star player is likely only an
excellent individual performer. Due to his taste of success in a World Series, and his
desired return to that level of play, a WSEP that is added to a team may bring far more
than production on the field. WSEPs can establish order, set direction and expectations,
provide motivation and inspiration, align coworkers to management’s direction, and hold
workers accountable to their goals (Pedersen, Parks, Quarterman, & Thibault, 2011).
MLB journeyman catcher Gregg Zaun tells of his situation as a rookie catcher with the
Baltimore Orioles, and the experiences he had playing with WSEP Cal Ripken Jr (1983
WS). Zaun was a recipient of Ripken Jr’s rewards and punishment during his time with
the Orioles. Zaun states that teams need to embrace the tone-setting and leadership that
WSEPs can set for a team from the front office to the team’s field manager (Townsend,
2015). He shares that a team should allow a WSEP “to create the atmosphere that they

30
want in the clubhouse, because at the end of the day, when guys get along and they know
their pecking order, and they know the hierarchy, everything seems to work out just fine”
(Townsend, 2015, “Greg Zaun Says Cal Ripken Jr Kept Him In Line”, para. 8). Ripken
Jr used his previous experiences and knowledge of leading a team to hold a form of
currency of respect that the other players looked to for guidance.
A recent example to this point from the management level of expectations is the
Oakland Athletics GM, Billy Beane, traded four All Star players on his squad in the
offseason leading to the 2015 campaign (Hickey, 2014). It can be considered that he is
likely removing players that are not leading the team as a whole to achieve greater goals
as this group of players, while excellent individual achievers, has reached only the first
round of the playoffs the last three seasons. Beane has even greater pressure upon him
since the team that has won three of the last five World Series Championships, the San
Francisco Giants, is only a short 8 miles from his club’s stadium. To those critics that
think Beane is making irrational moves, because trading four All Star players in one
offseason is abnormal, his team’s owner, Lew Wolff, supports the moves and states that
Beane “is in absolutely the very top tier of general managers current, or past” (Hickey,
2014).
In comparison to Beane’s example of trading All Stars that seem to lack
leadership, which could likely be expected from an experienced WSEP, Texas Rangers
GM, Jon Daniels, seems to have the same values as Beane, even to the point of being
willing to trade a WSEP, although not in the middle of a season. Daniels displayed his
view of the importance of leadership in the situation with an 8-year veteran, Ian Kinsler

31
(WSEP 2010 & 2011), who was clearly not displaying qualities that the GM and
ownership felt were needed to lead their squad. Daniels traded Kinsler, a player that the
Rangers franchise had developed in their minor league system, witnessed him attain All
Star status, and even enjoyed two World Series runs with (although the Rangers lost in
each). When Daniels requested that Kinsler take over the leadership position left open by
departed Michael Young (WSEP 2010 & 2011), he displayed no interest in the role.
Kinsler stated that he was upset with Daniels because he had asked him to bear too much
of a leadership role and he was also asked to change positions to make room for an
upcoming prospect (Durrett, 2014). These requests are responsibilities that GMs could
expect a team leader that is experienced to be willing to shoulder. Kinsler had spent eight
years gaining valuable experience, even at the World Series level, and was a fan favorite
in the team’s market but was not willing to lead when asked by his GM. This is a clear
example of how important leadership versus the individual performance of a player is to a
GM who expects it from a WSEP.
In the case of this study, we are looking specifically for players that have
experienced the World Series previously to decide whether they have raised the tide of
their newly acquired team’s performance to the level of being able to compete for the
World Series. In sports, winning is the gold standard of success and WSEPs have
exemplified this more thoroughly than a player that may have only performed well for at
least a half of a season, or didn’t lead their team to full potential in the end.

32
Summary
With the ever present demand for MLB GMs to produce a winning team that can
win championships sooner rather than later, there is always a desire by those involved in
decision making to find a more effective means of producing this result. Examining
experiential learning and its effect on players, as well as testing whether expectations are
met in making player moves is vitally important to GMs and their fans. With the
backdrop of baseball to examine these concepts, this study was aimed at accurately
assessing these phenomena.

33
CHAPTER III
METHOD
The purpose of this study was to test the effects of a team’s strategy of acquiring
players through a mid-season acquisition with previous World Series experience on their
winning percentage (WP%) and postseason success in an MLB season. The aim was to
test for the effects of experiential learning in MLB players that are World Series-
experienced.
Research Design
Quantitative Analysis
This research was conducted using quantitative analysis. As stated previously,
the most important aspect of the addition of an experienced player is to create a culture
that fosters performance. Therefore, a quantitative approach draws to the fact that the
end result of the trade for the WSEP is to win, and to realize a deeper playoff run than
previously. This is calculated most effectively through quantitative means. Thomas et al.
(2011) stated that “experimental research involves the manipulation of treatments in an
attempt to establish cause-and-effect relationships” (p. 17). This study clearly analyzes
the outputs from the cause-and-effect relationship of a WSEP’s treatment to an MLB
team.
While many studies often focus on the quality of the experience, or leadership,
this study may appear to disregard the means by which it was achieved. However, this

34
study is purely focused on the results of the trade on a team’s output. A quantitative
approach also maintains the previously established focus that a team’s main goal is to win
(Chen et al., 2008) rather than the focus being placed on how the team accomplished the
success. A thorough and detailed qualitative analysis of a team’s experiences as a result
of a WSEP’s presence is better suited for a study in the future.
Independent Variable: The WSEP
An interesting aspect to this study was that the independent variable, the WSEP
player, was the treatment, and the dependent variable was the winning percentage of a
team. Therefore, the independent variable WSEPs were male; MLB players (pitchers and
fielders) between the ages of 18 and 45, who currently play, or formerly played, in the
MLB between the years of 1994 and 2014. In this time frame, there were 1,003 roster
spots for players to experience a World Series. Due to the occurrence of teams and
players participating in the World Series on multiple occasions, 702 different players
participated in the World Series over the 20-year time frame and were available for
consideration in the study.
Inclusion and Exclusion Factors for the Independent Variable
To be included in the research, the WSEPs met the following:
1. The WSEPs utilized in the study experienced at least one MLB World Series,
even if it occurred prior to the 1994-2014 window of study for this research.
The outcome (i.e., win or loss) of their previous World Series was not
considered as significant. For the purpose of this study, it only matteedr that
they experienced a World Series previously in their career.
35
2. WSEPs utilized in the study joined their new teams in a variety of ways based
on MLB’s options for player movement. Players used in the study were
acquired during the season after July 1st and were obtained through an in-
season trade (waiver trade or non-waiver trade), had their contract purchased
by the acquiring MLB club (either from another MLB team, independent club
or foreign team), claimed off of waivers, or received from a conditional deal
(which is usually the consummation of a previous trade that included a Player
To Be Named Later).
- The limitation of using trades after July 1st and before the end of the
season is significant to the study from a baseball point of view. This date
was utilized because of the urgency it provides in the season. Teams that
believe they are capable of reaching the playoffs have a greater sense of
their abilities in July as they are between approximately 75 and 105 games
into their season. By the end of June, teams can look at their projected
outcome based on the standings of all teams in their League and make the
decision to look for a trade or acquisition. As Chicago Cubs President of
Baseball Operations, Theo Epstein, states regarding trades at the end of
June in the 2014 season, “Teams don’t like to rush into those types of
things. It takes time to develop” (Rogers, 2014, “Trade Talk Is
Speculation”, para. 2). That urgency comes to a head with the non waiver
trade deadline of July 31st at 4:00 p.m. ET each season, which is the
catalyst for teams to complete a trade before this time.

36
- This date was also selected because of the solid sample size that it
provides when considering the WP% of a team that is making a trade for a
WSEP. Since teams have played nearly 2/3rds of their season at this point,
they provide a good baseline of performance to then calculate the effect of
the independent variable. Trades made in June have played 50-75 games,
and leave a weak sample plus provide difficulty in testing if the WSEP
likely made a difference with potentially 75 to 100 games left in the
season.
3. The newly-acquired WSEP must have accumulated 20 games with his new
team to have been examined in the study and remain with the team to the end
of the season for a final tally of WP%. The 20 games limitation gives the
player ample time to acclimate with the new team and contribute both on and
off the field. There were 11 players in the study who experienced a trade and
then were traded again shortly after their initial trade within the same season.
The results of the initial trade were not used in the study. They only remained
in the study if their second trade allowed for them to experience 20 games
with their new club and they also finished the season with the team.
Dependent Variable: MLB Team’s Winning Percentage
The dependent variable in this study was the winning percentage (WP%) of an
MLB team. The WP% is the standard measurement in sports relating to the output of an
MLB franchise’s success in games played. It is calculated by dividing the team’s wins by
37
the total number of games played (MLB Basic Stats 101, 2014). As a formula, the
winning percentage is calculated as:
Winning Percentage (WP%) = Games Won Total Number of Games Played
Each team is comprised of a collection of 25 players that are male, MLB players (pitchers
and fielders) between the ages of 18 and 45, who currently play, or formerly played,
Major League Baseball between the years of 1994 and 2014. The winning percentage of
all participating MLB franchises was considered for the study.
Inclusion and Exclusion Factors for the Dependent Variable
1. Teams were included that traded for a WSEP between July 1st and the end of the
season, as described previously.
2. Teams acquiring a WSEP with a WP% below .400 and that did not make the
playoffs in the season that they traded for him were excluded from the study. The
reason for this decision is that a team with such a low WP% does not likely count
themselves as a contender for the playoffs. There are transactions that teams
make in which they acquire a WSEP with such a WP% below .400, but they are
likely in a rebuilding phase and constructing a team that can compete in future
seasons. It is commonplace each season in MLB to read about teams with
situations similar to the 2015 Philadelphia Phillies. At 38-64 (a .372 WP% as of
July 30th in the season), they were last place in their division, the National League
East (Stark & Bowden, 2015). The team was deemed to be “obvious sellers” in
the trade market and looking to utilize the trades of such players as Cole Hamels

38
(WS 2008 & 2009) and Jonathan Papelbon (WS 2007) as a trade piece that can
bring prospects back to a club’s minor league system (Montemurro, 2015). This
is a move that teams with a sub-.300 WP% make when looking to rebuild and
reduce their current season’s salary and/or luxury tax burden and a WSEP may be
included in such deals as their new club looks to the future. On the other side of
this trade, the Texas Rangers, who acquired Hamels, were seven games out of
first place, and four games from a potential wild card position. While they were
certainly in contention for a playoff spot, the attractive qualities of Hamels’
contract in which he would be with the Rangers three more seasons, was attractive
to the team for obtaining the WSEP and competing more furiously the upcoming
season. WSEPs can be acquired for future, long-term rebuilding purposes.
The factors placed on the independent variable for inclusion and exclusion,
yielded 222 WSEP trades that could be analyzed for research and 74 teams that
participated in mid-season trades taking place after July 1st and before the end of the
season, in which the WSEP logged 20 games with his new team and completed the
season with the club.
Participants
The participants in this study were males between the ages of 18 and 45 that
currently play, or formerly played, for MLB teams in the United States of America or in
Canada, between the years of 1994 and 2014, as well as the MLB franchises they played
for during the same time frame. As this is research utilizing public information of the

39
statistical achievements of MLB players, the entire population will be accessible for this
study.
Statistical Analysis
This research will utilize three statistical analyses in search of answering the four
research questions that are the aim of the study: a One-Way Repeated Measures
ANOVA will test the significance for Research Questions 1 & 2, an Independent-samples
t-Test will analyze Research Question 3, and a Chi-Square Goodness-of-Fit will be
utilized for Research Question 4.
Research Question 1: Is the addition of a WSEP to an MLB team in a mid-season
acquisition likely to produce a greater winning percentage in
regular season play from the date of the acquisition to the
completion of the season?
H10: There will be no significant difference between the means of the
regular season winning percentages on the day of the trade and at
the end of the season.
Hypothesis 1: Adding a WSEP in a mid-season trade is likely to make a
significant difference in a team’s regular season winning
percentage.
Research Question 2: With the recent addition of a WSEP, is there an optimal period of
time, or tipping point, that it is likely the effects will be
experienced in the team’s winning percentage?
40
H20: There will be no significant difference in the winning percentage
between the six measured periods.
Hypothesis 2: A recently added WSEP will improve the winning percentage of
his new team within 2 weeks of his arrival and sustain
improvement throughout the season.
Statistical Analysis: One-Way Repeated Measures ANOVA (Within Subjects Design)
- This analysis will provide a view of the team’s winning
percentage prior to the trade, as well as provide an analysis of
significance after the treatment.
- With the repeated measurements of the dependent variable, this
analysis will also monitor progress during the treatment period
for periodic effectiveness.
Hypothesis Testing
Procedure: - H0: µ1= µ2 = µ3 = µ4 = µ5 = µ6
- α = .05
- Criteria for rejecting H0: p ≤ .05
Research Question 3: Is there a significant difference between the numbers of WSEPs
utilized in teams that have won or lost the World Series?
H30: The mean of WSEPs on winning and losing World Series teams
will be equal.
Hypothesis 3: Teams that have won the World Series over the 1995-2014 span

41
are likely to have a significantly greater number of WSEPs when
compared to teams that lost the World Series.
Statistical Analysis: Independent-samples t-Test
Hypothesis Testing
Procedure: - µ1 = µ2
- α = .05
- Criteria for rejecting H0: p ≤ .05
Research Question 4: Is there a significant difference between observed and expected
frequencies of the levels of postseason success observed in teams
after having completed an acquisition of a WSEP?
H40: There will be no significant difference between the observed and
expected frequencies of post-season success by teams after having
completed an acquisition of a WSEP.
Hypothesis 4: There is likely to be a significant difference in the observed
post-season success of teams that have traded for a WSEP as the
data will not be consistent with a specified distribution.
Statistical Analysis: One-Way Chi-Square Goodness-of-Fit
- This analysis will compare the observed results of the
postseason success and test for significance against what would
be expected to happen naturally. The Chi-Square Goodness-
of-Fit is based on a comparison of observed frequencies with
the expected frequencies in which the expected frequencies can

42
be computed with the estimated parameters (van der Ven,
2013).
Hypothesis Testing
Procedure: - H0:
- α = .05
- Criteria for rejecting H0: p ≤ .05
Instruments
All data was collected from MLB’s official website, Elias Sports Bureau, or other
sports specific, baseball archived websites. Data collected was entered into a Microsoft
Excel spreadsheet and then entered into SPSS for calculations.
Procedure
Data was collected from the 1994 to 2014 MLB seasons. For each of those years,
the players that are World Series-experienced were recognized and their team movement
tracked. Each of the World Series Champions and runners up were closely evaluated for
players with previous World Series experience.
Research Design
Statistical Analysis One: One-Way Repeated Measures ANOVA (Within Subjects
Design)
Field (2013) states that a repeated measures design is best utilized when the same
entities participate or provide data at multiple time points. In this analysis, the team’s
winning percentage will be noted at six different trials, from the acquisition of the WSEP
43
to the end of the season, which will give a clear view of the progression of the team’s
output. Data for this analysis will be collected by logging all MLB players that are
World Series-experienced and were traded between July 1st in their respective season and
August 31st.
The winning percentage of the team acquiring the WSEP will be noted on the day
of the trade. It should be noted that a player in a trade will often be playing with their
new team within 24 hours, or by the next scheduled game, but there are occasions in
which a player may take up to 48 hours, or skipped the next game, to be in the lineup due
to travel or personnel issues. To account for this, the winning percentage will reflect the
team’s performance the day of the trade. It is also likely that the acquiring team’s
demeanor could be affected, either positively or negatively, immediately upon hearing of
the trade and this change could affect their playing and therefore their team’s winning
percentage.
Table 3.1 displays that data points will be gathered at six trials in the study for
each team’s WP%.

44
Table 3.1
Winning Percentage Data Points for Repeated Measures ANOVA
Data Point WP% Timing
Data Point 1 Day of Trade
Data Point 2 1 Week After Trade
Data Point 3 2 Weeks After Trade
Data Point 4 4 Weeks After Trade
Data Point 5 6 Weeks After Trade
Data Point 6 End of Season
These trials will be entered into SPSS and calculated using a One-Way Repeated
Measures ANOVA (Within Subjects Design). This analysis will calculate not only the
difference in WP% from the beginning of the trade to the end of the season, but also give
readings within the time frame to draw conclusions for the progress made since the
addition of the WSEP. This could aid in showing if the effects are felt immediately, over
time, or if there is a rise and decline of output.
Statistical Analysis Two: Independent-Samples t-Test
For this analysis, the number of WSEPs that are on each team for each of the
World Series from 1994 to 2014 will be counted. Teams will be classified as being the
World Series Champions (WSC) or having lost the World Series (WSL). The mean of
WSEPs used for winning teams will be compared against the mean of WSEPs used for
losing teams and calculated for significant difference.

45
Statistical Analysis Three: One-Way Chi-Square Goodness-of-Fit
For this analysis, teams that made an in-season trade for one or more WSEPs will
be calculated and compared against teams that did not make an in-season WSEP trade,
and the teams will be measured according to their playoff success. The analysis will then
be utilized to compare if the observed playoff performance of these teams was
comparable to what would be expected to happen naturally. Table 3.2 displays the level
of success in the playoffs and the categorization used for each level.
Table 3.2 MLB Playoff Levels for Research Question 4
Level of Playoffs Number Correlating for Analysis
Wild Card/Division Series 1
League Championship Series 2
World Series (Loser) 3
World Series (Winner) 4
Validity
This research was conducted utilizing past MLB season statistical information
retrieved from MLB’s official website as well as the Elias Sports Bureau which is the
official statistician for MLB. Two reliable baseball sources that track the history and
performance of the game (Baseball-Almanac.com and Baseball-Reference.com) were
also utilized for confirmation of data collected as well as confirming player careers and
transactions. Due to the nature of the data, the historical accuracy of the results and the

46
aspect of covering genuine teams, players, and their seasons, the internal validity in
regards to the data will be as accurate as is possible. With the official League data being
trustworthy and confirmed through multiple sources, this lends to the fact that absolutely
all players and their team’s information will be accessed easily. Every potential WSEP
and MLB team in the population will be included in the study, further increasing the
validity of the information and results of the study.
The isolation of the window of time that a WSEP is acquired and tracked over six
measurement points in the study, aids in tracking the output of the player’s effect on the
team. It can be argued that there are many other factors that affect a team during this
time frame, for example, injuries to other players or other roster changes, but in the latter
60 to 90 days of the season, these are likely to be of less significance, and most
importantly, are normal to the game of baseball and should be expected to some degree.
The purpose is to test the output of the team in regards to their WP%. This is the most
accurate means of testing the effects of the independent variable (the WSEP) on the
dependent variable (WP%) available using historical data.
All teams were subject to the same conditions of an MLB season, under the same
rules and application of the rules. Even though the study spans 20 seasons, there have
been no significant changes to the game of baseball, and each team experienced the same
restrictions and collective bargaining agreement in comparison to all other teams within
their season.
47
The use of real, historic MLB data signifies the external validity as well. Analysis
of the research will lead practitioners to recognize and appreciate the design and realism
of the study and the process. As in any research utilizing so many factors, there is not a
means to sterilize this information and ensure that only the independent variable is
affecting the dependent variable solely, especially being an analysis of past events, but
this study stays true to the data and the events and maintains validity for those
practitioners in baseball that may evaluate it.
Ethical Considerations
This study achieves the highest form of ethical consideration in regards to the
participants involved as it is an analysis of their past participation in playing for MLB
teams. As it is historical data, it will not have been intrusive into the lives or the player’s
or team’s performance in baseball.
Summary
The game of MLB, and the use of its historical data from the 1995-2014 seasons,
should provide an excellent pallet for a look into the player movement and their effects
on teams. With the factor that all players in the population are to be utilized for study,
the analyses of a One-Way Repeated Measures ANOVA, Descriptive Statistics, One-
Way Independent t-Test, and a Chi-Square Goodness-of-Fit should provide an academic
look into the practical strategies of personnel movement in the game of professional
baseball.

48
CHAPTER IV
RESULTS
Overview
The statistical findings of the collected data for this study are presented, examined
and summarized in this section. The purpose of this study was to test the effects of a
team’s strategy of acquiring players with previous World Series experience on their
future win-loss record and post-season success in an MLB season. The aim was to test
for the effects of experiential learning in MLB players that were World Series-
experienced. If the experience of playing on baseball’s most elite stage, the World
Series, is a rare and transformative event that gives players insight, experience, and a
level of success that few attain, and is sought after by other baseball clubs, then the
strategy of trading for these players at the trade deadline would be a plausible move by
GMs seeking to bolster their team’s roster for future success.
The Independent Variable: Qualified WSEPs
In this study, the number of players that qualified as WSEPs that were traded in-
season, on or after July 1st and prior to the end of the season but still qualifying with 20
games with their new team and having completed the season with the new club is 222.
The Elias Sports Bureau’s Book of Baseball Records (Siwoff, 2015) was utilized for
obtaining the playoff rosters of each of the 1,003 WSEPs that gained the experience of
having played in the World Series between 1995 and 2014. Each team was allowed to
49
carry 25 players on its roster to the World Series. On four occasions, each in consecutive
seasons (2008-2011), a team added a 26th man to its roster due to injury. In the 2011
World Series, the Texas Rangers carried only 24 players upon their own choice. Overall,
the study produced 702 different players that experienced the World Series at least once,
with 223 players having experienced more than one, even prior to the 1995 time frame.
Each player’s career was analyzed through MLB’s website (MLB.com) and
Baseball-Reference.com for his performance and transactions to verify the clubs he
played for during his career. These players were then analyzed for all off-season and in-
season trades. At this point, 349 players qualified as having been traded in-season.
- Players were excluded from the study that had experienced a World Series prior
to 1995 and were acquired prior to 1995; only the acquisitions made between 1995 and
2014 were examined.
- Player acquisitions were then removed from the study if their acquisition
occurred prior to the July 1st point of the season based on the factor that the teams
seeking to acquire players at this point have amassed enough games in the season for a
proper sample size of previous performance prior to the WSEP’s addition, and the
baseball tradition that this point in the season is when the urgency of trading ramps up.
- Player acquisitions were also removed from the study if they were traded to a
team that was, at the time of the trade, performing below the .400 WP% mark and failed
to make the playoffs. In support of this limitation, there were no player trades that met
the criteria of having been traded to a sub-.400 team that did proceed to postseason play.
(An interesting point of note is that only one team included in the study made the playoffs

50
with a sub-.500 WP%: the 1999 San Diego Padres finished with a 74-88 record, or .457
WP%, and lost in the Division Series.) As stated previously, these factors placed on the
qualification of the independent variable produced 222 player trades for research.
The Dependent Variable: MLB Team Winning Percentage
Each of the MLB teams that played from 1995-2014 was considered for the study.
With the League consisting of 28 teams from 1995-1997, and 30 teams from 1998-2014,
this provided 594 teams to evaluate over the 20-year span.
Once the acquisitions that met the criteria listed previously were evaluated, the
researcher reviewed the season’s performance of the team acquiring the WSEP. The
number of games that each team played prior to trading for the WSEP was logged and
calculated. On average, the teams made the trade for a WSEP on their 107th game of the
season. This was notable as it provides an adequate sample to review the team’s previous
performance and is almost exactly at the 2/3rds (66%) mark of their season as they play
162 regular season games. The date of the trade was confirmed through MLB.com and
Baseball-Reference.com and then cross-checked through Baseball-Almanac.com for the
new club’s record on the day of the trade (Trial 1), 5 games after the trade date (Trial 2),
10 games after the date (Trial 3), 15 games after the trade date (Trial 4), 20 games after
the trade date (Trial 5), and finally the end-of-season WP% (Trial 6).

51
Analysis
Research Questions One and Two: One-Way Repeated Measures ANOVA (Within
Subjects Design)
The first and second hypothesis dealt with the strategy of seeking to add a WSEP
to a team that was potentially gearing for a playoff run to boost the team’s regular season
performance. The purpose of the research was to test if there was a potentially significant
difference in the WP% before and after the trade
H10: There will be no significant difference between the means of the
regular season winning percentages on the day of the trade and at
the end of the season.
H20: There will be no significant difference in the winning percentage
between the six measured periods.
The capabilities of a One-Way Repeated Measures ANOVA allowed the data to
show not just simply the effects of beginning trials compared to ending trials, but to give
a deeper understanding of the data as it tests for the difference of the within-participant
variance (Field, 2013). This data provided the researcher with an understanding of
whether there was a period in which the newly-added WSEP begins to affect his team’s
winning percentage; whether it be directly (in the first five games), or takes longer than
five games, was sustained or drops off, or has a tipping point. Table 4.1 illustrates the
descriptive statistics for RQ1 by showing the difference in means between Trial 1 and
Trial 6. Table 4.1 also shows the means of each the trials necessary to analyze RQ2.

52
Table 4.1
Descriptive Statistics for One-Way Repeated Measures ANOVA Comparing Day-of-
Trade and End-of-Season Winning Percentages
Trial M SD N
1 – Beginning WP% .537 .053 222
2 – 5 games after .537 .052 222
3 – 10 games after .537 .052 222
4 – 15 games after .538 .051 222
5 – 20 games after .538 .051 222
6 – End of season WP% .537 .048 222
In respect to RQ1, it was easy to see in this simple comparison of the means that
the differences between the trials was very small with Trial 1 having a mean of .537 and
Trial 6 possessing a mean of .537. As significance was tested for, the comparison of the
means was clear as the F value was .246, and the p value was .942. This data is displayed
in Appendix A.
In comparing Trial 1 and Trial 6, the SPSS analysis showed that the significance
of the comparison was greater than .999. With the p value greater than .05, the null
hypothesis was retained. Therefore, the conclusion regarding RQ1 was that the addition
of a WSEP did not appear to provide greater success for the team.
In comparing Trials 1-6, the SPSS analysis shows that the significance of the
comparisons greater than .999 in the trials. With the p value greater than .05, the null

53
hypothesis was retained. Therefore, the conclusion regarding RQ2 is that there was no
significant difference in the winning percentage between the six measured periods. (For
full output from SPSS, see Appendix A.)
Research Question Three: Independent-Samples t-Test
The third research hypothesis sought to answer if the number of WSEPs on a
World Series winning team, or losing team, was significant.
This analysis reviewed the World Series winners and losers over the 20-year span
from 1995 to 2014. Therefore, there were 40 teams (N = 40) utilized for this analysis
with 20 teams as World Series Winners and 20 teams as World Series Losers. The Elias
Sports Bureau’s Book of Baseball Records (Siwoff, 2015) was utilized for obtaining the
playoff rosters of each of the 1,003 WSEPs that gained the experience of having played
in the World Series between 1995 and 2014. Each team’s roster was reviewed and
players were marked as having no previous World Series experience, or as having World
Series experience.
H30: The means of the WSEPs on winning and losing World Series
teams will be equal.
Table 4.2 displays the comparison from each of the 20 years in showing the actual
quantities of WSEPs on each winning and losing World Series team.
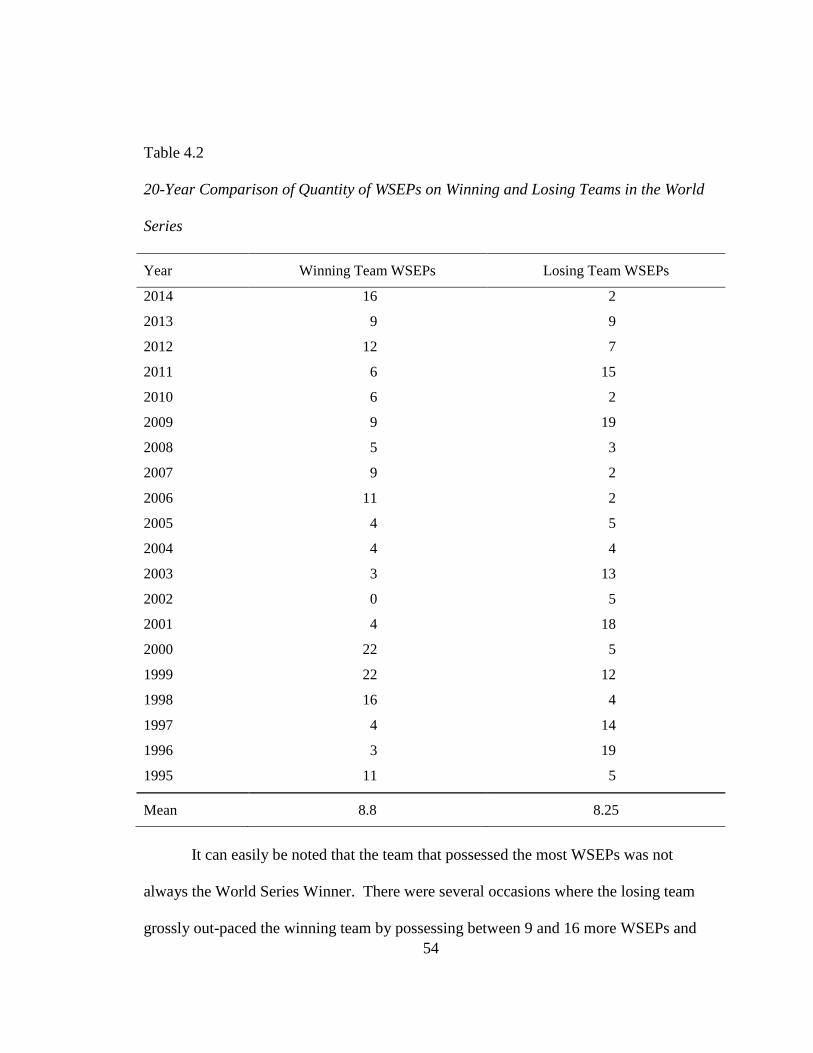
54
Table 4.2
20-Year Comparison of Quantity of WSEPs on Winning and Losing Teams in the World
Series
Year Winning Team WSEPs Losing Team WSEPs
2014 16 2
2013 9 9
2012 12 7
2011 6 15
2010 6 2
2009 9 19
2008 5 3
2007 9 2
2006 11 2
2005 4 5
2004 4 4
2003 3 13
2002 0 5
2001 4 18
2000 22 5
1999 22 12
1998 16 4
1997 4 14
1996 3 19
1995 11 5
Mean 8.8 8.25
It can easily be noted that the team that possessed the most WSEPs was not
always the World Series Winner. There were several occasions where the losing team
grossly out-paced the winning team by possessing between 9 and 16 more WSEPs and

55
still was not able to bring home the championship. In comparing the performance of the
teams with the most WSEPs, the larger WSEP-quantity team won 10 championships, and
lost eight championships and there were two years that the teams tied in the number of
WSEPs. In review of descriptive statistics from this analysis (Appendix B), the
difference in the mean is notably small as the t value was .282 and the p value was .700.
In comparing the means, the SPSS analysis showed that the significance of the
comparisons was .779 between the two samples. With the p value greater than .05, the
null hypothesis was retained. Therefore, the conclusion regarding RQ3 was that there
was no significant difference between the means of WSEPs on World Series winning
teams and World Series losing teams.
Research Question Four: One-Way Chi-Square Goodness-of-Fit
The fourth research analysis sought the answer to determining if the postseason
performance of teams that completed a trade for a WSEP was any different than what
might be expected to happen naturally.
For this analysis, all 166 MLB teams making the playoffs from 1995 to 2014 were
analyzed. Teams were qualified as either having made a transaction to acquire a WSEP
previous to their entering the playoffs or as not having made a transaction to acquire a
WSEP. Of the 166 teams, 74 completed a transaction, while 92 teams did not do so. The
team’s progress during that season’s playoffs was then categorized based on the level of
playoffs. Table 4.6 displays how the teams were charted and the highest level of playoffs
they achieved. It is important to note that the Wild Card and Division Series were
combined to the same level of post-season performance due to the fact that the Wild Card

56
was added in two years prior in 2012, and also due to the fact that it is only a one-game
“play in” round rather than a series format. This new format added only six more teams
to the playoff picture from 2012 to 2014. Interestingly, of the six teams that performed in
this level, four teams did make a WSEP acquisition. This could possibly indicate that
more often than not, teams were willing to make this transaction to get into the playoffs
to see if they can ride a wave of potential team chemistry into a deep playoff run. It also
signified that, early on into this new format, two-thirds of the teams flamed out in the first
round. Table 4.3 displays the breakdown of the performance of teams that either did, or
did not, acquire a WSEP and the level of playoff success that was achieved.
Table 4.3
Chart of Observed MLB Team Post-Season Performance
Transaction Wild Card & Division
Series
League Championship Series (LCS)
World Series Loser
World Series
Winner
Total
Acquired WSEP
36 16 11 11 74
Did Not Acquire WSEP
50 24 9 9 92
Once the team’s performance was logged, it was determined that a One-Way Chi-
Square Goodness-of-Fit would be an appropriate tool to use as team’s expected success
can be calculated based on the structure of the tournament bracket. This aspect made the
Goodness-of-fit more appropriate than a Test of Independence. For example, every team
that enters the playoffs does have the statistical opportunity to win the World Series
57
(which the Test of Independence would allow for). However, it was easy to conclude
that due to bracket attrition, half the teams were removed from the contest at every phase.
Therefore, if 74 teams enter the bracket, half of the teams were removed by the Wild
Card/Division Series round (37). Then half of the progressing teams were removed
during the League Championship Series round (18.5). Finally, of the remaining one-
quarter teams that entered the playoffs, half of these teams lost the World Series (9.25)
and half won the World Series (9.25). Therefore, since the number of teams at each level
were mathematically anticipated, the Goodness-of-Fit was most appropriate.
H40: There will be no significant difference in the level of post-season success as the
number of observed will be equal to the number expected, or within a specified
distribution.
Table 4.4 displays the observed data in comparison to what was expected from the
teams that completed a WSEP transaction, based on the N = 74, and the attrition of teams
at each level. At first glance, it was easy to note that Observed was extremely close to
Expected. There was the most modest of up-ticks in the observed number of teams that
made a WSEP transaction reaching the World Series.

58
Table 4.4
Chi-Square Goodness-of-Fit Data for Teams Completing a WSEP Transaction
Level Observed N Expected N Residual
WC/Division Series 36 37.0 -1.0
League Championship Series 16 18.5 -2.5
World Series – Loser 11 9.3 1.8
World Series - Winner 11 9.3 1.8
Total 74
However, as Table 4.5 shows, the up-tick was not enough to be mathematically
significant.
Table 4.5
Chi-Square Goodness-of-Fit Output for Teams Completing a WSEP Transaction
Calculation Level
Chi-Square 1.027a
df 3
Asymp. Sig. .795
To be completely thorough, a Chi-Square Goodness-of-Fit was also conducted on
the 92 playoff teams that did not conduct a WSEP transaction. These teams may have
made a transaction during the specified time frame, but not for a WSEP, or they made no
transaction at all. Table 4.6 displays the observed data in comparison to what should be
expected from the teams that did not complete a WSEP transaction, based on the n = 92,

59
and the attrition of teams at each level. At first glance, it was easy to note that Observed
is extremely close to Expected in this analysis also. There was the most modest of
down-ticks in the Observed number of teams that made a WSEP transaction reaching the
World Series.
Table 4.6
Chi-Square Goodness-of-Fit Data for Teams Not Completing a WSEP Transaction
Level Observed N Expected N Residual
WC/Division Series 50 46.0 4.0
League Championship Series 24 23.0 1.0
World Series – Loser 9 11.5 -2.5
World Series - Winner 9 11.5 -2.5
Total 92
However, as Table 4.7 shows, the down-tick is not enough to be mathematically
significant.
Table 4.7
Chi-Square Goodness-of-Fit Output for Teams Not Completing a WSEP Transaction –
Test Statistics
Calculation Level
Chi-Square 1.478a
df 3
Asymp. Sig. .687
60
In comparing the means, the SPSS analysis shows that the significance of the
initial analysis (WSEP transaction) comparisons was .795, and the secondary analysis
(non WSEP transaction) comparison was .687. With the p value greater than .05, the null
hypothesis was retained. Therefore, the conclusion regarding RQ4 was that the level of
post-season success for the number Observed was equal to the number Expected, or
within a specified distribution. (For full output from SPSS, see Appendix C.)
61
CHAPTER V
SUMMARY, DISCUSSION, CONCLUSION, AND RECOMMENDATIONS
FOR FURTHER STUDY
Earlier in this study, the quote from John F. Kennedy was posted that a rising tide
raises all ships. This quotation leads to research questions which seek to answer if a
WSEP should be sought for improving a team’s outcome either in the regular season or
the post-season. With postseason play and regular season play being two factors that can
be affected by this personnel strategy of acquiring players with this specialized
experience, several different analysis were utilized to answer the question from both
angles.
Research Questions One and Two
Research Question 1: Is the addition of a WSEP to an MLB team in a mid-season
acquisition likely to produce a greater winning percentage in regular season play
from the date of the acquisition to the completion of the season?
Research Question 2: With the recent addition of a WSEP, is there an optimal period of
time, or tipping point, that it is likely the effects will be experienced in the team’s
winning percentage?
The data showed that the difference in the means of the acquiring team’s WP% on
the day of the trade (.537) in comparison to its WP% at the end of the season (.537) was
not significant, and therefore caused us to retain the null hypothesis for RQ1. Also the
analysis showed that the four trials embedded between the day of the trade and the end of
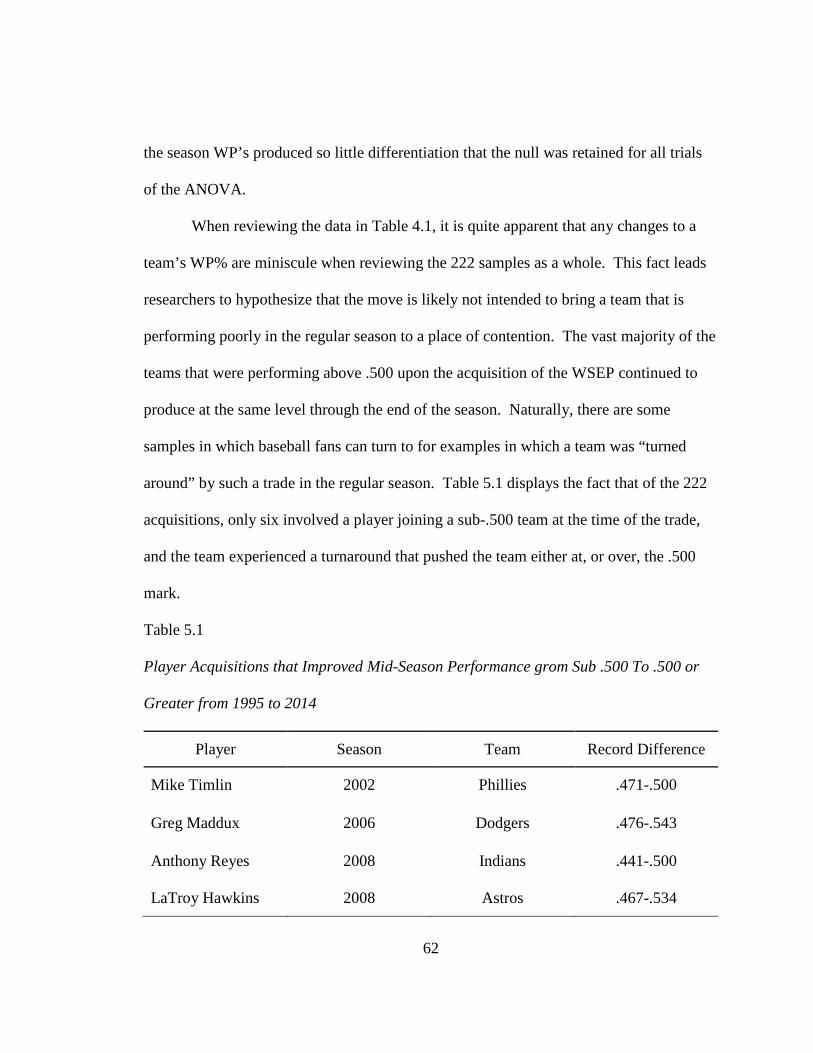
62
the season WP’s produced so little differentiation that the null was retained for all trials
of the ANOVA.
When reviewing the data in Table 4.1, it is quite apparent that any changes to a
team’s WP% are miniscule when reviewing the 222 samples as a whole. This fact leads
researchers to hypothesize that the move is likely not intended to bring a team that is
performing poorly in the regular season to a place of contention. The vast majority of the
teams that were performing above .500 upon the acquisition of the WSEP continued to
produce at the same level through the end of the season. Naturally, there are some
samples in which baseball fans can turn to for examples in which a team was “turned
around” by such a trade in the regular season. Table 5.1 displays the fact that of the 222
acquisitions, only six involved a player joining a sub-.500 team at the time of the trade,
and the team experienced a turnaround that pushed the team either at, or over, the .500
mark.
Table 5.1
Player Acquisitions that Improved Mid-Season Performance grom Sub .500 To .500 or
Greater from 1995 to 2014
Player Season Team Record Difference
Mike Timlin 2002 Phillies .471-.500
Greg Maddux 2006 Dodgers .476-.543
Anthony Reyes 2008 Indians .441-.500
LaTroy Hawkins 2008 Astros .467-.534

63
Table 5.1 (Cont.)
Player Season Team Record Difference
Juan Rivera 2011 Dodgers .446 - .509
Nate Schierholtz 2012 Phillies .447-.500
It is the optimism of baseball clubs that acquire a WSEP who they believe can
help turn around a season, that may be causing some teams to cling to this personnel
strategy with some tenacity. However, the data shows that it is very rarely a wise
decision if a team is performing at a sub-.500 level for its current season hopes of going
to the playoffs.
With the six trials in place that the One-Way Repeated Measures ANOVA tests
for, it was hoped to view if the acquisition created a tipping point that would indicate if
there was a time of adjustment, or optimal performance, from a WSEP joining a club.
Tables 4.1 and 4.2 indicate that there is not a significant difference in the comparison of
the means. In fact, with just a visual scan of the means, it was quite obvious that the
differences were miniscule from one trial to the next, and then also when considered as a
whole. By retaining the null, this indicates that teams should not expect there to be such
a tipping point or optimal performance period.
Research Question Three
Research Question 3: Is there a significant difference between the numbers of WSEPs
utilized in teams that have won or lost the World Series?
64
The first two Research Questions and analyses dealt with a team’s performance in
the regular season. As it was apparent that the strategy of adding a WSEP late in the
season was only beneficial in a handful of cases, it makes Research Questions 3 and 4 of
great importance as they give insight into a team’s post-season production. With the
teams “power loading” for WSEPs, it makes it interesting to research for the quantity of
these types of players that teams may either feel they need to have, or are naturally
possessing for ensuring a greater World Series success. In reviewing this data during
collection, the teams with the greatest quantity of WSEPs bounced back and forth from
the winner’s column to the loser’s column with some regularity. If one were to begin to
review the data and see a team that had won with a large number of WSEPs, they would
think that more WSEPs would make it an easy decision. However, a team that would win
a World Series and then return the next season, only to lose, would throw the loser’s
column back into balance. The occurrence of teams repeating as champions in successive
years is difficult based on the data. One interesting team to note, the 2002 Los Angeles
Angels, were the only team to win a championship without a single WSEP on the team
during the World Series.
The data in Table 4.2 and Appendix B indicate that the difference in the
comparison of the two means is not significant, and require us to retain the null.
Therefore, while teams may believe it is best to collect WSEPs for a deep playoff run, it
may not prove to be the most appropriate strategy to ensure success. When teams
competed in a Fall Classic that did not compete in the previous year’s contest, on 7 of the
20 observations, they won the World Series with more WSEPs than their opponents.
65
Interestingly, in this same scenario of not having participated the year before, 8 of the 20
observations were won by teams with fewer WSEPs than in the other dugout.
Essentially, teams trended to winning a World Series with a lesser amount of WSEPs
than their competition, and then trended to lose the next season and their quantity of
WSEPs was large due to the fact that the majority of their team that returned is now
qualified as a WSEP. This simply leads observers to conclude that the quantity of
WSEPs on a team does not play a significant role.
One interesting fact was noted in data collection and calculation that may aid
teams in considering what personnel strategy to consider. As players were qualified as
having experienced their first World Series to be considered for the study, they were
noted and tracked for which year was their first year, and then if they returned and
competed in any subsequent Fall Classics. This aided in the calculation of how many
WSEPs were on each winning or losing team, but was also something of interest during
calculation. These processes led to noticing how many players were earning that first
qualification, in comparison to those on the team that were already qualified.
An interesting aspect was noticed during the data collection phase. Players that
experienced their first World Series and then went on to experience subsequent Fall
Classics later in their careers were interesting to examine. It became apparent that these
players experiencing the World Series for the first time, and then seeing more, could
provide insight into a team’s developmental system. Teams that won the World Series
possessed an average of 6.1 first-time WSEPs against the losing teams who possessed an
average of 3.6. This fact indicates that teams that won the World Series possessed almost

66
twice as many WSEP prospects than their competitors. From this, it is not difficult for
researchers to conclude that teams that develop and utilize younger talent with the type of
potential that is likely to see them compete in two or more World Series, are potentially a
very strong indicator of championship success. This places great weight on the scouting
of players and their developmental systems that help players gain experience.
Research Question Four
Research Question 4: Is there a significant difference between the levels of postseason
success observed by teams after having completed a trade for a WSEP when
compared against teams that did not complete a WSEP than what would be
normally expected?
As the first analysis showed, making the move for a WSEP during the season is
very unlikely to improve a team’s regular season performance. Therefore, researchers are
left to conclude that teams could likely be attempting to acquire more WSEPs to ensure
greater depth in the playoffs. Research Question 4, and its analysis, was designed to give
a closer look at the postseason aspect of this phenomenon.
The Chi-Square Goodness-of-Fit is designed to give insight into determining if
something that is observed is significantly different than should be expected when
happening naturally. The playoff success of all teams that traded for WSEPs was
measured and categorized based on depth in the playoffs. At first glance, there is a slight
difference that catches a researcher’s attention; the number of teams in the observed
levels of WSEP acquisitions at the World Series level outpaced those expected naturally.
Also, the number of teams in the observed levels that did not complete WSEP

67
acquisitions was lower than expected at the World Series level. This first glance gave
hope that potentially the WSEP acquisition was going to prove to be a successful
strategy. However, with a p value of .795 for WSEP acquisition teams, and the follow up
test of non-WSEP acquisition teams producing a p value of .687, the difference was not
significant. This led the null to be retained and produced the outcome that the acquisition
of a WSEP is not significant when analyzing the team’s playoff success.
Summary of Research Questions and Analyses
Based on the three analyses, the data displays that WP% is not affected by the
addition of a WSEP to a team that is two-thirds of the way through their season. The data
show that the number of WSEPs that teams carry to the World Series is simply not a
predictor of winning the championship. Finally, the data show that there is no
significance in determining how far into the playoffs a team that makes a WSEP
acquisition is likely to go. The observed levels of performance were so close to the
expected levels that the instrument calculated it as insignificant.
Implications for Personnel Strategy Development in MLB
Keeping up with the Jones’
When this research is viewed in its entirety, and compared against what takes
place in the industry of professional baseball, it is interesting to consider why
professional baseball clubs employ the personnel strategy of acquiring WSEPs mid-
season with varying degrees of regularity. Appendix E shows the frequency of team
WSEP acquisitions by team and year from 1995 to 2014. Two teams that rarely
participate in this type of trade (Toronto Blue Jays and Kansas City Royals) by making
68
only three WSEP acquisitions in 20 years, actually both completed a transaction for a
WSEP in their 2015 campaigns (which were completed after collection of this study).
Only one franchise did not complete a single WSEP acquisition, under the parameters of
this study, in the 20-year time-span. The Montreal Expos (1995-2004) which then
transitioned to the Washington Nationals (2005 to 2015) were the only team not to do so
and endured three ownership changes, one of which included the team being owned and
operated by MLB itself.
On the opposite end of the conversation, of teams that rarely make this type of
acquisition, is the New York Yankees. This club seems to make this type of transaction
regularly, and then also appears to perform in the World Series regularly also. The
Yankees have made 18 WSEP acquisitions in the 20 years of this study. They acquired
WSEPs 12 of the 20 years and participated in 7 World Series, and won the championship
5 times (Major League Baseball Team History, 2015). The Yankees continually enjoyed
postseason success during this study’s timeframe as they appeared in seven Fall Classics.
Baseball analysts constantly discussed which great players from other teams that the
Yankees would trade for, and were often successful in completing the acquisition (Cohen,
2015). This practice that was employed by the Yankees has likely encouraged teams in
the League to “keep up with the Joneses” as owners of other clubs see the success the
Yankees have enjoyed from it and assume that it will give them success as well.
If this is the case, teams only need to understand that the Yankees are the second
most prolific team when it comes to making this type of acquisition. They get all the
attention, because they have enjoyed the success, when actually one other team has
69
completed more WSEP acquisitions than the Yankees but yet did not participate in a
World Series during the 20-year span of this study. The Los Angeles Dodgers completed
22 acquisitions to the Yankees 18 and did not appear in a single Fall Classic (Major
League Baseball Team History, 2015). It is very easy in sport, and other areas of life, to
want to watch and emulate the habits of those that are successful.
Public Relations, Marketing, and Sales Benefits
Each season as teams near the trade deadline, baseball analysts spend countless
hours on sports talk radio shows and in newspaper columns speculating as to how teams
can improve in ways that will help them enjoy more success in the short-term. Baseball
fans do not have to look far to find articles in which analysts state that they are certain
their favorite team will be better if a trade is made (Bondurant, 2015), or that fans will be
annoyed by inaction if teams do not complete a trade (Cohen, 2015). There is always the
“what if” factor when fans consider if their GM had made a trade, or not made a trade.
While GMs likely make the decisions that are best for their team based on all the aspects
of team chemistry, salaries, and the ease or difficulty of player movement, it is likely that
they do feel some pressure from ownership and fans to make a move that could likely
mortgage their future by trading a developing player for a short-term opportunity at
success in the present.
In professional sport there is often little room for patience for a rebuilding or
development process from fans and analysts. The timetable for winning is often
immediately as writers state, “Clubs obviously should not sit on their thumbs and wait for
their expected window when it looks like they can contend sooner.” (Berg, 2015) By
70
making these trades for WSEPs, they appear to be attempting to show commitment to
their fans and their own ballplayers, that they are willing to do what is necessary to win
(Berg, 2015). One point to consider is that if fans view a WSEP acquisition as a sign of
commitment to winning, then they will almost likely consider their team’s GM less
committed if a move was not made, even if the team was working to develop a younger
player that could produce at a higher level in the future.
By making the trade that fans and analysts seem to be in support of, they may not
only be attempting to calm the barbarians at the gate, but potentially energize the fan base
by adding a player that they feel more compelled to support while raising the team’s
marketability through the acquisition. A team that has promise and performed well in the
first half of the season, but is mired in a mid-season slump may also be experiencing a
mid-season ticket sales slump as well. The ability to invigorate their fan base with a
WSEP that fans have instant name recognition with, allows the team’s marketing and
sales efforts to seize a welcome opportunity as they push to reach the postseason. The
possibilities of what teams are capable of are endless in business terms, if they save
money, rather than making an unwise gamble for such a player. Teams can reinvest in
their marketing, advertising, database marketing, and customer loyalty and retention
programs. Each of these efforts can grow a team’s revenue and fan base significantly.
This research will not explore all the avenues of business expansion or improvement as it
is primarily dedicated to player personnel and team personnel strategies.
71
Familiar Faces
An interesting anomaly that occurred while gathering the data was noticing the
movement of WSEPs that were familiar to a franchise. On two occasions, players
competed in a World Series with a club, then left the team either due to a trade or free
agency. However, each player was then traded back to the team he experienced a World
Series with just before the deadline, and helped his former team reach another Fall
Classic. Luis Sojo experienced three World Series with the New York Yankees. After
the 1999 campaign, he moved to the Pittsburgh Pirates through free agency. The
Yankees traded for Sojo on August 7, 2000, to help their infield for their 2000 and 2001
World Series teams. Overall, Luis Sojo (WS 96, 98, 99, 00, & 01) experienced five Fall
Classics, all with the Yankees.
Another similar situation was that of Jeff Conine (WS 97 & 03). Conine
experienced the 1997 World Series with the Florida Marlins. He was traded after the
2003 season and went on to play for Kansas City and Baltimore. In the 2007 season, the
Marlins were preparing for the playoffs and added Conine on August 31, 2003, the last
possible day for trades and still make the team’s postseason roster. He experienced two
World Series, both with the Florida Marlins. This phenomenon shows that the original
club that he went to the World Series with, values his performance and character enough
to trade for them. In these instances, it may actually be beneficial to add a WSEP
because they are already familiar with the organization, the culture, and the present
leadership. These trades appear to have some potential merit, even in a short-term
situation but with so few to analyze, it is merely speculation.

72
Certainly, there is value in the eye of the beholder for players such as Derek Jeter
(WS 96, 98, 99, 00, 01, 03, & 09) and Mariano Rivera (WS 96, 98, 99, 00, 01, 03, & 09),
as they were players that never left the team they experienced the Fall Classic with on
seven occasions. Obviously their clubs valued their on-field performance and possibly
their leadership enough to never let them leave. Each of these players experienced seven
World Series with the New York Yankees. The player that experienced the most Fall
Classics in this span of this study, Andy Pettitte (WS 96, 98, 99, 00, 01, 03, 05, & 09),
left the Yankees in 2003 through free agency, experienced a World Series with the
Houston Astros in 2005, and then returned in the off-season through free agency to the
Yankees in 2006. It appears that when players exhibit a level of leadership, MLB clubs
show a strong desire to retain them, or even have them return, when they need
performance and leadership for another opportunity at a championship. Their actions in
returning them to their club signify this potential connection.
Leadership May be Different in Sport
Are leaders born? Or are they made? What does it take to be a successful leader?
These are questions often asked about the origin, effectiveness, and presence of a true
leader (Lussier & Kimball, 2009). Regardless of which answer holds true most often,
what is most important to organizations is that leadership is intended to have a significant
influence on an organization’s success (Burton & Welty Peachey, 2009). Lussier and
Kimball (2009) stated that performance is a measure of successful, effective leadership.
In the business world, experience often defines the decision-making of leaders and affects
the outcome of their work and of those around them but the concept is rarely tested in the

73
professional sports industry where team personnel and leadership have great expectations
and are highly scrutinized. While there are volumes of research dedicated to leadership
in all industries and aspects of life, there is a gap of research that seeks to quantify and
qualify the effectiveness of leadership in the field of sport.
There are countless discussions in academia journals, textbooks, and business
articles on the topic of leadership. It comes in many forms and is enacted in many ways.
Studies researching sport leadership often borrow and adapt models of leadership from
industrial, or organizational, psychology fields and examine their potential applicability
to sports because sports teams are often thought to possess many of the same
characteristics of typical corporate settings (Chelladurai, 1980; Rieke, Hammermeister, &
Chase, 2008). Business and sport organizations share many similarities such as: 1) an
exact roster of members occupying specific positions; 2) planned program of activity for
members; and 3) division of labor designed to achieve specific goals (Rieke et al., 2008).
Naturally, there are some differences depending on the discipline of business being
conducted, but research and wisdom point to many similarities and crossover connections
between the two fields. Martens (2004) posited that coaches, like business executives,
require expansive technical knowledge of their field of sport as well as administrative
leadership.
There is not a definite, proven method of leadership style that can be classified as
the most effective form of leadership in business or in sport (Lussier & Kimball, 2009).
There are typically four major leadership styles discussed in organizational studies:
transformational (Judge & Piccolo, 2004), transactional (Burton & Welty Peachey, 2009),

74
charismatic (Galvin, Waldman, & Balthazard, 2010) and servant (Hammermeister, 2014).
Regardless of the style utilized, leadership behavior has been identified as having a
significant influence on an organization’s success and it is what teams are looking for in
their personnel to lead them to success (Burton & Welty Peachey, 2009).
There can be on field benefits to adding a WSEP that also possesses strong
leadership skills to a team, such as an increase in production (e.g., batting average, hits,
runs, homeruns, fielding percentage, earned run average) from the previous player who
played the position prior to the acquisition of the WSEP, and it is important to note that
teams are often looking for the benefits of WSEPs’ presence off the field. A WSEP
leader may not be the “top dog” (e.g., ownership, general manager, manager/coach) in an
organization, but his presence can likely affect the outcome of a team’s efforts and
output. Pedersen et al. (2011, p. 100) are straight to the point when they state, “Managers
are often leaders, but not all leaders are necessarily managers.” Individuals are
displaying leadership any time they are influencing the behavior and output of others
(Pedersen et al., 2011). When reviewing the WSEPs in this study, it is impossible under
these research circumstances to know which WSEP is an excellent performer and which
is an effective leader. However, the indicators of a team holding onto one player their
entire career, or trading for them to return, and then participating in numerous
championships is a potential indicator. This could lead to a desire to further study and
emulate players such as Jeter, Rivera, Sojo, and Conine.
A WSEP who is added to a team may be expected to bring far more than
production on the field. A WSEP who is a leader can establish order, set direction and

75
expectations, provide motivation and inspiration, align coworkers to management’s
direction, and hold workers accountable to their goals (Pedersen et al., 2011). As
previously discussed in Chapter 2 of this study, there is a potential that GMs are making
these acquisitions hoping to add not only experience, but much needed leadership as well.
Jonathan Papelbon (2007 WS) was placed on the Philadelphia Phillies trade block in the
summer of 2015 and then dealt to the Washington Nationals, a team that performed well
early in the season but experienced a slump near the July trade deadline. Nationals GM
Mike Rizzo clearly exhibited that he was excited to receive Papelbon for his pitching
ability but seemed equally as impressed with the leadership that he believed was
encapsulated in the trade. Rizzo touted, “This guy wants to win. First and foremost, he
wants to win. He’s a winner. He’s won his whole career. He comes with high
credentials, high praise from his teammates, and guys who have been around him”
(Bowden & Crasnick, 2015). Those are clearly the words of a GM that expects to be
welcoming a WSEP and a leader that can energize and provide direction for his team.
It is likely that many teams believe they are getting a much needed boost in
leadership on the field and in the clubhouse as well but only receive a very experienced
player, or simply an outstanding performer. As previously mentioned in the case of
Texas Rangers GM, Jon Daniels, and Oakland Athletics GM, Billy Beane, both GMs
surprisingly traded away very experienced players, or WSEPs, as they were more
interested in acquiring leadership over talent and excellent performance. This leads
researchers to question what sports leadership truly is, what it looks like, and how to

76
measure it. As is paralleled in other industries, sport may be similar or vastly different in
expecting excellent performers to maintain a leadership presence also.
Potential Focus Shift From Mid-Season WSEP Acquisitions
This study is not intending to imply that adding a WSEP is not a wise move for
baseball clubs. It was aimed at investigating whether a mid-season acquisition of a
WSEP is an effective personnel strategy. At the point that many clubs acquired the
WSEP, their season was two-thirds complete and the addition of a WSEP did not
significantly affect their outcome from that point forward. Therefore, if teams are to be
encouraged to not make this mid-season transaction, the question arises as to what they
could potentially turn their focus towards in improving their squad.
Adding a WSEP is often a financial commitment that teams must take on the
burden of as in most cases, the players traded away were paid substantially less due to the
fact that they were lesser experienced, or even minor league players. A vast majority of
the transactions analyzed in this study included a WSEP joining a new team, while minor
league players were sent to the other side of the trade. A WSEP, due to the very nature of
his status of having performed on baseball’s greatest stage, is likely to command a larger
salary than the minor league players he was traded for. If teams do not pursue this
strategy, they could potentially justify saving millions of dollars in player salary which
could strengthen the franchise’s bottom line.
Another alternative for potential team focus is to reinvest it into player
development. In collecting data to analyze Research Question 3, it was discovered that
teams that won the World Series in this 20-year span, possessed almost twice as many

77
players that were competing in a World Series for the first time, and would go on and
compete in another Fall Classic than the losing team across the diamond. This fact points
greatly to a club’s commitment and importance to scouting and development of players in
their minor league system and in their early years as a Major Leaguer. Instead of
acquiring a player who can raise the team’s payroll by $5 million to $25 million, which is
expended each season, an investment in scouting and developing players could result in a
team being successful for several years, and invaluable to a GM in their learning how to
lead and motivate players.
It would be a great asset to a GM who is considering a trade for experience and
possibly leadership, to seek to develop it, encourage it, and nurture it from the roster of
players he currently possesses. Leadership training that is utilized in normal business
settings could be used to develop players off the diamond. Teams likely only focus on
on-field performance when this area could potentially make a significant impact in
performance and team cohesion for greater performance. Numerous programs exist that
can help develop individuals into becoming effective leaders and it is very likely that a
program can be tailored to fit the examples of leadership within the game of baseball and
would be extremely cost-effective when considering the expense of a WSEP’s salary.
Teams spend a great deal of time together travelling, and working together during the
season. Leadership training could be inserted into the schedule as teams are functioning
together from mid-February to September and beyond.

78
Implications for Theory Development
Experiential Learning in Baseball
David Kolb’s (1984) book Experiential Learning is one of the landmark studies in
the field (Dixon, 1994; Jarvis, 1987; Weil & McGill, 1989). Kolb champions the adult
education concept that experiential learning maintains faith in an individual’s innate
capacity to grow and learn over a lifetime (Kolb, 1984; Miettinen, 2000). Experiential
learning has a special nature as a cognitive field of study in education as it is viewed as
an opportunity to confront the challenges of adult education. Miettenen (2000) stated that
it is influential in management training and adult education as it embodies two important
concepts, experience, and reflection. One of its most important tenets is the ideological
faith in an individual’s innate capacity to grow and learn (Miettenen, 2000).
Based on this concept of Experiential Learning in the field of education, when
applied to the sport of professional baseball, it appears that the experience of having
played in MLB’s World Series is not a significant factor when predicting the future
success of a baseball team. If World Series experience is not a significant factor, it
causes the researcher to question if there is a predictor. It is likely that experience can be
supplanted with superior talent, organizational leadership, developmental training, a
separate experience that equals that of performing in the World Series, or a host of other
factors that may be at play. One of the limitations of this study is that there are likely too
many factors at play to determine the true factors that lead a team to winning a
championship. The World Series experience of a player being added to a team in a mid-
season trade has been attempted to be isolated and tested in this study though, and the
79
data is not present to support that this experience specifically is the sole contributing
factor to a team’s postseason success.
Expectancy Theory in Baseball
As MLB GMs oversee the progress of their season, they may see a need for equal
or greater output from a position on the field, and also an even greater need for leadership
in the dugout and clubhouse (T. Levine, personal communication, 2014). In consumer
behavioral theory, the GM is beginning the process in consumer decision-making.
Solomon (1994) details and lists the steps in the consumer decision-making model as: 1)
problem recognition, 2) information search, 3) evaluation of alternatives, 4) product
choice and, 5) outcomes. When potential consumers perceive that an available good can
aid in achieving desirable outcomes, then the buyer is motivated to purchase the item to
enjoy the positive consequences of the purchase (Solomon, 1994). Before the purchase is
even completed, the buyer begins to develop expectations that the perception will become
reality and begins to visualize satisfaction with the good or service (Kopalle & Lehmann,
2006). General Managers that seek to acquire players with previous World Series
experience are in belief that the player’s previous experience will translate to success on
their current team. This is an example of the Expectancy Theory (Vroom, 1964) being
utilized in baseball.
According to the Expectancy Theory, individuals will be motivated to perform
based on two expectancies. The first states that people will be motivated by the belief
that effort exerted will lead to a desired performance. The second is that a given
performance will lead to desired outcomes (Alstrom et al., 1999; Harder, 1991). This is
80
exemplified as the GM believes that the effort exerted through manipulating a trade, or
the steps taken in acquiring a WSEP, along with the financial responsibility the personnel
move entails, will lead to the desired performance of the team playing well. Through
these efforts, the GM then believes that the team will enjoy the desired outcomes of a
successful playoff performance or World Series participation.
In review of the examination of the Expectancy Theory to this study of baseball,
the data support that GMs are not likely to have their expectations met by adding a
WSEP. If GMs follow the tenets of the Expectancy Theory on both levels, they believe
that the effort exerted in acquiring a WSEP will lead to a desired performance. Also they
believe that the given performance of the WSEP will help lead the team to the desired
outcome of a World Series championship. Truthfully, the first aspect of the theory is
likely to be met; the effort exerted to acquire a WSEP is likely to lead to a desired
individual performance. A significant improvement in team performance may not result
a complete fulfillment of the first expectancy. The data shows that the second
expectancy is not met as teams often do not meet the desired outcome more often than
expected naturally.
Limitations
There are numerous limitations to this study that baseball fans will challenge as
they review this research. A likely limitation is that it does not account, nor is there any
way to account for, all factors at play in this study. Injuries to fellow teammates, the
many factors that can be considered when reviewing the processes and cohesion of a 25-
man team, differences in team cultures, differences in ownership, and differences in team

81
GMs and field managers are all factors that limit this study when viewed under a
microscope. There are also a great number of statistical categories with which to
evaluate MLB players. A limitation of this study is that it solely focused on winning but
the intention was to keep it simple. Baseball fans are known for wanting to linger on
numerous areas of statistical input until the point is completely diluted.
Baseball fans and analysts will also want to bring into question the “what if”
situations that fill the rich storyline of MLB. Oddities of the game that make its
experiences unique are abundant and open for critique. Even Chicago Cubs fans, who
witnessed their team trade for two WSEPs in the 2003 season, are likely to scrutinize that
their team could have won the World Series if not for the play in Game 6 of the National
League Championship Series versus the Florida Marlins that involved leftfielder Moises
Alou and the fan interference with Steve Bartman (Strauss, 2013). While this study did
not account for them specifically, it is left to believe that overall performance should
overcome these situations and that a team’s fate is more self-controlled than left to a fan
or analysts “what if.” What is not at question is the validity of the data in this study. The
players, their performances, the winning percentages, and overall outcomes cannot be
challenged or scrutinized.
Special Factors in the Game of Baseball Over 20 Years
Two items to note that did not affect the outcome of the research, but are worth
mentioning, is that the study was able to examine the history of 28 teams in MLB from
1995 to 1997 and 30 teams from 1998 to 2014. The League expanded in 1998 adding
two teams, the Tampa Bay Rays and the Arizona Diamondbacks (MLB Team History,

82
2015). The second item to note is that MLB changed its playoff format in 2012 to
include 2 more teams that compete in a one-game playoff Wild Card level, prior to the
Division Series. At the point of this study, this change brought 6 more teams into the
study than the lack of a change would have. This change in format was treated as
insignificant for the overall study as it is relatively new phenomenon to the MLB and
with it being simply a one-game playoff (rather than a five or seven game series), the data
of this round was folded into the Division Series data for ease of calculation.
Future Research
It appears that there is no other study directly focused on this phenomenon,
although popular media does show some interest in the topic. Diamond’s (2015) article
in the Wall Street Journal titled, “Trade Deadline Deals Seldom Work out this Well”
shows that some are focusing on this topic, but only in light detail and using selective
methods of comparison. This study focused solely on the outcome of winning and
helping a team to increase both its winning percentage and playoff success. As stated
earlier, in professional sport, winning is generally perceived as the most important aspect
of the game, over development, and in the sport of professional baseball, the team’s
overarching goal is to win the World Series (Chen et al., 2008). The phenomenon of
great performers versus great leaders would be of particular interest to fans and GMs
alike. This could lead to a crossover in other sports where players like LeBron James are
looked to for leadership, but typically provide only excellent performance and are
overcome by teams with lesser overall performers but strong leadership in the NBA
Finals.
83
More so than other industries, sport may be more influenced by individuals with a
transactional style as performance is so vital to professional sport. Players and managers
with a transformational leadership style may be able to make a great impact with a team.
An analysis of the most effective leadership styles in sport would carry interest for
researchers and practitioners. This would most likely lead to a qualitative study. It
would be interesting to survey the seven players that were a part of helping a team’s
WP% in the regular season to qualitatively assess if, or how, their input affected the team.
Field managers, GMs, and players would be an important focus to learn more about
sports leadership. Consequently, access to these individuals is typically difficult.
Conclusion
It is important to remember the earlier reference to Gould’s (1996, pp. 127-128)
eloquently phrased hypothesis that “systems manned by best performers in competition,
and working under the same rules through time, slowly discover optimal procedures and
reduce their variation as all personnel learn and master the best ways.” This lends to the
fact that even though there are mild differences between players when analyzing specific
statistical data regarding their performance, overall, they are likely to all perform
relatively similar in the end. The differential between one player hitting a single, and the
other a homerun is likely to be very slim, all things being relatively equal. Therefore,
making sacrifices that could affect a team’s future, or greatly affect their team payroll,
just to acquire a player that is World Series-experienced, does not seem wise in most
cases. This study contended that a team will be better suited to stick with the one to three
84
players that it was going to trade, rather than mortgage its future for a short-term,
unlikely gain.
Earlier in this research, John F. Kennedy was quoted regarding if a rising tide
raises all boats (1963). As GMs look for guidance as they decide if the personnel
strategy of acquiring WSEPs in mid-season transactions is fruitful, this study will
hopefully provide insight as to the trends of the last 20 years. With the outcome that
teams are not likely to see an appreciable improvement to mid-season performance, nor
are they likely to perform to a greater end in the postseason, the focus should lie on their
scouting, development, or acquiring WSEPs before the season begins. With only five
samples in the regular season shown to raise a team’s WP% to a marked, greater
performance than in the previous 100+ games, teams acquiring these players need to be
realistic of their expectations if the player they are bringing on board is a true leader, or
simply an excellent performer.
Hope Springs Eternal
Baseball fans are often romantic as they speak passionately about their game and
the memories it has given them. They are often blind optimists as they hope for what can
be. They are certain that things will be different, and better, if adjustments are made.
Long-time baseball fans are keenly aware of one of the most famous poems about the
game, E. L. Thayer’s, “Casey at the Bat,” which was first published in San Francisco’s
newspaper, The Daily Examiner in June 1888 (Appendix E). In the poem, Thayer sets
the perfect setting of the ending of a baseball game in which fans, some even readying to

85
leave due to their team being behind late in the game, still reserve hope for their team,
and specifically one player, to save the day.
Casey at the Bat by Earnest Lawrence Thayer
The outlook wasn’t brilliant for the Mudville nine that day:
The score stood four to two, with but one inning more to play.
And then when Cooney died at first, and Barrows did the same,
A sickly silence fell upon the patrons of the game.
A straggling few got up to go in deep despair. The rest
Clung to that hope which springs eternal in the human breast;
They thought, if only Casey could get but a whack at that –
We’d put up even money, now, with Casey at the bat.
The crowd is staying, hanging on the actions of Casey because of “that hope which
springs eternal in the human breast.” These are words that originated from Alexander
Pope’s, An Essay On Man, written in 1734. Baseball fans believe that the effort,
determination, and adjustments will produce a desired outcome, no matter the odds.
They want to believe in their heroes, even if newly acquired, as they cling to hope which
is never-ending within them.
The data of this research show that one player added late will not likely make a
difference but the research did show that six players were able to make a difference with
their teams in 20 years. Of those situations, five of the teams did not make the playoffs
but one team, the 2006 Los Angeles Dodgers, did earn their way to a National League
Division Series. Those are low odds in probability, but even Mudville fans would “put

86
up even money” with Casey at the bat, as they just know that their hope, and Casey’s bat,
will carry the day.
Fans across baseball have watched over a 20-year timespan as the New York
Yankees made this type of acquisition often and it seemingly appears to keep them in the
World Series limelight and conversation. To the fan or analyst not deeply involved with
the research, indirect links are made between these moves and success then conjoined to
create the belief that this strategy has validity.
Even at the writing of this research, the principle researcher’s beloved team, the
Texas Rangers, traded for a WSEP, Cole Hamels (WS 2008 & 2009) at the trade deadline
of 2015. When Hamels joined the club, the Rangers were 50-52 (.490 WP%), and he
became the first player in MLB history to be traded during a season immediately after
throwing a no-hitter (Stark & Bowden, 2015). The Rangers were seven games behind the
American League West leading Houston Astros on the day of the trade. After Hamels
joined the team, the Rangers improved to an 88-74 record (.543 WP%) to finish the
season and won their division, advancing them to the playoffs. Hamels even pitched a
complete game on the last day of the season to clinch the division title. Hope springs
eternal.
There are several instances in the 2015 Texas Rangers’ situation that buck the
findings of the normal trends of this research. In comparison to the other players in this
study, this is only the seventh time a WSEP was acquired at the trade deadline and the
team improved from a sub-.500 record to a record of .500 or greater and only the second
time a team that made this type of acquisition advanced to the MLB playoffs. One week

87
after the Rangers acquired Hamels, on August 7, 2015, the Rangers traded for a familiar
WSEP, Mike Napoli (WS 2011) as well (Andro, 2015). Napoli earned his WSEP status
after being with the team in the 2011 World Series loss to the St. Louis Cardinals.
Interestingly, when Napoli joined the team, their record was 54-54 (.500), so he does not
earn the distinction of having statistically propelled them from under .500 to over .500,
but his contribution was still noteworthy, even if it did not match the criteria of the other
acquisitions.
As Thayer (1888) concludes his famous baseball poem, he knew from his
experience following baseball over 127 years ago, and it still seems to be true today:
Oh, somewhere in this favored land, the sun is shining bright;
The band is playing somewhere, and somewhere hearts are light.
And somewhere men are laughing, and somewhere children shout;
But there is no joy in Mudville – mighty Casey has struck out.
(Poem available in its entirety, see Appendix D.)
Thayer was correct. The belief in one baseball player stepping in to save the day,
especially one added late in the season with the highest level of experience, should not be
expected to meet the demands of the greatest possible outcome, but still, for baseball
fans, hope springs eternal.

89
REFERENCES
Aberle, J. (2009). MLB transactions, part three: Waivers and DFA. SBNation.com.
Retrieved from http://www.purplerow.com/2009/2/19/762532/mlb-transactions-
part-thre.
Ahlstrom, D., Si, S., & Kennelly, J. (1999). Free agent performance in Major League
Baseball: Do teams get what they expect? Journal of Sport Management, 13, 181-
196.
Andro, A. (2015). Napoli coming back to Rangers after Trade with Red Sox. Fox Sports.
Retrieved from http://www.foxsports.com/southwest/story/napoli-coming-back-
to-rangers-after-trade-with-red-sox-080715.
Berg, T. (2015). Houston Astros make MLB trade season’s first splash with addition of
Scott Kazmir. USAToday.com. Retrieved from
http://ftw.usatoday.com/2015/07/houston-astros-oakland-athletics-trade-scott-
kazmir-daniel-mengden-jacob-nottingham-mlb.
Bondurant, T. (2015). MLB trade deadline: Should the Yankees be buyers or sellers?
SBNation.com. Retrieved from http://www.pinstripealley.com/yankees-rumors-
hot-stove/2015/7/6/8899841/yankees-trade-deadline-buyers-sellers-johnny-cueto-
ben-zobrist-rumors.
90
Bowden, J., & Crasnick, J. (2015). Nationals make deal for Phillies closer Jonathan
Papelbon. ESPN.com. Retrieved from
http://espn.go.com/mlb/story/_/id/13333105/philadelphia-phillies-trade-jonathan-
papelbon-washington-nationals
Boyce, L. A., Jackson, R. J., & Neal, L. (2010). Building successful leadership coaching
relationships: Examining impact of matching criteria in a leadership coaching
programme. The Journal of Management Development, 29, 914-931.
Burton, L. J., & Welty Peachey, J. (2009). Transactional, or transformational? Leadership
preferences of Division III athletic administrators. Journal of Intercollegiate
Sport, 2, 245-259.
Butin, D. W. (2010). Service-learning in theory and practice: The future of community
engagement in higher education. New York, NY: Palgrave MacMillan.
Carmon, Z., & Ariely, D. (2000). Focusing on the foregone: How value can appear so
different to buyers and sellers. Journal of Consumer Research, 27, 360-370.
Center, B. (2011). Padres keep Bell, lose game in Arizona. San Diego Union-Tribune.
Retrieved from http://www.utsandiego.com/news/2011/aug/26/padres-keep-bell-
lose-game-arizona/.
Chambers, D. J., & Lavery, S. (2012). Service-learning: A valuable component of pre-
service teacher education. Australian Journal of Teacher Education, 37(4), 128-
137. doi:10.14221/ajte.2012v37n4.2
Chelladurai, P. (1980). Leadership in sport organizations. Canadian Journal of Applied
Sport Sciences, 5(4), 226-231.

91
Chen, S., Rhodes, P., Nail, N., & Salazarj, W. (2008). Economic philosophy of Major
League Baseball franchises: Win, gain and spend. Missouri Journal of Health,
Physical Education, Recreation and Dance. 18, 34-42.
Coates, D., & Humphreys, B. R. (2002). The economic impact of postseason play in
professional sport. Journal of Sports Economics, 3(3), 291-299.
Cohen, J. (2015). Why the Yankees didn’t make a trade involving Aaron Judge or Greg
Bird. SBNation.com. Retrieved from http://www.pinstripealley.com/yankees-
editorials-opinions-analysis/2015/8/9/9121621/yankees-propects-judge-bird-
severino-free-agency-payroll.
Dewey, J. (1938). Experience and education. New York: MacMillan.
Diamond, J. (2015, September 11). Trade deadline deals seldom work out this well. The
Wall Street Journal, pp D-10.
Dixon, N. C. (1994). The organizational learning cycle. How we can learn collectively.
London: McGraw-Hill.
Drayer, J., Irwin, R. L., & Martin, N. T. (2009). “You couldn’t pay me enough”:
Understanding consumer valuations and ticket price efficiency for the Southern
Heritage Classic. International Journal of Sport Management, 12, 429-442.
Drayer, J., & Rascher, D. (2013). Sport pricing research: Past, present and future. Sport
Marketing Quarterly, 22, 123-128.
Durrett, R. (2014). Ian Kinsler: Hope the Rangers go 0-162. ESPNDallas.com. Retrieved
from http://espn.go.com/dallas/mlb/story/_/id/10548784/ian-kinsler-detroit-tigers-
hopes-texas-rangers-sleazeball-gm-jon-daniels-go-0-162.
92
Field, A. (2013). Discovering statistics using IBM SPSS statistics and sex and drugs and
rock ‘n’ roll (4th Ed). Thousand Oaks, CA: Sage Publications.
First year player draft. (2015). MLB.com. Retrieved from
http://mlb.mlb.com/mlb/draftday/faq.jsp.
Fried, J. (2012). Transformative learning through engagement: Student affairs practice
as experiential pedagogy. Sterling, VA: Stylus Publishing.
Funk, D. C., & James, J. D. (2001). The Psychological Continuum Model (PCM): A
conceptual framework for understanding an individual’s psychological connection
to sport. Sport Management Review, 4, 119-150.
Galvin, B. M., Waldman, D. A., & Balthazard, P. (2010). Visionary communication
qualities as mediators of the relationship between narcissism and attributions of
leader charisma. Personnel Psychology, 63, 509-537. http://doi.org/ffdq2j.
Gandy, M. (2014). Early signs the San Francisco Giants are the NL’s clear World Series
favorite. BleacherReport.com. Retrieved from
http://bleacherreport.com/articles/2221426-early-signs-the-san-francisco-giants-
are-the-nls-clear-world-series-favorite.
Goff, S. (2014). 2014 MLS player salaries. The Washington Post. Retrieved from
http://www.washingtonpost.com/blogs/soccer-insider/wp/2014/04/10/2014-mls-
player-salaries/.
Gould, S. J. (1996). Full house: The spread of excellence from Plato to Darwin. New
York: Three Rivers Press.

93
Hammermeister, J. J. (2014). John R Wooden, Stephen R Covey and servant leadership.
International Journal of Sports Science and Coaching, 9(1), 65-67.
Harder, J. (1991). Equity theory versus expectancy theory: The case of Major League
Baseball free agents. Journal of Applied Psychology, 76, 458-464.
Hickey, J. (2014). A’s general manager, Billy Beane, has Oakland fans up in arms. San
Jose Mercury News. Retrieved from
http://www.mercurynews.com/athletics/ci_27112329/general-manager-billy-
beane-has-oakland-fans-up.
Jarvis, P. (1987). Adult learning in the social context. London: Croom Helm.
Judge, T. A., & Piccolo, R. F. (2004). Transformational and transactional leadership: A
meta-analytic test of their relative validity. Journal of Applied Psychology, 89,
755-768. doi: 10.1037/0021-9010.89.5.755
Keenan, M. (1999). Experience really counts. Sporting News. 223(14), 53.
Kennedy, J. F. (1963). Remarks in Heber Springs, Arkansas at the dedication of Greers
Ferry Dam. The American Presidency Project. Retrieved from
http://www.presidency.ucsb.edu/ws/index.php?pid=9455.
Kolb, D. (1984). Experiential learning: Experience as the source of learning and
development. Englewood Cliffs, NJ: Prentice Hall.
Kopalle, P. K., & Lehmann, D. R. (1995). The effects of advertised and observed quality
on expectations about new product quality. Journal of Marketing Research, 32(3),
280-290. doi:10.2307/3151981
94
Kopalle, P. K., & Lehmann, D. R. (2006). Setting quality expectations when entering a
market: What should the promise be? Marketing Science, 25(1), 8-24. doi:
10.1287/mksc.1050.0122.
Kreiner-Phillips, K., & Orlick, T. (1993). Winning after winning: The psychology of
ongoing excellence. The Sport Psychologist, 7, 31-48.
Lussier, R. N., & Kimball, D. C. (2009). Applied sport management skills. Champaign,
IL: Human Kinetics.
Major League Baseball Basics: Stats 101. (2014). MLB.com. Retrieved from
http://mlb.mlb.com/mlb/official_info/baseball_basics/stats_101.jsp.
Major League Baseball Collective Bargaining Agreement. (2012). Major League
Baseball. Retrieved from http://mlb.mlb.com/pa/pdf/cba_english.pdf.
Major League Baseball Team History. (2015). MLB.com. Retrieved from
http://mlb.mlb.com/mlb/history/mlb_history_teams.jsp.
Major League Baseball Team Salaries. (2014). ESPN.com. Retrieved from
http://espn.go.com/mlb/team/salaries/_/name/nyy/new-york-yankees.
Major League Baseball Trade Deadline. (2014). MLB.com. Retrieved from
http://mlb.mlb.com/mlb/news/trade_deadline/index_14.jsp.
Major League Soccer Roster Rules and Regulations. (2014). Major League Soccer.
Retrieved from http://pressbox.mlssoccer.com/content/roster-rules-and-
regulations.
Martens, R. (2004). Successful coaching, 3rd Ed. Champaign, IL: Human Kinetics.
95
Miettinen, R. (2000). The concept of experiential learning and John Dewey’s theory of
reflective thought and action. International Journal of Lifelong Education, 19(1),
54-72.
Minor League Baseball Affiliates. (2015). MiLB.com. Retrieved from
http://www.milb.com/milb/info/affiliations.jsp.
Montemurro, M. (2015). Phillies have some quality assets as trade season heats up.
Delaware News Journal Online. Retrieved from
http://www.delawareonline.com/story/sports/mlb/phillies/2015/06/01/phillies-
quality-assets-trade-season-heats/28324739/.
National Basketball Association Collective Bargaining Agreement. (2012). National
Basketball Association. Retrieved from
http://www.nba.com/media/CBA101_9.12.pdf.
National Football League Collective Bargaining Agreement. (2010). NFL
Communications. Retrieved from http://nflcommunications.com/current-cba/.
National Hockey League Collective Bargaining Agreement. (2010). NHL Players’
Association. Retrieved from http://www.nhlpa.com/inside-nhlpa/collective-
bargaining-agreement.
Olsen, H. M., & Burk, B. (2014). Using reflection to assess students’ ability to learn and
develop leadership skills. Journal of Leisure Studies and Recreation Education. 1,
75-90.
96
Passan, J. (2015). 10 degrees: A trade deadline primer, with the Royals going all in (yes,
really). YahooSports.com. Retrieved from http://sports.yahoo.com/news/10-
degrees--a-trade-deadline-primer--with-the-royals-going-all-in--really-
072020259-
Pedersen, P. M., Parks, J. B., Quarterman, J., & Thibault, L. (2011). Contemporary Sport
Management, 4th Ed. Champaign, IL: Human Kinetics.
Percy, S. L., Zmipher, N. L., & Brukardt, M. J. (2006). Creating a new kind of university:
Institutionalizing community-university engagement. Bolton, MA: Anker
Publishing.
Pope, A. (1734). An Essay On Man. Poetry Foundation. Retrieved from
http://www.poetryfoundation.org/poem/174165
Portlock, A., & Rose, S. (2009). Effects of ambush marketing: UK consumer brand
recall and attitudes to official sponsors and non-sponsors associated with the
FIFA World Cup 2006. International Journal of Sports Marketing and
Sponsorship, 10(4), 271-286.
Rieke, M., Hammermeister, J., & Chase, M. (2008). Servant leadership in sport: A new
paradigm for effective coach behavior. International Journal of Sports Science
and Coaching. 3(2), 227-238.
Rogers, J. (2014). Epstein: Trade talk is speculation – for now. ESPN.com. Retrieved
from http://espn.go.com/blog/chicago/cubs/post/_/id/25009/epstein-trade-talk-yet-
to-heat-up-despite-rumors.
97
Short, D. J. (2012). Details of Yu Darvish’s contract with the Rangers. NBCSports.com.
Retrieved from http://hardballtalk.nbcsports.com/2012/01/20/details-of-yu-
darvishs-contract-with-the-rangers/.
Siwoff, S. (2015). The Elias book of baseball records, 2015 edition. New York, NY:
Seymour Siwoff.
Solomon, M. R. (1994). Consumer behavior (2nd Ed). Needham Heights, MA: Allyn and
Bacon.
Stark, J. (2010). Oswalt accepts trade to Phillies. ESPN.com. Retrieved from
http://sports.espn.go.com/mlb/news/story?id=5420095.
Stark, J. & Bowden, J. (2015). Rangers get Cole Hamels, reliever for lefty Matt
Harrison, 5 prospects. ESPN.com. Retrieved from
http://espn.go.com/mlb/story/_/id/13343205/philadelphia-phillies-deal-cole-
hamels-texas-rangers.
Strauss, B. (2013). Ten years later, infamous Cubs fan remains invisible. The New York
Times. Retrieved from http://www.nytimes.com/2013/10/14/sports/baseball/10-
years-later-a-cubs-fan-remains-invisible.html?_r=0.
Sue-Chan, S., & Latham, G. P. (2004). The relative effectiveness of external, peer, and
self-coaches. Applied Psychology: An International Review, 53(2), 260-278.
Tapp, A. (2004). The loyalty of football fans: We’ll support you ever more. The
Journal of Database Marketing & Customer Strategy Management, 11, 203-215.
Thayer, E. L. (1888). Casey at the bat. Baseball Almanac. Retrieved from
http://www.baseball-almanac.com/poetry/po_case.shtml.
98
Thomas, J. R., Nelson, J. K., & Silverman, S. J. (2011). Research methods in physical
activity (6th ed.). Champaign, IL: Human Kinetics, p 17.
Townsend, M. (2015). Gregg Zaun says physical abuse from Cal Ripken Jr kept him in
line. Big League Stew. Retrieved from http://sports.yahoo.com/blogs/mlb-big-
league-stew/gregg-zaun-says-physical-abuse-from-cal-ripken-jr--kept-him-in-
line-071143606.html.
van der Ven, A. H. G. S. (2013). Applying the Hardy distribution to the hole scores of the
2012 British Open Championship. International Journal of Golf Science, 2. 152-
161. doi:10.1123/ijgs.2013-0014.
Vroom, V. H. (1964). Work and Motivation. New York: Wiley.
Weil, S., & McGill, I. (1989). Making sense of experiential learning: Diversity in theory
and practice. Milton Keynes: Open University Press.
Wojnarowski, A. (2015). Agent: Kendrick Perkins to sign with Cavs after completing
buyout with Jazz. Yahoo Sports. Retrieved from
http://sports.yahoo.com/news/sources--cavaliers-emerge-as-frontrunners-to-sign-
kendrick-perkins-161310057-nba.html.
Wurdinger, S. D., & Carlson, J. A. (2010). Teaching for experiential learning: Five
approaches that work. New York, NY: Rowman & Littlefield Education.
Zeithaml, V. A., Berry, L. L., & Parasuraman, A. (1988). Communication and control
processes in the delivery of service quality. Journal of Marketing, 52(2), 35-48.
doi:10.2307/1251263
99
Zolecki, T. (2013). Amaro searching for veteran corner outfielder. MLB.com. Retrieved
from http://m.mlb.com/news/article/40851928/phillies-general-manager-ruben-
amaro-jr-searching-for-veteran-corner-outfielder
Zolecki, T. (2015). Papelbon would welcome a trade. MLB.com. Retrieved from
http://zozone.mlblogs.com/2014/07/10/papelbon-would-welcome-a-trade/.

100
Appendix A
Data Output For One-Way Repeated-Measures ANOVA

101
Data Output For One-Way Repeated-Measures ANOVA
Within-Subjects Factors
Measure: WP
Trial Dependent
Variable 1 Trial1B 2 Trial25 3 Trial310 4 Trial415 5 Trial520 6 Trial6E
Descriptive Statistics
Mean Std. Deviation N Trial1B .53785 .053317 222 Trial25 .53757 .052532 222 Trial310 .53762 .052069 222 Trial415 .53809 .051633 222 Trial520 .53827 .051279 222 Trial6E .53736 .048856 222
Multivariate Testsa
Effect Value F Hypothesis df Error df Sig. Partial Eta Squared
Trial Pillai’s Trace .006 .246b 5.000 217.000 .942 .006 Wilks’ Lambda .994 .246b 5.000 217.000 .942 .006 Hotelling’s Trace .006 .246b 5.000 217.000 .942 .006 Roy’s Largest Root .006 .246b 5.000 217.000 .942 .006
Mauchly’s Test of Sphericitya
Measure: WP Within Subjects Effect
Mauchly’s W
Approx. Chi-Square df Sig.
Epsilonb Greenhouse-
Geisser Huynh-Feldt
Lower-bound
Trial .068 589.932 14 .000 .458 .463 .200 Tests the null hypothesis that the error covariance matrix of the orthonormalized transformed dependent variables is proportional to an identity matrix. a. Design: Intercept Within Subjects Design: Trial b. May be used to adjust the degrees of freedom for the averaged tests of significance. Corrected tests are displayed in the Tests of Within-Subjects Effects table.
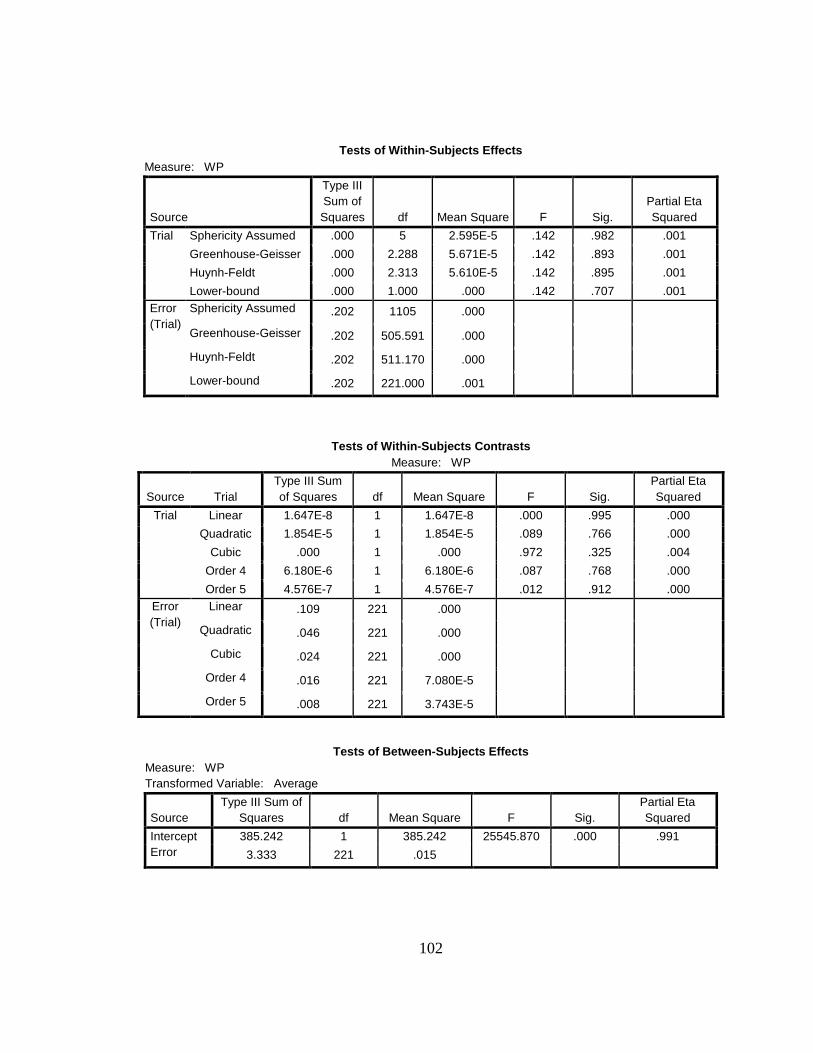
102
Tests of Within-Subjects Effects Measure: WP
Source
Type III Sum of Squares df Mean Square F Sig.
Partial Eta Squared
Trial Sphericity Assumed .000 5 2.595E-5 .142 .982 .001 Greenhouse-Geisser .000 2.288 5.671E-5 .142 .893 .001 Huynh-Feldt .000 2.313 5.610E-5 .142 .895 .001 Lower-bound .000 1.000 .000 .142 .707 .001
Error (Trial)
Sphericity Assumed .202 1105 .000 Greenhouse-Geisser .202 505.591 .000 Huynh-Feldt .202 511.170 .000 Lower-bound .202 221.000 .001
Tests of Within-Subjects Contrasts Measure: WP
Source Trial Type III Sum of Squares df Mean Square F Sig.
Partial Eta Squared
Trial Linear 1.647E-8 1 1.647E-8 .000 .995 .000 Quadratic 1.854E-5 1 1.854E-5 .089 .766 .000
Cubic .000 1 .000 .972 .325 .004 Order 4 6.180E-6 1 6.180E-6 .087 .768 .000 Order 5 4.576E-7 1 4.576E-7 .012 .912 .000
Error (Trial)
Linear .109 221 .000 Quadratic .046 221 .000
Cubic .024 221 .000 Order 4 .016 221 7.080E-5 Order 5 .008 221 3.743E-5
Tests of Between-Subjects Effects
Measure: WP Transformed Variable: Average
Source Type III Sum of
Squares df Mean Square F Sig. Partial Eta Squared
Intercept 385.242 1 385.242 25545.870 .000 .991 Error 3.333 221 .015

103
Estimates Measure: WP
Trial Mean Std. Error 95% Confidence Interval
Lower Bound Upper Bound 1 .538 .004 .531 .545 2 .538 .004 .531 .545 3 .538 .003 .531 .545 4 .538 .003 .531 .545 5 .538 .003 .531 .545 6 .537 .003 .531 .544

104
Pairwise Comparisons Measure: WP
(I) Trial (J) Trial Mean
Difference (I-J) Std. Error Sig.a
95% Confidence Interval for Differencea
Lower Bound Upper Bound 1 2 .000 .001 1.000 -.002 .003
3 .000 .001 1.000 -.002 .003 4 .000 .001 1.000 -.004 .003 5 .000 .001 1.000 -.004 .003 6 .000 .002 1.000 -.005 .006
2 1 .000 .001 1.000 -.003 .002 3 -4.955E-5 .001 1.000 -.002 .002 4 -.001 .001 1.000 -.004 .003 5 -.001 .001 1.000 -.004 .003 6 .000 .002 1.000 -.005 .006
3 1 .000 .001 1.000 -.003 .002 2 4.955E-5 .001 1.000 -.002 .002 4 .000 .001 1.000 -.002 .002 5 -.001 .001 1.000 -.003 .002 6 .000 .002 1.000 -.005 .005
4 1 .000 .001 1.000 -.003 .004 2 .001 .001 1.000 -.003 .004 3 .000 .001 1.000 -.002 .002 5 .000 .001 1.000 -.002 .002 6 .001 .002 1.000 -.004 .005
5 1 .000 .001 1.000 -.003 .004 2 .001 .001 1.000 -.003 .004 3 .001 .001 1.000 -.002 .003 4 .000 .001 1.000 -.002 .002 6 .001 .002 1.000 -.004 .005
6 1 .000 .002 1.000 -.006 .005 2 .000 .002 1.000 -.006 .005 3 .000 .002 1.000 -.005 .005 4 -.001 .002 1.000 -.005 .004 5 -.001 .002 1.000 -.005 .004
Based on estimated marginal means a. Adjustment for multiple comparisons: Bonferroni.
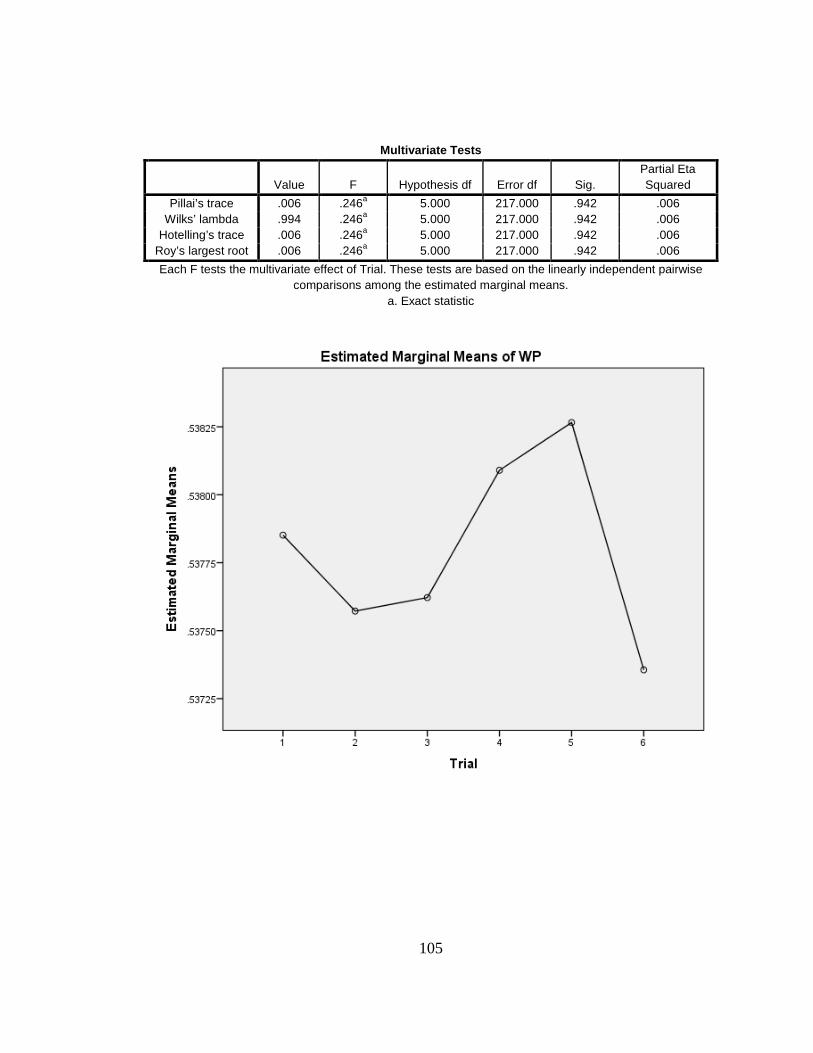
105
Multivariate Tests
Value F Hypothesis df Error df Sig. Partial Eta Squared
Pillai’s trace .006 .246a 5.000 217.000 .942 .006 Wilks’ lambda .994 .246a 5.000 217.000 .942 .006
Hotelling’s trace .006 .246a 5.000 217.000 .942 .006 Roy’s largest root .006 .246a 5.000 217.000 .942 .006 Each F tests the multivariate effect of Trial. These tests are based on the linearly independent pairwise
comparisons among the estimated marginal means. a. Exact statistic

106
Appendix B
Data Output for Independent-Samples t-Test
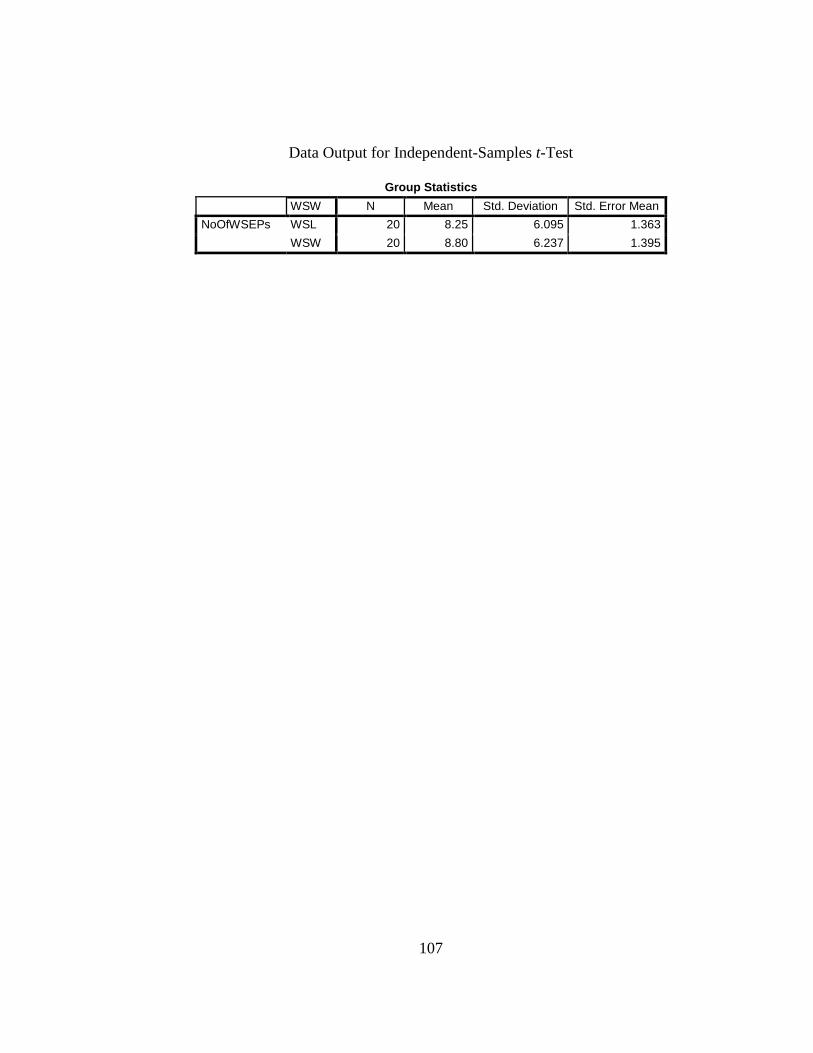
107
Data Output for Independent-Samples t-Test
Group Statistics WSW N Mean Std. Deviation Std. Error Mean NoOfWSEPs WSL 20 8.25 6.095 1.363
WSW 20 8.80 6.237 1.395

108
Independent Samples Test
Levene’s Test for Equality of
Variances t-test for Equality of Means
F Sig. t df Sig. (2-tailed)
Mean Difference
Std. Error Difference
95% Confidence Interval of the
Difference
Lower Upper NoOf
WSEPs Equal variances
assumed .151 .700 -
.282 38 .779 -.550 1.950 -4.498 3.398
Equal variances not assumed -
.282 37.980 .779 -.550 1.950 -4.498 3.398

109
Appendix C
Data Output For Chi-Square Goodness-of-Fit
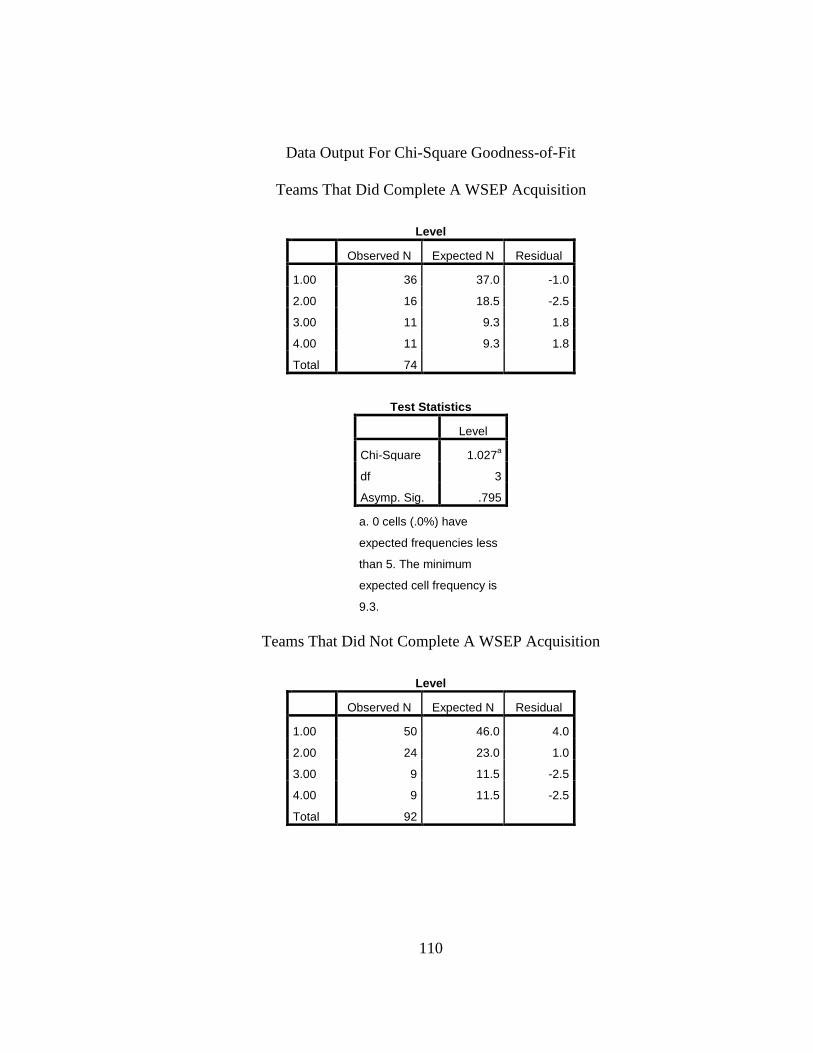
110
Data Output For Chi-Square Goodness-of-Fit
Teams That Did Complete A WSEP Acquisition
Level
Observed N Expected N Residual
1.00 36 37.0 -1.0
2.00 16 18.5 -2.5
3.00 11 9.3 1.8
4.00 11 9.3 1.8
Total 74
Test Statistics
Level
Chi-Square 1.027a
df 3
Asymp. Sig. .795
a. 0 cells (.0%) have
expected frequencies less
than 5. The minimum
expected cell frequency is
9.3.
Teams That Did Not Complete A WSEP Acquisition
Level
Observed N Expected N Residual
1.00 50 46.0 4.0
2.00 24 23.0 1.0
3.00 9 11.5 -2.5
4.00 9 11.5 -2.5
Total 92

111
Test Statistics
Level
Chi-Square 1.478a
df 3
Asymp. Sig. .687
a. 0 cells (.0%) have
expected frequencies less
than 5. The minimum
expected cell frequency is
11.5.
112
Appendix D
Casey at the Bat
by
Earnest Lawrence Thayer
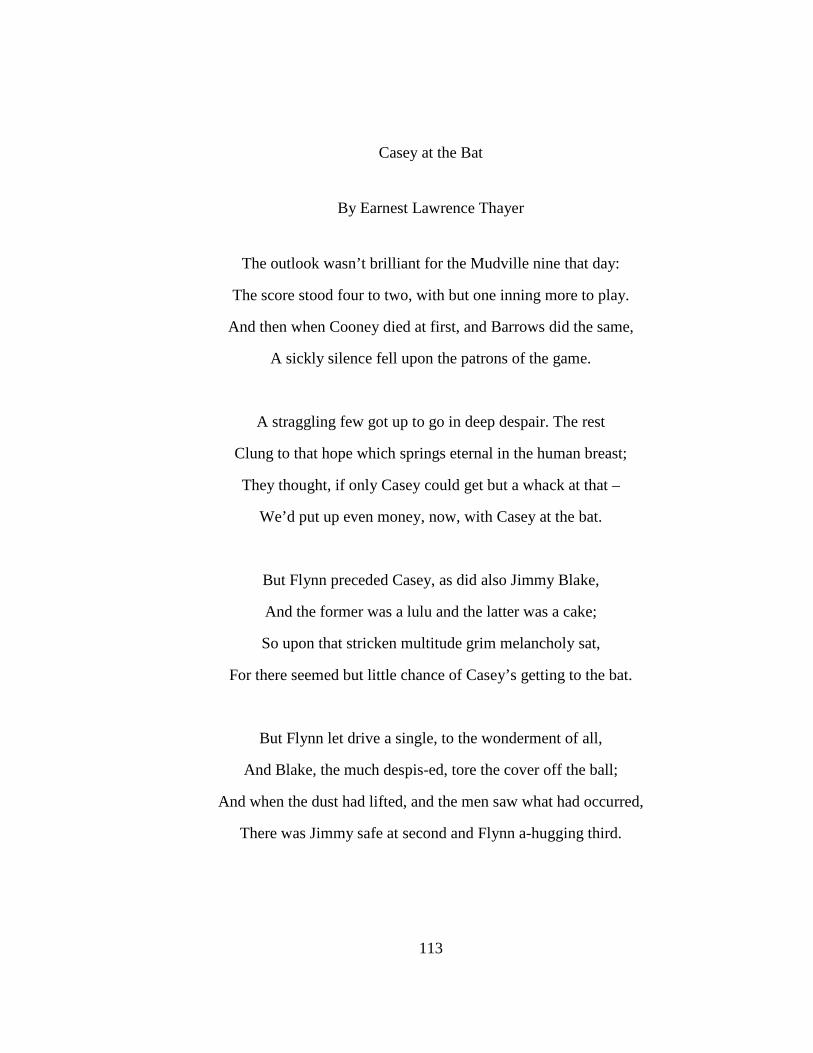
113
Casey at the Bat
By Earnest Lawrence Thayer
The outlook wasn’t brilliant for the Mudville nine that day:
The score stood four to two, with but one inning more to play.
And then when Cooney died at first, and Barrows did the same,
A sickly silence fell upon the patrons of the game.
A straggling few got up to go in deep despair. The rest
Clung to that hope which springs eternal in the human breast;
They thought, if only Casey could get but a whack at that –
We’d put up even money, now, with Casey at the bat.
But Flynn preceded Casey, as did also Jimmy Blake,
And the former was a lulu and the latter was a cake;
So upon that stricken multitude grim melancholy sat,
For there seemed but little chance of Casey’s getting to the bat.
But Flynn let drive a single, to the wonderment of all,
And Blake, the much despis-ed, tore the cover off the ball;
And when the dust had lifted, and the men saw what had occurred,
There was Jimmy safe at second and Flynn a-hugging third.

114
Then from 5,000 throats and more there rose a lusty yell;
It rumbled through the valley, it rattled in the dell;
It knocked upon the mountain and recoiled upon the flat,
For Casey, mighty Casey, was advancing to the bat.
There was ease in Casey’s manner as he stepped into his place;
There was pride in Casey’s bearing and a smile on Casey’s face.
And when, responding to the cheers, he lightly doffed his hat,
No stranger in the crowd could doubt ‘twas Casey at the bat.
Ten thousand eyes were on him as he rubbed his hands with dirt;
Five thousand tongues applauded when he wiped them on his shirt.
Then while the writhing pitcher ground the ball into his hip,
Defiance gleamed in Casey’s eye, a sneer curled Casey’s lip.
And now the leather-covered sphere came hurtling through the air,
And Casey stood a-watching it in haughty grandeur there.
Close by the sturdy batsman the ball unheeded sped-
"That ain’t my style," said Casey. "Strike one," the umpire said.
From the benches, black with people, there went up a muffled roar,
Like the beating of the storm-waves on a stern and distant shore.
"Kill him! Kill the umpire!" shouted someone on the stand;
And its likely they’d a-killed him had not Casey raised his hand.

115
With a smile of Christian charity great Casey’s visage shone;
He stilled the rising tumult; he bade the game go on;
He signaled to the pitcher, and once more the spheroid flew;
But Casey still ignored it, and the umpire said, "Strike two."
"Fraud!" cried the maddened thousands, and echo answered fraud;
But one scornful look from Casey and the audience was awed.
They saw his face grow stern and cold, they saw his muscles strain,
And they knew that Casey wouldn’t let that ball go by again.
The sneer is gone from Casey’s lip, his teeth are clenched in hate;
He pounds with cruel violence his bat upon the plate.
And now the pitcher holds the ball, and now he lets it go,
And now the air is shattered by the force of Casey’s blow.
Oh, somewhere in this favored land the sun is shining bright;
The band is playing somewhere, and somewhere hearts are light,
And somewhere men are laughing, and somewhere children shout;
But there is no joy in Mudville - mighty Casey has struck out.

116
Appendix E
Frequency of WSEP Acquisitions by Team and Year (1995-2014)
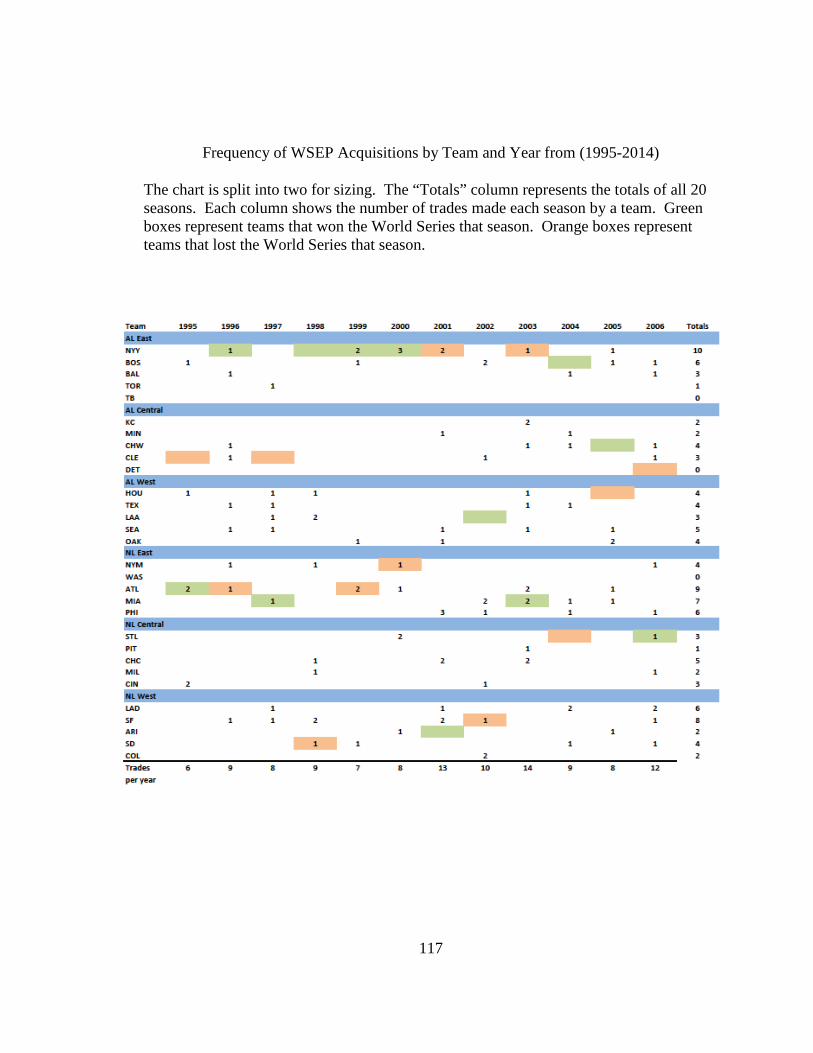
117
Frequency of WSEP Acquisitions by Team and Year from (1995-2014)
The chart is split into two for sizing. The “Totals” column represents the totals of all 20 seasons. Each column shows the number of trades made each season by a team. Green boxes represent teams that won the World Series that season. Orange boxes represent teams that lost the World Series that season.

118
119
Appendix F
Institutional Review Board Approval Letter

120