Do Power Cuts Affect Productivity? A Case Study Of Nigerian ...
12
International Business & Economics Research Journal – October 2012 Volume 11, Number 10 © 2012 The Clute Institute http://www.cluteinstitute.com/ 1163 Do Power Cuts Affect Productivity? A Case Study Of Nigerian Manufacturing Firms Busani Moyo, University of South Africa (UNISA), South Africa ABSTRACT The primary objective of this study is to examine the impact of power disruptions on firm productivity in the manufacturing sector in Nigeria. Using OLS and the Tobit models, results show that power outage variables (measured using hours per day without power and percentage of output lost due to power disruptions) have a negative and significant effect on productivity, particularly on small firms. The significance of power outage variables suggests that there is need for the Nigerian government to come up with ways of improving energy generation and supply, as well as proper maintenance of electricity infrastructure in the country. Deliberate efforts by the government to improve power infrastructure will result in the country’s being able to increase electricity production threefold and thus optimally utilize its installed generating capacity of 5900MW. Keywords: Power Cuts; Productivity; Nigerian Manufacturing INTRODUCTION ower supply in many African countries is generally known for its unreliability and high disruption costs, thus affecting production efficiency and competitiveness. Unreliable power leads to disruptions in production, loss of perishable goods, damage to sensitive equipment and loss of orders (Oshikoya et al, 2001). Despite the fact that Africa is endowed with the widest possible range of energy sources (coal, natural gas, petroleum, solar, hydro, geothermal, nuclear etc.), the continent’s power sector remains severely underdeveloped and energy consumption, in general, and electricity consumption, in particular, are relatively very low (Economic Commission for Africa, 2004). The problem with Africa’s electricity sector is not that of scarcity, but lack of infrastructure, proper financing mechanisms, and regulations that are important so as to make markets work in support of energy for sustainable development (UNDP, 2004). According to UNDP (2004), most power utilities in many countries are state-owned monopolies and thus, low tariffs and fiscal constraints have resulted in little investment and poor maintenance of infrastructure. Power outages, power surges, brown-outs, and load shedding remain common features in most countries 1 . As shown in Table 1, available statistics from the World Bank investment climate surveys also show that South Asia, Sub Saharan Africa, the Middle East and North Africa are parts of the world that are most affected by power outages. Thus, the average power outage days per month between 2000 and 2008 were 2.87 in North Africa and the Middle East, 10.30 in Sub-Saharan Africa (SSA), 42 and 3 in South Asia and Latin America, respectively, compared to the world average of 9 days per month. At the country level, Figure 1 shows the relationship between electricity production and consumption in Nigeria over the period 1990-2009. The graph shows that the country’s electricity consumption levels tracked very closely those of power production without any reserve margins being maintained. This could indicate that the levels of consumption of electricity were constrained by what has been produced and supplied. This means that any unexpected increases in demand will most likely lead to power outages or load shedding. Thus, this trend in consumption and production of electricity partly explains why the country experiences serious intermittent power disruptions. According to Babatunde and Shuaibu (2009), despite Nigeria’s vast oil reserves, much of the country’s citizens do not have access to an uninterrupted supply of electricity. Thus, Nigeria has approximately 5900MW of 1 Many firms in Africa have tried to avoid this problem by purchasing private generators, but this alternative increases fixed costs and may contribute to loss of competitiveness. P
-
Upload
khangminh22 -
Category
Documents
-
view
2 -
download
0
Transcript of Do Power Cuts Affect Productivity? A Case Study Of Nigerian ...
International Business & Economics Research Journal – October 2012 Volume 11, Number 10
© 2012 The Clute Institute http://www.cluteinstitute.com/ 1163
Do Power Cuts Affect Productivity? A Case
Study Of Nigerian Manufacturing Firms Busani Moyo, University of South Africa (UNISA), South Africa
ABSTRACT
The primary objective of this study is to examine the impact of power disruptions on firm
productivity in the manufacturing sector in Nigeria. Using OLS and the Tobit models, results show
that power outage variables (measured using hours per day without power and percentage of
output lost due to power disruptions) have a negative and significant effect on productivity,
particularly on small firms. The significance of power outage variables suggests that there is need
for the Nigerian government to come up with ways of improving energy generation and supply, as
well as proper maintenance of electricity infrastructure in the country. Deliberate efforts by the
government to improve power infrastructure will result in the country’s being able to increase
electricity production threefold and thus optimally utilize its installed generating capacity of
5900MW.
Keywords: Power Cuts; Productivity; Nigerian Manufacturing
INTRODUCTION
ower supply in many African countries is generally known for its unreliability and high disruption
costs, thus affecting production efficiency and competitiveness. Unreliable power leads to
disruptions in production, loss of perishable goods, damage to sensitive equipment and loss of orders
(Oshikoya et al, 2001). Despite the fact that Africa is endowed with the widest possible range of energy sources
(coal, natural gas, petroleum, solar, hydro, geothermal, nuclear etc.), the continent’s power sector remains severely
underdeveloped and energy consumption, in general, and electricity consumption, in particular, are relatively very
low (Economic Commission for Africa, 2004). The problem with Africa’s electricity sector is not that of scarcity,
but lack of infrastructure, proper financing mechanisms, and regulations that are important so as to make markets
work in support of energy for sustainable development (UNDP, 2004). According to UNDP (2004), most power
utilities in many countries are state-owned monopolies and thus, low tariffs and fiscal constraints have resulted in
little investment and poor maintenance of infrastructure. Power outages, power surges, brown-outs, and load
shedding remain common features in most countries1. As shown in Table 1, available statistics from the World Bank
investment climate surveys also show that South Asia, Sub Saharan Africa, the Middle East and North Africa are
parts of the world that are most affected by power outages. Thus, the average power outage days per month between
2000 and 2008 were 2.87 in North Africa and the Middle East, 10.30 in Sub-Saharan Africa (SSA), 42 and 3 in
South Asia and Latin America, respectively, compared to the world average of 9 days per month.
At the country level, Figure 1 shows the relationship between electricity production and consumption in
Nigeria over the period 1990-2009. The graph shows that the country’s electricity consumption levels tracked very
closely those of power production without any reserve margins being maintained. This could indicate that the levels
of consumption of electricity were constrained by what has been produced and supplied. This means that any
unexpected increases in demand will most likely lead to power outages or load shedding. Thus, this trend in
consumption and production of electricity partly explains why the country experiences serious intermittent power
disruptions. According to Babatunde and Shuaibu (2009), despite Nigeria’s vast oil reserves, much of the country’s
citizens do not have access to an uninterrupted supply of electricity. Thus, Nigeria has approximately 5900MW of
1 Many firms in Africa have tried to avoid this problem by purchasing private generators, but this alternative increases fixed
costs and may contribute to loss of competitiveness.
P

International Business & Economics Research Journal – October 2012 Volume 11, Number 10
1164 http://www.cluteinstitute.com/ © 2012 The Clute Institute
installed generating capacity but is only able to generate 1600MW because most power infrastructure facilities are
poorly maintained. This also explains why the power sector also experiences high energy losses of about 30%-35%
from generation to billing, low access to electricity by population (36%), as well as intermittent power outages
(Babatunde and Shuaibu, 2009).
Table 1: Electricity Infrastructure Problems (2000-2008)
Country/Region
Number Of
Power Outages
Per Month
Duration Of
Outages In
Hours
% Output Lost
Due To Power
Outages
Electricity From
Generator (If
Generator Is
Used) In %
Delay In
Obtaining
Electrical
Connection
Sub Saharan Africa 10.30 6.70 5.84 26.74 31.94
East Asia & Pacific 5.19 3.14 2.76 12.31 21.65
Latin America 2.68 7.59 4.19 18.40 34.45
South Asia 42.21 4.56 10.81 25.94 48.42
Middle East & North Africa 2.87 3.45 4.21 16.16 49.08
World 8.48 5.56 4.86 19.77 36.68
Source: World Bank’s Investment Climate Surveys Data
Figure 1
Source: World Development Indicators (2011)
According to Malik et al (2004), erratic power supply has become a fact of life for most manufacturers in
Nigeria who now increasingly rely on personal generators, voltage stabilizers, and motors to keep their machines
running. However, this self-supply of electricity raises the cost of production for domestic firms putting them at a
significant cost disadvantage relative to their foreign competitors. This problem of power disruption is particularly
costly for small firms which often lack resources to buy generators and are not well connected to NEPA officials
compared to large firms who, in some cases, have dedicated lines of power supply courtesy of NEPA (Malik et al,
2004). Statistics in Table 2 also support these arguments in that Nigeria experiences power outages for about 26
days per month and they last for about eight hours per day - far more than the regional and world averages. The
severity of power problems in Nigeria are also explained by the fact that about 9% of sales is lost due to these
disruptions, 86% of manufacturing firms in the country own or share a generator, and also, 76% of them expressed
their dissatisfaction with the services of National Electric Power Authority (NEPA), identifying power outages as a
major business constraint (Table 2).
The main aim of this study, therefore, is to investigate the impact of power infrastructure quality; i.e.,
power disruptions on productivity in the manufacturing sector in Nigeria, because power plays a very important role,
not only in facilitating the use of electric machinery, but in enhancing the productivity of other factor inputs such as
labour. Nigeria is one country that has been experiencing severe power outage problems; therefore, this study
attempts to analyze the impact of these disruptions on firm productivity. Additionally, the contributions of power
infrastructure to productivity derive not from the mere existence or creation of the physical facilities, like power
stations and power lines, but from their operation and the value of the services generated. Thus, power infrastructure
0
5000
10000
15000
20000
25000
19
90
1
99
1
19
92
1
99
3
19
94
1
99
5
19
96
1
99
7
19
98
1
99
9
20
00
2
00
1
20
02
2
00
3
20
04
2
00
5
20
06
2
00
7
20
08
2
00
9
Pro
du
ctio
n a
nd
Co
nsu
mp
tio
n
(KW
Bill
ion
s)
Demand and Supply of Electricity in Nigeria
Electric power consumption (kWh)
Electricity production net of losses
International Business & Economics Research Journal – October 2012 Volume 11, Number 10
© 2012 The Clute Institute http://www.cluteinstitute.com/ 1165
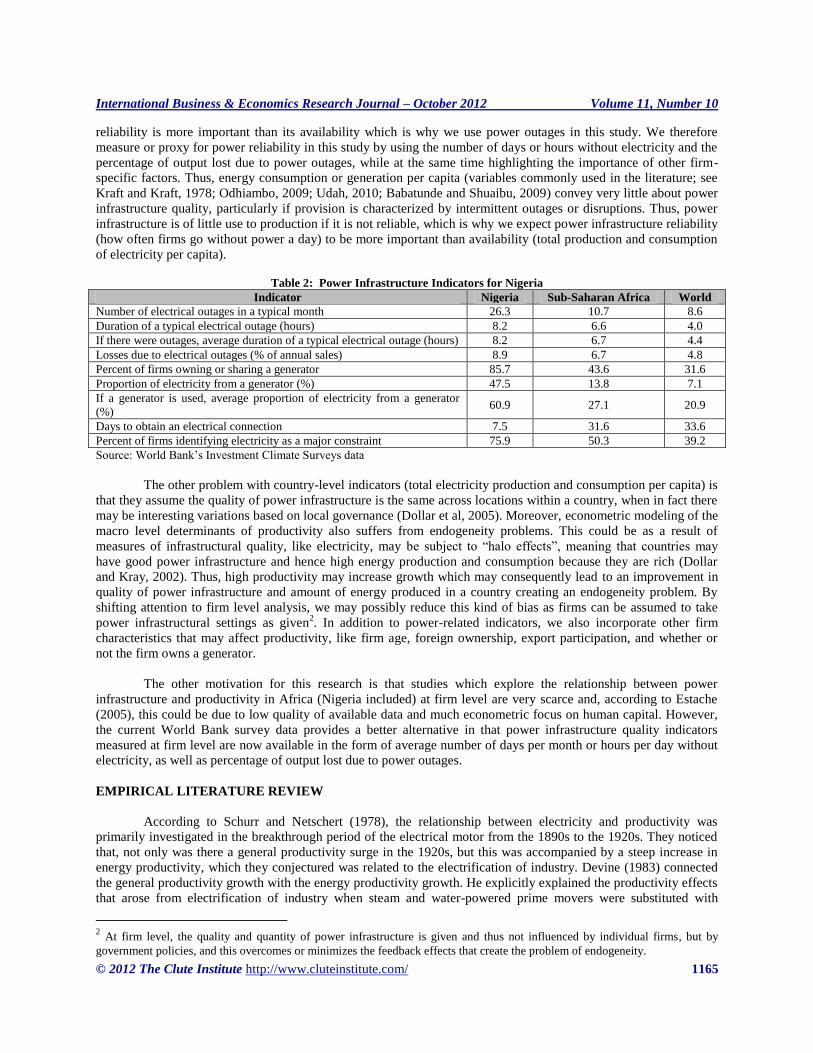
reliability is more important than its availability which is why we use power outages in this study. We therefore
measure or proxy for power reliability in this study by using the number of days or hours without electricity and the
percentage of output lost due to power outages, while at the same time highlighting the importance of other firm-
specific factors. Thus, energy consumption or generation per capita (variables commonly used in the literature; see
Kraft and Kraft, 1978; Odhiambo, 2009; Udah, 2010; Babatunde and Shuaibu, 2009) convey very little about power
infrastructure quality, particularly if provision is characterized by intermittent outages or disruptions. Thus, power
infrastructure is of little use to production if it is not reliable, which is why we expect power infrastructure reliability
(how often firms go without power a day) to be more important than availability (total production and consumption
of electricity per capita).
Table 2: Power Infrastructure Indicators for Nigeria
Indicator Nigeria Sub-Saharan Africa World
Number of electrical outages in a typical month 26.3 10.7 8.6
Duration of a typical electrical outage (hours) 8.2 6.6 4.0
If there were outages, average duration of a typical electrical outage (hours) 8.2 6.7 4.4
Losses due to electrical outages (% of annual sales) 8.9 6.7 4.8
Percent of firms owning or sharing a generator 85.7 43.6 31.6
Proportion of electricity from a generator (%) 47.5 13.8 7.1
If a generator is used, average proportion of electricity from a generator
(%) 60.9 27.1 20.9
Days to obtain an electrical connection 7.5 31.6 33.6
Percent of firms identifying electricity as a major constraint 75.9 50.3 39.2
Source: World Bank’s Investment Climate Surveys data
The other problem with country-level indicators (total electricity production and consumption per capita) is
that they assume the quality of power infrastructure is the same across locations within a country, when in fact there
may be interesting variations based on local governance (Dollar et al, 2005). Moreover, econometric modeling of the
macro level determinants of productivity also suffers from endogeneity problems. This could be as a result of
measures of infrastructural quality, like electricity, may be subject to “halo effects”, meaning that countries may
have good power infrastructure and hence high energy production and consumption because they are rich (Dollar
and Kray, 2002). Thus, high productivity may increase growth which may consequently lead to an improvement in
quality of power infrastructure and amount of energy produced in a country creating an endogeneity problem. By
shifting attention to firm level analysis, we may possibly reduce this kind of bias as firms can be assumed to take
power infrastructural settings as given2. In addition to power-related indicators, we also incorporate other firm
characteristics that may affect productivity, like firm age, foreign ownership, export participation, and whether or
not the firm owns a generator.
The other motivation for this research is that studies which explore the relationship between power
infrastructure and productivity in Africa (Nigeria included) at firm level are very scarce and, according to Estache
(2005), this could be due to low quality of available data and much econometric focus on human capital. However,
the current World Bank survey data provides a better alternative in that power infrastructure quality indicators
measured at firm level are now available in the form of average number of days per month or hours per day without
electricity, as well as percentage of output lost due to power outages.
EMPIRICAL LITERATURE REVIEW
According to Schurr and Netschert (1978), the relationship between electricity and productivity was
primarily investigated in the breakthrough period of the electrical motor from the 1890s to the 1920s. They noticed
that, not only was there a general productivity surge in the 1920s, but this was accompanied by a steep increase in
energy productivity, which they conjectured was related to the electrification of industry. Devine (1983) connected
the general productivity growth with the energy productivity growth. He explicitly explained the productivity effects
that arose from electrification of industry when steam and water-powered prime movers were substituted with
2 At firm level, the quality and quantity of power infrastructure is given and thus not influenced by individual firms, but by
government policies, and this overcomes or minimizes the feedback effects that create the problem of endogeneity.

International Business & Economics Research Journal – October 2012 Volume 11, Number 10
1166 http://www.cluteinstitute.com/ © 2012 The Clute Institute
electric motors that first drove groups of machines and later individual machines. Not only did this mean that energy
was saved because of reduced losses in the transmission of power within the industrial factories; it also improved the
working conditions, the control of machines, and enabled the gradual expansion of plants. Together, this improved
the productivity of labour and capital.
The growing interest in empirical investigation of infrastructure variables, like power, continued with the
works of Aschauer (1989). He studied the relationship between aggregate productivity and stock and flow of
government spending variables in the US economy for the period 1949-85. In his estimations, using a general Cobb-
Douglas production function, he treated government spending on public capital as one of the inputs in the
production function and proxy for infrastructure variables, like electricity. His results suggest that there is a strong
positive relationship between output per unit of capital input, the private labour capital ratio, and the ratio of the
public capital stock to the private capital stock. Mas et al. (1996) reports the regional dimension and temporal
dimension of the impact of public capital on productivity gains. Using data for Spanish regions over the period
1964-91, they estimate a Cobb-Douglas production function by means of panel data techniques to control for
unobserved state-specific characteristics. They found that economic infrastructure has a significant positive effect on
productivity, but social infrastructure does not. However, the problem with using composite indicators is that it
becomes difficult to disentangle the productivity impact of a specific infrastructure indicator, like power.
On Africa, Estache et al (2005) made one of the first attempts to conduct a more systematic, quantitative
assessment of the importance of Sub-Saharan Africa’s infrastructure. They found that electricity, water, roads, and
telecommunications are crucial factors in promoting growth. Esfahani and Ramirez (2003) estimated that Sub-
Saharan Africa’s poor growth performance is, in part, related to under investments in electricity and
telecommunications infrastructure. Estache et al (2005) also estimate that if Africa had enjoyed Korea’s quantity and
quality of infrastructure, it would have raised its annual growth in per capita income by about one percent. Hulten
(1996) found that differences in the effective use of infrastructure resources explain one-quarter of the growth
differential between Africa and East Asia and more than 40 percent of the growth differential between low and high-
growth countries.
There are a number of studies that have been done on Nigeria looking at electricity supply and
industrialization and growth. For instance, Udah (2010), using bounds test, found the long run and error correction
model showed that the index of industrial development, electricity supply, technology and capital employed are
important determinants of economic development. Iwayemi (1988) argued for importance of the energy sector in the
socio-economic development of Nigeria. He submitted that strong demand and increased supply would stimulate
increased income and higher living standards.
Oke (2006) attributed the non-competitiveness of Nigeria’s export goods to poor infrastructure, especially
electricity supply, which drives the running cost of firms. Ndebbio (2006) argued that electricity supply drives the
industrialization process. He submitted that one important indicator, whether a country is industrialized or not, is the
megawatt of electricity consumed. He further argued that a country’s electricity consumption per-capita in kilowatt
hours (KWH) is proportional to the state of industrialization of that country. Ekpo (2009) elaborated on the folly of
running a generator economy and its adverse effects on investment. He strongly argued that for Nigeria to jump start
and accelerate the pace of economic growth and development, the country should fix its power supply problem. In
his paper, Aigbokan (1999) argued that fixing the energy sector is tantamount to shifting the production possibility
curve of the country’s economy. Adenikinju (2005) provided a strong argument to support the importance of energy
supply. The poor nature of electricity supply in Nigeria, he argued, has imposed significant cost on the industrial
sector of the economy. This result corroborates the survey of the Manufacturers Association of Nigeria (MAN,
2005). In that survey, MAN indicated that the costs of generating power constitute about 36 percent of production.
All these studies used time series analysis and electricity production and consumption as power infrastructure
indicator variables while, in this study, we go down to firm level data and use infrastructure reliability indicators
(number of days and hours without power), which is a big departure from the standard approach in the literature.
International Business & Economics Research Journal – October 2012 Volume 11, Number 10
© 2012 The Clute Institute http://www.cluteinstitute.com/ 1167
EMPIRICAL METHODOLOGY
There are a number of methodologies that can be used to estimate productivity, each with its own strengths
and weaknesses. One can use index numbers, parametric and non-parametric methods, data envelope analysis, and
stochastic frontiers. According to Biesebroeck (2003), index numbers and data envelopment analysis are flexible in
the specification of technology but do not allow for measurement errors in the data3. He argued that parametric
methods, which calculate productivity from an estimated production function, are less vulnerable to measurement
errors, certainly in the dependent variable, but mis-specification of the production function might be an issue.
However, for our study, we propose to use an empirical model that borrows from the works of Harris and Trainor
(2005) and Njikam et al (2005). We measure plant level total factor productivity (TFP) using a standard Cobb
Douglas production function as follows:
iiiii KMLy 3210 (1)
where y refers to the log of output of firm i , K is log of stock of capital, M is log of material inputs, and L is log of
number of workers in each firm. In order to calculate total factor productivity (TFP), the common approach is to
obtain estimates of the elasticities of output with respect to inputs ( 321, and ) and then treat TFP4 as
residuals from equation (1). Thus, we obtain TFP as
iiiiii KMLyPTFLn ˆˆˆˆˆ321 (2)
Using this method, the TFP estimates from equation (2) would need to be regressed using a second stage
model against a set of determinants, such as the quality of power infrastructure variables, which do not feature when
estimating equation (1) and yet clearly are not random even though they are captured in the random error term i ,
where i ~ n.i.d5 (
2,0 ) is required for efficient and unbiased estimation of the model.
Newey and McFadden (1999) and Wang and Schmidt (2002) argue that using PTFLn ˆ , based on equation
(2) in a second stage model, results in both inefficient estimates (in the form of inconsistent standard errors and,
hence, inconsistent t -values6) of the determinants of TFP. Thus, Wang and Schmidt (2002) argue that this approach
3 Since survey data are very prone to measurement errors, these methods are therefore not suitable for our study. 4 TFP is the portion of output not explained by the amounts of inputs used in production and its aim is to identify output
differences that cannot be explained by input differences at country or firm level. TFP is measured at country level using the
Solow residual while at firm level, this can be estimated using a number of approaches, such as index numbers or data envelope
analysis, as well as parametric methods, like stochastic frontiers. The most simple way of measuring TFP, therefore, is to assume
a Cobb Douglas production function as follows:
MLAKY , where Y represents output, K represents capital inputs, L – labour inputs, M material inputs, and A stands
for that portion of output not explained by inputs and thus called total factor productivity (TFP). Therefore, to calculate TFP, we
transform the production function into logs and then express it in terms of A or TFP as follows:
)(
log
LogMLogLLogKLogYLogA
LogMLogLLogKLogAY
In this case, log A, or TFP, is proxied by using the residuals from the estimated Cobb Douglas production function. For more on
these TFP methods, see Biesebroeck (2003), Harris and Trainor (2005), and Njikam et al (2005), etc.
5 n.i.d. (2,0 ) means the error term is normal and independently distributed with a mean of zero and variance
2 . This is one
of the important classical linear regression assumptions and enables us to test for model and parameter significance using the F
and t- tests. 6 A t-value is the ratio of the estimated coefficient divided by the standard error and is used when checking the significance of
any independent variable used in a particular regression model. Generally, the higher the t-value, the greater the confidence we
have in the coefficient as a predictor in the model.
International Business & Economics Research Journal – October 2012 Volume 11, Number 10
1168 http://www.cluteinstitute.com/ © 2012 The Clute Institute
results in potentially biased estimates since by omitting factors from equation (1) that determine output, the
estimates of the estimated elasticities will suffer from an omitted variable problem and thus PTFLn ˆ will be
incorrectly measured. The other thing is that two-stage approaches are inefficient because they ignore any cross
equation restrictions since they do not take into account the correlation of the error terms across equations (Harris
and Trainor, 2005).
Moreover, a more serious problem associated with this approach is that of omitted variable bias. Thus the
first step regression, equation (1) ignores other known determinants of output and standard econometric theory says
that estimated elasticities from equation (1) will be biased as a result. Thus the estimates obtained in the second step
regression will also be biased and this is true regardless of whether factor inputs and those variables that determine
TFP are correlated or not7. Wang and Schmidt (2002) show that in the case of two step estimators of technical
efficiency using stochastic frontier production approach, simulations indicate that the bias due to omitted variable
problem is substantial. Their results are relevant even when using two step estimations of the determinants of TFP, a
technique shown by equation (1) and (2) above.
The preferred approach, therefore, is to directly include the determinants of output and thus TFP into
equation (1) since this will avoid any problems of inefficiency and bias and helps in directly testing whether such
determinants are statistically significant. Since TFP is defined as any change in output that is not due to changes in
factor inputs, we include these determinants directly into equation (1) as follows8:
iiiiiiii XPINFRAKMLy 213210 (3)
where iPINFRA is a measure of the quality of power infrastructure and iX is a vector of variables that includes
all other productivity effects, like firm age, dummy for foreign ownership and exporting, country and sectoral
dummies. We include these variables because some studies have shown that productivity is also affected by the age
of the firm, as well as exporting and foreign ownership (de Kok et al, 2006; Huergo and Jaumandreu, 2004; Griffith
et al, 2004; Harris and Robinson, 2004). We include generator ownership to ascertain whether such ownership does
minimize the negative effects of power outages on productivity. We capture this effect by interacting the generator
ownership dummy with quality of power infrastructure.
DATA AND VARIABLES MEASUREMENT
The World Bank’s Investment Climate Surveys (ICS) on manufacturing sectors in Nigeria is the primary
source of the data used in this study. The survey in this country was done in 2007 and the total number of
establishments covered is 2,387. These firms were also drawn from ten International Standards Industrial
Classification (ISI) industries in 11 Nigerian states.
We measure our productivity variables, like capital, using the replacement cost of plant and machinery
while output and material inputs are measured using total sales value and total cost of raw materials and
intermediate goods used in production, respectively. Firm age is calculated as the difference between the year the
firm was established and the year the survey was done. Foreign ownership is a dummy taking the value of 1 if the
firm has at least 10% foreign ownership, and zero otherwise9, and the export dummy takes a value of 1 if the firm
exports and zero otherwise. We also measured firm size using the total number of permanent workers. Power
7 In this case, the set of factors that determine output and those that determine TFP are firm specific and therefore correlated. 8 We assume here that TFP is a function of firm age, foreign ownership, quality of electricity infrastructure, etc. We therefore
substitute TFP for these variables and assume that they are linearly related. This approach was used by Harris and Trainor (2005)
and Njikam et al, (2005). 9 OECD (1999) and IMF (1995) recommend that a direct investment enterprise be defined as an incorporated or unincorporated
enterprise in which a foreign investor owns 10 percent or more of the ordinary shares or voting power of an incorporated
enterprise or the equivalent of an unincorporated enterprise. An effective voice in the management, as evidenced by an ownership
of at least 10 percent, implies that the direct investor is able to influence or participate in the management of an enterprise; it does
not require absolute control by the foreign investor.

International Business & Economics Research Journal – October 2012 Volume 11, Number 10
© 2012 The Clute Institute http://www.cluteinstitute.com/ 1169
disruptions are measured using the number of days firms go without power per month, the number of hours without
power per day, and the percentage of output lost due to power outages in a given year10
.
Dummies are included in the model so as to capture the unobserved sector heterogeneity because some
products may use less electricity than others in their production and these dummies may also capture sectoral
comparative advantage based on the country’s factor endowment differences (Yoshino, 2008). The manufacturing
sectors covered include textile and garment; machinery and equipment; chemical; electronic, non metallic minerals;
metal sector, other manufacturing; wood and furniture; as well as food sectors. We do our estimations using ordinary
least squares (OLS) and the Tobit models.
The results were estimated using both the Ordinary Least Squares method and the tobit approach. The tobit
method was used because the dependent variable output is censored from below. We estimated out variable of
interest power interruptions using days without power per month, hours without power per day, and percentage of
output lost due to power disruptions. This helps us to determine whether our results are robust to model and variable
specification. We also divided our firms into small (all firms with less than 20 employees) and large (all firms more
than 20 employees) to learn whether power outages affect firms indiscriminately or whether the impact depends on
size of the firm. In addition, by looking at the food sector, as well as the Textile and garment sector11
, we went
further and looked at the effect of power disruptions at sector level. These results are presented in Table 3 and 4.
It is generally argued that firms with some foreign ownership are more productive than those without
(Yoshino, 2008; Griffith et al, 2004; Harris and Robinson, 2004) because foreign ownership brings with it skills and
technologies that help improve the productivity of firms (productivity effect). Results from the above regressions
show that the foreign ownership dummy is an insignificant determinant of productivity. The variable is generally
insignificant, even at the sector level and using both the tobit and OLS. This may be because only about one percent
of surveyed Nigerian firms are foreign owned and most of them are in the food sector and are mostly large firms.
About 78% of all firms are small and only 0.5% of them are foreign owned which probably explains why the foreign
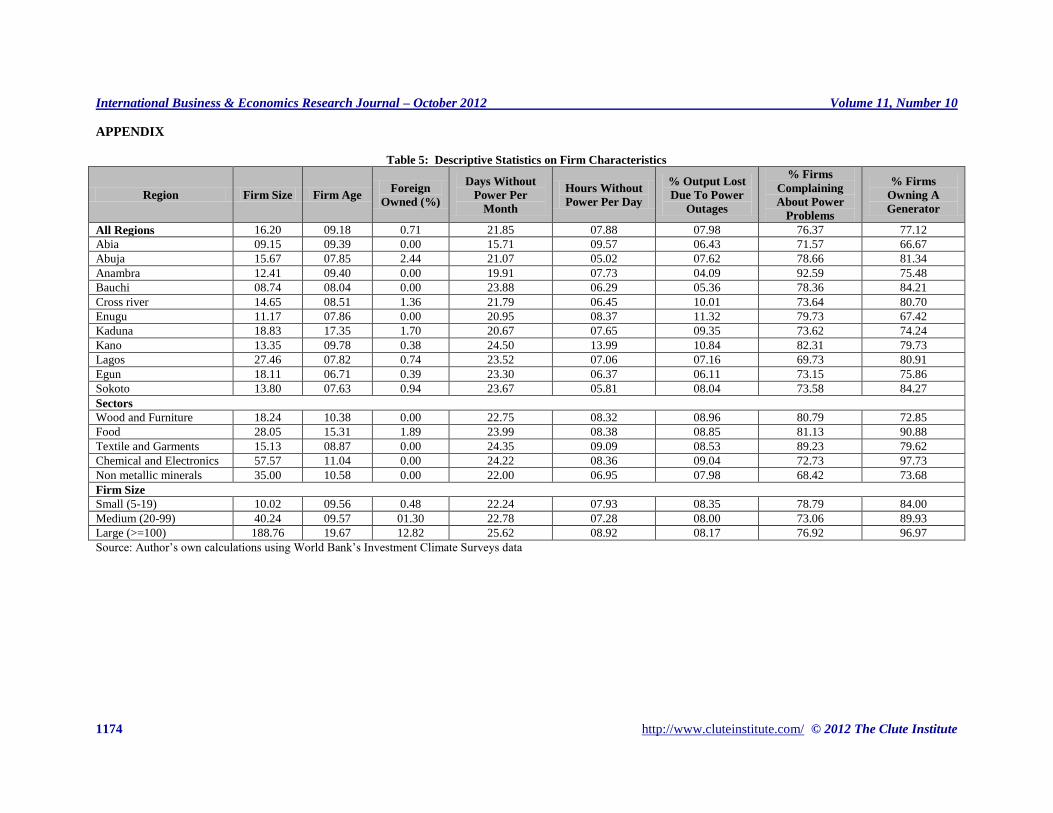
ownership dummy is insignificant (see Table 5 in Appendix). Even in the case of large firms, only 2.35% of these
firms were foreign owned which probably explains why the foreign ownership dummy is still not significant in the
large firms’ model. These results also show that firm size is consistently insignificant and sometimes negative while
age is positive and also insignificant. These results suggest that being older and bigger in size weakly affects a
firm’s level of productivity. The pattern of impact of these two variables seems to be replicated even when looking
at different firm sizes and at the sector level. This may also be explained by the fact that most of the firms are small
in size; therefore, firm size is irrelevant. The average age of all small firms is 10 years while those in the large firm
category are about 10.5 years; therefore, age might not be a factor determining firm productivity. However, the
export dummy is consistently positive and significant, suggesting that exporting enhances a firm’s productivity. This
is true despite the fact that only 2% of these firms export their products. Thus, productivity advantages of exporting
have nothing to do with being small, large, or operating in the food or textile and garment sectors. Thus, if all these
firms want to export, they have to be more productive so as to enhance their competitiveness over other firms in the
world market.
10 In each of the survey questionnaires used in these respective countries, respondents were asked to estimate the losses that
resulted from power outages, state the average number of power outages per year, and average duration of power outages in
hours per day. A question was also asked whether the responding firm owns or shares a generator. 11 We chose these two sectors because they had a reasonably large sample size.
International Business & Economics Research Journal – October 2012 Volume 11, Number 10
© 2012 The Clute Institute http://www.cluteinstitute.com/ 1170
RESULTS, PRESENTATION AND ANALYSIS
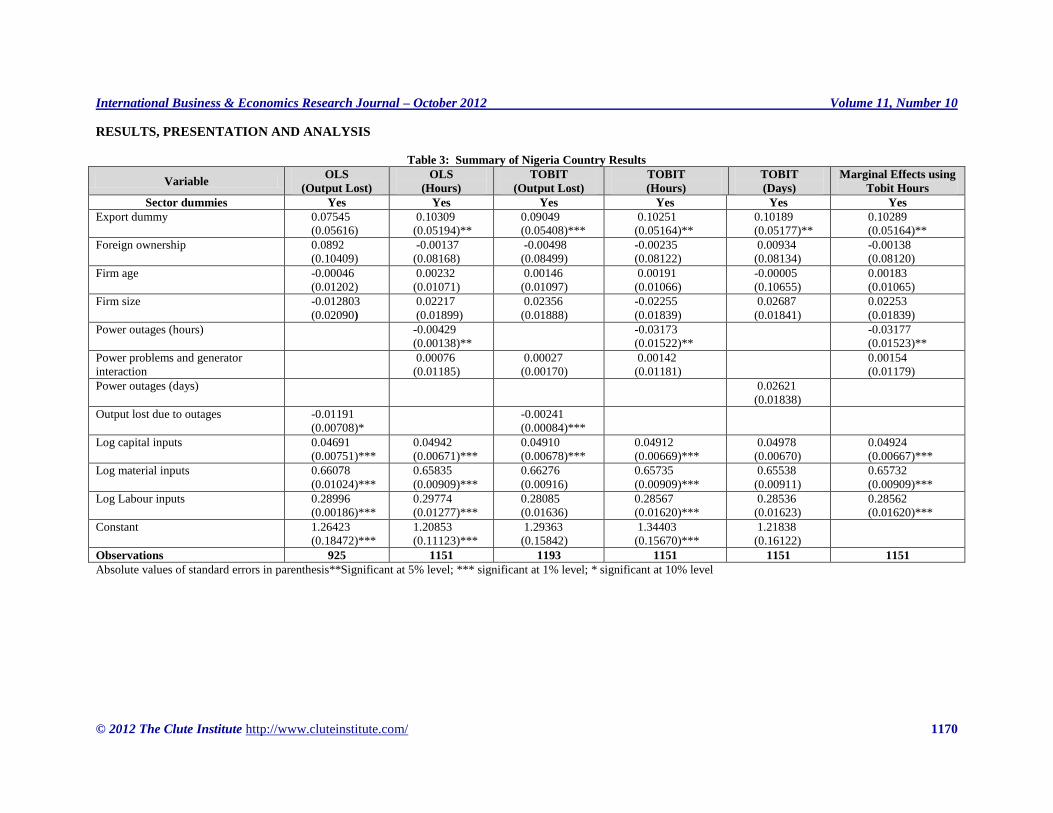
Table 3: Summary of Nigeria Country Results
Variable OLS
(Output Lost)
OLS
(Hours)
TOBIT
(Output Lost)
TOBIT
(Hours)
TOBIT
(Days)
Marginal Effects using
Tobit Hours
Sector dummies Yes Yes Yes Yes Yes Yes
Export dummy
0.07545
(0.05616)
0.10309
(0.05194)**
0.09049
(0.05408)***
0.10251
(0.05164)**
0.10189
(0.05177)**
0.10289
(0.05164)**
Foreign ownership 0.0892
(0.10409)
-0.00137
(0.08168)
-0.00498
(0.08499)
-0.00235
(0.08122)
0.00934
(0.08134)
-0.00138
(0.08120)
Firm age -0.00046 0.00232 0.00146 0.00191 -0.00005 0.00183
(0.01202) (0.01071) (0.01097) (0.01066) (0.10655) (0.01065)
Firm size -0.012803
(0.02090)
0.02217
(0.01899)
0.02356
(0.01888)
-0.02255
(0.01839)
0.02687
(0.01841)
0.02253
(0.01839)
Power outages (hours) -0.00429
(0.00138)**
-0.03173
(0.01522)**
-0.03177
(0.01523)**
Power problems and generator
interaction
0.00076
(0.01185)
0.00027
(0.00170)
0.00142
(0.01181)
0.00154
(0.01179)
Power outages (days)
0.02621
(0.01838)
Output lost due to outages
-0.01191
(0.00708)*
-0.00241
(0.00084)***
Log capital inputs
0.04691
(0.00751)***
0.04942
(0.00671)***
0.04910
(0.00678)***
0.04912
(0.00669)***
0.04978
(0.00670)
0.04924
(0.00667)***
Log material inputs
0.66078
(0.01024)***
0.65835
(0.00909)***
0.66276
(0.00916)
0.65735
(0.00909)***
0.65538
(0.00911)
0.65732
(0.00909)***
Log Labour inputs 0.28996
(0.00186)***
0.29774
(0.01277)***
0.28085
(0.01636)
0.28567
(0.01620)***
0.28536
(0.01623)
0.28562
(0.01620)***
Constant
1.26423
(0.18472)***
1.20853
(0.11123)***
1.29363
(0.15842)
1.34403
(0.15670)***
1.21838
(0.16122)
Observations 925 1151 1193 1151 1151 1151
Absolute values of standard errors in parenthesis**Significant at 5% level; *** significant at 1% level; * significant at 10% level
International Business & Economics Research Journal – October 2012 Volume 11, Number 10
1171 http://www.cluteinstitute.com/ © 2012 The Clute Institute
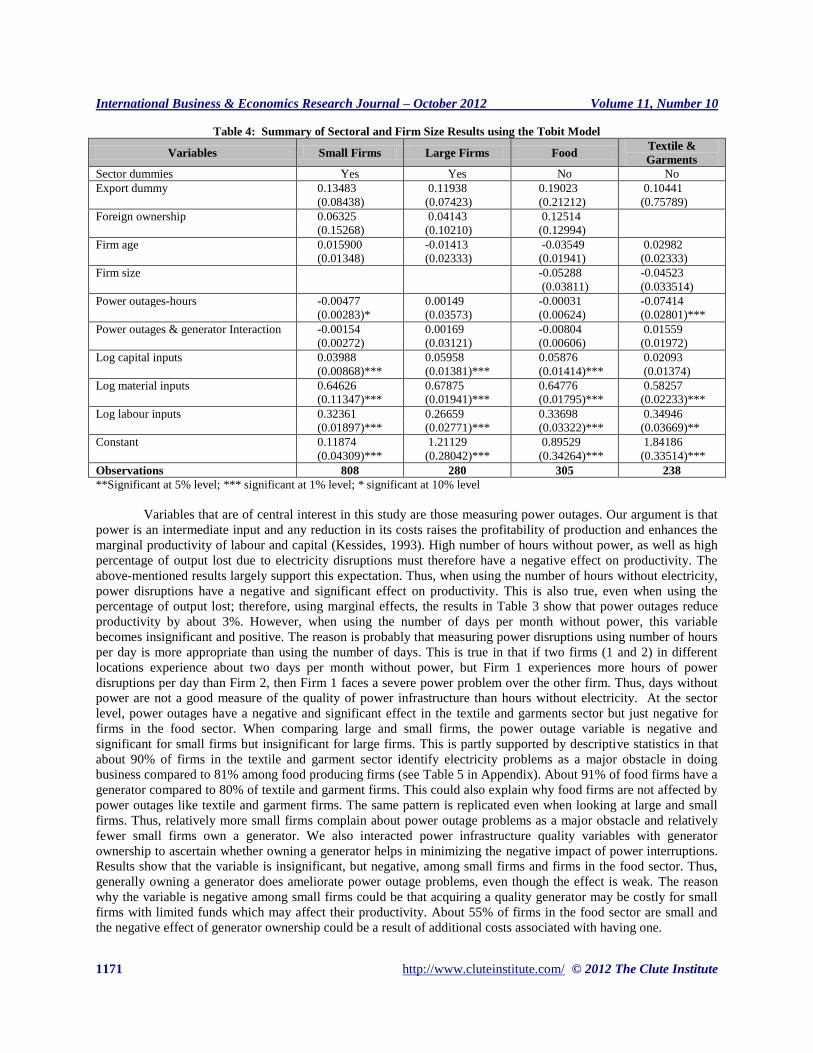
Table 4: Summary of Sectoral and Firm Size Results using the Tobit Model
Variables Small Firms Large Firms Food Textile &
Garments
Sector dummies Yes Yes No No
Export dummy
0.13483
(0.08438)
0.11938
(0.07423)
0.19023
(0.21212)
0.10441
(0.75789)
Foreign ownership 0.06325 0.04143 0.12514
(0.15268) (0.10210) (0.12994)
Firm age 0.015900 -0.01413 -0.03549 0.02982
(0.01348) (0.02333) (0.01941) (0.02333)
Firm size
-0.05288
(0.03811)
-0.04523
(0.033514)
Power outages-hours -0.00477 0.00149 -0.00031 -0.07414
(0.00283)* (0.03573) (0.00624) (0.02801)***
Power outages & generator Interaction
-0.00154
(0.00272)
0.00169
(0.03121)
-0.00804
(0.00606)
0.01559
(0.01972)
Log capital inputs
0.03988
(0.00868)***
0.05958
(0.01381)***
0.05876
(0.01414)***
0.02093
(0.01374)
Log material inputs
0.64626
(0.11347)***
0.67875
(0.01941)***
0.64776
(0.01795)***
0.58257
(0.02233)***
Log labour inputs 0.32361 0.26659 0.33698 0.34946
(0.01897)*** (0.02771)*** (0.03322)*** (0.03669)**
Constant
0.11874
(0.04309)***
1.21129
(0.28042)***
0.89529
(0.34264)***
1.84186
(0.33514)***
Observations 808 280 305 238
**Significant at 5% level; *** significant at 1% level; * significant at 10% level
Variables that are of central interest in this study are those measuring power outages. Our argument is that
power is an intermediate input and any reduction in its costs raises the profitability of production and enhances the
marginal productivity of labour and capital (Kessides, 1993). High number of hours without power, as well as high
percentage of output lost due to electricity disruptions must therefore have a negative effect on productivity. The
above-mentioned results largely support this expectation. Thus, when using the number of hours without electricity,
power disruptions have a negative and significant effect on productivity. This is also true, even when using the
percentage of output lost; therefore, using marginal effects, the results in Table 3 show that power outages reduce
productivity by about 3%. However, when using the number of days per month without power, this variable
becomes insignificant and positive. The reason is probably that measuring power disruptions using number of hours
per day is more appropriate than using the number of days. This is true in that if two firms (1 and 2) in different
locations experience about two days per month without power, but Firm 1 experiences more hours of power
disruptions per day than Firm 2, then Firm 1 faces a severe power problem over the other firm. Thus, days without
power are not a good measure of the quality of power infrastructure than hours without electricity. At the sector
level, power outages have a negative and significant effect in the textile and garments sector but just negative for
firms in the food sector. When comparing large and small firms, the power outage variable is negative and
significant for small firms but insignificant for large firms. This is partly supported by descriptive statistics in that
about 90% of firms in the textile and garment sector identify electricity problems as a major obstacle in doing
business compared to 81% among food producing firms (see Table 5 in Appendix). About 91% of food firms have a
generator compared to 80% of textile and garment firms. This could also explain why food firms are not affected by
power outages like textile and garment firms. The same pattern is replicated even when looking at large and small
firms. Thus, relatively more small firms complain about power outage problems as a major obstacle and relatively
fewer small firms own a generator. We also interacted power infrastructure quality variables with generator
ownership to ascertain whether owning a generator helps in minimizing the negative impact of power interruptions.
Results show that the variable is insignificant, but negative, among small firms and firms in the food sector. Thus,
generally owning a generator does ameliorate power outage problems, even though the effect is weak. The reason
why the variable is negative among small firms could be that acquiring a quality generator may be costly for small
firms with limited funds which may affect their productivity. About 55% of firms in the food sector are small and
the negative effect of generator ownership could be a result of additional costs associated with having one.
International Business & Economics Research Journal – October 2012 Volume 11, Number 10
1172 http://www.cluteinstitute.com/ © 2012 The Clute Institute
CONCLUSIONS
The primary objective of this study is to examine the impact of power disruptions on firm productivity in
the manufacturing sector of Nigeria. The significance of power outage variable suggests that there is need for the
Nigerian government to come up with ways of improving energy generation and supply. This could also be
supported by proper maintenance of electricity infrastructure. The severity of power outage problems in Nigeria is
ironical in that the country is well endowed with resources to produce power from crude oil and it is the sixth largest
exporter of crude oil in the world, but electricity black-outs and brown-outs appear to be the order of the day in this
country. This can be achieved either through the commonly used private-public partnership arrangements or
privatization of state-run power utility monopolies. Proper regulatory mechanisms can be used to minimize abuse of
monopoly power by these privatized utility companies. By so doing, resources will be generated to build and
maintain electricity infrastructure. According to Wasiu (2008), energy is the engine that drives industrialization,
which improves communication and helps innovation in science and technology, provides sound health care delivery
systems, and improves citizens’ standards of living. In light of these benefits, a sound energy policy would increase
competitiveness and growth, and reduce poverty and unemployment. This sound energy policy should not be limited
to the generation of electricity from fossil fuel like oil, gas and nuclear sources, but even environmentally-friendly
sources like biomass, geothermal, hydro power, ocean waves, solar, and wind. Since generators appear to be
helpful, the government could find ways of ensuring that firms can easily or cheaply access these machines. This
can be done by supporting firms who produce generators or even encourage more firms to participate in the
generator production sector so as to encourage competition and ultimately push prices down.
AUTHOR INFORMATION
Busani Moyo is a Senior Lecturer in the Department of Economics at the University of South Africa. Contact
details: Preller street, Muckleneuk Ridge, Pretoria: P.O. Box 392 UNISA 003 South Africa: Tel +27 12 429 6191/
+27 84 526 9216: E-mail: [email protected] / [email protected]
REFERENCES
1. Aschauer D (1989): Is Public expenditure productive? Journal of Monetary Economics Vol 23 177-200.
2. Babatunde M.A. and Shuaibu M.I (2009): The demand for residential electricity in Nigeria. A bound
testing approach. A paper presented at the 2009 Conference of the African Econometric Society.
3. Biesebroeck J V (2003): Exporting raises productivity in Sub Saharan African manufacturing firms.
Journal of International Economics Vol 67 373 – 391.
4. Biesebroeck J V (2003b) Revising some productivity Debates. NBER Working paper series 10065.
5. Devine W (1983): From Shafts to wires: Historical perspective on electrification. Journal of Economic
History Vol 2 347-372.
6. Dollar, D & Kray, A. (2003): Institutions, trade and growth. Journal of Monetary Economics Vol 50(1).
7. De Kok JMP, Fris P and Brouwer P (2006): On the relationship between firm age and productivity growth.
Scientific Analysis of entrepreneurship and SMEs (SCALES).
8. Economic Commission for Africa (2001 and 2005): United Nations Report: Defining Priorities for
Regional Integration through Infrastructure Development.
9. Ekpo U.N (2009): Public Investment and infrastructure development. The case of electric power supply in
Nigeria .
10. Esfahani H, and Ramirez M T (2003) Institutions, Infrastructure and Economic Growth. Journal of
Development Economics Vol 70 443-477.
11. Estache A (2005): What do we know about Sub Saharan Africa’s infrastructure and the impact of its 1990
Reforms? Mimeo, World Bank, Washington DC.
12. Griffith R, Redding S and Simpson H (2004): Foreign ownership and Productivity: New evidence from the
services sector and the R&D Lab. CEP Discussion paper No 649.
13. Harris R and Trainor M (2005) Capital subsidies and their impact on Total factor productivity: Firm level
evidence from Northern Ireland. Journal of Regional Science Vol 45 (1) 49-74.
14. Harris R and Robinson C (2003): Foreign ownership and productivity in the United Kingdom estimates for
UK Manufacturing using the ARD. Review of Industrial organization Vol 22 207-223.
International Business & Economics Research Journal – October 2012 Volume 11, Number 10
© 2012 The Clute Institute http://www.cluteinstitute.com/ 1173
15. Huergo E and Jamandreu J (2004): Firm age, process innovation and productivity growth. International
Journal of Industrial organization Vol 22.
16. Hulten C (1996): Infrastructure, Capital and Economic Growth. How well you use it may be more
important than how much you have. NBER Working paper Series 5847.
17. IMF (2005): Balance of Payments Manual, Fifth Edition.
18. Iwayemi A (1988): Nigeria’s Dual Energy Problems: Policy Issues and Challenges. International
Association for Energy Economics, Pages 17-21.
19. Kessides C (1993): Contributions of Infrastructure to Economic Development. A Review of Experience
and Policy Implications. World Bank Discussion Paper number 213.
20. Kraft J and Kraft A (1978): On the relationship between energy and GNP. Journal of energy Development
Vol 3 401-403.
21. Malik A. Teal F and Baptist S (2004): The performance of Nigerian manufacturing firms. Report on the
Nigerian manufacturing enterprise surveys, United Nations Industrial Development Organization Center for
the study of African Economies, University of Oxford.
22. Newey W K and McFadden D (199) Large sample estimation and Hypothesis testing in McFadden D and
Engle R (eds) Handbook of Econometrics Vol 4 Amsterdam. North Holland 2113-2245.
23. Njikam O, Binam N J and Tachi S (2006): Understanding Total factor Productivity growth in SSA.
SISERA Working Paper Series.
24. Oshikoya T and Hussain N (2001): Infrastructure for Economic Development in Africa, paper presented at
the 2nd Forum on African Perspective, ADB-OECD, Paris and France.
25. OECD (1999): Benchmark definition of Foreign Direct Investment. Third Edition, OECD Publications,
France.
26. Palangkaraya A, Stierwald A and Yong J (2009): Is Firm Productivity related to size and age? The case of
Large Australian firms. Journal of Industry, Competition and Trade Vol 9 (2) 167-195.
27. Schurr S and Netschert B (1978): Energy in the American Economy: 1850-1975. An economic study of its
history and prospects Baltimore. John Hopkins University Press.
28. Udah E.B (2010): Industrial development, electricity crisis and economic performance in Nigeria.
European Journal of Economics, Finance and Administrative sciences Vol 18, 105-121.
29. World Bank Investment Climate surveys: www.enterprisesurveys.org/ExploreTopics/?topicid=8
30. Wang H and Schmidt (2002): One step and two step estimations of the effects of exogenous variables on
technical efficiency levels. Journal of Productivity Analysis Vol 18 129 -144.
31. Wasiu Q (2008): Solutions to Nigeria’s power outrage.
32. http://www.booksie.com/editorial_and_opinion/article/quadri/solution-to-nigeria-power-outrage accessed
03/03/2012.
33. Yoshino, Y. 2008: Domestic Constraints, Firm Characteristics and Geographical Diversification of firm
level Manufacturing exports in Africa: World Bank Policy Research Working paper
International Business & Economics Research Journal – October 2012 Volume 11, Number 10
1174 http://www.cluteinstitute.com/ © 2012 The Clute Institute
APPENDIX
Table 5: Descriptive Statistics on Firm Characteristics
Region Firm Size Firm Age Foreign
Owned (%)
Days Without
Power Per
Month
Hours Without
Power Per Day
% Output Lost
Due To Power
Outages
% Firms
Complaining
About Power
Problems
% Firms
Owning A
Generator
All Regions 16.20 09.18 0.71 21.85 07.88 07.98 76.37 77.12
Abia 09.15 09.39 0.00 15.71 09.57 06.43 71.57 66.67
Abuja 15.67 07.85 2.44 21.07 05.02 07.62 78.66 81.34
Anambra 12.41 09.40 0.00 19.91 07.73 04.09 92.59 75.48
Bauchi 08.74 08.04 0.00 23.88 06.29 05.36 78.36 84.21
Cross river 14.65 08.51 1.36 21.79 06.45 10.01 73.64 80.70
Enugu 11.17 07.86 0.00 20.95 08.37 11.32 79.73 67.42
Kaduna 18.83 17.35 1.70 20.67 07.65 09.35 73.62 74.24
Kano 13.35 09.78 0.38 24.50 13.99 10.84 82.31 79.73
Lagos 27.46 07.82 0.74 23.52 07.06 07.16 69.73 80.91
Egun 18.11 06.71 0.39 23.30 06.37 06.11 73.15 75.86
Sokoto 13.80 07.63 0.94 23.67 05.81 08.04 73.58 84.27
Sectors
Wood and Furniture 18.24 10.38 0.00 22.75 08.32 08.96 80.79 72.85
Food 28.05 15.31 1.89 23.99 08.38 08.85 81.13 90.88
Textile and Garments 15.13 08.87 0.00 24.35 09.09 08.53 89.23 79.62
Chemical and Electronics 57.57 11.04 0.00 24.22 08.36 09.04 72.73 97.73
Non metallic minerals 35.00 10.58 0.00 22.00 06.95 07.98 68.42 73.68
Firm Size
Small (5-19) 10.02 09.56 0.48 22.24 07.93 08.35 78.79 84.00
Medium (20-99) 40.24 09.57 01.30 22.78 07.28 08.00 73.06 89.93
Large (>=100) 188.76 19.67 12.82 25.62 08.92 08.17 76.92 96.97
Source: Author’s own calculations using World Bank’s Investment Climate Surveys data