DO NEIGHBORHOOD PARKS AND PLAYGROUNDS REDUCE CHILDHOOD OBESITY
57
DO NEIGHBORHOOD PARKS AND PLAYGROUNDS REDUCE CHILDHOOD OBESITY? MAOYONG FAN *1 AND YANHONG JIN †1 ABSTRACT: Using the 2007 National Survey of Children’s Health data, we find a statistically and economically significant effect of neighborhood parks and playgrounds on childhood obesity based on covariate matching estimators. The park/playground effect depends on gender, age, race, household income, neighborhood safety, and other neighborhood amenities. The results suggest that adding a neighborhood park/playground may reduce the obesity rate and make children more fit, but relevant interventions must consider socioeconomic status of the targeted children as well as other neighborhood amenities. KEYWORDS: CHILDHOOD OBESITY, PARK/PLAYGROUND, NEIGHBORHOOD AMENITY, MATCHING JEL CLASSIFICATIONS: I18 I38 R53 Suggested running title: Neighborhood Parks/Playgrounds and Childhood Obesity? * Maoyong Fan is an assistant professor of Economics Department and a faculty research fellow of the Global Health Institute at Ball State University. Email: [email protected]. Tel.: (765) 285-5741. † Yanhong Jin is an assistant professor in Department of Agricultural, Food and Resource Economics at Rutgers University. Email: [email protected]. Tel.: (848)-932-9139; Fax: 732-932-8887. 1 Authors are ranked alphabetically and the seniority of authorship is equally shared.
Transcript of DO NEIGHBORHOOD PARKS AND PLAYGROUNDS REDUCE CHILDHOOD OBESITY

DO NEIGHBORHOOD PARKS AND PLAYGROUNDS REDUCE CHILDHOOD OBESITY?
MAOYONG FAN*1 AND YANHONG JIN†1
ABSTRACT:
Using the 2007 National Survey of Children’s Health data, we find a statistically and
economically significant effect of neighborhood parks and playgrounds on childhood obesity
based on covariate matching estimators. The park/playground effect depends on gender,
age, race, household income, neighborhood safety, and other neighborhood amenities. The
results suggest that adding a neighborhood park/playground may reduce the obesity rate and
make children more fit, but relevant interventions must consider socioeconomic status of
the targeted children as well as other neighborhood amenities.
KEYWORDS: CHILDHOOD OBESITY, PARK/PLAYGROUND, NEIGHBORHOOD AMENITY, MATCHING
JEL CLASSIFICATIONS: I18 I38 R53 Suggested running title: Neighborhood Parks/Playgrounds and Childhood Obesity?
* Maoyong Fan is an assistant professor of Economics Department and a faculty research fellow of the
Global Health Institute at Ball State University. Email: [email protected]. Tel.: (765) 285-5741. † Yanhong Jin is an assistant professor in Department of Agricultural, Food and Resource Economics at
Rutgers University. Email: [email protected]. Tel.: (848)-932-9139; Fax: 732-932-8887. 1 Authors are ranked alphabetically and the seniority of authorship is equally shared.

1
DO NEIGHBORHOOD PARKS AND PLAYGROUNDS REDUCE CHILDHOOD OBESITY?
The prevalence of childhood obesity in the United States has risen dramatically across all
racial, gender, and ethnic groups since 1980 (Dehghan, Akhtar-Danesh and Merchant, 2005).
Childhood obesity has significantly negative health, psychological, and social consequences
due to impaired quality of life and increased morbidity (Must and Strauss, 1999; Reilly et al.,
2003).
Obesity results from an energy imbalance involving too much caloric intake and/or
insufficient physical activity. Lakdawalla and Philipson (2002) find that much of the increase
in body weight over the 20th century is due to decreased physical activity, largely from
workers moving away from physically demanding jobs/activities and toward sedentary ones.
The 2009 National Youth Risk Behavior Survey conducted among 9th through 12th graders in
both public and private schools in the United States reports that 23% of students did not
participate in at least 60 minutes of physical activity on at least one day over a period of
seven days before the survey (NYRBS, 2009). The notion of an “obesogenic environment”
has been proposed and modeled to investigate how the built environment and socio-
economic deprivation at the community level affect childhood obesity (Caballero, 2007;
Papas et al., 2007). Among all the factors incorporated in the models of an obesogenic
environment, availability of and access to neighborhood amenities (e.g., physical facilities) is
regarded as one of the most important elements affecting childhood obesity and has gained
increasing attention in primary prevention (Koplan, Liverman and Kraak, 2005; Papas et al.,
2007; USDHHS, 2001). The literature has documented a positive association between a
higher level of physical activity and the density of neighborhood recreational facilities
(McInnes and Shinogle, 2009) or their proximity and attractiveness (Yancey et al., 2007).

2
This study focuses on neighborhood parks and playgrounds, as they provide physical
locations for children to engage in outdoor physical activity and to develop physically active
lifestyles. Furthermore, adding a park/playground to a neighborhood is a relatively feasible
policy intervention in the battle against childhood obesity.
The objective of this article is twofold. First, we estimate the effect of neighborhood
parks/playgrounds on childhood obesity, measured by body mass index (BMI) and the risk
of being overweight or obese. Second, we further explore how neighborhood attributes and
individual socioeconomic status influence the park/playground effect. We use the 2007
National Survey of Children’s Health (NSCH) for the empirical analysis. The 2007 NSCH
survey collected information on neighborhood characteristics, particularly, the existence of
parks/playgrounds, sidewalks/pathways, and community centers/kids’ clubs in each
respondent’s neighborhood. It also collected a rich set of socioeconomic information about
the respondents. The respondents are not randomly assigned to neighborhoods with
different amenities. Therefore, we face an endogeneity problem in evaluating the effect of
neighborhood parks/playgrounds on obesity using cross-sectional data because a health-
conscious individual may self-select into a neighborhood promoting physical activity. We
employ a covariate matching technique to address the selection problem and compare the
weight status of children having access to neighborhood amenities with that of similar
children having no access to neighborhood amenities.
We find that neighborhood parks/playgrounds make children more fit. The reduction in
BMI and the risk of being overweight or obese is both statistically and economically
significant. We also find that the effect depends on gender, age, race, household income
level, neighborhood safety, and other neighborhood amenities. The park/playground effect

3
is greater for girls than boys, for younger cohorts aged 10-13 than adolescents aged 14-17,
for non-Hispanic whites than blacks and Hispanics, for children in low-income households
than those in high-income households, and for children living in unsafe neighborhoods than
those living in safe neighborhoods. Community centers/kids’ clubs attenuate the
park/playground effect on both boys and girls, but sidewalks/pathways enhance (attenuate)
the park/playground effect on boys (girls).
Literature Review
Previous studies in the public health literature support the association between access to
neighborhood amenities and more outdoor physical activity and/or less sedentary activity
(Gordon-Larsen et al., 2006; Norman et al., 2006; Roemmich et al., 2006; Timperio et al.,
2004; Veugelers et al., 2008). Living in a neighborhood with walkable and connected
sidewalks and crosswalks, a large density of different types of destinations such as schools,
stores, and parks, and high levels of connectivity between destinations is found to be
associated with an increase in physical activity. However, the effectiveness of neighborhood
amenities on physical activity depends significantly on neighborhood safety because
concerns about neighborhood safety may decrease residents’ willingness to engage in
outdoor physical activity and curb active commuting (e.g., bicycling). Furthermore, residing
in an unsafe neighborhood may also increase stress and result in a less active lifestyle
(Björntorp, 2001; Roemmich et al., 2007), especially when exposed to neighborhood
violence (Kliewer, 2006).
Although the association between neighborhood amenities and physical activity is well
established in the literature, the relationship between neighborhood amenities and obesity is
less clear. Some studies find that neighborhood amenities are related to a lower prevalence of

4
overweight or obesity (Gordon-Larsen et al., 2006; Veugelers et al., 2008), but others find no
statistically significant relationship (Burdette and Whitaker, 2004; Norman et al., 2006).
Using the Children's Lifestyle and School Performance Study of Canada, Veugelers et al.
(2008) find that children in neighborhoods with good access to playgrounds, parks, and
recreational facilities are less likely to be overweight or obese. Using a survey of low-income
preschoolers living in Cincinnati, Ohio, Burdette and Whitaker (2004) find that proximity to
playgrounds is not related to the prevalence of being overweight.
Economic studies investigating the causal link between neighborhood environment and
childhood obesity are sparse. Kling et al. (2007) take advantage of the Moving to
Opportunity (MTO) program to investigate the neighborhood effect on adult health. The
MTO program is a randomized housing mobility experiment in which families living in a
distressed poor neighborhood in one of five cities (Baltimore, Boston, Chicago, Los Angeles,
and New York) were randomly offered vouchers to move to private housing units in a
lower-poverty neighborhood. The authors find a significant reduction in the prevalence of
adult obesity for the treated group relative to the control group. However, the MTO
program is expensive. Kling et al. (2007) do not identify the specific neighborhood factors
contributing to the reduction in obesity, which limits the study’s practical relevance for
interventions. Sandy et al. (2009) combine data on recreational trails and violent crimes with
anthropomorphic and diagnostic data from children’s clinic visits in Indianapolis between
1996 and 2005 to study the effects of urban environment on childhood obesity. The authors
assume that any change in neighborhood amenities were exogenous to children who
remained at the same address prior to and following the change. They find that the arrival of
amenities are unrelated to children’s BMI, but physical facilities, such as fitness areas and

5
volleyball courts, lead to statistically significant weight reduction among eight-year old boys.
In a closely related paper, Sandy et al. (2013) find that the presence of a trail nearby reduces
children’s weight but that the nearby violent crime rate may undermine the trail effect. They
attribute the credibility of the trail effect to two facts: (1) the location of trails is likely to be
exogenous because trails follow river banks and abandoned railways; and (2) trails are
unlikely to be factored into the house location choice among families, as there is very limited
time between their announcement and construction. However, as the authors admit, families
may self-select into neighborhoods with different neighborhood crime levels.
Overall, the literature on childhood obesity focusing on the built environment
investigates the association rather than causality and offers conflicting results. The
documented association between childhood obesity and neighborhood amenities is not
adequate to establish a causal relationship and provide policy implications given the
possibility of self-selection (Plantinga and Bernell, 2007; Sandy et al., 2009). The built
environment may be associated with obesity through either self-selection or environmental
determinism. That is, individuals who want to be physically active may select an environment
that promotes physical activity (self-selection); or a good environment causes individuals to
become more physically active than they would be otherwise, thus reducing the risk of being
overweight or obese (environmental determinism). This article focuses on the causal
relationship between neighborhood parks/playgrounds and childhood obesity.
Methodologies
This article employs a matching estimator to identify and quantify the causal impacts of
neighborhood parks/playgrounds on childhood obesity. Matching techniques have distinct
advantages over other non-experimental evaluation techniques. First, matching does not

6
impose any specific functional form between the dependent variable and independent
variables, thus avoiding possible model misspecification errors (Rosenbaum and Rubin,
1983). The so-called LaLonde’s (1986) critiques suggest that non-experimental estimates are
sensitive to model specification and differ greatly from the experimental estimates. Second,
matching may impose a common support requirement. The poor overlap on support
between the treated and untreated groups raises questions about the robustness of
parametric methods relying on the functional form to extrapolate outside the common
support (Smith and Todd, 2005). Third, matching allows endogenous covariates (Caliendo
and Kopeinig, 2008). However, the validity of matching techniques depends on the
assumption of selection on observables. Therefore, falsification tests are necessary to show
that unobservables are not driving the matching results.
There are two major types of matching techniques: propensity score matching (PSM)
and covariate matching (CVM). This article employs CVM because it allows exact matching
on certain variables. Crucial variables such as age and race require exact matching. Age is
very important to be controlled precisely because adolescence is a period of increasing self-
control over food choices and time use (Haywood, 1991) and the period of fastest growth
after infancy. Racial background also needs to be controlled precisely because the literature
of childhood obesity has documented significant differences in BMI and the obesity
prevalence across racial groups.
The basic idea of CVM is to impute counterfactual outcomes for treated individuals
using untreated individuals with similar values of covariates.1 If the decision to take the
treatment is “random” for individuals with similar values of the pretreatment variables or
covariates, we can use the average outcome of similar individuals who were not exposed to

7
the treatment as the counterfactual outcome for each individual. Intuitively, comparing two
individuals with the same predetermined characteristics, where one is treated and the other is
not, is like comparing these two individuals in a randomized experiment. A more detailed
technical discussion of the matching techniques can be found in Appendix A online.
Data and Diagnosis Analysis
The article uses the 2007 NSCH dataset, which contains a nationally representative random
sample of households in each of the 50 states and the District of Columbia. The survey was
designed to examine the physical and emotional health of children from birth to age 17. One
child is randomly selected from each household. The 2007 NSCH collected a rich set of
demographic, health, family, school, neighborhood and community information. In
particular, three questions were asked about different types of neighborhood amenities: (a)
Does a park or playground area exist in your neighborhood? (b) Do sidewalks or walking
paths exist in your neighborhood? and (c) Does a recreation center, community center, or
boys’ or girls’ club exist in your neighborhood? We create three dummy variables for these
three neighborhood amenities. The respondents were also asked to state their perception of
neighborhood safety by answering the question, “How often do you (surveyed child) feel
safe in your community or neighborhood?” Respondents were given four choices: Never,
Sometimes, Usually, and Always. We classify a neighborhood as safe if the respondents
answered “Always” and as non-safe if the respondents answered “never” or “sometimes.” 2
The article focuses on children aged 10-17 because only 44,015 individuals aged 10-17
out of all 91,532 individuals surveyed were asked to report both weight and height from
which their BMI is calculated. BMI, the most popular measurement to determine overweight
and obesity, is a reasonable indicator of body fatness for most children and teens. To

8
determine the overweight and obese status, we calculate the z-score based on age- and
gender-specific reference percentiles for BMI. Overweight (obesity) is defined as at or above
the 85th (95th) percentiles of age- and gender-specific BMI.3
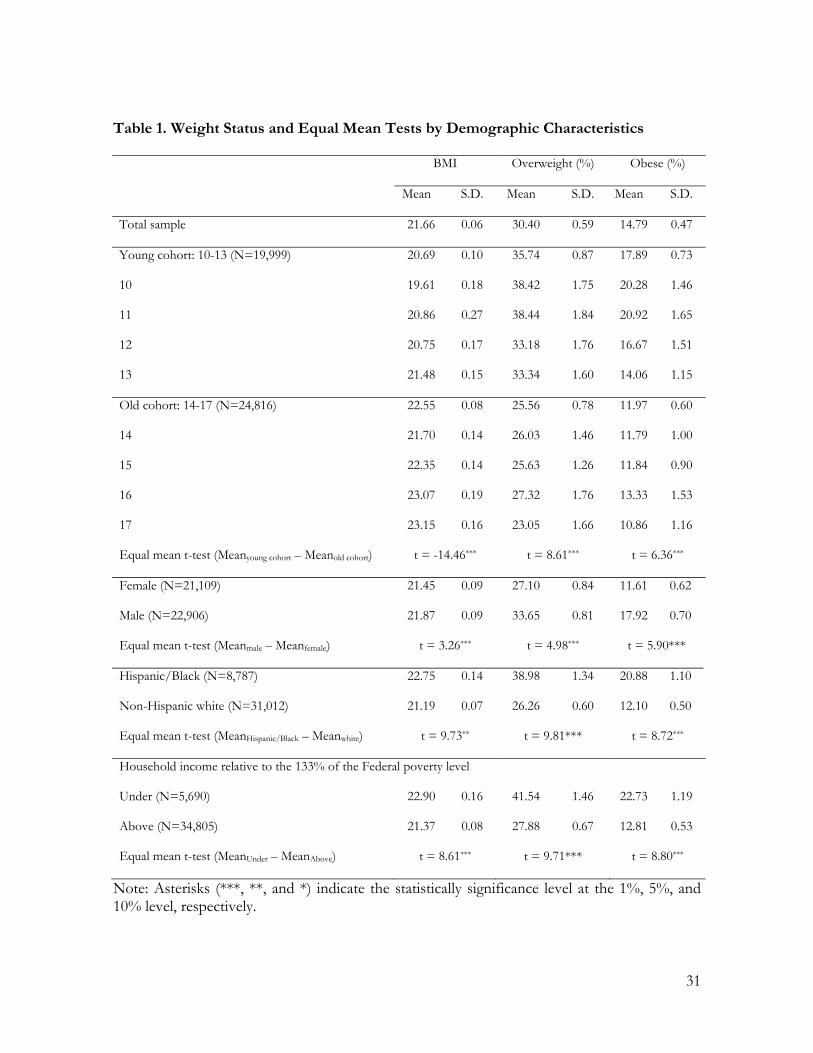
Table 1 presents the summary statistics for the three outcome variables across age
cohorts as well as by gender, race, and household income levels. 4 It shows that the
overweight and obesity rates in our sample are 35.74% and 17.89% for the pre- and early
adolescent group (19,999 individuals aged 10-13) and 25.56% and 11.97% for the adolescent
group (24,816 individuals aged 14-17). Compared with the younger cohort, the older cohort
has an increasing BMI but decreasing prevalence of overweight or obesity, which is
consistent with the literature (Flegal and Troiano, 2000). Table 1 also shows that the BMI
and the prevalence of being overweight or obese is higher among boys than girls, among
Hispanic and Black children than non-Hispanic white children, and among those living
below 133% of the federal poverty level than those living above it. The t-tests reported in
table 1 show that the weight difference by age cohort, gender, race, and income is statistically
significant at the 1% level.
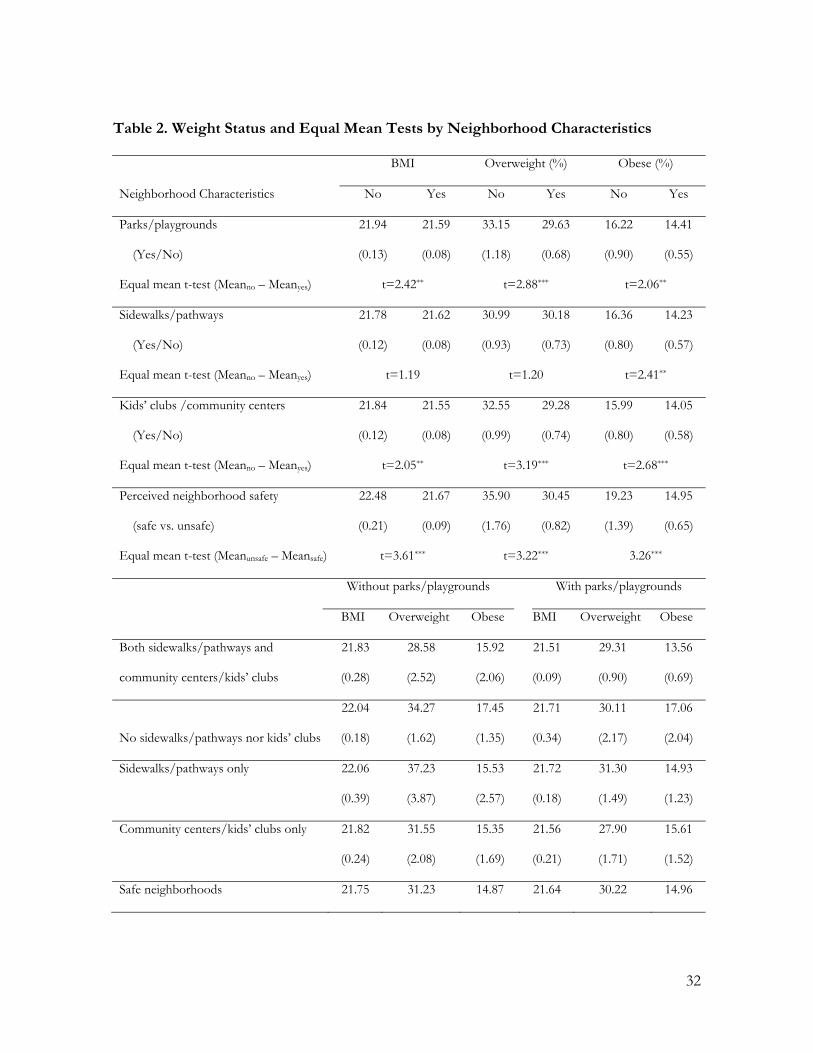
Table 2 compares the prevalence of overweight and obesity between neighborhoods
with and without different types of physical facilities. As shown in table 2, a neighborhood
with amenities such as playgrounds/parks, sidewalks/pathways, or community centers/kids’
clubs, or perceived as being safe is associated with lower BMI as well as a lower prevalence
of overweight or obesity. The differences in the weight measures between neighborhoods
with and without a particular amenity are statistically significant at the 5% level with an
exception of sidewalks/pathways. We also compare distributions of BMI between children
living in a neighborhood with and without a park/playground (see Figure D1 in Appendix D

9
online). The comparison suggests a gender-invariant pattern – children living in
neighborhoods with a park/playground have a lower probability of being overweight or
obese based on the kernel density estimates of BMI. The pattern is consistent across
subgroups.
To gauge how the park/playground effect is affected by neighborhood attributes, we
also summarize the weight measures for those living in a neighborhood with and without
parks/playgrounds conditional on other neighborhood amenities in the second part of table
2. The respondents living in a neighborhood with a park/playground, on average, have a
lower BMI and a lower risk of being overweight or obese irrespective of other neighborhood
amenities. The only exceptions are for the obesity risk in the neighborhoods where
community centers/kids’ clubs exist but no sidewalks/pathways as well as in the
neighborhoods that are perceived to be always safe, and for the overweight risk in the
neighborhoods where both community centers/kids’ clubs and sidewalks/pathways exist.
Furthermore, regardless of the existence of parks/playgrounds, neighborhoods perceived as
being safe, having community centers/kids’ clubs but no sidewalks/pathways, or having
both sidewalks/playgrounds and community centers/kids’ clubs are associated with a lower
BMI and a lower prevalence of overweight or obesity compared with their counterparts.
The summary statistics discussed above suggest that (a) both BMI and the prevalence of
overweight or obesity differ significantly by age, gender, race, household income level, and
the existence of neighborhood amenities; and (b) the impact of neighborhood
parks/playgrounds may vary by different socio-demographic groups, perceived
neighborhood safety level, and availability of other neighborhood amenities.
Matching Strategies and Main Results

10
We focus on the average treatment effects of neighborhood parks/playgrounds on the
untreated group (ATU) because understanding the potential park/playground effect on
childhood obesity in neighborhoods without this particular amenity has practical policy
implications. The average treatment effect on the untreated group can be written as follows:
(1) 1 0 | 0i i iATU E Y Y P
where Pi is the neighborhood park/playground status for individual i and Yti is the outcome
when treated (t = 1) and untreated (t = 0)
Selection of Matching Variables and Balance Tests
We match on male and female subsamples separately for the following three reasons. First,
males and females experience substantially different metabolic processes and types of body
development when they are teenagers and adolescents (Tarnopolsky, 1999). Second,
neighborhood amenities may affect males and females differently (Gomez et al., 2004;
Carver et al., 2008). Third, the data set is sufficiently large to conduct matching separately on
males (N = 22,906) and females (N = 21,109).
Implementing covariate matching requires choosing a set of matching variables. No
statistical algorithms or rules are available to choose a set of variables that satisfy the
identification condition of matching estimators. A rule of thumb is that not all relevant
variables should be matching covariates if the sample size of the treated or untreated group
is not large enough. Covariates that are not correlated or weakly correlated with outcome or
the treatment indicators may exacerbate the common support problem and result in large
variances (Imbens, 2004).
Our selection of matching covariates depends on theoretical considerations, regression
11
analyses, and data availability. First, socio-demographic information includes age and race for
both genders and whether born in the United States for males. BMI is found to be highly
age-dependent among children and adolescents (Cole, Freeman and Preece, 1995; Cole et al.,
2000). Racial background is a good way to control for certain genetic factors in a cross-
section data set. Because age and race are two extremely important BMI-determining
variables, we match age and race precisely. Second, health information includes children’s
general health status and teeth condition for both genders and whether having a depression
problem for females. Third, the physical activity-related information includes television
watching time, whether having a TV in the bedroom, and weekly exercise time for both
genders, as well as whether the respondents participate in after-school sports for females.
Fourth, parental and family information consists of mother’s education level, mother’s
health status, whether the mother was born in the United States, and family income level for
both genders, as well as the total number of children in the family for males. Parental and
household information is important. For example, the mother’s educational level and birth
place would be a proxy for the awareness of nutrition and dietary habit. We would expect
family income level and the number of children to reflect the unobserved information about
household resources and intra-household resource allocation. Fifth, perceived neighborhood
characteristics include whether having sidewalks/pathways, whether having community
centers and kids’ clubs, how often people help each other in the neighborhood, and the
perceived neighborhood safety level.
The Overall Treatment Effects of Neighborhood Parks and Playgrounds
The average treatment effects of neighborhood parks/playgrounds on weight status for the
untreated group and the corresponding standard errors are presented in panel A of table 3.

12
The results strongly suggest that neighborhood parks/playgrounds may make children more
fit as they decrease BMI as well as the risk of being overweight or obese. The impacts are
stronger on females than on males. More specifically, neighborhood parks/playgrounds may
reduce the probability of being overweight or obese by approximately three percentage
points for males and by five to six percentage points for females. To demonstrate the size of
the impact, we divide the treatment effects by the corresponding sample means of the
weight status among the untreated group and calculate the percentage change. The results
show that neighborhood parks/playgrounds may decrease BMI and the probability of being
overweight or obese by 1%, 9%, and 23% for males.5 The corresponding numbers for
females are even greater, namely 2%, 17%, and 28%. We conclude that the effects of
neighborhood parks/playgrounds are both statistically and economically significant and that
the effects are greater for females than for males.
Childhood obesity causes significant costs. The estimates of the annual direct medical
cost for children with excess weight in the United States range from $3 billion (Trasande and
Chatterjee, 2009) to $14 billion (Marder and Chang, 2006). The hospital costs alone
increased from $35 million during 1979-1981 to $127 million during 1997–1999 measured in
2001 constant U.S. dollars (Ebbeling, et al., 2002). Given the significant decrease in the
probability of being overweight or obese resulted from the addition of neighborhood
parks/playgrounds, we expect a significant cost saving. Furthermore, childhood obesity has
long-lasting negative impacts on adult health, employment, productivity and socioeconomic
status (Case, Fretig and Paxson, 2005). From this perspective, the cost saving could be more
significant in the long run.
Matching Quality and Robustness Checks of the Main Matching Results

13
To assess the quality of the estimated treatment effects, we perform the following tasks: (a)
assessing the balance of matching variables between the treated and untreated groups before
and after matching; (b) adding regional dummies to re-estimate the park/playground effect
for a robustness check; and (c) conducting falsification tests to show whether unobserved
individual and/or neighborhood characteristics are driving the main results.
A. Balancing Tests
To assess whether matching has been effective, for each matching covariate, we report the
mean differences between the treated and untreated groups before and after matching as
well as the p-values of t-statistics in table 4.6 The results show a clear lack of balance for
samples before matching: 19 (16) of 23 mean differences for males (females) are statistically
significant at the 5% level. Matching improves the balance significantly. After matching, the
number of mean differences of statistical significance reduces to 10 for both males and
females. Among these 10 covariates whose mean differences are still statistically significant, 6
(7) of them have smaller differences after matching for females (males). The balance is not
perfect after matching. First, the statistically significant mean difference continues to exist
after matching. Second, for children’s health condition, the exercise time and number of kids
in the household, and whether people help each other in the neighborhood either become
statistically significant, or the size increases after matching. The imperfect match is largely
due to the imposed precise match on gender, age, and racial background because precisely
matched variables are weighted 1,000 times more than other regular matching variables.
B. Robustness check by incorporating regional dummies as matching variables
Regional variations in food environment and climate conditions may affect the
park/playground effect. We re-estimate the main results by including regional dummies as

14
matching variables. However, adding 50 state dummies as matching variables is impractical
due to the curse of dimensionality. Instead, we construct two smaller sets of regional
dummies using different criteria. First, 50 states are divided into quintiles according to their
state prevalence of overweight and obesity among children aged 10 to 17.7 We then include
four quintile dummy variables as matching variables. Second, we divide the whole country
into 9 regions according to the definition of the U.S. Census, including New England and
Middle Atlantic in the Northeast region; East North Central and West North Central in the
Midwest region; South Atlantic, East South Central, and West South Central in the South
region; and Mountain and Pacific in the West region.8 Using the Pacific census division as a
base, we include the dummy variables for the other eight census divisions to capture the
regional effect. The results using both sets of regional dummies are shown in Appendix B
online. It is clear that the estimated treatment effects are qualitatively similar to the main
results when regional dummies are not included.
Since we want to use the same set of matching variables when we further explore how
individual characteristics and neighborhood attributes affect the park/playground effect on
obesity, including these regional dummies will make it harder to find a good match between
the treated and untreated groups given the further division of the sample by individual
characteristics and neighborhood attributes. Thus, we do not include these regional dummies
for the main results, but provide the results of incorporating the regional dummies as a
robustness check instead.
C. Falsification Tests
The validity of the main results relies on the assumption of selection on observables.
Although covariate matching has been effective in finding similar counterparts in the treated

15
group for each untreated individual and isolating the effect of neighborhood
parks/playgrounds on obesity, it remains possible that some unobserved differences
between children living in neighborhoods with and without parks/playgrounds may cause
bias in the estimated treatment effects. To provide evidence that unobserved individual
characteristics and neighborhood attributes are not the major driving factors of the main
results, we conduct two types of falsification tests.
First, individuals living in neighborhoods with parks/playgrounds may be more health
conscious, potentially leading the park/playground effect to be confounded. In addition,
unobserved neighborhood characteristics (e.g., local supply of medical services) may have
health impacts on children’s health status (e.g., weight status) and consequently result in bias.
To test this possibility, we replace the weight measure with a different health indicator,
asthma, as the dependent variable. The asthma variable is coded as one if the respondents
were diagnosed by a doctor or other health professionals as having asthma and zero
otherwise. If the park/playground effect is not confounded by other unobservables affecting
health, we should not expect neighborhood parks/playgrounds to have a significant impact
on the asthma risk. As shown in panel B of table 3, neighborhood parks/playgrounds have
no statistically and economically significant effect on the asthma risk for the untreated group.
The result suggests that it is unlikely that some unobserved factors affecting health are
driving our main results.
Second, we choose a subgroup of children from the treated group who are similar to the
untreated children as a fictitious untreated group. The fictitious untreated children differ
from the actual untreated children as the former ones actually live in a neighborhood with
parks/playgrounds. We re-estimate the treatment effect of parks/playgrounds on the
16
fictitious untreated group (see panel C of table 3). If unobserved confounding factors
affecting children’s behavior such as physical activity are driving the results, we should also
find significant treatment effects on the fictitious treated group because the fictitious
untreated respondents are similar to the actual untreated respondents other than the
availability of parks/playgrounds. 9 If there is no confounding factor influencing the
park/playground effect on obesity, the estimated park/playground effect for the fictitious
untreated group should not be negative and statistically significant.
To construct the fictitious untreated group, we estimate a probit model using the full
sample.10 We then only keep the actually treated group (respondents reporting to have a
park/playground in their neighborhoods) and predict the probability of having a
neighborhood park/playground for every individual using the estimated probit model. We
assign the respondents whose predicted probability of having a neighborhood
park/playground is less than half into the fictitious untreated group and the rest into the new
treated group. To assess whether the fictitious untreated group successfully mimics the
actual untreated group, we compare a large set of characteristics including children’s socio-
demographic variables, school types, health conditions, and physical activity-related
information of children; parental and household information; and neighborhood situations
between two groups (see details in Appendix C online). Out of 52 characteristics compared,
only 5 (7) out of these 52 characteristics show a significant difference at the 5% level
between the two groups for males (females). This finding indicates that the actual and
fictitious untreated groups are statistically similar based on the observables. We then re-
estimate the park/playground effect on obesity for the fictitious untreated group with the
full set of matching variables used for the main results.

17
As shown in panel C of table 3, none of the estimated park/playground effects for the
fictitious untreated group is negative and significant. The evidence that neighborhood
parks/playgrounds do not cause the fictitious untreated group to have a lower BMI or a
lower probability of being overweight or obese provides support that the unobservables are
not likely to be the driving factors of the park/playground effect.
Park/playground Effects by Neighborhood Attributes or Individual Characteristics
We investigate whether the park/playground effect on obesity depends on individual
characteristics or neighborhood attributes. 11 More specifically, we examine how the
park/playground effect varies by the existence of other neighborhood amenities and
perceived neighborhood safety as well as by household income level, age, and race.
DOES THE PARK/PLAYGROUND EFFECT DEPEND ON OTHER NEIGHBORHOOD AMENITIES?
We expect that the effects of a park/playground on the child’s weight status depend on the
other amenities in the same neighborhood because different amenities could be substitutes
or complements for a park/playground to children for outdoor physical activity. The 2007
NSCH data allow us to examine how sidewalks/pathways as well as community
centers/kids’ clubs in the neighborhood influence the park/playground effect. To achieve
this goal, we estimate ATU based on four subsamples with different combinations of these
two neighborhood amenities. Consequently, the following treatment effects are estimated:
(2)
1 1 0
2 1 0
3 1 0
4 1 0
: | 0, 1
: | 0, 0
: | 0, 1
: | 0, 0
i i i i
i i i i
i i i i
i i i i
E Y Y P SPE Y Y P SP
ATUE Y Y P RPE Y Y P RP
where Si is the status of neighborhood sidewalks/pathways and Ri is the neighborhood
community center/kids club for individual i. P1 (P2) represents the treatment effect of

18
parks/playgrounds on the weight status when sidewalks/pathways are (not) available in the
same neighborhood. Similarly, P3 (P4) represents the treatment effect of parks/playgrounds
when community centers/kids’ clubs are (not) available in the same neighborhood. The
comparisons between P1 and P2, as well as between P3 and P4, allow us to investigate whether
other neighborhood amenities enhance or attenuate the impacts of neighborhood
parks/playgrounds.
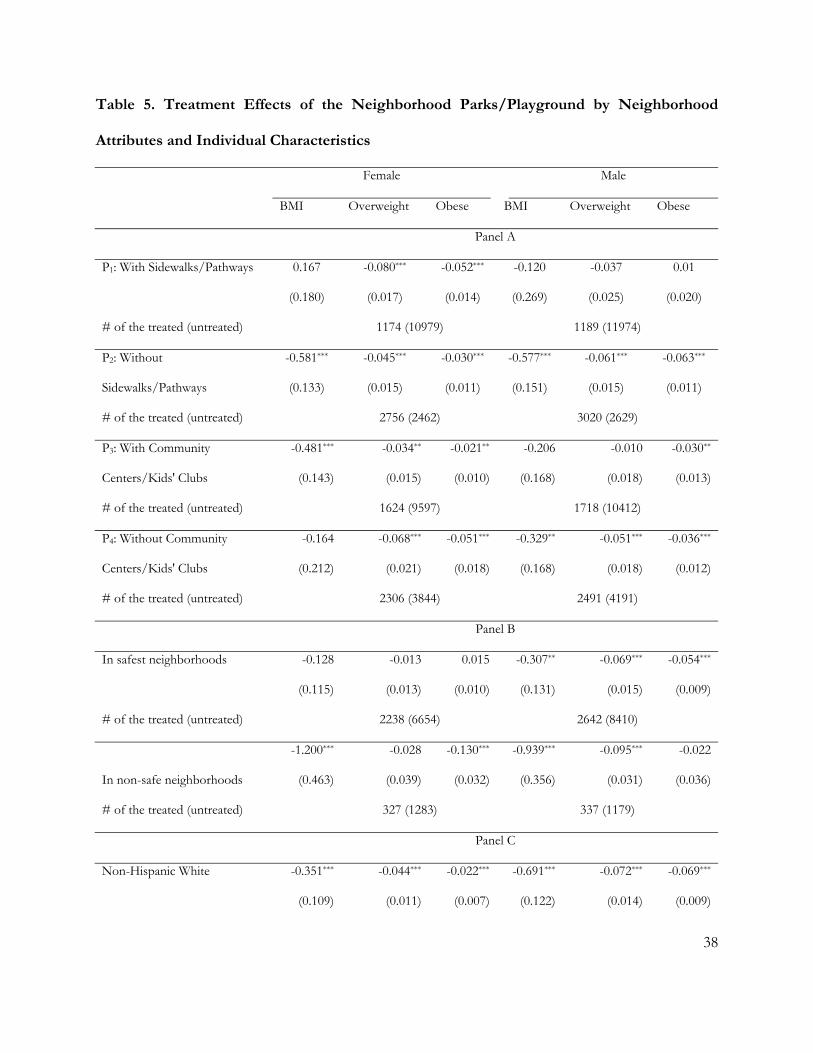
The results presented in Panel A of table 5 clearly show that the presence of other
amenities affects the neighborhood park/playground effect. In the case of neighborhood
sidewalks/pathways, for boys the treatment effects are statistically insignificant when a
park/playground coexists with sidewalks/pathways but become statistically significant and
greater in magnitude when sidewalks/pathways do not coexist with parks/playgrounds (P1
vs. P2 for males). This finding indicates that sidewalks/pathways are likely to be substitutes
for neighborhood parks/playgrounds. The situation differs for girls. More specifically, the
reduction in the overweight or obesity risk is approximately doubled when a
park/playground coexists with sidewalks/pathways (P1 vs. P2 for females). However, for girls
the results for BMI are not consistent with those for overweight or obesity risk. That is, an
absence of neighborhood sidewalks/pathways is associated with a statistically significant and
stronger park/playground effect, but the park/playground effect is not statistically significant
otherwise. The above results may suggest that parks/playgrounds and sidewalks/pathways
are more likely to be complements than substitutes for girls. The comparison between P3
and P4 shows that the community centers and/or kids’ clubs attenuate the effect of
neighborhood parks/playgrounds for both girls and boys. This finding suggests that
neighborhood parks/playgrounds and community centers are likely to be substitutes.
19
DOES THE PERCEIVED NEIGHBORHOOD SAFETY AFFECT THE PARK/PLAYGROUND EFFECT?
Neighborhood safety may play an important role in the use of neighborhood amenities and
affect obesity prevalence. First, concerns about neighborhood safety might decrease
residents’ willingness to engage in outdoor physical activity, encourage sedentary activity
and/or curb active commuting (e.g., bicycling, walking). In the case of modes of active
commuting between school and home, approximately half of schoolchildren in the United
States walked or bicycled to or from school in 1969 (USFHA, 1972), but fewer than 15% of
schoolchildren used active modes of transportation in 2002 (USEPA, 2003). Second, the
increased time spent on sedentary activity such as television watching and video game
playing may also increase snacking and inappropriate food choices due to television
advertising (Speiser, et al., 2005). Finally, residing in an unsafe neighborhood may also
increase stress and lead to overweight (Björntorp, 2001, Roemmich, et al., 2007), especially
when exposed to neighborhood violence (Kliewer, 2006). The increased sedentary activity,
the choice of inactive commute modes, and the decreased physical activity all contribute to
overweight and obesity (Must and Tybor, 2005, USDHHS, 2001).
A majority of previous studies measure neighborhood safety by parental or children's
subjective assessments. Some studies find a statistical relationship between neighborhood
safety and the level of physical activity and/or childhood obesity among girls but not boys
(Gomez, et al., 2004), among adolescents but not preschoolers (Burdette and Whitaker,
2005, Burdette and Whitaker, 2004), or in some ethnic groups but not the entire study
population (Duncan, et al., 2009). Romero, et al. (2001) find that fourth graders in eight
northern California elementary schools reported engaging in a lower level of physical activity
20
when they perceive neighborhood hazards. Duncan, et al. (2009) find that the parental
perception of their neighborhood’s safety is associated with a low obesity rate. The
inconsistent results may be partly due to the complexity of neighborhood safety measures.
Neighborhood safety is a complex concept including, but not limited to, diverse components
such as traffic safety (Alton et al., 2007), personal injury, bullying, harm from strangers
(Alton et al., 2007; Timperio et al., 2004), and threats of interpersonal violence (Carver,
Timperio and Crawford, 2008). It is not easy for the respondent to assess the safety level of
their neighborhood given the complexity of this concept.
We re-estimate the treatment effect for the untreated group on safe and unsafe
subsamples. The safe subsample includes those who report believing that their
neighborhood is “always” safe (55.25% of a total of 44,015 observations). The unsafe
subsample includes those who report perceiving their neighborhoods as “never” or
“sometimes” being safe (9.28% of a total of 44,015 observations).
Estimates are presented in panel B of table 5. Results show that providing a
park/playground may lead to a greater reduction in BMI and the probability of being
overweight or obese for both boys and girls in an unsafe neighborhood relative to a safe
neighborhood. The only exception is for the risk of obesity among boys. Furthermore, the
differences in the park/playground effect between safe and unsafe neighborhoods are more
significant for females than males. Therefore, adding a neighborhood park/playground to an
unsafe neighborhood may be more effective in helping children stay fit than to a safe
neighborhood. The reason for this finding may be that neighborhood parks/playgrounds are
important locations for children in unsafe neighborhoods to play safely, but children in a

21
safer neighborhood may have other outlets for indoor/outdoor physical activity. For
example, over 70% of neighborhoods with parks/playgrounds also have community
centers/kids’ clubs, whereas less than 40% of neighborhoods without parks/playground
have the same facilities. Therefore, the addition of a park/playground provides an
opportunity for children to play in a relatively safer place in an unsafe neighborhood, thus
encouraging more outdoor physical activity and leading to better weight outcomes.
DOES THE PARK/PLAYGROUND EFFECT DIFFER BY RACIAL AND ETHNIC GROUPS?
There are significant racial and ethnic disparities in obesity prevalence among U.S. children
and adolescents (USCDC, 2010). According to the NHANES 2007-2008, among adolescents
aged 12-19, Mexican-American boys have the highest prevalence of obesity (28.6%),
followed by non-Hispanic black boys (19.8%) and non-Hispanic white boys (16.7%). In
addition, non-Hispanic black girls have the highest prevalence of obesity (29.8%), followed
by Mexican-American girls (17.4%) and non-Hispanic white girls (14.5%). The 2007 NSCH
also provides evidence for racial and ethnic disparities in obesity prevalence. As shown in
table 1, the prevalence of obesity among Hispanic and black children aged 10-17 is 21.66%, a
rate double that for non-Hispanic white children (11.40%). And the prevalence of
overweight for non-Hispanic white children is only 2/3 of that for Hispanic and black
children (39.72% vs. 25.75%). Furthermore, the NHANES data for 1988-1994 and 2007-
2008 suggest that the racial and ethnic disparities in the prevalence of obesity widened in
2007-2008 (USCDC, 2010). The prevalence of obesity increased by 79% among non-
Hispanic girls and 63% among non-Hispanic white girls. During the same periods, the
growth rate of the prevalence of obesity doubled among Mexican-American and non-
Hispanic black boys (85-90%) compared to non-Hispanic white boys (44%). Based on these

22
statistics, policy interventions targeting Hispanic and black populations are more urgent than
other racial groups in combating the childhood obesity epidemic.
We re-estimate the treatment effects on the black and Hispanic subsample and non-
Hispanic white subsample and present the results in panel C of table 5. The
park/playground effects are negative and statistically significant in all weight measures for
non-Hispanic white children. The magnitude of the impact on boys is approximately two to
three times larger than that on girls. However, the treatment effects for Hispanic and black
children are not as large and significant as that for non-Hispanic white children. The results
show that a neighborhood park/playground may reduce the obesity risk among girls and
increase the BMI of boys without making them more overweight or obese. Although the
results show that the policy intervention targeting non-Hispanic white children is expected
to be more effective, we cannot ignore the significance of helping minority children, given
that Hispanic and Black children have much higher obesity rates than non-Hispanic white
children.
DOES FAMILY INCOME LEVEL AFFECT THE PARK/PLAYGROUND EFFECTS?
The causal effects of neighborhood amenities are likely to be different for children with
different household income levels. The 2007 NSCH collected household income
information in terms of categories outlined by different federal poverty levels. We divide the
2007 NSCH sample into two subsamples, below and above 133% of the federal poverty
level, which is frequently used as a threshold for income eligibility for receiving food and
nutrition subsidies through the National School Lunch Program, the School Breakfast
Program, and the Supplemental Nutrition Assistance Program. As shown in table 1,
compared with those with household income above 133% of the federal poverty level,

23
respondents with household income level below 133% of the federal poverty level have a
slightly higher BMI (22.86 vs. 21.29) but much higher overweight and obesity rates (42.32%
vs. 26.94% and 24.18% vs. 12.05%).
The matching results of two subgroups are presented in panel D of table 5. We find that
the treatment effect on obesity among those with household income below 133% of the
federal poverty level is more than double than that among those with household income
above 133% of the federal poverty level. This finding, together with the fact that the
prevalence of overweight and obesity is documented to be significantly greater among the
low-income population, provides support for intervention targeting those with low
socioeconomic status.
ARE THE PARK/PLAYGROUND EFFECTS AGE-SPECIFIC?
Due to different metabolic processes and patterns of physical activity among children at
different ages, neighborhood parks/playgrounds may affect different age groups differently.
Estimating the treatment effect for each age year separately may be problematic because
matching requires a large number of observations to obtain a good match, and the sample
size of each age year subgroups is too small. Therefore, we divide the sample into two
subgroups, the pre- and early adolescents aged 10-13 and adolescents aged 14-17, and re-
estimate the treatment effects.
Estimates are presented in panel E of table 5. The results show that the treatment
effects are stronger, and more statistically significant among the younger cohort aged 10-13
than the cohort aged 14-17 and that the effects are larger among females than males in the
younger cohort. Among the older cohort aged 14-17, we find that the treatment effects on
overweight and obesity are both negative and significant for females and that only the

24
treatment on overweight is negative and significant for males. In conclusion, a neighborhood
park/playground may be more beneficial to younger children, especially young girls.
Conclusions and Policy Implications
Stopping and reversing the childhood obesity epidemic requires promoting active lifestyle
and increasing energy expenditure. Improving neighborhood physical facilities such as parks
and playgrounds provides incentives for outdoor activity. However, it is necessary to build
evidence on how to intervene. This article estimates the causal effect of neighborhood
parks/playgrounds on childhood obesity; it also investigates how the causal effect is
attenuated or enhanced by other neighborhood attributes and whether the magnitude of the
effect depends on individual demographic and economic factors.
The results suggest that adding a park/playground to a neighborhood may reduce the
obesity rate and make children more fit. The reduction in BMI as well as the probability of
being overweight or obese is both statistically and economically significant. We also find the
following: (1) the causal impact is gender-dependent – on average, the impact is greater
among girls than boys; (2) the impact is age-specific – on average, the treatment effect is
greater among the younger cohort aged 10-13 compared with those aged 14-17 for both
gender groups; (3) the impact is race-specific – non-Hispanic white youth benefit from
neighborhood parks and playgrounds much more than blacks and Hispanics; (4) the effect is
greater among children in unsafe neighborhoods than among those living in safe
neighborhoods; (5) the impact depends on the household income level – children living
above 133% of the federal poverty level are more likely to benefit from neighborhood
parks/playgrounds, but the magnitude of the effect is greater among those living below the
133% of the federal poverty level if it is statistically significant; and (6) the impact depends

25
on other neighborhood amenities – the existence of community centers/kids’ clubs
attenuates the effect of parks/playground among both boys and girls, but
sidewalks/pathways enhance (attenuate) the effect among boys (girls).
Policy interventions improving a neighborhood’s build environment such as adding a
park/playground are likely to be effective based on the findings of this article. Furthermore,
interventions must consider the socioeconomic status of the targeted children as well as
other neighborhood amenities.
Inspired by the park/playground effect found in this article, we envision future research
documenting and analyzing the level and frequency of physical activity conditional on the
current condition of neighborhood amenities as well as potential increases in physical activity
if neighborhood amenities are provided. Such analyses require measures of actual physical
activity in neighborhood physical facilities and at home and school to control for
confoundness. Unfortunately, such information is not available in the NSCH data. We leave
this research question on how to promote an active lifestyle for future research pending on
available data and/or funding for field experiments.
References
Abadie, A., and G.W. Imbens. 2011. "Bias-corrected Matching Estimators for Average
Treatment Effects." Journal of Business and Economic Statistics 29(1):1-11.
Alton, D., P. Adab, L. Roberts, and T. Barrett. 2007. "Relationship between Walking Levels
and Perceptions of the Local Neighborhood Environment." British Medical Journal
92(1):29-33.

26
Björntorp, P. 2001. "Do Stress Reactions Cause Abdominal Obesity and Comorbidities?"
Obesity Reviews 2(2):73-86.
Burdette, H., and R. Whitaker. 2004. "Neighborhood Playgrounds, Fast Food Restaurants,
and Crime: Relationships to Overweight in Low-income Preschool Children."
Preventive Medicine 38(1):57-63.
Burdette, H., and R. Whitaker. 2005. "A National Study of Neighborhood Safety, Outdoor
Play, Television Viewing, and Obesity in Preschool Children." Pediatrics 116(3):657-
662.
Caballero, B. 2007. "The Global Epidemic of Obesity: An Overview." Epidemiologic Reviews
29(1):1.
Caliendo, M., and S. Kopeinig. 2008. "Some Practical Guidance for the Implementation of
Propensity Score Matchings." Journal of Economic Surveys 22(1):31-72.
Carver, A., A. Timperio, and D. Crawford. 2008. "Playing It Safe: The Influence of
Neighbourhood Safety on Children's Physical Activity--A Review." Health & Place
14(2):217-227.
Case, A., A. Fertig, and C. Paxson. 2005. "The Lasting Impact of Childhood Health and
Circumstance." Journal of Health Economics 24(2):365-389.
Cole, T., J. Freeman, and M. Preece. 1995. "Body Mass Index Reference Curves for the UK,
1990." Archives of Disease in Childhood 73(1):25-29.
Cole, T.J., M.C. Bellizzi, K.M. Flegal, and W.H. Dietz. 2000. "Establishing a Standard
Definition for Child Overweight and Obesity Worldwide: International Survey." BMJ
320(7244):1240.
Dehghan, M., N. Akhtar-Danesh, and A. Merchant. 2005. "Childhood Obesity, Prevalence
and Prevention." Nutrition Journal 4(1):24.

27
Duncan, D., R. Johnson, B. Molnar, and D. Azrael. 2009. "Association between
Neighborhood Safety and Overweight Status among Urban Adolescents." BMC
Public Health 9(1):289.
Ebbeling, C.B., D.B. Pawlak, and D.S. Ludwig. 2002. "Childhood Obesity: Public-health
Crisis, Common Sense Cure." The Lancet 360(9331):473-482.
Flegal, K.M., and R.P. Troiano. 2000. "Changes in the Distribution of Body Mass Index of
Adults and Children in the US Population." International Journal of Obesity 24:807-818.
Gomez, J., B. Johnson, M. Selva, and J. Sallis. 2004. "Violent Crime and Outdoor Physical
Activity among Inner-city Youth." Preventive Medicine 39(5):876-881.
Gordon-Larsen, P., M.C. Nelson, P. Page, and B.M. Popkin. 2006. "Inequality in the Built
Environment Underlies Key Health Disparities in Physical Activity and Obesity."
Pediatrics 117(2):417-424.
Haywood KM. 1991. "The Role of Physical Education in the Development of Active
Lifestyles. " Research Quarterly for Exercise and Sport 62:151-156.
Imbens, G.W. 2004. "Nonparametric Estimation of Average Treatment Effects Under
Exogeneity: A Review." Review of Economics and Statistics 86(1):4-29.
Kliewer, W. 2006. "Violence Exposure and Cortisol Responses in Urban Youth." International
Journal of Behavioral Medicine 13(2):109-120.
Kling, J.R., J.B. Liebman, and L.F. Katz. 2007. "Experimental Analysis of Neighborhood
Effects." Econometrica 75(1):83-119.
Koplan, J., C. Liverman, and V. Kraak. 2005. Preventing Childhood Obesity: Health in the Balance:
Institute of Medicine of the National Academy Press.
Lakdawalla, D., and T. Philipson. 2002. "The Growth of Obesity and Technological Change:
A Theoretical and Empirical Examination." NBER Working Paper No. 8946.

28
LaLonde, R.J. 1986. "Evaluating the Econometric Evaluations of Training Programs with
Experimental Data." The American Economic Review 76(4):604-620.
Marder, W., and S. Chang. 2006 "Childhood Obesity: Costs, Treatment Patterns, Disparities
in Care, and Prevalent Medical Conditions." Stamford, CT: Thomson Medstat
Research Brief.
McInnes, M.M., and J.A. Shinogle. 2009. "Physical Activity: Economic and Policy Factors."
NBER Working Paper No. 15039.
Must, and R. Strauss. 1999. "Risks and Consequences of Childhood and Adolescent
Obesity." International Journal of Obesity. Supplement 23(2):2-11.
Must, A., and D. Tybor. 2005. "Physical Activity and Sedentary Behavior: a Review of
Longitudinal Studies of Weight and Adiposity in Youth." International Journal of Obesity
29:S84-S96.
Norman, G., S. Nutter, S. Ryan, J. Sallis, K. Calfas, and K. Patrick. 2006. "Community
Design and Access to Recreational Facilities as Correlates of Adolescent Physical
Activity and Body-mass Index." Journal of Physical Activity & Health 3:S118-S128.
NYRBS. 2009. "2009 National Youth Risk Behavior Survey Overview." Available at
http://www.cashe.org/wp-content/uploads/2011/01/yrbs.sum_.2009.pdf.
Papas, M., A. Alberg, R. Ewing, K. Helzlsouer, T. Gary, and A. Klassen. 2007. "The Built
Environment and Obesity." Epidemiologic Reviews 29(1):129-143.
Plantinga, A., and S. Bernell. 2007. "The Association between Urban Sprawl and Obesity: is
it a Two Way Street?" Journal of Regional Science 47(5):857-879.
Reilly, J., E. Methven, Z. McDowell, B. Hacking, D. Alexander, L. Stewart, and C. Kelnar.
2003. "Health Consequences of Obesity." Archives of Disease in Childhood 88(9):748-
752.

29
Romero, A., T. Robinson, H. Kraemer, S. Erickson, K. Haydel, F. Mendoza, and J. Killen.
2001. "Are Perceived Neighborhood Hazards a Barrier to Physical Activity in
Children?" Archives of Pediatrics and Adolescent Medicine 155(10):1143-1148.
Roemmich, J., L. Epstein, S. Raja, L. Yin, J. Robinson, and D. Winiewicz. 2006. "Association
of Access to Parks and Recreational Facilities with the Physical Activity of Young
Children." Preventive Medicine 43(6):437-441.
Roemmich, J., J. Smith, L. Epstein, and M. Lambiase. 2007. "Stress Reactivity and Adiposity
of Youth." Obesity 15(9):2303-2310.
Rosenbaum, P.R., and D.B. Rubin. 1983. "The Central Role of the Propensity Score in
Observational Studies for Causal Effects." Biometrika 70(1):41-55.
Sandy, R., G. Liu, J.R. Ottensmann, R. Tchernis, J. Wilson, and O. Ford. 2009. "Studying the
Child Obesity Epidemic with Natural Experiments." NBER working paper w14989.
Sandy, R., R. Tchernis, J. Wilson, J. Ottensmann, G. Liu, and X. Zhou. 2013. "Effects of the
Built Environment on Childhood Obesity: The Case of Urban Recreation Trails and
Crime." Economics & Human Biology, 11 (1): 18-29
Smith, J., and P. Todd. 2005. "Does Matching Overcome LaLonde's Critique of
Nonexperimental Estimators?" Journal of Econometrics 125(1-2):305-353.
Speiser, P., M. Rudolf, H. Anhalt, C. Camacho-Hubner, F. Chiarelli, A. Eliakim, M.
Freemark, A. Gruters, E. Hershkovitz, and L. Iughetti. 2005. "Childhood Obesity."
Journal of Clinical Endocrinology & Metabolism 90(3):1871-1887.
Tarnopolsky, M. 1999. Gender Differences in Metabolism: Practical and Nutritional Implications: CRC
Press.
Timperio, A., J. Salmon, A. Telford, and D. Crawford. 2004. "Perceptions of Local
Neighbourhood Environments and Their Relationship to Childhood Overweight
and Obesity." International Journal of Obesity 29(2):170-175.

30
Trasande, L., and S. Chatterjee. 2009. "Corrigendum: The Impact of Obesity on Health
Service Utilization and Costs in Childhood." Obesity 17(7): 1473.
U.S. Centers for Disease Control and Prevention (USCDC). 2010. "Prevalence of Obesity
among Children and Adolescents: United States, Trends 1963-1965 Through 2007-
2008." Available at
http://www.cdc.gov/nchs/data/hestat/obesity_child_07_08/obesity_child_07_08.pdf.
U.S. Department of Health and Human Services (USDHHS). 2001. The Surgeon General’s Call
to Action to Prevent and Decrease Overweight and Obesity. Available at
http://www.surgeongeneral.gov/library/calls/obesity/CalltoAction.pdf.pdf.
U.S. Environmental Protection Agency (USEPA). 2003. "Travel and Environmental
Implication of School Sitting." Available at
http://www.epa.gov/smartgrowth/pdf/school_travel.pdf.
U.S. Federal Highway Adminstration (USFHA). 1972. Nationwide Personal Tranportation Study:
Tranporation Characteristics of School Chidlren. Available at
http://www.fhwa.dot.gov/ohim/1969/q.pdf.
Veugelers, P., F. Sithole, S. Zhang, and N. Muhajarine. 2008. "Neighborhood Characteristics
in Relation to Diet, Physical Activity and Overweight of Canadian Children."
International Journal of Pediatric Obesity 3(3):152-159.
Yancey, A.K., J.E. Fielding, G.R. Flores, J.F. Sallis, W.J. McCarthy, and L. Breslow. 2007.
"Creating a Robust Public Health Infrastructure for Physical Activity Promotion."
American Journal of Preventive Medicine 32(1):68-78.
31
Table 1. Weight Status and Equal Mean Tests by Demographic Characteristics
BMI Overweight (%) Obese (%)
Mean S.D. Mean S.D. Mean S.D.
Total sample 21.66 0.06 30.40 0.59 14.79 0.47
Young cohort: 10-13 (N=19,999) 20.69 0.10 35.74 0.87 17.89 0.73
10 19.61 0.18 38.42 1.75 20.28 1.46
11 20.86 0.27 38.44 1.84 20.92 1.65
12 20.75 0.17 33.18 1.76 16.67 1.51
13 21.48 0.15 33.34 1.60 14.06 1.15
Old cohort: 14-17 (N=24,816) 22.55 0.08 25.56 0.78 11.97 0.60
14 21.70 0.14 26.03 1.46 11.79 1.00
15 22.35 0.14 25.63 1.26 11.84 0.90
16 23.07 0.19 27.32 1.76 13.33 1.53
17 23.15 0.16 23.05 1.66 10.86 1.16
Equal mean t-test (Meanyoung cohort – Meanold cohort) t = -14.46*** t = 8.61*** t = 6.36***
Female (N=21,109) 21.45 0.09 27.10 0.84 11.61 0.62
Male (N=22,906) 21.87 0.09 33.65 0.81 17.92 0.70
Equal mean t-test (Meanmale – Meanfemale) t = 3.26*** t = 4.98*** t = 5.90***
Hispanic/Black (N=8,787) 22.75 0.14 38.98 1.34 20.88 1.10
Non-Hispanic white (N=31,012) 21.19 0.07 26.26 0.60 12.10 0.50
Equal mean t-test (MeanHispanic/Black – Meanwhite) t = 9.73** t = 9.81*** t = 8.72***
Household income relative to the 133% of the Federal poverty level
Under (N=5,690) 22.90 0.16 41.54 1.46 22.73 1.19
Above (N=34,805) 21.37 0.08 27.88 0.67 12.81 0.53
Equal mean t-test (MeanUnder – MeanAbove) t = 8.61*** t = 9.71*** t = 8.80***
Note: Asterisks (***, **, and *) indicate the statistically significance level at the 1%, 5%, and 10% level, respectively.
32
Table 2. Weight Status and Equal Mean Tests by Neighborhood Characteristics
Neighborhood Characteristics
BMI Overweight (%) Obese (%)
No Yes No Yes No Yes
Parks/playgrounds
(Yes/No)
21.94 21.59 33.15 29.63 16.22 14.41
(0.13) (0.08) (1.18) (0.68) (0.90) (0.55)
Equal mean t-test (Meanno – Meanyes) t=2.42** t=2.88*** t=2.06**
Sidewalks/pathways
(Yes/No)
21.78 21.62 30.99 30.18 16.36 14.23
(0.12) (0.08) (0.93) (0.73) (0.80) (0.57)
Equal mean t-test (Meanno – Meanyes) t=1.19 t=1.20 t=2.41**
Kids’ clubs /community centers
(Yes/No)
21.84 21.55 32.55 29.28 15.99 14.05
(0.12) (0.08) (0.99) (0.74) (0.80) (0.58)
Equal mean t-test (Meanno – Meanyes) t=2.05** t=3.19*** t=2.68***
Perceived neighborhood safety 22.48 21.67 35.90 30.45 19.23 14.95
(safe vs. unsafe) (0.21) (0.09) (1.76) (0.82) (1.39) (0.65)
Equal mean t-test (Meanunsafe – Meansafe) t=3.61*** t=3.22*** 3.26***
Without parks/playgrounds With parks/playgrounds
BMI Overweight Obese BMI Overweight Obese
Both sidewalks/pathways and
community centers/kids’ clubs
21.83
(0.28)
28.58
(2.52)
15.92
(2.06)
21.51
(0.09)
29.31
(0.90)
13.56
(0.69)
No sidewalks/pathways nor kids’ clubs
22.04
(0.18)
34.27
(1.62)
17.45
(1.35)
21.71
(0.34)
30.11
(2.17)
17.06
(2.04)
Sidewalks/pathways only
22.06
(0.39)
37.23
(3.87)
15.53
(2.57)
21.72
(0.18)
31.30
(1.49)
14.93
(1.23)
Community centers/kids’ clubs only 21.82
(0.24)
31.55
(2.08)
15.35
(1.69)
21.56
(0.21)
27.90
(1.71)
15.61
(1.52)
Safe neighborhoods 21.75 31.23 14.87 21.64 30.22 14.96

33
(0.14) (1.42) (0.97) (0.11) (0.98) (0.80)
Unsafe neighborhoods
23.60
(0.63)
43.63
(4.02)
28.99
(3.97)
22.20
(0.20)
33.88
(1.93)
16.80
(1.36)
Note: Asterisks (***, **, and *) indicate the statistically significance level at the 1%, 5%, and 10% level, respectively.

34
Table 3. Main Treatment Effects of the Neighborhood Parks/Playground on Childhood
Obesity and Falsification Tests
Female Male
BMI Overweight Obese BMI Overweight Obese
Panel A: Main Results a
Treatment effects -0.466*** -0.064*** -0.055*** -0.268** -0.027** -0.031***
(0.117) (0.011) (0.008) (0.126) (0.013) (0.010)
# of the treated (untreated)b 3930 (13441) 4209 (14603)
Panel B: Falsification Test 1 a
Asthma as dependent variable -0.002 -0.015
(0.007) (0.010)
Panel C: Falsification Test 2 a
Fictitious treated group 0.931*** 0.028 0.015 0.372 0.024 0
(0.202) (0.024) (0.018) -0.345 -0.029 -0.017
Note: Asterisks (***, **, and *) indicate the 1%, 5%, and 10% statistical significance level, respectively.
The NNM uses one neighbor in the untreated group. Numbers in the parenthesis are standard
deviation of the estimated treatment effects.
a The results are based on the one-neighbor match.
b The number of treated and untreated children is the same for all three outcome variables.

35
Table 4. Balancing Tests of Matching Covariates
Females Males
Differencea p Differencea p
Social-demographic information of children
Age (year) Unmatched 0.12*** 0.00 0.04 0.29
Matched 0.00 1.00 0.00 1.00
Non-Hispanic White (yes/no) Unmatched 0.05*** 0.00 0.06*** 0.00
Matched 0.00 1.00 0.00 1.00
Hispanic (yes/no) Unmatched -0.03*** 0.00 -0.02*** 0.00
Matched 0.00 1.00 0.00 1.00
Black (yes/no) Unmatched -0.01* 0.04 -0.02*** 0.00
Matched 0.00 1.00 0.00 1.00
Other race (yes/no) Unmatched 0.00 0.40 -0.01*** 0.00
Matched 0.00 1.00 0.00 1.00
Child born in the U.S.A. (yes/no) Unmatched NA NA 0.01*** 0.00
Matched NA NA 0.00 0.88
Children’s health information
Health condition of the child Unmatched 0.05*** 0.00 0.02 0.17
(from 1=excellent to 5=poor) Matched 0.10*** 0.00 0.08*** 0.00
Teeth (1=good; 0=bad) Unmatched -0.01 0.12 -0.01*** 0.00
Matched -0.01 0.12 -0.01 0.30
Child having a depression problem Unmatched 0.00 0.81 NA NA
(yes/no) Matched 0.00 0.46 NA NA
Physical activity related information of children
Television watch time (minute) Unmatched 5.31*** 0.00 1.93 0.29
Matched 9.95*** 0.00 9.44*** 0.00
A TV set in the kid’s bedroom (yes/no) Unmatched 0.05*** 0.00 0.05*** 0.00

36
Matched 0.01 0.27 -0.01 0.27
Exercise time (minute) Unmatched -0.13 0.00 -0.13*** 0.00
Matched -0.11* 0.02 -0.20*** 0.00
Take after-school sports lessons Unmatched -0.04*** 0.00 NA NA
(yes/no) Matched -0.03* 0.02 NA NA
Parental and household information
Mother’s education below high school Unmatched 0.01* 0.04 0.01** 0.01
(yes/no) Matched 0.01 0.26 0.01 0.23
Mother’s education above high school Unmatched 0.04*** 0.00 0.05*** 0.00
(yes/no) Matched 0.02* 0.02 0.02** 0.01
Mother’s health condition Unmatched 0.11*** 0.00 0.11*** 0.00
(from 1=excellent to 5=poor) Matched 0.09*** 0.00 0.09*** 0.00
Mother born in the U.S.A. (yes/no) Unmatched 0.03*** 0.00 0.04*** 0.00
Matched -0.01 0.16 -0.01 0.14
No. of kids in the household Unmatched NA NA -0.05*** 0.00
Matched NA NA 0.06*** 0.00
Household income below the poverty Unmatched 0.01*** 0.00 0.01*** 0.00
line (yes/no) Matched 0.01 0.09 0.01 0.18
Household income in 100-200% of the Unmatched 0.01 0.15 0.01* 0.03
poverty line (yes/no) Matched 0.01 0.15 0.01 0.10
Household income in 200-300% of the Unmatched 0.00 0.77 0.01 0.22
poverty line (yes/no) Matched 0.01 0.21 0.01 0.46
Perceived neighborhood characteristics
Neighborhood sidewalks and pathways Unmatched -0.52*** 0.00 -0.54*** 0.00
(yes/no) Matched -0.13*** 0.00 -0.11*** 0.00
Community center/kids’ club (yes/no) Unmatched -0.30*** 0.00 -0.31*** 0.00
Matched -0.08*** 0.00 -0.06*** 0.00

37
Help each other in the neighborhood
(1=absolutely no to 4=absolutely yes)
Unmatched -0.02 0.11 -0.05*** 0.00
Matched -0.06*** 0.00 -0.08*** 0.00
Feeling safe in the neighborhood Unmatched 0.07*** 0.00 0.05*** 0.00
(from 1=never to 4=always) Matched -0.03* 0.02 -0.04*** 0.00
Note: Asterisks (***, **, and *) indicate the statistically significant level at zero, one, and five percent, respectively.
a Mean differences of each matching covariate between those in the untreated group and those in the treated group. All tests are based on Covariate Matching with one neighbor. The results from matching with five neighbors are similar. T-statistics are calculated as
where n1 and n2 are the number of observations for the treatment and untreated groups on the support, respectively.
22
1 2
Treated Control
Treated Comparison
X X
ComparisonTreated
X Xt
n n
38
Table 5. Treatment Effects of the Neighborhood Parks/Playground by Neighborhood
Attributes and Individual Characteristics
Female Male
BMI Overweight Obese BMI Overweight Obese
Panel A
P1: With Sidewalks/Pathways 0.167 -0.080*** -0.052*** -0.120 -0.037 0.01
(0.180) (0.017) (0.014) (0.269) (0.025) (0.020)
# of the treated (untreated) 1174 (10979) 1189 (11974)
P2: Without
Sidewalks/Pathways
-0.581*** -0.045*** -0.030*** -0.577*** -0.061*** -0.063***
(0.133) (0.015) (0.011) (0.151) (0.015) (0.011)
# of the treated (untreated) 2756 (2462) 3020 (2629)
P3: With Community
Centers/Kids' Clubs
-0.481*** -0.034** -0.021** -0.206 -0.010 -0.030**
(0.143) (0.015) (0.010) (0.168) (0.018) (0.013)
# of the treated (untreated) 1624 (9597) 1718 (10412)
P4: Without Community
Centers/Kids' Clubs
-0.164 -0.068*** -0.051*** -0.329** -0.051*** -0.036***
(0.212) (0.021) (0.018) (0.168) (0.018) (0.012)
# of the treated (untreated) 2306 (3844) 2491 (4191)
Panel B
In safest neighborhoods -0.128 -0.013 0.015 -0.307** -0.069*** -0.054***
(0.115) (0.013) (0.010) (0.131) (0.015) (0.009)
# of the treated (untreated) 2238 (6654) 2642 (8410)
In non-safe neighborhoods
-1.200*** -0.028 -0.130*** -0.939*** -0.095*** -0.022
(0.463) (0.039) (0.032) (0.356) (0.031) (0.036)
# of the treated (untreated) 327 (1283) 337 (1179)
Panel C
Non-Hispanic White -0.351*** -0.044*** -0.022*** -0.691*** -0.072*** -0.069***
(0.109) (0.011) (0.007) (0.122) (0.014) (0.009)

39
# of the treated (untreated) 3046 (9676) 3307 (10556)
Black and Hispanic 0.684* 0.007 -0.053** 0.965** 0.076** 0.050
(0.359) (0.034) (0.027) (0.406) (0.039) (0.035)
# of the treated (untreated) 600 (2642) 646 (2861)
Panel D
Below 133% poverty line 0.761 -0.110*** -0.115*** -0.660* -0.046 -0.076**
(0.589) (0.036) 0.032 (0.344) (0.033) (0.033)
# of the treated (untreated) 549 (1683) 598 (1749)
Above 133% poverty line -0.463*** -0.036*** -0.041*** -0.396*** -0.054*** -0.036***
(0.105) (0.011) (0.007) (0.127) (0.014) (0.009)
# of the treated (untreated) 3381 (11758) 3611 (12854)
Panel E
Pre- and Early Adolescent
cohort (10-13)
-0.664*** -0.094*** -0.074*** -0.466*** -0.042** -0.044***
(0.218) (0.018) (0.015) (0.174) (0.021) (0.017)
# of the treated (untreated) 1673 (6035) 1795 (6387)
Adolescent cohort (14-17) -0.023 -0.037*** -0.038*** -0.282 -0.038** -0.024*
(0.143) (0.013) 0.008 (0.180) (0.017) (0.012)
# of the treated (untreated) 2257 (7406) 2414 (8216)
Note: Asterisks (***, **, and *) indicate the 1%, 5%, and 10% statistical significance level, respectively.
The NNM uses one neighbor in the untreated group. Numbers in the parenthesis are standard
deviation of the estimated treatment effects.

40
1 See Abadie and Imbens (2011) for detailed discussion of covariate matching techniques.
2 The respondents who chosen “Usually” were not included for the analysis focusing on
neighborhood safety as their perception of neighborhood safety is not decisive.
3 The growth chart can be found at the CDC website: http://www.cdc.gov/growthcharts/.
4 Throughout the article, sampling weights are employed in empirical analysis.
5 Let’s take obesity among males as an example. The obesity rate among the untreated group is 19.23
percent. The treatment effect is 3 percentage points. Therefore, the percentage change equals
100%*3/19.23=23%.
6 For the other matching models discussed in the rest of this paper, we do not present the balancing
test for the matching variables due to the limited space.
7 The state prevalence of obesity for children aged 10-17 in the United States is available at
http://www.statehealthfacts.org/comparetable.jsp?ind=51&cat=2&sub=14&yr=62&typ=2. Last
access on October 14, 2012.
8 The definitions of nine census divisions are available at
www.eia.gov/emeu/mecs/mecs2002/census.html.
9 The implicit assumption of this falsification test is that neighborhood characteristics, whether they
are unobserved or observed, are correlated to each other.
10 The dependent variable of the probit function is a dummy variable indicating the existence of a
neighborhood park/playground in each child’s neighborhood. The independent variables consists of
racial background, mother’s education level, a dummy for mother born in US, income/poverty level,
availability of other neighborhood amenities, and a complete set of state dummies. We also tried
several different specifications of the probit model and the results are similar.

41
11 The falsification tests for the park/playground effect on obesity by individual characteristics or
neighborhood attributes can be done using the same procedure as that for the main results.

1
AJAE appendix for
DO NEIGHBORHOOD PARKS AND PLAYGROUNDS REDUCE CHILDHOOD
OBESITY?
Authors Maoyong Fan
Department of Economics
Ball State University
Yanhong Jin
Department of Agricultural, Food and Resource Economics.
Rutgers, The State University of New Jersey
Date January 25, 2013
Note: The material contained herein is supplementary to the article
named in the title and published in the American Journal of
Agricultural Economics (AJAE).
2
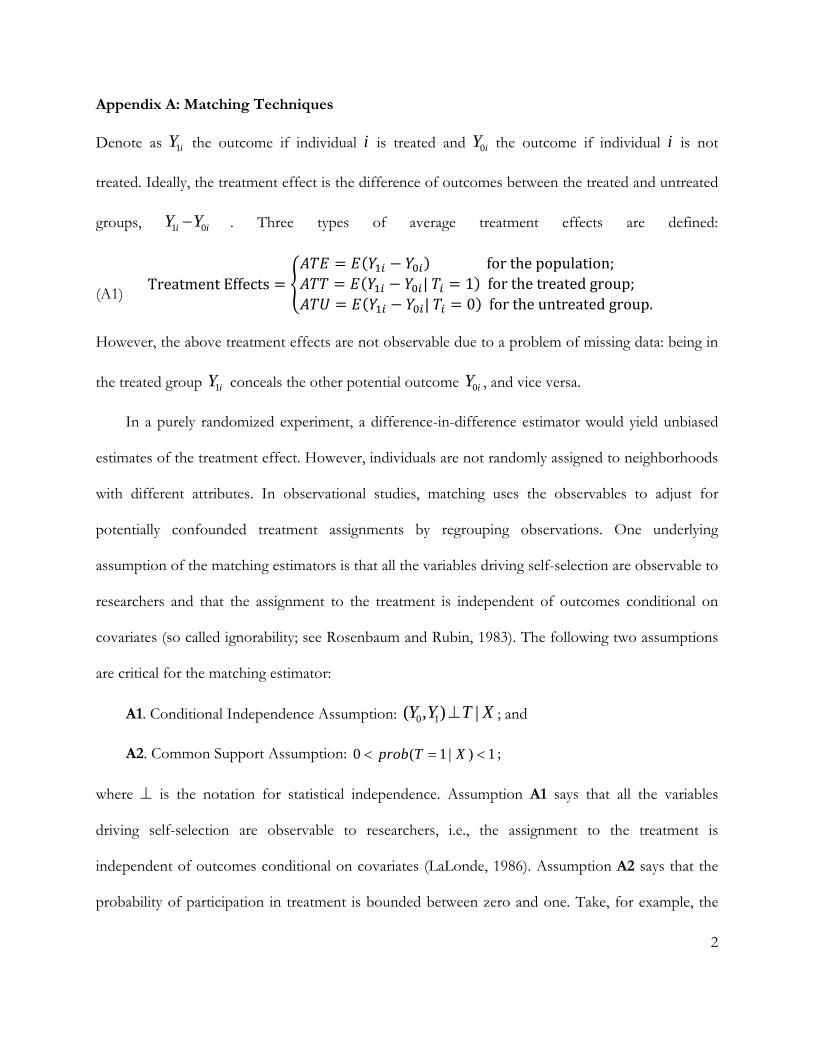
Appendix A: Matching Techniques
Denote as the outcome if individual is treated and the outcome if individual is not
treated. Ideally, the treatment effect is the difference of outcomes between the treated and untreated
groups, . Three types of average treatment effects are defined:
(A1) TreatmentEffects
forthepopulation;| 1 forthetreatedgroup;| 0 fortheuntreatedgroup.
However, the above treatment effects are not observable due to a problem of missing data: being in
the treated group conceals the other potential outcome , and vice versa.
In a purely randomized experiment, a difference-in-difference estimator would yield unbiased
estimates of the treatment effect. However, individuals are not randomly assigned to neighborhoods
with different attributes. In observational studies, matching uses the observables to adjust for
potentially confounded treatment assignments by regrouping observations. One underlying
assumption of the matching estimators is that all the variables driving self-selection are observable to
researchers and that the assignment to the treatment is independent of outcomes conditional on
covariates (so called ignorability; see Rosenbaum and Rubin, 1983). The following two assumptions
are critical for the matching estimator:
A1. Conditional Independence Assumption:
; and
A2. Common Support Assumption: ;
where is the notation for statistical independence. Assumption A1 says that all the variables
driving self-selection are observable to researchers, i.e., the assignment to the treatment is
independent of outcomes conditional on covariates (LaLonde, 1986). Assumption A2 says that the
probability of participation in treatment is bounded between zero and one. Take, for example, the
1iY i 0iY i
1 0i iY Y
1iY 0iY
0 1( , ) |Y Y T X
0 ( 1 | ) 1prob T X

3
average treatment effect for the treated (ATT). Under A1 and A2, we have
(A2)
Eq. (A2) shows that we can estimate ATT because the unbiased estimates of and
can be achieved based on the data. Similarly, we can also estimate treatment
effects for the untreated group (ATU) and for the population (ATE).
Covariate Matching
The basic idea of CVM is to impute counterfactual outcomes for treated individuals using untreated
individuals with similar values of covariates (See Abadie and Imbens (2011) for detailed discussion
of covariate matching techniques.). If the decision to take the treatment is “random” for individuals
with similar values of the pretreatment variables or covariates, we can use the average outcome of
similar individuals who were not exposed to the treatment as the counterfactual outcome for each
individual. Intuitively, comparing two individuals with the same predetermined characteristics, where
one is treated and the other is not, is like comparing these two individuals in a randomized
experiment.
To estimate ATT, the CVM estimator matches every treated individual to a number of
individuals in the untreated group with similar socio-economic characteristics that are correlated
with the treatment status and/or the outcome. The choice of the matched individuals in the
untreated group is based on the distance measured by the vector norm . Let be
the vector norm with positive definite matrix V. We use the diagonal matrix, of which the diagonal
elements are the inverses of the variances of Xi (the element of the set of covariates), as our
weighting matrix V. The weighting matrix V accounts for the difference in the scale of the
covariates. The CVM defines as the distance between the vectors and , where and
| 1 1 0
| 1 1 0
{ [ | 1, ] [ | 1, ]}
{ [ | 1, ] [ | 0, ]}x T
x T
ATT E E Y T X x E Y T X x
E E Y T X x E Y T X x
1[ | 1, ]E Y T X x
0[ | 0, ]E Y T X x
1/ 2'
Vx x Vx
Vz x x z x

4
represent the covariates for a treated unit and a potential match. Let dM(i) be the distance from
individual i to the Mth nearest match with the opposite treatment status. It is formally defined as
, where is the indicator function, which is equal to one when the
value in brackets is true and zero otherwise; and Xi and Xl are characteristics for the individual i and
the matched individual l. The set of individuals that individual i matches with is
. We denote the estimated outcome by if not
treated and if treated. The treatment effects defined in Eq. (A1) become:
(A3)
∑forthepopulation;
∑ ||
∑forthetreatedgroup;
∑ ||
∑fortheuntreatedgroup;
where N is the total sample size of the treated and untreated. The simple matching estimator will be
biased in finite samples when the matching is not exact. Abadie and Imbens (2011) develop a bias-
corrected matching estimator adjusting the difference within the matches for the differences in their
covariate values.
z
: 1
1l i
l i MVl T T
X X d i M
1
1, , 1 ,M l i l i MVi l N T T X X d i 0̂iY
1̂iY

5
Appendix B: Treatment Effect of Neighborhood Parks/Playgrounds on Childhood Obesity
when Incorporating the Regional Dummies as Matching Variables
Female Male BMI Overweight Obese BMI Overweight Obese
Quintile dummies for states based on their overweight/obesity prevalence1
-0.447*** -0.043*** -0.040*** -0.442*** -0.059*** -0.047***
(0.101) (0.012) (0.010) (0.167) (0.015)
(0.013)
# of the treated (untreated) 3930 (13441) 4209 (14603)
9 dummies for the census division2
-0.484*** -0.075*** -0.040*** -0.246* -0.035*** -0.038***
(0.100) (0.012) (0.010) (0.165) (0.014) (0.012)# of the treated (untreated) 3930 (13441) 4209 (14603)
1 Bases on the state prevalence of overweight and obesity among children aged 10 to 17, we group
the states into four quintiles and incorporate the quintile dummies as matching variables.
2 The US Department of Commerce, Bureau of the Census defines nine census divisions, including
New England and Middle Atlantic in the Northeast region; East North Central and West North
Central in the Midwest region; South Atlantic, East South Central, and West South Central in the
South region; and Mountain and Pacific in the West region. Using the Pacific census division as a
base, we include the dummy variables for the other eight census divisions to capture the state-
specific effect.
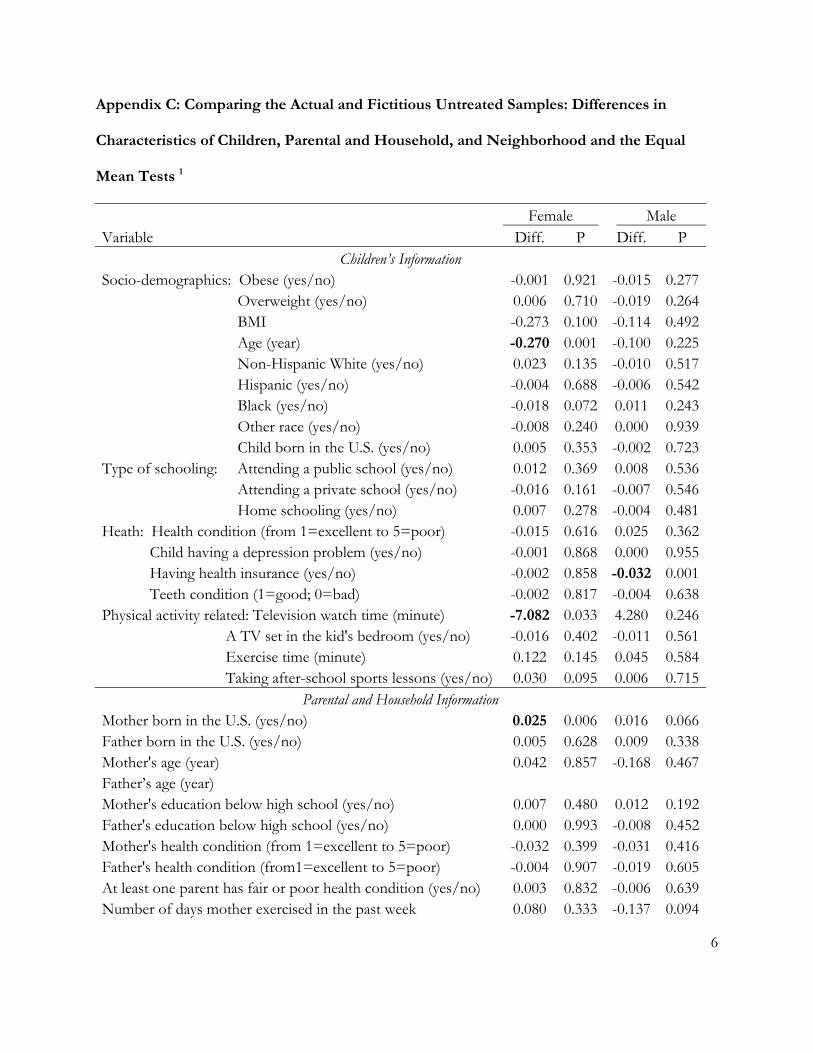
6
Appendix C: Comparing the Actual and Fictitious Untreated Samples: Differences in
Characteristics of Children, Parental and Household, and Neighborhood and the Equal
Mean Tests 1
Female Male Variable Diff. P Diff. P
Children’s Information Socio-demographics: Obese (yes/no) -0.001 0.921 -0.015 0.277 Overweight (yes/no) 0.006 0.710 -0.019 0.264 BMI -0.273 0.100 -0.114 0.492 Age (year) -0.270 0.001 -0.100 0.225 Non-Hispanic White (yes/no) 0.023 0.135 -0.010 0.517 Hispanic (yes/no) -0.004 0.688 -0.006 0.542 Black (yes/no) -0.018 0.072 0.011 0.243 Other race (yes/no) -0.008 0.240 0.000 0.939 Child born in the U.S. (yes/no) 0.005 0.353 -0.002 0.723Type of schooling: Attending a public school (yes/no) 0.012 0.369 0.008 0.536 Attending a private school (yes/no) -0.016 0.161 -0.007 0.546 Home schooling (yes/no) 0.007 0.278 -0.004 0.481Heath: Health condition (from 1=excellent to 5=poor) -0.015 0.616 0.025 0.362 Child having a depression problem (yes/no) -0.001 0.868 0.000 0.955 Having health insurance (yes/no) -0.002 0.858 -0.032 0.001 Teeth condition (1=good; 0=bad) -0.002 0.817 -0.004 0.638Physical activity related: Television watch time (minute) -7.082 0.033 4.280 0.246 A TV set in the kid's bedroom (yes/no) -0.016 0.402 -0.011 0.561 Exercise time (minute) 0.122 0.145 0.045 0.584 Taking after-school sports lessons (yes/no) 0.030 0.095 0.006 0.715
Parental and Household Information Mother born in the U.S. (yes/no) 0.025 0.006 0.016 0.066Father born in the U.S. (yes/no) 0.005 0.628 0.009 0.338Mother's age (year) 0.042 0.857 -0.168 0.467Father’s age (year) Mother's education below high school (yes/no) 0.007 0.480 0.012 0.192Father's education below high school (yes/no) 0.000 0.993 -0.008 0.452Mother's health condition (from 1=excellent to 5=poor) -0.032 0.399 -0.031 0.416Father's health condition (from1=excellent to 5=poor) -0.004 0.907 -0.019 0.605At least one parent has fair or poor health condition (yes/no) 0.003 0.832 -0.006 0.639Number of days mother exercised in the past week 0.080 0.333 -0.137 0.094

7
Number of days father exercised in the past week -0.042 0.671 -0.127 0.188Parents of a child are married (yes/no) 0.013 0.315 -0.003 0.817Raised by single mother (yes/no) -0.013 0.365 0.000 0.981No. of kids in the household 0.067 0.034 0.050 0.110Household income: below the poverty line (yes/no) 0.001 0.899 -0.012 0.253Household income: 100-200% of the poverty line (yes/no) 0.003 0.841 0.008 0.553Household income: 200-300% of the poverty line (yes/no) 0.040 0.006 0.014 0.331Poverty level (from 1=less than 133% to 5=400% and above) -0.095 0.075 -0.029 0.580No. of days in the past week that a family have meal together 0.024 0.756 -0.024 0.756
Perceived neighborhood characteristics Having sidewalks/pathways (yes/no) -0.298 0.000 -0.281 0.000Having kids' clubs (yes/no) -0.346 0.000 -0.354 0.000Having litter or garbage on the street or sidewalk (yes/no) -0.008 0.558 -0.030 0.022Having poorly kept housing in the neighborhood (yes/no) -0.037 0.005 -0.049 0.000Having vandalism such as broken windows or graffiti (yes/no) -0.002 0.818 -0.005 0.565People in the neighborhood help each out (yes/no) 0.002 0.956 0.036 0.206Having some people in the neighborhood to count on (yes/no) 0.056 0.043 0.023 0.417People in the neighborhood watching out for each other's children (yes/no) 0.046 0.103 0.031 0.280Having trusted people in the neighborhood help children outside playing or get hurt/scared (yes/no) 0.052 0.065 0.007 0.793Self-perception of a safe neighborhood (yes/no) -0.019 0.066 -0.001 0.909state-level obesity prevalence of 2007 0.000 0.873 0.000 0.764state-level obesity prevalence category (1=less than 0.25; 2=less than 0.30; 3=less than 0.35; and 4=0.35 and above) 0.016 0.557 -0.002 0.951
1 The column indicated “P” indicates the p-value of the mean test for each characteristic of
individual children, parental and household, and neighborhoods between the actual and fictitious
untreated samples. Numbers in bold suggest that that the particular characteristics is significantly
different at the 5% significance level.

8
Appendix D: BMI Distributions and Graphical Results
(a) Female (b) Male
Figure D1: BMI distributions of children living in a neighborhood with or without a
park/playground
0.0
5.1
.15
Den
sity
10 15 20 25 30 35 40 45 50 55 60Body Mass Index
With Parks/Playgrounds Without Parks/Playgrounds
Females
Kernel Density of Body Mass Index
0.0
5.1
Den
sity
10 15 20 25 30 35 40 45 50 55 60Body Mass Index
With Parks/Playgrounds Without Parks/Playgrounds
Males
Kernel Density of Body Mass Index
0.0
5.1
.15
Den
sity
10 15 20 25 30 35 40 45 50 55 60Body Mass Index
With Parks/Playgrounds Without Parks/Playgrounds
Females (Above 133% of Federal Poverty Level)
Kernel Density of Body Mass Index
0.0
5.1
.15
Den
sity
10 15 20 25 30 35 40 45 50 55 60Body Mass Index
With Parks/Playgrounds Without Parks/Playgrounds
Males (Above 133% of Federal Poverty Level)
Kernel Density of Body Mass Index
0.0
2.0
4.0
6.0
8.1
Den
sity
10 15 20 25 30 35 40 45 50 55 60Body Mass Index
With Parks/Playgrounds Without Parks/Playgrounds
Females (Below 133% of Federal Poverty Level)
Kernel Density of Body Mass Index
0.0
2.0
4.0
6.0
8.1
Den
sity
10 15 20 25 30 35 40 45 50 55 60Body Mass Index
With Parks/Playgrounds Without Parks/Playgrounds
Males (Below 133% of Federal Poverty Level)
Kernel Density of Body Mass Index
0.0
2.0
4.0
6.0
8.1
Den
sity
10 15 20 25 30 35 40 45 50 55 60Body Mass Index
With Parks/Playgrounds Without Parks/Playgrounds
Females (Black and Hispanic)
Kernel Density of Body Mass Index
0.0
2.0
4.0
6.0
8.1
Den
sity
10 15 20 25 30 35 40 45 50 55 60Body Mass Index
With Parks/Playgrounds Without Parks/Playgrounds
Males (Black and Hispanic)
Kernel Density of Body Mass Index
0.0
5.1
.15
Den
sity
10 15 20 25 30 35 40 45 50 55 60Body Mass Index
With Parks/Playgrounds Without Parks/Playgrounds
Females (Non-Hispanic White)
Kernel Density of Body Mass Index
0.0
5.1
.15
Den
sity
10 15 20 25 30 35 40 45 50 55 60Body Mass Index
With Parks/Playgrounds Without Parks/Playgrounds
Males (Non-Hispanic White)
Kernel Density of Body Mass Index

9
On the left scale is the BMI unit (kg/m2). On the right scale is the percentage point for the
probability of being overweight or obese.
Figure D2. Neighborhood park/playground effect on weight status for the untreated group
-0.268
-0.466
-3.055-2.715
-5.460
-6.388 -6.0
00
-4.0
00
-2.0
00
0.0
00
Ove
rwe
gih
t o
r O
be
sity
Ris
k (%
)
-0.6
00
-0.4
00
-0.2
00
0.0
00
BM
I U
nit
(kg
/m2 )
BMI Overweight Obese
Male, Significant Male, InsignificantFemale, Significant Female, Insignificant

10
On the left scale is the BMI unit (kg/m2). On the right scale is the percentage point for the
probability of being overweight or obese.
Figure D3. Neighborhood park/playground effect on weight status condition on other
amenities
-0.577-0.581
BMI Overweight Obese
-6.113 -6.298
-5.226
-7.977
-3.026
-4.480
-8.0
00
-4.0
00
0.0
00
Ove
rwe
gih
t o
r O
be
sity
Ris
k (%
)
-0.5
00
-0.2
50
0.0
00
BM
I U
nit
(kg
/m2 )
P1 P2 P1 P2 p1 p2
Male, Significant Male, Insignificant Female, Significant Female, Insignificant
(a) Co-exist with Neighborhood Sidewalks/Pathways (P1) or not (P2)
-0.329
-0.481
BMI Overweight Obese
-3.048
-5.088
-3.632
-2.109
-3.381
-5.118
-6.829
-6.0
00
-3.0
00
0.0
00
Ove
rwe
gih
t o
r O
be
sity
Ris
k (%
)
-0.6
00
-0.3
00
0.0
00
BM
I U
nit
(kg
/m2 )
P1 P2 P1 P2 p1 p2
Male, Significant Male, Insignificant Female, Significant Female, Insignificant
(b) Co-exist with Community Centers/Kids' Clubs (P3) or not (P4)

11
On the left scale is the BMI unit (kg/m2). On the right scale is the percentage point for the
probability of being overweight or obese.
Figure D4. Neighborhood park/playground effect on weight status among subgroups with
different level of perceive neighborhood safety
-0.307
-0.939
-5.370
-6.915
-9.463
-10
.00
0-8
.00
0-6
.00
0-4
.00
0-2
.00
00
.00
0O
verw
eg
iht
or
Ob
esi
ty R
isk
(%)
-1.0
00
-0.8
00
-0.6
00
-0.4
00
-0.2
00
0.0
00
BM
I U
nit
(kg
/m2 )
BMI Overweight Obese
Safest, Significant Safest, InsignificantNon-safest, Significant Non-safest, Insignificant
(a). Male
-1.200-13.045
-14
.00
0-1
0.5
00
-7.0
00-3
.50
00
.00
0O
verw
eg
iht
or
Ob
esi
ty R
isk
(%)
-1.4
00
-1.0
50
-0.7
00
-0.3
50
0.0
00
BM
I U
nit
(kg
/m2 )
BMI Overweight Obese
Safest, Significant Safest, InsignificantNon-safest, Significant Non-safest, Insignificant
(b). Female

12
On the left scale is the BMI unit (kg/m2). On the right scale is the percentage point for the
probability of being overweight or obese.
Figure D5. Neighborhood park/playground effect on weight status among different racial
subgroups
-0.691
-0.351
-6.860-7.191
-2.231
-4.392
-20
.00
0-1
5.0
00
-10
.00
0-5
.00
00
.00
0O
verw
eg
iht
or
Ob
esi
ty R
isk
(%)
-0.8
00
-0.6
00
-0.4
00
-0.2
00
0.0
00
BM
I U
nit
(kg
/m2 )
BMI Overweight Obese
Male, Significant Male, InsignificantFemale, Significant Female, Insignificant
(a). Non-Hispanic White
0.965
-5.301
-20
.00
0-1
0.0
00
0.0
00
10.
00
02
0.0
00
Ove
rwe
gih
t o
r O
be
sity
Ris
k (%
)
-1.0
00
-0.5
00
0.0
00
0.5
00
1.0
00
BM
I U
nit
(kg
/m2 )
BMI Overweight Obese
Male, Significant Male, InsignificantFemale, Significant Female, Insignificant
(b). Black and Hispanic

13
On the left scale is the BMI unit (kg/m2). On the right scale is the percentage point for the
probability of being overweight or obese.
Figure D6. Neighborhood park/playground effect on weight status among samples living
above or below 133% of the Federal poverty line
-7.571
-11.460-10.950
-12
.00
0-8
.00
0-4
.00
00
.00
04
.00
0O
verw
eg
iht
or
Ob
esi
ty R
isk
(%)
-1.5
00
-1.0
00
-0.5
00
0.0
00
0.5
00
1.0
00
BM
I U
nit
(kg
/m2 )
BMI Overweight Obese
Male, Significant Male, InsignificantFemale, Significant Female, Insignificant
(a). Below 133% Poverty Line
-0.396
-0.463
-5.363
-3.563-4.075
-3.624
-10
.00
0-8
.00
0-6
.00
0-4
.00
0-2
.00
00
.00
0O
verw
eg
iht
or
Ob
esi
ty R
isk
(%)
-0.5
00
-0.4
00
-0.3
00
-0.2
00
-0.1
00
0.0
00
BM
I U
nit
(kg
/m2 )
BMI Overweight Obese
Male, Significant Male, InsignificantFemale, Significant Female, Insignificant
(b). Above 133% Poverty Line

14
On the left scale is the BMI unit (kg/m2). On the right scale is the percentage point for the
probability of being overweight or obese.
Figure D7. Neighborhood park/playground effect on weight status by age cohorts
-0.466
-0.664
-4.357-4.153
-9.371
-7.432
-10
.00
0-7
.50
0-5
.00
0-2
.50
00
.00
0O
verw
eg
iht
or
Ob
esi
ty R
isk
(%)
-0.8
00
-0.6
00
-0.4
00
-0.2
00
0.0
00
BM
I U
nit
(kg
/m2 )
BMI Overweight Obese
Male,Significant Male,InsignificantFemale,Significant Female,Insignificant
(a). Pre- and Early Adolescent Cohort (10-13)
-3.818-3.693 -3.802
-8.0
00
-6.0
00
-4.0
00
-2.0
00
0.0
00
Ove
rwe
gih
t o
r O
be
sity
Ris
k (%
)
-0.4
00
-0.3
00
-0.2
00
-0.1
00
0.0
00
BM
I U
nit
(kg
/m2 )
BMI Overweight Obese
Male, Significant Male, InsignificantFemale, Significant Female, Insignificant
(b). Adolescent Cohort (14-17)

15
References
Abadie, A., and G.W. Imbens. 2011. "Bias-corrected matching estimators for average treatment
effects." Journal of Business and Economic Statistics 29(1):1-11.
LaLonde, R.J. 1986. "Evaluating the econometric evaluations of training programs with
experimental data." The American Economic Review 76(4):604-620.
Rosenbaum, P.R., and D.B. Rubin. 1983. "The central role of the propensity score in observational
studies for causal effects." Biometrika 70(1):41.