Do centennial tree-ring and stable isotope trends of Larix gmelinii (Rupr.) Rupr. indicate...
11
GLOBAL CHANGE ECOLOGY - ORIGINAL PAPER Do centennial tree-ring and stable isotope trends of Larix gmelinii (Rupr.) Rupr. indicate increasing water shortage in the Siberian north? Olga Vladimirovna Sidorova Rolf T. W. Siegwolf Matthias Saurer Alexander V. Shashkin Anastasia A. Knorre Anatoliy S. Prokushkin Eugene A. Vaganov Alexander V. Kirdyanov Received: 3 July 2008 / Accepted: 22 June 2009 Ó Springer-Verlag 2009 Abstract Tree-ring width of Larix gmelinii (Rupr.) Rupr., ratios of stable isotopes of C (d 13 C) and O (d 18 O) of whole wood and cellulose chronologies were obtained for the northern part of central Siberia (Tura, Russia) for the period 1864–2006. A strong decrease in the isotope ratios of O and C (after atmospheric d 13 C corrections) and tree- ring width was observed for the period 1967–2005, while weather station data show a decrease in July precipitation, along with increasing July air temperature and vapor pressure deficit (VPD). Temperature at the end of May and the whole month of June mainly determines tree radial growth and marks the beginning of the vegetation period in this region. A positive correlation between tree-ring width and July precipitation was found for the calibration period 1929–2005. Positive significant correlations between C isotope chronologies and temperatures of June and July were found for whole wood and cellulose and negative relationships with July precipitation. These relationships are strengthened when the likely physiological response of trees to increased CO 2 is taken into account (by applying a recently developed d 13 C correction). For the O isotope ratios, positive relationships with annual temperature, VPD of July and a negative correlation with annual precipitation were observed. The d 18 O in tree rings may reflect annual rather than summer temperatures, due to the late melting of the winter snow and its contribution to the tree water supply in summer. We observed a clear change in the isotope and climate trends after the 1960s, resulting in a drastic change in the relationship between C and O isotope ratios from a negative to a positive correlation. According to isotope fractionation models, this indicates reduced stomatal conductance at a relatively constant photosyn- thetic rate, as a response of trees to water deficit for the last half century in this permafrost region. Keywords Stable carbon isotope ratio Stable oxygen isotope ratio Climatic changes Tree-ring width Tura Introduction Studies of Siberian forests are important, because these sensitive ecosystems are very responsive to climate changes (Myneni et al. 1997; Vaganov and Shiyatov 1998; Briffa 2000; Sidorova et al. 2008). Recent reports about the impact of the rapidly increasing atmospheric CO 2 concentrations suggest that northern forest ecosystems may be particularly strongly affected by global warming (Keeling et al. 1996; Vaganov and Shiyatov 1998; Serreze et al. 2000). Increased C storage in phytomass (Ko ¨rner 2000; Knorre et al. 2006; IPCC 2001, 2007), changes in plant distribution and eco- system biogeochemical cycles and degradation of perma- frost (Osterkamp and Romanovsky 1999; IPCC 2001, 2007; Sugimoto et al. 2002; Delisle 2007) are among the predicted likely future consequences. Moreover, climate change and increasing CO 2 may have a combined effect on tree growth Communicated by Dan Yakir. O. V. Sidorova (&) A. V. Shashkin A. A. Knorre A. S. Prokushkin E. A. Vaganov A. V. Kirdyanov V.N. Sukachev Institute of Forest, 660036 Akademgorodok, Russia e-mail: [email protected]; [email protected] O. V. Sidorova R. T. W. Siegwolf M. Saurer Paul Scherrer Institute, 5232 Villigen, Switzerland A. A. Knorre E. A. Vaganov Siberian Federal University, Svobodny 79, 660041 Krasnoyarsk, Russia 123 Oecologia DOI 10.1007/s00442-009-1411-0
Transcript of Do centennial tree-ring and stable isotope trends of Larix gmelinii (Rupr.) Rupr. indicate...

GLOBAL CHANGE ECOLOGY - ORIGINAL PAPER
Do centennial tree-ring and stable isotope trends of Larix gmelinii(Rupr.) Rupr. indicate increasing water shortage in the Siberiannorth?
Olga Vladimirovna Sidorova Æ Rolf T. W. Siegwolf Æ Matthias Saurer ÆAlexander V. Shashkin Æ Anastasia A. Knorre Æ Anatoliy S. Prokushkin ÆEugene A. Vaganov Æ Alexander V. Kirdyanov
Received: 3 July 2008 / Accepted: 22 June 2009
� Springer-Verlag 2009
Abstract Tree-ring width of Larix gmelinii (Rupr.)
Rupr., ratios of stable isotopes of C (d13C) and O (d18O) of
whole wood and cellulose chronologies were obtained for
the northern part of central Siberia (Tura, Russia) for the
period 1864–2006. A strong decrease in the isotope ratios
of O and C (after atmospheric d13C corrections) and tree-
ring width was observed for the period 1967–2005, while
weather station data show a decrease in July precipitation,
along with increasing July air temperature and vapor
pressure deficit (VPD). Temperature at the end of May and
the whole month of June mainly determines tree radial
growth and marks the beginning of the vegetation period in
this region. A positive correlation between tree-ring width
and July precipitation was found for the calibration period
1929–2005. Positive significant correlations between C
isotope chronologies and temperatures of June and July
were found for whole wood and cellulose and negative
relationships with July precipitation. These relationships
are strengthened when the likely physiological response of
trees to increased CO2 is taken into account (by applying a
recently developed d13C correction). For the O isotope
ratios, positive relationships with annual temperature, VPD
of July and a negative correlation with annual precipitation
were observed. The d18O in tree rings may reflect annual
rather than summer temperatures, due to the late melting of
the winter snow and its contribution to the tree water
supply in summer. We observed a clear change in the
isotope and climate trends after the 1960s, resulting in a
drastic change in the relationship between C and O isotope
ratios from a negative to a positive correlation. According
to isotope fractionation models, this indicates reduced
stomatal conductance at a relatively constant photosyn-
thetic rate, as a response of trees to water deficit for the last
half century in this permafrost region.
Keywords Stable carbon isotope ratio �Stable oxygen isotope ratio � Climatic changes �Tree-ring width � Tura
Introduction
Studies of Siberian forests are important, because these
sensitive ecosystems are very responsive to climate changes
(Myneni et al. 1997; Vaganov and Shiyatov 1998; Briffa
2000; Sidorova et al. 2008). Recent reports about the impact
of the rapidly increasing atmospheric CO2 concentrations
suggest that northern forest ecosystems may be particularly
strongly affected by global warming (Keeling et al. 1996;
Vaganov and Shiyatov 1998; Serreze et al. 2000). Increased
C storage in phytomass (Korner 2000; Knorre et al. 2006;
IPCC 2001, 2007), changes in plant distribution and eco-
system biogeochemical cycles and degradation of perma-
frost (Osterkamp and Romanovsky 1999; IPCC 2001, 2007;
Sugimoto et al. 2002; Delisle 2007) are among the predicted
likely future consequences. Moreover, climate change and
increasing CO2 may have a combined effect on tree growth
Communicated by Dan Yakir.
O. V. Sidorova (&) � A. V. Shashkin � A. A. Knorre �A. S. Prokushkin � E. A. Vaganov � A. V. Kirdyanov
V.N. Sukachev Institute of Forest,
660036 Akademgorodok, Russia
e-mail: [email protected]; [email protected]
O. V. Sidorova � R. T. W. Siegwolf � M. Saurer
Paul Scherrer Institute, 5232 Villigen, Switzerland
A. A. Knorre � E. A. Vaganov
Siberian Federal University,
Svobodny 79, 660041 Krasnoyarsk, Russia
123
Oecologia
DOI 10.1007/s00442-009-1411-0
that does not always result in higher C accumulation for
high-latitude northern forests. A number of studies report
decreasing radial tree growth of white spruce (Picea glau-
ca) caused by drought stress associated with increasing
temperature at the northern tree line in Alaska during the
last century (Barber et al. 2000; D’Arrigo et al. 2004;
Wilmking and Juday 2005). However, the opposite pattern
showing increasing radial growth was observed for more
temperate regions, for instance the Swiss Central Plateau
(Saurer et al. 1997a), the White Mountains (Sierra Nevada,
US) (Graumlich 1991) and north-eastern France (Duquensnay
et al. 1998).
Tree growth is influenced by many factors such as solar
irradiance, temperature, precipitation, air humidity, soil
and ground water, nutrient availability as well as water
from melting permafrost (Schweingruber et al. 1996;
Vaganov et al. 1999; McCarrol and Loader 2004). Tree-
ring width and tree-ring isotope composition [ratios of
stable isotopes of C (d13C) and O (d18O)] are indicators for
both temperature and moisture regime changes, where
fractionation processes during CO2 uptake are important
for d13C, while for d18O changes in the soil and leaf water
isotope ratio are determining factors (Treydte et al. 2001;
McCarroll and Loader 2004; Saurer and Siegwolf 2007;
Leavitt et al. 2008).
The C isotopic ratio in tree rings reflects signals of water
availability and air humidity as a result of the impact of
climate on photosynthesis. During photosynthesis several
fractionation steps take place, first when CO2 from the
atmosphere diffuses into the intercellular spaces, and
second during CO2 fixation by the enzyme Rubisco. The
opening and closure of stomata determines the water con-
trol. Under dry conditions the stomata close to conserve
water, while under wet conditions the stomata open up to
optimize CO2 assimilation. Changes in the assimilation rate
of the needles will therefore influence the intercellular CO2
concentration (ci) through changes of the rate at which the
CO2 is utilized to form sugars and an increase or decrease
in stomatal conductance will affect the rate at which this
internal CO2 (ci) can be replenished (Farquhar et al. 1989).
Plants discriminate more strongly against 13C under con-
ditions of high ci, when stomata are relatively wide open or
photosynthesis is low. As trees respond to limited water
resources, particularly under low amounts of precipitation
and relatively warm and dry conditions by reducing the
stomatal conductance and photosynthetic rate, these result
in a diminished ci (Scheidegger et al. 2000; Saurer and
Siegwolf 2007).
O isotopes in tree rings contain isotope signals related to
temperature and precipitation, which represent the source
water for trees (Craig 1961; Dansgaard 1964; Saurer and
Siegwolf 2007). Water moves from the soil (ground water,
soil, snow melt water) via xylem to the leaves/needles,
where the lighter isotopes (16O) evaporate more easily than
heavier 18O, resulting in enriched leave/needle water
(Farquhar and Lloyd 1993; Scheidegger et al. 2000;
Cernusak et al. 2003). Enrichment in d18O may be
enhanced under drought conditions (Yakir and Sternberg
2000). Barbour et al. (2001) showed that d18O is mostly
negatively correlated with stomatal conductance, because
changes in transpiration influence the leaf water enrich-
ment by the replenishment of leaf water with unenriched
soil water. A mixed d18O signal of source and leave/needle
water enrichment is stored in the wood and cellulose of the
tree rings (Saurer et al. 1997b; Roden and Ehleringer
2000). During the biochemical transformations from CO2
to wood, the O isotope signal undergoes the following
major modifications: (1) it shifts by approximately 28%during the formation of cellulose (Stenberg et al. 1986); (2)
the signal amplitude is smoothed (damping effect) (Saurer
et al. 1997b) by the exchange of d18O of source and xylem
water during cellulose synthesis (Roden and Ehleringer
2000). Accordingly the O isotope ratio signals reveal
environmental information as a response to changes in
temperature, CO2 and humidity. As stomatal conductance
decreases with increasing ambient CO2 concentration the
water vapor exchange between the leaf and the ambient air
is reduced leaving its fingerprint as outlined above (Drake
et al. 1997; Saurer and Siegwolf 2007).
The information on evaporative enrichment contained in
the d18O of organic matter is useful to distinguish whether
a change in the ci, calculated using d13C, is due to changes
in stomatal conductance or photosynthetic rate (Scheidegger
et al. 2000). C and O isotopes measured in the same tree
rings may, therefore, be a useful tool for better under-
standing the response of trees to both climate and changes
in CO2. Since trees assimilate atmospheric CO2, changes
in the atmospheric isotope composition will be reflected
in the tree-ring C isotope ratio. However, the concentra-
tion of CO2 can also influence photosynthesis and therefore
the isotope discrimination. Tree-ring d13C chronologies
showing a decline over recent decades, that is not
explained by a parallel change in the controlling climatic
variables, have been reported from several areas, including
the Swiss Alps (Saurer et al. 1997b; Treydte et al. 2001),
north-eastern France (Duquensnay et al. 1998) and Finland
(Gagen et al. 2007). McCarroll et al. (2009) suggest that
this is a threshold effect, with trees having reached the
limits of physiological adaptation to increasing CO2 levels
in the atmosphere. A study of both tree-ring width and
isotope data may therefore help to disentangle the effects of
climate and CO2 on the trees.
Studies of the isotopic composition of tree rings in the
northern regions of Eurasia have been primarily conducted
for C (d13C) (Kagawa et al. 2003; Gagen et al. 2007;
Kirdyanov et al. 2008; Sidorova et al. 2008) and rarely for
Oecologia
123

O d18O (Saurer et al. 2002; Sidorova et al. 2008), but using
both isotopes could be very helpful in improving our
understanding of the forest response to environmental
changes of the past century.
In this paper we addressed the following questions:
1. Do Siberian larch [Larix gmelinii (Rupr.) Rupr.] trees,
which represent one of the main species in high-
latitude northern forests, show trends in tree-ring width
and stable isotope compositions for the recent period?
2. Which climatic factor (temperature/precipitation)
determines radial growth of larch trees growing on
permafrost during the recent climatic changes under
increasing CO2?
3. What kind of climatic signals can be extracted from
stable isotope data with and without applying de-
trending procedures?
To answer these questions we present a combined study
of tree-ring width and stable isotopic ratios (d13C, d18O) for
whole wood and cellulose from larch trees growing on
permafrost in the northern part of central Siberia (Russia)
for the period 1864–2006.
Materials and methods
Studied region and site description
The study was conducted 30 km north of the settlement of
Tura (64�320N–100�140E, 204 m a.s.l.) within the region of
continuous permafrost in the northern part of central
Siberia (Fig. 1). According to the Tura weather station
(64�270N, 100�230E, 168 m a.s.l.) the mean annual tem-
perature for the period 1928–2006 is -9.1�C. The growing
season length is approximately 70 days and lasts from the
end of May to the beginning of September (Abaimov et al.
1997). Mean monthly temperatures vary between ?16.6�C
in July (the warmest month) and -36.2�C in January (the
coldest month). Temperature extremes can range between
?36�C in summer and drop below -55�C in winter time.
The annual amount of precipitation is 368 mm (1936–
2006) with about 60% falling as a rain (June–September).
Samples of larch trees [Larix gmelinii (Rupr.) Rupr.]
were collected in pristine open canopy larch stands (canopy
closure is ca. 0.3) characterized by uneven-age structure
with some 300-year-old individuals (Fig. 1). The stands in
this region are common on flat terrains developed on deep
fluvial deposits (second and third river terraces). The soil
developed in such conditions is a Typic Haploturbel
(USDA 1998). The organic soil layer represents an acidic
mor-type forest floor of 10–20 cm thickness. The depth of
mineral soil is [1.5 m according to the soil survey con-
ducted in adjacent burned areas, and the soil texture is silty
loam. The depth of the active soil layer, defined as the part
of the upper soil that thaws in summer, reaches a maximum
in September up to 0.2–0.9 m depending on the micro-
topography (mounds and troughs) induced by cryoturba-
tion. The rooting depth in troughs is limited by the organic
layer when the upper mineral soil is over moistened
([90%) and cold (maximum temperature is 1�C). Rooting
depths in mounds reach up to 40 cm with 80% of roots
inhabiting the organic layer and upper 10 cm of mineral
soil, which dry out in July (ca. 20%). In general, the mature
trees in the region have a superficial rooting system with
lateral roots (which provide water and nutrients for the
mature trees under study) mainly expanded into the warmer
mounds and rarely into the colder (and sometimes ‘‘fro-
zen’’) trough (Kajimoto et al. 2003).
Spatial mosaics of moist troughs and dry mounds in the
studied terrains result in the lengthened fire intervals
[140 years vs. 60–80 years as an average for the region
(Kharuk et al. 2008)] and a higher survival of larch trees
after a fire leading to the co-occurrence of different gen-
erations of larches within the stand.
The ground vegetation is dominated by dwarf shrubs
(Ledum palustre L., Vaccinium vitis-idaea L.), mosses
[Pleurozium schreberi (Brid.) Mit., Aulocomnium palustre
(Hedw.) Schwaegr.] and lichens (Cladina spp. and Cetraria
spp.).
Wood material and data treatment
Tree-ring cores were collected from 20 trees at a height of
1.3 m with a 0.5-cm-diameter increment borer. The tree
cores were measured using semi-automatic devices (LIN-
TAB V-3.0; Germany) with a precision of 0.01 mm and
cross-dated for determining the exact calendar date for
each tree ring. The individual tree-ring width series were
standardized using a negative exponential curve orFig. 1 Photograph of the study site (photograph: A. V. Kirdyanov)
Oecologia
123

regression line to remove age-related trends. The abso-
lutely dated standardized site chronology was constructed
using individual tree series within the 180- to 200-year age
class (Cook and Kairiukstis 1990; Schweingruber 1996;
Rinn 1996; Cook and Krusic 2008). The expressed popu-
lation signal (EPS) was calculated to define a threshold
level of common signal between tree-ring series in year-to-
year variations, i.e., the sensitivity of the tree-ring width
variabilities to changes of external factors, and is based on
the average correlation between the trees. Normally, an
EPS higher than 0.85 is considered as sufficient for climate
reconstruction (Wigley et al. 1984; Cook and Kairiukstis
1990). The running correlations were calculated for over-
lapping 20-year periods, while moving with an advance of
1 year through the whole calibration period. The correla-
tion coefficients are plotted as a function of the middle year
of each period.
For the isotope analyses, eight tree cores from eight
different trees from the same sample set were used. We
selected cores with tree rings wide enough for isotope
measurements and the highest correlation of individual
tree-ring width series with the site chronology. To exclude
the influence of the juvenile effect (McCarroll and Loader
2004; Gagen et al. 2008; Sidorova et al. 2008), we ana-
lyzed only tree rings with a cambial age greater than
40 years and at least 180 years, i.e., the isotope chronolo-
gies were constructed for the period after 1860. The d13C
and d18O were analyzed for pooled material (milling each
single annual tree ring from eight trees together) for both
whole wood and for cellulose. The two materials have been
shown to yield partly independent signals (Borella et al.
1998; Sidorova et al. 2008). Material of each annual ring
was milled to a fine powder and weighed into tin capsules
for the analysis (0.6–0.8 mg for 13C/12C and 1.1–1.3 mg
for 18O/16O). The pooling procedure yields a reliable
isotope chronology with a reduced number of samples
(Treydte et al. 2001). Although pooling prevents the calcu-
lation of the common signal strength in the isotope chro-
nologies (McCarroll and Loader 2004), other studies on
conifers have obtained very strong common signals with as
few as five trees (McCarroll and Pawellek 2001; Gagen et al.
2004, 2006), so the samples of eight as used here are likely
to be more than adequate. For a-cellulose extraction, a sub-
sample of the whole wood was enclosed in filter bags and
washed twice for 2 h in 5% NaOH to remove the remaining
lipids, resins and hemicellulose. A 7% NaClO2 treatment
was then performed for 36 h to remove the lignin (Loader
et al. 1997). The packets were dried for 24 h at 50�C.
The isotope ratios (d13C and d18O) were determined on
whole wood and cellulose using a Delta-S isotope ratio
mass spectrometer (Finnigan MAT, Bremen, Germany)
linked to two elemental analyzers (EA-1108, and EA-1110;
Carlo Erba, Italy) via a variable open split interface
(ConFlo-II; Finnigan MAT, Bremen, Germany) at the
stable isotope facility of the Paul Scherer Institute, Villi-
gen, Switzerland. The d13C was determined by combustion
under excess O at a reactor temperature of 1,020�C, whilst
samples for d18O measurement were pyrolysed to CO at
1,080�C (Saurer et al. 1998), both in continuous flow
mode. This guarantees a high sample throughput rate with
good precision for d13C (r ± 0.1%) and d18O
(r ± 0.2%). The isotopic values were expressed in the dnotation relative to the international standards:
dsample ¼ ðRsample=Rstandard � 1Þ � 1000;
where Rsample is the molar fraction of 13C/12C, or 18O/16O
ratio of the sample and Rstandard, of the standards Vienna
Pee Dee belemnite for C and Vienna standard mean ocean
water for O.
Fossil fuel and ‘‘pre-industrial’’ correction for d13C
Correction of tree-ring d13C is necessary because the
combustion of fossil fuels and biomass and land-use
changes have resulted in a decrease in d13C of the atmo-
spheric CO2 over the last 150 years. Changes in the
isotopic ratio of atmospheric CO2 are directly reflected in
the isotopic ratios of the products of photosynthesis. Cal-
culating the differences for each year to the pre-industrial
value (1850) for d13C of atmospheric CO2 obtained from
ice cores and direct atmospheric measurements at the
Mauna Loa Observatory, Hawaii (Francey et al. 1999;
http://www.esrl.noaa.gov/gmd/ccgg/globalview/co2c13/
co2c13_intro.html) we subtracted these differences from
the raw isotope series for C for each year. Because isotope
fractionation is additive, this completely removes the trend
due to decreasing atmospheric d13C from fossil fuel
emissions and land-use changes.
After this correction, both wood and cellulose d13C
series still show a steep decline after 1960 that cannot be
explained by any similar inflection in climate variables that
might control fractionation. McCarroll et al. (2009) have
argued that this is typical for the behavior of tree-ring d13C
series at many sites and that it represents a change in the
response of trees to the increased availability of CO2. As
the amount of CO2 in the air (ca) has increased, trees have
responded in an active way by increasing their water-use
efficiency so that the ratio of ci to ca has remained constant.
Since d13C values are a function of the ratio ci/ca they have
also remained stable over the industrial period (Saurer et al.
1997a, b). In recent decades, however, many trees seem to
have reached the limits of this plasticity in response and
they no longer maintain a constant ci/ca ratio, so that the ci
has increased, leading to a decline in d13C.
A ‘‘pre-industrial’’ (pin) correction taking account of
this change in behavior has been proposed by McCarroll
Oecologia
123

et al. (2009). It is a constrained non-linear de-trending of
the d13C series after 1850 and the constraints are based on
the likely physiological response of trees to increased CO2.
The first constraint is that a unit increase in the ca cannot
directly cause more than the same unit increase in ci, and
the second constraint is that increases in water-use effi-
ciency are limited to maintaining a constant ci/ca ratio. The
extent of the correction depends on the difference between
an active response to increased CO2 (maintaining constant
ci/ca) and a passive response (allowing ci to increase in
parallel with ca, so that ca - ci, which represents effec-
tively water-use efficiency, remains constant). In the early
industrial period, when atmospheric CO2 was increasing
very slowly, it can only directly explain a small decline in
tree-ring d13C, so any steeper decline is not removed. In
more recent decades, when CO2 increased rapidly, it can
account directly for a more rapid rise in ci and so a steeper
decline in d13C can be removed.
When the pin correction of McCarroll et al. (2009) is
applied to the data herein it has no effect until about
1960 and after that it removes the decline in d13C in
both the whole wood and cellulose series completely.
This is because prior to 1960 the isotope series are ris-
ing, which reflects an increase in water-use efficiency
beyond that required to maintain a constant ratio ci/ca.
This implies not only an active response to the rise in
atmospheric CO2, but an additional environmental stress
causing the trees to restrict moisture loss. The steep
decline in both d13C series after 1960 probably repre-
sents a change from an active to a more passive response
and all of the decline could, in theory, be explained by
an inability to respond to the increasingly rapid rate of
increase in atmospheric CO2. In the discussion below the
first correction of d13C of atmospheric CO2 will be
termed ‘‘d13C’’ and the second (pin) correction (Mc-
Carroll et al. 2009) ‘‘d13C*’’.
Relation to climate
To analyze the influence of climate on tree-ring formation,
statistical analyses were performed with monthly temper-
ature and precipitation data from the nearest meteorologi-
cal station at Tura (30 km south of the study site). Pearson
correlation coefficients were calculated between tree-ring
width and isotope chronologies and meteorological mea-
surements for the period where data were available (1929–
2005). To investigate the stability of climatic signals over
time, the analyzed period was divided into two periods of
equal length (1929–1967 and 1967–2005). The vapor
pressure deficit (VPD) was calculated for 1958–2006 using
daily Tura weather station data assuming that Tdew =
a?bTmin, (where a and b were calculated using the avail-
able daily data for relative humidity). Tdew is the dew point
temperature and Tmin the minimum air temperature (Mur-
ray 1967).
Results
Tree-ring width, stable isotopes, climatic parameters
and their trends
The constructed larch tree-ring width index chronology
(TRW) covers the period 1751–2006 (Fig. 2). The mean
tree-ring width is 0.38 mm and the mean inter-series cor-
relation is 0.59. The EPS value is above the critical 0.85
level (EPS = 0.95) and indicates a high degree of common
variability between individual trees for the whole analyzed
period. The TRW is characterized by a strong increase
during 1864–1900. In the period 1900–1970, TRW
decreases, while after the 1970s, the TRW again shows a
slightly increasing trend (Fig. 2).
The stable isotope chronologies for d13C and d18O of
whole wood and cellulose were determined for the period
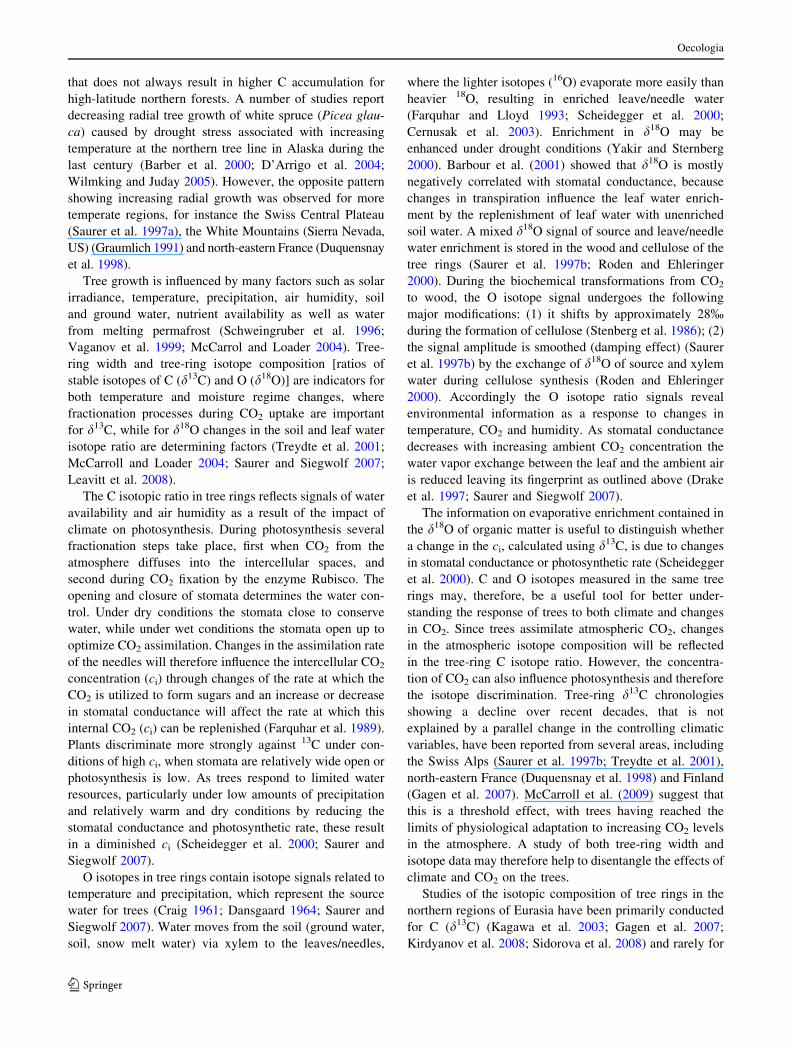
1864–2006 (Fig. 3a, b). The d13C series of both materials
(Fig. 3a) steadily increase from 1864 to 1960, decrease
afterwards when the d13C correction is used, but still
increased when the d13C* correction was applied (Fig. 3).
Before 1960, d13C and d13C* corrections show similar
results.
The mean d18O values in cellulose decrease from 1864
to about 1960. Afterwards no clear trend can be identified
(Fig. 3b). In contrast, the d18O values of whole wood show
a decreasing trend for the entire period (1864–2006). Wood
and cellulose isotope values in general show similar vari-
ations, with a correlation coefficient r = 0.75 (P \ 0.05)
for C and r = 0.61 (P \ 0.05) for O isotopes (1864–2006).
We observed a negative correlation between TRW and
d13C* of wood (r = -0.20, P \ 0.05) and cellulose
Year
Tre
e-rin
g in
dice
s
Num
ber
of tr
ees
0
10
20
30
40
50
60
70
80
90
100
-0.5
0.0
0.5
1.0
1.5
2.0
2.5
3.0
1760 1800 1840 1880 1920 1960 2000
Fig. 2 Tree-ring width standardized chronology and tree replications
are presented for the period 1751–2006
Oecologia
123
(r = -0.36, P \ 0.05) but a positive correlation with d18O
of whole wood (r = 0.26, P \ 0.05) and cellulose
(r = 0.39, P \ 0.05) for 1864–2006. No significant cor-
relation between TRW and d13C of cellulose was found.
The climate data show a slightly decreasing trend for
July precipitation and an increasing trend for July air
temperature during 1929–2005 (Fig. 3c). Monthly average
temperatures and precipitation for each month were sepa-
rated into two equal periods, 1929–1967 and 1967–2005,
for a detailed climatological analysis. The average July
precipitation decreased from 66.24 mm between 1929 and
1967 to 54.96 mm for 1967–2005, whereas the annual
amount of precipitation increased from 304.49 to
308.83 mm, mainly due to an increase in winter precipi-
tation (January, February). The average July temperature
increased from 16.3�C between 1929 and 1967 to 16.9�C
between 1967 and 2005, and the annual temperature
increased by 0.2�C.
Relationships between C and O isotopic signals
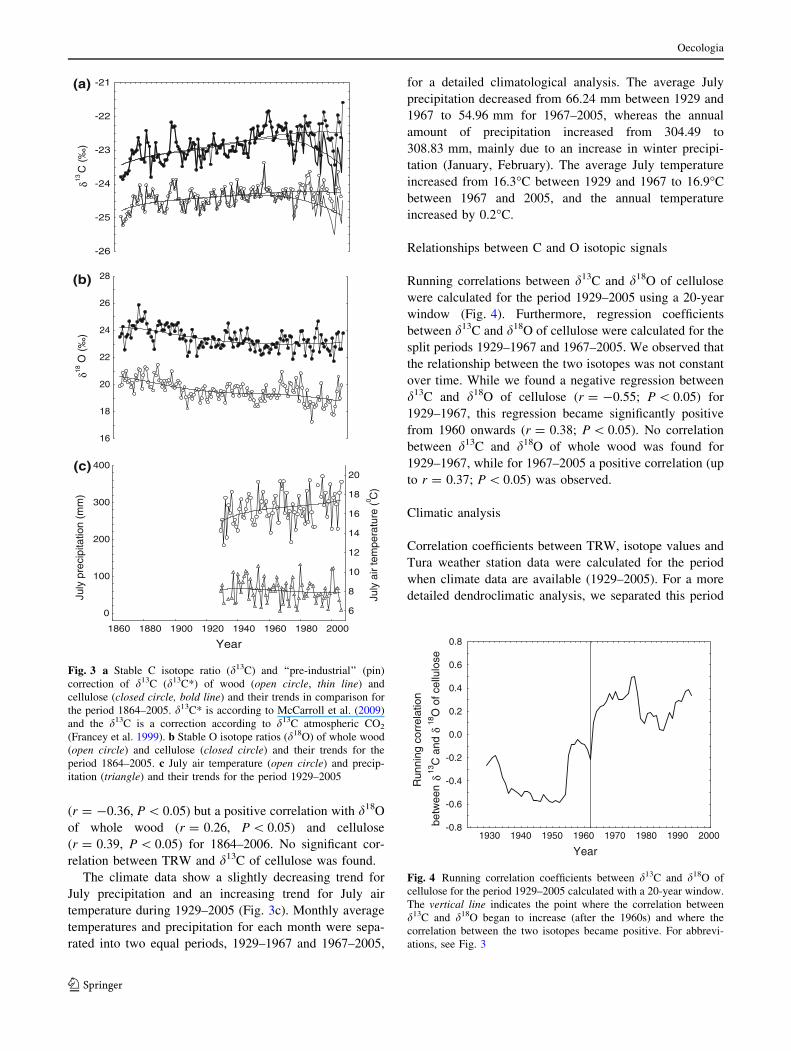
Running correlations between d13C and d18O of cellulose
were calculated for the period 1929–2005 using a 20-year
window (Fig. 4). Furthermore, regression coefficients
between d13C and d18O of cellulose were calculated for the
split periods 1929–1967 and 1967–2005. We observed that
the relationship between the two isotopes was not constant
over time. While we found a negative regression between
d13C and d18O of cellulose (r = -0.55; P \ 0.05) for
1929–1967, this regression became significantly positive
from 1960 onwards (r = 0.38; P \ 0.05). No correlation
between d13C and d18O of whole wood was found for
1929–1967, while for 1967–2005 a positive correlation (up
to r = 0.37; P \ 0.05) was observed.
Climatic analysis
Correlation coefficients between TRW, isotope values and
Tura weather station data were calculated for the period
when climate data are available (1929–2005). For a more
detailed dendroclimatic analysis, we separated this period
13C
(‰
)
-26
-25
-24
-23
-22
-21δ
18 O
(‰
)
16
18
20
22
24
26
28
δ
Year
July
pre
cipi
tatio
n (m
m)
July
air
tem
pera
ture
( C
) 0
6
8
10
12
14
16
18
20
0
100
200
300
400
1860 1880 1900 1920 1940 1960 1980 2000
(a)
(c)
(b)
Fig. 3 a Stable C isotope ratio (d13C) and ‘‘pre-industrial’’ (pin)
correction of d13C (d13C*) of wood (open circle, thin line) and
cellulose (closed circle, bold line) and their trends in comparison for
the period 1864–2005. d13C* is according to McCarroll et al. (2009)
and the d13C is a correction according to d13C atmospheric CO2
(Francey et al. 1999). b Stable O isotope ratios (d18O) of whole wood
(open circle) and cellulose (closed circle) and their trends for the
period 1864–2005. c July air temperature (open circle) and precip-
itation (triangle) and their trends for the period 1929–2005
Year
Run
ning
cor
rela
tion
betw
een
13C
and
18O
of c
ellu
lose
-0.8
-0.6
-0.4
-0.2
0.0
0.2
0.4
0.6
0.8
1930 1940 1950 1960 1970 1980 1990 2000
δδ
Fig. 4 Running correlation coefficients between d13C and d18O of
cellulose for the period 1929–2005 calculated with a 20-year window.
The vertical line indicates the point where the correlation between
d13C and d18O began to increase (after the 1960s) and where the
correlation between the two isotopes became positive. For abbrevi-
ations, see Fig. 3
Oecologia
123

into two equal parts as discussed above (1929–1967 and
1967–2005) because different tendencies in the radial tree
growth were observed before (negative trend) and after
(positive trend) 1967 (Fig. 2). We found significant, but not
very strong positive correlations between TRW and tem-
peratures of May and June as well as July precipitation for
1929–2005 (Fig. 5). The d13C and d13C* values of cellu-
lose show a positive correlation with July air temperature
and a negative correlation with July precipitation (Fig. 5).
Similarly, positive correlations were found between d13C*
of whole wood and temperature but for June (r = 0.29;
P \ 0.05) instead of July, and a negative correlation with
precipitation of July (r = -0.37; P \ 0.05) for 1929–
2005. When considering only the most recent period
(1967–2005), we observed a negative correlation between
d13C* and the annual amount of precipitation (r = -0.26
and r = -0.35; P \ 0.05) for whole wood and cellulose,
respectively.
Regarding the d18O of cellulose, we did not find any
significant correlation with monthly values of temperature
and precipitation, but with annual temperature and pre-
cipitation for both periods 1929–2005 and 1929–1967
(r = 0.24 and r = 0.40; P \ 0.05, respectively). In con-
trast, d18O of wood was not correlated with annual tem-
perature and precipitation but a negative correlation with
the average minimum temperature of February (r =
-0.44; P \ 0.05) for the period 1967–2005 was observed.
Finally, we found positive correlations between d13C* of
whole wood and VPD for June (r = 0.42; P \ 0.05) and
between VPD of July and d13C* (r = 0.51, P \ 0.05) and
d18O (r = 041, P \ 0.05) of cellulose.
Discussion
The TRW developed for the Tura region has a pattern
common for chronologies of central Siberia, showing
periods of relatively low growth alternating with abrupt
growth increases (Fig. 2). Such a pattern is mostly
explained by post-fire tree-ring growth after low-intensity
forest fires (Kharuk et al. 2008). Early studies showed that
the mean interval between fires is 80–200 years depending
on exposure and vegetation (Arbatskaya 1998; Kharuk
et al. 2008), which is in the range the observed frequency in
our study for intervals between strong growth increases.
Forest fires destroy the moss-lichen layer, which provides
thermal insulation, and can remove up to 70% of the annual
ecosystem production (Abaimov et al. 1997; Knorre et al.
2006; Prokushkin et al. 2006). The enhanced radiation on
the soil leads to permafrost thawing and to an increase in
the active soil layer. The melting permafrost water is
highly depleted in 18O and could therefore result in
decreasing isotopic trends in tree rings (Fig. 3b). The
melting permafrost water, however, can not be conserved
for a long time and is lost due to evaporation and run-off to
streams and rivers, leading to drought in the active layer
and decreasing tree growth as was observed at our study
site for the period after 1900 (Fig. 2). In this case the rain
water, which is isotopically heavier than melting perma-
frost water, may play a key role as a source of water for the
trees. The exact position of the permafrost is critical for
tree growth and may be detrimental if either too low or too
high.
After a fire several years are needed for recovery
(Abaimov et al. 1997). As a consequence the permafrost
layer rises again and reduces the growth and functionality
of the tree root systems (Alvarez and Korner 2007). The
permafrost has an important role as a direct water source in
summer drought because it buffers water availability to
plants. Sugimoto et al. (2002) reported that the pine forest
in eastern Siberia might be seriously damaged by a water
deficit in summer droughts if the permafrost disappeared.
On the other hand, when the permafrost table rises, root
growth decreases. It was found that the rate of permafrost
rise is inversely proportional to the growth rate of the
mosses (Knorre et al. 2006).
The tree-ring indices curve shows an abrupt decrease in
radial tree growth for the periods 1790–1810 and 1840–
1849, and then a rapid increase up to 1901 followed by a
continuous decrease (Fig. 2). We assume that the periods
with reduced tree-ring growth were caused by shallow
permafrost resulting in low water and nutrient availability.
Regarding the declining growth trend over the 20th cen-
tury, our results are in agreement with Barber et al. (2000,
2004), who reported a decrease in radial tree growth with
increasing temperature as a consequence of drought stress.
Month
Cor
rela
tion
coef
ficie
nt
-0.4
-0.3
-0.2
-0.1
0.0
0.1
0.2
0.3
0.4
0.5
S N J M M J S N J M M J
(a) (b)
Fig. 5 Correlation coefficients between temperature (a) and precip-
itation (b) from September of the previous year to August of the
current year and tree-ring width index chronology (open square),
d13C* of wood and cellulose (open and closed circles) and d13C of
wood and cellulose (thin and bold lines), respectively. The horizontallines show the significance level (P \ 0.05). For abbreviations, see
Fig. 3
Oecologia
123
During drought stress stomata close in order to prevent
water loss. A slowly increasing ca and ci might further
reduce the stomatal conductance while maintaining pho-
tosynthesis and tree radial growth at the same level towards
the end of the 21st century. A reduced stomatal conduc-
tance is reflected in increased d18O values, because the leaf
water enrichment in H218O is reduced to a lesser degree by
the convective flow of depleted source water (via the
xylem) than at higher transpiration rates (Peclet effect;
Farquhar and Lloyd 1993). In fact, we observed a slight
increase in d18O of wood and cellulose for the period
1967–2005 in comparison with 1929–1967 that indicates a
drought (Fig. 3b).
The overall trends over the 20th century show a decrease
in d18O, tree-ring width, precipitation and an increase of July
air temperature, July VPD and d13C (Fig. 3). After separat-
ing the climatic data (1929–2005) into two equal parts,
however, we observed a slight decrease for the d18O in
cellulose between 1929 and 1967, while the d13C, d13C*,
temperature and precipitation of July were relatively con-
stant or slightly increased. After 1960s the d13C and d13C*
chronologies diverge, suggesting that this is the period where
increased atmospheric CO2 becomes most effective.
According to the theory outlined in the section ‘‘Fossil fuel
and pre-industrial correction for d13C’’, this indicates that the
trees are no longer able to maintain a constant ci/ca, but ci is
increasing resulting in lower d13C values. This is clearly a
non-climatic, physiological effect that will hamper correla-
tion analysis with climate for the last few decades. The d18O
of cellulose was relatively constant, as were tree-ring width
and the d13C*, whereas the d13C clearly decreased.
Declining tree-ring d13C trends in recent decades were
observed at other locations in interior Alaska (Barber et al.
2004) and northern Finland (Gagen et al. 2007). In Finland
(Laanila) a divergence between d13C and d13C* of cellu-
lose has been observed since 1880 but in central Siberia
(Tura) it was not observed before 1960. Such a variation in
the response of trees from these different regions could be
due to differences in climatic conditions, differences in
microbial activity and nutrient availability in the soil or
different responses of trees to elevated CO2 in the atmo-
sphere. Such differences in the timing and magnitude of
responses are predicted by McCarroll et al. (2009), who
argue that there is no reason to suggest that all trees should
respond in the same way. A previous stable isotope study
for Siberian Scots pine in Turuchansk (66�N) showed a
declining trend in D13Cc for the second half of the 20th
century. Arneth et al. (2002) explained the trend by tree
responses to increasing atmospheric CO2 concentration and
increasing water-use efficiency due to increasing soil water
deficit and declining air humidity.
Climatological analysis showed positive correlations
between C isotope chronologies and temperatures of June
and July in whole wood and cellulose. This is expected
because June and July are the warmest months and these
relationships indicate an increase in photosynthetic capacity
and VPD. The warm and dry conditions cause stomatal
closure and lower the isotopic fractionation, leading to less
negative d13C values. The VPD is related to a reduction in
stomatal conductance and a further increase in d18O
enrichment of leaf water. Even during the warmest month of
July, the soil water is still frozen at a depth of 20–30 cm. The
melting water is still cold and cannot be used by roots at
the low soil temperature (Kramer and Boyer 1995). Thus the
accessibility of water for trees is limited, which can lead to
drought.
In contrast, the monthly temperatures were not signifi-
cantly represented in the d18O values. The positive corre-
lations with annual temperature, VPD of July and the
negative correlation with annual precipitation were
observed only for d18O. In general we observed lower
statistical relationships compared to other studies (Gagen
et al. 2007) which could be due to the complex site con-
ditions with frozen soil.
Numerous papers have reported similarities between
whole wood and cellulose for d13C (Leavitt and Long 1991;
Borella et al. 1998), suggesting that similar climatic signals
are contained in both materials. However, our analysis of
d13C in whole wood reflects the June temperature signal and
d18O of whole wood correlates with monthly minimum
temperatures, while none of these signals were found in
cellulose (Fig. 5). One reason for the presence of different
signals in whole wood and cellulose could be the direct link
between chemical composition of needles and isotopic ratios
in whole wood (Loader et al. 2003). In contrast, initial cel-
lulose synthesis begins earlier in the season with a mixture of
predominantly stored (old) and freshly assimilated carbo-
hydrates (Helle and Schleser 2004). Another reason could be
that the changes of the environmental conditions alter the
ratio of the wood compounds, as was found for plants
exposed to elevated CO2 (Korner 2000). In our previous
study from a more northern and more eastern Siberian site,
we suggested analyzing both whole wood and cellulose if
sufficient material is available because they contain different
climatic signals (Sidorova et al. 2008), and that conclusion
seems to be supported by the data presented here.
The application of the d13C* correction removes the
strong decreasing trend in tree-ring d13C by taking the
increasing ca into account. This correction was developed
specifically for removing changes in the physiological
response of trees in order to clarify the influence of climate
and thus use stable C isotopes in tree rings to reconstruct the
climate of the past. Therefore, the d13C* values cannot be
used for the analysis of physiological responses to elevated
CO2; they can, however, indicate when the impact of rising
CO2 becomes physiologically relevant.
Oecologia
123

A pronounced negative correlation between C and O
isotopes for 1929–1967 was observed (Fig. 4) and this
opposite behavior of the two isotopes could be explained
by a relatively constant stomatal conductance and
decreasing photosynthetic capacity according to the model
by Scheidegger et al. (2000). This period is characterized
by slightly increasing July precipitation. Under such con-
ditions the plant water loss is low and the stomata can be
open, which is reflected in a lower enrichment of d18O in
needle water. The application of the concept of Scheideg-
ger et al. (2000) to the isotope data therefore suggests a
decrease in photosynthesis, which is in line with the
observed declining tree-ring indices (Fig. 2).
In contrast, the period 1967–2005 is characterized by an
increase in the annual amount of precipitation, mainly
January and February. A lot of precipitation falling in
winter can lead to the delay of snow melt (because the
spring temperature did not change significantly for the last
50 years) and result in limited source water at the begin-
ning of the period of vegetative growth and a decrease in
wood production (Kirdyanov et al. 2003). Accordingly, we
observed a change from a negative to a positive correlation
between C and O isotope chronologies for this latter period.
An increase in d13C* indicates a decreasing ci. This is
either due to a reduced stomatal conductance at a constant
photosynthetic rate or a constant stomatal conductance
under an increased CO2 uptake. The observed slight rise in
d18O, however, indicates a reduction in stomatal conduc-
tance. Thus the relationship of the C and O isotope ratios
suggests a shift towards a drier climate during the growth
period (Scheidegger et al. 2000; Yakir and Sternberg
2000). Obviously the occurrence of drought depends
strongly on local soil conditions and a generalization based
on the results from one site applied to larger areas is
therefore difficult.
The stagnation in radial growth during the last 30 years,
similar to that observed for many sites in high latitudes of
the northern hemisphere (Briffa et al. 1998; Barber et al.
2000), and the strong impact of the correction for increased
CO2 at this time suggests that the trees there cannot utilize
the increasing CO2 concentration any further under the
given environmental conditions. The beginning of an
increasing drought and the limited access to nutrients in the
permafrost region strongly suggest CO2 saturation of these
trees. As the photosynthetic capacity can no longer be
enhanced the ci will increase along with the ca. Thus the13CO2 discrimination will increase with increasing CO2
concentration resulting in a continuous decrease in d13C, in
spite of a reduction in stomatal conductance, which is
documented with an increase in d18O. Finally we conclude
that these unique data represent the response of larch trees
to a slowly developing water shortage in the most recent
half century, even in this cold permafrost region.
Acknowledgments This study was supported by the Swiss National
Science Foundation (SNF 200021_121838/1, PIOI2-119259), the
Joint Research Project SCOPES (no. IB73A0-111134), and the Rus-
sian Foundation for Basic Research (RFBR nos. 06-05-64095-a,
07-04-96819 r_enisey, 07-04-00293a, 09-05-98015_r_sibir_a). This
work was conducted in collaboration with the European Union-fun-
ded Millennium Project (017008). Special thanks to Prof. Danny
McCarroll from Swansea University, UK for useful discussion and
valuable comments on the early stage of this manuscript. We would
like to thank the editor-in-chief, Christian Korner, the handling editor,
Dan Yakir, and the two anonymous reviewers for their helpful
comments.
References
Abaimov AP, Bondarev AI, Zyryanova OA, Shitova SA (1997) Polar
forests of Krasnoyarsk region. Novosibirsk, Nauka, p 208
Alvarez UP, Korner C (2007) Low temperature limits of root growth
in deciduous and evergreen temperature tree species. Funct Ecol
21:211–218
Arbatskaya MK (1998) Long term variability of climate, tree growth
and fire frequencies in taiga of Middle Siberia (in Russian). PhD
thesis, Institute of Forest, Krasnoyarsk, Russia
Arneth A, Lloyd J, Santruckova H, Bird M, Grigoryev S, Kalaschni-
kov YN, Gleixner G, Schulze ED (2002) Response of central
Siberian Scots pine to soil water deficit and long-term trends in
atmospheric CO2 concentration. Global Biogeochem Cycles 16.
1.10.1029/2000GB001374
Barber VA, Juday GP, Finney B (2000) Reduced growth of Alaskan
white spruce in the twentieth century from temperature-induced
drought stress. Nature 405:668–673
Barber VA, Juday GP, Finney BP, Wilmking M (2004) Reconstruc-
tion of summer temperature in interior Alaska from tree ring
proxies: evidence for changing synoptic climate regimes. Clim
Change 63:91–120
Barbour MM, Andrei TJ, Farquhar GD (2001) Correlation between
oxygen isotope ratios of wood constituents of Quercus and Pinussamples from around the world. Aust J Plant Physiol 28:335–348
Borella S, Leuenberger M, Saurer M (1998) Reducing uncertainties in
d13C analysis of tree rings: pooling, milling, and cellulose
extraction. J Geophys Res 103, NO.D.16:19519–19526
Briffa KR (2000) Annual climate variability in the Holocene:
interpreting the message of ancient trees. Quat Sci Rev 19:87–
105
Briffa K, Schweingruber F, Jones P, Osborn T (1998) Reduced
sensitivity of recent tree growth to temperature at high northern
latitudes. Nature 391:678–682
Cernusak LA, Pate JS, Farquhar GD (2003) Diurnal variation in the
stable isotope composition of water and dry matter in fruiting
Lupinus angustifolius under field conditions. Plant Cell Environ
25:893–907
Cook ER, Kairiukstis LA (eds) (1990) Methods of dendrochronology.
Applications in the environmental sciences. Kluwer, Dordrecht,
p 394
Cook ER, Krusic PJ (2008) A tree-ring standardization program based
on detrending and autoregressive time series modeling, with
interactive graphics (ARSTAN)
Craig H (1961) Isotopic variations in meteoric waters. Science
133:1702–1703
D’Arrigo R, Kaufmann RK, Davi N, Jacoby GC, Laskowski C,
Myneni RB, Cherubini P (2004) Thresholds for warming
induced growth decline at elevational tree line in the Yukon
territory, Canada. Glob Biogeochem Cycles 18. doi:10.1029/
2004GB002249
Oecologia
123

Dansgaard W (1964) Stable isotopes in precipitation. Tellus B Chem
Phys Meteorol 16:436–468
Delisle G (2007) Near-surface permafrost degradation: how severe
during the 21st century? Geophys Res Lett 34:L09503. doi:
1029/2007GL029323
Drake BG, GonzalezMeler MA, Long SP (1997) More efficient
plants: a consequence of rising atmospheric CO2? Annu Rev
Plant Physiol Plant Mol Biol 48:609–639
Duquensnay A, Breda N, Stievenard M, Dupouey JL (1998) Changes
of tree-ring d13C and water-use efficiency of beech (Fagussylvatica L.) in north-eastern France during the past century.
Plant Cell Environ 21:565–572
Farquhar GD, Lloyd J (1993) Carbon and oxygen isotope effects in
the exchange of carbon dioxide between plants and the
atmosphere. In: Ehleringer JR, Hall AE, Farquhar GD (eds)
Stable isotope and plant carbon/water relations. Academic Press,
San Diego, pp 47–70
Farquhar GD, Ehleringer JR, Hubick KT (1989) Carbon isotope
discrimination and photosynthesis. Annu Rev Plant Physiol Plant
Mol Biol 40:503–537
Francey RJ, Allison CE, Etheridge DM (1999) A 1000-year high
precision record of d13C in atmospheric CO2. Tellus B Chem
Phys Meteorol 51:170–193
Gagen MH, McCarroll D, Edouard J-L (2004) Latewood width,
maximum density and stable carbon isotope ratios of pine as
climate indicators in a dry, subalpine environment. Arct Antarct
Alp Res 36:166–171
Gagen MH, McCarroll D, Edouard J-L (2006) Combining ring width,
density and stable carbon isotope proxies to enhance the climate
signal in tree-rings: an example from the southern French Alps.
Clim Change 78:363–379
Gagen MH, McCarrol D, Loader NJ, Robertson I, Jalkanen R,
Anchukaitis KJ (2007) Exorcising the ‘segment length curse’
summer temperature reconstruction since AD 1640 using non
de-trend stable carbon isotope ratios from line trees in northern
Finland. Holocene 17:433–444
Gagen MH, McCarrol D, Robertson I, Loader NJ, Jalkanen R (2008)
Do tree ring d13C series from Pinus sylvestris in northern
Fennoscandia contain long-term non-climatic trends? Chem
Geol 252:42–51
Graumlich LJ (1991) Subalpine tree growth, climate, and increasing
CO2: an assessment of recent growth trends. Ecology 72:1–11
Helle G, Schleser GH (2004) Beyond CO2-fixation by Rubisco–an
interpretation of 13C/12C variations in tree rings from novel intra-
seasonal studies on broad-leaf trees. Plant Cell Environ 27:367–
380
IPCC (2001) Climate change 2001: the scientific basis. In: Houghton
JT, et al. (eds) Contribution of Working Group I to the 3rd
assessment report of the Intergovernmental Panel on Climate
Change. Cambridge University Press, USA
IPCC (2007) 4th assessment report, chapter 6. Intergovernmental
Panel on Climate Change, pp 434–497
Kagawa A, Naito D, Sugimoto A, Maximov TC (2003) Effects of
spatial variability in soil moisture on widths and d13C values of
eastern Siberian tree rings. J Geophys Res 108:D164500. doi:
10.1029/2002JD003019
Kajimoto T, Matsuura Y, Osawa A, Prokushkin AS, Sofronov MA,
Abaimov AP (2003) Root system development of Larix gmeliniitrees affected by micro-scale conditions of permafrost soils in
central Siberia. Plant Soil 255:281–292
Keeling CD, Chin JFS, Whorf TP (1996) Increased activity of
northern vegetation inferred from atmospheric CO2 measure-
ments. Nature 382:146–149
Kharuk VI, Ranson KJ, Dvinskaya ML (2008) Wildfires dynamic in
the larch dominance zone. Geophys Res Lett 35:L01402. doi:
10.1029/2007GL032291
Kirdyanov AV, Hughes M, Vaganov EA, Schweingruber F, Silkin P
(2003) The importance of early summer temperature and date of
snow melt for tree growth in the Siberian Subarctic. Trees
17:61–69
Kirdyanov AV, Treydte KS, Nikolaev A, Helle G, Schleser GH
(2008) Climatic signals in tree ring width, density and d13C from
larches in Eastern Siberia (Russia). Chem Geol 252:31–41
Knorre AA, Kirdyanov AA, Vaganov EA (2006) Climatically
induced interannual variability in aboveground production in
forest-tundra and northern taiga of central Siberia. Oecologia
147:86–95. doi:10.1007/s00442-005-0248-4
Korner C (2000) Biosphere responses to CO2 enrichment. Ecol Appl
10(6):1590–1619
Kramer PJ, Boyer JS (1995) Water relations of plants and soils.
Academic Press, New York, pp 167–199
Leavitt SW, Long A (1991) Seasonal stable-carbon isotope variability
in tree rings: possible paleoenvironmental signals. Chem Geol
(Isot Geosci Sect) 87:59–70
Leavitt SW, Chase TN, Rajagopalan B, Lee E, Lawrence PJ (2008)
Southwestern US tree-ring carbon isotope indices as a possible
proxy for reconstruction of greenness of vegetation. Geophys
Res Lett 35:L12704. doi:10.1029/2008GL033894
Loader NJ, Robertson I, Barker AC, Switsur VR, Waterhouse JS (1997)
Improved technique for the batch processing of small whole wood
samples to alpha-cellulose. Chem Geol 136:313–317
Loader NJ, Robertson I, McCarroll D (2003) Comparison of stable
carbon isotope ratios in the whole wood, cellulose and lignin of
oak tree rings, Palaeogeography, Palaeoclimatology. Palaeoe-
cology 196:395–407
McCarroll D, Loader NJ (2004) Stable isotopes in tree rings. Quat Sci
Rev 23:771–801
McCarroll D, Pawellek F (2001) Stable carbon isotope ratios of Pinussylvestris from northern Finland and the potential for extracting a
climate signal from long Fennoscandian chronologies. Holocene
11:517–526
McCarroll D, Gagen MH, Loader NJ, Robertson I, Anchukaitis KJ,
Los S, Young G, Jalkanen R, Kirchhefer A, Waterhouse JS
(2009) Correction of tree ring stable carbon isotope chronologies
for changes in the carbon dioxide content of the atmosphere.
Geochim Cosmochim Acta. doi:10.1016/j.ca.2008.11.041
Murray FW (1967) On the computation of saturation vapor pressure.
J Appl Meteorol 6:203–204
Myneni RB, Keeling CD, Tucker CJ, Asrar G, Namani RR (1997)
Increased plant growth in the northern high latitudes from 1981–
1991. Nature 386:698–702
Osterkamp TE, Romanovsky VE (1999) Evidence for warming and
thawing of discontinuous permafrost in Alaska. Permafr Periglac
Process 10(1):17–37
Prokushkin AS, Knorre AA, Kirdyanov AV, Schulze ED (2006)
Productivity of mosses and organic matter accumulation in the
litter of sphagnum larch forest in the permafrost zone. Russ J
Ecol 374:225–232. doi:10.1134/S1067413606040023
Rinn F (1996) TSAP, V. 3.6. Reference manual computer program for
tree ring analysis and presentation. Heidelberg, p 263
Roden JS, Ehleringer JR (2000) Hydrogen and oxygen isotope ratios
of leaf water and tree ring cellulose for field grown riparian trees.
Oecologia 123:481–489
Saurer M, Siegwolf RTW (2007) Human impacts on tree ring growth
reconstructed from stable isotopes. In: Dawson Todd E, Siegwolf
RTW (eds) Stable isotopes as indicators of ecological change
terrestrial ecology series. Elsevier, Amsterdam, pp 49–62
Saurer M, Borella S, Schweingruber F, Siegwolf R (1997a) Stable
isotopes in tree rings of beech: climatic versus site-related
influences. Trees 11:291–297
Saurer M, Aellen K, Siegwolf R (1997b) Correlating d13C and d18O in
cellulose of trees. Plant Cell Environ 20:1543–1550
Oecologia
123

Saurer M, Robertson I, Siegwolf R, Leuenberger M (1998) Oxygen
isotope analysis of cellulose: an inter-laboratory comparison.
Anal Chem 70(10):2074–2080
Saurer M, Schweingruber F, Vaganov EA, Schiyatov SG, Siegwolf R
(2002) Spatial and temporal oxygen isotope trends at the
northern tree-line in Eurasia. Geophys Res Lett 29(9):
10.1029/2001GL013739
Scheidegger Y, Saurer M, Bahn M, Siegwolf R (2000) Linking stable
isotopes with stomatal conductance and photosynthetic capacity:
a conceptual model. Oecologia 125:350–357
Schweingruber FH (1996) Tree rings and environment dendroecol-
ogy. Paul Haupt Publ Bern, Stuttgart, p 609
Serreze MC, Dyurgerov M, Romanovsky V, Oechel WC, Zhang JT,
Barry RG, Walsh JE, Chappin III, Osterkamp T (2000)
Observational evidence of recent change in the northern high–
latitude environment. Clim Change 46(1–2):159–207
Sidorova OV, Siegwolf RTW, Saurer M, Naurzbaev M, Vaganov EA
(2008) Isotopic composition (d13C, d18O) in wood and cellu-
lose of Siberian larch trees for early Medieval and recent
periods. J Geophys Res Biogeosci 113:G02019. doi:10.1029/
2007JG000473
Sternberg L, Deniro MJ, Savidge R (1986) Oxygen isotope exchange
between metabolites and water during biochemical reactions
leading to cellulose synthesis. Plant Physiol 82:423-427
Sugimoto A, Yanagisawa N, Naito D, Fujita N, Maximov TC (2002)
Importance of permafrost as a source of water for plants in east
Siberian taiga. Ecol Res 17:493–503
Treydte K, Schleser GH, Schweingruber FH, Winiger M (2001) The
climatic significance of d13C in subalpine spruce (Loetschental,
Swiss Alps). Tellus B Chem Phys Meteorol 53B:593–611
USDA (1998) Keys to soil taxonomy, 8th edn. USDA, Natural
Resources Conservation Service, Washington DC
Vaganov EA, Shiyatov SG (1998) Dendrochronological study in
Siberian climate. In: The problem of climate reconstruction and
nature in the Holocene and Pleistocene. Novosibirsk, pp 56–63
Vaganov EA, Hughes MK, Kirdyanov AV, Schweingruber FH, Silkin
PP (1999) Influence of snowfall and melt timing on tree growth
in subarctic Eurasia. Nature 400:149-151
Wigley T, Briffa K, Jones P (1984) On the average value of correlated
time series, with application in dendroclimatology and hydro-
meteorology. J Clim Appl Meteorol 23:201–213
Wilmking M, Juday GP (2005) Longitudinal variation of radial
growth at Alaska’s northern treeline-recent changes and possible
scenarios for the 21st century. Glob Planet Change 47:282–300
Yakir DL, Sternberg L (2000) The use of stable isotopes to study
ecosystem gas exchange. Oecologia 123:297–311
Oecologia
123