Disturbing Effects: Towards an Understanding of the Impact of Ant and Termite Activity on Australian...
94
DISTURBING EFFECTS: TOWARDS AN UNDERSTANDING OF THE IMPACT OF ANT AND TERMITE ACTIVITY ON AUSTRALIAN ARCHAEOLOGICAL SITES Cassandra Venn A thesis submitted in partial fulfillment of the requirements for the degree of Batchelor of arts with Honours in the School of Social Science, University of Queensland. October 2008.
Transcript of Disturbing Effects: Towards an Understanding of the Impact of Ant and Termite Activity on Australian...

DISTURBING EFFECTS:
TOWARDS AN UNDERSTANDING OF THE IMPACT OF ANT
AND TERMITE ACTIVITY ON AUSTRALIAN
ARCHAEOLOGICAL SITES
Cassandra Venn
A thesis submitted in partial fulfillment of the requirements for the degree of Batchelor of arts
with Honours in the School of Social Science, University of Queensland. October 2008.


I certify that I have read the final draft of this thesis and it is ready for submission in
accordance with the thesis requirements as set out in the School of Social Science Honours
(Anthropology/Archaeology) Handbook.
Dr Sean Ulm Dr Chris Clarkson
October 2008 October 2008
Brisbane, Australia Brisbane, Australia
I declare that the work presented in this thesis is the result of my own independent research,
except where otherwise acknowledged in the reference list. This material has not been
submitted either in whole or in part, for a degree at this or any other university.
Cassandra Venn
October 2008
Brisbane, Australia

- iv -

- v -
TABLE OF CONTENTS
LIST OF TABLES vii
LIST OF FIGURES viii
ABSTRACT x
ACKNOWLEDGEMENTS xi
CHAPTER ONE: INTRODUCTION 1
Introduction 1
Background and Rationale 1
Aims 3
Research Design 3
Thesis Organisation 4
CHAPTER TWO: LITERATURE REVIEW 5
Introduction 5
Taphonomy 5
Soil Science Studies of Ants and Termites 6
Archaeological Studies of Ants and Termites 9
Summary 13
CHAPTER THREE: METHODS 14
Introduction 14
Case Study: Berajondo 14
Site Background and Description 14
Ant and Termite Taxa Analysed 17
Iridomyrmex purpureus (meat ant) 17
Nasutitermes sp. 19
Laboratory Methods 19
Micromorphology 19
NIH Image Analysis 21
Particle Size Analysis 21
pH Levels 22
Munsell® Soil Colour 22
Summary 22
CHAPTER FOUR: RESULTS 24
Introduction 24
Mound Stratigraphic Descriptions 24
Micromorphology 24
Control 24
Mound #1 29
Mound #3 31

- vi -
Summary of Micromorphology 32
Particle Size Analysis 34
NIH Image Analysis 38
pH 39
Munsell Colour 39
Discussion 39
Nasutitermes sp. (termite) Mound versus Control Trench 40
Iridomyrmex purpureus (ant) Mound versus Control Trench 42
Summary 44
CHAPTER FIVE: DISCUSSION AND CONCLUSION 45
Introduction 45
Key Findings 45
Towards criteria for the Identification of Ant- and Termite-impacted
Sediments 45
Implications for Australian Archaeology 46
Directions for Future Research 46
Conclusion 47
APPENDIX A: Data Recording Forms 49
APPENDIX B: Berajondo Mound Survey Data 56
APPENDIX C: Glossary of Micromorphology Terms 61
APPENDIX D: Summary of Laboratory Methods applied to samples
from Berajondo 67
APPENDIX E: Stratigraphic Sections and Descriptions for Mounds
#6, #23, #25 71
APPENDIX F: Particle Size Distribution Data 77
REFERENCES CITED 80
- vii -
LIST OF TABLES
Table 1 Summary of reported mound characteristics and soil movement
by ants and termites 10
Table 2 Micromorphology samples, noting samples where context
has been retained 20
Table 3 Stratigraphic unit descriptions, Control Trench, southwest
wall, Berajondo 25
Table 4 Stratigraphic unit descriptions, Mound #1 (termite), east
wall, Berajondo 26
Table 5 Stratigraphic unit descriptions, Mound #3 (ant), south wall
Berajondo 27
Table 6 Summary of micromorphology results 36
Table 7 Results of the image analysis on micromorphology
samples 39
Table 8 pH values for Berajondo 39
Table 9 Munsell colour values for Berajondo 40

- viii -
LIST OF FIGURES
Figure 1 Cross section of Yam Camp 2
Figure 2 Schiffer‟s flow chart for durable elements 6
Figure 3 Stone line in road section in Africa attributed to termites 11
Figure 4 Stratigraphic profile of Nauwalabila I, showing the rubble layer
overlying bedrock 12
Figure 5 The cleared paddock at Berajondo 15
Figure 6 Map of the cleared paddock at Berajondo 16
Figure 7 Backhoe sectioning Mound #1 at Berajondo 18
Figure 8 Mound #3 (ant), facing north 18
Figure 9 Mound #1 (termite), facing south 19
Figure 10 Stratigraphic section, control trench, southwest wall,
Berajondo 25
Figure 11 Stratigraphic section, Mound #1 (termite), east wall
Berajondo 26
Figure 12 Stratigraphic section, Mound #3 (ant), south wall,
Berajondo 27
Figure 13 Cross-section of Mound #1 (termite), facing east 28
Figure 14 Cross-section of Mound #3 (ant), facing south 28
Figure 15 Cross-section of Mound #3 (ant), facing south 28
Figure 16 Control wall facing west 28
Figure 17 Granostriations indicated by the arrow in Control Trench,
AB Layer, PPLx100 33
Figure 18 Silt infilling around the voids in Control Bts Layer PPLx100 33
Figure 19 Planar void, Control Trench, BC Layer, XPLx100 33
Figure 20 Granostriation of clay and organics around gallery wall 33
Figure 21 Gallery wall, Mound #1, Ap Gallery Layer, PPLx100 33
Figure 22 Porostriation of silt, Mound #1, AB Layer, PPLx100 33
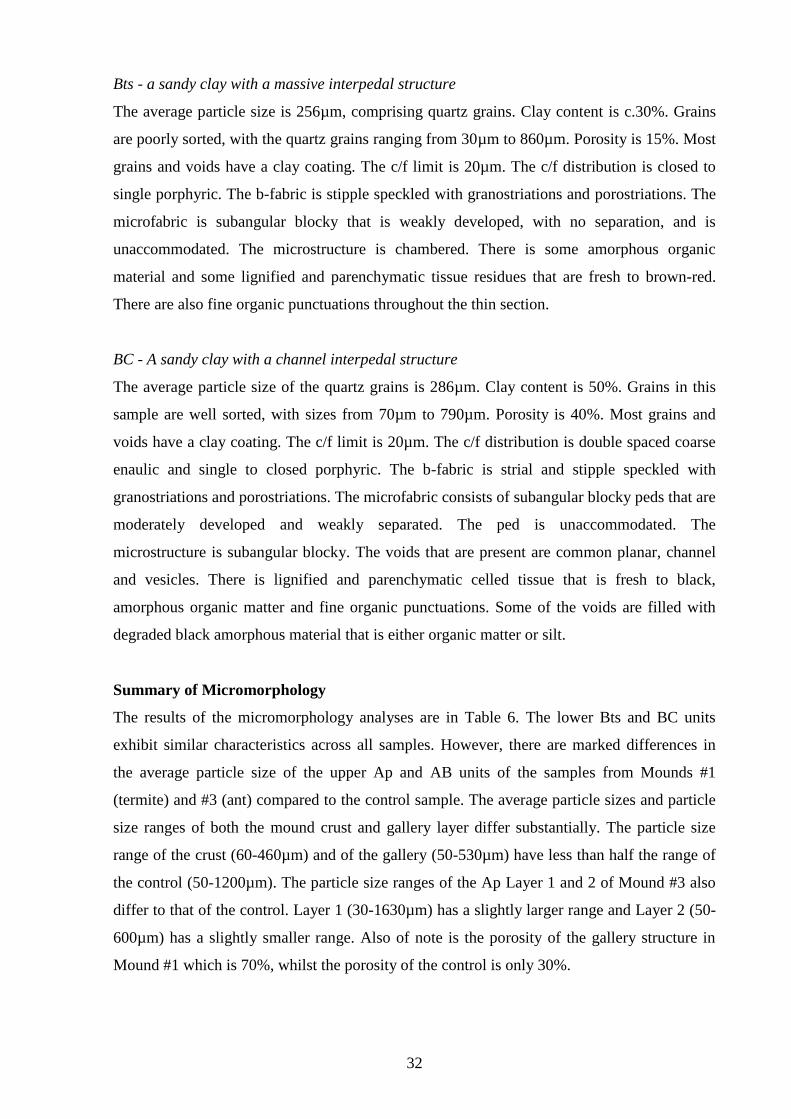
Figure 23 Excrement around voids, Mound #1, AB Layer PPLx100 34

- ix -
Figure 24 Gallery, Mound #3, AB Layer 34
Figure 25 Stipple speckled b-fabric, Mound #3, AB Layer 34
Figure 26 Particle size analysis, Ap Layer 37
Figure 27 Particle size analysis, AB layer 37
Figure 28 Particle size analysis, Bts layer 38
Figure 29 Particle size analysis, BC layer 38

- x -
ABSTRACT
This thesis examines the potential of ant and termite modification of archaeological deposits.
Soil Science and entomological studies show that ants and termites move large amounts of
sediments from considerable depths. However, this information has not been utilised in
Australian archaeology despite the close proximity of ant and termite nests to some
archaeological deposits. This study attempts to evaluate possible impacts of ants and termites
on archaeological deposits through the survey, excavation and analysis of sediments from
active termite (Nausititermes sp.) and meat ant (Iridomyrmex purpureus) mounds. Results
from this study demonstrate that, particle size analysis, micromorphological analysis and
image analysis can discriminate between ant- and termite-impacted deposits and control
samples. These results have the potential for a broad application in Australian archaeology in
the assessment of sites with suspected ant or termite disturbance.

- xi -
ACKNOWLEDGEMENTS
I would like to thank Michael Williams and Cedric Williams for allowing me to dig trenches
all over their property at Berajondo. I am also most grateful to my supervisors, Dr Sean Ulm
(Aboriginal and Torres Strait Islander Studies Unit), Dr Marshall Weisler (School of Social
Science), and Dr Chris Clarkson (School of Social Science) and to Associate Professor Jay
Hall and Dr Andy Fairbairn for their support in the early stages of this project. The invaluable
help that Peter Colls (School of Physical Sciences) provided in the sample preparation
laboratory is greatly appreciated. A big thank you must also go to Dr Ann-Maria Hart for
patiently teaching me the basics of micromorphology.
Karen Murphy, Luke Kirkwood, Michelle Langley, Elena Piotto, Noel Sprenger, Daniel
Rosendahl, Sue O‟Brien and Jill Reid deserve a special thanks for their help at Berajondo
during the survey and excavation phases of this project. I thank Eddie, who operated the
backhoe at Berajondo, Tom McDonald (National Parks and Wildlife Services) for his help
with modeling contours, and Mr Greg Daniels (Department of Integrative Biology) for
identifying the ant and termite specimens your assistance is greatly appreciated. I‟m also
appreciative of the help in the microscopy laboratory provided by Sue Nugent and Gail
Robertson. I am very grateful to Clair Harris for her advice, support and encouragement
throughout the last two years. I also owe a big thank-you to my family for their words of
encouragement, support and patience.

1
CHAPTER ONE
INTRODUCTION TO THE STUDY
Introduction
This thesis examines the potential effect of ant and termite activity on the formation and post-
depositional disturbance of Australian archaeological sites. Since the 1990s Australian
archaeologists have speculated that ant and termite activity may contribute to the movement
of artefacts within archaeological deposits. However, no research has been conducted to
evaluate these claims or develop diagnostic criteria for identifying ant and/or termite activity.
This study begins to directly address this problem through the integration of research in
entomology and soil science combined with survey, excavation and analysis of active ant and
termite nests.
Background and Rationale
Many Australian archaeological sites are documented as containing termite or ant nests,
including Mushroom Rock (Morwood et al. 1995:136), Yam Camp (Morwood and Dagg
1995:109) (Figure 1), Garnawala 2 (Clarkson and David 1995:29) and Grass Tree Shelter
(David 2002:22). At all of these rockshelter sites ant or termite nests are shown in
stratigraphic drawings, photographs, site plans, or are briefly mentioned in the text. Despite
the presence of ants or termites, none of the studies consider the potential impact of insect
activity on the integrity of the archaeological deposits investigated. These considerations are
critical given claims that some of Australia‟s earliest archaeological sites have been
substantially altered by ant or termite activity.
O‟Connell and Allen (1998:139), for example, have disputed claims for pre-50,000 BP
occupation at Nauwalabila I in Arnhem Land, arguing that termites may have been significant
agents in the displacement of artefacts and charcoal. However, only limited analysis have
been undertaken on samples from this site to refute these claims (Bird et al. 2002).

2
Figure 1. Cross-section of Yam Camp, showing proximity of termite mound to excavated squares.
(Morwood and Dagg 1995:110).
In contrast to the dearth of studies in archaeology, many soil science studies have investigated
the effects of ants and termites on soil and sediments. However, results of these studies have
generally not been considered in archaeological research, despite the fact that soil scientists
have reported the movement of objects, including artefacts, by ants and termites. Cowan et al.
(1985), for example, investigated the nests of meat ants (Iridomyrmex purpureus) and sugar
ants (Camponotus intrepidus) in western New South Wales and reported the movement of
objects including artefacts.
Furthermore, current taphonomic models do not account for disturbance caused by insect
activity or play down its potential impact. Soils and sediments are not immune to processes
that can alter their structure or original position within the archaeological record. As Hofman
(1986:163) stated over 20 years ago, there is “increasing evidence that vertical movement of
buried particles, including artifacts, within and between stratigraphic units not only is
common but in some sites may be pervasive”. Despite this assessment, the study of soil and
sediments is barely cited in taphonomic models. Most archaeological textbooks do not even
acknowledge that post-depositional processes affect the movement of soil and sediments,
instead focusing on the artefactual and faunal components of deposits (see for example Staeck
2002; Thomas 1998 and Dincauze 2000).

3
Limited studies have been conducted into the effects of bioturbation by various biological
agents on artefact movement. Specht (1985) reported disturbance of Pacific archaeological
sites by crab burrowing. Stein (1983) and Armour-Chelu and Andrews (1994) discussed
earthworm activity, including an experiment which demonstrated that earthworms (Lumbricus
terrestris) moved objects downwards.. Various studies have discussed the effects of wolf
spiders, mice, moles, gophers, squirrels, shrews, and others on the movement of soil (see
Ahlbrandt et al. 1978; Johnson 1989; Thorp 1949; Wood and Johnson 1978). However, none
of these studies present more than general, and often speculative, discussion. Clearly, more
extensive research needs to be conducted into all forms of post-depositional disturbance by
insect agents. There have been very few studies examining the effects of ants or termites, the
most notable being McBrearty‟s (1990) consideration of the effects of termites on African
archaeological sites.
Aims
The intention of this study is to establish whether a set of diagnostic criteria can be developed
to determine the presence of ant and termite activity in Australian archaeological sites. To
address this central research question, the following aims are identified for the study:
to determine, apply and evaluate methods for identifying ant- and termite-impacted
deposits;
to recommend analytical methods that consistently discriminate ant- and termite-
impacted deposits; and
to evaluate the potential impacts and applications of findings in Australian
archaeology.
Research Design
The research proceeded in the following five stages:
1. A critical review of archaeological literature to determine the validity of previous
archaeological considerations of insect bioturbation;
2. A review of entomological and soil science literature to establish methods for potential
application to archaeological contexts;

4
3. The survey and excavation at Berajondo, Central Queensland, to characterize and
obtain sediment samples from active ant and termite nests and a control site for
analysis;
4. The analyses of sediment samples using soil sciences methods to establish criteria for
determining the presence or absence of insect disturbance; and
5. The Evaluation of laboratory methods as proxies for detection of insect activity in
future archaeological analysis of soil and sediments.
Thesis Organisation
Chapter One outlined the problem and framework for the study, demonstrating the need for
greater consideration of ants and termites in archaeological site formation processes.
Chapter Two reviews archaeological and soil science literature concerning ant and termite
activity, commencing with current taphonomic literature. After establishing the shortcomings
of taphonomic research in this area, soil science studies are reviewed revealing a rich body of
research detailing the impact of ants and termites on soil turnover, soil movement, and
secondary impacts related to mound construction and abandonment. A review of relevant
archaeological studies follows which demonstrates the need for further research in this area.
The methods used to survey, excavate and analyse active termite and ant nests from
Berajondo are described in Chapter Three. A battery of quantitative and qualitative measures
are detailed, including pH testing, Munsell® soil colour comparisons, particle size analysis,
micromorphological analysis and image analysis.
Chapter Four presents the results of analyses described in Chapter Three. Image analysis,
particle size and micromorphological features emerge as effective criteria for discriminating
between ant- and termite-impacted deposits and control samples.
The study is concluded in Chapter Five with a discussion of the impact of findings on current
understandings of ant and termite bioturbation on the formation and alteration of
archaeological deposits and a consideration of future research directions.

5
CHAPTER TWO
TAPHONOMY, ANTS AND TERMITES: STUDIES OF
BIOTURBATION IN THE SOIL SCIENCES AND ARCHAEOLOGY
Introduction
Previous archaeological and soil science studies concerning ant and termite movement of soil
and sediments are reviewed and methodologies critiqued to establish a robust framework for
the current study. The review demonstrates that very little research has been undertaken in
this area, emphasising the need for research to be conducted in order to better understand the
impact of post-depositional ant and/or termite activity in archaeological sites.
Taphonomy
Until recently, taphonomic research in archaeology has centered around processes that affect
vertebrate remains (e.g. Hudson 1993; Kent 1981, 1993; Lyman 1994; Lyon 1970; Walters
1984, 1985). However, over the last two decades this emphasis has begun to shift with
increasing acknowledgement that taphonomy impacts on the life histories of all things that
enter the archaeological record (see Hiscock 1985:83). Despite these developments,
taphonomic studies still focus on describing processes leading to deposition, with processes
affecting archaeological sediments, ecofacts and artefacts after deposition largely neglected.
Brian (1994:23) identified that the emphasis on faunal remains stems from the origins of
taphonomy in palaeontology and notes that definitions of taphonomy are beginning to be
adjusted to include “a range of processes and materials”. Similarly, Hiscock (1990:35)
questioned the view of taphonomists that only bone is affected by taphonomic processes
arguing that “archaeology also deals with a wider variety of artefacts and ecofacts such as
stone artefacts, hearths, buildings and so on … why should these objects be exempt from the
taphonomic processes that act on bone?” As Walters (1990:21) noted, “taphonomy underlines
archaeological work, surrounds it, and relates aspects one to the other”. While, Australian
archaeologists recognise and acknowledge that the current scope of taphonomic studies are
problematic, very little research has been conducted into taphonomic processes. The research
that has been done does not extensively examine the potential impact of bioturbation on the
formation of archaeological sites, but rather an acknowledgement of the processes taking
place.

6
Schiffer (1972:156) argued that most archaeologists assume that “the spatial patterning of
archaeological remains reflects the spatial patterning of past activities”. To address these
issues Schiffer developed a series of detailed site formation models focusing on cultural
formation processes which describe the “lifeway” of the artefact (Figure 2). Schiffer‟s model
focuses on procurement, preparation, consumption and discard processes, but does not
account for post-depositional processes. These models assume that once an object enters the
archaeological record it stays in that location until it is excavated.
Figure 2. Schiffer‟s flow chart for durable elements (after Schiffer 1972:158).
As shown in Schiffer‟s (1972) flow chart for durable elements, the archaeological context of
artefacts is given little consideration in modeling the lifeway of the artefact. Whilst it is
important to understand the cultural use of artefacts, it is equally important to understand the
processes that affect these items after they have entered the archaeological record. Schiffer‟s
(1972) model emphasised that „context‟ is imperative in understanding cultural formation
processes. However, if the „archaeological context‟ is not given appropriate consideration any
understandings of the „cultural context‟ are less robust.
Soil Science Studies of Ants and Termites
Soil scientists have been studying the effects of ants and termites on soil and sediments for
many years, mostly in the context of agricultural applications (e.g. Cowan et al. 1985; Lobry
de Bruyn and Conacher 1990). Some of these studies have involved the excavation of ant and
termite nests, along with detailed recording of mound size and density, soil turnover rates,

7
particle size distributions, and a chemical analyses of soils and sediments. Allen and
O‟Connell (2003:13) argued that many of these soil science studies demonstrate that ants and
termites have a significant impact on the position of artefacts within archaeological sites, and
they also point out that archaeologists rarely cite this body of work.
The potential impact of ant and termite activity on archaeological deposits is evident in
calculations of soil movement. Williams (1968:153) found that some Australia termites bring
0.48m³ to the surface each year, causing displacement and concentration of larger sediments.
Briese (1982:380) has shown that some species of Australian ants move as much as 350-
420kg of soil to the surface each year. Carlson and Whitford (1991:135) found that, in
America, approximately 650kg/ha of soil had been moved by the activity of a single ant
colony. According to Eldridge and Pickard (1994:329) the common ant, Aphaenogaster
barbigula (ant), accumulates as much as 336g m² per year through nest building in Australia.
Lobry de Bruyn and Conacher (1990:64) found that termites in Senegal are capable of moving
2000kg/ha of soil to the surface every year. Considering that some termite colonies remain
active for as much as 700 years (McBrearty 1990:115; see also Watson 1967), the potential
impact of soil turnover on archaeological deposits is staggering.
Dostál et al. (2005:128) found that Lasius flavus (ant) colonies , in Slovakia, build up to 2500
mounds ha-¹. Wood and Johnson (1978:321) pointed out that there may be 40 or 50 mounds
per acre at some American sites. When these mounds are abandoned new ones are built.
Consequently, “a very considerable percentage of the total area may be worked over in a
relatively short time”, with abandoned mounds eroding and contributing to the top soil.
Humphreys and Mitchell (1988:265) found that soil up to 30-50cm deep may be overturned in
less than 1000 years in some tropical settings, with much longer rates estimated for arid
regions. Also, McBrearty (1990:116) stated that, in Zaire, 2,400,400kg of soil per ha may be
contained in a single Macrotermes (termite) mound at any given time. Mounds of meat ant
(Iridomyrmex greensladei), found in New South Wales, can measure up to 16.3cm high and
249cm in diameter (Nkem et al. 2000:612), while the largest termite mound ever recorded
was nine metres tall and had a diameter of 30m (Hole 1981:88). Given these studies, it is easy
to question the stratigraphic integrity of archaeological sites proximal to areas of ant and
termite activity.
Mounds may also be shared by different species of ants as well as termites. In their
excavation of sugar ant (Camponotus intrepidus) nests in New South Wales, Cowan et al.

8
(1985:100) discovered that one of the mounds was also shared by termites and “a small black
undetermined ant”. In the Northern Territory, Williams (1968:153) suggested that some
abandoned termite mounds may have been re-colonised by ants. Unlike the nests of other
species, these mounds may be occupied for long periods of time with their size increasing
over time (Dostál, et al. 2005:129).
Nkem et al. (2000:617) noted that disturbance also comes from the construction and
maintenance of foraging tracks, some of which may extend for up to 200m. McBrearty
(1990:118) also noted that sediments are brought to the surface by termites to cover foraging
tracks and sometimes to cover the food source itself.
Other processes affect stratigraphic integrity as a direct result of ant and termite activities.
Nkem et al. (2000:617) found that “mounds, with a higher percentage slope (around 7-8%),
would encourage erosion agents to redistribute soil material in the mounds after occupation,
with possible impacts on temporal and spatial variability of soil properties.” Over time
inactive mounds are eroded to contribute to the surrounding top soil and as the soil within
nests settles and tunnels collapse, artefacts may be displaced both vertically and horizontally
in deposits.
Eldridge and Pickard (1994:324) reported that soil deposited near nest entrances often has a
different texture and structure to the surrounding soil, making it more susceptible to erosion
by wind or water. They also suggest that it “may have a different nutrient status to that of the
surrounding soil”, which can make it an unattractive habitat for trees, also contributing to
erosion as tree roots help to stabilise the soil matrix. Similarly, Hole (1981:91) noted that
“where vegetative cover is lacking, mounding and construction of tributary runways by
termites accelerate erosion by wind and water”. As nothing is holding the soil in place there is
probably a higher rate of erosion that exposes lower layers to the elements causing more
erosion, further affecting the movement of objects within the deposit.
Cowan et al. (1985:103) have shown that ants can introduce foreign material to deposits as
part of the mound surface cover, including “quartz grains, sandstone fragments, charcoal,
twigs, eucalyptus buds or fruit, and miscellaneous materials such as „blue metal‟ aggregate,
bitumen particles from sealed road surfaces, and fragments of glass from car windscreens”.
The study found that nests located 10-15m from the road contained less than 10% of “blue-
metal” aggregate with percentages increasing towards the road (Cowan et al. 1985:104).

9
All of the processes outlined above have implications for the formation of archaeological
deposits. Documentation of mound size is significant as it indicates the volume of sediments
that can be moved by ants or termites (see McBrearty 1990, Nkem et al. 2000 and Hole
1981). Measuring soil turnover and movement rates confirm the initial indications of high
rates of this activity (see Williams 1968 and Dostál 2005). These findings have important
implications for the context of the artefact and its position in the archaeological record. Table
1 summarises data on soil movement by ants and termites reported in the soil science
literature.
Archaeological Studies of Ants And Termites
Although there is a broad literature concerning general bioturbation processes (see for
example Specht 1985 and Stein 1983), very little is directly relevant to ant or termite
disturbance in archaeological sites, and even fewer studies are relevant to Australian
archaeological sites.
Some archaeologists have recognised that ants and termites have a direct effect on the
movement of artefacts. In the United States, Canada and England, Wood and Johnson (1978)
examined many different processes that affect soil and sediment movement including faunal
turbation by burrowing mammals, crayfish, insects and earthworms. Ants were found to have
transported glass beads from burials to the surface and fragments of pottery from their
original position in the stratigraphic sequence, through a culturally sterile layer, to the surface
(Wood and Johnson 1978:321).
McBrearty (1990) presented an extended consideration of termite disturbance in African
archaeological sites, including mound densities and distribution, effects on archaeological
profiles, stone lines and soil biomantles, textural properties, mineralogical properties,
chemical properties, bone preservation and past and present microenvironmental effects. At
the FxJj50 site in northern Kenya, Bunn et al. (cited in McBrearty 1990:113) reported that
conjoining artefacts were found “vertically separated by considerable thickness of deposit” of
up to 1m, ascribed to movement caused by termites.
“Stone lines” are created when the size of sediments in soil profiles is too large for termites to
carry (Hole 1981; McBrearty 1990; Williams 1978). As a result, larger material is left behind
while smaller material is moved to the surface. Wood and Johnson (1978:324) noted that

Table 1. Summary of reported mound characteristics and soil movement by ants and termites
Family (ants) Species Mound
Height
Mound Area Soil Turnover Mound Density References
Iridomyrmex Iridomyrmex greensladei
(meat ant)
16.3cm Diameter: 249cm Nkem et al. 2000
Iridomyrmex Purpureus
(meat ant)
5-70cm 1.2m²
160x125cm
65x40cm
270x230cm
Diameter: 10-15cm
1.5-2m long
11,869cm/y
400cm³/ha/yˉ¹
150-180kg/ha/y
0.4% of surface area Briese 1982;
Cowan et al. 1985;
Ettershank 1968;
Greenslade 1974.
Camponotus Camponotus Intrepidus
(sugar ant)
20.4cm 55x39cm max. volume 11.1
50kg/ha
ˉ5g/m²/y
Cowan et al. 1985;
Humphreys and Mitchell 1988
Aphaenogaster Aphaenogaster sp.
(common ant)
150mm 10-20mm 0.9% of surface area Eldridge 1993
Formica Formica cinerea (prairie
ant)
40cm Diameter: 140cm 1.7% of surface area
0.1mm/y
Baxter and Hole 1967;
Carlson and Whitford 1991;
Hole 1981;
Lasius Lasius flavus (yellow
meadow ant)
2500 mounds haˉ¹ Dostál et al. 2005
Family
(termite)
Odontotermes
transvaalensis
1.5m Diameter: 4m 100kg haˉ¹-300 000kg
haˉ¹
0.1%-10% of the
surface
Wild 1975;
Wood 1988
Odontotermes
Tumultitermes Tumultitermes hastilis 75cm Diameter: 40cm 0.48m³ 500 mounds/ha
1108 haˉ¹
Lobry de Bruyn and Conacher 1990;
Williams 1968,1978.
Tumultitermes pastinator 50cm Diameter: 70cm 500 mounds/ha
125 haˉ¹
Lobry de Bruyn and Conacher 1990;
Williams 1968, 1978.
Nasutitermes Nasutitermes triodiae 500cm Diameter: 200cm 0.002cm/yr 5 haˉ¹ Lobry de Bruyn and Conacher 1990;
Williams 1978.
Drepanotermes Drepanotermes rubriceps 5cm Diameter: 150cm 89 haˉ¹ Lobry de Bruyn and Conacher 1990;
Williams 1978.
Macrotermes Macrotermes bellicosus 9m 3m 6m³ 14.8 mounds/ha in
Nigeria
McBrearty 1990;
Pomeroy 1976b;
Sands 1965;
Wood 1988.
Macrotermes Macrotermes sp. 9m 30m 2,400,400kg/ha in Zaire
0.3 t/haˉ¹yˉ¹ 10-40 haˉ¹in Uganda
30% of surface area in
Zaire
Lobry de Bruyn and Conacher 1990;
McBrearty 1990;
Meyer 1960;
Pomeroy 1976a, 1977.
10

11
the “process of upward movement of subsoil fines brought to the surface by termites will
eventually produce a „biomantle‟ many meters thick without horizons and result in a „lag‟
concentration of resistant stones at a depth” (Figure 3).
Figure 3. Stone line in road section in Africa attributed to termites (Wood and Johnson 1978:324).
In Australia the rockshelter site of Nauwalabila I in Arnhem Land with claimed occupation
before 50,000BP has been the centre of debate concerning potential termite disturbance.
O‟Connell and Allen (1998:139) argued that termites may have been a significant agent in the
displacement of artefacts and charcoal at the site. When Nauwalabila I was originally
excavated in 1972-1973 by Kamminga (Jones and Johnson 1985:165), no mention was made
of any possible disturbance within the site. When it was re-excavated in 1981 by Jones and
Johnson (1985:172-173; Bird et al. 2002:1062) a rubble layer containing artefacts was
discovered at the base of the deposit originally thought by Kamminga to be bedrock (Jones
and Johnson 1985:172). According to Jones and Johnson (1985:173), Kamminga‟s lowest
artefact came from 2.25m, however the lowest artefact recovered by Jones and Johnson‟s
subsequent excavation was recovered at 2.77m, within the rubble layer (Bird et al. 2002:1063;
O‟Connell and Allen 1998:135). The stratigraphic profile of Nauwalabila I clearly shows the
rubble layer discovered overlying bedrock (Figure 4).
This feature bears a striking similarity to the stone lines described by Hole (1981), Williams
(1978), McBrearty (1990) and Wood and Johnson (1978) (Figure 3). Despite this discovery

12
Jones and Johnson (1985:173) stated “that there is a high degree of stratigraphic integrity in
this site, with no obvious disturbance”.
Figure 4. Stratigraphic profile of Nauwalabila I, showing the rubble layer overlying bedrock (Bird et
al. 2002:1063).
O‟Connell and Allen (1998:139) subsequently argued that the rubble layer at Nauwalabila I
was formed by termite activity. Bird et al. (2002:1070) maintained that the level of insect
activity at the site is low on the basis of a particle size analysis that showed no “decrease in
the proportion of fine material at depth at Nauwalabila suggesting that disturbance by termites
has not been large”. Despite this statement, their particle size analysis results demonstrate that
there is “a decrease in the proportion of fine material at depth” (Bird et al. 2002:1067). Whilst
there is no clear decrease in the amount of silt and clay there is a decrease in sand and an
increase in gravel. They suggested that the observed distribution of silt and clay at
Nauwalabila I may have formed through the action of a fluctuating groundwater table.
However, they later acknowledge that charcoal may have fallen down ant or termite galleries
(Bird et al. 2002:1072).
These findings indicate the probability that there was termite activity at Nauwalabila I before,
after or during the presence of a high groundwater table. If this is the case, then the site has
been disturbed by both processes, casting further doubt on the integrity of the deposit and the
association of the 50,000 year old dates with human occupation. The documented presence of
termite or ant mounds at other archaeological sites across northern Australia (see Clarkson
and David 1995:29; David 2002:22; Morwood and Dagg 1995:109; Morwood et al.

13
1995:136) is yet to be investigated. The indications of ant and termite presence at these sites
suggests that the potential complexity of analysing archaeological deposits, like that of
Nauwalabila I, may be widespread.
Summary
Studies by soil scientists demonstrate that ants and termites are likely to have a significant
impact on the formation and post-depositional disturbance of archaeological sites. Although
archaeologists in Australia have speculated about the impact of insect bioturbation at
archaeological sites no analytical methods have been rigorously tested to distinguish
ant/termite affected soils. The next chapter addresses the development of such methods.

14
CHAPTER THREE
METHODS
Introduction
A case study is used to examine the potential effects of ants and termites on archaeological
deposits. Samples from in situ ant and termite nests from Central Queensland were analysed
to investigate the efficacy of methods in differentiating ant- and termite-impacted deposits.
Methods were selected to characterise differences in soil structure and content between ant
and termite nests and control samples. This chapter describes the case study and outlines
survey, excavation and sampling procedures before detailing the laboratory methods, using
pH, Munsell® colour, particle size analysis, micromorphology and image analysis.
Case Study: Berajondo
Site Background and Description
Samples for this study were collected from active ant and termite nests at Berajondo, a
pastoral property in Central Queensland. Berajondo is a 50ha property located 61km north of
Bundaberg and 39km southeast of Miriam Vale. The major soils in the region are dermosols,
kandosols, sodosols and tenosols (Donnollan et al. 2004). Berajondo has one 6ha cleared
paddock, bordered on all sides by open dry sclerophyll forest (Figures 5-6). The site was
selected for sampling owing to good accessibility and the high density of ant and termite
nests.
Fieldwork was conducted over two seasons in October and November 2007, beginning with a
systematic survey of the cleared paddock. The local topography and location of each mound
were plotted with both a hand-held GPS (Garmin® GPS map 60CSx) and EDM (Nikon®
Pulse Laser Station NPL-332). Mound length and width was calculated by measuring along
the longest axis of the mound and then the widest section at right-angles to this axis. Mound
height was measured with a local datum, autoset level and stadia rod. Any cleared foraging
tracks associated with mounds were recorded and their length measured using string and a
tape measure. The degree of weathering visible was also described and the number of visible
entrances counted. Photographs were taken of each mound facing, north, south, east, west and
in plan view.

15
Figure 5. The cleared paddock at Berajondo (Photograph: Sue O‟Brien).
Sediment samples (c.200g) were taken from 46 mounds and were given Field Specimen (FS)
numbers. From those 46 mounds 19% were occupied by Nasutitermes sp., 67% Iridomyrmex
purpureus, 4% Camponotus nigriceps, 2% Rhytidoponera metallica, 2% Polyarchis
(Hagiomyrma) and 6% of the mounds were dormant. For laboratory analysis, sediment
samples were taken from the Nasutitermes sp. and Iridomyrmex Purpureus nests. pH values
and Munsell® Soil Colour Chart tests were determined in the field for each sediment sample.
Live specimens were collected from each mound, and field identifications were confirmed by
Mr Greg Daniels at The School of Integrative Biology, University of Queensland. The field
recording form is presented in Appendix A and a summary of the data for each mound,
appears in Appendix B.
In the second field season conducted between 22-26 November 2007 five trenches of c.5m-
long, 1m-wide and 2.5m-deep were excavated through five mounds with a backhoe (Mounds
#1, #3, #6, #23, #25) (Figure 7). Each trench profile was photographed and drawn and
sediment samples taken from each stratigraphic unit and from a control wall. The control wall
was the western wall of Mound #1 (Figure 6). Segments of Polyvinyl Chloride piping were
pushed into the stratigraphic profile to encase the sediments for use in Micromorphological
analysis. The Micromorphology samples were taken from Mound #1, Mound #3 and the
control wall. Owing to time constraints, only sediments from Mound #1, Mound

Figure 6. Map of the cleared paddock at Berajondo, showing the location of recorded and excavated ant and termite mounds.
16

17
#3 and the control wall were subject to pH, Munsell®, particle size analysis and image
analysis in the laboratory, to compliment the micromorphological analysis.
Ant and Termite Mounds Analysed
The mounds selected for excavation are typical of the Iridomyrmex purpureus and
Nasutitermes sp. nests described in the literature.
Iridomyrmex Purpureus (meat ant) Mound #3
(Figure 8)
Iridomyrmex purpureus nests are built on open sites that have good drainage and receive
generous sunlight (Ettershank 1968:716). The sites chosen by this species receive more than
20cm rainfall per year and are “associated with eucalypts and acacias but never in forests with
a closed canopy” (Ettershank 1968:716). Iridomyrmex purpureus nests are distributed
throughout Australia (Ettershank 1968:716; 1978:32).
Iridomyrmex purpureus nests are immediately recognisable by the presence of gravel, twigs
and charcoal that make up the mound cover, or armour (Cowan et al. 1985:103). In some
cases the nests are also covered with eucalypt fruit and ironstone nodules (Ettershank
1968:716), nests are generally low, oval shaped mounds. The mounds studied by Cowan et al.
(1985:101) are circular or elliptical in shape and had a mean dimension of 160cm x 125cm
and 23cm in height. Most mounds are surrounded by a cleared area. However, some younger
nests are bordered by vegetation (Cowan et al. 1985:101).
Nests typically have many entrances amongst the mound cover (Ettershank 1968:718).
Ettershank (1968:718) and Greenslade (1974:8) noted that the number of entrances in the top
of the mound varied seasonally. Each hole connects to a “single set of galleries and chambers
linked by a vertical shaft” (Cowan et al. 1985:101). Most of the galleries examined by Cowan
et al. (1985:101) were in the upper 30cm of the mound, although some also occurred within
the subsoil (see also Greenslade 1974:9).
A large nest may have a number of smaller nests (termed „satellite nests‟) connected by trails
(Ettershank 1968:716). Other trails that are sometimes referred to as „foraging tracks‟ lead
from the nest to trees where workers collect “honey dew from homopterous insects, dead
insects, and possibly nectar as food” (Ettershank 1968:716).

18
Figure 7. Backhoe sectioning Mound #1 at Berajondo (photograph: Dan Rosendahl).
Figure 8. Mound #3 (ant), facing north (Photograph: Cassandra Venn). Inset: Iridomyrmex
purpureus (Photograph: A. Wild 2006).
Greenslade (1974:8) noted an enlargement of nests after rain, with ants observed transporting
soil out of nests and depositing it on the surface. According to Greenslade (1974:8), the gravel
cover was also “continually renewed”. Ettershank (1968:718) stated that the galleries and
tunnels of Iridomyrmex nests are lined “with a cement of saliva and silt”. Ettershank
(1968:718) also found that the particle sizes within the nest fell mainly within the silt and
coarse sand size categories.
19
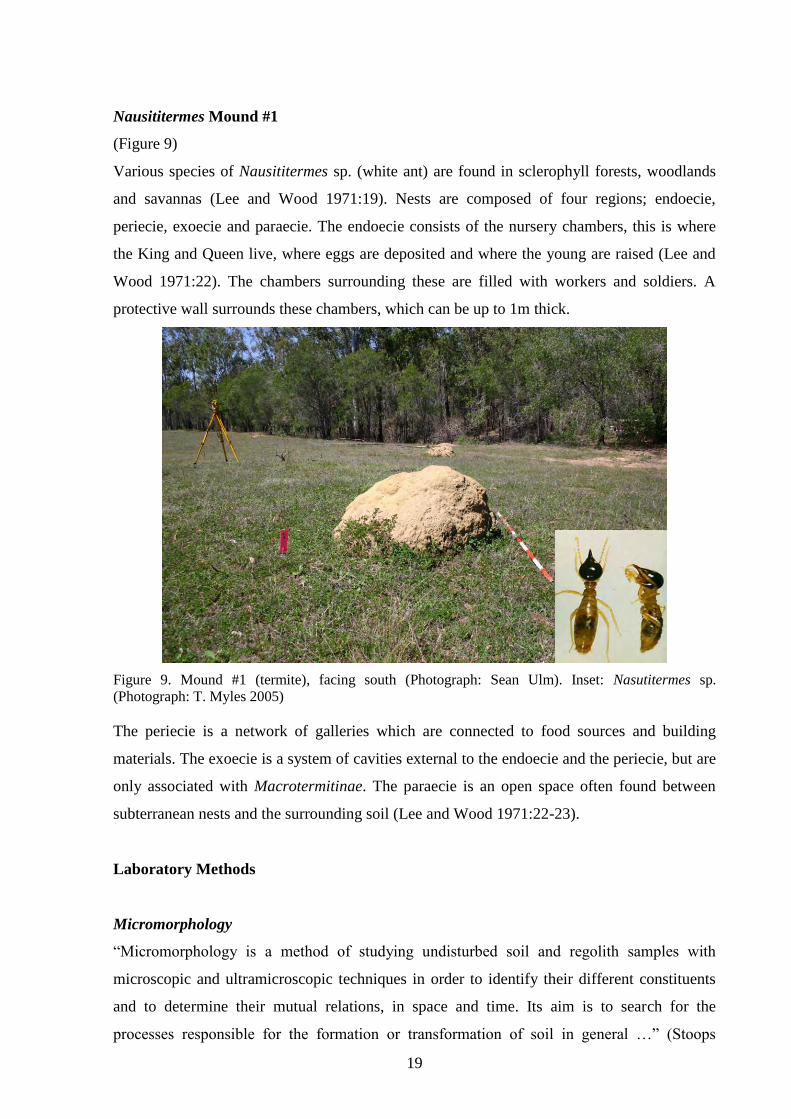
Nausititermes Mound #1
(Figure 9)
Various species of Nausititermes sp. (white ant) are found in sclerophyll forests, woodlands
and savannas (Lee and Wood 1971:19). Nests are composed of four regions; endoecie,
periecie, exoecie and paraecie. The endoecie consists of the nursery chambers, this is where
the King and Queen live, where eggs are deposited and where the young are raised (Lee and
Wood 1971:22). The chambers surrounding these are filled with workers and soldiers. A
protective wall surrounds these chambers, which can be up to 1m thick.
Figure 9. Mound #1 (termite), facing south (Photograph: Sean Ulm). Inset: Nasutitermes sp.
(Photograph: T. Myles 2005)
The periecie is a network of galleries which are connected to food sources and building
materials. The exoecie is a system of cavities external to the endoecie and the periecie, but are
only associated with Macrotermitinae. The paraecie is an open space often found between
subterranean nests and the surrounding soil (Lee and Wood 1971:22-23).
Laboratory Methods
Micromorphology
“Micromorphology is a method of studying undisturbed soil and regolith samples with
microscopic and ultramicroscopic techniques in order to identify their different constituents
and to determine their mutual relations, in space and time. Its aim is to search for the
processes responsible for the formation or transformation of soil in general …” (Stoops

20
2003:5). Micromorphology samples were prepared by the Sample Preparation Laboratory,
School of Physical Sciences, University of Queensland. Unfortunately, owing to limited
experience in the preparation of micromorphology thin sections at the facility, the samples
were not fully impregnated with resin, and the orientation of the samples was not taken into
consideration when sectioned, both key context requirements for micromorphological analysis
(Table 2). As a result, the available thin sections were only suitable for a small fraction of the
potential micromorphological analyses. However, the results obtained from the limited
analysis undertaken were considered to still be potentially informative. Descriptions follow
Bullock (1985) and Stoops (2003). The coarse/fine (c/f) limit for this analysis is set at 20µm.
The 12 thin sections were analysed using an Olympus® BX50 microscope with a rotating
stage, using plane-polarised (PPL) and cross-polarised (XPL) illumination. A grid was drawn
on each thin section, and six squares randomly selected for analysis. Point counting was used
to measure the frequency of grains of all sizes, in particular quartz, feldspar and organics.
From each square seven grains were measured for particle size analysis, and porosity was
estimated with the naked eye based on the area of the slides that voids covered.
Micromorphological analysis followed Stoops (2003), with the description of b-fabric,
microfabric, accommodation, coarse/fine (c/f) distribution, microstructure and the presence of
coatings in each sample. The sorting and size classification for each square was estimated
visually following Stoops (2003:48). For a glossary of terms used to describe the
micromorphology samples see Appendix C.
Table 2. Micromorphological samples, noting samples where context has been retained or lost as a
result of manufacturing faults.
Samples/Layer Context Retained Context Lost
FS#3 Control/Ap
FS#4 Control/AB
FS#5 Control/Bts
FS#6 Control/BC
FS#11 Mound #1/Crust
FS#12 Mound #1/Gallery
FS#14 Mound #1/AB
FS#15 Mound #1/Bts
FS#23 Mound #3/Ap
FS#24 Mound #3/AB
FS#25 Mound #3/Bts
FS#26 Mound #3/BC

21
National Institute of Mental Health (NIH) Image Analysis
NIH image analysis was used to measure the pore spaces or voids between the sediments in
each thin section, complementing the results obtained from micromorphological analysis. Due
to gallery structures in the nests and movement of the insects loosening different soil types,
porosity was considered an important indicator of ant or termite activity.
Each slide was scanned at 600dpi resolution. Scans were imported into ArcSoft
Photostudio®, cropped and converted to 8-bit-grayscale images. Each scan was then imported
into the public domain NIH Image program (available at http://rsb.info.nih.gov/nih-image/).
The scale was set at 236 pixels and the unit of length was set at centimeters, and the threshold
adjusted. A visual check was undertaken to ensure that all grains had been selected for
analysis and the noise setting adjusted to remove outliers. Radius was set at 3.0 pixels, 50
threshold and dark outliers were selected and the image porosity value recorded (pers comm.
A.M. Hart, University of Queensland 2008).
Particle Size Analysis
Particle size analysis was conducted in the Sample Preparation Laboratory, School of
Physical Sciences, University of Queensland. Through their extensive research of termite
nests, Lee and Wood (1971:25) have found that most species show a preference for finer
particle sizes and many nests have a larger amount of clay than surrounding soil. Also Carlson
and Whitford (1991:136) stated that Pogonomyrmex occidentalis (western harvester ant)
transport material in the order gravel > sand > silt > clay and have demonstrated that particle
size analysis is important for differentiating some species of ants. Lee and Wood (1971) have
undertaken similar research for termites. As a result particle size analysis was deemed a
useful indicator of ant- or termite-disturbed soil.
The methods used in this particle size analysis were provided by Mr Peter Colls (School of
Physical Sciences, University of Queensland). Samples were weighed and 15-20g randomly
separated into a weighing tray. Each sample was placed in a falcon tube with c.0.3g of sodium
polymetaphosphate and filled to 50ml with distilled water. Samples were mixed on a
Heidolph® reax top for approximately 1 minute, then placed in a water bath at 90C for three
hours.
Samples were wet sieved through 2mm, 500m, 250m and 63m screens into buckets. Each
sieve fraction was decanted onto an aluminium tray and placed on a stove at the lowest setting

22
for 1 hour to dry. The residual contents of the bucket were stirred, 500ml poured into a beaker
and 50ml poured into a falcon tube. Each falcon tube was placed in an Eppendorf® centrifuge
and spun for 6 minutes at 750rpm.
Clay and silt fractions were separated and poured onto aluminium trays and placed on the
warm stove to dry. The remainder of clay and silt left in the bucket was also poured into
aluminium trays and placed on the stove to dry. After drying, the samples were weighed and
the percentages of 2mm, 500m, 250m, 63m, silt, clay and the organic content of each
sample established. Weighing the sample gives a percentage of the overall distribution of that
size fraction in the sample.
The only exception to these methods was FS#13, which was soaked in 50ml hydrogen
peroxide and 50ml water in order to break down the high organic content before particle size
analysis could be conducted. Percentages of each size fraction within each layer were
calculated from the total sample, these percentages are presented in Chapter Four.
pH Values
pH testing was conducted using a CSIRO® Inoculo field pH kit. Three replicates per sample
were taken to improve accuracy and the most common result accepted. As mentioned above
termite mounds are constructed using excreta, plant remains and saliva as well as soil (Lee
and Wood 1971:23), therefore pH was considered a potential indicator of ant or termite
presence within archaeological deposits.
Munsell® Soil Colour Chart Tests
The universal Munsell® Soil Colour Chart was used to determine soil colour differences in
the sediment samples. This test was carried out on both dry and moist soil and sediments in
the laboratory to obtain an accurate representation of soil colour. The dry Munsell® reading
was undertaken first followed by the wet Munsell®. A spray bottle containing Milli Q water
was used to saturate dry soil and sediments. It was hoped that the organic rich soils and clay
soils to the nests would have consistently different colours.
Summary
The methods of analysis outlined in this chapter were selected on the basis of their ability to
characterise sediments and therefore potentially distinguish sediments impacted by ant and
termite activity. The results of the application of these methods to the Berajondo samples are

23
outlined in the next chapter. See APPENDIX D for a summary of the methods applied to all
samples taken.

24
CHAPTER FOUR
RESULTS AND DISCUSSION
Introduction
This chapter presents the results of analyses conducted on samples taken from Berajondo. The
results are presented by analysis type, including pH, Munsell colour, particle size analysis,
micromorphological analysis, mound density, and NIH image analysis.
Mound Stratigraphic Descriptions
Four stratigraphic units (Ap, AB, Bts, BC) were identified in each excavated section. Figures
10-12 present the stratigraphic profiles and the unit descriptions are in Tables 3-5 (see
Appendix E for sections and descriptions of the unanalyzed Mounds #6, #23 and #25).
Figures 13-16 are photographs of the cross-sections of Mounds #1 and #3.
Micromorphology
Micromorphological analysis was conducted on 12 samples, from Mound #1, Mound #3 and
the control wall from Berajondo (refer to Figures 10-12). The Ap sample of Mound #3
exhibited two separate layers which were analysed separately; Ap Layer 1 and Ap Layer 2.
Results are presented for each sample and are focus on particle size and sorting,
microstructure and porosity, microfabric and organics. Description of particle size, sorting,
microstructure, porosity, microfabric and organics for each sample is presented below.
Control Trench
Ap Layer - an organic rich sandy loam with subangular blocky interpedal structure
The c/f limit is 20µm.The average particle size is 249µm, the majority of which comprises
quartz unaccommodated. The microstructure is complex with dominant chamber, channel and
vugh voids. Decomposing and fresh celled organics are present, as well as lignified and
parenchymatic tissue residues and charcoal. Grains in this sample appear to be relatively
unsorted, with sizes ranging from 50µm to 1200µm. Porosity is c.30%.
Most grains, voids and organics have a hypocoating of silt and organics. The c/f distribution
is close porphyric. The b-fabric consists of stipple speckled, granostriations and

25
Table 3. Stratigraphic unit descriptions, Control Trench, southwest wall, Berajondo.
Layer Description
Ap Plough horizon, organic, rich and homogenous. Small to large
rootlets, more in Ap than AB.
AB Transitional, silty clay with clay mottling. Grades towards the base of
the horizon. Charcoal size 0.5cm to 1cm. Small gravel 0.5cm in
diameter. Small to large rootlets.
Bts t=clay rich. s=iron oxide and manganese. Loamy clay organic
mottling from decaying roots.
BC Sandy loam. Mottled with manganese and iron.
Figure 10. Stratigraphic section, Control Trench, southwest wall, Berajondo.

26
Table 4. Stratigraphic unit descriptions, Mound #1 (termite), east wall, Berajondo.
Layer Description
Ap Horizon under mound mixed (with the mound).
AB Transition, silty clay with clay mottling. Grades towards the bottom of
the horizon. Charcoal size 0.5cm to 1cm. Small gravel 0.5cm in
diameter. Small to large rootlets.
Bts t=clay rich. s=iron oxide and manganese. Loamy clay. Organic
mottling from decaying roots.
Figure 11. Stratigraphic section, Mound #1 (termite), east wall, Berajondo.

27
Table 5. Stratigraphic unit descriptions, Mound #3 (ant), south wall, Berajondo.
Layer Description
Ap and AB Beneath the ant mound. Mixed by ants.
Bts t=clay rich. s= iron oxide and manganese. Loamy clay. Organic
mottling from decaying roots.
BC Sandy loam. Mottled with manganese and iron.
Figure 12. Stratigraphic section, Mound #3 (ant), south wall, Berajondo.

28
Figure 13. Cross-section of Mound #1
(termite), facing east (Photograph: Dan
Rosendahl).
Figure 14 . Cross section of Mound #3 (ant),
facing south (Photograph: Dan Rosendahl).
Figure 15. Cross-section of Mound #3 (ant),
facing south. The blue markers show the
location of galleries. New galleries
appeared at the base of the trench during
excavation (Photograph: Dan Rosendahl).
Figure 16. Control wall, facing west.
(Photograph: Ann-Maria Hart)
porostriations. The microfabric is apedal to weakly developed with no separation and the ped
is unaccommodated. The microstructure is complex with dominant chamber, channel and
vugh voids. Decomposing and fresh celled organics are present, as well as lignified and
parenchymatic tissue residues and charcoal.
AB - an organic rich sandy clay with subangular blocky interpedal structure
The average particle size is 259µm, the majority of which are quartz grains. Grains are
unsorted, with sizes ranging from 30µm to 850µm. Porosity is c.20%. Most grains and voids
have a hypocoating or coatings of clay. The c/f limit is 20µm. The c/f distribution is close
porphyric. The b-fabric consists of stipple speckled, granostriations (Figure 17) and
porostriations. The microfabric is apedal to weakly developed with no separation, the ped is

29
unaccommodated. The microstructure is complex with common chamber, channel and vugh
voids present. There is fine amorphous organic matter throughout the thin section.
Bts - a sandy clay with angular blocky interpedal structure
The average particle size is 262µm, which are quartz grains. The clay content is c.40%.
Grains are moderately sorted, with quartz grains ranging in size from 60µm to 750µm. The
porosity is 10%. Most grains and voids have a clay coating. The c/f limit is 20µm.The c/f
distribution is single spaced to double spaced porphyric. The b-fabric consists of unistrial to
stipple speckled, granostriations and porostriations. The microfabric are subangular blocky
peds, moderately developed, weakly separated. The ped is partially accommodated. The
microstructure is complex with common chamber, channel, vugh and planar voids present.
There are some lignified and parenchymatic tissue residues present. There is also some silt or
decayed organic matter infilling some of the larger voids (Figure 18).
BC - a sandy clay loam with an angular blocky interpedal structure (Figure 19)
The average particle size of quartz grains in this sample is 313µm. Clay content is 40-50%
and the coarse sand content is c.50%. Grains are well sorted, ranging from 60µm to 700µm.
Porosity is <5%. Most grains and voids have a clay coating. The c/f limit is 20µm. The c/f
distribution is concave gefuric. The b-fabric consists of monostriations, granostriations and
porostriations. The microfabric consists of angular blocky peds which are moderately
developed, weakly separated. The ped is unaccomodated. The microstructure is angular
blocky, the common voids that are present are planar. There is a small fraction of
decomposing tissue and organ residues present.
Mound #1 Termite Mound
Ap/Mound Crust - an organic rich sandy loam with a subangular blocky interpedal structure
The average particle size is 205µm, which are quartz grains. Grains in this sample are
unsorted, ranging from 60µm to 460µm. Porosity is 10%. Around the edges of chambers, the
material consists of fine silts and clays. Most grains have a clay and silt coating and there is
an organic coating of voids (Figure 20). The c/f limit is 20µm. The c/f distribution is close
porphyric. The b-fabric consists of stipple speckled, granostriations and porostriations. The
microfabric is subangular blocky, weakly developed with no separation. The ped is
unaccommodated. The microstructure is complex with common chamber, channel and vugh
voids. There is some lignified and parenchymatic celled tissue (fresh and decomposing),

30
organ residue in various stages of decomposition and amorphous punctuations throughout the
thin section.
Ap/Gallery - The gallery structure consists of an organic rich sandy loam (mainly organic)
with a chamber interpedal structure
The average particle size is 184µm, comprising quartz grains. Grains are moderately sorted,
ranging from 50µm to 530µm. Porosity is 70%. Most grains and voids have an organic
coating (Figure 21). The c/f limit is 20µm. The c/f distribution is double spaced coarse
enaulic. The b-fabric is unistrial and porostriated. The microfabric consists of subangular
blocky peds which are weakly developed with no separation. The ped is unaccommodated.
The microstructure is complex with dominant chamber voids and rare channel and vugh
voids. There are decomposing organ residues present, as well as an organic pigment.
AB - an organic rich sandy loam with an apedal interpedal structure with channel and planar
voids
The average particle size in this sample is 248µm, comprising quartz grains. Grains are poorly
sorted, ranging from 60µm to 820µm. Porosity is 40%. Most grains and voids have a clay and
silt coating or hypocoating. The c/f limit is 20µm. The c/f distribution is close porphyric. The
b-fabric is granostriated and porostriated (Figure 22). The microfabric consists of subangular
blocky peds which are weakly developed with no separation. The ped is unaccommodated.
The microstructure is complex with common chamber, channel and vugh voids. There are
organic punctuations throughout the thin section and there is also a large amount of excrement
around most of the large voids (Figure 23).
Bts - a sandy clay with a subangular blocky interpedal structure
The average particle size is 280µm, comprising quartz grains. Clay content is c.40%. Grains
in this sample are moderately sorted, with the quartz grains ranging from 80µm to 1330µm.
Porosity is 25%. Most grains have a clay and silt coating of voids and quartz grains, most of
the chamber voids are filled with silt or organic matter. The c/f limit is 20µm. The c/f
distribution is double spaced coarse enaulic and close porphyric. The b-fabric consists of
stipple speckled and unistrial patterns with granostriations and porostriations. The microfabric
is subangular blocky, moderately developed, weakly separated, and is partially
accommodated. The microstructure is complex with common chamber, channel, vughs and
planar voids. There are also some vesicles present. There is some amorphous organic material

31
and some lignified and parenchymatic tissue residues. There are also fine organic
punctuations and some excrement near the voids.
Mound #3 Ant Mound
Ap Layer 1 - an organic rich sandy loam with a vughy interpedal structure
The average particle size is 270µm, comprising quartz grains. Grains are unsorted, ranging
from 30µm to 1630µm. Porosity is 30%. Most grains and voids have a silt and clay coating.
The c/f limit is 20µm. The c/f distribution is close porphyric. The b-fabric is stipple speckled,
granostriated and porostriated. The microfabric is apedal to weakly developed with no
separation. The ped is unaccommodated. The microstructure is a chamber microstructure.
There are charcoal, sclerotia, organ residues, organic pigment, and organic punctuations
present, as well as lignified and parenchymatic material that is fresh to red-brown.
Ap Layer 2 - an organic rich sandy loam with a complex interpedal structure with channels
and vughs
The average particle size is 219µm, comprising quartz grains. The grains in this sample are
unsorted, with sizes ranging from 50µm to 600µm. Porosity is 35%. Most grains and voids
have a clay and silt coating. The c/f limit is 20µm. The c/f distribution is close porphyric. The
b-fabric is granostriated, porostriated and stipple speckled. The microfabric is apedal to
weakly developed with no separation. The ped is unaccommodated. The microstructure is
chambered. There is organic pigment and organ residues present with varying degrees of
decomposition. There are also sclerotia and organic punctuations present as well as lignified
and parenchymatic celled material that is fresh to red-brown.
AB - an organic rich sandy loam with a complex interpedal structure with channels and vughs
The average particle size is 207µm, comprising quartz grains. Grains are unsorted, ranging
from 40µm to 780µm. Porosity is 30%. Most grains and voids have a silt and clay coating
(Figure 24). The c/f limit is 20µm. The c/f distribution is close porphyric. The b-fabric is
granostriated, porostriated and stipple speckled (Figure 25). The microfabric consists of
subangular blocky peds which are weakly developed with no separation. The ped is
unaccommodated. The microstructure is complex with common chamber, channel and vugh
voids. There are some lignified and parenchymatic tissues, sclerotia, amorphous organic
matter, fine amorphous punctuations and a small bone fragment.
32
Bts - a sandy clay with a massive interpedal structure
The average particle size is 256µm, comprising quartz grains. Clay content is c.30%. Grains
are poorly sorted, with the quartz grains ranging from 30µm to 860µm. Porosity is 15%. Most
grains and voids have a clay coating. The c/f limit is 20µm. The c/f distribution is closed to
single porphyric. The b-fabric is stipple speckled with granostriations and porostriations. The
microfabric is subangular blocky that is weakly developed, with no separation, and is
unaccommodated. The microstructure is chambered. There is some amorphous organic
material and some lignified and parenchymatic tissue residues that are fresh to brown-red.
There are also fine organic punctuations throughout the thin section.
BC - A sandy clay with a channel interpedal structure
The average particle size of the quartz grains is 286µm. Clay content is 50%. Grains in this
sample are well sorted, with sizes from 70µm to 790µm. Porosity is 40%. Most grains and
voids have a clay coating. The c/f limit is 20µm. The c/f distribution is double spaced coarse
enaulic and single to closed porphyric. The b-fabric is strial and stipple speckled with
granostriations and porostriations. The microfabric consists of subangular blocky peds that are
moderately developed and weakly separated. The ped is unaccommodated. The
microstructure is subangular blocky. The voids that are present are common planar, channel
and vesicles. There is lignified and parenchymatic celled tissue that is fresh to black,
amorphous organic matter and fine organic punctuations. Some of the voids are filled with
degraded black amorphous material that is either organic matter or silt.
Summary of Micromorphology
The results of the micromorphology analyses are in Table 6. The lower Bts and BC units
exhibit similar characteristics across all samples. However, there are marked differences in
the average particle size of the upper Ap and AB units of the samples from Mounds #1
(termite) and #3 (ant) compared to the control sample. The average particle sizes and particle
size ranges of both the mound crust and gallery layer differ substantially. The particle size
range of the crust (60-460µm) and of the gallery (50-530µm) have less than half the range of
the control (50-1200µm). The particle size ranges of the Ap Layer 1 and 2 of Mound #3 also
differ to that of the control. Layer 1 (30-1630µm) has a slightly larger range and Layer 2 (50-
600µm) has a slightly smaller range. Also of note is the porosity of the gallery structure in
Mound #1 which is 70%, whilst the porosity of the control is only 30%.

33
Figure 17. Granostriations indicated by the
arrow, Control Trench, AB Layer, PPL (plane
polarized) 100x.
Figure 18. Arrow shows silt infillng around the voids, Control
Trench, Bts Layer, PPL 100x.
Figure 19. Top arrow shows unistrial clay.
Bottom arrow shows a planar void, Control
Trench, BC Layer, XPL (cross polarized) 100x
Figure 20. Granostriation of clay and organics around gallery wall
indicated by the arrow. Mound #1, Mound Crust. PPL 100x
Figure 21. Gallery wall, Mound #1, Ap Gallery
Layer, PPL 100x. The arrow shows a quartz
grain.
Figure 22. Porostriation of silt, Mound #1, AB Layer, PPL 100x.
34
Figure 23. Excrement around voids, Mound
#1, AB Layer, PPL 100x.
Figure 24. Gallery, Mound #3, AB Layer.
Note the quartz, silt and clay porostriated
around the void XPL 100x.
Figure 25. Stipple speckled b-fabric, Mound #3 AB Layer PPL 100x.
Particle Size Analysis
Ap Layer
Figure 26 shows that the percentage of clay in the galleries of Mound #1 is more than four
times that of the clay content in the control sample, but the 500µm content is much lower than
the control. The silt and clay content of the mound crust is also higher than the control.
Mound #3 shows a similar particle size distribution to Mound #1.
AB Layer
The 2mm fraction in the AB layer of Mound #1 is three times higher than the 2mm content of
the control (Figure 27). In contrast, the particle size distributions for Mound #1 are lower in
the 500µm, 250µm, 63µm and silt than both Mound #3 and the control sample. The levels of
clay are approximately the same in all three samples. The 2mm content of Mound #3 is lower
than the control, but the other size classes are similar.
Bts and BC Layers
The percentage of 2mm sediments in the Mound #3 Bts layer (Figure 28) is more than five
times higher than Mound #1 and the control sample. Both Mound #1 and Mound #3 are lower

Table 6. Summary of micromorphology results.
Layer Control Mound #1 (termite) Mound #3 (ant)
Average
Particle
Size
Particle
Size
Range
Porosity Average
Particle
Size
Particle
Size
Range
Porosity Average
Particle
Size
Particle
Size
Range
Porosity
Mound Crust 205µm 60µm-
460µm
10%
Ap/Gallery/Ap Layer 1 249µm 50µm-
1200µm
30% 184µm 50µm-
530µm
70% 270µm 30µm-
1630µm
30%
Ap Layer 2 219µm 50µm-
600µm
35%
AB 259µm 30µm-
850µm
20% 248µm 60µm-
820µm
40% 207µm 40µm-
780µm
30%
Bts 262µm 60µm-
750µm
40% 280µm 80µm-
1330µm
40% 256µm 30µm-
860µm
15%
BC 313µm 60µm-
700µm
40-50% 286µm 70µm-
790µm
40%
35

37
in clay than the control sample. In all other size fractions all three samples are similar except
for the silt where the Mound #1 is higher than the control. In the BC layer (Figure 29) the
Mound #3 percentage is higher in 2mm, silt and clay, but lower in 500µm, 250µm and 63µm.
Refer to Appendix F for full particle size distribution data.
0
5
10
15
20
25
30
35
40
45
50
%
2mm 500µm 250µm 63µm <63µm <2µm
Size Fraction
Mound #1 Gallery
Mound #1 Crust
Mound #3 Ap
Control Ap
Figure 26. Particle size analysis, Ap layer, Berajondo. Note that the gallery and mound crust samples
of Mound #1 are included in the Ap layer for the purposes of this analysis even though they come
from different sections of the mound itself.
0
10
20
30
40
50
60
%
2mm 500µm 250µm 63µm <63µm <2µm
Size Fraction
Mound #1 AB
Mound #3 AB
Control AB
Figure 27. Particle size analysis, AB layer, Berajondo.

38
0
2
4
6
8
10
12
14
16
%
2mm 500µm 250µm 63µm <63µm <2µm
Size Fraction
Mound #1 Bts
Mound #3 Bts
Control Bts
Figure 28. Particle size analysis, Bts layer, Berajondo.
0
5
10
15
20
25
30
35
%
2mm 500µm 250µm 63µm <63µm <2µm
Size Fraction
Mound #3 BC
Control BC
Figure 29. Particle size analysis, BC layer, Berajondo. Samples were not taken from the BC layer of
Mound #1.
NIH Image Analysis
The results of the NIH image analysis, used to measure the porosity of each thin section, are
summarised in Table 7.The total area of pore spaces in the Mound #1 crust is 0.1187cm²
larger than in the control Ap Layer (Table 7). There is a marked difference between the
Mound #1 Gallery and the control. The area of the spaces in Mound #1 Gallery is 6.32124cm²
larger than the Control Ap. The area of pore spaces in Mound #3 Ap is 0.65797cm² smaller
than Control Ap, in contrast to the termite mound which is 6.32124cm² larger. The total area
in Mound #1 AB is 0.42904cm² larger than the Control AB, and the Mound #3 AB is
0.13636cm² larger than the Control AB. The total area of pore spaces in Mound #1 Bts is
0.94195cm² larger than Control Bts and Mound #3 Bts is 0.09022cm² larger than Control Bts.
The total area of Mound #3 BC is 0.02431cm² smaller than Control BC.

39
Table 7. Results of image analysis on Berajondo micromorphology samples.
Sample Count Total Area
(cm²)
Average Size
(cm²)
Area Fraction
Control Ap 347 0.70296 0.00203 1.1
Control AB 299 0.33676 0.00113 0.7
Control Bts 154 0.14482 0.00094 0.3
Control BC 107 0.06561 0.00061 0.1
Mound #1
Crust
186 0.82166 0.00442 1.3
Mound #1
Gallery
224 7.02420 0.03136 16.2
Mound #1 AB 310 0.76580 0.00247 1.5
Mound #1 Bts 394 1.08677 0.00276 2.7
Mound #3 Ap 57 0.04499 0.00079 0.1
Mound #3 AB 274 0.47312 0.00173 1.2
Mound #3 Bts 227 0.23504 0.00104 0.4
Mound #3 BC 52 0.04130 0.00079 0.1
pH
pH testing was conducted on all bulk sediment samples from Berajondo (Table 8) to detect
differences in the chemical structure between sediments in ant or termite constructed mounds
and control samples.
At Berajondo there are small but consistent differences in pH between the control trench and
Mound #1 in the Ap and Bts layers and between the control wall and Mound #3 in the Bts and
BC layers. The Bts layer within the Mound #1 and #3 trenches are more acidic than the
control sample, suggesting that termite and ant modification of sediments may result in lower
pH values for underlying sediments.
Table 8. pH values for Berajondo samples.
Layer Control Mound #1
(termite)
Mound #3
(ant)
Gallery/Ap 6 5.5 6
AB 6.5 6.5 6.5
Bts 6.5 5.5 5.5
BC 6.5 N/A 5
Munsell Colour
Table 9 shows that sediments in the termite gallery of Mound #1 are darker than the control
Ap sample. In Mound #3 the major differences in colour occur between the AB and BC layer,
with sediments underlying the ant mound consistently lighter than the corresponding control
samples.

40
Table 9. Munsell colour values for Berajondo samples. Control Mound #1 (termite) Mound #3 (ant)
Layer (dry) (wet) (dry) (wet) (dry) (wet)
Gallery/Ap 5/2 10YR
Grayish
Brown
4/2 2.5Y
Dark
Grayish
Brown
3/1 10YR
Very Dark
Gray
2.5/1 2.5Y
Black
6/2 2.5Y
Light
Brownish
Gray
4/2 2.5Y
Dark
Grayish
Brown
AB 5/3 2.5Y
Light Olive
Brown
6/4 2.5Y
Light
Yellowish
Brown
6/4 2.5Y
Light
Yellowish
Brown
4/4 10YR
Dark
Yellowish
Brown
8/4 2.5Y
Pale
Yellow
8/6 2.5Y
Yellow
Bts 6/8 10YR
Brownish
Yellow
5/6 10YR
Yellowish
Brown
6/6 10YR
Brownish
Yellow
5/6 10YR
Yellowish
Brown
7/8 10YR
Yellow
6/8 10YR
Brownish
Yellow
BC 6/6 10YR
Brownish
Yellow
6/6 10YR
Brownish
Yellow
N/A N/A 7/6 10YR
Yellow
8/2 2.5Y
Pale Yellow
Discussion
The diagnostic features resulting from the pH, micromorphology, image analysis and particle
size analysis are discussed in conjunction with the results obtained from the analyses of the
control samples.
Nasutitermes sp. (termite) Mound compared with Control Trench
Ap/Mound Crust
The average particle size in the crust of Mound #1 is 40µm smaller than the average particle
size of the control sample. The size range of particles in Mound #1 is 60-460µm where as the
size range for the control is 50-1200µm. These data suggest that termites selectively target
smaller size grains. The porosity measured in the image analysis shows a higher level of
porosity than the control. The quartz grains in the mound crust are coated with clay and silt,
whereas voids are coated with organics. Quartz grains and voids are unlikely to have coatings
in a disturbed profile because the matrix is constantly being moved around. Lee and Wood
(1971:30) have observed Nasutitermes exitiosus using saliva as a cement to build a mound
structure. They also report that Nasutitermes sp. use excrement to cement particles in the
outer walls of their mounds (Lee and Wood 1971:30). Therefore, the presence of an organic
/silt coating around the void walls suggests that this material has been used as an adhesive or
a stabiliser for the galleries.
Particle size analysis also shows that the mound crust is higher in clay and silt content than
the control Ap layer. This may be due to the building activities of the termites. Lee and Wood
(1971:25) have observed that most species favour “finer particle size fractions, with the result

41
that their mounds had a greater proportion … of clay than any of the soil horizons”. The b-
fabric in both the control and Mound #1 are the same, consistent with the Ap layer being part
of the near-surface disturbance zone. Interestingly the microfabric of Mound #1 is subangular
blocky, whereas the microfabric of the control is apedal, although the reasons for this are
unclear.
Ap/Gallery
The average particle size of quartz grains in the gallery are 60µm smaller than the control,
with a corresponding descrease in the size range. The percentages of clay, silt, very fine sand,
fine sand and medium sand only make up approximately 50-60% of the material. The balance
consists of organics as expected, since the gallery structure of Nasutitermes sp. is constructed
with undigested plant material and excreta (Lee and Wood 1971:35). Particle size analysis,
shows no 2mm material present, with minimal 500µm or <63µm (silt) material. The majority
of sediments are 63µm and <2µm. As noted in Chapter Two, the finer sediments are a result
of the termites preference for this material. However, the presence of this silty material is
minimal as it is composed mainly of organics (Figure 21). In contrast, the control sample is
dominated by 500µm, 250µm and 63µm material. Porosity, observed during
micromorphological analysis of Ap/gallery samples is much higher than the control. This is
due to the clearly constructed termite galleries.
All components in this sample have a coating of organics, with voids having a particularly
dense coating. The uniform orientation and porostriations of organics around the galleries in
this layer suggest that this is a result of the construction of the galleries rather than sediment
movement or the natural deposition of humic matter. pH values for this material are also
slightly more acidic than the corresponding control sample, due to the high organic content of
the gallery matrix.
AB
The size range of particles in the AB sample is almost the same as the control. The structure
of the Mound #1 sample is apedal, which suggests disturbance, whereas the control is
subangular blocky. The samples are otherwise very similar except for organic content. While
organics occur throughout both samples, there was a large amount of excrement found around
the edges of the larger voids in the Mound #1 sample. The presence of excrement around the
voids suggests termite activity in this layer. Of note in the particle size analysis is the 2mm
content, which reaches 60% in Mound #1, whereas the 2mm in the control only reaches 20%.

42
It could be inferred that the increase in 2mm material is the result of the movement of finer
material to higher levels in the mound by the termites. In conjunction with the excrement
found in this layer, the larger percentage of 2mm sediments is a strong indicator of termite
activity.
Bts
The average particle size in Mound #1 is 20µm larger than the control. The higher percentage
of coarse material in this layer is a further indication of the finer material being taken for
construction of the galleries. The size range of particles in Mound #3 is 30-1630µm, whereas
the control is 50-1200µm. Porosity is higher in this sample than in the control. Voids in
Mound #1 are infilled with a dark material that is either silt or organic matter. As this material
also appears (to a lesser extent) in the control sample, the most likely explanation is that it is
organic matter, possibly decayed roots. However, the results of the particle size analysis show
a higher level of silt in the sample than the control, which again is significant. This may
indicate that silt was placed in the voids deliberately. There was some excrement found near
the voids, indicating termite activity. The pH value for this layer is 5.5, which is higher in
acidity than the control and is likely to be due to the high level of excrement present
Iridomyrmex purpureus (ant) Mound compared with Control Trench
Ap Layer 1
The average particle size for the Ap layer 1 of Mound #3 is 20µm larger than the control Ap
layer. The porosity measured in this sample shows that it is higher than the control. The b-
fabric is stipple speckled; however, the control sample is also stipple speckled. The organics
found in both Mound #3 and the control are similar, as are the pH values and the particle size
results. In all other areas of the thin section the size range of particles is larger. An interesting
feature apparent in the micromorphological analysis are the porostriations around the voids
which consist of very fine sand, silt and clay (Figure 24). This is due to the gallery structure
of the nest. The finer material may have been used to reinforce the walls of the galleries.
Ap Layer 2
The average particle size for the second layer of Ap is 30µm smaller than the control and the
size range of particles is decreased by half. The complex interpedal structure, also contrasts
with the subangular blocky interpedal structure of the control. The quartz grains and voids
have a clay and silt coating, there is no clay coating apparent in the control. The clay and silt

43
coating may act as a cement to stabilise the gallery walls. The particle size analysis
demonstrates that there is a slight increase in clay and silt, which is consistent with the
coatings of the grains described above.
AB
The average particle size for the AB layer is 50µm smaller than the control. Like the Ap layer
the interpedal structure is complex with channels and vughs. The porosity measured for this
sample shows that it is higher than the control. While the b-fabric is mainly granostriated and
porostriated, it is the porostriations that are of the most interest (Figure 24). Many of these
larger voids are lined with very fine sand and silt. It is quite apparent that these are not natural
features and were constructed by ants. Although there is also organic material found in the
control sample, there is a larger amount and more variety than in the Mound #3 sample.
Particle size analysis showed that there is less of the 2mm size fraction than the control, but
the other size fractions are relatively similar in quantity. The decrease in 2mm particles
indicates a preference for the smaller material.
Bts
The interpedal structure of the Bts layer is massive, which indicates disturbance (Macphail et
al. 2003:81), whereas the interpedal structure of the control sample is angular blocky due to
the high clay content (Figure 18). The Mound #3 sample has a chamber microstructure, the
control has a complex microstructure including chamber, channel, planar voids and vughs.
The dominance of chamber voids in Mound #3 suggest construction by ants. The organic
content of this sample is higher than the control. The pH levels are lower than the control,
although any reason for this pattern is unclear. The particle size analysis showed that the 2mm
size fraction is higher than the control, whilst the silt and clay fractions are lower. The
increase in 2mm material may be due to the preference of smaller material and the decrease in
clay and silt confirms this. The porosity measured for this sample shows that it is slightly
higher than the control, suggesting ant activity in this layer.
BC
The average particle size in the BC layer is 30µm smaller than the control, however this is
probably owing to the fact that approximately half of the sample is clay. Again the interpedal
structures of both samples differ. The Mound #3 sample exhibits a channel interpedal
structure, whereas the control sample is angular blocky. The channel structure suggests some
level of disturbance in this layer. The c/f distribution also differs. A concave gefuric c/f

44
distribution in the control indicates that there has been less movement in that layer. Some
areas of the microfabric have a stipple speckled b-fabric, which also indicates disturbance. As
with the Bts layers of Mound #1 and the control, there is a dark matter infilling the voids. The
pH for this layer is also lower than the control sample. This may be due to the original
sediments containing a higher 2mm content.
Summary
Particle size analysis, image analysis and micromorphological analysis showed strong
differences between sediments impacted by Nasutitermes sp. and Iridomyrmex purpureus
when compared with the control samples. Results conform with expectations derived from the
soil science literature discussed in Chapter two. The particle size analysis confirmed that
Nasutitermes sp. favour small material rather than the larger material in moving sediments for
gallery construction. This is particularly evident in the gallery structure of Mound #1. Whilst
there was no lag concentration of stones at the base of the Mound #1 profile, there is a
concentration of larger particles in the AB and Bts layers. The high concentration of clay in
the gallery structure is a strong indicator of termite disturbance with broad application to
Australian archaeological sites, as it is nearly five times the level of clay found in the control
sample. The high level of organic matter in the gallery structure may also be used to indicate
termite activity.There is also a high level of 2mm fraction in the AB layer of Mound #1, three
times higher than the proportion of 2mm material in the control.
Micromorphology results also show the potential of the technique in future studies of ant and
termite disturbance in Australian archaeological sites. Results demonstrated that the galleries
within the crust structure of Mound #1 were lined with fine sand, silt and clay. There was also
a fine lens of organic material around the galleries. The visibly high organic content in the
gallery structure is an obvious indicator of termite activity. The presence of excrement in the
AB and Bts layers of Mound #1 may also be useful in the recognition of ant and termite
disturbance.
The 2mm fraction in the Bts and BC layers of Mound #3 are higher than the control sample,
with the 2mm fraction in the Bts being more than four times higher. The micromorphological
results show that the galleries in the AB layer of Mound #3 are lined with silt. There are also a
number of galleries that are lined with very fine sand, silt and clay. This indicates a
preferential movement of silts and clay for the use of this material to line the galleries.

45
CHAPTER FIVE
CONCLUSION
Introduction
This chapter presents the key findings of the study and discusses their implications for
Australian archaeological research. It has been demonstrated that Iridomyrmex purpureus and
Nasutitermes sp. have a significant impact on both the structural and morphological
characteristics of soil and sediments. However, further research needs to be undertaken in
order to refine our understanding of ant and termite contributions to site formation processes.
Specific research priorities to extend this research are identified.
Key Findings
The key findings of this research are:
Particle size analysis can differentiate between control material and ant- or termite-
impacted sediments;
Micromorphological analysis, particularly the characterization of structure, contributes
to the identification of disturbance in soil profiles;
Image analysis provides a useful addition to micromorphological analysis; and
pH and Munsell® soil colour tests provide only weak or ambiguous differentiation
between control material and termite or ant affected material.
Towards Criteria for the Identification of Ant- and Termite-Impacted Sediments
On the basis of these findings, a set of diagnostic criteria are presented below to determine the
presence of ant and termite activity in Australian soils and sediments, including
archaeological sites. These criteria can only be considered as preliminary until similar studies
of a broader range of ant and termite taxa and Australian archaeological sites with
documented insect activity are undertaken to confirm or reject the particle size,
micromorphological and image analysis criteria established here. These criteria are
Both ant and termites skew natural particle size distributions towards small particles in
the upper soil profile and larger particle sizes lower down the profile;

46
Key micromorphological indicators of ant- termite-impacts are an increase in organics
and finer material in the upper layers of the deposit with an increase of larger material
towards the base of the deposit; and
Porosity indicators, obtained with image analysis, are that there is more porosity in
every layer within termite mounds and the AB and Bts layers of ant mounds.
Implications for Australian Archaeology
Although limited to the study of Nasutitermes sp. and Iridomyrmex purpureus nests, the
findings of this study provide support for concerns about the potential disturbance of
Australian archaeological sites by ants and termites. Key early Australian sites, such as
Nauwalabila I, may indeed have been significantly affected by ant or termite disturbance.
Suggestions by O‟Connell and Allen (1998:139) that the rubble layer found at the base of
Nauwalabila I is the result of termite activity are supported by the particle size distribution
findings of this study (cf. Bird et al. 2002:67). However, the particle size distribution is not
conclusive, and, as demonstrated in the research presented in this thesis, should now be
coupled with micromorphology and image analysis to substantiate or refute the presence of
termite activity.
As discussed in Chapter Two, many Australian archaeological sites have documented ant or
termite activity in or adjacent to excavated deposits. However, only brief mention is made of
these occurrences, if at all, and the reader is often only made aware of ant or termite presence
at a site from site plans or stratigraphic profiles. Clearly, an assessment of the potential impact
of ant and termite activity at these sites using criteria such as those outlined here should be
undertaken and published interpretations re-evaluated in light of these findings.
Directions for Future Research
This research has demonstrated the effectiveness of particle size analysis deployed in
conjunction with micromorphological analysis and image analysis in identifying Iridomyrmex
purpureus- and Nasutitermes sp.-impacted sediments.
The study of sediments from a Nasutitermes sp. nest demonstrated the use of smaller material
in nest galleries, resulting in greater concentrations of larger particles in the lower Bts and BC
layers. The high levels of organic material and clay in gallery structures demonstrated through

47
particle size analysis and micromorphological analysis is also significant. For Iridomyrmex
purpureus, the high levels of coarse 2mm material in the Bts and BC layers are diagnostic
features. The lining of galleries with very fine sand, silt and clay are also significant
micromorphological features of Iridomyrmex purpureus nests.
To increase our understanding of the broad application of these features, more studies of this
nature need to be conducted examining various other species of ants and termites in different
soil types. Such studies will contribute to the development of diagnostic criteria and increased
understanding of the potential of insects to modify archaeological deposits. Once this task has
been accomplished further studies can be undertaken to analyse soils and sediments in
archaeological sites with known or suspected ant or termite disturbance.
A larger sample of bulk sediments need to be subject to particle size analysis to achieve
statistically significant sample sizes. Owing to the small sample number used for this study
statistical testing was not undertaken. While the results of particle size analysis in this study
indicate marked differences in the content of soil and sediments found in Iridomyrmex
purpureus and Nasutitermes sp. nests, a larger sample would likely confirm and refine
particle size analysis as a key diagnostic technique. When a more thorough understanding of
the characteristics of ant and termite nests has been achieved, robust criteria can be further
developed and applied to archaeological sites.
Conclusion
This study has demonstrated the ability of ants and termites to move large quantities of soil,
sediments and artefacts over long periods of time. Particle size analysis, micromorphological
analysis and image analysis were shown to be effective techniques in the identification of
sediments impacted by Iridomyrmex pupureus and Nasutitermes sp. Results have the potential
to form the basis of diagnostic criteria to identify sediments that have been affected by the
activity of ants and termites. Australian archaeologists cannot afford to be complacent about
this issue if debates surrounding the initial occupation of Australia are to be placed on a
firmer evidentiary basis. Similarly, taphonomic models should be revised to acknowledge and
model the potentially significant post-depositional alteration to the soil profile caused by
insect activity.

48

49
APPENDIX A: Data Recording Forms

50

51
BERAJONDO ARCHAEOLOGICAL ANT AND TERMITE PROJECT (BAATP)
Survey/Excavation Form
Site: Mound #: Excavation Unit:
Date: Excavator: Stratigraphic Unit:
Location: E N Recorder: Page #: 1 of
Munsell Colour: Hue: Y/R: Description:
Mound Cover: Gravel Vegetation Artefacts other
Mound Cover %:
Foraging Tracks: Number Total Length m Smallest Longest
Max. Length: m Max. Width: cm Max. Height: cm
Mound Shape: Conical Double Oval other (describe)
Circumference of cleared area:
Number of entrances visible:
Degree of Weathering (describe):
Status: Active Dormant
Is the Mound Occupied? Species:
Specimen Sample? (if available):
Photographs: Plan North South East West
Environment/Vegetation:
Relationship to other mounds:

52
Micromorphology Recording Form 1/3
Sample:
Date analysis started:
Particle size analysis:
1.
2.
3.
4.
5.
6.
7.
Point counting:
1. 2. 3. 4. 5. 6. 7.
Quartz
Feldspar
Organic
Porosity: 1.
2.
3.
4.
5.
6.

53
General b-fabric: 2/3
1.
2.
3.
4.
5.
6.
Microfabric:
1.
2.
3.
4.
5.
6.
Sorting:
1.
2.
3.
4.
5.
6.
Accomodation:
1.
2.
3.
4.
5.
6.
c/f distribution:
1.
2.
3.
4.
5.
6.

54
Size Classes: 3/3
Silt Clay VFS FS MS CS
1
2
3
4
5
6
Microstructure:
1.
2.
3.
4.
5.
6.
Coating:
1.
2.
3.
4.
5.
6.
Organics:
1.
2.
3.
4.
5.
6.

55

56
APPENDIX B: Berajondo Mound Survey Data

57

Mound Latitude Longitude Length N-S (cm) Width E-W
(cm)
Height (cm) Taxa No. Foraging
Tracks
Longest
Foraging
Track (m)
pH
Mound #1 151°48.300´ 24°36.419´ 125 130 58 Nasutitermes sp. 0 5
Mound #2 151º48.300´ 24°36.426´ 120 111 40 Nasutitermes sp. 0 5
Mound #3 151°48.299´ 24°36.431´ 198 194 32.2 Iridomyrmex purpureus 3 6.18 4.5
Mound #4 151°48.313´ 24°36.440´ 191 162 28.1 Iridomyrmex purpurerus 2 6.4 6
Mound #5 151°48.346´ 24°36.455´ 194 219 81 Iridomyrmex purpureus 1 5 4.5
Mound #6 151º48.399´ 24°36.459´ 144 168 49.6 Nasutitermes sp. 0 6.5
Mound #7 151°48.388´ 24°36.438´ 120 113 15.6 Iridomyrmex purpureus 4 7 6
Mound #8 151°48.386´ 24°36.397´ 140 148 18.5 Iridomyrmex purpureus 2 37 5
Mound #9 151°48.334´ 24°36.379´ 155 125 11.7 Iridomyrmex purpureus 2 28.2 5
Mound #10 151°48.308´ 24°36.382´ 130 159 21.5 Iridomyrmex purpureus 2 4.6 5
Mound #11 151°48.308´ 24°36.382´ 83 78 105 Iridomyrmex purpureus 1 2.2 5
Mound #12 151°48.311´ 24°36.373´ 36 29 11.1 Nasutitermes sp. 0 5
Mound #13 151°48.312´ 24°36.371 81 70 20.6 Nasutitermes sp. 0 5
Mound #14 151°48.316´ 24°36.368´ 55 43 17.6 Nasutitermes sp. 0 5
Mound #15 151°48.320´ 24°36.358´ 82 84 23.9 Dormant 0 5
Mound #16 151°48.364´ 24°36.394´ 120 95 11.6 Iridomyrmex Purpureus 7 19 5
Mound #17 151°48.361´ 24°36.355´ 115 110 4.1 Iridomyrmex purpureus 0 4.5
Mound #18 151°48.404´ 24°36.369´ 225 116 12.5 Iridomyrmex purpureus 2 38 5
Mound #19 151°48.431´ 24°36.351´ 213 282 52.1 Iridomyrmex purpureus 2 18 6
Mound #20 151°48.432´ 24°36.354´ 90 88 18.2 Dormant 0 5
Mound #21 151°48.435´ 24°36.347´ 53 60 10 Dormant 0 5
Mound #22 151°48.419´ 24°36.346´ 102 93 37.6 Nasutitermes sp. 0 5
Mound #23 151°48.433´ 24°36.402´ 213 135 47.6 Iridomyrmex purpureus 5 17 (T)6 (A)5
Mound #24 151°48.484´ 24°36.424´ 213 245 46.5 Iridomyrmex purpureus 1 14.4 6
Mound #25 151°48.486´ 24°36.377´ 180 165 24.9 Iridomyrmex purpureus 2 32.2 6
Mound #26 151°48.310´ 24°36.419´ 90 80 15.5 Iridmyrmex purpureus 1 2.9 5
Mound #27 151°48.313´ 24°36.420´ 100 310 7 Iridomyrmex purpureus 2 33.24 5
Mound #28 151°48.330´ 24°36.425´ 94 70 5.5 Iridomyrmex Purpureus 3 9.85 5
Mound #29 151°48.328´ 24°36.430´ 110 65 22.7 Iridomyrmex purpureus 1 6.27 5
Mound #30 151°48.357´ 24°36.415´ 75 65 9.5 Iridomyrmex purpureus 10 5.40 5
Mound #31 151°48.361´ 24°36.409´ 58 120 5.5 Iridomyrmex purpureus 4 6.86 5
Mound #32 151°48.391´ 24°36.381´ 93 127 2.5 Iridomyrmex purpureus 5 8.54 5
Mound #33 151°48.446´ 24°36.395´ 170 136 21.5 Iridomyrmex purpureus 1 7.37 4.5
Mound #34 151°48.456´ 24°36.374´ 110 104 8.5 Iridomyrmex purpureus 2 13.18 7
Mound #35 151°48.461´ 24°36.369´ 148 164 32.5 Nasutitermes sp. 0 5
Mound #36 151°48.466´ 24°36.360´ 174 150 28.5 Camponotus nigriceps 0 5
Mound #37 151°48.509´ 24°36.379´ 168 150 17 Iridomyrmex purpureus 1 12.9 5
Mound #38 151°48.519´ 24°36.384´ 88 94 40 Nasutitermes sp. 0 5
Mound #39 151°48.509´ 24°36.407´ 154 172 39.5 Iridomymex purpureus 4 16.24 5
Mound #40 151°48.506´ 24°36.405´ 147 168 36 Iridomyrmex purpureus 1 10.66 5
58

Mound Latitude Longitude Length N-S (cm) Width E-W
(cm)
Height (cm) Taxa No. Foraging
Tracks
Longest
Foraging
Track (m)
pH
Mound #41 151°48.515´ 24°36.422´ 180 322 9 Iridomyrmex purpureus
and Camponotus
nigriceps
2 7.82 4.5
Mound #42 151°48.456´ 24°36.421´ 162 162 4 Iridomyrmex purpureus 1 8.1 5
Mound #43 151°48.461´ 24°36.447´ 164 171 16 Rhytidoponera metallica
and Polyrhachis
(Hagiomyrma) sp.
0 6.5
Mound #44 151°48.422´ 24°36.426´ 170 183 10 Iridomyrmex purpureus 1 11.48 4.5
Mound #45 95 90 7 Iridomyrmex purpureus 0 7.5
Mound #46 95 103 32 Iridomyrmex purpureus 0 5
59

60

61
APPENDIX C: Glossary of Micromorphology Terms (after Stoops 2003: 5-177)

62
63
Accommodation: “Accomodation of peds to each other is a measure of the degree to which
opposite faces exhibit complimentary shapes”.
Amorphous Organic Fine Material: “can be of different types … most organics consist of
amorphous material”.
Angular Blocky: “aggregates have angular edges, few voids, and are separated by an intricate
system of planar voids”.
Apedal: “in an apedal material, the morphology and pattern of the pores describe the
microstructure”.
b-fabric: “describes the origins and the patterns of orientation and distribution of interference
colours in the micromass”.
c/f distribution: “expresses the distribution of individual fabric units in relation to smaller
fabric units and associated pores”.
Chamber Microstructure: “apedal or intrapedal material with chambers as dominant voids”.
Close Porphyric: “The coarser constituents have points of contact”.
Coatings: “are intrusive pedofeatures coating a natural surface in the soil”.
Complex Microstructure: “mixture of two or more microstructure types; a combination of
terms can be used to name the microstructure of the whole thin section”.
Concave Gefuric: “the finer material occurs only as bridges linking the coarser constituents,
the bridges are concave”.

64
Double-Spaced Coarse Enaulic: “The coarser constituents do not touch each other, and their
distance is more than once, but less than twice the mean diameter. The aggregates are larger
than the coarse components”.
Double-Spaced Porphyric: “the coarser constituents do not touch each other, and their
distance is more than once, but less than twice the mean diameter”.
Granostriated: “clay domains are oriented parallel to the walls of resistant fabric units,
producing a halo of interference colours”.
Hypocoating: “matrix pedofeatures referred to a natural surface in the soil and immediately
adjoining it”.
Interpedal: relationship between two fabric units.
Lignified Tissues: “composed of elongated, thick-walled originally empty cells”.
Monostriated: “isolated and independent streaks of parallel oriented clay domains are
observed in the micromass”.
Organic Pigment: “occurs as stains in the fine material, generally brownish or grayish in
PPL”.
Organ Residues: “composed of at least five interconnected cells of only one tissue type, and
without a recognizable organ contour”.
Parenchymatic Tissues: “composed of at least five interconnected cells of only one tissue
type, and without a recognizable organ contour”.
Porostriated: “clay domains in the micromass are oriented parallel to the surface of a pore”.
Punctuations: “small dark or opague grains about 1µm large”.

65
Sclerotia: a fungi that is capable of being dormant for long periods of time.
Single-Spaced Porphyric: “the coarser constituents do not touch each other, and their
distance is less than their mean diameter”.
Stipple Speckled: “consisting of individual and isolated speckles”.
Subangular Blocky: aggregates “separated by short planar voids on all or most sides”.
Unistrial: The micromass is oriented in “one preferred direction”.
Voids: “spaces not occupied by solid soil material”.

66

67
APPENDIX D: Summary of laboratory methods applied to samples from Berajondo.

68

69
Sample pH Munsell Particle Size
Analysis
Micromorphology NIH Image Analysis
Control Ap
Control AB
Control Bts
Control BC
Mound #1 Crust
Mound #1 Gallery
Mound #1 AB
Mound #1 Bts
Mound #2
Mound #3 Ap
Mound #3 AB
Mound #3 Bts
Mound #3 BC
Mound #4
Mound #5
Mound #6
Mound #7
Mound #8
Mound #9
Mound #10
Mound #11
Mound #12
Mound #13
Mound #14
Mound #15
Mound #16
Mound #17
Mound #18
Mound #19
Mound #20
Mound #21
Mound #22
Mound #23
Mound #24
Mound #25
Mound #26
Mound #27
Mound #28
Mound #29
Mound #30
Mound #31
Mound #32
Mound #33
Mound #34
Mound #35
Mound #36
Mound #37
Mound #38
Mound #39
Mound #40
Mound #41
Mound #42
Mound #43
Mound #44
Mound #45
Mound #46

70

71
APPENDIX E: Stratigraphic Sections and Descriptions for Mounds #6, 23 and 25.

72
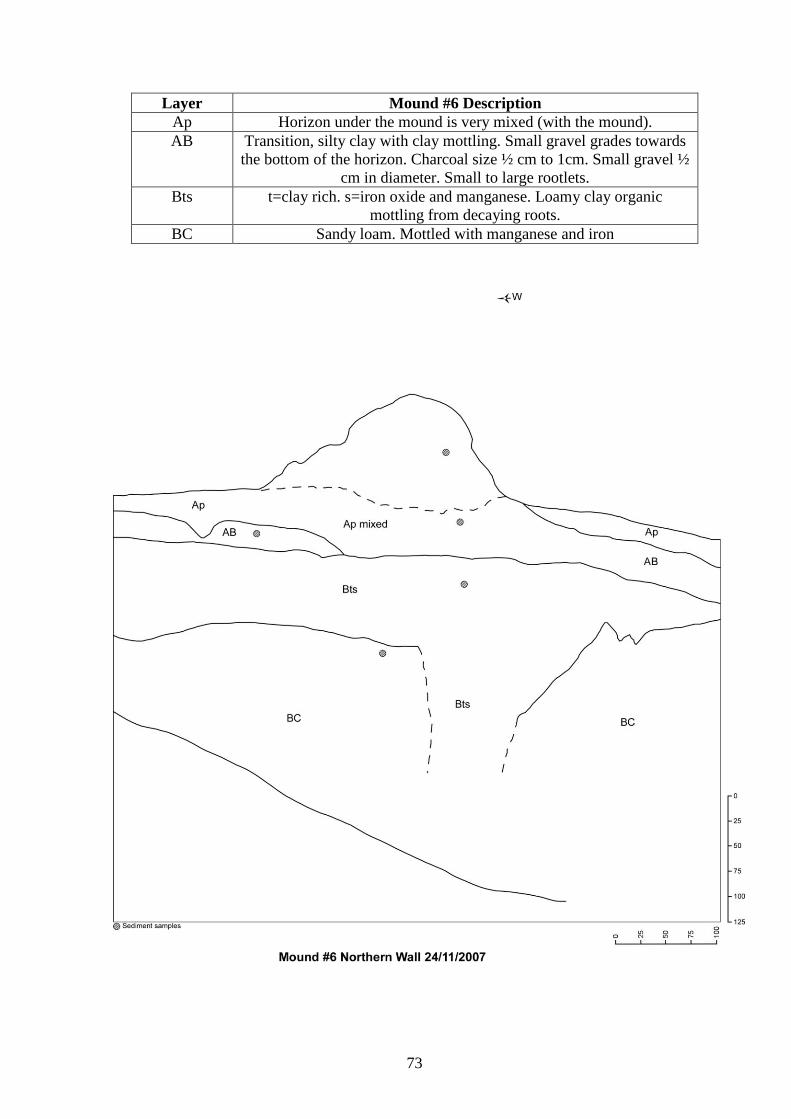
73
Layer Mound #6 Description
Ap Horizon under the mound is very mixed (with the mound).
AB Transition, silty clay with clay mottling. Small gravel grades towards
the bottom of the horizon. Charcoal size ½ cm to 1cm. Small gravel ½
cm in diameter. Small to large rootlets.
Bts t=clay rich. s=iron oxide and manganese. Loamy clay organic
mottling from decaying roots.
BC Sandy loam. Mottled with manganese and iron

74
Layer Mound #23 Description
Ap Horizon under the mound is very mixed (with the mound)
AB Transition, silty clay with clay mottling. Small gravel grades towards the
bottom of the horizon. Charcoal size 1/2cm to 1cm. Small gravel1/2 cm
in diameter. Small to large rootlets
Bts t=clay rich. s=iron oxide and manganese. Loamy clay organic mottling
from decaying roots.
BC Sandy loam. Mottled with manganese and iron.

75
Layer Mound #25 Description
Ap and AB Beneath the ant mound. Has been mixed by ants.
B Silty loam with small gravel between 2-5mm with small rootlets.
Some iron mottling.
C Clay rich. Small to medium size gravel between 2mm-1cm. Iron
and manganese rich. Loamy clay.

76

77
APPENDIX F: Particle Size Distribution Data

78

Sample Sample 2mm 500 µm 250 µm 63 µm Clay Silt Organic
g g % g % g % g % g % g % g
M1SW3gallery 15.9 0 0 0.2 1.48 1.2 8.88 3.5 25.90 6.23 46.11 4.7 34.79
2.39
M3SW8BC
FS#31
15.1 5 34.29 1.1 7.54 1.4 9.60 2.2 15.09 4.03 27.64 3.8 26.06
0.52
M1SW7Bts
FS#17
17 0.3 1.93 2.5 16.14 2.8 18.08 3.4 21.95 2.77 17.88 5.71 36.87
1.51
M3SW5Ap
FS#28
17.1 0.4 2.38 2.8 16.70 3.5 20.88 5.2 31.02 2.46 14.67 3.56 21.24
0.33
M1WC8BC
FS#10
18.5 3.1 16.89 4.4 23.98 2.9 15.80 3.4 18.53 2.37 12.91 2.2 11.99
0.15
M1WC7Bts
FS#9
18.2 0 0 2.2 13.59 3 18.53 3.8 23.47 3.99 24.65 4.56 28.
2.01
M3SW6AB
FS#29
16 1.1 7.15 3 19.52 3.2 20.82 4.3 27.98 2.48 16.14 3.99 25.96
0.63
M3SW7Bts
FS#30
18.1 1.7 10.02 2.3 13.55 2.9 17.09 4.6 27.11 2.41 14.20 3.8 22.40
1.13
M1WC6AB
FS#8
18.6 3.5 19.70 2.4 13.51 3 16.89 4.8 27.02 2.57 14.47 3.34 18.80
0.84
M1SW6AB
FS#16
15.1 8.8 59.72 1.2 8.14 1.2 8.14 1.8 12.21 2 13.57 1.46 9.90
0.36
M1WC5Ap
FS#7
15.4 1.1 6.09 4.4 24.38 4.4 24.38 5.7 31.59 1.53 8.48 2.57 14.24
0
Mound #1
crust FS#1
15.5 0 0 2.7 17.67 3.4 22.25 4.6 30.11 3.36 21.99 4.23 27.69
0.22
79
80
REFERENCES CITED
Ahlbrandt, T.S., S. Andrews and D.T. Gwynne 1978 Bioturbation in Eolian deposits. Journal
of Sedimentary Petrology. 48(3):839-848.
Allen, J. and J. O‟Connell 2003 The long and the short of it: Archaeological approaches to
determining when humans first colonized Australia and New Guinea. Australian
Archaeology 57:5-19.
Armour-Chelu, M. and P. Andrews 1994 Some effects of bioturbation by earthworms
(Oligochaeta) on archaeological sites. Journal of Archaeological Science 21:433-
443.
Baxter, P.F. and F.D. Hole 1967 Ant (Formica cinerea) pedoturbation in a prairie soil. Soil
Science Society of America Proceedings 31:425-428.
Bird, M.I., C.S.M. Turney, L.K. Fifield, R. Jones, L.K. Ayliffe, A. Palmer, R. Cresswell and
S. Robertson 2002 Radiocarbon analysis of the early archaeological site of
Nauwalabila I, Arnhem Land, Australia: Implications for sample suitability and
stratigraphic integrity. Quaternary Science Reviews 21:1061-1075.
Brian, D. 1994 Shall I Compare Thee to a fish? A Comparative Taphonomic Analysis of
Vertebrate Remains from Nara Inlet Art Site, Hook Island, Central Queensland
Coast. Unpublished BA (Hons) thesis, School of Social Science, University of
Queensland, Brisbane.
Briese, D.T. 1982 The effects of ants on the soil of a semi-arid saltbush habitat. Insectes
Sociaux 29(2):375-386.
Bullock P., N. Fedoroff, A. Jongerius, G. Stoops and T. Tursina 1985 Handbook for Soil Thin
Section Description. Wolverhampton, Waine Research Publications.
Carlson, S.R. and W.G. Whitford 1991 Ant mound influence on vegetation and soils in a
semiarid mountain ecosystem. American Midland Naturalist 126(1):125-139.
Clarkson, C. and B. David 1995 The antiquity of blades and points revisited: Investigating the
emergence of systemic blade production southwest of Arnhem Land, Northern
Australia. The Artefact 18:22-44.
Cowan, J.A., G.S. Humphreys, P.B. Mitchell and C.L. Murphy 1985 An assessment of
pedoturbation by two species of mound-building ants, Camponotus Intrepidus
(Kirby) and Iridomyrmex Purpureus (F. Smith). Australian Journal of Soil
Research 22:95-107.
David, B. 2002 Landscapes, Rock-Art and the Dreaming: An Archaeology of
Preunderstanding. London: Leicester University Press.
Dincauze, D.F. 2000 Environmental Archaeology: Principles and Practice. Cambridge,
Cambridge University Press.
Donnollan, T.E., T.R. Wetherall and S.C. Griffiths 2004 Land Resources of the Miriam Vale
and Kolan Shires. Brisbane: Department of Natural Resources, Mines and Energy.

81
Dostál, P., M. Březnová, V. Kozlíčková, T. Herben and P.Kovář 2005 Ant-induced soil
modification and its effect on plant below-ground biomass. Pedobiologia 49:127-
137.
Eldridge, D.J. 1993 Effects of ants on sandy sols in semi-arid eastern Australia: Local
distribution of nest entrances and their effect on infiltration of water. Australian
Journal of Soil Research 31:509-518.
Eldridge, D.J. and J. Pickard 1994 Effects of ants on sandy soils in semi-arid eastern
Australia: II* Relocation of nest entrances and consequences for bioturbation.
Australian Journal of Soil Research 32:323-333.
Ettershank, G. 1968 The three-dimensional gallery structure of the nest of the meat and
Iridomyrmex Purpureus (sm.) (Hymenoptera: Formicidae)* Australian Journal of
Zoology 16:715-723.
1978 Acquisition of water from soil by the Meat-Ant Iridomyrmex purpureus
(Smith) (Hymenoptera: Formicidae). Insectes Sociaux 25(1):31-38.
Greenslade, P.J.M. 1974 Some relation of the meat ant, Iridomyrmex Purpureus
(Hymenoptera: Formicidae) with soil in South Australia. Journal of Soil Biology
and Biochemistry 6:7-14.
Hiscock, P. 1985 The need for a taphonomic perspective in stone artefact analysis.
Queensland Archaeological Research 2:82-97.
1990 A study in scarlet: Taphonomy and inorganic artefacts. In S. Solomon, I.
Davidson and D. Watson (eds), Problem Solving in Taphonomy: Archaeological
and Palaeontological Studies from Europe, Africa and Oceania. Tempus 2:34-49.
St Lucia: Anthropology Museum, University of Queensland.
Hofman, J.L. 1986 Vertical movement of artifacts in alluvial and stratified deposits. Current
Anthropology 27(2):163-171.
Hole, F.D. 1981 Effects of animals that live in soils. Geoderma 25:75-112.
Hudson, J. 1993 The impacts of domestic dogs on bone in forager camps; or, the dog-gone
bones. In J. Hudson (ed.), From Bones to Behaviour, pp.301-323. Carbondale:
Southern Illinois University.
Humphreys, G.S. and P.B. Mitchell 1988 Bioturbation: An important pedological and
geomorphological process. Abstracts, Volume 1, 26th
Congress of the Interational
Geological Union, Sydney. Pp.265.
Johnson, D.L. 1989 Subsurface stone lines, stone zones, artifact-manuport layers, and
biomantles produced by bioturbation via pocket gophers (Thomomys bottae).
American Antiquity 54(2):370-389.
Jones, R. and I. Johnson 1985 Deaf Adder Gorge: Lindner site, Nauwalabila 1. In R. Jones
(ed.), Archaeological Research in Kakadu National Park pp.165-224. Special
Publication 13. Australian National Parks and Wildlife Service.

82
Kent, S. 1981 The dog – Archaeologist‟s best friend or worst enemy: The spatial distribution
of faunal remains. Journal of Field Archaeology 8(3):367-372.
Kent, S. 1993 Variability in faunal assemblages: The influence of hunting skill, sharing, dogs,
and mode of cooking on faunal remains at a sedentary Kalahari community.
Journal of Anthropological Archaeology 12(3):323-385.
Lee, K.E. and T.G. Wood 1971 Termites and Soils. New York: Academic Press.
Lobry de Bruyn, L.A. and A.J. Conacher 1990 The role of termites and ants in soil
modification: A review. Soil Biology and Biochemistry 28:55-93.
Lyman, R.L. 1994 Vertebrate Taphonomy. Cambridge: Cambridge University Press.
Lyon, P. 1970 Differential bone destruction: An ethnographic example. American Antiquity
35(2):213-215.
Macphail, R.I., J. Crowther, T.G. Acott, M.G. Belland and J.M. Cruise 2003 The
experimental earthwork at Wareham, Dorset. After 33 years: Changes to the
buried LFH and Ah horizons. Journal of Archaeological Science 30:77-93.
McBrearty, S. 1990 Consider the humble termite: Termites as agents of post-depositional
disturbance at African archaeological sites. Journal of Archaeological Science
17:111-143.
Meyer, J.A. 1960 Résultas agronomiques d‟un essay de nivellement des termitières realize
dans la Cuvete central congolaise. Bulletin of Agriculture Congo 51:1047-1059.
Morwood, M.J. and L. Dagg 1995 Excavations at Yam Camp. In M.J. Morwood and D.R.
Hobbs (eds) Quinkan Prehistory: The Archaeology of Aboriginal art in Southeast
Cape York Peninsula, Australia pp.107-115. Tempus 3 St Lucia: Anthropology
Museum, University of Queensland
Morwood, M.J., S.L‟Oste-Brown and D.M. Price 1995 Excavations at Mushroom Rock. In
M.J. Morwood and D.R. Hobbs (eds), Quinkan Prehistory: The Archaeology of
Aboriginal Art in Southeast Cape York Peninsula, Australia pp.133-146. Tempus
3 St Lucia: Anthropology Museum, University of Queensland.
Myles, T.G. 2005 Urban Entomology Program, University of Toronto. 19th
October 2008.
www.utoronto.ca/forest/termite/termite/htm
Nkem, J.N., L.A. Lobry de Bruyn, C.D. Grant and N.R. Hulugalle 2000 The impact of ant
bioturbation and foraging activities on surrounding soil properties. Pedobiologia
44:609-621.
O‟Connell, J.F. and J. Allen 1998 When did humans first arrive in greater Australia and why
is it important to know? Evolutionary Anthropology 6:132-146.
Pomeroy, D.E. 1976a Some effects of mound-building termites on soils in Uganda. Journal of
Soil Science 27:377-394.

83
1976b Studies on a population of large termite mounds in Uganda. Ecological
Entomology 1:49-61.
1977 The distribution and abundance of large termite mounds in Uganda. Journal
of Applied Ecology 14:465-476.
Sands, W.A. 1965 Termite distribution in man-modified habitats in West Africa, with special
reference to species segregation in the genus Trinervitermes (Isoptera, Termitidae,
Nasutitermitinae). Journal of Animal Ecology 34:557-571.
Schiffer, M.B. 1972 Archaeological context and systemic context. American Antiquity
37:156-165.
Specht, J. 1985 Crabs as disturbance factors in tropical archaeological sites. Australian
Archaeology 21:11-18.
Staeck, J.P. 2002 Back to the Earth: An Introduction to Archaeology. Mountain View,
Mayfield Publishing Company.
Stein, J. 1983 Earthworm activity: A source of potential disturbance of archaeological
sediments. American Antiquity 48(2):277-289.
Stoops, G. 2003 Guidelines for Analysis and Description of Soil and Regolith Thin Sections.
Madison:Soil Science Society of America Incorporated.
Thomas, D.H. 1998 Archaeology. Fort Worth, Harcourt Brace College Publishers.
Thorp, J. 1949 Effects of certain animals that live in soils. The Scientific Monthly 68(3):180-
191.
Walters, I. 1984 Gone to the dogs: A study of bone attrition at a central Australian campsite.
Mankind 14(5): 398-400.
1985 Bone loss: One explicit quantitative guess. Current Anthropology 26(5):642-
643.
1990 The necessary science of taphonomy. In S. Solomon, I. Davidson and D.
Watson (eds) Problem Solving in Taphonomy: Archaeological and
Palaeontological Studies from Europe, Africa and Oceania. Tempus 2:18-24. St
Lucia: Anthropology Museum, University of Queensland.
Watson, J.P. 1967 A termite mound in an Iron Age burial ground in Rhodesia. Journal of
Ecology 55:663-669.
Williams, M.A.J. 1968 Termites and soil development near Brocks Creek, Northern Territory.
The Australian Journal of Science 31(4):153-154.
Williams, M.A.J. 1978 Termites, soil and landscape equilibrium in the Northern Territory of
Australia. In J.L. Davies and M.A.J. Williams (eds) Landform Evolution in
Australasia, pp.128-141.

84
Wild, A. 2008 www.myrmecos.net 19th
October 2008.
Wild, H. 1975 Termites and the serpentines of the Great Dyke of Rhodesia. Trans Rhodesian
Scientific Association 57(1):1-11.
Wood, T.G. 1988 Termites and the soil environment. Biology and Fertility of Soils. 6:228-
236.
Wood, W.R. and D.L. Johnson 1978 A survey of disturbance processes in archaeological site
formation. Advances in Archaeological Method and Theory. 1:315-381.