Director General Bangladesh Bureau of Statistics (BBS ...
196
Director General Bangladesh Bureau of Statistics (BBS) Statistics and Informatics Division (SID) Ministry of Planning Government of the People’s Republic of Bangladesh Preface 'The Monthly Statistical Bulletin-Bangladesh’ is a monthly publication of Bangladesh Bureau of Statistics. This publication provides monthly data compiled on meteorology, food and agriculture, employment and price wages, transport and communication, industry and energy, national accounts etc. Though this publication is issued in Februry 2013, it consists data of both January & February 2013. I would like to thank Mr. Satya Ranjan Mondal, Director, Mr. Abul Kalam Azad, Joint Director and Mr. Nasir Uddin Ahmmed, Deputy Director,National Accounting Wing, BBS and their team for their rigorous exercise and valuable contribution in bringing out this publication. I decisively believe that the publication would be a useful document for planners, policy makers, researchers, development partners/agencies, academicians and other stakeholders. Any suggestion for improvement of the publication will be highly appreciated. Dhaka Golam Mostafa Kamal August, 2013 (Additional Secretary) Director General
-
Upload
khangminh22 -
Category
Documents
-
view
1 -
download
0
Transcript of Director General Bangladesh Bureau of Statistics (BBS ...

Director General
Bangladesh Bureau of Statistics (BBS)
Statistics and Informatics Division (SID)
Ministry of Planning
Government of the People’s Republic of Bangladesh
Preface
'The Monthly Statistical Bulletin-Bangladesh’ is a monthly publication of Bangladesh Bureau of Statistics.
This publication provides monthly data compiled on meteorology, food and agriculture, employment and price
wages, transport and communication, industry and energy, national accounts etc. Though this publication is
issued in Februry 2013, it consists data of both January & February 2013.
I would like to thank Mr. Satya Ranjan Mondal, Director, Mr. Abul Kalam Azad, Joint Director and Mr.
Nasir Uddin Ahmmed, Deputy Director,National Accounting Wing, BBS and their team for their rigorous exercise
and valuable contribution in bringing out this publication. I decisively believe that the publication would be a useful
document for planners, policy makers, researchers, development partners/agencies, academicians and other
stakeholders. Any suggestion for improvement of the publication will be highly appreciated.
Dhaka Golam Mostafa Kamal
August, 2013 (Additional Secretary)
Director General

Table of contents
Monthly Statistical Bulletin, Bangladesh, June-2013. iii
TABLE OF CONTENTS
Table No. Title Page No. INTRODUCTION .............................................................................................................................................................. vii-viii Key Indicators of Bangladesh .............................................................................................................. ix-xii
CHAPTER 1: METEOROLOGY .................................................................................................................................... 1 1.1 Monthly Average Temperature at Selected Centres ............................................................................................. 1 1.2 Monthly Total Rainfall at Selected Centres ........................................................................................................... 2 1.3 Monthly Average Humidity at Selected Centres .................................................................................................... 3
CHAPTER 2: EMPLOYMENT WAGES AND WAGE INDICES ............................................................................. 4 2.1 Average Daily Wage Rates for Industrial Workers at Selected Centres ................................................................ 4 2.2 Average Wage Rates for Industrial Workers in Bangladesh ...................................................... 5 2.3 Average Wage Rates for Construction Workers in Principal Towns ...................................................................... 5-6 2.4 Average Daily Wage Rate of Agricultural Labour With Food and Without Food by Greater District and by Sex ... 7-8 2.5 Wage Rate Indices by Major Sectors in Bangladesh ............................................................................................ 9 2.6 Wage Rate Indices by Major Sectors in Dhaka Division ....................................................................................... 10 2.7 Wage Rate Indices by Major Sectors in Chittagong Division ................................................................................. 11 2.8 Wage Rate Indices by Major Sectors in Khulna Division ....................................................................................... 12 2.9 Wage Rate Indices by Major Sectors in Rajshahi Division ........ 13 2.10 Employment Indices of Industrial Workers in Selected Industries ......................................................................... 14-15 2.11 Productivity Indices Of Industrial Workers In Selected Industries ......................................................................... 16-17 2.12 Departure of Bangladesh Nationals on Employment by Country of Destination .................................................... 18
CHAPTER 3: PRICES AND PRICE INDICES ........................................................................................................... 19 3.1 Average Wholesale Prices of Selected Agricultural Commodities in Principal Towns & Harvest Time Market Price of Agricultural Crops 2008-09 to 2009-10 ................................................................................................... 19-24 3.2 Average Wholesale Prices of Selected Manufactured Goods at Principal Towns ................................................. 25-26 3.3 Average Wholesale Prices of Selected Building Materials at Principal Towns ...................................................... 27-31 3.4 Transport Charges of Building Materials (Bangladesh) ........................................................................ 32 3.5 Average Prices of Tea Sold at Chittagong Auction ............................................................................................... 33 3.6 Average Retail Prices of Essential Consumer Goods at Principal Towns ............................................................. 34-50 3.7.A Consumer Price Index, National (Base 1995-96) .................................................................................................. 51 3.8.A Consumer Price Index, Rural (Base 1995-96)....................................................................................................... 52 3.9.A Consumer Price Index, Urban (Base 1995-96) ..................................................................................................... 53 3.7.B Consumer Price Index, National (Base 2005-06) .................................................................................................. 54 3.8.B Consumer Price Index, Rural (Base 2005-06)....................................................................................................... 555 3.9.B Consumer Price Index, Urban (Base 2005-06) ..................................................................................................... 56 3.10 Construction Materials Price Indeces in Bangladesh ............................................................................................ 57 3.11 Index of wholesale prices of agricultural and industrial products, Dhaka ...................................................... 58-59
3.12 Building Material Price......................................... ................................................................................................. 60 3.13 Retail Prices of Gold and Silver in Dhaka ............................................................................................................. 61 3.14 House Rent Indices of Various Categories of Private Residential Houses at Different Centres ............................ 62-63 3.15 House Rent Indices of Various Categories of Private Residential Houses, Bangladesh ....................................... 64
CHAPTER 4: FOOD AND AGRICULTURE ................................................................................................................ 65 4.1 Indices of Area and Production of Crops ............................................................................................................... 65-66 4.2 Land Utilization Statistics 2008-09 & 2009-10 ....................................................................................................... 67 4.3 Region-wise Irrigated Area under Different Means, 2007-08 & 2008-09 ............................................................... 68 4.4 Region-wise Irrigated Area under Different Crops 2010-11 & 2011-12 ................................................................ 69-70 4.5 Region-wise Irrigated Area under Different Means Various Crops 2010-11 & 2011-12 ....................................... 70 4.6 Acreage, Production and Yield Rate of Agricultural Crops 2008-09, 2009-10&2010-11(p) ................................... 71-72 4.7 Production and Sales of Fertilizer by Variety ....................................................................................... 73

Table of contents
iv Monthly Statistical Bulletin, Bangladesh, June-2013.
Table No. Title Page No. 4.8 Average Retail Prices of Fertilizer ......................................................................................................................... 73 4.9 Import of Pesticides by Type ................................................................................................................................. 74 4.10 Consumption Of Pesticides ................................................................................................................................... 74 4.11 Food Grain Production .......................................................................................................................................... 75 4.12 Import, Procurement and Distribution of Food ...................................................................................................... 75 4.13 Public Food Distribution by Channel ..................................................................................................................... 76
CHAPTER 5: INDUSTRY, ENERGY AND MINING ................................................................................................... 77 5.1 Production of Food Manufacturing Industries ........................................................................................................ 77-78 5.2 Production of Beverage and Tobacco Manufacturing Industries ........................................................................... 79 5.3 Cloth and Yarn Production of Cotton Textile Mills ................................................................................................. 80 5.4 Count-wise Production of Yarn of Textile Mills ...................................................................................................... 81 5.5 Variety-wise Production of Cloth of Textile Mills .................................................................................................... 82 5.6 Installed Capacity, Employment, Production of Jute Goods and Raw Jute Consumption of Jute Mills ................. 83 5.7 Production of Silk and Synthetic, Dying and Bleaching and Carpet and Rugs ...................................................... 84 5.8 Variety-wise Production of Jute Goods of Jute Mills ............................................................................................. 85 5.9 Production of Readymade Garments, Tanned and Finished Leather .................................................................. 86 5.10 Production of Hardboard, Particle Board and Wooden Furniture .......................................................................... 87 5.11 Production of Paper (All Kinds) and Newspaper ................................................................................................... 88 5.12 Production of Medicines, Fertilizer, Paints and Varnishes .................................................................................... 89 5.13 Variety-wise Production of Chemicals ................................................................................................................... 90 5.14 Production of Soap & Detergent, Matches, Petroleum, Rubber Footwear and Cycle Tyres & Tubes ................... 91-92 5.15 Production of Cement, Glass, Ceramics and Bricks.............................................................................................. 93-94 5.16 Production of Steel Ingot, M.S. Plate etc............................................................................................................... 95 5.17 Production of Utensil and Plumbing Equipment ................................................................................................... 96 5.18 Production of Engine & Turbine and Textile Machinery ........................................................................................ 97-98 5.19 Production of Telephone, Cables and Battery ....................................................................................................... 99 5.20 Production of Radio-Set Two-in-One and Black & White Television ..................................................................... 100 5.21 Production Coloured Television Set by Size ......................................................................................................... 101 5.22 Variety-wise Production of Fans and Electric Lamps ............................................................................................ 102 5.23 Production of Bi-cycle, Motor-cycle and Motor-vehicles ........................................................................................ 103 5.24 Generation and Consumption of Electricity ........................................................................................................... 104 5.25 Production and Consumption of Natural Gas ........................................................................................................ 105 5.26 Production of Minerals .......................................................................................................................................... 106 5.27 Quantum Index of Industrial Production (All Industries) .................................................................................... 107 5.28 Quantum Index of Medium and Large-scale Manufacturing Industries by Major Industry Groups (2 Digit Level) 108 5.29 Quantum Index of Medium and Large-scale Manufacturing Industries by Major Industry Groups (4 Digit Level) ... 109-114 5.30 Quantum Index of Small Scale Manufacturing Industries (2-Digit Level) ........................................................... 115 5.31 Quantum Index of Small Scale Manufacturing Industries (4-Digit Level) .......................................................... 115-118 5.32 Quantum Index of Mining and Electricity ........................................................................................................... 119 5.33 Price Indices of the Domestically Produced Industrial Goods by Their End-Use Classification ......................... 120 5.34 Price Indices of the Domestically Produced Industrial Goods by Their Major Economic Activity Classification ..................................................................................................................................................... 120 5.35 Price Indices of the Domestically Produced Industrial Goods by Industrial Groups ........................................... 121-125
CHAPTER 6: TRANSPORT, COMMUNICATION AND TOURISM ........................................................................ 126 6.1 Movement of Passengers & Freight and Earnings by Bangladesh Railway .......................................................... 126 6.2 Number and Tonnage of Wagons Loaded With Selected Commodities by Bangladesh Railway at Chittagong Port ................................................................................................................................................. 127 6.3 Cargo Handled by Chittagong and Mongla Ports .................................................................................................. 128 6.4 International Shipping Entered into and Cleared from Chittagong and Mongla Ports ........................................... 129 6.5 Passengers and Vehicles Carried by BIWTC Ferries and Revenue Earnings Therefrom .................................. 130-131 6.6 Number of Letters, Parcels and Money-order Booked Through Different Post Offices ......................................... 132 6.7 Arrival of Tourists by Month and Foreign Exchange Earnings ............................................................................... 133 6.8 Arrival Of Tourists In Bangladesh By Nationality ................................................................................................... 133 6.9 Passenger Movement by Airports/Aerodromes ................................................................................................... 134 6.10 Freight/Mail Loaded and Unloaded by Airports/Aerodromes ............................................................................... 134 6.11 Air Traffic Movement by Airport/Aerodromes ...................................................................................................... 135
Table of contents
Monthly Statistical Bulletin, Bangladesh, June-2013. v
Table No. Title Page No.
CHAPTER 7: FOREIGN TRADE ............................................................................................................................... 136 7.1 Monthly Merchandise Exports (2 Digit HS CODE) .............................................................................. ............. . 136-138 7.2 Monthly Export of Major Commodities (4 Digit)......................................................................................... ... 139 7.3 Monthly Merchandise Import (2 Digit HS CODE) ............................................................................................... 140-142 7.4 Monthly Import of Major Commodities (4 Digit) .................................................................................................. 143 7.5 Value of Export & Import .................................................................................................................................... 144 7.6 Unit Price of Major Export Item ......................................................................................................................... 145 7.7 Unit Price Index of Major Import Item ................................................................................................................. 146-150 7.8 Balance of Payment ........................................................................................................................................... 151 7.9 Country Wise Remittances ................................................................................................................................. 152
CHAPTER 8: NATIONAL ACCOUNTS .................................................................................................................... 153 8.1 Gross Domestic Product of Bangladesh at Current Prices 2006-07 to 2011-12 ................................................. 153 8.2 Sectoral Share of GDP at Current Prices 2006-07 to 2011-12 ........................................................................... 154 8.3 Sectoral Growth Rate of GDP at Current Prices 2006-07 to 2011-12 ................................................................ 155 8.4 Gross Domestic Product of Bangladesh at Constant Prices 2006-07 to 2011-12 .............................................. 156 8.5 Sectoral Share of GDP at Constant Prices 2006-07 to 2011-12 ........................................................................ 157 8.6 Sectoral Growth Rate of GDP at Constant Prices 2006-07 to 2011-12 .............................................................. 158 8.7 Implicit GDP and Sectoral Deflators 2006-07 to 2011-12 ................................................................................... 159 8.8 Gross Domestic Product of Bangladesh at Current Price by Major Economic Activities, 2007-8 to 2011-12 ..... 160 8.9 Gross Domestic Product of Bangladesh at Constant Price by Major Economic Sector, 2007-08 to 2011-12 (Base: 1995-96) ................................................................................................................................................. 161 8.10 Per Capita GDP, GNI and NNI at Current Prices, 2007-08 to 2011-12 .............................................................. 161 8.11 Per Capita Real GDP, GNI And NNI 2007-08 to 2011-12 (Base: 1995-96) ....................................................... 161 8.12 Domestic Product by Expenditure Categproes at Current Prices 2006-07 to 2009-10 ....................................... 162 8.13 Gross Domestic Product By Expenditure Categories At Constant Price (Base: 1995-96).................................. 163
CHAPTER 9: PUBLIC FINANCE ............................................................................................................................. 164 9.1 Revenue Receipt of the Government ................................................................................................................ 164-165
CHAPTER 10: BANKING AND MONETARY STATISTICS ................................................................................... 166 10.1 Monetary Survey ................................................................................................................................................ 166-168 10.2 Banking Statistics (Bangladesh Bank) ............................................................................................................... 169 10.3 Banking Statistics (Scheduled Banks) ................................................................................................................ 170-171 10.4 Official Exchange Rates of Selected Currencies ................................................................................................ 172 10.5 Savings Under Various Savings Schemes (Saving Certificates) ........................................................................ 173-174 10.6 Schedule Bank's Credit by Public and Private Sectors ...................................................................................... 175 10.7 Scheduled Bank's Credit by Economic Purpose ................................................................................................ 176
CHAPTER 11: STOCK MARKET ................................................................................................................................ 177 11.1 Highlights of Stock Market ................................................................................................................................. 177 11.2 DSE Market Score Board ................................................................................................................................... 177 11.3 DSE Market Score Board ................................................................................................................................... 177 11.4 DSE Performance .............................................................................................................................................. 177 11.5 Market (Capitalization) Value of Ordinary Shares .............................................................................................. 178-179 11.6 Index of Ordinary Shares of Companies Listed in the Dhaka Stock Exchange Ltd. ........................................... 180-181
CHAPTER 12: FOREIGN ASSISTANCE .................................................................................................................. 182 12.1 Summery of Commitment and Disbursement .................................................................................................... 182
CHAPTER 13: STANDARD CONVERSION FACTORS .......................................................................................... 183 13.1 Standard Conversion Factors ............................................................................................................................ 183-186
ANNEXURE : PRICE LIST OF BBS PUBLICATIONS
Introduction
Monthly Statistical Bulletin, Bangladesh, June-2013. vii
INTRODUCTION
The Bangladesh Bureau of Statistics (BBS) has been bringing out the Monthly Statistical Bulletin (MSB) over the last 32
years as a regular publication. The main purpose of this publication is to present the current socio-economic structure of the
country covering almost all the sectors. This publication is alienated to 13 chapters focusing on particular subject matter area
for facilitating the users, attention in accordance with their requirement. Like many other publications published by BBS, the
Monthly Statistical Bulletin has proven to be a unique source of information in the wide range of socio-economic issues
pertaining to Bangladesh.
Sources of Data: Data sources are referred under the tables.
Rounding of Figures:
In many cases figures have been rounded off to the nearest final digit (in cases of thousand, million, lakh, crore, etc.).
This may lead to slight discrepancy between the sum of constituent items and total. In such cases, however, the total figure
should be used instead of sum of the constituent items.
Greater District: "Greater district" is used to denote the former 21 districts functioning before the creation of new 64 districts. Greater
district is identical with "Statistical Region" used in the earlier issues of the Monthly Statistical Bulletin.
Key symbols used: – Data nil or magnitude zero .. Data negligible ... Data not available '000' Thousand (e) Estimated figures (p) Provisional figures (r) Revised figures na not available Qnty. Quantity
Measurement units:
Birah 80 Pieces Cft Cubic feet Crore 10,000,000 (Ten million) Cwt Hundred weight Doz Dozen or 12 units Hali 4 pieces Kg Kilogram KL Kilolitre Km Kilometre Lakh 100,000 (One hundred thousand) Lb Pound Mkwh Million Kilo watt hour Mt Metric ton Max Maximum Mini Minimum No. Number Sft Square feet Sq. km Square kilometre Sq. m Square metre
Introduction
viii Monthly Statistical Bulletin, Bangladesh, June-2013.
Abbreviations used:
BBS Bangladesh Bureau of Statistics BHDS Bangladesh Household and Demographic Survey CBR Crude Birth Rate CDR Crude Death Rate CWR Child Women Ratio DR Death Rate DDR Demogrphic Dependency Ratio GDP Gross Domestic Product GNI Gross National Income HIES Household Income and Expenditure Survey HT Hill Tracts HYV High Yielding Variety HDS Health and Demographic Survey HSC Harmonised Commodity Description and Coding system IMR Infant Mortality Rate MMR Meternal Mortality Ratio NNI Net National Income SVRS Sample Vital Registration System TFR Total Fertility Rate TC Travellers Cheque VAT Value Added Tax VRS Vital Registration System

Key indicators of Bangladesh
Monthly Statistical Bulletin, Bangladesh, June-2013. ix
KEY INDICATORS OF BANGLADESH 1.AREA : (Sq. Km.) Total Area 147570 Effective Land Area 119624 Riverine Area 8236 Forest Area 19710Source: Survey of Bangladesh (SOB)
2. HOUSEHOLD AND HOUSING:
Indicators 2007 2008 2009 2010 2011
Household Size (Dwelling) 4.8 4.7 4.7 4.6 4.5 Pucca Housing structure (%) (Rural), Pucca + Semi Pucca 11.7 13.7 14.1 16.5 16.5 Others (%) 88.3 86.3 85.9 83.5 83.5 Household with Electricity(%)
Rural 38.7 41.8 42.9 43.2 50.1 Urban 86.3 86.8 86.9 87.0 87.0 Household with Sanitary Toilet Rural 46.4 55.1 58.0 58.1 55.0 Urban 77.1 83.0 79.6 79.7 78.3 Household using Tap Water (%) Rural 1.0 1.5 1.8 1.9 1.3 Urban 32.0 34.6 31.4 31.2 20.3 Household using Tube well Water (%) Rural 97.6 96.2 93.3 95.8 96.1 Urban 67.7 64.9 65.1 67.8 79.0 Source: Sample Vital Registration System (SVRS), BBS 3. MID YEAR POPULATION : (Million)
Indicators 2006 2007 2008 2009 2010 2011 Both Sex 140.6 142.6 144.7 146.7 148.6 150.6 Male 72.0 73.1 74.1 75.1 76.1 77.1 Female 68.6 69.5 70.6 71.6 72.5 73.5 Rural Population 106.0 106.9 108.4 109.3 110.1 111.6 Urban Population 34.6 35.7 36.3 37.4 38.5 39.8 Sex Ratio (Males per 100 Females) 105.0 105.0 105.0 105.0 104.9 104.9 Density per Sq. Km. 953 966 980 993 1007 1021 Population growth rate 1.41 1.40 1.39 1.36 1.36 1.37 Source: Sample Vital Registration System (SVRS), BBS 4. VITAL STATISTICS:
Indicators 2007 2008 2009 2010 2011 TFR (Per woman) 2.39 2.30 2.15 2.12 2.11 CBR (per thousand population) 20.9 20.5 19.4 19.2 19.2 CDR (per thousand population) 6.2 6.0 5.8 5.6 5.5 Maternal Mortality Ratio per 1000 Live Birth 3.51 3.48 2.59 2.16 2.09 IMR (per thousand live birth) 43 41 39 36 35 DR (per thousand population) (1-4 Year Age) 3.6 3.1 2.7 2.3 2.4 Life Expectancy at Birth (Yrs) 66.6 66.8 67.2 67.7 69 Demographic Dependency Ratio (DDR) 70 67 66 65 57 Child-Woman Ratio (CWR) 398 380 375 369 341 Mean Age at Ist Marriage (Female) 18.4 19.0 18.5 18.7 18.6 Mean Age at Ist Marriage (Male) 23.6 23.8 23.8 23.9 24.9 Source: Sample Vital Registration System (SVRS), BBS
Key indicators of Bangladesh
x Monthly Statistical Bulletin, Bangladesh, June-2013.
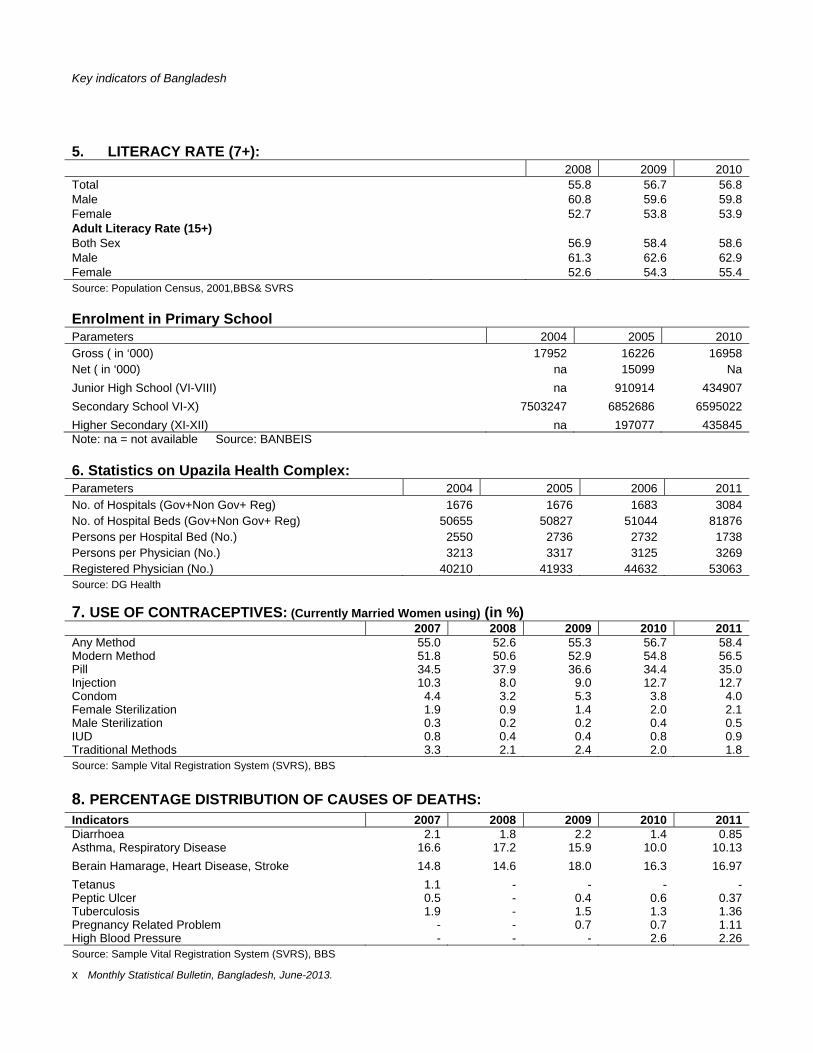
5. LITERACY RATE (7+):
2008 2009 2010 Total 55.8 56.7 56.8 Male 60.8 59.6 59.8 Female 52.7 53.8 53.9 Adult Literacy Rate (15+) Both Sex 56.9 58.4 58.6 Male 61.3 62.6 62.9 Female 52.6 54.3 55.4 Source: Population Census, 2001,BBS& SVRS Enrolment in Primary School Parameters 2004 2005 2010 Gross ( in ‘000) 17952 16226 16958 Net ( in ‘000) na 15099 Na Junior High School (VI-VIII) na 910914 434907 Secondary School VI-X) 7503247 6852686 6595022 Higher Secondary (XI-XII) na 197077 435845 Note: na = not available Source: BANBEIS 6. Statistics on Upazila Health Complex: Parameters 2004 2005 2006 2011 No. of Hospitals (Gov+Non Gov+ Reg) 1676 1676 1683 3084 No. of Hospital Beds (Gov+Non Gov+ Reg) 50655 50827 51044 81876 Persons per Hospital Bed (No.) 2550 2736 2732 1738 Persons per Physician (No.) 3213 3317 3125 3269 Registered Physician (No.) 40210 41933 44632 53063 Source: DG Health 7. USE OF CONTRACEPTIVES: (Currently Married Women using) (in %) 2007 2008 2009 2010 2011 Any Method 55.0 52.6 55.3 56.7 58.4 Modern Method 51.8 50.6 52.9 54.8 56.5 Pill 34.5 37.9 36.6 34.4 35.0 Injection 10.3 8.0 9.0 12.7 12.7 Condom 4.4 3.2 5.3 3.8 4.0 Female Sterilization 1.9 0.9 1.4 2.0 2.1 Male Sterilization 0.3 0.2 0.2 0.4 0.5 IUD 0.8 0.4 0.4 0.8 0.9 Traditional Methods 3.3 2.1 2.4 2.0 1.8 Source: Sample Vital Registration System (SVRS), BBS 8. PERCENTAGE DISTRIBUTION OF CAUSES OF DEATHS:
Indicators 2007 2008 2009 2010 2011 Diarrhoea 2.1 1.8 2.2 1.4 0.85 Asthma, Respiratory Disease 16.6 17.2 15.9 10.0 10.13 Berain Hamarage, Heart Disease, Stroke 14.8 14.6 18.0 16.3 16.97 Tetanus 1.1 - - - - Peptic Ulcer 0.5 - 0.4 0.6 0.37 Tuberculosis 1.9 - 1.5 1.3 1.36 Pregnancy Related Problem - - 0.7 0.7 1.11 High Blood Pressure - - - 2.6 2.26 Source: Sample Vital Registration System (SVRS), BBS

Key indicators of Bangladesh
Monthly Statistical Bulletin, Bangladesh, June-2013. xi
9. MORBIDITY:
I. Prevalence of Morbidity per 1000 Population 2000 Both sex 188.0 Male 178.9 Female 197.5
II. Prevalence of Morbidity per 1000 Population from Selected Disease 2000
Diarrhoea 9.4 Asthma 5.1 Pneumonia 2.4 Tetanus 0.07 Peptic ulcer 15.2 Tuberculosis 0.89 Malaria 2.8 Kalaazar 0.25 Leprosy 0.11 Measles 1.32 Deptheria 0.04 Diabetes 2.7 III. Prevalence of Disability per 1000 Population
2000 Both sex 6.04 Male 7.38 Female 4.66 Source: Bangladesh Household and Demographic Survey (BDHS), 2000 10. LABOUR FORCE : usual definition (age 15+)
2002-03 2005-06 2010Civilian Labour Force (Million) 46.3 49.5 56.7 Crude Activity Rate (%) 34.7 36.0 38.1 Refined Activity Rate (%) 57.3 58.5 59.3 Employed Population by Sector usual Definition (age 15+) (in%)
2002-03 2005-06 2010 Agriculture 51.7 48.1. 47.5 Manufacturing 13.7 11.00 12.4 Others 34.6 40.9 40.1 Source : Labour Force Survey-2010 11. NATIONAL ACCOUNTS :
2008-09 2009-10 2010-11 2011-12(p) GDP at (‘95-96) Constant Price (Million Taka) 3401968 3608446 3850504 4093775 GDP at Current Market Price (Million Taka) 6147952 6943243 7967040 9147842 GNI at Current Market Price (MillionTaka) 6706964 7589278 8692175 10047227 Per Capita Income (GNI) (In Taka) 46504 51959 58083 66283 Per Capita Income (GNI) (In US $) 676 751 816 848

Key indicators of Bangladesh
xii Monthly Statistical Bulletin, Bangladesh, June-2013.
Implicit GDP Deflator 180.72 192.42 206.91 223.46 Real GDP Growth (Percent) 5.74 6.07 6.71 6.32 Source: National Accounting Wing, BBS. Note: “p” Provisional 12. INVESTMENT AND SAVINGS AT CURRENT PRICES: (Million Taka)
2007-08 2008-09 2009-10 2010-11(p) Gross Domestic Saving 1108511 1235039 1395533 1542798 Gross national Saving 1649119 1818120 2084047 2236529 Investment 1321322 1498393 1695107 1947863 Consumption 4349713 4912913 5547710 6332152 Note: “p” Denotes Provisional 13. MONEY AND BANKING : (Million Taka)
2006-07 2007-08 2008-09 2009-10 Narrow Money (M1) 501680 593144 664269 879883 Broad Money(M2) 2115042 2487949 2964999 3630311 Net Foreign Assets 323971 373179 474594 670737 Bank Advances 1465733 1815526 2090486 NA Bank Deposits 1952052 2316049 2793912 NA Remittances 412985 542952 666765 760110 Foreign Exchange Reserve 349314 421377 515945 747121 Exchange Rate (Period Average) 69.03 68.60 68.80 69.18 Exchange Rate (End Period) 68.80 68.52 69.06 69.45 Source : Bangladesh Bank
14. EXTERNAL TRADE : (Million Taka)
2008-09 2009-10 2010-11 Total Export (f.o.b) 1074992 1134589 1629733 Total Import (e.i.f) 1580898 1794324 2659405 Balance (-)505906 (-)659735 (-)1029672 Source: Foreign Trade, National Accounting Wing.BBS
15. CONSUMPTION AND NUTRITION :
2005 2010 Per Capita Per day Food Intake (gram) 948 1000 Per Capita Per day Calorie Intake (k. cal) 2238.5 2318.3 Per Capita Per day Protein Intake (gram) 62.52 66.26 Source: Household Income and Expenditure Survey BBS-2010
16. FOOD AND AGRICULTURE : (Lac Metric Ton)
Production 2008-09 2009-10 2010-11 Rice 313.17 319.75 335.42 Wheat 8.49 9.01 9.72 Jute (Lac Bales) 46.78 50.90 83.96 Sugarcane 52.33 44.91 46.71 Pulses 1.96 2.20 02.32 Source : Agriculture Wing, BBS

Meteorology
Monthly Statistical Bulletin, Bangladesh, June-2013. 1
CHAPTER 1: METEOROLOGY
1.1 MONTHLY AVERAGE TEMPERATURE AT SELECTED CENTRES (In Celsius)
Centres 2012
Monthly Jan’13 Feb’13 Mar’13 Apr’13 May’13 June’13
Maxi. Mini. Maxi. Mini. Maxi. Mini. Maxi. Mini. Maxi. Mini. Maxi. Mini. Maxi. Mini.
Dhaka 32.3 24.3 24.2 12.3 28.9 17.5 33.4 22.1 34.2 24.4 31.7 24.8 33.7 27.2Mymensingh 31.7 23.0 23.8 10.5 28.4 15.7 31.8 19.6 32.5 22.5 30.4 24.2 33.1 26.4Tangail 32.1 23.1 23.9 9.8 28.2 14.3 33.3 19.5 34.4 22.9 32.0 24.2 34.4 26.3Faridpur 32.2 23.8 23.9 10.3 28.6 14.8 33.8 20.3 35.0 23.7 32.2 24.5 33.7 26.7Madaripur 32.1 23.2 24.5 10.0 28.9 14.8 33.0 20.3 34.2 23.5 32.1 24.3 33.3 26.4 Chittagong 31.1 24.2 25.0 12.7 29.3 17.0 31.1 20.8 31.9 24.4 30.3 24.5 31.7 26.1Sandwip 32.1 23.8 26.2 11.5 30.7 15.4 32.4 20.1 33.1 24.1 30.2 24.6 32.6 26.2Sitakunda 33.8 23.7 27.0 9.8 31.6 14.3 32.9 19.2 33.5 23.4 31.3 24.2 33.0 26.0Rangamati 31.9 23.0 25.7 10.4 30.8 14.6 34.8 18.9 35.7 22.7 31.2 23.7 33.3 25.4Comilla 31.5 23.4 24.5 10.9 28.8 15.8 31.9 20.6 32.9 23.4 30.7 24.2 33.4 26.5Chandpur 32.4 24.2 24.4 11.7 29.1 16.0 33.3 21.3 33.8 23.9 31.5 24.4 33.4 26.5Maijdicourt 31.8 24.7 24.9 12.5 29.4 16.8 33.3 21.0 34.0 23.9 31.1 24.7 33.1 26.9Feni 31.3 23.2 25.2 10.9 29.4 15.3 32.7 20.4 33.0 23.7 30.1 24.3 32.7 26.2Hatiya 31.4 23.6 25.5 11.6 29.7 15.6 32.6 20.3 33.0 23.9 30.4 24.6 31.6 26.1Cox's Bazar 32.4 24.5 26.8 13.9 30.7 18.2 32.2 21.4 33.8 24.5 31.8 24.7 32.4 25.8Kutubdia 32.3 24.4 25.0 13.5 27.8 17.5 30.3 21.3 31.8 24.4 30.9 24.7 31.6 25.6Teknaf 31.3 24.3 26.0 14.0 30.5 16.6 31.1 20.7 31.9 24.1 30.9 24.8 31.1 25.8 Sylhet 31.8 22.8 25.6 11.8 31.2 15.9 34.2 19.7 33.0 21.8 30.4 22.7 33.9 25.8Srimangal 31.7 22.0 24.9 7.5 29.8 12.1 33.5 17.4 33.7 21.3 31.3 22.5 33.6 25.5 Rajshahi 32.4 21.9 23.3 9.3 27.9 13.6 33.9 18.2 36.4 22.6 33.9 24.8 35.1 26.6Ishwardi 31.9 21.7 23.2 8.6 27.7 13.1 33.8 18.3 35.6 23.1 33.2 24.9 34.4 26.7Bogra 32.6 22.9 23.7 10.3 28.6 15.1 32.8 19.9 33.7 22.8 32.0 24.5 34.5 26.8Rangpur 31.1 22.4 22.5 9.1 27.3 14.2 31.6 18.2 31.6 21.4 31.1 23.7 33.4 26.4Dinajpur 31.6 21.6 22.6 8.5 27.7 13.9 31.9 18.0 32.5 21.3 31.7 23.9 31.8 23.9Sayedpur 31.9 21.8 22.9 8.7 28.2 14.3 32.1 18.0 32.7 20.9 31.6 23.7 33.8 26.4 Khulna 32.4 23.8 24.8 11.7 29.1 15.6 33.8 21.1 35.4 24.1 33.3 25.2 33.9 27.1Mongla 32.0 23.9 24.6 12.4 28.7 16.2 34.2 21.6 35.8 24.6 33.3 25.2 33.0 26.7Satkhira 32.0 23.7 24.0 11.3 28.1 15.1 33.2 20.5 35.1 24.3 33.5 25.5 33.5 27.0Jessore 33.0 22.2 24.8 9.3 29.2 13.6 34.5 19.6 36.0 23.6 33.9 25.2 34.0 26.5Chuadanga 32.4 21.5 23.6 8.6 28.0 12.8 34.6 18.4 36.2 23.3 34.2 24.9 34.0 26.4 Barisal 32.1 23.3 24.8 10.6 29.0 14.9 33.2 21.0 34.1 24.0 31.4 24.8 32.8 26.8Patuakhali 32.0 23.5 25.6 11.7 29.6 15.5 34.2 21.1 34.6 24.0 31.9 25.1 32.7 26.7Khepupara 32.0 23.7 24.0 12.0 29.8 15.5 33.6 21.2 34.3 24.4 32.2 25.0 32.7 26.5Bhola 31.6 23.1 25.3 10.9 29.3 15.3 32.8 21.1 33.6 24.2 30.7 24.5 32.9 26.7Note: Information contained in this table are based on preliminary unchecked data. Source: Bangladesh Meteorological Department

Meteorology
2 Monthly Statistical Bulletin, Bangladesh, June-2013.
1.2 MONTHLY TOTAL RAINFALL AT SELECTED CENTRES (Milimetres) Centres
2012
Monthly
Nov’12 Dec’12 Jan’13 Feb’13 Mar’13 Apr’13 May’13 Jun’13
Dhaka 1328 68 5 0 0 7 30 390 318 Mymensingh 1514 19 0 0 0 3 68 307 264 Tangail 1469 94 1 0 0 3 79 298 218 Faridpur 1282 112 7 0 0 5 53 388 285 Madaripur 1542 86 1 0 0 2 29 770 205 Chittagong 3642 3 0 0 0 1 59 781 569 Sandwip 4093 3 0 0 0 0 52 579 548 Sitakunda 2298 19 1 0 0 1 56 479 594 Rangamati 2794 24 0 0 0 1 59 540 294 Comilla 1901 102 3 0 0 2 28 472 219 Chandpur 1752 92 2 0 0 1 135 685 506 Maijdicourt 2476 29 0 0 0 1 65 678 653 Feni 2873 18 0 0 0 3 17 541 502 Hatiya 2986 13 2 0 0 2 50 851 601 Cox's Bazar 4125 13 0 0 0 0 56 744 873 Kutubdia 4650 47 0 0 0 0 85 1138 1144 Teknaf 4983 23 0 0 0 0 42 758 844 Sylhet 4947 48 0 0 0 8 237 957 727 Srimangal 1926 21 0 0 0 2 104 784 300 Rajshahi 1165 102 1 0 0 3 51 210 167 Ishwardi 1063 89 15 0 0 3 68 187 261 Bogra 1143 36 1 0 0 3 43 154 250 Rangpur 1874 0 0 0 0 2 128 427 314 Dinajpur 1475 1 0 0 0 1 100 249 287 Sayedpur 1851 0 0 0 0 0 58 285 247 Khulna 1642 80 2 0 0 2 70 451 198 Mongla 1777 34 8 0 0 2 28 393 233 Satkhira 1390 95 7 0 0 4 30 322 217 Jessore 1234 61 2 0 0 4 63 292 213 Chuadanga 1142 81 7 0 0 4 32 262 148 Barisal 1619 44 0 0 0 3 64 664 278 Patuakhali 1892 71 0 0 0 1 27 652 338 Khepupara 2625 69 7 0 0 0 68 728 432 Bhola 1493 35 1 0 0 1 28 664 276 Note: Information contained in this table are based on preliminary unchecked data. Source: Bangladesh Meteorological Department.

Meteorology
Monthly Statistical Bulletin, Bangladesh, June-2013. 3
1.3 MONTHLY AVERAGE HUMIDITY AT SELECTED CENTRES (Percent)
Centres 2012 Monthly
Dec’12 Jan’13 Feb’13 Mar’13 Apr’13 May’13 Jun’13 Dhaka 67.4 77 64 52 50 59 77 73 Mymensingh 79.3 91 78 67 68 73 82 79 Tangail 89.4 89 82 70 61 63 79 76 Faridpur 74.0 85 77 63 58 61 82 78 Madaripur 79.3 91 83 71 66 70 84 79 Chittagong 77.7 81 73 62 73 74 84 82 Sandwip 80.3 88 76 63 71 71 83 81 Sitakunda 78.5 83 78 67 67 69 83 81 Rangamati 77.3 88 77 58 57 61 77 79 Comilla 77.5 83 73 64 71 73 83 78 Chandpur 76.6 85 77 66 67 72 84 79 Maijdicourt 77.4 84 73 63 63 68 81 77 Feni 80.0 86 78 65 67 70 84 79 Hatiya 80.8 86 74 64 68 73 85 83 Cox's Bazar 76.0 78 65 62 70 73 84 81 Kutubdia 80.3 79 79 76 77 85 86 87 Teknaf - - - 56 67 70 81 84 Sylhet 75.1 84 74 57 53 65 81 77 Srimangal 76.9 92 83 70 60 65 78 78 Rajshahi 74.6 89 82 70 59 57 76 79 Ishwardi 75.8 91 85 71 55 56 76 79 Bogra 73.5 86 78 64 57 63 79 76 Rangpur 76.8 87 79 68 60 66 80 78 Dinajpur 73.4 84 77 64 56 63 78 76 Sayedpur 75.3 87 80 64 57 65 80 77 Khulna 78.5 87 8 71 64 64 80 81 Mongla 82.5 81 73 62 64 67 80 83 Satkhira 81.5 81 77 66 67 66 79 77 Jessore 81.8 81 81 67 60 62 77 77 Chuadanga 83.8 87 82 72 59 60 79 82 Barisal 85.8 88 82 84 71 69 84 80 Patuakhali 88.3 87 78 66 69 71 84 84 Khepupara 83.4 81 70 59 80 70 82 82 Bhola 80.0 89 80 68 69 70 84 79 Note: Information contained in this table are based on preliminary unchecked data. Source: Bangladesh Meteorological Department

Employment, Wages and Wage Indices
4 Monthly Statistical Bulletin, Bangladesh, June-2013.
CHAPTER 2: EMPLOYMENT, WAGES AND WAGE INDICES 2.1 AVERAGE DAILY WAGE-RATES FOR INDUSTRIAL WORKERS AT SELECTED CENTRES (Taka)
Sl No.
Industry Group
Type of labour 2008-09 Monthly
Nov’12 Dec’12 Jan’13 Feb’13 Mar’13 Apr’13 May’13 June’13Dhaka 1. Cotton Skilled 230.25 293 295 295 295 298 299 302 300 Textile Unskilled 170.00 213 214 215 215 215 215 216 2162. Jute textile Skilled 225.75 286 286 288 288 291 292 295 293 Unskilled 141.50 211 212 213 214 216 217 217 2173. Match Skilled 218.08 276 276 278 279 282 284 286 285 Unskilled 158.08 213 214 214 214 216 217 218 2174. Engineering (fitter) Skilled 332.50 337 377 378 380 382 385 387 386 Unskilled 158.08 267 268 270 271 275 275 276 2765. Edible oil Skilled 242.08 284 285 288 290 293 295 298 297 (mustard oil Line man) Unskilled 190.42 226 226 228 231 233 234 2236 2356. Average Skilled 249.80 - - - - - - - - for Industry Unskilled 163.62 - - - - - - - -Rajshahi 1. Cotton Skilled 222.25 276 276 277 279 281 282 285 283 Textile Unskilled 148.75 206 208 210 211 212 212 213 2132. Jute textile Skilled 221.00 269 269 270 272 274 275 278 276 Unskilled 141.75 201 205 208 208 208 208 209 2093. Match Skilled 206.25 249 249 252 255 256 258 266 259 Unskilled 133.75 176 2179 180 182 183 183 185 1844. Engineering (fitter) Skilled 328.92 376 376 377 380 282 383 289 383 Unskilled 213.00 261 262 263 266 287 267 268 2685. Edible oil Skilled 216.33 263 265 268 270 272 273 274 273 (mustard oil Line man) Unskilled 159.25 211 212 213 215 216 216 217 2166. Average Skilled 238.95 - - - - - - - - for Industry Unskilled 159.30 - - - - - - - -Khulna 1. Cotton Skilled 227.33 289 289 290 291 293 294 297 296 Textile Unskilled 157.08 213 215 215 215 216 216 218 2172. Jute textile Skilled 221.33 269 269 270 272 273 274 276 275 Unskilled 140.83 203 205 207 207 208 208 210 2093. Match Skilled 210.00 257 257 258 259 261 262 264 263 Unskilled 133.58 197 200 202 202 204 204 205 2054. Engineering Skilled 324.58 367 367 368 369 371 373 375 374 (fitter) Unskilled 213.83 257 257 258 258 259 259 260 2605. Edible oil Skilled 217.92 276 276 277 278 279 281 282 282 (mustard oil Line man) Unskilled 166.17 211 212 213 214 215 215 215 2156. Average Skilled 240.23 - - - - - - - - for Industry Unskilled 162.30 - - - - - - - -Chittagong 1. Cotton Skilled 233.17 311 312 313 314 316 318 322 320 Textile Unskilled 150.00 218 218 220 220 222 222 223 2232272. Jute textile Skilled 228.25 286 286 288 289 291 292 294 293144 Unskilled 143.33 216 218 220 220 221 222 223 2233.208 Match Skilled 208.67 276 276 277 279 279 280 282 281145 Unskilled 143.83 211 212 213 213 214 214 215 2154.330 Engineering Skilled 331.75 376 376 377 377 379 380 382 381215 (fitter) Unskilled 217.00 266 288 270 271 272 273 274 2745.225 Edible oil Skilled 228.17 285 285 286 287 290 292 294 293180 (mustard oil Line man) Unskilled 170.17 226 227 228 228 230 230 232 2316.244 Average Skilled 246.00 - - - - - - -167 for Industry Unskilled 165.67 - - - - - - -Source: National Accounting Wing, BBS.

Employment, Wages and Wage Indices
Monthly Statistical Bulletin, Bangladesh, June-2013.. 5
2.2 AVERAGE WAGE RATES FOR INDUSTRIAL WORKERS IN BANGLADESH (Nominal wage in Taka)
Sl. No. Industry Type of
labour 2008-09 Monthly
Nov’12 Dec’12 Jan’13 Feb’13 Mar’13 Apr’13 May’13 June’131. Medium & Large Scale Industry:
(i) Cotton Textile Skilled 228.25 292 293 294 295 297 298 300 301 Unskilled 156.46 212 214 215 215 216 216 217 217
(ii) Jute Textile Skilled 224.08 277 277 279 280 282 283 284 285 Unskilled 141.85 207 210 212 212 213 213 214 214
(iii) Match Skilled 210.83 264 264 266 267 269 271 271 273 Unskilled 142.31 199 201 202 203 204 204 205 205
(iv) Engineering Skilled 329.44 374 374 375 376 378 380 281 382 (fitter) Unskilled 216.90 263 264 285 266 268 26 269 269
(v) Edible 0il Skilled 226.13 277 278 279 2811 283 285 286 287 Unskilled 172.50 218 219 220 222 223 223 224 2252. Small & Cottage Skilled 204.71 264 266 268 273 276 278 279 282 Industry (weaver) Unskilled - - - - - - - - -3. Construction Skilled 265.04 425 429 439 438 442 445 446 448
Unskilled (Helper)
163.25 315 318 322 324 327 327 328 329
Note: The averages are based on data collected from 4 centres viz. Dhaka, Chittagong, Rajshahi and Khulna. Source: National Accounting Wing, BBS.
2.3 AVERAGE WAGE RATES FOR CONSTRUCTION WORKERS IN PRINCIPAL TOWNS (Taka)
Type of Construction Worker
Town 2008-09 Monthly
Oct’12 Nov’12 Dec’12 Jan’13 Feb’13 Mar’13 Apr’13 May’13 June’13
Mason (skilled) Chittagong 270.83 450 555 455 455 455 455 - - - Dhaka 286.33 400 400 400 400 400 400 - 420 420 Khulna 254.00 400 400 460 460 460 - 400 410 412 Narayanganj 250.00 400 400 400 400 400 - 400 400 400 Rajshahi 230.58 381 - - 3822 400 400 400 405 400 Rangpur 250.00 370 370 390 390 400 400 400 405 400 Sylhet 300.00 400 400 400 400 400 400 400 400 400Helper to mason Chittagong 216.67 250 250 250 300 300 320 - - -
Dhaka 200.00 253 255 255 258 258 270 350 350 Khulna 180.00 300 300 360 360 360 ---- - 362 360 Narayanganj 190.83 320 320 320 320 320 - 360 360 360 Rajshahi 186.25 263 - - 265 270 300 350 352 650 Rangpur 180.00 251 251 251 252 254 255 320 325 320 Sylhet 182.50 290 290 290 290 295 300 255 255 255
Carpenter (skilled) Chittagong 310.83 450 450 400 450 440 450 300 - - Dhaka 300.00 430 430 430 430 435 435 - 425 435 Khulna 226.92 300 350 350 370 375 - 375 376 375 Narayanganj 300.00 500 500 500 500 500 - 500 500 500 Rajshahi 209.58 300 300 300 350 350 300 350 350 350 Rangpur 210.00 300 300 306 306 310 310 310 310 210 Sylhet 220.83 400 400 400 400 405 405 405 405 405

Employment, Wages and Wage Indices
6 Monthly Statistical Bulletin, Bangladesh, June-2013.
2.3 AVERAGE WAGE RATES FOR CONSTRUCTION WORKERS IN PRINCIPAL TOWNS-CONTD. (Taka)
Type of cons- truction worker
Town 2008-09 Monthly
Oct’12 Nov’12 Dec’12 Jan’13 Feb’13 Mar’13 Apr’13 May’13 June’13
Plumber Chittagong 310.42 430 450 450 450 455 455 - - -(sanitary fitter) Dhaka 333.33 520 520 - 520 450 450 - 450 450 Khulna 243.33 350 400 400 450 450 - 450 450 452 Narayanganj 296.67 450 450 450 450 450 - 450 450 450 Rajshahi 211.67 330 335 355 375 365 370 450 450 452 Rangpur 250.10 350 360 360 860 450 450 450 450 450 Sylhet 300.00 450 450 450 450 450 450 450 450 455 Painter Chittagong 307.08 400 450 450 450 450 450 - - - Dhaka 310.42 430 430 - 430 435 435 - 435 435 Khulna 220.67 350 350 350 400 400 - 400 400 400 Narayanganj 256.67 450 450 450 450 450 - 450 450 450 Rajshahi 210.00 333 335 335 350 355 355 3355 355 357 Rangpur 248.33 400 400 400 400 400 400 400 400 400 Sylhet 300.00 400 400 400 400 400 405 405 405 405 Electrician Chittagong 325.00 450 500 500 500 500 5500 - - - Dhaka 333.33 500 500 500 500 560 560 - 450 405 Khulna 234.17 372 375 375 400 400 - 400 400 400 Narayanganj 392.50 530 530 530 530 530 - 530 535 535 Rajshahi 221.67 330 330 330 350 355 355 355 355 357 Rangpur 248.33 350 350 350 350 400 400 400 400 405 Sylhet 300.00 400 400 400 400 400 405 405 405 407
Brick breaking (i) 1' Size Khoa per 100 cft.
Chittagong 837.50 800 900 900 100 1050 055 1055 - -Dhaka 1066.67 1230 1500 - 1500 1520 1520 1520 4525 1050Khulna 670.83 - 400 400 1050 1050 - 1050 1050 1055
Narayanganj 920.83 950 950 - 1050 1060 - 1060 4060 1065 Rajshahi 991.67 1600 1600 160 1600 1602 1610 1620 1625 1625 Rangpur 1000.00 2105 2105 - - - 950 980 980 982 Sylhet 800.00 950 950 950 1050 1050 - 1050 1050 1055Situ Mosaic (Fitting charge) persft.
Dhaka 25.83 30 30 30 30 30 30 30 30
Glazed Tile (Fitting charge)per sft.
Dhaka 25.83 32 32 32 32 32 32 32 32
Floor Tile(Fitting charge)per sft.
Dhaka 25.83 31 31 31 31 31 31 31 31
Source: National Accounting Wing, BBS
Employment, Wages and Wage Indices
Monthly Statistical Bulletin, Bangladesh, June-2013.. 7
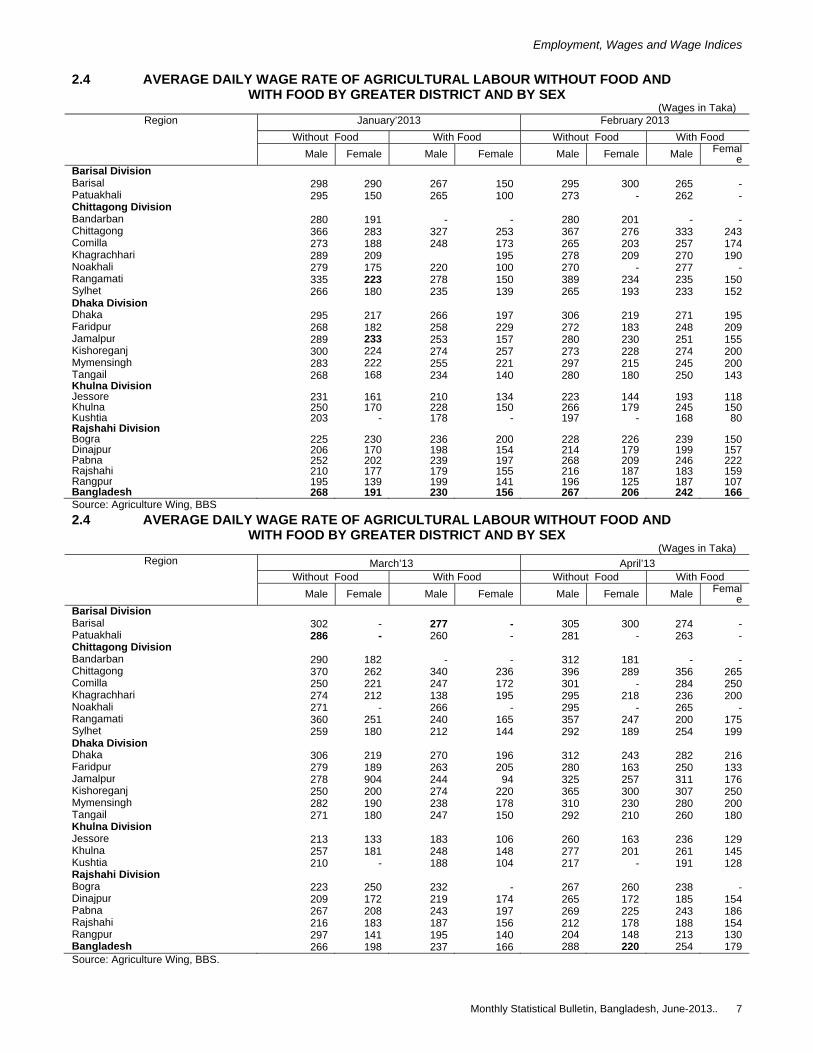
2.4 AVERAGE DAILY WAGE RATE OF AGRICULTURAL LABOUR WITHOUT FOOD AND WITH FOOD BY GREATER DISTRICT AND BY SEX
(Wages in Taka) Region January’2013 February 2013
Without Food With Food Without Food With FoodMale Female Male Female Male Female Male Femal
eBarisal Division Barisal 298 290 267 150 295 300 265 - Patuakhali 295 150 265 100 273 - 262 - Chittagong Division Bandarban 280 191 - - 280 201 - - Chittagong 366 283 327 253 367 276 333 243 Comilla 273 188 248 173 265 203 257 174 Khagrachhari 289 209 195 278 209 270 190 Noakhali 279 175 220 100 270 - 277 - Rangamati 335 223 278 150 389 234 235 150 Sylhet 266 180 235 139 265 193 233 152 Dhaka Division Dhaka 295 217 266 197 306 219 271 195 Faridpur 268 182 258 229 272 183 248 209 Jamalpur 289 233 253 157 280 230 251 155 Kishoreganj 300 224 274 257 273 228 274 200 Mymensingh 283 222 255 221 297 215 245 200 Tangail 268 168 234 140 280 180 250 143 Khulna Division Jessore 231 161 210 134 223 144 193 118Khulna 250 170 228 150 266 179 245 150Kushtia 203 - 178 - 197 - 168 80Rajshahi Division Bogra 225 230 236 200 228 226 239 150Dinajpur 206 170 198 154 214 179 199 157Pabna 252 202 239 197 268 209 246 222Rajshahi 210 177 179 155 216 187 183 159Rangpur 195 139 199 141 196 125 187 107Bangladesh 268 191 230 156 267 206 242 166Source: Agriculture Wing, BBS
2.4 AVERAGE DAILY WAGE RATE OF AGRICULTURAL LABOUR WITHOUT FOOD AND WITH FOOD BY GREATER DISTRICT AND BY SEX
(Wages in Taka) Region March’13 April’13
Without Food With Food Without Food With FoodMale Female Male Female Male Female Male Femal
eBarisal Division Barisal 302 - 277 - 305 300 274 - Patuakhali 286 - 260 - 281 - 263 - Chittagong Division Bandarban 290 182 - - 312 181 - - Chittagong 370 262 340 236 396 289 356 265 Comilla 250 221 247 172 301 - 284 250 Khagrachhari 274 212 138 195 295 218 236 200 Noakhali 271 - 266 - 295 - 265 - Rangamati 360 251 240 165 357 247 200 175 Sylhet 259 180 212 144 292 189 254 199 Dhaka Division Dhaka 306 219 270 196 312 243 282 216 Faridpur 279 189 263 205 280 163 250 133 Jamalpur 278 904 244 94 325 257 311 176 Kishoreganj 250 200 274 220 365 300 307 250 Mymensingh 282 190 238 178 310 230 280 200 Tangail 271 180 247 150 292 210 260 180 Khulna Division Jessore 213 133 183 106 260 163 236 129 Khulna 257 181 248 148 277 201 261 145 Kushtia 210 - 188 104 217 - 191 128 Rajshahi Division Bogra 223 250 232 - 267 260 238 - Dinajpur 209 172 219 174 265 172 185 154 Pabna 267 208 243 197 269 225 243 186 Rajshahi 216 183 187 156 212 178 188 154 Rangpur 297 141 195 140 204 148 213 130Bangladesh 266 198 237 166 288 220 254 179Source: Agriculture Wing, BBS.

Employment, Wages and Wage Indices
8 Monthly Statistical Bulletin, Bangladesh, June-2013.
2.4 AVERAGE DAILY WAGE RATE OF AGRICULTURAL LABOUR WITHOUT FOOD AND WITH FOOD BY GREATER DISTRICT AND BY SEX
(Wages in Taka) Region May’13 Jun’13
Without Food With Food Without Food With FoodMale Female Male Female Male Female Male Female
Barisal Division Barisal 307 295 280 - 308 300 276 - Patuakhali 280 - 260 - 293 - 261 - Chittagong Division Bandarban 299 211 - - 305 192 - - Chittagong 427 304 380 258 406 281 365 241 Comilla 324 220 357 200 309 223 271 201 Khagrachhari 295 223 240 200 292 212 220 180 Noakhali 303 - 290 - 289 - 309 - Rangamati 394 269 260 200 278 258 250 200 Sylhet 293 196 247 163 255 186 202 128 Dhaka Division Dhaka 358 253 346 227 331 254 296 228 Faridpur 349 202 275 185 287 208 264 205 Jamalpur 325 250 300 190 266 228 247 158 Kishoreganj 372 350 351 270 266 212 266 184 Mymensingh 373 205 338 263 28 205 259 245 Tangail 360 293 322 246 290 200 267 150 Khulna Division Jessore 284 186 264 156 229 126 212 97 Khulna 291 207 275 202 251 184 236 140 Kushtia 224 - 191 126 Rajshahi Division Bogra 292 255 270 200 253 250 256 200 Dinajpur 253 216 230 195 234 195 210 161 Pabna 280 245 238 225 290 259 270 220 Rajshahi 225 190 199 171 215 189 178 164 Rangpur 253 149 230 130 250 146 236 127Bangladesh 311 236 280 201 283 245 252 175
2.4 AVERAGE DAILY WAGE RATE OF AGRICULTURAL LABOUR WITHOUT FOOD AND WITH FOOD BY GREATER DISTRICT AND BY SEX
(Wages in Taka) Region Nov12 Dec’12
Without Food With Food Without Food With FoodMale Female Male Female Male Female Male Female
Barisal Division Barisal 286 215 244 190 300 269 264 - Patuakhali 291 - 226 165 294 150 265 - Chittagong Division Bandarban 270 190 - - 285 194 115 162Chittagong 340 183 305 180 374 265 315 200 Comilla 300 205 260 182 281 190 214 160 Khagrachhari 260 197 180 165 194 206 109 162 Noakhali 290 208 248 - 288 182 257 - Rangamati 300 207 220 165 243 207 213 172 Sylhet 270 210 232 180 175 187 215 160 Dhaka Division Dhaka 300 217 254 163 294 219 240 178 Faridpur 254 205 207 154 270 189 233 163 Jamalpur 310 185 265 135 290 217 232 - Kishoreganj 335 225 278 185 300 231 249 178 Mymensingh 300 218 253 179 285 220 158 189 Tangail 251 165 219 137 270 170 240 142 Khulna Division Jessore 209 148 185 125 230 267 200 134 Khulna 295 210 245 177 266 160 230 129 Kushtia 207 105 178 130 211 - 189 115 Rajshahi Division Bogra 261 207 211 184 301 218 285 158 Dinajpur 207 158 172 135 214 195 180 163 Pabna 264 205 215 160 260 200 251 162 Rajshahi 212 190 185 151 228 180 200 155 Rangpur 198 147 165 108 203 140 190 120 Bangladesh 270 195 225 160 272 198 228 158Source : Agriculture Wing,BBS

Employment, Wages and Wage Indices
Monthly Statistical Bulletin, Bangladesh, June-2013.. 9
2.5 WAGE RATE INDICES BY MAJOR SECTOR IN BANGLADESH (Base: 1969-70=100)
Period General Nominal Indices
Agriculture Fishery Manufacturing industry Construction
2008-09 June 5232.55 4529.36 4539.15 6350.05 4374.47
2009-10 Jan 5464.14 4838.92 4746.26 6541.48 4652.56 Feb 5492.28 4878.23 4770.87 6561.60 4677.10 Mar 5505.57 4902.32 4780.50 6572.99 4699.07 Apr 5522.48 4943.73 4794.54 6579.26 4715.59 May 5547.13 4968.21 4809.37 6614.89 4930.29 Jun 5561.84 4985.37 4827.45 6620.28 4955.80
2010-11 Jul 5595.56 5026.58 4846.86 6663.54 4777.27 Aug 5613.23 5054.74 4871.08 6669.92 4800.52 Sep 5640.80 5101.41 4887.65 6693.13 4828.66 Oct 5668.87 5149.51 4912.41 6711.10 4860.23 Nov 5702.95 5195.25 4945.57 6743.18 4887.55 Dec 5711.89 5206.90 4952.01 6753.82 4892.91 Jan 5738.57 5253.54 4977.60 6774.27 4913.18 Feb 5809.08 5384.58 4977.60 6817.01 4965.53 Mar 5895.14 5511.40 5162.58 6850.82 5100.90 Apr 5947.74 5594.06 5235.84 6864.97 5178.85 May 5999.79 5676.39 5909.52 6884.22 5250.57 Jun 6056.06 5753.22 5361.37 6910.79 5344.11
2011-12 Jul 6101.70 5828.99 5400.29 6936.66 5405.90 Aug 6141.83 5841.49 4813.73 7032.03 5989.88 Sep 6201.48 5856.67 4831.25 7063.56 6192.33 Oct 6259.82 5907.76 4877.58 7074.97 6363.82 Nov 6300.87 5940.21 4913.08 7093.02 6465.05 Dec 6360.44 5955.39 5049.75 7121.17 6554.72 Jan 6434.87 600.28 5157.62 7148.92 6718.35 Feb 6595.37 6229.42 5303.74 7294.48 6854.71 Mar 6639.85 6279.11 5359.74 7340.35 6879.67 Apr 6758.57 6381.26 5440.37 7439.02 7092.68 May 6883.56 6628.35 3522.92 7533.17 7200.20 June 6951.68 6753.96 5572.70 7576.63 7279.70
2012-13 Jul 7012.96 6836.77 5639.54 7647.31 7293.85 Aug 7063.13 6903.01 5679.64 7709.36 7314.29 Sep 7155.37 7020.32 5766.99 7787.37 7414.78 Oct 7210.84 7117.65 5838.09 7809.52 7479.40 Nov 7277.04 7232.22 5917.49 7834.03 7567.40 Dec 7358.93 7368.19 6017.98 7881.53 7645.34 Jan 7441.84 7509.67 6086.43 7939.82 7733.44 Feb 7531.22 7673.25 6117.54 8037.04 7791.23 Mar 7599.64 7732.61 6159.95 8122.49 7860.66 Apr 7633.19 7766.43 6183.92 8164.94 7885.72 May 7667.68 7803.71 3218.95 8204.47 7906.80 June 7709.24 7834.34 6244.08 8268.94 7930.19
Source: National Accounting Wing, BBS.
Employment, Wages and Wage Indices
10 Monthly Statistical Bulletin, Bangladesh, June-2013.
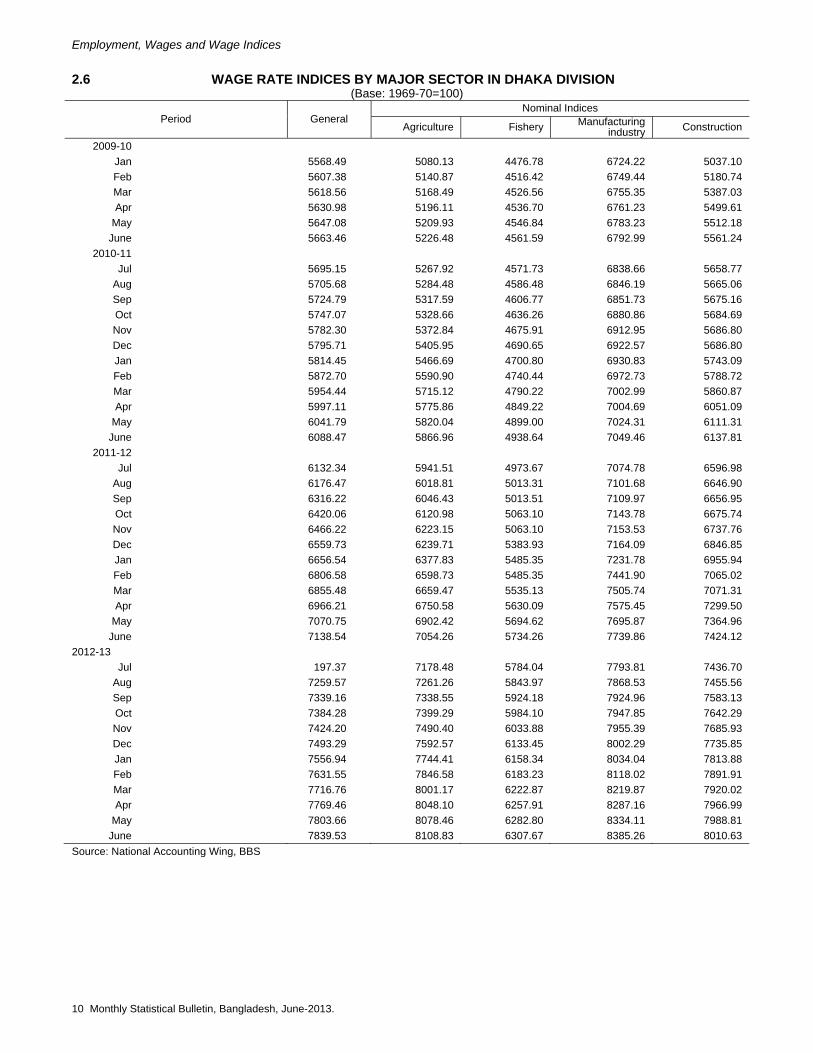
2.6 WAGE RATE INDICES BY MAJOR SECTOR IN DHAKA DIVISION (Base: 1969-70=100)
Period General Nominal Indices
Agriculture Fishery Manufacturing industry Construction
2009-10 Jan 5568.49 5080.13 4476.78 6724.22 5037.10 Feb 5607.38 5140.87 4516.42 6749.44 5180.74 Mar 5618.56 5168.49 4526.56 6755.35 5387.03 Apr 5630.98 5196.11 4536.70 6761.23 5499.61
May 5647.08 5209.93 4546.84 6783.23 5512.18 June 5663.46 5226.48 4561.59 6792.99 5561.24
2010-11 Jul 5695.15 5267.92 4571.73 6838.66 5658.77
Aug 5705.68 5284.48 4586.48 6846.19 5665.06 Sep 5724.79 5317.59 4606.77 6851.73 5675.16 Oct 5747.07 5328.66 4636.26 6880.86 5684.69 Nov 5782.30 5372.84 4675.91 6912.95 5686.80 Dec 5795.71 5405.95 4690.65 6922.57 5686.80 Jan 5814.45 5466.69 4700.80 6930.83 5743.09 Feb 5872.70 5590.90 4740.44 6972.73 5788.72 Mar 5954.44 5715.12 4790.22 7002.99 5860.87 Apr 5997.11 5775.86 4849.22 7004.69 6051.09
May 6041.79 5820.04 4899.00 7024.31 6111.31 June 6088.47 5866.96 4938.64 7049.46 6137.81
2011-12 Jul 6132.34 5941.51 4973.67 7074.78 6596.98
Aug 6176.47 6018.81 5013.31 7101.68 6646.90 Sep 6316.22 6046.43 5013.51 7109.97 6656.95 Oct 6420.06 6120.98 5063.10 7143.78 6675.74 Nov 6466.22 6223.15 5063.10 7153.53 6737.76 Dec 6559.73 6239.71 5383.93 7164.09 6846.85 Jan 6656.54 6377.83 5485.35 7231.78 6955.94 Feb 6806.58 6598.73 5485.35 7441.90 7065.02 Mar 6855.48 6659.47 5535.13 7505.74 7071.31 Apr 6966.21 6750.58 5630.09 7575.45 7299.50
May 7070.75 6902.42 5694.62 7695.87 7364.96 June 7138.54 7054.26 5734.26 7739.86 7424.12
2012-13 Jul 197.37 7178.48 5784.04 7793.81 7436.70
Aug 7259.57 7261.26 5843.97 7868.53 7455.56 Sep 7339.16 7338.55 5924.18 7924.96 7583.13 Oct 7384.28 7399.29 5984.10 7947.85 7642.29 Nov 7424.20 7490.40 6033.88 7955.39 7685.93 Dec 7493.29 7592.57 6133.45 8002.29 7735.85 Jan 7556.94 7744.41 6158.34 8034.04 7813.88 Feb 7631.55 7846.58 6183.23 8118.02 7891.91 Mar 7716.76 8001.17 6222.87 8219.87 7920.02 Apr 7769.46 8048.10 6257.91 8287.16 7966.99
May 7803.66 8078.46 6282.80 8334.11 7988.81 June 7839.53 8108.83 6307.67 8385.26 8010.63
Source: National Accounting Wing, BBS

Employment, Wages and Wage Indices
Monthly Statistical Bulletin, Bangladesh, June-2013.. 11
2.7 WAGE RATE INDICES BY MAJOR SECTOR IN CHITTAGONG DIVISION (Base: 1969-70=100)
Period General Nominal Indices
Agriculture Fishery Manufacturing industry Construction
2008-09 June 4741.58 4138.96 3519.40 6014.48 4020.56
2009-10 Jan 4955.50 4419.35 3645.84 6257.73 4396.84 Feb 4974.52 4444.17 3655.90 6281.60 4504.34 Mar 4984.01 4460.30 3666.91 6285.04 4622.78 Apr 4993.67 4472.70 3677.93 6290.75 4736.22
May 5010.66 4485.11 3687.99 6315.74 4848.72 June 5023.29 4501.24 3699.00 6320.30 4875.60
2010-11 Jul 5053.51 4533.50 3719.12 6366.54 4881.85
Aug 5068.43 4558.31 3730.13 6372.49 4908.74 Sep 5091.31 4583.13 3741.15 6398.81 4934.68 Oct 5115.60 4640.20 3762.22 6407.02 4941.56 Nov 514493 4697.27 3772.28 6436.93 4981.25 Dec 5149.90 4697.27 3783.29 6440.73 4987.50 Jan 5172.71 4725.81 3794.31 6468.13 4997.19 Feb 5231.51 4820.10 3879.55 6509.25 4999.38
Mar 5296.88 4937.97 3932.72 6533.89 5045.97 Apr 5333.51 4995.04 3964.80 6554.47 5198.97
May 5365.94 5064.42 4017.96 6554.52 5238.17 June 5415.62 5162.53 4060.11 6579.12 5697.24
2011-12 Jul 5461.41 5215.88 4102.26 6602.85 5783.20
Aug 5520.03 5285.36 4155.42 6632.61 5894.36 Sep 5700.37 5317.62 4155.42 6642.11 5915.45 Oct 5744.90 5342.42 4245.96 6644.52 5947.37 Nov 5780.66 5342.43 4296.26 6661.53 5941.53 Dec 5834.39 5383.37 4401.63 6673.48 6039.99 Jan 5880.06 5383.37 4507.00 6685.74 6138.44 Feb 6247.11 6042.18 4777.56 7040.23 6335.35
Mar 6275.76 6074.44 4819.71 7061.69 6361.29 Apr 6380.88 6184.86 4882.93 7152.18 6532.26
May 6475.35 6352.36 4936.09 7225.75 6636.96 June 6531.97 6470.22 4978.24 7254.55 6702.28
2012-13 Jul 6581.43 6507.44 5073.55 7305.70 6714.78 Aug 6626.10 6588.09 5093.67 7357.61 6733.53 Sep 6720.70 6693.55 5177.01 7470.63 6791.67 Oct 6757.63 6763.03 5214.13 7489.98 6831.05
Nov 6810.22 6836.23 5284.28 7520.24 6890.12 Dec 6883.58 6978.91 5359.47 7545.46 6988.58 Jan 6970.74 7121.59 5454.78 7598.75 7079.84 Feb 7033.67 7264.27 5486.86 7642.76 7131.72
Mar 7107.13 7305.21 5518.00 7754.57 7203.29 Apr 7145.67 7346.15 5548.18 7802.39 7229.23
May 7174.56 7374.69 5579.31 7831.82 7255.17 June 7208.73 7403.23 5610.45 7877.54 7274.87
Source: National Accounting Wing, BBS
Employment, Wages and Wage Indices
12 Monthly Statistical Bulletin, Bangladesh, June-2013.
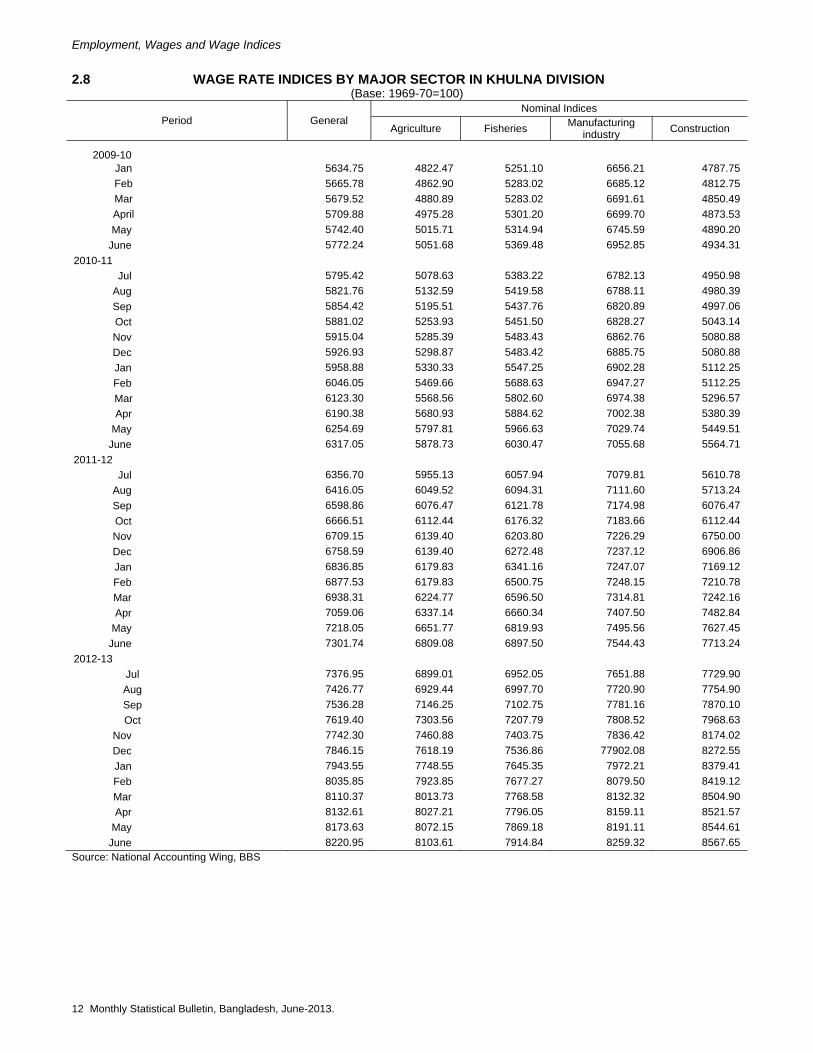
2.8 WAGE RATE INDICES BY MAJOR SECTOR IN KHULNA DIVISION (Base: 1969-70=100)
Period General Nominal Indices
Agriculture Fisheries Manufacturing industry Construction
2009-10 Jan 5634.75 4822.47 5251.10 6656.21 4787.75 Feb 5665.78 4862.90 5283.02 6685.12 4812.75 Mar 5679.52 4880.89 5283.02 6691.61 4850.49 April 5709.88 4975.28 5301.20 6699.70 4873.53 May 5742.40 5015.71 5314.94 6745.59 4890.20
June 5772.24 5051.68 5369.48 6952.85 4934.31 2010-11
Jul 5795.42 5078.63 5383.22 6782.13 4950.98 Aug 5821.76 5132.59 5419.58 6788.11 4980.39 Sep 5854.42 5195.51 5437.76 6820.89 4997.06 Oct 5881.02 5253.93 5451.50 6828.27 5043.14 Nov 5915.04 5285.39 5483.43 6862.76 5080.88 Dec 5926.93 5298.87 5483.42 6885.75 5080.88 Jan 5958.88 5330.33 5547.25 6902.28 5112.25 Feb 6046.05 5469.66 5688.63 6947.27 5112.25 Mar 6123.30 5568.56 5802.60 6974.38 5296.57 Apr 6190.38 5680.93 5884.62 7002.38 5380.39
May 6254.69 5797.81 5966.63 7029.74 5449.51 June 6317.05 5878.73 6030.47 7055.68 5564.71
2011-12 Jul 6356.70 5955.13 6057.94 7079.81 5610.78
Aug 6416.05 6049.52 6094.31 7111.60 5713.24 Sep 6598.86 6076.47 6121.78 7174.98 6076.47 Oct 6666.51 6112.44 6176.32 7183.66 6112.44 Nov 6709.15 6139.40 6203.80 7226.29 6750.00 Dec 6758.59 6139.40 6272.48 7237.12 6906.86 Jan 6836.85 6179.83 6341.16 7247.07 7169.12 Feb 6877.53 6179.83 6500.75 7248.15 7210.78 Mar 6938.31 6224.77 6596.50 7314.81 7242.16 Apr 7059.06 6337.14 6660.34 7407.50 7482.84
May 7218.05 6651.77 6819.93 7495.56 7627.45 June 7301.74 6809.08 6897.50 7544.43 7713.24
2012-13 Jul 7376.95 6899.01 6952.05 7651.88 7729.90 Aug 7426.77 6929.44 6997.70 7720.90 7754.90 Sep 7536.28 7146.25 7102.75 7781.16 7870.10 Oct 7619.40 7303.56 7207.79 7808.52 7968.63
Nov 7742.30 7460.88 7403.75 7836.42 8174.02 Dec 7846.15 7618.19 7536.86 77902.08 8272.55 Jan 7943.55 7748.55 7645.35 7972.21 8379.41 Feb 8035.85 7923.85 7677.27 8079.50 8419.12 Mar 8110.37 8013.73 7768.58 8132.32 8504.90 Apr 8132.61 8027.21 7796.05 8159.11 8521.57
May 8173.63 8072.15 7869.18 8191.11 8544.61 June 8220.95 8103.61 7914.84 8259.32 8567.65
Source: National Accounting Wing, BBS
Employment, Wages and Wage Indices
Monthly Statistical Bulletin, Bangladesh, June-2013.. 13
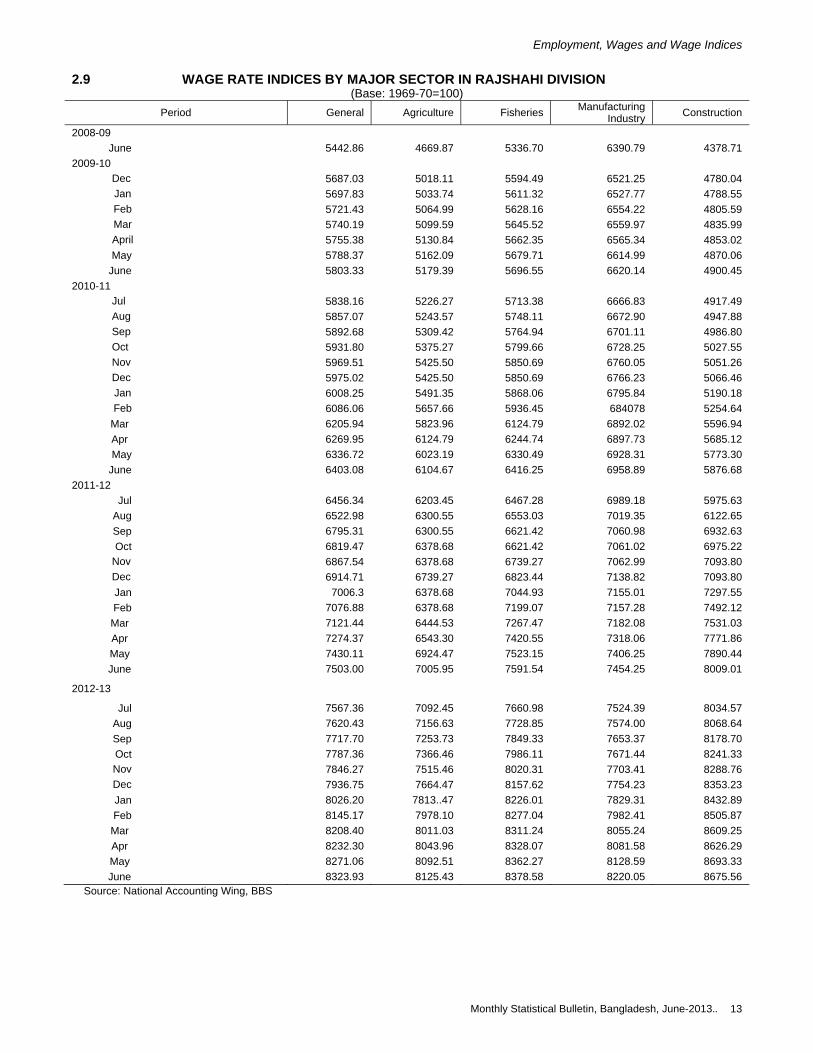
2.9 WAGE RATE INDICES BY MAJOR SECTOR IN RAJSHAHI DIVISION (Base: 1969-70=100)
Period General Agriculture Fisheries Manufacturing Industry Construction
2008-09 June 5442.86 4669.87 5336.70 6390.79 4378.71
2009-10 Dec 5687.03 5018.11 5594.49 6521.25 4780.04 Jan 5697.83 5033.74 5611.32 6527.77 4788.55 Feb 5721.43 5064.99 5628.16 6554.22 4805.59 Mar 5740.19 5099.59 5645.52 6559.97 4835.99 April 5755.38 5130.84 5662.35 6565.34 4853.02 May 5788.37 5162.09 5679.71 6614.99 4870.06
June 5803.33 5179.39 5696.55 6620.14 4900.45 2010-11
Jul 5838.16 5226.27 5713.38 6666.83 4917.49 Aug 5857.07 5243.57 5748.11 6672.90 4947.88 Sep 5892.68 5309.42 5764.94 6701.11 4986.80 Oct 5931.80 5375.27 5799.66 6728.25 5027.55 Nov 5969.51 5425.50 5850.69 6760.05 5051.26 Dec 5975.02 5425.50 5850.69 6766.23 5066.46 Jan 6008.25 5491.35 5868.06 6795.84 5190.18 Feb 6086.06 5657.66 5936.45 684078 5254.64
Mar 6205.94 5823.96 6124.79 6892.02 5596.94 Apr 6269.95 6124.79 6244.74 6897.73 5685.12 May 6336.72 6023.19 6330.49 6928.31 5773.30
June 6403.08 6104.67 6416.25 6958.89 5876.68 2011-12
Jul 6456.34 6203.45 6467.28 6989.18 5975.63 Aug 6522.98 6300.55 6553.03 7019.35 6122.65 Sep 6795.31 6300.55 6621.42 7060.98 6932.63 Oct 6819.47 6378.68 6621.42 7061.02 6975.22
Nov 6867.54 6378.68 6739.27 7062.99 7093.80 Dec 6914.71 6739.27 6823.44 7138.82 7093.80 Jan 7006.3 6378.68 7044.93 7155.01 7297.55 Feb 7076.88 6378.68 7199.07 7157.28 7492.12 Mar 7121.44 6444.53 7267.47 7182.08 7531.03 Apr 7274.37 6543.30 7420.55 7318.06 7771.86 May 7430.11 6924.47 7523.15 7406.25 7890.44 June 7503.00 7005.95 7591.54 7454.25 8009.01
2012-13
Jul 7567.36 7092.45 7660.98 7524.39 8034.57 Aug 7620.43 7156.63 7728.85 7574.00 8068.64 Sep 7717.70 7253.73 7849.33 7653.37 8178.70 Oct 7787.36 7366.46 7986.11 7671.44 8241.33 Nov 7846.27 7515.46 8020.31 7703.41 8288.76 Dec 7936.75 7664.47 8157.62 7754.23 8353.23 Jan 8026.20 7813..47 8226.01 7829.31 8432.89 Feb 8145.17 7978.10 8277.04 7982.41 8505.87 Mar 8208.40 8011.03 8311.24 8055.24 8609.25 Apr 8232.30 8043.96 8328.07 8081.58 8626.29 May 8271.06 8092.51 8362.27 8128.59 8693.33 June 8323.93 8125.43 8378.58 8220.05 8675.56
Source: National Accounting Wing, BBS
Employment, Wages and Wage Indices
14 Monthly Statistical Bulletin, Bangladesh, June-2013.
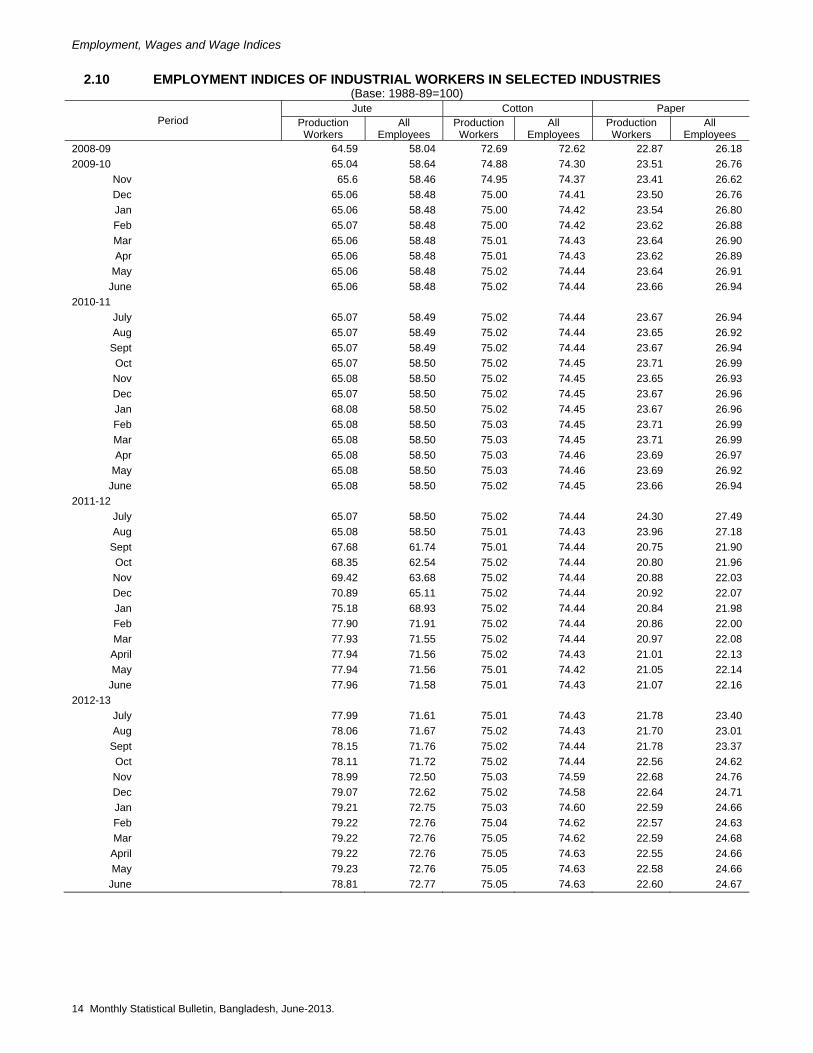
2.10 EMPLOYMENT INDICES OF INDUSTRIAL WORKERS IN SELECTED INDUSTRIES (Base: 1988-89=100)
Period Jute Cotton Paper
Production Workers
All Employees
Production Workers
All Employees
Production Workers
All Employees
2008-09 64.59 58.04 72.69 72.62 22.87 26.18 2009-10 65.04 58.64 74.88 74.30 23.51 26.76
Nov 65.6 58.46 74.95 74.37 23.41 26.62 Dec 65.06 58.48 75.00 74.41 23.50 26.76 Jan 65.06 58.48 75.00 74.42 23.54 26.80 Feb 65.07 58.48 75.00 74.42 23.62 26.88 Mar 65.06 58.48 75.01 74.43 23.64 26.90 Apr 65.06 58.48 75.01 74.43 23.62 26.89
May 65.06 58.48 75.02 74.44 23.64 26.91 June 65.06 58.48 75.02 74.44 23.66 26.94
2010-11 July 65.07 58.49 75.02 74.44 23.67 26.94 Aug 65.07 58.49 75.02 74.44 23.65 26.92
Sept 65.07 58.49 75.02 74.44 23.67 26.94 Oct 65.07 58.50 75.02 74.45 23.71 26.99 Nov 65.08 58.50 75.02 74.45 23.65 26.93 Dec 65.07 58.50 75.02 74.45 23.67 26.96 Jan 68.08 58.50 75.02 74.45 23.67 26.96 Feb 65.08 58.50 75.03 74.45 23.71 26.99 Mar 65.08 58.50 75.03 74.45 23.71 26.99 Apr 65.08 58.50 75.03 74.46 23.69 26.97
May 65.08 58.50 75.03 74.46 23.69 26.92 June 65.08 58.50 75.02 74.45 23.66 26.94
2011-12 July 65.07 58.50 75.02 74.44 24.30 27.49 Aug 65.08 58.50 75.01 74.43 23.96 27.18
Sept 67.68 61.74 75.01 74.44 20.75 21.90 Oct 68.35 62.54 75.02 74.44 20.80 21.96 Nov 69.42 63.68 75.02 74.44 20.88 22.03 Dec 70.89 65.11 75.02 74.44 20.92 22.07 Jan 75.18 68.93 75.02 74.44 20.84 21.98 Feb 77.90 71.91 75.02 74.44 20.86 22.00 Mar 77.93 71.55 75.02 74.44 20.97 22.08
April 77.94 71.56 75.02 74.43 21.01 22.13 May 77.94 71.56 75.01 74.42 21.05 22.14
June 77.96 71.58 75.01 74.43 21.07 22.16 2012-13
July 77.99 71.61 75.01 74.43 21.78 23.40 Aug 78.06 71.67 75.02 74.43 21.70 23.01
Sept 78.15 71.76 75.02 74.44 21.78 23.37 Oct 78.11 71.72 75.02 74.44 22.56 24.62 Nov 78.99 72.50 75.03 74.59 22.68 24.76 Dec 79.07 72.62 75.02 74.58 22.64 24.71 Jan 79.21 72.75 75.03 74.60 22.59 24.66 Feb 79.22 72.76 75.04 74.62 22.57 24.63 Mar 79.22 72.76 75.05 74.62 22.59 24.68
April 79.22 72.76 75.05 74.63 22.55 24.66 May 79.23 72.76 75.05 74.63 22.58 24.66
June 78.81 72.77 75.05 74.63 22.60 24.67

Employment, Wages and Wage Indices
Monthly Statistical Bulletin, Bangladesh, June-2013.. 15
2.10 EPLOYMENT INDICES OF INDUSTRIAL WORKERS IN SELECTED INDUSTRIES CONTD. (Base: 1988-89=100)
Period
Cement Fertilizer Petroleum Paints & Varnishes
Production Workers
All Employee
s
Production Workers
All Employee
s
Production Workers
All Employee
s
Production Workers
All Employees
2009-10 166.28 152.30 82.61 88.06 114..71 131.34 207.48 169.30
Jan 167.17 152.99 82.71 88.14 116.07 132.63 209.62 171.39 Feb 167.31 153.13 82.71 88.17 116.37 132.95 210.16 171.86 Mar 167.50 153.43 82.74 88.17 116.62 133.27 211.22 172.79 Apr 167.71 153.66 82.71 88.14 116.89 133.60 211.76 173.25
May 167.99 153.96 82.74 88.17 117.16 134.08 212.29 173.72 Jun 168.13 154.11 82.74 88.17 117.16 134.08 212.83 174.18
2010-11 July 168.27 154.20 82.71 88.14 117.17 134.09 213.90 174.88 Aug 168.27 154.20 82.75 88.17 116.89 133.76 213.90 174.88
Sept 168.41 154.35 82.75 88.17 117.17 134.09 214.97 175.58 Oct 168.54 154.50 82.82 88.22 116.89 133.76 216.58 176.74 Nov 168.54 154.50 83.06 88.43 117.71 134.89 217.11 177.21 Dec 168.68 154.65 83.13 88.47 117.98 135.22 217.11 177.21 Jan 168.82 154.80 83.17 88.50 118.26 135.54 217.65 177.67 Feb 168.96 154.95 83.10 88.44 117.71 134.89 218.18 178.14 Mar 168.96 154.95 83.17 88.50 118.26 135.54 218.18 178.14 Apr 168.96 154.95 83.03 88.40 117.98 135.22 219.25 179.07
May 169.23 155.40 83.03 88.43 118.53 136.03 219.79 180.23 June 169.23 155.40 83.06 88.44 117.98 135.37 218.71 178.83
2010-11 July 168.95 155.10 83.13 88.48 117.16 134.41 214.43 174.65 Aug 169.09 155.25 83.16 88.50 117.43 134.73 214.97 175.11
Sept 197.52 159.93 84.41 75.77 102.17 124.87 136.89 114.88 Oct 197.80 160.01 84.34 75.71 102.99 125.68 137.96 115.81 Nov 198.07 160.01 84.51 75.85 104.08 126.65 139.03 116.51 Dec 198.48 160.31 84.69 75.98 105.17 127.78 140.64 117.44 Jan 198.76 160.61 84.90 76.13 104.63 127.14 142.24 118.60 Feb 199.17 160.99 84.62 75.92 103.81 126.33 144.31 119.30 Mar 19986 161.52 84.52 75.88 104.35 126.81 144.38 120.00 Apr 200.00 161.75 83.30 74.85 104.90 127.30 141.71 118.13
May 200.54 162.20 83.16 74.71 105.72 127.94 143.85 119.53 June 200.58 162.35 83.47 74.89 103..54 126.33 145.45 120.46
2012-13 July 199.73 161.38 91.88 83.58 100.27 128.11 145.99 120.70 Aug 199.73 161.45 91.32 83.58 100.27 127.95 147.06 121.86
Sept 200.27 161.98 91.32 83.20 101.09 128.76 148.66 123.26 Oct 199.86 161.60 92.05 83.43 100.81 128.27 147.06 121.86 Nov 200.54 162.50 92..22 84.22 100.81 128.27 149.73 123.25 Dec 201.09 162.81 92.15 84.10 100.81 128.10 150.80 123.72 Jan 201.23 162.96 92.01 83.54 100.27 126.97 150.80 123.48 Feb 201.37 163.11 92.15 83.47 99.45 126.65 151.87 124.41 Mar 201.64 163.41 91.98 83.35 100.27 126.49 152.40 124.88
April 201.78 163.56 92.19 83.68 101.08 126.81 152.40 124.65 May 201.79 163.57 90.56 83.10 100.82 126.82 151.87 124.19
June 201.92 163.72 90.56 83.10 100.82 127.30 151.34 123.95

Employment, Wages and Wage Indices
16 Monthly Statistical Bulletin, Bangladesh, June-2013.
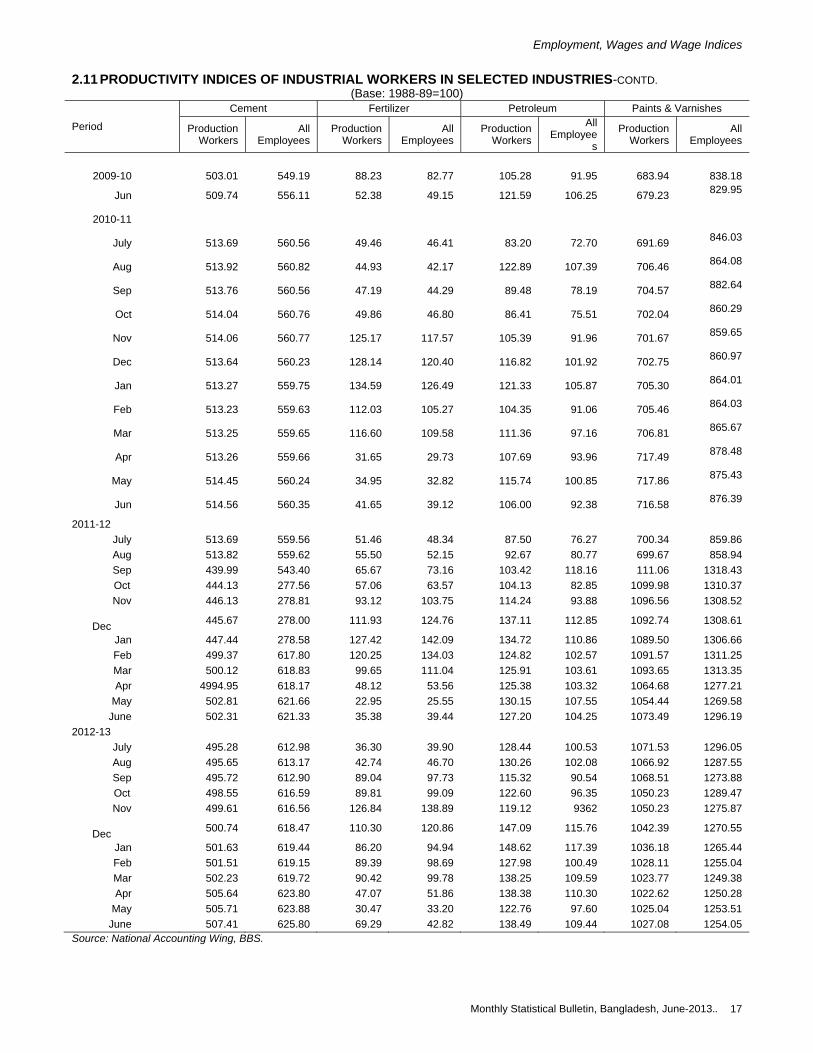
2.11 PRODUCTIVITY INDICES OF INDUSTRIAL WORKERS IN SELECTED INDUSTRIES (Base: 1988-89=100)
Period Jute Cotton Paper
Production Workers All Employees Production
Workers All Employees Production Workers All Employees
2008-09 91.65 86.84 411.76 414.98 92.73 68.86 2009-10 91.65 86.84 411.76 414.98 92.73 68.86
Nov 95.51 106.29 412.75 416.02 113.82 99.93 Dec 83.71 93.12 413.15 416.42 110.46 97.01 Jan 99.66 110.87 409.13 412.32 18.86 13.56 Feb 85.32 94.93 411.42 414.63 09.39 08.25 Mar 88.02 97.93 411.85 415.06 83.92 73.75 Apr 78.17 86.96 412.87 416.09 78.74 69.17
May 84.46 93.96 413.31 416.53 150.88 132.55 Jun 134.46 149.58 414.47 417.70 110.18 96.77
2010-11 July 86.23 95.93 414.27 422.54 102.75 90.27 Aug 83.48 92.87 419.75 423.03 90.91 79.87
Sept 77.19 85.88 419.98 423.25 96.79 85.04 Oct 86.66 96.39 420.51 423.73 98.65 86.66 Nov 91.40 101.68 421.19 424.42 83.47 93.30 Dec 86.75 96.50 421.38 424.61 92.61 81.31 Jan 92.36 102.75 421.74 424.97 83.44 73.26 Feb 72.91 81.11 422.12 425.41 105.31 92.52 Mar 87.15 96.96 422.26 425.55 123.87 108.82 Apr 92.50 102.91 422.70 425.93 122.71 107.79
May 96.68 107.56 423.71 426.95 121.10 106.39 June 158.81 176.68 422.40 425.64 121.25 106.49
2011-12 July 101.38 112.76 421.36 424.65 228.39 201.89 Aug 102.21 113.70 373.34 376.15 211.22 186.20
Sept 97.87 107.28 37669 379.58 292.81 277.44 Oct 113.92 124.51 390.90 393.95 305.72 289.57 Nov 83.17 90.67 393.42 396.49 327.01 309.94 Dec 106.37 115.81 394.53 397.60 328.01 310.91 Jan 90.99 99.24 391.13 394.18 261.03 247.49 Feb 73.40 79.51 391.62 394.68 287.67 272.77 Mar 78.08 85.04 399.42 402.53 306.29 290.84 Apr 91.28 99.42 397.81 400.96 312.42 296.61
May 80.58 87.77 39534 398.48 314.25 298.78 June 177.96 193.82 396.58 399.67 316.04 300.49
2012-13 July 94.61 103.04 394.97 398.05 377.04 350.94 Aug 75.93 82.70 397.89 401.05 312.90 293.94
Sept 106.97 116.50 398.13 401.24 298.12 277.83 Oct 97.25 105.91 398.37 401.48 275.00 251.99 Nov 96.26 104.88 398.62 400.97 276.94 253.67 Dec 100.32 109.23 399.17 401.52 302.38 277.05 Jan 102.39 111.49 399.29 401.59 302.65 277.25 Feb 96.25 104.79 399.36 401.60 279.39 256.02 Mar 89.27 97.19 398.66 400.96 283.39 259.40
April 98.04 106.74 398.81 401.05 280.26 256.28 May 84.17 91.64 398.44 400.68 290.48 265.98
June 232.89 253.57 298.93 401.18 288.76 264.53
Employment, Wages and Wage Indices
Monthly Statistical Bulletin, Bangladesh, June-2013.. 17
2.11 PRODUCTIVITY INDICES OF INDUSTRIAL WORKERS IN SELECTED INDUSTRIES-CONTD. (Base: 1988-89=100)
Period
Cement Fertilizer Petroleum Paints & Varnishes
Production Workers
All Employees
Production Workers
All Employees
Production Workers
All Employee
s
Production Workers
All Employees
2009-10 503.01 549.19 88.23 82.77 105.28 91.95 683.94 838.18
Jun 509.74 556.11 52.38 49.15 121.59 106.25 679.23 829.95
2010-11
July 513.69 560.56 49.46 46.41 83.20 72.70 691.69 846.03
Aug 513.92 560.82 44.93 42.17 122.89 107.39 706.46 864.08
Sep 513.76 560.56 47.19 44.29 89.48 78.19 704.57 882.64
Oct 514.04 560.76 49.86 46.80 86.41 75.51 702.04 860.29
Nov 514.06 560.77 125.17 117.57 105.39 91.96 701.67 859.65
Dec 513.64 560.23 128.14 120.40 116.82 101.92 702.75 860.97
Jan 513.27 559.75 134.59 126.49 121.33 105.87 705.30 864.01
Feb 513.23 559.63 112.03 105.27 104.35 91.06 705.46 864.03
Mar 513.25 559.65 116.60 109.58 111.36 97.16 706.81 865.67
Apr 513.26 559.66 31.65 29.73 107.69 93.96 717.49 878.48
May 514.45 560.24 34.95 32.82 115.74 100.85 717.86 875.43
Jun 514.56 560.35 41.65 39.12 106.00 92.38 716.58 876.39
2011-12 July 513.69 559.56 51.46 48.34 87.50 76.27 700.34 859.86 Aug 513.82 559.62 55.50 52.15 92.67 80.77 699.67 858.94 Sep 439.99 543.40 65.67 73.16 103.42 118.16 111.06 1318.43 Oct 444.13 277.56 57.06 63.57 104.13 82.85 1099.98 1310.37 Nov 446.13 278.81 93.12 103.75 114.24 93.88 1096.56 1308.52
Dec 445.67 278.00 111.93 124.76 137.11 112.85 1092.74 1308.61
Jan 447.44 278.58 127.42 142.09 134.72 110.86 1089.50 1306.66 Feb 499.37 617.80 120.25 134.03 124.82 102.57 1091.57 1311.25 Mar 500.12 618.83 99.65 111.04 125.91 103.61 1093.65 1313.35 Apr 4994.95 618.17 48.12 53.56 125.38 103.32 1064.68 1277.21
May 502.81 621.66 22.95 25.55 130.15 107.55 1054.44 1269.58 June 502.31 621.33 35.38 39.44 127.20 104.25 1073.49 1296.19
2012-13 July 495.28 612.98 36.30 39.90 128.44 100.53 1071.53 1296.05 Aug 495.65 613.17 42.74 46.70 130.26 102.08 1066.92 1287.55 Sep 495.72 612.90 89.04 97.73 115.32 90.54 1068.51 1273.88 Oct 498.55 616.59 89.81 99.09 122.60 96.35 1050.23 1289.47 Nov 499.61 616.56 126.84 138.89 119.12 9362 1050.23 1275.87
Dec 500.74 618.47 110.30 120.86 147.09 115.76 1042.39 1270.55
Jan 501.63 619.44 86.20 94.94 148.62 117.39 1036.18 1265.44 Feb 501.51 619.15 89.39 98.69 127.98 100.49 1028.11 1255.04 Mar 502.23 619.72 90.42 99.78 138.25 109.59 1023.77 1249.38 Apr 505.64 623.80 47.07 51.86 138.38 110.30 1022.62 1250.28
May 505.71 623.88 30.47 33.20 122.76 97.60 1025.04 1253.51 June 507.41 625.80 69.29 42.82 138.49 109.44 1027.08 1254.05
Source: National Accounting Wing, BBS.

Employment, Wages and Wage Indices
18 Monthly Statistical Bulletin, Bangladesh, June-2013.
2.12 DEPARTURE OF BANGLADESH NATIONALS ON EMPLOYMENT BY COUNTRY OF DESTINATION (Number) Country 2012 Monthly Oct’12 Nov’12 Dec’12 jan’13 Feb’13 Mar’13 Apr’13 Afganistan - - - - - - - - Australia - - - - - - - - Azerbizan 21777 - - - - - - - Bahrain 5038 1646 1821 2000 2580 1917 2668 1904 Brunei - 391 300 309 290 307 368 290 Canada - - - - - - - - China - - - - - - - - Cyprus 7478 - - - - - - - Egypt - 82 114 383 142- 390 202 02 Ethiopia - - - - - - - - Germany - - - - - - - - Greece - - - - - - - - Hong Kong - - - - - - - - Indonesia - - - - - - - - Iran - - - - - - - - Italy 9280 606 578 590 838 397 660 220 Japan 420 13 2 7 - - 05 04 Jordan 11726 1580 1399 1355 1952 1406 2621 1847 Korea (South) - - - - - - - - Kuwait 2 - - - - - - - Laus 17268 - - - - - - - Lebanon 14864 1048 1222 1204 1295 1207 1275 1024 Libya 14975 55 24 341 1338 2077 2617 461 Malaysia 804 53 82 103 62 137 349 304 Maldives 3705 - - - - - - -
Mauritious 5421 487 447 415 484 600 351 402
Madagaskar - - - - - - - - Netherland - - - - - - - - Newzealand 2288 - - - - - - - Iraq 359 22 - 27 46 564 431 148 Oman 170326 11436 12979 13561 14967 11719 12458 11038 Palau 12085 - - - - - - - Qatar 28801 3390 3173 2897 4255 3701 4605 4734 Rumania 7069 - - - - - - - Saudia Arabia 21232 2097 1419 1952 2857 2349 1749 952 Singapore 58657 4563 5113 5274 5325 3983 4581 5889 Sudan 23 2 2 4 2 - 19 08 Syria 2699 - - - - - - - S. Korea 1447 102 154 123 101 8 147 270 Tonga - - -- - - - - - U.A.E 215452 355 351 418 608 588 845 916 U.S.A - - - - - - - - UK 17 2 - 1 1 1 04 01 Viet Nam - - - - - - - - Yemen 181 - - - - - - - Other Countries 10190 1082 1255 687 361 177 289 1275 Misc. Clearance 9509 612 838 758 853 661 856 592 Grand Total: 607798 29624 31281 32409 38337 32189 37100 32281 68074-
S-1158768ource : Bureau of Manpower, Employment and Training.
Prices and Price Indices
Monthly Statistical Bulletin, Bangladesh, June-2013. 19
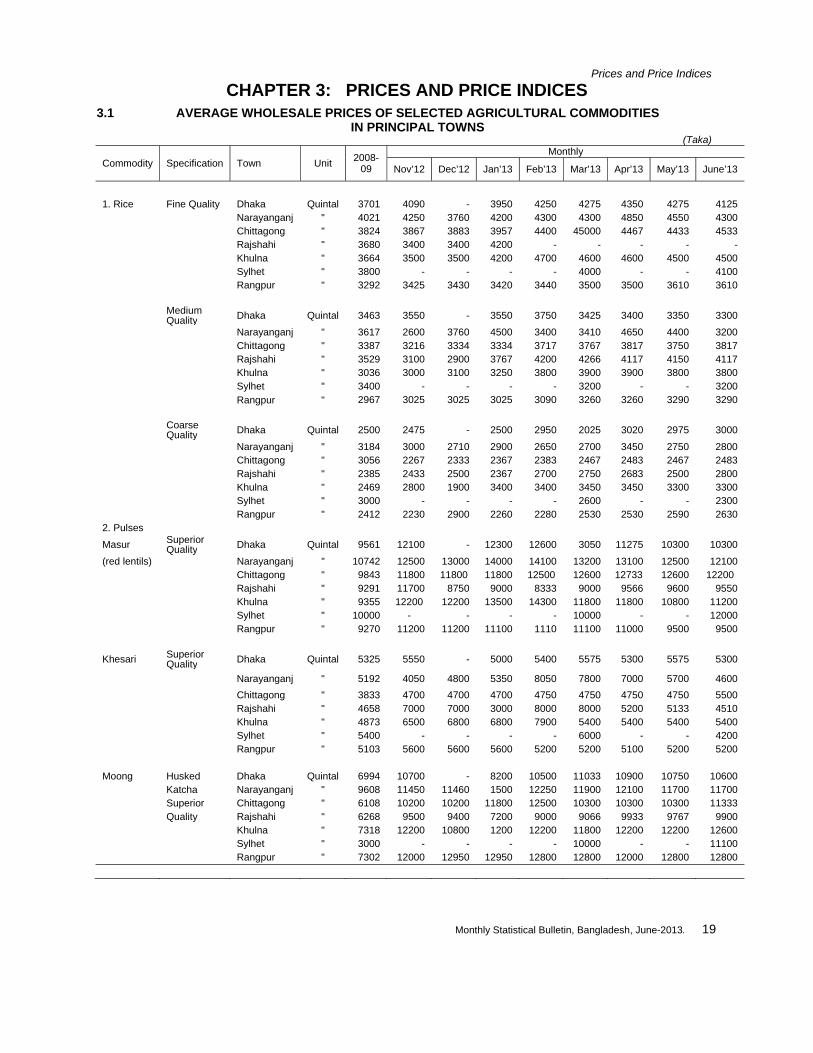
CHAPTER 3: PRICES AND PRICE INDICES
3.1 AVERAGE WHOLESALE PRICES OF SELECTED AGRICULTURAL COMMODITIES IN PRINCIPAL TOWNS
(Taka)
Commodity Specification Town Unit 2008-09
Monthly
Nov’12 Dec’12 Jan’13 Feb’13 Mar’13 Apr’13 May’13 June’13
1. Rice Fine Quality Dhaka Quintal 3701 4090 - 3950 4250 4275 4350 4275 4125 Narayanganj " 4021 4250 3760 4200 4300 4300 4850 4550 4300 Chittagong " 3824 3867 3883 3957 4400 45000 4467 4433 4533 Rajshahi " 3680 3400 3400 4200 - - - - - Khulna " 3664 3500 3500 4200 4700 4600 4600 4500 4500 Sylhet " 3800 - - - - 4000 - - 4100 Rangpur " 3292 3425 3430 3420 3440 3500 3500 3610 3610
Medium Quality Dhaka Quintal 3463 3550 - 3550 3750 3425 3400 3350 3300
Narayanganj " 3617 2600 3760 4500 3400 3410 4650 4400 3200 Chittagong " 3387 3216 3334 3334 3717 3767 3817 3750 3817 Rajshahi " 3529 3100 2900 3767 4200 4266 4117 4150 4117 Khulna " 3036 3000 3100 3250 3800 3900 3900 3800 3800 Sylhet " 3400 - - - - 3200 - - 3200 Rangpur " 2967 3025 3025 3025 3090 3260 3260 3290 3290
Coarse Quality Dhaka Quintal 2500 2475 - 2500 2950 2025 3020 2975 3000
Narayanganj " 3184 3000 2710 2900 2650 2700 3450 2750 2800 Chittagong " 3056 2267 2333 2367 2383 2467 2483 2467 2483 Rajshahi " 2385 2433 2500 2367 2700 2750 2683 2500 2800 Khulna " 2469 2800 1900 3400 3400 3450 3450 3300 3300 Sylhet " 3000 - - - - 2600 - - 2300 Rangpur " 2412 2230 2900 2260 2280 2530 2530 2590 2630 2. Pulses
Masur Superior Quality Dhaka Quintal 9561 12100 - 12300 12600 3050 11275 10300 10300
(red lentils) Narayanganj " 10742 12500 13000 14000 14100 13200 13100 12500 12100 Chittagong " 9843 11800 11800 11800 12500 12600 12733 12600 12200 Rajshahi " 9291 11700 8750 9000 8333 9000 9566 9600 9550 Khulna " 9355 12200 12200 13500 14300 11800 11800 10800 11200 Sylhet " 10000 - - - - 10000 - - 12000 Rangpur " 9270 11200 11200 11100 1110 11100 11000 9500 9500
Khesari Superior Quality Dhaka Quintal 5325 5550 - 5000 5400 5575 5300 5575 5300
Narayanganj " 5192 4050 4800 5350 8050 7800 7000 5700 4600 Chittagong " 3833 4700 4700 4700 4750 4750 4750 4750 5500 Rajshahi " 4658 7000 7000 3000 8000 8000 5200 5133 4510 Khulna " 4873 6500 6800 6800 7900 5400 5400 5400 5400 Sylhet " 5400 - - - - 6000 - - 4200 Rangpur " 5103 5600 5600 5600 5200 5200 5100 5200 5200 Moong Husked Dhaka Quintal 6994 10700 - 8200 10500 11033 10900 10750 10600 Katcha Narayanganj " 9608 11450 11460 1500 12250 11900 12100 11700 11700 Superior Chittagong " 6108 10200 10200 11800 12500 10300 10300 10300 11333 Quality Rajshahi " 6268 9500 9400 7200 9000 9066 9933 9767 9900 Khulna " 7318 12200 10800 1200 12200 11800 12200 12200 12600 Sylhet " 3000 - - - - 10000 - - 11100 Rangpur " 7302 12000 12950 12950 12800 12800 12000 12800 12800

Prices and Price Indices
20 Monthly Statistical Bulletin, Bangladesh, June-2013.
3.1 AVERAGE WHOLESALE PRICE OF SELECTED AGRICULTURALCOMMODITIES IN PRINCIPAL TOWNS-CONTD.
(Taka)
Commodity Specification Town Unit Monthly
2008-09 Dec’12 Jan’13 Feb’13 Mar’13 Apr’13 May’13 June’13
Gram Husked Dhaka Quintal 6200 - 8700 8600 8500 8400 8250 7500
Superior Quality Narayanganj " 6000 8600 5950 7750 8000 11100 8800 7200
Chittagong " 5000 8433 8434 8500 8500 8500 8500 8500 Rajshahi " 6800 8850 7500 - - - 7850 - Khulna " 8100 8300 8400 7800 7800 7800 7900 7700 Sylhet " 7000 - - - 8000 - - 8000 Rangpur ,, 7200 8500 8600 7500 7500 7000 8000 7000 3. Oilseed
Mustard Superior Quality Dhaka Quintal - - - - - - - -
Narayanganj " - - - - - - - - Chittagong " - - - - - - - - Rajshahi " - - - - - - - - Khulna " 7000 13000 13000 13000 13000 13000 13000 13000 Sylhet " 7000 - - - - - - - Rangpur " - 8000 - - - - - - 4. Spices:
Chillies Superior Quality Dhaka Quintal 17000 - 12000 15100 15000 14500 13000 14200
(dry) Narayanganj " 14000 14300 13600 15450 13500 15100 14500 14500 Chittagong " 18000 13300 13300 13500 13500 13500 13500 13500 Rajshahi " 16000 16000 17000 16000 16033 14933 14966 14750 Khulna " 16000 15500 15500 15500 15500 15500 15500 15500 Sylhet " 17000 - - - 15000 - - 16000 Rangpur " 12000 12000 12100 12000 12000 11000 14200 12000
Onion Superior Quality Dhaka Quintal 4000 - 3600 3210 3300 2500 2800 3350
Narayanganj " 3700 2750 4100 4550 3850 2100 1040 3300 Chittagong " 4000 3200 3200 3500 3700 2800 2750 2750 Rajshahi " 3700 4350 4400 3400 2333 1917 1900 3200 Khulna " 3000 4500 2600 3000 3000 2300 2600 2700 Sylhet " 3500 - - - 2800 - - 2400 Rangpur " 3500 3500 3500 3100 2400 2300 2300 2800
Garlic Superior Quality Dhaka Quintal 7000 - 4800 4900 4100 3800 5900 3200
Narayanganj " 6450 4900 3650 4550 4050 5800 4200 7500 Chittagong " 8000 9800 9800 8500 1000 1000 10000 10000 Rajshahi " 4500 2900 3000 4767 3800 4800 4800 6500 Khulna " 6100 3200 2800 5700 3400 3600 5300 8500 Sylhet " 8000 - - - 9000 - - 9000 Rangpur " 5700 2400 2700 6100 5000 5000 6000 3200
Turmeric Superior Quality Dhaka Quintal 30000 - 10750 12200 12000 12000 11100 11500
Narayanganj " 27500 14500 11200 15100 18100 10100 17000 18100 Chittagong " 18000 13000 13000 13000 13000 13000 13000 13000 Rajshahi " 21000 - - - - - - - Khulna " 24000 13500 11500 11500 11500 13000 11800 11500 Sylhet " 20000 - - - 23000 - - 23000 Rangpur " 17000 6200 6000 6100 6100 7100 6000 6000

Prices and Price Indices
Monthly Statistical Bulletin, Bangladesh, June-2013. 21
3.1 AVERAGE WHOLESALE PRICE OF SELECTED AGRICULTURAL COMMODITIES IN PRINCIPAL TOWNS–CONTD.
(Taka)
Commodity Specification Town Unit Monthly
2008-09 Dec’12 Jan’13 Feb’13 Mar’13 Apr’13 May’13 June’13
Ginger Superior Quality Dhaka Quintal - - 6200 6300 - 6050 7000 6500
Narayanganj " 7100 5000 5450 6100 5100 5200 8800 8500 Chittagong " 6000 8600 8600 8000 9000 9000 9000 9000 Rajshahi " 5500 4100 4600 6250 6500 6700 6800 7500 Khulna " 7000 7000 7000 5000 8000 7500 7500 9000 Sylhet " 7300 - - - 7500 - - 5500 Rangpur " 6500 4500 5200 6000 6500 6600 4500 7500 Corriander
seed Superior Quality Dhaka Quintal - - 7000 5850 6500 6500 6530 6500
Narayanganj " 16100 5000 12100 14100 10600 7200 9200 7500 Chittagong " - - - - - - - - Rajshahi " 5800 4750 4760 4600 4600 5233 5233 5500 Khulna " 5800 5800 5800 5700 5800 5800 5800 8500 Sylhet " 6650 - - - 9000 - - 9000 Rangpur " 4500 4400 4400 4400 4400 5000 2500 4000 5.Vegetable
Potato Superior Quality Dhaka Quintal 1100 - 2450 1225 1275 1275 1325 1275
Narayanganj " 1000 1800 1850 1500 1000 810 1300 1450 Chittagong " 1200 2900 2900 1300 1450 1467 1400 1450 Rajshahi " 1100 2100 2400 1050 975 1050 1050 1400 Khulna " 100 2800 2700 1700 1050 1100 1200 1200 Sylhet " 700 - - - 1200 - - 1100 Rangpur " 1100 1850 2220 1250 875 875 760 920
Brinjal Superior Quality Dhaka Quintal 3000 - 2700 4000 2900 2450 2400 3200
Narayanganj " 2600 3250 3850 3500 3850 2100 2200 2500 Chittagong " 2500 2850 2850 1500 1500 2000 1300 2500 Rajshahi " 1800 2300 2800 1025 1100 1400 1633 3000 Khulna " 1300 2300 3000 2600 1000 2200 2500 3000 Sylhet " 2250 - - - 3200 - - 2200 Rangpur " 1000 2000 2320 1700 1250 1200 1000 2000
6. Egg Hen Dhaka Per 100 815 - 816 925 1000 975 1000 890
Narayanganj " 600 900 820 970 900 900 800 900 Chittagong " 650 960 970 970 970 980 97 950 Rajshahi " 600 875 1030 - 900 933 725 750 Khulna " 560 900 900 900 - 900 950 900 Sylhet " 750 - - - 930 - - 950 Rangpur " 600 950 980 980 980 900 880 920

Prices and Price Indices
22 Monthly Statistical Bulletin, Bangladesh, June-2013.
3.1 AVERAGE WHOLESALE PRICE OF SELECTED AGRICULTURALCOMMODITIES IN PRINCIPAL TOWNS- CONTD.
(Taka)
Commodity Specification Town Unit Monthly
2008-09 Nov’12 Dec’12 Jan’13 Feb’13 Mar’13 Apr’13 May’13 June’13
7. Tobacco leaf Superior Dhaka Quintal 12050 21500 - 21500 - - - - -
Motihari Quality Narayanganj " - - - - - - - - - Chittagong " 6000 - - - - - - - -
Rajshahi " 6000 7250 7250 7250 7266 7200 7283 7267 7300
Khulna " 17168 16500 16500 16500 16500 16500 16500 16500 16500 Sylhet " - - - - - 14000 - - 14000 Rangpur " 5543 - - - - 13000 14000 12000 12000
8. Betel leaf Medium Size Dhaka Per Gadi 4649 7000 - 6900 10450 12700 13600 10350 6300
Narayanganj (6400) 3775 6000 6100 8100 10500 18100 12500 13700 16900 Chittagong " 3253 5600 5600 5600 3500 2500 3617 3750 3520 Rajshahi " 3750 6000 4000 4000 6400 6400 6313 6400 4500 Khulna " 2952 5000 4700 4700 5000 5000 5000 5000 5000 Sylhet " 5600 - - - - 3640 - - 3600 Rangpur " 2567 4200 3000 3200 3500 3500 4000 6900 5100 9. Betelnut Tanti (whole- Dhaka Quintal 14528 22500 - 26000 26050 20500 25000 25050 25050 dry) Superior Narayanganj " 9392 24600 25000 28100 19700 18250 26200 2100 33000 Quality Chittagong " 9000 26000 28000 28000 28000 28000 28000 28000 28000 Rajshahi " 12187 20500 19000 18300 19000 19000 19033 20000 20500 Khulna " 12404 17000 17000 17000 17000 17000 17000 77000 17000 Sylhet " 10000 - - - - 33000 - - 33000 Rangpur " 13017 27000 26000 6000 26000 26000 25000 26000 23000 10.Groundnut Superior Dhaka Quintal 4000 - - - - - - - - Quality Narayanganj " 3780 - - - - - - - - Chittagong " 4500 - - - - - - - - Rajshahi " 5175 - - - - - - - - Khulna " 3885 - 7100 7100 7100 7600 7600 8000 8000 Sylhet " - - - - - - - - - Rangpur " 3864 10000 10000 10000 10000 10000 10000 10000 9500 Source: National Accounting Wing, BBS . Contd.

Prices and Price Indices
Monthly Statistical Bulletin, Bangladesh, June-2013. 23
3.01 Harvest Time Market Price of Agricultural Crops, 2006-2007 to 2011-2012
(Per Quintal/100 pieces in Taka)
Sl.No. Names of Crops 2006-07 2007-08 2008-09 2009-10 2010-11 2011-12
1 Aman Local 1054 1710 1426 1579 2082 2028
2 Aman HYV 1088 1796 1441 1699 2201 1657
3 Aman Pajam - - - - - -
4 Aus Local - - - - - -
5 Aus HYV - - - - - -
6 Aus Pajam - - - - - -
7 Boro Local 1064 1481 1460 1442 1776 1391
8 Boro HYV 1099 1338 1301 1276 2005 1543
9 Boro Pajam - - - - - -
10 Wheat 1761 2889 1446 1727 2056 1974
11 Mash 3904 3567 3192 4558 5010 5798
12 Masur 4651 4904 6066 6230 4926 5446
13 Mung 3513 4273 3453 6304 6677 6006
14 Gram 3949 4614 3197 4034 4256 6097
15 Motor 2708 3768 4086 5043 3685 4052
16 Kheshari 1764 2795 2822 2986 2145 2714
17 Mustard 2604 4034 3455 3657 3618 4563
18 Lin seeds 2766 2845 3431 3551 - -
19 Til 2194 3208 2195 2838 2965 3878
20 Groundnut 2532 2828 3283 3249 4716 5513
21 Onion 1403 2952 2395 2379 2751 1573
22 Garlic 3730 2729 2357 7351 8868 2806
23 Chillies (dry) 11250 10447 6968 11188 12377 15646
24 Chillies (green) 2318 3947 3110 3168 2675 5011
25 Zinger 2160 2725 3876 5958 7046 3512
26 Turmeric 3347 4103 6276 9743 19332 9783
27 Corriander seeds 3879 3746 4911 4895 4415 4592
28 Betel nut 7639 9415 6467 6763 9998 10500
29 Betel leaves 1337 1680 2698 3821 3522 4116
30 Jute (White) 1475 1696 - 2563 - -
31 Jute (tossa) 1826 - 2450 2818 4314 2927
32 Tobacco (jati) - 6000 - - - -
33 Tobacco (Matihari) 4650 - - - - -
34 Arum 766 1007 1083 1726 1370 1808
35 Karala 1241 873 1769 1665 1760 2515
36 Jhinga 969 990 1207 1390 1404 1880
37 Lady`s Finger 1194 1098 1422 1390 1592 2094
38 Cabbage 562 546 707 703 754 551
39 Pumkin 712 1098 1137 732 1011 1339
40 Bean 1023 1153 1398 1192 1744 1487

Prices and Price Indices
24 Monthly Statistical Bulletin, Bangladesh, June-2013.
3.01 Harvest Time Market Price of Agricultural Crops, 2006-2007 to 2011-2012 (Per Quintal/100 pieces
in Taka) Sl.No. Names of Crops 2006-07 2007-08 2008-09 2009-10 2010-11 2011-12
41 Puisak 520 649 683 587 590 991
42 Cucumber 949 906 1201 1425 1338 1425
43 Patal 923 1126 1496 1360 1136 2180
44 Cauliflower 832 907 1045 937 1279 941
45 Brinjal 1107 1222 1576 1463 1767 1895
46 Radish(china) 582 574 709 705 860 756
47 Water gourd 8522 744 814 1848 1185 1214
48 Chichinga 798 924 1053 1058 1091 1793
49 Tomato 991 1086 1225 939 1912 1590
50 Chalkumra 758 873 938 905 938 1300
51 Potato (local) 1164 1502 1461 1803 922 1077
52 Potato (Holand) 1311 1199 1444 1504 757 827
53 S. Potato 1334 675 715 730 932 1237
54 Banana (Chapa) 84 90 124 98 154 145
55 Banana (Sabri) 119 130 189 184 179 228
56 Banana (Shaghar) 104 106 162 183 137 195
57 Pine Apple ( local) - - - - - -
58 Pine (jul Doog) 1388 1270 1474 1550 2032 1548
59 Pine (Kelenda) - - - - - -
60 Lemon 128 100 91 155 2090 1680
61 Jack Fruit 3593 4301 3892 4708 5075 4598
62 Water melon 3454 4274 4014 - 6303 6079
63 Litchi 236 129 125 227 104 227
64 Orange 723 1126 - - - -
65 Mango (guti) 2255 2011 2211 1097 5445 2150
66 Fozli - - - 4750 7375 8565
67 Arseni - - - 6400 3471 -
68 Langra - - - 6000 - -
69 Gofalvog - - - 2391 5250 5050
70 Coconut 1131 962 1381 1373 1391 2054
Sources: Department of Agricultural Marketing.
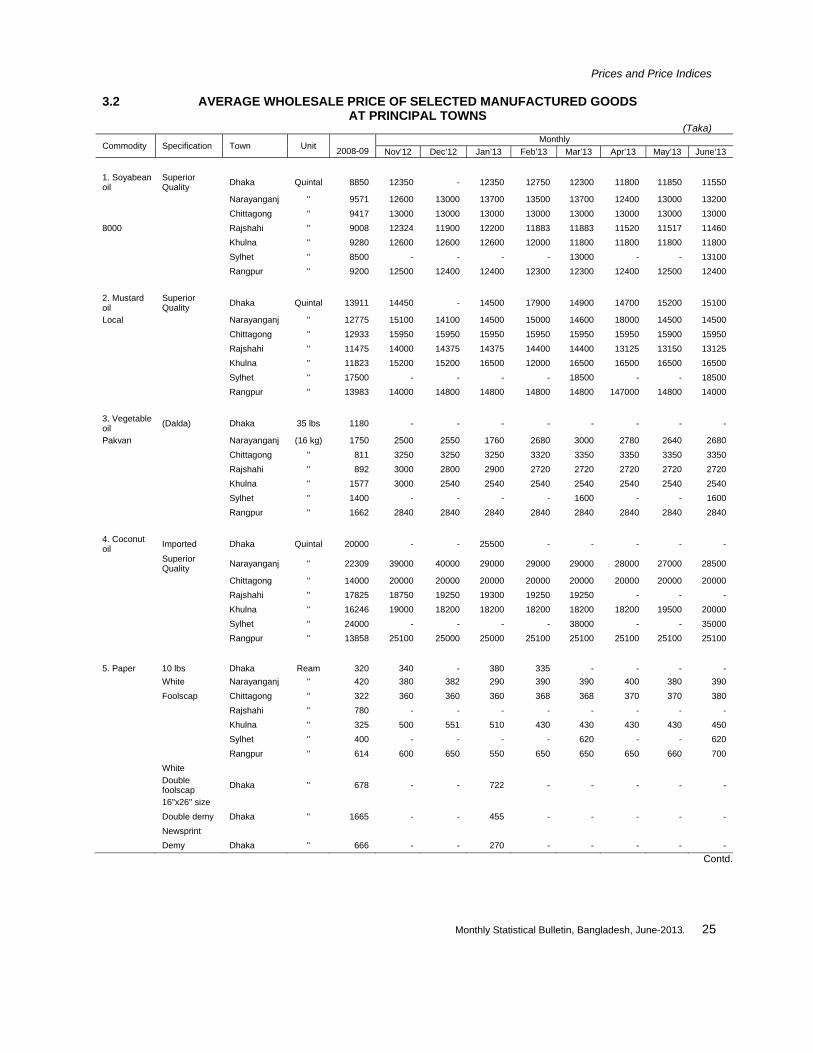
Prices and Price Indices
Monthly Statistical Bulletin, Bangladesh, June-2013. 25
3.2 AVERAGE WHOLESALE PRICE OF SELECTED MANUFACTURED GOODS AT PRINCIPAL TOWNS
(Taka)
Commodity Specification Town Unit Monthly
2008-09 Nov’12 Dec’12 Jan’13 Feb’13 Mar’13 Apr’13 May’13 June’13 1. Soyabean oil
Superior Quality Dhaka Quintal 8850 12350 - 12350 12750 12300 11800 11850 11550
Narayanganj " 9571 12600 13000 13700 13500 13700 12400 13000 13200 Chittagong " 9417 13000 13000 13000 13000 13000 13000 13000 13000 8000 Rajshahi " 9008 12324 11900 12200 11883 11883 11520 11517 11460 Khulna " 9280 12600 12600 12600 12000 11800 11800 11800 11800 Sylhet " 8500 - - - - 13000 - - 13100 Rangpur " 9200 12500 12400 12400 12300 12300 12400 12500 12400 2. Mustard oil
Superior Quality Dhaka Quintal 13911 14450 - 14500 17900 14900 14700 15200 15100
Local Narayanganj " 12775 15100 14100 14500 15000 14600 18000 14500 14500 Chittagong " 12933 15950 15950 15950 15950 15950 15950 15900 15950 Rajshahi " 11475 14000 14375 14375 14400 14400 13125 13150 13125 Khulna " 11823 15200 15200 16500 12000 16500 16500 16500 16500 Sylhet " 17500 - - - - 18500 - - 18500 Rangpur " 13983 14000 14800 14800 14800 14800 147000 14800 14000 3. Vegetable oil (Dalda) Dhaka 35 lbs 1180 - - - - - - - -
Pakvan Narayanganj (16 kg) 1750 2500 2550 1760 2680 3000 2780 2640 2680 Chittagong " 811 3250 3250 3250 3320 3350 3350 3350 3350 Rajshahi " 892 3000 2800 2900 2720 2720 2720 2720 2720 Khulna " 1577 3000 2540 2540 2540 2540 2540 2540 2540 Sylhet " 1400 - - - - 1600 - - 1600 Rangpur " 1662 2840 2840 2840 2840 2840 2840 2840 2840 4. Coconut oil Imported Dhaka Quintal 20000 - - 25500 - - - - -
Superior Quality Narayanganj " 22309 39000 40000 29000 29000 29000 28000 27000 28500
Chittagong " 14000 20000 20000 20000 20000 20000 20000 20000 20000 Rajshahi " 17825 18750 19250 19300 19250 19250 - - - Khulna " 16246 19000 18200 18200 18200 18200 18200 19500 20000 Sylhet " 24000 - - - - 38000 - - 35000 Rangpur " 13858 25100 25000 25000 25100 25100 25100 25100 25100
5. Paper 10 lbs Dhaka Ream 320 340 - 380 335 - - - - White Narayanganj " 420 380 382 290 390 390 400 380 390 Foolscap Chittagong " 322 360 360 360 368 368 370 370 380 Rajshahi " 780 - - - - - - - - Khulna " 325 500 551 510 430 430 430 430 450 Sylhet " 400 - - - - 620 - - 620 Rangpur " 614 600 650 550 650 650 650 660 700 White
Double foolscap Dhaka " 678 - - 722 - - - - -
16"x26" size Double demy Dhaka " 1665 - - 455 - - - - - Newsprint Demy Dhaka " 666 - - 270 - - - - - Contd.

Prices and Price Indices
26 Monthly Statistical Bulletin, Bangladesh, June-2013.
3.2 AVERAGE WHOLESALE PRICE OF SELECTED MANUFACTURED GOODS AT PRINCIPAL TOWNS.
(Taka)
Commodity Specification Town Unit Monthly 2008-09 Nov’12 Dec’12 Jan’13 Feb’13 Mar’13 Apr’13 May’13 June’13
6. Rubber Goods: Cycletyre Dhaka Dozon - - - - - - - - - Malaysia Chittagong " - - - - - - - - -
Master Service Rajshahi " - - - - - - - - -
Khulna " 2350 3500 3500 3600 3500 3500 3500 3500 3500 Sylhet " - - - - - 4800 - - 4800 Rangpur " 2870 3480 3500 - 3400 3500 3500 3500 3490 Cycletube Dhaka Dozon - - - - - - - - - (Local) Chittagong " - - - - - - - - - Deshi Rajshahi " 840 1317 1316 1367 1310 1320 1313 1325 1350 Khulna " 730 1600 1500 1300 1300 1300 1300 1300 1400 Sylhet " - - - - - 1860 - - 1770
Rangpur " 750 1125 1125 1200 1125 1126 1200 1300 1124
7. Matches 40 Sticks Dhaka Gross - - - 240 - - 250 - - Box Narayanganj " 270 276 270 260 264 264 216 264 264 Chittagong " - 220 220 220 220 220 230 220 220 Rajshahi " 95 200 200 200 200 200 200 200 200 Khulna " 156 158 158 136 156 156 156 156 156 Sylhet " - - - - - - - - - Rangpur " 150 216 215 215 216 216 216 216 216 Source: National Accounting Wing, BBS

Prices and Price Indices
Monthly Statistical Bulletin, Bangladesh, June-2013. 27
3.3 AVERAGE WHOLESALE PRICES OF SELECTED BUILDING MATERIALS AT PRINCIPAL TOWNS
(Taka) Commodity Specification Town Unit 2008-09 Monthly
Feb’13 Mar’13 Apr’13 May’13 Jun’13 1. Bricks 10” (First class) Dhaka 1000 6467 7710 7720 7720 7730 7750 Chittagong " 5890 7660 7765 7670 7680 7685 Rajshahi " 4100 7232 7235 7240 7240 7245 Khulna " 4792 6370 6375 6375 6385 6390 Sylhet " 5562 7320 7325 7330 7335 7340 Barisal " 4233 6498 6505 6510 6520 6525 Average " 5174 7131.67 7154.17 7140.83 7148.33 7155.83 2. Cement Local (Holcim) Dhaka 50 kg. 374 515 517 517 518 519 Chittagong " 367 514 516 516 517 518 Rajshahi " 465 508 512 514 514 515 Khulna " 366 505 509 511 512 513 Sylhet " 368 504 507 510 511 512 Barisal " 360 505 510 510 513 514
Average " 383 508.50 511.83 513.00 514.17 515.17 3. Sand Coarse Dhaka 200 cft 1127 2070 2070 2070 2075 2075 Chittagong " 1200 2305 2308 2308 2310 2310 Rajshahi " 1558 2072 2075 2075 2078 2078 Khulna " 1712 2235 2235 2238 2238 2248 Sylhet " 1240 2155 2155 2158 2125 2160 Barisal " 1500 2065 2068 2065 2070 2070 Average " 1390 2150.33 2151.83 2152.33 2149.33 2156.83 4. Stone/ 3"—8" dia Sylhet : Boulder Superior Quality (a) Chattak Cft. 58.46 135 136 137 137 138 (b) Goainghat Cft 26.38 118 124 125 128 129 Average " 42.40 126.5 130.00 131.00 132.5 133.5
5.A. M.S.Rods (2 Suta) Dhaka 50KG. 2843 3344 3344 3344 3344 3345 (Scrap 40grade) Chittagong " 3054 3292 3294 3294 3294 3295 Rajshahi * " 2988 3180 3182 3182 3183 3183 Khulna " 2987 3085 3088 3088 3089 3090 Sylhet " 2789 3075 3075 3077 3075 3078 Barisal " 2493 3055 3056 3056 3058 3058 Average " 2859 3171.83 3173.17 3173.50 3173.83 3174.83 B. M.S.Rods (3 Suta) Dhaka 50KG. 3081 3390 3390 3390 3392 3392
(Scrap 40grade) Chittagong " 3102 3290 3291 3291 3292 3292 Rajshahi * " 3148 3179 3179 3180 3180 3181 Khulna " 3063 3102 3102 3103 3103 3104 Sylhet " 2801 3080 3081 3081 3082 3082 Barisal " Na 3076 3076 3077 3078 3078 Average " 3039 3186.17 3186.50 3187.00 3187.83 3188.17

Prices and Price Indices
28 Monthly Statistical Bulletin, Bangladesh, June-2013.
3.3 AVERAGE WHOLESALE PRICE OF SELECTED BUILDING MATERIALS AT PRINCIPAL TOWNS-CONTD.
Commodity Specification Town Unit 2008-09 Monthly Feb’13 Mar’13 Apr’13 May’13 Jun’13 C. M.S. Rods (4 Suta) Dhaka 50Kg 2730 3225 3225 3226 3226 3230(Scrap 40 grade) Chittagong " 3050 3288 3289 3289 3290 3290
Rajshahi * " 3154 3178 3178 3180 3180 3180 Khulna " 2785 3083 3084 3084 3085 3085 Sylhet " 2904 3067 3068 3068 3070 3070 Barisal " 2693 3053 3053 3054 3054 3055 Average " 2886 3149.00 3149.50 3150.17 3150.83 3151.67 D. M.S. Rods (5 Suta) Dhaka 50Kg 2854 3225 3225 3226 3226 3230
(Scrap 40 grade) Chittagong " 3008 3288 3289 3289 3290 3290 Rajshahi * " 3079 3178 3178 3180 3180 3180 Khulna " 3054 3083 3084 3084 3085 3085 Sylhet " 2869 3067 3068 3068 3070 3070 Barisal " 2808 6053 3053 3054 3054 3055 Average " 2949 3149.00 3149.50 3150.17 3150.83 3151.67 E. M.S. Rods (6 Suta) Dhaka 50Kg 3115 3228 3228 3230 3230 3232
(Scrap 40 grade) Chittagong " 2992 3290 3290 3291 3291 3292 Rajshahi * " 3117 3180 3180 3181 3181 3182 Khulna " 3048 3082 3082 3084 3085 3085 Sylhet " 2831 3068 3068 3069 3070 3070 Barisal " 2247 3054 3054 3055 3055 3056 Average " 2892 3150.33 3150.33 3151.67 3152.00 3152.83 F. M.S. Rods (7 Suta) Dhaka 50Kg 2718 3265 3265 3265 3266 3266
(Scrap 40 grade) Chittagong " 2958 3290 3290 3290 3291 3292 Rajshahi * " 3279 3180 3180 3181 3182 3182 Khulna " 2958 3082 3083 3083 3084 3084 Sylhet " 2807 3068 3068 3069 3069 3070 Barisal " 2699 3055 3055 3056 3055 3057 Average " 2903 3156.67 3156.83 3157.33 3158.00 3158.50
G. M.S. Rods (8 Suta) Dhaka 50Kg 2642 3265 3265 3265 3266 3266(Scrap 40 grade) Chittagong " 2923 3290 3290 3290 3291 3292 Rajshahi * " 3075 3180 3180 3181 3182 3182 Khulna " 2957 3082 3083 3083 3084 3084 Sylhet " 2947 3068 3068 3069 3069 3070 Barisal " 2755 3055 3055 3056 3056 3057 Average " 2883 3156.67 3156.83 3157.33 3158.00 3158.50 6.A. Iron Rods (2 Suta) Dhaka 50Kg 3077 3355 3355 3356 3356 3358(Bilet 60 grade). Chittagong " 3069 3295 3295 3296 3296 3297 Rajshahi * " 3178 3192 3192 3193 3193 3194 Khulna " Na 3118 3118 3120 3120 3120 Sylhet " 2880 3090 3090 3091 3091 3092 Barisal " Na 3065 3065 3066 3066 3067 Average " 3051 3185.83 3185.83 3187.00 3187.00 3188.00

Prices and Price Indices
Monthly Statistical Bulletin, Bangladesh, June-2013. 29
3.3 AVERAGE WHOLESALE PRICE OF SELECTED BUILDING MATERIALS AT PRINCIPAL TOWNS-CONTD. Commodity Specification Town Unit 2008-09 Monthly
Feb’13 Mar’13 Apr’13 May’13 Jun’13
B. Iron Rods (3 Suta) Dhaka 50Kg 3883 3365 3380 3395 3410 3420(Bilet 60 grade). Chittagong " 3245 3398 3398 3400 3415 3420 Rajshahi * " 3117 3200 3220 3245 3300 3305 Khulna " 2997 3160 3195 3225 3305 3310 Sylhet " 2869 3140 3185 3215 3310 3310 Barisal " 2825 3125 3190 3195 3285 3295 Average " 3156 3231.33 3261.3 3279.17 3337.50 3343.33 C. Iron Rods (4Suta) Dhaka 50Kg 3067 3462 3463 3463 3464 3464(Bilet 60 grade). Chittagong " 2956 3420 3420 3422 3422 3422 Rajshahi * " 3140 3177 3178 3178 3179 3180 Khulna " 3063 3082 3082 3082 3083 3083 Sylhet " 2790 3069 3069 3070 3070 3171 Barisal " Na 3055 3056 3056 3057 3058 Average " 3003 3210.63 3211.33 3211.83 3212.50 3229.67 D. Iron Rods (5 Suta) Dhaka 50Kg 3229 3462 3463 3463 3464 3464 (Bilet 60 grade). Chittagong " 2975 3420 3420 3422 3422 3422 Rajshahi * " 3115 3177 3178 3178 3179 3180 Khulna " 3048 3082 3082 3082 3083 3083 Sylhet " 3195 3069 3069 3070 3070 3171 Barisal " 3055 3055 3056 3056 3057 3058 Average " 3103 3210.83 3211.33 3211.83 3212.50 3229.67 E. Iron Rods (6 Suta) Dhaka 50Kg 2892 3392 3392 3393 3393 3394(Bilet 60 grade). Chittagong " 3088 3398 3398 3400 3400 3400 Rajshahi * " 3025 3182 3182 3183 3183 3184 Khulna " 2894 3086 3087 3087 3088 3088 Sylhet " 2883 3070 3070 3071 3071 3072 Barisal " 2960 3052 3053 3053 3054 3054 Average " 2957 3196.67 3197.00 3197.83 3198.17 3198.67
F. Iron Rods (7 Suta) Dhaka 50Kg 3220 3385 3386 3386 3386 3388(Bilet 60 grade). Chittagong " 3029 3398 3398 3398 3400 3400 Rajshahi * " 3115 3178 3178 3180 3180 3180 Khulna " 3048 3085 3086 3086 3086 3087 Sylhet " 2848 3070 3070 3072 3072 3072 Barisal " 2272 3053 3053 3054 3054 3055 Average " 2922 3194.83 3195.17 3196.00 3196.33 3197.00
G. Iron Rods (8 Suta) Dhaka 50Kg 3193 3385 3386 3386 3386 3388(Bilet 60 grade). Chittagong " 3029 3398 3398 3398 3400 3400 Rajshahi * " 3115 3178 3178 3180 3180 3180 Khulna " 3048 3085 3086 3086 3086 3087 Sylhet " 2768 3070 3070 3072 3072 3072 Barisal " Na 3053 3053 3054 3054 3055- Average “ 3031 3194.83 3195.17 3196.00 3196.33 3197.00
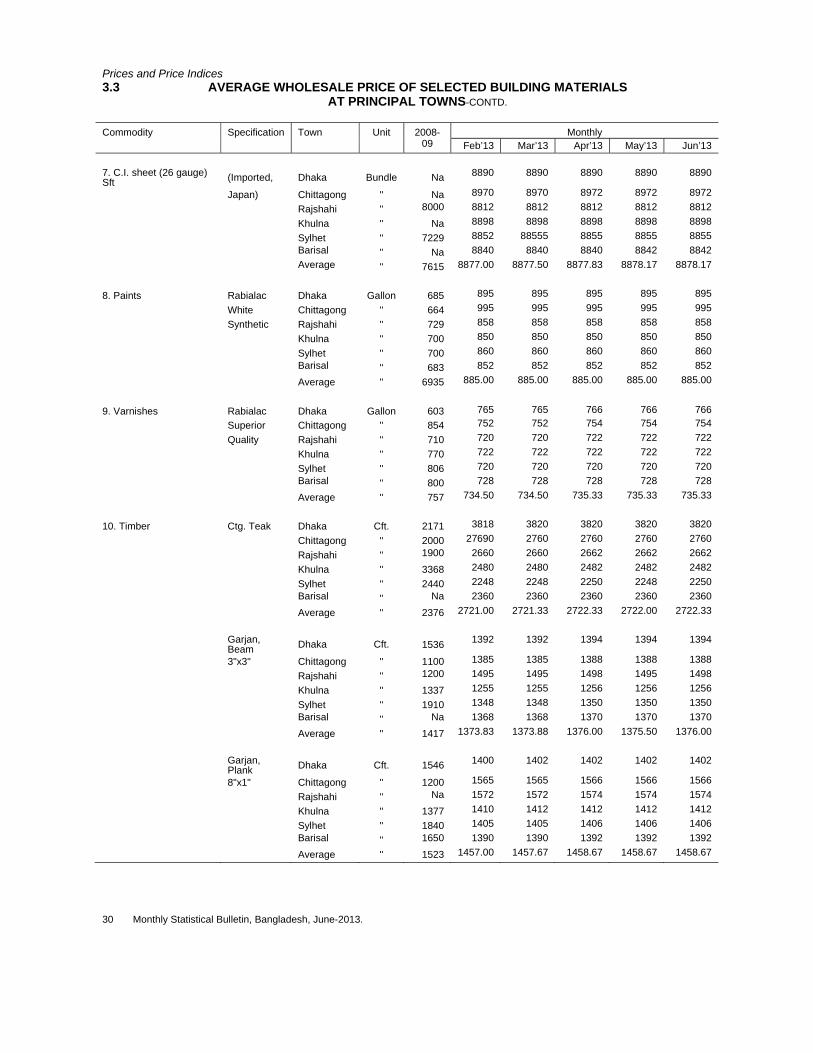
Prices and Price Indices
30 Monthly Statistical Bulletin, Bangladesh, June-2013.
3.3 AVERAGE WHOLESALE PRICE OF SELECTED BUILDING MATERIALS AT PRINCIPAL TOWNS-CONTD. Commodity
Specification Town Unit 2008-09
Monthly Feb’13 Mar’13 Apr’13 May’13 Jun’13
7. C.I. sheet (26 gauge) Sft (Imported, Dhaka Bundle Na 8890 8890 8890 8890 8890
Japan) Chittagong " Na 8970 8970 8972 8972 8972 Rajshahi " 8000 8812 8812 8812 8812 8812 Khulna " Na 8898 8898 8898 8898 8898 Sylhet " 7229 8852 88555 8855 8855 8855 Barisal " Na 8840 8840 8840 8842 8842 Average " 7615 8877.00 8877.50 8877.83 8878.17 8878.17 8. Paints Rabialac Dhaka Gallon 685 895 895 895 895 895 White Chittagong " 664 995 995 995 995 995 Synthetic Rajshahi " 729 858 858 858 858 858 Khulna " 700 850 850 850 850 850 Sylhet " 700 860 860 860 860 860 Barisal " 683 852 852 852 852 852 Average " 6935 885.00 885.00 885.00 885.00 885.00
9. Varnishes Rabialac Dhaka Gallon 603 765 765 766 766 766 Superior Chittagong " 854 752 752 754 754 754 Quality Rajshahi " 710 720 720 722 722 722 Khulna " 770 722 722 722 722 722 Sylhet " 806 720 720 720 720 720 Barisal " 800 728 728 728 728 728 Average " 757 734.50 734.50 735.33 735.33 735.33 10. Timber Ctg. Teak Dhaka Cft. 2171 3818 3820 3820 3820 3820 Chittagong " 2000 27690 2760 2760 2760 2760 Rajshahi " 1900 2660 2660 2662 2662 2662 Khulna " 3368 2480 2480 2482 2482 2482 Sylhet " 2440 2248 2248 2250 2248 2250 Barisal " Na 2360 2360 2360 2360 2360 Average " 2376 2721.00 2721.33 2722.33 2722.00 2722.33
Garjan, Beam Dhaka Cft. 1536 1392 1392 1394 1394 1394
3"x3" Chittagong " 1100 1385 1385 1388 1388 1388 Rajshahi " 1200 1495 1495 1498 1495 1498 Khulna " 1337 1255 1255 1256 1256 1256 Sylhet " 1910 1348 1348 1350 1350 1350 Barisal " Na 1368 1368 1370 1370 1370 Average " 1417 1373.83 1373.88 1376.00 1375.50 1376.00
Garjan, Plank Dhaka Cft. 1546 1400 1402 1402 1402 1402
8"x1" Chittagong " 1200 1565 1565 1566 1566 1566 Rajshahi " Na 1572 1572 1574 1574 1574 Khulna " 1377 1410 1412 1412 1412 1412 Sylhet " 1840 1405 1405 1406 1406 1406 Barisal " 1650 1390 1390 1392 1392 1392 Average " 1523 1457.00 1457.67 1458.67 1458.67 1458.67

Prices and Price Indices
Monthly Statistical Bulletin, Bangladesh, June-2013. 31
3.3 AVERAGE WHOLESALE PRICE OF SELECTED BUILDING MATERIALS AT PRINCIPAL TOWNS-CONCLD. Commodity Specification Town Unit 2008-
09 Monthly
Feb’13 Mar’13 Apr’13 May’13 Jun’13 Mango, Plank Dhaka Cft. 503 595 595 595 596 596
8"x1" Chittagong " 650 635 635 636 636 637
Rajshahi " 500 515 515 515 515 515
Khulna " 400 385 385 390 390 390
Sylhet " 600 385 385 388 388 388
Barisal " 425 395 395 398 398 398
Average " 513 485.00 485.00 487.00 487.17 487.33 11. Bamboo Borak Dhaka Each 181.25 278 280 280 282 282
(about 30 Chittagong " 150.00 370 370 372 372 374
ft.long) Rajshahi " 151.68 272 274 274 274 275
Khulna " 142.73 275 275 278 278 278
Sylhet " 155.84 270 272 272 272 274
Barisal " 147.73 268 270 270 272 272
Average " 154.87 288.83 290.17 291.00 291.67 292.50
12. A. Bitumin (80/100 grade) BPC Chittagong m.ton 40000 70250 70265 70300 70400 70500
B.Bitumin (60/70 grade)BPC Chittagong m.ton 44000 75500 75500 75500 75500 75500
Source: National Accounting Wing, BBS.

Prices and Price Indices
32 Monthly Statistical Bulletin, Bangladesh, June-2013.
3.4 TRANSPORT CHARGES OF BUILDING MATERIALS, BANGLADESH
Period Motor Truck (3 tons per 8 km)
Bullock Cart (cart load per 5 km)
Pushcart (cart load per km)
Country Boat (ton per 8 km)
Group Index (Base: 1969-70=100)
2009-10
Jul - - - - 3922.92 Aug - - - - 3909.21 Sept 1433.00 350.00 542.00 592.00 3912.38 Oct 1433.00 350.00 542.00 592.00 3899.02 Nov 1433.00 350.00 542.00 592.00 3923.10 Dec 1433.00 350.00 542.00 592.00 3918.53 Jan 1416.67 350.00 491.67 591.67 3930.83 Feb 1450.00 350.00 491.67 602.00 3952.09 Mar 1450.00 350.00 550.00 602.00 3954.03 Apr 1466.67 358.33 566.67 603.33 3968.96 May 1498.60 350.00 450.00 594.50 3972.13 June 1498.33 350.00 450.00 596.67 3981.09
2010-11 Jul - - - - 4039.82 Aug - - - - 4062.10 Sept - - - - 4228.52 Oct’ 1644.67 416.67 506.83 624.17 4264.90 Nov 1644.67 416.83 507.00 625.83 4293.72 Dec 1644.67 417.00 507.17 628.33 4328.52 Jan - - - - 4489.31 Feb - - - - 4564.00 Mar - - - - 4737.27 Apr - - - - 4890.34 May - - - - 5028.47 June - - - - 5154.64
2011-12 Jul - - - - 5259.56 Aug - - - - 5343.21 Sept - - - - 5452.69 Oct’ - - - - 5539.85 Nov - - - - 5607.38 Dec - - - - 5669.12 Jan - - - - 5716.54 Feb - - - - 5759.89 Mar - - - - 5787.11 Apr - - - - 5819.45 May - - - - 5853.19 June - - - - 5886.75
2012-13 Jul - - - - 5961.97 Aug - - - - 6033.32 Sept - - - - 6098.17 Oct’ - - - - 6159.05
Source: National Accounting wing, BBS.

Prices and Price Indices
Monthly Statistical Bulletin, Bangladesh, June-2013. 33
3.5 AVERAGE PRICE OF TEA SOLD AT CHITTAGONG AUCTION Period Total Quantity ('000' kg.) Total Value (million
Taka) Average Price (Taka per kg.)
2008-09 Mar 199 26 132.89 April 2188 296 135.36 May 4832 684 141.52 June 6186 956 154.54
2009-10 Jul 8090 1115 137.93 Aug 9176 1174 128.05 Sep 7319 917 125.41 Oct 10056 1266 125.98 Nov 5727 665 125.94 Dec 5284 664 125.93 Jan 255 32 125.70 Feb 55 7 127.93 Mar 352 46 132.83 April 200 297 135.36 May 5145 728 141.52 June 6386 986 154.54
2010-11 Jul 8197 1205 147.00 Aug 8632 1272 147.38 Sep 8636 1288 149.17 Oct 7705 1071 138.99 Nov 6958 1013 145.98 Dec 5518 873 158.30 Jan 222 37 167.69 Feb 34 6 148.80 Mar 508 81 158.79 April 3377 565 167.33 May 4557 645 141.52 June 6743 1043 154.54
2011-12 Jul 8239 1.46 177.24 Aug 8045 1.45 179.80 Sep 8874 1.59 179.52 Oct 8379 1.32 157.76 Nov 6112 .89 146.37 Dec 3663 .56 153.56 Jan 156 .0234 150.00 Feb 41 .0071 172.26 Mar 433 .0776 179.22 April 3140 .4525 144.12 May 5820 0.8846 151.99 June 6892 1.2251 177.77
2012-13 July 8300 1.5323 184.62 Aug 9440 1.7526 185.66 Sep 8968 1.6336 182.16 Oct 8285 1.5252 184.61 Nov 7108 1.2507 175.95 Dec 5263 0.9840 186.97
Source: Tea Board and BBS.

Prices and Price Indices
34 Monthly Statistical Bulletin, Bangladesh, June-2013.
3.6 AVERAGE RETAIL PRICE OF ESSENTIAL CONSUMER GOODS AT PRINCIPAL TOWNS (Taka)
Commodity Specification Town Unit
2008-09
Monthly
Nov’12 Dec’12 Jan’13 Feb’13 Mar’13 Apr’13 May’13 June’13
1. Rice Fine Dhaka Kg 62.50 - - - 70 - 70 70 - Quality Narayanganj " (-) - - - 68 - 72 70 - Chittagong " 58 - - 71 71 71.00 71 70 71 Rajshahi " 70 - - 70 70 70.00 60 68 70 Khulna " 56 - - 53 65 65.00 60 65 53 Sylhet " 57 - - - - - 70 70 - Rangpur " 53.00 - - 58 64 68 62 70 58 Barisal " 53.50 - - 55 70 70 68 68 55 Boiled Dhaka Kg 38.75 35 36 36 38 38 38 38 38 Medium Narayanganj " 38.00 36 35 36 37 37 37 36 37 Chittagong " 37.00 - 36 38 38 38 38 64 38 Rajshahi " 38.00 32 30 36 39.33 39 39 69 32 Khulna " 34.00 32 33 38 38 38 38 38 38 Sylhet " 35.75 - 32 34 34 36 36 36 39 Rangpur " 36.00 32 33 37 33 37 37 37 38 Barisal " - 33 30 30 35 35 35 36 Coarse Dhaka Kg 29.32 28 28 34 34 34 34 34 37 Narayanganj " 29.75 30 25 34 34 34 35 34 34 Chittagong " 28.00 - - 32 32 32 32 32 35 Rajshahi " 26.00 25 25 29 29 29 29 29 32 Khulna " 29.00 26 25 32 35 35 35 35 29 Sylhet " 29.75 - 24 29 29 29 29 29 35 32.00 Rangpur " 27.00 22 25 25 25 25 25 25 29 32.00 Barisal " 26.00 26 26 27.33 27.37 28 27 27.22 25
2.Flour(Atta) Superior Dhaka Kg 31.41 38 42 38 38 38 38 38 27.30 Quality Narayanganj " 29.46 38 41 38 38 38 38 38 38 Chittagong " 30.00 - - 40 38 38 38 38 38 Rajshahi " 30.00 38 38 39 38 38 38 38 38 Khulna " 34.00 39 40 38 38 38 38 38 38 Sylhet " 30.00 - 40 39 38 38 39 38 38 Rangpur " 32.00 38 44 39 38 37 39 38 38 Barisal " 22.50 38 40 39 37.36 - 37 38 38 3. Pulses Split, Kutcha Dhaka Kg 80.50 120 120 122.89 120 120 120 120 720 Moog Narayanganj " 79.00 115 115 122 125 125 125 120 725 Chittagong " 80.00 - - 114 120 120 120 110.50 120 Rajshahi " 80.00 120 120 120 120 120 120 120.00 120 Khulna " 73.00 125 125 124 124 124 124 124.00 124 Sylhet " 75.00 - 120 120 140 120 120 120.00 120 Rangpur " 75.00 134 134 140 120 140 140 140.00 140 Barisal " 70.00 115 118 108.33 108.32 109 108 104 108.33 Masur Husked, Dhaka Kg 105.00 135 140 140 145 130 130 115 130 Whole Narayanganj " 104.00 140 140 140 140 120 120 115 120 Chittagong " 105.00 - - 140 140 125 125 115 125 Rajshahi " 100.00 140 140 140 136 125 105 112 125 Khulna " 102.00 140 141 140 140 120 120 115 120 Sylhet " 100.00 - 138 138 140 125 125 115 125 Rangpur " 100.00 134 140 136 136 125 120 112 125 Barisal " 90.00 140 140 135 118.33 118 119 116 118.33

Prices and Price Indices
Monthly Statistical Bulletin, Bangladesh, June-2013. 35
3.6 AVERAGE RETAIL PRICE OF ESSENTIAL CONSUMER GOODS AT PRINCIPAL TOWNS-CONTD. (Taka)
Commodity Specification Town Unit
2008-09
Monthly
Nov’12 Dec’12 Jan’13 Feb’13 Mar’13 Apr’13 May’13 June’13
Khesari Superior Dhaka Kg 56.00 74 70 65 60 70 70 58 70 Quality Narayanganj " 56.00 70 70 64 98 71 72 55 72 Chittagong " 56.00 - - 65 60 68 68 68 68 Rajshahi " 52.00 75 70 72 65 72 72 60 72 Khulna " 54.00 80 70 70 70 70 70 64 70 Shlhet " 48.75 - 75 65 70 75 78 64 75 Rangpur " 50.00 72 72 64 65 68 68 62 68 Barisal " 53.50 70 65 65 69.33 69 69 60 69
Matar Superior Dhaka Kg 60.75 95 95 90 80 - 70 70 90
Quality Narayanganj " 58.00 90 90 44 70 - 64 64 - Chittagong " 56.00 - - 60 75 - 85 85 60 Rajshahi " 62.00 90 90 100 80 - 75 75 100 Khulna " 89.00 - - 100 75 - 70 70 100 Sylhet " 48.75 90 90 45 80 - - - - Rangpur " - - 85 80 80 - 8 0.90 80 Barisal " 47.00 - 95 55.66 75 - 75 75.66 56
Gram Superior Dhaka Kg 67.00 85 100 100 100 100 100 90 100 (Chhola) Quality Narayanganj " 65.00 95 100 100 110 103.50 105 90 105 Chittagong " 57.00 100 - 95 95 95 95 95 95 Rajshahi " 60.00 100 99 100 95 95 95 92 95 Khulna " 56.00 - 95 90 90 90 90 90 90 Sylhet " 26.25 92 99 105 105 105 105 94 105
Rangpur " 55.00 95 95 95 100 100 100 94 100
Barisal " 48.00 97 99 86.66 86.66 86.66 86.60 88 87 Mashkalai Superior Dhaka Kg 66.00 10 100 110 110 110 110 100 110 Quality Narayanganj " 58.00 100 100 108 115 113 115 100 115 Chittagong " 62.00 - - 120 120 112 112 90 112 Rajshahi " 52.00 115 115 100 115 120 120 100 120 Khulna " 58.00 95 95 100 110 110 110 110 110 Sylhet " 50.00 - 110 115 130 130 130 130 130 Rangpur " 57.00 115 115 100 105 105 105 100 105 Barisal " 70.00 100 100 90 97.60 97.66 97.60 99 984. Fish Rohi Fresh (Big cut pieces) Dhaka Kg 238.00 250 35 - 300 260 260 260 260 Narayanganj " 245.00 260 - 350 260 275 280 280 280 Chittagong " 190.00 - 320 270 270 270 270 270 270 Rajshahi " 245.00 218 300 260 260 290 290 290 290 Khulna " 197.00 250 300 300 300 313 313 313 313 Sylhet " 187.50 - 350 380 380 380 380 280 380 Rangpur " 260.00 300 300 280 280 290 290 290 290 Barisal " 220.00 220 100 266.60 266 300 300 300 300
Koi Medium Dhaka Kg 310.00 240 320 270 210 270 280 260 280 (climbing Narayanganj " 280.00 230 320 260 220 250 250 300 250 fish) Chittagong " 330.00 - - 300 300 290 300 260 300 Rajshahi " 320.00 200 300 250 200 260 260 260 260 Khulna " 340.00 195 300 285 220 260 260 400 260
Sylhet " 210.00 - 300 265 750 400 400 650 400 Rangpur " 235.00 350 300 250 220 270 260 260 460 Barisal " 400.00 320 260 260 300 650 650 650 650

Prices and Price Indices
36 Monthly Statistical Bulletin, Bangladesh, June-2013.
3.6 AVERAGE RETAIL PRICE OF ESSENTIAL CONSUMER GOODS AT PRINCIPAL TOWNS-CONTD. (Taka)
Commodity Specification Town Unit
2008-09
Monthly
Nov’12 Dec’12 Jan’13 Feb’13 Mar’13 Apr’13 May’13 June’13
Hilsa Medium Dhaka Kg 389.00 900 900 800 800 750 800 800 800 Narayanganj " 365.00 850 850 750 750 750 800 800 800 Chittagong " 310.00 - - 700 750 740 750 750 750 Rajshahi " 350.00 - - - - - - - - Khulna " 400.00 653 655 741 750 780 780 780 780 Sylhet " 272.50 - 655 765 750 850 850 850 850 Rangpur " 360.00 780 740 700 800 800 800 800 800 Barisal " 300.00 650 650 850 800 800 800 800 800 Chingri Medium Dhaka Kg 416.00 475 600 600 500 500 500 600 500 (shrimp) Narayanganj " 550.00 425 550 660 650 500 660 600 656 Chittagong " 410.00 - - 600 813 800 800 700 800 Rajshahi " 420.00 240 650 700 650 650 650 650 650 Khulna " 420.00 205 600 500 580 555 700 600 700 Sylhet " 335.00 190 550 500 555 700 555 600 535 Rangpur “ - - - - - - - - - Barisal 425.00 250 500 550 525 525 525 600 525 Soal Medium Dhaka Kg 210.00 - - 425 425 400 425 425 425 Narayanganj " 173.00 380 400 345 400 375 40 450 400 Chittagong " 190.00 - - 335 374 350 350 400 250 Rajshahi " 200.00 400 360 350 350 360 360 350 360 Khulna " 150.00 380 355 365 365 380 380 380 380 Sylhet " 187.00 - 350 300 400 400 400 400 400 Rangpur " 182.00 360 360 360 360 360 360 369.50 360 Barisal " 165.00 350 350 333.33 350 390 390 390 390 Boal Medium Dhaka Kg 242.00 400 400 400 400 400 400 500 400 Narayanganj " 178.00 420 420 390 380 420 450 450 450 Chittagong " 285.00 - - - - - - - - Rajshahi " 185.00 400 400 389 400 400 400 400 400 Khulna " 230.00 450 450 450 450 450 450 450 450
Sylhet " 207.50 - 400 400 400 400 400 400 400 Rangpur " 210.00 400 400 380 380 390 390 390 390 Barisal " 260.00 450 400 316.66 316 400 400 400 400 Puti Small Dhaka Kg 143.00 200 200 200 250 250 250 300 250 Narayanganj " 175.00 250 200 200 365 250 265 280 265 Chittagong " 115.00 - - 200 160 200 200 300 2.00 Rajshahi " 90.00 200 190 190 200 200 200 200 2.0 Khulna 125.00 - 200 150 140 140 140 200 140 Sylhet " 107.50 140 160 180 180 180 180 250 180 Rangpur " 135.00 - 160 160 160 160 160 160 160 Barisal “ - 175 - 175 176 176 177 200 177Shingi Medium Dhaka Kg 505.00 750 700 750 700 750 750 700 750 Narayanganj " 354.00 750 700 720 700 700 700 75 700 Chittagong " 415.00 - - 750 650 654 649 649 654 Rajshahi " 385.00 780 557 750 750 750 750 750 750 Khulna " 380.00 750 50 750 750 750 750 750 750 Sylhet " 320.00 - 800 650 700 700 700 700 700 Rangpur " 425.00 700 550 650 560 560 560 560 510 Barisal " 437.50 780 700 600 600 600 600 600 600
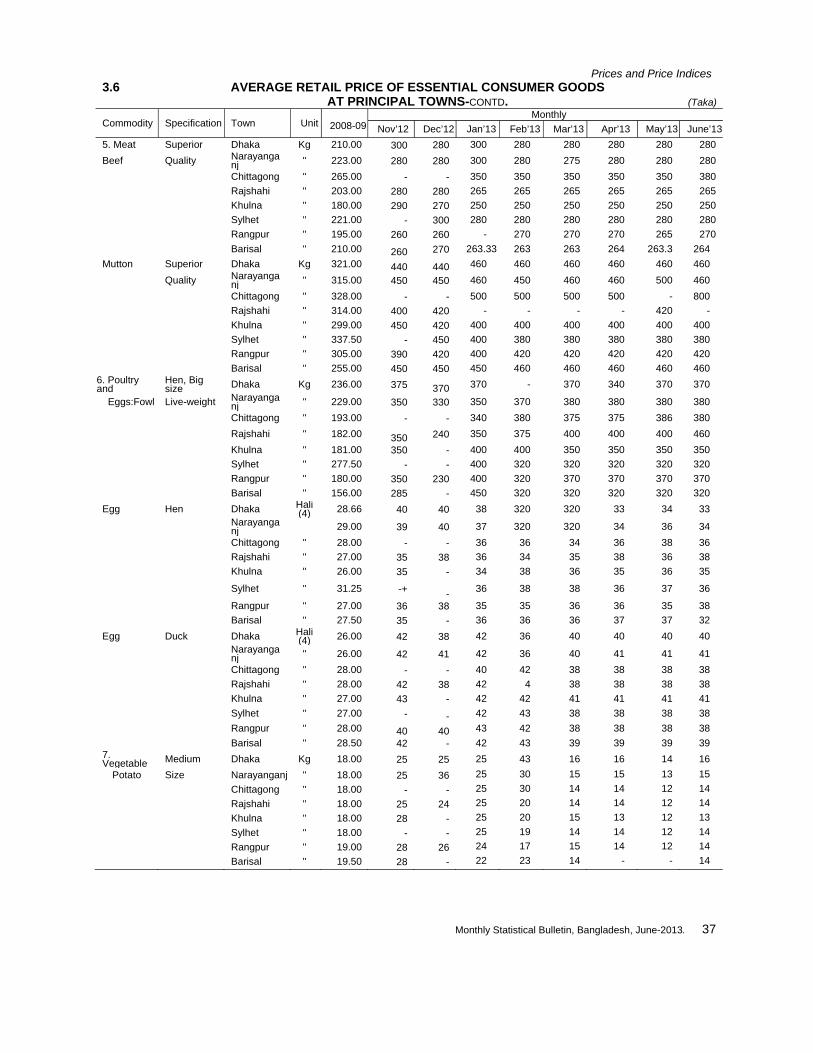
Prices and Price Indices
Monthly Statistical Bulletin, Bangladesh, June-2013. 37
3.6 AVERAGE RETAIL PRICE OF ESSENTIAL CONSUMER GOODS AT PRINCIPAL TOWNS-CONTD. (Taka)
Commodity Specification Town Unit
2008-09Monthly
Nov’12 Dec’12 Jan’13 Feb’13 Mar’13 Apr’13 May’13 June’135. Meat Superior Dhaka Kg 210.00 300 280 300 280 280 280 280 280 Beef Quality Narayanga
nj " 223.00 280 280 300 280 275 280 280 280 Chittagong " 265.00 - - 350 350 350 350 350 380 Rajshahi " 203.00 280 280 265 265 265 265 265 265 Khulna " 180.00 290 270 250 250 250 250 250 250 Sylhet " 221.00 - 300 280 280 280 280 280 280 Rangpur " 195.00 260 260 - 270 270 270 265 270 Barisal " 210.00 260 270 263.33 263 263 264 263.3 264 Mutton Superior Dhaka Kg 321.00 440 440 460 460 460 460 460 460 Quality Narayanga
nj " 315.00 450 450 460 450 460 460 500 460 Chittagong " 328.00 - - 500 500 500 500 - 800 Rajshahi " 314.00 400 420 - - - - 420 - Khulna " 299.00 450 420 400 400 400 400 400 400 Sylhet " 337.50 - 450 400 380 380 380 380 380 Rangpur " 305.00 390 420 400 420 420 420 420 420 Barisal " 255.00 450 450 450 460 460 460 460 460
6. Poultry and
Hen, Big size Dhaka Kg 236.00 375 370 370 - 370 340 370 370
Eggs:Fowl Live-weight Narayanganj " 229.00 350 330 350 370 380 380 380 380
Chittagong " 193.00 - - 340 380 375 375 386 380 Rajshahi " 182.00 350 240 350 375 400 400 400 460 Khulna " 181.00 350 - 400 400 350 350 350 350 Sylhet " 277.50 - - 400 320 320 320 320 320 Rangpur " 180.00 350 230 400 320 370 370 370 370 Barisal " 156.00 285 - 450 320 320 320 320 320 Egg Hen Dhaka Hali
(4) 28.66 40 40 38 320 320 33 34 33
Narayanganj 29.00 39 40 37 320 320 34 36 34
Chittagong " 28.00 - - 36 36 34 36 38 36 Rajshahi " 27.00 35 38 36 34 35 38 36 38 Khulna " 26.00 35 - 34 38 36 35 36 35
Sylhet " 31.25 -+ - 36 38 38 36 37 36
Rangpur " 27.00 36 38 35 35 36 36 35 38 Barisal " 27.50 35 - 36 36 36 37 37 32 Egg Duck Dhaka Hali
(4) 26.00 42 38 42 36 40 40 40 40
Narayanganj " 26.00 42 41 42 36 40 41 41 41
Chittagong " 28.00 - - 40 42 38 38 38 38 Rajshahi " 28.00 42 38 42 4 38 38 38 38 Khulna " 27.00 43 - 42 42 41 41 41 41 Sylhet " 27.00 - - 42 43 38 38 38 38 Rangpur " 28.00 40 40 43 42 38 38 38 38 Barisal " 28.50 42 - 42 43 39 39 39 39 7. Vegetable Medium Dhaka Kg 18.00 25 25 25 43 16 16 14 16
Potato Size Narayanganj " 18.00 25 36 25 30 15 15 13 15 Chittagong " 18.00 - - 25 30 14 14 12 14 Rajshahi " 18.00 25 24 25 20 14 14 12 14 Khulna " 18.00 28 - 25 20 15 13 12 13 Sylhet " 18.00 - - 25 19 14 14 12 14 Rangpur " 19.00 28 26 24 17 15 14 12 14
Barisal " 19.50 28 - 22 23 14 - - 14

Prices and Price Indices
38 Monthly Statistical Bulletin, Bangladesh, June-2013.
3.6 AVERAGE RETAIL PRICE OF ESSENTIAL CONSUMER GOODS AT PRINCIPAL TOWNS-CONTD. (Taka)
Commodity Specification Town Unit
2008-09
Monthly
Nov’12 Dec’12 Jan’13 Feb’13 Mar’13 Apr’13 May’13 June’13
Patal Superior Dhaka Kg 26.00 40 - - - - - - - (Parvel) Quality Narayanganj " 27.00 - - - - - - - - Chittagong " 24.00 - - - - - - - - Rajshahi " 23.00 30 20 - - - - - - Khulna " 19.00 26 - 50 50 - - - 40 Sylhet " - - - 50 30 - - - 345 Rangpur " 18.00 25 20 - - - - - - Barisal " - 20 - - - - - - -
Bitter Gourd Superior Dhaka Kg 30.00 60 60 - 50 30 50 25 50 (locally called Quality Narayanganj " 28.00 - - 60 45 30 45 26 45
uchchhya) Chittagong " 26.00 - - 59 34 20 34 18 34 Rajshahi " 27.00 55 62 80 30 20 30 20 30 Khulna " 28.00 - - 80 35 20 35 20 35 Sylhet " 32.50 - - 40 35 35 35 20 35 Rangpur " 24.00 40 - - - - - - - Barisal " - 40 - - 32 32 32 22 32
Brinjal Superior Dhaka Kg 30.00 48 49 50 50 40 55 30 40
Quality Narayanganj " 31.00 46 46 46 46 40 40 30 48 Chittagong " 20.00 - - 30 38 37 3025 38 35 Rajshahi " 18.00 42 28 30 40 25 20 20 17 Khulna " 23.00 36 - 30 38 20 30 18 14 Sylhet " 25.00 - - 35 35 16 20 30 35 Rangpur " 18.00 40 26 34 40 35 30 20 20 Barisal " 30.00 48 - 40 40 30 25 25 30
Mitha Kumra Medium Dhaka Kg 13.50 27 25 30 30 30 30 26 25
Narayanganj " 18.00 22 24 30 3025 30 20 25 30 Chittagong " 18.00 - - 28 28 30 20 20 20 Rajshahi " 18.00 25 23 28 30 20 15 20 20 Khulna " 14.00 25 - 30 30 30 30 15 15 Sylhet " 20.00 - - 30 - - - 30 30 Rangpur " 14.00 20 - - 28 20 20 20 - Barisal " 17.00 24 30 20 20 20 20 20
Spinach Superior Dhaka Kg 12.00 20 - 20 20 20 20 20 20 (palong, pui) Quality Narayanganj " 12.00 20 15 21 16 14 20 12 20 Chittagong " 11.00 - 26 15 14 14 12 13 12 Rajshahi " 9.00 15 - 14 24 12 13 12 13 Khulna " 8.00 15 20 24 - - 12 - 12 Sylhet " 15.00 - - - 20 10 - 23 - Rangpur " 8.00 12 - 20 23 23 10 10 10 Barisal " - 12 12 23.33 - - 23 - 24 Chalkumra Green Dhaka Kg 19.00 28 - - 30 36 - - - One seer Narayanganj " 23.00 2 - 30 30 20 30 20 30 Size Chittagong " 13.00 7 - 25 27 20 20 20 20 Rajshahi " 15.00 - 25 20 28 25 18.50 15 181 Khulna " 11.00 20 - 20 35 25 18 18 - Sylhet " 24.00 20 - 27 - - 25 20 25 Rangpur " 12.00 20 20 - - - - - 18 Barisal " - 28 - - - - - - -

Prices and Price Indices
Monthly Statistical Bulletin, Bangladesh, June-2013. 39
3.6 AVERAGE RETAIL PRICE OF ESSENTIAL CONSUMER GOODS AT PRINCIPAL TOWNS-CONTD. (Taka)
Commodity Specification Town Unit
2008-09
Monthly
Nov’12 Dec’12 Jan’13 Feb’13 Mar’13 Apr’13 May’13 June’13
Jhinga Superior Dhaka Kg 27.00 50 - - - - - 30 - Quality Narayanganj " 20.00 45 - - - - - 32 - Chittagong " 21.00 - - 30 30 30 30 30 30
Rajshahi " 19.00 40 - - - - - 30 - Khulna " 16.00 25 - 25 25 - 25 25 25
Sylhet " 26.00 - - - - - - 30 -
Rangpur " 13.00 28 - - - - - 24 - Barisal " - 26 - - - - - 24 -
Ladys finger Superior Dhaka Kg 27.00 50 50 - - - - - - Quality Narayanganj " 25.00 45 - - - - - 30 - Chittagong " 22.00 40 - 30 45 50 32 32 32
Rajshahi " 26.00 42 - 35 45 45 30 32 30 Khulna " 20.00 - - 42 42 46 28 30 28 Sylhet " 25.00 35 - 40 40 48 20 28 20
Rangpur " 18.00 45 - 20 40 48 28 20 28 Barisal 30.00 20 - - - - - 15 -
Papaya Green Dhaka Kg 12.00 20 20 20 25 20 20 14 20
Medium Narayanganj " 13.00 - 24 20 22 16 16 12 16 Chittagong " 12.00 18 - 25 25 15 15 10 15 Rajshah " 10.00 15 9 14 28 15 15 16 15 Khulna " 9.00 - - 15 26 12 26 15 26
Sylhet " 13.50 16 - 20 20 20 20 15 20 Rangpur " 11.00 17.33 18 15 24 15 28 16 26 Barisal " 11.50 - - 18 24 24 24 15 24
Beans Superior Quality Dhaka Kg 39.00 55 64 40 30 30 20 15 20
(Shim) Narayanganj " 39.00 48 64 40 35 30 25 16 25
Chittagong " 28.00 - - 48 30 22 20 20 20 Rajshahi " 24.00 48 35 46 30 22 20 18 20
Khulna " 25.00 45 - 50 32 23 23 15 23 Sylhet " 36.00 - - 50 22 15 15 15 15 Rangpur " 24.00 40 40 40 32 20 18 18 18
Barisal 25.00 48 - 38 30 30 30 15 30
Cauliflower Superior quality Dhaka Kg 26.00 50 40 35 35 20 20 18 20
12 chatak to Narayanganj " 27.00 48 38 35 28 20 20 19.50 20 1 seer size Chittagong " 14.00 - - 32 20 16 14 18 14 Rajshahi " 13.00 45 28 26 22 15 20 17 26
Khulna " 9.00 45 - 44 20 15 12 14 12 Sylhet " 26.65 - - 35 20 14 14 12 14
Rangpur " 10.00 42 30 26 20 18 10 12 10
Barisal " 17.00 50 - 23.33 20 18 18 14 18
Cabbage SuperiorQuality Dhaka Kg 18.00 30 30 - - - 15 10 -
2.33 kg Size Narayanganj " 22.00 30 35 32 20 15 15 18 15
Chittagong " 9.00 - - 24 15 15 15 12 15
Rajshahi " 9.00 25 20 18 18 12 12 15 12
Khulna " 8.00 25 - 25 16 12 12 12 12
Sylhet " 17.50 - - 30 12 10 12 10 12
Rangpur " 8.00 28 23 21 16 12 10 12 10
Barisal " 14.00 25 - 21.66 15 10 10 10 10

Prices and Price Indices
40 Monthly Statistical Bulletin, Bangladesh, June-2013.
3.6 AVERAGE RETAIL PRICE OF ESSENTIAL CONSUMER GOODS AT PRINCIPAL TOWNS-CONTD. (Taka)
Commodity Specification Town Unit 2008-
09 Monthly
Nov’12 Dec’12 Jan’13 Feb’13 Mar’13 Apr’13 May’13 June’13
Tomato Fresh, Ripe Dhaka Kg 45.00 82 80 50 30 30 30 30 30 Superior Narayanganj " 48.00 80 95 60 35 35 35 36 35 Quality Chittagong " 38.00 - - 60 32 30 15 28 15 Rajshahi " 30.00 72 40 46 34 24 20 25 20 Khulna " 16.00 70 - 70 26 15 12 25 12 Sylhet " 28.50 - - 40 20 10 10 30 10 Rangpur " 23.00 70 - 40 28 20 15 25 15 Barisal " 34.00 75 - 45 45 15 15 30 15
8. Edible oil Superior Dhaka Kg 148.00 200 160 200 200 190 200 200 200
Mustard oil Quality Narayanganj " 135.00 190 165 180 190 190 190 193.9 190 Chittagong " 133.00 - - 180 200 200 200 200 200 Rajshahi " 122.00 195 155 175 200 200 200 200 200 Khulna " 125.00 195 - 180 180 180 180 180 180 Sylhet " 150.00 - - 190 180 180 180 180 180 Rangpur " 140.00 180 160 185 175 175 175 175 175 Barisal " 152.50 180 - 180 158 158 158 158.33 158
Soyabean Superior Dhaka Kg 96.00 135 126 135 135 130 130 130 130
Oil Quality Narayanganj " 97.00 134 138 135 135 135 135 135 135 Chittagong " 96.00 - - 135 132 130 130 130 130 Rajshahi " 87.00 130 128 135 133 132 132 132 132 Khulna " 97.00 135 - 135 135 135 135 135 135 Sylhet " 88.75 - - 135 135 135 135 135 135 Rangpur " 95.00 132 130 136 136 136 136 136 136 Barisal " 100.00 128.50 - 128 128 128 128 128 128 9. Salt and Local Dhaka Kg 16.50 32 30 30 32 28 28 28 28 spices Salt Fine, White Narayanganj " 16.00 32 30 32 31 29 28 28 28 Chittagong " 18.00 - - 30 33 28 28 28 27 Rajshahi " 16.00 32 30 29 30 28 28 28 78 Khulna " 16.00 32 - 32 32 32 32 32 32 Sylhet " 17.25 - - 32 32 32 32 32 32 Rangpur " 17.00 32 31 31 31 29 28 29 29 Barisal 18.00 32 - 30 30 30 30 30 30 Chillies Superior Dhaka Kg 126.00 165 160 160 160 160 160 160 160 (dry) Quality Narayanganj " 124.00 155 152 150 165 165 165 165 165 Chittagong " 145.00 - - 200 200 200 200 200 200
Rajshahi " 120.00 165 175 155 185 185 185 185 185
Khulna " 100.00 150 - 170 175 175 175 175 175
Sylhet " 127.50 - - 16 165 165 165 165 165 Rangpur " 125.00 160 150 155 17 170 170 170 170 Barisal " 82.50 155 - 160 143 143 144 143.33 144 Onion Superior Dhaka Kg 31.00 45 48 40 40 35 30 30 32 Quality Narayanganj " 30.00 40 55 45 56 32 32 30 32
Chittagong " 26.00 - - 35 38 38 30 26 30 Rajshahi " 28.00 40 48 35 38 32 32 26 32
Khulna " 28.00 40 - 50 50 38 27 26 28
Sylhet " 27.50 - - 40 40 35 28 28 40 Rangpur " 28.00 40 42 40 50 30 40 27 32 Barisal " 33.00 38 - 31.33 31 31 31 30 32

Prices and Price Indices
Monthly Statistical Bulletin, Bangladesh, June-2013. 41
3.6 AVERAGE RETAIL PRICE OF ESSENTIAL CONSUMER GOODS AT PRINCIPAL TOWNS-CONTD.60.00 (Taka)
Commodity Specification Town Unit
2008-09Monthly
Nov’12 Dec’12 Jan’13 Feb’13 Mar’13 Apr’13 May’13 June’13 Garlic Superior Dhaka Kg 38.00 55 45 50 50 60 70 90 70 (Rasun) Quality Narayanganj " 37.00 50 36 45 45 60 75 100 75 Chittagong " 36.00 - - 55 58 50 75 80 75 Rajshahi " 35.00 48 40 45 55 50 65 80 75 Khulna " 33.00 48 - 45 45 58 58 90 8880 Sylhet " 40.00 - - 45 45 60 50 85 65 Rangpur " 35.00 40 46 40 40 60 60 72 80 Barisal " 22.50 60 - 76.66 76 5 76 85 20 Turmeric Superior Dhaka Kg 96.00 155 140 120 120 120 120 120 115 (Halud) Quality Narayanganj " 93.00 150 127 110 110 110 110 114 110 Chittagong " 75.00 - - 100 100 110 110 110 110 Rajshahi " 100.00 145 100 100 100 110 110 110 110 Khulna " 96.00 145 - 105 105 105 105 105 - Sylhet " 85.00 - - - - - - 110 105 Rangpur " 85.00 130 - - - - - 106 - Barisal " 65.00 130 - 95.50 88 90 88 90 88
Cuminseed Superior Dhaka 100 Gram 38.00 50 45 50 50 48 45 46 46
(Jira) Quality Narayanganj " 37.00 50 42 48 50 46 46 48 46 Chittagong " 36.00 - - 50 50 44 44 44 44 Rajshahi " 35.00 50 50 50 52 43 43 43 43 Khulna " 34.00 47 - 55 55 40 42 42 92 Sylhet " 38.75 - - 54 54 42 50 50 50 Rangpur " 34.00 50 38 50 50 41 43 43 43 Barisal " 36.00 47 - 52 50 50 50 50 50 Ginger Superior Dhaka Kg 62.00 80 55 60 90 85 90 105 100 (Ada) Quality Narayanganj " 60.00 80 62 65 85 90 95 115 48 Chittagong " 60.00 - - 60 65 90 90 108 105 Rajshahi " 70.00 78 55 60 65 90 95 112 98 Khulna " 65.00 80 - 80 80 89 93 100 116 Sylhet " 49.50 - - 80 80 80 90 105 120 Rangpur " 60.00 78 50 55 88 85 85 110 100 Barisal 63.50 75 - 95 85 85 94 110 85
Cardamon Superior Dhaka 50 Gram 60.00 98 - 100 90 90 90 95 90
Quality Narayanganj " 60.00 98 - 100 95 95 95 96 88
Chittagong " 55.00 - - 100 100 100 100 100 100 Rajshahi " 56.00 98 - 90 105 105 105 105 105 Khulna " 56.00 94 - 100 90 90 90 95 90 Sylhet " 57.50 - - 100 95 95 95 100 95 Rangpur " 56.00 92 - 95 90 90 90 105 90 Barisal " 65.00 90 - 90 78 78= 78 100 79
Cinnamon Superior Dhaka 50 Gram 19.00 - - 16 15 15 15 18 15
(Sticks) Quality Narayanganj " 20.00 - - 15 16 16 16 17.50 16 Chittagong " 18.00 - - 16 14 14 14 16.00 14 Rajshahi " 16.00 - - 16 15 15 15 17.50 15 Khulna " 17.00 - - 15 16 16 16 17.50 16 Sylhet " 23.75 - - 14 15 15 14 18.00 15 Rangpur " 18.00 - - 13 14 14 15 17.50 14 Barisal " 25.00 - - 17 17 17 17 17.9 17
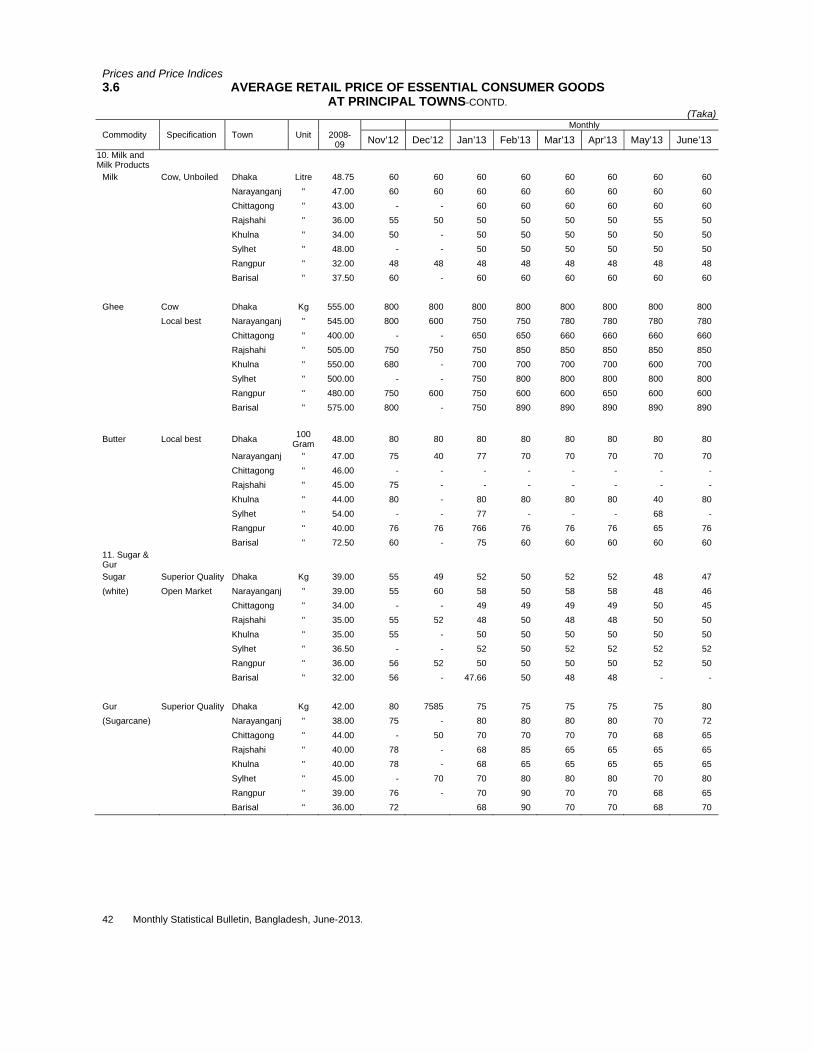
Prices and Price Indices
42 Monthly Statistical Bulletin, Bangladesh, June-2013.
3.6 AVERAGE RETAIL PRICE OF ESSENTIAL CONSUMER GOODS AT PRINCIPAL TOWNS-CONTD. (Taka)
Commodity Specification Town Unit
2008-09
Monthly
Nov’12 Dec’12 Jan’13 Feb’13 Mar’13 Apr’13 May’13 June’13 10. Milk and Milk Products
Milk Cow, Unboiled Dhaka Litre 48.75 60 60 60 60 60 60 60 60 Narayanganj " 47.00 60 60 60 60 60 60 60 60 Chittagong " 43.00 - - 60 60 60 60 60 60 Rajshahi " 36.00 55 50 50 50 50 50 55 50 Khulna " 34.00 50 - 50 50 50 50 50 50 Sylhet " 48.00 - - 50 50 50 50 50 50 Rangpur " 32.00 48 48 48 48 48 48 48 48 Barisal " 37.50 60 - 60 60 60 60 60 60 Ghee Cow Dhaka Kg 555.00 800 800 800 800 800 800 800 800 Local best Narayanganj " 545.00 800 600 750 750 780 780 780 780 Chittagong " 400.00 - - 650 650 660 660 660 660 Rajshahi " 505.00 750 750 750 850 850 850 850 850 Khulna " 550.00 680 - 700 700 700 700 600 700 Sylhet " 500.00 - - 750 800 800 800 800 800 Rangpur " 480.00 750 600 750 600 600 650 600 600 Barisal " 575.00 800 - 750 890 890 890 890 890
Butter Local best Dhaka 100 Gram 48.00 80 80 80 80 80 80 80 80
Narayanganj " 47.00 75 40 77 70 70 70 70 70 Chittagong " 46.00 - - - - - - - - Rajshahi " 45.00 75 - - - - - - - Khulna " 44.00 80 - 80 80 80 80 40 80 Sylhet " 54.00 - - 77 - - - 68 - Rangpur " 40.00 76 76 766 76 76 76 65 76 Barisal " 72.50 60 - 75 60 60 60 60 60 11. Sugar & Gur
Sugar Superior Quality Dhaka Kg 39.00 55 49 52 50 52 52 48 47 (white) Open Market Narayanganj " 39.00 55 60 58 50 58 58 48 46 Chittagong " 34.00 - - 49 49 49 49 50 45 Rajshahi " 35.00 55 52 48 50 48 48 50 50 Khulna " 35.00 55 - 50 50 50 50 50 50 Sylhet " 36.50 - - 52 50 52 52 52 52 Rangpur " 36.00 56 52 50 50 50 50 52 50 Barisal " 32.00 56 - 47.66 50 48 48 - - Gur Superior Quality Dhaka Kg 42.00 80 7585 75 75 75 75 75 80 (Sugarcane) Narayanganj " 38.00 75 - 80 80 80 80 70 72 Chittagong " 44.00 - 50 70 70 70 70 68 65 Rajshahi " 40.00 78 - 68 85 65 65 65 65 Khulna " 40.00 78 - 68 65 65 65 65 65 Sylhet " 45.00 - 70 70 80 80 80 70 80 Rangpur " 39.00 76 - 70 90 70 70 68 65 Barisal " 36.00 72 68 90 70 70 68 70

Prices and Price Indices
Monthly Statistical Bulletin, Bangladesh, June-2013. 43
3.6 AVERAGE RETAIL PRICE OF ESSENTIAL CONSUMER GOODS AT PRINCIPAL TOWNS-CONTD. (Taka)
Commodity Specification Town Unit
2008-09
Monthly
Nov’12 Dec’12 Jan’13 Feb’13 Mar’13 Apr’13 May’13 June’13
12. Fruits
Banana Sabri Dhaka Hali (4)
12.00 25 20 20 20 18 20 20 20
Medium Size Narayanganj " 12.00 22 - - - - - - -
Chittagong " 10.00 - - 24 24 24 24 24 24 Rajshahi " 8.00 18 12 13 13 13 13 20 13 Khulna " 10.00 18 - 18 18 18 18 22 18 Sylhet " 15.00 - - 40 30 30 30 22 30 Rangpur " 11.00 14 14 14 14 14 14 22 14 Barisal “ 8.00 16 - 11.33 12 12 12 22 12 Papaya Ripe Dhaka Each 41.00 70 75 60 65 60 65 60 65
Superior Quality Narayanganj " 45.00 60 85 60 60 60 60 58 60
Medium Size Chittagong " 35.00 - - 55 50 50 50 45 55
Rajshahi " 25.00 55 30 50 48 48 48 48 52 Khulna " 32.00 56 - 55 56 42 56 56 53 Sylhet " 33.75 - - 55 - - - - - Rangpur " 34.00 50 70 60 60 55 60 60 60 Barisal “ 30.00 70 - 70 73 75 73 73.33 74
Pineapple Medium Size Dhaka Each 21.00 165 140 - - - - - -
Narayanganj " 22.00 155 145 - - - - - - Chittagong " 8.00 - - - - - - - - Rajshahi " 25.00 155 150 20 32 28 32 28 32 Khulna " 15.00 150 - - - - - - - Sylhet " 18.33 - - 30 36 30 36 33.60 96 Rangpur " - 145 155 - - - - - - Barisal “ 20.00 155 - - - - - - -
Orange Medium Size Dhaka Hali
(4) 45.00 80 60 60 60 60 60 80 85
Narayanganj 45.00 75 55 65 55 60 55 75 80 Chittagong " 50.00 - - 58 58 60 58 80 68 Rajshahi " 55.00 75 70 45 45 70 45 84 75 Khulna " 42.00 65 - 65 65 80 65 75 75 Sylhet " 50.00 - - 45 45 55 45 80 85 Rangpur " 47.00 75 70 60 60 70 60 75 75 Barisal “ 57.50 72 - 56.66 56 60 56 80 75
Coconut Medium Size Dhaka Each 26.00 40 35 38 35 35 35 30 32
Narayanganj " 25.00 38 36 37 34 34 34 28 34 Chittagong " 20.00 - - 36 36 35 36 28 32 Rajshahi " 18.00 34 30 36 34 34 34 28 30 Khulna " 18.00 30 - 32 35 32 38 35 30 Sylhet " 28.75 - - 32 36.50 20 30.50 35.50 30.50 Rangpur " 17.00 35 38 38 38 30 38 32 32 Barisal “ 27.00 35 - 35 32 32 33 32.37 33

Prices and Price Indices
44 Monthly Statistical Bulletin, Bangladesh, June-2013.
3.6 AVERAGE RETAIL PRICE OF ESSENTIAL CONSUMER GOODS AT PRINCIPAL TOWNS-CONTD. (Taka)
Commodity Specification Town Unit
2008-09
Monthly
Nov’12 Dec’12 Jan’13 Feb’13 Mar’13 Apr’13 May’13 June’13
13. Tea Ispahani/Finlay/ Dhaka. 200gr 43.00 66 36 72 72 72 72 72 72 Equivalent Narayanganj " 48.00 75 62 75 75 75 75 75 75 Chittagong " 45.00 - - 72 72 72 72 72 72 Rajshahi " 45.00 63 65 75 75 75 75 75 75 Khulna " 40.00 58 - 75 75 75 75 75 75 Sylhet " 48.75 - - 75 75 75 75 75 75 Rangpur " 39.00 64 64 74 74 74 74 74 74 Barisal “ 37.00 60 - 65 65 65 65 65 6514. Bread & Buiscuit
Biscuit Locally Dhaka Kg 127.00 180 180 180 180 180 180 180 200 Produced Narayanganj " 140.00 175 250 180 180 180 180 180 180 Best Quality Chittagong " 192.00 - - 140 450 150 150 150 149 Rajshahi " 108.00 150 163 140 140 140 140 140 140 Khulna " 149.00 150 - 150 170 170 170 150 170 Sylhet " 87.50 - - 180 120 120 170 140 120 Rangpur " 111.00 140 147 150 149 149 149 149 145 Barisal “ 120.00 160 - 160 158 158 158 158 158
Bread Fair Average Quality Dhaka 400gr 26.00 40 35 40 40 40 40 40 40
400 gm wt Narayanganj " 32.00 40 48 40 40 40 40 40 40 Chittagong " 30.00 - - 40 40 40 40 40 40 Rajshahi " 28.00 30 163 30 30 30 30 35 36 Khulna " 25.00 30 - 30 30 30 30 30 30 Sylhet " 23.60 - - 40 40 40 40 44 40 Rangpur " 27.00 35 147 35 35 35 35 35 35 Barisal “ 21.50 36 - 30 30 30 30 30 3015. Muri Fair Average Dhaka Kg 52.00 60 50 50 50 60 60 60 60
(puffed rice) Quality Narayanganj " 48.00 60 54 55 55 60 60 60 60
Chittagong " 48.00 - - 50 60 60 60 60 60 Rajshahi " 42.00 60 60 50 60 60 60 55 60 Khulna " 52.00 50 - 50 55 60 60 60 60 Sylhet " 48.00 - - 55 60 60 60 58 60 Rangpur " 49.00 55 48 48 50 50 50 60 50 Barisal “ 55.50 65 - 78.66 60 60 60 60 6016. Fuel and Lighting Firewood Gazari, Split Dhaka Quintal 800.00 - - - - - - - - Narayanganj " 800.00 500 460 500 500 550 550 550 550 Chittagong " 700.00 - - 550 550 450 560 560 560 Rajshahi " - - - - - - - - - Khulna " 450.00 - - 540 540 500 565 560 565 Sylhet " 450.00 - - 437 437 500 437 445 437 Rangpur " - - - - - - - - - Barisal “ - - - - - - - - -

Prices and Price Indices
Monthly Statistical Bulletin, Bangladesh, June-2013. 45
3.6 AVERAGE RETAIL PRICE OF ESSENTIAL CONSUMER GOODS AT PRINCIPAL TOWNS-CONTD. (Taka)
Commodity Specification Town Unit
2008-09
Monthly
Nov’12 Dec’12 Jan’13 Feb’13 Mar’13 Apr’13 May’13 June’13
17. Mango tree Dhaka Quintal 450.00 - - - - - - - - Split Narayanganj " 450.00 300 210 410 410 400 410 417.50 450 Chittagong " 260.00 - - 380 380 380 380 380 380 Rajshahi " 375.00 348 450 380 380 380 380 380 380 Khulna " 300.00 - - 360 360 360 380 360 360 Sylhet " 300.00 - - - - - - - - Rangpur " 310.00 400 410 350 350 350 350 350 350 Barisal “ 208.33 500 - 350 350 350 350 350 350
Matches 40 Stick box Dhaka Each 1.60 2 200 2 2 2 2 2 2 Narayanganj " 1.60 2 200 2 2 2 2 2 2
Chittagong " 1.60 - - 2 2 2 2 2 2
Rajshahi " 1.60 2 2.00 2 2 2 2 2 2
Khulna " 1.60 2 - 2 2 2 2 2 2
Sylhet " 1.60 - - 2 2 2 2 2 2 Rangpur " 1.60 2 2.00 2 2 2 2 2 2 Barisal “ 1.60 2 - 2 2 2 2 2 2
18. Kerosene White Dhaka Litre 48.00 65 66 72 70 70 70 70 70 Narayanganj " 48.00 64 65 68 68 70 70 70 70 Chittagong " 45.00 - - 68 68 68 68 68 88 Rajshahi " 45.00 63 3 68.50 70 70 70 70 70 Khulna " 43.00 63 - 70 70 70 70 70 70 Sylhet " 45.00 - - 68 68 68 68 68 68 Rangpur " 44.00 64 62.5 68 68 68 68 68 68 Barisal “ - 63 - 68 68 68 68 68 68
19. Saree Local Mill-40x40 Dhaka 5 yrd 319.00 500 475 400 420 450 450 550 450
Medium Narayanganj (4.6 mtr) 290.00 400 285 400 420 400 500 400 Quality Chittagong Each 295.00 - - 420 483 470 483 483 4850 Rajshahi " 300.00 400 456.66 410 430 430 430 430 430 Khulna " 308.00 - - 400 400 400 400 400 400 Sylhet " 223.00 - - 420 400 400 400 400 400 Rangpur " 230.00 420 500 420 420 420 420 420 420 Barisal “ 268.00 420 - 420 400 400 400 400 400
Longcloth Medium Dhaka Metre 36.00 60 65 395 62 62 62 62 62
Quality Narayanganj " 35.00 58 42 62 63 60 63 63 63 Local Chittagong " 34.00 - - 62 58 64 58 58 65 Rajshahi " 35.00 68 53 60 62 62 62 62 65 Khulna " 35.00 60 - 60 62 62 62 62 65 Sylhet " 40.00 - - 63 58 58 58 58 66 Rangpur " 38.00 65 43 62 62 62 62 62 66
Barisal “ 40.00 60 - 62 62 62 62 62 66
Drill Local, Khaki Dhaka Metre 145.00 - - - - - - - - Medium Narayanganj " 135.00 - - - - - - - - Quality Chittagong " 75.00 - - - - - - - - Rajshahi " 115.00 105 218 100 110 110 110 110 110 Khulna " 110.00 115 - 120 115 115 115 115 115 Sylhet " 73.00 - - 120 120 120 120 120 120 Rangpur " 93.00 98.50 150 120 115 115 115 115 115 Barisal “ - 98 - 112 118 118 118 118 118

Prices and Price Indices
46 Monthly Statistical Bulletin, Bangladesh, June-2013.
3.6 AVERAGE RETAIL PRICE OF ESSENTIAL CONSUMER GOODS AT PRINCIPAL TOWNS-CONTD. (Taka)
Commodity Specification Town Unit
2008-09
Monthly
Nov’12 Dec’12 Jan’13 Feb’13 Mar’13 Apr’13 May’13 June’13
Ganji 36" Size Dhaka Each 65.00 100 90 90 90 85 90 90 90
Superior Quality Narayanganj " 64.00 80 60 75 85 85 85 90 85
Chittagong " 48.00 - - 85 80 80 80 80 85 Rajshahi " 49.00 80 85 80 80 80 80 80 80 Khulna " 72.00 - - 86 80 80 80 80 80 Sylhet " 50.00 - - 75 84 85 85 85 80 Rangpur " 45.00 80 85 85 80 80 85 85 85 Barisal “ 60.00 70 - 85 85 85 85 85 85
Shoes Gents, Bata, Dhaka Pair 1100.00 2250 1190 1190 1750 1750 1750 1750 1750
Rubber Sole, Narayanganj " 699.00 2150 999 999 850 1800 1800 1800 1800
Std. Size Chittagong " 850.00 - - 850 1750 1750 1750 1750 1750 Rajshahi " 1400.00 - - 1223 1900 1900 1750 1900 1900 Khulna " 850.00 - - 1250 1800 1800 1900 1800 1800 Sylhet " 675.00 - - 1200 1800 180 1800 1800 1800 Rangpur " 1683.00 1700 1250 1250 1800 1800 1800 1800 1800 Barisal “ 1076.00 1700 - 1190 1800 1800 1800 1800 1800
Toilet soap Lux International Dhaka Each 20.00 28 26 28 28 28 28 28 28
Medium Size Narayanganj " 21.00 28 40 28 28 28 28 28 28
Chittagong " 17.00 - - 28 28 28 28 28 28 Rajshahi " 18.00 28 27.33 28 28 28 28 28 28 Khulna " 22.00 28 - 28 28 28 28 28 28 Sylhet " 17.00 - - 28 28 28 28 28 28 Rangpur " 18.00 28 26 28 28 28 28 28 28 Barisal “ 20.00 28 - 28 28 28 28 28 28
Washing Tibet 570 Dhaka Each 14.00 17 16 17 17 17 17 17 17 Soap Narayanganj " 14.00 17 - - 17 - - - - Chittagong " 14.00 - - 17 17 17 17 17 17 Rajshahi " 14.00 17 16 17 17 17 17 17 17 Khulna " 13.00 17 - 17 17 17 17 17 17 Sylhet " 15.00 - - 17 17 17 17 17 17 Rangpur " 14.00 17 18 17 17 17 17 17 17 Barisal “ 13.00 17 - 17 17 17 17 17 17
Washing Pancha No. 1 Dhaka Each 10.00 - - - 17 17 17 17 17
Soap Equivalent Narayanganj " 10.00 50 10 45 - - - - - Chittagong " 12.00 - - 55 45 45 45 45 46 Rajshahi " 12.00 - - - 48 48 48 46 48 Khulna " 12.00 - - 52 - - - - 52 Sylhet " 12.00 - - 50 52 52 52 48 45 Rangpur " 9.00 50 42 55 45 45 45 - 50 Barisal “ 12.00 48 - 45 50 50 50 52 48 Talcum Tibet, Local Dhaka Each 45.00 42 50 40 48 48 48 45 45 Powder Narayanganj " 55.00 42 58 40 40 40 40 50 43 Chittagong " 55.00 - - 40 40 40 40 48 40 Rajshahi " 40.00 40 38.33 40 40 40 40 40 40 Khulna " 55.00 - - 40 40 40 40 40 39 Sylhet " 54.00 - - 40 40 40 40 40 40 Rangpur " 40.00 38 35 40 40 40 40 40 40 Barisal “ 45.00 40 - 40 40 40 40 40 40

Prices and Price Indices
Monthly Statistical Bulletin, Bangladesh, June-2013. 47
3.6 AVERAGE RETAIL PRICE OF ESSENTIAL CONSUMER GOODS AT PRINCIPAL TOWNS-CONTD. (Taka)
Commodity Specification Town Unit
2008-09
Monthly
Nov’12 Dec’12 Jan’13 Feb’13 Mar’13 Apr’13 May’13 June’13
Face Cream Ponds, Dhaka Each 107.00 54 60 52 52 52 52 55 52 (vanishing) Medium Narayanganj " 102.00 - 66 52 52 52 52 55 53 Chittagong " 100.00 - - 52 52 52 52 52 52 Rajshahi " 90.00 54 50 55 55 55 55 55 55 Khulna " 94.00 55 - 50 50 50 50 50 50 Sylhet " 60.00 - - 55 55 55 55 55 55 Rangpur " 85.00 53 50 55 51.50 57.50 52 51.50 51.50 Barisal “ 58.00 52 - 55 55 55 55 55 55 Hair oils Cocoanut Dhaka Each 260.00 260 310 260 260 260 260 270 260 unscented Narayanganj " 271.00 25 - - - - - - 255 (Imported) Chittagong " 275.00 - - - - - - - 250 Rajshahi " 285.00 255 265 270 270 270 270 270 250 Khulna " 265.00 - - 290 230 290 290 290 270 Sylhet " 188.00 255 - 256 256 256 256 256 263.00 Rangpur " 270.00 - 265 270 270 270 270 270 260 Barisal “ 200.00 - - - - - - - - 21. Medical care
Disprin Tablet Dhaka Each 1.00 1.00 1.50 1.00 1.00 1.00 1.00 1.00 1.00
Aspirin Narayanganj " 1.00 1.00 2.00 1.00 1.00 1.00 1.00 1.00 1.00 Chittagong " 1.00 - - 1.00 1.00 1.00 1.00 1.00 1.00 Rajshahi " 1.00 1.00 1.00 1.00 1.00 1.00 1.00 1.00 1.00 Khulna " 1.00 1.00 - 1.00 1.00 1.00 1.00 1.00 1.00 Sylhet " 1.00 - - 1.00 1.00 1.00 1.00 1.00 1.00 Rangpur " 1.00 1.00 1.00 1.00 1.00 1.00 1.00 1.00 1.00 Barisal “ 1.00 1.00 - 1.00 1.00 1.00 1.00 1.00 1.00
Penicillin Glaxo, 5 lakhs Dhaka Each 25.00 30 12 30 30.00 30 30 30 30
Narayanganj " 23.00 30 20 30 30 30 30 30 30
Chittagong " 36.00 - - 30 30 30 30 30 32 Rajshahi " 30.00 29 10 30 30 30 30 30 32 Khulna " 32.00 - - 32 32 32 32 32 32 Sylhet " 19.00 - - 32 32 32 32 32 30 Rangpur " 26.00 29 29 30 30 30 32 32 32 Barisal “ - - - 32 30 32 32 32 32 22. Baby Food
Lactozen 400 gms. tin Dhaka Each 370.00 530 440 540 540 550 545 550 550
(half cream) Narayanganj " 365.00 535 550 545 535 550 550 550 550 Chittagong " 365.00 - - 565 550 550 550 550 550 Rajshahi " 370.00 565 553 560 560 560 560 560 560 Khulna " 370.00 560 - 560 550 560 560 560 560
Sylhet " 385.00 - - 550 550 550 550 550 550
Rangpur " 370.00 565 400 560 550 550 550 550 550 Barisal “ 365.00 540 - 560 560 560 560 560 560

Prices and Price Indices
48 Monthly Statistical Bulletin, Bangladesh, June-2013.
‘3.6 AVERAGE RETAIL PRICE OF ESSENTIAL CONSUMER GOODS AT PRINCIPAL TOWNS-CONTD. (Taka)
Commodity Specification Town Unit
2008-
09
Monthly
Nov’12 Dec’12 Jan’13 Feb’13 Mar’13 Apr’13 May’13 June’13
Powder milk Dhaka Each 1392.00 1500 1900 1950 1950 1960 1960 1960 1960
Dano (full cream) Narayanganj " 1365.00 1960 1750 1960 1960 1950 1960 1960 1960
2 kg tin Chittagong " 1345.00 - - - - - - - - Rajshahi " 1380.00 1965 1840 - - - - - - Khulna " 1190.00 1980 - 1940 1950 1950 1950 1950 1930 Sylhet " 1362.50 - - 1930 1950 1940 1950 1950 1457 Rangpur " 1255.00 1935 1650 1930 1950 1940 1950 1950 1470 Barisal “ 1190.00 1920 - 1925 1925 1970 1970 1970 Ovaltine 1 lb. tin Dhaka Each 223.00 360 315 390 400 400 400 400 400 Narayanganj " 225.00 380 - 385 380 380 380 380 380 Chittagong " 245.00 - - 390 400 400 400 400 400 Rajshahi " 255.00 398 370 400 400 400 400 400 400 Khulna " 260.00 394 - 390 400 400 400 400 400 Sylhet " 305.00 - - 400 400 400 400 400 400 Rangpur " 245.00 400 332 400 380 380 380 380 380 Barisal “ 208.00 - - - - - - - - Horlics Big bottle Dhaka Each 229.00 330 335 345 345 345 345 345 345
(400 gram pot) Narayanganj " 227.00 350 330 332 332 340 340 340 340
Chittagong " 232.00 - - 335 340 338.50 338.50 338.50 33805 Rajshahi " 240.00 330 330 332 332 332 332 332 332 Khulna " 235.00 315 - 335 330 330 330 330 330 Sylhet " 275.00 - - 340 340 340 340 340 340 Rangpur " 235.00 320 320 334 334 334 384 334 334 Barisal “ 205.00 330 - 330 330 330 330 330 23. Educational Fullscape Dhaka Quire 20.00 22 20 20 20 20 20 20 20
Expenses Paper
white-10 lbs Narayanganj " 19.00 22 19 20 20 20 20 20 20
Chittagong " 18.00 - - 22 22 22 22 22 22 Rajshahi " 17.00 - - - - - - - - Khulna " 18.00 - - 25 25 25 25 25 25 Sylhet " 22.00 - - 25 25 25 25 25 25
Rangpur " 18.00 23 20 20 20 20 20 20 20 Barisal “ 18.00 24 - 23 23 23 23 23 23
Pencil Deer brand Dhaka Each 15.00 12 100 12 12 12 12 12 12
Medium Narayanganj " 14.00 14 12 12 12 12 12 12 12 Chittagong " 16.00 - - 15 15 15 15 15 15 Rajshahi " 16.00 14 9.33 16 16 16 16 16 16 Khulna " 18.00 - - 15 15 13 15 15 15 Sylhet " 15.00 - - 15 13 15 13 13 13 Rangpur " 16.00 13 15 10 12 12 12 12 12 Barisal “ 14.00 - - 12 12 12 12 12 12

Prices and Price Indices
Monthly Statistical Bulletin, Bangladesh, June-2013. 49
3.6 AVERAGE RETAIL PRICE OF ESSENTIAL CONSUMER GOODS AT PRINCIPAL TOWNS-CONTD. (Taka)
Commodity Specification Town Unit
2008-09
Monthly
Nov’12 Dec’12 Jan’13 Feb’13 Mar’13 Apr’13 May’13 June’13
24. Other Miscellaneous Items
Medium Size
Dhaka Birah 54.00 80 90 90 100 120 130 80 100
Betal leaf Narayanganj (80
pcs) 60.00 85 125 110 100 100 125 95 95
(Paan) Chittagong “ 48.00 - - 98 98 140 140 85 85 Rajshahi “ 50.00 70 52 65 80 120 120 79 80 Khulna “ 40.00 70 - 70 80 150 150 120 85 Sylhet “ 60.00 - - 80 68 140 140 100 20 Rangpur “ 45.00 80 45 80 78 120 120 95 90 Barisal “ 75.00 70 - 80 80 90 140 90 70 Betel nut Tanti, Whole Dhaka Kg 157.00 250 265 275 275 270 275 400 275 (Supari) Narayanganj “ 145.00 255 285 280 280 270 280 350 280 Chittagong “ 150.00 - - 160 250 300 300 300 300 Rajshahi “ 130.00 270 225 230 260 300 300 300 300 Khulna “ 130.00 250 - 185 280 280 280 280 280 Sylhet “ 145.00 - - 350 300 300 300 300 300 Rangpur “ 150.00 280 280 285 280 280 280 280 280 Barisal “ 140.00 260 - 176.66 176 176 177 - 177
Tobacco Leaf Dhaka Kg 150.00 30 20 300 300 290 30 300 300 Motihari Narayanganj “ 230.00 28 20 290 290 290 29 290 290 Chittagong “ 150.00 - - - - - - - Rajshahi “ - 28 15 280 280 285 28.50 290 295 Khulna “ 180.00 30 - 270 280 280 - 280 280 Sylhet “ 220.00 - - 270 280 - 28 280 280 Rangpur “ 140.00 - - - - 280 28 - - Barisal “ 150.00 28 - 250 280 280 28 280 280 Bidi Local best Dhaka Each 6.00 8 8 8 8 8 8 8 8 Pkt of 25 sticks Narayanganj “ 6.00 8 8 8 8 8 8 8 8 Chittagong “ 6.00 - - 7 7 6 7 7 7 Rajshahi “ 6.00 6 6 6 6 6 6 6 6 Khulna “ 6.00 6 - 6 6 7 7 7 7 Sylhet “ 6.00 - - 7 7 7 7 7 7 Rangpur “ 6.00 7 6 6 6 6 6 6 6 Barisal “ 6.00 6 - 6 6 8 8 8 8
25. Cigarettes Dhaka Each 58.00 100 92 98 100 100 100 100 100 Pkt of 20 Sticks Narayanganj “ 58.00 95 - 96 95 95 95 95 95 Gold Leaf Chittagong “ 57.00 - 80 98 100 100 100 100 100 Rajshahi “ 57.00 95 - 100 100 100 100 100 100 Khulna “ 57.00 100 - 100 98 98 95 98 58 Sylhet “ 53.00 - 80 98 97 97 95 97 97 Rangpur “ 54.00 94 - 98 95 95 100 95 95 Barisal “ 50.00 100 - 100 100 100 - 100 100
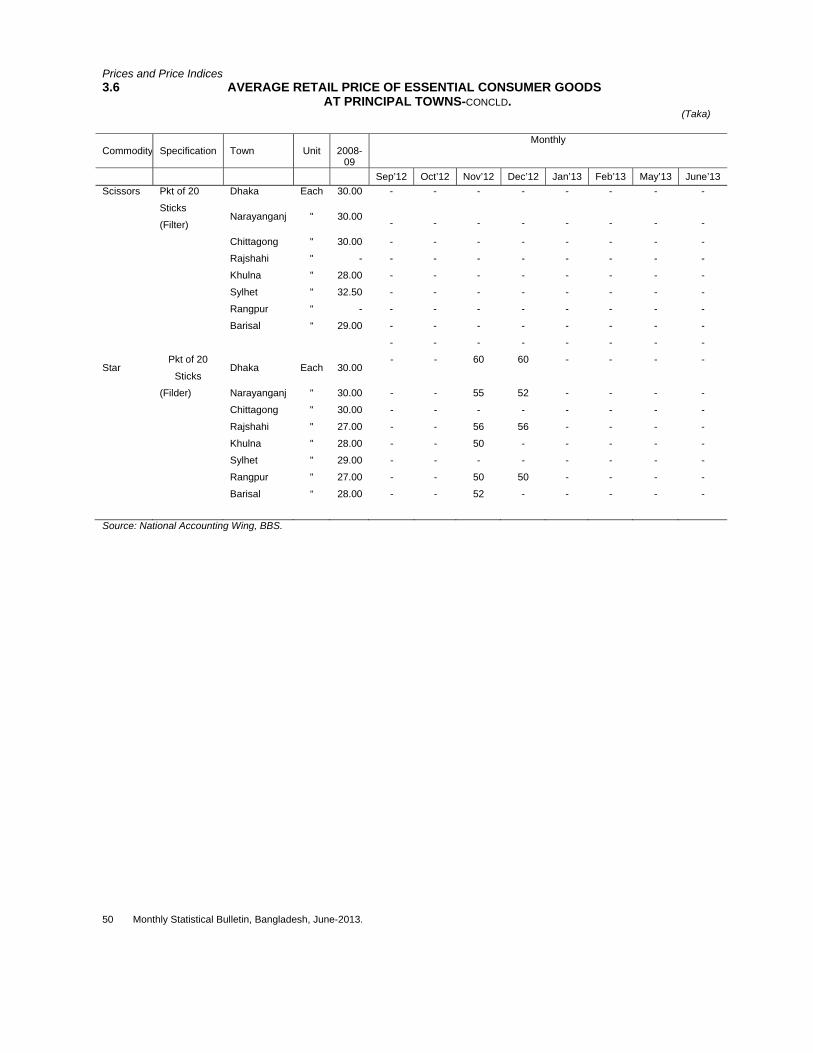
Prices and Price Indices
50 Monthly Statistical Bulletin, Bangladesh, June-2013.
3.6 AVERAGE RETAIL PRICE OF ESSENTIAL CONSUMER GOODS AT PRINCIPAL TOWNS-CONCLD. (Taka)
Commodity Specification Town Unit
2008-09
Monthly
Sep’12 Oct’12 Nov’12 Dec’12 Jan’13 Feb’13 May’13 June’13 Scissors Pkt of 20 Dhaka Each 30.00 - - - - - - - -
Sticks
(Filter) Narayanganj " 30.00 - - - - - - - -
Chittagong " 30.00 - - - - - - - -
Rajshahi " - - - - - - - - -
Khulna " 28.00 - - - - - - - -
Sylhet " 32.50 - - - - - - - -
Rangpur " - - - - - - - - -
Barisal “ 29.00 - - - - - - - -
- - - - - - - -
Star Pkt of 20
Sticks Dhaka Each 30.00
- - 60 60 - - - -
(Filder) Narayanganj " 30.00 - - 55 52 - - - -
Chittagong " 30.00 - - - - - - - -
Rajshahi " 27.00 - - 56 56 - - - -
Khulna " 28.00 - - 50 - - - - -
Sylhet " 29.00 - - - - - - - -
Rangpur " 27.00 - - 50 50 - - - -
Barisal “ 28.00 - - 52 - - - - -
Source: National Accounting Wing, BBS.

Prices and Price Indices
Monthly Statistical Bulletin, Bangladesh, June-2013. 51
3.7.A CONSUMER PRICE INDEX, NATIONAL (Base : 1995-96=100)
Period General Food,
Beverage & Tobacco
Nonfood Clothing & Footwear
Gross Rent, Fuel &
Lighting
Furniture Funishing
Household equ. & Oper.
Medical Care & Health
Expenses
Trnasport Communicatio
ns
Recreation Enterainment, Education cul.
Ser.
Misc. Goods & Services
1 2 3 4 5 6 7 8 9 10 11 2009-10
Nov 222.14 241.55 196.87 181.51 191.65 214.68 199.55 233.95 191.75 208.75
Dec 222.33 241.59 197.26 181.80 191.93 215.53 199.80 234.71 192.35 208.97
Jan 222.38 241.65 197.29 181.83 191.95 215.61 199.80 234.75 192.38 208.99Feb 222.50 241.70 197.53 182.08 192.12 216.15 199.94 235.18 192.70 209.07Mar 222.61 241.49 198.09 182.58 192.33 217.26 200.42 235.89 194.49 209.69Apr 222.49 240.48 199.31 183.46 194.05 218.81 200.86 236.62 196.00 210.20May 223.59 242.09 199.89 183.51 194.64 219.19 201.01 236.73 196.46 210.69June 226.11 246.29 199.94 183.68 194.88 220.16 201.05 237.02 196.58 210.90
2010-11 July 229.55 251.59 200.65 184.71 195.70 221.65 201.35 237.57 196.84 211.24Aug 233.31 257.44 201.46 186.82 196.29 224.45 201.42 237.85 196.98 211.45Sept 236.53 262.23 220.29 188.95 196.38 227.00 201.49 239.18 197.17 212.49Oct 238.68 265.16 203.03 189.89 196.84 228.62 201.89 240.16 197.25 214.53Nov 238.89 265.22 203.43 190.16 197.02 231.03 202.36 240.37 197.38 215.57Dec 240.75 268.19 203.71 190.39 197.34 231.54 202.38 240.72 197.49 215.87Jan 242.48 270.44 204.88 191.96 197.61 233.05 203.17 242.24 198.97 219.44Feb 244.28 272.57 206.15 193.74 198.65 234.05 204.52 244.85 199.44 220.66Mar 245.97 274.99 206.65 194.09 199.09 234.31 205.03 245.96 199.61 221.35Apr 246.24 275.02 207.23 195.10 199.33 236.42 205.36 246.66 199.83 222.22May 246.39 273.95 209.24 197.48 199.93 238.55 207.37 253.82 200.03 226.28June 249.11 277.11 211.39 199.75 200.82 240.28 207.71 260.60 200.31 231.92
2011-12 Jul 254.72 285.31 213.61 205.21 201.36 243.34 208.52 263.88 200.67 236.78Aug 259.66 290.13 219.11 219.58 206.42 248.67 209.66 266.33 201.47 239.63
Sept 264.85 298.29 220.04 220.01 207.34 250.04 210.10 269.21 201.60 240.03Oct 265.94 299.15 221.41 222.07 207.90 253.56 210.78 273.63 201.79 242.10Nov 266.55 298.29 224.16 224.95 212.24 255.40 211.45 274.64 202.19 244.37Dec 266.34 296.08 226.89 226.97 216.27 258.37 213.39 276.66 202.71 246.54Jan 270.59 299.91 231.84 229.36 224.92 262.74 216.29 278.54 203.01 250.11Feb 269.76 296.89 234.13 231.33 227.31 266.05 219.32 281.65 203.77 252.18Mar 270.81 297.77 235.50 232.09 228.35 267.68 221.58 282.68 204.35 256.38Apr 270.68 297.36 235.77 232.13 228.92 267.73 221.61 282.81 204.43 256.43May 268.93 294.39 235.85 232.15 228.96 267.84 221.65 282.88 204.52 256.76June 270.43 296.74 236.16 232.33 229.17 267.98 223.32 283.14 204.71 256.93
2012-13 Jul 275.18 303.29 238.27 235.62 232.23 269.44 224.88 283.37 204.90 257.15Aug 280.26 310.73 240.12 242.55 232...44 272.78 225.00 284.81 205.24 259.85
Sept 284.43 316.65 241.94 244.87 234.44 276.22 225.75 286.73 205.93 260.92Oct 285.14 315.80 244.57 250.13 236.09 278.28 226.95 290.90 206.37 264.77Nov 286.30 317.53 245.02 250.79 236.23 279.74 227.03 291.36 206.93 265.48Dec 286.83 317.77 246.02 253.050 236.55 281.11 227.56 292.34 207.87 266.61Jan 290.56 321.52 249.94 255.76 241.86 282.79 228.81 294.99 213.80 269.61Feb 291.00 321.65 250.79 257.51 242.55 283.86 229.67 295.80 213.96 270.45Mar 291.78 322.48 251.48 258.77 243.15 285.30 229.92 29618 214.18 271.17Apr 292.14 322.85 251.82 259.17 243.52 285.65 230.10 296.67 214.26 271.38May 290.07 319.11 252.19 260.75 243.87 286.75 230.42 298.01 214.49 171.64June 291.98 322.04 252.67 261.01 243.93 286.99 230.52 298.23 214.64 271.95
Source: National Accounting wing, BBS.

Prices and Price Indices
52 Monthly Statistical Bulletin, Bangladesh, June-2013.
3.8.A CONSUMER PRICE INDEX, RURAL (Base : 1995-96=100)
Period General Food,
Beverage & Tobacco
Nonfood Clothing & Footwear
Gross Rent, Fuel & Lighting
Furniture Funishing Household
equ. & Oper.
Medical Care & Health Expenses
Trnasport Communi cations
Recreation Enterainment, Education cul.
Ser.
Misc. Goods & Services
Weights 100.00 62.32 37.04 6.88 14.69 2.70 2.79 2.98 3.20 3.8 1 2 3 4 5 6 7 8 9 10 11
2009-10 Feb 224.49 237.11 203.06 177.99 208.12 208.48 204.02 233.55 197.52 205.19Mar 224.53 236.87 203.55 178.53 208.28 209.23 204.11 233.95 199.79 205.36Apr 224.39 235.77 205.03 179.68 210.58 210.42 204.60 234.44 201.89 205.57
May 225.58 237.43 205.44 179.73 211.35 210.87 204.79 234.52 202.16 205.72June 227.97 241.05 205.72 179.91 211.68 211.93 204.84 234.73 202.16 205.93
2010-11 July 231.78 246.70 206.42 180.78 212.78 211.98 205.09 235.19 202.40 206.12Aug 235.63 252.33 207.23 182.83 213.56 212.79 205.14 235.45 202.52 206.37
Sept 239.38 257.80 208.06 185.02 213.65 214.72 205.18 236.50 202.75 207.75Oct 242.18 261.87 208.72 186.06 214.18 214.86 205.21 237.28 202.82 209.38Nov 242.31 261.90 209.01 186.18 214.42 216.39 205.26 237.43 202.94 209.77Dec 244.30 264.85 209.37 186.47 214.87 216.96 205.26 237.85 203.06 210.14Jan 245.83 266.53 210.64 187.90 215.01 218.51 206.01 239.41 204.96 214.93Feb 247.99 269.10 212.11 189.67 216.47 219.14 207.28 242.32 205.54 216.29Mar 249.96 272.01 212.49 190.11 216.95 219.420 207.32 242.58 205.72 216.77Apr 250.18 272.04 213.02 191.36 217.24 219.61 207.64 243.10 205.98 217.54
May 250.23 270.79 215.28 194.21 218.05 221.88 210.20 250.86 206.22 221.45June 252.84 273.67 217.42 196.58 219.26 223.78 210.31 256.20 206.53 227.48
2011-12 July 257.49 280.07 219.10 201.35 219.70 224.45 210.39 257.43 206.63 231.97Aug 262.34 284.11 225.35 216.11 226.48 228.93 211.74 258.56 207.72 233.93
Sept 267.74 292.22 226.15 216.59 227.73 229.74 211.84 259.98 207.84 234.20Oct 268.84 293.14 227.53 218.32 228.49 230.26 212.10 265.74 208.04 236.34Nov 269.86 292.80 230.87 221.42 234.31 231.96 212.63 266.29 208.55 238.29Dec 269.33 290.28 233.70 223.55 238.52 234.14 214.32 268.56 209.20 240.69Jan 273.23 293.66 238.51 226.00 247.35 238.70 216.44 269.61 209.57 243.09Feb 272.28 290.75 240.89 228.19 249.94 241.41 219.79 272.3.72 210.49 244.69Mar 273.46 291.63 242.59 229.02 251.34 242.70 222.34 273.91 211.27 249.92Apr 273.22 291.12 242.78 251.74 242.74 242.75 222.36 274.08 211.34 249.96
May 271.19 287.86 242.87 229.10 251.79 242.79 222.39 274.13 211.44 250.36June 272.77 290.14 243.24 229.24 252.08 242.47 24.66 274.38 211.60 250.48
2012-13 Jul 277.33 296.42 244.87 232.79 253.85 244.24 226.29 274.60 211.76 250.68
Aug 282.29 303.24 246.67 239.81 2554.14 246.22 226.37 275.63 212.17 251.79Sept 286.33 308.58 248.50 242.42 256.08 248.08 227.07 278.00 212.99 253.03Oct 287.08 308.48 250.69 247.39 25686 249.57 228.17 281.59 213.48 257.29Nov 288.20 309.96 251.21 248.22 257.04 251.09 228.18 282.00 214.17 258.12Dec 288.65 310.06 252.27 250.75 257.46 252.24 228.73 283.07 214.96 259.53Jan 292.44 313.51 256.64 253.10 264.33 254.04 230.30 285.62 219.32 263.14Feb 292.89 313.63 257.62 254.87 265.23 255.05 230.99 286.25 219.49 264.25Mar 293.86 314.74 258.38 256.16 265.96 256.68 231.21 286.68 219.66 264.70Apr 294.23 315.12 258.72 256.52 266.41 256.95 231.35 287.02 219.75 264.91
May 291.88 311.18 259.08 258.22 266.85 257.98 231.49 287.73 219.95 265.06
June 293.75 313.90 259.50
258.38 266.92 258.13 231.57 287.80 220.12 265.32
Source: National Accounting wing, BBS.

Prices and Price Indices
Monthly Statistical Bulletin, Bangladesh, June-2013. 53
3.9.A CONSUMER PRICE INDEX, URBAN (Base : 1995-96=100)
Period General Food,
Beverage &
Tobacco Nonfood Clothing &
Footwear
Gross Rent, Fuel &
Lighting
Furniture Funishing Household
equ. & Oper.
Medical Care & Health
Expenses
Trnasport Communi
cations
Recreation Enterainment, Education
cul. Ser.
Misc. Goods & Services
100.00 62.32 37.04 6.88 14.69 2.70 2.79 2.98 3.20 3.8
1 2 3 4 5 6 7 8 9 10 112009-10
Nov 217.22 252.76 183.34 191.81 152.60 233.46 189.55 237.74 180.34 217.71Dec 217.50 252.78 183.87 192.09 153.05 234.09 189.63 238.89 180.80 218.41Jan 217.54 252.82 183.92 192.19 153.09 234.34 189.64 238.89 180.84 218.43Feb 217.64 252.89 184.05 192.22 153.16 234.84 190.02 239.15 180.96 218.51Mar 217.95 252.75 184.78 192.45 153.49 236.57 191.45 240.60 181.59 220.24Apr 217.86 251.95 185.38 192.65 153.81 239.24 191.76 241.94 181.67 221.46
May 218.75 253.45 185.68 192.73 153.94 239.45 191.81 242.12 182.59 222.81June 221.58 254.05 185.87 192.87 153.96 240.19 191.83 242.60 182.98 222.99
2010-11 July 224.12 263.50 186.59 194.29 154.10 245.19 192.25 243.37 183.37 223.71Aug 227.65 269.87 187.41 196.52 154.22 252.84 192.36 243.71 183.50 223.81Sept 229.60 273.01 188.23 198.51 154.33 256.90 192.51 245.71 183.59 224.04Oct 230.17 273.18 189.18 199.21 154.60 262.14 193.82 247.16 183.68 227.06Nov 230.56 273.29 189..84 199.85 154.66 266.68 195.29 247.53 183.83 229.69Dec 232.09 276.33 189.92 199.92 154.66 267.05 195.38 247.70 183.93 229..81Jan 234.33 279.97 190..84 201.85 155.23 268.47 196.27 249.12 184.37 230.42Feb 235.24 281.02 191.62 203.64 155.27 270.35 197.80 251.00 184.57 231.29Mar 236.2 282.23 192.42 203.78 155.60 270.57 199.45 254.19 184.73 232.50Apr 236.64 282.29 193.12 204.21 155.70 277.36 199.80 255.33 184.84 233.63
May 237.05 281.65 194.54 205.43 155.80 279.15 200.47 261.04 184.95 238.03June 240.03 285.48 196.72 207.47 155.91 280.47 201.38 271.32 185.17 242.73
2010-11 July 247.98 298.08 200.24 214.60 156.71 289.35 203.98 279.60 186.17 248.50Aug 253.14 304.79 203.91 228.03 157.57 296.74 204.58 285.26 186.26 253.50
Sept 257.82 313.06 205.17 228.35 157.70 299.49 205.85 29.70 186.39 254.23Oct 258.87 313.80 206.52 231.20 157.76 310.31 207.55 292.84 186.58 256.14Nov 258.49 311.66 207.82 233.54 158.51 312.47 208.57 294.97 186.70 259.18Dec 259.07 310.21 210.32 235.29 162.10 317.38 211.13 296.39 186.89 260.78Jan 264.17 315.13 215.60 237.55 170.29 321.30 215.91 300.30 187.03 267.20Feb 263.62 311.83 217.67 238.97 172.21 326.07 218.19 303.39 187.39 270.42Mar 264.35 312.72 218.24 239.57 172.37 328.50 219.74 304.03 187.51 272.10Apr 264.50 312.55 218.70 239.59 173.34 328.55 219.80 304.08 187.61 272.18
May 263.42 310.18 218.75 239.59 173.35 328.85 219.84 304.18 187.67 272.36June 264.73 312.81 218.91 239.85 173.37 329.14 220.05 304.46 187.92 272.65
2012-13 Jul 269.93 320.02 222.20 242.51 179.57 330.82 221.43 304.72 188.18 272.91
Aug 275.32 328.98 224.17 249.23 179.61 336.07 221.68 307.16 188.35 279.47Sept 279.82 336.31 225.98 250.84 181.74 344.74 222.53 308.00 188.74 280.13Oct 280.40 333.63 229.65 256.80 185.52 348.21 223.97 313.58 189.05 282.97Nov 281.67 335.96 229.93 257.06 185.56 349.51 224.24 314.15 189.30 283.41Dec 282.39 336.53 230.79 260.21 185.63 351.40 224.72 314.92 190.61 283.85Jan 285.99 341.02 233.53 262.23 187.15 352.80 225.17 317.81 200.35 285.37Feb 286.40 341.19 234.17 263.95 187.33 354.01 226.47 319.05 200.50 285.58Mar 286.72 341.33 234.67 265.13 187.59 355.00 226.78 319.32 200.82 286.92Apr 287.05 341.66 235.00 265.63 187.77 355.55 227.06 320.18 200.90 287.14
May 285.67 338.41 235.40 266.92 187.91 356.81 227.80 323.06 201.20 287.68June 287.86 341.86 236.03 267.42 187.93 357.28 227.98 323.63 201.29 288.09
Source: National Accounting wing, BBS.

Prices and Price Indices
54 Monthly Statistical Bulletin, Bangladesh, June-2013.
3.7.B CONSUMER PRICE INDEX, NATIONAL (Base : 2005-06=100)
Period General Food,
Beverage & Tobacco
Nonfood Clothing & Footwear
Gross Rent, Fuel &
Lighting
Furniture Furnishing
Household equ. & Oper.
Medical Care & Health
Expenses
Trnasport Communicatio
ns
Recreation Entertainment, Education cul.
Ser.
Misc. Goods & Services
1 2 3 4 5 6 7 8 9 10 11 2010-11
July’ 147.19 156.87 134.78 133.52 130.10 150.45 138.67 124.84 136.99 145.02Aug 150.00 161.36 135.42 135.37 130.37 151.55 139.47 124.82 137.70 145.09Sept 151.75 164.01 136.03 136.86 130.44 153.13 139.40 125.41 137.69 146.43Oct 154.27 167.97 136.71 137.53 130.78 154.84 141.22 125.63 138.27 146.84Nov 155.27 169.42 137.13 137.93 130.86 156.54 141.97 125.69 138.58 147.43Dec 158.22 173.74 138.33 138.62 132.24 159.11 145.85 125.71 138.61 147.79Jan 159.23 174.79 139.28 140.79 133.05 160.08 145.80 126.27 139.51 148.69Feb 160.23 175.89 140.15 142.13 133.53 160.49 147.95 127.23 140.89 148.91Mar 160.88 176.66 140.66 143.11 133.82 161.40 148.29 127.48 141.19 149.72Apr 160.80 176.21 141.05 143.76 133.94 162.59 148.36 127.71 141.52 150.30May 159.80 173.58 142.13 145.00 134.22 163.30 148.81 131.01 141.58 153.00June 161.38 175.24 143.60 146.44 134.58 164.13 148.87 137.47 141.67 154.90
2011-12 July 164.63 179.96 144.98 149.42 135.02 165.92 149.17 140.58 141.77 156.34Aug 168.06 183.76 147.93 156.92 137.14 168.07 149.41 144.62 141.92 159.41Sept 170.96 188.38 148.63 157.17 137.49 168.84 151.19 146.68 142.02 159.74Oct 171.23 188.34 149.28 158.47 17.69 170.29 151.38 147.64 142.06 160.64Nov 170.60 186.35 150.40 159.70 139.11 171.03 151.60 48.21 142.47 163.31Dec 170.27 184.62 151.87 160..75 141.86 172.42 152.06 148.78 142.70 164.34Jan 172.89 186.97 154.89 161.93 146.88 177.82 152.13 149.68 144.93 166.26Feb 171.35 183.14 156.23 163.51 148.30 179.91 154.15 150.68 145.16 167.51Mar 171.76 183.08 157..24 164.73 148.68 182.53 155.03 151.48 146.25 168.96Apr 170.83 181.15 157.60 164.86 149.27 182.68 154.96 151.48 147.54 168.99May 169.40 178.26 158.03 165.93 149.39 183.45 155.05 151.51 148.29 169.56June 170.33 179.74 158.27 166.18 149.53 183.98 155.44 151.58 148.64 169.84
2012-13 Jul 173.20 183.97 159.39 167.46 151.42 184.83 156.10 151.82 149.31 170.23Aug 176.41 187.89 161.68 173.51 151.65 187.54 158.10 154.50 150.72 174.05
Sept 179.44 191.68 16375 175.75 153.41 170.78 159.33 155.85 152.88 177.29Oct 181.26 193.07 166.12 178.97 154.70 194.43 159.58 158.39 155.31 182.35Nov 181.77 193.70 166.47 179.24 154.91 195.18 159.65 158.57 155.68 183.40Dec 182.43 194.37 167.11 180.44 155.08 196.65 159.90 159.35 156.34 184.00Jan 184.34 196.36 168.92 181.82 157.07 196.98 160.20 161.60 160.55 185.66Feb 184.79 196.78 169.42 182.65 157.39 198.21 160.49 161.86 160.89 186.13Mar 185.01 196.82 169.88 183.36 157.72 99.32 160.55 162.16 161.15 186.66Apr 185.13 196.87 170.07 183.62 157.93 199.69 160.61 162.34 161.23 186.76May 182.91 192.75 170.29 184.35 157.95 199.99 160.66 162.67 161.28 186.54June 184.04 194.58 170.53 184.73 158.13 200.38 160.72 162.95 161.47 187.08
Source: National Accounting wing, BBS.

Prices and Price Indices
Monthly Statistical Bulletin, Bangladesh, June-2013. 55
3.8.B CONSUMER PRICE INDEX, RURAL (Base : 2005-06=100)
Period General Food,
Beverage & Tobacco
Nonfood Clothing & Footwear
Gross Rent, Fuel & Lighting
Furniture Furnishing Household
equ. & Oper.
Medical Care & Health Expenses
Trnasport Communi cations
Recreation Entertainment, Education cul.
Ser.
Misc. Goods & Services
Weights 100.00 62.32 37.04 6.88 14.69 2.70 2.79 2.98 3.20 3.8 1 2 3 4 5 6 7 8 9 10 11
2010-11 July 148.45 155.58 137.10 135.41 132.50 149.16 141.16 122.83 147.95 145.79Aug 151.64 160.32 137.83 137.61 132.93 149.64 142.11 122.85 148.98 105.86
Sept 153.50 163.01 138.38 137.31 132.98 150.36 141.79 122.95 148.54 147.14Oct 156.68 167.83 138.95 140.13 133.35 51.61 142.66 123.07 148.75 148.20Nov 158.04 169.77 139.38 140.65 133.45 153.35 143.19 123.12 140.32 148.23Dec 161.61 174.90 140.48 141.67 133.71 156.26 148.41 123.13 149.35 148.44Jan 162.41 175.53 141.53 144.66 133.73 157.24 148.75 123.70 150.95 150.25Feb 163.54 176.62 142.74 146.10 134.61 157.52 151.55 124.73 153.98 150.59Mar 164.46 177.72 143.35 147.48 134.91 158.62 151.84 124.77 153.95 151.55Apr 164.36 177.36 143.68 148.25 135.08 158.94 151.81 124.99 153.99 152.30
May 163.34 174.82 145.07 149.69 135.54 159.61 152.33 129.71 154.12 155.56June 164.90 176.23 146.88 151.22 136.12 160.34 152.35 138.58 154.20 157.69
2011-12 July 167.62 179.87 148.11 153.63 136.40 161.41 152.54 142.55 154.25 158.67Aug 171.10 183.39 151.54 160.78 139.85 162.79 152.79 146.55 154.55 162.8
Sept 174.00 187.61 152.33 161.09 140.42 163.36 155.32 148.56 154.58 163.06Oct 174.32 187.76 152.92 162.08 140.75 163.57 155.43 150.03 154.63 164.10Nov 173.97 186.37 154.24 163.08 142.96 164.09 155.63 150.20 154.83 167.92Dec 173.54 184.78 155.66 164.11 145.62 165.24 156.09 150.82 154.96 169.24Jan 176.40 187.57 158.65 165.53 150.02 171.78 155.56 151.43 159.24 170.92Feb 174.32 183.25 160.42 167.52 151.33 173.32 158.88 152.41 159.46 171.94Mar 174.72 183.10 161.40 168.83 151.94 176.28 159.91 153.41 160.44 173.94Apr 173.78 181.32 161.80 169..02 152.32 176.38 159.91 153.64 162.90 174.02
May 172.19 178.53 162.09 169.30 152.34 176.78 159.92 153.66 164.30 174.70June 173.12 179.98 162.34 169.61 152.46 177.16 160.45 153.74 164.26 174.74
2012-13 July 175.73 183.62 163.20 170.76 153.58 178.14 161.13 153.82 166.11 174.85Aug 178.97 187.18 165.91 178.29 153.73 180.03 163.59 159.99 168.15 178.50
Sept 181.76 190.63 167.64 181.13 155.00 181.68 164.32 158.12 170.21 181.17Oct 183.28 191.81 169.70 184.12 155.50 184.82 164.54 160.85 173.11 185.72Nov 183.71 192.24 170.13 184.40 155.83 185.64 164.54 161.02 173.43 187.21Dec 184.24 192.74 170.11 185.29 156.09 187.10 164.86 161.46 173.54 188.14Jan 184.44 195.11 172.64 186.88 158.95 187.31 165.13 162.61 177.24 190.73Feb 186.99 195.63 173.21 187.64 159.43 188.91 165.41 162.77 177.27 191.23Mar 187.23 195.69 173.76 188.34 159.86 190.32 165.46 163.28 177.35 191.62Apr 187.34 195.75 173.96 188.57 160.15 190.64 165.50 163.40 177.44 191.72
May 184.97 191.75 174.20 189.35 160.18 190.98 165.53 163.65 177.50 191.79June 186.15 193.53 174.40 189.68 160.43 191.28 165.55 163.73 177.56 191.97
Source: National Accounting wing, BBS.

Prices and Price Indices
56 Monthly Statistical Bulletin, Bangladesh, June-2013.
3.9.B CONSUMER PRICE INDEX, URBAN (Base : 2005-06=100)
Period General Food,
Beverage &
Tobacco Nonfood Clothing &
Footwear
Gross Rent, Fuel &
Lighting
Furniture Funishing Household
equ. & Oper.
Medical Care & Health
Expenses
Trnasport Communi
cations
Recreation Enterainment, Education
cul. Ser.
Misc. Goods & Services
100.00 62.32 37.04 6.88 14.69 2.70 2.79 2.98 3.20 3.8
1 2 3 4 5 6 7 8 9 10 112010-11
Jul 144.87 160.02 131.70 189.94 127.31 152.72 134.41 127.06 125.16 144.97Aug 146.95 163.91 132.21 131.14 127.41 154.91 134.96 127.00 125.96 144.15Sept 148.51 166.45 132.91 132.19 127.49 158.00 135.30 128.11 125.97 144.93Oct 149.82 168.33 133.72 132.59 127.81 160.52 138.75 128.45 126.98 145.16Nov 150.14 168.54 134.12 132.78 127.85 162.16 139.89 128.52 126.99 146.49
Dec7 151.96 170.92 135.46 132.84 130.54 164.12 141.46 128.54 127.02 147.00Jan 153.35 172.99 136.28 133.44 132.25 165.08 140.74 129.10 127.17 146.77Feb 154.10 174.11 136.70 134.58 132.29 165.72 141.79 129.97 127.19 146.84Mar 154.27 174.06 137.06 134.80 132.56 166.27 142.21 130.48 127.42 147.48Apr 154.23 173.41 137.54 135.23 132.63 169.00 142.45 130.70 128.06 147.83
May 153.26 170.56 138.21 136.09 132.69 169.79 142.78 132.44 128.05 149.84June 154.85 172.83 139.22 137.36 132.79 170.80 142.91 186.24 128.15 151.44
2011-12 July 159.11 180.16 140.79 141.41 133.43 173.86 143.42 138.40 128.31 153.46Aug 162.44 184.64 143.12 149.59 133.99 177.36 143.62 142.49 128.31 155.16Sept 165.35 190.27 143.68 149.74 134.09 178.48 144.11 144.60 128.48 155.64Oct 165.51 189.77 144.42 151.63 134.14 182.11 144.46 145.00 128.49 156.35Nov 164.36 186.31 145.27 153.28 134.66 183.24 144.70 146.03 129.14 157.62Dec 164.22 184.23 146.82 154.37 137.50 185.04 145.18 146.53 129.47 158.29Jan 166.40 185.50 149.79 155.10 143.24 188.45 146.26 147.75 129.48 160.50Feb 165.85 182.88 151.04 155.89 144.78 191.48 146.06 148.78 129.73 162.06Mar 166.28 183.05 151.69 156.96 144.90 193.52 146.60 149.12 130.93 162.81Apr 165.38 180.76 152.01 156.96 145.73 193.77 146.49 149.11 130.96 162.78
May 16.24 177.61 152.61 159.51 145.97 195.17 146.72 149.14 130.99 163.22June 165.16 179.33 152.83 159.66 146.13 195.97 146.87 149.19 131.02 163.79
2012-13 July 168.52 184.88 154.29 161.18 148.93 196.60 147.49 149.61 131.18 164.53Aug 171.67 189.64 156.04 164.44 149.24 200.78 148.71 151.75 131.91 168.56
Sept 175.16 194.24 158.57 165.54 151.57 211.33 150.78 153.34 134.19 172.49
Oct 177.53 196.13 161.35 169.21 153.77 211.95 151.10 155.69 136.10 178.18Nov 178.19 197.27 161.59 169.44 153.84 213.46 151.27 155.87 136.53 178.70Dec 179.07 198.33 162.31 171.25 153.91 213.98 151.41 157.01 137.78 178.96Jan 180.43 199.42 163.95 172.21 154.90 213.98 151.77 160.48 142.53 179.41Feb 180.72 199.53 164.36 173.16 155.04 214.58 152.08 160.85 143.21 179.83Mar 180.92 199.57 164.70 173.91 155.20 215.14 152.15 160.91 143.67 180.54Apr 181.03 199.59 164.89 174.21 155.35 215.60 152.23 161.17 143.74 180.64
May 179.08 195.18 165.08 174.84 155.37 215.83 152.33 161.58 143.79 180.74June 180.16 197.16 165.37 175.31 155.48 216.34 152.45 162.09 144.11 181.04
Source: National Accounting wing, BBS.

Prices and Price Indices
Monthly Statistical Bulletin, Bangladesh, June-2013. 57
3.10 CONSTRUCTION MATERIALS, PRICE INDICES IN BANGLADESH (Base: 1998-99=100)
Item YEAR MONTHLY
2009-10 Oct’12 Nov’12 Dec‘12 Jan’13 Feb’13 Mar’13 Apr’13 May’13 June’13 Bangladesh
Building materials 263.91 287.67 290.71 293.57 301.48 305.33 308.83 312.38 316.54 326.91
Labour charges 348.29 425.24 431.10 437.51 442.96 448.94 453.95 459.18 465.12 471.03
Transport charges 1399..65 1618.34 1628.11 1638.75 1649.09 1656.31 1664.50 1671.06 1662.00 1680.28
General index 310.28 350.47 354.18 357.69 365.20 369.61 373.55 377.51 382.09 391.57
Barisal
Building materials 255.46 278.29 280.93 283.53 292.13 296.16 300.20 304.16 308.93 312.91
Labour charges 448.77 521.89 524.43 530.77 533.44 536.12 538.79 541.46 544.13 548.48
Transport charges 1329.96 1522.21 1530.38 1538.54 1553.08 1567.63 1582.17 1590.71 1599.25 1605.39
General index 330.03 368.95 371.74 375.32 382.80 386.86 390.91 394.73 399.15 403.27
Dhaka
Building materials 272.99 293.65 295.96 298.33 300.76 303.93 305.86 308.13 313.50 312.04
Labour charges 276.42 345.96 347.81 349.24 353.73 358.72 363.28 367.43 374.02 378.16
Transport charges 1164.21 1499.05 1514.67 1523.75 1535.49 1555.20 1568.07 1581.98 1595.13 1903.86
General index 298.33 337.05 339.64 342.02 345.10 349.07 351.81 354.76 360.58 360.47
Chittagong
Building materials 279.52 309.53 315.23 319.02 322.87 326.36 329.86 331.10 333.40 334.57
Labour charges 257.23 314.66 317.81 319.36 323.07 326.58 330.33 333.65 338.29 341.80
Transport charges 1900.79 2295.51 2302.74 2314.38 2322.86 2324.90 2328.85 2332.80 2338.70 2343.90
General index 320.60 366.13 371.38 374.46 378.91 382.36 385.92 387.64 390.49 392.23
Khulna
Building materials 258.31 276.47 279.56 282.85 296.21 300.66 303.98 308.93 313.37 318.14
Labour charges 356.28 441.81 449.27 457.19 463.46 469.72 475.99 482.26 490.10 496.06
Transport charges 1400.91 1617.85 1632.96 1648.06 1656.14 1664.23 1672.31 1680.39 1680.94 1684.54
General index 312.08 350.03 354.37 358.97 370.71 375.65 379.71 385.03 390.06 395.04
Rajshahi
Building materials 265.86 285.49 287.81 290.47 299.22 301.81 305.43 309.14 312.77 361.85
Labour charges 337.82 433.32 444.53 453.79 460.49 466.52 472.88 478.91 485.61 493.46
Transport charges 1286.08 1516.13 1530.29 1544.46 1558.54 1566.96 1575.38 1581.54 1585.46 4590.49
General index 304.66 342.96 346.96 351.25 359.77 363.11 367.34 371.51 375.69 416.43
Sylhet
Building materials 251.30 282.56 284.94 287.19 297.71 303.03 307.67 312.82 317.29 321.93
Labour charges 341.34 414.52 420.49 426.45 434.32 445.78 451.74 459.61 467.48 475.34
Transport charges 1080.50 1139.98 1144.20 1148.33 1154.81 1157.85 1163.81 1169.86 1172.51 1177.08
General index 295.97 337.72 340.98 344.14 353.93 360.60 365.59 371.39 376.59 381.8
Source: Price & Wages Section, National Accounting Wing, BBS

Prices and Price Indices
58 Monthly Statistical Bulletin, Bangladesh, June-2013.
3.11 INDEX OF WHOLESALE PRICES OF AGRICULTURAL AND INDUSTRIAL PRODUCTS, DHAKA
(Base : 1969-70=100) Agricultural Products Industrial Products
Period Food Raw materials
Fuel Total Food Raw materials
Fuel & Lighting
Manufacturing Total All groups
Weight 41.08 25.94 0.85 67.87 7.96 6.38 6.16 11.63 32.13 100.00
2005-06
Jul 2150 2126 2624 2146 2007 1458 2810 1374 1822 2042
Aug 2162 2128 2628 2155 2002 1458 2929 1378 1848 2056
Sep 2162 2128 2628 2155 2002 1458 2929 1378 1848 2056
Oct 2251 2129 2628 2209 2139 1458 3441 1405 1986 2138
Nov 2241 2134 2634 2005 2153 1458 3441 1403 1989 2195
Dec 2257 2150 2639 2221 2192 1456 3476 1404 2007 2152
Jan 2280 2194 2645 2232 2227 1455 3481 1397 2013 2162
Feb 2247 2194 2645 2232 2227 1453 3481 1397 2014 2162
Mar 2321 2202 2649 2280 2260 1488 3485 1419 2037 2203
Apr 2366 2221 2655 2314 2301 1512 3497 1458 2069 2235
May 2459 2236 2660 2376 2353 1512 3497 1509 2100 2287
Jun 2525 2251 2660 2422 2377 1521 3863 1515 2180 2344
2006-07
Jul 2618.79 2246.77 2660.00 2477.12 2289.17 1527.29 3966.03 1523.87 2177.62 2380.89
Aug 2633.41 2248.89 2664.05 2486.83 2283.47 1527.29 4133.99 1528.31 2210.00 2397.28
Sep 2633.41 2248.89 2664.05 2486.83 2283.47 1527.29 4133.99 1528.31 2210.00 2397.88
Oct 2741.81 2249.94 2664.05 2552.84 2439.73 1527.29 4856.63 1558.25 2398.00 2503.09
Nov 2729.63 2255.23 2670.14 2547.57 2455.70 1527.29 4856.63 1556.07 2401.16 2500.53
Dec 2749.12 2272.14 2675.21 2565.89 2500.18 1525.19 4906.02 1557.14 2421.64 2519.54
Jan 2777.13 2318.64 2681.29 2600.70 2540.11 1524.14 4913.08 1549.38 2429.89 2545.81
Feb 2736.94 2318.64 2681.29 2576.37 2540.11 1522.05 4913.08 1549.38 2429.47 2529.17
Mar 2827.307 2327.09 2685.34 2634.20 2577.74 1558.71 4918.73 1573.78 2455.91 2576.92
Apr 2881.89 2347.17 2691.43 2675.13 2624.51 1583.85 4935.66 1617.04 2491.26 2616.05
May 2995.16 2363.02 2696.49 2749.82 2683.82 1583.85 4935.66 1673.60 2526.25 2677.99
Jun 3075.55 2378.87 2696.49 2804.54 2711.19 1593.28 5452.24 1680.25 2636.33 2750.49
2007-08
Jul 3077.04 2374.41 2696.49 2803.73 2611.02 1599.86 5597.66 1690.09 2644.23 2752.48
Aug 3191.33 2376.64 2700.60 2873.81 2604.52 1599.86 5834.71 1695.01 2689.83 2814.70
Sep 3209.15 2376.64 2700.60 2884.59 2604.52 1599.86 5834.71 1695.01 2689.83 2822.02
Oct 3209.15 2377.76 2700.60 2885.02 2782.75 1599.86 6854.64 1728.22 2941.45 2903.15
Nov 3341.25 2383.34 2706.77 2967.19 2800.96 1599.86 6854.64 1725.76 2945.08 2960.09
Dec 3326.41 2401.21 2711.91 2965.10 2851.70 1597.67 6924.36 1726.99 2971.02 2967.00
Jan 3350.16 2450.35 2718.07 2998.33 2897.23 1596.57 6934.32 1718.38 2980.90 2992.73
Feb 3384.30 2450.35 2718.07 3019.00 2897.23 1594.38 6934.32 1718.38 2980.47 3006.62
Mar 3335.31 2459.29 2722.18 2992.82 2940.16 1632.78 6942.29 1745.45 3009.97 2998.33
Apr 3445.16 2480.51 2728.35 3067.49 2993.50 1659.12 6966.19 1793.42 3050.21 3061.94
May 3511.95 2497.26 2733.49 3114.39 3061.15 1659.12 6966.19 1856.15 3089.48 3106.38
Jun 3649.99 25140.01 2733.49 3204.34 3092.37 1668.99 7695.28 1863.53 3241.61 3216.32

Prices and Price Indices
Monthly Statistical Bulletin, Bangladesh, June-2013. 59
3.11 INDEX OF WHOLESALE PRICES OF AGRICULTURAL AND INDUSTRIAL PRODUCTS, DHAKA
(Base : 1969-70=100) Agricultural Products Industrial Products
Period Food Raw materials
Fuel Total Food Raw materials
Fuel & Lighting
Manufacturing Total All groups
Weight 41.08 25.94 0.85 67.87 7.96 6.38 6.16 11.63 32.13 100.00
2008-09
Nov 3910.76 2518.73 2743.91 3364.11 3194.76 1675.89 9674.63 1914.01 3665.94 3461.09 Dec 4071.75 2537.62 2749.11 3468.84 3252.63 1673.59 9773.04 1915.37 3699.18 3542.85 Jan 4053.66 2589.55 2755.36 3477.81 3304.57 1672.44 9787.09 1905.82 3711.08 3552.76 Feb 4082.60 2589.55 2755.36 3495.33 3304.57 1670.14 9787.09 1905.82 3710.63 3564.51 Mar 4124.20 2598.99 2759.53 3524.18 3353.53 1710.37 9798.34 1935.83 3743.67 3594.70 Apr 4064.51 2621.42 2765.78 3496.69 3414.37 1737.96 9832.08 1989.04 3789.79 3590.86 May 4198.37 2639.12 2770.99 3584.55 3491.53 1737.96 9832.08 2058.61 3833.87 3664.65 Jun 4279.77 2656.83 2770.99 3640.58 3527.15 1748.30 10861.12 2066.80 4044.97 3664.51
2009-10 Jul 4565.17 2651.84 2770.99 3811.42 3396.83 1755.53 11150.80 2078.90 4074.00 3670.79 Aug 4567.38 2654.33 2775.21 3813.76 3388.36 1755.53 11623.02 2084.96 4164.61 3675.49 Sep 4737.03 2654.33 2775.21 3916.45 3388.36 1755.53 11623.02 2084.96 4164.61 3996.18 Oct 4763.47 2655.58 2775.21 3932.93 3620.23 1755.53 13654.77 2125.81 4626.25 4155.69 Nov 4763.47 2661.82 2781.55 3935.39 3643.93 1755.53 13654.77 2122.78 4631.03 4158.90 Dec 4959.56 2681.77 2786.83 4061.77 3709.94 1753.12 13793.66 2124.30 4674.08 4258.51 Jan 4937.52 2736.66 2793.17 4069.49 3769.17 1751.92 13813.50 2113.70 4688.52 4282.39 Feb 4972.78 2736.66 2793.17 4090.83 3769.17 1749.51 13813.50 2113.70 4688.04 4282.71 Mar 5023.45 2746.63 2797.39 4125.37 3825.03 1791.65 13829.37 2146.99 4725.23 4418.11 Apr 4950.74 2770.33 4090.50 4090.50 3894.42 1820.55 13876.99 2206.00 4778.47 4511.54 May 5113.79 2789.04 2809.01 4196.40 3982.43 1820.55 13876.99 2283.16 4827.96 4549.32 Jun 5212.93 2807.75 2809.01 4263.56 4023.05 1831.38 15329.37 2292.24 5121.88 4575.34
2010-11 Jul 5212.93 2802.48 2809.01 4261.55 3874.40 1838.95 15738.23 2305.67 51.69.77 4653.36 Aug 5560.57 2805.12 2813.29 4473.03 3864.75 1838.95 16404.72 2312.38 5297.56 4737.95 Sep 5563.25 2805.12 2813.29 4474.65 3864.75 1838.95 16404.72 2312.38 5297.56 4739.05 Oct 5769.90 2806.44 2813.29 4600.23 4129.22 1838.95 19272.33 2357.69 5929.13 5027.20 Nov 5802.10 2813.03 2819.71 4622.32 4156.25 1838.95 19272.33 2354.33 5934.62 5043.95 Dec 5802.10 2834.12 2825.06 4630.45 4231.53 1836.43 19468.36 2356.01 5990.95 5067.58 Jan 6040.95 2892.12 2831.49 4797.27 4299.10 1835.17 19496.36 2344.26 6008.59 5186.47 Feb 6014.11 2892.12 2831.49 4781.02 4299.10 1832.65 19496.36 2344.26 6008.09 5195.28 Mar 6057.05 2902.66 2835.77 4811.10 4362.80 1876.79 19518.77 2381.18 6050.18 5209.22 Apr 6118.77 2927.71 2842.19 4858.11 4441.95 1907.06 19585.97 2446.62 6112.17 5261.04 May 6030.21 2947.48 2847.55 4812.13 4542.34 1907.06 19585.97 2532.21 6167.76 5247.69 Jun 6228.80 2967.26 2847.55 4939.89 458867 1918.41 21635.86 2542.27 6578.11 5466.25
2011-12 Jul 6349.57 2961.68 2847.55 5050.78 4419.12 1926.34 22212.93 2557.16 6653.66 5565.79 Aug 6349.57 2964.47 2851.89 5071.97 4408.11 1926.34 23153.62 2564.61 6833.95 5638.09 Sep 6773.00 2964.47 2851.89 5071.97 4408.11 1926.34 23153.62 2564.61 6833.98 5698.09 Oct 6776.27 2965.86 285.89 5199.06 4709.77 1926.34 27200.95 2614.86 7702.68 6103.47 Nov 7027.97 2972.83 2858.40 4718.93 4740.59 1926.34 27200.95 2611.13 7708.98 6110.49 Dec 7067.20 2995.12 2863.82 5227.30 4826.47 1923.70 27477.63 2613.00 7783.44 6125.69 Jan 7067.20 3056.41 2870.33 5253.19 4903.53 1922.38 27517.15 2599.97 7805.17 6135.77 Feb 7358.12 3056.41 2870.33 5253.19 4903.53 1919.73 27517.15 2599.97 7804.65 6153.47 Mar 7325.44 3067.56 2874.68 5356.16 4976.19 1965.98 27548.77 2640.91 7852.59 6165.05 Apr 7377.74 3094.03 2881.19 5446.19 5066.47 1997.69 27643.63 2713.50 7925.48 6242.78 May 7452.92 3114.92 2886.61 5592.11 5180.97 1997.69 27643.63 2808.41 7987.91 6361.88 Jun 7345.05 3135.82 2886.61 5700.37 5233.81 2009.58 30536.85 2819.58 8562.06 6619.83

Prices and Price Indices
60 Monthly Statistical Bulletin, Bangladesh, June-2013.
3.12 BUILDING MATERIAL PRICE INDEX IN BANGLADESH (BASE: 1998-99=100 AND 1969-70=100)
Building materials Labour charges Transport charges General Index YEAR Base:
1998-99=100 Index
Base: 1969-
70=100 Index
Base: 1998-
99=100 Index
Base: 1969-
70=100 Index
Base: 1998-99=100 Index
Base: 1969-70=100 Index
Base: 1998-
99=100 Index
Base: 1969-70=100 Index
2008-09 Mar 203.09 3416.30 235.05 4201.55 519.91 11991.86 213.74 3756.15 Apr 205.31 3453.64 244.76 4375.12 527.97 12177.76 218.92 3847.18 May 207.32 3487.45 224.89 4019.94 563.44 12995.89 221.55 3893.40 June 207.54 3491.15 225.08 4023.33 581.92 13422.13 222.40 3908.33
2009-10 July 206.64 3476.01 229.54 4103.06 597.28 13776.41 223.23 3922.92 Aug 204.70 3443.38 235.87 4216.21 573.21 13530.77 222.45 3909.21 Sep 205.17 3451.29 236.87 4234.08 586.63 13221.23 222.63 3912.38 Oct 206.45 3439.17 237.55 4246.24 562.41 12972.13 221.87 3899.02 Nov 206.02 3465.58 238.83 4269.12 557.87 12867.41 223.24 3923.10 Dec 206.15 3467.77 238.06 4255.35 551.57 12722.10 222.98 3918.53 Jan 207.30 3487.12 239.31 4277.70 545.52 12582.56 223.68 3930.83 Feb 207.44 3490.14 239.96 4289.32 545.52 12589.48 224.09 3952.09 Mar 208.12 3500.91 250.00 4468.78 569.29 13130.82 225.00 3954.03 Apr 208.90 3514.03 251.14 4489.16 570.89 13167.72 225.85 3968.96 May 208.97 3532.03 251.80 4500.96 571.19 13174.64 226.03 3972.13 June 209.48 3523.79 252.34 4510.61 571.68 13185.94 226.54 3981.09
2010-11 July 211.88 3564.16 257.96 4611.07 637.40 14701.79 231.02 4059.82 Aug 212.44 3573.58 259.47 4638.06 637.51 14704.33 231.15 4062.10 Sep 219.27 3688.47 269.83 4823.25 687.30 15852.75 240.62 4228.52 Oct 220.95 3716.73 271.71 4856.85 703.16 16218.56 242.69 4264.90 Nov 222.71 3746.34 272.48 4870.62 703.27 16221.10 244.33 4293.72 Dec 224.59 3777.96 274.32 4903.51 707.29 16313.82 246.31 4328.52 Jan 232.36 3908.66 277.37 4958.02 802.00 18496.33 255.46 4489.31 Feb 234.62 3946.68 278.50 4978.22 882.41 20353.01 259.71 4564.00 Mar 240.09 4038.69 289.29 5171.10 1008.29 23256.46 269.57 4737.27 Apr 245.16 4123.98 301.55 5390.25 1106.14 25513.40 278.28 4890.34 May 249.00 4188.58 313.03 5595.45 1076.34 24826.05 286.14 5028.47 June 252.44 4246.44 325.54 5819.07 1174.81 27097.29 293.32 5154.64
2011-12 July 256.16 4309.02 333.56 5962.43 1328.29 30637.34 299.29 5259.56 Aug 259.00 4356.79 341.86 6110.79 1359.42 31355.37 304.05 5343.21 Sep 263.91 4439.39 348.29 6225.73 1399.65 32283.28 310.28 5452.69 Oct 267.29 4496.24 354.45 6335.84 1437.74 33161.84 315.24 5539.85 Nov 268.55 4517.49 361.82 6467.49 1335.24 30797.70 319.08 5607.38 Dec 270.00 4541.86 369.01 6596.11 1364.44 31471.21 322.60 5669.12 Jan 271.00 4558.68 375.97 6720.56 1535.27 35411.28 325.29 5716.54 Feb 271.89 4573.63 382.71 6840.91 1547.63 35696.37 327.76 5759.89 Mar 272.34 4581.19 386.80 6914.10 1557.45 35922.98 329.31 5787.11 Apr 273.12 4594.31 391.41 6996.50 1567.87 36163.32 331.15 5819.45 May 273.89 4607.26 396.27 7082.31 1593.66 36758.17 333.07 5853.19 June 274.42 4616.18 402.13 7188.13 1597.71 36851.58 334.98 5886.75
2012-13 July 278.39 4682.96 407.70 7287.69 1589.72 36667.69 339.26 5961.97
August 281.69 4738.47 413.88 7398.16 1600.46 36915.01 343.32 6033.32 Sep 284.89 4792.35 419.44 7497.55 1609.81 37130.77 347.01 6098.17 Oct 287.67 4839.00 425.24 7601.20 1618.34 37327.31 350.47 6159.04 Nov 290.74 4890.71 431.1 7705.97 1628.21 37555.07 354.18 6224.16 Dec 293.57 4938.31 437.51 7820.55 1638.75 37798.18 357.78 6287.43 Jan 301.48 5071.42 442.96 7917.89 1649.09 38036.59 365.20 6417.89 Feb 305.33 5136.07 448.94 8024.93 1656.31 38203.25 369.61 6495.30 Mar 308.83 5195.04 453.95 8114.38 1664.50 38392.19 373.55 6564.49 Apr 312.38 5254.70 459.18 8207.88 1671.06 38543.47 377.51 6634.14 May 316.54 5324.74 465.12 8314.08 1662.00 38334.40 382.09 6714.69 June 326.91 5499.09 471.03 8419.67 1680.28 38756.10 391.57 6881.25
Source : Price & Wages Section, National Accounting Wing, BBS

Prices and Price Indices
Monthly Statistical Bulletin, Bangladesh, June-2013. 61
3.13 RETAIL PRICE OF GOLD AND SILVER IN DHAKA
(Taka/gram)
Period Gold (pure) Guinea Gold Silver Bar
2009-10
Nov 2636.00 2426.00 78.00 Dec - 2785.00 80.00 Jan 3067.78 2862.33 64.25 Feb 3100.00 2875.00 65.00 Mar 3100.00 2950.00 68.00 Apr 3250.00 3100.00 68.00 May - - 52.00 June - 3100.00 60.00
2010-11
July 3300.00 - 68.00 Aug 3300.00 2900.00 58.00 Sep 3300.00 3050.00 58.00 Oct 3350.00 3200.00 60.00 Nov 3350.00 3350.00 58.00 Dec 4000.00 3850.00 60.00 Jan - 3557.00 62.00 Feb - - 64.00 Mar - - 80.00 Apr - - 61.00 May - 3822.00 61.00 June - 3824.00 67.00
2011-12
July - 4050 70 Aug - 4180.00 80.00
Sep-11 - 4100.00 -Oct-11 - 4455.00 94.00 Nov-11 - 4352.00 92.00 Dec-11 - - -
Jan 4562.00 5000.00 100.00 Feb 4730.00 4950.00 135.00 Mar 4625.00 5200.00 106.42 Apr 4675.42 5250.00 106.42 May 4650.00 5550.00 1070.15 June 4640.00 5550.00 107.28
2012-13
July 4680 5490 130.00 Aug 4931 5500 138.00 Sep 5201.00 6150 125.00 Oct 5100.00 6000 135.00 Nov - 5100 135 Dec - 5100 135 Jan - 5100 130 Feb - 5100 140 Mar 5150 5465 150 Apr 5100 5470 150
May’13 5000 5470 150 June’13 5100 - 150 Source: National Accounting Wing, BBS

Prices and Price Indices
62 Monthly Statistical Bulletin, Bangladesh, June-2013.
3.14 HOUSE RENT INDICES OF VARIOUS CATEGORIES OF PRIVATE RESIDENTIAL HOUSES AT DIFFERENT CENTRES
(Base: 1973-74=100)
Sl. Area Income Year Quarter Ending No. of House (sft) level by Group 2010-11 2011-12 Sep’12 Dec’12 Mar’13 June’13
Dhaka
1. 1401-1800 Higher Income
1149.08 1222.68 1248.15 1235.55 1262.00 1268.51
2. 1200-1400 1250.00 1334.12 1393.65 1396.82 1402.12 1406.343 1000-1199 930.56 1036.11 1111.11 1111.11 1122.22 1227.774. 800-999 975.38 1197.62 135.76 1325.76 1363.64 1372.72
5. 600-799 Middle Income
1587.50 1833.50 2066.00 2100.00 2133.00 2166.00
6. 400-599 1741.07 2098.44 2321.88 2321.88 2366.70 2409.377 250-399 2022.79 2492.60 2848.15 2905.56 2962.96 2990.748. 600-799 1898.10 2380.76 2797.44 2864.10 2930.36 2994.879. 600-799 1670.55 2127.88 2393.75 2426.56 2460.11 2492.18 10 400-599 Lower Income 1960.40 2358.03 2639.29 2639.29 2717.39 2755.3511. 600- 1982.59 2514.77 2902.27 2902.27 2998.07 3045.4512. 400-599 2479.62 3209.37 3803.13 3940.62 4008.15 4075.0013. 240-399 3023.52 4647.37 5821.05 5821.05 6002.24 6110.5214. 240-below 3781.51 5588.23 6723.67 6723.53 7058.82 7223.5215. 125-160 9372.18 11294.44 12644.44 1300.00 13550.14 14000.0016. 100 below 11562.50 15000.00 16250.00 16250.00 16875.00 17500.00 Average 3002.67 3770.99 4268.10 4317.71 4450.79 4558.61 Chittagong
1. 1401-1800 Higher Income
844.57 910.87 954.35 958.70 961.18 963.04
2. 1200-1400 8777.56 961.73 1051.02 1057.14 1062.22 1065.303. 1000-1199 780.64 900.00 993.55 1000.00 1006.45 1012.904. 800-999 1118.41 1338.16 1535.09 1535.09 1557.02 1566.66
5. 600-799 Middle Income
1441.87 1738.95 1920.93 1960.46 1991.16 2009.30
6. 400-599 1590.00 2038.75 2410.00 2436.67 2461.53 1486.66 250-399 1646.1 2130.31 2417.02 2478.72 2514.51 2538.297. 600-799 1976.43 2465.71 2897.14 2934.29 2974.56 3011.428. 600-799 1865.95 2367.24 2694.83 2732.76 2770.94 2808.62
10 400-599 Lower Income 2247.02 2862.50 3314.29 3366.67 3395.62 3414.2811. 600- 1703.36 2215.38 2507.69 2592.31 2646.32 2675.0012 400-599 2460.94 3225.00 3721.88 3790.62 3829.79 3881.2513. 240-399 2503.45 3165.51 3720.69 3793.16 3848.91 3903.4414. 240-below 4160.87 4843.48 5465.22 5591.30 5677.02 5760.86 Average 1801.28 2225.97 2543.12 2587.70 2621.16 37097.02

Prices and Price Indices
Monthly Statistical Bulletin, Bangladesh, June-2013. 63
3.14 HOUSE RENT INDICES OF VARIOUS CATEGORIES OF PRIVATE RESIDENTIAL HOUSES AT DIFFERENT CENTRES—CONTD.
(Base: 1973-74=100)
Sl. Area Income Year Quarter Ending No. of House (sft) level by Group 2010-11 2011-12 Sep’12 Dec’12 Mar’13 June’13
Rajshahi
1. 1401-1800 Higher Income
1786.67 2119.26 2368.18 2368.18 2446.34 2445.45
2. 1200-1400 1856.67 2320.83 2523.33 2546.67 2561.91 2600.003 1000-1199 4. 800-999
5. 600-799 Middle Income
1845.16 2205.64 2461.29 2461.29 2503.61 2512.90
6. 400-599 2033.50 2550.00 2866.00 2900.00 2933.33 2946.007 250-399 2206.62 2941.17 3388.24 3388.24 3431.37 3429.418. 600-799 3044.57 4113.04 4682.61 4747.83 4869.57 5417.399. 600-799 1654.91 2291.52 2630.36 2630.36 2634.52 2692..85 10 400-599 Lower Income 2154.88 2785.97 3153.66 3207.32 3259.04 3278.0411. 600- 2284.56 3066.17 3502.94 3429.41 3692.12 3752.9412. 400-599 2060.34 2775.78 3190.63 3259.38 3351.06 3456.2513. 240-399 2466.67 2970.83 3287.50 3108.33 3106.73 3104.1614. 240-below 4927.28 5054.55 5054.55 5054.55 5050.51 5045.45 Average 2360.20 2932.93 3259.11 3275.13 3325.01 3390.07 Khulna
1. 1401-1800 Higher Income
760.90 850.69 912.82 912.82 954.87 943.58
2. 1200-1400 735.72 861.90 966.67 966.67 988.46 990.473. 1000-1199 1006.43 1098.57 1168.57 1180.00 1192.55 1254.284. 800-999 1246.51 1387.21 1462.79 1479.07 1495.02 1593.02
5. 600-799 Middle Income
1231.98 1453.49 1604.65 1644.19 1672.01 1623.25
6. 400-599 1140.44 1395.22 1550.00 1572.06 1594.61 1616.17 250-399 1335.46 1563.18 1818.18 1818.18 1860.80 1901.817. 600-799 1396.67 1650.00 1884.44 1920.00 2020.20 2053.338. 600-799 892.70 1148.59 1248.31 1273.03 1298.38 1348.31
10 400-599 Lower Income 1509.72 1650.92 1851.85 1892.59 1932.37 2011.1111. 600- 1121.10 1376.17 1495.31 1495.91 1562.50 1595.3112 400-599 1410.47 1670.35 1881.40 1930.23 2081.80 2076.7413. 240-399 1221.32 1252.97 1374.47 1438.24 1376.72 1376.4714. 240-below 1186.36 1333.33 1333.33 1415.15 1332.01 1330.30 Average 1156.84 1336.58 1468.20 1495.37 1520.73 1551.01

Prices and Price Indices
64 Monthly Statistical Bulletin, Bangladesh, June-2013.
3.15 HOUSE RENT INDICES OF VARIOUS CATEGORIES OF PRIVATE RESIDENTIAL HOUSES, BANGLADESH
(Base: 1973-74=100) Sl. No. Centre 2010-11 2011-12
Quarter Ending
Sep’12 Dec’12 Mar’13 June’13 1. Dhaka 3002.67 3770.99 4268.10 4317.71 4450.79 4558.61 2. Chittagong 1801.28 2225.97 2543.12 2587.70 2621.16 37097.20 3. Khulna 1156.84 1336.58 1468.20 1495.67 1520.73 1551.01 4. Rajshahi 2360.20 2932.93 3259.11 3275.13 3325.01 3390.07 Bangladesh 2080.25 2566.61 2884.63 2918.97 2979.42 3052.65 Notes: 1. Upto 1987-88 the index of Bangladesh is the average of 6 centres, viz. Dhaka, Chittagong, Khulna, Rajshahi, Rangpur
and Sylhet. Since Jul-Sept '88 quarter, the index of Bangladesh is the average of 4 centres, viz. Dhaka, Chittagong, Khulna and Rajshahi.
2. (i) House at Sl. 1 refers to pucca house having 3 bed rooms with attached baths, drawing-cum-dining room,
kitchen, pantry, garage provided with gas electricity and water connection. (ii) House at Sl. 2 refers to pucca house having two bed rooms with attached baths, drawing-cum-dining room
kitchen, pantry, garage and servant quarters provided with gas, electricity and water connection. (iii) House at Sl. 3 refers to pucca house having 2 bed rooms with attached baths, drawing-cum-dining, room
kitchen, pantry, garage and servant room provided with gas, electricity and water connection. (iv) House at Sl. 4 refers to pucca house having two rooms with attached baths, drawing-cum-dining room kitchen
and store room provided with gas, electricity and water connection. (v) House at Sl. 5 refers to pucca house having 2 rooms with one bath, kitchen and store room provided with gas,
electricity and water connection. (vi) House at Sl. 6 refers to pucca house having 2 rooms with one bath, kitchen and store provided with gas
electricity and water connection. (vii) House at Sl. 7 refers to semi-pucca house having 2 rooms, one bath room, kitchen and store provided with gas,
electricity and water connection. (viii) House at Sl. 8 refers to semi-pucca house having 2 rooms, one bath room, kitchen and store without any
ammenities. (ix) House at Sl. 9 refers to pucca house having 2 rooms, one bath and kitchen provided with gas, electricity and
water connection. (x) House at Sl. 10 refers to pucca house having 2 rooms, one bath room and kitchen without any ammenities. (xi) House at Sl. 11 refers to semi-pucca house having 2 rooms one bath room and kitchen with gas, electricity and
water connection. (xii) House at Sl. 12 refers to semi-pucca house having 2 rooms, one bath room and kitchen without any
ammenities. (xiii) House at Sl. 13 refers to katcha house having 2 rooms one bath room and kitchen without any ammenities.
(xiv) House at Sl. 14 refers to katcha house having one room and one bath room without any ammenities. Note: The schedule of Household Rent Index (HRI) for data collection has been revised. So the table no 3.14 & 3.15 has been revised
accordingly. Source: National Accounting Wing, BBS

Food and Agriculture
Monthly Statistical Bulletin, Bangladesh, June-2013. 65
CHAPTER 4: FOOD AND AGRICULTURE 4.1 INDICES OF AREA AND PRODUCTION OF CROPS (Base : 1984-85=100)
Crop Area Production
2007-08 2008-09 2009-10 2010-11 2011-12 2007-08 2008-09 2009-10 2010-11 2011-12Cereals Aus 31 36 33 38 39 54 68 61 77 84 Aman 88 96 99 99 98 122 147 154 161 161 Boro 293 299 299 303 305 454 455 462 476 48 Wheat 57 58 56 54 53 58 58 62 66 68 Potato 361 357 391 414 387 522 454 684 718 708 Jute 65 62 62 105 112 80 92 100 166 157 Barley/jab 02 02 03 02 0 04 03 03 03 03 Jower 05 05 12 12 08 09 33 28 20 10 Bajra 02 02 02 06 06 04 - 04 10 09 Maize 5932 3404 4030 4389 06 4117 22313 27137 31140 39685 Cheena & Kaon 06 04 04 04 5223 06 05 05 04 04 Other cereals 08 03 02 02 04 2 02 02 02 02 Pulses Gram 09 08 07 08 07 09 08 07 08 09 Arhar 17 13 11 10 07 21 16 14 12 08 Masur 31 30 33 36 37 44 37 43 49 49 Motar 33 32 28 28 28 41 43 37 41 41 Moong 40 36 39 46 61 59 51 58 56 75 Maskalai 32 33 43 42 42 38 40 52 53 44 Kheshari 39 35 35 37 38 39 42 45 46 48 Gari Kalai 03 02 02 02 02 05 04 04 03 3 Other pulses 23 28 30 30 31 30 39 48 43 43 Oil Seeds Til 39 38 42 41 39 58 62 70 68 65 Rape & Mustard 61 61 45 65 72 80 71 53 86 92 Ground nut 111 111 120 113 110 140 147 169 169 164 Linseed 18 16 16 15 14 21 19 19 18 17 Castor 29 - - - - 81 - - - Coconut 08 09 08 23 07 402 381 485 308 448 Other oil seeds 235 159 71 66 59 306 - 112 124 115 Spices & Condiments Chillies 131 124 121 142 134 263 244 244 389 281 Onion 368 316 345 370 398 632 523 620 747 774 Garlic 265 270 292 306 348 363 388 412 524 581 Turmeric 152 251 151 154 163 443 443 398 426 509 Ginger 151 151 145 146 139 194 183 189 188 182 Corriander 258 216 242 254 256 290 434 355 390 403 Other Spices & Condiments 72 - - - - 73 - - - - Sugars Sugarcane 79 77 72 71 66 72 76 - 68 67 Palmyrapalm(Juice) - - Fibres Cotton 72 59 78 80 82 53 42 54 50 55 Sunhemp 04 04 03 04 03 02 03 06 08 07 Other Fibres (Shimul) - - - - - - - - - - Drugs and Narcotics Tea 121 122 124 127 130 156 157 158 160 160 Tobacco 56 58 74 94 98 82 82 112 161 173 Betel nut 60 49 44 53 46 1110 1138 1013 958 1076 Betel leaves 139 141 143 146 183 158 169 148 171 245 Other drugs & narcotics 01 01 01 01 - 05 05 03 03 -* Separate sunhemp data not being available the index for the crop for 1993-94 is included in other fibres. Data of the table are revised.

Food and Agriculture
66 Monthly Statistical Bulletin, Bangladesh, June-2013.
4.1 INDICES OF AREA AND PRODUCTION OF CROPS-CONTD. (Base : 1984-85=100)
Crop Area Production
2007-08 2008-09 2009-10 2010-11 2011-12 2007-08 2008-09 2009-10 2010-11 2011-12Fruits (Temporary) Banana 132 132 133 131 122 127 121 119 116 108Pineapple 120 119 120 113 150 - 174 178 166 137Water Melon 40 130 136 124 160 165 162 175 165 230Fruits (Permanent) Mango 70 69 71 61 68 494 509 644 547 581Jack Fruit 45 41 46 48 42 441 440 454 435 420Papaya 59 33 34 37 28 441 440 454 457 438Litchi 67 46 49 53 159 434 549 645 659 562Ber 19 47 - 47 50 1018 1071 - 1665 1160Guava 174 172 143 141 141 1127 1196 1353 2020 1414Orange 46 48 41 43 43 73 96 125 141 140Pomelo 27 21 17 17 15 697 770 805 815 845Lime & lemon 77 84 97 75 78 837 881 816 865 1003Other fruits 02 - 02 02 01 41 49 62 55 48Other citrus fruits 05 - 04 05 03 171 173 223 217 220Winter Vegetables Rabi Brinjal 166 161 163 162 156 181 179 182 181 188Rabi Pumkin 236 241 225 248 255 280 302 325 318 342Cauliflower 212 216 223 221 218 259 254 265 297 275Cabbage 215 218 221 209 221 331 322 354 334 334Water gourd 214 221 223 228 226 253 265 270 276 279Tomato 206 213 249 259 268 200 210 265 324 356Radish 171 165 168 165 165 202 195 197 195 197Beans 248 259 264 276 273 272 290 291 311 309Palong sak 271 279 284 281 285 320 311 328 314 313Other winter vegetables 83 82 85 83 82 71 70 74 74 71Summer Vegetables Kharif pumpkin 270 285 184 286 290 384 431 432 440 366Kharif brinjal 203 200 199 198 178 236 238 240 239 250Patal 295 301 303 302 303 381 392 423 451 466Lady's finger 380 392 396 411 408 509 535 560 571 591Jhinga 242 247 249 284 275 256 260 275 286 281Karala 256 262 267 275 273 309 313 223 351 351Arum 249 267 292 281 279 308 358 384 409 404Chalkumra 236 257 275 286 290 268 292 319 331 339Cucumber 275 275 291 292 299 321 384 482 423 438Puisak 484 329 514 529 534 570 649 487 690 711Chichinga 296 310 322 322 334 298 323 336 348 352Danta 350 352 358 358 366 461 381 494 504 514Barbati 281 287 37 305 305 354 487 378 397 404Other summer vegetables 260 272 160 307 302 361 322 297 345 341Other Food Sweet potato 51 51 51 43 40 45 45 45 44 37Other Non-food Fooder 201 239 247 250 246 243 383 378 402 406Mulberry 39 34 34 27 23 638 590 537 363 715 Source: Agriculture Wing, BBS. N.B.: (a) From the 2004-05 data collected in new forms. (b) Permanent fruit Crops Acreage Covers area under garden. (c) Permanent fruit Crops Production Covers Production under garden as well as outside garden.

Food and Agriculture
Monthly Statistical Bulletin, Bangladesh, June-2013. 67
4.2 LAND UTILIZATION STATISTICS 2010-11 & 2011-12 (Area in ‘000’ acres)
Name of Region Total Area Forest Not available for cultivation Culturable waste Current Fallows 2011-12 2011-12 2010-11 2011-12 2010-11 2010-11 2011-12 2010-11 2011-12
Bandarban 1107 799 799 102 102 105 104 37 35Chittagong 2035 651 671 718 716 40 38 3 5Comilla 1660 2 2 454 453 9 8 118 83Khagrachhari 667 554 554 36 36 2 1 3 2Noakhali 1525 455 455 369 368 12 11 1 -Rangamati 1511 1394 1394 23 22 6 5 5 3Sylhet 3113 189 189 918 917 137 135 368 302Dhaka 1838 66 550 771 769 38 37 30 16Faridpur 1726 - 30 515 514 23 2 105 75Jamalpur 839 30 2 207 206 7 6 12 8Kishoreganj 1380 2 39 386 384 57 58 57 61Mymensingh 1078 39 123 282 281 6 5 28 11Tangail 844 123 366 149 147 4 3 30 21Barisal 2040 366 0 507 506 12 10 2 -Jessore 1623 - 1426 486 485 8 7 42 23Khulna 3062 1426 0 517 515 27 26 126 124Kushtia 861 - 225 307 307 1 1 1 -Patuakhali 1245 225 0 229 227 6 7 36 33Bogra 960 1- 26 244 243 2 1 1 1Dinajpur 1644 26 0 355 354 16 15 28 26Pabna 1201 - 7 420 419 6 5 14 10Rajshahi 2333 7 5 546 545 6 5 47 40Rangpur 2377 5 724 722 12 11 59 51
Bangladesh 36669 6359 6368 9265 9238 542 521 1153 930 4.2 LAND UTILIZATION STATISTICS 2010-11 & 2011-12CONTD. Region Single Cropped Area Double Cropped Area Triple Cropped Area Net cropped Area Total Cropped Area
2010-11 2011-12 2010-11 2011-12 2010-11 2011-12 2010-11 2011-12 2010-11 2011-12Bandarban 44 48 16 15 4 4 64 67 88 90Chittagong 148 189 316 302 141 132 605 623 1203 1189Comilla 368 442 543 510 165 159 1078 1113 1957 1947Khagrachhari 11 13 41 40 20 21 72 74 153 156Noakhali 79 76 452 451 158 163 689 690 1457 1467Rangamati 52 61 27 20 5 5 8 86 121 116Sylhet 816 922 561 510 124 136 1502 1569 2314 2354Dhaka 374 438 465 375 106 134 946 948 1626 1594Faridpur 274 342 620 519 188 251 1084 1114 2086 2141Jamalpur 27 56 363 340 192 190 584 588 1337 1314Kishoreganj 322 339 458 432 100 102 880 873 1538 1509Mymensingh 66 101 486 463 170 175 724 741 1556 1560Tangail 139 168 303 279 98 101 540 548 1039 1029Barisal 463 463 504 503 186 190 1154 1157 2033 2043Jessore 33 91 719 638 333 375 1088 1107 2482 2504Khulna 701 727 206 176 60 65 968 969 1297 1278Kushtia 2 1 241 161 308 390 552 553 1412 1497Patuakhali 455 467 224 211 72 73 751 751 1119 1108Bogra 13 18 435 402 265 293 714 714 1682 1705Dinajpur 136 156 813 775 269 289 1220 1222 2577 2581Pabna 155 158 430 427 176 180 762 766 1547 1556Rajshahi 579 506 912 906 235 321 1728 1735 3116 3289Rangpur 269 246 1014 1033 295 306 1579 1586 3186 3234Bangladesh 5526 6028 10149 9488 3670 4055 19368 19594 36926 37261Note : (1) Total land area of all regions have been reported from the office of the Survey of Bangladesh. (2) Forest figures have been reported from the office of the Chief Conservator of forest. It does not include private forestry. Source : Agriculture Wing, BBS

Food and Agriculture
68 Monthly Statistical Bulletin, Bangladesh, June-2013.
4.3 REGIONWISE IRRIGATED AREA UNDER DIFFERENT MEANS 2010-11 & 2011-12 (Figures in ‘000’ acres)
Name of Region Power Pump Deep Tube-well Shallow Tube-well Hand Tube-well Total Tube-well
2010-11 2011-12 2010-11 2011-12 2010-11 2011-12 2010-11 2011-12 2010-11 2011-12
Bandarban 16 12 - - - - - - - - Chittagong 275 281 15 15 32 39 2 2 49 56 Comilla 324 330 215 216 369 377 6 6 590 592 Khagrachari 23 27 - - - - - - - - Noakhali 176 208 50 79 40 44 - - 90 123 Rangamati 15 16 - - - - - - - - Sylhet 489 506 20 21 119 121 2 5 141 147 Dhaka 203 210 72 73 509 526 14 2 595 601 Faridpur 201 257 36 43 627 569 1 - 664 613 Jamalpur 13 14 28 27 574 520 2 1 604 608 Kishoregonj 262 273 57 57 491 490 2 2 550 549 Mymensingh 21 20 251 245 382 357 1 3 634 605 Tangail 2 1 58 58 433 436 1 1 492 495 Barisal 348 346 - - - - 3 3 3 3 Jessore 36 42 193 196 1098 1113 0 - 1291 1309 Khulna 106 46 45 295 292 3 4 344 341 Kushtia 103 12 64 67 832 883 4 4 900 954 Patuakhali 11 29 - - - - - - - - Bogra 30 1 223 219 754 781 - - 977 1000 Dinajpur 1 5 303 296 1039 1125 4 3 1346 1424 Pabna 5 16 105 131 571 594 - 2 676 727 Rajshahi 16 113 796 832 1046 1089 3 3 1845 1924 Rangpur 115 62 107 11 1387 1497 12 11 1506 1619 Bangladesh 62 2887 2639 2731 10598 10913 60 53 13297 13697 4.3 REGIONWISE IRRIGATED AREA UNDER DIFFERENT MEANS 2010-11 & 2011-12-CONTD.
(Figures in ‘000’ acres) Name of Region
Traditional Total Irrigated Area Total Cropped Area % of irrigated Area 2010-11 2011-12 2010-11 2011-12 2010-11 2011-12 2010-11 2011-12
Bandarban 14 12 30 24 88 90 34.09 26.67 Chittagong 72 70 396 407 1203 1189 32.92 34.26 Comilla 29 28 943 957 1957 1947 48.19 49.15 Khagrachari 28 29 51 56 153 156 33.33 35.90 Noakhali 10 2 276 333 1457 1467 18.94 22.70 Rangamati 10 10 25 26 121 116 20.66 22.41 Sylhet 213 223 843 876 2314 2354 36.43 37.21 Dhaka 18 17 816 828 1626 1594 50.18 51.14 Faridpur 20 21 885 891 2086 2141 42.43 41.62 Jamalpur 15 15 632 637 1337 1314 47.27 48.48 Kishoregonj 36 35 848 857 1538 1509 55.14 56.79 Mymensingh 25 26 680 651 1556 1560 43.70 41.73 Tangail 9 9 503 505 1039 1029 48.41 49.08 Barisal 49 52 400 401 2033 2043 19.68 19.63 Jessore 19 20 1346 1371 2482 2504 54.23 54.75 Khulna 36 46 483 493 1297 1278 37.24 38.58 Kushtia 122 107 1033 1073 1412 1497 73.16 71.68 Patuakhali 39 38 69 67 1119 1108 6.17 6.05 Bogra 4 4 982 1005 1682 1705 58.38 58.94 Dinajpur 7 8 1358 1437 2577 2581 52.70 55.68 Pabna 10 6 702 749 1547 1556 45.38 48.14 Rajshahi 50 47 2010 2084 3116 3289 64.51 63.36 Rangpur 25 26 1593 1707 3186 3234 50.00 52.78 Bangladesh 860 851 16904 17435 36926 37261 45.78 46.79 Source : Agriculture Wing, BBS.

Food and Agriculture
Monthly Statistical Bulletin, Bangladesh, June-2013. 69
4.4 REGIONWISE IRRIGATED AREA UNDER DIFFERENT CROPS 2010-11 & 2011-12 (Figures in ‘000’ acres) Name of Region Aman Boro Wheat
2010-11 2011-12 2010-11 2011-12 2010-11 2011-12Bandarban - - 15 14 - -
Chittagong - 1 299 308 - - Comilla 20 20 835 849 6 6 Khagrachari 11 14 25 27 - - Noakhali 1 1 254 304 1 1 Rangamati - - 18 18 - - Sylhet 26 29 755 782 1 1 Dhaka 43 42 642 647 2 2 Faridpur 190 109 432 524 134 122 Jamalpur 33 34 523 529 12 11 Kishoregonj 16 16 809 820 4 4 Mymensingh 11 12 638 608 4 3 Tangail 63 66 406 406 3 3 Barisal 4 3 337 336 5 6 Jessore 252 310 774 755 54 51 Khulna 12 51 389 345 3 11 Kushtia 300 306 244 239 81 80 Patuakhali 2 2 18 17 - - Bogra 66 84 625 631 8 9 Dinajpur 117 184 700 702 199 185 Pabna 101 109 502 504 61 67 Rajshahi 375 423 945 926 212 208 Rangpur 72 83 1128 1182 66 62 Bangladesh 1715 1899 11313- 11473 856 832 - 4.4 REGIONWISE IRRIGATED AREA UNDER DIFFERENT CROPS 2010-11 & 2011-12-CONTD.
(Figures in ‘000’ acres) Name of Region Potato Vegetable Sugar Cane
2010-11 2011-12 2010-11 2011-12 2010-11 2011-12
Bandarban 3 3 4 4 - -
Chittagong 11 11 51 52 3 3 Comilla 35 35 33 53 2 2 Khagrachari 1 1 8 9 1 1 Noakhali 2 2 16 23 1 1 Rangamati 1 1 4 4 - - Sylhet 13 13 32 39 - - Dhaka 69 71 51 57 - - Faridpur 4 4 17 27 2 2 Jamalpur 18 14 24 26 7 7 Kishoregonj 4 4 10 9 - - Mymensingh 2 2 19 20 1 1 Tangail 2 2 18 17 1 1 Barisal 9 10 33 32 1 2 Jessore 18 10 68 88 7 6 Khulna 11 15 52 56 2 2 Kushtia 13 12 92 109 24 28 Patuakhali 5 4 7 8 - - Bogra 209 201 24 27 1 2 Dinajpur 164 158 44 48 18 17 Pabna 4 5 11 11 2 2 Rajshahi 139 139 56 61 57 59 Rangpur 205 204 45 63 10 11 Bangladesh 942 921 737 817 140 147 N.B. : 1997-98 figures have been revised. ‘..’ indicates negligible, Source: Agriculture Wing, BBS Note: Irrigated area under the crops aus, other cereals,,pulses and oil seeds has been omitted from the year 2004-05 due to negligible area under consideration

Food and Agriculture
70 Monthly Statistical Bulletin, Bangladesh, June-2013.
4.4 REGIONWISE IRRIGATED AREA UNDER DIFFERENT CROPS 2010-11 & 2011-12-CONTD. (Figures in ‘000’ acres) Name of Region
Cotton Other Total 2010-11 2011-12 2010-11 2011-12 2010-11 2011-12
Bandarban 2 2 6 1 30 24 Chittagong 1 1 31 31 396 407 Comilla - - 12 12 943 957 Khagrachari 2 2 3 2 51 56 Noakhali - - 1 1 276 333 Rangamati - - 2 3 25 26 Sylhet - - 16 18 843 876 Dhaka - - 9 9 816 828 Faridpur - - 106 103 885 891 Jamalpur - - 15 16 632 67 Kishoregonj - - 5 4 848 857 Mymensingh - - 5 5 680 651 Tangail - - 10 10 503 505 Barisal - - 11 12 400 401 Jessore - 4 149 145 1346 1371 Khulna 36 39 14 13 483 493 Kushtia - - 243 260 1033 1073 Patuakhali - - 37 36 69 67 Bogra - - 49 51 982 1005 Dinajpur - - 116 143 1358 1437 Pabna - - 21 51 702 749 Rajshahi - - 226 268 2010 2084 Rangpur 1 1 66 101 1593 1707 Bangladesh 48 51 1153 1295 16904 17435 N.B. : 1997-98 figures have been revised. Source: Agriculture Wing, BBS.48 ‘..’ indicates negligible 4.5 REGIONWISE IRRIGATED AREA UNDER DIFFERENT MEANS AND VARIOUS CROPS 2010-11 & 2011-12 (Figures in ‘000’ acres)
Name of Main Crops Power Pump Deep Tube-well Shallow Tube-well Hand Tube-well Total Tube-well
2010-11 2011-12 2010-11 2011-12 2010-11 2011-12 2010-11 2011-12 2010-11 2011-12
1. Aman 279 314 268 298 1075 1189 6 6 1349 1492 2. Boro 1838 1900 1766 1797 7093 7181 40 35 8899 9013 3. Wheat 139 138 134 130 536 521 3 3 673 654 4. Sugar cane 23 24 21 23 88 92 1 - 110 115 5. Cotton 8 9 8 8 30 32 0 0 38 40 6. Patato 153 153 147 144 591 576 3 3 741 724 7. Vegetables 120 135 115 128 462 511 3 2 580 642 8. Others 187 214 180 203 723 811 4 4 907 1017 Total 2747 2887 2639 2731 10598 10913 60 53 13297 13697
4.5 REGIONWISE IRRIGATED AREA UNDER DIFFERENT MEANS AND VARIOUS CROPS 2010-11 & 2011-12-CONTD. (Figures in acres) Crops Traditional Total Means
2010-11 2011-12 2010-11 2011-12 1. Aman 87 93 1715 1899 2. Boro 576 560 11313 11437 3. Wheat 4 41 856 832 4. Sugar cane 7 7 140 147 5. Cotton 2 2 48 51 6. Patato 48 45 942 921 7. Vegetables 37 40 737 817 8. Others 54 63 1153 1295 Total 860 851 16904 17435 N.B. : Canals included Traditional. Source: Agriculture Wing, BBS.

Food and Agriculture
Monthly Statistical Bulletin, Bangladesh, June-2013. 71
4.6 ACREAGE, PRODUCTION AND YIELD RATE OF AGRICULTURAL CROPS
Crops 2010-11 2011-12 2012-13
Area ‘000’ acres
Production ‘000’
M.Tons
Per Acre yield
M.Tons
Area ‘000’ acres
Production ‘000’
M.Tons
Per Acre yield
M.Tons
Area ‘000’ acres
Production ‘000’
M.Tons
Per Acre yield
M.TonsCereals Rice-aus 2750 2133 .776 2812 2332 0.82 2602 2158 0.83 Rice-aman 13951 12792 .917 13789 12798 0.92 13863 12897 0.93 Rice-boro 11788 18617 1.579 11886 18759 1.58 11762 18778 1.60 Wheat 923 972 1.053 885 995 1.12 1029 1255 1.22 Barley 1.352 0.484 .358 01 0.32 0.32 01 0.26 0.26 Rabi and Bhadoi Jower 0.484 0.251 .518 0.37 0.22 0.59 - - - Bajra 0.169 0.099 .604 0.14 0.08 0.57 - - - Maize 409 1018 2.486 487 1298 2.665 - - - Cheena 03 01 .357 03 01 0.33 - - - Other cereals 5.783 1.539 .266 0.255 0.208 0.82 - - - Pulses Gram 20 07 0.32 19 07 0.36 - - - Arahar 02 01 .373 01 0.44 0.44 - - - Moong 68 19 0.95 91 26 0.28 - - - Masur 205 80 0.39 213 80 0.37 222 93 0.42 Mashkalai 78 29 0.37 77 24 0.31 - - - Kheshari 221 83 0.38 230 88 0.38 262 103 0.39 Gari kalai .413 .146 .354 0.38 0.13 0.34 - - - Mator 16 06 0.36 16 06 0.37 - - - Other pulses - 02 .415 18 07 0.38 - - - Edible oilseeds Til 89 31 0.35 82 30 0.37 - - - Rape and mustard 623 246 .395 682 262 0.38 - - - Rabi & Bhadoi groundnut 78 54 0.69 77 52 0.68 - - - Other oilseeds - - - Linseeds 25 07 0.28 24 06 0.25 23 06 0.26 Coconut 07 326 .045 06 372 62.00 - - - Castor - - - - - - - - - Other oilseeds 01 .414 .403 01 0.37 0.37 - - - Spices Chillies (kharif) 40 38 .95 41 21 0.51 40 19 0.47 Chillies (rabi) 219 138 0.63 199 105 0.52 - - - Onion 316 1052 332 335 1159 3.45 332 1168 3.52 Garlic 10.4 209 2.00 109 234 2.14 - - - Turmeric 57 125 2.19 61 150 2.45 - - - Ginger 23 74 3.22 22 72 3.27 - - - Corriander - 03 .470 29 10 0.34 28 9 0.34 Other condiments and sp 07 03 0.43 07 04 0.57 - - - Sugar Sugarcane 287 4671 1.627 266 4603 17.30 270 4434 16.42 Date-palm (juice) 03 227 .056 04 209 52.25 - - - Palmyrapalm (Juice) .464 96 .142 0.363 96 .136 - - - Fibres Jute (Bales) 1751 8396 4.79 1878 8003 4.26 1683 7610 4.52 Cotton 24 14 0.58 18 12 0.66 - - - Bhadoi sunhemp - - - - - - - - - Rabi sunhemp 0.16 01 6.25 0.16 01 6.25 - - - Other cotton (Shimul) 0.147 11 .029 0.22 10 0.30 40 10 0.26 Drugs and Narcotics Tea 140 61 .43 143 60 0.41 144 64 0.44 Tobacco 121 79 0.65 126 85 0.67 120 79 0.66 Betelnut 45 218 0.003 39 244 .004 36 228 6.33 Betel leave 46 92 2.00 - 152 2.68 55 136 2.45
*Including Castor.
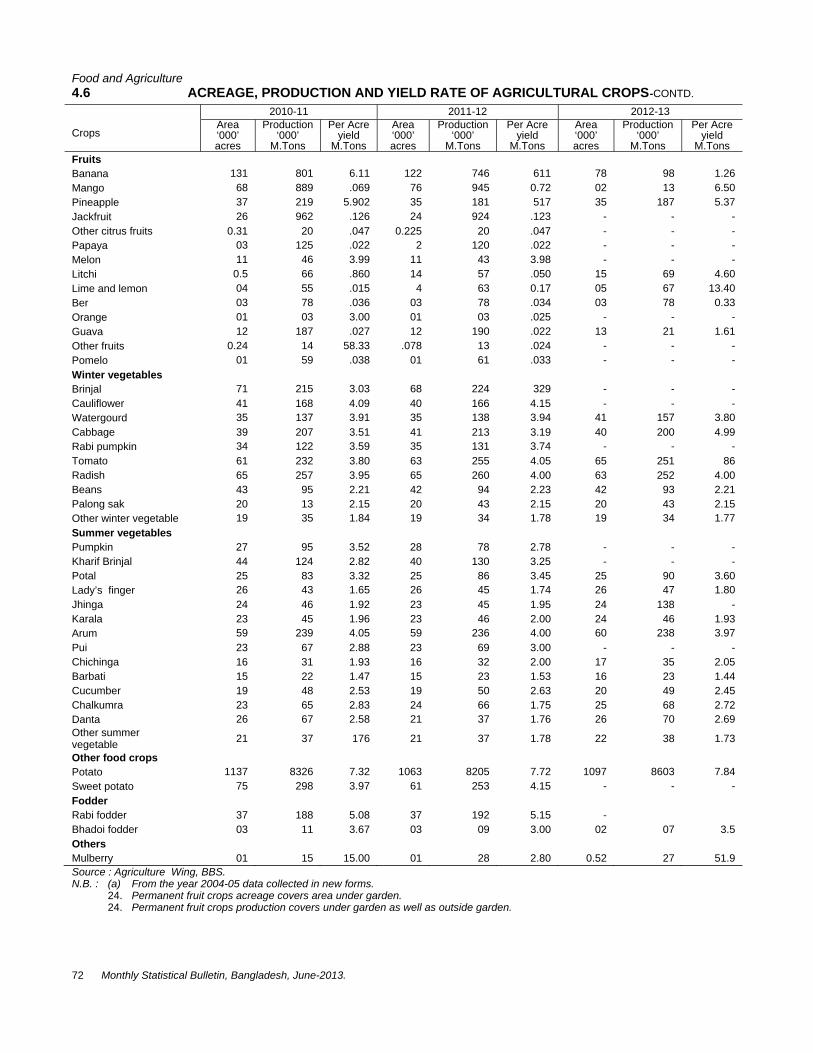
Food and Agriculture
72 Monthly Statistical Bulletin, Bangladesh, June-2013.
4.6 ACREAGE, PRODUCTION AND YIELD RATE OF AGRICULTURAL CROPS-CONTD.
Crops
2010-11 2011-12 2012-13 Area ‘000’ acres
Production ‘000’
M.Tons
Per Acre yield
M.Tons
Area ‘000’ acres
Production ‘000’
M.Tons
Per Acre yield
M.Tons
Area ‘000’ acres
Production ‘000’
M.Tons
Per Acre yield
M.TonsFruits Banana 131 801 6.11 122 746 611 78 98 1.26 Mango 68 889 .069 76 945 0.72 02 13 6.50 Pineapple 37 219 5.902 35 181 517 35 187 5.37 Jackfruit 26 962 .126 24 924 .123 - - - Other citrus fruits 0.31 20 .047 0.225 20 .047 - - - Papaya 03 125 .022 2 120 .022 - - - Melon 11 46 3.99 11 43 3.98 - - - Litchi 0.5 66 .860 14 57 .050 15 69 4.60 Lime and lemon 04 55 .015 4 63 0.17 05 67 13.40 Ber 03 78 .036 03 78 .034 03 78 0.33 Orange 01 03 3.00 01 03 .025 - - - Guava 12 187 .027 12 190 .022 13 21 1.61 Other fruits 0.24 14 58.33 .078 13 .024 - - - Pomelo 01 59 .038 01 61 .033 - - - Winter vegetables Brinjal 71 215 3.03 68 224 329 - - - Cauliflower 41 168 4.09 40 166 4.15 - - - Watergourd 35 137 3.91 35 138 3.94 41 157 3.80 Cabbage 39 207 3.51 41 213 3.19 40 200 4.99 Rabi pumpkin 34 122 3.59 35 131 3.74 - - - Tomato 61 232 3.80 63 255 4.05 65 251 86 Radish 65 257 3.95 65 260 4.00 63 252 4.00 Beans 43 95 2.21 42 94 2.23 42 93 2.21 Palong sak 20 13 2.15 20 43 2.15 20 43 2.15 Other winter vegetable 19 35 1.84 19 34 1.78 19 34 1.77 Summer vegetables Pumpkin 27 95 3.52 28 78 2.78 - - - Kharif Brinjal 44 124 2.82 40 130 3.25 - - - Potal 25 83 3.32 25 86 3.45 25 90 3.60 Lady’s finger 26 43 1.65 26 45 1.74 26 47 1.80 Jhinga 24 46 1.92 23 45 1.95 24 138 - Karala 23 45 1.96 23 46 2.00 24 46 1.93 Arum 59 239 4.05 59 236 4.00 60 238 3.97 Pui 23 67 2.88 23 69 3.00 - - - Chichinga 16 31 1.93 16 32 2.00 17 35 2.05 Barbati 15 22 1.47 15 23 1.53 16 23 1.44 Cucumber 19 48 2.53 19 50 2.63 20 49 2.45 Chalkumra 23 65 2.83 24 66 1.75 25 68 2.72 Danta 26 67 2.58 21 37 1.76 26 70 2.69 Other summer vegetable 21 37 176 21 37 1.78 22 38 1.73
Other food crops Potato 1137 8326 7.32 1063 8205 7.72 1097 8603 7.84 Sweet potato 75 298 3.97 61 253 4.15 - - - Fodder Rabi fodder 37 188 5.08 37 192 5.15 - Bhadoi fodder 03 11 3.67 03 09 3.00 02 07 3.5 Others Mulberry 01 15 15.00 01 28 2.80 0.52 27 51.9 Source : Agriculture Wing, BBS. N.B. : (a) From the year 2004-05 data collected in new forms.
�24. Permanent fruit crops acreage covers area under garden. �24. Permanent fruit crops production covers under garden as well as outside garden.

Food and Agriculture
Monthly Statistical Bulletin, Bangladesh, June-2013. 73
4.7 PRODUCTION AND SALES OF FERTILIZER BY VARIETY (‘000’ mt)
Period Production Local and Export Sales
Urea Ammon T.S.P. S.S.P. Total Urea Ammon T.S.P. S.S.P. Total
2006-07 Dec 161.3 0.6 5.0 13.0 179.9 213.8 0.6 6.2 17.6 238.2 Jan 157.8 0.7 3.7 10.5 172.7 195.2 0.7 3.1 16.0 215.0 Feb 130.9 0.6 3.0 13.4 147.9 160.5 0.5 2.1 17.7 180.8 Mar 158.4 0.4 6.3 10.8 175.9 157.6 0.5 2.9 10.6 171.6 Apr 147.7 0.1 5.3 1.2 154.3 90.5 0.1 3.4 5.0 99.0 May 152.2 0.6 0.1 2.3 155.2 45.3 0.6 5.4 2.0 53.3 Jun 162.0 0.7 9.3 1.8 173.8 68.4 0.6 2.0 4.0 75.0
2007-08 Jul 147.6 0.6 3.4 15.7 167.3 159.9 0.6 0.1 11.2 171.8 Aug 107.6 0.8 4.7 9.3 122.4 91.9 0.9 1.1 15.5 109.4 Sep 83.4 0.6 5.0 2.9 91.9 97.7 0.0 5.3 3.6 106.6 Oct 123.7 0.4 5.7 2.0 131.8 144.3 0.3 1.1 2.9 148.6 Nov 81.0 0.2 5.6 0.0 86.8 166.2 0.7 10.6 0.0 177.5 Dec 136.5 0.2 1.9 2.5 141.1 149.5 0.3 3.3 0.0 153.1
Note: Data on fertilizer were collected earlier from Bangladesh Agriculture Development Corporation (BADC) Since BADC has recently discontinued its collection programme, fertilizer statistics obtained from BCIC have been presented in this table. Source: Bangladesh Chemical Industries Corporation (BCIC).
4.8 AVERAGE RETAIL PRICE OF FERTILIZER
*Tk. Per 50 Kg. Year/Month Urea TSP SSP
MOP
Jan 293.50 681.50 462.50 644.00 883.00 Feb 300.00 659.00 645.00 643.00 927.50 Mar 306.50 694.00 450.00 681.50 931.50 Apr 300.00 723.00 470.00 682.00 950.00 May 299.50 725.50 462.00 691.90 968.00 Jun 301.00 724.90 752.00 700.50 971.50
2006-07 Jul 310.00 713.00 451.50 739.50 977.00 Aug 309.00 730.00 484.50 768.50 988.50 Sep 311.00 745.00 460.50 770.50 993.50 Oct 314.00 745.00 478.50 766.50 997.50 Nov 320.50 751.00 471.00 759.50 1005.00 Dec 322.50 757.50 468.00 743.50 1037.50 Jan 308.50 729.00 458.00 740.00 1071.00 Feb 301.50 744.00 457.00 767.00 1025.50 Mar 302.00 779.50 474.50 778.50 1049.50 Apr 302.50 766.50 466.50 787.50 1017.50 May 306.00 801.00 475.00 802.00 1061.50 Jun 301.00 876.50 449.00 804.50 1007.00
2007-08 Jul 302.00 894.00 472.50 814.50 1010.90 Aug 302.50 903.50 496.00 827.50 1027.50 Sep 301.50 917.00 497.00 849.00 1038.00 Oct 301.00 914.50 495.00 848.50 1038.00 Nov 302.00 857.50 500.00 932.00 1034.00 Dec 300.50 1296.00 … 1122.50 1486.50 Jan 305.00 1388.50 … 1174.00 1957.50 Feb 303.50 1551.00 … 1249.50 1988.00
Source : Ministry of Agriculture.

Food and Agriculture
74 Monthly Statistical Bulletin, Bangladesh, June-2013.
4.09 IMPORT OF PESTICIDES BY TYPE (Qnty: mt & value: ‘000’ Taka)
Period Insecticides Fungicides
Weedicides,herbi des & similar
product
Rodenticides and Similar Products
Other Insecticides Total
Qnty Value Qnty Value Qnty Value Qnty Value Qnty Value Qnty Value 2002-03 4072 917014 1776 292841 704 142581 77 17394 89 11865 6718 1381695 2003-04 8732 1073526 3427 482550 1509 194959 64 11310 95 14765 13827 1777110 2004-05 8713 1170715 5742 765896 1993 331926 43 14856 166 20165 16657 2303558 2005-06 9406 1454801 5662 1075088 1456 483984 94 24083 136 22602 16754 3060558 2006-07 9728 1566986 7646 1131837 1424 469833 146 46252 241 47831 19185 3262739
2007-08 105 12487 115 21852 75 38613 - - 23413 4600922 23708 4673874
Source: National Accounting Wing, BBS. 4.10 CONSUMPTION OF PESTICIDES
(mt/kl)
Period Insecticide Miticide Fungicide Herbicide Rodenticide Total
Granular Liquid Powder GENERAL SULPHUR 2011 20335.35 3574.84 673.50 73.84 3007.8 12804.31 3895.59 58.50 44423.80 2012 16539.35 3455.46 641.37 55.20 3182.60 13295.21 3623.94 89.81 40882.94 2006
Apr-Jun 3041.72 634.23 156.95 - 746.50 - 443.12 2.85 5025.17 Jul-Sep 3608.65 934.2 135.69 - 1780.31 - 259.24 2.44 6720.35 Oct-Dec 1570.08 556.47 83.50 - 1717.42 - 1410.30 5.00 5347.77
2007 Jan-Mar 8712.64 1075.03 152.55 7.44 4967.92 - 1065.85 - 15981.46 Apr-Jun 3100.87 526.42 103.36 28.86 940.28 - 393.05 2.75 5095.57 July-Sep 4090.41 774.00 133.77 13.80 1617.15 - 153.16 6.35 6788.64 Oct-Dec 4059.32 728.72 129.67 12.01 2702.21 - 2213.20 1.28 9846.41
2008 Jan-Mar 10312.06 1442.28 268.20 9.37 7040.17 - 1007.41 11.80 20091.29 Apr-Jun 4611.94 681.33 140.04 33.39 1856.71 - 543.74 13.17 7880.92 July-Sep 73878.82 1267.29 194.95 15.42 3038.21 - 260.61 20.43 12184.73 Oct-Dec 2918.76 799.50 91.01 5.50 2482.69 - 2213.01 22.78 8533.25
2009 Jan-Mar 11039.08 1485.45 224.11 16.32 7274.31 - 1092.30 24.34 21155.91 Apr-Jun 2623.58 576.88 120.00 21.82 729.22 - 298.05 3.28 4372.83 July-Sep 4022.35 1009.35 138.60 12.22 1156.34 - 505.39 9.98 6854.23 Oct-Dec 4433.86 1203.21 124.09 5.61 5193.80 - 1804.11 24.78 12789.46
2010 Jan-Mar 8823.71 1533.31 197.15 14.93 1051.33 4740.72 959.90 29.98 17350.43 Apr-Jun 2339.29 882.54 109.44 19.20 216.34 590.70 246.27 10.59 4114.37 July-Sep 4830.99 939.56 154.58 9.23 576.37 1730.22 344.30 12.94 8598.19 Oct-Dec 4973.81 899.53 110.65 7.35 1710.76 2652.99 1795.65 26.90 12177.64
2011 Jan-Mar 8717.59 1014.64 210.35 21.33 853.78 6917.00 1264.841 19.78 19019.31 Apr-Jun 3454.69 600.53 111.64 27.23 252.10 1027.93 485.15 8.78 5968.05 July-Sep 4646.22 905.13 194.78 12.27 466.05 2318.52 472.16 11.77 9026.90 Oct-Dec 3515.80 947.10 162.55 12.96 1472.19 2540.85 1673.45 18.17 10343.07
2012 Jan-Mar 7346.52 1139.09 246.89 10.08 875.20 6426.59 1216.70 25.89 17286.96 Apr-Jun 2424.24 490.93 97.01 20.58 249.23 1395.92 528.16 8.77 5214.84 July-Sep 3811.45 813.32 138.35 10.50 480.50 2445.10 617.50 32.45 8349.17 Oct-Dec 2957.14 1012.12 159.12 14.04 1577.67 3027.60 1261.58 22.70 10031.97
2013 Jan-Mar 4494.00 952.64 256.74 14.19 917.68 6147.58 856.58 34.91 13674.32
Source: Bangladesh Crop Protection Association. (BCPA)

Food and Agriculture
Monthly Statistical Bulletin, Bangladesh, June-2013. 75
4.11 FOODGRAIN PRODUCTION (Lakh m.tons)
Group 2004-05 2005-06 2006-07 2007-08 2008-09 2009-10 2010-11
Actual Actual Actual Actual Actual Actual Actual
Aus 15.0 17.4 15.1 15.0 18.9 17.0 21.3
Aman 98.2 108.0 108.4 96.6 116.1 122.0 127.9
HYV/Boro 138.0 139.0 149.6 177.6 178.0 180.6 186.2
Wheat 9.76 7.35 7.37 8.44 8.49 9.01 9.7
Total: 261.0 271.75 280.47 297.64 332.49 328.61 345.10 Source: BBS. 4.12 IMPORT, PROCUREMENT AND DISTRIBUTION OF FOOD
('000' mt) Period
Import Internal Procurement Distribution Stock Rice Wheat Rice Paddy Wheat Rice Wheat Rice Paddy Wheat
2004-05 82 183 251 12 - 1103 256 6139 303 1739 2005-06 - - 505 - - 803 174 6259 271 2198 2006-07 - - - - - 1290 192 6737 235 1495
2005-06
Jul 1 9 97 1 - 14 9 586 31 152 Aug - 17 97 - - 43 21 669 33 151 Sep - 7 114 - - 96 15 724 33 147 Oct - - 44 - - 175 13 740 33 140 Nov 13 75 - - - 52 16 608 32 105 Dec - 60 32 - - 67 24 562 21 185 Jan - - 37 - - 41 4 499 16 246 Feb - - 63 - - 83 18 421 14 247 Mar 32 - 21 - - 86 20 408 14 229 Apr - - - - - 13 3 353 13 227 May - - - - - 87 27 278 13 229 Jun - - - - - 46 17 411 18 140
2006-07
Jul - - - - - 14 9 534 22 176 Aug - - - - - 118 24 753 25 167 Sep - - - - - 147 17 799 28 157 Oct - - - - - 204 18 738 28 140 Nov - - - - - 44 19 590 28 122 Dec - - - - - 72 21 568 22 102 Jan - - - - - 43 12 605 15 97 Feb - - - - - 34 13 616 13 85 Mar - - - - - 100 12 601 13 97 Apr - - - - - 314 12 503 13 92 May - - - - - 73 16 187 13 108 Jun - - - - - 127 19 243 15 152
Stock : For the split year, opening stock of 1st July and for months opening stock on the 1st day. Source : Directorate of Food

Food and Agriculture
76 Monthly Statistical Bulletin, Bangladesh, June-2013.
4.13 PUBLIC FOOD DISTRIBUTION BY CHANNEL JUNE, 2012 ('000' mt)
Sector 2010-11 Monthly
May’12 June’12 Rice Wheat Total Rice Wheat Total Rice Wheat Total
1 Statutory Rationing - - - - - - - - -
2 Modified Rationing (Palli Rationing)* - - - - - - - - -
3 Priority Distribution system i) Essential Priorities (Defence) 91059 65974 157033 7681 5659 13340 7780 5725 13505 ii) Large Employees (Industries) 299 17144 17443 - 1486 1476 - 1406 1406 iii) Other Priorities 15658 4652 20310 1451 414 1865 1723 483 2206 4 Works Programme Distribution
system
i) Food for Works Programme 8322 120314 128636 11066 1972 46038 53664 2511 56175 ii) Canal Digging iii) Test Relief 1309 175573 176882 7490 - 7490 58114 - 58714 iv) Food for education - - - - - - - - - 5 Gratuity, Relief, Vulnerable Å
Other Distribution system
i) Vulnerable Group/V.G.D. 141616 121926 263542 22458 2747 22458 17854 97 17951 ii) Gratuity Relief 33464 10 33474 1930 - 1930 13207 - 13207 iii) Flour Mills iv) Marketing Operation v) Credit sale 63740 32480 96220 5690 16852 8437 5559 5559 8351 vi) V.G.F. 114207 156 114363 7097 - 7097 1087 2792 1978 vii) Open market sales 861177 25815 886992 6018 - 2287 3002 891 25419 viii) Special Auction - - - - - - - - - ix) Permit - - - - - - - - - x) Others 61720 37489 99209 3535 4474 8009 14462 13177 27639 6 Free Sale Grand Total 1392570 601532 1994102 107416 33594 141010 177052 19499 226551 Source : Directorate of food * Modified Rationing includes Palli Chakki

Monthly Statistical Bulletin, Bangladesh, June-2013. . 77
CHAPTER 5: INDUSTRY, ENERGY AND MINING
5.1 PRODUCTION OF FOOD MANUFACTURING INDUSTRIES (Value: '000' Taka)
Period 3114-Shrimps & Froglegs 3115-Soyabean Oil & Vegetable Ghee 3118-Atta, Maida, Suji
Qnty. (mt)
Value
No. of Unit
Qnty. (mt)
Value
No. of Unit
Qnty. (mt)
Value
1 2 3 4 5 6 7 8 9 2008-09 - - 5 6090 485768 6 11172 241410 2009-10 4484 - 5 6410 429459 6 13044 279432
Jan 3672 1789499 5 6414 429738 6 13055 300265 Feb 1773 871250 5 6416 429872 6 13061 300403 Mar 2655 1290849 5 6419 430073 6 13069 300587 Apr 3909 1907680 5 6420 430140 6 13072 300656 May 6127 2986044 5 6421 430207 6 13075 300725 Jun 6223 3603907 5 6422 430274 6 13077 300771
2010-11 July 3968 2727159 5 6425 533275 6 13080 353160 Aug 7254 2761623 5 6426 533358 6 13083 353241 Sept 6095 2987287 5 6427 533441 6 13082 353214 Oct 7182 3556461 5 6427 539868 6 13084 353268 Nov 6000 - 5 6429 546465 6 13087 379523 Dec 6003 - 5 6430 546550 6 13088 379552 Jan 6000 - 5 6432 553152 6 13089 379581 Feb 3386 2063724 5 6435 559845 6 13092 353484 Mar 2977 1943189 5 6435 559845 6 13095 353565 April 3909 1907680 5 6436 579240 6 13098 353646 May 5650 3000210 5 6483 713130 6 13239 317736 Jun 6969 3670821 5 6485 713350 6 13267 318408
2011-12 July 7404 3899960 5 8050 845250 6 13300 319200 Aug 7459 3928714 5 8051 845355 6 13307 319368 Sept 6341 3340045 5 8053 845565 6 13305 319320 Oct 7392 3893606 5 8053 845565 6 13308 319392 Nov 5699 2998583 5 8654 898170 6 13310 319440 Dec 6553 3451826 5 9552 1041168 6 13318 332950 Jan 6154 3241651 5 9960 1085640 6 13324 346424 Feb 4046 2131571 5 10600 1187200 6 13330 373240 Mar 3492 1840000 5 11200 1254400 6 14048 365248 Apr 3907 2 12000 1344000 6 14549 363725 May 2 13000 1417000 8 14558 363950 June 2 14150 1584800 8 14590 379340
2012-13 July 5254 346618 2 19225 1999400 8 14716 397332 Aug 4396 2772107 2 21500 2150000 8 14734 412552 Sept 4919 3102073 2 27991 2799100 8 14738 397926 Oct 5833 375596 2 27406 2740600 8 14757 427953 Nov 5207 3608754 2 24720 2472000 8 15656 485336 Dec 4525 3314291 2 25093 2509300 8 16927 541664 Jan 3480 2501647 2 24307 2430700 8 16915 541280 Feb 3235 2352925 2 28599 2802702 8 16738 535616 Mar 2216 1607191 2 28600 2717000 8 16767 536544 Apr 3691 2311342 2 28602 2745792 8 17353 555296 May 5620 3768107 2 28604 2774588 8 17377 538687 June 5547 3802059 2 28618 2575620 8 17370 521100
Note:These Unit total production does not means the total production of Bangladesh. Source: E.P.B & Private Enterprise.

Industry, Energy and Mining
Monthly Statistical Bulletin, Bangladesh, June-2013. 78
5.1 PRODUCTION OF FOOD MANUFACTURING INDUSTRIES-CONTD. (Value: '000' Taka
Period 3122-Bakery Products 3123-Sugar 3126/27-Tea
No. of Unit
Qnty. M.T.
Value
No. of Unit
Qnty. (mt)
Value
No. of Unit
Qnty. (mt)
Value
10 11 12 13 14 15 16 17 18 2008-09 20 4368 348381 - - - - - - 2009-10 - 4018 273716 - 5183 - - 4954 -
Jan 20 4120 288400 15 31878 1434492 116 336 - Feb 20 4165 291550 15 7576 340943 116 27 3834 Mar 20 4186 293020 15 - - 116 199 28258 Apr 20 4295 257700 15 - - 116 2188 310696 May 20 4198 251880 15 - - 116 4318 - Jun 20 4245 252700 15 - - 116 6902 -
2010-11 July 20 4425 381900 15 - - 116 1266188 Aug 20 380 382800 15 - - 116 8632 1329328 Sept 20 6370 376200 15 - - 116 7705 1186570 Oct 20 6290 391092 15 654 29430 116 6958 1071532 Nov 20 6295 520200 15 6602 297020 116 5578 859012 Dec 20 6299 557600 15 33495 1505655 116 5518 849772 Jan 20 6287 - 15 34705 1561725 116 222 34188 Feb 20 6695 - 15 19006 855270 116 34 5236 Mar 20 6785 - 15 6533 293985 116 508 7832 Apr 20 4295 257700 15 - - 116 3377 520058 May 20 7386 517020 15 - - 116 4557 701778 Jun 20 6045 423150 15 - - 116 6749 1039346
2011-12 July 20 4900 343000 15 - - 116 8239 1268806 Aug 20 4475 313250 15 - - 116 7039 1084006 Sept 20 4025 40250 15 - - 116 8874 - Oct 20 3570 35700 15 - - 116 8379 - Nov 20 3750 37500 15 5998 - 116 8384 - Dec 20 3250 32500 15 31923 - 116 5401 - Jan 20 3625 362500 15 25409 - 116 147 - Feb 20 3680 36800 15 5977 - 116 206 - Mar 20 3875 38750 - - - 116 375 - Apr 20 3668 - 15 0 - 116 2593 - May 20 3751 375100 - 116 4810 - Jun 20 3749 374900 - - 116 6567 -
2012-13 July 20 3852 385200 15 - - 116 8300 - Aug 20 3823 382300 15 - - 116 9440 - Sept 20 3885 388500 15 - - 116 8968 - Oct 20 3895 389500 15 - - 116 8285 - Nov 20 3908 450757 15 3953 - 116 7108 - Dec 20 3886 450369 15 30210 - 116 4800 - Jan 20 3825 450256 15 39009 - 116 5263 - Feb 20 3875 406206 15 21568 - 116 202 - Mar 20 3887 388700 15 10363 - 116 554 - Apr 20 3845 384500 15 2020 - 116 3173 - May 20 3855 385500 15 - - 116 4927 - Jun 20 3960 396000 15 - - 116 6793 -
Note:These Unit total production does not means the total production of Bangladesh.

Monthly Statistical Bulletin, Bangladesh, June-2013. . 79
5.2 PRODUCTION OF BEVERAGE AND TOBACCO MANUFACTURING INDUSTRIES (Value: '000' Taka)
3128-Edible Salts 3134-Beverage (Soft Drink) 3141-Cigarettes 3143-Biddies Period No. of
Unit Qnty. (mt)
Value No. of Unit
Qnty. ('000' doz
bottle)
Value No. of Unit
Qnty. (Million Stick)
No. of Unit
Qnty. ('000' No.)
Value
2008-09 - 6276 - 4 2905 822549 20 1887 13 4287 3206546 2009-10 - 6457 - 4 3133 570145 20 1973 13 4658 574633
Nov 8 6375 60565 4 3130 569660 20 1970 19 4533 543960 Dec 8 6376 60564 4 3124 568568 20 1973 13 4620 554400 Jan 8 6378 60582 4 3121 568022 20 1974 13 4560 547200 Feb 8 6382 60620 4 3127 569114 20 1975 13 4635 556200 Mar 8 6380 60601 4 3137 570934 20 1974 13 4715 565800 Apr 8 6383 60602 4 3145 572390 20 1976 13 4819 626470 May 8 6385 60647 4 3148 572936 20 1978 13 4930 665550 Jun 8 6382 60618 4 3153 573846 20 1980 13 5125 691875
2010-11 July 8 6380 60599 4 3160 733120 20 1983 13 5568 751680 Aug 8 6383 60627 4 3166 734512 20 1984 13 5670 765450 Sept 8 6384 60636 4 3171 735672 20 1985 13 5520 745200 Oct 8 6082 57768 4 3169 735208 20 1982 13 5590 754658 Nov 8 6084 57798 4 3157 7312424 20 1984 13 6185 834975 Dec 8 6085 57807 11 3135 727320 20 1985 13 6290 849150 Jan 8 6087 57826 4 3123 724536 20 1987 13 6299 - Feb 8 6088 57836 4 3157 776622 20 1989 13 6575 - Mar 8 6090 57855 4 3180 782280 20 1992 13 6685 - Apr 8 6383 60629 4 3192 785232 20 1976 13 4819 626470 May 8 6390 57875 4 3220 792120 20 1985 13 6680 895120 Jun 8 6393 57883 4 3240 797040 20 1585 13 5590 749060
2011-12 July 8 6092 57874 4 3750 922500 20 2754 13 4638 621492 Aug 8 6095 57902 4 3759 924714 20 2428 13 4695 629130 Sept 8 6098 57930 4 3762 925452 20 2558 13 5012 676499 Oct 8 6092 57873 4 3760 924960 20 2240 13 5029 678793 Nov 8 6585 62557 4 3752 844200 20 2345 13 5033 679455 Dec 8 6075 57712 4 3670 825750 20 2762 13 5057 682695 Jan 8 6040 55955 4 3637 581920 20 2892 13 4738 - Feb 8 5890 56496 4 3690 590400 20 2500 13 5035 - Mar 8 5947 55955 4 3765 587340 20 2530 13 5538 - Apr 8 5940 56430 4 4070 634920 20 3107 13 6540 - May 4 4097 639132 20 3110 6525 - June 4 4100 639600 20 3125 6538 -
2012-13 July 8 5915 59150 4 4095 638820 20 1707 13 6845 889850 Aug 8 5905 59050 4 4224 692736 20 2530 13 6838 888940 Sept 8 5898 59090 4 4239 695196 20 1149 13 6948 903240 Oct 8 5895 58950 4 4673 766364 20 2303 13 6985 908050 Nov 8 5907 59070 4 4296 704544 20 2277 13 6990 908700 Dec 8 6018 60180 4 4148 680272 20 2192 13 6998 909740 Jan 8 6135 61350 4 1804 804256 20 2372 13 7002 928430 Feb 8 6148 61480 4 4950 826650 20 2086 13 6995 909350 Mar 8 6380 60610 4 4971 830157 - 2724 13 6990 908700 Apr 8 6390 60705 4 5654 949872 1 2548 13 6982 907660 May 8 6375 30562 4 5719 960792 1 2520 13 6985 908050 June 8 6385 30657 4 5741 895596 1 1862 13 6988 90844
Note:Thse Unit total production does not means the total production of Bangladesh. Source: Private Enterprise & National Board of Revenue.

Industry, Energy and Mining
Monthly Statistical Bulletin, Bangladesh, June-2013. 80
5.3 CLOTH AND YARN PRODUCTION OF COTTON TEXTILE MILLS (Value: '000' Taka)
Period
No. of
Unit
Installed Capacity Spindles
('000')
3211-Production of Yarn
Production of Cloth
Surplus Yarn
Consumption of cotton
Employment (Number)
Qnty. ('000' K.G.)
Value Qnty. ('000' Metre)
Value ' Qnty. ('000' K.G.)
('000' K.G.)
All emplo-yees
Product Workers
2009-10 - - 15098 - 4414 - - - - - Jan 63 1228 15035 2706300 4350 152250 14046 17290 50546 43118 Feb 63 1228 15117 2645475 4385 184170 14120 17385 50557 43126 Mar 63 1228 15135 - 4389 - 14138 17405 50557 43126 Apr 63 1228 15172 - 4402 - 14172 17448 50561 43127 May 63 1228 15189 - 4415 - 14186 17467 50565 43129 Jun 63 1228 15230 - 4435 - 14222 17515 50567 43130
2010-11 July 63 1228 15376 2767680 4635 185400 14323 17515 50567 43130
Aug 63 1228 15392 2770560 4647 185880 14336 17700 50570 43132
Sept 63 1228 15398 - 4662 - 14338 17707 50572 43133 Oct 63 1228 15416 - 4675 - 14353 17728 50575 43135 Nov 63 1228 15439 - 4692 - 14373 17755 50576 43136 Dec 63 1228 15445 - 4699 - 14377 17762 50577 43137 Jan 63 1228 15457 - 4708 - 14387 17776 50584 43143 Feb 63 1228 15469 - 4717 - 14397 17789 50585 43145 Mar 63 1228 15475 - 4725 - 14401 17796 50589 43145 Apr 63 1228 15172 - 4402 - 14401 17796 50589 43145 May 63 1228 15520 - 4785 - 14432 17848 50592 43149 Jun 63 1228 15527 - 4492 - 14506 17856 50585 43155
2011-12 July 63 1228 15470 2970240 4572 185400 14431 17790 50568 43130 Aug 63 1228 13392 2611440 4586 185880 12350 15401 50558 43126 Sept 63 1228 13725 2745000 4592 186123 12681 15784 50562 43128 Oct 63 1228 14237 2847400 4805 201820 14128 16372 50565 43130 Nov 63 1228 14350 287000 4732 198744 13275 16502 50566 43132 Dec 63 1228 14388 2877600 4755 199710 13307 16546 50567 43132 Jan 63 1228 14250 850000 4784 200928 13163 16387 50567 43132 Feb 63 1228 14270 2834000 4780 200760 13184 16410 50568 43133 Mar 63 1228 14570 2914000 4798 201516 13480 16755 50570 43135 Apr 63 1228 14530 2885635 4687 196554 13465 16709 50559 43129 May 63 - 14425 - 4720 - - - 50555 43127 Jun 63 - 14370 - 4735 - - - 50557 43128
2011-12 July 63 - 14430 - 4625 - - - 50557 43128 Aug 63 - 14527 - 4715 - - - 50553 43126 Sept 63 - 14535 - - - - - - - Oct 63 - 14542 - - - - - - - Nov 63 - 14555 - 4729 - - - - - Dec 63 - 14567 - 4765 - - - - - Jan 63 - 14572 2899828 - - - - - - Feb 63 - 14575 2900425 - - - - - - Mar 63 - 14548 - - - - - - - Apr 63 - 14555 - - - - - - - May 63 - 14542 - - - - - - - Jun 63 - 14560 - - - - - - -
Note:These Unit total production does not means the total production of Bangladesh. Source: Bangladesh Textile Mills Corporation and Bangladesh Textile Mills Association.
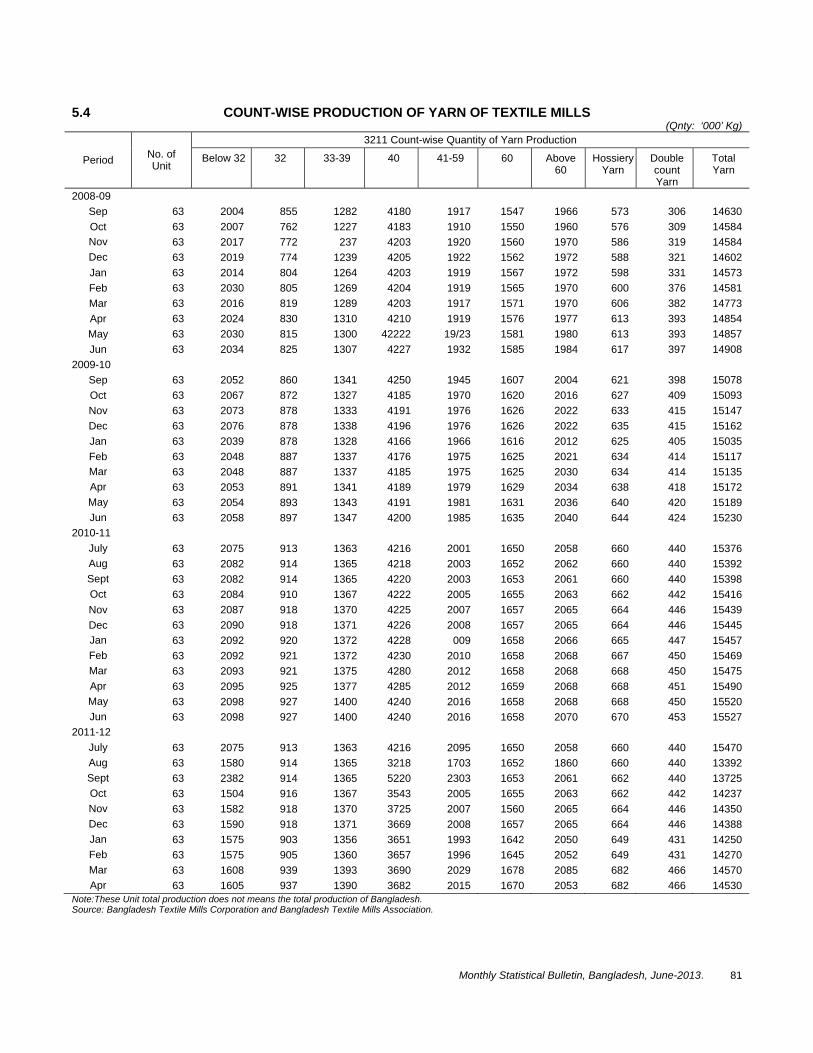
Monthly Statistical Bulletin, Bangladesh, June-2013. . 81
5.4 COUNT-WISE PRODUCTION OF YARN OF TEXTILE MILLS
(Qnty: ‘000’ Kg)
Period No. of Unit
3211 Count-wise Quantity of Yarn Production
Below 32 32 33-39 40 41-59 60 Above 60
Hossiery Yarn
Double count Yarn
Total Yarn
2008-09 Sep 63 2004 855 1282 4180 1917 1547 1966 573 306 14630 Oct 63 2007 762 1227 4183 1910 1550 1960 576 309 14584 Nov 63 2017 772 237 4203 1920 1560 1970 586 319 14584 Dec 63 2019 774 1239 4205 1922 1562 1972 588 321 14602 Jan 63 2014 804 1264 4203 1919 1567 1972 598 331 14573 Feb 63 2030 805 1269 4204 1919 1565 1970 600 376 14581 Mar 63 2016 819 1289 4203 1917 1571 1970 606 382 14773 Apr 63 2024 830 1310 4210 1919 1576 1977 613 393 14854 May 63 2030 815 1300 42222 19/23 1581 1980 613 393 14857 Jun 63 2034 825 1307 4227 1932 1585 1984 617 397 14908
2009-10 Sep 63 2052 860 1341 4250 1945 1607 2004 621 398 15078 Oct 63 2067 872 1327 4185 1970 1620 2016 627 409 15093 Nov 63 2073 878 1333 4191 1976 1626 2022 633 415 15147 Dec 63 2076 878 1338 4196 1976 1626 2022 635 415 15162 Jan 63 2039 878 1328 4166 1966 1616 2012 625 405 15035 Feb 63 2048 887 1337 4176 1975 1625 2021 634 414 15117 Mar 63 2048 887 1337 4185 1975 1625 2030 634 414 15135 Apr 63 2053 891 1341 4189 1979 1629 2034 638 418 15172 May 63 2054 893 1343 4191 1981 1631 2036 640 420 15189 Jun 63 2058 897 1347 4200 1985 1635 2040 644 424 15230
2010-11 July 63 2075 913 1363 4216 2001 1650 2058 660 440 15376 Aug 63 2082 914 1365 4218 2003 1652 2062 660 440 15392 Sept 63 2082 914 1365 4220 2003 1653 2061 660 440 15398 Oct 63 2084 910 1367 4222 2005 1655 2063 662 442 15416 Nov 63 2087 918 1370 4225 2007 1657 2065 664 446 15439 Dec 63 2090 918 1371 4226 2008 1657 2065 664 446 15445 Jan 63 2092 920 1372 4228 009 1658 2066 665 447 15457 Feb 63 2092 921 1372 4230 2010 1658 2068 667 450 15469 Mar 63 2093 921 1375 4280 2012 1658 2068 668 450 15475 Apr 63 2095 925 1377 4285 2012 1659 2068 668 451 15490 May 63 2098 927 1400 4240 2016 1658 2068 668 450 15520 Jun 63 2098 927 1400 4240 2016 1658 2070 670 453 15527
2011-12 July 63 2075 913 1363 4216 2095 1650 2058 660 440 15470 Aug 63 1580 914 1365 3218 1703 1652 1860 660 440 13392 Sept 63 2382 914 1365 5220 2303 1653 2061 662 440 13725 Oct 63 1504 916 1367 3543 2005 1655 2063 662 442 14237 Nov 63 1582 918 1370 3725 2007 1560 2065 664 446 14350 Dec 63 1590 918 1371 3669 2008 1657 2065 664 446 14388 Jan 63 1575 903 1356 3651 1993 1642 2050 649 431 14250 Feb 63 1575 905 1360 3657 1996 1645 2052 649 431 14270 Mar 63 1608 939 1393 3690 2029 1678 2085 682 466 14570 Apr 63 1605 937 1390 3682 2015 1670 2053 682 466 14530
Note:These Unit total production does not means the total production of Bangladesh. Source: Bangladesh Textile Mills Corporation and Bangladesh Textile Mills Association.

Industry, Energy and Mining
Monthly Statistical Bulletin, Bangladesh, June-2013. 82
5.5 VARIETY-WISE PRODUCTION OF CLOTH OF TEXTILE MILLS (Qnty: '000' metre)
Period No. of
Unit
3211- Variet-wise Quantity of Cloth Production Total
Cloth Longcloth Poplin Shirting Drill Markin Others
2008-09 Sep 25 777 311 457 625 1397 588 4155
Oct 25 774 308 454 622 1392 585 4135
Nov 25 779 313 459 627 1397 590 4165 Dec 25 781 315 461 629 1399 592 4077 Jan 25 783 317 463 631 1402 594 4190 Feb 25 793 327 473 641 1432 604 4270 Mar 25 796 329 476 644 1435 607 4287 Apr 25 800 331 478 647 1442 610 4308 May 25 804 335 482 651 1446 614 4332 Jun 25 807 338 485 654 1453 617 4354
2009-10 July 25 803 338 485 654 1453 617 4350 Aug 25 807 342 439 658 1457 617 4370 Sep 25 816 350 406 667 1565 611 4415 Oct 25 820 355 503 663 1500 640 4481 Nov 25 831 366 514 674 1511 651 4490 Dec 25 831 366 514 674 1511 654 4493 Jan 25 731 346 494 654 1491 634 4350 Feb 25 737 352 500 660 1498 638 4385 Mar 25 737 352 500 660 1502 638 4389 Apr 25 740 354 502 662 1504 642 4402 May 25 742 356 504 664 1507 644 4415 Jun 25 745 359 507 667 1512 647 4435
2010-11 July 25 778 392 540 700 1545 682 4635 Aug 25 780 394 542 702 1547 680 4647 Sept 25 785 396 544 704 1549 684 4662 Oct 25 787 398 546 706 1552 686 4675 Nov 25 790 400 549 709 1555 689 4692 Dec 25 792 401 550 710 1556 690 4699 Jan 25 792 403 552 712 1557 692 4708 Feb 25 793 405 553 715 1558 693 4717 Mar 25 795 406 554 716 1560 694 4725 Apr 25 795 406 554 718 1560 694 4727 May 25 804 416 563 728 1570 704 4785 Jun 25 805 417 564 730 1570 706 4792
2011-12 July 25 768 382 530 700 1525 660 4572 Aug 25 770 384 532 693 1537 672 4586 Sept 25 765 386 534 694 1539 674 4592 Oct 25 787 398 596 756 1582 686 4805 Nov 25 790 400 459 749 1555 689 4732 Dec 25 792 407 550 760 1556 690 4755 Jan 25 787 402 545 755 1552 68 5 4784 Feb 25 787 402 545 755 1548 685 4780 Mar 25 790 405 548 758 1551 688 4798 Apr 25 770 397 525 727 1533 677 4687
Note:These Unit total production does not means the total production of Bangladesh. Source: Bangladesh Textile Mills Corporation and Bangladesh Textile Mills Association.

Monthly Statistical Bulletin, Bangladesh, June-2013. . 83
5.6 INSTALLED CAPACITY, EMPLOYMENT, PRODUCTION OF JUTE GOODS AND RAW JUTE CONSUMPTION OF JUTE MILLS
(Qnty: '000' mt)
Period No. of Unit
3213-Production of Jute goods and Raw Jute Installed Capacity
('000' looms)
Employment (all Category)
(Number)
Production of Jute Goods Raw Jute
Consumption Qnty. Value (M. Tk.)
2008-09 Feb 88 22 130850 21 526 23 Mar 88 22 130857 20 501 22 Apr 88 22 101672 19 500 21
May 88 22 101672 18 474 21 Jun 88 22 10222 41 1079 52
2009-10 - - - 25 - - July 88 22 102217 25 658 25 Aug 88 22 102387 24 632 24 Sep 88 22 102402 21 - 21 Oct 88 22 103455 27 - 28 Nov 88 22 102455 26 - 27 Dec 88 22 102469 23 - 24 Jan 88 22 102469 28 738 29 Feb 88 23 102487 24 - 25 Mar 88 23 102481 24 - 25 Apr 88 23 102481 22 - 23
May 88 23 102484 23 - 24 Jun 88 23 102484 37 - 38
2010-11 July 90 24 102490 24 - 26 Aug 88 23 102503 21 - 22
Sept 88 23 102506 27 - 28 Nov 88 23 102515 25 - 26 Dec 88 23 102519 24 - 25 Jan 88 24 102522 25 - 26 Feb 88 24 102525 20 - 21 Mar 88 24 102523 24 - 25 Apr 88 24 - 24 - 25
May 88 24 102525 27 - 28 Jun 88 24 102525 44 - 46
2011-12 July 88 24 102527 28 - 30 Aug 88 24 102527 28 - 30
Sept 88 24 102530 28 - 30 Oct 88 24 102532 33 - 35 Nov 88 24 102535 24 - 25 Dec 88 24 102542 32 - 34 Jan 88 24 102543 24 - 30 Feb 88 24 102545 24 - 25 Mar 88 24 102547 25 - 26 Apr 88 24 125405 30 - 32
May 88 24 25578 28 30 June 88 24 58927 30 32
2011-12 July 88 24 31338 29 - 31 Aug
6Note:These Unit total production does not means the total production of Bangladesh. Source: Bangladesh Jute Mills Corporation and Bangladesh Jute Mills Association.

Industry, Energy and Mining
Monthly Statistical Bulletin, Bangladesh, June-2013. 84
5.7 PRODUCTION OF SILK & SYNTHETIC, DYING & BLEACHING AND CARPET & RUGS (Value: '000' Taka)
Period
3214 3217 3224
Silk & Synthetic Dying & Bleaching Printing Carpet & Rugs
Unit Qnty. ('000'metre)
Value Unit Qnty. ('000'Metre)
Value Unit Qnty. ('000'Metre)
Value Unit Qnty. ('000'Metre)
Value
2008-09 792 11236 - 5699 22742 - 797 8728 3 45425 - 2009-10 - 816 11570 - 5728 22860 - 824 9025 3 40247 -
Jan 7 816 11570 20 5732 22876 4 828 9066 3 40352 17439 Feb 7 818 11043 20 5735 25807 4 826 9044 3 37540 16224 Mar 7 819 11056 20 5737 25816 4 824 9022 3 33750 - Apr 7 817 11029 20 5709 25690 4 820 8978 3 34670 - May 7 818 11024 20 5712 25703 4 824 9022 3 34770 - Jun 7 816 10997 20 5710 25694 4 822 9000 3 34775 -
2010-11 July 7 816 11015 20 5708 25686 4 820 8978 3 30850 - Aug 7 819 11037 20 5710 25695 4 819 8967 3 - - Sept 7 817 - 20 5711 - 4 816 - 3 30120 - Oct 7 818 - 20 5708 - 4 818 - 3 30325 - Nov 7 820 11050 20 5712 25694 4 821 9852 3 30229 - Dec 7 823 11090 20 5720 25740 4 823 9876 3 30337 - Jan 7 821 11063 20 5722 25749 4 825 9900 3 - - Feb 7 823 10699 20 5724 25758 4 827 9924 3 - - Mar 7 825 10725 20 5727 25771 4 830 9960 3 - - Apr 7 817 11029 20 5709 25690 4 820 8978 3 34670 - May 7 826 12390 20 5725 28625 4 829 12435 3 22105 - Jun 7 829 12435 20 5728 28640 4 832 12480 3 0 -
2011-12 July 7 825 12375 20 5730 28650 4 830 12450 3 - - Aug 7 830 12450 20 5734 28670 4 835 12525 - - - Sept 7 833 12495 20 5728 31504 4 827 12405 3 - - Oct 7 825 12375 20 5715 31432 4 810 12150 3 - - Nov 7 820 12300 20 5705 31377 4 805 12075 3 - - Dec 7 813 12195 20 5695 31322 4 798 11970 3 - - Jan 7 805 12075 20 5530 30415 4 745 7450 3 - - Feb 7 785 11775 20 5475 30112 4 718 7180 3 - - Mar 7 769 11535 20 5475 - 4 718 - 3 - - Apr 7 775 10850 20 5465 27325 4 725 7250 3 - - May 7 785 10990 20 5470 27350 4 720 7200 3 - - June 7 790 11060 20 5475 27375 4 425 7250 6 - -
2011-12
July 7 782 10948 20 5467 27335 4 722 7220 3 - - Aug 7 792 11088 20 5448 27240 4 715 7150 3 - -
Sept 7 785 10990 20 5440 27200 4 710 7100 3 - - Oct 7 782 10948 20 5435 27175 4 712 7120 3 - -
Nov 7 787 - 20 5420 32520 4 705 8460 3 - - Dec 7 784 - 20 5395 32370 4 693 8316 3 - - Jan 7 775 10850 20 5378 32268 4 710 8520 3 - - Feb 7 769 10766 20 5380 3228 4 714 8568 3 - - Mar 7 760 10570 20 5365 32190 4 695 6950 - - - Apr 7 766 10710 20 5370 32280 4 705 7100 - - - May 7 755 10570 20 5360 34840 4 720 7200 - - - June 7 765 10710 20 5375 34937 4 731 7310 - - -
Note:These Unit total production does not means the total production of Bangladesh. Source: Private Enterprise.
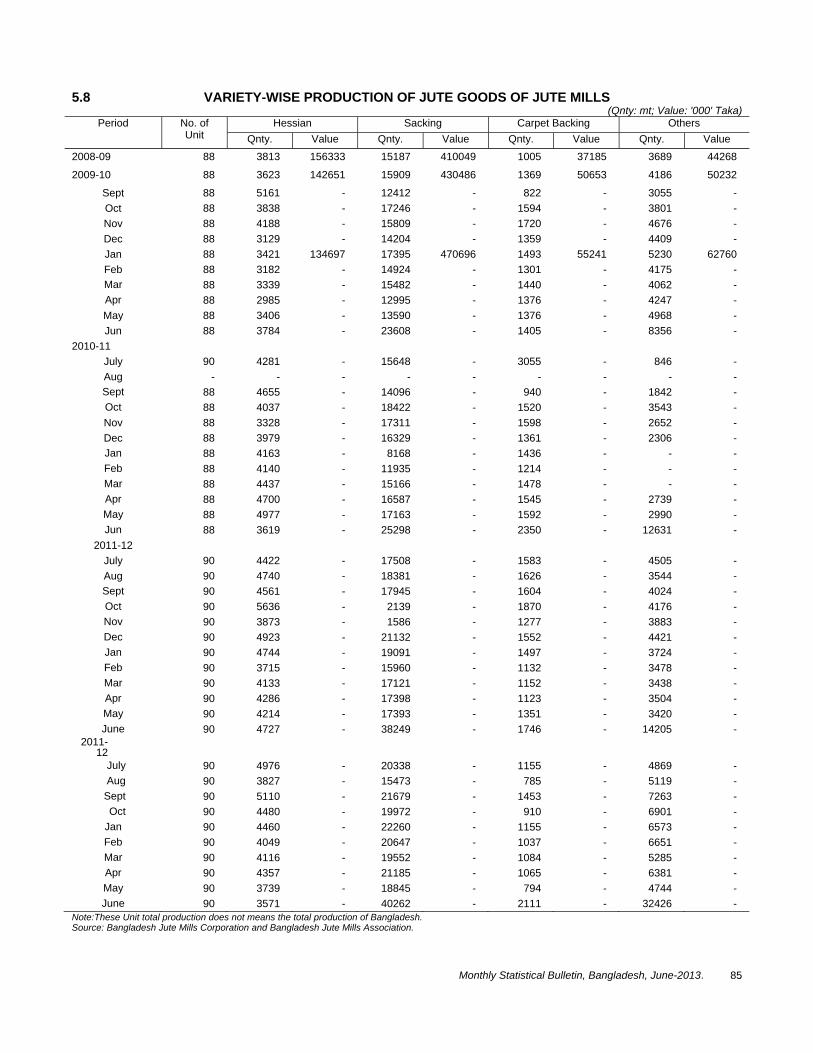
Monthly Statistical Bulletin, Bangladesh, June-2013. . 85
5.8 VARIETY-WISE PRODUCTION OF JUTE GOODS OF JUTE MILLS (Qnty: mt; Value: '000' Taka)
Period No. of Unit
Hessian Sacking Carpet Backing Others Qnty. Value Qnty. Value Qnty. Value Qnty. Value
2008-09 88 3813 156333 15187 410049 1005 37185 3689 44268
2009-10 88 3623 142651 15909 430486 1369 50653 4186 50232
Sept 88 5161 - 12412 - 822 - 3055 - Oct 88 3838 - 17246 - 1594 - 3801 - Nov 88 4188 - 15809 - 1720 - 4676 - Dec 88 3129 - 14204 - 1359 - 4409 - Jan 88 3421 134697 17395 470696 1493 55241 5230 62760 Feb 88 3182 - 14924 - 1301 - 4175 - Mar 88 3339 - 15482 - 1440 - 4062 - Apr 88 2985 - 12995 - 1376 - 4247 - May 88 3406 - 13590 - 1376 - 4968 - Jun 88 3784 - 23608 - 1405 - 8356 -
2010-11 July 90 4281 - 15648 - 3055 - 846 - Aug - - - - - - - - - Sept 88 4655 - 14096 - 940 - 1842 - Oct 88 4037 - 18422 - 1520 - 3543 - Nov 88 3328 - 17311 - 1598 - 2652 - Dec 88 3979 - 16329 - 1361 - 2306 - Jan 88 4163 - 8168 - 1436 - - - Feb 88 4140 - 11935 - 1214 - - - Mar 88 4437 - 15166 - 1478 - - - Apr 88 4700 - 16587 - 1545 - 2739 - May 88 4977 - 17163 - 1592 - 2990 - Jun 88 3619 - 25298 - 2350 - 12631 -
2011-12 July 90 4422 - 17508 - 1583 - 4505 - Aug 90 4740 - 18381 - 1626 - 3544 - Sept 90 4561 - 17945 - 1604 - 4024 - Oct 90 5636 - 2139 - 1870 - 4176 - Nov 90 3873 - 1586 - 1277 - 3883 - Dec 90 4923 - 21132 - 1552 - 4421 - Jan 90 4744 - 19091 - 1497 - 3724 - Feb 90 3715 - 15960 - 1132 - 3478 - Mar 90 4133 - 17121 - 1152 - 3438 - Apr 90 4286 - 17398 - 1123 - 3504 - May 90 4214 - 17393 - 1351 - 3420 - June 90 4727 - 38249 - 1746 - 14205 -
2011-12
July 90 4976 - 20338 - 1155 - 4869 - Aug 90 3827 - 15473 - 785 - 5119 -
Sept 90 5110 - 21679 - 1453 - 7263 - Oct 90 4480 - 19972 - 910 - 6901 -
Jan 90 4460 - 22260 - 1155 - 6573 - Feb 90 4049 - 20647 - 1037 - 6651 - Mar 90 4116 - 19552 - 1084 - 5285 - Apr 90 4357 - 21185 - 1065 - 6381 - May 90 3739 - 18845 - 794 - 4744 - June 90 3571 - 40262 - 2111 - 32426 -
Note:These Unit total production does not means the total production of Bangladesh. Source: Bangladesh Jute Mills Corporation and Bangladesh Jute Mills Association.

Industry, Energy and Mining
Monthly Statistical Bulletin, Bangladesh, June-2013. 86
5.9 PRODUCTION OF READY-MADE GARMENTS, TANNED AND FINISHED LEATHER
Period 3231 Ready-made Garments 3241-Tanning and Finished Leather Qnty. ('000' doz) Value (Million
Taka) Qnty: ('000' Sq.m.) Value: (Million
Taka) 2009-10 - - 871 - Mar 17923 42571 1049 1480
Apr 14857 35074 1007 1509
May 16328 38505 1186 1775
Jun 14474 43235 1181 1754
2010-11
Sep 11482 33019 674 1190
Oct 16401 39426 780 1536
Nov 19706 47930 760 -
Dec 20200 45700 800 -
Jan 19812 47175 700 1474
Feb 21632 52317 966 1913
Mar 24583 60098 1208 2417
Apr 14857 50748 1007 5097
May 23935 59374 1138 2314
Jun 26912 67116 973 2001
2011-12
July 26516 66128 700 1178
Aug 26002 64847 793 1327
Sept 15534 38739 332 556
Oct 21416 53409 835 1397
Nov 19280 48081 539 902
Dec 28224 70387 661 1106 Jan 30645 76424 822 1375 Feb 28792 71805 1198 2005 Mar 28448 70951 1374 1374 Apr 23572 58785 1270 2138
May 28450 70951 821 1374 June 29621 73871 790 1323
2011-12 July - 81266 672 2347 Aug - 62395 1150 1871
Sept - 57139 1895 1972 Oct - 61753 1528 2560
Nov - 57807 1104 1850
Dec - 84186 1773 2970 Jan - 91743 1529 2569 Feb - 77761 1497 2515 Mar - 78182 1966 3303 Apr - 65011 2079 3494
May - 77795 2136 3631 June - 87379 1688 2869
Note: Date are base on export figures.

Monthly Statistical Bulletin, Bangladesh, June-2013. . 87
5.10 PRODUCTION OF HARD BOARD PARTICLE BOARD & WOODEN FURNITURE (Qnty: '000' Sq. m & Value: '000' Taka)
Period 3314-Hard Board 3314-Particle Board 3314-Wooden Furniture No. of Unit Qnty. Value No. of Unit Qnty . Value No. of Unit Qnty. Value
2009-10 - - - - - - - 6080 10920 Nov 1 82 6938 3 516 75625 10 6075 10911 Dec 1 87 7375 3 526 77091 10 6080 10920 Jan 1 18 1373 3 536 78556 10 6082 33451 Feb 1 108 9585 3 546 80022 10 6085 33467 Mar 1 128 9849 3 548 80315 10 6082 33450 Apr 1 88 6662 3 552 80901 10 6086 33472 May 1 111 9115 3 556 81487 10 6088 33483 Jun 1 109 - 3 558 - 10 6090 33494
2010-11 Sep 1 95 - 3 569 83387 10 6087 33478 Oct 1 102 - 3 573 83973 10 6089 33489 Nov 1 95 - 3 590 86464 10 6093 36558 Dec 1 92 - 3 592 86757 10 6095 36570 Jan 1 52 - 3 595 - 10 6090 36540 Feb 1 40 - 3 598 - 10 6098 36588 Mar 1 39 - 3 601 - 10 6100 42700 Apr 1 88 6662 3 552 80901 10 6086 33472 May 1 0.1 73 3 602 - 10 6000 42000 Jun 1 0.1 525 3 597 - 10 6008 42056
2011-12 July 1 24 2162 3 620 90860 10 5992 41944 Aug 1 - - 3 629 92179 10 5998 41986 Sept 1 - - 3 629 92179 10 5990 41930 Oct 1 - - 3 633 92715 10 5985 41895 Nov 1 - - 3 635 93059 10 5995 4965 Dec 1 - - 3 640 93791 10 5980 41860 Nov 1 - - 3 635 93059 10 5995 4965 Dec 1 - - 3 640 93791 10 5980 41860 Jan 1 - - 3 645 94523 10 5970 44775 Feb 1 - - 3 650 95256 10 5875 44062 Mar 1 - - 3 655 95630 10 5430 40725 Apr 1 - - 3 660 - 10 5430 41650 May 1 - - 3 660 97455 10 5430 40725 June 1 - - 3 625 - 10 5435 70762
2011-12
July 1 - - 3 630 - 10 5428 40709 Aug 1 - - 3 635 - 10 5410 40574
Sept 1 - - 3 639 - 10 5395 40462 Oct 1 - - 3 638 - 10 5335 40012 Nov 1 - - 3 642 - 10 5400 40500 Dec 1 - - 3 646 - 10 5475 41062 Jan 1 - - 3 648 - 10 5395 40462 Feb 1 - - 3 650 - 10 5398 40485 Mar 1 - - 3 652 - 10 5381 40357 Apr 1 - - 3 658 - 10 5391 40425 May 1 - - 3 665 - 10 5415 40612 June 1 - - 3 668 - 10 5452 40890
Note:These Unit total production does not means the total production of Bangladesh. Source: Bangladesh Forest Industries Development Corporation and Private Enterprise.

Industry, Energy and Mining
Monthly Statistical Bulletin, Bangladesh, June-2013. 88
5.10 PRODUCTION OF PAPER (ALL KINDS) AND NEWSPAPER (Value: ‘000’ Taka)
Period 3411-Paper (all kinds) 3421-News Paper No. of Unit Qnty. (mt) Value
No. of Unit Qnty.
(‘000’ Nos.) Value
2009-10
Nov 1 1906 151955 10 39271 328272 Dec 1 1854 148571 10 39721 238380 Jan 1 317 103830 10 39739 238434 Feb 1 151 9943 10 39748 238488 Mar 1 1417 112878 10 39750 238500 Apr 1 1328 106374 10 39890 239340
May 1 2540 208280 10 39896 239376 Jun 1 1862 - 10 39920 -
2010-11 July 1 1737 153522 10 39924 239544 Aug 1 1535 139712 10 39930 239580 Sep 1 1636 113273 10 39934 239604 Oct 1 1670 102875 10 39938 239628 Nov 1 1410 125200 10 39940 239646 Dec 1 1565 144076 10 39942 239664 Jan 1 1410 - 10 39947 - Feb 1 1789 - 10 39950 - Mar 1 2097 - 10 39953 - Apr 1 1328 106374 10 39890 239340 May 1 2045 185379 10 39925 239550 Jun 1 2049 185742 10 39928 239568
2011-12 July 1 4963 173626 10 39967 2398029 Aug 1 4614 165847 10 39970 2398209
Sept 1 4334 416202 10 39973 239878 Oct 1 5441 - 10 39976 239856 Nov 1 4876 - 10 39980 239880 Dec 1 6020 - 10 39984 239904 Jan 1 3885 - 10 39990 - Feb 1 4285 - 10 39996 - Mar 1 4587 - 10 39999 - Apr 1 4687 450101 10 39890 239340
May 1 4724 - 10 39818 239388 June 1 4755 - 10 39998 -
2011-12 July 1 5864 - 10 39995 - Aug 1 4849 - 10 39997 -
Sept 1 4637 - 10 39998 - Oct 1 4430 - 10 40005 - Nov 1 4485 - 10 40012 - Dec 1 4889 - 10 40017 - Jan 1 4882 - 10 40019 - Feb 1 4503 - 10 40021 - Mar 1 4572 - 10 40023 - Apr 1 4513 - 10 40025 -
May 1 4684 - 10 40035 - June 1 4660 - 10 40053 -
239340Note:These Unit total production does not means the total production of Bangladesh. Source: Bangladesh Chemical Industries Corporation and Trusts of Paper and Other Paper Offices.
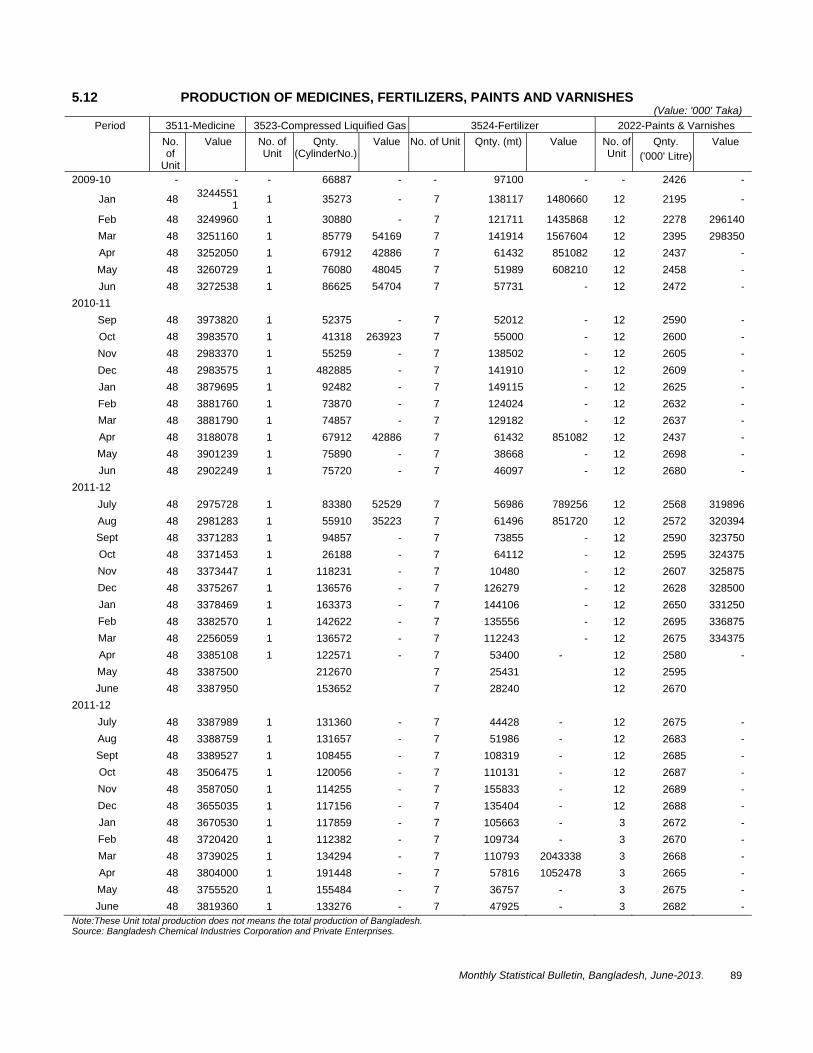
Monthly Statistical Bulletin, Bangladesh, June-2013. . 89
5.12 PRODUCTION OF MEDICINES, FERTILIZERS, PAINTS AND VARNISHES (Value: '000' Taka)
Period 3511-Medicine 3523-Compressed Liquified Gas 3524-Fertilizer 2022-Paints & Varnishes No. of
Unit
Value No. of Unit
Qnty. (CylinderNo.)
Value No. of Unit Qnty. (mt) Value No. of Unit
Qnty. ('000' Litre)
Value
2009-10 - - - 66887 - - 97100 - - 2426 -
Jan 48 32445511 1 35273 - 7 138117 1480660 12 2195 -
Feb 48 3249960 1 30880 - 7 121711 1435868 12 2278 296140 Mar 48 3251160 1 85779 54169 7 141914 1567604 12 2395 298350 Apr 48 3252050 1 67912 42886 7 61432 851082 12 2437 - May 48 3260729 1 76080 48045 7 51989 608210 12 2458 - Jun 48 3272538 1 86625 54704 7 57731 - 12 2472 -
2010-11 Sep 48 3973820 1 52375 - 7 52012 - 12 2590 - Oct 48 3983570 1 41318 263923 7 55000 - 12 2600 - Nov 48 2983370 1 55259 - 7 138502 - 12 2605 - Dec 48 2983575 1 482885 - 7 141910 - 12 2609 - Jan 48 3879695 1 92482 - 7 149115 - 12 2625 - Feb 48 3881760 1 73870 - 7 124024 - 12 2632 - Mar 48 3881790 1 74857 - 7 129182 - 12 2637 - Apr 48 3188078 1 67912 42886 7 61432 851082 12 2437 - May 48 3901239 1 75890 - 7 38668 - 12 2698 - Jun 48 2902249 1 75720 - 7 46097 - 12 2680 -
2011-12 July 48 2975728 1 83380 52529 7 56986 789256 12 2568 319896 Aug 48 2981283 1 55910 35223 7 61496 851720 12 2572 320394 Sept 48 3371283 1 94857 - 7 73855 - 12 2590 323750 Oct 48 3371453 1 26188 - 7 64112 - 12 2595 324375 Nov 48 3373447 1 118231 - 7 10480 - 12 2607 325875 Dec 48 3375267 1 136576 - 7 126279 - 12 2628 328500 Jan 48 3378469 1 163373 - 7 144106 - 12 2650 331250 Feb 48 3382570 1 142622 - 7 135556 - 12 2695 336875 Mar 48 2256059 1 136572 - 7 112243 - 12 2675 334375 Apr 48 3385108 1 122571 - 7 53400 - 12 2580 - May 48 3387500 212670 7 25431 12 2595 June 48 3387950 153652 7 28240 12 2670
2011-12 July 48 3387989 1 131360 - 7 44428 - 12 2675 - Aug 48 3388759 1 131657 - 7 51986 - 12 2683 - Sept 48 3389527 1 108455 - 7 108319 - 12 2685 - Oct 48 3506475 1 120056 - 7 110131 - 12 2687 - Nov 48 3587050 1 114255 - 7 155833 - 12 2689 - Dec 48 3655035 1 117156 - 7 135404 - 12 2688 - Jan 48 3670530 1 117859 - 7 105663 - 3 2672 - Feb 48 3720420 1 112382 - 7 109734 - 3 2670 - Mar 48 3739025 1 134294 - 7 110793 2043338 3 2668 - Apr 48 3804000 1 191448 - 7 57816 1052478 3 2665 - May 48 3755520 1 155484 - 7 36757 - 3 2675 - June 48 3819360 1 133276 - 7 47925 - 3 2682 -
Note:These Unit total production does not means the total production of Bangladesh. Source: Bangladesh Chemical Industries Corporation and Private Enterprises.

Industry, Energy and Mining
Monthly Statistical Bulletin, Bangladesh, June-2013. 90
2009.14 VARIETY-WISE PRODUCTION OF CHEMICALS (Value: ‘000’ Taka)
Period No. of Unit
Sulphuric Acid
No. of Unit Hydrochloric Acid Caustic Soda Chlorine
Qnty. (mt) QNty. (mt) Value Qnty. (mt) Value Qnty. (mt) Value 2007-08
Jul 1 - 2 -
-
-
-
-
-
Aug 1 - 2 - - - - - - Sep 1 - 2 - - - - - - Oct 1 - 2 - - - - - - Nov 1 - 2 - - - - - - Dec 1 - 2 - - - - - - Jan 1 - 2 - - - - - - Feb 1 - 2 - - - - - - Mar 1 - 2 - - - - - - Apr 1 - 2 - - - - - -
May 1 - 2 - - - - - - Jun 1 - 2 - - - - - -
2008-09
Jul 1 - 2 -
-
-
-
-
-
Aug 1 - 2 - - - - - -
Sep 1 - 2 -
-
-
-
-
-
Oct 1 - 2 - - - - - - Nov 1 - 2 - - - - - - Dec 1 - 2 - - - - - - Jan 1 - 2 - - - - - - Feb 1 - 2 - - - - - - Mar 1 - 2 - - - - - - Apr 1 - 2 - - - - - -
May 1 - 2 - - - - - -
Jun 1 - 2 -
-
-
-
-
-
2009-10 Jul 1 - 2 - - - - - - Aug 1 - 2 - - - - - - Sep 1 - 2 - - - - - - Oct 1 - 2 - - - - - - Nov 1 - 2 - - - - - - Dec 1 - 2 - - - - - - Jan 1 - 2 - - - - - - Feb 1 - 2 - - - - - - Mar 1 - 2 - - - - - - Apr 1 - 2 - - - - - - Sep - - - - - - - - - Oct - - - - - - - - - May Jun Apr - - - - - - - - - Sep - - - -- - - - - - Oct - - - - - - - - -
Note:These Unit total production does not means the total production of Bangladesh. Source: Bangladesh Chemical Industries Corporation.

Monthly Statistical Bulletin, Bangladesh, June-2013. . 91
2009.14 PRODUCTION OF SOAP & DETERGENT, MATCHES, PETROLEUM, RUBBER FOOTWEAR AND CYCLE TYRES & TUBES
(Value: ‘000’ Taka)
Period
3532-Perfumes & Cosmetics
3533-Soap and Detergent 3535-Matches 3541-Petroleum Production
No. of Unit
Value No. of Unit
Qnty. (mt)
Value No. of
Unit
Qnty. (‘000’ Gross box)
Value No. of
Unit
Qnty. (mt) Value
1 2 3 4 5 6 7 8 9 10 11 12 2009-10 - - - 5180 - 20 1110 66600 - 105516 -
Jan 12 190577 14 4895 - 20 1055 63300 1 95270 - Feb 12 192780 14 4987 300739 20 1027 61620 1 106244 3672273 Mar 12 195375 14 5056 305888 20 1045 62700 1 112785 3633121 Apr 12 196589 14 5058 306009 20 1067 64020 1 118840 370019 May 12 208495 14 5095 - 20 1075 64500 1 120860 3887633 Jun 12 208992 14 6027 - 20 1108 - 1 12446 3972784
2010-11 July 12 209087 14 6020 364210 20 1123 67380 1 85178 2937834
Aug 12 14 6023 364391 - - - 1 125513 4111654 Sep 12 209175 14 6021 364270 20 1175 70500 1 113510 3930764 Oct 12 209587 14 6020 364200 20 1177 70620 1 97120 3460235 Nov 12 209589 14 6022 - 20 1180 70800 1 108390 - Dec 12 209597 14 6025 - 20 1182 70920 1 120420 - Jan 12 209627 14 6025 - 20 1184 71040 1 125370 - Feb 12 209698 14 6032 - 20 1187 71400 1 107320 - Mar 12 209715 14 6035 - 20 1190 64020 1 115060 - Apr 12 141135 14 5058 306009 20 1067 - 1 118840 370019 May 12 212547 14 6045 - 20 1192 64022 1 119870 4335299 Jun 12 213590 14 5549 - 20 1194 64022 1 109270 3750253
2011-12 July 12 209286 14 5357 324098 20 1125 60322 1 89570 3074042
Aug 12 209525 14 5360 323744 20 1132 60697 1 95089 3263454 Sept 12 219420 14 5275 318610 20 1235 66219 1 923203 31684533 Oct 12 219934 14 5088 305280 20 1482 79463 1 93709 3216093 Nov 12 219932 14 5895 365490 20 1720 92224 1 103890 3565505 Dec 12 221578 14 5275 327050 20 1725 92492 1 125990 4323977 Jan 12 159821 14 5270 - 20 1525 - 1 123160 - Feb 12 159971 14 5340 - 20 1530 - 1 113220 - Mar 12 160750 14 5357 - 20 1565 - 1 114800 - Apr 12 225295 14 5430 - 20 1795 - 1 114920 - May 12 227590 14 5527 - 20 1732 - 1 120220 - June 12 228355 14 5539 - 20 1738 - 1 115080 -
2011-12
July 3 228570 14 5625 - 2 1762 - 1 1138000 - Aug 3 228755 14 5629 - 2 1765 - 1 114120 -
Sept 3 228927 14 5632 - 2 1770 - 1 101860 - Oct 3 228938 14 5646 - 2 1775 - 1 123160 - Nov 3 229280 14 5648 - 2 1782 - 1 104925 - Dec 3 229109 14 5647 - 2 1780 - 1 129560 - Jan 3 229530 14 5619 - 2 1730 - 1 130210 - Feb 3 229725 14 5652 - 2 1735 - 1 111210 - Mar 3 229867 14 5657 - 2 1732 - 1 121120 - Apr 3 229867 14 5660 - 2 1728 - 1 121730 - May 3 229868 14 5664 - 2 1720 - 1 108140 - June 3 229868 14 5667 - 2 1718 - 1 122220 -
Note:These Unit total production does not means the total production of Bangladesh.102575 Source: Petro-Bangla and Private Enterprises.93317

Industry, Energy and Mining
Monthly Statistical Bulletin, Bangladesh, June-2013. 92
5.14 RUBBER FOOTWEAR AND CYCLE TYRES & TUBES-CONTD. (Value: '000' Taka)
Period 3561-Cycle Tyres and Tubes 3569-Rubber Products (Footwear) 3579-PVC Products No. of
Unit Qnty. (Doz)
Value No. of Unit
Qnty. (Doz)
Value No. of Unit
Qnty. (mt)
Value
13 14 15 16 17 18 19 20 21 2009-10 - - - - 27729 - - 1584 -
Jan 3 3502 - 17 26750 - 6 1570 - Feb 3 3528 3527 17 25870 3622 6 1582 94920 Mar 3 3540 3539 17 25947 3684 6 1595 95700 Apr 3 3545 3544 17 26280 - 6 1609 -
May 3 3550 3549 17 26280 - 6 1723 - Jun 3 3562 3561 17 27530 - 6 1755 -
2010-11
July 3 3325 - 17 25098 - 6 1865 -
Aug 3 3325 - 17 24385 - 6 1873 - Sep 3 3384 - 17 24538 - 6 1895 - Oct 3 3398 - 17 25300 - 6 1898 - Nov 3 3407 - 17 25350 - 6 1900 - Dec 3 3428 - 17 25355 - 6 1905 - Jan 3 3433 - 17 27872 - 6 1940 - Feb 3 3350 - 17 27877 - 6 1955 - Mar 3 3465 - 17 27886 - 6 1970 - Apr 3 3545 3344 17 26075 - 6 1609 -
May 3 3450 - 17 25078 - 6 2026 - Jun 3 3448 - 17 26190 - 6 2039 -
2011-12 July 3 3530 - 17 19058 - 6 2015 -
Aug 3 3495 - 17 19085 - 6 2027 - Sept 3 3590 - 17 18720 - 6 2135 - Oct 3 3579 - 17 18590 - 6 2075 - Nov 3 3587 - 17 15650 - 6 2178 - Dec 3 3609 - 17 18765 - 6 2190 - Jan 3 3615 - 17 15305 - 6 2170 - Feb 3 3480 - 17 15230 - 6 2180 - Mar 3 3495 - 17 15290 - 6 2250 - Apr 3 3520 - 17 16370 - 6 2275 -
May 17 16485 2290 June 17 16690 2237
2011-12 July - - - 17 16755 - 6 2549 - Aug - - - 17 16572 - 6 2557 -
Sept - - - 17 16580 - 6 2562 - Oct - - - 17 16785 - 6 2567 - Nov - - - 17 17624 - 6 2668 - Dec - - - 17 17658 - 6 2665 - Jan - - - 17 17672 - 6 2650 - Feb - - - 17 17683 - 6 2532 - Mar - - - 17 18743 - 6 2453 - Apr - - - 17 18820 - 6 2438 -
May - - - 17 18867 - 6 2430 - June - - - 17 18895 - 6 2418 -
Note:These Unit total production does not means the total production of Bangladesh. Source: Petro-Bangla and Private Enterprises.

Monthly Statistical Bulletin, Bangladesh, June-2013. . 93
5.15 PRODUCTION OF CEMENT, GLASS, CERAMICS AND BRICKS (Value: '000' Taka)
Period 3612-China Ceramics 3621-Glass Sheet 3622-Glass Product
No. of Unit
Qnty.('000' Doz)
Value No. of Unit Qnty. ('000' sq.m.)
Value No. of Unit
Qnty. (Gross)
Value
1 2 3 4 5 6 7 8 9 10 2009-10 - - - - 163 18582 - 320992 75257
Jan 6 746 262077 1 177 19330 11 305247 - Feb 6 748 262780 1 131 14545 11 308547 72340 Mar 6 750 263482 1 - - 11 308750 72387 Apr 6 755 265239 1 112 12804 11 308745 72386
May 6 760 266995 1 - - 11 308747 72386 Jun 6 762 - 1 177 19783 11 308742 72385
2010-11 - - - - 162 16709 - - - July 6 765 268745 1 168 15407 11 308740 72384
Aug 6 768 269798 1 134 17159 11 308742 72385 Sep 6 772 271204 1 - - - 308745 72385 Oct 6 775 272258 1 - - - 308748 72386 Nov 6 778 273311 1 167 16727 11 308750 154375 Dec 6 780 274716 1 178 18139 11 308752 154376 Jan 6 786 - 1 170 - 11 308745 154372 Feb 6 789 - 1 173 - 11 308748 154373 Mar 6 791 - 1 179 - 11 308740 154369 Apr 6 755 265239 1 182 - 11 308745 150308
May 6 760 - 1 126 15165 11 308745 150300 Jun 6 760 - 1 100 12040 11 308730 150297
2011-12 July 6 732 - 1 120 - 11 228712 - Aug 6 740 - 1 127 - 11 228825 -
Sept 6 742 - 1 122 - 11 225490 - Oct 6 743 - 1 118 - 11 225590 - Nov 6 745 - 1 123 - 11 210890 - Dec 6 752 - 1 123 - 11 203150 - Jan 6 760 - 1 122 - 11 179500 - Feb 6 755 - 1 120 - 11 155200 - Mar 6 760 - 1 123 - 11 155200 - Apr 6 785 - 1 131 - 11 155800 -
May 6 790 11 155300 - June 6 795 11 152500 -
2011-12 July 5 760 - 1 201 - 11 152120 - Aug 5 762 - 1 202 - 11 150000 -
Sept 5 - - 1 194 - 11 145000 - Oct 5 - - 1 199 - 11 140000 - Nov 5 774 - - - - 11 135000 - Dec 5 770 - - - - 11 130000 - Jan 5 1 11 122700 - Feb 5 1 11 118500 - Mar 5 10610 1 - - 11 115650 - Apr 5 10650 1 - - 11 110600 -
May 5 768 - 1 - - 11 105300 - June 5 769 - 1 - - 11 100250 -
Note:These Unit total production does not means the total production of Bangladesh.

Industry, Energy and Mining
Monthly Statistical Bulletin, Bangladesh, June-2013. 94
5.15 PRODUCTION OF CEMENT, GLASS, CERAMICS AND BRICKS-CONTD. (Value: '000' Taka)
Period 3691-Brick & Tile 3692-Cement
No. of Unit
Qnty . ('000' No.)
Value No. of Unit
Qnty. (M.T.)
Value
11 12 13 14 15 16 2008-09 8528 24608 - - - - 2009-10 - 9518 28554 - 239766 -
Dec 9 8960 - 12 243935 1512397 Jan 9 8275 - 12 235720 1337464 Feb 9 10375 31125 12 236330 1341246 Mar 9 10590 31770 12 240010 1487875 Apr 9 10595 31785 12 239833 1487205 May 9 10590 31770 12 243056 1506947 Jun 9 10592 31776 12 245675 1523185
2010-11 Sep 9 10590 37065 12 357469 2216308 Oct 9 10592 37072 12 357473 2216333 Nov 9 10595 37082 12 248360 - Dec 9 10599 37096 12 248362 - Jan 9 10600 37100 12 248390 - Feb 9 10605 37117 12 248577 - Mar 9 10707 37124 12 248586 - Apr 9 10595 31785 12 239833 1487205 May 9 10595 37082 12 357550 - Jun 9 10590 37065 12 357655 -
2011-12 July 9 10580 31740 12 357349 2501443 Aug 9 10575 31720 12 354960 2484720 Sept 9 10300 30900 12 355830 - Oct 9 10550 31650 12 345960 - Nov 9 10560 31680 12 356750 - Dec 9 10585 10485 12 355370 - Jan 9 10595 32592 12 254941 - Feb 9 10185 31468 12 285115 - Mar 9 10070 - 12 286527 - Apr 9 10023 35050 12 286630 - May 9 10010 35035 289050 June 9 10000 35000 282165
2011-12
July 9 10020 35070 8 283570 - Aug 9 9977 34919 8 283785 -
Sept 9 9960 34860 8 286750 - Oct 9 9950 34825 8 288500 - Nov 9 9560 38240 8 287210 - Dec 9 9240 36960 8 288650 - Jan 9 9255 46275 8 289370 - Feb 9 9265 46325 8 289500 - Mar 9 9728 37088 8 290300 - Apr 9 9735 37128 8 292480 - May 9 9725 34037 8 292530 - June 9 9730 34055 8 293700 -
Note:These Unit total production does not means the total production of Bangladesh.12 ource: Bangladesh Chemical Industries Corporation and Private Enterprises.12
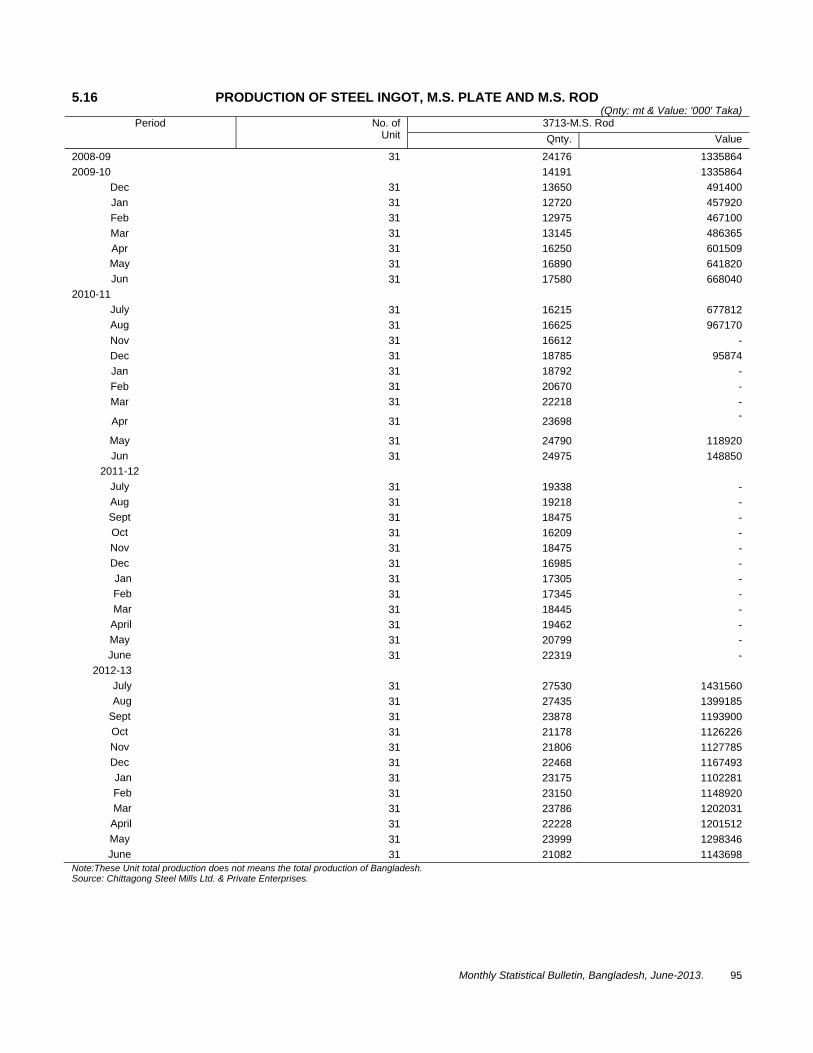
Monthly Statistical Bulletin, Bangladesh, June-2013. . 95
5.16 PRODUCTION OF STEEL INGOT, M.S. PLATE AND M.S. ROD (Qnty: mt & Value: '000' Taka)
Period No. of Unit
3713-M.S. Rod Qnty. Value
2008-09 31 24176 1335864 2009-10 14191 1335864
Dec 31 13650 491400 Jan 31 12720 457920 Feb 31 12975 467100 Mar 31 13145 486365 Apr 31 16250 601509 May 31 16890 641820 Jun 31 17580 668040
2010-11 July 31 16215 677812 Aug 31 16625 967170 Nov 31 16612 - Dec 31 18785 95874 Jan 31 18792 - Feb 31 20670 - Mar 31 22218 -
Apr 31 23698 -
May 31 24790 118920 Jun 31 24975 148850
2011-12 July 31 19338 - Aug 31 19218 - Sept 31 18475 - Oct 31 16209 - Nov 31 18475 - Dec 31 16985 - Jan 31 17305 - Feb 31 17345 - Mar 31 18445 -
April 31 19462 - May 31 20799 - June 31 22319 -
2012-13 July 31 27530 1431560 Aug 31 27435 1399185
Sept 31 23878 1193900 Oct 31 21178 1126226 Nov 31 21806 1127785 Dec 31 22468 1167493 Jan 31 23175 1102281 Feb 31 23150 1148920 Mar 31 23786 1202031
April 31 22228 1201512 May 31 23999 1298346 June 31 21082 1143698
Note:These Unit total production does not means the total production of Bangladesh. Source: Chittagong Steel Mills Ltd. & Private Enterprises.

Industry, Energy and Mining
Monthly Statistical Bulletin, Bangladesh, June-2013. 96
5.17 RODUCTION OF UTENSIL AND PLUMBING EQUIPMENT (Value : ‘000’ Taka)
Period 3819-Utensils 3827-Plumbing Equipment Aluminium Equipment
No. of Unit Qnty. (mt) Value No. of Unit Qnty. (Doz) Value 2009-10 - 616 123200 12 36785 30531
Jan 41 617 132655 12 36789 30535 Feb 41 618 132870 12 36792 30537 Mar 41 620 133300 12 36794 30539 Apr 41 622 133730 12 36793 30538 May 41 623 133945 12 36796 30541 Jun 41 625 134375 12 36794 30539
2010-11 July 41 624 134160 12 36787 30901 Aug 41 626 134590 12 36787 30901 Sep 41 627 134805 12 36785 30899 Oct 41 625 134375 12 36786 30900
Nov 41 627 137940 12 36788 31270 Dec 41 630 138600 12 36790 31272 Jan 41 628 138160 12 36789 31271 Feb 41 627 137940 12 36791 31272 Mar 41 629 138380 12 36794 31275 Apr 41 622 133730 12 36797 31645 May 41 627 144900 12 36802 31650 Jun 41 631 145130 12 36805 31652
2011-12 July 41 628 144440 12 36812 44174 Aug 41 630 144900 12 36808 44170 Sept 41 634 145820 12 36811 44173 Oct 41 628 144440 12 36810 46013 Nov 41 625 14.750 12 36812 46015 Dec 41 610 141450 12 36818 51545 Jan 41 609 152150 12 36815 51541 Feb 41 597 161190 12 36788 51503 Mar 41 597 - 12 36735 51429 April 41 586 158220 12 36250 54375 May 583 157410 12 36225 54338 June 580 156600 12 36210 54315
2011-12 July 41 590 159300 12 35105 56168 Aug 41 586 158220 12 34354 58402 Sept 41 580 - 8 34147 60099 Oct 41 586 - 8 34120 61416 Nov 41 582 - 8 34100 61380 Dec 41 583 - 8 33897 61015 Jan 41 586 - 8 32855 65710 Feb 41 587 - 8 32675 65350 Mar 41 597 - 8 32673 67306 April 41 606 - 8 32690 68649 May 41 682 - 8 32710 68691 June 41 685 - 8 32727 70363
Note:These Unit total production does not means the total production of Bangladesh. Source: Private Enterprises.
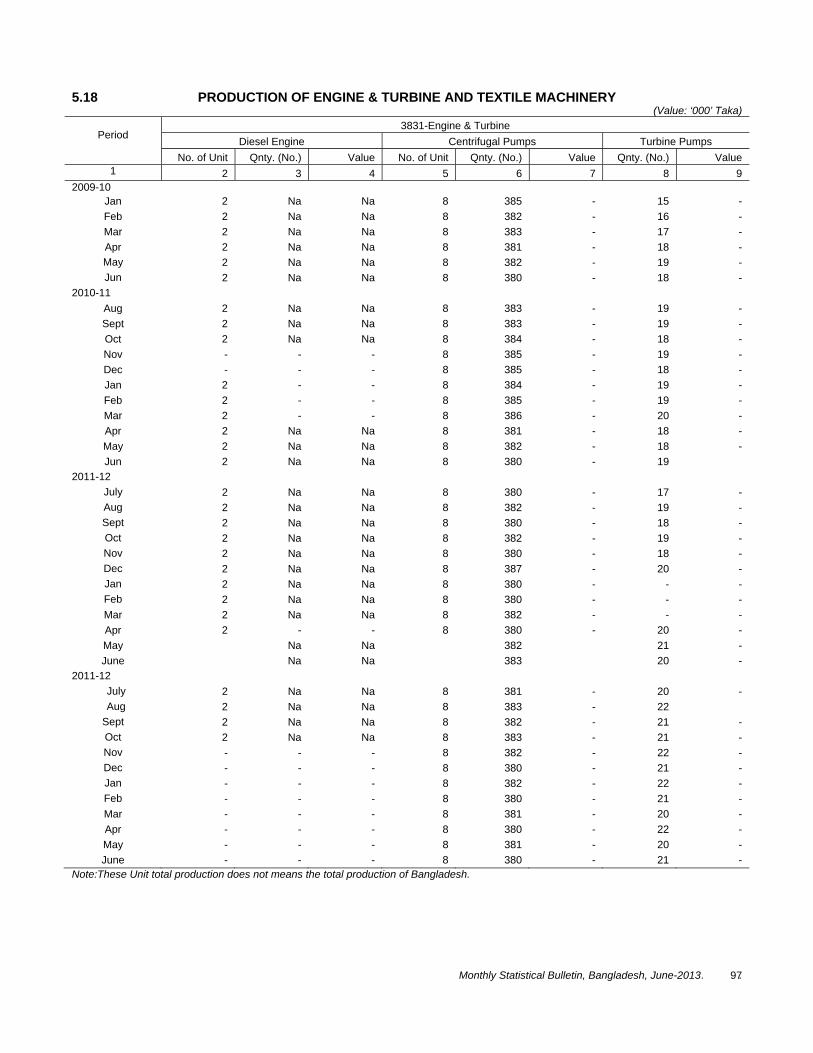
Monthly Statistical Bulletin, Bangladesh, June-2013. . 97
5.18 PRODUCTION OF ENGINE & TURBINE AND TEXTILE MACHINERY (Value: ‘000’ Taka)
Period
3831-Engine & Turbine Diesel Engine Centrifugal Pumps Turbine Pumps
No. of Unit Qnty. (No.) Value No. of Unit Qnty. (No.) Value Qnty. (No.) Value 1 2 3 4 5 6 7 8 9
2009-10 Jan 2 Na Na 8 385 - 15 - Feb 2 Na Na 8 382 - 16 - Mar 2 Na Na 8 383 - 17 - Apr 2 Na Na 8 381 - 18 - May 2 Na Na 8 382 - 19 - Jun 2 Na Na 8 380 - 18 -
2010-11 Aug 2 Na Na 8 383 - 19 - Sept 2 Na Na 8 383 - 19 - Oct 2 Na Na 8 384 - 18 - Nov - - - 8 385 - 19 - Dec - - - 8 385 - 18 - Jan 2 - - 8 384 - 19 - Feb 2 - - 8 385 - 19 - Mar 2 - - 8 386 - 20 - Apr 2 Na Na 8 381 - 18 - May 2 Na Na 8 382 - 18 - Jun 2 Na Na 8 380 - 19
2011-12 July 2 Na Na 8 380 - 17 - Aug 2 Na Na 8 382 - 19 - Sept 2 Na Na 8 380 - 18 - Oct 2 Na Na 8 382 - 19 - Nov 2 Na Na 8 380 - 18 - Dec 2 Na Na 8 387 - 20 - Jan 2 Na Na 8 380 - - - Feb 2 Na Na 8 380 - - - Mar 2 Na Na 8 382 - - - Apr 2 - - 8 380 - 20 - May Na Na 382 21 - June Na Na 383 20 -
2011-12 July 2 Na Na 8 381 - 20 - Aug 2 Na Na 8 383 - 22
Sept 2 Na Na 8 382 - 21 - Oct 2 Na Na 8 383 - 21 - Nov - - - 8 382 - 22 - Dec - - - 8 380 - 21 - Jan - - - 8 382 - 22 - Feb - - - 8 380 - 21 - Mar - - - 8 381 - 20 - Apr - - - 8 380 - 22 - May - - - 8 381 - 20 - June - - - 8 380 - 21 -
Note:These Unit total production does not means the total production of Bangladesh.

Industry, Energy and Mining
Monthly Statistical Bulletin, Bangladesh, June-2013. 98
5.18 PRODUCTION OF ENGINE & TURBINE AND TEXTILE MACHINERY-CONTD. (Value: '000' Taka)
Period 3834-Textile Machinery 3841-Electrical Machinery and Apparatus
No. of Unit Qnty. (No.000) Value No. of Unit Qnty. (No.) Value 10 11 12 13 14 15
2009-10 12 227 4500 - 6688 - Dec 12 218 4360 7 7023 - Jan 12 231 4620 7 6095 - Feb 12 244 4880 7 6190 350 Mar 12 251 5020 7 6230 352 Apr 12 248 4836 7 6385 - May 12 250 4875 2 6390 - Jun 12 253 4934 2 6397 -
2010-11 Aug 12 180 3600 7 6230 - Sept 12 180 3600 7 6230 - Oct 12 179 3580 7 6180 - Nov 12 182 3640 7 6240 - Dec 12 184 3680 7 6247 - Jan 12 185 3700 7 6025 - Feb 12 193 3860 7 6035 - Mar 12 198 3960 2 6037 - Apr 12 205 4100 7 6385 - May 12 217 4557 7 6040 - Jun 12 222 4662 7 6025 -
2011-12 July 12 233 5126 7 6028 - Aug 12 235 5170 7 6052 - Sept 12 234 5148 7 6027 - Oct 12 236 5310 7 6008 - Nov 12 235 5288 7 7035 - Dec 12 241 5543 7 6855 - Jan 12 239 5497 7 6870 - Feb 12 237 5570 7 6887 - Mar 12 234 5148 7 6987 - Apr 12 227 5221 7 6875 - May 12 223 5241 7 6955 - June 12 220 5170 7 7020 -
2012-13 July 12 195 4485 7 7015 - Aug 12 192 4416 7 7015 - Sept 12 191 4393 7 7032 - Oct 12 193 4439 2 7035 - Nov 12 194 - 2 7056 - Dec 12 195 - 2 7045 - Jan 12 192 - 2 7032 - Feb 12 190 - 2 7065 - Mar 12 193 - 2 7068 - Apr 12 191 - 2 7075 - May 12 196 - 2 7083 - June 12 192 - 2 7089 -
Note:These Unit total production does not means the total production of Bangladesh. Source: Bangladesh Steel & Engineering Corporation and Private Enterprises.

Monthly Statistical Bulletin, Bangladesh, June-2013. . 99
5.19 PRODUCTION OF TELEPHONE, CABLES AND BATTERY (Value: '000' Taka)
Period No. of 3842-Telephone No. of 3844-Cables No. of 3846-Battery (Drycell)
Factories Qnty. (No.) Value Factories Qnty. (mt) Value Factories Qnty. ('000' No.)
Value
2008-09 - - - 5 2009 22828 3 8686 118119 2009-10 - - - 5 2009 22828 3 9368 129144
Jan 1 849 1723 5 2071 23510 3 9400 129583 Feb 1 843 1714 5 2074 23544 3 9430 129996 Mar 1 843 1714 5 2077 23578 3 9500 130960 Apr 1 843 1714 5 2080 23612 3 9605 132407 May 1 843 1714 5 2082 23634 3 9700 133716 Jun 1 843 1714 5 2084 23656 3 9765 134612
2010-11 July 1 842 1712 5 2087 23690 3 9800 135094 Aug 1 842 1712 5 2090 23724 3 9825 135438 Sept 1 842 1712 5 2092 23756 3 9828 135479 Oct 1 850 1726 5 2109 23950 3 9900 136472 Nov 1 852 1860 5 2112 23984 3 9920 136747 Dec 1 855 1861 5 2118 24052 3 9935 136952 Jan 1 855 - 5 2218 25174 3 9952 137138 Feb 1 857 - 5 2223 25231 3 9957 137207 Mar 1 857 - 5 2225 25253 3 9960 137248 Apr 1 843 1714 5 2080 23612 3 9605 192407 May 1 00 - 5 2292 23607 3 9993 89637 Jun 1 00 - 5 2295 23615 3 9996 89664
2011-12 July 1 00 - 5 2052 566352 3 8058 72280 Aug 1 00 - 5 2060 568560 3 8030 72029 Sept 1 00 - 5 2097 568287 3 9597 86085 Oct 1 00 - 5 2065 559615 3 9505 85259 Nov 1 00 - 5 2099 568829 3 13816 123929 Dec 1 00 - 5 1029 25332 3 16795 150651 Jan 1 1500 - 5 1027 278317 3 25332 227228 Feb 1 1500 - 5 1030 279130 3 20607 184845 Mar 1 1500 - 5 1045 283195 3 22422 201125 Apr 1 1500 - 5 1537 3 22725 - May 5 1656 3 23645 June 5 1670 3 23790
2011-12 July - - - 5 1687 - 2 23875 - Aug - - - 5 1695 2 22970 Sept - - - 5 1928 - 2 23255 - Oct - - - 5 1932 - 2 23268 - Nov - - - 5 1937 - 2 23272 - Dec - - - 5 1934 - 2 23270 - Jan - - - 5 1925 - 2 23120 - Feb - - - 5 1920 - 2 23170 - Mar - - - 5 1908 - 2 23182 - Apr - - - 5 1905 - 2 22915 - May - - - 5 1902 - 2 23215 - June - - - 5 1896 - 2 23320 -
Note:These Unit total production does not means the total production of Bangladesh. Source: Telephone Shilpa Sangstha, BCIC and Private Enterprises.

Industry, Energy and Mining
Monthly Statistical Bulletin, Bangladesh, June-2013. 100
5.20 PRODUCTION OF RADIO SET AND BLACK AND WHITE TELEVISION SET BY SIZE (Qnty: No. & Value: '000' Taka)
Radio Set Black and White Set(Television) Period No. of 1-Band Upto 17"
Unit Qnty. Value Unit Qnty. Value 2008-09
Jan 7 2966 1886 6 7111 26566 Feb 7 2975 1891 6 7125 21618 Mar 7 2990 1913 6 7135 26655 Apr 7 2990 1913 6 7139 26669 May 7 2992 1914 6 7145 26683 Jun 7 2995 1916 6 7153 26705
2009-10 July 7 3000 1923 6 7160 26731 Aug 7 2995 1916 6 7175 26787 Sept 7 2990 1930 6 7180 26805 Oct 7 3002 1935 6 7189 26838 Nov 7 3010 1940 6 7200 26879 Dec 7 3012 1942 6 7210 26916 Jan 7 3024 1950 6 7250 27065 Feb 7 3000 1934 6 7000 26131 Mar 7 - - 6 7020 26205 Apr 7 - - 6 7025 26223 May 7 2950 1901 6 7020 26205 Jun 7 - - 6 7025 26223
2010-11 July 7 2850 1791 6 7009 26167 Aug 7 2840 1726 6 7015 26185 Sept 7 2840 1785 6 7024 26226 Oct 7 2842 1786 6 7031 26246 Nov 7 2844 1727 6 7022 26205 Dec 7 2842 1726 6 7025 26216 Jan 7 2840 1727 6 7025 26217 Feb 7 2842 1728 6 7023 26210 Mar 7 2843 1729 6 7024 26214 Apr 7 2900 1823 6 7025 26223 May 7 2843 - 6 7030 26241 Jun 7 2847 - 6 7035 26240
2011-12 July 7 2715 - 6 700 - Aug 7 2700 - 6 710 - Sept 7 2500 - 6 7020 - Oct 7 2300 - 6 7055 - Nov 7 2300 - 6 7000 - Dec 7 2000 - 6 6870 - Jan 7 2000 - 6 19545 - Feb 7 2000 - 6 19565 - Mar 7 2000 - 6 19573 - Apr 7 2000 6 5860 - May 7 2000 6570 Jun 7 2000 6570
2011-12 July 7 - - - 6120 - Aug 7 - - - 6235 Sept 7 - - - 6257 - Oct 7 - - - 6260 - Jan - - - - 19614 - Feb - - - - 19645 - Mar - - - - - - Apr - - - - - - May - - - - - - Jun - - - - -
Note:These Unit total production does not means the total production of Bangladesh. Source: Bangladesh Steel & Engineering Corporation and Private Enterprises.
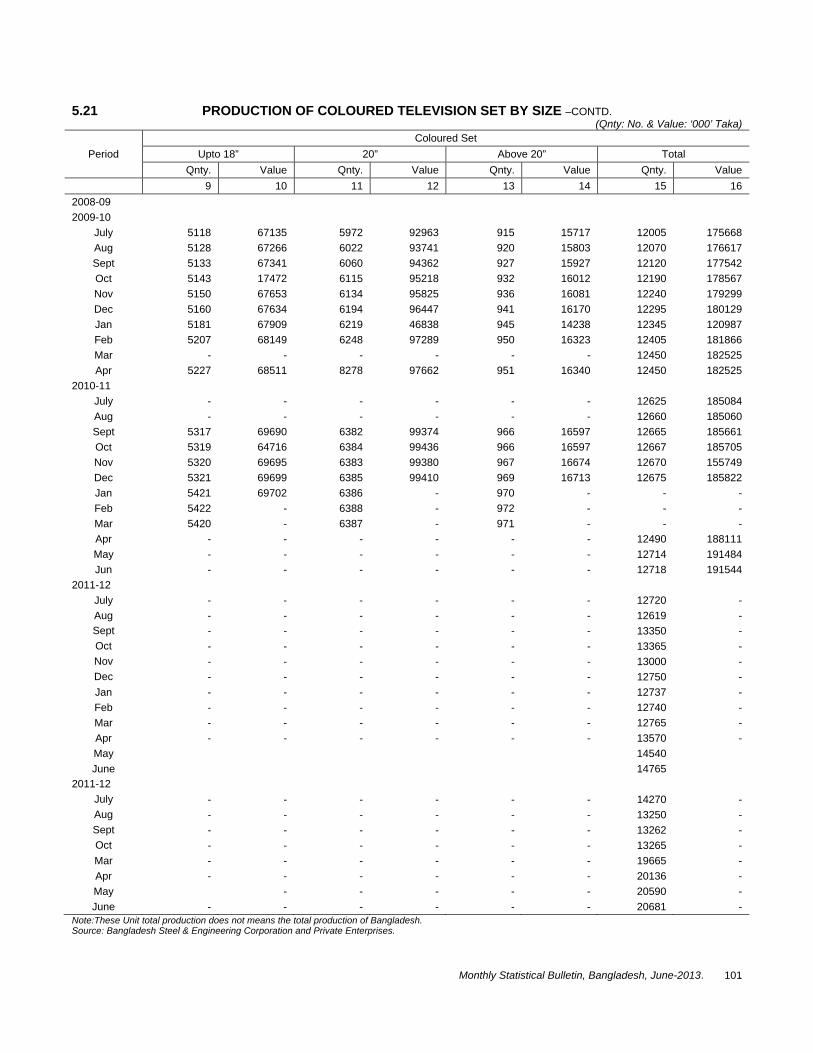
Monthly Statistical Bulletin, Bangladesh, June-2013. . 101
5.21 PRODUCTION OF COLOURED TELEVISION SET BY SIZE –CONTD.
(Qnty: No. & Value: ‘000’ Taka)
Period Coloured Set
Upto 18” 20” Above 20” Total Qnty. Value Qnty. Value Qnty. Value Qnty. Value
9 10 11 12 13 14 15 16 2008-09 2009-10
July 5118 67135 5972 92963 915 15717 12005 175668 Aug 5128 67266 6022 93741 920 15803 12070 176617 Sept 5133 67341 6060 94362 927 15927 12120 177542 Oct 5143 17472 6115 95218 932 16012 12190 178567 Nov 5150 67653 6134 95825 936 16081 12240 179299 Dec 5160 67634 6194 96447 941 16170 12295 180129 Jan 5181 67909 6219 46838 945 14238 12345 120987 Feb 5207 68149 6248 97289 950 16323 12405 181866 Mar - - - - - - 12450 182525 Apr 5227 68511 8278 97662 951 16340 12450 182525
2010-11 July - - - - - - 12625 185084 Aug - - - - - - 12660 185060 Sept 5317 69690 6382 99374 966 16597 12665 185661 Oct 5319 64716 6384 99436 966 16597 12667 185705 Nov 5320 69695 6383 99380 967 16674 12670 155749 Dec 5321 69699 6385 99410 969 16713 12675 185822 Jan 5421 69702 6386 - 970 - - - Feb 5422 - 6388 - 972 - - - Mar 5420 - 6387 - 971 - - - Apr - - - - - - 12490 188111 May - - - - - - 12714 191484 Jun - - - - - - 12718 191544
2011-12 July - - - - - - 12720 - Aug - - - - - - 12619 - Sept - - - - - - 13350 - Oct - - - - - - 13365 - Nov - - - - - - 13000 - Dec - - - - - - 12750 - Jan - - - - - - 12737 - Feb - - - - - - 12740 - Mar - - - - - - 12765 - Apr - - - - - - 13570 - May 14540 June 14765
2011-12 July - - - - - - 14270 - Aug - - - - - - 13250 - Sept - - - - - - 13262 - Oct - - - - - - 13265 - Mar - - - - - - 19665 - Apr - - - - - - 20136 - May - - - - - 20590 - June - - - - - - 20681 -
Note:These Unit total production does not means the total production of Bangladesh. Source: Bangladesh Steel & Engineering Corporation and Private Enterprises.

Industry, Energy and Mining
Monthly Statistical Bulletin, Bangladesh, June-2013. 102
5.22 VARIETY-WISE PRODUCTION OF FANS AND ELECTRIC LAMPS (Value: '000' Taka)
Period No. of Factories
Fans Ceiling Fans No. of
Factories
3845-Electric Lamps No. of
Factories
3849-Electrical Apparatus & Supplies
N.E.CBulb Tubes Qnty. (No.) Value Qnty.
('000' No.) Value Qnty. ('000' No.) Value Qnty.(No.) Value
2009-10 Jan 9 8959 348542 3 3650 - - - 14 22376 - Feb 9 - - 3 3872 67100 - - 14 20788 29838 Mar 9 8955 12486 3 3899 67567 1375 59277 14 21439 30772 Apr 9 9050 12611 3 3950 68450 1410 60785 14 22549 - May 9 9125 12715 7 4010 69489 1470 6337 14 22760 - Jun 9 - - 7 4055 70268 - - 14 22789 -
2010-11 July 9 9300 12958 3 4079 70683 1529 65914 14 20215 - Aug 9 - - 3 4090 70302 - - 14 20173 - Sept 9 9359 13662 7 4079 71028 1547 66689 14 20250 - Oct 9 9370 13073 7 4110 71218 1555 67033 14 20195 - Nov 9 9375 12449 7 4135 71075 1454 - 14 20370 - Dec 9 9377 12451 7 4147 71282 1470 - 14 20375 - Jan 9 9380 13085 7 4159 71493 1470 - 14 20378 - Feb 9 9385 13092 7 4160 71510 1478 - 14 20380 - Mar 9 9387 13094 7 4163 71562 1480 - 14 20381 - Apr 9 9390 13098 7 3950 6845 1485 - 14 22549 - May 9 9380 13097 7 4272 - 1490 - 14 20305 - Jun 9 9382 - 7 4285 - 1493 - 14 20127 -
2011-12 July 9 13890 20612 7 4009 - 1509 - 14 20520 - Aug 9 12585 18676 7 4022 - 1517 - 14 18500 - Sept 9 12590 18683 7 4039 - 1620 - 14 18250 - Oct 9 12690 18831 7 4023 - 1570 - 14 18027 - Nov 9 135520 20063 7 4123 - 1582 - 14 22650 - Dec 9 12508 18561 7 4350 - 1577 - 14 22790 - Jan 9 9865 - 7 4365 - 1627 - 14 22790 - Feb 9 11067 - 7 4360 - 1640 - 14 22795 - Mar 9 15075 - 7 4376 - 1650 - 14 22735 - Apr 9 17720 - 7 4255 - 1200 - 14 20925 - May 9 18950 4460 21750 June 9 18310 4478 20855
2012-13 July 9 18012 - 7 4495 - - - 14 20120 - Aug 9 18230 - 7 4437 - - - 14 20530 - Sept 9 18265 26028 7 4492 - - - 14 21329 - Oct 9 18235 25985 7 4499 - - - 14 21375 - Nov - 18243 - 7 4492 - - - 14 21381 - Dec - 18239 - 7 4499 - - - 14 21378 - Jan 9 18265 - 7 4487 - - - 14 21385 - Feb 9 18236 - 7 4497 - - - 14 21390 - Mar 9 18256 - 7 4482 - - - 14 21370 - Apr 9 18720 - 7 4495 - - - 14 21653 - May 9 19460 - 7 4498 - - - 14 21678 - June 9 19468 - 7 4503 - - - 14 21690 -
Note:These Unit total production does not means the total production of Bangladesh. Source: Bangladesh Steel & Engineering Corporation and Private Enterprises.

Monthly Statistical Bulletin, Bangladesh, June-2013. . 103
5.23 PRODUCTION OF BI-CYCLES, MOTOR CYCLES AND MOTOR VEHICLES (Qnty: No. & Value: '000' Taka)
Period
3854-Motor vehicles 3855-Motor Cycle 3856-Bi-Cycle No. of Unit Qnty. Value No. of Unit Qnty. Value No. of Unit Qnty. Values
2008-09 Jun 2 209 396888 3 4613 425725 6 - -
2009-10 - 68 - - 4112 - - - - Nov 2 50 113692 3 4211 371172 6 3280 3598 DEc 2 58 129697 3 3846 413183 6 3285 - Jan 2 72 175402 3 2433 242738 6 3290 3605 Feb 2 78 191173 3 3576 328954 6 - - Mar 2 54 121236 3 3886 377189 6 3295 3611 Apr 2 64 1523640 3 4556 431900 6 3299 3615 May 2 98 236389 3 5954 574354 6 3505 3621 Jun 2 195 392582 3 6648 604087 6 - -
2010-11 July 2 30 74230 3 2891 287847 6 - - Aug 2 30 83391 3 3211 328815 6 - - Sept 2 45 - 3 3727 - 6 3367 3602 Oct 2 40 - 3 3826 - 6 3375 3611 Nov 2 56 156991 3 3426 349509 6 3407 - Dec 2 47 131762 3 3660 332381 6 3428 - Jan 2 38 162092 3 2341 411125 6 3429 - Feb 2 50 139769 3 3161 362228 6 3430 - Mar 2 49 227739 3 4409 484726 6 3427 - Apr 2 64 153640 3 4556 431900 6 3430 - May 2 130 279168 3 6077 691880 6 3400 - Jun 2 86 232905 3 8375 939811 6 3375 -
2011-12 July 2 45 - 3 449 - 6 3025 - Aug 2 37 - 3 2249 - 6 3042 - Sept 2 41 - 3 1349 - 6 2800 - Oct 2 49 - 3 3086 - 6 2920 - Nov 2 56 - 3 3899 - 6 2985 - Dec 2 131 - 3 4060 - 6 3027 - Jan 2 77 - 3 2657 - 6 3022 - Feb 2 70 - 3 3650 - 6 2983 - Mar 2 76 - 3 2403 - 6 2855 - Apr 2 95 - 3 3797 - 6 3025 - May 72 3250 June 72 3917
2012-13 July 2 63 - 3 3630 - - - - Aug 2 57 - 3 3575 - - - - Sept 2 66 - 3 3482 - - - - Oct 2 58 - 3 3078 - - - - Nov 2 50 - 3 3085 - - - - Dec 2 50 - 3 2507 - - - - Jan 2 59 - 3 2392 - - - - Feb 2 52 - 3 2398 - - - - Mar 2 41 - 3 3687 - - - - Apr 2 50 - 3 3710 - - - - May 2 59 - 3 4549 - - - - June 2 152 - 3 8589 - - - -
Note:These Unit total production does not means the total production of Bangladesh. Source: Bangladesh Steel & Engineering Corporation and Private Enterprises.

Industry, Energy and Mining
Monthly Statistical Bulletin, Bangladesh, June-2013. 104
5.24 GENERATION AND CONSUMPTION OF ELECTRICITY (Qnty: MKWH & Value: ‘000’ Taka)
Period
Gross Energy Station Individual Power
RPP Net Consumption
Generation Service and Own Use
Production Generation Qnty. Consumed
Amount Billed to Consumers
(1) (2) (3) (4) 5=(1-2+3+4) (6) (7) 2009-10
Jan 1246.81 73.95 662.68 - 2022.55 1930.59 5128.84 Mar 1262.07 72.18 594.93 - 2031.92 1919.31 5045.88 Apr 1502.12 88.57 758.50 - 2466.23 2331.44 6180.57 May 1573.12 91.76 669.26 - 2475.89 2312.32 6225.60 Jun 1491.79 84.80 703.15 - 2437.62 2274.86 6189.08
2010-11 July 1506.49 83.58 755.14 - 2542.80 2374.83 6423.87 Aug 1579.06 93.77 789.39 - 2699.10 2515.99 6787.66 Sept 1449.94 83.57 772.50 - 2568.51 2496.70 6477.85 Oct 1369.01 72.82 799.93 - 2548.32 2468.77 6470.16 Nov 1139.15 56.89 609.24 -- 2074.09 2006.19 5355.29 Dec 1034.79 52.81 671.41 - 2017..58 1976.80 5249.11 Jan 1086.49 58.88 664.52 - 2145.04 2037.35 5459.80 Feb 1179.14 65.30 544.86 2130.26 2073.02 5840.89 Mar 1292.85 73.30 667.71 - 2533.49 2467.27 6875.14 Apr 1320.93 71.64 787.44 - 2665.49 2585.85 7220.45 May 1320.00 70.86 765.34 - 2690.00 2650.84 7487.70 Jun 1253.16 68.66 736.55 - 2734.00 2674.19 7664.23
2011-12 July 1273.52 68.39 771.81 - 2940.27 2901.93 8127.13 Aug 1403.29 92.81 731.20 - 3019.09 2977.38 8602.69 Sept 1280.53 62.53 728.27 - 2908.17 2817.50 8245.98 Oct 1358.48 71.44 744.43 - 3057.64 2937.52 8703.70 Nov 1231.44 61.23 698.30 - 2308.95 2268.40 6831.38 Dec 1241.62 61.95 706.17 - 2403.35 2325.92 7836.67 Jan 1249.10 63.24 688.38 - 2554.83 2426.50 8410.58 Feb 1143.47 59.73 673.59 - 2532.15 2447.21 9259.97 Mar 1309.79 63.59 750.43 - 2847.80 2783.53 11238.80 Apr 1439.63 87.08 704.32 - 2692.62 2594.86 10651.55 May 1517.06 89.88 761.61 - 3010.21 2917.03 11791.65 June 1592.37 92.23 747..90 - 3087.85 2986.38 12443.34
2012-13 July 1797.10 95.79 794.38 1018.43 3514.11 3404.46 13621.54 Aug 1774.05 93.61 797.71 952.26 3430.40 3324.65 13178.90 Sept 1580.74 82399 788.25 959.67 3245.67 3158.09 14794.34 Oct 1498.55 81.92 766.60 841.12 3024.36 2939.93 13796.55 Nov 1315.70 71.25 701.91 518.16 2464.52 2400.48 11532.67 Dec 1199.76 62.44 670.20 587.40 2394.92 2334.63 11172.73 Jan 1149.20 60.85 631.91 736.46 2456.72 2389.36 11305.65 Feb 1540.34 79.89 312.40 742.39 2515.24 2445.41 11448.68 Mar 1687.68 85.72 679.14 1016.15 3297.25 3205.88 14761.57 Apr 1719.00 87.82 750.58 997.59 3379.34 3280.73 15196.72 May 1777.85 107.39 69458 842.09 3207.13 3122.78 14738.24 June 1869.97 103.36 753.70 1032.43 3552.75 3460.62 -
Source: Power Development Board, Rural Electrification Board and Dhaka Electricity Supply Authority.

Monthly Statistical Bulletin, Bangladesh, June-2013. . 105
5.25 PRODUCTION AND CONSUMPTION OF NATURAL GAS (Qnty: 106 cu metre & Value: '000' Taka)
Period
No. of Production Consumption Gas Field Qnty. Value Qnty. Value
2009-10 Nov 17 1583 - 1539 6739260 Dec 17 1649 - 1645 7389090 Jan 17 1727 5956423 1694 760151
Feb 17 1569 - 1607 7182800 Mar 17 1724 - 1786 7903190 Apr 17 1674 - 1716 7496000 May 17 1719 - 1760 7828390 Jun 17 1627 - 1693 7517810
2010-11 July 17 1723 - 1540 6591 Aug 17 - - - Sept 17 1553.95 - 1417 6138 Oct 17 1697.11 - 1742 7767 Nov 17 1573.76 - 1620 7312 Dec 17 1684.85 - 1691 7717 Jan 17 1739.11 - 1699 6375 Feb 17 1599.86 - 1615 7385 Mar 17 1746.41 - 2732 7816 Apr 17 1637.62 - 1656 7390 May 17 1703.10 - 1716 8400 Jun 17 1681.66 - 1680 7865
2011-12 July 17 1734.97 - 1743 8582 Aug 17 1710.43 - 1692 8227 Sept 17 1635.93 - 1757 8923 Oct 17 1750.63 - 1806 9458 Nov 17 1624.45 - 1672 8248 Dec 17 1781.09 - 1758 9434 Jan 17 1803.51 - 1796 9309 Feb 17 1688.84 - 1736 8935 Mar 17 1826.12 - 1864 9519 Apr 17 1777 - 1803 9126 May 1880 1849 9510 June 1822
2012-13 July 17 1932 - 1898 9554 Aug 17 1839 - 1857 9524 Sept 17 1909 - 1935 10123 Oct 17 1874 - 1906 9877 Nov 17 1892 - 1871 9756 Dec 17 1913 - 1844 9635 Jan 17 1927 - 1861 10022 Feb 17 1768 - 1796 9271 Mar 17 1968 - - - Apr 17 1886 - - - May 17 1892 - - - June 17 1885 - - -
Source: Petrobangla
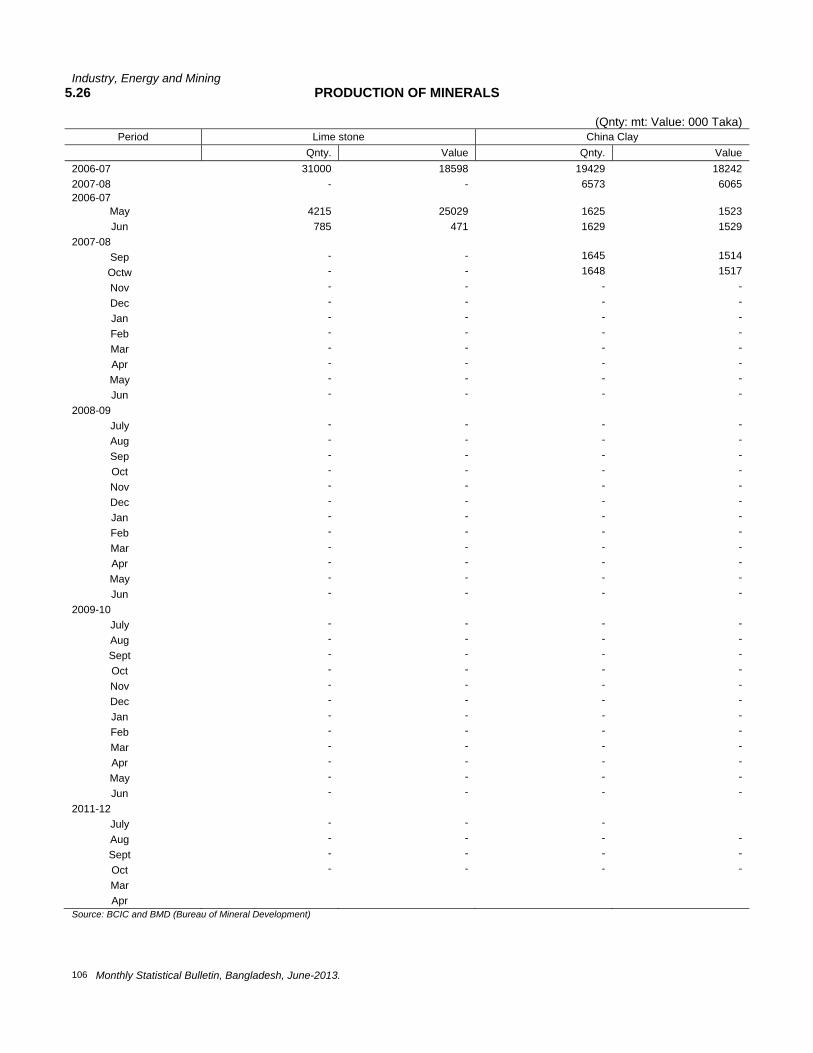
Industry, Energy and Mining
Monthly Statistical Bulletin, Bangladesh, June-2013. 106
5.26 PRODUCTION OF MINERALS
(Qnty: mt: Value: 000 Taka) Period Lime stone China Clay
Qnty. Value Qnty. Value 2006-07 31000 18598 19429 18242 2007-08 - - 6573 6065 2006-07
May 4215 25029 1625 1523 Jun 785 471 1629 1529
2007-08 Sep - - 1645 1514 Octw - - 1648 1517 Nov - - - - Dec - - - - Jan - - - - Feb - - - - Mar - - - - Apr - - - - May - - - - Jun - - - -
2008-09 July - - - - Aug - - - - Sep - - - - Oct - - - - Nov - - - - Dec - - - - Jan - - - - Feb - - - - Mar - - - - Apr - - - - May - - - - Jun - - - -
2009-10 July - - - - Aug - - - - Sept - - - - Oct - - - - Nov - - - - Dec - - - - Jan - - - - Feb - - - - Mar - - - - Apr - - - - May - - - - Jun - - - -
2011-12 July - - - Aug - - - - Sept - - - - Oct - - - - Mar Apr
Source: BCIC and BMD (Bureau of Mineral Development)

Monthly Statistical Bulletin, Bangladesh, June-2013. . 107
5.27 QUANTUM INDEX OF INDUSTRIAL PRODUCTION (ALL INDUSTRIES) (Base : 1988-89=100)
Period General Index (All Industries) Manufacturing
Mining & Quarrying
Electricity
Weight 100.00 89.47 1.74 8.79
2008-09 2009-10 437.27 442.12 449.31 385.59
Jan 442.10 451.51 467.46 341.24 Feb 430.41 439.13 424.70 342.76 Mar 454.06 457.56 466.65 415.97 Apr 423.73 424.10 453.12 414.12 May 444.31 447.19 463.94 411.08 Jun 475.65 482.66 440.40 411.25
2010-11 July 483.55 489.24 466.38 428.96 Aug 485.70 489.01 469.36 455.27 Sept 433.28 433.78 420.64 430.65 Oct 458.32 461.10 459.34 429.80 Nov 503.70 511.85 426.05 436.04 Dec 519.28 529.07 456.09 432.16 Jan 508.63 523.79 470.71 361.82 Feb 522.79 540.60 433.09 359.29 Mar 556.85 571.22 472.61 427.27 Apr 531.91 541.73 443.37 449.54 May 563.25 575.10 460.97 462.86 Jun 567.60 580.24 455.28 461.18
2011-12 July 563.85 572.35 469.67 495.93 Aug 557.44 564.02 462.91 509.25 Sept 465.51 463.43 442.88 490.53 Oct 530.24 533.23 458.53 513.98 Nov 513.62 515.97 450.68 502.17 Dec 579.19 598.74 452.03 405.34 Jan 587.68 603.69 556.79 430.81 Feb 579.22 595.49 511.31 427.10 Mar 576.56 587.60 494.26 480.41 Apr 550.93 561.84 479.10 454.09
May 592.25 602.80 476.94 507.73
June 632.38 646.08 493.18 520.89 2012-13
July 599.65 610.36 500.76 510.26 Aug 579.59 581.27 497.84 578.58
Sept 568.55 571.64 516.79 547.37 Oct 575.22 582.94 507.25 510.10 Nov 555.23 569.77 512.13 415.80 Dec 654.19 681.43 517.81 403.99 Jan 663.00 690.16 521.60 414.45 Feb 608.66 629.31 478.56 424.24 Mar 618.52 626.32 532.70 556.15 Apr 569.99 571.15 510.50 569.98
May 635.17 646.81 512.13 540.96 June 680.95 692.29 510.23 599.33
Source: National Accounting Wing, BBS.
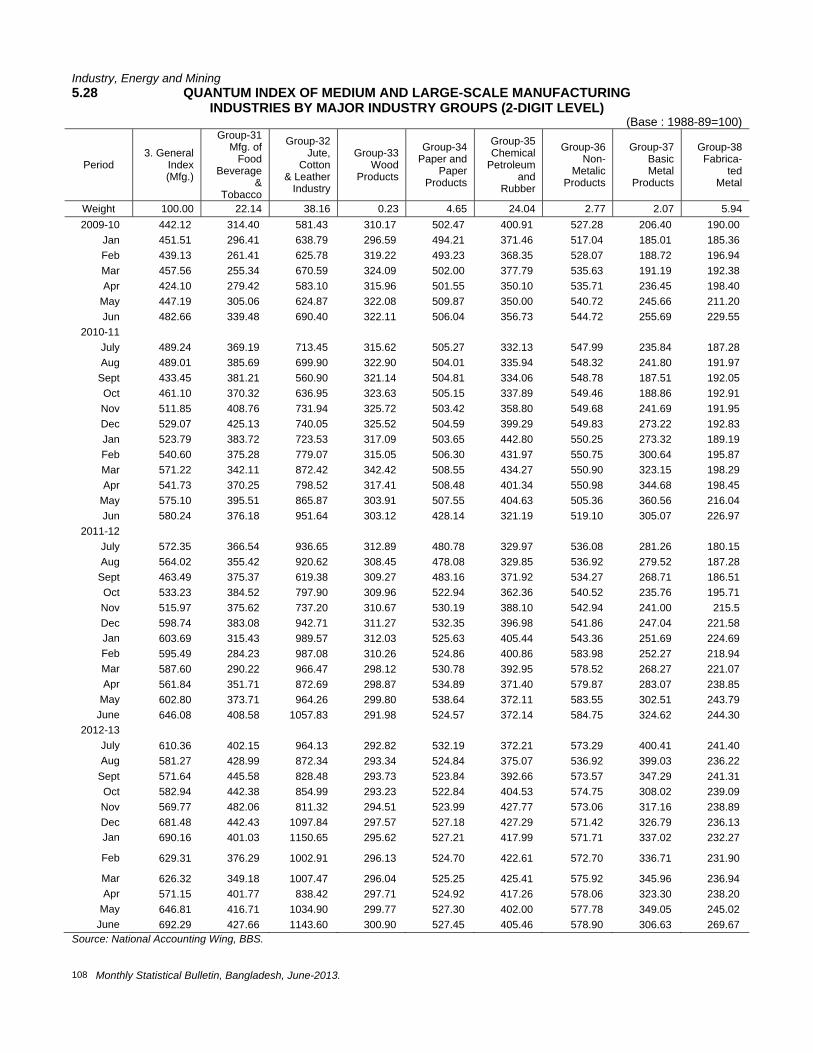
Industry, Energy and Mining
Monthly Statistical Bulletin, Bangladesh, June-2013. 108
5.28 QUANTUM INDEX OF MEDIUM AND LARGE-SCALE MANUFACTURING INDUSTRIES BY MAJOR INDUSTRY GROUPS (2-DIGIT LEVEL)
(Base : 1988-89=100)
Period 3. General
Index (Mfg.)
Group-31 Mfg. of
Food Beverage
& Tobacco
Group-32 Jute,
Cotton & Leather
Industry
Group-33 Wood
Products
Group-34 Paper and
Paper Products
Group-35 Chemical
Petroleum and
Rubber
Group-36 Non-
Metalic Products
Group-37 Basic Metal
Products
Group-38 Fabrica-
ted Metal
Weight 100.00 22.14 38.16 0.23 4.65 24.04 2.77 2.07 5.94 2009-10 442.12 314.40 581.43 310.17 502.47 400.91 527.28 206.40 190.00
Jan 451.51 296.41 638.79 296.59 494.21 371.46 517.04 185.01 185.36 Feb 439.13 261.41 625.78 319.22 493.23 368.35 528.07 188.72 196.94 Mar 457.56 255.34 670.59 324.09 502.00 377.79 535.63 191.19 192.38 Apr 424.10 279.42 583.10 315.96 501.55 350.10 535.71 236.45 198.40
May 447.19 305.06 624.87 322.08 509.87 350.00 540.72 245.66 211.20 Jun 482.66 339.48 690.40 322.11 506.04 356.73 544.72 255.69 229.55
2010-11 July 489.24 369.19 713.45 315.62 505.27 332.13 547.99 235.84 187.28 Aug 489.01 385.69 699.90 322.90 504.01 335.94 548.32 241.80 191.97
Sept 433.45 381.21 560.90 321.14 504.81 334.06 548.78 187.51 192.05 Oct 461.10 370.32 636.95 323.63 505.15 337.89 549.46 188.86 192.91 Nov 511.85 408.76 731.94 325.72 503.42 358.80 549.68 241.69 191.95 Dec 529.07 425.13 740.05 325.52 504.59 399.29 549.83 273.22 192.83 Jan 523.79 383.72 723.53 317.09 503.65 442.80 550.25 273.32 189.19 Feb 540.60 375.28 779.07 315.05 506.30 431.97 550.75 300.64 195.87 Mar 571.22 342.11 872.42 342.42 508.55 434.27 550.90 323.15 198.29 Apr 541.73 370.25 798.52 317.41 508.48 401.34 550.98 344.68 198.45
May 575.10 395.51 865.87 303.91 507.55 404.63 505.36 360.56 216.04 Jun 580.24 376.18 951.64 303.12 428.14 321.19 519.10 305.07 226.97
2011-12 July 572.35 366.54 936.65 312.89 480.78 329.97 536.08 281.26 180.15 Aug 564.02 355.42 920.62 308.45 478.08 329.85 536.92 279.52 187.28
Sept 463.49 375.37 619.38 309.27 483.16 371.92 534.27 268.71 186.51 Oct 533.23 384.52 797.90 309.96 522.94 362.36 540.52 235.76 195.71 Nov 515.97 375.62 737.20 310.67 530.19 388.10 542.94 241.00 215.5 Dec 598.74 383.08 942.71 311.27 532.35 396.98 541.86 247.04 221.58 Jan 603.69 315.43 989.57 312.03 525.63 405.44 543.36 251.69 224.69 Feb 595.49 284.23 987.08 310.26 524.86 400.86 583.98 252.27 218.94 Mar 587.60 290.22 966.47 298.12 530.78 392.95 578.52 268.27 221.07 Apr 561.84 351.71 872.69 298.87 534.89 371.40 579.87 283.07 238.85
May 602.80 373.71 964.26 299.80 538.64 372.11 583.55 302.51 243.79 June 646.08 408.58 1057.83 291.98 524.57 372.14 584.75 324.62 244.30
2012-13 July 610.36 402.15 964.13 292.82 532.19 372.21 573.29 400.41 241.40 Aug 581.27 428.99 872.34 293.34 524.84 375.07 536.92 399.03 236.22
Sept 571.64 445.58 828.48 293.73 523.84 392.66 573.57 347.29 241.31 Oct 582.94 442.38 854.99 293.23 522.84 404.53 574.75 308.02 239.09 Nov 569.77 482.06 811.32 294.51 523.99 427.77 573.06 317.16 238.89 Dec 681.48 442.43 1097.84 297.57 527.18 427.29 571.42 326.79 236.13 Jan 690.16 401.03 1150.65 295.62 527.21 417.99 571.71 337.02 232.27
Feb 629.31 376.29 1002.91 296.13 524.70 422.61 572.70 336.71 231.90
Mar 626.32 349.18 1007.47 296.04 525.25 425.41 575.92 345.96 236.94 Apr 571.15 401.77 838.42 297.71 524.92 417.26 578.06 323.30 238.20
May 646.81 416.71 1034.90 299.77 527.30 402.00 577.78 349.05 245.02 June 692.29 427.66 1143.60 300.90 527.45 405.46 578.90 306.63 269.67
Source: National Accounting Wing, BBS.

Monthly Statistical Bulletin, Bangladesh, June-2013. . 109
5.29 QUANTUM INDEX OF MEDIUM AND LARGE-SCALE MANUFACTURING INDUSTRIES BY MAJOR INDUSTRY GROUPS (4-DIGIT LEVEL)
(Base : 1988-89=100)
Period
Group 1 : 31 Manufacturing of Food, Beverage and Tobacco 31-
Group 1-Index
3114 Fish &
Seafood
3115 Vg. oil
& Soya.
3118 Flour
Milling
3122 Bakery
Prod.
3123 Sugar
3126/27 Tea
3128 Edible
Salf
3131 Spirits
Alcohol
3134 Soft
Drink
3141 Cigarettes
3143 Bidi
Weight 22.14 1.81 0.44 1.18 0.96 2.78 7.87 0.30 0.70 0.15 2.10 3.85 2009-10 314.40 350.35 147.12 299.66 421.58 56 142.84 759.68 127.27 555.44 168.07 900.93
Jan 296.41 286.87 147.21 299.91 432.32 348.66 9.69 750.35 153.02 553.37 168.14 882.01 Feb 261.41 286.87 147.26 300.05 437.04 82.86 0.78 750.82 114.43 554.43 168.23 896.52 Mar 255.34 286.87 147.33 300.23 439.24 - 5.74 750.59 107.38 556.21 168.14 911.99 Apr 279.42 286.87 147.35 300.30 450.68 - 63.09 750.94 96.64 557.62 168.31 932.11
May 305.06 268.87 147.37 300.37 440.50 - 124.51 751.18 11.08 558.16 168.48 953.58
Jun 339.48 268.87 147.39 300.41 445.44 - 199.02 750.82 148.32 559.04 168.65 992.30 2010-11
July 369.19 309.53 147.46 300.48 464.32 - 237.08 750.59 103.36 560.28 168.91 1076.98 Aug 385.69 309.53 147.49 300.55 669.46 - 246.45 750.94 129.19 561.35 168.19 1096.71 Sept 381.21 476.17 147.51 300.53 668.42 - 249.86 751.06 109.73 562.23 169.08 1067.70 Oct 370.2 561.09 147.51 300.57 660.02 - 215.69 715.53 102.35 561.88 168.82 1081.24 Nov 408.76 468.75 147.56 300.64 660.55 72.21 200.20 715.76 160.07 599.75 168.99 1190.32 Dec 425.13 468.75 147.58 300.67 660.97 365.95 137.66 715.88 102.35 555.85 169.08 1216.63 Jan 383.72 468.75 147.62 300.69 659.71 379.58 6.40 716.12 168.12 731.03 169.75 1218.38 Feb 370.73 468.69 147.69 300.76 702.52 207.87 0.98 716.24 145.97 737.06 169.42 1271.76 Mar 342.11 232.58 147..69 300.83 711.96 71.45 14.65 716.47 107.72 741.13 169.68 1293.04 Apr 370.25 342.66 147.72 300.90 737.25 00 97.38 716.74 144.97 743.26 170.78 1271.76
May 395.51 441.41 148.30 304.14 775.03 00 131.40 716.47 141.61 744.15 169.08 1292.07 Jun 376.18 544.45 141.96 235.86 634.31 00 194.61 716.82 132.55 718.09 135.01 1081.24
2011-12 July 366.54 578.44 150.33 254.54 514.17 - 237.57 716.71 101.68 664.89 234.58 897.10 Aug 355.42 582.73 157.24 305.70 469.57 - 202.97 717.06 129.19 666.49 206.81 908.12 Sept 375.37 495.39 157.33 305.65 422.35 0.00 255.88 717.41 115.44 667.02 207.84 969.44 Oct 384.52 577.50 184.83 305.72 374.61 0.00 241.61 717.71 212.71 1666.67 190.80 1030.75 Nov 375.62 444.77 184.62 305.77 393.49 65.60 241.95 794.71 152.68 665.25 199.74 973.50 Dec 383.08 511.95 196.28 305.95 341.03 349.15 155.74 714.71 100.67 650.71 207.33 978.14 Jan 315.43 480.78 228.60 306.09 380.38 277.91 5.94 710.59 159.73 643.79 246.34 916.44 Feb 284.23 316.09 243.29 306.23 386.15 65.37 4.24 692.94 234.23 654.76 212.95 973.39 Mar 290.22 272.81 257.06 322.72 406.61 0.00 10.81 699.65 108.05 667.55 215.50 1071.18 Aprl 351.71 305.23 275.42 334.23 384.89 0.00 74.77 698.82 24.16 721.63 264.65 1264.99 May 373.71 272.97 282.30 334.44 393.60 0.00 138.70 398.59 82.55 726.42 264.91 1262.09
June 408.54 470.70 293.78 338.85 393.39 0.00 189.36 697.65 71.48 726.95 266.18 1264.60 2012-13
July 402.15 251.48 441.24 338.07 404.20 0.00 212.92 695.88 102.01 726.06 145.40 1323.98 Aug 428.99 343.44 493.46 338.48 401.15 0.00 242.59 694.71 142.95 748.94 215.50 1322.63
Sept 445.58 522.58 642.44 338.57 407.66 0.00 258.59 693.88 157.38 751.60 97.87 1343.31 Oct 442.38 455.70 629.01 339.01 408.71 0.00 238.90 693.53 106.04 828.55 196.17 1351.06 Nov 432.06 406.80 567.36 359.66 410.07 43.24 204.96 694.94 133.22 761.70 193.95 1352.03 Dec 442.43 353.52 575.92 388.86 407.76 330.42 138.41 708.00 168.46 735.46 186.72 1353.58 Jan 401.03 271.88 557.88 388.58 407.66 426.65 6.72 721.76 95.30 869.50 202.08 1354.35 Feb 376.29 252.73 656.39 384.52 406.61 235.90 0.89 723.29 210.20 877.66 177.69 1353.00 Mar 349.18 173.13 656.41 385.18 407.87 0.00 15.97 750.59 152.68 881.38 232.03 1352.03 Aprl 401.77 288.36 656.46 398.64 403.46 135.44 91.49 751.76 141.61 1002.48 217.04 1350.48 May 416.71 439.06 656.51 399.20 404.51 0.00 142.07 750.00 193.62 1014.01 214.65 1351.06
June 427.66 433.36 656.83 399.04 415.53 0.00 195.88 471.18 98.32 1017.91 158.60 1351.64
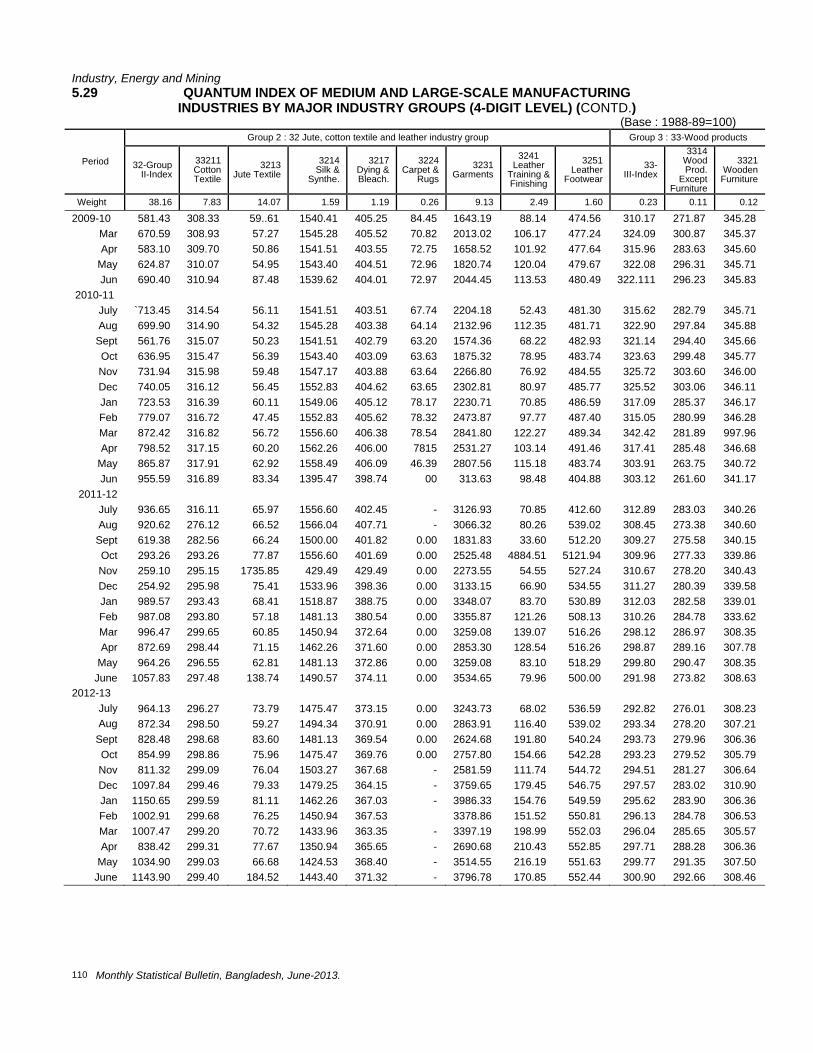
Industry, Energy and Mining
Monthly Statistical Bulletin, Bangladesh, June-2013. 110
5.29 QUANTUM INDEX OF MEDIUM AND LARGE-SCALE MANUFACTURING INDUSTRIES BY MAJOR INDUSTRY GROUPS (4-DIGIT LEVEL) (CONTD.)
(Base : 1988-89=100)
Period
Group 2 : 32 Jute, cotton textile and leather industry group Group 3 : 33-Wood products
32-Group II-Index
33211 Cotton Textile
3213 Jute Textile
3214 Silk &
Synthe.
3217 Dying & Bleach.
3224 Carpet &
Rugs 3231
Garments
3241 Leather
Training & Finishing
3251 Leather
Footwear 33-
III-Index
3314Wood Prod.
Except Furniture
3321 Wooden Furniture
Weight 38.16 7.83 14.07 1.59 1.19 0.26 9.13 2.49 1.60 0.23 0.11 0.12
2009-10 581.43 308.33 59..61 1540.41 405.25 84.45 1643.19 88.14 474.56 310.17 271.87 345.28 Mar 670.59 308.93 57.27 1545.28 405.52 70.82 2013.02 106.17 477.24 324.09 300.87 345.37 Apr 583.10 309.70 50.86 1541.51 403.55 72.75 1658.52 101.92 477.64 315.96 283.63 345.60
May 624.87 310.07 54.95 1543.40 404.51 72.96 1820.74 120.04 479.67 322.08 296.31 345.71 Jun 690.40 310.94 87.48 1539.62 404.01 72.97 2044.45 113.53 480.49 322.111 296.23 345.83
2010-11 July `713.45 314.54 56.11 1541.51 403.51 67.74 2204.18 52.43 481.30 315.62 282.79 345.71 Aug 699.90 314.90 54.32 1545.28 403.38 64.14 2132.96 112.35 481.71 322.90 297.84 345.88
Sept 561.76 315.07 50.23 1541.51 402.79 63.20 1574.36 68.22 482.93 321.14 294.40 345.66 Oct 636.95 315.47 56.39 1543.40 403.09 63.63 1875.32 78.95 483.74 323.63 299.48 345.77 Nov 731.94 315.98 59.48 1547.17 403.88 63.64 2266.80 76.92 484.55 325.72 303.60 346.00
Dec 740.05 316.12 56.45 1552.83 404.62 63.65 2302.81 80.97 485.77 325.52 303.06 346.11 Jan 723.53 316.39 60.11 1549.06 405.12 78.17 2230.71 70.85 486.59 317.09 285.37 346.17
Feb 779.07 316.72 47.45 1552.83 405.62 78.32 2473.87 97.77 487.40 315.05 280.99 346.28 Mar 872.42 316.82 56.72 1556.60 406.38 78.54 2841.80 122.27 489.34 342.42 281.89 997.96 Apr 798.52 317.15 60.20 1562.26 406.00 7815 2531.27 103.14 491.46 317.41 285.48 346.68
May 865.87 317.91 62.92 1558.49 406.09 46.39 2807.56 115.18 483.74 303.91 263.75 340.72 Jun 955.59 316.89 83.34 1395.47 398.74 00 313.63 98.48 404.88 303.12 261.60 341.17
2011-12 July 936.65 316.11 65.97 1556.60 402.45 - 3126.93 70.85 412.60 312.89 283.03 340.26 Aug 920.62 276.12 66.52 1566.04 407.71 - 3066.32 80.26 539.02 308.45 273.38 340.60
Sept 619.38 282.56 66.24 1500.00 401.82 0.00 1831.83 33.60 512.20 309.27 275.58 340.15 Oct 293.26 293.26 77.87 1556.60 401.69 0.00 2525.48 4884.51 5121.94 309.96 277.33 339.86
Nov 259.10 295.15 1735.85 429.49 429.49 0.00 2273.55 54.55 527.24 310.67 278.20 340.43 Dec 254.92 295.98 75.41 1533.96 398.36 0.00 3133.15 66.90 534.55 311.27 280.39 339.58 Jan 989.57 293.43 68.41 1518.87 388.75 0.00 3348.07 83.70 530.89 312.03 282.58 339.01
Feb 987.08 293.80 57.18 1481.13 380.54 0.00 3355.87 121.26 508.13 310.26 284.78 333.62 Mar 996.47 299.65 60.85 1450.94 372.64 0.00 3259.08 139.07 516.26 298.12 286.97 308.35 Apr 872.69 298.44 71.15 1462.26 371.60 0.00 2853.30 128.54 516.26 298.87 289.16 307.78
May 964.26 296.55 62.81 1481.13 372.86 0.00 3259.08 83.10 518.29 299.80 290.47 308.35 June 1057.83 297.48 138.74 1490.57 374.11 0.00 3534.65 79.96 500.00 291.98 273.82 308.63
2012-13 July 964.13 296.27 73.79 1475.47 373.15 0.00 3243.73 68.02 536.59 292.82 276.01 308.23 Aug 872.34 298.50 59.27 1494.34 370.91 0.00 2863.91 116.40 539.02 293.34 278.20 307.21
Sept 828.48 298.68 83.60 1481.13 369.54 0.00 2624.68 191.80 540.24 293.73 279.96 306.36 Oct 854.99 298.86 75.96 1475.47 369.76 0.00 2757.80 154.66 542.28 293.23 279.52 305.79 Nov 811.32 299.09 76.04 1503.27 367.68 - 2581.59 111.74 544.72 294.51 281.27 306.64 Dec 1097.84 299.46 79.33 1479.25 364.15 - 3759.65 179.45 546.75 297.57 283.02 310.90 Jan 1150.65 299.59 81.11 1462.26 367.03 - 3986.33 154.76 549.59 295.62 283.90 306.36
Feb 1002.91 299.68 76.25 1450.94 367.53 3378.86 151.52 550.81 296.13 284.78 306.53 Mar 1007.47 299.20 70.72 1433.96 363.35 - 3397.19 198.99 552.03 296.04 285.65 305.57 Apr 838.42 299.31 77.67 1350.94 365.65 - 2690.68 210.43 552.85 297.71 288.28 306.36
May 1034.90 299.03 66.68 1424.53 368.40 - 3514.55 216.19 551.63 299.77 291.35 307.50 June 1143.90 299.40 184.52 1443.40 371.32 - 3796.78 170.85 552.44 300.90 292.66 308.46
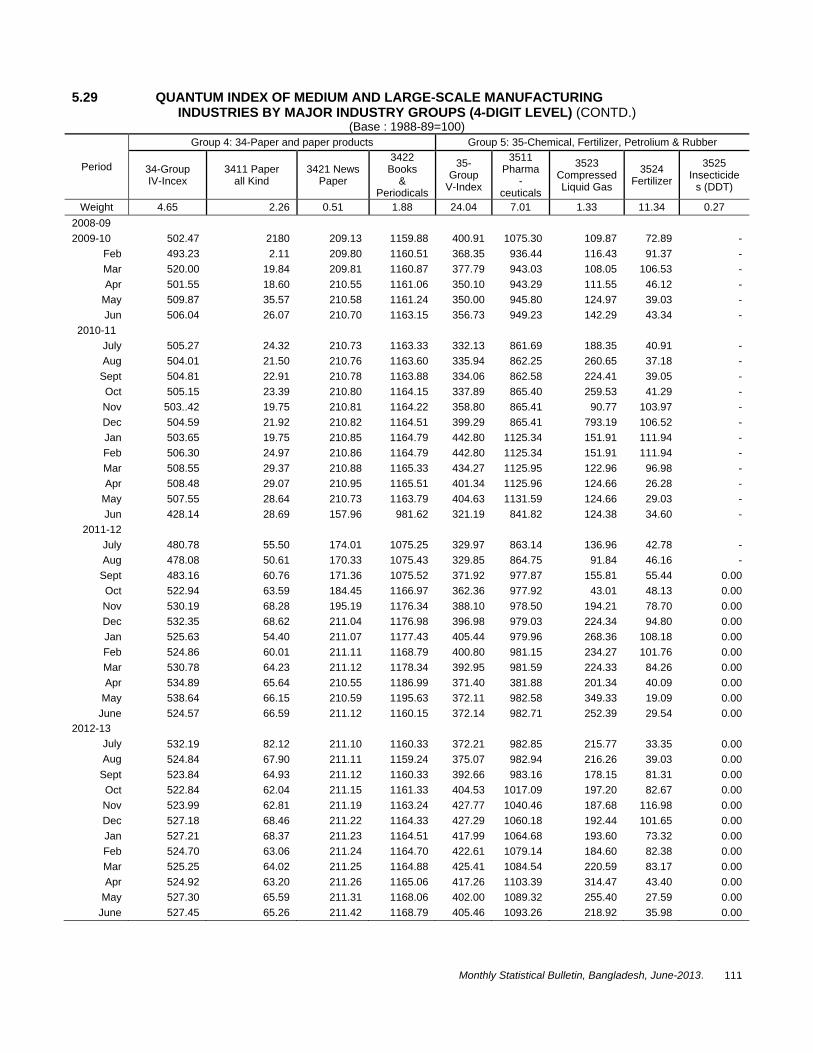
Monthly Statistical Bulletin, Bangladesh, June-2013. . 111
5.29 QUANTUM INDEX OF MEDIUM AND LARGE-SCALE MANUFACTURING INDUSTRIES BY MAJOR INDUSTRY GROUPS (4-DIGIT LEVEL) (CONTD.) (Base : 1988-89=100)
Period
Group 4: 34-Paper and paper products Group 5: 35-Chemical, Fertilizer, Petrolium & Rubber
34-Group IV-Incex
3411 Paper all Kind
3421 News Paper
3422 Books
& Periodicals
35-Group
V-Index
3511 Pharma
-ceuticals
3523 Compressed Liquid Gas
3524 Fertilizer
3525 Insecticide
s (DDT)
Weight 4.65 2.26 0.51 1.88 24.04 7.01 1.33 11.34 0.27 2008-09 2009-10 502.47 2180 209.13 1159.88 400.91 1075.30 109.87 72.89 -
Feb 493.23 2.11 209.80 1160.51 368.35 936.44 116.43 91.37 - Mar 520.00 19.84 209.81 1160.87 377.79 943.03 108.05 106.53 - Apr 501.55 18.60 210.55 1161.06 350.10 943.29 111.55 46.12 -
May 509.87 35.57 210.58 1161.24 350.00 945.80 124.97 39.03 - Jun 506.04 26.07 210.70 1163.15 356.73 949.23 142.29 43.34 -
2010-11 July 505.27 24.32 210.73 1163.33 332.13 861.69 188.35 40.91 - Aug 504.01 21.50 210.76 1163.60 335.94 862.25 260.65 37.18 -
Sept 504.81 22.91 210.78 1163.88 334.06 862.58 224.41 39.05 - Oct 505.15 23.39 210.80 1164.15 337.89 865.40 259.53 41.29 - Nov 503..42 19.75 210.81 1164.22 358.80 865.41 90.77 103.97 - Dec 504.59 21.92 210.82 1164.51 399.29 865.41 793.19 106.52 - Jan 503.65 19.75 210.85 1164.79 442.80 1125.34 151.91 111.94 - Feb 506.30 24.97 210.86 1164.79 442.80 1125.34 151.91 111.94 - Mar 508.55 29.37 210.88 1165.33 434.27 1125.95 122.96 96.98 - Apr 508.48 29.07 210.95 1165.51 401.34 1125.96 124.66 26.28 -
May 507.55 28.64 210.73 1163.79 404.63 1131.59 124.66 29.03 - Jun 428.14 28.69 157.96 981.62 321.19 841.82 124.38 34.60 -
2011-12 July 480.78 55.50 174.01 1075.25 329.97 863.14 136.96 42.78 - Aug 478.08 50.61 170.33 1075.43 329.85 864.75 91.84 46.16 -
Sept 483.16 60.76 171.36 1075.52 371.92 977.87 155.81 55.44 0.00 Oct 522.94 63.59 184.45 1166.97 362.36 977.92 43.01 48.13 0.00 Nov 530.19 68.28 195.19 1176.34 388.10 978.50 194.21 78.70 0.00 Dec 532.35 68.62 211.04 1176.98 396.98 979.03 224.34 94.80 0.00 Jan 525.63 54.40 211.07 1177.43 405.44 979.96 268.36 108.18 0.00
Feb 524.86 60.01 211.11 1168.79 400.80 981.15 234.27 101.76 0.00 Mar 530.78 64.23 211.12 1178.34 392.95 981.59 224.33 84.26 0.00 Apr 534.89 65.64 210.55 1186.99 371.40 381.88 201.34 40.09 0.00
May 538.64 66.15 210.59 1195.63 372.11 982.58 349.33 19.09 0.00 June 524.57 66.59 211.12 1160.15 372.14 982.71 252.39 29.54 0.00
2012-13 July 532.19 82.12 211.10 1160.33 372.21 982.85 215.77 33.35 0.00 Aug 524.84 67.90 211.11 1159.24 375.07 982.94 216.26 39.03 0.00
Sept 523.84 64.93 211.12 1160.33 392.66 983.16 178.15 81.31 0.00 Oct 522.84 62.04 211.15 1161.33 404.53 1017.09 197.20 82.67 0.00 Nov 523.99 62.81 211.19 1163.24 427.77 1040.46 187.68 116.98 0.00 Dec 527.18 68.46 211.22 1164.33 427.29 1060.18 192.44 101.65 0.00 Jan 527.21 68.37 211.23 1164.51 417.99 1064.68 193.60 73.32 0.00
Feb 524.70 63.06 211.24 1164.70 422.61 1079.14 184.60 82.38 0.00 Mar 525.25 64.02 211.25 1164.88 425.41 1084.54 220.59 83.17 0.00 Apr 524.92 63.20 211.26 1165.06 417.26 1103.39 314.47 43.40 0.00
May 527.30 65.59 211.31 1168.06 402.00 1089.32 255.40 27.59 0.00 June 527.45 65.26 211.42 1168.79 405.46 1093.26 218.92 35.98 0.00

Industry, Energy and Mining
Monthly Statistical Bulletin, Bangladesh, June-2013. 112
5.29 QUANTUM INDEX OF MEDIUM AND LARGE-SCALE MANUFACTURING INDUSTRIES BY MAJOR INDUSTRY GROUPS (4-DIGIT LEVEL) (CONTD.)
(Base : 1988-89=100)
Period
Group 5 : 35-Chemical,Fertilizer, Petrolium & Rubber
Group 6 : 36-Non-metalic Products
3531 Paints &
Varnishes
3532 Perfume &
Consme.
3533-Scap &
Detergent
3535
Matches
3541 Petrolium Products
3569 Rubber
Footwear
3579 PVC
Products
36-Group IV-Index
3612
Ceramic Weight 0.06 0.45 1.74 0.35 0.66 0.53 0.30 2.77 0.55
2008-09 2009-10 1419.05 665.79 169.06 89.73 120.77 86.19 972.14 527.28 227.70
Jan 434.21 4.44 209.75 1160.15 371.46 941.11 57.94 103.68 - Feb 1332.16 652.24 162.76 82.96 121.60 80.41 970.55 528.17 228.75 Mar 1400.58 661.02 165.01 84.41 129.09 80.65 978.53 535.63 229.36 Apr 1425.15 668.51 165.08 86.19 136.02 81.05 987.12 535.71 230.89
May 1437.43 705.40 166.29 86.83 138.33 81.69 1057.06 540.72 232.42 Jun 1445.61 707.09 196.70 89.50 142.46 85.57 1076.79 544.72 233.03
2010-11 July 1479.53 707.41 196.48 90.71 97.49 78.01 1144.17 547.99 233.94 Aug 1511.11 706.68 196.57 93.86 143.65 75.80 1149.08 548.32 234.86
Sept 1514.62 707.71 196.51 94.91 104.84 76.27 1162.58 548.78 236.09 Oct 1520.47 709.10 196.48 95.07 101.00 78.64 1164.42 549.46 237.00 Nov 1523.39 709.10 196.54 95.32 124.06 78.80 1165.64 549.68 237.92 Dec 1525.73 709.12 196.64 95.48 137.82 78.81 1168.71 549.83 238.53 Jan 1535.09 709.24 196.77 95.64 143.49 86.63 1190.18 550.25 240.37 Feb 1539.18 709.47 196.87 95.88 122.83 86.65 1190.39 550.75 241.28 Mar 1542.11 709.53 196.96 96.12 131.69 86.68 1208.59 550.90 241.90 Apr 1573.10 710.06 197.19 96.53 127.05 86.69 1236.20 550.98 242.51
May 1577.78 719.11 197.29 96.28 137.19 77.95 1242.94 550.36 232.42 Jun 1567.25 720.64 181.10 96.45 125.06 68.97 1250.92 519.10 234.25
2011-12 July 1501.75 708.08 174.84 90.87 102.52 54.24 1236.20 536.08 223.85 Aug 1504.09 708.89 174.93 91.44 108.83 59.32 1243.56 536.92 226.30
Sept 1514.62 742.37 172.16 91.68 105.67 58.19 1309.82 534.27 226.91 Oct 1517.54 744.11 166.06 19.71 107.25 57.78 1315.95 540.52 227.22 Nov 1624.56 744.12 192.40 138.93 118.91 57.97 1336.20 542.34 227.83 Dec 1536.84 749.67 172.16 139.34 144.20 58.28 1343.56 541.86 126.48 Jan 1549.71 757.01 172.00 123.18 140.96 47.57 1331.29 543.36 232.42
Feb 1564.33 757.73 174.28 123.59 129.58 47.34 1337.42 583.98 230.89 Mar 1576.02 761.42 174.84 126.41 131.39 4753 1380.37 578.52 232.42 Apr 1508.77 762.24 177.22 139.34 131.53 50.88 1395.71 579.87 240.06
May 1517.54 770.01 180.39 139.90 137.60 51.24 1527.61 583.55 241.59 June 1561.40 772.60 180.78 141.52 131.71 51.88 1556.44 584.75 243.12
2012-13 July 1564.33 773.32 183.58 142.33 128.79 52.08 1563.80 573.29 232.42 Aug 1569.01 773.95 183.71 142.57 130.61 51.51 1568.71 536.92 233.03
Sept 1570.18 774.53 183.81 142.97 116.58 51.54 1571.78 573.57 233.94 Oct 1571.35 774.57 184.27 143.62 123.60 52.17 1574.85 574.75 234.86 Nov 1572.51 775.72 184.33 143.94 120.09 54.78 1636.81 573.06 236.70 Dec 1571.93 775.15 184.30 143.78 148.29 54.89 1634.97 571.42 235.47 Jan 1562.57 776.57 184.37 139.74 149.03 54.93 1625.77 571.71 236.09
Feb 1561.40 777.23 184.46 140.15 127.28 54.96 1628.22 572.70 236.39 Mar 1560.23 777.71 184.63 139.90 138.63 58.26 1504.91 575.92 234.56 Apr 1558.48 777.74 184.73 139.88 139.88 58.50 1495.71 578.06 232.42
May 1556.73 781.63 184.79 138.93 123.77 58.64 1490.80 577.78 234.86 June 1554.39 783.64 184.95 138.77 139.32 58.73 1483.44 578.90 235.17

Monthly Statistical Bulletin, Bangladesh, June-2013. . 113
5.29 QUANTUM INDEX OF MEDIUM AND LARGE-SCALE MANUFACTURING INDUSTRIES BY MAJOR INDUSTRY GROUPS (4-DIGIT LEVEL) (CONTD)
(Base : 1988-89=100)
Period
Group 6: 36-Non-Metalic Products Machinery & Equipments Group 7: 37-Basic Metal Products Group 8 : 38-Fabricated Metal
3622 Glass Prod.
3691 Bricks
3692 Cement
37-Group VII-Index
3711 Iron & Steel
3713 Re-Roll Mill
Prod.
38-Group VIII- Index
3819 Alumi- nium Wear & Utensil
bing
3827 Plum- Equipments
Weight 0.15 0.90 1.17 2.07 0.16 1.91 5.94 0.45 0.17 2008-09 2009-10 837.51 256.76 836.42 206.40 - 223.69 190.23 175.33 555.52
Mar 805.57 285.68 837.26 191.19 - 207.20 192.38 176.49 535.65 Apr 805.55 285.81 836.65 236.45 - 256.25 198.40 177.06 535.64
May 805.56 285.68 847.89 245.66 - 266.23 211.20 177.35 535.68 Jun 805.55 285.73 857.03 255.69 - 277.11 229.55 177.92 535.65
2010-11 July 805.54 285.68 864.39 235.84 - 255.60 187.28 177.63 535.58 Aug 805.55 285.62 864.78 241.80 - 262.06 191.97 178.20 535.55
Sept 805.55 285.68 865.23 187.51 - 203.22 192.05 178.48 535.52 Oct 805.56 285.73 866.37 188.86 - 204.68 192.91 177.92 535.54 Nov 805.57 285.81 866.39 241.69 - 261.93 191.95 178.48 535.57 Dec 805.57 285.92 866.40 273.22 - 296.11 192.83 179.39 535.59 Jan 805.55 285.95 866..50 273.32 - 296.22 189.19 178.77 535.58 Feb 805.56 286.088 867.15 300.64 - 325.82 195.87 178..48 535.61 Mar 805.56 286.13 867.18 323.15 - 350.22 198.29 179.05 535.65 Apr 805.55 285.97 867.20 344.68 - 273.54 198.45 178.77 535.70
May 805.53 285.81 870.61 360.56 - 390.76 216.04 179.34 535.77 Jun 544.60 231.72 870.79 319.62 - 346.39 226.97 179.62 535.81
2011-12 July 596.74 285.41 867.89 281.26 - 304.82 180.15 178.77 535.91
Aug. 597.03 285.27 868.82 279.52 - 302.93 187.28 179.34 535.86 Sept 588.33 277.85 869.07 268.71 - 291.22 186.51 192.43 535.90 Oct 588.59 284.60 878.50 235.76 - 255.50 195.71 178.77 535.89 Nov 589.10 284.87 883.66 241.00 - 261.19 215.50 177.92 535.91 Dec 550.24 285.54 884.57 247.04 - 267.73 221.58 173.65 536.00 Jan 530.04 285.81 889.35 251.69 - 272.78 224.69 175.07 535.96
Feb 531.15 274.75 994.61 252.27 - 273.41 218.94 173.36 535.57 Mar 404.94 271.65 999.54 268.27 - 290.75 221.07 169.94 534.79 Apr 406.50 270.38 999.90 283.07 - 306.78 238.85 166.81 527.73
May 405.20 270.03 1008.34 302.51 - 327.85 243.79 165.96 527.37 June 397.89 269.76 1008.74 324.62 - 351.81 244.30 165.11 527.15
2012-13 July 396.90 270.30 989.22 400.41 - 433.95 241.40 167.95 511.06 Aug 391.37 269.14 989.97 399.03 - 432.45 236.22 166.81 500.13
Sept 378.32 268.68 992.78 347.29 - 376.39 241.31 165.11 497.12 Oct 365.28 269.22 996.41 308.02 - 333.83 239.09 166.53 496.72 Nov 352.23 257.89 1001.92 317.16 - 343.73 288.89 165.67 496.43 Dec 339.19 249.26 1006.94 326.79 - 354.16 236.13 165.96 493.48 Jan 320.14 249.66 1009.45 337.07 - 365.31 232.27 166.81 478.31
Feb 327.45 250.74 1009.91 336.71 - 364.91 231.90 16710 475.69 Mar 301.75 262.42 1012.70 345.96 - 374.94 236.94 169.94 475.66
Apr 288.57 262.61 1020.30 323.30 - 350.38 238.20 172.51 475.91
May 274.74 262.34 1020.48 349.05 - 378.29 245.02 194.14 476.20 June 261.56 262.48 1024.56 306.63 - 332.31 269.67 195.00 476.44
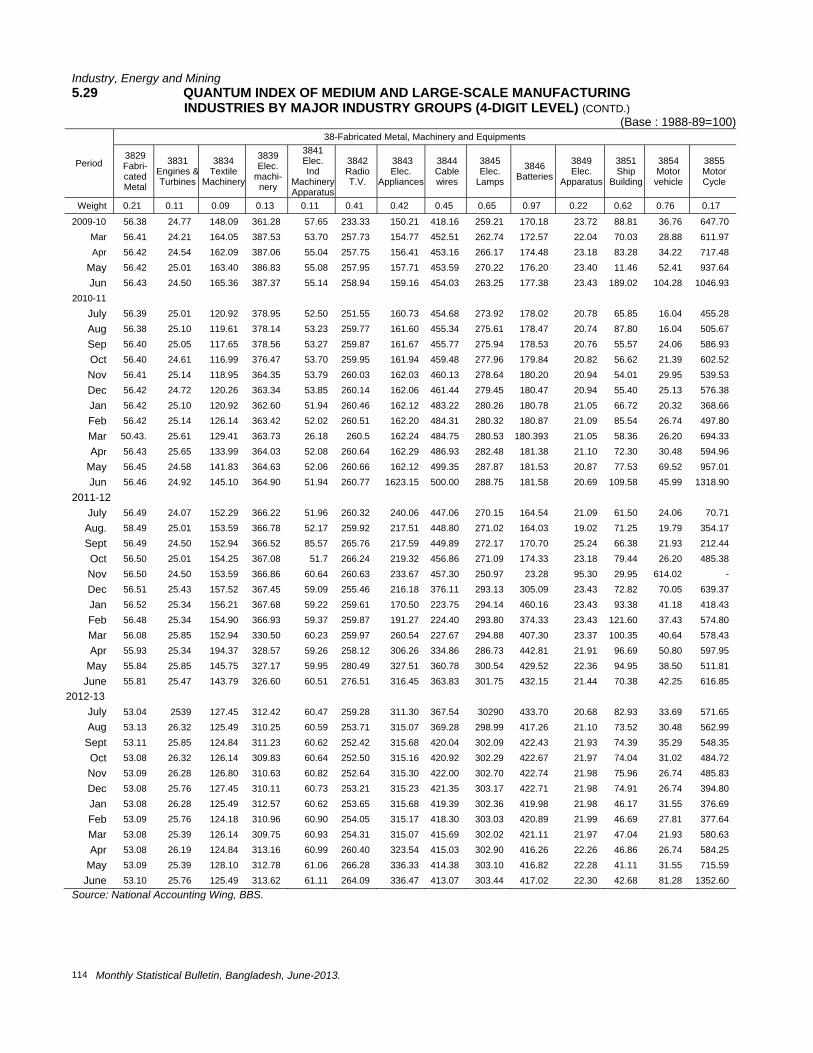
Industry, Energy and Mining
Monthly Statistical Bulletin, Bangladesh, June-2013. 114
5.29 QUANTUM INDEX OF MEDIUM AND LARGE-SCALE MANUFACTURING INDUSTRIES BY MAJOR INDUSTRY GROUPS (4-DIGIT LEVEL) (CONTD.)
(Base : 1988-89=100)
Period
38-Fabricated Metal, Machinery and Equipments
3829 Fabri-cated Metal
3831 Engines &Turbines
3834 Textile
Machinery
3839 Elec.
machi-nery
3841 Elec. Ind
Machinery Apparatus
3842 Radio T.V.
3843 Elec.
Appliances
3844 Cable wires
3845 Elec.
Lamps
3846 Batteries
3849 Elec.
Apparatus
3851 Ship
Building
3854 Motor vehicle
3855 Motor Cycle
Weight 0.21 0.11 0.09 0.13 0.11 0.41 0.42 0.45 0.65 0.97 0.22 0.62 0.76 0.17
2009-10 56.38 24.77 148.09 361.28 57.65 233.33 150.21 418.16 259.21 170.18 23.72 88.81 36.76 647.70 Mar 56.41 24.21 164.05 387.53 53.70 257.73 154.77 452.51 262.74 172.57 22.04 70.03 28.88 611.97 Apr 56.42 24.54 162.09 387.06 55.04 257.75 156.41 453.16 266.17 174.48 23.18 83.28 34.22 717.48
May 56.42 25.01 163.40 386.83 55.08 257.95 157.71 453.59 270.22 176.20 23.40 11.46 52.41 937.64
Jun 56.43 24.50 165.36 387.37 55.14 258.94 159.16 454.03 263.25 177.38 23.43 189.02 104.28 1046.93 2010-11
July 56.39 25.01 120.92 378.95 52.50 251.55 160.73 454.68 273.92 178.02 20.78 65.85 16.04 455.28
Aug 56.38 25.10 119.61 378.14 53.23 259.77 161.60 455.34 275.61 178.47 20.74 87.80 16.04 505.67
Sep 56.40 25.05 117.65 378.56 53.27 259.87 161.67 455.77 275.94 178.53 20.76 55.57 24.06 586.93
Oct 56.40 24.61 116.99 376.47 53.70 259.95 161.94 459.48 277.96 179.84 20.82 56.62 21.39 602.52
Nov 56.41 25.14 118.95 364.35 53.79 260.03 162.03 460.13 278.64 180.20 20.94 54.01 29.95 539.53
Dec 56.42 24.72 120.26 363.34 53.85 260.14 162.06 461.44 279.45 180.47 20.94 55.40 25.13 576.38
Jan 56.42 25.10 120.92 362.60 51.94 260.46 162.12 483.22 280.26 180.78 21.05 66.72 20.32 368.66
Feb 56.42 25.14 126.14 363.42 52.02 260.51 162.20 484.31 280.32 180.87 21.09 85.54 26.74 497.80
Mar 50.43. 25.61 129.41 363.73 26.18 260.5 162.24 484.75 280.53 180.393 21.05 58.36 26.20 694.33
Apr 56.43 25.65 133.99 364.03 52.08 260.64 162.29 486.93 282.48 181.38 21.10 72.30 30.48 594.96
May 56.45 24.58 141.83 364.63 52.06 260.66 162.12 499.35 287.87 181.53 20.87 77.53 69.52 957.01
Jun 56.46 24.92 145.10 364.90 51.94 260.77 1623.15 500.00 288.75 181.58 20.69 109.58 45.99 1318.90
2011-12
July 56.49 24.07 152.29 366.22 51.96 260.32 240.06 447.06 270.15 164.54 21.09 61.50 24.06 70.71
Aug. 58.49 25.01 153.59 366.78 52.17 259.92 217.51 448.80 271.02 164.03 19.02 71.25 19.79 354.17
Sept 56.49 24.50 152.94 366.52 85.57 265.76 217.59 449.89 272.17 170.70 25.24 66.38 21.93 212.44
Oct 56.50 25.01 154.25 367.08 51.7 266.24 219.32 456.86 271.09 174.33 23.18 79.44 26.20 485.38
Nov 56.50 24.50 153.59 366.86 60.64 260.63 233.67 457.30 250.97 23.28 95.30 29.95 614.02 -
Dec 56.51 25.43 157.52 367.45 59.09 255.46 216.18 376.11 293.13 305.09 23.43 72.82 70.05 639.37
Jan 56.52 25.34 156.21 367.68 59.22 259.61 170.50 223.75 294.14 460.16 23.43 93.38 41.18 418.43
Feb 56.48 25.34 154.90 366.93 59.37 259.87 191.27 224.40 293.80 374.33 23.43 121.60 37.43 574.80
Mar 56.08 25.85 152.94 330.50 60.23 259.97 260.54 227.67 294.88 407.30 23.37 100.35 40.64 578.43
Apr 55.93 25.34 194.37 328.57 59.26 258.12 306.26 334.86 286.73 442.81 21.91 96.69 50.80 597.95
May 55.84 25.85 145.75 327.17 59.95 280.49 327.51 360.78 300.54 429.52 22.36 94.95 38.50 511.81
June 55.81 25.47 143.79 326.60 60.51 276.51 316.45 363.83 301.75 432.15 21.44 70.38 42.25 616.85 2012-13
July 53.04 2539 127.45 312.42 60.47 259.28 311.30 367.54 30290 433.70 20.68 82.93 33.69 571.65 Aug 53.13 26.32 125.49 310.25 60.59 253.71 315.07 369.28 298.99 417.26 21.10 73.52 30.48 562.99
Sept 53.11 25.85 124.84 311.23 60.62 252.42 315.68 420.04 302.09 422.43 21.93 74.39 35.29 548.35
Oct 53.08 26.32 126.14 309.83 60.64 252.50 315.16 420.92 302.29 422.67 21.97 74.04 31.02 484.72
Nov 53.09 26.28 126.80 310.63 60.82 252.64 315.30 422.00 302.70 422.74 21.98 75.96 26.74 485.83
Dec 53.08 25.76 127.45 310.11 60.73 253.21 315.23 421.35 303.17 422.71 21.98 74.91 26.74 394.80
Jan 53.08 26.28 125.49 312.57 60.62 253.65 315.68 419.39 302.36 419.98 21.98 46.17 31.55 376.69
Feb 53.09 25.76 124.18 310.96 60.90 254.05 315.17 418.30 303.03 420.89 21.99 46.69 27.81 377.64
Mar 53.08 25.39 126.14 309.75 60.93 254.31 315.07 415.69 302.02 421.11 21.97 47.04 21.93 580.63
Apr 53.08 26.19 124.84 313.16 60.99 260.40 323.54 415.03 302.90 416.26 22.26 46.86 26.74 584.25
May 53.09 25.39 128.10 312.78 61.06 266.28 336.33 414.38 303.10 416.82 22.28 41.11 31.55 715.59
June 53.10 25.76 125.49 313.62 61.11 264.09 336.47 413.07 303.44 417.02 22.30 42.68 81.28 1352.60 Source: National Accounting Wing, BBS.

Monthly Statistical Bulletin, Bangladesh, June-2013. . 115
5.30 QUANTUM INDEX OF SMALL SCALE MANUFACTURING INDUSTRIES (2-DIGIT LEVEL) (Base: 1995-96=100)-CONTD.
Period General
Index (Mfg.)
31 Food,
Beverages & Tobacco
32 Textiles,
Leather & Apparel
33 Wood & Wood
Products
34Paper,
Printing & Publish-
Ing
35 Chemicals Rubber &
Plastic
36 Non-Metalic
Mineral Prod.
37 Basic Metal Industries
38 Metal
Products Machinery
39 Other Mfg. Industries
Weight 100.00 38.86 7.67 30.43 5.33 1.46 0.35 0.72 12.12 3.05Jan-Mar/10 296.09 255.98 255.22 368.36 578.46 228.47 293.28 115.41 251.27 107.02 Apr-Jun 300.86 255.98 242.38 383.50 510.63 239.10 289.41 114.27 269.89 95.64 2010-11 July-Sep 284.09 214.27 239.01 373.65 505.08 246.67 320.74 111.42 274.92 97.99 Oct-Dec 298.40 234.77 392.61 386.64 499.30 250.85 289.84 116.71 271.23 102.99 Jan-Mar 335.79 293.07 263.02 407.47 504.08 253.19 290.70 117.30 344.24 116.86 Apr-Jun 338.87 286.89 265.51 410.03 563.74 256.52 290.84 173.71 334.22 185.49 2011-12 July-Sep 324.78 266.28 275.49 388.27 565.56 268.64 289.70 236.74 321.55 204.66 Oct-Dec. 328.94 277.42 258.19 387.03 561.49 272.93 287.98 202.52 335.76 211.79 Jan-Mar 331.93 297.58 234.57 284.35 557.12 244.17 282.98 177.99 331.56 181.74 Apr-June 335.24 289.59 259.38 293.95 565.86 252.52 287.84 180.69 339.07 185.59 2012-13 July-Sep 349.03 320.10 260.34 404.35 569.18 259.81 288.27 182.39 326.73 181.98 Oct-Dec. 366.74 354.82 267.96 411.79 579.19 261.34 299.00 205.22 332.26 179.88 Source: National Accounting Wing, BBS.
5.31 QUANTUM INDEX OF SMALL SCALE MANUFACTURING INDUSTRIES (4-DIGIT LEVEL)
(Base: 1995-96=100)
Period General
Index (Mfg.)
311-312
TOTAL
311-312 Food Mfg. 3118
Grain Milling 3119
Rice Milling 3122
Bakery Products
3125 Chocolate
321 TOTAL
321- Textiles 3211- Lungi
3112 Diary
Products 3116
Edible Oil
Weight 100.00 38.86 1.74 2.24 3.72 21.11 9.69 0.36 3.35 1.08
2007-08 Apr-Jun 259.46 173.78 178.83 107.53 203.60 153.75 221.88 133.41 156.76 284.13 2008-09 July-Sep 268.98 184.47 179.29 106.91 202.96 155.11 261.96 136.62 162.78 293.99 Oct-Dec 275.64 184.93 179.47 102.37 203.22 155.67 263.64 132.85 169.92 314.69 Jan-Mar 276.74 185.87 179.61 103.55 203.99 157.03 263.77 135.34 170.76 313.30 Apr-Jun 277.68 185.36 179.67 105.65 198.20 160.94 255.35 124.28 172.57 317.71 2009-10 July-Sep 305.83 255.98 180.05 105.81 203.22 277.32 283.08 121.49 176.37 322.92 Oct-Dec 314.43 273.32 181.89 100.37 203.99 307.51 287.68 116.78 178.29 317.71 Jan-Mar/10 296.09 251.83 178.97 883.77 204.38 190.89 174.85 115.48 176.95 312.50 Apr-Jun 300.86 250.58 179.93 84.78 203.99 271.57 278.49 123.26 176.95 315.00 2010-11 July-Sep 284.09 214.27 179.29 81.42 217.50 227.24 225.16 122.46 167.36 300.35 Oct-Dec 298.40 234.77 180.23 77.26 202.83 262.78 236.44 121.49 179.24 314.93 Jan-Mar 335.79 293.07 176.29 87.32 266.54 362.22 227.94 110.46 191.63 330.73 Apr-Jun 338.87 286.89 164.65 87.35 267.70 320.85 294.49 121.50 179.08 286.46 2011-12 July-Sep 324.78 266.28 165.04 68.82 201.93 326.68 228.95 112.26 194.22 322.92 Oct-Dec. 328.94 261.11 155.67 58.67 201.67 349.44 222.29 82.06 192.28 305.21 Jan-Mar 331.93 297.58 163.87 44.41 210.55 390.58 218.76 86.33 179.18 263.37 Apr-June 335.22 289.59 156.53 33.02 204.50 385.78 203.42 56.73 210.90 337.85 2012-13 Jul-Sep 349.03 320.10 156.13 42.18 201.54 458.47 166.32 92.91 201.35 343.23 Oct-Dec. 366.74 354.82 140.88 42.69 198.71 501.84 214.81 92.03 233.82 447.57

Industry, Energy and Mining
Monthly Statistical Bulletin, Bangladesh, June-2013. 116
5.31 QUANTUM INDEX OF SMALL SCALE MANUFACTURING INDUSTRIES (4-DIGIT LEVEL)-CONTD. (Base: 1995-96=100)
321- 322 323 324 325 327 331 332 341
Period Textiles 3214-
Dhottes & Sarees
Textile Except.
Wearing Apparels
Leather Products
Footwear Except Leather
Embrodiery on Textiles
Wood Prod. Except
Furniture Wooden Furniture
Paper & Paper Prods.
3223 3231 3243 3251 3271 3311 3321 3413
Knitwear Garments Leather Prod. Exp. F.wear
Leather & Other
Footwear Exp. Rub.
Embroidery Saw & Planing Mills Furniture Paper &
Paper Board
Weight 2.27 1.16 0.44 0.74 1.51 0.46 11.62 18.81 0.352007-08 July-Sep 98.71 308.90 156.09 241.40 383.05 112.34 338.61 341.50 2441.89 Oct-Dec 95.62 346.56 157.02 245.95 384.76 122.56 358.88 328.95 2395.35 Jan-Mar 98.49 347.90 163.93 250.71 383.36 125.47 376.50 330.53 2379.07 Apr-Jun 96.16 346.16 169.00 226.42 382.43 130.20 384.22 341.05 2390.70 2008-09 July-Sep 100.36 352.32 170.73 227.63 383.05 148.12 424.12 339.85 2406.98 Oct-Dec 101.04 372.33 170.96 231.07 382.27 194.92 445.00 350.08 2441.86 Jan-Mar 102.94 369.34 171.35 234.11 383.67 194.48 455.06 343.98 2451.16 Apr-Jun 103.52 318.92 172.72 235.93 443.23 213.89 445.73 345.71 2451.16 2009-10 July-Sep 106.64 359.32 174.05 236.74 458.79 247.68 443.15 345.86 2458.14 Oct-Dec 111.95 365.33 174.20 239.27 461.90 255.82 454.76 346.32 2462.79 Jan-Mar/10 112.46 279.33 167.82 241.40 461.12 199.88 413.28 340.60 2502.33 Apr-Jun 111.27 234.64 174.60 242.91 432.66 183.02 436.88 350.53 2511.63 2010-11 July-Sep 104.09 271.71 163.86 239.88 400.47 224.10 427.22 340.60 2525.58 Oct-Dec 114.68 285.65 175.06 246.26 432.35 236.21 435.43 366.17 2532.56 Jan-Mar 125.45 291.16 175.23 248.38 444.79 228.48 450.23 381.05 2541.86 Apr-Jun 128.00 294.32 175.46 320.45 446.50 231.25 231.25 383.91 2551.16 2011-12 July-Sep 132.99 297.76 180.36 341.09 449.46 231.54 431.85 361.35 2560.74 Oct-Dec. 138.55 289.45 170.34 282.69 401.40 239.98 422.39 365.19 2458.14 Jan-Mar 139.12 293.40 170.86 256.58 319.75 240.59 413.71 366.54 2409.30 Apr-June 150.50 309.06 1841.51 267.81 351.32 249.05 414.21 381.49 2437.81 2012-13 Jul-Sep 133.85 311.86 187.16 292.51 364.23 242.92 404.35 384.59 2423.26 Oct-Dec. 132.12 372.24 189.31 113.36 372.47 240.36 448.88 388.87 2420.93

Monthly Statistical Bulletin, Bangladesh, June-2013. . 117
5.31 QUANTUM INDEX OF SMALL SCALE MANUFACTURING INDUSTRIES (4-DIGIT LEVEL)-CONTD.
(Base: 1995-96=100)
Period
342 342 Printing & Publishing 357 357 Plastic Products N.E.C. 369
Total
3422 Book Printing
& Publishing
3423 Commercial Job Printing
3424/34 Cards &
Stationery Total
3571 Rubber
Sandles & Shoes
3572 Polythine Products
3579 Misc Plastic
Products
Cement Products
3693 Rcc Pipes
Weight 4.98 0.81 2.50 1.64 1.46 0.59 0.22 0.66 0.35
2009-10 Jul-Sep 364.81 106.11 220.08 715.84 241.40 216.89 - 263.68 304.01 Oct-Dec 379.83 106.65 221.36 759.22 244.14 219.11 - 266.90 282.69 Jan-Mar/10 379.03 106.81 222.55 754.88 228.47 202.25 - 252.31 293.28 Apr-Jun 370.00 106.95 223.57 725.81 239.10 210.23 - 265.34 289.41 2010-11 July-Sep 363.08 107.07 224.12 703.90 246.67 214.56 - 275.85 320.74 Oct-Dec 356.40 107.16 224.29 683.30 250.85 214.37 - 284.02 289.84 Jan-Mar 360.86 107.32 224.59 696.31 253.19 217.98 - 285.21 290.70 Apr-Jun 424.06 107.42 224.80 887.85 256.52 170.81 - 334.44 290.84 2011-12 July-Sep 425.35 87.09 370.46 1460.70 268.64 128.23 - 396.27 289.70 Oct-Dec. 428.19 108.04 226.96 896.75 272.93 132.46 - 400.62 287.98 Jan-Mar 426.94 106.95 230.62 887.85 244.17 118.70 - 358.23 282.98 Apr-June 434.34 107.10 230.79 909.98 252.52 111.31 - 380.89 287.84 2012-13 July-Sep 438.87 108.08 235.46 916.05 259.81 112.04 - 394.15 288.27 Oct-Dec. 449.75 108.81 239.49 942.52 261.39 113.14 - 396.07 299.00
5.31 QUANTUM INDEX OF SMALL SCALE MANUFACTURING INDUSTRIES (4-DIGIT LEVEL)-CONTD. (Base: 1995-96=100)
371 381 381 Metal Prod. Machi. 382 382 Metal Prod. Except. Furniture 383
Period Iron & Steel (Nuts&Bolt Industries
TOTAL 3814 Steel
Products
3815Structural
Metal TOTAL
3823C.I. Pan
&
3824/38 Metal Trunks
&
3829Metal Prods. NEC. Excpt.
Total
3712 Products Tin Plate Tincans Machinery Iron & Steel
Weight 0.72 6.50 2.93 3.57 2.57 0.32 0.54 1.71 2.142008-09 Jan-Mar 123.76 303.99 338.19 275.92 223.20 222.12 109.51 259.31 161.17 Apr-Jun 133.69 312.69 347.64 284.00 234.97 222.07 112.29 276.12 161.11 2009-10 July-Sep 138.62 316.72 355.91 284.56 224.91 222.22 114.15 260.40 165.36 Oct-Dec 135.25 320.23 362.60 285.46 225.19 222.22 114.74 260.62 169.77 Jan-Mar/10 115.41 307.37 355.51 267.86 205.40 207.15 106.39 236.35 163.32 Apr-Jun 114.27 331.14 387.01 285.30 219.62 203.12 97.47 261.28 174.51 2010-11 July-Sep 111.42 343.72 419.29 281.69 213.65 202.56 93.76 253.58 170.99 Oct-Dec 116.71 331.41 391.34 282.23 219.54 202.94 92.09 262.89 181.70 Jan-Mar 117.30 457.70 624.80 320.56 220.32 201.31 95.40 263.33 208.46 Apr-Jun 173.71 436.24 548.43 344.17 210.89 155.03 76.05 263.03 227.31 2011-12 July-Sep 236.74 403.89 476.38 344.40 203.43 151.45 51.99 260.99 249.08 Oct-Dec. 202.52 411.55 478.35 356.73 210.81 105.59 33.98 286.35 294.12 Jan-Mar 177.99 427.74 517.32 354.22 193.03 95.18 61.86 252.77 259.07 Apr-June 180.69 414.77 475.98 364.52 212.69 80.72 54.21 287.43 310.93 2012-13 July-Sep 182.39 389.72 398.43 382.57 220.61 85.44 45.08 301.33 304.82 Oct-Dec. 205.22 393.06 401.57 386.07 223.18 81.14 36.02 308.86 320.00

Industry, Energy and Mining
Monthly Statistical Bulletin, Bangladesh, June-2013. 118
5.31 QUANTUM INDEX OF SMALL SCALE MANUFACTURING INDUSTRIES (4-DIGIT LEVEL) (Base: 1995-96=100)
Period 383 Non-Electrical Machinery 384 385 385 Transport Equip. 393 393 Jewellery of pre. Metal 3832 3834 3839 Electrical TOTAL 3854 3856 TOTAL 3931 3935
Agri. Machinery
Textiles Machinery
Machinery Excpt.
Electrical
Machinery3849
Electrical Apparatus
N.E.C.
Motor Tyres
Tubes & Parts
Bicycle & Rickshaw
Parts
Ornaments (Gold & Silver)
Plastic & Wooden
Toys
Weight 0.79 0.84 0.51 0.16 0.75 0.62 0.13 3.05 2.98 0.08
2006-07 Oct-Dec 133.73 162.19 107.94 536.74 117.69 111.32 148.09 159.02 159.30 128.85 Jan-Mar 166.52 168.70 110.24 557.98 120.55 114.60 148.89 156.31 159.49 130.13 Apr-Jun 169.87 169.92 112.59 528.23 113.67 108.84 136.72 152.21 152.25 131.64 2007-08 Jul-Sep 160.39 168.43 113.63 534.30 115.80 108.73 149.52 152.60 152.56 134.96 Oct-Dec 163.48 169.04 115.77 564.66 118.77 113.76 142.64 153.23 153.19 135.69 Jan-Mar 166.57 171.46 116.06 614.44 117.94 109.75 156.99 153.50 153.46 136.11 Apr-Jun 167.34 171.21 116.64 612.93 119.57 111.82 156.48 151.94 151.81 137.91 2008-09 Jul-Sep 167.77 171.25 116.90 616.21 120.84 112.84 158.99 152.20 152.03 139.37 Oct-Dec 171.62 172.09 117.94 625.96 119.80 112.67 153.82 154.62 154.48 140.37 Jan-Mar 174.97 173.02 120.29 610.69 119.28 112.48 151.72 154.76 154.61 140.94 Apr-Jun 175.40 172.33 120.48 572.55 120.08 113.94 149.39 169.79 170.00 140.86 2009-10 July-Sep 184.35 173.48 122.54 562.84 123.04 117.04 151.64 164.98 164.73 153.60 Oct-Dec 195.89 173.59 123.01 559.20 119.51 111.75 156.52 138.32 137.59 150.29 Jan-Mar/10 191.47 167.68 112.53 540.98 111.34 114.068 143.09 107.02 105.66 144.26 Apr-Jun 215.65 171.02 116.54 554.94 12254 115.22 157.49 95.64 93.00 181.88 2010-11 July-Sep 209.60 186.76 114.84 540.98 128.47 123.61 151.64 97.99 96.12 155.35 Oct-Dec 224.22 181.67 115.87 534.90 125.99 120.32 153.00 102.99 101.20 156.66 Jan-Mar 303.73 174.29 117.16 558.58 127.29 117.59 173.53 116.86 114.98 172.35 Apr-Jun 306.43 176.17 188.97 559.22 129.70 120.4 173.72 185.49 185.15 174.87 2011-12 July-Sep 342.26 176.80 223.81 599.71 160.03 141.83 246.83 204.63 204.90 169.01 Oct-Dec. 452.21 194.41 213.46 614.70 166.43 154.59 222.85 211.79 212.35 164.62 Jan-Mar 417.27 171.06 158.98 407.27 163.46 155.71 200.42 181.74 161.68 161.51 Apr-June 529.66 194.58 163.74 455.83 171.54 164.35 205.85 185.59 185.47 166.97 2012-13 July-Sep 532.36 141.62 166.80 485.06 173.28 165.61 209.87 181.98 181.68 170.55 Oct-Dec. 564.77 179.76 171.84 487.38 181.09 171.36 227.50 179.88 179.45 173.63 Source: National Accounting Wing, BBS.

Monthly Statistical Bulletin, Bangladesh, June-2013. . 119
5.32 QUANTUM INDEX OF MINING AND ELECTRICITY (Base : 1988-89=100)
Period 2 Mining and Quarrying
General Index (Mining) 291-412
2912 Lime Stone
2915 China Clay
4121 Natural Gas
4114Electricity
GenerationWeight 100.00 0.20 0.19 99.61 100.00
2008-09 2009-10
July 457.45 - - 459.24 411.42 Aug 458.53 - - 460.33 413.10 Sep 427.33 - - 424.70 398.09 Oct 436.40 - - 460.15 400.28 Nov 430.30 - - 428.49 338.38 Dec 444.96 - - 446.35 318.30 Jan 467.46 - - 469.29 941.24 Feb 424.70 - - 426.36 342.76 Sep 420.64 - - 422.28 430.65 Oct 459.34 - - 461.14 429.80 Nov 426.05 - - 427.72 436.04 Dec 456.09 - - 457.88 432.16 Jan 470.71 - - 472.55 361.82 Feb 433.09 - - 434.78 359.29 Mar 472.61 - - 474.46 427.27 Apr 443.37 - - 445.11 449.54 May 460.97 - - 462.77 462.86 Jun 455.28 - - 457.77 461.18
2011-12 July 469.67 - - 471.47 495.93 Aug 462.91 - - 464.67 509.25 Sep 442.83 - - 444.57 490.53 Oct 458.53 - - 460.33 513.98 Nov 450.68 - - 452.45 502.17 Dec 452.03 - - 453.80 405.34 Jan 556.79 - - 358.97 430.81 Feb 551.31 - - 513.32 427.10 Mar 494.26 - - 496.20 480.41 April 479.10 - - 480.98 454.09 May 476.94 - - 478.80 507.73 June 493.18 - - 495.11 520.89
2012-13 July 500.76 - - 502.72 510.26 Aug 497.84 - - 499.73 578.58 Sep 516.79 - - 518.75 547.37 Oct 507.25 - - 509.24 510.10 Nov 512.13 - - 514.13 415.80 Dec 517.81 - - 519.84 403.99 Jan 521.60 - - 523.64 414.45 Feb 478.56 - - 480.43 424.24 Mar 532.70 - - 534.78 556.15 April 510.50 - - 512.50 569.98 May 512.12 - - 514.13 540.96 June 510.23 - - 512.23 599.33
Source: National Accounting Wing, BBS.
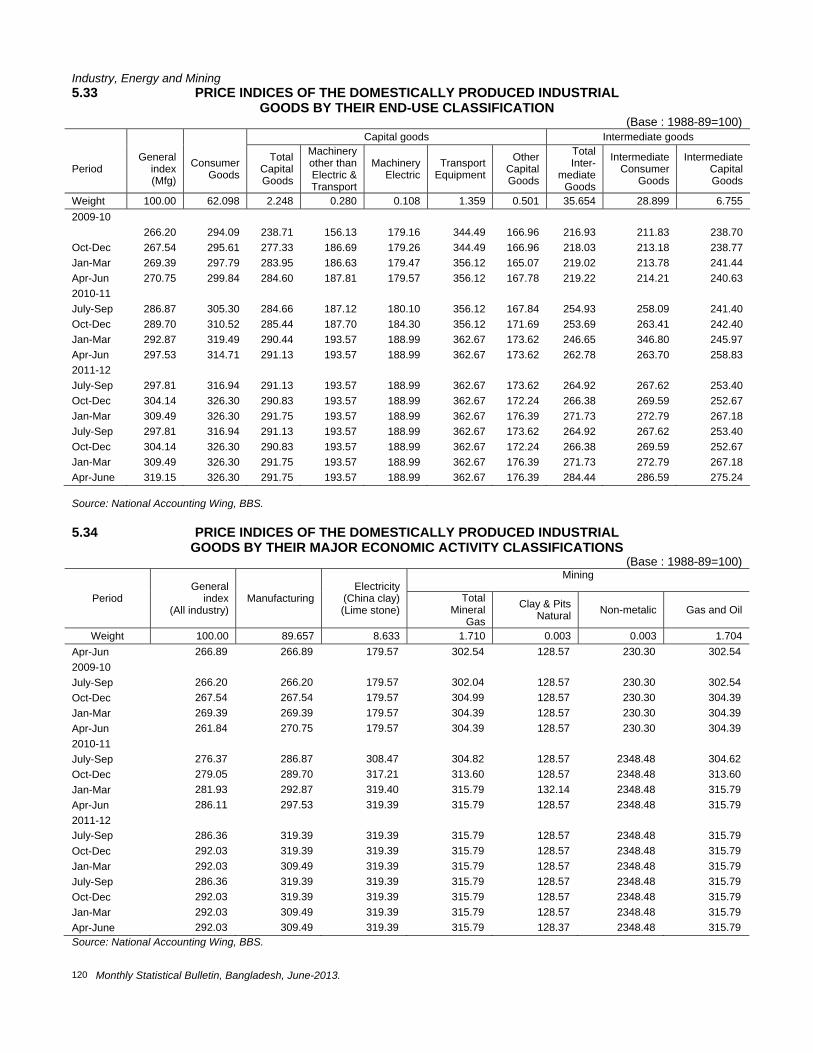
Industry, Energy and Mining
Monthly Statistical Bulletin, Bangladesh, June-2013. 120
5.33 PRICE INDICES OF THE DOMESTICALLY PRODUCED INDUSTRIAL GOODS BY THEIR END-USE CLASSIFICATION
(Base : 1988-89=100) Capital goods Intermediate goods
Period General
index (Mfg)
Consumer Goods
Total Capital Goods
Machinery other than Electric & Transport
Machinery Electric
Transport Equipment
Other Capital Goods
Total Inter-
mediate Goods
Intermediate Consumer
Goods
Intermediate Capital Goods
Weight 100.00 62.098 2.248 0.280 0.108 1.359 0.501 35.654 28.899 6.755 2009-10 266.20 294.09 238.71 156.13 179.16 344.49 166.96 216.93 211.83 238.70 Oct-Dec 267.54 295.61 277.33 186.69 179.26 344.49 166.96 218.03 213.18 238.77 Jan-Mar 269.39 297.79 283.95 186.63 179.47 356.12 165.07 219.02 213.78 241.44 Apr-Jun 270.75 299.84 284.60 187.81 179.57 356.12 167.78 219.22 214.21 240.63 2010-11 July-Sep 286.87 305.30 284.66 187.12 180.10 356.12 167.84 254.93 258.09 241.40 Oct-Dec 289.70 310.52 285.44 187.70 184.30 356.12 171.69 253.69 263.41 242.40 Jan-Mar 292.87 319.49 290.44 193.57 188.99 362.67 173.62 246.65 346.80 245.97 Apr-Jun 297.53 314.71 291.13 193.57 188.99 362.67 173.62 262.78 263.70 258.83 2011-12 July-Sep 297.81 316.94 291.13 193.57 188.99 362.67 173.62 264.92 267.62 253.40 Oct-Dec 304.14 326.30 290.83 193.57 188.99 362.67 172.24 266.38 269.59 252.67 Jan-Mar 309.49 326.30 291.75 193.57 188.99 362.67 176.39 271.73 272.79 267.18 July-Sep 297.81 316.94 291.13 193.57 188.99 362.67 173.62 264.92 267.62 253.40 Oct-Dec 304.14 326.30 290.83 193.57 188.99 362.67 172.24 266.38 269.59 252.67 Jan-Mar 309.49 326.30 291.75 193.57 188.99 362.67 176.39 271.73 272.79 267.18 Apr-June 319.15 326.30 291.75 193.57 188.99 362.67 176.39 284.44 286.59 275.24 Source: National Accounting Wing, BBS. 5.34 PRICE INDICES OF THE DOMESTICALLY PRODUCED INDUSTRIAL GOODS BY THEIR MAJOR ECONOMIC ACTIVITY CLASSIFICATIONS
(Base : 1988-89=100)
Period General
index (All industry)
Manufacturing Electricity
(China clay) (Lime stone)
Mining
Total Mineral
Gas
Clay & Pits Natural Non-metalic Gas and Oil
Weight 100.00 89.657 8.633 1.710 0.003 0.003 1.704 Apr-Jun 266.89 266.89 179.57 302.54 128.57 230.30 302.54 2009-10 July-Sep 266.20 266.20 179.57 302.04 128.57 230.30 302.54 Oct-Dec 267.54 267.54 179.57 304.99 128.57 230.30 304.39 Jan-Mar 269.39 269.39 179.57 304.39 128.57 230.30 304.39 Apr-Jun 261.84 270.75 179.57 304.39 128.57 230.30 304.39 2010-11 July-Sep 276.37 286.87 308.47 304.82 128.57 2348.48 304.62 Oct-Dec 279.05 289.70 317.21 313.60 128.57 2348.48 313.60 Jan-Mar 281.93 292.87 319.40 315.79 132.14 2348.48 315.79 Apr-Jun 286.11 297.53 319.39 315.79 128.57 2348.48 315.79 2011-12 July-Sep 286.36 319.39 319.39 315.79 128.57 2348.48 315.79 Oct-Dec 292.03 319.39 319.39 315.79 128.57 2348.48 315.79 Jan-Mar 292.03 309.49 319.39 315.79 128.57 2348.48 315.79 July-Sep 286.36 319.39 319.39 315.79 128.57 2348.48 315.79 Oct-Dec 292.03 319.39 319.39 315.79 128.57 2348.48 315.79 Jan-Mar 292.03 309.49 319.39 315.79 128.57 2348.48 315.79 Apr-June 292.03 309.49 319.39 315.79 128.37 2348.48 315.79 Source: National Accounting Wing, BBS.

Monthly Statistical Bulletin, Bangladesh, June-2013. . 121
5.35 PRICE INDICES OF THE DOMESTICALLY PRODUCEDINDUSTRIAL GOODS BY INDUSTRIAL GROUPS (Base : 1988-89=100)
Period General
Index (Mfg.)
311-312 Food manufacturing except beverage 311-312
Total Products
3112 Dairy
Vegetable
3113 Fruits &
Sea Foods
3114 Fish &
3115 VanashpatiOil & Fats
3116 Edible Milling
3118 Flour
Products
3122 Bakery
Mfg.
3123 Sugar (Black)
3126 Tea
(Blended)
3127 Tea Salt
3128 Edible
Weight 100.00 16.632 0.174 0.032 1.768 0.436 1.389 1.158 0.943 2.723 7.562 0.148 0.289 2009-10 July-Sep 266.20 309.21 569.48 303.69 545.35 147.04 284.08 260.87 687.87 145.60 280.62 223.08 366.67
Oct-Dec 267.54 319.53 569.48 303.69 545.35 147.04 289.90 263.01 700.74 145.60 286.77 227.69 383.33 Jan-Mar 269.39 318.86 569.48 303.69 546.35 147.07 291.81 264.81 691.94 169.87 290.86 227.69 366.67 Apr-Jun 270.75 321.25 569.48 303.69 548.31 147.04 293.71 269.13 698.16 172.30 290.66 227.69 366.67 2010-11 Jul-Sep 286.87 332.18 574.98 315.83 503.85 161.88 316.60 305.96 313.46 218.40 315.44 230.77 366.67 Oct-Dec 209.70 325.85 586.58 315.53 508.79 175.37 320.42 331.07 314.23 218.40 315.44 235.38 366.67 Jan-Mar 292.87 301.21 593.46 315.53 567.79 202.35 331.86 323.13 348.73 218.40 368.70 235.83 366.67 Apr-Jun 297.53 366.25 593.46 315.53 512.74 242.82 392.89 301.00 348.73 218.40 368.70 235.38 366.67 2011-12 Jul-Sep. 297.81 366.90 574.98 304.17 513.73 212.62 396.70 319.67 349.51 218.40 368.70 236.92 316.67 Oct-Dec 304.14 367.20 584.53 304.17 514.72 242.82 400.52 321.47 494.60 232.96 372.80 236.92 333.33 Jan-Mar 309.49 367.83 584.53 304.17 515.71 242.82 402.43 326.86 494.60 235.39 372.80 236.92 316.67 Apr-June 319.15 423.43 584.53 304.17 521.26 250.92 423.41 318.15 584.69 235.39 402.52 236.92 322.33
5.35 PRICE INDICES OF THE DOMESTICALLY PRODUCED INDUSTRIAL GOODS BY INDUSTRIAL GROUPS-CONTD.
(Base : 1988-89=100)
Period
313- Beverage Industries 314-Tobacco Mfg 321-Textile manufacturing 322-Textile (Car[et & Rugs)323 wear ing Appar
els
313 Total
3131 Spirits& Alcohol
3134 Soft
Drinks
314 Total
3141 Ciga- rette
3142 Bidies
321 Total
3211 Cotton Textile
3213 Jute
Textile
3214 Silk artifici al
silk & rayon
3217 Dying &
Blea ching
322 Total
3224 Car pet & Rug
3226 Thread
Ball making
3231 Ready made
GarmentsWeight 0.828 0.678 0.150 5.835 2.056 3.779 24.190 7.679 13.790 1.558 1.163 0.269 0.256 0.013 8.953 2008-
09 July-Sep 141.17 116.83 250.98 162.80 168.46 159.72 253.65 175.89 210.32 194.10 110.64 366.56 380.12 140.71 360.55
Oct-Dec 141.17 116.67 250.98 167.30 168.46 166.67 193.56 175.91 210.32 194.10 110.64 308.56 380.12 140.91 360.55 Jan-Mar 141.52 116.87 252.94 167.30 168.46 166.67 194.08 177.25 210.92 194.54 110.64 368.56 380.12 140.91 360.55 Apr-Jun 141.88 116.78 254.90 172.95 169.19 175.00 194.76 179.26 210.32 196.26 10.64 368.56 38.12 140.91 360.55 2009-10 July-Sep 141.88 116.87 254.90 180.41 180.41 181.88 198.29 181.88 215.05 196.26 110.64 368.36 380.12 140.91 371.16
Oct-Dec 141.88 116.87 254.90 180.93 181.63 180.56 199.11 184.31 215.05 196.98 110.64 368.61 380.12 142.05 371.16 Jan-Mar 143.65 116.87 264.71 185.43 181.63 187.50 198.95 183.50 215.05 197.70 111.79 368.60 380.12 142.05 371.16 Apr-Jun 143.65 11687 264.71 185.45 181.63 187.50 199.41 184.64 215.05 199.13 111.84 368.61 380.12 142.05 311.16 2010-11 July-Sep 134.90 116.87 227.45 287.45 187.35 186.50 249.59 186.27 303.91 201.30 90.58 368.67 380.12 143.18 381.76
Oct-Dec 137.59 117.71 227.49 187.97 188.83 187.50 255.72 193.83 310.26 201.30 90.82 368.83 380.12 146.59 390.24 Jan-Mar 139.37 117.71 237.25 188.49 195.32 187.50 235.70 196.82 273.21 203.46 90.71 375.38 386.94 147.73 392.36 Apr-Jun 140.08 117.71 241.18 189.46 193.07 187.50 260.49 205.49 311.87 203.46 9077 7.14 00.00 147.73 397.67 2011-12 Jul-Sep 140.76 116.55 210.18 189.46 193.07 187.59 263.40 186.27 328.26 201.30 86.79 7.14 0.00 147.73 299.31 Oct-Dec 140.76 118.55 241.18 189.46 193.07 187.50 264.76 186.38 331.79 201.30 72.56 7.14 0.00 147.73 377.52 Jan-Mar 140.76 118.55 241.18 185.09 193.44 180.56 269.44 197.28 332.49 201.30 89.64 7.14 0.00 147.73 398.20 Apr-June 152.48 118.55 305.97 188.97 204.45 180.56 284.64 211.97 390.63 201.30 93.73 7.14 0.00 47.73 398.20

Industry, Energy and Mining
Monthly Statistical Bulletin, Bangladesh, June-2013. 122
5.35 PRICE INDICES OF THE DOMESTICALLY PRODUCED INDUSTRIAL GOODS BY INDUSTRIAL GROUPS-CONTD.
(Base : 1988-89=100)
Period
324 Leather &
leather Product
3241 Tanning & Finishing
325 Foot wear
3251 Leather
Footwear
331 Wood prod.
Except Furniture
3314 Board Mft.
332 Furniture
& Fixture 3321
Wooden Furniture
341 Paper & paper
Fproducts 3411 Paper
Products (All kinds)
342-Mfg. Printing & Publishing
342 Total
3421 News Paper Book
etc.
3423 Books &
Periodicals
Weight 2.439 1.568 0.104 0.117 2.217 2.345 0.533 1.842 2009-10 July-Sep 286.60 686.09 196.50 662.89 183.59 291.46 312.50 285.71 Oct-Dec 289.69 686.09 197.54 679.40 184.23 291.46 312.50 285.71 Jan-Mar 293.93 726.45 199.43 683.18 189.29 308.28 312.50 307.13 Apr-Jun 293.93 746.63 201.74 686.97 189.29 308.28 312.50 307.13 2010-11 July-Sep 293.93 754.70 202.37 686.97 189.29 314.99 343.75 307.13 Oct-Dec 297.01 766.81 205.30 698.78 191.42 334.07 343.75 331.42 Jan-Mar 297.60 774.88 208.24 704.50 192.31 334.07 343.75 331.42 Apr-Jun 299.31 782.95 208.24 704.50 194.14 336.32 345.75 334.29 2011-12 July-Sep 299.31 786.99 187.61 714.46 194.14 343.02 375.00 334.29 Oct-Dec 302.21 791.02 187.61 714.46 195.3 349.75 375.00 342.86 Jan-Mar 302.63 807.17 187.61 714.46 195.36 351.43 375.00 345.00 Apr-June 303.06 847.63 187.61 714.46 195.99 353.12 375.00 347.14 5.35 PRICE INDICES OF THE DOMESTICALLY PRODUCED INDUSTRIAL GOODS BY INDUSTRIAL GROUPS-CONTD. (Base : 1988-89=100) 351-Drugs 352 Industrial 353 Mfg. of other Chemical products Period pharma- Chemical ceuticals 3511 352 3523 3524 3525 353 3531 3532 3533 3535 Drugs & Total Compre- Chemical Disinfect- Total Paints & Perfumes Soap & Matches Medicines ssed Fertilizers ants & Varnishes & Detergent Liquified Insecti- Cosmetics Gas cide Weight 6.870 12.690 1.308 11.120 0.262 2.553 0.060 0.441 1.707 0.345 2008-09 Oct-Dec 203.60 359.01 776.67 315.33 127.89 161.78 231.93 210.38 147.69 157.04 Jan-Mar 204.74 359.27 779.17 315.33 127.89 164.11 241.41 214.57 147.67 167.50 Apr-Jun 206.24 359.44 780.83 315.33 127.89 164.92 247.89 218.37 147.67 167.50 2009-10 July-Sep 207.39 326.45 780.83 277.68 127.89 164.42 247.89 218.37 147.67 167.50 Oct-Dec 208.07 326.95 780.83 278.23 128.49 166.28 254.02 219.12 149.29 167.50 Jan-Mar 202.01 3247.03 780.83 274.91 128.49 167.66 258.85 221.53 149.29 173.79 Apr-Jun 204.50 324.03 780.83 274.91 128.49 167.71 261.17 221.53 149.29 173.79 2010-11 July-Sep 207.18 325.65 791.67 275.47 128.85 173.18 224.69 262.11 155.78 177.97 Oct-Dec 213.62 325.76 791.67 275.58 129.18 174.81 207.06 267.66 157.41 177.97 Jan-Mar 220.60 327.30 800.00 276.34 130.05 176.36 271.84 229.21 159.03 177.97 Apr-Jun 228.38 299.75 804.17 244.41 130.05 187.21 271.84 229.21 175.26 177.97 2011-12 July-Sep 228.38 299.75 804.17 244.41 130.05 179.07 271.84 224.69 155.78 219.85 Oct-Dec 230.46 359.41 808.33 312.01 130.05 181.24 171.84 224.69 159.03 219.85 Jan-Mar 231.50 369.71 812.50 323.28 130.05 182.42 271.84 224.69 162.27 212.54 Apr-June 237.85 368.65 812.50 322.07 130.05 193.27 271.84 224.69 178.50 212.54

Monthly Statistical Bulletin, Bangladesh, June-2013. . 123
5.35 PRICE INDICES OF THE DOMESTICALLY PRODUCED INDUSTRIAL GOODS BY INDUSTRIAL GROUPS-CONTD. (Base : 1988-89=100) 354 356-Mfg. of Rubber 357 361 362-Glass & 369-Mfg. of other petroleum Products Misc. Mfg. Glass Product Non-metalic products Period & Coal mfg. Plastic of Prod. Pottery 3541 356 3561 3569 3579 3612 362 3621 3622 369 3691 3692 Petro- Total Cycle Rubber PVC Pottery Total Glass Glass Total Bricks cement leum tyre foot pro- china sheet pro- & tube wear ducts wear duct Weight 0.643 0.522 0.002 0.520 0.289 0.538 0.148 0.005 0.143 2.033 0.890 1.143 2009-10
July-Sep 527.15 248.49 210.17 248.64 109.82 172.32 157.80 168.84 157.48 309.24 294.76 302.31
Oct-Dec 550.27 248.51 214.98 248.14 109.82 178.80 152.80 166.84 157.48 139.24 294.76 320.51
Jan-Mar 569.85 255.69 220.66 255.82 109.82 186.67 157.80 166.84 157.48 309.50 295.35 320.51
Apr-Jun 573.19 256.79 220.66 256.93 109.82 186.67 159.70 166.84 159.45 311.24 299.34 220.51
2010-11
July-Sep 587.85 262.33 233.87 262.44 110.70 192.95 161.5 177.27 161.42 316.03 310.27 320.51
Oct-Dec 582.52 298.14 242.09 298.36 110.70 193.27 165.93 182.48 165.35 316.90 312.27 320.51
Jan-Mar 591.26 318.79 245.50 319.07 110.92 197.21 169.91 187.70 169.29 306.73 318.25 333.33
Apr-Jun 620.20 318.74 245.50 319.07 110.92 197.21 169.91 187.70 169.29 329.92 322.24 335.90
2011-12
Jul-Sep. 587.85 321.82 241.31 322.11 110.92 192.96 162.31 187.70 161.42 329.92 322.24 335.90
Oct-Dec 588.39 312.82 246.31 322.11 110.92 192.96 162.31 187.70 161.42 320.57 190.33 344.10
Jan-Mar 588.40 321.52 246.31 322.11 110.92 192.96 162.31 197.70 161.42 321.71 290.39 346.15
Apr-June 655.49 321.82 246.31 322.11 110.92 192.96 162.31 187.70 161.42 334.69 290.33 369.23
5.35 PRICE INDICES OF THE DOMESTICALLY PRODUCED INDUSTRIAL GOODS BY INDUSTRIAL GROUPS-CONTD.
(Base : 1988-89=100)
Period
371-Mfg. Basic Metal Product 381-Mfg. Metal Products
371 Total
3711 Iron & Steel
3713 Re-rolling
Mills
381 Total
3812 Hand &
Edge Tools
3813 Blades
Knives etc.
3814 Metal
Furniture
3817 Heating &
Llighting
3819 Utensils
Weight 2.028 0.162 1.866 0.727 0.006 0.052 0.178 0.046 0.445 2008-09 July-Sep 345.67 151.77 362.50 212.22 296.69 156.99 291.07 230.50 184.81 Oct-Dec 345.67 157.77 362.50 212.76 296.69 150.99 293.01 230.50 184.81 Jan-Mar 345.67 151.77 362.50 214.21 296.69 162.60 293.52 239.36 184.81 Apr-Jun 270.91 151.77 281.25 216.12 296.69 162.60 301.29 239.36 184.81 2009-10 July-Sep 270.91 157.77 281.25 217.57 296.69 174.22 301.24 248.33 184.81 Oct-Dec 270.91 151.77 281.25 218.07 296.69 174.22 301.29 257.09 184.81 Jan-Mar 270.91 156.14 281.25 229.60 296.69 174.22 303.10 265.96 202.00 Apr-Jun 270.91 151.77 281.25 231.91 296.69 185.83 309.14 265.96 202.00 2010-11 July-Sep 280.00 153.99 290.94 275.28 296.69 185.83 312.10 274.82 270.76 Oct-Dec 178.28 156.41 280.18 284.45 307.20 185.83 316.46 283.69 282.94 Jan-Mar 280.03 158.02 290.63 292.88 315.33 185.83 317.88 292.55 292.55 Apr-Jun 285.78 158.02 296.88 231.99 315.33 168.41 317.88 292.55 292.55 2011-12 July-Sep 270.34 153.99 280.44 232.77 315.33 174.22 319.35 292.55 197.69 Oct-Dec 285.46 153.99 296.88 238.03 315.33 174.22 319.35 292.55 206.28 Jan-Mar 322.84 153.99 337.90 238.03 315.33 174.22 319.35 292.55 206.28 Apr-June 334.34 153.99 350.00 238.03 315.33 174.22 319.35 292.55 206.28
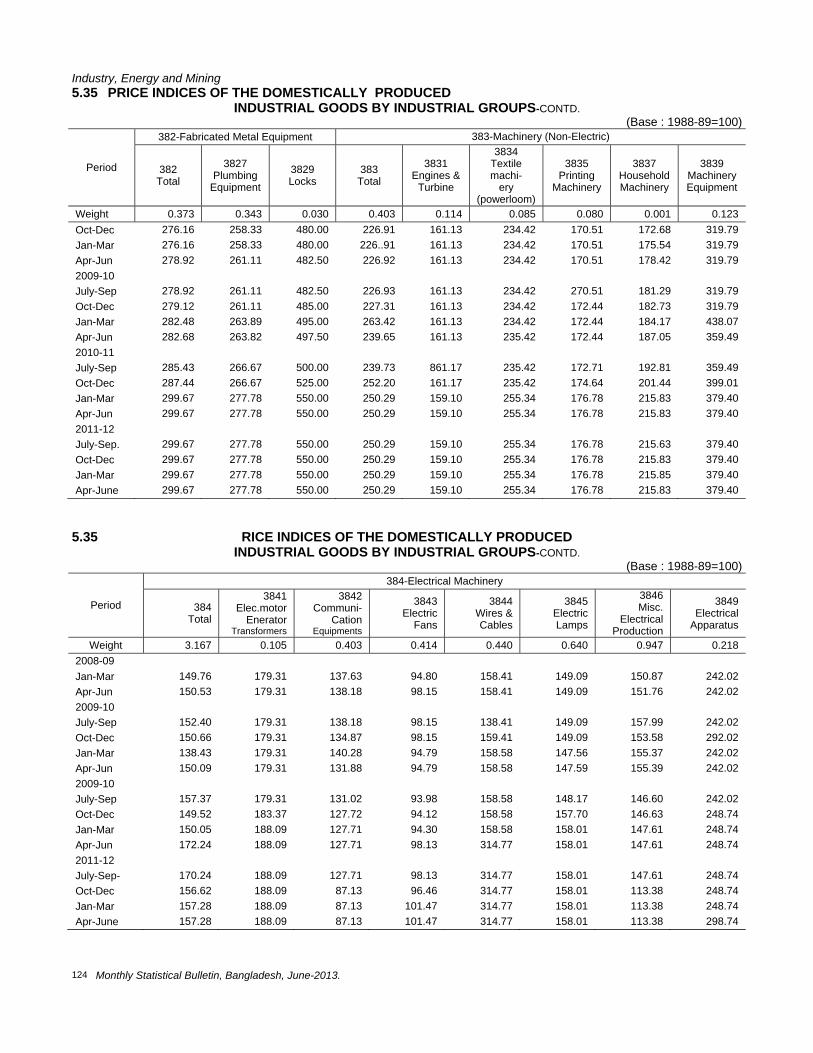
Industry, Energy and Mining
Monthly Statistical Bulletin, Bangladesh, June-2013. 124
5.35 PRICE INDICES OF THE DOMESTICALLY PRODUCED INDUSTRIAL GOODS BY INDUSTRIAL GROUPS-CONTD.
(Base : 1988-89=100)
Period
382-Fabricated Metal Equipment 383-Machinery (Non-Electric)
382 Total
3827 Plumbing
Equipment
3829 Locks
383 Total
3831 Engines &
Turbine
3834 Textile machi-
ery (powerloom)
3835 Printing
Machinery
3837 Household Machinery
3839 Machinery Equipment
Weight 0.373 0.343 0.030 0.403 0.114 0.085 0.080 0.001 0.123 Oct-Dec 276.16 258.33 480.00 226.91 161.13 234.42 170.51 172.68 319.79 Jan-Mar 276.16 258.33 480.00 226..91 161.13 234.42 170.51 175.54 319.79 Apr-Jun 278.92 261.11 482.50 226.92 161.13 234.42 170.51 178.42 319.79 2009-10 July-Sep 278.92 261.11 482.50 226.93 161.13 234.42 270.51 181.29 319.79 Oct-Dec 279.12 261.11 485.00 227.31 161.13 234.42 172.44 182.73 319.79 Jan-Mar 282.48 263.89 495.00 263.42 161.13 234.42 172.44 184.17 438.07 Apr-Jun 282.68 263.82 497.50 239.65 161.13 235.42 172.44 187.05 359.49 2010-11 July-Sep 285.43 266.67 500.00 239.73 861.17 235.42 172.71 192.81 359.49 Oct-Dec 287.44 266.67 525.00 252.20 161.17 235.42 174.64 201.44 399.01 Jan-Mar 299.67 277.78 550.00 250.29 159.10 255.34 176.78 215.83 379.40 Apr-Jun 299.67 277.78 550.00 250.29 159.10 255.34 176.78 215.83 379.40 2011-12 July-Sep. 299.67 277.78 550.00 250.29 159.10 255.34 176.78 215.63 379.40 Oct-Dec 299.67 277.78 550.00 250.29 159.10 255.34 176.78 215.83 379.40 Jan-Mar 299.67 277.78 550.00 250.29 159.10 255.34 176.78 215.85 379.40 Apr-June 299.67 277.78 550.00 250.29 159.10 255.34 176.78 215.83 379.40 5.35 RICE INDICES OF THE DOMESTICALLY PRODUCED INDUSTRIAL GOODS BY INDUSTRIAL GROUPS-CONTD.
(Base : 1988-89=100)
Period
384-Electrical Machinery
384 Total
3841 Elec.motor
Enerator Transformers
3842 Communi-
Cation Equipments
3843 Electric
Fans
3844 Wires & Cables
3845 Electric Lamps
3846 Misc.
Electrical Production
3849 Electrical
Apparatus
Weight 3.167 0.105 0.403 0.414 0.440 0.640 0.947 0.218 2008-09 Jan-Mar 149.76 179.31 137.63 94.80 158.41 149.09 150.87 242.02 Apr-Jun 150.53 179.31 138.18 98.15 158.41 149.09 151.76 242.02 2009-10 July-Sep 152.40 179.31 138.18 98.15 138.41 149.09 157.99 242.02 Oct-Dec 150.66 179.31 134.87 98.15 159.41 149.09 153.58 292.02 Jan-Mar 138.43 179.31 140.28 94.79 158.58 147.56 155.37 242.02 Apr-Jun 150.09 179.31 131.88 94.79 158.58 147.59 155.39 242.02 2009-10 July-Sep 157.37 179.31 131.02 93.98 158.58 148.17 146.60 242.02 Oct-Dec 149.52 183.37 127.72 94.12 158.58 157.70 146.63 248.74 Jan-Mar 150.05 188.09 127.71 94.30 158.58 158.01 147.61 248.74 Apr-Jun 172.24 188.09 127.71 98.13 314.77 158.01 147.61 248.74 2011-12 July-Sep- 170.24 188.09 127.71 98.13 314.77 158.01 147.61 248.74 Oct-Dec 156.62 188.09 87.13 96.46 314.77 158.01 113.38 248.74 Jan-Mar 157.28 188.09 87.13 101.47 314.77 158.01 113.38 248.74 Apr-June 157.28 188.09 87.13 101.47 314.77 158.01 113.38 298.74

Monthly Statistical Bulletin, Bangladesh, June-2013. . 125
5.35 PRICE INDICES OF THE DOMESTICALLY PRODUCED INDUSTRIAL GOODS BY INDUSTRIAL GROUPS-CONCLD.
(Base : 1988-89=100) Period 385-Transport Equipment
385 Total
3851 Ship Building
3854 Motor Vehicle
3855 Motor Cycle
Weight 1.519 0.612 0.747 0.160 2008-09 July-Sep 292.53 178.54 399.64 288.44 Oct-Dec 332.41 178.54 480.45 229.87 Jan-Mar 332.55 178.54 480.45 231.12 Apr-Jun 332.69 178.54 480.45 232.45 2009-10 July-Sep 332.97 178.54 480.45 235.12 Oct-Dec 332.97 178.54 480.45 235.12 Jan-Mar 343.94 178.54 501.61 240.47 Apr-Jun 343.94 178.54 501.61 240.47 2010-11 July-Sep 321.29 178.54 501.68 243.14 Oct-Dec 344.22 178.54 501.65 243.14 Jan-Mar 350.08 180.74 511.73 243.14 Apr-Jun 354.87 180.74 511.73 288.56 July-Sep 354.87 180.74 511.73 288.56 Apr-June 354.87 180.74 511.73 288.56 Source: National Accounting Wing, BBS.

Transport, Communication and Tourism
126 Monthly Statistical Bulletin, Bangladesh, June-2013.
CHAPTER 6 : TRANSPORT, COMMUNICATION AND TOURISM
6.1 MOVEMENT OF PASSENGERS AND FREIGHT AND EARNINGS OF BANGLADESH RAILWAY
Period No. of
Passengers (million)
Passenger Kilo metres
(million)
Freight Carried (million tonne)
Freight Tonne kilo
Metres (million)
Number of Wagons Loaded Earnings (Million Taka)
Broad gauge('000')
Metre gauge('000')
Total ('000') passengers Other coa
ching Goods Misc Total
2009-10 64 6616 269 781 52 131 183 2955 105 1430 877 5374 2010-11 65 7312 2.61 705 66 112 178 2889 103 1101 983 5104 2011-12 66 8780 3.25 700 81 80 161 3498 332 1158 444 5426 2012-13 68 6356 2.31 1032 48 90 138 4585 163 1261 3908 9914
June 6 563 022 658 4 9 13 252 9 113 33 407 2010-11
July 6 688 0.26 65 5 11 16 242 8 106 25 381 Aug 5 586 0.25 63 6 9 15 234 11 103 15 363 Sep 6 670 0.20 60 4 10 14 268 10 99 71 448 Oct 5 567 0.20 61 5 8 13 226 10 99 81 417 Nov 6 605 0.24 62 5 9 14 242 9 102 33 385 Dec 5 770 0.21 53 7 10 17 308 10 86 42 445 Jan 6 607 0.21 52 6 10 16 242 11 86 64 356 Feb 5 575 0.19 51 5 8 13 230 11 64 31 403 Mar 6 682 0.21 54 4 9 13 272 11 88 47 418 Apr 5 504 0.22 54 6 7 13 202 07 89 191 489
May 5 507 0.18 68 7 10 17 203 08 78 156 444 Jun 5 551 0.24 62 6 11 17 220 08 101 226 555
2011-12 July 6 720 0.17 40 8 5 13 253 09 67 09 338 Aug 5 628 0.14 47 5 7 12 219 09 78 20 326 Sep 6 619 0.21 68 6 5 11 275 9 111 20 415 Oct 5 610 0.28 57 5 7 12 266 11 94 13 383 Nov 5 567 0.36 51 7 6 13 272 8 84 11 374 Dec 6 728 0.45 57 6 7 13 254 9 94 11 368 Jan 5 650 0.27 90 7 6 13 259 84 149 106 598 Feb 5 624 0.26 53 5 7 12 249 81 88 10 428 Mar 6 695 0.29 74 6 6 12 278 85 122 108 592 Apr 5 1039 0.27 54 9 8 17 415 09 89 18 530
May 6 960 0.26 53 8 7 15 384 09 88 56 537 June 6 940 0.29 56 9 9 18 374 09 94 62 539
2012-13 July 6 784 0.18 72 4 7 11 296 10 49 420 775 Aug 6 819 0.18 63 4 7 11 327 9 38 471 846 Sep 5 806 0.18 69 4 9 13 322 11 66 433 831 Oct 6 1104 0.19 97 4 9 13 441 9 86 945 1481 Nov 6 1122 0.20 106 4 9 13 448 11 75 486 1020 Dec 6 1146 0.22 104 4 9 13 458 10 95 716 1279- Jan 5 104 0.16 73 4 8 12 415 17 121 20 572 Feb 5 108 0.17 63 4 7 11 430 16 104 253 803 Mar 5 85 0.18 72 4 7 11 338 17 109 21 484 Apr 6 85 0.22 92 4 6 10 338 17 153 45 553
May 6 82 0.21 107 4 6 10 329 18 176 48 571 June 6 111 0.22 114 4 6 10 443 18 189 50 699
Source : Bangladesh Railway

Transport, Communication and Tourism
Monthly Statistical Bulletin, Bangladesh, June-2013. 127
6.2 NUMBER AND TONNAGE OF WAGONS LOADED WITH SELECTED COMMODITIES BY BANGLADESH RAILWAY AT CHITTAGONG PORT
Period Foodgrains Petrol & Kerosene Others Container Total
Number Tonnage Number Tonnage Number Tonnage Number Tonnage Number Tonnage 2009-10 6561 102250 19148 263040 206 3013 65506 547384 91622 905887 2010-11 5556 79096 18620 244403 212 3174 71824 666733 97192 1014556 2011-12 1568 25862 19691 257376 5463 49736 6833 597086 95405 930060 2012-13 2092 34538 22001 300073 5029 54830 60510 546377 89632 935819
Sep’09 713 10617 1739 26294 12 181 5324 47377 7988 84469 Oct’09 240 3682 1366 20381 23 336 4761 42862 6390 67261
Nov 465 6767 1598 24050 31 443 4866 40192 6960 71452 Dec 545 8344 1466 22005 17 241 5410 43248 7438 73838 Jan 572 8563 1585 23506 18 272 5879 47912 8054 80253 Feb 456 7330 1822 21708 16 239 6843 50882 9137 80359 Mar 577 10235 1968 24833 17 243 3986 35150 6548 70461 Apr 666 11081 1774 21842 18 275 5592 43691 8050 76889
May 403 6145 1360 16520 13 183 5585 50400 7361 73248 June 518 8218 1491 17791 14 198 5764 51876 7787 78083
2010-11 July 700 10515 1308 19514 13 205 5675 48841 7676 79074
Aug 612 9144 1470 21590 12 197 5672 46601 7766 77532 Sep 713 10423 1639 2339 12 180 5248 48049 7612 82042 Oct 240 1299 1360 19381 22 335 5292 47522 6914 68537 Nov 465 5821 1498 23050 30 440 4300 43259 6293 72570 Dec 470 5848 1399 23224 28 340 4737 44559 6634 73971 Jan 510 7660 1500 22265 16 246 5758 48388 7784 78659 Feb 450 6723 1620 23911 15 234 5688 50906 7773 81774 Mar 570 8334 1868 26469 16 245 6984 54608 9438 89656 Apr 326 5308 1830 23365 15 245 7669 76000 9840 104918
May 200 3281 1760 21945 17 260 8162 83000 10139 108486 June 300 4740 1368 17350 16 247 7639 75000 9323 97337
2011-12 July 102 1374 1474 18526 294 4922 5517 47178 7.387 72000 Aug 156 2605 1468 18112 293 3270 5466 47013 7383 71000 Sep 102 1827 984 12578 363 3807 5414 50788 6863 69000 Oct 102 1555 1356 17481 407 3073 5597 49891 7412 72000 Nov 156 2559 1626 20805 613 5836 6473 53800 8868 83000 Dec - - 1926 25596 1106 7288 6161 51116 9193 84000 Jan 110 1797 1994 25501 479 5011 4674 43542 7257 75851 Feb 238 3973 1352 17054 351 3695 5688 50906 7629 75628 Mar 249 4085 1894 24224 469 4980 5775 49087 8387 82376 Apr 178 2992 1888 25836 307 3001 6257 51171 8630 83000
May - - 1834 25593 386 1718 5356 50709 7576 78020 June 175 3095 1895 26070 395 3135 6355 51885 8820 84185
2012-13 July 180 3025 1664 21467 522 3895 4947 45613 7313 74000 Aug 162 2557 1558 20730 338 4244 4990 46469 7048 74000 Sep 102 1649 1682 21878 420 5456 6815 56016 9019 85000 Oct 206 3409 1796 24377 345 4412 6292 50802 8639 83000 Nov 210 3475 1799 29809 350 4476 6343 50934 8702 88694 Dec 215 3569 1820 30157 355 4544 6395 52566 8785 90836 Jan 65 1062 1933 25292 329 3630 5472 52016 7799 82000 Feb 218 3518 1723 22802 440 4189 4407 39491 6788 70000 Mar 256 4278 1796 26759 505 4461 4421 44502 6978 80000 Apr - - 2018 24846 467 5116 3432 36038 5917 66000
May 238 3976 2020 24885 475 5104 3442 36035 6175 70000 June 240 4020 2192 27071 483 5303 3554 35895 6469 72289
Source : Bangladesh Railway Note : (-) Indicates data not available
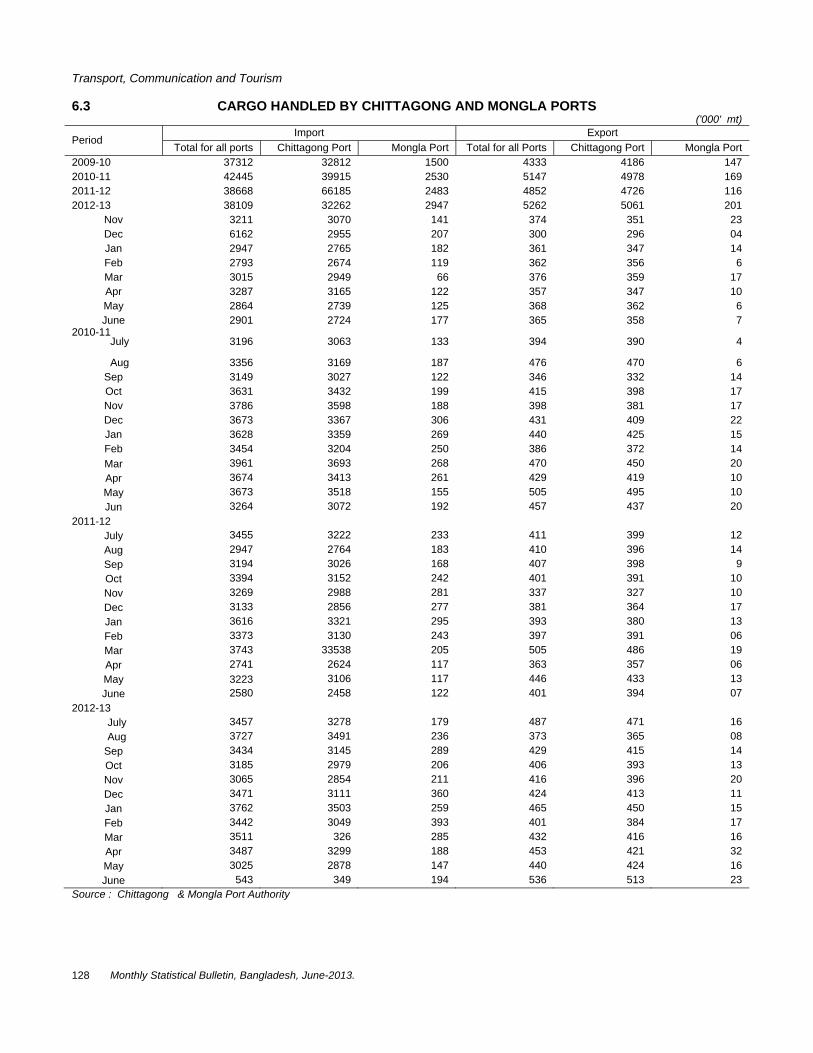
Transport, Communication and Tourism
128 Monthly Statistical Bulletin, Bangladesh, June-2013.
6.3 CARGO HANDLED BY CHITTAGONG AND MONGLA PORTS ('000' mt)
Period Import Export
Total for all ports Chittagong Port Mongla Port Total for all Ports Chittagong Port Mongla Port 2009-10 37312 32812 1500 4333 4186 147 2010-11 42445 39915 2530 5147 4978 169 2011-12 38668 66185 2483 4852 4726 116 2012-13 38109 32262 2947 5262 5061 201
Nov 3211 3070 141 374 351 23 Dec 6162 2955 207 300 296 04 Jan 2947 2765 182 361 347 14 Feb 2793 2674 119 362 356 6 Mar 3015 2949 66 376 359 17 Apr 3287 3165 122 357 347 10 May 2864 2739 125 368 362 6 June 2901 2724 177 365 358 7
2010-11 July
3196
3063 133 394 390 4
Aug 3356 3169 187 476 470 6 Sep 3149 3027 122 346 332 14 Oct 3631 3432 199 415 398 17 Nov 3786 3598 188 398 381 17 Dec 3673 3367 306 431 409 22 Jan 3628 3359 269 440 425 15 Feb 3454 3204 250 386 372 14 Mar 3961 3693 268 470 450 20 Apr 3674 3413 261 429 419 10 May 3673 3518 155 505 495 10 Jun 3264 3072 192 457 437 20
2011-12 July 3455 3222 233 411 399 12 Aug 2947 2764 183 410 396 14 Sep 3194 3026 168 407 398 9 Oct 3394 3152 242 401 391 10 Nov 3269 2988 281 337 327 10 Dec 3133 2856 277 381 364 17 Jan 3616 3321 295 393 380 13 Feb 3373 3130 243 397 391 06 Mar 3743 33538 205 505 486 19 Apr 2741 2624 117 363 357 06 May 3223 3106 117 446 433 13 June 2580 2458 122 401 394 07
2012-13 July 3457 3278 179 487 471 16 Aug 3727 3491 236 373 365 08
Sep 3434 3145 289 429 415 14 Oct 3185 2979 206 406 393 13 Nov 3065 2854 211 416 396 20 Dec 3471 3111 360 424 413 11 Jan 3762 3503 259 465 450 15 Feb 3442 3049 393 401 384 17 Mar 3511 326 285 432 416 16 Apr 3487 3299 188 453 421 32 May 3025 2878 147 440 424 16 June 543 349 194 536 513 23
Source : Chittagong & Mongla Port Authority

Transport, Communication and Tourism
Monthly Statistical Bulletin, Bangladesh, June-2013. 129
6.4 INTERNATIONAL SHIPPING VESSELS ENTERED INTO AND CLEARED FROM CHITTAGONG AND MONGLA PORTS
Period
Vessels entered Vessels Cleared
Number Net Registered Tonnage
Number Net Registered Tonnage
In Ballast ('000' mt)
With Cargo ('000' mt)
In Ballast ('000' mt)
With Cargo ('000' mt)
All Ports 2010-11 2431 2067 13123 2396 12941 2237 2011-12 2162 2252 12988 2137 11964 3294 2012-13 2166 1929 13782 2156 11859 3583 Chiittagogn Port 2010-11 2159 1985 11349 2128 11375 1971 2011-12 1928 2231 11361 1898 10460 3093 2012-13 1884 1897 11752 1881 10146 3300 Mongla Port 2010-11 272 82 1774 268 1566 266 2011-12 234 21 1627 239 1504 201 2012-13 282 32 2030 275 1713 283 Chiittagogn Port 2011-12
Oct-12 148 169 889 159 894 240 Nov-12 150 133 892 146 251 852 Dec-12 152 162 878 152 789 230
2012-13 Jan-13 168 131 1117 168 886 223 Feb-13 138 154 855 135 753 212 Mar-13 150 145 932 155 823 303 Apr-13 169 156 1051 163 1021 149
May-13 174 132 1110 166 1042 152 June’13 162 148 1024 167 979 171
Mongla Port 2011-12
Jul 24 - 168 20 109 14 Aug 19 - 105 22 127 23 Sep 14 - 97 19 116 16 Oct 27 05 184 22 132 14 Nov 26 - 178 24 158 12 Dec 20 16 150 27 187 25 Jan 30 - 240 23 165 20 Feb 15 - 108 25 179 16 Mar 19 - 134 20 115 25 Apr 14 - 90 12 63 08
May 12 - 77 14 81 15 June 14 - 96 11 72 12
2012-13 July 19 - 140 18 91 24
Augu 21 - 160 20 118 19 Sep 23 - 203 21 153 19 Oct 21 04 142 24 179 14 Nov 21 05 157 21 139 22 Dec 29 - 252 26 210 15 Jan 21 06 138 25 167 23 Feb 31 - 250 27 166 32 Mar 22 - 150 24 176 24 Apr 24 06 139 22 89 29
May 21 - 138 24 123 36 June 29 11 161 23 102 26
Source : Chittagong and Mongla Port Authority Notoe: (-) Indicuters Data not Available.

Transport, Communication and Tourism
130 Monthly Statistical Bulletin, Bangladesh, June-2013.
6.5 Passengers And vehicles Carried By BIWTC Ferries and revenue earrings There from
Cont Period No. of
ferries in traffic
Aricha Sector Chandpur Sector Mawa Sector No. of
Passengers Carried (`000}
No. of Vehicles Transported
(`000}
Revenue Earned (`000)
Taka
No. of Passengers
Carried (`000}
No. of Vehicles Transported
(`000}
Revenue Earned (`000)
Taka
No. of Passengers
Carried (`000}
No. of Vehicles Transported
(`000} 1 2 3 4 5 6 7 8 9 10
2010-11 342 13433 1247 1164684 145 43 49092 4327 4742011-12 388 12726 1245 1229638 209 49 61638 5351 5772012-13 398 12668 1264 1278757 276 53 71937 3798 6112010-11 Sept’10 28 1214 98 89698 12 03 3914 367 37Oct.-10 26 1066 104 96758 07 03 3341 315 32Nov.-10 31 1195 110 98645 10 03 3380 335 40Dec.-10 22 1204 114 106709 06 03 3118 368 41Jan.-11 29 1126 103 96360 11 03. 4144 351 40Feb.11 33 1078 99 92634 16 04 4256 356 40Mar.-11 33 1164 112 104441 17 04 4522 282 44Apr.-11 31 1096 106 99951 17 04 4948 398 41May-11 30 1187 114 106749 17 04 4901 378 43June-11 28 1025 97 90288 15 03 3805 326 362011-12 July’11 32 1009 101 94967 12 03 2986 339 41Aug’11 35 1095 101 96691 12 03 3651 1511 43Sept’11 33 1133 95 98636 17 04 4838 377 44Oct.-11 30 1046 104 101645 15 05 5479 355 48Nov-11 30 1142 114 104801 15 04 4317 353 57Dec-11 32 954 101 95964 17 03 4648 316 47
Jan-12 31 1061 107 105225 15 04 4636 328 49
Feb-12 32 1063 105 102052 22 04 5061 336 48
MAR-12 33 1034 103 100427 19 05 6382 350 52
Apr-12 34 930 96 95859 17 04 5846 325 46
May-12 33 1101 111 114032 18 05 6720 381 52
June-12 32 1158 107 119339 18 05 7074 380 50
2012-13 July 33 1013 104 113429 17 05 7231 340 49Aug 35 1235 113 120698 23 05 6013 363 59
Sep 34 1026 95 102517 25 05 6837 273 46
Oct 35 1159 122 124183 30 05 6161 305 53Nov 35 1246 108 117523 28 05 5840 356 55Dec 33 964 96 104269 19 04 5586 295 50
Jan 32 1141 110 12226 29 05 6712 323 53
Feb 32 987 100 109256 31 04 5883 312 50
MAR 32 824 97 109690 19 04 5521 300 51
Apr 32 911 100 115359 17 04 5927 285 48
May-13 33 1012 108 122031 21 04 5313 297 47
June-13 32 1150 110 127573 17 03 4913 349 50

Transport, Communication and Tourism
Monthly Statistical Bulletin, Bangladesh, June-2013. 131
6.5 Passengers And vehicles Carried By BIWTC Ferries and revenue earrings There from
Period Vola Sector Vadoria Sector Total
Revenue Earned (`000) Taka
No. of Passengers
Carried (`000}
No. of Vehicles
Transported (`000}
Revenue Earned (`000) Taka
No. of Passengers
Carried (`000}
No. of Vehicles
Transported (`000}
Revenue Earned (`000) Taka
No. of Passengers
Carried (`000}
No. of Vehicles
Transported (`000}
Revenue Earned (`000) Taka
11 12 13 14 15 16 17 18 19 20
2010-11 420255 - 34 43380 - 40 25662 17902 1831 17050842011-12 513153 - 40 59993 01 45 27141 18275 1952 18825672012-13 644238 - 37 68562 05 46 33762 16749 2010 20972522010-11
Sept 30372 - 03 3368 - 03 2000 1594 144 129352Oct. 31659 - 02 2342 - 04 2466 1387 144 136566Nov 30909 - 03 3980 3 03 2237 1540 158 139152Dec 37127 - 03 4059 - 03 2191 1579 164 153234Jan 35764 - 03 3859 - 03 1942 1487 151 142068Feb 34853 - 02 3428 - 02 1666 1449 148 136836Mar 38543 - 03 3931 - 03 1766 1564 165 153202Apr 37866 - 03 4699 - 03 1802 1512 158 149267
May 37723 - 03 4405 - 04 2434 1581 168 156212June 30989 - 03 3461 - 04 2325 1366 143 130868
2011-12 July 34932 - 03 4016 - 04 2327 1360 151 139228Aug 36799 - 02 3216 - 03 1540 2618 151 141898
Sept 37830 - 02 3414 - 03 1757 1527 148 137474Oct. 42185 - 03 3724 - 03 1882 1416 162 154916Nov 42418 - 04 5142 - 03 1894 1510 181 158572Dec 41613 - 05 5631 - 05 2872 1287 159 150729Jan 44365 - 03 5265 - 04 2556 1403 168 162047Feb 43402 - 03 4751 - 04 2369 1421 164 157635Mar 46027 - 04 5869 - 04 2325 1403 167 161030Apr 44556 - 04 6651 - 04 2277 1272 155 155189
May 48696 - 04 6303 - 04 2532 1500 176 178283June 50330 - 03 6013 01 04 2810 1558 170 185566
2012-13
July 51117 - 03 5581 02 04 2848 1372 166 180206Aug 51634 - 04 6119 01 04 2765 1622 184 187229
Sep 47292 - 03 6046 01 04 2835 1326 153 165528
Oct 48674 - 04 6651 01 04 2936 1496 188 188604Nov 56441 - 04 6722 - 04 2687 1630 175 189212Dec 48932 - 03 5798 - 03 2621 1278 156 167207Jan 51478 - 03 6255 - 04 2826 1494 175 79497Feb 52383 - 02 4147 - 03 2409 1330 159 174078Mar 58307 - 03 5165 - 04 2791 1144 158 181475Apr 59390 - 03 6235 - 04 2923 1213 160 189833
May 57221 - 02 4169 - 04 2749 1329 164 191483June 61369 - 03 5674 - 04 3372 1515 172 202900
Source: Banglades Inland Water Transport Corporation (B.I.W.TC) Note: (-) Indicated Data Not Avaliable.

Transport, Communication and Tourism
132 Monthly Statistical Bulletin, Bangladesh, June-2013.
6.6 NUMBER OF LETTERS, PARCELS AND MONEY ORDERS BOOKED THROUGH DIFFERENT POST OFFICES Period
No. of Regd. Letters Booked No. of Parcels Booked Money Orders
Insured Ordinary('000') V. P. ('000') Insured Ordinary('000') V. P. ('000') In '000' No. Value in Lakh Taka
2010-11 730 7695 154 326 712 113 3018 86061 2011-12 1235 8449 151 422 827 73 2218 62592 2012-13 12278 8460 160 411 825 86 1528 43597 2009-10
Nov 151 700 8 20 64 8 408 10857 Dec 155 621 8 15 65 6 252 5289 Jan 98 626 7 9 61 7 337 7845 Feb 177 605 6 25 79 7 325 7851 Mar 166 685 13 35 71 6 369 8713 Apr’ 260 608 12 45 72 6 328 7644 May 40 789 11 38 80 6 321 7440
June’ 142 732 11 24 87 7 312 7571 2010-11
July 29 681 11 22 70 9 269 7075 Aug 114 582 9 24 71 9 363 9601 Sep 81 595 11 16 50 07 242 8161 Oct 32 657 12 19 49 05 275 6915 Nov 153 616 08 35 51 08 250 8628 Dec 35 630 10 17 53 10 240 6565 Jan 27 593 13 15 51 10 245 6650 Feb 35 614 16 37 48 10 224 6411 Mar 57 723 20 36 53 11 257 7243 Apr 31 657 19 45 60 12 232 6387
May 02 697 12 41 44 13 242 7027 Jun 134 650 13 30 112 09 179 5398
2011-12 July 113 812 13 24 199 08 168 5190 Aug 60 635 07 17 55 05 229 7858 Sep 60 733 12 23 43 5 180 4418 Oct 80 654 15 30 57 6 203 7137 Nov 34 650 11 35 51 06 149 4464 Dec 32 653 13 31 53 05 147 4308 Jan 49 685 14 26 61 06 177 4773 Feb 532 667 13 93 62 06 259 6407 Mar 104 689 14 39 55 05 214 4899 Apr 33 775 15 40 59 06 155 4361
May 107 759 10 38 63 05 164 4756 June 31 737 14 26 69 10 142 4021
2012-13 July 8081 693 17 16 102 08 228 5240 Aug 25 588 07 24 77 06 148 5023 Sep 926 745 15 23 56 07 123 2631 Oct 700 669 12 23 48 06 164 6250 Nov 563 741 12 40 118 06 111 4034 Dec 290 787 12 31 55 09 112 3053 Jan 130 702 13 34 58 10 118 3007 Feb 80 649 13 51 55 07 117 2761 Mar 147 658 16 42 61 05 101 2872 Apr 102 649 17 53 93 07 104 2929
May 532 669 09 41 49 06 95 2866 June 702 910 17 33 51 09 107 2931
Source : Bangladesh Post Office

Transport, Communication and Tourism
Monthly Statistical Bulletin, Bangladesh, June-2013. 133
6.7 ARRIVAL OF TOURISTS BY MONTH AND FOREIGN EXCHANGE EARNINGS FROM TOURISM
(Earning in lakh Taka)
Month 2008 2009 2010 2011 2012 2013
No. of Tourists
Earn Ings
No. of Tourists
Earn Ings
No. of Tourists
Earn Ings
No. of Tourists
Earn Ings
No. of Tourists
Earn Ings
No. of Tourists
No of Earn ings
Jan 39345 7492 28638 6492 30728 4959 14256 7133 10210 1006 - 10064 Feb 30788 5850 26286 5796 24657 4969 13231 6333 9506 1092 - 10915 Mar 30079 5277 25114 5189 29723 5659 10730 6243 10416 7000 - 7307 Apr 25128 4593 24786 4738 23439 4273 9297 3734 10002 6929 - 6130 May 36929 4230 23704 5382 24208 3421 10771 3824 10901 6163 - 5613 Jun 39158 5095 22244 4177 20867 4730 9945 4803 10411 4839 - 6465 Jul 42457 4619 21780 4599 22620 3209 8317 4823 10703 -6323 - - Aug 36017 4173 18239 4109 20622 4313 9714 4123 9961 5605 - - Sep 26723 4644 14749 3496 18934 3680 10947 3902 10111 6834 - - Oct 43213 4156 19963 3612 31611 5252 18228 4742 10162 6321 - - Nov 39996 5133 19336 4613 25137 4771 19193 5757 10210 5503 - - Dec 77499 5896 22274 5177 30840 6385 19988 7199 12350 7866 - - Total 467332 61218 267107 57380 303386 55624 154617 62394 124943 73474 - - Source : Bangladesh Parjatan Corporation- Not: (-) Indicates data not available. 6.8 ARRIVAL OF TOURISTS IN BANGLADESH BY NATIONALITY
(Number)
Country 2003 2004 2005 2006 2007 2008 2009 2010 2011 2012 Australia 3787 6815 3686 4878 6092 1609 1507 1306 1381 1395Canada 5847 8964 4519 5085 8701 2265 1289 1278 1410 1203
France 2924 3157 2736 2674 2785 892 846 965 986 911 German F.R. 4184 4812 3128 3190 4372 1014 1131 1038 1227 1158 Greece 147 211 164 180 97 59 101 51 60 54 Italy 2420 2629 1800 1667 2029 864 838 930 958 921 Japan 6523 8757 6269 4370 5020 3975 3731 5011 5675 5773 Netherlands 2735 2939 2431 1416 2116 703 772 684 791 752 New Zealand 1094 1604 1480 1084 1127 283 260 190 187 - Norway 1002 1282 1025 725 861 344 336 259 262 227 Sweden 2062 2360 2364 1869 124 763 704 567 693 686 Switzerland 873 957 1264 978 808 321 336 348 322 344 Singapore 2786 3073 1562 2321 3309 - - - - 811 Thailand 4188 3376 2955 3469 3166 570 610 571 853 644 U. K. 42138 52410 24955 37136 42692 19436 25901 35378 4171 3232 U.S.A. 24458 27895 13422 19604 28414 7721 5833 6103 5750 - Russia 59 118 263 1122 1043 208 151 145 149 195 Yugoslavia 01 12 4 3 14 10 01 - - - Others 52577 60328 47403 48024 67368 21713 20618 21915 24220 28518 India 84704 80469 86239 60516 69506 122974 100250 96444 105522 78119
Total 244509 271270 207662 200311 249644 185724 165215 173183 154617 124943 Source : Bangladesh Parjatan Corporation Note: (-) Data not available.

Transport, Communication and Tourism
134 Monthly Statistical Bulletin, Bangladesh, June-2013.
6.09 PASSENGER MOVEMENT BY AIRPORTS/AERODROMES (Number)
Period Shahzalal
International Airport
Chittagong Airport
Osmani Airport
Jessore Airport
Rajshahi Aerodrome
Saidpur Aerodrome
Cox’s Bazar
Aerodrome Barisal
Aerodrome Total
2011-12 5047009 950720 214048 87142 2189 4329 60194 - 6366032 2012-13 5840890 880249 193868 86206 2847 7205 62874 798 7074937
2011-12 197361 4880 9441 2693 - 03 2211 - 208089 Oct 399439 82940 14992 7492 285 83 3435 - 509066 Nov 482621 78424 13969 8148 - - 4325 - 587487 Dec 433688 86829 19799 7989 - 538 7100 - 555943 Jan 434745 84533 20679 8506 264 643 7294 - 556664 Feb 411830 79916 20513 8323 241 699 8187 - 529709 Mar 417562 90053 24303 7914 309 576 6033 - 546750 Apr 420789 71944 19308 6106 188 530 4592 - 523457
May 422765 75262 17702 6041 230 498 4239 - 526737 June 428902 82045 18651 6092 223 529 4437 - 540879
2012-13 Sep 519817 74164 16159 6473 289 588 4413 - 621903 Oct 518706 73900 10626 6959 290 795 5602 - 616878 Nov 521665 71580 10863 6879 265 710 7496 - 619458 Dec 510359 72420 11490 7300 310 800 6608 - 609287 Jan 468223 73843 16202 7276 274 643 6459 - 572920 Feb 459055 75624 17165 8323 186 404 6407 - 567164 Mar 462128 75946 18720 7507 281 - 5559 - 570141 Apr 471836 69708 18485 6309 124 - 4068 64 570594
May 467943 72892 17040 8070 - 1081 4035 334 571395 June 474875 73781 17682 9336 391 1065 5622 400 583152
Source : Civil Aviation Authority of Bangladesh Note : (-)data not available
6.10 FREIGHT/MAILS LOADED AND UNLOADED BY AIRPORTS/AERODROMES (mt)
May
Period Shahzalal
International Airport
Chittagong Airport
Osmani Airport
Jessore Airport
Rajshahi Aerodrome
Saidpur Aerodrome
Cox’s Bazar
Aerodrome Barisal
Aerodrome Total
2010-11 148818 3188 1264 2932 4455 - 160722
2011-12 197361 4880 941 2693 - 03 2211 - 208089 2012-13 228400 3314 1186 2690 - - 1949 94 238170 2011-12
Dec 17864 297 78 68 - - - - 18307 Jan 15641 1776 90 106 - - 23 - 17636 Feb 15297 191 82 191 - - 134 - 15895 Mar 15968 233 106 181 - - 159 - 16647 Apr 16038 221 77 246 - - 237 - 16819
May 16472 250 92 382 - - 381 - 17577 June 16816 292 80 370 - - 384 - 17942
2012-13 Jul 19126 324 101 79 - - 22 - 19652
Aug 18368 199 65 113 - - 47 - 18792 Sep 19431 348 72 212 - - 60 - 20123 Oct 20126 230 27 117 - - 60 - 20560 Nov 21454 219 33 76 - - 10 - 21792 Dec 19139 242 27 84 - - 60 - 19552 Jan 17697 209 137 94 - - 44 - 18181 Feb 17368 430 140 373 - - 317 - 18628 Mar 18447 271 146 469 - - 429 - 19762 Apr 18447 271 146 469 - - 429 01 20381
May 18732 230 142 347 - - 288 03 19742 June 20065 341 150 257 - - 183 91 21005
Source : Civil Aviation Authority of Bangladesh Note : (-) Indicates data not available

Transport, Communication and Tourism
Monthly Statistical Bulletin, Bangladesh, June-2013. 135
6.11 AIR TRAFFIC MOVEMENTS BY AIRPORTS/AERODROMES
(Number)
Period Shahzalal
International Airport
Chittagong Airport
Osmani Airport
Jessore Airport
Rajshahi Aerodrome
Saidpur Aerodrome
Cox's Bazar Aerodrome
Barisal Aerodrome Total
2010-11 62044 21268 2959 23800 208 58 3349 0 113683 2011-12 56896 24126 3389 26434 3567 995 2827 64 118298 2012-13 61109 23772 2630 24693 8426 407 2881 68 120151 2009-10
Mar 4721 1436 266 2490 - 2 140 18 9073 Apr 5685 1446 270 7376 - 2 238 - 15017 May 6227 1358 238 1778 - 6 374 4 9985 Jun 4137 1258 170 1520 - 4 282 - 7371
2010-11 July 4387 1337 218 1520 2 0 317 0 7781 Aug 4379 1168 220 2944 0 0 164 0 8875 Sep 4034 1052 310 1600 15 10 240 0 7261 Oct 4365 1196 262 2182 165 16 140 0 8326 Nov 5885 1478 212 1849 10 2 146 0 9582 Dec 5208 1587 240 729 16 30 200 0 8010 Jan 4888 1625 245 1296 - - 233 0 8287 Feb 4841 3131 254 2140 - - 376 0 10742 Mar 5292 2100 289 3507 - - 380 - 11568 Apr 5244 2075 326 2145 - - 383 - 10173 May 4825 2371 199 2728 - - 381 - 10504 Jun 8696 2148 184 1157 - - 389 - 12574
2011-12 July 4415 2037 192 1058 - - 242 - 7944 Aug 4104 2105 186 3232 48 14 240 - 9929 Sep 4618 1720 270 4124 290 - 98 - 11120 Oct 4955 2130 233 3240 605 72 202 - 11437 Nov 4852 1939 258 1338 327 - 193 12 8919 Dec 4490 1828 271 669 22 6 188 12 7486 Jan 4541 2048 310 870 490 28 198 8 8493 Feb 4800 2195 406 1983 446 730 332 16 10908 Mar 5390 2199 250 2674 796 30 284 8 19401 Apr 4980 1762 393 3087 187 30 232 8 10679 May 4729 2024 302 2086 174 25 310 - 9650 June 5022 2139 318 2080 182 32 308 - 10081
2012-13 Jul 4633 1872 300 708 250 30 104 8 7905
Augu 4720 1722 102 873 172 30 124 2 7844 Sep 4895 1952 230 2396 635 30 228 8 10374 Oct 5673 2245 158 2724 652 36 210 - 11698 Nov 6620 1955 157 1359 273 05 252 4 10625 Dec 6946 1950 228 1780 180 10 130 - 11224 Jan 4429 1774 213 1083 4371 36 250 02 8224 Feb 4130 1703 208 3313 711 92 323 02 10482 Mar 4667 2165 276 4058 306 42 370 02 11886 Apr 4666 2265 246 3353 200 30 350 12 11122 May 4639 1978 212 1887 209 28 286 08 9247 June 5091 2191 300 1159 467 38 254 20 9520
Source : Civil Aviation Authority of Bangladesh Note: (-) Indicated Data Not Avilavle.

Foreign Trade
136 Monthly Statistical Bulletin, Bangladesh, June-2013.
CHAPTER 7: FOREIGN TRADE 7.1 Monthly merchandise exports (2 digit HS code) ( Million Taka)
HS
Chapter
Commodities
Monthly
Dec’12 Jan’13 Feb’13 Mar’13 Apr’13 May’13 Jun’13
1 Live animals - - - - .01 - .14
2 Meat and edible meat offal 42.61 49.63 21.95 36.77 62.62 36.91 57.08
3 Fishes, crustacean and other aquatic 4157.87 3326.60 2837.21 2127.37 2899.13 4351.53 4198.50
4 Dairy produces edible product of animal
origin.
5.46 9.41 .45 .18 3.18 6.26 3.15
5 Products of animal origin 52.05 84.83 41.71 66.62 48.60 119.14 67.01
6 Live tree and other plants etc. 168.86 170.55 110.05 173.23 242.15 325.69 258.63
7 Edible vegetables, roots as tubers 529.85 595.44 615.10 764.19 786.67 1001.55 1090.20
8 Edible fruits and nuts citus fruits 777.80 939.23 604.11 497.64 569.89 580.77 133.21
9 Coffee, tea, mate and spices 302.56 163.15 109.98 70.26 125.23 120.14 202.34
10 Cereals 17.23 - 9 9.64 21.41 56.15 62.44
11 Product of milling industry : malt etc. 1.48 .73 1.57 - 8.44 10.21 1.36
12 Oil seeds and oleaginous fruits 130.14 81.57 90.78 62.66 39.42 31.04 96.51
13. Lae, gum, resign veg sopicytraet .22 .20 .20 1.19 .91 1.76 .37
14 Vegetable plaiting materials .44 - .24 .01 2.16 1.37 -
15 Animal or vegetable fats and oils 60.27 30.38 82.83 106.11 84.26 42.35 135.84
16 Prepared of meat or fish etc. 25.51 9.75 55.78 58.48 81.14 45.50 46.53
17 Sugar and sugar confectionery 1197.97 1914 11.68 438.97 1391.68 294.11 63.78
18 Cocoa and cocoa prcparation .44 .30 .47 .02 .09 .03 .48
19 Prepared of cereals, flour, starch etc. 248.20 228.21 206.02 232.05 372.40 543.67 486.22
20 Prepared of vegetable fruits, nuts, etc. 333.48 222.83 265.37 397.52 366.28 528.95 605.82
21 Misc. edible preparations 6.80 .47 1.74 1.72 .20 1.03 .78
22 Beverages, spirits and vinegar 17.07 15.15 25.55 69.81 52.84 58.57 30.62
23 Residues & waste from the food industry 107.00 105.86 66.88 91.18 55.01 72.95 71.65
24 Tobacco mfg tobacco substitutes 377.25 332.15 122.25 199.48 120.66 202.62 538.03
25 Salt, sulphur, etc. and plastering metals
stone
Cement 50.47 43.74 26.77 16.13 31.35 22.22 14.36
26 Ores, slag and ash 79.23 205.99 204.90 192.54 15.82 145.09 256.07
27 Mineral, fuels/oils etc. 2745.66 1954.61 3387.61 2248.96 526.17 6192.88 1995.92
28
Inorganic. chem.: compounds of specious
metals etc.
25.06 36.99 448.44 29.23 26.68 36.92 43.17
29 Organic chemicals .25 .80 1.79 .50 - - 3.68
30 Pharmaceutical products 364.95 514.70 363.43 361.67 395.77 459.83 393.94
31 Fertilizers - .09 .04 - .02 - -
32 Tanning/dyeing ext; dye pigments etc. 2.80 .56 1.00 7.81 8.20 54 1.19
33 Essential Oils, perfumery/toilet pre. .25 1.63 2.85 - 5.35 .01 2.43
34 Soap, orga. Surface-active agents etc. 18.74 25.45 17.32 20.16 10.79 4.62 11.10

Foreign Trade
Monthly Statistical Bulletin, Bangladesh, June-2013. 137
7.1 Monthly merchandise exports (2 digit HS code)-CONTD.
(Million Taka) HS
Chapter
Commodities Monthly
Dec’12 Jan’13 Feb’13 Mar’13 Apr’13 May’13 Jun’13
35 Albuminoidal subst. starches, glues etc. 13.03 14.21 6.68 .46 14.36 1.92 8.67
36 Explosives pyrotechnic products etc. - - - - - - -
37 Photographic/cinematographic goods - - 36 - - - -
38 Miscellaneous chem. Products 16.89 29.25 40.16 31.78 37.00 10.51 41.67
39 Plastics and articles thereof 553.73 588.71 474.65 544.27 578.49 618.84 489.42
40 Rubber and articles thereof 89.71 117.01 85.29 85.64 95.28 81.52 54.70
41 Raw hides & skins, leather 2969.98 2568.51 2515.05 3304.14 3493.68 3631.22 2869.21
42 Art of saddlery & harness etc. 850.29 847.87 642.26 951.41 917.21 - -
43 Fur skins & artificial fur. Mfg. - - - - - - -
44 Wood & art. of wood; wood charcoal 18.96 4.34 6.77 16.47 35.15 14.17 14.57
45 Cork and articles of cork - - - - - - -
46 Manufactures of straw etc. 44.58 33.9 28.57 33.26 36.79 47.34 47.56
47 Pulp/ wood/fibrous cellulose materials etc. - - - - .98 - -
48 Paper & paper board; art. P. pulp etc. 255.03 218.47 228.37 203.89 208.68 279.41 276.97
49 Printed books, news papers, pictures etc. 17.23 8.86 3.64 2.57 4.61 15.97 9.49
50 Silk .02 - - 12.51 .50 - -
51 Wool, fine/coarse animal hair etc. .70 - - - - - .95
52 Cotton 783.75 849.08 786.14 795.31 739.21 775.23 773.68
53 Other veg. tex. fibres, paper/yarn etc. 4894.64 5321.15 4986.96 5635.54 6163.77 5203.77 4533.10
54 Man-made filaments 231.09 250.46 191.44 194.29 209.12 252.28 221.06
55 Man-made staple fibres 230.61 238.67 224.26 423.58 317.39 318.31 352.62
56 Wadding felts nonwovens, speci. yarn etc. 142.38 158.2 180.09 153.20 172.39 206.85 145.51
57 Carpet other text. floor coverings 64.16 29.11 29.08 89.88 51.15 56.69 83.81
58 Special woven fab; tufted tex.fabrics etc. 568.53 772.00 657.02 641.83 547.87 534.70 594.97
59 Impregnated, coated, tex fab. etc. 84.02 74.50 59.53 76.66 71.54 89.76 66.76
60 Knitted or crocheted fabrics 122.28 101.98 106.53 143.02 183.62 176.61 121.41
61 Art. of aprl. Cloth acsor. knit/crocht. 73264.68 75300.3 64183.60 67207.22 61944.23 - -
62 Art. of aprl. cloth acsor. n-knit/ crocht 84185.54 91742.81 77629.50 78188.62 65012.22 - -
63 Other made up tex. articles etc. 7258.29 7201.42 5897.01 7644.63 6479.47 7290.11 7291.66
64 Footwear, gaiter & like etc. 2993.10 3456.82 2467.86 2010.15 2255.13 2883.37 3266.82
65 Headgear and parts thereof 344.15 331.56 278.67 336.32 300.38 355.29 327.18
66 Umbrellas, sun umbrellas, walk sticks etc. - .22 .09 .07 - - -

Foreign Trade
138 Monthly Statistical Bulletin, Bangladesh, June-2013.
7.1 Monthly merchandise exports (2 digit HS code)-CONT. ( Million Taka)
HS Commodities Monthly
Chapter Dec’12 Jan’13 Feb’13 Mar’13 Apr’13 May’13 Jun’13
67 Prepared feathers & down/articles etc.
56.11 66.86 46.94 56.34 71.80 69.94 60.72
68 Art of stone, plastic, cement etc.
1.76 3.92 1.53 - .18 135.43 6.26
69 Ceramic products 341.22 21.94 242.34 241.38 245.22 272.85 254.69
70 Glass and glassware 1.03 .76 - .07 .35 1.10 .85
71 Natural/culture pearls & precious stones etc.
.02 - - .72 - .87 .99
72 Iron or steel 232.25 259.93 238.86 181.18 101.88 335.10 155.31
73 Articles of iron or steel 142.13 103.07 205.73 216.24 184.23 120.29 78..99
74 Copper and articles thereof 531.84 516.68 457.53 546.52 335.84 387.66 234.08
76 Aluminum and article thereof - - .19 .89 4.69 1.48 3.86
78 Lead and articles thereof 47.61 21.30 9.51 - 21.31 63.82 3.70
79 Zinc and articles thereof 18.14 28.61 18.20 14.88 8.12 18.73 15.59
80 Tin and articles thereof - - .01 - - - -
81 Other base metals, cermets etc. - - - - 3.63 - -
82 Tools, implements, cutlery etc. 4.72 14.91 17.17 36.40 22.65 - -
83 Miscellaneous art of base metal.
.42 - .42 .07 - - 1.14
84 Nuclear reactors, boilers etc. 402.62 354.19 487.34 645.32 778.71 271.15 200.16
85 Electrical mach. & equipment, parts etc.
506.91 340.22 355.36 358.85 230.83 355.31 242.04
86 Rail/tramway locomotives etc. - 8.74 7.14 11.97 8.14 8.46 .20
87 Vehicles, other than rail/tram way’s & parts etc.
708.79 918.98 2029.01 994.43 82.81 1163.67 828.80
88 Aircraft, space craft and parts. 227.39 212.34 9.38 .50 49.03 .25 30.74
89 Ships, boats & floating structures
58.56 18.70 .87 359.28 4.11 .30 1.51
90 Optical, photograph, cinematgph. Medical inst. etc.
241.86 305.06 309.72 299.53 379.99 373.94 416.81
91 Clocks & watches & parts. 2.81 5.46 - 9.50 1.50 7.09 2.16
92 Musical /instruments and parts etc.
- .16 - - - - -
93 Arms, & ammunition and parts & accessories
- - 128.84 - - - -
94 Furniture, bedding, mattresses etc.
213.86 253.66 204.84 268.25 273.02 207.51 192.37
95 Toys, games & sports requisites & parts etc.
156.59 218.95 173.88 217.66 142.09 115.52 242.97
96 Miscellaneous mfg. articles 78.04 64.67 68.32 78.75 91.39 94.02 87.90
97 Works/ art, collectors & antiques
- 28.68 - 2.92 3.41 .20 54.86
98 Miscellaneous national provisions
2.47 1.06 112.21 1.11 2.08 - -
Total 195822.5 181551.68 162031.77 - - Source: National Accounting Wing, BBS.-
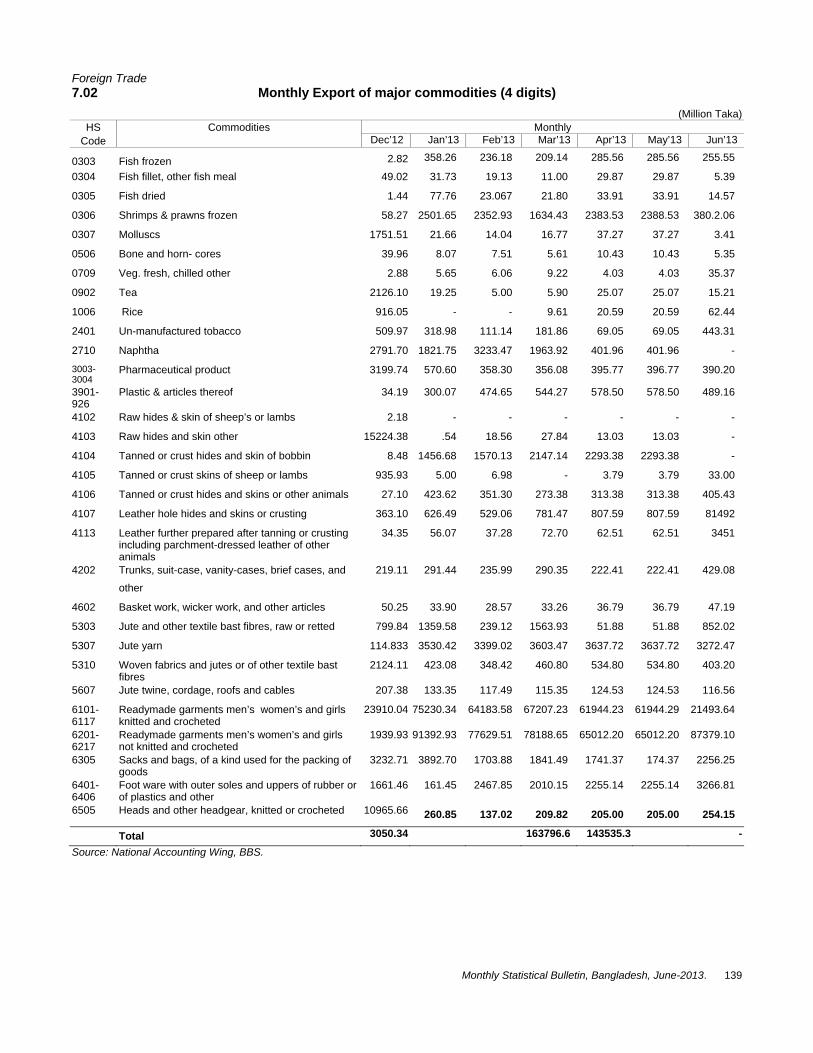
Foreign Trade
Monthly Statistical Bulletin, Bangladesh, June-2013. 139
7.02 Monthly Export of major commodities (4 digits) (Million Taka)
HS Commodities Monthly Code Dec’12 Jan’13 Feb’13 Mar’13 Apr’13 May’13 Jun’13
0303 Fish frozen 2.82 358.26 236.18 209.14 285.56 285.56 255.55
0304 Fish fillet, other fish meal 49.02 31.73 19.13 11.00 29.87 29.87 5.39
0305 Fish dried 1.44 77.76 23.067 21.80 33.91 33.91 14.57
0306 Shrimps & prawns frozen 58.27 2501.65 2352.93 1634.43 2383.53 2388.53 380.2.06
0307 Molluscs 1751.51 21.66 14.04 16.77 37.27 37.27 3.41
0506 Bone and horn- cores 39.96 8.07 7.51 5.61 10.43 10.43 5.35
0709 Veg. fresh, chilled other 2.88 5.65 6.06 9.22 4.03 4.03 35.37
0902 Tea 2126.10 19.25 5.00 5.90 25.07 25.07 15.21
1006 Rice 916.05 - - 9.61 20.59 20.59 62.44
2401 Un-manufactured tobacco 509.97 318.98 111.14 181.86 69.05 69.05 443.31
2710 Naphtha 2791.70 1821.75 3233.47 1963.92 401.96 401.96 -
3003-3004
Pharmaceutical product 3199.74 570.60 358.30 356.08 395.77 396.77 390.20
3901-926
Plastic & articles thereof 34.19 300.07 474.65 544.27 578.50 578.50 489.16
4102 Raw hides & skin of sheep’s or lambs 2.18 - - - - - -
4103 Raw hides and skin other 15224.38 .54 18.56 27.84 13.03 13.03 -
4104 Tanned or crust hides and skin of bobbin 8.48 1456.68 1570.13 2147.14 2293.38 2293.38 -
4105 Tanned or crust skins of sheep or lambs 935.93 5.00 6.98 - 3.79 3.79 33.00
4106 Tanned or crust hides and skins or other animals 27.10 423.62 351.30 273.38 313.38 313.38 405.43
4107 Leather hole hides and skins or crusting 363.10 626.49 529.06 781.47 807.59 807.59 81492
4113 Leather further prepared after tanning or crusting including parchment-dressed leather of other animals
34.35 56.07 37.28 72.70 62.51 62.51 3451
4202 Trunks, suit-case, vanity-cases, brief cases, and
other
219.11 291.44 235.99 290.35 222.41 222.41 429.08
4602 Basket work, wicker work, and other articles 50.25 33.90 28.57 33.26 36.79 36.79 47.19
5303 Jute and other textile bast fibres, raw or retted 799.84 1359.58 239.12 1563.93 51.88 51.88 852.02
5307 Jute yarn 114.833 3530.42 3399.02 3603.47 3637.72 3637.72 3272.47
5310 Woven fabrics and jutes or of other textile bast fibres
2124.11 423.08 348.42 460.80 534.80 534.80 403.20
5607 Jute twine, cordage, roofs and cables 207.38 133.35 117.49 115.35 124.53 124.53 116.56
6101-6117
Readymade garments men’s women’s and girls knitted and crocheted
23910.04 75230.34 64183.58 67207.23 61944.23 61944.29 21493.64
6201-6217
Readymade garments men’s women’s and girls not knitted and crocheted
1939.93 91392.93 77629.51 78188.65 65012.20 65012.20 87379.10
6305 Sacks and bags, of a kind used for the packing of goods
3232.71 3892.70 1703.88 1841.49 1741.37 174.37 2256.25
6401-6406
Foot ware with outer soles and uppers of rubber or of plastics and other
1661.46 161.45 2467.85 2010.15 2255.14 2255.14 3266.81
6505 Heads and other headgear, knitted or crocheted 10965.66 260.85 137.02 209.82 205.00 205.00 254.15
Total 3050.34 163796.6 143535.3 -
Source: National Accounting Wing, BBS.

Foreign Trade
140 Monthly Statistical Bulletin, Bangladesh, June-2013.
7.3 Monthly Merchandise import (2 digit HS Code) ( Million Taka)
HS
Commodities
Monthly
Code Dec’12 Jan’13 Feb’13 Mar’13 Apr’13 May’13 Jun’13
1 Live animals 49.02 131.25 71.30 64.07 131.31 68.70 36.81
2 Meat and edible meat offal 1.44 .40 1.59 .77 40.33 .21 .87
3 Fishes, crustacean and other aquatic 58.27 147.69 261.41 321.49 356.36 240.19 258.02
4 Dairy produces edible product of animal
origin.
1751.51 2005.86 1236.59 1737.85 2143.22 2055.94 1491.99
5 Products of animal origin 39.96 80.62 44.95 271.90 95.28 50.17 34.72
6 Live tree and other plants etc. 2.88 3.65 1.47 1.56 .88 17.46 1.93
7 Edible vegetables, roots as tubers 2126.10 3673.46 2679.70 2426.51 7584.81 4688.68 5934.90
8 Edible fruits and nuts citrus fruits 916.05 798.00 715.45 576.55 856.28 870.82 592.27
9 Coffee, tea, mate and spices 509.97 455.77 679.57 617.50 627.53 740.67 912.63
10 Cereals 2791.70 3318.25 3550.25 5070.63 7769.29 5187.06 2825.77
11 Product of milling industry: malt etc. 151.94 347.76 234.64 258.86 209.74 77.53 129.58
12 Oil seeds and oleaginous fruits 3199.74 2559.62 2705.78 3115.76 421.16 3075.16 5341.25
13 Lac, gums, resins , veg. saps & extra 34.19 35.94 20.96 23.45 43.45 43.70 39.77
14 Veg. plaiting materials - 8.51 9.84 10.42 21.65 9.23 16.57
15 Animal or veg. fats and oils 2.18 34495.21 21882.79 13769.81 17055.09 12490.96 30828.46
16 Preparations of meat or fish etc. 15224.38 3.92 9.94 63.51 5.13 .07 9.48
17 Sugar and sugar confectionery 8.48 5215.08 4902.97 901.48 5654.38 1007.49 9929.86
18 Cocoa and cocoa preparation 935.93 28.19 30.70 52.16 13.72 25.19 30.50
19 Preparations of cereals, flour, starch etc. 27.10 655.38 482.92 332.20 467.87 429.53 625.29
20 Preparations of veg. fruits, nuts, etc. 363.10 66.05 37.87 40.56 59.81 53.42 60.68
21 Misc. edible preparations 34.35 240.16 362.93 296.71 386.44 321.17 426.27
22 Beverages, spirits and vinegar 219.11 54.05 44.84 28.68 59.02 60.15 103.37
23 Residues & waste from the food indus. 799.84 2438.50 1551.36 1494.77 1401.89 1493.50 2033.26
24 Tobacco mfg tobacco substitutes 114.83 87.47 100.85 26.44 125.70 34.18 104.72
25 Salt, sulphur, etc. and plastering metals
stone cement
5124.11 7950.13 6041.37 5059.96 6251.09 4764.47 7162.23
26 Ores, slag and ash 207.38 355.42 462.70 442.09 348.80 531.10 261.97
27 Mineral, fuels/oils etc. 23910.04 26288.64 14206.39 17088.92 28149.47 30165.50 39413.02
28 Inorganic. Chem.: compounds of specious
metals etc.
1939.93 1751.07 1398.57 1818.83 176.33 2153.04 2514.29
29 Organic Chemicals 3232.71 3593.59 2933.31 3510.17 3768.53 3732.23 3598.74
30 Pharmaceutical products 1661.46 895.87 951.40 919.66 1430.42 1050.05 1530.85
31 Fertilizers 10965.66 8823.19 3333.65 5664.91 2018.17 2698.40 13255.58
32 Tanning/dyeing ext; dye pigments etc. 3050.34 3465.40 2738.98 2898.33 3495.04 3203.97 3291.46

Foreign Trade
Monthly Statistical Bulletin, Bangladesh, June-2013. 141
7.3 Monthly Merchandise import (2 digit HS Code) ( Million Taka)
HS Commodities Monthly
Code Dec’12 Jan’13 Feb’13 Mar’13 Apr’13 May’13 Jun’13
33 Essential Oils, perfumery/toilet pre. 481.15 693.01 463.06 430.50 523.81 466.55 588.16
34 Soap, orga. Surface-active agents etc. 906.44 1129.93 860..45 1110.62 1098.21 - -
35 Albuminoidal subst. starches, glues etc. 311.17 427.41 358.35 384.78 399.38 361.05 293.45
36 Explosives pyrotechnic products etc. 34.81 3.593 - 33.51 13.77 1.22 16.02
37 Photographic/cinematographic goods 176.48 107.04 105.22 171.85 318.98 148.17 173.28
38 Miscellaneous chem. products 2562.81 3052.24 2259.57 2683.42 2559.67 2647.70 2376.17
39 Plastics and articles thereof 8437.72 10439.73 7846.25 10417.21 12306.79 10168.64 9728.81
40 Rubber and articles thereof 160.60 1921.00 1166.21 1397.21 1510.21 1559.92 1671.00
41 Raw hides & skins, leather 682.088 575.23 411.63 397.45 553.65 742.30 727.29
42 Art of saddlery & harness etc. 142.30 142.52 104.19 118.04 83.74 - -
43 Fur skins & artificial fur. Mfg. 2.25 .23 1.34 1.75 5.50 6.28 1.09
44 Wood & art. of wood; wood charcoal 644.67 776.09 457.41 626.79 630.67 678.66 964.37
45 Cork and articles of cork .09 1.45 .15 1.85 2.38 1.22 1.37
46 Manufactures of straw etc. .64 1.21 1.30 1.71 1.47 1.34 .25
47 Pulp/ wood/fibrous cellulosic materials etc. 1167.54 1159.41 630.09 952.76 1037.28 862.48 113719
48 Paper & paper board; art. Paper pulps etc. 3232.75 3395.43 2841.54 3397.98 3724.35 3631.35 3270.57
49 Printed Book, News paper & picture 811.53 586.6 514.22 133.00 332.96 12456 130.96
50 Silk 35.00 72.17 25.86 115.56 64.27 11.23 23.98
51 Wool, fine/coarse animal hair etc 356.95 03.70 89.14 293.30 801.17 722.37 688.38
52 Cotton 44650.49 46229.43 44515.96 42765.9 55373.07 54059.53 44570.65
53 Other veg. tex. fibres, paper/yarn etc. 221.32 230.17 137.03 47.89 89.32 105.18 13.00
54 Man-made filaments 5461.28 6246.87 5152.55 5335.93 6392.22 6184.35 5783.51
55 Man-made staple fibres 7916.31 8837.80 9306.56 8388.03 10647.9 12085.79 10253.91
56 Wadding felts non-wovens, special yarn etc. 245.87 167.98 163.50 188.48 180.34 182.35 411.39
57 Carpet other text. floor coverings 23.65 29.44 20.30 28.66 17.60 19.46 35.21
58 Special woven fab; tufted tex. fabrics etc. 651.22 656.85 382.92 613.20 906.8 1164.09 1130.91
59 Impregnated, coated, tex fab. etc. 613.83 793.54 526.83 743.60 578.31 723.75 957.85
60 Knitted or crocheted fabrics 2566.14 2168.37 1971.64 1964.85 2967.75 3068.43 2183.97
61 Art. of aprl. cloth acsor. Knit /crocheted 8297 76.30 77.76 58.34 109.58 83.14 185.05
62 Art. of aprl. cloth acsor. n-knit/ crocheted 6231.37 6407.67 5095.73 4786.52 6422.98 6344.07 5364.48
63 Other made up tex. articles etc. 367.96 220.79 170.44 211.98 135.61 149.65 320.58
64 Footwear, gaiter & like etc. 690.51 646.10 629.30 547.09 670.35 1064.67 704.64
65 Headgear and parts thereof 26.35 26.31 10.91 18.44 11.90 12.02 14.96

Foreign Trade
142 Monthly Statistical Bulletin, Bangladesh, June-2013.
7.3 Monthly Merchandise import (2 digit HS Code)-CONTD. (Million Taka) HS Commodities Monthly
Code Dec’12 Jan’13 Feb’13 Mar’13 Apr’13 May’13 Jun’13
66 Umbrellas, sun umbrellas, walk sticks etc. 7.08 20.30 22.99 23.41 43.54 53.75 76.83
67 Prepared feathers & down/articles etc 110.44 372.91 184.30 226.21 313.52 - -
68 Art of stone, plastic, cement etc. 179.88 205.42 260.45 221.77 225.79 309.58 325.53
69 Ceramic products 308.29 386.21 286.17 239.25 274.30 375.09 638.34
70 Glass and glassware 384.85 450.82 401.27 428.13 462.58 400.24 446.00
71 Natural/culture pearls & precious stones etc/ 205.91 23.69 174.99 25.21 245.28 39.97 64.93
72 Iron or steel 7038.19 14420.46 11548.44 13912.68 12424.98 14867.60 16949.22
73 Articles of iron or steel 2920.42 4234.67 3028.88 2100.39 2404.23 1728.84 3214.76
74 Copper and articles thereof 1336.20 1000.48 820.01 758.64 598.66 819.92 1073.81
75 Nickel and articles thereof 17.30 25.39 11.77 10.31 3.14 10.89 30.22
76 Aluminum and article thereof 1479.61 1976.83 1643.38 1548.19 1836.83 1719.45 1343.70
78 Lead and articles thereof 297.94 191.58 171.54 206.99 417.70 170.72 281.42
79 Zinc and articles thereof 719.56 744.02 696.27 824.20 982.18 776.02 519.52
80 Tin and articles thereof 4.45 9.06 42.89 11.48 27.56 20.84 15.52
81 Other base metals, cermets etc. 25.04 55.17 26.56 46.78 66.49 28.93 6.22
82 Tools, implements, cutlery etc. 223.12 260.48 239.84 204.57 168.59 138.77 245.75
83 Miscellaneous art of base metal. 285.48 431.95 302.91 296.73 292.62 312.41 297.81
84 Nuclear reactors, boilers etc. 25979.33 2780.1.69 25296.43 1847236 25543.17 21107.44 21471.07
85 Electrical mach. & equipment, parts etc. 12550.60 16400.37 12931.40 10320.68 12332.83 13227.03 11112.49
86 Rail/tramway locomotives etc. 10491 5.18 502.16 4.27 2715.55 27.59 14.46
87 Vehicles, other than rail/tram way’s & parts
etc.
5639.06 6376.96 4336.42 4435.19 4920.47 4369.63 5926.03
88 Aircraft, space craft and parts. 1365.01 4616.30 269.99 817.91 657.42 1010.57 406.60
89 Ships, boats & floating structures 8942.31 8553.17 10877.13 10329.22 10163.54 7108.01 6589.07
90 Optical, photgph. Cinematgph. Medical inst.
etc.
2047.99 1960.26 1616.64 1699.37 2232.39 2277.67 2424.10
91 Clocks & watches & parts. 26.56 27.44 20.62 24.25 36.52 34.03 33.05
92 Musical /instruments and parts etc. 2.73 4.85 1.16 .43 1.73 5.48 1.26
93 Arms, & ammunition and parts &
accessories
186.20 955.24 3.37 14.96 11.38 2029.92 183.10
94 Furniture, bedding, mattresses etc. 293.68 577.71 634.01 758.91 1245.94 844.84 392.93
95 Toys, games & sports requisites & parts
etc.
156.34 151.35 94.64 98.89 93.35 77.39 103.07
96 Miscellaneous mfg. articles 1421.78 1572.78 1088.63 1478.94 1785.63 1594.01 1361.41
97 Works/ art, collectors & antiques .11 1.32 1.78 57.55 .23 .14 .10
98 Miscellaneous national provisions 1.09 5.77 3.01 .60 2.65 - -
Total 245277.68 22687.33 286041.13 - - Source: National Accounting Wing, BBS

Foreign Trade
Monthly Statistical Bulletin, Bangladesh, June-2013. 143
7.4 Monthly import of major commodities (4 digits) (Million Taka) HS
Code
Commodities Monthly
Dec’12 Jan’13 Feb’13 Mar’13 Apr’13 May’13 Jun’13 0401 Milk & cream 1.36 4.41 .46 2.66 1.00 2.88 .86
0703 Onion & Garlic 277.63 35923 557.45 245.35 191.16 207.78 373.78 0713 Dried leguminous veg. 1882.40 3307.29 2090..47 2178.42 7393.02 4477.65 5554.85 0804 Dates 151.12 25.40 120.24 62.81 148.42 147.53 191.91 0806 Grapes .09 6.82 18.13 6.34 4.74 9.21 17.88 0808 Apples .92 402.42 344.28 190.30 260.79 277.78 225.68 0904 Pepper 383.45 51.11 97.49 31.08 26.73 11.64 12.44 1001 Wheat 66.62 3156.67 3459.03 038.77 7652.39 5117.09 700.04 1006 Rice 2640.00 55.86 59.03 24.16 63.11 38.23 125.20 1108 Starches 25.85 229.56 233.59 228.38 0.14 69.07 107.09 1201-1212 Oil seeds 145.33 2556.62 2705.77 3115.76 421.15 3075.17 5341.24 15072763.71 Soyabean oil 3198.82 13699.13 4774.32 3398.50 6996.16 2287.65 4590.03 15112749.7 Palm 0il 7045.40 20539.98 16991.24 10186.08 9689.89 9935.85 26089.15 17015672.57 Sugar 7950.88 5143.46 4798.15 752.55 5518.96 870.62 9766.69 24011941.15 Un-manufactured
tobacco 876.59 68.28 81.53 5.12 101.35 20.76 81.39
252384.19 Cement 80.97 6063.42 5245.88 4353.64 4809.21 3802.92 6155.93 27093176.62 Petroleum oil crude - 16718.36 - - - - - 2710- Petroleum product 3904.23 131.99 11660.05 12512.55 25330.59 25847.64 25847.64 2801-2851 In organic Chemicals 23010.58 3575.09 1398.15 1817.32 1745.23 2152.99 2514.17 2901-2942 Organic Chemicals 3227.81 8823.18 2933.27 3471.12 3768.54 3732.22 3598.74 3101-3105 2180.1Fertilizers 10965.73 2930.78 3333.65 5664.91 2018.17 2698.40 13255.59 3201-3215 Tannin1290.19g &
dyeing 3080.43 3052.24 2738.99 2898.34 3495.05 3168.98 3291.48
3801-3825 Chemical prod1768.49uct
2562.69 10439.74 2238.24 2683.43 2559.68 2647.55 2356.31
3901-3926 Plastic & articles thereof 8505.63 3395.50 7846.24 10417.06 12306.79 10167.83 9728.90 4801-4823 Paper & paper board 2671.18 11935.92 8623.14 3397.97 3724.37 3631.25 3270.44 5201-5203 Raw cotton 12479.44 6645.15 15319.30 17049.75 19818.74 18470.47 16117.47 5205-5207 Cotton yarn 6163.26 24295.21 6430.92 6088.48 7339.31 7154.47 6186.15 5208-5212 Cotton fabric 25938.29 2109.88 22735.84 18580.91 28188.32 28370.46 22222.01 5402-5406 Synthetic yarn 3088.56 3260.96 2111.09 2129.73 2604.27 2158.85 1930.13 5407-5408 Synthetic fabric 2754.49 282.70 2342.10 2510.12 2935.79 3265.03 2932.06 5504-5507 Staple fibre 228.81 2461.07 318.86 388.79 462.38 556.11 496.84 5509-5511 Yarn of staple fibre 1500.53 1207.56 3242.49 2568.57 3559.10 4145.38 3332.85 5512-5516 Fabric of staple fibre 4643.25 14420.51 4163.89 3815.93 5191.03 5451.44 4906.30 7201-7229 Iron & steel 7038.67 4238.64 11548.34 13912.67 12424.95 14867.59 16949.23 7301-7326 Article of iron & steel 9354.00 1976.81 3028.73 2100.38 2404.20 1728.82 3214.74 7601-7616 Aluminum & article
thereof 1114.00 27760.76 1643.34 154820 1846.65 1719.37 1343.69
8402-8485 Machinery & parts 19567.22 16400.13 25242.81 18410.19 30487.50 21010.74 21446.23 8501-8548 Electrical goods 20015.72 4.70 12931.42 10320.65 12332.78 47063.24 11111.59 8607-8609 Rail, tramway,
locomotive 104.91 6376.99 52.30 4.27 61.51 - -
8701-8716 Vehicle 5649.97 9532.96 4336.43 4435.19 5020.47 - - 8902,8903,8908 Ships ,boat, floating structure 8879.00 1917.64 8694.30 10329.23 7385.86 - - 9001-9033 Optical, Photo, Cinema
etc. 54055.25 2616.62 1699.36 2232.39 - -
Total 265231.10 188566.00 242521.90 - -
Source: National Accounting Wing, BBS.
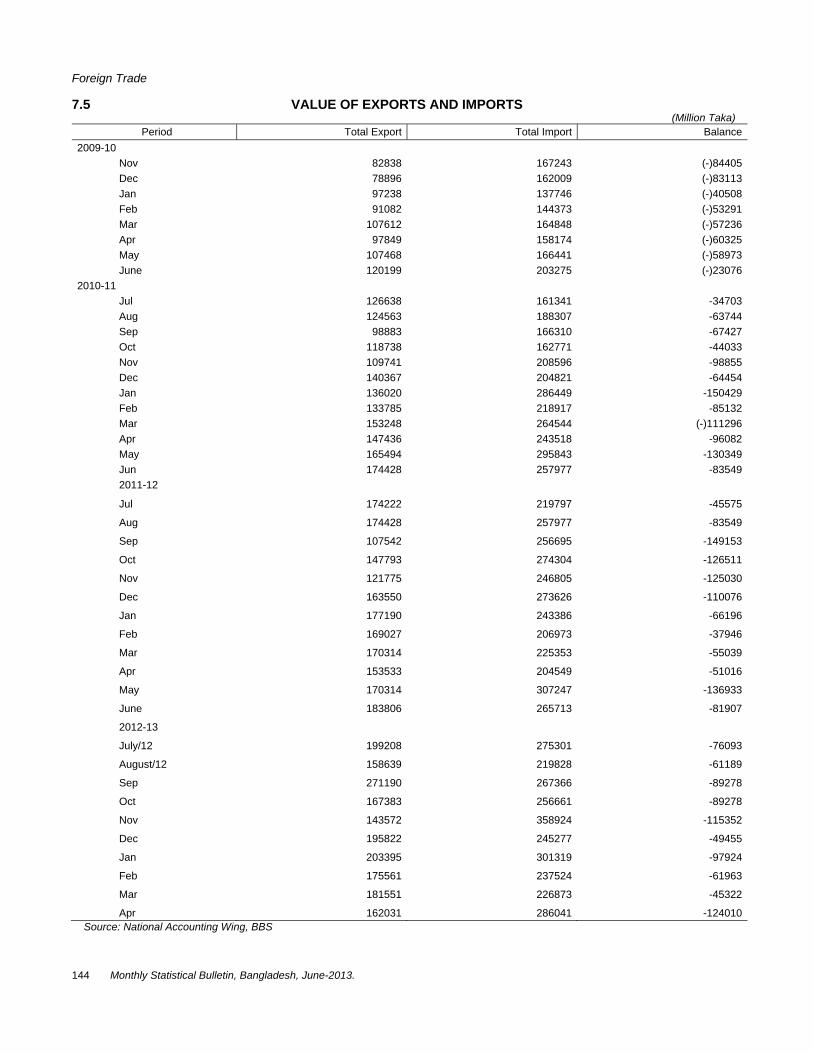
Foreign Trade
144 Monthly Statistical Bulletin, Bangladesh, June-2013.
7.5 VALUE OF EXPORTS AND IMPORTS (Million Taka)
Period Total Export Total Import Balance2009-10
Nov 82838 167243 (-)84405Dec 78896 162009 (-)83113Jan 97238 137746 (-)40508Feb 91082 144373 (-)53291Mar 107612 164848 (-)57236Apr 97849 158174 (-)60325May 107468 166441 (-)58973June 120199 203275 (-)23076
2010-11 Jul 126638 161341 -34703Aug 124563 188307 -63744Sep 98883 166310 -67427Oct 118738 162771 -44033Nov 109741 208596 -98855Dec 140367 204821 -64454Jan 136020 286449 -150429Feb 133785 218917 -85132Mar 153248 264544 (-)111296Apr 147436 243518 -96082May 165494 295843 -130349Jun 174428 257977 -835492011-12
Jul 174222 219797 -45575
Aug 174428 257977 -83549
Sep 107542 256695 -149153
Oct 147793 274304 -126511
Nov 121775 246805 -125030
Dec 163550 273626 -110076
Jan 177190 243386 -66196
Feb 169027 206973 -37946
Mar 170314 225353 -55039
Apr 153533 204549 -51016
May 170314 307247 -136933
June 183806 265713 -81907
2012-13
July/12 199208 275301 -76093
August/12 158639 219828 -61189
Sep 271190 267366 -89278
Oct 167383 256661 -89278
Nov 143572 358924 -115352
Dec 195822 245277 -49455
Jan 203395 301319 -97924
Feb 175561 237524 -61963
Mar 181551 226873 -45322
Apr 162031 286041 -124010Source: National Accounting Wing, BBS

Foreign Trade
Monthly Statistical Bulletin, Bangladesh, June-2013. 145
7.6 UNIT PRICE INDEX OF MAJOR EXPORT ITEMS (Base : 2002-2003)
Sl. No. Commodity Unit Weight
Unit Price Index 2009-10 2010-11 2011-12
General Index 100 149.99 165.56 216.37
1. Fish Kg 6.25 102.89 118.74 106.37 i) Fish Kg 0.59 121.00 145.00 167.46 ii) Shrimps & Prawn Frozen Kg 5.66 10 0.00 100.00 100.00
2. Vegetables fresh/chilled Kg 0.26 147.50 163.00 168.753. Tea Kg 0.28 173.09 239.00 236.114. Naptha & furnace oil Kg 0.42 380.51 373.00 428.40
i) Naptha Kg 0.20 159.00 444.00 528.62 ii) Furnace oil Kg 0.27 183.18 321.00 354.16
5. Pharmaceutical product Kg 0.11 90.00 84.00 10.386. Fertilizer Kg 1.33 139.74 331.00 370.237. Leather raw hides & skins Kg 3.39 287.00 203.00 167.368. Raw jute Kg 0.95 200.51 357.00 246.159. Jute goods Kg 5.70 148.00 218.00 310.68
i) Jute yarn Kg 1.74 224.00 147.00 394.44 ii) Jute fabrics Kg 1.08 232.00 236.00 253.96 iii) Jute twine, cordage, ropes Kg 0.41 222.00 259.00 381.34 iv) Jute sacks & bugs Kg 2.47 145.36 169.00 264.75
10. Terry Towlling Kg 0.45 530.27 157.00 210.9111. Readymade garments Kg 78.60 130.00 192.00 215.10
i) Men/boys/women/girls, over- coats, car coats, rain coats No 1.34 242.00 316.00 279.70
ii) Men boys/women/girls suits No 0.68 140.89 144.00 368.42
iii) Men/boys/women/girls jackets & blazers No 7.20 140.35 146.00 195.52
iiv) Men/boys/women/girls trousers, bib, shorts etc. No 20.42 179.00 180.00 5.34
v) Women/girls dress No 0.70 205.00 244.00 51.62 vi) Women shirts No 0.96 141.65 115.00 1207.14 vii) Men/boys/women/girls shirts No 21.22 175.00 200.00 217.02 viii) T-Shirts No 13.55 120.25 122.00 610.19 ix) Jerseys No 12.53 92.00 93.00 61.36
12. Tents Kg 0.87 230.02 240.00 227.8913. Footwear Pair 0.85 313.00 325.00 290.84
i) Footwear (Sports) Pair 0.34 175.00 183.00 323.77 ii) Footwear, other Pair 0.51 252.00 270.00 268.88
14. Hats & other head gear Kg 0.34 142.00 172.00 355.8115. China/Ceramic tableware Kg 0.13 - - 177.03
Source: National Accounting Wing, BBS Note: The Base year of general index on Import & Export is changed to 2002-03 from 1988-89.

Foreign Trade
146 Monthly Statistical Bulletin, Bangladesh, June-2013.
7.7 UNIT PRICE INDEX OF MAJOR IMPORT ITEMS (Base : 2002-2003)
Sl. No. Commodity Unit Weight Unit Price Incex
2009-10(P) 2010-11 2011-12
General Index 100 174.99 196.45 321.03 1. Live Poultry No 0.07 185.00 205.00 490.85 2. Meat of Sheep/goat Kg 0.10 66.00 48.00 80.88 3. Milk Powder Kg 0.60 123.00 124.00 185.52 4. Butter fat/oil Kg 0.03 193.29 200.00 334.70 5. Onion/Garlic 0.15 199.87 212.00 2165.59
i) Onion Kg 0.03 116.53 156.00 203.46 ii) Garlic Kg 0.12 220.70 225.00 550.96
6. Dried Legummous Vegetale (Shelled) Kg 1.45 152.80 141.00 174.22 7. Fruits 0.23 121.13 130.00 176.77
i) Dates Kg 0.09 101.96 123.00 189.72 ii) Orange Kg 0.02 97.92 100.00 109.57 iii) Grapes Kg 0.05 125.36 125.00 232.47 iv) Apples Kg 0.07 149.26 152.00 168.36
8. Spices 0.45 172.22 176.00 360.72 i) Pepper/Chillies Kg 0.12 205.33 213.00 323.46 ii) Cinnomon Kg 0.06 54.80 56.00 66.30 iii) Clove Kg 0.02 130.49 137.00 941.88 iv) Cardamon Kg 0.08 93.58 97.00 580.53 v) Cumin seeds Kg 0.15 238.86 234.00 327.66 vi) Ginger Kg 0.02 181.94 237.00 202.27
9. Cereals 4.54 220.80 269.28 415.38 i) Wheat Kg 2.18 189.80 271.00 298.63 ii) Maize Kg 0.44 391.00 347.00 1578.54 iii) Rice Kg 1.92 217.00 250.00 281.38
10. Starch Kg 0.08 220.30 245.00 366.01 11. Oil Seeds 0.81 188.52 225.46 251.39
i) Copra Kg 0.07 167.10 183.00 47.47 ii) Rape/Colza seed Kg 0.56 171.63 221.00 272.15 iii) Mastard seed Kg 0.18 249.37 256.00 266.11
12. Edible Oil Kg 9.56 229.95 187.20 386.89 i) Soyabean oil Kg 4.91 233.86 196.00 379.29 ii) Palm Oil Kg 4.65 225.82 178.00 394.91
13. Sugar 0.78 182.95 215.81 261.40 i) Sugar Kg 0.73 187.20 221.00 268.66 ii) Sugar Glucose/Lactose Kg 0.05 121.00 140.00 185.76
14. Oil Caka/Animal feeding 0.75 179.24 187.77 229.39 i) Oil Cake Kg 0.32 253.45 256.00 273.46 ii) Animal feeding Kg 0.43 124.00 137.00 196.60
15. Tobacco Unmanufactured Kg 0.29 152.98 154.00 215.01 16. Cement Clinker Kg 2.21 161.00 163.00 215.64 17. Petroleum Petroleum 8.05 315.74 311.88 446.63
i) Crude Petoleum Oil Kg 2.61 363.79 370.00 646.75 ii) Kerosene Oil Kg 1.15 241.28 335.00 281.60 iii) Diesel Oil Kg 3.94 274.60 270.00 299.22 iv) Lubricating Oil Kg 0.35 251.59 277.00 630.55
18. Inorganic Chemicals Kg 1.08 134.04 212.00 216.53 19. Organic Chemicals 0.65 153.20 161.65 176.52
i) Vitamins Kg 0.13 178.32 173.00 180.26 ii) Hormones, natural other Kg 0.06 68.84 53.00 67.34 iii) Antibiotics Kg 0.46 157.12 173.00 189.70

Foreign Trade
Monthly Statistical Bulletin, Bangladesh, June-2013. 147
7.7 UNIT PRICE INDEX OF MAJOR IMPORT ITEMS-Contd. (Base : 2002-2003) Sl. No. Commodity Unit Weight
Unit Price Index 2009-10 2010-11 2011-12
20. Pharmaceutical Products Kg 0.87 228.39 218.92 285.99 i) Medicaments Kg 0.52 325.30 303.00 349.76 ii) Chemical contraceptive preparation based on homnoncs Kg 0.35 84.41 94.00 191.24
21. Fertilizer Kg 1.62 373.73 374.00 694.56 22. Tanning and Pying substances 1.07 158.43 171.73 193.71
i) Synthetic Organic Tanning Substances Kg 0.16 157.67 168.00 181.49 ii) Dyes Kg 0.79 164.61 177.00 196.25
iii)Printing Ink, Writing or Drawing Ink and other Ink Kg 0.12 118.65 142.00 193.29
23. Mixtures of Odoriferous usbstances Kg 0.33 87.12 90.00 115.04
24. Organic surface Active agent Kg 0.11 128.62 140.00 164.9325. Insecticides Kg 0.44 125.16 113.00 128.4626. Finishing agent Dying for Textile Industries Kg 0.25 167.07 174.00 190.1127. Poastic Materials 3.89 164.78 186.80 791.32
i) Artificial Plastics and Planstic Products Kg 2.93 157.46 176.00 258.85 ii) Articles of Plastics Kg 0.96 187.12 221.00 2416.47
28. Rubber and Rubber Articles 0.67 156.94 172.86 102.82 i) Natural rubber Kg 0.07 258.18 308.00 462.07 ii) Synthetic Rubber Kg 0.05 226.09 289.00 321.71 iii) Tyre for Motor car No 0.07 152.54 169.00 9.57 iv) Tyre for Bus/Lorry No 0.37 144.03 144.00 4.64 v) Rubber contraceptive Kg 0.11 107.33 133.00 164.31
29 Wood in the Rough C.M. 0.65 120.96 123.00 123.43
30. Pulps of othe fibrous cellulosic material & waste & scrap paper or paper board Kg 0.35 121.16 158.00 202.02
31. Paper & Paper board 2.28 132.36 173.57 197.81 i) Newsprint in rolls or sheet Kg 0.27 150.70 202.00 231.94 ii) Paper and Paper boards un coated Kg 0.30 145.13 108.00 192.09 iii) Tissue Paper Kg 0.04 130.76 158.00 169.80 iv) Craft Paper Kg 0.46 131.72 170.00 185.83 v) Semichemical fuiting paper Kg 0.23 131.35 181.00 191.45 vi) Paper and paperboard coated Kg 0.75 121.85 146.00 161.49 vii) Paper & Paperboard label print Kg 0.23 131.00 318.00 322.56
32. Raw Cotton Kg 6.34 142.52 139.00 142.5333. Cotton Textile 8.15 159.61 114.86 52.02
i) Cotton yarn Kg 1.67 138.69 139.00 216.71 ii) Cotton fabrics Kg 6.48 165.00 109.00 9.57
34. Synthetic Textile 3.41 154.82 193.09 208.32 i) Synthetic Filament thread Kg 0.39 104.00 155.00 154.50 ii) Synthetic filament yarn Kg 0.83 159.70 204.00 159.88 iii) Synthetic filament fabrics Kg 2.19 162.00 197.00 236.27
35. Staple fibres 6.65 139.14 166.46 200.89 i) Artificial filament tow Kg 0.19 171.67 79.00 206.02 ii) Synthetic staple fibres Kg 0.48 173.25 243.00 253.35 iii) Synthetic staple fibre sewing thread Kg 0.16 89.00 131.00 146.34 iv) Synthetic staple fibre yarn Kg 1.62 102.00 138.00 146.65 v) Synthetic staple fibre fabrics Kg 4.20 150.00 174.00 217.65
36. Special Woven Fabrics 0.77 189.39 165.83 187.88 i) Woven pile and chenille fabrics Kg 0.12 217.00 266.00 341.90 iii) Label Bages similar Articles Woven Kg 0.32 218.00 125.00 129.78
iii) Textile fabrics, impreguated coated covered with plastics Kg 0.33 151.62 169.00 188.20

Foreign Trade
148 Monthly Statistical Bulletin, Bangladesh, June-2013.
7.7 UNIT PRICE INDEX OF MAJOR IMPORT ITEMS-Contd. (Base : 2002-2003)
Sl. No. Commodity Unit Weight
Unit Price Inxex 2009-10 2010-11 2011-12
37. Knitted fabrics 0.67 168.90 185.5 237.70 i) Pile fabrics, terry fabrics Knitted Kg 0.43 180.64 182.00 260.74 ii) Knitted fabricsclastomeric yarn o Rubber Thread Kg 0.21 147.93 194.00 199.35 iii) Knitted fabrics other Kg 0.03 147.57 173.00 175.80
38. Second hand clothing Kg 0.06 93.63 83.00 99.73 39. Float glass and surface ground or Polished glass in sheet Sqm 0.11 3.60 5.00 5.77 40. Iron and steel and article thereof 5.77 212.76 233.86 271.80
i) Iron and steel Kg 4.71 208.29 221.00 255.82 ii) Articles of Iron ans Steel Kg 1.06 232.29 291.00 342.80
41. Copper and Copper Articles 0.17 391.47 463.06 541.72 i) Refined copper and coppers alloys unwrought Kg 0.08 373.56 390.00 501.81 ii) Refind copper wire Kg 0.09 407.41 528.00 577.19
42. Aluminium and Articles thereof 0.65 181.43 206.00 220.87 i) Unwrought Aluminium Kg 0.41 172.16 206.00 218.60 ii) Aluminium foil Kg 0.24 197.29 206.00 224.75
43. Steam and Vapour generating Boiler 0.12 - 62.00 37.61 i) Steam and Vapour generating boiler Kg 0.12 72.44 - -
44. Spark and compression ignition Combustion engine and Parts 0.40 225.80 123.45 120.07
i) Spark ignition receprocating or Rotary internal combustion Piston engine No 0.03 44.64 17.00 0.80
ii0 Compression ignition internal combustion piston engine No 0.27 253.92 181.00 177.42 iii) Parts of Engine Kg 0.10 204.24 - 82.52
45. Mechanical and Electrical Mechineries Equipment and Parts 2.46 120.57 136.79 159.49 i) Terbo-jets, turbo propellers and other gas furbines No 0.07 13.00 3.00 3.78 ii) Pumps for liquids No 0.23 25.00 60.00 12.72 iii) Air or vacum pumps, air or other gas compressors and fans No 0.22 147.00 289.00 818.67 iv) Air conditioning Machines No 0.20 101.00 16.00 14.07
v) Refrigerators, and other refrigerating or freezing equipment No 0.51 200.00 220.00 109.99
vi) Machinery, Plant or Laboratory equipment No 0.22 113.00 166.00 207.19 vii) Centrifuges, including centrifugal dryers No 0.11 146.00 87.00 67.14
viii) Dish washing machines including cleaning, sealing, lebelling etc. machines No. 0.29 132.00 144.00 140.67
ix) Ships, derricks, cranes and work trucks filled with crance No 0.07 256.00 171.00 145.98 x) Other lifting, handling, loading orun-loading machinery No 0.34 58.00 69.00 62.31
xi) Self Propelled bulldozers, graders-levellers etc. and also Road Rollers No 0.17 90.00 106.00 135.38
xii) Other moving, grading, levelling scraping excavating, tamping machinery No 0.03 109.00 74.00 65.69
46. Agriculture and other machinery 0.92 96.35 45.32 97.03
i) Agricultural, horticultural or forestry machinery No 0.41 122.00 7.00 120.24
ii) Other agricultural, horticultural, forestry, poultry-keeping machinery No 0.11 78.00 75.00 1.31
iii) Machinery for food or drinks No 0.09 123.00 148.00 146.85
iv) Other machinery for making up paperpulp, paper or paperboard No 0.50 112.00 105.00 154.30
v) Printing machinery No 0.15 7.00 3.00 12.83

Foreign Trade
Monthly Statistical Bulletin, Bangladesh, June-2013. 149
7.7 UNIT PRICE INDEX OF MAJOR IMPORT ITEMS-Contd. (Base : 2002-2003)
Sl. No. Commodity Unit Weight
Unit Price Index 2009-10 2010-11 2011-12
47. Textile and sewing machinery No 3.49 237.89 92.46 96.46 i) Machines of preparing textile fibes No 0.87 70.00 51.00 35.16 ii) Weaving machines (looms) No 0.33 121.00 155.00 168.57 iii) Knitting machines No 0.67 119.00 105.00 109.51
iv) Other Textile Auxiliary machinery for use with machines Kg 0.30 212.00 195.00 239.93
v) Machinery for washing cleaning wriuging, drying ironing, bleaching, dying etc. machines No 0.80 669.00 85.00 99.24
vi) Sewing machines domestic (Eectric) No 0.33 88.00 13.00 36.45 vii) Sewing machine other (automatic) No 0.19 115.00 137.00 71.93
48. Rulling Mills & Machine Tools 0.54 162.30 172.63 175.27 i) Metal rolling mills and rolls No 0.50 168.00 175.00 178.69 ii) Machine Tools for drilling boring milling ortapping No 0.04 91.00 143.00 132.53
49. Data processing machine (Computer) 1.16 100.50 104.95 76.18 i) Automatic data processing machine and unit No 0.66 88.00 89.00 37.46 ii) Parts data processing machines Kg 0.50 117.00 126.00 127.28
50. Machinery for sorting screening, washing crushing, grinding mixing of stone, or other mineral substance No 0.22 89.00 101.00 107.99
51. Machinery for working Rubber or Plastics No 0.31 120.00 108.00 130.30 52. Machines and Mechanical Appliances No 0.36 132.00 142.00 113.51 53. Mould Box Base Patern Rubber/Plastics Kg 0.09 241.00 221.00 268.81 54. Electric generator and Transformer 1.23 144.34 947.00 1097.25
i) Electric Motor generator No 0.12 151.00 8086.00 9312.05 ii) Electric generating set and rotary converter No 0.66 127.00 183.00 210.56 iii) Electric transformer Indicator set No 0.45 168.00 164.00 207.12
55. Electric Accumulators including seperator No 0.07 148.22 1725.00 1851.84
56. Electrical apparatus for line-telephone or line telegraphy No 0.38 229.00 246.00 281.60
57. Computer Articles 0.24 - 365.13 4138.77 i) Magnetic Disc Unrecorded Computer No 0.07 - 1221 3854.42 ii) Computer Disk Packs No 0.17 - - 4255.85
58. Transmission Reception Apparatus other No 0.95 255.00 91 110.23 59. Television including Video Monitors/Projector 0.55 - - 9.15
i) T.V. colour in CKd condition No 0.04 - - 4.07 ii) T.V. colour in CBU condition No 0.40 - - 6.32 iii) T.V. Black and White in CKD condition No 0.11 - - 22.81
60. Electrical Parts thereof 0.64 108.38 141.36 174.34
i) Electrical apparatus for switching or protecting electrical circuits Kg 0.51 123.00 144.00 181.59
ii) Boards, Panels, Consoles, Desks,Cabinets other Kg 0.13 51.00 131.00 145.87

Foreign Trade
150 Monthly Statistical Bulletin, Bangladesh, June-2013.
7.7 UNIT PRICE INDEX OF MAJOR IMPORT ITEMS-Contd. (Base : 2002-2003)
Sl. No. Commodity Unit Weight
Unit Price Index 2009-10 2010-11 2011-12
61. Electronic integrated circuit and micro-assembles No 0.03 53.00 24.00 28.2862. Insulated wire cable and other insulated electric conductors Kg 0.68 240.00 339.00 397.5663. Electrical Insulator of any material Kg 0.04 137.00 177.00 231.8864. Tractors No 0.11 134.00 46.00 52.8365. Transport scating capacity ten or more No 0.58 55.00 116.00 144.3766. i) Motor car and Station Wagon No 1.66 54.00 27.00 0.28
ii) Three wheeled vehicles No 0.32 142.00 60.00 0.72 iii) Truck/Pickup/Van No 0.69 183.00 182.00 227.97
67. Motor Cycle No 0.43 186.00 189.00 191.2968. Bi-cylces No 0.56 113.00 321.00 165.6869. Chips and vessels 2.14 134.92 195.00 2063.39
i) Cruise ships, excursion boat and similar vessels No 0.06 140.27 254.00 1452.90
ii) Vessels for breakingup No 2.08 134.76 193.00 2081.0070. Medical Instruments 0.44 66.85 282.18 168.24
i) Instruments and appliances used in Medical Surgical dental and Veternary No 0.22 4.72 363.00 34.78
ii) X-ray apparatus No 0.12 339.00 250.00 364.39 iii) Instruments & apparatus for Physical or Chemical analysis No 0.10 186.00 143.00 226.48
71. Gas, liquid or Electricity supply or Production meter No 0.13 190.00 109.00 172.0472. Prefabricated building Kg 0.16 242.00 241.00 345.2573. Buttons, Press fasteners, suap fasteners etc. kg 0.30 249.00 308.00 409.7074. Slide fasteners and parts Kg 0.54 197.00 196.00 216.39
Source: National Accounting Wing, BBS.

Foreign Trade
Monthly Statistical Bulletin, Bangladesh, June-2013. 151
7.8 BALANCE OF PAYMENTS DURING THE MONTH OF
DECEMBER’12 TO JUNE-’13 (In cores Taka)
Items 2011-12(P)
Monthly
Dec’12 Jan’13 Feb’13 Mar’13 Apr’13 May’13 June’13Current Account a) Goods Import (FOB) 252310.1 21237.4 26152.2 20591.0 19558.2 24793.6 23039.4 26362.4 Export (FOB) 195820.9 19323.0 19993.8 17162.4 17899.8 16001.4 19473.6 17793.3 Trade Balance (1-2) -56489.2 -1914.4 -6145.4 -3428.6 -1658.4 -8792.2 -3665.8 -8569.1 b) Services Receipts 21283.7 2077.9 1638.2 1500.3 1649.9 1703.5 1735.3 2452.1 Payments 41072.4 3549.6 3960.2 3035.9 3378.3 3625.9 3878.3 4209.2 Net -19788.7 -1471.7 -2322.0 -1535.6 -1728.4 -1922.4 -2143.0 -1757.1 c) Income Receipts 1283.0 97.9 55.7 42.0 45.7 73.5 54.9 51.2 Payments 12717.4 907.6 1997.3 762.2 1525.2 1846.5 1623.9 1561.0 Net -11434.4 -809.7 -1941.6 -720.2 -1479.5 -1773.0 -1569.0 -1509.8 d) Current Transfer Official 788.4 45.1 6.8 1.9 38.6 0.0 32.7 44.9 Private 102580.2 11068.6 11021.2 9305.4 9911.1 9590.0 8800.3 8581.0 of which: Worker's remittances 101586.23 10366.71 10555.99 9190.40 9660.55 9319.42 8462.96 8228.42 Total: 103368.6 11113.7 11028.0 9307.3 9949.7 9590.0 8833.0 8625.9Current Account Balance(a+b+c+d) 15656.3 6917.9 619.0 3622.9 5083.4 -2897.6 1555.2 -3210.1 Capital and Financial Account (Net) 1. Capital Account 3888.8 599.2 90.5 24.8 513.1 0.0 434.1 595.92. Direct Investment 6223.9 -530.4 -836.8 -818.8 -544.2 -1212.9 -699.6 -796.13. Portfolio Investment 4313.3 2601.8 134.0 130.8 -257.9 7.0 -449.3 1083.64. Other Investment -19755.0 -3761.9 -2173.3 -2228.5 5211.1 -9303.2 3245.9 -11112.05. Reserve Assets -2547.6 7916.4 2361.1 7221.8 1240.5 6733.4 -1328.1 6764.8Total (1+2+3+4+5) -7876.6 6225.9 -515 4305.3 5649.5 -3775.7 768.9 -4059.7Errors and Omissions -7779.7 -1291.2 -1224.5 657.6 53.0 -878.1 -1220.4 -1445.5Note : Data have been compiled on the basis of IMF, BOP manual (5th edition) Source : Economic Trends, Statistics Department, Bangladesh Bank. P= Provisional
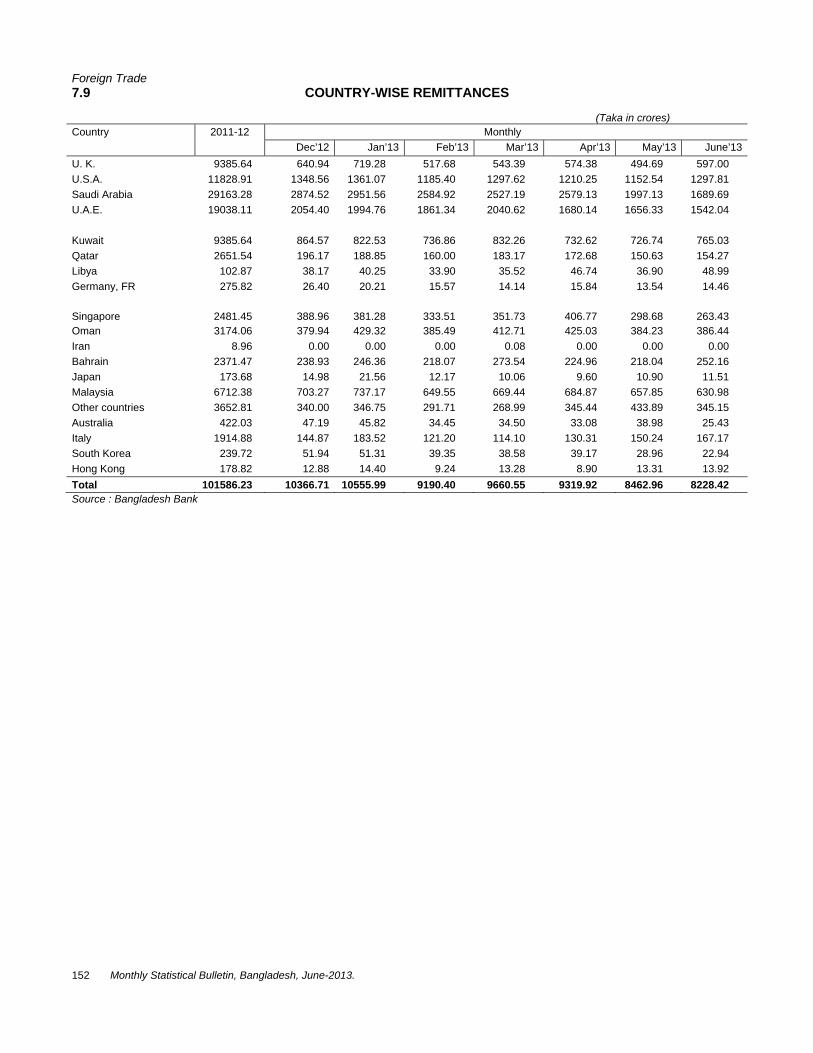
Foreign Trade
152 Monthly Statistical Bulletin, Bangladesh, June-2013.
7.9 COUNTRY-WISE REMITTANCES
(Taka in crores) Country 2011-12 Monthly Dec’12 Jan’13 Feb’13 Mar’13 Apr’13 May’13 June’13U. K. 9385.64 640.94 719.28 517.68 543.39 574.38 494.69 597.00 U.S.A. 11828.91 1348.56 1361.07 1185.40 1297.62 1210.25 1152.54 1297.81 Saudi Arabia 29163.28 2874.52 2951.56 2584.92 2527.19 2579.13 1997.13 1689.69 U.A.E. 19038.11 2054.40 1994.76 1861.34 2040.62 1680.14 1656.33 1542.04 Kuwait 9385.64 864.57 822.53 736.86 832.26 732.62 726.74 765.03 Qatar 2651.54 196.17 188.85 160.00 183.17 172.68 150.63 154.27 Libya 102.87 38.17 40.25 33.90 35.52 46.74 36.90 48.99 Germany, FR 275.82 26.40 20.21 15.57 14.14 15.84 13.54 14.46 Singapore 2481.45 388.96 381.28 333.51 351.73 406.77 298.68 263.43 Oman 3174.06 379.94 429.32 385.49 412.71 425.03 384.23 386.44 Iran 8.96 0.00 0.00 0.00 0.08 0.00 0.00 0.00 Bahrain 2371.47 238.93 246.36 218.07 273.54 224.96 218.04 252.16 Japan 173.68 14.98 21.56 12.17 10.06 9.60 10.90 11.51 Malaysia 6712.38 703.27 737.17 649.55 669.44 684.87 657.85 630.98 Other countries 3652.81 340.00 346.75 291.71 268.99 345.44 433.89 345.15 Australia 422.03 47.19 45.82 34.45 34.50 33.08 38.98 25.43 Italy 1914.88 144.87 183.52 121.20 114.10 130.31 150.24 167.17 South Korea 239.72 51.94 51.31 39.35 38.58 39.17 28.96 22.94 Hong Kong 178.82 12.88 14.40 9.24 13.28 8.90 13.31 13.92 Total 101586.23 10366.71 10555.99 9190.40 9660.55 9319.92 8462.96 8228.42 Source : Bangladesh Bank

National Accounts
Monthly Statistical Bulletin, Bangladesh, June-2013. 153
CHAPTER 8: NATIONAL ACCOUNTS 8.1 GROSS DOMESTIC PRODUCT OF BANGLADESH AT CURRENT PRICE
(Million Taka) SL.No. Industrial Origin Sector 2007-08 2008-09 2009-10 2010-11 2011-12 2012-13(p)
1. Agriculture and Forestry 802015 894264 1005880 1135819 1257514 1369873a) Crops & Horticulture 605784 672467 753391 852379 936580 1008342
b) Animal Farmings 121182 140022 162188 184700 212177 241685
c) Forest and related services 75049 81775 90301 98741 108756 119846 2. Fishing 197901 218064 242229 269962 310031 356724 3. Mining and Quarrying 61517 70910 81141 90631 104455 124126
a) Natural gas and crude petroleum 31641 35900 40393 42624 47293 55357b) Other mining & quarrying 29876 35010 40748 48007 57162 68769
4. Manufacturing 939008 1064453 1201081 1355505 1557497 1760300
a) Large & medium scale 667587 756104 848991 971208 1120749 1271960b) Small scale 271421 308349 352090 384297 436748 488340
5. Electricity, Gas and Water Supply 60704 65421 71945 82113 95950 111690
a) Electricity 49551 53109 58398 67751 80313 94330b) Gas 7162 7929 8762 9078 9664 10753c) Water 3991 4383 4786 5285 5972 6608
6. Construction 438538 501253 556581 639815 766348 8998487. Wholesale and Retail Trade 782203 8802764 1002946 1159586 1306836 14349268. Hotel and Restaurants 38889 44598 51501 59975 71373 82488 9. Transport, Storage & Communication 569074 642803 718796 854647 1018098 1187474
a) Land Transport 428575 483648 541588 660878 803658 949254b) Water Transport 36211 39230 42137 45322 49610 53168c) Air Transport 5461 5892 - 7219 8318 9687d) Support transport services, storage 15689 17582 19380 20699 24528 28623e) Post and Tele Communications 83137 96452 109201 120530 131984 146741
10. Financial Intermediations 89548 102453 122998 144843 175759 205290
a) Monetary intermediation (Banks) 66564 76135 90631 106213 129680 151620b) Insurance 19300 22010 27016 32310 38564 44900c) Other financial intermediation 3684 4308 5351 6320 7515 8770
11. Real Estate, Renting and Business activities 380580 416164 456830 503373 589488 65653312. Public Administration and Defence 144270 163604 187569 223806 253208 28427613. Educatoin 135315 154940 179084 213078 240584 27935814. Health and Social Works 118191 133908 151424 175822 205740 23580015. Community, Social and Personal services 502002 583643 684655 778758 914852 1041000 GDP at current producer price 5259755 5939243 6714660 7687734 8867733 10029705 Import duty 198469 208709 228583 279306 313681 350162 GDP at current market price 5458224 6147952 6943243 7967040 9181414 10379867Source: National Accounting Wing, BBS. Note: ``P’’ denotes Provisional estimates.

National Accounts
154 Monthly Statistical Bulletin, Bangladesh, June-2013.
8.2 SECTORAL SHARES OF GDP AT CURRENT PRICE
SL.No. Industrial Origin Sector 2007-08 2008-09 2009-10 2010-11 2011-12 2012-13(p)1. Agriculture and Forestry 15.25 15.06 14.98 14.77 14.18 13.66
a) Crops & Horticulture 11.52 11.32 11.22 11.09 10.56 10.05b) Animal Farmings 2.30 2.36 2.42 2.40 2.39 2.41c) Forest and related services 1.43 1.38 1.34 1.28 1.23 1.19
2. Fishing 3.76 3.67 3.61 3.51 3.50 3.563. Mining and Quarrying 1.17 1.19 1.21 1.18 1.18 1.24
a) Natural gas and crude petroleum 0.60 0.60 0.60 0.55 0.53 0.55b) 0ther Mining & Quarrying 0.57 0.59 0.61 0.62 0.64 0.69
4. Manufacturing 17.85 17.92 17.89 17.63 17.56 17.55
a) Large & medium scale 12.69 12.73 12.64 12.63 12.64 12.68b) Small scale 5.16 5.19 5.24 5.00 4.93 4.87
5. Electricity, Gas and Water Supply 1.15 1.10 1.07 1.07 1.08 1.11
a) Electricity 0.94 0.89 0.87 0.88 0.91 0.94b) Gas 0.14 0.13 0.13 0.12 0.11 0.11c) Water 0.08 0.07 0.07 0.07 0.07 0.07
6. Construction 8.34 8.44 8.29 8.32 8.64 8.977. Wholesale and Retail Trade 14.87 14.86 14.94 15.08 14.74 14.318. Hotel and Restaurants 0.74 0.75 0.77 0.78 0.80 0.829. Transport, Storage & Communication 10.82 10.82 10.70 11.12 11.48 11.84
a) Land Transport 8.15 8.14 8.07 8.60 9.06 9.46b) Water Transport 0.69 0.66 0.63 0.59 0.56 0.53c) Air Transport 0.10 0.10 0.10 0.09 0.09 0.10d) Support Transport services, storage 0.30 0.30 0.29 0.27 0.28 0.29e) Post and Tele communication 1.58 1.62 1.63 1.57 1.49 1.46
10. Financial Intermediations 1.70 1.73 1.83 1.88 1.98 2.05
a) Monetary intermediation (Banks) 1.27 1.28 1.35 1.38 1.46 1.51b) Insurance 0.37 0.37 0.40 0.42 0.43 0.45c) Other financial intermediation 0.07 0.07 0.08 0.08 0.08 0.09
11. Real Estate, Renting and Business activities 7.24 7.01 6.80 6.55 6.65 6.5512. Public Administration and Defence 2.74 2.75 2.79 2.91 2.86 2.8313. Educatoin 2.57 2.61 2.67 2.77 2.71 2.7914. Health and Social Works 2.25 2.25 2.26 2.29 2.32 2.35 15. Community, Social and Personal services 9.54 9.83 10.20 10.13 10.32 10.38 GDP at current market price 100.00 100.00 100.00 100.00 100.00 100.00Source: National Accounting Wing, BBS. Note: ``P’’ denotes Provisional estimates.

National Accounts
Monthly Statistical Bulletin, Bangladesh, June-2013. 155
8.3 SECTORAL GROWTH RATE OF GDP AT CURRENT PRICE (Percentage)
SL.No. Industrial Origin9.65tor 2007-08 2008-09 2009-10 2010-11 2011-12 2012-13(p)
1. Agriculture and Forestry 14.37 11.50 12.48 12.92 10.71 8.94
a) Crops & Horticulture 15.46 11.01 12.03 13.14 9.88 7.66b) Animal Farmings 12.41 15.55 15.83 13.88 14.88 13.91c) Forest and related services 9.14 8.96 10.43 9.35 10.14 10.20
2. Fishing 11.29 10.19 11.08 11.45 14.84 15.06 3. Mining and Quarrying 15.60 15.27 14.43 11.70 15.25 18.83
a) Natural gas and crude petroleum 11.20 13.46 12.52 5.52 10.95 17.05b) Other mining & quarrying 20.64 17.18 16.39 17.81 19.07 20.31
4. Manufacturing 15.67 13.36 12.84 12.86 14.90 13.02
a) Large & medium scale 15.72 13.26 12.28 14.40 15.40 13.49b) Small scale 15.55 13.61 14.19 9.15 13.65 11.81
5. Electricity, Gas and Water Supply 8.60 7.77 9.97 14.13 16.85 16.41
a) Electricity 8.49 7.18 9.96 16.02 18.54 17.45b) Gas 9.98 10.71 10.50 3.61 6.46 11.27c) Water 7.40 9.82 9.20 10.43 13.01 10.64
6. Construction 16.81 14.30 11.04 14.95 19.78 17.427. Wholesale and Retail Trade 18.50 12.86 13.61 15.62 12.70 9.808. Hotel and Restaurants 18.23 14.68 15.48 16.46 19.00 15.57 9. Transport, Storage & Communication 16.35 12.96 11.82 18.90 19.13 16.64
a) Land Transport 16.29 12.85 11.98 22.03 21.60 18.12b) Water Transport 9.51 8.34 7.41 7.56 9.46 7.17c) Air Transport 7.21 7.89 10.16 11.22 15.23 16.45d) Support Transport services, storage 10.50 12.06 10.23 6.81 18.50 16.69e) Post and Tele communication 21.91 16.02 13.22 10.37 9.50 11.18
10. Financial Intermediations 15.64 14.41 20.05 17.76 21.34 16.80
a) Monetary intermediation (Banks) 14.83 14.38 19.04 17.19 22.09 16.92b) Insurance 17.70 14.04 22.74 19.60 19.36 16.43c) Other financial intermediation 20.00 16.94 24.21 18.11 18.91 16.70
11. Real Estate, Renting and Business activities 8.96 9.35 9.77 10.19 17.11 11.3712. Public Administration and Defence 13.21 13.40 14.65 19.32 13.14 12.2713. Educatoin 14.91 14.50 15.58 18.98 12.91 16.1214. Health and Social Works 14.68 13.30 13.08 16.11 17.02 14.6115. Community, Social and Personal services 15.22 16.26 17.31 13.74 17.48 13.79 GDP at current market price 15.52 12.64 12.94 14.75 15.24 13.05Source: National Accounting Wing, BBS. Note: ``P’’ denotes Provisional estimates.

National Accounts
156 Monthly Statistical Bulletin, Bangladesh, June-2013.
8.4 GROSS DOMESTIC PRODUCT OF BANGLADESH AT CONSTANT PRICE (Base: 1995-96)
(Million Taka)
SL.No. Industrial Origin Sector 2007-08 2008-09 2009-10 2010-11 2011-12 2012-13(p)
1. Agriculture and Forestry 501567 522152 551174 579226 593476 600503
a) Crops & Horticulture 360717 375200 398194 420672 428896 429536b) Animal Farmings 86532 89542 92568 95787 99037 102496c) Forest and related services 54318 57410 60412 62767 65543 68471
2. Fishing 144285 150287 156519 164741 173620 183208 3. Mining and Quarrying 37509 41199 44824 46976 50634 56267
a) Natural gas and crude petroleum 22797 24884 26904 27187 28543 31478b) Other mining & quarrying 14712 16315 17920 19789 22091 24789
4. Manufacturing 550772 587539 625707 684818 748970 818925
a) Large & medium scale 391572 417350 442298 490699 542323 598306b) Small scale 159200 170189 183409 194119 206647 220619
5. Electricity, Gas and Water Supply 49193 52101 55893 59598 66770 72495
a) Electricity 40680 42872 45964 49335 55825 60645b) Gas 5871 6365 6843 6899 7194 7853c) Water 2642 2863 3086 3363 3751 3997
6. Construction 283177 299308 317298 337952 363523 3928027. Wholesale and Retail Trade 445434 473085 500878 532493 562481 5888768. Hotel and Restaurants 21756 23405 25186 27087 29141 31364 9. Transport, Storage & Communication 323566 349487 376366 397784 424119 452536
a) Land Transport 199012 209306 221828 230996 243691 255426b) Water Transport 25436 26062 26325 26602 26931 27335c) Air Transport 3524 3784 4129 4470 5062 5809d) Support transport services, storage 10179 11161 12070 12492 13825 14988e) Post and Tele Communications 85415 99174 112014 123223 134611 148977
10. Financial Intermediations 55960 60993 68093 74658 82897 90353
a) Monetary intermediation (Banks) 41681 45454 50211 54749 60954 66605b) Insurance 11988 12993 14926 16655 18364 19867c) Other financial intermediation 2291 2546 2956 3254 3579 3881
11. Real Estate, Renting and Business activities 232205 241062 250445 260370 270914 281929
12. Public Administration and Defence 85432 91423 99060 108638 114955 120786
13. Educatoin 80129 86581 94578 103430 110884 12159214. Health and Social Works 71627 76782 83001 89934 97047 10433615. Community, Social and Personal services 217314 227534 238265 249474 261349 274055 GDP at constant producer price 3099926 3282937 3487288 3717178 3950780 4190026 Import duty 117334 119031 121158 133326 139752 147175 GDP at constant market price 3217260 3401968 3608446 3850504 4090532 4337201Source: National Accounting Wing, BBS. Note: ``P’’ denotes Provisional estimates.

National Accounts
Monthly Statistical Bulletin, Bangladesh, June-2013. 157
8.5 SECTORAL SHARES OF GDP AT CONSTANT PRICE (Percentage)
SL.No. Industrial Origin Sector 2007-08 2008-09 2009-10 2010-11 2011-12 2012-13(p)
1. Agriculture and Forestry 16.18 15.91 15.81 15.58 15.02 14.33a) Crops & Horticulture 11.64 11.43 11.42 11.32 10.86 10.25b) Animal Farmings 2.79 2.73 2.65 2.58 2.51 2.45c) Forest and related services 1.75 1.75 1.73 1.69 1.66 1.63
2. Fishing 4.65 4.58 4.49 4.43 4.39 4.373. Mining and Quarrying 1.21 1.25 1.29 1.26 1.28 1.34
a) Natural gas and crude petroleum 0.74 0.76 0.77 0.73 0.72 0.75b) Other mining & quarrying 0.47 0.50 0.51 0.53 0.56 0.59
4. Manufacturing 17.77 17.90 17.94 18.42 18.96 19.54a) Large & medium scale 12.63 12.71 12.68 13.20 13.73 14.28b) Small scale 5.14 5.18 5.26 5.22 5.23 5.27
5. Electricity, Gas and Water Supply 1.59 1.59 1.60 1.60 1.69 1.73a) Electricity 1.31 1.31 1.32 1.33 1.41 1.45b) Gas 0.19 0.19 0.20 0.19 0.18 0.19c) Water 0.09 0.09 0.09 0.09 0.09 0.10
6. Construction 9.13 9.12 9.10 9.09 9.20 9.377. Wholesale and Retail Trade 14.37 14.41 14.36 14.33 14.24 14.058. Hotel and Restaurants 0.70 0.71 0.72 0.73 0.74 0.759. Transport, Storage & Communication 10.44 10.65 10.79 10.70 10.74 10.80
a) Land Transport 6.42 6.38 6.36 6.21 6.17 6.10b) Water Transport 0.82 0.79 0.75 0.72 0.68 0.65c) Air Transport 0.11 0.12 0.12 0.12 0.13 0.14d) Support transport services, storage 0.33 0.34 0.35 0.34 0.35 0.36e) Post and Tele Communications 2.76 3.02 3.21 3.31 3.41 3.56
10. Financial Intermediations 1.81 1.86 1.95 2.01 2.10 2.16a) Monetary intermediation (Banks) 1.34 1.38 1.44 1.47 1.54 1.59b) Insurance 0.39 0.40 0.43 0.45 0.46 0.47c) Other financial intermediation 0.07 0.08 0.08 0.09 0.09 0.09
11. Real Estate, Renting and Business activities 7.49 7.34 7.18 7.00 6.86 6.7312. Public Administration and Defence 2.76 2.78 2.84 2.92 2.91 2.8813. Educatoin 2.58 2.64 2.71 2.78 2.81 2.9014. Health and Social Works 2.31 2.34 2.38 2.42 2.46 2.4915. Community, Social and Personal services 7.01 6.93 6.83 6.71 6.62 6.54 GDP at constant market price 100.00 100.00 100.00 100.00 100.00 100.00Source: National Accounting Wing, BBS. Note: ``P’’ denotes Provisional estimates.

National Accounts
158 Monthly Statistical Bulletin, Bangladesh, June-2013.
8.6 SECTORAL GROWTH RATE OF GDP AT CONSTANT PRICE (Percentage)
SL.No. Industrial Origin Sector 2007-08 2008-09 2009-10 2010-11 2011-12 2012-13(p)
1. Agriculture and Forestry 2.93 4.10 5.56 5.09 2.46 1.18
a) Crops & Horticulture 2.67 4.02 6.13 5.65 1.95 0.15b) Animal Farmings 2.44 3.48 3.8 3.48 3.39 3.49c) Forest and related services 5.47 5.69 5.23 3.90 4.42 4.47
2. Fishing 4.18 4.16 4.15 5.25 5.39 5.52 3. Mining and Quarrying 8.94 9.84 8.80 4.80 7.79 11.12
a) Natural gas and crude petroleum 8.26 9.15 8.12 1.05 4.99 10.28b) Other mining & quarrying 10.01 10.90 9.84 10.43 11.63 12.21
4. Manufacturing 7.21 6.68 6.50 9.45 9.37 9.34
a) Large & medium scale 7.26 6.58 5.98 10.94 10.52 10.32b) Small scale 7.10 6.90 7.77 5.84 6.45 6.76
5. Electricity, Gas and Water Supply 6.77 5.91 7.28 6.63 12.03 8.57
a) Electricity 6.68 5.39 7.21 7.33 13.15 8.63b) Gas 7.72 8.42 7.51 0.82 4.27 9.16c) Water 6.00 8.39 7.77 8.99 11.54 6.56
6. Construction 5.68 5.70 6.01 6.51 7.57 8.057. Wholesale and Retail Trade 6.82 6.21 5.87 6.31 5.63 4.698. Hotel and Restaurants 7.55 7.58 7.61 7.55 7.58 7.63 9. Transport, Storage & Communication 8.55 8.01 7.69 5.69 6.62 6.70
a) Land Transport 4.54 5.17 5.98 4.13 5.50 4.82b) Water Transport 2.54 2.46 1.01 1.05 1.24 1.50c) Air Transport 6.20 7.38 9.13 8.26 13.24 14.76d) Support transport services, storage 8.45 9.64 8.15 3.50 10.66 8.41e) Post and Tele Communications 21.64 16.11 12.95 10.01 9.24 10.67
10. Financial Intermediations 8.89 8.99 11.64 9.64 11.04 8.99
a) Monetary intermediation (Banks) 8.38 9.05 10.47 9.04 11.33 9.27b) Insurance 10.03 8.38 14.88 11.58 10.26 8.18c) Other financial intermediation 12.47 11.13 16.10 10.08 9.99 8.44
11. Real Estate, Renting and Business activities 3.75 3.81 3.89 3.96 4.05 4.0712. Public Administration and Defence 6.21 7.01 8.35 9.67 5.81 5.0713. Educatoin 7.80 8.05 9.24 9.36 7.21 9.6614. Health and Social Works 7.02 7.20 8.10 8.35 7.91 7.51 15. Community, Social and Personal services 4.62 4.70 4.72 4.70 4.76 4.86 GDP at constant market price 6.19 5.74 6.07 6.71 6.23 6.03Source: National Accounting Wing, BBS. Note: ``P’’ denotes Provisional estimates.
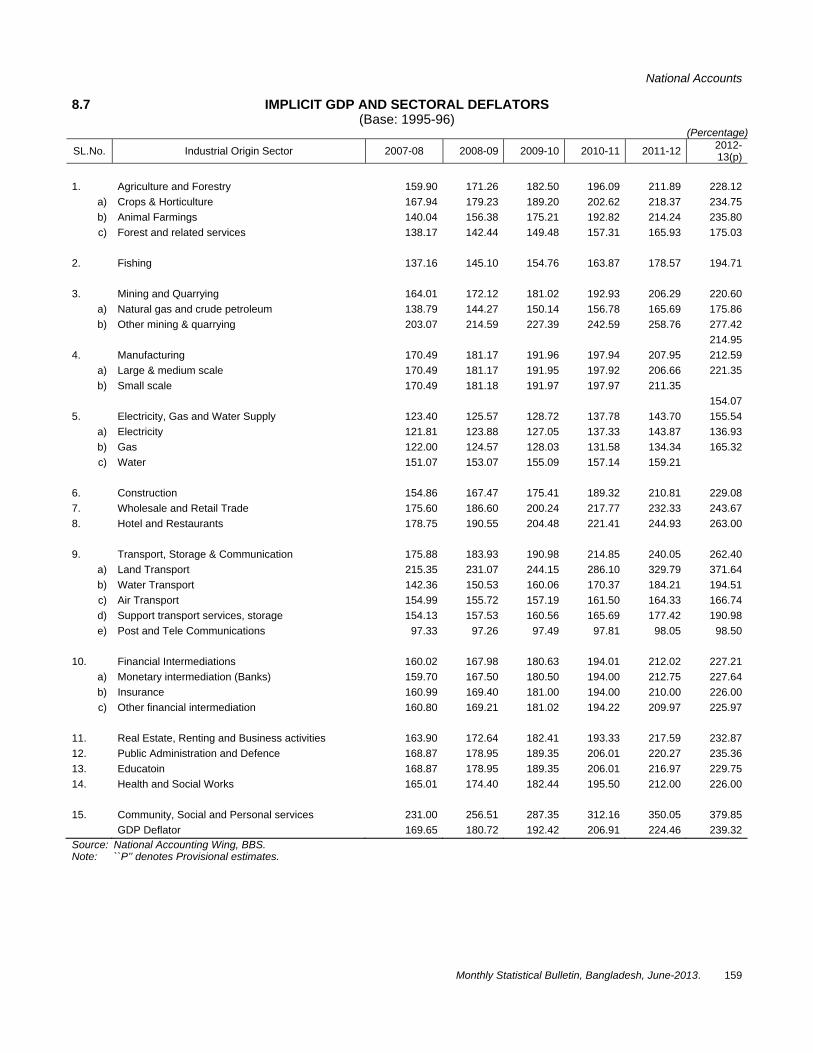
National Accounts
Monthly Statistical Bulletin, Bangladesh, June-2013. 159
8.7 IMPLICIT GDP AND SECTORAL DEFLATORS
(Base: 1995-96) (Percentage)
SL.No. Industrial Origin Sector 2007-08 2008-09 2009-10 2010-11 2011-12 2012-13(p)
1. Agriculture and Forestry 159.90 171.26 182.50 196.09 211.89 228.12
a) Crops & Horticulture 167.94 179.23 189.20 202.62 218.37 234.75b) Animal Farmings 140.04 156.38 175.21 192.82 214.24 235.80c) Forest and related services 138.17 142.44 149.48 157.31 165.93 175.03
2. Fishing 137.16 145.10 154.76 163.87 178.57 194.71 3. Mining and Quarrying 164.01 172.12 181.02 192.93 206.29 220.60
a) Natural gas and crude petroleum 138.79 144.27 150.14 156.78 165.69 175.86b) Other mining & quarrying 203.07 214.59 227.39 242.59 258.76 277.42
214.954. Manufacturing 170.49 181.17 191.96 197.94 207.95 212.59
a) Large & medium scale 170.49 181.17 191.95 197.92 206.66 221.35b) Small scale 170.49 181.18 191.97 197.97 211.35
154.075. Electricity, Gas and Water Supply 123.40 125.57 128.72 137.78 143.70 155.54
a) Electricity 121.81 123.88 127.05 137.33 143.87 136.93b) Gas 122.00 124.57 128.03 131.58 134.34 165.32c) Water 151.07 153.07 155.09 157.14 159.21
6. Construction 154.86 167.47 175.41 189.32 210.81 229.087. Wholesale and Retail Trade 175.60 186.60 200.24 217.77 232.33 243.678. Hotel and Restaurants 178.75 190.55 204.48 221.41 244.93 263.00 9. Transport, Storage & Communication 175.88 183.93 190.98 214.85 240.05 262.40
a) Land Transport 215.35 231.07 244.15 286.10 329.79 371.64b) Water Transport 142.36 150.53 160.06 170.37 184.21 194.51c) Air Transport 154.99 155.72 157.19 161.50 164.33 166.74d) Support transport services, storage 154.13 157.53 160.56 165.69 177.42 190.98e) Post and Tele Communications 97.33 97.26 97.49 97.81 98.05 98.50
10. Financial Intermediations 160.02 167.98 180.63 194.01 212.02 227.21
a) Monetary intermediation (Banks) 159.70 167.50 180.50 194.00 212.75 227.64b) Insurance 160.99 169.40 181.00 194.00 210.00 226.00c) Other financial intermediation 160.80 169.21 181.02 194.22 209.97 225.97
11. Real Estate, Renting and Business activities 163.90 172.64 182.41 193.33 217.59 232.8712. Public Administration and Defence 168.87 178.95 189.35 206.01 220.27 235.3613. Educatoin 168.87 178.95 189.35 206.01 216.97 229.7514. Health and Social Works 165.01 174.40 182.44 195.50 212.00 226.00 15. Community, Social and Personal services 231.00 256.51 287.35 312.16 350.05 379.85 GDP Deflator 169.65 180.72 192.42 206.91 224.46 239.32Source: National Accounting Wing, BBS. Note: ``P’’ denotes Provisional estimates.
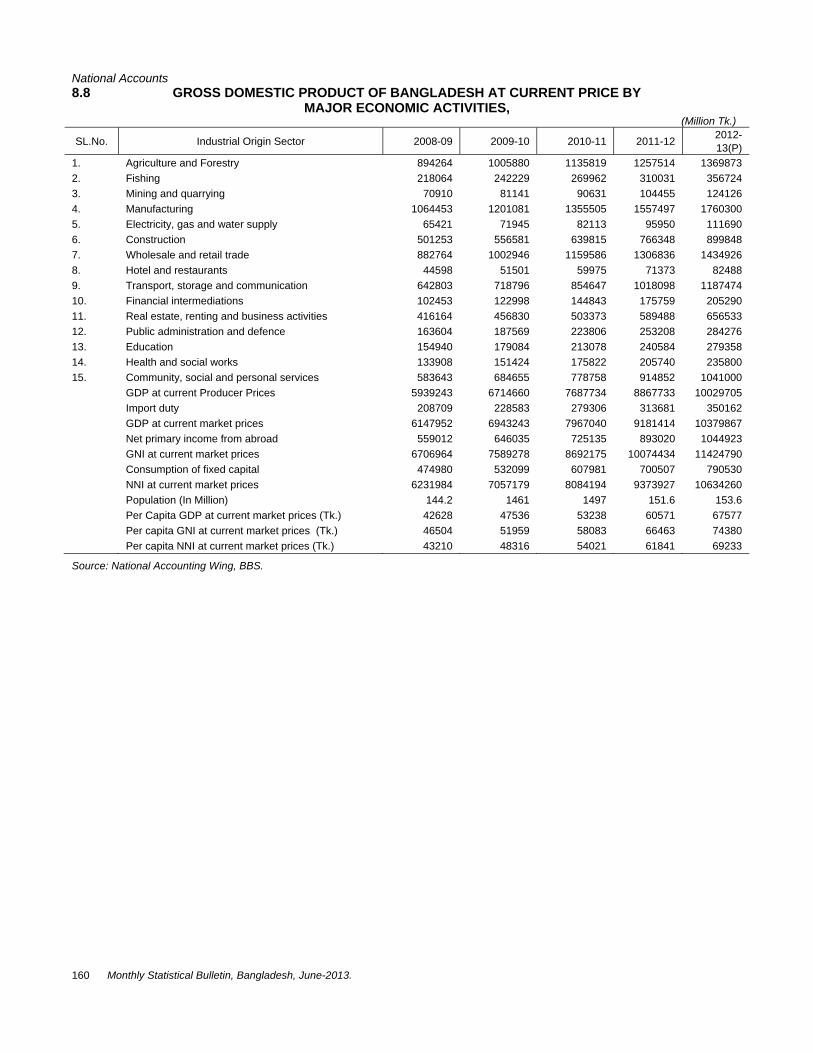
National Accounts
160 Monthly Statistical Bulletin, Bangladesh, June-2013.
8.8 GROSS DOMESTIC PRODUCT OF BANGLADESH AT CURRENT PRICE BY MAJOR ECONOMIC ACTIVITIES,
(Million Tk.)
SL.No. Industrial Origin Sector 2008-09 2009-10 2010-11 2011-12 2012-13(P)
1. Agriculture and Forestry 894264 1005880 1135819 1257514 1369873 2. Fishing 218064 242229 269962 310031 356724 3. Mining and quarrying 70910 81141 90631 104455 124126 4. Manufacturing 1064453 1201081 1355505 1557497 1760300 5. Electricity, gas and water supply 65421 71945 82113 95950 111690 6. Construction 501253 556581 639815 766348 899848 7. Wholesale and retail trade 882764 1002946 1159586 1306836 1434926 8. Hotel and restaurants 44598 51501 59975 71373 82488 9. Transport, storage and communication 642803 718796 854647 1018098 1187474 10. Financial intermediations 102453 122998 144843 175759 205290 11. Real estate, renting and business activities 416164 456830 503373 589488 656533 12. Public administration and defence 163604 187569 223806 253208 284276 13. Education 154940 179084 213078 240584 279358 14. Health and social works 133908 151424 175822 205740 235800 15. Community, social and personal services 583643 684655 778758 914852 1041000 GDP at current Producer Prices 5939243 6714660 7687734 8867733 10029705 Import duty 208709 228583 279306 313681 350162 GDP at current market prices 6147952 6943243 7967040 9181414 10379867 Net primary income from abroad 559012 646035 725135 893020 1044923 GNI at current market prices 6706964 7589278 8692175 10074434 11424790 Consumption of fixed capital 474980 532099 607981 700507 790530 NNI at current market prices 6231984 7057179 8084194 9373927 10634260 Population (In Million) 144.2 1461 1497 151.6 153.6 Per Capita GDP at current market prices (Tk.) 42628 47536 53238 60571 67577 Per capita GNI at current market prices (Tk.) 46504 51959 58083 66463 74380 Per capita NNI at current market prices (Tk.) 43210 48316 54021 61841 69233
Source: National Accounting Wing, BBS.

National Accounts
Monthly Statistical Bulletin, Bangladesh, June-2013. 161
8.9 GROSS DOMESTIC PRODUCT OF BANGLADESH AT CONSTANT PRICE BY MAJOR ECONOMIC SECTOR
(BASE : 1995-96) (Million Tk.)
SL.No. Industrial Origin Sector 2008-09 2009-10 2010-11 2011-12 2012-13(P) 1. Agriculture and Forestry 522152 551174 579226 593476 600503 2. Fishing 150287 156519 164741 173620 183208 3. Mining and quarrying 41199 44824 46976 50634 56267 4. Manufacturing 587539 625707 684818 748970 818925 5. Electricity, gas and water supply 52101 55893 59598 66770 72495 6. Construction 299308 317298 337952 363523 392802 7. Wholesale and retail trade 473085 500878 532493 562481 588876 8. Hotel and restaurants 23405 25186 27087 29141 31364 9. Transport, storage and communication 349487 376366 397784 424119 452536 10. Financial intermediations 60993 68093 74658 82897 90353 11. Real estate, renting and business activities 241062 250445 260370 270914 281929 12. Public administration and defence 91423 99060 108638 114955 120786 13. Education 86581 94578 103430 110884 121592 14. Health and social works 76782 83001 89934 97047 104336 15. Community, social and personal services 227534 238265 249474 261349 274055 GDP at Constant Producer Prices 3282937 3487288 3717178 3950780 4190026 Import duty 119031 121158 133326 139752 147175 GDP at Constant market prices 3401968 3608446 3850504 4090532 4337201 Net primary income from abroad 309329 335748 350461 397861 436618 GNI at Constant market prices 3711298 3944194 4200965 4488393 4773820 Consumption of fixed capital 262547 276348 293971 312092 330253 NNI at Constant market prices 3448751 3667846 3906994 4176301 4443567 Population (In Million) 144.2 146.1 149.7 151.6 153.6 Per Capita GDP at constant market prices (Tk.) 23588 24705 25730 26986 28237 Per capita GNI at constantmarket prices (Tk.) 25733 27003 28072 29611 31080 Per capita NNI at constantmarket prices (Tk.) 23912 25111 26108 27552 28929 Source: National Accounting Wing, BBS. 8.10 PER CAPITA GDP, GNI AND NNI AT CURRENT PRICE,2003-04 TO 2008-09(P)
Item Unit 2008-09 2009-10 2010-11 2011-12 2012-13(P)
GDP (Million Tk.) 6147952 6943243 7967040 9181414 10379867 GNI (Million Tk.) 6706964 7589278 8692175 10074434 11424790 NNI (Million Tk.) 6231984 7057179 8084194 9373927 10634260 Population (Million No.) 144.2 146.1 149.7 1516 153.6 Per capita GDP (In Tk.) 42628 47536 53238 60571 67577 Per capita GNI (In Tk.) 46504 51959 58083 66463 74380 Per capita NNI (In Tk.) 43210 48316 54021 61841 69233 Exchange rate (Taka per US$) 68.80 69.18 71.17 79.10 80.61 Per capita GDP (In US$) 620 687 748 766 838 Per capita GNI (In US$) 676 751 816 840 923 Per capita NNI (In US$) 628 698 759 782 859
8.11 PER CAPITA REAL GDP, GNI AND NNI, 2002-03 TO 2007-08(P) (BASE : 1995-96)
Item Unit 2008-09 2009-10 2010-11 2011-12 2012-13(P)
GDP (Million Tk.) 3401968 3608446 3850504 4090532 4337201 GNI (Million Tk.) 3711298 3944194 4200965 4488393 4773820 NNI (Million Tk.) 3448751 3667846 3906994 4176301 4443567 Population (Million Tk.) 144.2 146.1 149.7 151.6 153.6 Per Capita GDP (In Tk.) 23588 24705 25730 269.86 28237 Per Capita GNI (In Tk.) 25733 27003 28072 29611 31080 Per Capita NNI (In Tk.) 23912 25111 26108 27552 28929 Source: National Accounting Wing, BBS.

National Accounts
162 Monthly Statistical Bulletin, Bangladesh, June-2013.
8.12 DOMESTIC PRODUCT BY EXPENDITURE CATEGORIES AT CURRENT PRICE (Million Taka)
Item 2008-09 2009-10 2010-11 2011-12 2012-13(P) Domestic Demand (1)+(2) 6411306 7242817 8433997 9849783 11167578
Consumption(1) 4912913 5547710 6430219 7412870 8381453
Private 4589386 5174992 5969353 6899975 7812152
General Govt. 323527 372718 460866 512895 569301
Investment(2) 1498393 1695107 2003777 2436913 2786125
Private 1209417 1346905 1554436 1840359 1971268
Public 288976 348201 449341 596554 814858
Exports(3) 1194401 1277985 1824521 2127459 2371053
Imports(4) 1632429 1736938 2518417 2949225 3216720
Resource balance(3)-(4) (-)438028 (-)458953 (-)693896 -821766 845667
Gross Domestic Exp. at m.p. 5973278 6783864 7740101 9028017 10321912
Gross Domestic Product at m.p.(5) 6147952 6943243 7967040 9181414 10379867
Statistical Discrepancy(6) 174674 159379 226939 153397 57955
Net factor income from abroad(7) 559012 646035 725135 893020 1044923
Gross National Income at m.p.(8)(5)+(7) 6706964 7589278 8692175 10074434 11424790
Net current transfers from abroad 24069 42479 31015 17909 19883
Gross Disposable National Income(10)=(8)+(9) 6731033 7631757 8723190 10092343 11444672
Gross Domestic saving(11)=(5)(1 1235039 1395533 1536821 1768544 1998414
Gross National saving(12)=(10)-(1 1818120 2084047 2292971 2679473 3063220
Current Account Balance(13)=(12)- 145053 229561 62254 89163 219139
Memo Items:(% of GDP)
Consumption 79.91 79.90 80.71 80.74 80.75
Private 74.65 74.53 74.93 75.15 75.26
General Govt. 5.26 5.37 5.78 5.59 5.48
Investment 24.37 24.41 25.15 26.54 26.84
Private 19.67 19.40 19.51 20.04 18.99
Public 4.70 5.01 5.64 6.50 7.85
Exports of goods & services 19.43 18.41 22.90 23.17 22.84
Imports of goods & services 26.55 25.02 31.61 32.12 30.99
Gross Domestic saving 20.09 20.10 19.29 19.26 19.25
Gross National saving 29.57 30.02 28.78 29.18 29.51
Source: National Accounting Wing, BBS. Note: ``P’’ denotes Provisional estimates.

National Accounts
Monthly Statistical Bulletin, Bangladesh, June-2013. 163
8.13 GROSS DOMESTIC PRODUCT BY EXPENDITURE CATEGORIES AT CONSTANT PRICE (1995-96=100)
(Million Taka) Item 2008-09 2009-10 2010-11 2011-12 2012-13(P)
Domestic Demand (1)+(2) 3357603 3561374 3815685 4059610 4274529 Consumption(1) 2433535 2563998 2722851 2844318 2988364 Private 2252745 2367156 2509664 2622420 2757852 General Gonit 180790 196842 213187 221899 230512 Investment(2) 924068 997376 1092834 1215291 1286165 Private 741309 787038 842591 907899 896736 Public 182759 210338 250243 307393 389429 Resource balance ((3)-(4) 12783 14601 20095 24310 45202 Exports (3) 670141 676450 874921 942961 975885 Imports (4) 657358 661850 854826 918652 930683 Gross Domestic Exp. at m.p. 3370385 3575975 3835780 4083919 4319731 Gross Domestic Product at m.p.(5) 3401968 3608446 3850504 4090532 4337201 Statistical Discrepancy(6) 31583 32471 14724 6613 17470 Net factor income from abroad(7) 309329 335748 350461 397861 436618 Gross National Income at m.p.(8)=(5)+(7) 3711298 3944194 4200965 4488393 4773819 Net current transfers from abroad (9) 13319 22077 14990 7979 8308 Gross Disposable National Income(10)=(8)+(9) 3724616 3966271 4215954 4496372 4782127
GDP Deflator 180.72 192.42 206.91 224.46 23932
(Implicit deflators, Base: 1995-96=100
Final consumption expenditure : 203.72 218.62 237.85 263.11 283.27
Consumer price index (rebased) 178.95 189.35 216.18 231.14 246.97
CPI (Government employee, rebased)
Gross Capital Formation
Construction Materiel Price Index 165.90 173.51 187.48 208.68 227.57
(Building Materiel Price Index)
Other construction (Kutcha) 176.88 186.74 200.30 154.4 162.88
Planted Machinery 132.83 138.96 151.80 223.06 236.24
Transport equipment 193.34 203.17 221.04 176.99 185.89
Other capital goods
Unit Price Index
Export 178.23 188.93 208.54 225.61 242.96
Import 248.33 262.44 294.61 321.04 345.63
(Annual Percentage Change)
Final consumption expenditure :
Household final consumption expenditure 5.94 5.08 6.02 4.49 5.16
General govt. final consumption expenditure 5.89 8.88 8.30 4.09 3.88
Gross capital formation 6.19 7.93 9.57 11.21 5.83
Exports of goods and services 0.02 6.17 29.34 7.78 3.49
Imports of goods and services (-)2.60 15.09 29.16 7.47 1.31
Source : National Accounting Wing, BBS.

Public Finance
164 Monthly Statistical Bulletin, Bangladesh, June-2013.
CHAPTER 9: PUBLIC FINANCE
9.1 REVENUE RECEIPTS OF THE GOVERNMENT (Million Taka)
Period Customs
Export Duty
Excise Duty
Income Tax
VAT Supl.Tax Domestic
Supl.Tax Import Domestic Import Total
2009-10 Nov 7927.6 - 02.1 9765.6 11218.6 8583.4 19802.0 6492.9 2555.3 Dec 7081.9 - 57.0 13591.0 11159.9 7811.4 18971.3 6173.3 2210.9 Jan 7441.8 - 256.4 9846.9 11195.0 8901.9 21041.9 6332.7 2475.2 Feb 7113.2 - 2287.3 10559.7 20215.7 8137.6 20775.4 5725.1 2262.6 Mar 8692.2 - 683.3 18092.7 11670.6 10393.2 22063.8 6605.2 2850.6 Apr 7995.6 - 112.9 14285.6 12332.3 8213.3 20545.6 6912.7 2360.4 May 8106.9 - 21.3 15678.1 13205.2 9553.7 22758.9 7402.3 2763.7 Jun 10582.6 - 07.1 92306.9 17120.4 12001.3 29121.7 7224.5 3878.4
2010-11 July 7404.8 05.6 08.7 8381.9 12040.1 8425.9 20466.0 5962.1 2350.3 Aug 9109.8 34.2 11.0 9975.2 12284.7 10681.1 22965.8 7950.7 3383.1 Sept 7846.4 62.6 5.9 16591.7 13279.2 8226.6 21505.8 7813.5 2752.1 Oct 8767.5 21.3 11.2 12757.6 13901.7 9584.3 23486.0 7961.8 3397.0 Nov 8707.4 43.8 09.1 13460.5 13606.5 9127.7 22734.2 7818.9 3334.5 Dec 9425.3 36.8 08.1 18192.2 15420.9 10643.8 26064.7 8163.8 3306.2 Jan 10493.0 06.9 119.9 14115.0 14727.5 11294.0 26021.5 9003.0 3617.1 Feb 8717.9 06.0 3420.3 1338.0 13208.8 9637.7 22846.5 69924.2 2732.2 Mar 10315.9 34.5 367.2 24478.9 14946.5 10159.0 25105.5 8667.6 5339.8 Apr 9549.4 10.3 201.8 17555.2 15792.1 10087.8 258799 8563.9 2954.6 May 13252.5 18.2 184.2 19448.6 18028.1 12848.8 30876.9 9329.1 4133.1 Jun 11970.5 6.9 488.1 57976.5 20730.7 12809.6 33540.3 8856.4 4487.1
2011-12 July 9516.0 35.1 113.8 10866.2 14358.7 9001.2 23359.9 8405.2 3640.8 Aug 9668.7 38.1 62.4 12924.0 14163.6 9153.1 23316.7 8704.7 3787.1 Sept 9728.7 84.6 103.3 21099.6 13458.5 9501.3 22959.8 8083.2 3286.1 Oct 10721.8 91.0 158.2 16150.2 16387.0 10437.7 26824.7 9456.2 4320.5 Nov 10584.0 0.00 158.0 16399.0 16410.4 10188.5 26598.9 8743.0 4229.1 Dec 10124.3 0.00 124.1 23217.4 16201.1 11708.2 27909.3 8944.7 3246.8 Jan 11498.9 0.00 937.1 18330.5 18865.2 12573.7 31438.9 9515.8 3686.2 Feb 9863.8 0.00 4532.5 17782.6 16351.7 11001.2 27352.9 9937.7 3366.4 Mar 10530.5 .2 566.4 31770.0 20583.9 11044.6 31628.5 10889.7 3557.8 April 13102.1 7.6 186.3 21988.2 19391.5 11479.7 30871.2 11437.9 3254.1 May 12765.6 7.0 52.8 24349.0 22622.4 13782.6 36405.0 13617.2 3629.2 June 12429.5 2.0 153.3 66888.8 29585.7 14444.6 44030.3 11542.4 3990.8
2012-13 July 11483.5 1.6 137.3 14125.0 16432.6 11874.0 28306.6 5333.7 4272.3 Aug 9419.2 12.0 158.0 1434.41 16073.0 10446.6 26519.6 8280.5 3848.6 Sept 10939.8 25.0 217.8 27465.8 17695.0 11075.9 28770.9 10091.4 3843.5 Oct 10905.3 34.41 184.1 21215.9 19848.1 11703.0 31551.1 8793.4 3961.8 Nov 10684.6 46.2 203.5 21082.2 19776.9 11629.5 31406.4 9580.3 3662.8 Dec 9683.2 39.5 153.2 29919.0 19874.8 11005.5 30880.3 9259.7 3243.7 Jan 12143.0 10.0 1920.1 24205.4 22836.8 14640.3 37477.1 10901.2 3550.3 Feb 10357.2 25.0 3144.5 28784.2 19354.0 11762.7 31116.7 12065.3 3020.1 Mar 10395.9 9.9 607.7 41849.7 23290.9 11366.9 34657.8 11742.1 2853.6 April 11673.7 5.0 416.2 33795.7 23653.6 13098.1 36751.7 12174.3 3364.0 May 10995.3 6.9 265.1 32289.0 26099.1 11866.6 37965.7 12988.3 3085.8 June 13847.7 12.5 156.6 73702.0 39242.3 16122.7 55365.0 9311.1 3698.1
Source: National Board of Revenue.31770.0

Public Finance
Monthly Statistical Bulletin, Bangladesh, June-2013. 165
9.1 REVENUE RECEIPTS OF THE GOVERNMENT-Concld. (Million Taka) Period Others Registration Land Revenue Forest Revenue Post Office Revenue 2008-09
Jun 349.4 1183.1 677.8 102.4 376.5 2009-10
Nov 402.5 795.1 95.5 39.3 128.7 Dec 304.0 810.0 132.9 28.7 117.8 Jan 350.7 778.1 175.3 47.7 132.5 Feb 327.1 781.3 181.8 48.3 129.5 Mar 331.8 832.3 257.0 43.7 152.0 Apr 263.1 822.0 290.1 43.6 192.1 May 400.5 797.4 305.4 41.7 - Jun 385.7 1125.4 542.4 92.6 693.5
2010-11 July 412.7 888.9 63.7 7.8 118.3 Aug 262.2 895.7 94.9 23.5 - Sept 344.0 875.5 97.2 26.6 109.7 Oct 345.6 756.3 134.1 29.1 137.4 Nov 437.3 844.3 123.4 37.1 - Dec 301.5 874.9 193.0 30.9 - Jan 376.6 1547.7 175.3 41.3 112.8 Feb 319.3 1292.2 181.9 52.7 97.6 Mar 285.1 1737.2 260.2 50.8 131.2 Apr 402.4 1557.1 317.8 53.8 110.2 May 302.9 1639.5 309.4 67.5 156.6 Jun 298.3 1858.9 485.7 151.5 782.9
2011-12 July 284.0 1414.4 623.5 18.8 108.7 Aug 323.6 1245.5 751.4 51.2 126.5
Sept 379.0 1416.9 123.3 35.0 118.9 Oct 510.4 1776.3 140.7 45.8 130.9 Nov 408.2 1356.5 177.5 33.9 118.6 Dec 358.1 2244.9 224.8 41.4 111.9 Jan 408.3 1669.3 248.9 41.3 139.8 Feb 328.6 1868.6 251.1 52.7 97.5 Mar 393.3 1675.5 275.6 50.7 145.1 Apr 503.2 1727.0 368.0 53.7 145.8 May 740.0 1752.8 329.6 63.5 149.1 June 410.1 2040.9 563.6 158.3 778.6
2012-13 July 573.5 1807.7 123.6 52.8 166.8 Aug 468.8 1123.1 134.9 29.8 116.7 Sept 558.7 2021.5 166.1 46.0 151.3 Oct 603.5 1444.7 166.8 37.4 145.6 Nov 476.7 1252.2 177.5 58.8 147.2 Dec 511.5 2304.5 211.9 59.9 139.4 Jan 400.9 1432.5 279.9 68.9 155.2 Feb 533.5 1785.7 238.1 57.1 131.6 Mar 448.0 1666.3 261.9 60.6 115.2 Apr 562.6 1957.0 279.2 75.6 140.7 May 497.9 1879.3 341.0 67.9 117.2 June 373.3 1477.4 554.1 142.2 135.0
Source: 1) National Board of Revenue 2) Ministry of Land Administration and Land Records (3) Forest Department 4) General Post Office .
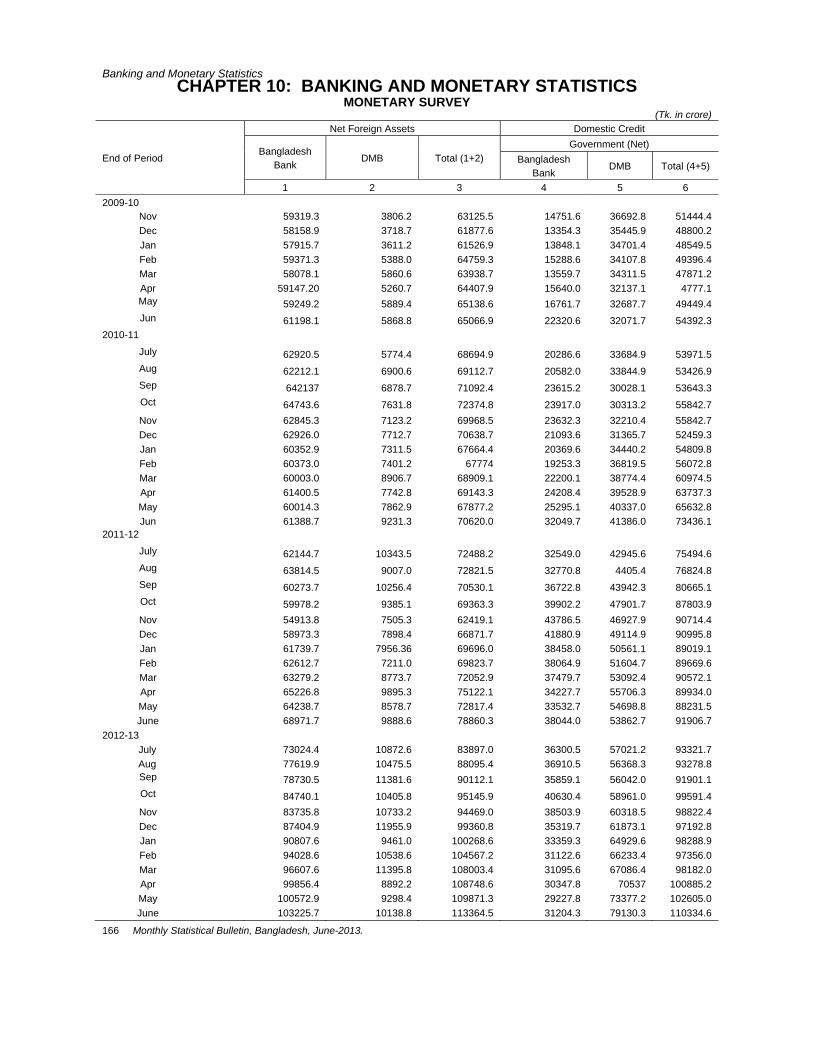
Banking and Monetary Statistics
166 Monthly Statistical Bulletin, Bangladesh, June-2013.
CHAPTER 10: BANKING AND MONETARY STATISTICS MONETARY SURVEY
(Tk. in crore)
End of Period
Net Foreign Assets Domestic Credit
Bangladesh Bank
DMB Total (1+2) Government (Net)
Bangladesh Bank
DMB Total (4+5)
1 2 3 4 5 6 2009-10
Nov 59319.3 3806.2 63125.5 14751.6 36692.8 51444.4 Dec 58158.9 3718.7 61877.6 13354.3 35445.9 48800.2 Jan 57915.7 3611.2 61526.9 13848.1 34701.4 48549.5 Feb 59371.3 5388.0 64759.3 15288.6 34107.8 49396.4 Mar 58078.1 5860.6 63938.7 13559.7 34311.5 47871.2 Apr 59147.20 5260.7 64407.9 15640.0 32137.1 4777.1 May 59249.2 5889.4 65138.6 16761.7 32687.7 49449.4 Jun 61198.1 5868.8 65066.9 22320.6 32071.7 54392.3
2010-11 July 62920.5 5774.4 68694.9 20286.6 33684.9 53971.5 Aug 62212.1 6900.6 69112.7 20582.0 33844.9 53426.9 Sep 642137 6878.7 71092.4 23615.2 30028.1 53643.3 Oct 64743.6 7631.8 72374.8 23917.0 30313.2 55842.7 Nov 62845.3 7123.2 69968.5 23632.3 32210.4 55842.7 Dec 62926.0 7712.7 70638.7 21093.6 31365.7 52459.3 Jan 60352.9 7311.5 67664.4 20369.6 34440.2 54809.8 Feb 60373.0 7401.2 67774 19253.3 36819.5 56072.8 Mar 60003.0 8906.7 68909.1 22200.1 38774.4 60974.5 Apr 61400.5 7742.8 69143.3 24208.4 39528.9 63737.3 May 60014.3 7862.9 67877.2 25295.1 40337.0 65632.8 Jun 61388.7 9231.3 70620.0 32049.7 41386.0 73436.1
2011-12 July 62144.7 10343.5 72488.2 32549.0 42945.6 75494.6 Aug 63814.5 9007.0 72821.5 32770.8 4405.4 76824.8 Sep 60273.7 10256.4 70530.1 36722.8 43942.3 80665.1 Oct 59978.2 9385.1 69363.3 39902.2 47901.7 87803.9 Nov 54913.8 7505.3 62419.1 43786.5 46927.9 90714.4 Dec 58973.3 7898.4 66871.7 41880.9 49114.9 90995.8 Jan 61739.7 7956.36 69696.0 38458.0 50561.1 89019.1 Feb 62612.7 7211.0 69823.7 38064.9 51604.7 89669.6 Mar 63279.2 8773.7 72052.9 37479.7 53092.4 90572.1 Apr 65226.8 9895.3 75122.1 34227.7 55706.3 89934.0 May 64238.7 8578.7 72817.4 33532.7 54698.8 88231.5 June 68971.7 9888.6 78860.3 38044.0 53862.7 91906.7
2012-13 July 73024.4 10872.6 83897.0 36300.5 57021.2 93321.7 Aug 77619.9 10475.5 88095.4 36910.5 56368.3 93278.8 Sep 78730.5 11381.6 90112.1 35859.1 56042.0 91901.1 Oct 84740.1 10405.8 95145.9 40630.4 58961.0 99591.4 Nov 83735.8 10733.2 94469.0 38503.9 60318.5 98822.4 Dec 87404.9 11955.9 99360.8 35319.7 61873.1 97192.8 Jan 90807.6 9461.0 100268.6 33359.3 64929.6 98288.9 Feb 94028.6 10538.6 104567.2 31122.6 66233.4 97356.0 Mar 96607.6 11395.8 108003.4 31095.6 67086.4 98182.0 Apr 99856.4 8892.2 108748.6 30347.8 70537 100885.2 May 100572.9 9298.4 109871.3 29227.8 73377.2 102605.0 June 103225.7 10138.8 113364.5 31204.3 79130.3 110334.6

Banking and Monetary Statistics
Monthly Statistical Bulletin, Bangladesh, June-2013. 167
10.1 MONETARY SURVEY-CONTD. (Tk. in crore)
End of Period
Domestic Credit
Net Other Asset
Net Domestic Asset
(11+12)
Bangladesh Bank
Other Public Sector DMB
Total (7+8)
Private Sector
Total Domestic
Credit (6+9+10)
7 8 9 10 11 12 13 2008-09 808.1 11586.5 12394.7 217927.5 288507.3 (-)39940.0 248567.3 2009-10 793.0 14230.3 15023.0 270760.8 340176.1 (-)44211.8 295364.3
2009-10 Dec 784.9 14185.7 14970.5 243705.0 307475.8 (-)41161.1 266314.7 Jan 802.4 13458.5 14260.9 246103.4 308913.8 (-)42449.6 266464.2 Feb 796.7 13595.6 14392.3 248002.6 311791.3 (-)42179.5 269611.8 Mar 796.7 14393.6 15190.3 251083.0 314144.5 (-)4053.9 273640.6 Apr 794.7 14709.4 15504.1 256204.1 319485.3 (-)40852.4 278632.9
May 794.7 14005.5 14800.2 264038.6 328288.2 (-)41200.9 287087.3 Jun 793.0 14230.0 15023.0 270760.8 340176.1 (-)44211.8 295964.3
2010-11 July 786.0 14307.5 15093.5 273906.7 342971.7 -47283.5 295688.2 Aug 786.0 786.0 15273.4 280504.4 349204.7 -45217.5 303987.2 Sep 773.0 14839.8 15612.8 287242.7 356498.8 (-)48495.2 308003.6 Oct 766.0 15234.7 16000.7 2933856.4 364087.3 (-)51230.5 312856.8 Nov 766.0 16445.9 17211.9 363218.9 376273.5 50474.0 324683.4 Dec 747.3 18232.6 18979.9 310923.7 382362.9 (-)53722.6 328640.3 Jan 1147.3 18719.5 19866.8 315165.1 389841.7 (-)55665.6 334176.1 Feb 1347.3 18519.7 19867.0 318281.8 394221.6 (-)55210.9 339010.7 Mar 1345.3 18697.5 20042.8 326475.1 4050992.4 (-)57071.6 348021.4 Apr 945.3 17559.7 18505.0 330460.7 412703.0 (-)60384.7 352318.3
May 739.3 18160.6 18899.9 336638.2 421170.9 (-)59772.3 361398.6 Jun 776.7 18600.4 19377.1 340712.7 433525.9 (-)63625.9 369900.0
2011-12 July 737.7 18345.0 19082.7 340637.6 435214.9 65163.1 370051.8 Aug 692.7 19113.3 19806.0 345561.9 442192.7 61168.8 381023.9 Sep 687.5 18202.6 18890.1 350375.5 449930.7 (-)67063.2 382867.5 Oct 687.7 16777.2 17464.9 356919.6 462188.4 (-)70247.5 391940.9 Nov 687.7 19248.0 19935.7 361838.6 472488.7 (-)70385.9 402102.8 Dec 684.0 18616.6 19300.6 371242.6 481539.0 (-)72913.8 408625.2 Jan 684.0 17239.9 17923.9 374855.6 481798.6 (-)77791.0 404007.6 Feb 684.0 18489.0 19173.0 380511.6 489354.2 (-)78378.7 410975.5 Mar 984.0 17375.1 18359.1 387121.6 496052.8 (-)77777.9 418274.9 Apr 984.0 17954.1 18938.1 390663.8 499535.9 (-)80851.0 418684.9
May 984.0 17417.4 18401.4 398594.4 505227.3 -76956.1 428271.2 June 1181.9 17224.1 18406.0 407901.6 518214.3 -79965.1 438249.2
2012-13 July 1027.3 17288.8 18316.1 409662.3 521300.1 -82564.7 438735.4 Aug 1027.3 17555.5 18582.8 414420.5 526282.1 -81203.9 445078.2 Sep 1027.3 16994.8 18022.1 420037.5 529960.7 -83969.6 445991.1 Oct 1027.3 17403.8 18431.1 422538.1 540560.6 -84550.7 456009.9 Nov 1027.3 18392.0 19419.3 424817.7 543059.4 -86777.1 456282.3 Dec 1025.7 20501.1 21526.8 432892.2 551611.8 -85066.6 466545.2 Jan 1075.7 20775.4 218511 430429.2 550569.2 -88361.0 462208.2 Feb 1275.7 22539.1 23814.8 433628.5 554799.3 -87684.3 467115.0 Mar 1325.7 23790.9 25116.6 436353.9 559652.5 -88547.4 471105.1 Apr 1330.9 25133.2 26464.1 440218.1 567567.4 -91199.2 476368.2
May 1333.6 26068.2 27401.8 444153.4 574160.2 -92149.5 482010.7 June 1354.5 23667.4 25021.9 452925.1 588281.6 -98140.7 490140.9
Note: Since July 1994, the Scheduled Banks are termed as Deposit Money Banks (DMB) due to inclusion of BSBL. Source: Economic Trends and Bangladesh Bank Bulletin.

Banking and Monetary Statistics
168 Monthly Statistical Bulletin, Bangladesh, June-2013.
10.01 MONETARY SURVEY-CONTD. (Tk. in crore)
End of Period Currency Outside Banks
Demand Deposit
Money Supply (M1)
(14+15)
Time Deposit (Quassi Money)
Broad Money (M2)
(16+17) 14 15 16 17 18
2008-09 2009-10
Jan 41694.8 335020 75332.2 252568.5 328192.3 Feb 41602.4 341954 75936.7 258434.4 127991.1 Mar 41493.5 35935.0 77579.1 260000.1 337579.3 Apr 42330.1 36879.9 79368.3 263672.5 343040.8
May 44578.9 38004.5 82748.6 269477.2 352225.8 Jun 46157.1 41621.8 87988.3 275042.8 363031.1
2010-11 July 47116.4 38870.1 86156.4 278226.7 364383.1 Aug 49819.7 40061.5 90050.0 283049.90 373099.9 Sep 49738.3 41832.8 91808.2 287287.8 379096.0 Oct 48623.3 43979.6 92784.9 292446.4 385231.3 Nov 53225.9 44465.6 97877.2 296774.8 394651.9 Dec 52917.6 46777.6 99918.9 299360.1 399279.0 Jan 52083.9 46017.1 98288.8 303551.7 401840.5 Feb 51918.2 45060.3 97162.7 309622.2 406784.9 Mar 51804.6 48006.8 998114.6 316927.2 416738.6 Apr 52354.0 46001.1 98355.1 322917.0 421272.1
May 53958.6 45508.9 99467.5 329627.0 429094.5 Jun 54795.1 48106.2 102901.3 337418.9 440320.2
2011-12 July 55274.6 48001.5 103276.1 339006.3 442282.4 Aug 64254.0 47173.7 111427.7 342150.9 453578.6 Sep 57154.4 47049.5 104203.9 348892.5 453096.4 Oct 59473.1 48274.6 107747.7 353286.4 461034.1 Nov 58575.3 45512.5 104087.8 360154.4 464242.2 Dec 58145.3 49524.1 107669.4 367540.6 475210.0 Jan 57883.4 46425.2 104308.6 369137.8 473446.4 Feb 57582.5 46248.0 103830.5 376714.7 480545.2 Mar 57972.6 48335.7 106308.3 383764.7 490073.0 Apr 57264.1 48339.7 105603.8 387940.9 493544.7
May 58859.8 47342.1 106201.9 394617.0 500818.9 June 58417.1 51060.4 109477.5 407388.1 516865.6
2012-13 July 60293.0 49862.6 110155.6 412228.5 522384.1 Aug 65430.5 51143.0 116573.5 416336.1 532909.6 Sep 61214.5 49531.0 110745.5 425093.7 535839.2 Oct 72679.9 47678.6 120358.5 430548.7 550907.2 Nov 65445.4 47720.4 113165.8 437289.5 550455.3 Dec 64935.4 53385.8 118321.2 447296.9 565618.1 Jan 65413.0 48124.6 113537.6 448638.8 562176.4 Feb 65963.7 48561.7 114525.4 456837.8 571363.2 Mar 66116.6 51935.9 118052.5 460738.6 578791.1 Apr 66266.0 51951.9 118217.9 466577.7 584795.6
May 67924.6 50058.3 117982.9 473586.4 591569.3 June 67552.9 55736.5 123289.4 479902.3 603191.7
Note: Since July 1994, the Scheduled Banks are termed as Deposit 107669.4Money Banks (DMB) due to inclusion of BSBL. Source: Economic Trends, Bangladesh Bank.

Banking and Monetary Statistics
Monthly Statistical Bulletin, Bangladesh, June-2013. 169
10.2 BANKING STATISTICS (Bangladesh Bank)
(Million Taka)
Period Liabilities Assets
Notes in Circulation
Deposit Foreign Liabilitie
s
Credits Foreign Assets Total Scheduled
Banks Govern-
ment Total ScheduledBanks Government Others
1 2 3 4 5 6 7 8 9 10 11 2008-09 2009-10
Jan 452844 351472 248732 102740 46234 309177 62103 241221 5853 82345 Feb 45454.3 358314 270244 88070 42747 308418 57710 240956 6750 96627 Mar 450755 323586 218227 105359 41710 305658 57906 240956 6796 106316 Apr 458214 346147 241591 84556 42170 302046 57618 240956 3472 98655
May 484337 338201 265677 72524 43208 302540 58847 240141 3558 102101 Jun 499473 298499 298355 144 40717 285817 58521 223350 3946 99494
2010-11 July 508012 314087 293603 20484 44375 285426 58436 223350 3640 102129 Aug 540936 288790 272751 16039 42565 290424 64349 221859 4216 111571 Sep 536306 280227 280067 160 45069 300338 59104 236312 4922 113856 Oct 532016 276348 276184 164 45671 305298 61073 239334 4891 122189
Nov 585545 262549 262395 154 51702 332406 90852 236477 5027 122934 Dec 573182 293349 277982 15367 45392 351975 119695 226303 5977 122519 Jan 568687 286869 264261 22608 48019 356326 120344 226304 9678 121134 Feb 567691 340964 307791 33173 60313 409849 175096 225706 9047 134325 Mar 559789 315539 312566 2973 54241 399446 165163 224974 9309 143378 Apr 567504 321438 321258 180 61078 418983 167186 242264 9533 138506
May 585677 320532 320349 183 59262 441797 178964 253134 9699 137891 Jun 599155 367921 367742 179 56354 496383 166088 320676 9619 148667
201-12 July 608178 352321 352142 179 50306 493690 168021 325669 9808 153741 Aug 697958 352838 352660 178 69144 550862 208975 341887 10514 159214 Sep 618689 342092 341922 171 50132 495771 128373 367398 10845 152697 Oct 651605 339306 339126 180 61397 557633 158431 399202 13015 155248 Nov 636359 345930 345759 171 60182 593453 155417 438036 10975 135235 Dec 631812 352523 352347 176 62907 579615 160630 418985 10969 141891 Jan 630158 268618 268434 184 69027 567005 182241 384764 11626 148590 Feb 626918 277926 277742 184 80449 572163 191330 380833 11623 152559 Mar 630072 280382 280200 182 75062 565984 191005 374979 12966 162799 Apr 631079 276505 276324 181 66857 558287 215829 342458 13325 165810
May 636700 277707 277538 169 70555 55646. 220967 335496 13452 156341 June 642007 326795 326623 172 73079 606886 226274 380612 13545 171965
2012-13 July 665302 305070 304903 167 64843 556180 193008 363172 13512 173569 Aug 712703 312124 311956 168 73239 548305 179032 369273 13584 177994 Sep 675227 314504 314499 5 62507 511572 152976 358596 13685 176323 Oct 791707 318305 318300 5 61917 570157 163848 406309 13729 165974 Nov 708048 343234 343229 5 62796 522331 137287 385044 15005 170128 Dec 717332 342427 342422 5 60725 507679 154477 353202 15239 180285 Jan 711975 340138 340133 5 60739 483457 149859 333598 15275 155349 Feb 720463 340691 340686 5 56883 438321 127090 311231 19103 162268 Mar 735937 335444 335439 5 55216 409089 98128 310961 20727 169174 Apr 728329 350285 350280 5 59022 387695 84212 303483 21071 147944
May 738412 368477 368472 5 59436 402413 90009 312404 21374 152421 June 746336 368213 368034 179 66676 394473 102190 292283 26551 168064
Source : Bangladesh Bank.

Banking and Monetary Statistics
170 Monthly Statistical Bulletin, Bangladesh, June-2013.
10.3 BANKING STATISTICS (Scheduled Banks)
(Million Taka)
Period
Liabilities Deposits (1)
Foreign Exchange Reserve
Borrowing from
Bangladesh Bank
Assets Liquid assets
Total Demand Time Total Cash
Balance with
Bangladesh Bank
Of which Excess
Reserves
2008-09 2603095 302365 2300736 515977 61020 351035 33394 226061 91580 2008-009 2009-10
Jan 2861605 335020 2526585 698818 62103 272098 32704 193461 45933 Feb 2926298 341954 2584344 730749 57710 273638 35799 194618 43221 Mar 2959351 359350 2600001 702296 57806 245814 36973 180776 28065 Apr 3005524 368799 2636725 734667 57618 252428 35258 186006 31164
May 3074817 380045 2694772 703786 58847 242704 36977 182159 23568 Jun 3166646 416218 2750428 747163 58521 246950 35258 187415 24277
2010-11 July 3170968 38870.1 278226.7 746130 58437 319027 45063 223650 60314 Aug 3231114 400615 2830499 764938 64350 317968 40366 222006 55546 Sep 3291206 418328 2872878 761085 59106 324843 44579 225180 55084 Oct 3364260 439796 2924464 790128 61074 316345 50093 220143 46110 Nov 341240.4 44465.6 296774.8 752897 9085.3 298858 58585 208518 31755 Dec 346137.7 46777.6 299360.1 790645 11969.5 353418 50987 239443 62688 Jan 3495688 460171 3035517 738723 141116 335675 52449 231789 51437 Feb 3546625 450403 3096222 772682 175096 366357 43783 252719 69855 Mar 3649343 480068 3169275 745226 165163 380336 43425 262061 75970 Apr 3689181 460011 3229170 789121 167185 388481 38475 269515 81335
May 3751359 455089 3296270 734848 178964 312072 48905 263167 71796 Jun 3855251 481062 3374189 778360 178134 363032 52449 310583 113108
2011-12 July 3870078 480015 3390063 747825 168026 439203 55580 290853 92770 Aug 3893246 471737 3421509 787490 208981 408929 53673 277366 77890 Sep 3959420 470495 3488925 732261 128381 451472 53258 300643 90543 Oct 4015610 482746 3532864 762292 158431 440072 54395 302969 89786 Nov 4056669 455125 3601544 675626 155417 438277 47133 303706 87438 Dec 4170647 495241 3675406 752682 160630 469158 57604 316686 94868 Jan 4155630 464252 3691378 758573 182297 426837 46078 300699 80060 Feb 4229627 462480 3767147 796711 191329 431959 44723 305983 81253 Mar 4321004 483357 3837647 761811 191005 446142 48511 313546 84085 Apr 4362806 483397 3879409 819238 215829 438787 44340 313046 81401
May 4419591 473421 3946170 774269 220968 452618 44234 322074 86310 June 4584485 510604 4073881 848634 216716 558643 56794 373365 128484
2012-13 July 4620911 498626 4122285 863504 193008 438341 51663 346145 100533 Aug 4674791 511430 4163361 934494 179032 470365 50697 334182 85486 Sep 4746247 495310 4250937 918113 152976 487410 56561 341809 89040 Oct 4782273 476786 4305487 1002034 163848 503470 62614 347764 93092 Nov 4850099 477204 4372895 959610 137287 529170 63611 362199 103360 Dec 5006827 533858 4472969 1018175 154477 503043 68376 350755 83912 Jan 4967634 481246 4486388 1035788 149859 571524 71924 382356 117244 Feb 5053995 485617 4568378 1091980 127090 540208 66290 371509 102409 Mar 5126745 519359 4607386 1092487 98128 525284 73114 362711 89459 Apr 5185296 519519 4665777 1155711 84212 553607 75769 376849 100989
May 5236447 500583 4735864 1129870 90009 586206 85601 389699 110906 June 5356388 557365 4799023 1191138 102190 558746 90212 377414 91120

Banking and Monetary Statistics
Monthly Statistical Bulletin, Bangladesh, June-2013. 171
10.03 BANKING STATISTICS-Contd. (Scheduled Bank)
(Million Taka)
Period Credits (2) Credit/Deposit Ratios (percent)
Total Money at Call
Investment Advances Bills Total Credit
Advance and Bills
2008-09 2507686 - 447447 1943088 117151 93 79 2009-10 2706809 - 552150 2013983 140676 85 68 2009-10
Nov 3218955 - 987491 2104871 124593 86 80 Dec 9339682 - 1003414 2204122 132146 86 82 Jan 3463898 22118 1110119 2211018 120643 121 81 Feb 3253086 22361 1012157 2218568 125924 111 80 Mar 2595149 25646 549395 1884215 135893 88 68 Apr 2627208 790 538739 1921378 141491 87 69
May 2651903 440 552208 1956630 143065 86 68 Jun 2706809 - 552150 2013983 140676 85 68
2010-11 July 3140975 - 562080 2428836 150059 104 80 Aug 3190584 - 554551 2485042 150991 104 79 Sep 3285243 - 536678 250750 241058 104 81 Oct 3355280 600 549726 2556709 248254 104 81 Nov 3535264 - 585050 2580431 270457 100 78 Dec 3553656 150 603316 2660258 289932 100 79 Jan 3678034 - 609614 2774761 293659 96 97 Feb 3736242 350 648224 2784983 302685 83 83 Mar 3774864 750 661162 2913153 199799 97 82 Apr 3712496 550 673205 2938970 204771 99 85
May 3881590 7798 701905 2954611 217276 100 82 Jun 3986064 10998 725675 3038968 10423 99 82
2011-12 July 3964609 900 729922 3021797 211990 104 82 Aug 4016357 1015 745045 3051938 218359 103 81 Sep 4082863 700 754487 3118492 209184 103 82 Oct 4165315 1800 798084 3154210 211221 104 81 Nov 4199589 1500 776776 6194145 227168 103 81 Dec 4354533 4080 797380 3324895 228178 104 82 Jan 4418100 2830 853723 3344046 217501 106 81 Feb 4479089 2150 866372 3370352 240215 100 81 Mar 4576242 1200 881295 3460721 233026 105 81 Apr 4616012 1300 899696 3475689 239327 105 80
May 4695037 1320 922730 3535241 235746 105 80 June 4814295 500 934796 3640477 238522 105 81
2012-13 July 4811403 2470 928877 3646425 233631 105 81 Aug 4849195 2500 938710 3673995 233990 105 81
Sep 4932958 3250 948017 3764255 217436 105 81 Oct 4956755 2750 985482 3756846 211677 105 80 Nov 4953448 2500 974280 3751778 224890 104 80 Dec 5094601 2600 993969 3873672 224360 104 80 Jan 5078328 2200 1032059 3819705 224364 105 80 Feb 5096909 3950 1042099 3829483 221377 105 79 Mar 5244816 3950 1141912 3876499 222455 105 78 Apr 5287901 2850 1185656 3875855 223540 104 78
May 5340385 3115 1234422 3876636 226212 104 77 June 5447564 2600 1323905 3922052 199007 103 76
Source: Bangladesh Bank. * corrected.
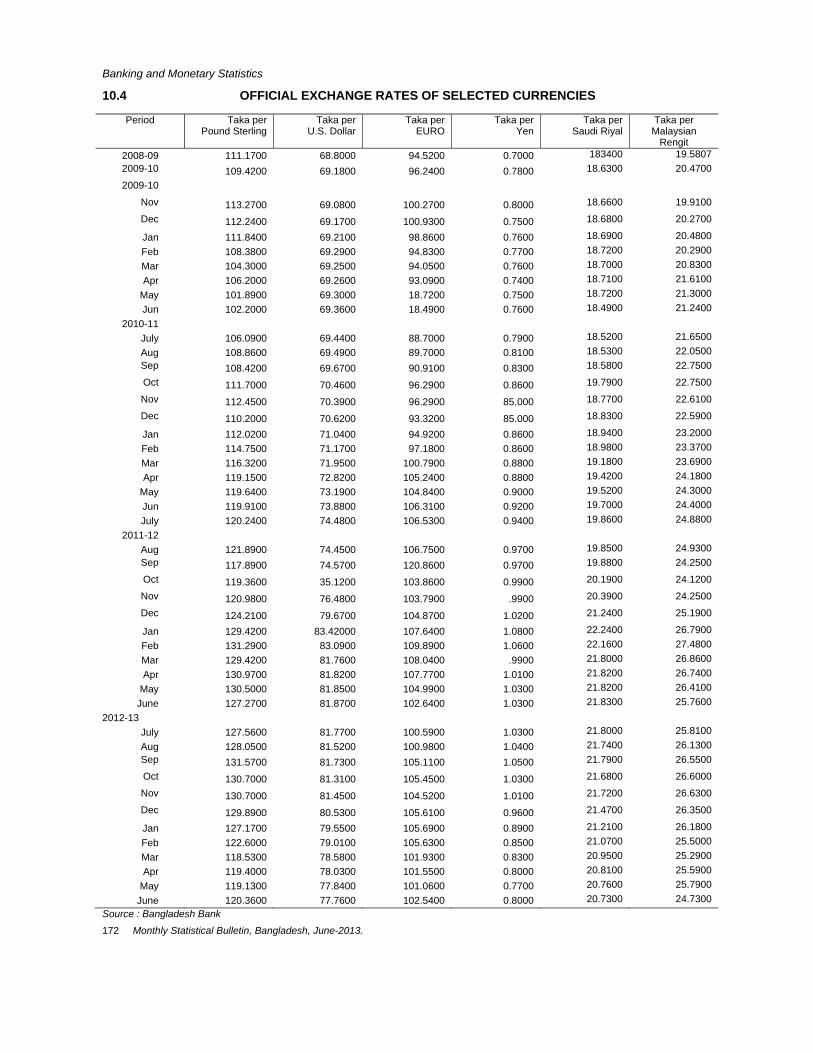
Banking and Monetary Statistics
172 Monthly Statistical Bulletin, Bangladesh, June-2013.
10.4 OFFICIAL EXCHANGE RATES OF SELECTED CURRENCIES
Period Taka per Pound Sterling
Taka per U.S. Dollar
Taka per EURO
Taka per Yen
Taka per Saudi Riyal
Taka per Malaysian
Rengit 2008-09 111.1700 68.8000 94.5200 0.7000 183400 19.5807 2009-10 109.4200 69.1800 96.2400 0.7800 18.6300 20.4700
2009-10
Nov 113.2700 69.0800 100.2700 0.8000 18.6600 19.9100
Dec 112.2400 69.1700 100.9300 0.7500 18.6800 20.2700
Jan 111.8400 69.2100 98.8600 0.7600 18.6900 20.4800 Feb 108.3800 69.2900 94.8300 0.7700 18.7200 20.2900 Mar 104.3000 69.2500 94.0500 0.7600 18.7000 20.8300 Apr 106.2000 69.2600 93.0900 0.7400 18.7100 21.6100
May 101.8900 69.3000 18.7200 0.7500 18.7200 21.3000 Jun 102.2000 69.3600 18.4900 0.7600 18.4900 21.2400
2010-11 July 106.0900 69.4400 88.7000 0.7900 18.5200 21.6500 Aug 108.8600 69.4900 89.7000 0.8100 18.5300 22.0500Sep 108.4200 69.6700 90.9100 0.8300 18.5800 22.7500
Oct 111.7000 70.4600 96.2900 0.8600 19.7900 22.7500
Nov 112.4500 70.3900 96.2900 85.000 18.7700 22.6100
Dec 110.2000 70.6200 93.3200 85.000 18.8300 22.5900
Jan 112.0200 71.0400 94.9200 0.8600 18.9400 23.2000 Feb 114.7500 71.1700 97.1800 0.8600 18.9800 23.3700 Mar 116.3200 71.9500 100.7900 0.8800 19.1800 23.6900 Apr 119.1500 72.8200 105.2400 0.8800 19.4200 24.1800
May 119.6400 73.1900 104.8400 0.9000 19.5200 24.3000 Jun 119.9100 73.8800 106.3100 0.9200 19.7000 24.4000 July 120.2400 74.4800 106.5300 0.9400 19.8600 24.8800
2011-12 Aug 121.8900 74.4500 106.7500 0.9700 19.8500 24.9300 Sep 117.8900 74.5700 120.8600 0.9700 19.8800 24.2500
Oct 119.3600 35.1200 103.8600 0.9900 20.1900 24.1200
Nov 120.9800 76.4800 103.7900 .9900 20.3900 24.2500
Dec 124.2100 79.6700 104.8700 1.0200 21.2400 25.1900
Jan 129.4200 83.42000 107.6400 1.0800 22.2400 26.7900 Feb 131.2900 83.0900 109.8900 1.0600 22.1600 27.4800Mar 129.4200 81.7600 108.0400 .9900 21.8000 26.8600 Apr 130.9700 81.8200 107.7700 1.0100 21.8200 26.7400
May 130.5000 81.8500 104.9900 1.0300 21.8200 26.4100 June 127.2700 81.8700 102.6400 1.0300 21.8300 25.7600
2012-13 July 127.5600 81.7700 100.5900 1.0300 21.8000 25.8100 Aug 128.0500 81.5200 100.9800 1.0400 21.7400 26.1300 Sep 131.5700 81.7300 105.1100 1.0500 21.7900 26.5500
Oct 130.7000 81.3100 105.4500 1.0300 21.6800 26.6000
Nov 130.7000 81.4500 104.5200 1.0100 21.7200 26.6300
Dec 129.8900 80.5300 105.6100 0.9600 21.4700 26.3500
Jan 127.1700 79.5500 105.6900 0.8900 21.2100 26.1800 Feb 122.6000 79.0100 105.6300 0.8500 21.0700 25.5000 Mar 118.5300 78.5800 101.9300 0.8300 20.9500 25.2900 Apr 119.4000 78.0300 101.5500 0.8000 20.8100 25.5900
May 119.1300 77.8400 101.0600 0.7700 20.7600 25.7900 June 120.3600 77.7600 102.5400 0.8000 20.7300 24.7300
Source : Bangladesh Bank

Banking and Monetary Statistics
Monthly Statistical Bulletin, Bangladesh, June-2013. 173
10.5 SAVINGS UNDER VARIOUS SAVINGS SCHEMES (Savings Certificates)
(Taka in crore)
Name of Project
2012-13 Taka in `000 Through Bank Through Saving Bureau Deposit Repayment Net Deposit Repayment Net Deposit Repayment Net
Nett Interest Nett Interest Nett Interest1 2 3 4 5 6 7 8 9 10 11 12 13 14
1 Protirakkha Sanchayapatra
- 50.00 63.00 50.00 - 0.56 0.78 0.56 - 0.12 0.17 0.12
2 5 Years Bangladesh sanchaya patra
2471.00 2200.00 1200.00 271.00 208.35 116.64 60.28 91.71 40.09 43.89 24.17 3.80
3 3 Yeas sanchaya patra
- - - - - - - - - - - -
4 Bonus sanchaya patra
- 1.00 0.04 1.00 - - - - - - - -
5 Half yearly profit based sanchaya patra
- 5.00 1.00 5.00 - - - - - - - -
6 Paribar sanchaya patra
10,000.00 900.00 1200.00 9100.00 154.21 20.44 50.52 133.77 111.07 14.33 29.77 96.74
7 Quarterly profit based sanchaya patra
4500.00 10000.00 2000.00 5500.00 209.86 424.10 56.31 214.24 107.55 260.93 28.00 153.38
8 Deposit sanchaya patra
- - - - - - - - - - - -
9 Pensioner sanchaya patra
3500.00 1500.00 1000.00 2000.00 30.77 59.30 39.15 28.53 18.37 36.39 15.96 18.02
10 Post office savvngs Bank
- - - - - - - - - - - -
(KA) Ordinary 1360.00 1100.00 70.00 260.00 - - - - - - - -
(KHA) Fixed 5000.00 4000.00 1200.00 1000.00 - - - - - - - -
(GA) Bonus Hisab
- - - - - - - - - - -
11 Posta L life Insurance
90.00 27.00 4.00 63.00 - - - - - - - -
Total 26921.00 19783.00 6738.04 7138.00 603.19 621.04 207.04 17.85 277.08 355.66 98.07 78.58
12 Bangladesh prize bond
48.00 35.00 10.00 13.00 1.47 0.28 1.55 1.19 - - - -
13 Wage Earner`s development bond
1000.00 450.00 300.00 550.00 34.95 74.09 82.50 39.14 - - - -
14 3 Years National investment bond
- 700.00 180.00 700.00 - 27.14 6.92 27.14 - - - -
15 U.S Dollar Premium bond
60.00 26.00 12.00 34.00 7.80 4.31 0.80 3.49 - - - -
16 U.S Dollar investment bond
500.00 135.00 90.00 365.00 20.47 12.98 6.14 7.49 - - - -
17 Total 1608.00 1346.00 592.00 262.00 64.69 118.80 97.91 54.11 - - - -
18 Grand Total 28529.00 21129.00 7330.04 7400.00 667.88 739.84 304.95 71.96 277.08 355.66 98.07 78.58

Banking and Monetary Statistics
174 Monthly Statistical Bulletin, Bangladesh, June-2013.
10.5 SAVINGS UNDER VARIOUS SAVINGS SCHEMES-Concld. (Savings Certificates)
(Taka in crore)
Name of Project Through Post Office Investment in June-2013 Investment in July-2012 to June-2013 Taka in
`000 Deposit Repayment Net Deposit Repayment Net Deposit Repayment Net
Nett Interest Nett Interest Nett Interest 15 16 17 18 19 20 21 22 23 24 25 26
Protirakkha Sanchayapatra - 0.17 0.14 0.17 - 0.85 1.09 0.85 - 22.53 23.58 22.53
5 Years Bangladesh sanchaya patra
30.54 15.14 7.65 15.40 278.98 175.67 92.10 103.31 2169.67 2144.34 1067.78 25.33
3 Yeas sanchaya patra - - - - - - - - - - - -
Bonus sanchaya patra - 0.00 0.00 0.00 - 0.00 0.00 0.00 - 0.14 0.50 0.14
Half yearly profit based sanchaya patra
- - - - - - - - - 0.07 0.338 0..07
Paribar sanchaya patra 320.49 32.19 84.17 288.29 585.77 66.96 164.46 518.80 7632.82 1040.25 15534.62 6592.56
Quarterly profit based sanchaya patra
205.89 280.90 44.72 75.01 523.30 965.93 129.03 442.63 6039.81 10286.71 1702.80 4246.90
Deposit sanchaya patra - - - - - - - - - 0.02 - 0.02
Pensioner sanchaya patra 26.84 32.48 21.33 5.64 75.98 128.17 76..44 52.19 1286.52 1693.88 899.79 407.36
Post office savvngs Bank - - - - - - - - - - - -
(Ka) Ordinary 101.75 96.61 4.23 5.14 101.75 96.61 4.23 5.14 1178.93 1157.87 40.26 21.05
(KHA) Fixed 303.68 343.89 140.11 40.20 303.68 343.89 140.11 40.20 3886.43 4601.33 1736.27 714.90
(GA) Bonus Hisab - - - - - - - - - - 0.02 -
Postal life insurance 8.03 7.64 - 0.38 8.03 7.64 - 0.38 88.57 74.46 00.53 14.11
Total 997.22 809.03 302.35 188.19 1877.49 1785.73 607.46 91.76 22282.74 21021.59 7006.54 1261.15
Bangladesh prize bond - - - - 1.47 0.28 1.55 1.19 60.26 40.30 12.71 19.96
Wage erner`s development bond - - - - 34.95 74.09 82.50 39.14 432.37 508.61 697.32 76.24
3 Years natinal investment bond - - - - - 27.14 6.92 27.14 - 728.18 185.64 728.18
U.S Dollar investment bond - - - - 7.80 4.31 0.80 3.49 87.33 55.48 12.99 31.85
U.S Dollar investment bond - - - - 20.47 12.98 6.14 7.49 464.07 199.77 65.44 264.30
Total - - - - 64.69 118.80 97.91 54.11 1044.03 1532.34 974.10 488.31
Grand Total 997.22 809.03 302.35 188.19 1942.18 1904.53 705.37 37.65 23326.77 22553.93 7980.64 772.84
Source: directorate of national savings

Banking and Monetary Statistics
Monthly Statistical Bulletin, Bangladesh, June-2013. 175
10.6 SCHEDULED BANK'S CREDIT BY PUBLIC AND PRIVATE SECTORS (Amount in Lacs of Taka) Sectors 30-09-11 31-12-11 31-03-12 30-06-12 30-09-12 30-12-12
Amount Amount Amount Amount Amount Amount
A. Public sector 72189.78 76626.96 79812.57 86239.30 80565.74 82491.71
Government 9027.98 8306.74 8496.72 9626.20 9930.31 8500.51
Autonomous Semi-Autonomous
bodies 13276.52 15479.91 15420.60 15694.58 15946.32 16358.3
Financial institutions 2411.81 2470.49 2307.47 2835.19 2480.06 4294.10
Other Financial Institution (DMB) 2432.03 2371.41 2511.17 5008.23 2585.58 2558.19
Non-Financial Enterprises 42603.4 45293.80 48267.64 50023.21 46803.61 48078.96
Local Authorities 2064.43 2247.95 2303.19 2596.77 2428.40 2087.13
Others 373.61 456.66 505.78 455.12 391.46 614.52
B. Private Sectors 348041.62 368566.72 378882.28 400167.97 423475.30 449875.11
Agriculture & Fishing Professionals 13679.32 14413.34 14011.36 14825.47 16026.07 15213.89
Manufacturing Companies 14244.20 23129.23 24618.90 27912.50 28684.60 29551.39
Commerce & Trade 73858.02 81628.56 79967.26 75180.78 82257.12 94596.57
Transport Construction &Storage 3261.57 2694.95 2743.34 2745.16 3262.31 2601.94
Trust Funds and non-profit
Organisations 4252.98 3542.85 3480.74 4480.34 5775.76 5070.10
Professional and self employed
Persons 26074.19 29030.84 27544.60 27478.35 26573.00 25687.68
Financial institutions 16103.78 23925.59 23434.56 1834176 18198.86 21645.84
Others n.i.e. 196567.56 190201.36 203081.52 229203.61 242697.58 255507.70
Grand Total 420231.40 445193.68 458694.85 486407.27 504041.04 532366.82
Source : Bangladesh Bank

Banking and Monetary Statistics
176 Monthly Statistical Bulletin, Bangladesh, June-2013.
10.7 SCHEDULED BANK'S CREDIT BY ECONOMIC PURPOSE (Amount in Lacs of Taka) Sectors 30-09-11 31-12-11 31-03-12 30-06-12 30-09-12 30-12-12 Amount Amount Amount Amount Amount Amount
Agriculture, Fishing and Forestry 19140.14 19577.77 18930.81 20930.18 20933.85 19909.82 Industry other than working (capital financing) 68502.70 73101.57 75868.63 79625.96 77482.84 83861.05 Construction 25934.05 28527.43 31871.91 32034.40 33981.34 37333.05 Water Works & Sanitary Services 100.06 106.22 102.23 154.91 122.31 117.93 Trade 121210.14 130826.51 140453.45 149134.77 153604.21 158520.82 Storage 787.90 929.71 837.59 1000.91 1007.37 1035.10 Transport and Communications 5278.60 7180.08 7860.25 7974.07 9714.16 9281.85 Working Capital Financing 49707.94 19532.78 49347.95 50006.71 55602.95 54908.54 Miscellaneous Services 38375.95 40740.37 40834.52 45071.34 45990.11 45656.94 Grand Total 329037.48 350522.44 366107.34 385933.25 398439.14 410625.1 Source : Bangladesh Bank

Stock Market
Monthly Statistical Bulletin, Bangladesh, June-2013. 177
CHAPTER 11: STOCK MARKET 11.1 HIGHLIGHT OF STOCK MARKET FOR JUNE, 2013 Sl.No DSE Main Board June’ 13
1. Total Number of Listed Securities 525 2. Total Number of Companies 251 3. Total Number of Mutual Funds 42 4. Total Number of Debentures 8 5. Total Number of Treasury Bonds 221
11.2 DSE MARKET SCORER BOARD (N0. In mn)
Sl.No DSE Main Board June’13
1. Total Number of Shares, Mutual Fund Certificates & Debentures of All Listed Securities 42287 2. Total Number of Shares of All Listed Companies 38431 3. Total Number of Certificates of All Listed Mutual Funds 3844 4. Total Number of Debentures of All Listed Debentures. 409 5. Total Number of Gov. T-Bonds 5485 6. Total Number of All Listed CorporateBonds 6534
11.3 DSE MARKET SCORER BOARD
Sl.No DSE Main Board Tk mn US$ mn 1.
Total Issued Capital of : All Listed Securities
983594 12649.18
2. Alll Companies 389102 5004 3. All Mutual Funds 38437 494 4. All Debentures 140 2 5. All Govt. Bonds 549381 7065 6. Listed Corporate Bonds 6534 84 Total Market Capitalisation of : 1. All Listed Securities 2527386 32503 2. All CompaniesShares 1929490 24814 3. All Mutual Funds 41308 531 4. All Debentures 576 7 5. All Listed Govt Bonds 549381 7065 6. All Corporate Bonds 6631 85 7. Conversion Rate 77.76
11.4 DSE PERFORMANCE-JUNE –2013
Sl.No June’13 May’13 Change % Month High Month Low
1. DSE All Share Price Index (30th June) 4104.65 3878.07 5.84 4259.22 3882.81 2. General Index (as of 30th June) 4385.77 4100.51 6.96 4477.09 4133.60 3. DSE 30 (as of 30th June) 1532.55 1426.75 7.42 1570.35 1443.91 4. Total Turnover Value (TK mn) 132366.22 60015.87 120.55 10722.63 4317.43 5. Total Turnover Value (US$ mn) 1702.24 771.11 120.75 6. Total Turnover Volume (in `000) 3170098 1825014 73.70 238292 104697 7. Market Capitalisation (Tk bn) 2530.25 2384.09 6.13 2579.06 2401.38 8. Market Capitalisation (US$ bn) 32.54 30.63 6.23 - - 9. Daily Average Turnover (Tk mn) 6618.31 3000.79 120.55 - - Exponential Moving Average (as of 30th June) 1. General Index 3540.81 3213.24 10.19 - - 2. DS 30 1240.39 1118.28 10.92 - - 3. DSE All Share Price Index 3341.82 3042.05 9.85 - - Relative Strength Index (as of 30th June) 1. General Index 56.62 60.89 7.02 - - 2. DSE 30 in DEX 58.21 67.20 13.39 - - 3. DSE All Share Price Index 52.77 63.53 16.95 - - 4. Market P/E x (as of 30th June) 14.60 12.06 21.06 - - 5. Yield as of (as of 30th June) 3.60 4.00 10.00 - - 6. Trading Days 20 20 - - 7. 1 US$ 77.76 77.83 - - Source: Dhaka Stock Exchange LTD.-

Stock Market
178 Monthly Statistical Bulletin, Bangladesh, June-2013.
11.5 MARKET CAPITALISATION (VALUE) OF ORDINARY SHARES (Taka in Crores)
COMPANY GROUPS
Period Banks Financial Institutions
Mutual Funds
Engineering Food &
Allied Products
Fuel & Power
Jute Industries
Textile Industries
1 2 3 4 5 6 7 8
2008-09 - 2009-10 -
Jan 45376.70 18239.30 2884.40 6856.20 4172.10 20313.80 66.20 5055.90 Feb 42344.90 17932.30 3149.40 6856.20 4172.10 20313.80 66.20 5055.90 Mar 41210.30 17336.90 2748.40 6927.40 4082.20 20202.00 64.30 5259.60 Apr 41896.80 20104.60 2714.30 72077.10 4064.60 26709.90 66.80 5144.10
May 51890.30 24543.60 2737.40 8868.40 309.90 29066.90 62.20 6066.60 Jun 64408.30 28352.90 2723.10 9507.80 4335.10 30142.70 61.10 6098.00
2010-11 July 63278.10 29981.00 2869.50 10819.80 5244.30 31285.70 68.20 6920.40 Aug 62251.10 32405.10 3209.10 12306.50 5389.60 31791.80 80.80 11246.60 Sep 66115.20 31512.00 3293.10 13547.50 5670.70 32952.70 81.30 11134.30 Oct 76538.60 38724.90 3448.00 13509.60 6212.80 37326.70 81.90 11182.80 Nov 92262.40 39460.40 3651.30 12419.70 6514.60 32057.90 134.30 12579.20 Dec 1000096.90 39053.40 4445.80 13727.50 6467.60 29435.40 105.90 12554.80 Jan 86303.90 35811.00 3977.40 14224.80 6081.60 29261.70 88.10 11357.30 Feb 56161.80 26022.20 3047.70 8917.80 4448.90 20712.00 56.30 7298.30 Mar 62712.10 30689.90 3375.70 12194.40 5927.80 26740.80 101.60 10102.70 Apr 57913.00 27772.60 3432.70 11802.30 5356.30 24949.40 97.40 9403.80
May 58872.10 26431.90 3506.00 11748.90 5343.30 25165.30 85.50 7840.40 June 68061.90 28715.50 3595.50 12054.80 5342.00 28931.40 79.00 8229.20
2011-12 July 72183.30 28853.00 4110.10 12840.70 5303.60 31077.60 79.40 9648.90 Aug 71659.60 27461.90 3491.50 12078.70 5181.00 29232.90 78.40 7159.90 Sep 66763.20 23296.60 3573.30 11425.10 5320.20 29002.10 84.80 6541.90 Oct 61625.10 18379.00 3176.10 8972.80 4785.90 25265.60 63.90 4776.80 Nov 65656.10 19397.60 3259.20 9324.40 5094.20 25395.10 58.70 5252.70 Dec 66400.30 19035.80 3301.30 10187.20 5628.40 23854.10 79.20 5630.00 Jan 52028.30 15223.10 2951.50 7929.10 4893.10 18719.40 62.70 4090.10 Feb 56127.00 16461.80 3069.60 8774.90 542260 22660.10 59.30 4381.90 Mar 57200.30 18243.50 3735.40 9025.50 5172.10 26173.20 60.50 5191.20 Apr 55267.80 20464.00 3692.20 10020.70 5089.50 27002.50 59.00 5085.90
May 53306.60 19672.10 3646.30 8978.30 5078.30 24421.20 52.40 4510.00 June 51238.60 18987.80 3588.10 8631.40 5117.60 24813.00 49.80 4585.00
2012-13 July 46453.90 15924.40 3454.80 7770.30 5202.60 22988.00 45.20 4300.70 Aug 48830.10 17415.80 3336.50 8837.90 5632.60 26747.90 51.00 5098.00 Sep 50612.70 1823.80 4344.10 3134.20 6110.70 26978.30 61.00 6748.90 Oct 50071.30 16973.20 4380.90 8589.60 6315.00 27012.20 56.60 6168.30 Nov 47241.30 15497.70 4104.50 7614.00 6756.60 23154.70 58.50 5904.10 Dec 4903830 15413.50 3973.00 7644.40 6491.90 21779.80 44.20 6592.30 Jan 49251.80 15296.50 3660.80 7600.20 6677.90 22814.40 43.00 6486.40 Feb 45900.40 15150.80 3415.90 7152.40 6848.60 24365.40 40.50 6705.30 Mar 41346.70 12711.00 3113.00 6228.50 6945.00 22271.30 33.80 5505.20 Apr 38154.00 11818.20 3207.10 6269.00 7126.90 22612.80 43.50 5529.40
May 41767.80 1395.70 3809.10 7437.70 8024.00 25329.50 51.70 6008.00 June 41710.10 16994.60 4130.80 9567.00 8581.60 29036.70 49.50 6418.50
Note: Market Capital station have been revised due to change in groups. Source: Bangladesh Bank.

Stock Market
Monthly Statistical Bulletin, Bangladesh, June-2013. 179
11.5 MARKET CAPITALISATION (VALUE) OF ORDINARY SHARES-CONTD. (Taka in Crores)
Period
C O M P A N Y G R O U P S
Pharma ceuticals Chemicals
Paper & Printing
Real Estate & Services
Cements & Cera
mics
Insurance Company
Telecommu- nication
Miscellaneous Aggregate
Mar ket Capital
8 9 10 11 12 13 14 15
2009-10 Jan 16326.50 119.10 2790.50 5572.70 8841.80 45419.60 181348.10 Feb 15560.10 96.30 2585.80 4733.70 8370.40 57485.80 188722.90 Mar 16259.90 123.90 3223.60 4815.40 8239.30 48907.90 9515.90 188917.00 Apr 16269.70 154.30 3407.70 4758.60 9571.70 43844.20 9873.60 195858.00
May 16978.70 102.60 3073.00 5124.10 10370.60 37322.30 9580.90 210097.00 Jun 16282.40 85.90 2684.70 5476.90 10591.10 31826.60 15064.20 227640.80
2010-11 July 17217.20 109.80 3095.40 6591.70 10388.90 34891.80 17545.70 240307.50 Aug 18579.80 130.20 3863.60 7146.20 12854.30 34500.20 18298.30 254053.20 Sep 21199.10 137.80 3886.60 8403.20 13935.00 32326.20 18474.00 262668.70 Oct 21266.80 123.30 3578.80 7985.50 15836.50 31313.50 18463.60 285593.30 Nov 22400.80 127.10 3504.90 7745.50 18840.30 31691.50 18822.50 302202.40 Dec 20574.90 126.20 3018.00 7299.10 18268.50 33190.40 18124.50 306519.10 Jan 19796.60 108.50 2711.40 6626.60 15915.40 32042.60 1748927 281796.17 Feb 15041.90 66.90 1624.20 4381.60 10256.80 18890.70 11351.40 188278.50 Mar 19045.00 109.30 2556.60 6011.30 14534.30 23481.70 15164.00 232747.20 Apr 18556.20 107.50 1831.50 5440.50 14532.00 21226.70 14639.57 217061.47
May 16949.90 95.60 1865.90 6836.80 13486.70 20052.00 11772.87 210053.17 Jun 18080.80 90.60 1871.80 7703.00 14010.40 22131.40 13804.30 232701.60
2011-12 July 19903.40 104.30 2191.60 8070.40 15053.90 25601.70 15424.50 250446.40 Aug 17533.50 91.80 1913.50 8585.20 13641.70 24264.90 15165.10 237539.60 Sep 19634.300 80.00 1878.50 8127.90 12759.10 22090.90 14626.97 22520.87 Oct 16757.20 61.90 1391.20 5176.20 10668.70 21510.30 12123.30 194734.00 Nov 17282.80 59.90 1466.10 7075.90 10890.50 122171.90 13350.94 205736.04 Dec 16976.80 77.30 1449.70 6987.70 11102.70 22077.40 12756.60 205544.50 Jan 14059.50 60.60 1090.40 5648.80 9408.80 20997.20 10096.20 1672058.80 Feb 15151.50 62.50 1295.50 6229.70 10247.30 21618.30 11176.00 182738.00 Mar 16369.40 61.00 1450.60 7122.50 10693.00 25885.30 12265.48 198648.98 Apr 17717.60 51.70 1346.00 7875.80 11330.20 28990.90 12202.70 206196.80
May 15573.70 49.80 1270.20 8382.40 11177.70 27870.20 10667.10 194656.30 June 16465.80 48.80 1187.30 8386.30 10716.90 28924.30 10503.38 193244.08
2012-13 July 15568.20 41.20 1032.10 7501.60 9829.70 28529.90 11142.88 179785.48 Aug 14209.60 46.20 1167.50 8229.80 10470.60 25815.40 13260.70 189149.60 Sep 16217.70 46.00 1182.00 8320.80 10439.20 2417030 14471.15 197068.85 Oct 15782.90 39.10 1093.00 8076.60 10122.70 25402.20 14748.20 194831.80 Nov 14839.90 38.40 889.10 7403.10 9495.20 24856.00 13828.09 181681.19 Dec 14982.90 36.30 891.50 7363.70 9815.50 25362.70 14099.07 183529.07 Jan 15395.10 36.90 823.30 7707.40 10215.20 24402.80 14134.10 184545.20 Feb 15362.60 35.00 1059.10 7362.90 9832.80 21515.90 13404.52 178153.02 Mar 16596.00 31.90 750.70 7447.80 8841.10 21385.90 11441.60 164649.50 Apr 16494.70 32.90 672.40 7206.80 8537.70 20966.00 10958.63 159630.03
May 17152.30 35.90 857.10 8108.40 10008.30 25326.70 11432.15 179299.35 June 19754.10 32.90 954.10 9156.10 10675.20 27168.20 13513.61 197743.01

Stock Market
180 Monthly Statistical Bulletin, Bangladesh, June-2013.
11.6 INDEX OF ORDINARY SHARES OF COMPANIES LISTED IN THE DHAKA STOCK EXCHANGE LTD.
(BASE: 1994-95=100)
End of Period General Index Turn Over (Tk) Total Issused Capital
Total Number of Companies
1 2 3 4 5 2009-10
Jan 5367.11 26289.94 16780.50 259 Feb 5560.56 24998.21 17111.10 263 Mar 5582.33 17511.60 18063.10 265 Apr 5654.88 19130.32 18596.10 267
May 6107.81 38623.84 19448.00 267 Jun 6153.68 38773.37 21744.60 273
2010-11 July 6342.76 32276.93 21852.80 272 Aug 6657.97 39443.81 22669.20 274 Sep 7097.38 31256.81 22066.50 274 Oct 7957.12 46800.90 22639.00 248 Nov 8602.44 47171.72 22989.30 251 Dec 8290.41 38717.41 24410.60 251 Jan 7484.23 18696.92 24885.70 263 Feb 5203.08 11488.71 24625.40 265 Mar 6352.10 21712.51 26511.20 262 Apr 6050.85 15628.44 27267.40 263
May 5758.26 9221.13 29034.30 266 Jun 6117.23 13465.03 30104.50 267
2011-12 July 6459.62 29817.30 30411.60 268 Aug 6212.00 8864.87 30108.20 267 Sep 5910.20 7057.25 30567.20 268 Oct 5036.50 6999.04 31722.20 271 Nov 5268.55 6951.43 32676.90 272 Dec 5257.61 6152.98 32231.50 272 Jan 4153.96 8877.05 32434.80 273 Feb 4695.41 5724.37 33218.20 274
Mar 4990.32 8412.31 35463.20 275 Apr 5098.90 17660.27 36439.20 278
May 4734.33 6691.82 37666.20 279 June 4572.88 3936.38 38410.90 279
2012-13 July 4159.17 4056.41 39020.40 284 Aug 4446.87 5727.66 39037.30 284 Sep 4544.41 18761.51 39243.20 284 Oct 4493.92 10649.53 39367.40 284 Nov 4210.58 5538.07 38881.20 284 Dec 4219.31 4080.77 40035.50 286 Jan 4230.69 3895.75 40083.70 286 Feb 4047.23 7211.71 40282.30 288
Mar 3722.41 3330.57 41032.40 292 Apr 3618.49 3226.42 41696.40 293
May 4100.51 6001.57 42307.40 293 June 4385.77 13236.59 43407.30 296
Note: Indices have been revised considering 1994-95 base year instead of 1986-87. Source: Bangladesh Bank.
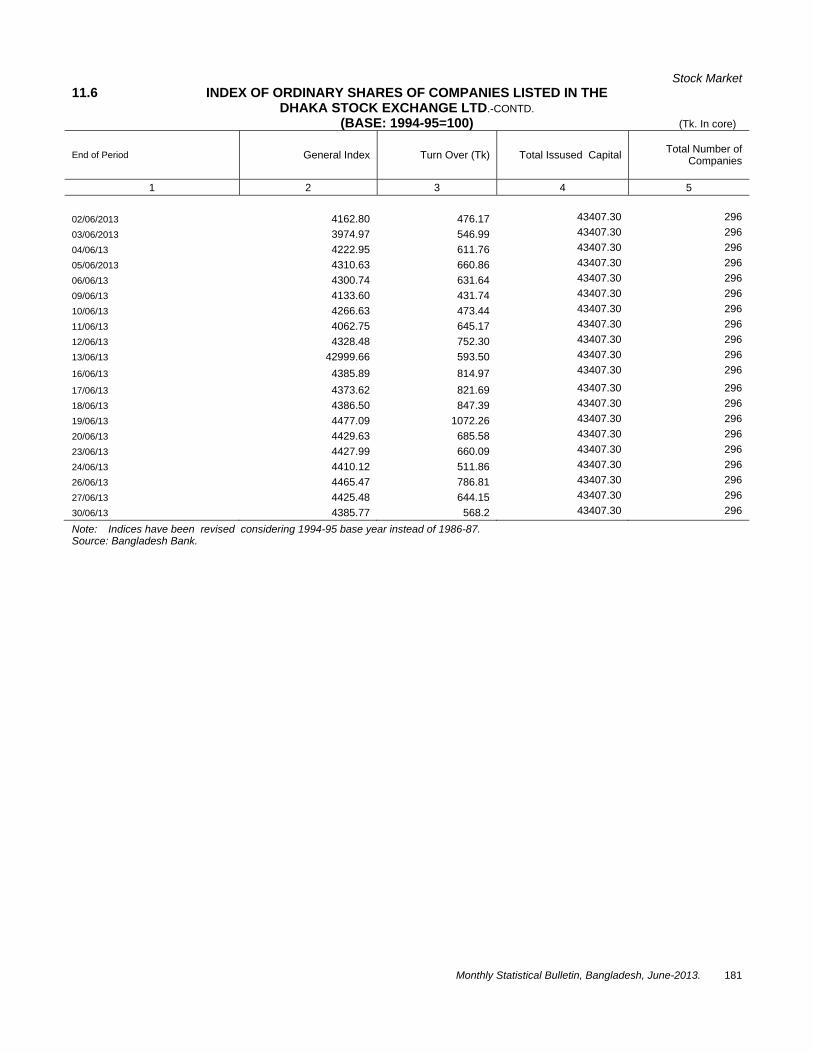
Stock Market
Monthly Statistical Bulletin, Bangladesh, June-2013. 181
11.6 INDEX OF ORDINARY SHARES OF COMPANIES LISTED IN THE DHAKA STOCK EXCHANGE LTD.-CONTD. (BASE: 1994-95=100) (Tk. In core)
End of Period General Index Turn Over (Tk) Total Issused Capital Total Number of Companies
1 2 3 4 5
02/06/2013 4162.80 476.17 43407.30 296 03/06/2013 3974.97 546.99 43407.30 296 04/06/13 4222.95 611.76 43407.30 296 05/06/2013 4310.63 660.86 43407.30 296 06/06/13 4300.74 631.64 43407.30 296 09/06/13 4133.60 431.74 43407.30 296 10/06/13 4266.63 473.44 43407.30 296 11/06/13 4062.75 645.17 43407.30 296 12/06/13 4328.48 752.30 43407.30 296 13/06/13 42999.66 593.50 43407.30 296
16/06/13 4385.89 814.97 43407.30 296
17/06/13 4373.62 821.69 43407.30 296 18/06/13 4386.50 847.39 43407.30 296 19/06/13 4477.09 1072.26 43407.30 296 20/06/13 4429.63 685.58 43407.30 296 23/06/13 4427.99 660.09 43407.30 296 24/06/13 4410.12 511.86 43407.30 296 26/06/13 4465.47 786.81 43407.30 296 27/06/13 4425.48 644.15 43407.30 296 30/06/13 4385.77 568.2 43407.30 296
Note: Indices have been revised considering 1994-95 base year instead of 1986-87. Source: Bangladesh Bank.

Foreign Assistance
182 Monthly Statistical Bulletin, Bangladesh, June-2013.
CHAPTER 12: FOREIGN ASSISTANCE 12.1 SUMMARY OF COMMITMENT AND DISBURSEMENT (1990-91 TO 2005-06) (Million US Dollar)
Year Opening Pipeline
Cancell/ Trans.a
Commitment Total Available
Disbursement Exrate Abjust.a
Disb/ Avlbl Grant Loan Total Grant Loan Total
1 2 3 4 5 6 7 8 9 10 11 12=10/7%
1990-91 5915.160 135.657 485.064 885.280 1370.344 7149.847 831.463 901.112 1732.575 126.852 24.2
1991-92 5290.420 104.557 1140.428 775.182 1915.610 7101.473 817.250 794.218 1611.468 489.851 22.7
1992-93 5979.856 65.732 734.548 540.000 1274.548 7188.672 818.250 856.758 1675.008 201.301 23.3
1993-94 5312.363 330.472 463.850 1946.334 2410.184 7392.075 710.091 848.552 1558.643 76.403 21.1
1994-95 5914.939 188.621 860.905 751.307 1612.212 7338.530 890.121 848.970 1739.091 631.176 23.7
1995-96 6230.617 143.828 863.840 415.735 1279.575 7366.364 677.489 766.261 1443.750 491.377 19.8
1996-97 5431.237 722.771 842.250 818.867 1661.117 6369.583 736.069 745.161 1481.230 191.261 23.3
1997-98 4697.092 76.724 584.569 1206.146 1790.715 6144.083 502.842 748.531 1251.373 264.180 19.5
1998-99 4895.530 37.225 861.879 1786.637 2648.516 7506.821 669.346 866.711 1536.057 8.812 20.5
1999-00 5979.575 128.947 619.248 855.779 1475.027 7325.655 726.079 861.869 1587.948 14.633 21.7
2000-01 5752.268 210.604 937.729 1115.111 2052.840 7594.504 504.147 864.657 1368.804 367.745 18.0
2001-02 5857.955 117.826 401.769 476.975 878.744 6618.873 478.806 963.428 1442.234 272.847 21.8
2002-03 5450.047 15.610 383.298 1309.273 1692.571 7127.008 510147 1074.875 1585.022 179.848 22.2
2003-04 5738.109 8.075 886.778 036.302 1923.080 7653.114 338.452 694.980 1033.432 318.190 13.5
2004-05 6911.062 277.480 302.917 1277.790 1580.707 8214.289 244.229 1244.218 1488.447 31.302 18.1
2005-06 6694.542 256.439 628.381 1158.979 1787.360 8225.463 500.542 1067.094 1567.636 31.302 19.1
Total 145180494
2908240 23200.791 30734.059 53934.850 196207.104 20056.725 24773.544 44830.269 582.664 22.8
Notes: a-/ Cancellation / Transfer and Exchange Rate Adjustment were introduced from 1984-85. Exchange Rate Adjustment figure is not available separately for 1984-85 to 1988-89 and is include within Cancellation/Transfer amount- 135.657. Source : Economic Relations Division, Ministry of Fianance.

Standard Conversion Factors
Monthly Statistical Bulletin, Bangladesh, June-2013. 183
CHAPTER 13 : STANDARD CONVERSION FACTORS 13.1 STANDARD CONVERSION FACTORS
SL. NO. Unit Unit
Multiply By To Convert Col. 2 into Col. 3 To Convert Col. 3 into Col.2
1 2 3 4 5 1. Acre Bigha 3.025 0.3305785 2. Acre Decimal 100 0.01 3. Acre Hectare 0.4046856 2.471054 4. Acre Katha 60.5 0.0165289 5. Acre Sq. Metre 4046.856422 0.0002471054 6. Acre Sq. Mile 0.0015625 640 7. Acre Sq. Yard 4840 0.0002066 8. Acre Hectare 0.01 100 9. Acre Sq. Metre 100 0.01 10. Acre Decimal 2.471054 0.4046856 11. Bale (Cotton) Long Ton 0.175 5.7142857 12. Bale ( " ) Maund 4.763889 0.2099125 13. Bale ( " ) Metric Ton 0.17780821 5.6240372 14. Bale ( " ) Pound 392 0.0025510 15. Bale ( " ) Quintal 1.778082 0.56240372 16. Bale( " ) Short Ton 0.196 5.1020408 17. Bale ( Jute ) Long Ton 0.1785714 5.6 18. Bale( " ) Maund 4.861111 0.20571438 19. Bale( " ) Metric Ton 0.1814369 5.511557 20. Bale( " ) Pound 400 0.0025 21. Bale( " ) Quintal 1.8143695 0.5511557 22. Bale( " ) Short Ton 0.2 5 23. Bigha Acre 0.3305785 3.025 24. Bigha Are 13.378038 0.0747493 25. Bigha Hectare 0.13378038 7.4749378 26. Bigha Sq. Metre 1337.803776 0.0007474938 27. Bigha Sq. Yard 1600 0.000625 28. Centimetre Foot 0.0328084 30.48 29. Centimetre Inch 0.3937008 2.54 30. Centimetre Metre 0.01 100 31. Centimetre Millimetre 10 0.1 32. Chain Foot 66 0.0151515 33. Chain Furlong 0.1 10 34. Chain Kilometre 0.2201168 49.709695 35. Chain Metre 20.1168 0.0497097 36. Chain Mile 0.0125 80 37. Chain Yard 22 0.0454545 38. Chhattack (Weight) Gram 58.3190188 0.017147065 39. Chhattack ( " ) Kilogram 0.05831902 17.147065 40. Chhattack ( " ) Ounce 2.0571429 0.4861111 41. Chhattack (Area) Are 0.04180637 23.919801 42. Chhattack ( " ) Sq. Metre 4.180637 0.239198 43. Chhattack ( " ) Sq. Yard 5 0.2 44. Cubic Centimetre(Area) Cubic Inch 0.06102374 16.387064 45. Cubic Centimetre ( " ) Cubic Metre 0.000001 1000000 46. Cubic Foot (Cft.) Cubic Metre 0.02831685 35.3146667
47. Cubic Inch Cubic Centimetre 16.387064 0.06102374
48. Cubic Metre Cubic Foot 35.3146667 0.02831685 49. Decimal Acre 0.01 100

Standard Conversion Factors
184 Monthly Statistical Bulletin, Bangladesh, June-2013.
13.1 STANDARD CONVERSION FACTORS -Contd.
SL. NO. Unit Unit
Multiply By
To Convert Col. 2 into Col. 3 To Convert Col. 3 into Col.2 1 2 3 4 5
50. Decimal Acre 0.4046856 2.471054 51. Decimal Bigha 0.03025 33.057851 52. Decimal Hectare 0.0040468564 247.105381 53. Decimal Katha 0.605 1.6528926 54. Decimal Sq. Foot 435.6 0.00229568 55. Decimal Sq. Metre 40.468564 0.024710538 56. Foot Centimetre 30.48 0.0328084 57. Foot Inch 12 0.0833333 58. Foot Metre 0.3048 3.2808399 59. Foot Yard 0.33333 3 60. Furlong Chain 10 0.1 61. Furlong Foot 660 0.0015155 62. Furlong Kilometre 0.201168 4.97097 63. Furlong Metre 201.168 0.00497097 65. Furlong Mile 0.125 8 66. Furlong Yard 220 0.0045454 66. Gallon ( Imperial ) Litre 4.546087 0.2199694 67. Gallon ( " ) U.S. Gallon 1.2009524 0.8326725 68. Gallon (U.S.) Gallon (Imperial) 0.8326725 1.2009524 69. Gallon (U. S.) Litre 3.785402 0.26417277 70. Gram Chhattack 0.017147065 58.3190188 71. Gram Ounce 0.035273962 28.349523 72. Gram Tola 0.08573532 11.663804 73. Hectare Acre 2.471054 0.4046856 74. Hectare Sq. Kilometre 0.01 100 75. Hectare Sq. Metre 10000 0.0001 76. Hectare Sq. Mile 0.0038610216 258.998811 77. Hundred weight (Cwt.) Kilogram 50.802346 0.01968413 78. Hundred weight ( " ) Long Ton 0.05 20 79. Hundred weight ( " ) Maund 1.361111 0.7346939 80. Hundred weight ( " ) Metric Ton 0.05080235 19.68413 81. Hundred weight ( " ) Pound 112 0.0089285 82. Hundred weight ( " ) Quintal 0.5080235 1.968413 83. Hundred weight ( " ) Short Ton 0.056 17.857143 84. Inch Centimetre 2.54 0.3937008 85. Inch Foot 0.0833333 12 86. Inch Metre 0.0254 39.370079 87. Inch Millimetre 25.4 0.03937008 88. Katha Decimal 1.6528926 0.605 89. Katha Sq. Foot 720 0.0013888 90. Katha Sq. Metre 66.8901888 0.0149498756 91. Katha Sq. Yard 80 0.0125 92. Kilogram Hundred weight 0.01968413 50.802346 93. Kilogram Long Ton 0.0009842065 1016.04692 94. Kilogram Maund 0.02679229 37.324172 95. Kilogram Metric Ton 0.001 1000 96. Kilogram Pound 2.2046226 0.45359237 97. Kilogram Quintal 0.01 100 98. Kilogram Seer 1.0716916 0.9331043 99. Kilometre Short Ton 0.0011023113 907.184749 100. Kilometre Chain 49.709695 0.0201168

Standard Conversion Factors
Monthly Statistical Bulletin, Bangladesh, June-2013. 185
13.1 STANDARD CONVERSION FACTORS-Contd. SL. NO. Unit Unit
Multiply By To Convert Col. 2 into Col.3 To Convert Col. 3 into Col.2
1 2 3 4 5 101. Kilometre Furlong 4.97097 0.201168 102. Kilometre Metre 1000 0.001 103. Kilometre Mile 0.6213712 1.609344 104. Kilometre Yard 1093.613298 0.0009144 105. Litre Cubic Centimetre 1000.028 0.000999972 106. Litre Gallon (Imperial) 0.2199694 4.546087 107. Litre Gallon (U.S.) 0.26417277 3.785402 108. Long Ton or British Ton Hundred wieght 20 0.05 109. Long Ton ( " ) Kilogram 1016.04692 0.0009842065 110. Long Ton ( " ) Maund 27.222222 0.0367347 111. Long Ton ( " ) Metric Ton 1.0160469 0.9842065 112. Long Ton ( " ) Pound 2240 0.0004464 113. Long Ton ( " ) Quintal 10.160469 0.09842065 114. Long Ton ( " ) Short Ton or U.S. Ton 1.12 0.8928571 115. Maund Hundred weight 0.7346939 1.361111 116. Maund Kilogram 37.324172 0.02679229 117. Maund Long Ton 0.0367347 27.222222 118. Maund Metric Ton 0.037324172 26.792289 119. Maund Pound 82.285714 0.012152778 120. Maund Quintal 0.3732417 2.679229 121. Maund Short Ton 0.041142857 24.305556 122. Metre Centimetre 100 0.01 123. Metre Chain 0.0497097 20.1168 124. Metre Foot 3.2808399 0.3048 125. Metre Inch 39.370079 0.0254 126. Metre Yard 1.0936133 0.9144 127. Metric Ton or Tonne Hundred weight 19.68413 0.05080235 128. Metric Ton " Kilogram 1000 0.001 129. Metric Ton " Long Ton 0.9842065 1.0160469 130. Metric Ton " Maund 26.792289 0.037324172 131. Metric Ton " Pound 2204.6226 0.0004535924 132. Metric Ton " Quintal 10 0.1 133. Metric Ton " Short Ton 1.102311 0.907185 134. Mile Chain 80 0.0125 135. Mile Furlong 8 0.125 136. Mile Kilometre 1.609344 0.6213712 137. Mile Metre 1609.344 0.0006213712 138. Mile Yard 1760 0.0005681 139. Millimetre Centimetre 0.1 10 140. Millimetre Inch 0.03937008 25.4 141. Millimetre Metre 0.001 1000 142. Ounce Gram 28.349523 0.035273962 143. Ounce Pound 0.0625 16 144. Ounce Tola 2.4305556 0.41142857 145. Pint Gallon (Imperial) 0.125 8 146. Pint Litre 0.568261 1.759755 147. Pound Gram 453.592374 0.0022046226 148. Pound Hundred weight Divide by 112 112 149. Pound Kilogram 0.45359237 2.2046226 150. Pound Long Ton Divide by 2240 2240

Standard Conversion Factors
186 Monthly Statistical Bulletin, Bangladesh, June-2013.
13.1 STANDARD CONVERSION FACTORS—Contd. SL. NO. Unit Unit
Multiply By To Convert Col. 2 into Col. 3 To Convert Col. 3 into Col.2
1 2 3 4 5 151. Pound Metric Ton 0.0004535924 2204.6226 152. Pound Ounce 16 0.0625 153. Pound Seer 0.4861111 2.057143 154. Pound Short Ton 0.0005 2000 155. Quintal Hundred weight 1.968413 0.5080235 156. Kilogram Kilogram 100 0.01 157. Quintal Long Ton 0.09842065 10.16049 158. Quintal Metric Ton 0.1 10 159. Quintal Maund 2.679229 0.3732417 160. Quintal Pound 220.46226 0.0045359237 161. Quintal Short Ton 0.11023113 9.0718475 162. Seer Kilogram 0.9331043 1.0716916 163. Seer Pound 2.057143 0.4861111 164. Short Ton or U.S. Ton Hundred weight (Cwt.) 17.857143 0.056 165. Short Ton ( " ) Kilogram 907.184749 0.0011023113 166. Short Ton ( " ) Long Ton 0.8928571 1.12 167. Short Ton ( " ) Maund 24.305556 0.041142857 168. Short Ton ( " ) Metric Ton 0.907185 1.102311 169. Short Ton ( " ) Pound 2000 0.0005 170. Short Ton ( " ) Quintal 9.0718475 0.11023113 171. Square Centimetre Sq. Inch 0.1550003 6.4516 172. Square Centimetre Sq. Metre 0.0001 10000 173. Square Foot Katha 0.0013888 720 174. Square Foot Sq. Metre 0.09290304 10.7639104 175. Square Inch Sq. Centimetre 6.4516 0.1550003 176. Square Kilometre Hectare 100 0.01 177. Square Kilometre Sq. Mile 0.3861022 2.589988 178. Square Metre Are 0.01 100 179. Square Metre Hectare 0.0001 10000 180. Square Metre Sq. Foot 10.7639104 0.09290304 181. Square Metre Sq. Yard 1.19599 0.8361274 182. Square Mile Acre 640 0.0015625 183. Square Mile Hectare 258.998811 0.0038610216 184. Square Mile Sq. Kilometre 2.589988 0.3861022 185. Square Yard Acre 0.0002066 4840 186. Square Yard Are 0.0083612736 119.5990046 187. Square Yard Sq. Foot 9 0.1111111 188. Square Yard Sq. Metre 0.8361274 1.19599 189. Tola Gram 11.663804 0.08573532 190. Tola Ounce 0.41142857 2.4305556 191. Ton (British) Long Ton See long ton - 192. Ton (U.S.) Short Ton See short ton - 193. Tonne Metric Ton See metric ton - 194. U. S. Gallon– Gallon (U. S.) See gallon (U.S.) - 195. Yard Chain 0.0454545 22 196. Yard Foot 3 0.333333 197. Yard Furiong 0.0045454 220 198. Yard Kilogram 0.0009144 1093.613298 199. Yard Metre 0.9144 1.0936133 200. To convert fahrenheit into celcius/centigrade : C = (F-32) X 5/9 To convert celcius/centigrade into fahrenheit : F = (CX9/5+32) Note : Milli = 1/1000 Centi = 1/100 Deci = 1/10 Deca = 10 times Hecto - 100 times Kilo = 1000 times 1 litre water at 4oC = 1 Kg. (approximately).