Direct Lightning Strikes to Test Power Distribution Lines—Part I: Experiment and Overall Results
9
2236 IEEE TRANSACTIONS ON POWER DELIVERY, VOL. 22, NO. 4, OCTOBER 2007 Direct Lightning Strikes to Test Power Distribution Lines—Part I: Experiment and Overall Results Jens Schoene, Martin A. Uman, Fellow, IEEE, Vladimir A. Rakov, Fellow, IEEE, Angel G. Mata, Carlos T. Mata, Member, IEEE, Keith J. Rambo, Jason Jerauld, Member, IEEE, Douglas M. Jordan, and George H. Schnetzer Abstract—The interaction of rocket-triggered lightning with two unenergized power distribution lines of about 800 m length was studied at the International Center for Lightning Research and Testing in Florida. A horizontally configured line was tested in 2000, and a vertically configured line in 2001, 2002, and 2003. The horizontally and vertically configured lines were equipped with six and four arrester stations, respectively, and, additionally, in 2003, the vertical line with a pole-mounted transformer. During the 2000, 2001, and 2002 experiments, arresters were frequently rendered inoperable by disconnector operation during triggered lightning strokes, but there was no disconnector operation during the 2003 experiment when the transformer was on the line. In all four years, there were commonly flashovers from the struck phase-conductor to the closest phase-conductor not subjected to direct lightning cur- rent injection. The self-consistency of measurements is assessed via comparison of the injected lightning current with: 1) the total cur- rent flowing to Earth through the multiple line groundings and 2) the total phase-to-neutral current flowing through the line ar- resters and line terminations. This paper is part one of two related papers. Index Terms—Arresters, grounding electrodes, lightning, power distribution lines, power transformers. I. INTRODUCTION L IGHTNING commonly strikes power distribution lines and is particularly troublesome in areas exhibiting a high ground flash density, such as the southeastern U.S. Light- ning arresters are often placed between the phase and neutral conductors of the power lines, both on the line proper and at so-called line weak points such as cable connections and pole-mounted transformers. The function of these arresters is to limit surge voltages in order to both protect equipment con- nected to the line and to prevent line flashovers and outages [1]. The design of lightning protection for distribution lines involves weighing the initial cost of the arresters and the replacement costs for damaged arresters against the benefits of protection for equipment and an expected reduction in line flashover and outage rates. Gapless metal–oxide varistors (MOVs) are the most widely used arresters for the protection of power lines. Arresters commonly contain disconnectors that serve to isolate from ground arresters that have failed in a short-circuit mode, so as to keep the line operational. Disconnectors are designed Manuscript received January 24, 2006; revised November 21, 2006. This work was supported by the Florida Power and Light Company. Paper no. TPWRD-00032-2006. The authors are with the Department of Electrical and Computer Engineering, University of Florida, Gainesville, FL 32611 USA (e-mail: jenss@ufl.edu; [email protected]fl.edu). Digital Object Identifier 10.1109/TPWRD.2007.905378 to withstand transient lightning currents during normal arrester operation. If the arrester fails, the thermal heating due to the 60 Hz fault current causes a detonation of a cartridge that separates the arrester ground lead from the base end of the arrester [2]. The present paper is the first of a sequence of two related papers. Presented in this paper is a description of experiments involving the interaction of rocket-triggered lightning with two unenergized test distribution lines, a verification of the validity of the experimental techniques used, and a performance assess- ment regarding the frequency of disconnector operation and line flashovers. The companion paper discusses various aspects of the lightning current division on the test lines and compares the measured lightning current division with model-predicted results. The interaction of rocket-triggered and natural lightning with power distribution and transmission lines has previously been investigated in studies conducted in the U.S. [3]–[6], Mexico [7], South Africa [8], and Japan [9]–[13]. The experiments discussed in this paper were performed at the International Center for Lightning Research and Testing (ICLRT), which is an outdoor facility occupying about 1 at the Camp Blanding Army National Guard Base, located in north-central Florida, approximately midway be- tween Gainesville, home of the University of Florida, and Jacksonville. At the ICLRT, lightning is triggered (artificially initiated) from natural overhead thunderclouds for a variety of purposes using the rocket-and-wire technique [6], [14], [15]. Triggered lightning is typically composed of an initial stage involving a steady current of the order of 100 A with a duration of hundreds of milliseconds followed by one or more dart leader-return stroke sequences which are very similar to the strokes following the first stroke in natural lightning. An overview of the ICLRT is given in Fig. 1 including a depiction of both the horizontally configured and the vertically config- ured distribution lines on which experiments were performed. Also shown in Fig. 1 is the tower rocket-launching facility from which the triggered lightning current was directed to the distribution lines. The rocket-triggered lightning experiments conducted from 2000 through 2003 were designed to study the direct lightning strike interaction with two different types of three-phase dis- tribution lines and, if possible, to decide which line was better from the point of view of lightning immunity. The two distribu- tion lines are: 1) a cross-arm horizontal line configuration with three spans between arrester stations studied during Summer 2000 and previously considered in [16] and 2) a vertical line configuration with four spans between arrester stations studied during Summers 2001, 2002, and 2003. The primary differences 0885-8977/$25.00 © 2007 IEEE
Transcript of Direct Lightning Strikes to Test Power Distribution Lines—Part I: Experiment and Overall Results

2236 IEEE TRANSACTIONS ON POWER DELIVERY, VOL. 22, NO. 4, OCTOBER 2007
Direct Lightning Strikes to Test Power DistributionLines—Part I: Experiment and Overall ResultsJens Schoene, Martin A. Uman, Fellow, IEEE, Vladimir A. Rakov, Fellow, IEEE, Angel G. Mata,
Carlos T. Mata, Member, IEEE, Keith J. Rambo, Jason Jerauld, Member, IEEE, Douglas M. Jordan, andGeorge H. Schnetzer
Abstract—The interaction of rocket-triggered lightning with twounenergized power distribution lines of about 800 m length wasstudied at the International Center for Lightning Research andTesting in Florida. A horizontally configured line was tested in2000, and a vertically configured line in 2001, 2002, and 2003. Thehorizontally and vertically configured lines were equipped with sixand four arrester stations, respectively, and, additionally, in 2003,the vertical line with a pole-mounted transformer. During the 2000,2001, and 2002 experiments, arresters were frequently renderedinoperable by disconnector operation during triggered lightningstrokes, but there was no disconnector operation during the 2003experiment when the transformer was on the line. In all four years,there were commonly flashovers from the struck phase-conductorto the closest phase-conductor not subjected to direct lightning cur-rent injection. The self-consistency of measurements is assessed viacomparison of the injected lightning current with: 1) the total cur-rent flowing to Earth through the multiple line groundings and2) the total phase-to-neutral current flowing through the line ar-resters and line terminations. This paper is part one of two relatedpapers.
Index Terms—Arresters, grounding electrodes, lightning, powerdistribution lines, power transformers.
I. INTRODUCTION
L IGHTNING commonly strikes power distribution linesand is particularly troublesome in areas exhibiting a high
ground flash density, such as the southeastern U.S. Light-ning arresters are often placed between the phase and neutralconductors of the power lines, both on the line proper andat so-called line weak points such as cable connections andpole-mounted transformers. The function of these arresters isto limit surge voltages in order to both protect equipment con-nected to the line and to prevent line flashovers and outages [1].The design of lightning protection for distribution lines involvesweighing the initial cost of the arresters and the replacementcosts for damaged arresters against the benefits of protectionfor equipment and an expected reduction in line flashover andoutage rates. Gapless metal–oxide varistors (MOVs) are themost widely used arresters for the protection of power lines.Arresters commonly contain disconnectors that serve to isolatefrom ground arresters that have failed in a short-circuit mode,so as to keep the line operational. Disconnectors are designed
Manuscript received January 24, 2006; revised November 21, 2006. Thiswork was supported by the Florida Power and Light Company. Paper no.TPWRD-00032-2006.
The authors are with the Department of Electrical and Computer Engineering,University of Florida, Gainesville, FL 32611 USA (e-mail: [email protected];[email protected]).
Digital Object Identifier 10.1109/TPWRD.2007.905378
to withstand transient lightning currents during normal arresteroperation. If the arrester fails, the thermal heating due to the 60Hz fault current causes a detonation of a cartridge that separatesthe arrester ground lead from the base end of the arrester [2].The present paper is the first of a sequence of two relatedpapers. Presented in this paper is a description of experimentsinvolving the interaction of rocket-triggered lightning with twounenergized test distribution lines, a verification of the validityof the experimental techniques used, and a performance assess-ment regarding the frequency of disconnector operation andline flashovers. The companion paper discusses various aspectsof the lightning current division on the test lines and comparesthe measured lightning current division with model-predictedresults. The interaction of rocket-triggered and natural lightningwith power distribution and transmission lines has previouslybeen investigated in studies conducted in the U.S. [3]–[6],Mexico [7], South Africa [8], and Japan [9]–[13].
The experiments discussed in this paper were performed atthe International Center for Lightning Research and Testing(ICLRT), which is an outdoor facility occupying about 1
at the Camp Blanding Army National Guard Base,located in north-central Florida, approximately midway be-tween Gainesville, home of the University of Florida, andJacksonville. At the ICLRT, lightning is triggered (artificiallyinitiated) from natural overhead thunderclouds for a varietyof purposes using the rocket-and-wire technique [6], [14],[15]. Triggered lightning is typically composed of an initialstage involving a steady current of the order of 100 A with aduration of hundreds of milliseconds followed by one or moredart leader-return stroke sequences which are very similar tothe strokes following the first stroke in natural lightning. Anoverview of the ICLRT is given in Fig. 1 including a depictionof both the horizontally configured and the vertically config-ured distribution lines on which experiments were performed.Also shown in Fig. 1 is the tower rocket-launching facilityfrom which the triggered lightning current was directed to thedistribution lines.
The rocket-triggered lightning experiments conducted from2000 through 2003 were designed to study the direct lightningstrike interaction with two different types of three-phase dis-tribution lines and, if possible, to decide which line was betterfrom the point of view of lightning immunity. The two distribu-tion lines are: 1) a cross-arm horizontal line configuration withthree spans between arrester stations studied during Summer2000 and previously considered in [16] and 2) a vertical lineconfiguration with four spans between arrester stations studiedduring Summers 2001, 2002, and 2003. The primary differences
0885-8977/$25.00 © 2007 IEEE

SCHOENE et al.: DIRECT LIGHTNING STRIKES TO TEST POWER DISTRIBUTION LINES—PART 1 2237
Fig. 1. ICLRT overview, 2000–2003. On the two test distribution lines, labeledpoles indicate arrester stations.
TABLE IEXPERIMENTAL CONFIGURATIONS USED IN 2000 THROUGH 2003EXPERIMENTS. POLE NUMBERS ARE IDENTIFIED IN FIGS. 1 AND 2
between the two test distribution lines and “real world” distribu-tion lines are that 1) the test distribution lines are unenergized,2) the test distribution lines are relatively short (about 800 m)and are terminated at the line ends in their characteristic imped-ances, and 3) a distribution transformer was present only on theline tested in 2003, and neither test line was connected to a zonesubstation transformer. A word of caution: One should not in-discriminately assume that all aspects of the experimental dataacquired from the interaction of rocket-triggered lightning withthe test distribution lines are directly applicable to the interac-tion of natural lightning with “real world” distribution lines, aswe will discuss.
II. EXPERIMENT
An overview of all experimental configurations considered isfound in Table I. The table includes information about the loca-tion of the three-phase arrester stations, arrester types (manufac-turer “A” or “B”), number of arresters on the line, the presence
Fig. 2. Test distribution line having a vertical configuration (2001–2003) withmeasurement points and the location of lightning current injection identified. Atransformer was connected to the phase A at pole 2 in 2003 only.
of a transformer on the line, and the use of a diversion techniquefor the initial-stage current, often referred to as initial contin-uous current (ICC).
The configuration of the horizontal line experiment has beendescribed in detail in [16] and [17]. The horizontal line hadthree horizontally-arranged phase conductors and one neutralconductor located about 1.5 m below the phase conductors, alength of about 856 m with 18 poles (average span length: 50m), and arrester stations at poles 2, 5, 8, 11, 14, and 17. Light-ning currents were injected into phase C between poles 9 and10 at midspan. The distance between the struck phase (phaseC) and the next closest conductor (phase B) was 70 cm. Thetest line neutral was grounded at each arrester station and at theline terminations. Currents on the horizontal line were measuredwith current transformers or shunts. Additionally, phase-to-neu-tral and phase-to-phase voltages were measured at pole 8 andpole 11 with magnetic-flux-compensated voltage dividers. Thevoltage dividers were designed to minimize voltages due to thetime-varying magnetic flux produced by the arrester current andcoupled to the voltage divider loop.
The vertical line shown in Fig. 2 had four vertically arrangedconductors—three phase conductors and one neutral conductorbelow the phase conductors (see also [18] and [19]). It had alength of about 812 m with 15 wooden poles (average spanlength: 58 m) and arrester stations at poles 2, 6, 10, and 14where gapless MOV 18 kV arresters manufactured by manu-facturer “A” or manufacturer “B” were installed on all threephases. Tests with the manufacturer “B” arresters according toIEEE Standard C62.11 [20] show that the time to disconnector

2238 IEEE TRANSACTIONS ON POWER DELIVERY, VOL. 22, NO. 4, OCTOBER 2007
TABLE IIARRESTERS VI-CHARACTERISTICS
operation is about 1000, 300, 200, and 30 ms for 60 Hz faultcurrents of 20, 80, 200, and 800 A rms, respectively. The manu-facturer-provided VI-characteristics of the two arrester types inresponse to an 8/20 current pulse are found in Table II.
At each end of the vertical line, a 500 terminator was in-stalled between each phase and the neutral conductor to simu-late, as far as microsecond-scale transients are concerned, infin-itely long lines by matching the characteristic impedances of thelines. A drawing of the vertical line showing all current mea-surement points in 2003 is given in Fig. 2. No voltages weremeasured on the vertical line. A 50 kVA transformer withoutservice drop was present in 2003 at pole 2 and connected to thetop phase conductor (phase A). The center-tapped secondary ofthe transformer was terminated in resistive loads of 4 and 6
. Current in the transformer primary was measured. The 2001and 2002 measurement points were similar to those in 2003 ex-cept for the additional measurement at the transformer primaryin 2003. There were two other differences between the exper-iments: 1) each of the four arrester stations had two arrestersin parallel1 on phase A in 2002 and only one arrester in 2001and 2003, and 2) phase A insulators in 2003 had higher insula-tion strength than in 2001 and 2002. A detailed description ofthe 2001 and 2002 experiments is found in [21]. The verticaltest line neutral was grounded at each arrester station and atthe line terminations (Fig. 2). The low-frequency, low-currentgrounding resistances measured using a clamp-on meter were24, 20, 18, 18, 28, and 24 for poles 1, 2, 6, 10, 14, and 15,respectively. Note that the precise resistance values may varywith level of rainfall or lack of same. During 2001, 2002, and2003, currents from 99 triggered-lightning return strokes wereinjected into phase A of the vertical line at midspan betweenpoles 7 and 8 (Fig. 2). The distance between the struck phase(phase A) and the next closest conductor (phase B) was 80 cm.The rocket launcher, shown in Fig. 3, was mounted on an 11 mhigh wooden tower that was located about 20 m north of andnear the midpoint of the test line (Fig. 1).
The 2002/2003 experiment differed from the 2001 verticalline experiment in that a separate path to ground, other thanvia the test distribution line, was provided for the initial con-tinuous current (ICC) preceding the return strokes in a triggeredflash. The ICC was diverted from the line so that the line ar-resters would not be subjected to the current and charge transferof the ICC, only to the return stroke currents and any contin-uing current that might follow the return strokes. The diverted
1The arresters connected in parallel were of the same type from the same man-ufacturer. However, small differences of the arresters’ VI-characteristics due tothe manufacturing process of the MOV disks may have existed.
Fig. 3. Tower launcher with interceptor structure used during the 2002/2003experiment.
ICC flowed through the rocket launcher to ground, while cur-rents of return strokes following the ICC and any continuing cur-rent after those strokes were generally injected into a horizontal“U” shaped intercepting conductor mounted above the launcher(Fig. 3) and from there were directed to the line via a wire con-nection. The triggered-lightning current through the launcherand through the intercepting structure was measured with two1.25 current viewing resistors (CVRs) (frequency response:0 to 12 MHz). CVRs of the same type as well as 1 CVRs(frequency response: 0 to 9 MHz) were used to measure the cur-rents flowing to ground from the test line. Currents on the line,other than the ground currents, were measured using currenttransformers (CTs) with frequency responses ranging from 1 Hzto 20 MHz, 7 Hz to 5 MHz, or 5 Hz to 15 MHz. During the 2001vertical line experiment, one Yokogawa DL716 (with sixteen,12-bit channels) and seven LeCroy Waverunner LT344L (eachwith four, 8-bit channels) digitizing oscilloscopes were used torecord the sensor outputs, providing 44 digital channels for theexperiment. During the 2002/2003 vertical line experiment, twoYokogawa DL716, six LeCroy Waverunner LT344L, and oneLeCroy 9354 (with four, 8-bit channels) digitizing oscilloscopeswere used to provide 60 channels of digital data recording. TheYokogawa oscilloscopes sampled continuously for 4 s at 1 MHzin 2001 and 2002 and for 2 s at 2 MHz in 2003. The LeCroy os-cilloscopes sampled at 20 MHz and recorded in ten 5-ms or five10-ms segments. The Yokogawa and LeCroy data were lowpassfiltered at 500 kHz and 5 MHz, respectively. Each of the currentmeasurements (25, 26, and 27 current measurement points forthe 2001, 2002, and 2003 experiments, respectively) were trans-mitted to the Launch Control trailer (Fig. 1) via a Nicolet Isobe3000 link (upper frequency response: 15 MHz) composed of areceiver–transmitter pair and a connecting fiber optic cable.
III. RESULTS
Table III summarizes information on the number of flasheswith return strokes, the number of flashes without returnstrokes (composed of the initial stage only), the number ofreturn strokes, and statistical information on the lightning return
SCHOENE et al.: DIRECT LIGHTNING STRIKES TO TEST POWER DISTRIBUTION LINES—PART 1 2239
Fig. 4. Measured currents for flash FPL0312, stroke 5.
stroke peak currents, 10–90% risetimes, and charge2 injectedinto the line.3 Note that the 10–90% risetimes for all lightningcurrents during the 2000 experiment and for most currentsduring the 2003 experiment could not be determined due tothe presence of ringing during the rising edge of the currentwaveform. Data from the 2003 experiment, flash FPL0312,stroke 5, are presented in Fig. 4. These data are typical forthe case where no current bypassed the sensors due to lineflashovers (Section III-C). Fig. 4 shows a typical example of 1)the lightning incident current injected into the line (center offigure), 2) all measured phase A arrester and termination-re-sistor currents (top), 3) all ground currents (bottom), and 4) thetransformer current (right). Each measurement is shown on twotime scales, 100 and 2 ms.
2The charge is obtained by integrating the lightning return stroke current overa 1 ms time interval.
3The measured peak currents and charge injected into the line in 2000 havebeen multiplied by 0.75 to account for apparent errors in the lightning currentmeasurements (see Section III-A).
A. Current Balance Check
The consistency of the data from the vertical and horizontalline experiments were tested by comparing the injected light-ning current with 1) the current leaving the system (the sum ofall ground currents) and 2) the current flowing from the struckphase to the neutral conductor (for the vertical line experimentthe sum of all phase A arrester currents plus the termination cur-rents4). The currents shown on a 100 time scale for FPL0312,stroke 5 in Figs. 5(a) and 6(a) illustrate that initially, during thefirst 10 or so, the injected current is not equal to the total cur-rent leaving the system or the total current flowing from phaseA to the neutral conductor. This apparent discrepancy at earlytimes is probably due to reflections from impedance disconti-nuities on the line. From 10 s to 5 ms, the measured injected
4Only the termination resistor current at pole 1 was measured. The termina-tion resistor current at pole 15 was assumed to be equal to the pole 1 terminationresistor current due to the symmetry of the test system with respect to the cur-rent injection point.

2240 IEEE TRANSACTIONS ON POWER DELIVERY, VOL. 22, NO. 4, OCTOBER 2007
Fig. 5. Flash FPL0312, stroke 5. (a) Lightning current injected into phase Aand the sum of ground currents. (b) Charge injected and the sum of chargestransferred to ground on a 100-�s time scale. The charge displayed in (b) wasobtained by numerically integrating the current waveforms shown in (a).
Fig. 6. Flash FPL0312, stroke 5. (a) Lightning current injected into phase Aand the sum of currents transferred from phase A to the neutral conductor. (b)Charge injected and the sum of charges transferred from phase A to the neutralconductor on a 100 �s time scale. The charge displayed in (b) was obtained bynumerically integrating the current waveforms shown in (a).
current and the total measured current flowing to ground are invery good agreement (although only the first 100 s are pre-sented in this paper). The injected current and the total mea-sured current flowing between phase A and neutral are not equalfor times after about 2 ms (not shown in this paper), probablydue to measurement limitations and errors associated with thecore saturation of the current transformers. The currents shownin Figs. 5(a) and 6(a) were numerically integrated to obtain thetransferred charge, the results being found in Figs. 5(b) and 6(b),respectively. These figures show that the charge injected intothe system is equal to both the charge leaving the system andto the charge transferred from phase A to neutral for the first100 . In fact, the injected charge is equal both to the totalmeasured charge leaving the system and to the total measuredcharge transferred from phase A to the neutral for at least 2 ms.The above observations are entirely consistent with the data for
TABLE IIIDATA FROM THE 2000 THROUGH 2003 EXPERIMENTS
other strokes recorded in 2002 and 2003 (the exception beingstrokes where flashovers cause appreciable charge to bypass thephase A-to-neutral measurement devices). The very good agree-ment between the input charge, the charge transferred to ground,and the charge transferred from phase A to neutral shows thatthe charge is conserved and therefore provides confidence in thevalidity of the data.
For the horizontal line experiment performed in Summer2000, the input charge (the integrated lightning current) wasreported by [16] to be 25% to 30% larger than the sum ofthe charges transferred to ground for the five strokes dis-cussed. Based on a consistency check of all (published andunpublished) 2000 lightning currents, struck-phase-to-neutralcurrents, and ground currents, it is now believed that the reasonfor the discrepancy between the input and ground charges in2000 is due to a 25% overestimation of the tower lightningcurrent and was not due to a loss of charge due to undetectedflashovers, a cause that was not ruled out by [16]. Consequently,a multiplicative factor of 0.75 is here applied to the 2000 mea-sured peak currents and charge transfers, and the corrected dataare presented in Table III.
B. Transformer Currents
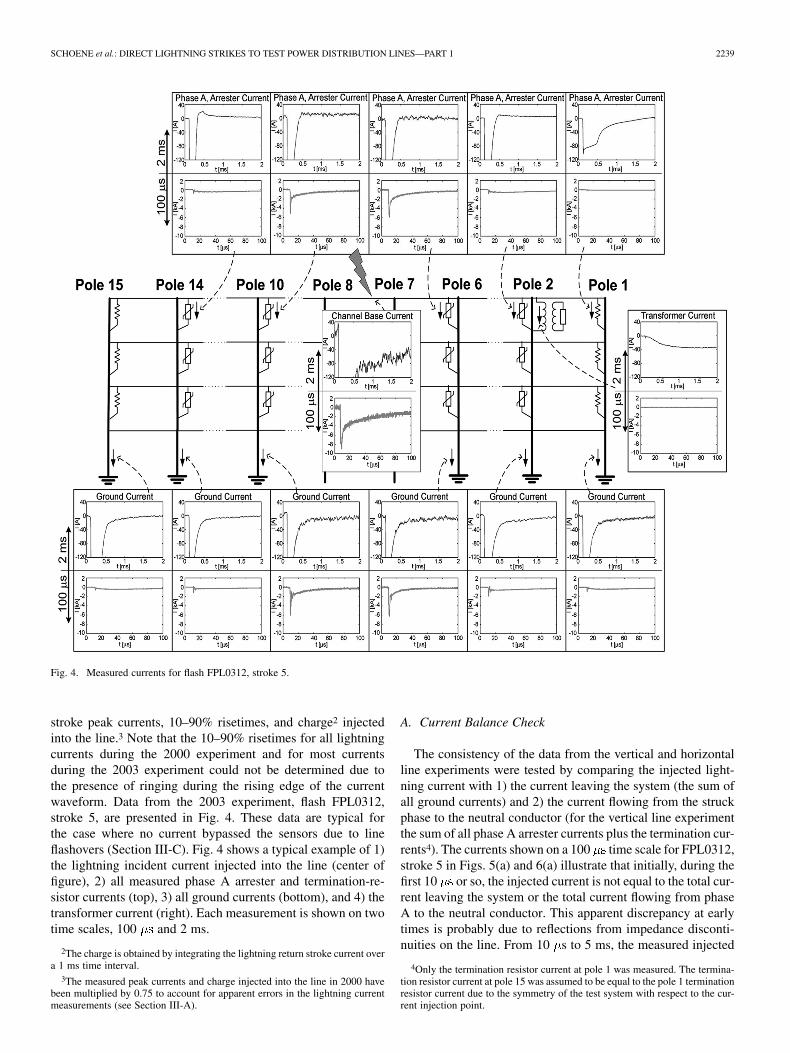
The peak values of the currents through the primary of thepole-mounted step-down transformer for the 26 strokes whosecurrents were injected into the vertical line in 2003 ranged fromsome tens of amperes at a time of a millisecond from the start ofthe return stroke to 200 A at a time of 4 ms. Currents larger than200 A could not be measured for more than a few millisecondsdue to saturation of the core of the current transformer mea-suring the step-down transformer current. Fig. 7 shows data forFPL0312, stroke 5 on a 5 ms time-scale. Note that all data inFig. 7 were low-pass filtered with a 5th order, 25 kHz, Butter-worth digital filter. Fig. 7(a) shows the three currents from phaseA to neutral at poles 1 and 2, that is, the transformer current, thepole 2 arrester current and the pole 1 terminator current. The
SCHOENE et al.: DIRECT LIGHTNING STRIKES TO TEST POWER DISTRIBUTION LINES—PART 1 2241
Fig. 7. FPL 0312, stroke 5. (a) Phase A to neutral currents at poles 1 and 2. (b)The injected lightning current, the phase A current measured on the pole-1 sideof the pole 6 arrester station (current flowing along the phase A conductor frompole 6 toward pole 1), and the sum of all phase to neutral currents between thepole 6 arrester station and pole 1.
arrester current drops rapidly to a small positive value (it is nor-mally negative) at 0.4 ms, or so (positive polarity means posi-tive current is flowing from the neutral into the phase A), andfrom there decays slowly to zero, maintaining the positive po-larity. The terminator current exhibits a fast dip after 0.5 ms andchanges to positive polarity after 2.5 ms. Fig. 7(b) shows the sumof the three currents from phase A to neutral shown in Fig. 7(a)along with the injected current and the phase A current at pole 6(measured after the injected current passes the phase A arresterat pole 6). The sum of the three phase A currents is equal to thephase A current measured at pole 6 for at least 5 ms (currentslarger than 100 A, not displayed in Fig. 7(b), match well, too).This result is expected (since phase A current measured at pole6 flows to the neutral at the three phase A to neutral connec-tions found at poles 1 and 2) and gives further confidence in thedata. After 2 ms, the sum of the three currents from phase A toneutral, with the transformer current being the largest contrib-utor, are equal to the injected lightning current. Note that after2 ms the transformer current is actually slightly larger than theinjected current due to the polarity change of the arrester andterminator currents.
C. Arrester Disconnector Operation and Flashovers
Information is now presented on the performance of the lineconfigurations tested from 2000 through 2003 regarding 1) ar-resters rendered inoperative due to disconnector operation and2) line flashovers. The arresters were not examined for internaldamage to the MOV blocks although external arrester damagewas often observed. Note that disconnectors are designed notto operate on lightning current, whether the arrester functionsnormally or whether the MOV blocks fail, but rather on thelarger rms charge transfer associated with 60 Hz fault currentin the event of MOV block failure. Typically there was morethan one lightning flash triggered to a line per day, but the linecould not be inspected for disconnector operation until the endof the overall triggering session so that there may have beenlightning flashes that did not cause disconnector operation fol-lowed by flashes on the same day that did cause disconnector
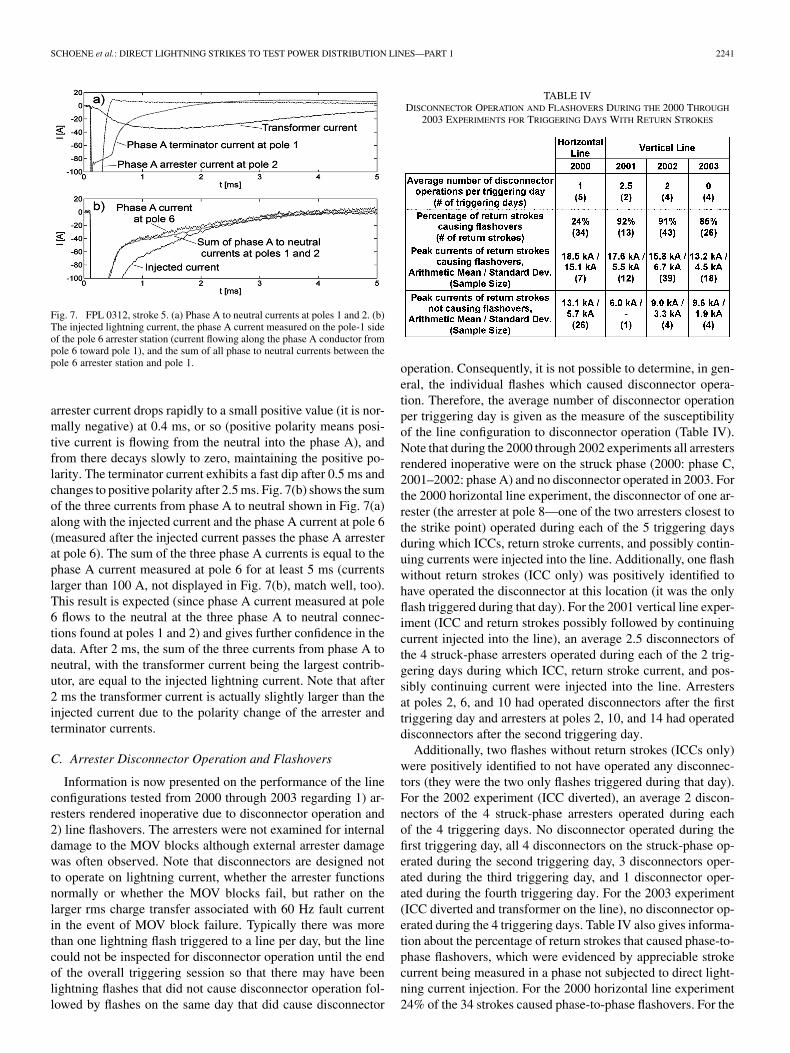
TABLE IVDISCONNECTOR OPERATION AND FLASHOVERS DURING THE 2000 THROUGH
2003 EXPERIMENTS FOR TRIGGERING DAYS WITH RETURN STROKES
operation. Consequently, it is not possible to determine, in gen-eral, the individual flashes which caused disconnector opera-tion. Therefore, the average number of disconnector operationper triggering day is given as the measure of the susceptibilityof the line configuration to disconnector operation (Table IV).Note that during the 2000 through 2002 experiments all arrestersrendered inoperative were on the struck phase (2000: phase C,2001–2002: phase A) and no disconnector operated in 2003. Forthe 2000 horizontal line experiment, the disconnector of one ar-rester (the arrester at pole 8—one of the two arresters closest tothe strike point) operated during each of the 5 triggering daysduring which ICCs, return stroke currents, and possibly contin-uing currents were injected into the line. Additionally, one flashwithout return strokes (ICC only) was positively identified tohave operated the disconnector at this location (it was the onlyflash triggered during that day). For the 2001 vertical line exper-iment (ICC and return strokes possibly followed by continuingcurrent injected into the line), an average 2.5 disconnectors ofthe 4 struck-phase arresters operated during each of the 2 trig-gering days during which ICC, return stroke current, and pos-sibly continuing current were injected into the line. Arrestersat poles 2, 6, and 10 had operated disconnectors after the firsttriggering day and arresters at poles 2, 10, and 14 had operateddisconnectors after the second triggering day.
Additionally, two flashes without return strokes (ICCs only)were positively identified to not have operated any disconnec-tors (they were the two only flashes triggered during that day).For the 2002 experiment (ICC diverted), an average 2 discon-nectors of the 4 struck-phase arresters operated during eachof the 4 triggering days. No disconnector operated during thefirst triggering day, all 4 disconnectors on the struck-phase op-erated during the second triggering day, 3 disconnectors oper-ated during the third triggering day, and 1 disconnector oper-ated during the fourth triggering day. For the 2003 experiment(ICC diverted and transformer on the line), no disconnector op-erated during the 4 triggering days. Table IV also gives informa-tion about the percentage of return strokes that caused phase-to-phase flashovers, which were evidenced by appreciable strokecurrent being measured in a phase not subjected to direct light-ning current injection. For the 2000 horizontal line experiment24% of the 34 strokes caused phase-to-phase flashovers. For the

2242 IEEE TRANSACTIONS ON POWER DELIVERY, VOL. 22, NO. 4, OCTOBER 2007
2001, 2002, and 2003 vertical line experiments flashovers oc-curred much more frequently—about 90% of the 13, 43, and26 strokes, respectively, caused flashovers. All 3 flashes thatcontained strokes which did not cause any flashovers occurredduring the 2000 experiment. Statistical information on the peakcurrents of strokes causing flashovers and of strokes not causingflashovers are also given in Table IV. On average, the peakcurrents of the former are larger than the peak currents of thelatter, as expected. However, for all years strokes with very smallpeak currents (down to 5.6 kA) caused flashover. Note that thetotal sample size of the return stroke peak currents is not al-ways equal to the total number of strokes due to failed currentmeasurements.
IV. DISCUSSION
The disconnector operations per lightning triggering day arediscussed now. The likely reason for the more frequent discon-nector operation during the 2001/2002 experiment than duringthe 2000 experiment (Table IV) was the different number of ar-rester stations on the line (2000: 6 arrester stations, 2001/2002:4 arrester stations); that is, the thermal heating that caused op-eration of the disconnector was less during the 2000 experimentsince the lightning current divided among more arresters. Al-though the average number of operated disconnectors per trig-gering day on the vertical line was slightly reduced from 2001 to2002 (2001: 2.5 disconnector operations, 2002: 2 disconnectoroperations), the difference is not statistically significant. There-fore, there is no experimental evidence that the two changesmade in 2002, that is, employing two arresters in parallel (versussingle arresters on phase A in 2001, see Table I) and not in-jecting the ICC into the line (see Section II) helped reduce thelikelihood of disconnector operation. The reason for the insen-sitivity of the disconnector operation to whether single or twoparallel arresters are being used is probably related to the knowndifficulties of matching two MOVs connected in parallel dueto the intrinsic nonuniformity of the MOV disk’s microstruc-ture [22]. Ideally, the lightning current through two arrestersconnected in parallel is equally shared between them, whichwould double their joint energy handling capability. This wasapparently not the case for the arresters connected in parallelduring the 2002 experiment. On the other hand, Hitoshi et al.[13] investigated the effectiveness of using two arresters in par-allel by injecting a current impulse from a surge generator intoa 430 m long test distribution line and found that the two ar-resters equally shared the currents. Note that even though noICC was injected into the line in 2002, continuing current whichhas properties similar to the ICC (current of the order of 100 Afor some milliseconds to hundreds of milliseconds after returnstroke initiation) followed some of the strokes. Note also thatthe average return stroke charge injected into the line in the ini-tial millisecond was significantly larger in 2001 than in 2002(2001: 2.3 C, 2002: 1.2 C, see Table III) which also may ac-count for the slightly larger number of disconnector operationsper triggering day in 2001. The absence of disconnector oper-ation in 2003 versus 2000, 2001, and 2002, during which therewere common disconnector operations, can likely be attributedto the presence of a transformer on the line in 2003 (see Table I),
which shunted the low-magnitude, low-frequency lightning cur-rent components through the transformer primary to earth asshown in Section III-B. In other words, the transformer mayhave served to reduce the low-frequency currents through thearresters preventing excessive thermal heating of the discon-nectors’ cartridges, whereas the arresters initially protected thetransformer from damage due to high-voltage transients. Notethat even though the average return stroke charge injected intothe line in the initial millisecond was slightly larger in 2002 thanin 2003 (2002: 1.2 C, 2003: 1.0 C, see Table III) the maximumcharge transfer was larger during the 2003 experiment (2002:4.1 C, 2003: 6.0 C). Also, the 2003 experiment included the flashwith the largest number of return strokes of all experiments (a16-stroke flash).
It is an important result of this study that disconnectors fre-quently operated during the 2000 through 2002 experimentseven though 60 Hz fault current was not present (disconnec-tors are designed to operate only on the 60 Hz power frequencyfault current that follows MOV block failure). There is directevidence that long duration currents caused disconnector op-eration: some disconnectors operated during events that con-tained ICC only. There is also evidence that disconnector op-eration on the test distribution lines was not exclusively causedby long-duration currents: the disconnectors of arresters closestto the strike point, which pass the bulk of the impulsive light-ning currents during the initial tens of microsecond after the re-turn stroke initiation (see part 2 and [16]) operated most often.It appears that disconnector operation on the test distributionlines was typically caused by excessive heating due to the com-bined charge transferred during both the return stroke currenttransients and the long duration currents. Significantly, discon-nector operation on the 2003 line was eliminated, apparently bythe absence of the long duration currents through the arrestersdue to the alternative current path provided by the transformer.This implies that even though the energy absorbed during bothlong duration currents and return stroke transients contributesignificantly to disconnector operation, as noted above, the en-ergy absorbed during the return stroke current transients alone istypically not large enough to cause disconnector operation. It isimportant to note that this statement applies to disconnector op-eration from rocket-triggered lightning on the test distributionlines only and not necessarily to ’real world’ distribution lines,where natural lightning first return stroke currents have typi-cally a much larger energy content than rocket-triggered returnstroke currents, where the long-duration currents divide amongmany more arresters, and where distribution and zone substa-tions transformers are present.
Phase-to-phase flashovers occurred much less frequentlyduring the horizontal line experiment than during the verticalline experiments (Table IV) even though the distance of thestruck phase to the next closest phase was smaller for thehorizontal line than it was for the vertical line (horizontalline: 70 cm, vertical line: 80 cm). The reason for the fewerphase-to-phase flashovers on the horizontal line is likely re-lated to one or more of the following differences between thehorizontal and vertical line experiments.
1) The differences in arrester spacings (horizontal line: ar-rester stations every 3 spans, vertical line: arrester stations
SCHOENE et al.: DIRECT LIGHTNING STRIKES TO TEST POWER DISTRIBUTION LINES—PART 1 2243
every 4 spans). The arresters reduce the voltage on thestruck phase thereby preventing flashovers. However, thevoltage reduction does not occur instantaneously, but is de-layed by the time it takes for the voltage signal to travelfrom the injection point to the arrester, be reversed in po-larity, and from there travel back to any point betweenthe arrester stations. For the horizontal line, the distancesfrom the lightning current injection point to each of thetwo closest arresters were 1.5 spans (span length: 50 m).Due to symmetry, the weakest point on the horizontal line(that is, the point on the line where the voltage relief wavefrom the arresters arrives last and therefore is most likely toexperience a flashover) is the current injection point. Thismeans that, for the horizontal line, the voltage relief wavehas arrived everywhere on the struck phase after 0.5(the roundtrip distance from the weakest point to the strikepoint, 3 spans or 150 m, divided by the speed of the trav-eling wave, we assume although the actualspeed of the wave is slightly less than c). For the verticalline, the distance from the lightning current injection pointto the closest arrester in one direction was 1.5 spans andto the closest arrester in the other direction was 2.5 spans(span length: 58 m). A calculation similar to the one per-formed for the horizontal line above shows that the voltagerelief wave has arrived everywhere on the line after 0.7(that is, 0.2 later than for the horizontal line). The largerdelay time for the vertical line can have a significant im-pact on the voltage at the weakest point. At the time therelief wave arrives (horizontal line: 0.5 , vertical line:0.7 ) the voltage at the weakest point on the vertical lineis estimated to be about 40% larger than the voltage at theweakest point on the horizontal line (assuming the voltagebuilds up linearly during the first 0.7 5), which increasesthe probability of flashovers on the vertical line.
2) The presence of voltage measurement equipment on thehorizontal line. The voltage dividers might have helpedto prevent phase-to-phase flashovers by passing current orby facilitating phase-to-neutral flashovers which could noteasily be detected, thereby reducing the potential differ-ence between the struck phase and the next closest phase.
3) The differences in phase arrangements. In the presence ofboth direct current injection and the electric and magneticfields of the leader/return stroke sequence, the horizontalarrangement of the phases in the horizontal line might ex-perience a smaller potential difference between the struckphase and the next closest phase than the potential differ-ence of the vertically arranged phases in the vertical line.However, the induced voltages have been calculated usingthe LIOV-EMTP96 code [23] (the calculation results arenot presented here) and were found to be very small com-pared to the voltages caused by the direct lightning currentinjection.
Interestingly, the percentages of strokes causing flashoverswere essentially the same for all three years during which thevertical line was tested (2001: 92%, 2002: 91%, and 2003: 85%)
5This is a reasonable assumption since the injected current waveforms, whichare expected to have the same waveshape as the voltages, have an average10–90% risetime of well above 1 �s (see Table III in Section III).
even though the disconnector operation during the 2001/2002experiments and the 2003 experiment was quite different (2.5and 2 disconnector operations per triggering day for the 2001and 2002 experiments, respectively, versus no disconnector op-eration for the 2003 experiment). Apparently, the tendency ofthe vertical line configuration to experience flashovers is neithersignificantly influenced by the number of disconnected arresterson the line nor by the presence of the transformer on the line (atransformer was only present during the 2003 experiment).
V. SUMMARY
What follows is a summary of the results presented in thispaper. It is important to remember that the results summarizedhere were obtained from tests with rocket-triggered lightningcurrents injected into unenergized, test distribution lines of 800m length and hence that “real world” distribution lines exposedto natural lightning may not react in exactly the same manner.
1) The disconnector operation common during the 2001/2002vertical line experiment was absent during the 2003 ver-tical line experiment, probably due to a transformer on theline which protected the arresters by shunting the long-du-ration current to ground.
2) Disconnector operation during the 2000 horizontal line ex-periment was considerably less frequent than during the2001/2002 vertical line experiment, which was possiblydue to the larger number of arrester stations on the 2000horizontal line reducing the long-duration current througheach individual arrester.
3) Typically, the disconnectors of arresters closest to the light-ning current injection point, which conduct the bulk of thelightning return stroke transients, were the ones that oper-ated.
4) The results summarized in items 1)–3) and other resultsgiven in the paper indicate that the combined energy inputof the return stroke transients and long-duration currents intriggered lightning is sufficient to activate disconnectors.However, the absence of disconnector operation in 2003where the long-duration current was considerably reducedby a transformer implies that the return stroke current tran-sients in rocket-triggered lightning alone do not commonlyactivate disconnectors.
5) No statistically significant experimental evidence wasfound that employing two arresters in parallel instead ofsingle arresters reduces the likelihood of disconnectoroperation.
6) No statistically significant experimental evidence wasfound that not injecting the initial continuous current oftriggered lightning into the distribution line reduces thelikelihood of disconnector operation.
7) Theory presented in the previous section shows that thevoltage between the struck phase and the next closest phaseat the weakest point on the vertical line (arresters every 4spans) is about 40% smaller than the voltage at the weakestpoint on the horizontal line (arresters every 3 spans) dueto the different arrester spacing. The smaller number offlashovers on the horizontal line compared to the number
2244 IEEE TRANSACTIONS ON POWER DELIVERY, VOL. 22, NO. 4, OCTOBER 2007
of flashovers on the vertical line appears to reflect this dif-ference in voltage, although other explanations for the dif-ferent flashover behavior of the lines are possible.
8) The tendency of the vertical line configuration to experi-ence frequent flashovers was apparently neither influencedby the number of disconnected arresters nor by the pres-ence of a transformer on the line.
ACKNOWLEDGMENT
The authors would like to thank M. V. Stapleton, R. Sutil, P.Diaz, and R. Rey for participating in the experiments as wellas Dr. C. A. Nucci, Dr. F. Rachidi, and Dr. M. Paolone forproviding the LIOV-EMTP96 code, and Dr. M. Darveniza andthe anonymous reviewers for very helpful discussions, whichhelped the authors considerably improve this paper.
REFERENCES
[1] IEEE Guide for Improving the Lightning Performance of ElectricPower Overhead Distribution Lines, IEEE Std. 1410, 2004.
[2] D. W. Lenk, “New distribution class arrester ground lead disconnectordesign enhances detonation reliability and improves arrester perfor-mance,” presented at the Power System Conf. Expo., Oct. 2004.
[3] H. M. Schneider and H. R. Stillwell, “Measurement of lightning currentwaveshapes on distribution systems,” in Proc. IEEE Power Eng. Soc.Summer Meeting, Jul. 15–20, 1979, pp. 526–5, Paper A 79.
[4] P. P. Barker, R. T. Mancao, D. J. Kvaltine, and D. E. Parrish, “Char-acteristics of lightning surges measured at metal oxide distribution ar-resters,” IEEE Trans. Power Del., vol. 8, no. 1, pp. 301–310, Jan. 1993.
[5] M. I. Fernandez, K. J. Rambo, V. A. Rakov, and M. A. Uman, “Perfor-mance of MOV arresters during very close, direct lightning strikes toa power distribution system,” IEEE Trans. Power Del., vol. 14, no. 2,pp. 411–418, Apr. 1999.
[6] M. A. Uman, V. A. Rakov, K. J. Rambo, T. W. Vaught, M. I. Fernandez,D. J. Cordier, R. M. Chandler, R. Bernstein, and C. Golden, “Triggered-lightning experiments at Camp Blanding, Florida (1993–1995),” Trans.Inst. Elect. Eng. Jpn., vol. 117-B, pp. 446–452, 1997.
[7] F. De la Rosa, R. Valdivia, H. Perez, and J. Losa, “Discussion aboutthe inducing effects of lightning in an experimental power distributionline in Mexico,” IEEE Trans. Power Del., vol. 3, no. 3, pp. 1080–1089,Jul. 1998.
[8] A. J. Eriksson, M. F. Stringfellow, and D. V. Meal, “Lightning-inducedovervoltages on overhead distribution lines,” IEEE Trans. Power App.Syst., vol. PAS-101, pp. 960–968, Apr. 1982.
[9] K. Horii and M. Nakano, “Artificially triggered lightning,” in Hand-book of Atmospheric Electrodynamics, H. Volland, Ed. Boca Raton,FL: CRC, 1995, vol. 1, pp. 151–166.
[10] Y. Matsumoto, O. Sakuma, K. Shinjo, M. Saiki, T. Wakai, T. Sakai,H. Nagasaka, H. Motoyama, and M. Ishii, “Measurement of lightningsurges on test transmission line equipped with arresters struck by nat-ural and triggered lightning,” IEEE Trans. Power Del., vol. 11, no. 2,pp. 996–1002, Apr. 1996.
[11] H. Motoyama, Y. Matsumoto, and N. Itamoto, “Observation and anal-ysis of multiphase back flashover on the okushishiku test transmissionline caused by winter lightning,” IEEE Trans. Power Del., vol. 13, no.4, pp. 1391–1398, Oct. 1998.
[12] M. Kobayashi, H. Sasaki, and K. Nakada, “Rocket-triggered lightningexperiments on zinc oxide arresters and their applications to powertransmission lines,” Elect. Eng. Jpn., vol. 122, no. 4, 1998.
[13] S. Hitoshi, A. Asakawa, S. Yokoyama, and K. Nakada, “Effectivenessof installing two pairs of distribution surge arresters in parallel,” pre-sented at the High Voltage Engineering Symp., Aug. 22–27, 1999.
[14] V. A. Rakov, “Lightning discharges triggered using rocket-and-wiretechniques,” Recent Res. Devel. Geophys., pp. 141–171, 1999.
[15] V. A. Rakov and M. A. Uman, Lightning: Physics and Effects. Cam-bridge, U.K.: Cambridge University Press, 2003.
[16] C. T. Mata, V. A. Rakov, K. J. Rambo, P. Diaz, R. Rey, and M. A.Uman, “Measurement of the division of lightning return stroke currentamong the multiple arresters and grounds of a power distribution line,”IEEE Trans. Power Del., vol. 18, no. 4, pp. 1203–1208, Oct. 2003.
[17] C. T. Mata, “Interaction of lightning with power distribution lines,”Ph.D. dissertation, Univ. Florida, Gainesville, 2000.
[18] C. T. Mata, V. A. Rakov, and M. A. Uman, “Division of lightning cur-rent and charge among multiple arresters and grounds of a power dis-tribution line,” in Proc. 26th Int. Conf. Lightning Protection, Krakow,Poland, Sep. 2–6, 2002, pp. 585–590.
[19] V. A. Rakov, C. T. Mata, M. A. Uman, K. J. Rambo, and A. G. Mata,“Review of triggered-lightning experiments at the ICLRT at CampBlanding, Florida,” in Proc. 5th IEEE Power Tech Conf., Bologna,Italy, 2003, pp. 8–8, Paper 381.
[20] IEEE Standard for Metal-Oxide Surge Arresters for AC Power Circuits(> 1 kV), IEEE Std. C62.11, 2005.
[21] A. G. Mata, “Interaction of lightning with power distribution lines:2001 and 2002 experiments at the International Center for Light-ning Research and Testing (ICLRT),” M.Sc. degree, Univ. Florida,Gainesville, 2003.
[22] J. He, S. Chen, R. Zeng, X. Liang, Z. Guan, S. Han, and H. Cho,“Electrical parameter statistic analysis and parallel coordination ofZnO varistors in low-voltage protection devices,” IEEE Trans. PowerDel., vol. 20, no. 1, pp. 131–137, Jan. 2005.
[23] M. Paolone, J. Schoene, M. A. Uman, V. A. Rakov, D. Jordan, K.J. Rambo, J. Jerauld, C. A. Nucci, A. Borghetti, F. Rachidi, and E.Petrache, “Testing of the LIOV-EMTP96 code for computing light-ning-induced currents on real distribution lines: Triggered-lightningexperiments,” presented at the Int. Conf. Lightning Protection, 2004.
For photographs and biographies, see Part II.