Dileni Gunewardena Meanings, Methods and Requirements
286
Dileni Gunewardena February 2004 P OVERTY MEASUREMENT : Meanings, Methods and Requirements Study Series No. 1 - 2004
-
Upload
khangminh22 -
Category
Documents
-
view
0 -
download
0
Transcript of Dileni Gunewardena Meanings, Methods and Requirements

Dileni GunewardenaFebruary 2004
POVERTY MEASUREMENT:Meanings, Methods and Requirements
Study Series No. 1 - 2004
29 Gregory’s Road Colombo 7Sri LankaTel: 94 11 2676 955-8 2667 967-8Fax: 94 11 2676 959E-mail: [email protected]
This study was supportedby the German FederalMinistry for EconomicCoorporation andDevelopment (BMZ)through the GermanTechnical Coorporation
ISBN 955-1040-00-7

POVERTY MEASUREMENT:Meanings, Methods and Requirements
Dileni Gunewardena
February 2004

© Centre for Poverty Analysis, 2003
National Library of Sri Lanka-Cataloguing in - Publication Data
Gunawardena, DileniPoverty Measurement Methodology : Meanings, Methods andRequirements/Dileni Gunewardena. - Colombo: Centrefor Poverty Analysis, 2004.- p. ; 29 c.m.
ISBN 955-1040-00-7 Price :
i. 362.5 DDC 21 ii. Title1. Poverty
ISBN 955-1040-00-7
ISBN 955-1040-00-7

Dileni Gunewardena’s interest in poverty measurement began in 1993when she was involved in producing a poverty profile for the WorldBank’s Poverty Assessment of Sri Lanka using raw data from the House-hold Income and Expenditure Surveys conducted by Sri Lanka’s Depart-ment of Census and Statistics. She has given lectures in the World BankInstitute’s South Asia Region Workshops on Economic Growth andPoverty Reduction, and participated in the South Asia Regional Con-sultation on the World Development Report 2000/1. Together withco-author, Dominique van de Walle, she won the award for Best Re-search on ‘Escaping Poverty’ at the First Annual Awards Competi-tion, Global Development Network in December 2000, for a paper onSources of Ethnic Inequality in Vietnam. She has a Ph.D. in Economicsfrom American University (Washington, D.C.) and received her B.A.(Honours) in Economics from the University of Peradeniya. She is nowa Senior Lecturer in the Department of Economics and Statistics at theUniversity of Peradeniya where she teaches Economic Development,Gender Economics and Labour Economics.
The Centre for Poverty Analysis (CEPA) was established in May 2001 asan independent institute providing professional services on poverty relateddevelopment issues. CEPA provides services in the areas of Applied Re-search, Advisory Services, Training and Dialogue & Exchange to develop-ment organizations and professionals. These services are concentrated withincore programme areas that currently include the following; Poverty ImpactMonitoring, Poverty and Youth, Poverty and Conflict, Poverty InformationKnowledge Management.
The study, Poverty Measurement: Meanings, Methods and Requirementsby Dileni Gunewardena, is a product of the programme on PovertyInformation and Knowledge Management. The study was sponsoredby the Poverty Impact Monitoring Unit (PIMU) of the German Tech-nical Coorporation (GTZ).
The CEPA Publication Series currently includes the following cat-egories; Studies, Edited Volumes, Working Papers, Articles, Event Se-ries, Manuals/Handbooks and Policy Briefs. CEPA also houses a Re-source Centre containing a growing volume of literature and data onpoverty in Sri Lanka.


For Lavanya Maureen de Mel,with the hope that when she grows up she will find less poverty,
no matter how she decides to measure it


This technical study was commissioned by CEPA with financial spon-sorship by the German Technical Coorporation (GTZ) to facilitate thesetting up of a study programme on improving Sri Lanka’s povertymeasurement methodology and the poverty information system.
Poverty measurement and analysis is needed to identify the poor,the nature and extent of poverty and its determinants, and to assess theimpact of policies (and non-policy shocks) and (poverty alleviation andother social welfare) programmes on the poor. Efficient and accuratepoverty-monitoring enables a nation to evaluate its progress in raisingthe standard of living of its poor, and provides much needed evidenceto guide social development policy formulation and to support policyreform. Strengthening a country’s ability to track progress on povertyreduction is desirable from the donor community’s point of view andthis has obvious benefits for the recipient country. National measuresof poverty (and other welfare indicators) also provide the basis for in-ternational estimates, which enable the international community tokeep track of global poverty trends. This is especially relevant at thispoint in time, when the international community has agreed on theimportance of achieving the eight Millennium Development Goals bythe year 2015.1
The last two decades have witnessed considerable analytical effortsby research organizations, academics and practitioners worldwide,which are directed towards (a) deriving good practices in measuringpoverty in all its dimensions, and (b) generating the data requirementsand improving the statistical capacity necessary for measurement andmonitoring.2 This research has been fruitfully used to inform policyand guide economic reform in some countries.3
B A C K G R O U N D T O T H E S T U D Y
1 The responsibility for collecting national data on several core indicators lies with individualcountries. See www.developmentgoals.org for a list of 48 indicators that will help monitor achieve-ment in 18 specific targets under the eight broad Millennium Development Goals (MDGs).2 Poverty mapping initiatives (CGIAR, UNEP etc. etc), Paris 21, and so on.3 For example, see Mackinnon, John and Ritva Reinikka, “How Research Can Assist Policy:The Case of Economic Reforms in Uganda”, World Bank Research Observer Vol 17, 2 (Fall)2002.

Sri Lanka has had a long history of data collection and statisticalcapability and is, in many ways, a model that other countries couldfollow in the area of data generation.4 However, while on the onehand, much of the data collected remains underutilised by researchersand policymakers, on the other hand, little revision of data surveys hasbeen undertaken in order to make the data more useful to researchers.There are large potential gains from greater dialogue between data us-ers (local and international academics, research institutions and practi-tioners) and data producers (primarily the Department of Census andStatistics and the Statistics Department of the Central Bank of Sri Lanka).This is never truer than in the area of poverty research and monitor-ing.
Poverty measurement exercises have been undertaken for Sri Lankain at least the last twenty years.5 These have been characterized bydifferences in the choice of welfare indicators (income, expenditure anddietary energy) as well as in the method of deriving a poverty line. An“official” poverty line does not exist, nor is there consensus on themethodology that should be used. Little effort has been directed atconceptualising and measuring non-income measures of poverty.
This study arises out of a need identified during a series of brain-storming sessions organised by the Centre for Poverty Analysis (CEPA)on these issues with experts in the field, including data producers andusers. The issues discussed specifically included the need to reconsiderthe current definitions on poverty and methods of measuring poverty,on-going initiatives to improve the poverty data-base, methods of im-proving existing data, and the centralization and dissemination of data.
The objectives of this study, as identified by CEPA:The study will provide an overview of the issues relevant to Sri Lanka’spoverty measurement methodology and the poverty information sys-
4 Sri Lanka’s Department of Census and Statistics was considered a possible venue for a studytour by the World Bank Institute in 2001.5 A list of estimates of the Headcount Index from studies conducted in the 1980s and 1990s basedon survey data from 1969 until 1991 are given in Table 1 in Tudawe, Indra, Review of Data andData Sources to Monitor Poverty in Sri Lanka, Report prepared for MIMAP-Sri Lanka, Phase I,Colombo, Institute of Policy Studies, June 1999.

tem, with a focus on the strengths and weaknesses of the current status.In addition to focusing upon economic dimensions of poverty and
quantitative methods of data collection and analysis, the study will re-flect upon the role of non-economic measures and qualitative method-ologies in defining, and measuring poverty.
The study will identify methods to address the issues discussed. Itwill propose a plan of action that will not be constrained by the exist-ing institutional structure and availability of personnel.
Organisation of the study:In keeping with the aforesaid objectives, the study, which comprisestwo parts, focuses on three main questions: Where do we need to be?Where are we? How do we get to where we need to be?
Part I: Poverty Measurement: Meanings, Methods and RequirementsPart I focuses on the question, Where do we need to be? and attempts toprovide an overview of the consensus (and where there is no consen-sus, an outline of the areas and nature of disagreement) on interna-tional best practices in relation to poverty measurement methodology.
The international literature on poverty measurement is a vast area,and somewhat like the proverbial elephant. Typically, social scientistsof different disciplines, and practitioners of different approaches, likethe blind men in the fable, are familiar with their own methodologyand only marginally aware of developments in other approaches tomeasuring poverty (and consequently apt to dismiss them out of hand).A new empirical debate has arisen as to whether poverty has increasedor decreased in the developing world in this era of globalization.7 Ad-ditionally, the area of poverty measurement is experiencing a new phasein conceptual advances, evident in the last few years, even months. Allthese factors provide the motivation for presenting a review that at-
7 Bhalla (2002), Chen and Ravallion (2001) and Reddy and Pogge (2003).

tempts to cover a wide variety of approaches, and does so at a some-what detailed level. This study is thus a combination of a non-technicalreview and a manual.
This study comprises three main sections: (1) a review of conceptualapproaches to poverty measurement, (2) a review of international bestpractice in relation to poverty measurement and (3) a review of datarequirements (and typical sources) for poverty measurement.
Part II: Improving Poverty measurement in Sri LankaPart II is a policy paper that focuses on improving Sri Lanka’s povertymeasurement methodology in the light of the best practices identifiedin Part I. It summarizes the main issues outlined in Part I in response tothe question Where do we need to be and asks the questions Where arewe? and How do we get where we need to be? In response to these ques-tions, it provides an overview of the current status of poverty measure-ment methodology in Sri Lanka, identifying areas in which Sri Lankais lagging behind, and outlines a plan of action that identifies (a) prior-ity areas for improvement, (b) key players in the improvement processand (c) steps that need to be taken by the key players.
AcknowledgementsI wish to thank, without implicating, Nisha Arunatilaka, Anila DiasBandaranaike, Christoph Feyen, Ramani Gunatilaka, Hans Gsaenger,Neranjana Gunetilleke, Azra Jafferjee, Wimal Nanayakkara, DariniRajasingham Senanayake, Indra Tudawe, and other members of theconsultative group for comments on a previous draft of this paper. Thecomments of participants at CEPA’s Open Forum no.18 where someof this material was presented were very helpful in revising the paper.Dinushka Senanayake provided invaluable research assistance. Sureshde Mel, Ramani Gunatilaka, Neranjana Gunetilleke, T. Jogaratnam,

A.G.W. Nanayakkara, Kumari Nanayakkara, Nimal Sanderatne, Tu-dor Silva and Suranjana Vidhyaratne were also extremely generous inproviding resource material. Some readers will already have recognisedthat the phrasing of the dedication to Part I is not original-I have para-phrased the dedication to the first edition of Amartya Sen’s book OnEconomic Inequality. The sum of my debt to Amartya Sen’s work inhelping me to understand the measurement of poverty is, of course,much larger.
My husband, Suresh and daughter, Lavanya, deserve special thanksfor putting up with my general unavailability during the time this studywas being written. Suresh also read and commented on an earlier ver-sion of the manuscript, in addition to relieving me of household choresand childcare duties for extended periods of time. This study could nothave been done without the unstinted support he gave me.
Finally, I am immensely grateful to Azra Jafferjee and NeranjanaGunetilleke and others at CEPA for their patience as the study grewlarger and longer.
I alone am responsible for any errors, omissions and inconsistenciesthat remain.
Dileni GunewardenaPeradeniya, December 2003.


CONTENTS
1 . CONCEPTUAL ISSUES IN POVERTYMEASUREMENT 11.1 The uses of poverty measurement. 21.2 Approaches to defining and measuring poverty 5
1.2.1 Monetary approach 71.2.2 Capabilities approach 71.2.3 Social exclusion approach 81.2.4 Participatory approach 10
1.3 Issues in defining poverty 101.3.1 Poverty in what space? 111.3.2 Poverty is multidimensional 141.3.3. Absolute vs. relative 151.3.4. Subjective or objective? 181.3.5. Poverty and inequality 201.3.6. Direct and indirect definitions of poverty 211.3.7. The dynamics of poverty 221.3.8. Poverty and vulnerability 24
1.4.Summar y 25
2. GOOD PRACTICE IN POVERTY MEASUREMENT 272.1 Monetary approaches to poverty measurement 28
2.1.1. Choice of indicator(s) 292.1.2. Choice of unit of analysis 312.1.3. Choice of poverty line 352.1.4. Choice of poverty measure 522.1.5 Uses and limitations of monetary measures 56
2.2 Incorporating multidimensionality in poverty measurement 582.2.1 Introduction 582.2.2 Choice of dimensions and indicators 622.2.3 Choice of thresholds 692.2.4 Choice of weights, or how to aggregate? 71

2.3 Measuring the dynamics of poverty 782.3.1 Measuring chronic poverty using panel data 792.3.2 Measuring chronic poverty without panel data 84
2.4 Measuring vulnerability 862.5 Measuring voicelessness and powerlessness 882.6 Capability approaches to poverty measurement 88
2.6.1 Choice of indicator(s) 902.6.2 Choice of unit of analysis 932.6.3 Choice of poverty line 932.6.4 Choice of poverty measure 95
2.7 Social exclusion approaches to poverty measurement 992.7.1 Choice of indicator(s) 1002.7.2 Choice of unit of analysis 1052.7.3 Choice of poverty line 1062.7.4 Choice of poverty measure 1072.7.5 The contribution of the social exclusion approach 108
2.8 Participatory approaches to poverty measurement 1102.8.1 Choice of indicator(s) 1112.8.2 Choice of unit of analysis 1122.8.3 Choice of poverty line 1122.8.4 Choice of poverty measure 112
2.9 Other approaches to poverty measurement 1142.9.1 Poverty monitoring 1142.9.2 Poverty maps 1182.9.3 Subjective measures of poverty 120
2.10 Summary 128
3. DATA REQUIREMENTS FOR POVERTYMEASUREMENT 1313.1 In t roduc t i on 1313.2 Sources of data 131

3.2.1 Censuses and surveys 1323.2.2 Qualitative data 1423.2.3 Administrative data 1443.2.4 Combining survey and census data 148
3.3 Specific data issues 1513.3.1 Panel data: is it worth it? 1513.3.2 Non-compatible data 153
3.4 Poverty information/monitoring systems 1533.4.1 Assessing sources for a poverty monitoring system 1533.4.2 Maintaining international comparability 1543.4.3 Rationalizing data collection nationally 1543.4.4 Features of a poverty information strategy 155
3.5 Summar y 156
4. CONCLUSIONS AND THE WAY FORWARD 158
REFERENCES 160APPENDICES 189Appendix A: Components of a poverty profile
for Bangladesh 1996 190Appendix B: A comparison of four approaches to poverty 192Appendix C: Poverty lines from around the world 199Appendix D. Asset based indices 219Appendix E: Selected lists of indicators for measuring
and monitoring poverty 223Appendix F : Some well-known composite indices 240Appendix G: Selected research using proxy measures
of economic welfare 244Appendix H: Data sources 248
INDEX 260


1
In the introductory comments to a conference held at Cornell Univer-sity in the spring of 2002, Ravi Kanbur stated that while the 1970s andearly 1980s were characterised by conceptual ferment in the economicanalysis of poverty and inequality, the last fifteen years have seen fewadvances conceptually in this area.8 He suggested that there was both aneed and an opening for a new phase of conceptual advances (Kanbur2002). Scarcely one year after this statement was made, there is grow-ing evidence of this new conceptual ferment and a resurgence in re-search.9 Conducting a review of international research in poverty mea-surement methodology in this context is somewhat like hitting a mov-ing target. While many of the conceptual issues and problems raisedand discussed in this chapter are not new, the international communityis a lot closer to finding new and better answers to these issues andproblems than ever before. This is reflected in Chapters 2 and 3, which,draw largely from the last fifteen years of consolidation and applica-tion, but also include wherever possible, new methodological insightsand developments in data generation.
Why (or for what) poverty is measured will determine to some ex-tent what is measured and how it is measured. Therefore, in Chapter 1,I outline the typical uses of poverty data with a view to defining thescope of the study, and, subsequently, to be able to highlight the differ-ences in data requirements for each of these uses. I then present thedebates and consensus regarding concepts and definitions of povertyand identify those that will be used in this study, and that will form thebasis for identifying data requirements.
1. CONCEPTUAL ISSUES IN POVERTY MEASUREMENT
8 Rather, they were characterised by consolidation, application and policy debate.9 If the themes of several international conferences held in 2003, and of special issues of interna-tional journals, are anything to go by, consider the following: in February, the University ofManchester held a Conference on “Staying Poor: Chronic Poverty and Development Policy”and the World Bank held a workshop on Measuring Empowerment, the WIDER conference on“Inequality, Poverty and Well-being” was held in May. In September, a Conference on the Capa-bility Approach was held in Pavia, Italy. The March 2003 issue of World Development was de-voted to the topic of Chronic Poverty and Development Policy. This is apart from the policydebates and academic research that have been taking place in the developed world, particularlyin Europe, the U.S. and Australia. See also Thorbeck, 2003.

2
POVERTY MEASUREMENT: Meanings, Methods and Requirements
1.1 The uses of poverty measurementWhy poverty is measured to some extent determines what is measuredand how it is measured. Coudouel, Hentschel and Wodon (2001) listfour purposes of poverty measurement and analysis: (1) cognitive (toknow what the situation is) (2) analytical (to understand the factorsdetermining this situation) (3) policy making (to design interventionsbest adapted to the issues) and (4) monitoring and evaluation (to assesswhether current policies are effective, and whether the situation is chang-ing).
(1) Poverty measurement takes place at regular intervals so that asociety is aware of the ground situation regarding poverty. This cantake place at the sub-national, national and international levels. Pov-erty measurement for cognitive purposes typically involves (a) identi-fying a poverty line or threshold (which is sometimes called the refer-encing problem or the identification problem) and (b) deciding how toconvey information about the poor in a single indicator or measure(known as the aggregation problem). These problems are addressed insection 2.1 below. Poverty measures thus constructed are used to makepoverty comparisons within countries over time or across groups, orwith other countries at the same point in time. For international pov-erty comparisons, a consensus on universally acceptable measures andindicators is needed, and to some extent exists (Ravallion 1994). Pov-erty comparisons between groups are used to construct a poverty pro-file. This will typically contain (a) poverty measures across geographi-cal regions and other categories (for example, poverty rates by gender,age, ethnicity, occupation, educational status and labour force partici-pation, etc.); (b) the contribution of these groups to poverty measures(for example, 80% of the poor live in rural areas) and (c) the relativerisks of being poor for different groups (Coudouel et al. 2001). (SeeAppendix A for an example).

3
(2) Poverty analysis moves from describing poverty, to understand-ing its causes. Types of analysis vary from econometric analyses of themicroeconomic determinants of poverty (the approach used in the lastWorld Bank Bangladesh poverty profile)10 to more qualitative and par-ticipatory approaches such as that used in the World Bank Voices ofthe Poor (Narayan et al. 2000). A variety of approaches and methodsexist, and there is some consensus on the most appropriate approachfor each need.11 Whatever the approach used, the purpose of analysis isto identify the correlates of poverty and understand its causes. Povertyanalysis, therefore, invariably requires information other than povertyindicators (gender, age, ethnicity, occupation, educational status andlabour market information, asset ownership and access, infrastructureavailability, health and nutritional status etc.)
(3) Probably the most important reason for measuring and analysingpoverty is to inform policy to design interventions to alleviate pov-erty. One incentive for improving poverty measurement methodologyand data has come from the need to better target interventions. Pri-mary among interventions are income support schemes directed at thepoor. Deciding on a poverty line or threshold is of paramount impor-tance in this case (see section 2.1.3). In addition, poverty profiles of thetype described above are useful to guide targeting to the poorest groups.However, the design of interventions is not the only policy applicationof poverty analysis. It is now explicitly recognised that the overall policyframework needs to incorporate a poverty focus, and mechanisms needto be put in place to measure or monitor the impacts of policy onpoverty. In addition, poverty analysis that reveals the causes of pov-erty has immediate policy relevance.
(4) Monitoring is a continuous process that takes place more fre-quently than measuring, and its purpose is to provide an almost con-tinuous report on poverty, and how policy makes an impact on pov-
10 Wodon, Quentin, 2000. “Micro Determinants of Consumption, Poverty, Growth and In-equality in Bangladesh”, Applied Economics, 32:1337-1352.11 See the World Bank manual for policy makers. (Klugman, Jeni, (ed.), 2002. A Sourcebook forPoverty Reduction Strategies. Washington, D.C.: World Bank).
CONCEPTUAL ISSUES IN POVERTY MEASUREMENT

4
POVERTY MEASUREMENT: Meanings, Methods and Requirements
erty alleviation. Like poverty analysis, approaches to monitoring rangefrom sophisticated computable general equilibrium models to more con-textual evaluations that are based on the perceptions of the poor them-selves. As with analysis, monitoring also requires information otherthan the information on chosen poverty indicators. These will includeinformation on inputs and processes in addition to outputs, outcomes,and impacts. The distinction is made between poverty monitoring andpoverty impact monitoring/evaluation (Klugman 2001). This paperfocuses on poverty measurement, and the monitoring of poverty thatcomplements measurement.
A slightly different categorisation of the purposes of measurementis often cited in the literature (Kanbur and Squire 2001, Asra and Santos-Francisco 1998). The distinction is made between poverty measure-ment for the purpose of comparison (similar to category (1) in the firsttypology) and poverty measurement for the purpose of designing spe-cific poverty-reducing actions (one may argue that categories (2)–(4)above are variants of this purpose). Precision and robustness becomemore important when the objective of measurement is to help in thedesign of specific poverty-reducing actions because equal treatment ofequals is a fundamental principle of public policy (Kanbur and Squire2001).
A variant on the question “for what purpose” is the question “forwhose purposes?” This question is posed and answered by Uphoff (2001)who asks “For academics, for whom precision and elegance bring pro-fessional and personal rewards? For bureaucrats or policy-makers whoneed to make decisions about resource allocation? For the poor them-selves, so that they understand their situation better and can act moreeffectively on their own behalf?” This paper is based on the belief thatthe main purpose of poverty measurement is to reduce or eradicatepoverty (and poverty measurement is for the poor in that sense), and

5
that policymakers and academics have a positive and important role toplay in that process.
The focus of this paper as the title indicates will be on poverty mea-surement, rather than on monitoring or analysis. While the underlyingconcepts discussed in Chapter 1 are relevant to all the purposes andtypes of poverty “measurement”, the differences in these purposes be-come more obvious when moving from concepts to measurement (Chap-ter 2) and finally to identifying data requirements (Chapter 3). Anyattempt to include all measurement issues and data requirements willbe beyond the scope of this study. On the other hand, there will beconsiderable overlap in the discussion, and where relevant, data andmeasurement issues relating to monitoring and analysis will also bediscussed.12
1.2 Approaches to defining and measuring poverty:Several distinct approaches to measuring poverty are evident in thesocial science literature. Some of these approaches are conceptuallyprecise and distinct, while others have considerable overlap with eachother. Any attempt to classify these approaches is unlikely to be defini-tive or exhaustive. The categorisation adopted in this study is from arecent set of studies from Queen Elizabeth House, which focuses onfour distinct approaches to poverty definition and measurement (a) themonetary approach (b) the capabilities approach (c) social exclusionand (d) the participatory approach (Ruggeri-Laderchi et al. 2003).
Approaches to conceptualising, defining and measuring poverty areoften loosely referred to as “quantitative” or “qualitative”, yet there isoften confusion as to just what these two terms mean.
12 One way to explain this is to say that this paper will focus mainly on the issues raised inChapter 1 of the World Bank’s Sourcebook for Poverty Reduction Strategies (Klugman et al. 2001)that deals with Well-being Measurement and Analysis (Coudouel et al. 2001) and less with thoseraised in Chapter 3 in the Sourcebook on Monitoring and Evaluation.
CONCEPTUAL ISSUES IN POVERTY MEASUREMENT
6
POVERTY MEASUREMENT: Meanings, Methods and Requirements
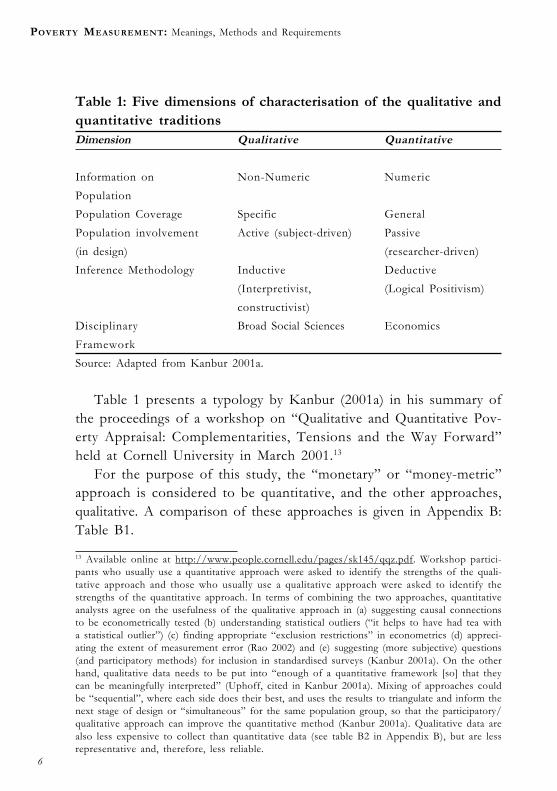
Table 1: Five dimensions of characterisation of the qualitative andquantitative traditionsDimension Qualitative Quantitative
Information on Non-Numeric Numeric
Population
Population Coverage Specific General
Population involvement Active (subject-driven) Passive
(in design) (researcher-driven)
Inference Methodology Inductive Deductive
(Interpretivist, (Logical Positivism)
constructivist)
Disciplinary Broad Social Sciences Economics
Framework
Source: Adapted from Kanbur 2001a.
Table 1 presents a typology by Kanbur (2001a) in his summary ofthe proceedings of a workshop on “Qualitative and Quantitative Pov-erty Appraisal: Complementarities, Tensions and the Way Forward”held at Cornell University in March 2001.13
For the purpose of this study, the “monetary” or “money-metric”approach is considered to be quantitative, and the other approaches,qualitative. A comparison of these approaches is given in Appendix B:Table B1.
13 Available online at http://www.people.cornell.edu/pages/sk145/qqz.pdf. Workshop partici-pants who usually use a quantitative approach were asked to identify the strengths of the quali-tative approach and those who usually use a qualitative approach were asked to identify thestrengths of the quantitative approach. In terms of combining the two approaches, quantitativeanalysts agree on the usefulness of the qualitative approach in (a) suggesting causal connectionsto be econometrically tested (b) understanding statistical outliers (“it helps to have had tea witha statistical outlier”) (c) finding appropriate “exclusion restrictions” in econometrics (d) appreci-ating the extent of measurement error (Rao 2002) and (e) suggesting (more subjective) questions(and participatory methods) for inclusion in standardised surveys (Kanbur 2001a). On the otherhand, qualitative data needs to be put into “enough of a quantitative framework [so] that theycan be meaningfully interpreted” (Uphoff, cited in Kanbur 2001a). Mixing of approaches couldbe “sequential”, where each side does their best, and uses the results to triangulate and inform thenext stage of design or “simultaneous” for the same population group, so that the participatory/qualitative approach can improve the quantitative method (Kanbur 2001a). Qualitative data arealso less expensive to collect than quantitative data (see table B2 in Appendix B), but are lessrepresentative and, therefore, less reliable.

7
1.2.1 Monetary approachIn this study the adjectives “monetary”, “money-metric”, “income” and“consumption” and “objective-quantitative” are often used interchange-ably to refer to the predominant approach used in Economics to mea-sure poverty that uses household (numeric/quantitative) data collectedin (representative, quantitative) household surveys on either income orconsumption to construct measures of poverty that relate to a countryor region. 14
This approach falls under the welfarist (or utilitarian) approach, wherea preference ordering over goods, representable by a utility function isused (Ravallion 1994). The poverty line, in this approach, is the mini-mum cost of the poverty level of utility at prevailing prices and house-hold characteristics (Ravallion 1998). This approach has also been calledthe income approach (UNDP 1997, p. 16) or monetary approach, be-cause “in practice, the welfarist approach typically leads to measuresbased solely on the goods and services consumed by a household, andthe household’s size and demographic composition” which is a morenarrow term than utility (Ravallion 1994).
This approach has dominated the poverty discourse, particularly inthe area of measurement. Issues pertaining to measurement under thisapproach are discussed in section 2.1.
1.2.2 Capabilities approachThe capabilities approach was first presented by Amartya Sen in theessay “Equality of What?” delivered as the Tanner Lecture on HumanValues in 1979.15 It defines poverty as not being able to do certainthings; lacking capabilities to function or lacking “the substantive free-doms [a person] enjoys to lead the kind of life he or she values” (Sen1999). It has gained general acceptance in the last decade, and it hasbecome the dominant approach used by the UNDP since the UNDP-
14 As well as the world! (Chen and Ravallion 2001, Bhalla 2002).15 This was initially published in McMurrin (1980).
CONCEPTUAL ISSUES IN POVERTY MEASUREMENT

8
POVERTY MEASUREMENT: Meanings, Methods and Requirements
based Human Development Report 1997 on poverty (UNDP 1997). TheWorld Bank-based World Development Report 2000/2001 on povertyalso accepts this approach as being a better characterisation of the expe-rience of poverty and increasing our understanding of its causes (WorldBank, 2001). The task of poverty analysis and measurement under thisapproach is to identify what these capabilities are in specific societiesand who fails to reach them. However, operationalising this approachstill has a long way to go (Ravallion 1994). Currently, the practice fol-lowed by the Human Development Report is to report on functionings,rather than capabilities.16 These functionings include being well nour-ished, being adequately clothed and sheltered and avoiding preventablemorbidity, being informed and knowledgeable, being capable of repro-duction, enjoying personal security and being able to participate freelyand actively in society (Falkingham and Namazie 2002). It has beenpointed out that a functionings-based operationalisation of the capabili-ties approach is essentially no different from using basic needs measures.17
Issues relating to measurement under this approach are discussed insection 2.6.
1.2.3 Social exclusion approachSocial exclusion has been described as occurring when a substantial partof the population are disadvantaged, disenfranchised and disaffected(Bradley et al. 2003). The EU defines social exclusion as the “processthrough which individuals or groups are wholly or partially excludedfrom full participation in the society in which they live” (cited in RuggeriLaderchi et al. 2003) and “a progressive process of marginalization lead-ing to economic deprivation and various forms of social and cultural
16 A functioning is an achievement, whereas a capability is an ability to achieve (Sen 1987, p.36).17 A basic needs approach also focuses on material deprivation, but may be regarded as broaderthan the monetary approach in that it includes needs that are not purely physiological. Forexample, the Human Development Report 1997 (UNDP 1997) mentions the need for employ-ment and “participation” as part of the basic needs approach. The basic needs approach empha-sizes the importance of directly measuring poverty, using measures that are intrinsic, not instru-mental. Basic needs indicators include access to food, shelter, schooling health services, potablewater, and sanitation facilities, employment opportunities and opportunities for communityparticipation.
9
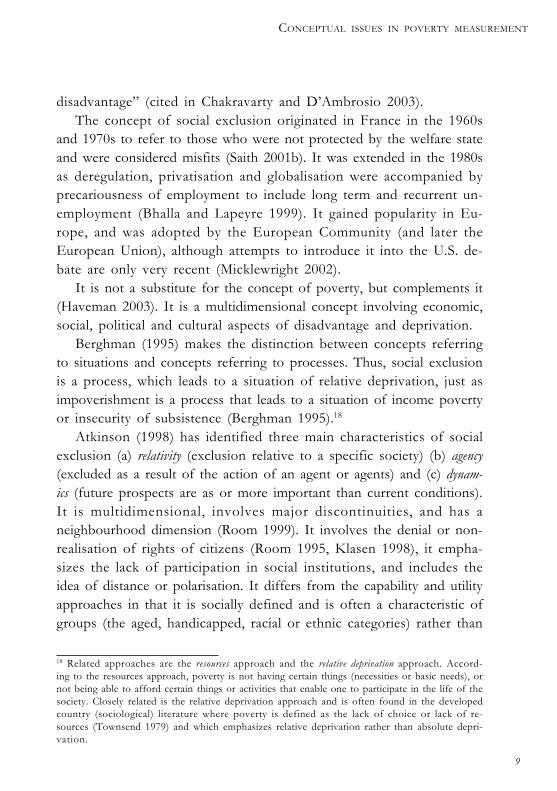
disadvantage” (cited in Chakravarty and D’Ambrosio 2003).The concept of social exclusion originated in France in the 1960s
and 1970s to refer to those who were not protected by the welfare stateand were considered misfits (Saith 2001b). It was extended in the 1980sas deregulation, privatisation and globalisation were accompanied byprecariousness of employment to include long term and recurrent un-employment (Bhalla and Lapeyre 1999). It gained popularity in Eu-rope, and was adopted by the European Community (and later theEuropean Union), although attempts to introduce it into the U.S. de-bate are only very recent (Micklewright 2002).
It is not a substitute for the concept of poverty, but complements it(Haveman 2003). It is a multidimensional concept involving economic,social, political and cultural aspects of disadvantage and deprivation.
Berghman (1995) makes the distinction between concepts referringto situations and concepts referring to processes. Thus, social exclusionis a process, which leads to a situation of relative deprivation, just asimpoverishment is a process that leads to a situation of income povertyor insecurity of subsistence (Berghman 1995).18
Atkinson (1998) has identified three main characteristics of socialexclusion (a) relativity (exclusion relative to a specific society) (b) agency(excluded as a result of the action of an agent or agents) and (c) dynam-ics (future prospects are as or more important than current conditions).It is multidimensional, involves major discontinuities, and has aneighbourhood dimension (Room 1999). It involves the denial or non-realisation of rights of citizens (Room 1995, Klasen 1998), it empha-sizes the lack of participation in social institutions, and includes theidea of distance or polarisation. It differs from the capability and utilityapproaches in that it is socially defined and is often a characteristic ofgroups (the aged, handicapped, racial or ethnic categories) rather than
18 Related approaches are the resources approach and the relative deprivation approach. Accord-ing to the resources approach, poverty is not having certain things (necessities or basic needs), ornot being able to afford certain things or activities that enable one to participate in the life of thesociety. Closely related is the relative deprivation approach and is often found in the developedcountry (sociological) literature where poverty is defined as the lack of choice or lack of re-sources (Townsend 1979) and which emphasizes relative deprivation rather than absolute depri-vation.
CONCEPTUAL ISSUES IN POVERTY MEASUREMENT

10
POVERTY MEASUREMENT: Meanings, Methods and Requirements
pertaining to individuals (Ruggeri-Laderchi et al. 2003). The agency as-pect of social exclusion also points to the existence of distributionalconflict.19
Issues relating to measurement under this approach, and in a devel-oping country context are discussed in section 2.7.
1.2.4 Participatory approachThe critical feature distinguishing the participatory approach from otherapproaches is that in this approach the people themselves participate inassessing their own poverty and are able to “share, enhance, and analysetheir knowledge of life and conditions, to plan and to act.” (Chambers1994). Participatory poverty assessments (PPAs) are “designed to learnhow individuals from various social groups assess their own povertyand existing poverty reduction strategies, how various survival strate-gies operate, which government poverty reduction strategies peopleprefer, and which they are prepared to support. The findings are meantto refocus, elaborate or validate conclusions from conventional pov-erty assessments” (Salmen 1995, cited in Kanbur and Squire 2001). “Par-ticipatory assessments pay special attention to process, with the aim ofengaging a range of stakeholders, generating involvement, maximizinglocal ownership, and building commitment to change” (Kanbur andSquire 2001). Issues relating to measurement under this approach, in adeveloping country context, are discussed in section 2.8.
1.3 Issues in defining povertyAny discussion about the measurement of poverty needs to begin withits definition. There is a general consensus that poverty is about depri-vation, or lack of well-being. However, beyond this point there ismuch debate, some of which is still unresolved. Some of the issues thatare discussed are:
19 Whereas the utility and capability approaches imply that poverty can be reduced throughgrowth alone, this approach focuses on the importance of redistribution.

11
In what space is poverty best conceptualised?Is poverty a uni-dimensional or multidimensional phenomenon?Is poverty about absolute or relative deprivation?Is poverty subjective or objective?In what sense is poverty different from inequality?Should poverty be measured directly or indirectly?Does the time duration of poverty matter for measurement?How is vulnerability related to (and different from) poverty?There are many areas of overlap in the discussion of these issues,
and frequently those that take one position in relation to a particulardebate, will take a related position with respect to another debate. Forexample, Townsend adopts a needs or resources approach to poverty,which then leads him to assert the untenability of the idea of absoluteneeds (Townsend 1979, cited in Sen 1983). Similarly, a fully relativistposition defines poverty in terms of inequality.
1.3.1 Poverty in what space?In 1979, when Sen first introduced the capability approach, the prevail-ing theories offered by Moral Philosophy relating to equality wereUtilitarianism and the Rawlsian theory of justice (Saith 2001a). Senproposed capabilities as an alternative and more appropriate “space” toevaluate inequality than the space of utilities or that of primary goods.20
Sen (1999) presents the claims in favour of the capability approach topoverty as follows: (1) the approach concentrates on deprivations thatare intrinsically important, unlike income which is only instrumen-tally significant (2) income is not the only instrument generating capa-bilities (see Figure 1 below) and (3) the instrumental relation betweenlow income and low capabilities is variable between different familiesand different individuals.
20 This approach was further developed by Sen in subsequent publications (Sen 1985; 1987; 1988;1992; 1997; and 1999).
CONCEPTUAL ISSUES IN POVERTY MEASUREMENT

12
POVERTY MEASUREMENT: Meanings, Methods and Requirements
Muellbauer (1987) presents the links that Sen (1987) makes betweengoods, capabilities, functionings and utilities in Figure 1 below. Start-ing from the top right hand row, conventional market goods are firsttransformed into material characteristics (for example, aspects of nutri-tion such as calories and proteins). These characteristics are then trans-formed into capabilities and finally into actual functionings (achieve-ments). Higher levels of achievement give higher levels of utility. Ateach step of transformation, other factors come into play (the lowerrow). Thus, it is not goods only, but a person’s environment (for ex-ample, climate and public goods such as clean air) that determine theamounts of material characteristics that can be achieved. Conversionof these material characteristics into capabilities will vary according topersonal characteristics, and the final achievements will depend also onthe person’s psychic state, which also influences the utility the personderives from his/her functionings.
If one were to include income in this figure it would be to the rightof commodities, and a corresponding box in the lower row would in-clude prices (income, together with prevailing prices, determine theamount of commodities that can be consumed). Sen (1992) argues thatin income space, the relevant concept of poverty has to be inadequacy(for generating minimally acceptable capabilities) rather than lowness(independently of characteristics).
Figure 1: Utility, functionings, capabilities and their sources
Source: Muellbauer 1987.

13
Although utility is depicted as the end of the chain, Sen argues againstusing utility to judge the standard of living because utility or the abilityto be happy is (a) just another capability and (b) too subjective andquirky. The same argument can be raised against using functionings oractual achievements (The oft-quoted example of the person with meanswho is fasting out of choice as opposed to the person who is starvingbecause of lack of means is relevant here). Sen argues that it is “the setof available capabilities of a person to function …[that is] what the stan-dard of living ought to be about”. This is a point on which there isconsensus. However, when it comes to measurement, it is often easierto observe people’s actual achievements or functioning, than their ca-pabilities or what the set of achievements might have been.
Ravallion (1998) argues that focusing on capabilities for defining pov-erty does not require that we abandon monetary, utility-based, charac-terizations of welfare. The concept of capabilities, as an intermediatelevel between utility and commodities consumed is a way of dealingwith the problem of referencing (determining the poverty line) and isnot a substitute for utility as the welfare indicator, but complements itby providing additional information. He argues that presenting the twoapproaches as fundamentally different and debating their relative mer-its can be misleading.
Operationalisation of the social exclusion approach varies in termsof the space in which poverty is measured. Several attempts have beenmade to explicitly apply the capabilities approach to social exclusion(Poggi 2003). Other ways of measuring social exclusion explicitly referto “resources” lacked (Mack and Lansley 1985) while a third categorymakes no explicit reference to the capabilities approach, yet tends tofocus more on what people are excluded from doing or being ratherthan on what they lack.
CONCEPTUAL ISSUES IN POVERTY MEASUREMENT

14
POVERTY MEASUREMENT: Meanings, Methods and Requirements
While explicit mention of space is not evident in the participatoryapproach, the emphasis on the process and experience of poverty iscloser to a capabilities approach than a resources or commodities ap-proach.
1.3.2 Poverty is multidimensionalThe notion that poverty is deprivation that is experienced in multipledimensions is uncontroversial. Conceptions of what these dimensionsmight be have evolved over time from the purely economic to includingeducation and health (social indicators, or indicators of human poverty)to much broader ideas that include social inclusion, empowerment ofthe powerless and voiceless (political) and vulnerability. The decennialWorld Bank World Development Reports on poverty illustrate the ex-panding conception of poverty. The World Development Report 1990included low achievements in education and health as part of the ap-propriate concept of poverty, while the World Development Report 2000/2001 includes vulnerability and exposure to risk, as well as voiceless-ness and powerlessness. Measuring the latter aspects of poverty posesspecial challenges, but there is ongoing work in this area.21
Chambers (1992) suggests that at a minimum, there are three dimen-sions of poverty: survival, security and self-respect. Baulch (1996) expandsthis conceptualisation of poverty in a “pyramid of poverty concepts”.Line 3 provides the conception of poverty as economic survival, whichis broader than (private) income (or consumption) alone, including com-mon property resources and state provided commodities.22 The inclu-sion of assets recognises the role of assets in reducing vulnerability orincreasing security, while dignity and autonomy, ingredients of self-respect, are important aspects of functioning, the lack of which is mani-fest in voicelessness and powerlessness. Thus, the last line is consider-ably expanded to a definition closer to Sen’s understanding of povertyas capability deprivation.23
21 Conference on measuring empowerment held in Washington, D.C. (World Bank) in March 2003.22 A completely “economic” definition would also include time adjustments that enable the totalvalue of home production to be incorporated (Douthitt 1994).23 Other “pyramids” of expanding poverty concepts define poverty in terms of four types ofcapability deprivation: economic, human, social, political and protective (Gsaenger 2003).

15
Figure 2: A pyramid of poverty concepts
Source: Baulch, 1996
Note: PC=private consumption; CPR=common property resources; SPC= state pro-
vided commodities
It should be noted that measurement becomes increasingly moredifficult as one moves further down the pyramid in Figure 2. The ex-tent to which monetary poverty measures are good proxies of thebroader concepts then becomes a crucial issue (Baulch 1996).
The capabilities, social exclusion and participatory approaches allexplicitly refer to poverty as multidimensional. However, the differ-ence in concepts leads to differences in the way these multiple dimen-sions are incorporated into the measurement of poverty. Chapter 2reviews this in greater detail (Section 2.2).
1.3.3. Absolute vs. relativeThe relativist approach sees an individual’s or household’s deprivation(or lack of well-being) determined by its position relative to others insociety (Townsend 1979). Sen (1983) distinguishes between fullyrelativised and primarily relativised views of poverty.
A fully relativised view of poverty (where for example, the poor are
CONCEPTUAL ISSUES IN POVERTY MEASUREMENT

16
POVERTY MEASUREMENT: Meanings, Methods and Requirements
considered to be those in the bottom 10 or 20 percent of society) essen-tially means that poverty is viewed as an issue of inequality. One prob-lem with viewing poverty in this way is that it will never be completelyeradicated. Similarly, if the level of living in the entire society falls,with no change in the distribution, according to this approach, pov-erty would not have increased, although some people may even be starv-ing. It also makes comparisons across countries or regions difficult,although one might argue that if the same relative definition was to beused by all countries, some type of comparison can be made. A prima-rily relativised view of poverty is less problematic. For example, theEuropean Commission uses a relative poverty line of 60% of the me-dian income, which replaced the previous threshold of half the meanincome of the society.24 The number below this poverty threshold can,in theory at least, be zero (Sen, 1983).
An absolute definition of poverty is based on the idea that “there isan irreducible core of absolute deprivation in our idea of poverty, whichtranslates reports of starvation, malnutrition and visible hardship intoa diagnosis of poverty, without having to ascertain first the relativepicture” (Sen 1981). This irreducible core need not be time-invariant;people’s absolute needs can vary over time. It is also probable that thiscore will vary from society to society: absolute deprivation in sub-Sa-haran Africa will be different from absolute deprivation in Alaska.
Sen (1983) explains this by pointing out that, “the absolute satisfac-tion of some … needs might depend on a person’s relative position vis-à-vis others” which (Sen thinks) is well illustrated by Adam Smith’sdiscussion of the concept of necessities in The Wealth of Nations:
“By necessaries I understand not only the commodities which are indis-pensably necessary for the support of life, but whatever the custom of thecountry renders it indecent for creditable people, even the lowest order, tobe without … Custom … has rendered leather shoes a necessary of life in24 The EC defines the poor as “persons, families or groups of persons whose resources (material,cultural and social) are so limited as to exclude them from the minimum acceptable way of life inthe Member State in which they live” Hagenaars et al. 1994:2.

17
England. The poorest creditable person of either sex would be ashamed toappear in public without them.”
(Smith 1776, pp. 351-2).
While many use this passage as an example of a relative conceptionof poverty, Sen points out that what is absolute here is the avoidance ofshame, which Sen characterises as a capability. In order to escape pov-erty, what are needed are shoes (a commodity) and that is society-spe-cific. Thus, Sen argues, “absolute deprivation in terms of a person’scapabilities relates to relative deprivation in terms of commodities, in-comes and resources” (1983).
In 1995, at the UN World Summit on Social Development, the gov-ernments of 117 countries agreed on the definitions of absolute andoverall poverty.
“Poverty has various manifestations, including lack of income and pro-ductive resources sufficient to ensure sustainable livelihoods; hunger andmalnutrition; ill health; limited or lack of access to education and otherbasic services; increased morbidity and mortality from illness; homelessnessand inadequate housing; unsafe environments; and social discriminationand exclusion. It is also characterised by a lack of participation in decision-making and in civil, social and cultural life. It occurs in all countries: asmass poverty in many developing countries, pockets of poverty amid wealthin developed countries, loss of livelihoods as a result of economic recession,sudden poverty as a result of disaster or conflict, the poverty of low-wageworkers, and the utter destitution of people who fall outside family supportsystems, social institutions and safety nets.
Women bear a disproportionate burden of poverty and children grow-ing up in poverty are often permanently disadvantaged. Older people, peoplewith disabilities, indigenous people, refugees and internally displaced per-sons are also particularly vulnerable to poverty. Furthermore, poverty in
CONCEPTUAL ISSUES IN POVERTY MEASUREMENT

18
POVERTY MEASUREMENT: Meanings, Methods and Requirements
its various forms represents a barrier to communication and access to ser-vices, as well as a major health risk, and people living in poverty are par-ticularly vulnerable to the consequences of disasters and conflicts. Absolutepoverty is a condition characterised by severe deprivation of basic humanneeds, including food, safe drinking water, sanitation facilities, health, shel-ter, education and information. It depends not only on income but also onaccess to social services.”
United Nations (1995)
Do the different approaches to poverty view poverty as primarilyabsolute or relative? While the quantitative approach can incorporateboth views, the tendency, at least in the case of measuring poverty inthe developing world, is to use the concept of absolute deprivation.What comprises the minimum level of well-being below which a per-son or household can be said to be poor will vary in each society. Howthis translates into the determination of the (monetary) poverty line isdiscussed in section 2.1.
Poverty measurement in the capabilities-functionings approach tendsto use absolute measures (or expert-defined thresholds), although theindicators used may be society-specific and change over time and acrosslocations.
In the relative deprivation and social exclusion approaches, poverty,by definition, is relative. However, there is a tendency when applyingthis approach to developing countries to use measures of exclusion anddeprivation defined in an absolute sense.
In the participatory approach, poverty definitions are local, and there-fore highly relative.
1.3.4. Subjective or objective?Does poverty have an objective existence, where it is up to the researcher,or society to observe and describe it, or is it society or individuals in

19
society, that define(s) it? If so, who defines it?25 Two other variants ofthis question are, is the definition of poverty ultimately a value judge-ment? (The parallel question is, whose value judgement?) Is it a policydefinition?
Why some people may find it difficult to conceptualise poverty asabsolute deprivation is the difficulty in determining what the core ofpoverty is, or where the poverty threshold lies. They would argue thatany attempt to define a poverty threshold is normative and prescrip-tive. Piachaud (1981) claims that “the definition by an individual, or bysociety collectively, of what level represents poverty will always be avalue judgement”. Mollie Orshansky (1969), who was influential in de-termining the U.S. poverty line says “poverty, like beauty, lies in theeyes of the beholder.”26 Marx (1867) had no such problem: “in a givencountry, at a given period, the average quantity of the means of subsis-tence necessary for the labourer is practically known.”27 Commentingon this, Sen argues that “[while the] description of necessities may bevery far from unambiguous ... the presence of ambiguity in a descrip-tion does not make it a prescriptive act-only one of ambiguous descrip-tion.”
Interestingly, participants at the Cornell “Q-squared” Conference(who were mainly proponents of either the monetary approach or theparticipatory approach) did not seem to consider this to be overly im-portant. Kanbur (2001a) says that context (the strength of the qualita-tive approach) was seen as important, but more as a better investigativemethod in revealing the unique “truth”, than as a way of revealingmultiple and possibly conflicting perspectives on reality.28
25 One typology distinguishes between “expert-based deprivation thresholds” and “people’s viewson what is necessary” (Boltvinik 1997)26 See Case Study C1 in Appendix C for more on the U.S. poverty line.27 Quoted in Sen, 1981.28 Summary of the proceedings of a workshop on “Qualitative and Quantitative Poverty Ap-praisal: Complementarities, Tensions and the Way Forward” held at Cornell University in March2001, available online at http://www.people.cornell.edu/pages/sk145/qqz.pdf
CONCEPTUAL ISSUES IN POVERTY MEASUREMENT

20
POVERTY MEASUREMENT: Meanings, Methods and Requirements
Poverty is not a policy definitionTwo types of poverty lines are found in practice: (1) a diagnostic ordescriptive poverty line (“who are the poor?”) and (2) a prescriptive or“immediately imperative” income-support line (“who are eligible to re-ceive assistance?”) (Foster and Sen 1997). In Britain, the poverty line isrelated to the Official Supplementary Benefit Scale (Sen 1983), and thisis the case in China as well (Asra and Santos-Francisco 2001).29 Thetradition of identifying the poverty line with the level of benefits hasbeen called the policy definition of poverty (U.S. President’s Commis-sion on Income Maintenance in 1969, cited in Sen, 1983). The defini-tion of poverty does not depend on the feasibility set of a given society,although the latter will determine how much poverty is eradicated.The danger of linking the poverty line to the cut-off to be eligible forgovernment support is obvious: a lower poverty line will imply thatthere is less poverty, whereas in reality, it will only mean that less pov-erty is being eradicated. As Sen (1983) succinctly states “Inescapablepoverty is still poverty”. Thus, when there is a link between the pov-erty line and the cut-off for eligibility for benefits, it is important thatthe poverty line is determined before and independently of the latter.
1.3.5. Poverty and inequalityPoverty and inequality are conceptually distinct. When measuring in-equality, one is concerned with changes in the entire distribution ofwell-being. For example, “a transfer of income from a person in the topincome group to one in the middle income range must ceteris paribusreduce inequality; but it may leave the perception of poverty quiteunchanged” (Sen 1981). Even relative definitions of poverty line definepoverty either in relation to a relative poverty line or concentrate onthe levels of deprivation of the most disadvantaged, such as the bottom
29 In Hong Kong, although there is no official poverty line (because the government refuses toadopt one), the government claims that the rates of social assistance are adequate, and the pre-vailing level at which support through social assistance is given is taken to be the de facto povertyline (MacPherson 1998). See Tables C1 and C2 in Appendix C.

21
40% of the society, whereas inequality is concerned with changes inthe relative position of anyone in the society.30
The concepts of poverty and inequality are strongly related, how-ever, and there is a strong case for focusing on inequality among thepoor. That is, it is important not to regard the poor as one homog-enous group, but to differentiate between different levels (or degrees)of poverty. Many societies will agree, in theory at least, that improvingthe lot of the poorest of the poor (the Rawlsian criterion) ranks first onthe poverty alleviation agenda.
While the conceptual distinctness of poverty and inequality is ac-ceptable to any of the approaches to poverty discussed in this study,inequality is a key concept in both social exclusion and participatoryapproaches, where the relative nature of poverty is emphasized.
1.3.6. Direct and indirect definitions of povertyA distinction that is often made in the literature is that between directand indirect measures of poverty (Sen 1981). Sen (1999) also refers tothe related difference between intrinsic and instrumental measures ofpoverty. A direct measure such as the Direct Calorie Intake Method(DCI) of defining poverty directly observes whether some measure ofadequacy (enough calories so as not to be hungry) has been met or not,whereas an indirect measure such as income only conveys the informa-tion as to whether the level of adequacy can be attained (afforded) ornot. Atkinson (1987) makes the distinction between the right to a mini-mum level of resources and the attainment of a minimum standard ofliving.31 Indirect approaches tend to be used by the objective-quantita-tive approach, while the direct approach is favoured more by the sub-jective-qualitative approach. Table 2 provides a useful overview.
30 This focus only on those below the poverty line is known as the “focus axiom” of poverty.31 Note that Atkinson’s distinction is more akin to the difference between capabilities (the abil-ity to do or be certain things) and functionings (the actual achievement or attainment of them).
CONCEPTUAL ISSUES IN POVERTY MEASUREMENT

22
POVERTY MEASUREMENT: Meanings, Methods and Requirements
Table 2: Direct and indirect conceptsDefinition or issue Indirect concepts found in Direct concepts found
Objective-Quantitative or in Subjective-Qualitative
Monetary approach or Social Exclusion approach
Definition of welfare Resources, in particular Living conditions, way
income (that are of life, quality of life
determinants of a way
of life)
Definition of poverty Lack of resources, in Social exclusion, lack of social
particular, income integration
Relevant concept in Subsistence minimum Relative deprivation concept
empirical poverty concept
research
Measuring devices Poverty line, equivalence Deprivation scale, index of
scales deprivation
Social policy goals Guaranteeing minimum Combating social exclusion
income
Source: Adapted from Kohl 1996
1.3.7. The dynamics of povertyChronic and transitory poverty are distinct phenomena, caused by dif-ferent processes with different policy applications. For example, poli-cies to alleviate chronic poverty demand increases in the physical andhuman capital of the poor or in the returns to their labour, while insur-ance schemes are more appropriate for transient poverty (Kanbur andSquire 2001).
Thus, the measurement of poverty should aim to shed light not juston the static observation of households’ living standards at differing

23
points in time, but on the duration of poverty, and the processes thatmove households in and out of poverty. For example, how much of areduction in poverty is due to better protection of those groups vulner-able to poverty (those who are just above the poverty line), versus bet-ter performance at promoting the poor (moving them out of poverty)?(Dreze and Sen 1989, cited in Ravallion 1996). People who are “at risk”may temporarily have low incomes, but those who have just emergedfrom poverty may temporarily be above the poverty line, but be stillsuffering from material deprivation from prolonged periods on lowincome (Bradshaw 1993, Gordon 2000).
How large are movements in and out of poverty? Several studiessuggest they are large. For example, between 1975 and 1983 panel datafrom a survey of six Indian villages by the International Crops Re-search Institute for Semi-Arid Tropics (ICRISAT) showed that 50 per-cent of the population was poor in a typical year, but that only 19percent was poor in every year (World Bank 1990). Jalan and Ravallion(1998) found that in China transient poverty accounted for 37 percentof total poverty for households that were below the poverty line, onaverage, and that this varied according to the overall level of the prov-ince (in better off provinces a higher proportion of poverty was tran-sient). In Indonesia, the country hardest hit by the East Asian Crisis,incomes in urban areas fell by one third, whereas the decline in ruralareas was less than 15 percent (Poppele, Sumarto and Pritchett 1999).Allocation of income support schemes according to the pre-crisis dis-tribution of poverty would have missed many of the newly poor inurban areas (Kanbur and Squire 2001).
Hulme and Shepherd (2003) attempt a conceptualisation of chronicpoverty that advocates (1) a durational definition that an individual ischronically poor if he experiences significant capability deprivation fora period of 5 years or more, (2) a multidimensional definition that in-
CONCEPTUAL ISSUES IN POVERTY MEASUREMENT

24
POVERTY MEASUREMENT: Meanings, Methods and Requirements
corporates non-monetary measures into the measurement of long-termpoverty, (3) focusing on chronic deprivation experienced by individu-als rather than households,32 (4) a relative, rather than absolute defini-tion of chronic poverty.
The different approaches to understanding poverty differ in theirapproach to the time duration of poverty, and use different methods inanalysing and measuring it. These are examined in detail in Chapter 2,section 2.3.
1.3.8. Poverty and vulnerabilityVulnerability is an aspect of poverty that relates to risks, shocks, stressesand internal defencelessness (Streeten 1994, cited in Lok-Desallien, 1997).World Bank (2002a) defines it as the expected welfare loss resultingfrom unexpected events and lack of insurance against them. The poorare vulnerable to external shocks,33 the poor are less well insured againstrisk, and as a result fall deeper into poverty. Chambers (1995) describesvulnerability as having “two sides: the external side of exposure toshocks, stress, and risk; and the internal side of defencelessness, mean-ing a lack of means to cope without damaging loss”. Outside sources ofrisk range from irregular rainfall and epidemics to crime and violence,the structural vulnerability of homes, and civil conflict. On the inter-nal side, the poor lack the means to protect themselves adequately againstrisk: assets, insurance, and access to credit. Thus, vulnerability (or theother side of the coin, assets to protect against vulnerability) could wellbe used in Baulch’s (1996) pyramid of expanding poverty concepts (Fig-ure 2).
Participatory surveys reveal that economically marginalized groupstend to be socially marginalized as well, so that they are disadvantagedwith respect to both resources and power (Salmen 1995). In Cameroon,the poor distinguished themselves from the non-poor on five main cri-
32 In some households, all members may not experience poverty “in similar ways over similartimes”.33 These could occur at the micro (household) level (for example, illness, death), sometimes calledidiosyncratic, at the meso or community level (pollution, riots), and at the national or interna-tional level (national calamities, macroeconomic shocks), known as aggregate risk.

25
teria: hunger in their households, fewer meals a day and nutritionallyinadequate diets; a higher percentage of their income spent on food;nonexistent or low sources of cash income, and a feeling of powerlessnessand inability to make themselves heard (World Bank 1995a, cited inKanbur and Squire 2001).
Kanbur and Squire (2001) identify at least two dimensions of theproblem of risk: it keeps the poor in low-risk, low-return activities,and it endangers what they already have. Studies of credit and insur-ance highlight the difficulties involved in lending to and insuring thepoor (Aleem 1990 and Hazell, Pomareda and Valdes 1986). This keepsthem in low-risk low-return activities. For example, a study of Indianhouseholds found that households that are more vulnerable to incomeshocks devote a much smaller proportion of land to risky high-yieldingvarieties (Morduch 1990). Most credit networks are intra-village, andof little use in the face of aggregate shocks (like crop failure) that hit theentire village. A study of rural households in south-western China inthe 1985-1990 period found that the loss of one year’s income as a re-sult of crop failure led to a manageable 10 percent decline in consump-tion for the following year for the richest third of households, but forthe poorest 10 percent the comparable figure was a devastating 40 per-cent (Jalan and Ravallion 1999).
A summary of measurement issues relating to vulnerability is givenin section 2.4 in Chapter 2.
1.4. SummaryAny measurement of poverty must begin with defining andconceptualising it. Why poverty is measured determines to some ex-tent how it is measured, and the definitions that relate to the measure-ment of it. Kanbur and Squire (2001) argue that the way in which pov-erty is defined drives the strategy for dealing with it. Broadening the
CONCEPTUAL ISSUES IN POVERTY MEASUREMENT

26
POVERTY MEASUREMENT: Meanings, Methods and Requirements
definition enables a larger range of policy instruments to be used toreduce it. At the same time, the interactions among different aspectscall for a careful integration of policies. The purpose of this chapter inhighlighting the debates in poverty definition and measurement was toindicate the complexity of the issues involved, the diversity of the ap-proaches to conceptualising and measuring poverty, and indicate thenature of disagreements.
The concept of poverty used in this study is not restricted to oneapproach, but draws from all of them, highlighting similarities and dif-ferences (see Appendix B, table B1).34 It is based on a definition ofpoverty that is primarily absolute, albeit with an inescapable relativeelement, it holds that poverty is not a value judgement or a policydefinition but rather has an objective existence, which is up to the re-searcher to identify, describe and analyse, that quantitative-objectiveand qualitative-subjective approaches complementarily assist in uncov-ering this objective existence, that it is distinct from inequality, thoughrelated, and that inequality among the poor is a factor that needs to beincluded in poverty measurement, that it is multidimensional, incor-porating not only material deprivation but also vulnerability and pow-erlessness, and that capturing the dynamics of poverty is an importantcomponent of poverty measurement.
In the next chapter, I look at specific issues in measuring poverty. Ibegin by outlining best practice methods in poverty measurement withinthe monetary approach, and assess how it resolves the issues raised inChapter 1. I then move on to the other approaches, and examine eachin the context of the issues raised in this chapter.
34 “This study” refers to the present volume as well as to the accompanying policy paper Improv-ing Poverty Measurement in Sri Lanka

27
Any exercise involving the measurement of poverty needs to addressthe problems of: (1) Identification (Who are the poor?), and (2) Aggre-gation (How can the phenomenon of poverty be described orsummarised in a scalar index?). An additional problem that arises un-der the issue of identification is that of referencing (with reference towhat are the poor considered poor?) Measurement choices that affectidentification include (i) the choice of indicator, and (ii) the choice of apoverty line or “threshold”. Choices that affect aggregation include (iii)the choice of unit over which poverty is to be defined, (iv) the choice ofmeasure, and (v) the choice of weights when multiple dimensions are com-bined.35 How these issues are addressed and choices made depend onthe approach to understanding and measuring poverty that is used.
In this chapter, I attempt to describe how the different approachesto poverty address the aforesaid choices and deal with incorporatinginto measurement, the conceptual issues discussed in Chapter 1. A largesection of this chapter (section 2.1) is devoted to the traditional objec-tive-quantitative approach with its focus on monetary measures of pov-erty. The relative size of this section is primarily due to the volume ofthe literature on measurement within this approach. A secondary rea-son for the focus on this approach is to provide the Sri Lankan readerwith a much-needed reference to best practices that have been devel-oped in this approach over the last two decades or so.
In sections 2.2 and 2.3 I focus on two major aspects of poverty mea-surement that have either ostensibly, or in reality, been ignored in theobjective-quantitative approach. Section 2.2 highlights the main issuesinvolved in the incorporation of multidimensionality in poverty mea-surement. Section 2.3 focuses on measuring the dynamics of poverty.
35 The choice of weights is also implicit in converting household consumption into equivalisedindividual consumption.
2. GOOD PRACTICE IN POVERTY MEASUREMENT

28
POVERTY MEASUREMENT: Meanings, Methods and Requirements
Sections 2.4 and 2.5 on measurement of vulnerability and voicelessnessand powerless, by contrast, are much smaller, reflecting either the sizeof the literature, or that these issues are addressed in other sections.36
From sections 2.6 to 2.8, I expand the review to include capabilities,social exclusion, and participatory approaches to measuring poverty.The literature on measurement within these approaches is consider-ably smaller than in the objective-quantitative approach, but is grow-ing rapidly, and has much to contribute to the issues of incorporatingmultidimensionality and dynamics into the measurement of poverty.Section 2.9 discusses two related approaches (proxy measures of pov-erty, and subjective indices of deprivation). Section 2.10 summarisesthis section and highlights issues relevant to improving poverty mea-surement methodology.
2.1 Monetary approaches to poverty measurementThe monetary approach to measuring poverty can be traced back toBooth (1887) and Rowntree (1901) who studied poverty in Londonand York, in the late 19th and early 20th centuries. In the 20th century,poverty measurement within this approach made “basic conceptualadvances” with the work of Atkinson (1970, 1987) and Sen (1973, 1976,1981, 1987) in the 1970s and 1980s, culminating (at least according toone author) with the famous paper (Foster, Greer and Thorbecke 1984)that resulted in the FGT measures that are now the “workhorse ofapplied work on poverty the world over” (Kanbur 2002).
In this section, I begin with the four choices that any poverty mea-surement exercise must address, drawing on the well-known work ofRavallion (1994, 1996 and 1998) and others in outlining best practicewithin this work (Deaton 1997, Olsen Lanjouw 1997, Coudouel et al.2001). I then briefly describe the uses of this method and end with anoutline of the limitations of this approach.
36 Many of the issues relating to vulnerability are dealt with in the section on poverty dynamics(Section 2.3) as well as in the section on multidimensionality. Both vulnerability and voiceless-ness and powerlessness are dealt with in the capabilities, social exclusion and participatory ap-proaches to poverty measurement as well (Sections 2.6 to 2.8).

29
2.1.1. Choice of indicatorThe main contenders for measuring poverty in the “monetary” approachare income and consumption expenditure. Coudouel et al. (2001) presentthree arguments from the literature for using consumption rather thanincome.37 (1) It is a better outcome indicator than income. Actual con-sumption gives a better idea of a person’s well-being. Income may nottranslate easily into capabilities (access, availability etc. influence thecorrespondence of income to capabilities). (2) Consumption is a betterindicator of a household’s ability to maintain its standard of living evenwhen income fluctuates (the ability to smooth consumption is an im-portant aspect of well-being). These two factors have provided reasonsfor the consideration of the use of expenditure in the measurement ofpoverty in some developed countries (Travers and Richardson 1993 inthe Australian poverty measurement debate; Slesnick 1993 referring tothe U.S., both cited in Saunders 1997). The recent Eurostat povertymeasurement project used expenditure as the indicator, compared tothe Luxemburg Income Study (which focuses on income inequality).Atkinson (1989) distinguishes between a “standard of living approach”which sees poverty in terms of not actually meeting a minimum stan-dard (consumption would be the appropriate indicator here), and a“minimum rights” approach, which focuses on the right to (being ableto afford) a minimum level of resources (income is more appropriate inthis instance). However, the overwhelming argument in favour of us-ing consumption when measuring poverty in developing countries is(3) that it is usually better measured than income.
Measurement error and the choice of indicatorTypically, income data is unreliable because people do not like to re-veal their income (especially if there is a perception that the informa-tion will be used against them-for tax purposes, or jeopardise their sta-
37 See also Deaton 1997 and Ravallion 1994.
GOOD PRACTICE IN POVERTY MEASUREMENT

30
POVERTY MEASUREMENT: Meanings, Methods and Requirements
tus as government benefit recipients). In the urban informal sector andin rural agrarian households, income flows will vary and recall error ishighly likely. Net income needs to be calculated, which necessitates therecall of input costs and household’s consumption of their own pro-duce, which requires imputing prices.38 Measuring consumption ex-penditure is also not without problems. Prices of households’ own con-sumption need to be imputed and the relevant recall (reference) periodfor different sets of expenditures need to be determined such that mea-surement error is minimised.39 Empirical work has shown that themore commodities listed on a recall sheet, the higher the measure ofaggregated consumption that results (Pradhan 2000). This means thatchanges in the number of items included in the survey may bias inter-temporal or cross-country comparisons (or comparisons of differentregions within the same country based on different survey instruments).Omission of certain categories of expenditures may bias the profile ofpoverty if the effect of the omitted category is non-random. For ex-ample, if the use value of water is not included in a consumption mea-sure, and the public provision of water is correlated with locality (ur-ban/rural or geographically) the estimates of poverty will be biased.(Consumption of water-abundant urban areas is underestimated rela-tive to water-scarce rural areas). However, expenditure modules inhousehold surveys are typically designed well. (Some countries even goto the extreme of not collecting income data because it may influencethe information that households supply on expenditure).40
Another problem with using consumption (expenditure) rather thanincome is that some items of expenditure are incurred due to a fall inwell-being (for example, health expenditures are incurred when a per-
38 Parallel, developed country groups where consumption expenditure may be a better indicatorthan income are the self-employed and the aged (Saunders 1997).39 A well-known example involves the 50th round of India’s National Sample Survey in 1993/94where the standard (but unusual in data collection practice) 30-day recall period for all items waschanged to the 7 days before for items of food, beverages, etc. and 365 days for items whereexpenditure was infrequent. Experimental surveys conducted following the 1993-94 survey con-firmed that reported expenditure in food is significantly higher if the recall period is shortened,and average monthly expenditure on durables is lower if the recall period is lengthened (Deaton2001b and Sen 2000, cited in Tarozzi 2003).40 India’s National Sample Survey.

31
son falls sick, yet, following common practice a person who incurredsuch expenses would be considered less poor than a person who hadzero health expenditure).
Valuing home production and imputing pricesIn many agrarian economies cash income (expenditure) is only a smallproportion of total income (consumption). The problem of what pricesto impute arises whether the indicator being used is income or expendi-ture. If income is the chosen indicator, one needs to calculate the valueof production. The appropriate measure is net returns (gross outputminus purchased inputs and hired labour costs).41 The question of howto value the output (or, if expenditure is the chosen indicator, how tovalue consumption of own produce) arises: what is the appropriate price?Is it farm-gate (the opportunity cost of not selling it), or market (whatit would have cost to buy it), private or official marketing agency, localor regional? These issues are discussed further in Deaton (1997) andDeaton and Zaidi (1999)
Deriving the use value of other goods and servicesEven the best measures of consumption expenditure are likely to runinto problems when imputing, say, the rental value of owner-occupiedhousing in regions where the rental equivalent would be almost impos-sible to determine. While it is important to price basic services such aswater, the process of doing so is complicated.42 Similarly, while it isimportant to impute a value to in-kind benefits such as publicly pro-vided health and education services, there are difficulties in doing so.
2.1.2. Choice of unit of analysisWhere consumption behaviour is concerned, the “family”, not the in-dividual is the natural unit (Sen, 1981; Atkinson, 1991). This may be
41 Family labour would enter into both sides of the equation (part of total income, but needs tobe netted out of gross income from production), and therefore can be omitted.42 About 50 percent of households in Ecuador obtain water from the highly subsidized publicnetwork. The urban poor, who are not connected, have to pay high prices to obtain water fromprivate bowsers. The survey only includes nominal expenditure which does not accurately indi-cate actual consumption by households (Hentschel and Lanjouw, 1996).
GOOD PRACTICE IN POVERTY MEASUREMENT

32
POVERTY MEASUREMENT: Meanings, Methods and Requirements
the household (unit of residence), the spending unit, a blood or maritalrelationship, dependence or inner family (those usually at home).43 Whywe focus on this larger unit, and not individuals, is because we do notassume that individuals with zero income are without resources. Inpractice this means that data is collected at the household level, and allmembers of the household are treated as having a common standard ofliving.44
However, it is difficult to think of households as repositories ofwell-being (Deaton, 1997) so one needs to convert family income intoindividual income. The easiest way to convert family income is to di-vide through by the number of family members. However, two impor-tant concepts to be considered are that of (a) economies of scale (twopeople living together must spend less to achieve a given living stan-dard than two people living apart, for eg. housing costs and utilitiesexpenditure are unlikely to double when family size increases45) and (b)need-based adult equivalence-households differ in their composition,and more specifically, children need less than adults.46 Dividing house-hold income (expenditure) equally among its members ignores the truedispersion, and therefore understates inequality and, in some instances,poverty. When there are economies of scale, using per capita income(expenditure) as the indicator will overstate poverty (understate wel-fare). Household consumption then needs to be scaled in some mannerto derive equivalent consumption.47
Equation 1 is a useful way of depicting equivalent consumption.
43 In the UK, until 1985, official statistics were based on the family unit. This definition wassubsequently changed to that of the household — characterised by common residence andcommonspending.44 This can be a problem if there is great variation in the allocation of resources within house-holds, for example, if women or the elderly are discriminated against within the household.45 However, in many developing countries, housing costs are a small percentage of expenditure,economies of scale are likely to be small.46 Some analyses also use a breakdown by gender. The notion that women need less than men iscontroversial.47 Alternatively, different poverty lines could be used for different household compositions. It ismore common to convert the consumption indicator than to use several poverty lines, althoughthese are equivalent. (See discussion below on adjusting for prices and consumption patterns).

33
Equation 1Equivalent consumption = total household consumption / ns
where n is household size and s is the elasticity of “family need”with respect to family size; which varies according to the age composi-tion of household. When s=0 there is no adjustment for family size;when s=1 the measure is equal to per capita consumption (whichamounts to ignoring economies of scale and equivalence scales). Withs=0.5 (strong economies of scale), a household of four persons are as-sumed to have needs that are twice those of a one-person household,whereas with the per capita adjustment (s=1) their needs would befour times as high. Where there are moderate economies of scale (s=0.75)the assumption is that a four-person household has needs that are 2.8times that of a one-person household.48
The question of how to adjust for economies of scale and adult equiva-lence is then the question of how to determine s. (1) One basis is to usethe nutritional requirements of different types of people. It is commonin developing countries to find nutrition-based scales based on age andgender. For example, in order to function normally, a child below theage of five may need one-third the calories of an adult male. If this isused as the basis for an equivalence scale, a household with one adultmale and three children below the age of five will be considered equalto two (equivalent) adult males (Olson Lanjouw 1997). Nutritional re-quirements (while not uncontroversial) can only be used to determineequivalence in food requirements.49 Children’s non-food needs such aseducation, clothing and medicine could easily exceed those of adults.While several nutritional norms used in practice differentiate betweenadult males and females, this practice is debatable.
(2) A second way to deal with this is to base it on consumptionpractices; how do people regard the equivalence question themselves?
48 The example is from Falkingham and Namazie (2002). A study of poverty in Ireland used thefollowing scales (1) Initial adult 1, additional adult 0.7, additional child 0.5 (2) Initial adult 1,additional adult 0.6 and additional child 0.4 (3) Initial adult 1, additional adult 0.66 and addi-tional child 0.33 (Whelan and Nolan 1996).49 Even when determining nutritional norms, one needs to consider activity levels, degree ofphysical adaptation of persons to different nutritional intakes at given activity levels, and theimportance of nutrients other than calories.
GOOD PRACTICE IN POVERTY MEASUREMENT

34
POVERTY MEASUREMENT: Meanings, Methods and Requirements
This can be done by (a) asking people themselves: for example, Howmuch extra income would a larger family need to manage? “Subjective”perceptions of a poverty line may be useful to derive a poverty line inthis manner (See section 2.9). It can also be done by (b) using householddata to examine the actual consumption behaviour of families withdiffering sizes. The problem with deriving scales from observed con-sumption patterns is that families may not have the same concern formeeting the different needs of different groups (that is, female and eld-erly individuals may be discriminated against).
The methods described above to find equivalence scales by differenttypes of people do not always solve the problem of economies of scale.Dreze and Srinivasan (1995) have argued that the share of public goodsin total consumption can be interpreted as an upper bound of the de-gree of economies of scale in household consumption.
While there are theoretically many ways of establishing equivalencescales, there is little guidance on how to choose among the differentmethods available. Use of household per capita income (expenditure)assigned to individuals is still widely used, and in the absence of a widelyaccepted alternative to it (Olson Lanjouw 1997) is still “best practice”(Deaton 1997). An obvious exception is that the use of per capita con-sumption will lead to the erroneous conclusion that larger householdsare poorer.
Does it matter in practice? Empirical studies have shown that pov-erty rates are quite sensitive to the introduction of equivalence scales(and it is quite common to use sensitivity analysis with alternative equiva-lence scales), but a recent study of Ecuador (Hentschel and Lanjouw1996) indicated that poverty profiles are much less sensitive (OlsenLanjouw 1997). When there is insufficient basis for deciding on a par-ticular equivalence scale, the best approach is to conduct a sensitivityanalysis to see if poverty profiles are sensitive to the choice of equiva-lent scale.

35
2.1.3. Choice of poverty lineIn this section I first examine the functions of poverty lines, then brieflyexamine measurement-related issues relating to absolute and relativepoverty lines and finally focus on methods of constructing (absolute)poverty lines. I draw heavily on Olson Lanjouw (1997) and Ravallion(1994, 1996 and 1998).
Functions of poverty linesAs with the overall measurement of poverty, the use of a particularpoverty line determines the factors that should be considered in con-structing it. Olson Lanjouw (1997) identifies four functions of povertylines (a) poverty monitoring (b) developing a poverty profile (c) a thresh-old for entitlements and (d) a focus for public debate.
Poverty monitoringThe poverty monitoring function of poverty lines is to allow the calcu-lation of poverty rates which, in turn, allows for poverty comparisons,which can then be used to inform the targeting of transfers or deter-mine the best locations for development expenditures, to track changesin poverty rates over time, and to evaluate the poverty impact of policyinterventions.
Developing a poverty profilePoverty lines can be used to construct poverty profiles, which identifythe correlates of poverty and are helpful in identifying the determi-nants of poverty. The general location of a poverty line that is con-structed for this purpose should have broad support and be in line withconventional intuition (Olson Lanjouw 1997).
GOOD PRACTICE IN POVERTY MEASUREMENT

36
POVERTY MEASUREMENT: Meanings, Methods and Requirements
A threshold for entitlementsIn several countries the poverty line is (or is linked to) the referenceincome or expenditure level to which state transfers are linked. Pov-erty is then defined as a policy definition (see section 1.3.4.) of povertyreferred to earlier, and this role is controversial because it providesgovernments with an incentive to define the poverty line according tothe availability of government funds needed to alleviate it. Much of thepublic debate surrounding the new “experimental” poverty lines in theU.S. relate to this very issue.50
A focus for public debateA poverty line can help to focus public attention on the issue of pov-erty. Atkinson (1993, cited in Olson Lanjouw 1997) claims that theexistence of a well-defined poverty line in the U.S. has helped to in-crease public discussion of the situation of the poor and how it haschanged over time. This is true for the new “experimental” povertyline in the U.S (Citro and Michael 1995). The $1-a-day poverty linewhich has come in for a lot of criticism, nevertheless has this feature ofbeing useful for advocacy purposes: it is easy to visualise and can beunderstood by laymen as well as experts, and helps to keep the issue (ofdeveloping countries’ poverty) alive in the developed world. An offi-cial national poverty line “provides a public benchmark for the level ofliving standards that are considered adequate in a country, and thusconstitutes a key device for monitoring the progress of poverty reduc-tion policies, whether by government of other parts of civil society”(Falkingham and Namazie 2002).
Absolute or relativeThe conceptual issues underlying the choice between measuring abso-lute and relative poverty were discussed in section 1.3.3. Absolute pov-
50 See Fisher 1999 for an overview of developments since the 1995 report of the National Re-search Council Panel. Some of these are given in Case Study C1 in Appendix C.

37
erty lines attempt to set a standard of absolute deprivation, while rela-tive poverty lines are defined in relation to the distribution of the popu-lation under consideration. An example of a relative poverty line thatwas commonly used in many developed countries (and all the Euro-pean Union) is 50 percent of average (mean) income (adjusted for fam-ily size and composition using equivalence scales) (for example, Callanand Nolan 1998). This was proposed in the 1960s by the U.S. econo-mist Victor Fuchs because it was a line that would automatically rise asliving standards rose. The European Union adopted a different defini-tion in 2002, that of 60% of the median (adjusted) income because themedian is less sensitive to changes in income for groups of the popula-tion.51 Relative poverty lines of the type described above work wellwhen living standards rise slowly and steadily; however, if they fall ina period of economic decline, the poverty line will also fall in real terms.This happened in New Zealand between 1983/84 and 1992/93 wheredespite a fall in real terms of the relative poverty line, measured pov-erty remained constant. If the absolute value of the 1983/84 relativepoverty lines were used in 1992/93, measured poverty would have in-creased almost three-fold, from 4.3 to 11.3 percent (Waldegrave andFrater 1996). Had relative poverty lines been used in Africa during the1980s, measured poverty would undoubtedly have been underestimated!Relative poverty lines also do not work well when incomes are risingvery rapidly, as in Ireland in the last decade (where the distribution ofincome remained constant, so that low incomes also rose). The mis-leading impression that is given with a relative (moving) poverty line inthis situation is that no progress has been made in reducing the extentof poverty. Thus, even in the developed world, there are situationswhen relative poverty lines should be complemented with absolute pov-erty lines. It has become common now to include both a time-variantrelative poverty line, as well as a relative poverty line for a specific year
51 For example, if everyone in the population were given enough money to bring them up to halfmean, then the mean itself would rise, whereas if the same were done with those below half themedian income, the median would not change. Unlike the mean, the median is unaffected bychanges in the incomes of the very rich.
GOOD PRACTICE IN POVERTY MEASUREMENT

38
POVERTY MEASUREMENT: Meanings, Methods and Requirements
that is fixed in real terms over time (Feres et al. 2003).Although there are strong philosophical reasons for choosing a rela-
tive, rather than an absolute poverty line, ultimately the choice of cut-off for a relative poverty line is always arbitrary. Relative poverty linesmake most sense in countries where absolute deprivation is not thesocial norm. In many low-income countries a poverty line of half themedian will not suffice to meet even the most basic needs (Falkinghamand Namazie 2002). A relative poverty line that has been used for Ghanaby the World Bank is two-thirds of mean household expenditure percapita (World Bank 1995b). A similar approach used by Neef (2002)uses 40 percent of average incomes to denote the threshold for severepoverty and 60 percent of average incomes to denote the threshold forrelative poverty in Romania. An accepted (though arbitrary) measurefor the definition of destitution is “a quarter of median rural income”(Harriss-White 2003).
International and nationalPoverty comparisons across countries can use national poverty lines oran internationally-comparable standard. For example, if one were com-paring Sri Lanka and Bangladesh in a given year, one could say “x per-cent of the population in Sri Lanka was poor compared to x percent inBangladesh, where we are using the definitions of poverty that eachcountry uses to define its standard of minimum needs”. Alternatively,one can try to arrive at some common standard and then find out howmuch poverty exists in Sri Lanka and Bangladesh relative to that stan-dard. This latter approach is reflected in the now famous $1-a-day atpurchasing power parity poverty line (Chen and Ravallion 2000). Inpractice, poverty measures using these different approaches rarely yieldthe same results. Comparisons of poverty rates in Asian countries basedon national poverty lines with those based on PPP-adjusted $1-a-day

39
line showed higher poverty rates using the former (Gsaenger 2003).Atkinson (1991) reports that in Europe, poverty according to a linethat is fixed at 50 percent of average national income is significantlydifferent from (lower than) poverty according to a line fixed at 50 per-cent of the community average. Thus, the $1-a-day poverty line shouldbe seen as a supplement to, rather than a replacement for, a nationalpoverty line based on a minimum consumption basket that has beencalculated and priced specifically for an individual country’s circum-stances (Falkingham and Namazie 2002).52 The discussion below per-tains to how this should be done.
Method of choosing an absolute poverty lineOnce the choice of indicator, and the choice of unit of analysis havebeen made, the next steps in constructing a poverty line are decidingon (1) the food component of the poverty line and (2) how to includenon-food items.53
Setting the food poverty lineThis involves determining the minimum nutritional requirements perday for a reference person or household, which in practice, are typi-cally defined in terms of energy requirements (Olson Lanjouw).54 Twoapproaches are commonly used: (a) Least cost approach (b) Actual ex-penditure approach.
52 The value of the $1-a-day in local currency terms is obtained using purchasing power parityrates—whose construction is not entirely without problems.53 The Direct Calorie Intake (DCI) method (described below) of deriving a poverty line onlycomputes a food poverty line, which is derived in terms of energy requirements that are given interms of caloric intake. Several other methods exist which do not separate out the food and non-food component, such as (a) Lipton’s (1983) definition of ultra-poverty which considers thepoor to be those who spend more than 80 percent of their income on food while meeting lessthan 80 percent of their nutritional requirement (b) The Wolf Point or equilibrium point methodwhich identifies the poverty line as that level of income where household savings are zero.Other methods use the income level where the Engel coefficient (proportion of income/expen-diture) allocated to food reaches a maximum [(Edirisinghe 1987) uses this method].54 Some exceptions are the Philippines Food Poverty line which includes protein micro-nutrientintake as well (Asra and Santos-Francisco 2001), and food poverty line used in a World BankPoverty Assessment for the Kyrgyz Republic where the food basket was determined to meetprotein, carbohydrate and fat minimums as well (Olson Lanjouw 1997).
GOOD PRACTICE IN POVERTY MEASUREMENT

40
POVERTY MEASUREMENT: Meanings, Methods and Requirements
The least cost approach constructs a food basket that is consistentwith prevailing tastes and satisfies the minimum calorie requirement atthe lowest cost, given prevailing prices. Its main advantage is that it isnot a highly data-intensive process. Its main disadvantage is that it isunlikely that people with food expenditure equal to this food povertyline will actually be meeting their minimum requirements (because tastesdiffer). In addition, when minimum requirements are defined in termsof several norms (calories, proteins, carbohydrates, vitamins, etc.), de-riving the poverty line becomes a complicated linear programming ex-ercise, which makes the result non-transparent (and non-intuitive) tothe layman (Olson Lanjouw 1997).
Expenditure-based food poverty lines use actual data on householdexpenditure to derive the poverty line. A segment of the population(the lower deciles) is chosen as the reference population, and their foodconsumption patterns (in terms of actual quantities of a basket of mainfood items) are obtained from household survey data.55 The contentsand composition of the basket are derived entirely from actual con-sumption data. These quantities are converted (using national calorieconversion tables) into calories and total caloric intake is calculated.56
Actual consumption can then be scaled up or down, depending onwhether the total calorie intake is less or more than the minimum re-quirement. Once this is done, the cost of the basket is calculated ac-cording to prevailing prices to obtain the food poverty line.
Thus, the main difference between this method, and the methodpreviously described, is that rather than prescribing a least-cost foodbasket, this method uses the actual consumption patterns of house-holds in determining the food basket. Thus, the final basket is not nec-
55 Practice in determining this reference population varies across countries. The prescribed methodis to choose the lowest 40% (or thereabouts) based on a national ranking of individuals.56 Note that calorie conversion will differ by individuals, and any average conversion is only anapproximation of actual conversion. The degree of disaggregation for conversion tables is a mat-ter of controversy. Some would argue for separate urban and rural conversion rates, in additionto those by sex and age, while others would argue that the appropriate division might be bysector of occupation, rather than location (for example, manual workers expend more caloriesthan those in sedentary occupations).

41
essarily (and is unlikely to be) a least-cost basket. This is more likely toensure that minimum nutrition requirements are being met at the pov-erty line.
The disadvantage of this approach is that data requirements are heavy.Information is needed not only on expenditure on food but also onquantities consumed, and not just on food purchased, but food pro-duced at home, and this then leads to issues of pricing (imputing valuesto) home-produced food.
However, this is the method most commonly used in constructing afood poverty line. The U.S. food poverty line, derived in the 1960s isone of the early examples based on a household survey of consump-tion.57
Both these approaches run into problems when food consumptionpatterns vary hugely by region or by a particular group in society. Thisissue is dealt with in the section on adjustments below.
Another approach that is sometimes used by governments is theDirect Calorie Intake (DCI) method. In this case, calories, rather thanconsumption or income, is the indicator, and the poverty line is itselfdenoted in calories, that is, it is related to the minimum calorie require-ment.58 The advantage of the DCI method is that it is just that-direct-one observes a capability (not being undernourished) being met directly(intrinsically, rather than instrumentally). Moreover, it is a “real” mea-sure of consumption. If one uses this method, one does not have tocalculate price indices to make comparisons over time and space (seebelow). Its main disadvantage is that it ignores the fact that food con-sumption is only one aspect of well being, that poverty denotes a lackof access to basic needs other than food, such as clothing, housing,education and health.
The once-popular definition of ultra-poverty (those who spend morethan 80 percent of their income or consumption on food expenditure
57 The Department of Agriculture’s 1955 household survey of food consumption.58 This measure is thus not a monetary indicator.
GOOD PRACTICE IN POVERTY MEASUREMENT

42
POVERTY MEASUREMENT: Meanings, Methods and Requirements
and meet less than 80 percent of their caloric requirement) is a variantof this method, which allows for non-food expenditure, but is also prob-lematic. The Food and Agricultural Organisation (FAO)’s categorisationdefines a household to be at minimum subsistence if its food share is 50-59 percent, and to be in absolute poverty if the food share was over 59percent. Both these measures are based on the so-called Engel curve,the empirical observation that as income increases, the proportion ofincome used for food falls. The problem with this concept is that it hasbeen observed (by Lipton 1983, among others) that at very low in-comes (the poorest 5-15 percent, Lipton says), the Engel coefficient(the food share) first rises as incomes increase, before it falls. Thesehouseholds would not be meeting their minimum food requirements,and as their income increases, they allocate a greater proportion of theincreased incomes to improve food intakes. According to the FAO andultra-poor definitions, an increase in incomes would lead to an increasein measured poverty, which is counter-intuitive. Anand et al. (1993)use consumer finance data from Sri Lanka (CFS 1981/82) to test thecriteria in the concept of ultra-poverty and find that (a) neither calorieintake nor food share, on their own, contain very much poverty infor-mation, that (b) together they perform better than separately, but that(c) even the double criterion is inferior to a poverty criterion basedsimply on total expenditure. Food share is also not a very useful con-cept in countries with high public service provision, such as China(where the public provision of health and education services obviatesthe need for private expenditure on them-and thereby reduces the nonfood component of expenditure).
Accounting for non-food expenditure in the poverty line.Two approaches are possible: (a) a direct method where the non-fooditems are explicitly defined and priced and added to the food poverty

43
line (also known as a budget-standards approach) and (b) where thefood poverty line is scaled up by some factor to determine the (total)poverty line.
The first approach is rarely used in practice (Olson Lanjouw 1997),although its use may be more widespread than is commonly believed.An example of its use is the Ministry of Labour’s calculation of thepoverty line for Uzbekistan (World Bank 1994 cited in Olson Lanjouw1997). COPLAMAR (1983) uses the Mexican Basket of EssentialSatisfiers, which includes “expert-based” standards for clothing andshoes. The difficulty in doing so is that unlike a minimum nutritionalrequirement, on which some consensus may be achieved, there are few“standards” that can be applied to basic non-food items, and any list isbound to be contentious. A criticism of the budget standard approach(that applies to both food and non-food components of it) is that it is“dominated by expert assessment of the normative dimensions ofadequacy”(Saunders 1997).59 These expert judgements can be mislead-ing because they create the unwarranted impression of objectivity (Citroand Michael 1995, quoted in Saunders 1997).
The second method of scaling up the food poverty line to obtain thetotal poverty line is more common. This method looks at the actualnon-food expenditure of some group. The question is which group?Two approaches are commonly used: (1) determining the average levelof total expenditure of those people whose food expenditure is justequal to the food poverty line and (2) determining the non-food expen-diture of people whose total expenditure is just equal to the povertyline and adding it to the food poverty line. Ravallion (1994) refers tothe first as the typical non-food spending of those who just attain thefood requirement, and the second as the typical non-food spending ofthose who can just afford the food requirement. The argument in favourof the latter is that if people whose consumption is just enough to af-
59 These experts would include nutritionists, housing experts, health care specialists and financialcounsellors.
GOOD PRACTICE IN POVERTY MEASUREMENT

44
POVERTY MEASUREMENT: Meanings, Methods and Requirements
ford their food spending divert some of it to non-food spending, thenthat non-food spending could be termed basic. Ravallion (1994) sug-gests that the two approaches represent an upper (ZU) and lower (ZL)bound of the poverty line, respectively. This approach is known as theCost-of-basic-needs method (CBN) (see Figure 3).
Figure 3: The Cost of Basic Needs Method for setting the non-foodallowance
A practical difficulty exists if there is no “group” whose food ortotal expenditure is equal to the poverty line. One possibility is to choosehouseholds whose (per capita or adult equivalent) food expenditure iswithin a small interval around the poverty line and calculate their me-dian total (per capita or adult equivalent) expenditure. Several groupsof households could be chosen at successively larger intervals aroundthe poverty line, and an average of their median total expenditure canbe used as the final poverty line. Another possibility is to use a sub-sample of household survey data to estimate a model of food expendi-

45
tures as a function of total expenditures and other characteristics, suchas household size and age composition, and to use the estimates to pre-dict the nonfood expenditure of households at a given level of foodexpenditure (Ravallion 1994).
Adjustments for price differences and consumption patternsPoverty lines are used among other things, for poverty comparisons.This must mean, for example, if poverty comparisons are made overtime, that the poverty line must be adjusted to account for inflation.This can be done in one of two ways: if the poverty line is anchored in,for example, 1995 prices, current expenditure data (for example, in 2002)can be converted to real terms in 1995 prices. Alternatively, currentexpenditure data can be kept in nominal terms and the 1995 povertyline can be updated to 2002 real terms. Both these methods require asuitable price index.
The cost of living may also vary, at a given point in time, betweenregions, or urban and rural areas of the same country. Adjustment forregional price variation is then necessary (and possible, using house-hold survey data). In a similar manner to that described for temporaladjustments, one of two methods may be used. A regional cost-of-liv-ing index may be constructed, and expenditures adjusted by this indexand then compared against a single, national, poverty line. Alterna-tively, and equivalently, unadjusted expenditures can be comparedagainst region-specific poverty lines. Note, however, that these region-specific poverty lines are region-specific only in terms of prices, andnot consumption patterns. This is known as the principle of consis-tency, or treating individuals with the same living standards equally.
Price adjustments need to take into account differentials in quality.For example, Ravallion and van de Walle (1991) found that, althoughaverage dwelling rents were six times higher in urban Java than in ruralJava, once quality differences were taken into account, the differential
GOOD PRACTICE IN POVERTY MEASUREMENT

46
POVERTY MEASUREMENT: Meanings, Methods and Requirements
was only about 10 percent.When consumption patterns vary widely by region, should poverty
lines be based on different (food) baskets? The question to be asked iswhether the reason for different consumption habits is due to tastedifferences or differences in levels of wealth. Richer urban householdsmay consume a more refined quality of rice than poorer rural house-holds, because they can afford to do so. In this case it is difficult tojustify different food baskets: a single consumption basket based on theconsumption pattern of low-income households in the country as awhole is justified. However, if, in some region of the country, rice isnot consumed at all, owing to some factor other than price, then thereare problems with using a common basket as in the case of East Sumbain Indonesia (CEPA 2003). Some researchers argue for methods such asthe food energy intake method (see below) on grounds of specificity, inthat it reflects better the actual food consumption behaviour of indi-viduals around the caloric threshold given their tastes and preferences,in addition to relative prices.60
One commonly used method that uses separate food baskets is thefood energy intake method (FEI). This method aims to find the mon-etary value of the poverty line at which “basic needs” are met, implic-itly acknowledging that total consumption of goods and services is abetter welfare indicator than food-energy intake per se (Ravallion 1998).The exercise is described graphically in Figure 4.
The easiest way to calculate poverty lines according to the FEImethod is to calculate mean consumption of a sub-sample of house-holds that meet their required calorie intake (in whatever manner).Alternatively, one can regress-separately by sub-sample-food energyintake (not food expenditure) on total consumption, and calculate thepoverty line as the inverse of the function. Like the DCI method, itavoids the need for price data. The problem with the FEI method isthat it allows poverty lines to differ according to tastes, activity levels
60 Asra and Santos-Francisco (2001) explore the issues of consistency and specificity in a reviewof poverty lines in several Asian countries.

47
and relative prices, and other factors that may not be relevant to pov-erty comparisons (Ravallion 1998). For example, in the case of urbanand rural areas, nonfood goods tend to have lower prices in urban ar-eas, and their availability is greater. As a result, the demand for foodand, therefore, food energy intake will be lower in urban areas than inrural areas at any given level of income. But this does not mean urbanhouseholds are poorer. Activity levels in certain urban occupations willbe less than in agricultural occupations, requiring fewer calories (forexample, agricultural labour and factory work, WHO 1985 cited inRavallion 1998) so food intakes may be lower at a given income. Urbanareas may consume more expensive calories. Poverty lines calculatedfor Indonesia, using the FEI method, resulted in urban-rural cost ofliving differences far in excess of the reality, and calculated povertyrates that portrayed urban poverty incidence to be higher than ruralpoverty, when the reverse was the actual case (Ravallion and Bidani1994).
Figure 4: The Food-Energy Intake Method
GOOD PRACTICE IN POVERTY MEASUREMENT

48
POVERTY MEASUREMENT: Meanings, Methods and Requirements
How can genuinely different consumption patterns be accountedfor in constructing poverty lines? One possibility is to choose a refer-ence group (for example, the bottom 40 percent of the population)nationally, and construct separate consumption baskets for the differ-ent regions.
Finally, cost-of-living adjustments, whether spatial or temporal,should be made using prices that are appropriate to the poor. Inte-grated surveys like the Living Standards Measurement Survey (LSMS)include a community-level module on prices, which (if obtained lo-cally, and for items that the poor consume) can be used to constructprice indices. Alternatively, unit values can be constructed (divide house-hold expenditure on items by the quantity consumed of them) which,though not as good as using prices, are better than the alternative ofnot adjusting for cost-of-living differences.
Updating the poverty line between survey years requires the use oflocal consumer price indices. Consumer price indices are constructedfrom two sources: a set of prices, collected on a regular schedule fromretail shops and markets around the country; and a set of weights, whichtypically come from a household expenditure survey. Problems canarise with both components (Deaton 2001). Prices may be difficult tocollect in rural areas, resulting in urban bias, the markets chosen maynot be representative, and enumerators may not observe the pricespeople actually pay. The main problem with weights is when they aretoo old. The Indian Consumer Price Index for Agricultural Labourers(CPIAL) had weights that were 35 years old, when it was revised in late1995. When updating its poverty lines, the Indian Planning Commis-sion re-weights the components of the CPIAL so as to match moreclosely the purchases of people near the poverty line, using weightsfrom 1973-74, which are still dated (Deaton 2001a).

49
Table 3: Summary of approaches to setting an absolute poverty lineComponent of Method Advantages Disadvantages
the Final
Poverty Line
Food Poverty Least-Cost Identifies the lowest cost Food bundle may not
Line (normative) food bundle. Does not accord with actual eating
require detailed habits. Complex-particu-
expenditure data. larly with multiple nutri-
tional minimum.
Expenditure-based Consistent with eating habits Requires detailed house-
(normative) of low-income households. hold-level quantity and ex-
More likely that obtaining a penditure data.
caloric minimum implies
balanced nutrition.
Non-Food Choosing Non- Straightforward and transparent. Arbitrary and paternalistic.
Component Food Bundle Does not require expenditure Requires price data.
(normative) Directly data.
Scaling Up Food Reflects behaviour of low-income Requires household-level
Poverty Line households. expenditure data.
(non-normative)
Source: Olson Lanjouw 1997.
Should poverty lines be increased in real terms over time? A well-known argument is that consumption patterns change over time, thatthere are goods today that were not known several years ago. Whilesome would argue for maintaining the historic reference bundle ongrounds of consistency, others would argue to change the referencebundle to reflect changing consumption patterns on the grounds of
GOOD PRACTICE IN POVERTY MEASUREMENT

50
POVERTY MEASUREMENT: Meanings, Methods and Requirements
specificity. The advantage of the relative poverty line approach is thatit automatically updates the poverty line for inclusion of such changes,as well as changes in the overall level of well-being of the society. An-other approach to incorporate changing consumption patterns is tobroadly define groups of essential goods and services (for example, food,housing, health and education, transportation, personal care), but usehousehold surveys, whenever they are available, to include consump-tion patterns and update poverty lines. This is the approach recom-mended by the National Research Council Panel on revising the U.S.poverty line (Citro and Michael 1995).
The dominance approach or poverty comparisons without povertylinesArguments about arbitrariness of the poverty line will persist, what-ever the method chosen. An alternative to using a poverty line is to usethe dominance approach, which can be used when the purpose of pov-erty measurement is to develop a poverty profile, or to make compari-sons across groups and time. This method is graphical, and uses house-hold data on the chosen indicator (for example, per adult equivalentconsumption expenditure). Cumulative distribution functions for 1985-86, 1990-91 and 1995-96 for Sri Lanka are plotted in Figure 5.

51
Figure 5: Cumulative distribution functions in Sri Lanka,1985-1996
Source: Gunewardena 2000.
The horizontal axis is given in percentages of the poverty line. Sincethe poverty line is denoted in per capita household consumption ex-penditure (Rs.791.67 per person per month in 1995-96 rupees), this isthe underlying metric. For each level of per capita expenditure (ex-pressed as a percentage of the poverty line) reading off the vertical axisfor one of the curves indicates the incidence of poverty that wouldresult if that level had been chosen. For example, at (100 percent of) thepoverty line, the incidence of poverty in 1995-96 is close to 25 percent,in 1990-91 it is a little less than 20 percent and in 1985-86 it is close to 30percent. Looking at the graph one can see that if the poverty line wereto lie anywhere between 50 percent and 250 percent of its current posi-
GOOD PRACTICE IN POVERTY MEASUREMENT

52
POVERTY MEASUREMENT: Meanings, Methods and Requirements
tion (that is anywhere between Rs.396 and Rs.1979 per person permonth) it would always be true that the incidence of poverty in 1985-86 was the highest and in 1990-91 the lowest, among the three timeperiods. This result is robust to a wide range of poverty lines (fromabout 50% to 250% of the reference poverty line).
This approach is useful only when the curves do not intersect. Anintersection of the curves would imply that it mattered where the pov-erty line was located; a comparison of poverty incidence would not berobust anymore.
Underlying this approach is the notion that the usefulness of pov-erty measurement lies in the ability to make poverty comparisons basedon ranking rather than cardinal comparisons. The latter are too “fragileto the specific assumptions that inevitably underlie a particular pov-erty line or poverty measure” (Olson Lanjouw 1997).
2.1.4. Choice of poverty measureTwo theoretical “requirements” of poverty measures are worth dis-cussing before specific measures are discussed. One is the requirementof decomposability, the other is the requirement of continuity. A de-composable measure “allows the breakdown of total poverty into com-ponents, and tells us how much of the overall poverty may be attrib-uted to various population subgroups respectively” (Foster and Sen1997). An intuitive way of understanding this concept is to think ofwhat would happen with measures that are not decomposable: it wouldbe entirely possible for the poverty measure for the whole group (say,for Sri Lanka) to go up while the measure for each subgroup (urban,rural and estate) were to go down.
“Continuity” is also easier to understand in terms of its opposite:discontinuity or the existence of a “jump” at the poverty line. If we areconfident that there really is a “jump” in welfare at the poverty line,and we are confident about the location of the poverty line, then pov-

53
erty measures that are not continuous are a good thing. On the otherhand, if we do not believe the jump occurs at a particular poverty line,then continuity is to be desired. The property of continuity allows ameasure of poverty to give highest priority to the “poorest”. This con-cept is illustrated below with regard to the specific poverty measures.
The Headcount Index (H) is one of the best-known and most widelyused measures of poverty. It measures the incidence of poverty, that is,the percentage of individuals in a given population whose standard ofliving lies below the poverty line. The problem with this measure isthat it disregards inequality below the poverty line, that is, it containsno information on the degree of poverty (shortfall below the povertyline) of each individual. For example, if a transfer of income from apoorer person to a richer person (both of whom start off below thepoverty line) enables that individual to “jump” the poverty line, ac-cording to the headcount index, poverty has decreased; but we disre-gard the effect on the individual who remained below the poverty line,and became poorer.61 Another illustration is that if a poor person wereto die, it would reduce the headcount index, not increase it! (Sen 1976).The advantage of this measure is that it is easy to understand, and it isalso decomposable.
The Poverty Gap Index (PG) remedies the lack of information be-low the poverty line by measuring the depth of poverty. It is the aver-age shortfall between an individual's level of consumption and the pov-erty line, where the shortfall for all individuals whose consumptionfalls above the poverty line is zero. It can be interpreted as a per capitameasure of the total shortfall of individual welfare levels below thepoverty line.
The income-gap ratio (I), which is the percentage average shortfallof the poor from the poverty line, is more intuitive than the povertygap ratio, but it gives no information about the numbers in poverty(another way of saying this is that it only indicates the depth of pov-
61 In the language of social welfare and inequality axioms, it violates the principle of transfers.
GOOD PRACTICE IN POVERTY MEASUREMENT

54
POVERTY MEASUREMENT: Meanings, Methods and Requirements
erty, but not its extent). The poverty gap ratio does both, in that it isthe product of the Headcount Index and the income-gap ratio (H x I).
However, in both these measures, if the transfer from a poorer per-son (poor) to a richer person (poor) leaves the richer person below thepoverty line, the aggregate (and thus, the per capita) shortfall will notchange, because the increase in the poorer person’s shortfall is exactlyoffset by the decrease in the richer person’s shortfall.
Sen (1976) attempted to remedy this by constructing a measure ofpoverty (S) that explicitly included inequality below the poverty line.The original formula for Sen’s index is given by Equation 2:
Equation 2S = H(GP) - PG(1 - GP)
where GP is the gini coefficient among the poor. The equation aboveexpresses poverty as a combination of the headcount index, and thepoverty gap index, specifically as the average of the two, weighted bythe gini coefficient. The problem with the gini coefficient is that it isnot strictly decomposable, and as a result S is also not decomposable. Itis also not a “continuous” measure of poverty.
The Squared Poverty Gap index (PG2) measures the severity of pov-erty. By squaring the shortfall between an individual's level of con-sumption and the poverty line, it places greater weight on poorer indi-viduals. Thus, the squared poverty gap index is sensitive to relativedeprivation among the poor. The headcount index, poverty gap indexand poverty gap squared index are part of a family of measures of pov-erty known as the Foster-Greer-Thorbecke measures that can be de-fined as
Equation 3Pα = (1/n) Σ
x<z [(z-x
i)/z]α

55
where xi is the consumption of the ith individual, z is the poverty
line, n is the population size and α is a non-negative parameter. Whenα is 0, P=H; when α is 1, P=PG; and α is 2, P=PG2 (Foster, Greer andThorbecke, 1984).62 Table 4 summarises the poverty measures describedin this section.
Table 4: Choice of poverty measurePoverty Measure Description
P0
The percentage of individuals in a given population whose
Headcount Index (H) standard of living lies below the poverty line
The incidence of poverty Problem: violates the principle of transfers
I Percentage shortfall of the average income of the poor
Income gap ratio Problem: not sensitive to the number of poor people
P1
The average shortfall between an individual's level of con-
Poverty Gap index (PG) sumption and the poverty line, where the shortfall for all
The depth of poverty individuals whose consumption falls above the poverty line
is zero. Sensitive to the number of poor people. Product of H
and I. (HI)
Problem: not sensitive to transfers among the poor which
leave the richer individual still below the poverty line (the
increase in the poorer person’s shortfall is exactly offset by
the decrease in the richer person’s shortfall)
PS
Expresses poverty as a weighted average of the poverty gap
Sen’s measure of poverty and the poverty gap index where the weight is the gini
coefficient. H(Gp) - PG (1-Gp)
Problem: the Gini coefficient is not additively decompos
able, therefore neither is Sen’s P.
P2
By squaring the shortfall between an individual's level of
Squared Poverty Gap consumption and the poverty line, it places greater weight
index (PG2) on poorer individuals.
The severity of poverty
62 Extensions of the FGT measures have been applied in a dynamic framework (Jalan and Ravallion1998, Christiaensen and Boisvert 2003) as well as in poverty comparisons within a multidimen-sional framework (Duclos, Sahn and Younger 2003).
GOOD PRACTICE IN POVERTY MEASUREMENT

56
POVERTY MEASUREMENT: Meanings, Methods and Requirements
ShortcomingsWhile these measures are used extensively in both developing and de-veloped country poverty measurement exercises, they suffer from sev-eral shortcomings. (1) It has already been stated that they would regis-ter a decrease, not an increase if a poor person were to die. Kanbur(2002) has pointed out that in situations where (large numbers of) poorpeople were to die (such as AIDS victims in Africa, who are mainly therural poor) because of their poverty (inability to afford expensive treat-ment) the FGT measures (or any measures that focus on the currentlyliving) are inadequate.63 (2) They are also not subgroup sensitive(Subramaniam 2003). The following example from Subramaniam (2003)illustrates this. If for example, one divides the population into two sub-groups, A and B, where A is an historically disadvantaged group (like adepressed caste) and the headcount ratio of poverty for A is 0.7 and forB is 0.3, and the groups comprise half the population each, the totalheadcount ratio for the country would be 0.5 (0.7*0.5 + 0.3*0.5). If apure redistribution from B to A were to decrease A’s poverty to 0.6,while increase B’s poverty to 0.4, we may be predisposed (saysSubramaniam) to regard this as an improvement, while the headcountindex registers none (0.6*0.5 + 0.4*0.5) = 0.5. This idea of incorporat-ing what is sometimes termed horizontal equity into measures of pov-erty is somewhat controversial, although subgroup sensitivity is a stan-dard property of measures of inequality. They are (3) not sensitive toinequality around (above) the poverty line. A new approach by Fosterand Szekely (2000) attempts to derive a measure that is more sensitiveto the state of income distribution, where the non-poor also receive aweight-which can be made as small as one wishes.
2.1.5 Uses and limitations of monetary measuresThis section (2.1) has described standard practice in the measurement
63 Kanbur and Mukherjee (2003) attempt to modify the FGT measure so that it is not “perverselymortality sensitive.” Further development of this measure would require confronting deep-rootednormative and philosophical questions such as placing a value on years of life lost (Thorbecke2003).

57
of poverty within the monetary approach. I end this section with abrief discussion of the uses and limitations of these measures.
Poverty comparisons, analysis, informing policy and monitoringThe primary use of these measures is cognitive, in order to know howmany people are poor, and how poor they are, as well as to be able tomake comparisons over time. Monetary measures of poverty are usedto construct poverty profiles, not just for developing countries by theWorld Bank, but also by other researchers and countries (for example,Callan and Nolan 1998 for Ireland). These profiles, in turn, are used foranalysis, as they help to identify the correlates of poverty, and catego-ries of people who are poor, and to monitor the movement of povertyover time. The indicator variable, or a poverty line based transforma-tion of it (that is, consumption as a proportion of the poverty line, xi
/z) is typically used in both static and dynamic econometric analyses ofpoverty and well-being. These analyses in turn, provide guidance forformulating policy as well as providing feedback on the performanceof policy.
Targeting and poverty monitoringThe use of these measures in targeting varies. In several developed coun-tries, the poverty line, defined in income terms, is used as the basis foran income cut-off for government benefits. In developing countries, itmakes little or no sense to do this, as comparing a poverty line that isbased on a measure of consumption, that includes-in large measure-theimputed value of households’ non-market consumption, withhousehold’s cash income is, to say the least, inconsistent. (See section2.1.1 for more details). However, poverty analysis using monetarymeasures can point to broad categories for targeting. Similarly, mon-etary measures of poverty constructed from survey data can be com-
GOOD PRACTICE IN POVERTY MEASUREMENT

58
POVERTY MEASUREMENT: Meanings, Methods and Requirements
bined with census data to construct poverty maps that help with geo-graphic targeting (see section 3.2.4). Apart from such contexts, how-ever, since these measures require survey data that is available onlyintermittently, they are of limited value in continuous poverty moni-toring. This has led to the search for suitable proxy measures (Section2.9).
Limitations of monetary measures of povertyThe “limitations” of monetary measures of poverty include (1) its in-ability to adequately measure deprivation in multiple dimensions (2) itslimitations in capturing more than “snap-shot” measures of poverty (3)its reliance on objective or expert-based determination of standards (4)its focus on absolute poverty and (5) its reliance on quantitative datacollection methods. The rest of this chapter examines the ability ofseveral alternative approaches to address these problems as well as re-cent efforts of economists within the quantitative approach to addresssome of these limitations and so improve the “objective-quantitative”approach. The aspects of multidimensionality and dynamics of povertyare given emphasis in this examination, and are discussed next, in sec-tions 2.2 and 2.3.
2.2 Incorporating multidimensionality in poverty measurement2.2.1 IntroductionIn this section, I begin by describing the inability of monetary mea-sures of poverty to adequately capture multiple dimensions of poverty.I then go on to describe general issues relating to the incorporation ofmultidimensionality in a measure of poverty. Sections 2.2.2 –2.2.4 dealwith each of these issues individually.

59
Monetary measures and multidimensionalityFigure 1 and Figure 2 in Chapter 1 illustrate the point that even thebest measure of monetary poverty leaves many dimensions of povertyunmeasured.
Figure 1 indicates that there are several sources of parametric varia-tion in the conversion of income to functionings (that is, the variousthings we can do or be).64 These include (1) personal heterogeneities(people have different physical characteristics connected with disabil-ity, illness, age, or gender, that make their needs diverse) (2) environ-mental diversities (for example, Climatic conditions, rainfall, floodingetc.) (3) variations in social climate (this includes public facilities such ashealth care and education, the prevalence or absence of crime and vio-lence, and the nature of community relationships)65 (4) differences inrational perspective (someone relatively poor in a rich community mayneed a higher level of income to “function” than an absolutely poorperson in a poor community) and (5) intra-household inequality66
An “economic” conception of poverty would include common prop-erty resources and state-provided commodities, as well as private con-sumption (line 3 in Figure 2). However, the review in section 2.1 hasshown that even the best measure of poverty within the monetary ap-proach is at best a measure of private consumption. Yet, studies showcommon property resources and state-provided commodities to beimportant contributors to well-being among the poor and would-bepoor.
64 See also Sen 1997.65 For example, in Indonesia in 1987 the implicit subsidy to the poorest decile of urban popula-tion through the use of hospitals and primary health centres was twice that received by thepoorest decile of the rural population (van de Walle 1994). In Ghana, World Bank povertyassessment results which illustrated that income poverty had declined by three or four percent-age points (good by African standards) during the period 1987-1991 were met with scepticism,and the underlying perception that poverty could not have declined was supported by the factthat this period coincided with the reduction of many government subsidies to the poor (Kanbur2001).66 Work by Haddad and Kanbur (1990) cited in Coudouel et al. (2001) indicate that relying onhousehold-level data alone could lead to an underestimation of inequality of more than 25 per-cent. Recent initiatives on measuring child poverty (Micklewright and Stewart 2001, White,Leavy and Masters 2002) also recognise the limitations of the income approach in measuringchild poverty. Kabeer (1994) argues that the bias in intra-household welfare distribution suggeststhat women and children are likely to be disproportionately represented in the ranks of thosebelow the poverty line.
GOOD PRACTICE IN POVERTY MEASUREMENT

60
POVERTY MEASUREMENT: Meanings, Methods and Requirements
Consider the following scenario: a country undergoes a period offiscal discipline that leads to growth, which even trickles down to thepoorest deciles, as measured by consumption. However, part of thefiscal discipline involved budget cuts that led to the closing down ofpublicly provided community-level health services. The overall rise inwealth increases the demand for land, and leads to privatising of thecommons. What is the overall impact of these movements on a typical“poor” person? While her consumption increases, she will experience afall in welfare because she either has further to walk in order to gatherfuel, wood and collect water; or she has to depend on less safe sourcesof water. She may now visit the local private sector doctor when herchild falls sick, whose services may actually be of a lower quality thanof the base hospital she used to visit previously. Moreover, because heruse of these services results in monetary expenditure that she did notincur before, this may actually register as an increase in her consump-tion, and thus may show her as being better off than she was before.
Jodha (1995) found that between 1950 and the early 1980s, commonareas declined by 31 percent to 55 percent in study villages in the dryregions of India. It would be misleading to assume that even had mea-sured income poverty decreased over the period, overall deprivationhad also declined. In Britain, the welfare state multiplies the income ofthe bottom 20% four fold through welfare benefits, of which the valueof services received by them (income in-kind) are twice as much as theyearn (Gordon 2002).
Empirical evidence on the relationship between income and otherdimensions of poverty is mixed. Where there is evidence from house-hold survey data, it appears that the multiple dimensions of poverty dogo together; for example, years of education increase with income, thepoorer are sicker, and so on (Kanbur and Squire 2001). “Individualswith lower incomes on average also have lower welfare in other dimen-sions … However, it is also noticeable that the correlations are rather

61
modest-income usually explains very little of the variation in non-mon-etary welfare indicators (Appleton and Song 1999: 25).
A related question that recent research focuses on, is whether in-come growth will be sufficient to reduce non-monetary dimensions ofpoverty such as under-five mortality, and child malnutrition. The an-swer appears to be in the negative: publicly provided services and inter-ventions still have a major role to play (Haddad et al. 2003, World Bank2003).
Given the limitations of the standard income or monetary approachin measuring non-monetary dimensions of poverty, what possibilitiesexist for the incorporation of multidimensionality in the measurementof poverty? This question is addressed in the rest of section 2.2 as wellas where appropriate in sections 2.4 -- 2.9.
Issues and approachesMeasurement issues in a multidimensional context may be (a) dimen-sion specific, or (b) arise from the fact of multiple dimensions (Qizilbash2003). As with the monetary approach to poverty measurement, anymultidimensional measure of poverty must address the problems ofidentification and aggregation.
The identification problem relates to the familiar choices of units ofanalysis, indicators and thresholds. However, the choice of indicator isnow also a question of choosing dimensions of well-being, and the choiceof poverty line or cut-off now refers to identifying the appropriate levelthat determines adequacy in each of the multiple dimensions. In addi-tion to this is the further question of how to identify someone as poor-whether one takes a union or intersection to this problem. A union orintersection approach regards someone as poor if he/she is poor in anydimension relating to poverty (Bourguignon and Chakravarty 2002,Brandolini and d’Alessio 2001) and an intersection approach identifies
GOOD PRACTICE IN POVERTY MEASUREMENT

62
POVERTY MEASUREMENT: Meanings, Methods and Requirements
someone as poor if he/she is poor in all the specified dimensions.A third approach is to estimate multidimensional poverty lines, that is,classify the poor if they are poor in terms of some overall index oraverage of indices relating to poverty (Klasen 1997 and 2000). This hasbeen termed the intermediate approach by Duclos, Sahn and Younger(2003) where an individual may be poor if he/she is below some pov-erty line that applies to all dimensions.67
The aggregation problem now refers, in addition to the problem ofaggregating across individuals, of individual well-being status (and therelated problem, dealt with in the choice of poverty measure of how toweigh the extent of deprivation in each dimension), to the problem ofaggregating across individual indicators or dimensions, leading to theproblem of the choice of weights to be given to each of the multipledimensions to be aggregated.
These are discussed further in sections 2.2.2 – 2.2.4.
2.2.2 Choice of dimensions and indicatorsThere appears to be little disagreement regarding the dimensions thatneed to be included in a multidimensional measure of poverty. Thepyramid in Figure 1, to a large extent, expresses the growing consensusas to what these dimensions should be. An alternative depiction of themultiple dimensions of poverty defined in terms of capability depriva-tions (see section 2.6) is given in Figure 6 below.
However, when it comes to operationalizing these dimensions in avector of well-being indicators, there is wide variation in the indicatorsused, and few guidelines on the basis for inclusion.
Indicators may be chosen as direct measures of poverty (for example,using a capabilities, basic needs or social exclusion approach) or as proxiesof consumption (poverty). In the latter case, the guiding principle isobvious, and statistical or econometric methods are used to identifythe indicators that correlate best with (consumption) poverty (See Ap-pendix D on asset-based indices for an example).
67 See section 2.2.3

63
Figure 6: Dimensions of capability deprivation
Source: DAC/OECD Guidelines on Poverty Reduction 2001, Paris, cited in Gsaenger
2003.
When the indicator is expected to be a direct measure of well-beingor deprivation, the guidelines for choice are less clear.68 However, policy-oriented studies in the last few years have generated several principlesor criteria that should be applied to such indicators.
Atkinson et al. (2002) identified a set of six basic principles or prop-erties that each indicator should satisfy: (1) Clarity and lack of ambigu-ity (2) robustness and validation (3) policy responsiveness (and lack ofmanipulation) (4) Comparability (across countries) and consistency (whatis being measured is consistent across time and space) (5) timeliness (butsubject to revision) and (6) avoidance of unnecessary informational bur-den on states, enterprises and citizens.69
Achibache et al. (2001) provide some general guidelines to identify agood impact/outcome indicator. It (a) provides a direct and unambigu-ous measure of progress-more (or less) is unmistakably better (b) is rel-evant-it measures goals or factors that have an impact on the goals (c)
68 One author refers to the underlying imprecision about the dimensions of well-being which arerelevant to the poverty evaluation exercise as “horizontal vagueness” (Qizilbash 2003).69 In a report prepared for the Council of the European Union on indicators of social exclusion.
GOOD PRACTICE IN POVERTY MEASUREMENT

64
POVERTY MEASUREMENT: Meanings, Methods and Requirements
varies across areas, groups, over time, and is sensitive to changes inpolicies, programs, institutions (d) is not easily blown off course byunrelated developments and cannot be easily manipulated to showachievement where none exists (e) can be tracked (better if already avail-able), is available frequently, and is not too costly to track.
Ravallion (1996) outlines the following list of what he calls “Ingredi-ents for a Credible Approach to Poverty Measurement”: (1) A sensiblepoverty measure based on the distribution of real expenditure per singleadult covering all market goods and services (including those obtainedfrom non-market sources), (2) Indicators of access to non-market goodsfor which meaningful prices cannot be assigned, such as access to non-market education and health services (3) Indicators of distribution withinthe household, measures of gender disparities and child nutritional sta-tus (4) Indicators of certain personal characteristics which entail un-usual constraints on the ability to escape poverty, such as physical handi-caps or impairments due to past chronic undernutrition.
The different approaches to measuring poverty provide additionalguidelines to selecting indicators. For example, a typical list of indica-tors following the capabilities approach is suggested by Nussbaum (2000).
Table 5: Nussbaum’s list of features essential to full human life
1. Life: normal length of life
2. Health: good health, adequate nutrition and shelter
3. Bodily integrity: movement; choice in reproduction
4. Senses: imagination and thought, informed by education
5. Emotions: attachments
6. Practical reason: critical reflection and planning life
7. Affiliation: social interaction, protection against discrimination
8. Other species: respect for and living with other species
9. Play
10. Control over one’s environment, politicall (choice) and materially (property).
Source: Nussbaum 2000

65
However, this has been criticised as (a) being based on a very smallsample of views and (b) representing a Western late-20th century con-ception of the “good life” (Ruggeri-Ladderchi et al. 2003). There is con-siderable overlap between this list and other lists of basic needs, socialexclusion indicators and proxies for poverty. For example, indicatorsof social exclusion in developed countries include unemployment, ac-cess to housing, minimal income, citizenship, democratic rights andsocial contacts, households with children living in poverty, teenagemothers (see List E1 and Table E1 in Appendix E).
A list of components that correspond to the capability deprivation,outlined in Figure 6, and are more appropriate in a developing countrycontext, is given in Table E2 in Appendix E.
A similar list of eight broad components of poverty that are identi-fied in IFAD’s rural poverty report for 1992 is given in Table 6.
Table 6: Eight broad components of povertyPoverty Measure Description
Material deprivation Inadequate food supplies, poor nutritional status, poor health,
poor education, lack of clothing and housing, fuel insecurity,
and absence of provisions for emergencies.
Lack of assets Material assets (land, agricultural inputs,etc.) and human
capital (education, training, etc.)
Isolation Social, political and geographic marginalisation (remote areas
with limited access to transport, roads, markets and
communication links).
Alienation Isolation and exploitative social relations, includes people who
lack identity and control, are unemployed or underemployed,
lack marketable skills, and have limited access to training and
education
GOOD PRACTICE IN POVERTY MEASUREMENT

66
POVERTY MEASUREMENT: Meanings, Methods and Requirements
Table 6: Eight broad components of poverty contd.Poverty Measure Description
Dependence Skewed dependency relations such as between landlord and
tenant, employer and employee, creditor and debtor, buyer and
seller, or patron and bonded labourer
Lack of decision Limited participation and freedom of choice
making power
Vulnerability to Nature (droughts, floods, cyclones, locusts), markets (collapse
external shocks in commodity prices, labour supply and demand), demography
(loss of bread winner, death, divorce), health (illness of bread
winner) and war Insecurity Risk of being exposed to physical
violence
IFAD 1992, cited in Sumner 2003
Sumner (2003) provides a list of indicators that are commonly used,which capture many of the dimensions and components outlined above.This list includes a list of indicators reflecting empowerment and par-ticipation, in addition to education, health and nutrition and environ-ment indicators. Several of these are Millennium Development Indica-tors (indicators to monitor the achievement of targets relating to theMillennium Development Goals (MDGs) agreed upon by the interna-tional community).70
70 See www.paris21.org/betterworld

67
Table 7: Most commonly used non-economic well-being measuresIndicators
Educat ionEducation enrolment rates*
Survival to the final primary or secondary school grade/completion of primary or
secondary school
Literacy rates
Health and nutritionMalnutrition rates* /food or calorie consumption per capita/Body
mass index
Mortality and morbidity rates*/life expectancy/not expected to
survive forty years/infection rates*
Health service usage-skilled personnel at birth*/contraceptive
prevalence rate*/immunisation rates*
Env i r o nmen tAccess to “improved” water sources
Access to “adequate”sanitation
Household infrastructure-permanent material used for walls of home and electric-
ity supply
Empowerment and participationParticipation in general and local election voting (decision making at
various levels)
Extent of knowledge of local projects and district budgets (access to
information)
Number, size and revenue of active NGOs (potential for civil society
monitoring)
Note: * denotes the indicator is a Millennium Development Goal
Source: Sumner 2003.
GOOD PRACTICE IN POVERTY MEASUREMENT

68
POVERTY MEASUREMENT: Meanings, Methods and Requirements
The subjective approach provides a criterion for choosing amongindicators, known as the “consensual” approach: to include indicatorsthat more than 75% (or a similar percentage) of households consideredto be absolutely necessary (Razafindrakoto and Roubaud 2003, alsoDirven, et. al. 1998, Mack and Lansley 1985).
While indicators that measure non-monetary dimensions of pov-erty need to be universally applicable, they will also need to be some-what location specific. Participatory studies can yield indicators, whichare identified by the population that is being studied. A well-knownlist of “ill-being” indicators drawn from participatory studies is givenin Table 8.
Table 8: Criteria of ill-being
Being disabled (for example, blind, Suffering the effects of destructive
crippled, mentally ill, chronically sick) behaviours (for example,
alcoholism)
Lacking land, livestock, farm Being “poor in people”, lacking
equipment, a grinding mill social support
Being unable to decently bury their Having to put children in
dead employment
Being unable to send their children Being single parents
to school
Having more mouths to feed, Having to accept demeaning or
fewer hands to help low-status work
Lacking able-bodied family Having food security for only a
members who can feed their few months each year
families in a crisis
Having bad housing Being dependent on common
property resources
Source: Chambers 1995

69
A comprehensive set of indicators used in various contexts, andwithin various approaches is given in Appendix E. These expand onthe lists given above and include education and occupation of house-hold members, demographic composition and indicators of food secu-rity and vulnerability.
Ultimately, the choice of indicator may respond to philosophical pre-conceptions (beliefs that self chosen, participatory or basic needs indicesare inherently better than economic indicators),71 to data limitations,or to the results of analysis (ranging from statistical techniques to partici-patory studies). When choosing from among these indicators, a usefulguiding principle is to explore the tradeoffs inherent in the choice ofindicators. This will include (a) the assumptions that are made, the prac-tical implications in terms of (b) costs, (c) technical requirements, (d)errors of inclusion and exclusion and (e) characteristics of the chosenpopulation (Davis and Siano 2001).
2.2.3 Choice of thresholdsThe choice of threshold in a multidimensional approach has to dealwith the location of appropriate thresholds in each of the unitary di-mensions that are components of the overall multidimensional index,as well as address the issue of identification in relation to the dimen-sions taken together.
The choice of threshold in a unidimensional setting for non-mon-etary indicators must address issues similar to those raised in relation tomonetary measures, in section 2.1.3. While the discussion in that sec-tion indicated the problems of robustness that can plague the choice ofa monetary poverty line, the same applies to many of the indicatorsthat are used in composite indices of poverty. However, discussion ofthe problem of choosing thresholds in the dimensions is rare (com-pared to that in the monetary approach).
71 Or the opposite. See the note to Table E1 in Appendix E.
GOOD PRACTICE IN POVERTY MEASUREMENT

70
POVERTY MEASUREMENT: Meanings, Methods and Requirements
Several indices that have long been used in practice use such thresh-olds.72 For example, two of the component indicators of the HPI-1percentage of children under 5 who are underweight, percentage ofpopulation with access to improved sources of water have explicit thresh-olds.73 Many of these thresholds indicate some kind of natural or obvi-ous cut-off that is often determined by expert knowledge (for example,as in the classification of water sources into safe and unsafe), sometimeswith the aid of reference data (as in the case of the determination of thecut-off for measures of undernutrition).
However, more often, the location of such a threshold is less obvi-ous, and is often arbitrary. This is less of a problem when the indicatoris used separately, as the measure is transparent and evident. On theother hand, when an indicator that is based on a threshold, as for ex-ample, the longevity indicator in the HPI (probability at birth of livingup to age 40), is combined with other indicators into a composite in-dex, the implications of using that particular threshold become less evi-dent.
One approach used to resolve the problem is the use of the so-called“consensual” or “consensus” approach, where surveys or participatorystudies indicate not only which indicators are appropriate, but whichthresholds apply as well.74
Recent methodological advances include the use of the Fuzzy SetTheory to determine thresholds. The Fuzzy Set Theory has been advo-cated where concepts are vague, that is, there is no definite criteria fordiscerning which elements do and do not belong to a particular set, butrather there is a continuum of grades of membership.75 For this reason
72 Except in the case of multidimensional indices constructed purely by ranking.73 That is, the cut-off that determines whether a child is underweight or not, and the demarcationbetween sources of water that are safe and unsafe.74 The application of the subject approach in the measurement of social exclusion in Britain is anexample. See Table E1 and List E1 in Appendix E.75 Qizilbash (2003) refers to this as “vertical vagueness”, as distinct from vagueness about thedimensions of well-being relevant to the poverty measurement exercise, or “horizontal vague-ness”.

71
it has been said to be particularly appropriate to the measurement ofpoverty (Miceli 1998).76
The recent application of the Fuzzy Set Theory provides method-ologies to incorporate both “absolute” and “relativist” approaches tothe measurement of multidimensional poverty (Cerioli and Zani 1990)as well as methodologies (totally fuzzy and relative method or TFR)that avoid the use of arbitrary threshold values (Cheli and Lemmi 1995).
Once the problem of appropriate thresholds in each of the compo-nent dimensions has been dealt with, one needs to deal with the prob-lem of identification of the poor, taking into account all the dimen-sions, that is, derive multidimensional poverty lines. Since this involvesaggregation across multiple dimensions, it is dealt with in section 2.2.4.
Duclos, Sahn and Younger (2003) provide a methodology for pov-erty comparisons in the spirit of the stochastic dominance literature,which is robust over a broad range of poverty lines (as in the unidimen-sional approach outlined in section 2.1.3) which applies equally well to“union”, “intersection” and “intermediate” approaches to poverty iden-tification in a multidimensional approach (see section 2.2.4).
2.2.4 Choice of weights, or how to aggregate?There are two distinct positions in relation to the incorporation ofnon-income dimensions in the measurement of poverty. One has beencalled the radical multidimensional approach that advocates povertycomparisons within each dimension independently of each other with-out aggregation. The other is to aggregate the multiple dimensions us-ing specific aggregation rules or aggregative strategies. These strategiesare shown in from Brandolini and D’Alessio (2000).
76 If Y is a set of y individuals (i=1, ...,y) and A, a fuzzy subset of Y, the set of poor people. Inthe fuzzy approach fA(i) the membership function to the poor set is defined as :fA(i) = 0 if individual i is absolutely non-poor0<fA(i) < 1 if individual i reveals a partial membership to the poor set.fA(i) = 1 if individual i completely belongs to the poor setThe entire problem in this approach consists in the formalisation of the membership function(Fusco 2003).
GOOD PRACTICE IN POVERTY MEASUREMENT

72
POVERTY MEASUREMENT: Meanings, Methods and Requirements
Figure 7: Strategies for multidimensional measurement
Source: adapted from Brandolini and D’Alessio (2000).
The radical multidimensional positionThe extreme or radical multidimensional position is that a syntheticindex is not essential or desirable, a view held by those who espouse themonetary approach, as well as by those who are among its strongestcritics (Ravallion 1996, Kabeer 1989). Ravallion (1996) explicitly ad-vises against
“adding up multiple indicators into a single scalar metric when there isno obvious basis for setting the trade-offs. It is not clear what meaning canbe attached to the result and the aggregation also wastes information; it canbe important to know that region A is doing well in the income space, butnot in basic health and schooling, while in region B it is the reverse. Rather,what seems to be called for is a genuinely multi-dimensional approach inwhich expenditure on market goods sits side-by-side with “non-income” in-dicators of access to non-market goods and indicators of intra-householddistribution.”
Ravallion (1996)

73
This approach tends to be a supplementation strategy, where in-come poverty measures are supplemented with other measures. All in-dicators are considered one by one, by studying their univariate char-acteristics. The problem is that, as the number of dimensions grow,one cannot do justice to all the information that is contained therein.77
Aggregating multiple dimensionsIn classifying approaches to aggregating multiple dimensions of povertythe World Development Report 2000/2001 (World Bank 2001) refers tothree approaches: (1) Alternative aggregation rules (2) The welfare func-tion approach and (3) Composite index approach.78 One can attempt tofit these into the framework in Figure 7. Thus, “non-aggregative” strate-gies of the figure are described here as aggregation rules, while the wel-fare function approach cited here is the approach used in the multidi-mensional poverty indices of Bourguignon and Chakravarty (2002) re-ferred to in the figure. Well-being indicators referred to in the figure arethe composite indices described in this section.
Aggregation rulesAggregating across multiple dimensions (as in aggregation across indi-viduals of individual well-being statuses) requires specific aggregationrules. Two commonly used rules are those of union and intersection.The implicit requirement is that each dimension uses a threshold, be-low which the population is considered poor or deprived in that di-mension, and there is a dichotomous division of the population foreach division such that they fall into poor and non-poor categories(DANE 1989). Typically, one of the dimensions used is that of incomepoverty.
Duclos, Sahn and Younger (2003) illustrate the typical approachesin Figure 8. X and Y are two dimensions along which well-being is
77 The practical implication is that a donor who would like to know “which is the neediestdistrict” in terms of X, Y and Z, cannot be given a direct answer with only one “neediest”candidate district.78 The discussion of partial ordering and complete orderings is found in section 2.6.4 under thecapability approach.
GOOD PRACTICE IN POVERTY MEASUREMENT

74
POVERTY MEASUREMENT: Meanings, Methods and Requirements
measured (for example, health and consumption). ZX
and ZY are pov-
erty lines in the X and Y dimensions respectively. An unknown pov-erty threshold separates the poor from the rich. This threshold can bethought of as a series of points at which overall well-being of the indi-vidual is equal to the “poverty level” of well-being, and below whichindividuals are in poverty. λ
1 (the thick dotted line in Figure 8) is a
poverty threshold that uses the concept of intersection, that is, only ifan individual is poor in both X and Y dimensions (health poor andconsumption poor), is he is considered to be poor. The concept of union,where an individual is considered poor, if he is poor in either (any) ofthe dimensions (health poor or consumption poor) given by the finelydotted L-shaped line λ
2.
The poverty line λ3 provides an intermediate approach, where even
if an individual is not poor in one dimension, he/she would be consid-ered poor if his/her well-being in other dimensions is sufficiently low.In other words, in this approach individuals are classified as poor ifthey are poor in terms of some overall index or average of indices relat-ing to poverty.79
Figure 8: Union, intersection and intermediary poverty thresholds
Source: Duclos, Sahn and Younger, 2003.
79 Note that this is equivalent to saying that the poverty line in one dimension is a function ofwell-being measured in another.

75
Welfare functionsA welfare function approach uses various dimensions of well-being,allows for trade-offs, and defines a threshold or minimum level of totalwelfare. It typically uses an intermediate approach in terms of aggrega-tion rules. The welfare function approach attempts to make ethical andtheoretical implications of different aggregation rules explicit. The dif-ficulty lies in finding a suitable welfare function for comparisons be-tween non-market elements of welfare. Recent attempts at multidimen-sional poverty measurement specify a poverty threshold for each func-tioning, look at the shortfalls of the functioning quantities of differentindividuals from the threshold levels, and aggregates these shortfallsinto an overall magnitude of poverty (Bourguignon and Chakravarty2002, cited in Chakravarty and D’Ambrosio 2003).
Composite indices and statistical methodsComposite indices, which impose weights rather than using weightsestimated from peoples’ choices, are useful for advocacy and cross-coun-try comparisons (such as the Human Development Index and the Ca-pability Poverty Measure and Human Poverty Index).
Composite indices are constructed by combining separate indicesthat are calculated in a relative way, or ranked (for example, the lifeexpectancy component of the HDI calculates actual life expectancy rela-tive to the minimum, as a proportion of the range of life expectancy,that is, the maximum minus the minimum). Other indices (for example,in Latin American statistical offices) combine ranks of variables, ratherthan actual values. Because rankings, or relative achievements are notnecessarily highly correlated, combining them together can make themdifficult to interpret. There is no objective basis for selecting the weight-ing or ranking schemes on which aggregation is based (Ravallion 1996).Thus, implicit trade-offs are included which were never intended. Thereis no explicit role for examining trade-offs within this approach. Ap-pendix F describes the construction of some well-known compositeindices.
GOOD PRACTICE IN POVERTY MEASUREMENT

76
POVERTY MEASUREMENT: Meanings, Methods and Requirements
The problem of weighting a composite index has at least six solu-tions in the literature. The first is (1) to use equal weights. This methodis used because the alternative of assigning weights is considered arbi-trary. However, this amounts to saying that the welfare value of own-ing a radio is the same as having access to a flush toilet which, in turn,is the same as having safe drinking water (Falkingham and Namazie2002). This is, unfortunately, a very commonly used procedure (seereview of demographic studies in developing countries by Montgom-ery et al.)80 used by researchers in developed and developing countries.Filmer and Pritchett (1998) state that its only advantage is that it doesnot appear to be as arbitrary as it really is!
A second method is to (2) use weights determined by some form of“consultative” process. This may be from households themselves suchas the weighting procedure described in Townsend’s “subjective depri-vation scale” above (see also Dirven 1998) or a group of experts andpolicy analysts [as in Bolivia, Navajas et al. (2000) or the weights usedin the calculation of the Human Poverty Index chosen by Anand andSen (1997)].
Another method is (3) which is used in constructing asset-based in-dices is to use information on assets together with price data to con-struct a household wealth index. The difficulty in doing this is thatreliable price information is not always available.
The fourth solution, also from the asset index literature is (4) to usethe asset variables as explanatory variables in a multivariate regression(say, if educational attainment were the dependent variable, householdasset ownership variables are used on the right-hand side as explana-tory variables).81 However, because some of these assets are both out-comes and measures of wealth themselves, as well as being inputs intoother outcomes (for example, electricity is an indicator of wealth, but
80 A list of these studies is given in Appendix G.81 This is the approach used and recommended by Montgomery et al. (2000).

77
it is also an input into studying, which affects schooling outcomes), themeasured effect in these regressions is not a wealth effect. Thus, al-though the regression coefficients can be used as a linear “index” of theasset variable that best predicts the dependent variable (for example,educational attainment) the index cannot be interpreted as the effect ofan increase in wealth on educational attainment.
Two more solutions (also from the asset index literature) in theform of (5) principal component analysis (used by Filmer and Pritchett1998) and (6) factor analysis (used by Sahn and Stifel 2000) extract thecombination of variables that best captures the common informationfrom all the variables. The assumption used in both these methods isthat there is a common factor “welfare” behind the ownership of theseassets.
The statistical methods of factor analysis and principal componentsanalysis define (in slightly different ways) that factor as a weighted sumof the individual assets. Sahn and Stifel (2000) found that the two meth-ods yielded similar results: the Spearman rank correlation coefficientfor the indices to be about 0.98, while Hewett and Montgomery (2001)in a study of developing-country cities found that living standards in-dexes derived from the two methods vary empirically with the educa-tion of household head and by city size. Sahn and Stifel (2000) arguethat the factor analysis method is better because the model and assump-tions are made explicit, and provide guidance on which assets should orshould not be included in the index. Many recent studies have used thesimpler principal components methods (Zeller 2001). Yet Hewett andMontgomery (2001) argue that factor analysis is better grounded intheory and more appropriate for the purpose.82
Another approach that has been recently applied to the analysis ofwell-being (DiTomaso 2003) is the multiple indicator multiple causes
82 Both of these methods may be unsatisfactory in the case of latent variables. Latent variables aremetrical or categorical variables which underlie the observed binary (taking value 0 or 1) vari-able that is used in the construction of an index. In this case latent trait analysis or latent classanalysis is more appropriate than either principal components or factor analysis (Bartholomew,et. al. 2002, cited in Falkingham and Namazie 2002).
GOOD PRACTICE IN POVERTY MEASUREMENT

78
POVERTY MEASUREMENT: Meanings, Methods and Requirements
(MIMIC) approach, which has been used extensively in psychometricsand more recently in econometrics and is founded upon the specifica-tion of a system of equations which specify the relationship between aset of unobservable latent variables, a set of observable endogenousindicators, and a set of observable exogenous variables.
2.3 Measuring the dynamics of povertyIt has long been accepted in the poverty literature that it is imperativeto understand the dynamics of poverty. Dealing with the issue of dy-namics in the measurement of poverty has a somewhat more recenthistory. Qualitative approaches that focus on processes have tended topay more attention to the dynamics of poverty than quantitative ap-proaches that are said to reveal only “snapshots” of poverty. However,there has been a recent increase in the emphasis on the dynamics ofpoverty. Within the capability approach, some have argued that “be-coming” is as important a category of analysis as “being” and “doing”(Comim 2003). Within quantitative and qualitative approaches, meth-odological advances include (a) methods to distinguish between pov-erty that is transient, and poverty that is permanent or chronic, andmovements in and out of poverty, as well more recent work that (b)attempts to understand the evolution of capabilities (D’Agata 2003) orthe adaptive processes that influence subjective well-being (Burchardt2003). It is the former literature, and in particular the identification ofchronic poverty, that this chapter focuses on.
There is growing recognition that transitory and chronic povertyare caused by different processes and have different routes out of pov-erty, with important implications for policy. The different approachesto understanding poverty differ in their approach to the measurementof the time duration of poverty. These are reviewed in this section.83
83 This section draws primarily on two sources: (a) 14 articles in the March 2003 issue of WorldDevelopment which used a variety of approaches to conceptualising and analysing chronic pov-erty, and (b) the section on measuring vulnerability in Coudouel et al. (2001).

79
Two main methods are used to measure chronic poverty (McKayand Lawson 2003). The first of these uses longitudinal or panel data,and typically, though not necessarily focuses on monetary measures ofliving standards. A variant of this approach uses non-monetary mea-sures (for example, measures of malnutrition or illiteracy) with similar(panel) data and analysis. Panel data analyses will necessarily look atshort-term fluctuations in poverty because the data being used will typi-cally not be more than ten years in duration, and is usually less.84 An-other approach is to use information that is obtained at one point intime but which offers evidence on chronic poverty. This may be ob-tained from retrospective questions or life histories, or one-time indica-tors that have implications for duration, such as illiteracy or stunting(McKay and Lawson 2003).
2.3.1 Measuring chronic poverty using panel dataThe quantitative approach to poverty measurement typically uses paneldata. The advantage of using panel data is that it allows the analyst totrack the dynamics of poverty at the most disaggregated level possible—typically the level of the household. Panel data analysis uses two mainapproaches: spells and components. These are discussed below.
Poverty spells, survival, entry and exit ratesA poverty spell is defined as beginning when an individual moves intopoverty (that is, to be poor in a particular period having not been poorin the previous period) and ending when the individual moves out ofpoverty (that is, not being poor in a particular period having been poorin the previous period). Exit rates and survival rates can be calculatedfor specific time periods.
A household is classified according to the frequency or duration of
84 Note that this is due to the recent availability of panel data in developing countries. However,because of attrition, even the best of long-term panel datasets will also be limited.
GOOD PRACTICE IN POVERTY MEASUREMENT

80
POVERTY MEASUREMENT: Meanings, Methods and Requirements
the spells of poverty they experience. Typically, criteria vary amongstudies. The most stringent one is that which defines a household aschronically poor only if it is poor in all the periods under examination.Another criterion is to consider a household chronically poor if it ispoor in a consecutive number (say, three) of periods.
Table 9: Long term poverty according to the “poverty spells” indi-cator and two poverty lines: survival rate (%): 1985-90Poverty spells (survival rate after n-years) 1 2 3 4
National Social Minimum Income
(NSMI) Total population 28.7 13.9 2.5 0.0
Subjective Poverty Line (SPL) Total population 56.3 39.2 26.1 23.4
Dirven et al. (1998)
Alternatively, entry and exit probabilities can be computed.
Table 10: Entry and exit probabilities, rural Pakistan, 1986-91Probability of entering poverty Probability of escapingfor non-poor households poverty for poor households
1986/87-1990/91 24 49
Source: Baulch and McCulloch 1998
Transition matrices depict movements in and out of poverty. In thetable below, the last row and last column give total percentages of thepoor and non poor in the respective years. The first row and columnindicate the percentage of those who were poor in both periods, whilethe second row and second column indicate the percentage of thosewho were not poor in both periods. The first row and second column

81
indicate those who escaped poverty in the second period, while thefirst column and second row indicated those who entered poverty inthe second period.
Table 11: Movements in and out of poverty in rural EthiopiaCell percentage Status in 1995Status in 1989 Poo r Non poor Total
Poor 31 30 61
Non poor 15 24 39Total 46 54 100
Source: Dercon 1999
These measures can be used to detect the correlates and determi-nants of vulnerability. For example, Duncan et al. (1993) found thatpoverty spells in the Netherlands were related to labour market events(losing work, reduced working hours) and household formation events(divorce or separation). Muller (1997) used transition matrices to dis-tinguish between seasonal and non-seasonal poverty.
Components of povertyIn the components approach, an attempt is made to distinguish thepermanent component of the welfare indicator (usually income or con-sumption) from transitory shifts. The permanent component is basedeither on the average over time, or a prediction of household consump-tion based on known household characteristics. In the example givenin Table 12, households that are always below the poverty line areclassified as persistently poor, while those who are always above it areclassified as never poor. In between are those who, on average, arebelow the poverty line, but are sometimes above it (called the chroni-
GOOD PRACTICE IN POVERTY MEASUREMENT

82
POVERTY MEASUREMENT: Meanings, Methods and Requirements
cally poor) and those who are on average above the poverty line, butsometimes below it (called the transiently poor).
Table 12: Classification of households in rural China over 1985-1990 (Percentage)
Persistent ly Chron i ca l l y Trans i ent ly Nev e rP o o r p o o r poor p o o r
Full Sample (Guangdon,
Guangxi, Guizhou and
Yunnan provinces) 6.2 14.4 33.4 46.0
Source: Jalan and Ravallion 1999
Nonmonetary dimensions of chronic and transitory deprivationAlthough most existing empirical analyses of chronic poverty have beenbased on monetary measures of living standards, the methods describedabove can be used with indicators other than income or consumption.Such measures could include measures of health, education, and subjec-tive measures of deprivation. Dirven et al. (1998) compared povertyspells based on income (using the European Commission’s relative pov-erty line at the time-of 50 percent of median standardised householdincome) and poverty spells based on responses (very difficultly or diffi-cultly) to the question “How did you get along with your householdincome in the previous twelve months?” and found that survival ratesaccording to the second (subjective) definition dropped drastically, whilefor income, the decrease was much slower.85
85 A description of the subjective approach is given in section 2.9.

83
Table 13: Long-term poverty according to the poverty spells indica-tor using below 50% of median standardised household income (1985-94) and having difficulties getting along (1985-95).Poverty spells(Cumulative survival rates after n-years) 1 2 3 4 5
Below 50% of the median 44.2 32.7 26.7 20.9 20.9
Difficulties getting along 41.2 22.6 13.9 9.1 6.8
Dirven et al. 1998.
Baulch and Masset (2003) use panel data from the 1992-3 and 1997-98Vietnam Living Standard Surveys (VLSS) to measure chronic povertyaccording to a number of indicators and dimensions (Consumptionpoverty, food consumption poverty, stunted children, malnourishedadults and children never in primary school). The null hypothesis ofindependence between monetary poverty indicators and nonmonetarypoverty indicators can always be rejected, but overlap between subcat-egories of chronic poverty was generally modest. For example, theyfound a low correlation between chronic monetary poverty and chronicstunting which, on further analysis, turned out to be due to the lowcorrelation between monetary poverty and stunting in any one year. Asimilar pattern was observed for the correlation between adult malnu-trition and monetary poverty. On the other hand, poverty profilesreveal that many, but not all, of the characteristics associated withchronic food poverty (which is also a measure of extreme consumptionpoverty) are shared by the chronically stunted and the never-educated(children).86
Some indicators are more likely than others to vary or fluctuateover the relatively short time horizons presented by the available panel
86 For example, children who are chronically stunted and have never attended primary schoolare, like the chronically food poor, most likely to come from a large, ethnic minority householdliving in a remote rural commune in the mountainous Northern Uplands or Central Highlandsregions. This is not true of chronically malnourished adults, most of whom live in the Red Riverand Mekong Deltas, plus the Southeast, and come from the Kinh-Hoa majority (Baulch and Masset2003, p. 451).
GOOD PRACTICE IN POVERTY MEASUREMENT

84
POVERTY MEASUREMENT: Meanings, Methods and Requirements
data. Height-for-age, for example, as a measure of chronic malnutri-tion, or literacy, cannot be used in the manner described above, but arein themselves measures of chronic deprivation.
Measurement issuesThe accuracy with which the poverty line is estimated is important inthe measurement of poverty, especially when a spells approach is used.If a household is just above the poverty line most of the time, it willnot be considered chronically poor, according to some of the methodsdescribed. A measure that takes into account duration, rather than fre-quency of poverty spells is subject to similar sensitivity to the povertyline. Given that the data is truncated in time (one has no informationfor the period before and after the survey period, and in cases wherethe panel is non-consecutive, in between as well) a household maybewrongly classified as transiently poor. Studies using both approacheshave found that the components approach produces 5-25% more chroni-cally poor people (Yaqub 2003).
The estimation of prices takes on special significance in the estima-tion of transitory poverty. The use of the consumer price index (CPI)may not be appropriate if prices in the reference bundle do not moveparallel with the CPI (Thorbecke 2003). The use of the same real mon-etary poverty line (expressed as an annual average) may not be appro-priate in the face of large seasonal fluctuations when one is trackingtransitory poverty.
2.3.2 Measuring chronic poverty without panel dataAll the examples cited above used panel data. When panel data is notavailable, repeated cross-sections may be used to track poverty dynamicsfor regions or clusters, though not for households (Wodon 1999). Whilethis will not reveal information about poverty dynamics within these

85
broad areas, it is more likely that chronic poverty exists in areas thatexhibit few changes in poverty levels over time.
When only a single cross-sectional survey is available, it is possible tobuild measures of vulnerability that rely on variation within commu-nities or other subgroups or external information on the seasonality ofprices and production. For example, Suryahadi and Sumarto (2001) re-gress the relationship between household consumption and its charac-teristics and term the predicted value an estimate of permanent con-sumption. Thus, the transient poor are those whose current consump-tion falls below the poverty line, but whose predicted consumption liesabove it, while the chronically poor are those whose predicted andactual consumption lie below the poverty line.
Gordon (2002) uses data from Britain’s Poverty and Social ExclusionSurvey to classify the population into four groups-poor, rising out ofpoverty, vulnerability to poverty and not poor-based on households’income and “standard of living”.87 Those whose incomes were high,but whose standard of living was low were those who were rising outof poverty (the improvement in living standards lags behind the im-provement in incomes) while those whose incomes were low, but whosestandard of living was high were those who were vulnerable to, orfalling into poverty, maintaining their standard of living by dissaving.A parallel exercise for developing countries could be carried out withexisting household survey data using a broad consumption indicator tomeasure standard of living.88
The severity of poverty or extreme poverty is often considered a proxyfor persistent poverty. Nevertheless, many studies that do use paneldata analysis find that the chronically poor are not necessarily the poor-est (Aliber 2001 for Kwa-Zulu Natal in South Africa, Gaiha 1989 forIndia), indicating that this is not a very good proxy.
87 Standard of living is measured using a relative deprivation approach.88 The difficulty arises if income is badly measured.
GOOD PRACTICE IN POVERTY MEASUREMENT

86
POVERTY MEASUREMENT: Meanings, Methods and Requirements
Those experiencing multiple dimensions of deprivation may also be con-sidered to be chronically poor (Hulme et al. 2001). The usual difficul-ties in measuring multidimensionality apply in this case as well (seesection 2.2).
Indicators that are observed at one point in time but that provideinformation on longer-term processes are useful measures or proxies ofchronic poverty. For example, the average height of school children,illiteracy, and asset ownership are indicators that reveal informationabout the dynamics of poverty. Recent empirical work in labour eco-nomics shows that unskilled workers are trapped in a vicious circle ofemployment in the low-skilled sector, unemployment, and periods outof the labour force (Bradshaw et al. 2003). However, when using thisapproach, it is important to distinguish between deprivation and thecauses of deprivation.
Bird and Shepherd (2003) use a “recovery index” which gives a sub-jective assessment of change in assets. This measures the degree of per-ceived improvement or decline over a period following a severe drought(5 years prior to the date of the survey, and is based on responses to 8questions on change in food security related variables).
2.4 Measuring vulnerabilityVulnerability in the dimensions of income and health is the risk that ahousehold will experience an episode of income or health poverty overtime. However, vulnerability also means the probability of being ex-posed to several other risks (violence, crime, natural disasters, enforcedpremature school-leaving, etc.) (World Bank 2001).
Several ways in which vulnerability can be measured using consump-tion-related measures are well known. For example: (a) variability inconsumption (the higher the coefficient of variation the more vulner-able the household (Morduch 1998) (b) whether an income shock is

87
passed onto current consumption or not (are households able to de-plete savings or borrow in the face of a shock, and thereby smoothcurrent consumption?) (Amin, Rai and Topa 1999, Jalan and Ravallion1999) (c) how often a household is above or below the poverty line in agiven period (Gaiha and Deolalikar 1993), and (d) as the proportion ofnon-poor households who became poor in a subsequent period (Sen2003).
The limitations of using the coefficient of variation are well-known:It does not differentiate between (1) upward and downward fluctua-tions, whereas it is mainly the latter that affects the poor (2) fluctua-tions that are bunched together (worse for the poor) versus fluctua-tions that are spaced across time and (3) fluctuations that are varied inseverity versus fluctuations that are moderate and equal (See box 1.3 inWorld Bank 2001). Vulnerability is sometimes group-specific in its im-pact, for example, on children’s health and development, physical well-being, social capital, family sizes, and insecurity of old age (World Bank2002).
For policy purposes, it is not sufficient to identify vulnerability af-ter the fact. One needs indicators that can be used to identify at-riskhouseholds beforehand. There is some consensus that a single indicatorcannot capture all the complexities of vulnerability. (World Bank 2001)and Moser (1998) identify the following indicators as useful in assessinga household’s exposure to risk: (1) physical assets (housing, equipmentand land) (2) human capital (health and education) (3) labour and (4)stocks (food, money or valuables) are a measure of the households’capacity to self-insure. (5) Income diversification is sometimes, but notalways an indicator of the households’ ability to spread risk. (6) Linksto networks (family-based networks, occupation-based groups of mu-tual help, rotating savings and credit groups, and other groups or asso-ciations to which a household belongs) can be a source of transfers in
GOOD PRACTICE IN POVERTY MEASUREMENT

88
POVERTY MEASUREMENT: Meanings, Methods and Requirements
cash or kind in the event of a calamity. In addition, (7) participation inthe formal safety net (social assistance, unemployment insurance, pen-sions and other publicly provided transfers) and (8) access to creditmarkets are other indicators of a household’s ability to cope with shock.
Detailed qualitative surveys-or modules in quantitative surveys in-corporating questions on these indicators-are required to capture allthe dimensions of vulnerability. Measuring vulnerability requires paneldata, because vulnerability is a dynamic concept. Households need tobe obseved more than once in order to assess how they respond toshocks.
Another approach to measuring vulnerability is to measure the preva-lence of risks or shocks (usually aggregate risks such as crime, naturaldisasters).89
2.5 Measuring voicelessness and powerlessnessVoicelessness and powerlessness (and the opposite, empowerment) canbe measured using a combination of participatory methods and nationalsurveys on qualitative variables such as the extent of civil and politicalliberties. Best practices in methodology and the associated data require-ments are part of a new and ongoing research agenda which is still at avery early stage (World Bank 2001, World Bank 2003).90
2.6 Capability approaches to poverty measurementThe capabilities approach which was first introduced by Sen in 1979(Sen 1980) has had a lot of appeal in the area of poverty measurement.Sen’s persuasive arguments in favour of capabilities rather than utilityor commodities as the space in which to measure well-being are well-known and widely accepted to be true. It is not merely a way to enlargethe evaluation of well-being to variables other than income, but it is aradically different way to conceive the meaning of well-being(Chiappero-Martinetti 2000).
89 See indicators relating to vulnerability in the tables in Appendix E .90 See indicators in Table E2 in Appendix E.

89
In this section, I focus on developments in operationalising the approach,drawing heavily from existing reviews, in particular, Saith (2001a).
Saith describes the main features of the capabilities approach, whichwill be familiar to the reader from Figure 1. A person may possess thefollowing commodity vector [sack of rice, bicycle] which has a corre-sponding commodity characteristics vector [nutrition, transport]91
which enables this person to achieve various functionings, for example,(moderately nourished).92 Although commodity characteristics do notvary by person, functionings do, so that another individual having aparasitic infection with the same commodity, may only achieve thefunctioning (poorly nourished). A functioning vector is a list offunctionings that a person achieves, given the commodities at her dis-posal, her personal characteristics, and other environmental factors thatimpinge on her situation, which gives a snapshot of the person’s stateof being.93 A capability is the ability to be or do something.94 Anindividual possessing a certain quantity of the commodity rice thus hasthe capability to be moderately nourished, although she may not chooseto be so (Saith 2001a). A capability set is the set of all possible func-tioning vectors that a person can achieve. Thus, continuing to follow(Saith 2001), the capability set in this situation is {[moderately nour-ished, transported], [well-nourished, stationary]}. An individual can thenselect the functioning vector she prefers, which is then her “chosenstate of being” which can be called her “well-being achievement”. Free-dom means having a capability set that offers plenty of opportunityfor choice (Muellbauer 1987).95 The appropriate criterion of poverty isthe lack of fundamental capabilities, that is, the lack of opportunity to at-tain basic functionings.91 Note that a commodity may have multiple characteristics, for example, rice has a social charac-teristic in that people meet to eat (Saith 2001a).92 A functioning is what a person succeeds in doing with the commodities (and their characteris-tics) in his possession, given his personal characteristics, as well as the existing external circum-stances (including factors like physical environment, cultural factors, public goods provisionetc.) depicted in Figure 1.93 In the example above, a person may use the bicycle and be [moderately-nourished, transported]or choose to save the energy on cycling, and be [well-nourished, stationary].94 If a dynamic aspect is incorporated, a capability is also the ability to become something.95 Sen (1985) refines the concept by making a distinction between “well-being” freedom and“agency freedom”.
GOOD PRACTICE IN POVERTY MEASUREMENT

90
POVERTY MEASUREMENT: Meanings, Methods and Requirements
Within the capability approach, the problem of identification is dealtwith in the literature, mainly in terms of the choice of indicator. Theproblem of aggregation is the dual problem posed by multidimension-ality, of aggregating elementary indicators to obtain an overall evalua-tion for each single dimension (functioning/capability) and to add upall the dimensions to reach an overall evaluation of well-being.
2.6.1 Choice of indicatorThe choice of indicator within the capability approach is thus twochoices: (1) identifying the appropriate evaluative space and (2) identi-fying a list of capabilities or functionings and a set of indicators relatedto the selected dimensions of well-being with adequate criteria to mea-sure and represent them (Chiappero Martinetti 2000).
Although ideally, interpersonal comparisons ought to involve evalu-ation and comparison of capability sets, in practice, many researchershave restricted themselves to the analysis of functionings. Three rea-sons for doing so are: (1) trying to measure capabilities involves enu-merating the entire set of alternatives, which in theory, can be infinite(2) the time dimension can create problems and (3) capability measure-ment is highly demanding. In terms of information-statistical databasesgive information on what occurred, and not on what could have oc-curred (Brandolini and d’Alessio 1998).
Evaluative spaceSaith (2001a) points out that evaluation (or measurement) within thecapability approach takes three forms (1) within the space of“functionings” only (2) combining the space of “functionings” and in-come, and (3) within “income” space, but using the concept of adjustedincome.

91
Evaluation within the functionings spaceIrrespective of the level at which assessment of well-being is conducted,the number of capabilities of functionings that could be considered areenormous. However, if the purpose of well-being comparison is to iden-tify the poor, a subset of capabilities/functionings may suffice. Sen (1993)argues that identifying a minimal combination of basic capabilities canbe a good way of setting up the problem of diagnosing and measuringpoverty. Basic capabilities here are defined, as in Sen (1980) to separateout the ability to satisfy certain crucially important functionings up tocertain minimally adequate levels (below which people count as beingscandalously “deprived”).
Evaluation combining functionings and incomeIn this approach, traditional income-based approaches are combinedwith (a) information on functionings themselves, or (b) variables whichare instrumental in the determination of the capability set, such as theprevalence of unemployment, availability and reach of health care, evi-dence of gender bias in family allocation (Foster and Sen 1997).96 Arange of possibilities exist within this approach, ranging from that sug-gested by Ravallion (1996) among others (see section 2.2) where noattempt is made to aggregate the different measures used, to approachesthat use composite indices that include an income indicator such as theUNDP’s Human Development Index (HDI) and Human Poverty In-dex for developed countries (HPI-2).97
Evaluation within (adjusted) income spaceOperationalising the capabilities approach within the income space alonerequires taking into account each individual’s respective conversionability and deriving individual specific poverty lines (Saith 2001a). Thisis similar to the second approach, where both income, and functionings
96 Foster and Sen (1997) point out that these extensions of income poverty do not aim at a precise“bottom line” but rather seek to enrich the overall understanding of poverty.97 HPI-1 does not use an income indicator.
GOOD PRACTICE IN POVERTY MEASUREMENT

92
POVERTY MEASUREMENT: Meanings, Methods and Requirements
are considered in the measurement. It differs in that the measures aredeveloped entirely in income space.
An alternative way of looking at this is as an extension of the equiva-lence scale approach (used commonly within the monetary approach),where household income is converted into individual income takinginto account economies of scale, and differences in individual charac-teristics (see section 2.1.2). In this relatively new approach tooperationalising capabilities, individual incomes are adjusted for differ-ences in functionings in order to get some sort of “functioning-equiva-lent incomes”. Thus, according to Foster and Sen (1997) the incomelevel of a family may be adjusted downwards by illiteracy and upwardsby higher levels of education, to make them “equivalent” in terms ofcapability achievement. This approach has much to offer in terms ofpractical usefulness, and allows for more articulation and stricter metrics(Foster and Sen 1997) especially in relation to the problem of aggrega-tion. Work in this area includes that explored by Angus Deaton, AnneCase and Christina Paxson,98 Ballestrino (1995) and Desai (1995).99
However, when variations in the conversion of income into capa-bility arise from handicaps that are not so easily compensated by higherpersonal income (such as living in an epidemiologically dangerous envi-ronment, or having an incurable or untreatable disease) then this ap-proach is less satisfactory, and the need to look directly at capabilities/functionings (as described in the previous two approaches) may be in-evitable (Foster and Sen 1997).
Indicators and dimensionsWhat these “basic capabilities” and “basic functionings” may be needsto be ascertained. Fusco (2003) suggests two ways (other than by hunch)of choosing indicators, one a priori and the other a posteriori. The apriori method is to rely on recommendations made by the bon sens of a
98 In a joint research project of Angus Deaton and Amartya Sen, supported by the MacArthurFoundation.99 Ballestrino makes some suggestions toward developing societal poverty lines, while Desai’smethodology is resources required to guarantee a minimal list of capabilities (Saith 2001a).

93
philosopher or a school of long tradition.100 The a posteriori method isto apply a multivariate technique of data analysis (such as principalcomponent analysis, factor analysis, latent variable analysis) on a sample,but there is no guarantee that the list will be exhaustive.
Alkire (1998) provides a useful list of guidelines that functioningsmust satisfy in order to be considered as indicators of basic depriva-tion: (1) the functioning belongs to the capability set (is itself valuable)or the functioning is directly associated with the capability set (highlycorrelated, etc.) (2) the functioning pertains to a basic human need, thatis, that without which one’s life may be blighted (3) the functioning isnot significantly dependent on any non-basic prior functioning (4) thefunctioning is not dependent on the presence of uncommon ability orinterest (5) the level of achieved functioning, which is widely recognisedas “basic” can be specified and empirically observed (6) provision of thefunctioning does not necessarily compromise freedom to pursue othersignificant functionings in the long term.
2.6.2 Choice of unit of analysisEmpirical operationalisations of the capabilities approach have typi-cally used the individual (for example, numbers enrolled in school, mor-tality, literacy, undernutrition). Like poverty measures, some informa-tion is collected at the household (for example, access to safe water andsanitation) and the appropriate computations for individuals are made,assuming intra-household equality.
2.6.3 Choice of poverty lineThe choice of poverty line in the capability approach has to address theproblems of any multidimensional poverty measure. Poverty thresh-olds have to be determined for each elementary indicator, and a thresh-old (or aggregation rule) in multidimensional space also needs to bedetermined (see section 2.2.3 and 2.2.4).
100 Streeten (1981), Doyal and Gough (1991), Desai (1995) Qizilbash (1998) and Nussbaum (2000)provide several lists whose merits and demerits are discussed in the literature.
GOOD PRACTICE IN POVERTY MEASUREMENT

94
POVERTY MEASUREMENT: Meanings, Methods and Requirements
In some instances, these thresholds may be obvious, or natural. Theymay need to be determined by experts, and there is an inescapable ele-ment of arbitrariness in most cases (as for example in the HPI-1 andHPI-2 described in Appendix F).
Fuzzy Set Theory has been applied to determine poverty thresholdsin capability measurement (see section 2.2.3). In this approach, follow-ing Chiappero Martinetti (2000) we let “F be the fuzzy subsets thatdefine the position of each individual according to the degree of attain-ment of a given attainment (functionings), µF is the membership func-tion. In this case, if
µF (x) = 0, there is complete failure in achieving the functioning
represented by X0< µ
F (x) < 1, there is a partial achievement of the functioning
represented by Xµ
F (x) = 1, there is complete achievement of the functioning repre-
sented by X.”
In the first application of fuzzy set theory to poverty measurementCerioli and Zani (1990) presented a method of computing a multidi-mensional deprivation ratio and functioning indices for dichotomousvariables (which are traditional sets; non-possession of a good implies adeprivation of the good, possession implies an achievement in the rel-evant functioning), categorical variables and continuous variables.
Let D=[D1,...,D
k] be the set of living standard indicators, chosen as
outlined in section 2.6.1, and Kj be the subset of individuals deprived in
Dj, so that k
ij is the value that denotes the degree of deprivation of
variable j by individual i, and Hj is the subset indicating level of achieve-
ment in the functioning represented by Dj, hij is the value that denotes
the degree of functioning in variable j by individual i.

95
The membership function in the case of deprivation in categoricalvariables is then
µK (i) = 1 if 0 < c
ij < c
inf, j
µK (i) = (c
sup,j, - c
ij)/c
sup,j - c
inf,jif c
inf, j < c
ij < c
sup, j
µK (i) = 0 if c
ij > c
sup, j
where cinf,j
and csup,j
stand for two threshold values. cinf,j
is the thresh-old under which the individual is certainly deprived in the jth dimen-sion, while c
sup,j is the threshold above which the individual is certainly
not poor relative to the jth dimension. Achievement in functioningscan be specified in a similar way.
µH (i) = 0 if 0 < c
ij <c
inf, j
µH (i) = (c
ij - c
inf, j)/ (c
sup,j-c
inf,j) if c
inf, j < c
ij < c
sup, j
µH (i) = 1 if c
ij > c
sup, j
Note that these specifications in the case of categorical variables as-sume that values are equally spaced.
The specifications of the membership functions are similar in thecase of continuous variables. One obvious application of continuousvariables is the use of income or consumption, but now instead of onepoverty line or threshold (as in section 2.1.3), two thresholds are speci-fied. Cerioli and Zani suggest that the lower threshold (c
inf,j) could be
fixed at the level of subsistence poverty (absolute poverty) and the higherthreshold (c
ij) at the level of the mean or median income (relative pov-
erty).
2.6.4 Choice of poverty measureConstructing poverty measures under the capabilities approach, like in
GOOD PRACTICE IN POVERTY MEASUREMENT

96
POVERTY MEASUREMENT: Meanings, Methods and Requirements
the monetary approach, requires both identification and some mecha-nism for aggregation. As discussed in section 2.2, this poses some prob-lems when more than one functioning is considered. The discussion insection 2.2.3 and 2.2.4 applies to capability measures; in fact, many ofthem were derived under the capability measurement research agenda.In this section, I focus mainly on interpersonal comparison, specifi-cally the distinction between partial ordering and complete ordering,drawing heavily on Saith (2001a).
Partial orderingTwo possible procedures may be followed.
Dominance partial orderingAn individual may be considered better than another if the value ofone of the functionings in the functioning vector is higher than that ofthe other, provided the value of none of the remaining functionings islower (similar to the Pareto criteria). This is also known as vector domi-nance.
Table 14: Dominance partial orderingIndividuals “Being healthy” “Being educated” “Being nourished”
days well previous year level of education mid-arm circumference
(max. 365) (max. 12) (max. 8)
A 360 8 4
B 330 6 4
C 365 7 5
Source: Saith (2001a)
On the basis of dominance ranking, A ranks higher than B, and C

97
ranks higher than B, but A and C cannot be ranked against each other.All that can be said is that the well-being of A is higher than that of B,and the well-being of C is higher than that of B, but no relative rankingof A and C is possible.
Sequential dominanceThis analysis technique is used for the comparison of income distribu-tions when family needs differ, yet it could be used to obtain partialorderings within the capabilities framework (Brandolini and D’Alessio2000).
Complete orderingThis implies that some decision has to be taken on the relative impor-tance of each functioning. Some ways in which this is done are dis-cussed in section 2. 2.4.
A commonly used technique to achieve this is Borda rule ranking.The rule provides a method of rank-order score where each unit (forexample, country or region) is awarded a point equal to its rank in eachcriterion (dimension) of ranking (alternative with the least well-beingscores 1, and that with the highest scores N), where all scores are addedup into aggregate scores, and ranked according to aggregate scores (whichis the Borda ranking). If two individuals tie they are given the samenumber, and the rank given to the next score is one higher to accountfor the replication. The advantage this has over dominance ranking isthat it can give a complete ordering (see Table 15), and it is simple andeasy to use and the fact that its strengths and weaknesses are transpar-ent and well-known. A major weakness is that it only allows for ordi-nal comparisons. Thus, implicit in the rule is the principle of equalweighting (no weight is given for distance or depth of deprivation).
GOOD PRACTICE IN POVERTY MEASUREMENT

98
POVERTY MEASUREMENT: Meanings, Methods and Requirements
Table 15: Borda rankIndividuals “Being “Being “Being Total Rank Borda Rank
healthy” educated” nourished” Valuedays well level of mid-arm
previous year education circumferencerank rank rank
A 2 3 1 6 2B 1 1 1 3 1C 3 2 3 8 3
Source: Saith (2001a)
The problem of inability to rank A and C is now solved, with thewell-being of C being declared the highest by the Borda score, followedby the well-being of A, and then of B. However, there is no way toknow if the relative position of C to A is much better than that of A toB.
Composite indexSection 2.2.4 and Appendix F deal with most of the literature on com-posite indices. In this section, I continue with the illustration providedby Saith (2001a). The values here are “normalised” values of those inTable 14. The composite index is simply an arithmetic mean, whichassigns equal weight to all dimensions. The ranking follows that of theBorda score. However, it is possible to compare the relative position ofC to A, with that of A to B.
Table 16: Composite indexIndividuals “Being “Being “Being Composite
healthy” educated” nourished” indexdays well level of mid-arm (arithmetic
previous year education circumference mean)normalised value normalised value normalised value
A 0.99 0.67 0.50 0.72B 0.90 0.50 0.50 0.63C 1.00 0.58 0.62 0.73
Source: Saith (2001a)

99
Application of fuzzy set theory to aggregation of multiple dimensionsRecent contributions that make use of fuzzy set theory provide waysin which to incorporate a system of weights (Cerioli and Zani 1990).Fusco (2003) following Brandolini and D’Alessio (1998) arrives at twoways of aggregating the values derived in section 2.6.3; one is a multidi-mensional ratio of deprivation/functionings for each individual (unitof analysis),101 whereas the other is a unidimensional ratio indicatingthe average population in the membership of a deprivation/achieve-ment in functioning.102 Both these ratios are computed as averages. Inthe multidimensional aggregation, the weight w
kj used are the inverse
function of the rate of individuals deprived in/achieving in the jth func-tioning, so that the greater the frequency of deprivation/achievementin an attribute, the greater its importance.103 The weighting schemesused so far are inevitably arbitrary or debatable.
2.7 Social exclusion approaches to poverty measurementAlthough there is far less consensus on methodologies for measuringsocial exclusion than there is in the measurement of monetary poverty,there are several pragmatic approaches that have been undertaken. Forexample, many publications of member states of the EU cross-tabulatemonetary poverty with indicators of several domains that relate to so-cial exclusion (EU Social Protection Committee 1998). In this section,I draw on some recent attempts to develop a scientifically/theoreti-cally/conceptually-based methodology for measuring social exclusion.
A conceptually based measurement of social exclusion would allowthe calculation of the level of social exclusion in a country, compari-sons across countries or groups, and allow for subgroup decomposi-tion.104 As in a quantitative or monetary measure of poverty, it would
101 The unit of analysis used by Fusco (2003) is actually the country.102 This is analogous to the familiar percentage of people without access to safe water, except thatthe threshold for safe water is now fuzzy, rather than arbitrarily dichotomous.103 An alternative is to give equal weights to each dimension, as in the UNDP indices.104 That is, be capable of answering the question, given the level of social exclusion in a society,which subgroups of the population, partitioned according to ethnic, geographic, and any othersocioeconomic characteristic, contribute more to aggregate social exclusion (Chakravarty andD’Ambrosio 2003).
GOOD PRACTICE IN POVERTY MEASUREMENT

100
POVERTY MEASUREMENT: Meanings, Methods and Requirements
need to address the problems of identification and aggregation and therelated choices of indicator, unit of analysis, poverty line and povertymeasure. Some of the defining features of social exclusion that deter-mine how these choices are made are: (1) multidimensionality of theconcept which includes political, cultural, and social as well as materialaspects of exclusion,105 (2) relativity (3) the focus on dynamics and (4)social interaction (Bossert et al. 2003). In this section I examine the im-plications of these properties for the measurement of social exclusion.
2.7.1 Choice of indicator(s)Domains, dimensions and indicatorsSocial exclusion is by definition multidimensional, and implies depri-vation in a wide range of indicators or functionings of living standards,which can be of a quantitative or qualitative type. As in a multidimen-sional measure of poverty, a measure of social exclusion needs to iden-tify the domains and dimensions along which the deprivation or disad-vantage occurs.
Typically, the social exclusion literature refers, first to the selectionof domains (for example, health), then dimensions are chosen withinthese domains (for example, length of life in health) after which indica-tors that measure these dimensions are selected. Finally, composite mea-sures or synthetic indices are constructed that combine the dimensionsinto a single measure (see section 2.7.4).106
The choice of domains, dimensions and indicators is somewhat adhoc, as the examples that follow indicate. The Statistical ProgrammeCommittee of the EU (1998) recommended three domains (1) income(2) labour market and (3) social indicators.107 Böhnke (2001), also in thecontext of social exclusion in the EU, argues for four “levels” of socialexclusion: (1) the non-realisation of rights and the denial of access tosocial protection systems (for example, homelessness, illiteracy, under-
105 Many of the functionings that are considered are qualitative, or measured using a subjective orconsensual approach to measurement. See more about this approach in section 2.7106 This is the procedure outlined in the construction of Social Indicators for the EU (Noll 2001).107 Fifteen indicators suggested by Eurostat (2000) fall into 7 domains: (1) Financial difficulties(2) Basic necessities (3) Housing conditions (4) Durables (5) Health (6) Social contact (7) Dissat-isfaction.

101
nutrition) (2) disadvantages in several life domains that may interactand reinforce each other such as low income, bad housing conditions,precarious labour market attachment, unemployment (3) weak socialnetworks and family ties, limited opportunities to take part in social,political and cultural life and (4) individual perception of opportunitiesand deprivation. Saunders (2003) defines three dimensions in the Aus-tralian context: lack of social interaction, domestic deprivation andextreme consumption hardship. Camara et al. (2003) mapping socialexclusion in urban Brazil include four dimensions: (1) autonomy (2)life quality (3) human development and (4) equality.108 Gordon et al.(2000) analysing social exclusion in Britain, argue for four dimensionsto be included: (1) impoverishment or exclusion from adequate incomeor resources (2) labour market exclusion (3) service exclusion and (4)exclusion from social relations. I follow this last classification, as beingboth comprehensive and having a basis for justification.
Exclusion from adequate income or resourcesGordon (2002) defines poverty as the state of having both low incomesand low standards of living. Many studies of social exclusion go beyondthe standard income or monetary approach in measuring poverty us-ing, in addition, measures of items lacked, as in the relative deprivationapproach (pioneered in Mack and Lansley 1985), and people’s own per-ceptions of their situation, as in the subjective approach to povertymeasurement (Dirven et al. 1998). For example, the project of measur-ing poverty and social exclusion in Britain in which Gordon was in-volved in used three separate measures: income poverty, necessitiespoverty, and subjective poverty (Bradshaw et al. 2000).
Exclusion from the labour marketA dominant theme in the social exclusion literature is labour market
108 Variables under autonomy include poverty and labour market related variables, quality ofhousing, and access to services are included under quality of life, literacy and education, mortal-ity and violence are included under human development, and gender equality variables underequality. These variables are specific to the conditions in São Paulo.
GOOD PRACTICE IN POVERTY MEASUREMENT

102
POVERTY MEASUREMENT: Meanings, Methods and Requirements
access. Social exclusion is identified with non-participation in the labourmarket and long-term unemployment. There is justification for doingso within this approach: a job provides not merely an income, but isalso an arena for social contact and social interaction (Bradshaw et al.2000).
However, Gordon (2002) points out the danger of oversimplifica-tion-for example, being employed in a job with long working hourscan lead to non-participation in social activities that people themselvesconsider to be necessary (such as weddings and funerals), while overhalf the population in many countries does not participate in the labourforce from “choice”, rather than exclusion, either because they are en-gaged in unpaid labour, or because they are too young or too old.109
Recent work in developed countries attempts to combine work onunemployment duration, and a larger set of labour market transitionswith the concept of social exclusion-if some workers are “persistently”excluded, that is, trapped in a vicious circle of low skilled employment,unemployment and labour market withdrawal, the policy implicationsare more serious than if workers spend brief episodes of exclusion fol-lowed by inclusion (Bradley et al. 2003).
Exclusion from servicesAn aspect of social inclusion is lack of access to basic services, bothinside the home (such as electricity, water supply and sanitation) andoutside (transport, markets, financial and health services). The Povertyand Social Exclusion Survey in Britain allowed researchers to identifywhether households lacked access to these services because they wereunavailable, or because the households could not afford them, or be-cause they did not want to. The World Development Report 2004 showshow service provision is failing the poor (World Bank 2003).
109 However, a gender-analytic approach may point out the constrained nature of the choice thatoperates in unpaid labour which, in certain circumstances, can lead to social exclusion.

103
Exclusion from social relationsThe social exclusion approach is specifically interested in social interac-tion. Involuntary non-participation in socially-perceived necessary ac-tivities, isolation, perceived lack of support, lack of civic engagementand confinement were dimensions in which social exclusion was mea-sured in Britain, using data from the Poverty and Social Exclusion Sur-vey (Bradshaw et al. 2000).
Relevant domains in a developing country contextSaith (2001b) examines the feasibility of operationalizing the conceptof social exclusion in developing countries. In the North, Saith (2001b)claims, patterns of social integration are institutionalised and clearlydefined, and social exclusion, when applied to those outside acceptednorms includes those excluded from the welfare state, social security,and in long-term unemployment. Given the differences between theNorth and South in terms of political history, the magnitude of insecu-rity, administrative resources and budget constraints in developing coun-tries, applying the same criteria in the South as in the North does notappear practically feasible (Saith 2001b). An alternative route is exploredby Saith (2001b) in the context of “social security schemes as they havedeveloped in developing countries”. Social security in developing coun-tries, unlike in developed countries, includes the activism of the public,non-governmental organizations, social, political and humanitarian in-stitutions as well as the activity of the state (Saith 2001b). It includes aprotective dimension (such as the prevention of famines) as well as apromotive dimension (such as the alleviation of regular and persistentdeprivation like endemic hunger or rampant morbidity). Saith (2001b)points out that while this latter dimension is similar to the concept ofsocial security in developed countries, identifying individuals who doand do not benefit from the system would be very difficult. Identifica-
GOOD PRACTICE IN POVERTY MEASUREMENT

104
POVERTY MEASUREMENT: Meanings, Methods and Requirements
tion on the basis, of outcomes, rather than benefits is far more feasible.Thus, the excluded could be those “who do not achieve certain mini-mum standards of functionings related health, nutrition and education(Saith 2001b). However, defining exclusion in relation to employmentstatus is problematic because the majority of the population would beengaged in activity outside the organised sector, and could not be con-sidered “excluded”.
Studies in developing countries range from those that are in factstudies of multidimensional poverty, concentrating on dimensions ofhealth, education, housing, water supply, sanitation and social security(Appasamy et al. 1996 for India) or exclusion from land (Mearns andSinha, 1999 for Orissa, in India), to those that include exclusion fromrights and social networks as well as employment, credit and insurance(Figueroa, Altamirano, and Sulmont 1996 for Peru), and those that useda subjective approach to defining social exclusion (Bedoui and Gouia1995 for Tunisa).110 Saith (2001b) argues that many of these studies aresimply revisiting old debates and discussions about the multidimen-sionality of poverty, under new terminology.
How to measure exclusion within these dimensions?While most studies measuring exclusion state very clearly which di-mensions and indicators they use, these indicators are used in a very adhoc. manner. The issues relating to aggregation are those that arise inany multidimensional index, and are dealt with in section 2.2.4.
Identifying groups approachSome studies of social exclusion attempt to identify whether an indi-vidual is socially excluded or not, based on whether the individual con-
110 These are all studies reviewed by Saith (2001).

105
cerned belongs to a group that is considered at risk of social exclusion.Sources of social exclusion include physical isolation, ethnicity, genderand religious discrimination, bureaucratic barriers, institutionalised roadbias, corruption, intimidation and physical violence, and the nature ofthe local and national political elite.
The problem with this type of approach is that while it is prag-matic, it over-generalises, and is not very useful in helping to identifythe socially excluded.111
Persistence and the dynamics of exclusionThe social exclusion literature refers to the importance of persistence,for example, one spell of unemployment does not make an individualsocially excluded (Bradley et al. 2003, Klasen 1999). Another time-re-lated feature of social exclusion is that disadvantage is often cumula-tive-poor educational attainment and poor educational achievement (asmeasured by literacy and numeracy tests) have strong impacts on un-employment rates. Exclusion - or adverse inclusion or incorporation-thus, may be the cause of chronic poverty (Bird and Shepherd 2003).
Geography and exclusionAdverse geography may limit access to resources for participation(through lack of proximity, mobility, and networks) as well as gener-ate exclusion through statistical discrimination (Klasen 1999).
2.7.2 Choice of unit of analysisAlthough it is argued that social exclusion moves beyond the individualto include a neighbourhood dimension, in practice, this approach doesnot differ very much from conventional methods of poverty measure-ment (Bradshaw et al. 2000). Information is collected at the unit or
GOOD PRACTICE IN POVERTY MEASUREMENT
111 Gordon (2002) comments that the only person in Great Britain who was not excluded undera compilation of groups based on existing studies was Prince Phillip! The queen herself, being apensioner and a woman, would have to be defined as socially excluded. Applying the “Lady Di”test (discarding any theory that would have included her as socially excluded because she was asingle parent with mental health problems, because they took it as axiomatic that she was not)enabled Gordon and his colleagues at the Townsend Centre for International Poverty Researchto discard most of the literature on social exclusion!

106
POVERTY MEASUREMENT: Meanings, Methods and Requirements
household level, but the unit of analysis is often the individual(Chakravarty and D’Ambrosio 2003).
2.7.3 Choice of poverty lineHaveman (2003) poses the following question: if inclusion is a con-tinuum, how do we establish exclusion? Chakravarty and D’Ambrosio(2003) argue that social exclusion differs from multidimensional pov-erty in the sense that, although both multidimensional poverty andsocial exclusion relate to failure in functionings, (absolute) poverty doesso in terms of shortfalls from a threshold, while social exclusion relatesto the inability to participate. Thus, they do not use a poverty line.Functioning failure is then incorporated in their measure in a some-what complex way: an individual is considered deprived whenever thereare people who experience fewer functioning failures than him/her. Inthis manner, if no household in a society had access to safe water, anyone of those households would not be considered deprived, or excluded.While this may be a fair interpretation of the concept of exclusion, itobviously does not fit with a concept of poverty, especially of absolutepoverty.
An alternative way of conceptualising the poverty line in a socialexclusion framework that emphasises neighbourhood effects is illus-trated in Figure 9. The poverty thresholds would be optimal if it oc-curs at the position indicated, where the differences between the poorand the rich are maximised and the differences within the two groupsare minimised.

107
Figure 9: Poverty and social exclusion
Source: Adapted from Gordon (2002)
Camara et al. 2003 use a method where reference values of zero aregiven to a basic standard of inclusion for each variable. Areas with val-ues above this are mapped onto a positive scale, while areas below areassigned negative values. Each index has a range between-1 (total exclu-sion) and 1 (total inclusion).
The Statistical Programme Committee of the EU using a more prag-matic approach, notes that the use of the median rather than the meanas a reference for the poverty line is more in line with a social exclusiondefinition, because social exclusion implies distance from the standardincome level, which is the income level in the middle of the distribu-tion (EU 1998).
2.7.4 Choice of poverty measureThe debate on whether the multiple indicators in the measurement ofsocial exclusion should be aggregated or not is still open, with severalinitiatives choosing not to do so (Bradshaw et al. 2000).
GOOD PRACTICE IN POVERTY MEASUREMENT

108
POVERTY MEASUREMENT: Meanings, Methods and Requirements
Unlike the well-known measures of poverty and inequality, mea-sures of social exclusion are only just being developed. Some research-ers follow a “pragmatic” approach to aggregation, including the rank-ing method adopted in the calculation of the Human Development andHuman Poverty indices. Others like Chakravarty and D’Ambrosio(2003) and Bossert et al. (2003) characterise a family of measures of so-cial exclusion using an axiomatic approach, in a way similar to the deri-vation of standard poverty and inequality measures. The measures sat-isfy the axioms of normalization (if nobody is socially excluded themeasure is zero), monotonicity (if the deprivation score of a person in-creases, the measure increases), subgroup decomposability (for any parti-tioning of the population with respect to some socioeconomic or de-mographic characteristic, the overall social exclusion is the populationweighted average of subgroup exclusion levels),112 and nondecreasingmarginality (when aggregating individual deprivation scores into anoverall indicator of exclusion, a higher deprivation score does not get alower weight than a lower score).
Chakravarty and D’Ambrosio (2003) and Bossert et al. (2003) incor-porate the concept of social exclusion and functioning failure as occur-ring if an individual has more functioning failures relative to the rest ofsociety. Similarly, they consider the dynamics of social exclusion toimply that exclusion occurs with persistence (this is similar to the ideaof persistence in labour market exclusion in Bradley et al. 2003 cited insection 2.3.1).
2.7.5 The contribution of the social exclusion approachWhat does the social exclusion approach add to the measurement ofpoverty? Despite its wide acceptance by policy makers in developedcountries, others have been sceptical about its value added. Bradshaw etal. (2000) claim that “social exclusion has been contrasted with a parodyof the concept of poverty.” Haveman (2003) suggests that its contribu-
112 This property is useful in calculating a particular group’s contribution to aggregate exclusion,and hence to identify the subgroups that are more afflicted by exclusion, and to implement anti-exclusion policy (Chakravarty and D’Ambrosio 2003).

109
tion is in adding the concept of “participation” (described as access tojobs, public services, social activities) which adds richness to the mean-ing of disadvantage and forces a search for policies other than incomesupport. Klasen (1998) suggests that social exclusion can be seen as thedenial of three important capabilities: the ability to be integrated intothe community, participate in community and public life and enjoysocial bases of self-respect (Sen 1992, Sen 1999). However, difficultiesin incorporating these into measurement remain.
Measuring exclusionThe measurement of poverty in many developed countries includesseveral instruments to measure exclusion (see Annexe E). While thesemeasures cannot be applied directly to developing countries, some guide-lines for measurement can be derived from this literature. Ruggeri-Laderchi has three suggestions: (a) Take norms from outside the soci-ety, for example, from developed countries. This would fit in with anabsolute approach, whereas to be completely relative may lead to ac-cepting as the norm that which is an intrinsic aspect of deprivation, forexample, the caste system is part of the social system. (b) Derive thecharacteristics through consultation in participatory approaches. Thismethod has great potential for identifying what societies themselvesconsider aspects of social exclusion. Its disadvantages, described in sec-tion 2.6 include the point made above, that using a subjective approachmay lead to accepting as normal, and therefore ignoring, what is essen-tially deprivation or exclusion. (c) A third approach, used commonlyin the economics profession is to derive empirically structural charac-teristics of the population (race, caste, region, types of occupation) thatare correlated with deprivation in other approaches.
Some excluded groups relevant to Asia have been identified byDeolalikar et al. (2002). In rural areas, these are the landless, small andmarginal tenant cultivators, and indigenous peoples (often ethnic mi-
GOOD PRACTICE IN POVERTY MEASUREMENT

110
POVERTY MEASUREMENT: Meanings, Methods and Requirements
norities). In urban areas these are urban slum-dwellers who are usuallyrecent migrants, women (widows and household heads) and children(street children, child workers and orphans). Regional exclusion (forexample, Northeast Thailand and the Northern Uplands and CentralHighlands in Vietnam) is also identified as a category of exclusion.
Specific measures of social exclusion (inclusion or integration) thatare appropriate for developing countries may include indicators of “soli-darity”: (a) at least one member of the household has participated inmutual aid activities with neighbourhoods or in an association (b) atleast one member of the household has found his job thanks to per-sonal relations (c) the household has received (or given) gifts comingfrom (or to) other households at the time of festivities during the year,and indicators of “participation in social life” such as access to and keep-ing abreast of information, knowledge of institutions, participation inassociation activities (Razafindrakoto and Roubaud 2003).
2.8 Participatory approaches to poverty measurementParticipatory appraisalsParticipatory poverty assessments (PPA), such as those used in the WorldBank, evolved from participatory rural appraisal (PRA) defined as “agrowing family of approaches and methods to enable local people toshare, enhance, and analyse their knowledge of life and conditions, toplan and to act.” (Chambers 1994).
Rapid appraisal and participatory appraisal are commonly used ap-proaches in monitoring poverty and the participatory design of projects.Participatory appraisal has the specific objective of empowering thetarget group, while rapid appraisal methods are meant to provide evalu-ators data on the community in a very short time (usually a day visit)with a usually predetermined agenda (Zeller et al. 2001). They use simi-

111
lar methods. (See Appendix F for a list of methods). They are useful inidentifying vulnerable groups in a community and, therefore, suitedfor targeting, as well as the participatory design of development projectsand services.
Participatory wealth rankingParticipatory wealth ranking, a method used by both these approaches,asserts the primacy of local knowledge over externally determined mea-surement criteria. The ranking is based on the subjective view of thepeople in a community, who generate their own criteria with which torank poverty or wealth. The ranking involves several stages: mapping,which takes place at a community meeting, where a village map is drawnand a list of households are generated from the map; initial ranking ofhousehold;113 and analysis114 (Falkingham and Namazie 2002).
2.8.1 Choice of indicatorThe participatory approach uses local knowledge in the choice of indi-cator, and thus has a unique contribution to poverty measurement.Chambers’ 1997 list of indicators from participatory assessments showsthe importance of lacking assets, education, labour, and food security.These were typically important indicators.
The largest PPA conducted by the World Bank is Voices of the Poorwhich included 69,000 people and 78 PPAs in more than 47 countries(Narayan et al. 2000). Voices of the poor concluded that the poor definepoverty as multi-dimensional and beyond material well-being (Sumner2003). (1) Risk and vulnerability and (2) empowerment and participa-tion were two aspects of well-being highlighted both in this study andthe conjoint World Development Report 2000/2001. The study alsoidentified food security and employment as important aspects of mate-rial well-being.
113 Each household is represented by a card. Three reference groups are set up for each section ofthe village that has been mapped, with three to five members of the community in each group.Each group meets separately and sorts the household cards according to wealth on a continuumfrom high to low.114 The results of the ranking of different groups are brought together and the piles are scored.The final score of each household is the average of the ranks it was given by three referencegroups
GOOD PRACTICE IN POVERTY MEASUREMENT

112
POVERTY MEASUREMENT: Meanings, Methods and Requirements
The advantage of the participatory approach is that it can be used toidentify location-specific poverty indicators and indicators of depriva-tion.
2.8.2 Choice of unit of analysisThe unit of analysis is typically the household (see section on Participa-tory Wealth Ranking above).
2.8.3 Choice of poverty linePoverty thresholds are implicit in this approach, which does not con-struct well-defined poverty lines, but rather asks for participatory wealthranking, which fits in more with a completely relative notion of pov-erty.
2.8.4 Choice of poverty measureAggregation of information on individuals in poverty into a measure isnot addressed in the participatory approach. Baulch (1996b) characterisesparticipatory approaches as being strong on identification, but weakon aggregation. This may be too simplistic an assessment.
Chung et al. (1997) list several reasons why the usefulness of thesemethods in assessing poverty for regional, national or international com-parisons is limited. (1) The results stem from subjective ratings of com-munity members and are difficult to verify (2) the method is consistentwith finding the poorest third in one village, but it may not be consis-tent in finding in which communities the poorest third of an entireregion reside (3) strategic responses or biases in anticipation of benefitsfrom understating wealth, cannot be ruled out (4) the method requiresskilful and experienced communicators, in comparison with structuredsurveys that only require enumerators.
On the one hand, identification of the poorest takes place at a micro(village) level, and does not provide a means of consistent comparison

113
across villages. On the other hand, methods are being devised that al-low the application of these results beyond the village level. These arediscussed below.
Participatory approaches can be extrapolated to other communi-ties, as for example in Ravnborg (1999), where a well-being index iscreated and extrapolated by means of a questionnaire applied to a ran-dom sample of communities. The similarity with proxy means testingis evident: but rather than key variables being identified by multivari-ate regression, they are identified by local informants (Davis and Siano2001). Leclerc et al. (2000) extrapolate their results to the whole coun-try using neural nets and proxy indicators found in census data.
Christiaensen et al. (2000) were able to test if participatory wealthranking and village mapping compared well with the more traditionalhousehold survey methodology by using both methods in a study offive villages in Northern Mali. They found that a sampling frame con-structed from a population census and revised with local input sufferedfrom undercoverage, while village mapping suffered from overcoverage.PWR resulted in higher estimates of household size and lower esti-mates of household wealth than the household survey. They interpretthis to be the result of the dynamics of these different activities. Theyargue that rather than asserting the superiority of one method overanother, it is important to carefully examine and acknowledge the bi-ases that can result from a particular method being used. They reiteratethe importance of triangulating, or cross-checking, information that isobtained.
In another comparison in Kenya, the findings of the 1995 participa-tory survey using “wealth ranking” were compared with those of a1992 National Welfare Monitoring Survey based on an established pov-erty line. Where cluster sampling was carefully carried out and wheredrought did not seriously affect the district in the intervening years,the estimates of poverty from the participatory survey were virtually
GOOD PRACTICE IN POVERTY MEASUREMENT

114
POVERTY MEASUREMENT: Meanings, Methods and Requirements
identical to those from the national survey (Narayan and Nyamwaya1996 cited in Kanbur and Squire 2001).
Another apparent “inconsistency” between qualitative and quanti-tative results is that households that are clearly below the poverty linein monetary terms may not consider themselves poor in a wealth rank-ing/participatory/subjective approach. The reason for this is usuallythat “perceptions” of poverty have a strong relative component. People“feel” poor relative to their neighbourhood (Thorbecke 2003).
Other criticisms of the approach are, that while communities areheterogeneous, the “voices” that are heard are likely to be those of thepowerful. The public nature of the assessments may make it difficult toget honest assessments, and involve participants in some risk.
2.9 Other approaches to poverty measurement2.9.1 Poverty monitoringPoverty monitoring is distinct from poverty measurement in that themeasurement takes place at regular intervals, while monitoring is a “con-tinuous” process. While the focus of this paper is on measurement, it isnecessary to refer to monitoring, however briefly, in the context of thepoverty information system.
One approach that is sometimes (inappropriately) used is to updatethe existing national poverty line, and compare project beneficiaryhouseholds’ income (or expenditure) level with this poverty line. Na-tional poverty lines are usually laboriously constructed according tocurrent best practice (as outlined in section 2.2), using data from well-designed expenditure modules of over 200 items from budget surveysconducted by national statistics offices. Conducting a similarly detailedand time-intensive expenditure survey in the project area is expensiveand requires well-trained personnel. Instead, what is typically done isto compare the poverty line with an income or expenditure measure

115
that is based on a few questions in the survey and subject to a great dealof measurement error. This is compounded by the fact that cash in-comes and expenditures form a very small fraction of (rural) develop-ing country household income/expenditure.
Another alternative may be to use nationally gathered survey datafor the project area. This may not be possible because of sampling de-sign. Moreover, when there is a time lapse between the national surveyand the assessment exercise, inflation and changes in relative prices needto be accounted for as well (Zeller et al. 2001). In addition, access tonational data may be restricted, or the cost of the data (when govern-ments sell it) may be prohibitive, and it may be poorly documented sothat considerable time is needed for a skilled analyst to make the datacomparable and to resolve the issues of inflation and changes in relativeprices (Zeller et al. 2001).
Other approaches that are used are those of Rapid Appraisal andParticipatory Appraisal. However, the use of these approaches is lim-ited in the monitoring of poverty at the national or regional level (seesection 2.8.).
As a result, several monitoring tools and techniques are being devel-oped that attempt to fill this gap. They are described below.
Proxy means testingPoverty indicators (or component indicators of composite indices ofpoverty) are either (a) unambiguous measures of poverty (such as mea-sures of the incidence of hunger) or (b) proxies for consumption (orincome) poverty (Zeller et al. 2001). Proxy means testing offers an ex-ample of indicators chosen on the latter basis.
Proxy means testing is used for the purpose of targeting. The indica-tor of poverty (welfare) is income or consumption (usually consump-tion, as defended in section 2.1). The purpose of the exercise is to iden-
GOOD PRACTICE IN POVERTY MEASUREMENT

116
POVERTY MEASUREMENT: Meanings, Methods and Requirements
tify good predictors/correlates of consumption, which are easily mea-surable and verifiable, and which may be used when information onconsumption is unavailable.
Proxy means tests have been developed by the World Bank usingLSMS data (Grosh and Baker 1996, Grosh and Glinskaya 1998) as wellas by the International Food Policy Research Institute (IFPRI) (Ahmedand Bouis 2001) using the IFPRI-led 1997 Egypt Integrated HouseholdSurvey (EIHS). Grosh and Glinskaya (1998) use six classes of indepen-dent variables: (1) location (2) household composition (3) social catego-ries (4) housing quality (5) ownership of assets and consumer durablesand (6) employment and verifiable income-related variables. Ahmedand Bouis (2001) include an additional category: education. Comparingthe model with estimates derived from the same survey, based on con-sumption expenditures results in an error of exclusion that is 28.2 per-cent and an error of inclusion of 16.3 percent.
Monitoring toolsThe need to monitor poverty continuously has led to the developmentof new “tools” for the purpose. One of these, the CGAP Poverty As-sessment Tool, is described below. Rapid monitoring surveys devel-oped by the World Bank, UNDP and other organizations are also aresponse to this need. Some examples are described in the next chapter.
The CGAP poverty assessment toolThe Consultative Group to Assist the Poorest (CGAP) poverty assess-ment tool is a low-cost tool intended for use in project and policy as-sessment developed by the International Food Policy Research Insti-tute (IFPRI) with technical and financial support of CGAP of the WorldBank.115 It was developed specifically to measure the poverty level ofmicrofinance clients, but it can be applied to identify the poor in a
115 See Zeller et al. (2001) for a detailed description.

117
general sense as well.Zeller (2001) describes the steps in developing the tool as (1) identi-
fying a large number (over 300) of indicators which were tested in thefield in four case-studies and subsequently reduced (2) designing a sur-vey methodology that facilitated the collection of information on theseindicators from households in the operational area of the programme(microfinance institution) and (3) applying a suitable statistical meth-odology for summarizing the information in the various indicators intoa single summary index.
The indicators were divided into (a) those which express the meansto achieve welfare, specifically the household’s human capital (familysize, education, occupation, etc.), physical capital (type and value ofassets owned), and social capital and (b) those which are closer to theends themselves (access to health services, food, electricity, energy, water,shelter and clothing, human security, and environmental quality). Over300 indicators were pre-selected. The strategy followed in identifyingreliable indicators was to choose indicators that were (a) obvious mea-sures of a dimension of poverty, such as the incidence of hunger or (b)good proxies for household total expenditure. An eight-point list ofcriteria was used to evaluate indicator suitability: (1) suitability for ur-ban-rural contexts (2) sensitivity of question (3) time and cost require-ments to obtain answers (4) quality of the indicator in discriminatingbetween different poverty levels (5) reliability116 (6) simplicity and (7)universality in an international context.
The list of indicators that were rejected and the grounds for rejec-tion is enlightening. They included (a) indicators using child-specificinformation (not all households have children, therefore, not a univer-sal indicator) (b) indicators of social capital (still an evolving area ofinvestigation and measurable and comparable indicators are not easilyfound) (c) subjective responses (responses on self-assessment of poverty
116 In the data collection sense, that the answer can be verified in a recheck.
GOOD PRACTICE IN POVERTY MEASUREMENT

118
POVERTY MEASUREMENT: Meanings, Methods and Requirements
were considered unreliable for comparisons) (d) health-related infor-mation (reliable health information requires longer recall periods andmore intensive and specialized training of interviewers, which is ex-pensive).
The questionnaire was field tested in four sites, one each in CentralAmerica, East Africa, Southern Africa and South Asia. The final list ofindicators used in the questionnaire and the list of indicators used toconstruct the poverty index are given in Table E8 and List E3 in Ap-pendix E.
The composite poverty index is then constructed using principalcomponents analysis. Complete details describing each step in imple-menting the tool are available in manual form (Henry et al. 2000).
2.9.2 Poverty maps117
Poverty maps are data sets that provide information about the spatialdistribution of poverty and inequality within a country, because theyallow the visualization of the incidence and magnitude of poverty acrossspace. Poverty maps are not limited to monetary measures. They canbe used with a variety of non-income indicators, both separately aswell as combined. These include infant mortality, chronic malnutri-tion, illiteracy, school-aged children not in school, overcrowded hous-ing, inadequate roofing, and the proportion of the population withoutaccess to water, sewerage, and electricity (Schady 2002).
Poverty maps (a) capture heterogeneity within a country (b) iden-tify geographic factors that influence poverty by enabling the researcherto investigate whether spatial disparities within living standards havebeen caused (and the nature of the causation) by geographically definedfactors such as agro-ecological resource endowments, access to inputand output markets, and availability of educational and health facilities(c) improve the targeting of resources and interventions by allowingthe most needy groups to be identified, and thereby minimizing the
117 This section draws on several reviews of geographic targeting and data requirements for pov-erty mapping (Henninger 1998, Schady 2002 and Deichman 1999).

119
leakage of transfers to non-poor persons (type I error) and the risk of apoor person being missed by a programme (type II error)118 (d) im-prove communication about poverty conditions by encouraging visualcomparison and making it easier to look for spatial trends, clusters orother patterns, and provide local stakeholders with information requiredfor local decision-making and for negotiation with government agen-cies, making them an important tool for local empowerment and de-centralization (e) provide an alternative to aggregating multiple dimen-sions of poverty. The advantage of spatial maps is that these multipledimensions can be described separately, but in a manner that enablesthem to be compared easily. Spatial maps can be used to overlap in-come-poverty, malnutrition, and access maps to assess joint correla-tions or disparities.
Maps that show indicators of well-being can help policy by indicat-ing areas that need additional resources such as infrastructure. Poorareas may also be selected to receive some form of direct transfer pay-ments, for example, in the form of subsidized credit, funds for publicworks, food-for-work programs, or direct local administrative budgetsubsidies.
Different forms of targeting can be distinguished: geographical tar-geting in which broad allocations of resources are made, individual as-sessment mechanisms in which households or individuals have to fulfilcertain criteria to be able to participate in social programmes, and self-targeting where the programme is designed to appeal only to the poor.
Poverty mapping is best used for geographical targeting where re-sources are directed toward areas that are identified as poor. An advan-tage of geographical targeting is that it requires relatively low adminis-trative costs. Indirect estimation of geographically referenced indica-tors or well-being tends to be less expensive than detailed surveys, moni-toring systems or means testing. Furthermore, if an existing adminis-trative structures such as county, district or municipal governments.
GOOD PRACTICE IN POVERTY MEASUREMENT
118 However, because poverty maps will have a certain error attached to them, they need to bevalidated and accompanied by independent sources of information.

120
POVERTY MEASUREMENT: Meanings, Methods and Requirements
Poverty mapping needs to make use of several data sources and indi-cators. For example, overlaying a poverty map with geographical in-formation on access to health care will not only inform decisions inwhere to expand health services, but also how to do so; poorer areaswith less access should be subsidized, while some form of cost-recoverycan be used in less poor areas.
The important research question that can be addressed with smallarea data is why poor regions exist at all (Ravallion and Wodon 1997).Two explanations exist: Individualistic explanations that assume no bar-riers to mobility and structural explanations that argue that mobility islimited.
According to the first explanation, people remain in poor areas be-cause of wage or price incentives, or because they believe they have agreater chance of making a living in a less competitive environment.Low rents, poor infrastructure, limited service and a lack of economicopportunities are the result of individual decisions by the poor to livein that area.
The essential feature of the structural explanation is that mobility islimited. People have little choice, and are, therefore, caught in a spatialpoverty trap where poor resource endowments lead to limited access toeducational, social and economic opportunities, thereby further increas-ing the differences between poor and better-off areas.
Empirical testing of structural theories requires quality informationon poverty as well as on human and geographical capital variables. Otherresearch uses of small area data include testing the influence of the leveland inequality of personal income on health and/or educational out-comes or other community-level choice variables.
2.9.3 Subjective measures of povertyThe monetary approach is typically associated with the quantitative-

121
objective approach outlined in section 2.1 above. However, the subjec-tive approach to poverty, which is described in this section, has both amonetary dimension where subjective assessments of the poverty lineare elicited from respondents, as well as a non-monetary dimensionwhere measures of “deprivation” are based directly on items that re-spondents consider important in the determination of well-being. Inthis section I focus primarily on the monetary dimension, but includediscussion of resource-based deprivation.
The subjective approach to measuring poverty attempts to movethe task of defining the poverty line away from experts to the poor orordinary members of society. “Perceptions of poverty” can be elicitedwith regard to (a) the perceptions of the poor with regard to their ownsituation (b) a judgement (not necessarily by the poor themselves) aboutminimum standards and needs and (c) poverty rankings, sometimescalled participatory wealth rankings (“which groups are most vulner-able in the village?”). While these are all “subjective” assessments thelast category is better described under the term “participatory approach”.This is partly because the methodology by which these perceptions areelicited are different for (a) and (b) (usually from small-scale surveys)than for (c). Hence in this section, I restrict the discussion to (a) and (b).
These perceptions can be used to (a) derive poverty lines, or providea reality check on poverty lines derived in some other manner, (b) in-form choices about equivalence scales, economies of scale, regional cost-of-living differences.
The limitations of this approach are that (a) they can reproduceexisting patterns of discrimination or exclusion that are deeply embed-ded in social norms (b) They are not obtained using rigorous samplingmethods and are therefore not representative, only indicative, and assuch cannot be used to set public action priorities and (c) they are sub-ject to time-horizon problems (the poor tend to focus on short-term
GOOD PRACTICE IN POVERTY MEASUREMENT

122
POVERTY MEASUREMENT: Meanings, Methods and Requirements
consequences, while technocrats and policymakers focus on the me-dium term) (Kanbur 2001b).
A segment of the developed country literature on poverty can betermed the subjective or consensus approach to poverty measurement.119
This supports the notions that (a) poverty is about the lack of choicesand (b) poverty is socially-specific and culturally relativistic, and that,wherever possible, the poverty line should be socially determined andsocially endorsed (Saunders 1997).
Several variants of consensual approaches to poverty lines are used:(1) Some obtain views about hypothetical families while (2) others fo-cus on respondents views about their own situation or how much in-come they need (Goedhart et al. 1977, Dirven et al. 1998) and (3) a thirdapproach (which defines poverty as the “enforced lack of socially per-ceived necessities”) asks which components of living standards are “nec-essary” (Mack and Lansley 1985). This information may be used toconstruct an (subjective) income poverty line, using price/cost infor-mation, or it may be used to construct a subjective deprivation povertyline based on scores (Dirven et al. 1998).
An example of the first approach is the Gallup poll question “whatis the smallest amount of money a family of four needs to get along inyour community?” (Danziger et al. 1984:501). It can also be used withhouses of different compositions and thereby provide a basis for con-structing equivalence scales (Rainwater 1974). The difficulty with thisapproach is that people are asked to put themselves in other peoples’shoes.
The second approach uses either a subjective poverty line (SPL) whichasks respondents about the minimum income they need to make endsmeet, or a Leyden poverty line (LPL) which is based on the concept of
119 This “subjective” approach is based largely on questions of a monetary nature, which is whythis topic is included in this section.

123
the welfare function of income (MacPherson and Silburn 1998: 13).Poverty lines using the SPL approach are typically based on a mini-mum income question (MIQ) such as the following “What income leveldo you personally consider to be absolutely minimal? That is to saythat with less you could not make ends meet” (Goedhart et al. 1977,Pradhan and Ravallion 2000).
How does one use this approach to construct a poverty line? Em-pirical studies have found that the answer to the MIQ is positivelyrelated with actual income (See Pradhan and Ravallion 2000 for a list ofempirical studies). The relationship looks like that shown in Figure 1.Thus z* is a good candidate for a poverty line-below it, people feeltheir income is not enough, above it, people feel their income is enough.Common practice in the developed country literatures is to find z*using a regression of minimum income on actual income (Pradhan andRavallion 2000).
Figure 10: The subjective poverty line (z*)
GOOD PRACTICE IN POVERTY MEASUREMENT

124
POVERTY MEASUREMENT: Meanings, Methods and Requirements
However, there are problems with this method. The regressions typi-cally use the answer from the MIQ as the measure of income.120 Thestandard practice in the MIQ assumes that the household that respondsto that question already knows its income, when this may not be true-they may only include cash income (excluding imputed income fromown housing or own production) which will be an underestimate, orthey may include asset sales, or ignore production costs (an overesti-mate). These problems are particularly acute in developing countries,which have led some researchers to develop alternative means of iden-tifying the subjective poverty line without an MIQ (Pradhan andRavallion 2000). The alternative proposed by Pradhan and Ravallion(2000) is to ask several (qualitative) questions on consumption adequacy(of different categories) in a quantitative survey.
Table 17: Questions on consumption adequacyI would like to ask your opinon of your family’s standard of living
It was less than adequate for your family’s needs 1
It was just adequate for your family’s needs 2
It was more than adequate for your family’s need 3
Not applicable 4
*Adequate means no more nor less than what the respondent considers to be the minimum
consumption needs of the family.
Concerning your family’s food consumption over the past one month, which of the
following is true?
Concerning your family’s housing, which of the following is true?
Concerning your family’s housing, which of the following is true?
Concerning your family’s clothing, which of the following is true?
Concerning the health care your family gets, which of the following is true?
Concerning your children’s schooling, which of the following is true?
Source: Pradhan and Ravallion, 2000
120 Pradhan and Ravallion make the point that this measure is obtained from just one question,whereas many pages of programming code are required to construct typical income and expendi-ture indicators used in standard (traditional, objective-quantitative) poverty measurement fromsurvey responses.

125
The responses to these questions are then used, together with the re-sponses to quantitative questions on actual expenditure, to construct apoverty line (See Pradhan and Ravallion, 2000 for a detailed descrip-tion of the methods used to do so).
Analyses of this nature have recently been carried out on seven WestAfrican cities (Razafindrakoto and Roubaud 2003). Data were fromrecent surveys, which included consumption and living conditions ofhouseholds as well as “subjective” perceptions on their standard of liv-ing. Sen (2003) also constructs subjective poverty lines (using a some-what complicated definition of the SPL) and compares movements inand out of poverty as defined by objective and subjective poverty lines.
Research conducted by the Social Policy Research Centre (SPRC)in Australia found that when a sample of Australians were asked theMIQ, that is, what was the minimum income they needed in order tomake ends meet, there was a great deal of variation, and only 30 per-cent of the variation could be explained by the actual income and fam-ily circumstances of the respondents (Saunders 1997). When the ques-tion is asked of a more homogenous sample of Department of SocialSecurity (DSS) clients (those who actually receive income support) theMIQ response exceeds the actual income of those surveyed by between30 and 80 percent. However, when asked to choose the statement thatbest described what being in poverty meant to them (see below) theresponses indicated that few of them saw poverty in purely relativeterms (“having less than others”) and the vast majority saw it in termscloser to the concept of absolute deprivation (relating to not being ableto afford “basics” and having to struggle to “survive”).
GOOD PRACTICE IN POVERTY MEASUREMENT

126
POVERTY MEASUREMENT: Meanings, Methods and Requirements
Table 18: Perceptions of the meaning of poverty among DSS clientsPercentages
Not having enough money to make ends meet 12.3
Having a lot less than everyone else 1.8
Not having enough to buy basics like food and clothing 41.9
Having to struggle to survive each and every day 26.4
Never having enough to be able to live decently 8.6
Never being able to afford any of the good things in life 6.7
Don’t know 2.5
Source: SPRC Longitudinal Survey of DSS Clients, First Wave of Interviews (prelimi-
nary) quoted in Saunders, 1997
Other studies have found that dramatically different answers maybe given in responses to only slight changes in the wording of questions(Walker 1987; Hagenaars and de Vos 1988; van den Bosch et al. 1993).
The other approach is to use household questionnaires to find outwhat respondents (as opposed to experts) consider to be necessities.Widely varying answers are given, because people’s responses are basedon their own situation, regardless how far they are from the povertyline (MacPherson and Silburn 1998). A study by Mack and Lansley(1985) claims to include items that are indicators of “not only the basicessentials for survival … but also access or otherwise, to participating insociety and being able to play a social role”. Most respondents classified22 of these items as necessities and their absence was negatively corre-lated with income. Mack and Lansley anyone who could not affordthree or more of these items was considered to be poor. Callan andNolan (1998) also use “suitable” direct information on indicators ofdeprivation to construct a measure of exclusion due to lack of resources.Callan and Nolan (1998) use factor analysis and identify a set of eightitems that cluster together in a factor analysis of a larger set of items.An “enforced lack” in any one of these eight items is treated as an

127
indicator of underlying generalised deprivation. A measure of povertycombining income and “deprivation” information is obtained by re-garding a household as poor if it falls below 60 percent of average in-come and is experiencing deprivation (as defined above).
The Poverty and Social Exclusion Survey (PSE) conducted in Britainin June 1999 followed a similar approach. Just over 25% of the popula-tion was found to be poor, where poverty was defined as both lowincome and low standard of living or multiple deprivation (defined aslack of necessities as defined by respondents).
A recent study by Razafindrakoto and Roubaud (2003) presents mea-sures and analysis of poverty in Antananarivo, Madagascar in terms ofseven measures. These are (a) standard “objective-quantitative” mon-etary measures such as the $1 and $2-a-day measures, as well as non-monetary objective poverty measures in terms of (b) living conditions (c)human capital and (d) social exclusion and subjective poverty measuressuch as (e) a general perception of the standard of living, (f) non-satis-faction of needs seen as vital (consensus principle) and (g) financial pov-erty. They find that although none of the seven categories defined as poorrepresents less than 32% of the population, only 2.4%combine all the crite-ria. On the other hand 78% of the population show at least one form ofpoverty. These results indicate that the multidimensionality of povertyis better described by a vector of well-being indicators, rather than asingle indicator. Correlations between the indicators were higher be-tween indicators of a single category (for example, objective or subjec-tive) than between indicators across these categories. Monetary pov-erty measures had the highest correlation with any other indicator.Determinants of objective and subjective poverty also tended to be dif-ferent.
Studies that have investigated the correlation between income andsubjective well-being (both proxies for utility) have found positive butweak correlations (Burchardt 2003). The low correspondence between
GOOD PRACTICE IN POVERTY MEASUREMENT

128
POVERTY MEASUREMENT: Meanings, Methods and Requirements
income and subjective well-being may be due to (a) inaccurate measure-ment of income (b) the importance of non-income factors for subjec-tive well-being (c) the disposition for happiness being a personal trait(d) the neighbourhood or reference group effect and (e) adaptation ac-cording previous income trajectory.121 Conclusive evidence for or againstadaptation requires longitudinal data. Using a two-wave panel for Rus-sia, Ravallion and Lokshin (2001) find that household income is a strongindependent predictor of change in subjective economic welfare, con-trolling for baseline income. Burchardt (2003) using ten years of datafrom the British Household Panel Survey found that subjective well-being is influenced not only by an individual’s current situation, butby their previous situation as well. Those who have become poor areless satisfied than those who have been poor for a long time, whilethose who are upwardly mobile are no more satisfied than those whohave experienced a higher income over a period. Therefore, income is aflawed proxy for satisfaction, and satisfaction is unsuitable for assessingcurrent well-being.
2.10 SummaryIn this section, I first outline areas in which there is consensus, areas inwhich there is disagreement, and areas that despite disagreement, pro-vide definite routes to follow, and make some general conclusions onthe state of poverty measurement.
Areas in which there is consensusThe definition of poverty. The idea that poverty relates to the abil-ity to participate in society is evident in the developed country lit-erature as well as in the developing country literature. In the devel-oped country literature the concept of social exclusion is used of-ten. In the developing country literature the term capabilities, and
121 (c) is the Psychological explanation while (d) is the sociological explanation.

129
the related ability to function/participate is emphasized. The con-cept of capabilities is readily accepted as being “what the standardof living” is about.The monetary measurement of poverty and associated quantitativeapproach are inadequate.The multiple dimensions of poverty need to be included in povertymeasurement.There is much to be gained by combining quantitative and qualita-tive approaches. There is scope for incorporating subjective ap-proaches to determining the poverty line. Participatory approachescan provide context, explain outliers, help identify indicators, etc.
Areas in which there is disagreementOn how to incorporate multidimensionality, specificallyWhether the dimensions should be aggregatedHow they should be aggregatedOn whether to use relative or absolute poverty linesOn whether poverty lines should be objective (expert-based)or subjectiveOn what bases should be used for objective poverty lines (budgetstandard or least-cost)On how to construct adult equivalence scales
Areas in which there is no consensus, but there are several definitealternatives followed
Aggregating multiple dimensionsThe selection of indicators or dimensions to be included
It is now clearly recognised that any single indicator of poverty willnot adequately describe or measure the complex phenomenon that is

130
POVERTY MEASUREMENT: Meanings, Methods and Requirements
poverty. Multidimensionality of poverty is now firmly accepted, andwe are much closer to measuring it than we were a decade ago.
It is also evident-although arguably-that any single approach to mea-suring poverty will not suffice. The contribution of the monetary ap-proach to poverty measurement is well-known, just as its limitationsare evident. The capability approach to poverty measurement by fo-cusing on basic deprivation, has contributed much to the conceptualresurgence in this field, and thus provides a good theoretical and con-ceptual basis for improvements in poverty measurement. However,the social exclusion approach has a contribution to make by adding theelement of participation or inclusion. Participatory approaches pro-vide the local non-expert based knowledge that is insufficiently empha-sized in the other approaches.
We are also much better at measuring the dynamics of poverty thanwe were several years ago. The availability of panel data has led tomethodological improvement in distinguishing between the transientlyand permanently poor and tracking movements in and out of poverty.This has also had important implications for the measurement of vul-nerability. The measurement of empowerment, or its absence in voice-lessness and powerlessness is still at a somewhat rudimentary stage, butwith a growing research agenda.
Recent empirical work has focused on comparing results using dif-ferent approaches (quantitative and qualitative, objective and subjec-tive, monetary and non-monetary, etc.). This leads to the question ofdata requirements for the measurement methods advocated in this chap-ter, which is the subject of the next chapter.

131
3.1 IntroductionThe purpose of this chapter is to provide an overview of the data re-quirements for the poverty measurement exercises outlined in Chapter2, give an indication of typical data sources for these requirements,highlight their strengths and weaknesses, and provide examples fromother countries. In addition, this chapter raises issues pertaining to thesedata requirements in the context of the current international povertymeasurement and monitoring agenda.
In the next section I provide a brief overview of data sources thatare available in most countries worldwide. This section draws heavilyfrom several excellent reviews of data sources (Lok-Desallien 1996,Coudouel et al. 2001 and Achikbache et al. 2001).
3.2 Sources of dataAchikbache et al. (2001) illustrate the statistical process in Figure 1,Appendix H. Various “statistical organizations” gather information fromeconomic and social agents using a variety of data collection methods.These data are processed in varying degrees and the resulting statisticalproducts, including poverty monitoring data, are used by a variety ofdata users. Our focus, in this chapter is on (raw) data sources (whatAchikbache et al. call data collection methods), rather than on “statisti-cal products”.
Data sources are categorised into censuses and sample surveys, ad-ministrative or service records and qualitative and participatory sur-veys and appraisals.
A visually useful classification of data sources is given by Lok-Desallien (1996)122 who presents the various data sources on twocontinuums (Figure 2, Appendix H). The vertical axis indicates differ-
3. DATA REQUIREMENTS FOR POVERTY MEASUREMENT
122 Adapted from Marchant, 1994.

132
POVERTY MEASUREMENT: Meanings, Methods and Requirements
ences in data collection methodology that range from subjective assess-ment through a series of more structured approaches including quanti-tative and qualitative questionnaires to direct measurement (for example,anthropometric data). The horizontal axis provides a continuum insample size from the case study to the census. Surveys of the quantita-tive type typically undertaken by National Statistical Organisations(NSOs) are bunched on the upper right of the diagram, reflecting theiruse of quantitative questionnaires and probability sampling, while rapidappraisals, ethnographic investigations and other intensive anthropo-logical studies are bunched in the lower right hand side. Several “hy-brid” surveys hover above the horizontal axis, which are based on struc-tured interview but use a variety of sampling methods.
In this section I focus on these different types of data and their uses.I begin by focusing on censuses and sample surveys, I follow with anoverview of qualitative data, and finally I focus on several importantsources of data from administrative records.
3.2.1 Censuses and surveysCensusesCensuses of population and housing are held infrequently, even in de-veloped countries, but provide an important role in poverty measure-ment. They are usually the main source of a national sampling frame,on which sample designs for subsequent surveys are based. In addition,recent work on small area estimation has highlighted the importanceof censuses in providing estimates (for all households) of the probabil-ity of being poor. (See section 2.1.5 and section 3.2.4). Agriculturalcensuses are also important, especially in providing data on vulnerabil-ity of livelihoods and security of food supply in the rural sector. Somerecent censuses have also provided sufficient information to be used inmultidimensional poverty analysis (Qizilbash 2003).123
123 The 1996 South African census data have been the focus of some of the recent academic andpolicy-oriented literatures on South Africa (Qizilbash 2003).

133
The population census usually contains descriptive statistics of thehousing stock, access to basic services such as water, electricity andsanitation, information on education and employment patterns and popu-lation statistics.
Multi-topic sample surveysSurveys that are based on probability sampling and that collect infor-mation on a number of topics are extremely useful for poverty analy-sis, that is, understanding the causes of poverty.
Multi-topic surveys fall into two categories: (a) large-scale and in-depth surveys which are designed to provide a wide range of represen-tative data on households, which are time-intensive, and (2) rapid orlight surveys, which also collect information on several topics, whichmay be administered to large or small samples, but which can be ad-ministered quickly and over a short space of time.
The World Bank’s Living Standards Measurement Survey and Inte-grated Surveys and RAND’s Family Life Surveys in Malaysia and Indo-nesia (which include data on household income and consumption ex-penditures as well as measures of public services and demographicbehaviour) are examples of the first category of multi-topic surveys.Priority Surveys and Core Welfare Indicators Questionnaire (CWIQ)fall into the latter category.
LSMS surveysThese comprise both a household survey and a community level mod-ule. The household survey collects information on household expendi-tures and income, health, fertility, anthropometrics, education, employ-ment, agricultural and non-agricultural self-employment, the owner-ship of assets such as housing and land, access to services and socialprogrammes, credit and savings information, migration, etc.
DATA REQUIREMENTS FOR POVERTY MEASUREMENT
134
POVERTY MEASUREMENT: Meanings, Methods and Requirements
The community module collects information on community infra-structure and access to basic services, seasonal labour markets, wagerates and agricultural practices. It is usually administered to a villageleader, except for the health and education sections, which are coveredat the relevant facility with appropriate staff.
The price module focuses on the prices of the most important pur-chases and sales by low-income households, including consumer pricesfrom local markets for food and nonfood items, and prices of the mainproducts and consumption items of poor households.
LSMS surveys tend to be expensive, costing around $700,000 (de-pending on the sample size), and time intensive to administer (at leastone hour, and depending on the modules included, repeated visits arerequired) and long in duration (19 months from sample and question-naire design to completion of initial data analysis). If they are “piggy-backed” onto existing surveys they are somewhat less expensive (LokDessallien 1996).
Because of their time-intensive and expensive nature, LSMS and In-tegrated Surveys (IS) are administered at 4-6 year intervals. Repeat sur-veys include a core panel in order to be able to track the same house-holds over time.
The LSMS project is conducted by the World Bank, and informa-tion on datasets, archives of studies based on LSMS surveys are avail-able on the LSMS website: http://www.worldbank.org/html/prdph/lsms. See also Grosh and Munoz (1996) and Grosh and Glewwe (2000).
Core Welfare Indicators Survey (CWIQ)The Core Welfare Indicators Survey is an example of a rapid monitor-ing survey that is quick and easy to implement. It is conducted annu-ally, for the purpose of rapid monitoring of key indicators for differentpopulation subgroups, in particular indicators of access, utilisation and

135
satisfaction with core social and economic services (see List E2, Appen-dix E), and has the following features:
It is part of an overall monitoring package.It has a short questionnaire with multiple-choice questions for easy
and rapid data collection and is administered in a single visit.It uses optical scanners to speed data entry to eliminate data entry
bottlenecks and pre-programmed validation procedures to ensure highbuilt in data quality levels.
It has “push-button” standardised outputs (tabulation plan).It employs as large a sample as is feasible, given national statistical
resource constraints, and the need for rapid results.It is not designed to measure or monitor poverty, rather it is in-
tended only to measure whether or not public services and develop-ment programmes are reaching and benefiting the poor, and to moni-tor selected indicators (those that contain advance warnings of futureimpacts of policies and events) and assess household living conditions,access to basic social services and infrastructure and satisfaction withthese services.
Rapid nutrition monitoring in BangladeshA similar rapid monitoring survey is the Nutrition Surveillance Projectin Bangladesh which has been conducted since 1990. It was spearheadedby Helen Keller International, actively involves local civil society orga-nizations and the government, and is funded by UNICEF and USAID(UNDP 2000).
It collects household data across the country every two months tomonitor people’s food security and poverty.
A typical survey lasts six weeks.It covers 41 subdistricts and 4 urban slum wards.The purpose is to link malnutrition to its causes.
DATA REQUIREMENTS FOR POVERTY MEASUREMENT

136
POVERTY MEASUREMENT: Meanings, Methods and Requirements
Information is collected on:The socio-economic status of the householdHousehold agricultural productionDemographic characteristicsFood consumption and Nutrition of household membersHealth and Vitamin A status of mothers and childrenVillage-level pricesSpecial modules are added to the basic questionnaire to address spe-
cific problems.A brief report with summary findings quickly follows each survey
round.The project has been used to assess the effects of disasters and the
impact of relief and rehabilitation efforts on household members, par-ticularly nutrition and health of children.
Demographic and Health Surveys (DHS)The DHS surveys have been carried out in over 50 countries, primarilywith USAID sponsorship. They comprise two sections: a householdquestionnaire, and an individual questionnaire which is administeredto all females between the age of 15 and 49.
The household questionnaire includes information on basic house-hold data, survivorship and residence of parents, eligibility for indi-vidual interview, household amenities, time to get water, drinking wa-ter source, toilet facilities, housing conditions and ownership of con-sumer durables. They typically do not include income or expendituremodules, with one exception: the 1994 Indonesia DHS, which fieldedan experimental module on household consumption expenditures inabout half the surveyed households.
The individual questionnaire includes respondents background in-formation including childhood residence, date of birth and age ofwomen, education and literacy, religion and ethnicity, information on

137
reproduction, contraception, health of children including breastfeedingpractices, immunization and health, marriage and fertility preferences,husband’s background and woman’s employment, anthropometric data(child height and weight) for children under 5.
These surveys are in-depth surveys that are time-intensive (they in-clude weighing and measurement of children, and sometimes women)and costly, and therefore are held only every 6-7 years.
The DHS surveys are administered by Macro International, Inc.Datasets and documentation are available to researchers at their websitehttp://www.macroint.com/dhs. Lok Dessallien (1996) estimates theircost to be approximately $500,000 and their duration 16-18 months.
Because these surveys are based on a somewhat uniform question-naire across countries (and therefore allow for cross-country compari-sons), are well-documented, and easily accessible, and contain informa-tion on assets and access to services, they have become an importantsource of data for developing asset-based proxy indices, and asset-pov-erty indices (see section 2.4).
In addition, they are a unique source of information (on nutrition,health and education) on individuals (women and children) allowingfor some intrahousehold analysis.
Household Income and Expenditure Surveys (HIES)Household Income and Expenditure surveys are the main vehicle forthe collection of income and expenditure data in a country. Data fromthese surveys have been used to construct measures of income and ex-penditure inequality and poverty, to construct weights of average house-hold consumption bundles for consumer price indices, estimation ofsavings, incidence of taxation, elasticity of demand for goods and ser-vices and nutritional analysis of food consumption.
HIES surveys are typically national in coverage, although in somecountries (mainly in Latin America) they are confined to urban areas.
DATA REQUIREMENTS FOR POVERTY MEASUREMENT

138
POVERTY MEASUREMENT: Meanings, Methods and Requirements
Information collected in the HIES includes household demographicinformation (including education and occupation of all household mem-bers), household income (individual and collective, in-cash and in-kind,paid and self-employment), household expenditures (individual and col-lective, for purchased goods and services as well as for consumption ofself-production) and assets (family business stocks, owned housing).
Income poverty estimates rely heavily on consumption expendituredata. Thus, HIES are the main sources of data for the measurement ofmonetary poverty. Depending on the breadth of the survey, these sur-veys are also useful for poverty analysis, although typically not as use-ful as multi-topic surveys such as the LSMS.
A criticism of household survey data is that expenditure is oftencollected at the level of the household rather than the individual. Thus,little information is available on intra-household consumption and in-tra-household allocation of resources. In the case of household publicgoods it is not possible to allocate expenditures individually. In the caseof private goods, the purchaser and the consumer may differ, and thepurchaser may not be well informed about its use, and the consumerabout its purchase. However, in the case of other goods, such as ciga-rettes, it is relatively easy to find out who consumes how much (Caseand Deaton 2002). Field experience has shown that accurate informa-tion can be obtained only when there is both a “household” question-naire, as well as a series of “individual” questionnaires where each adultis asked to report a subset of expenditures (Case and Deaton 2002).
HIES can be expensive and time-intensive. Many countries typicallyadminister them only every five years or so. However, this varies, inboth developing and developed country situations. India (see below)administers this survey annually, as does the UK (Family Budget Sur-vey). On the other hand, in Ireland, the Central Statistical Office’s(CSO) household budget survey (conducted since 1973) is conductedonly once in seven years.

139
National Sample Survey (NSS)Conducted by the National Sample Survey Organization practicallyevery year since 1951. Since 1972/73, a quinquennial survey is includedwith a considerably larger sample size. Only expenditure data is col-lected (no income data). Recent debate involves the increasing discrep-ancy between consumption growth as measured by the NSS when com-pared with national accounts statistics (NAS).
Labour Force and Employment SurveysLabour Force and Employment Surveys are traditionally used to ob-tain regular estimates of (un)employment and labour force participa-tion. The survey sample is typically smaller than that of an HIES. Theuse of these surveys in (consumption) poverty measurement is limitedbecause they only contain earnings data. Household information is lim-ited to demographic and education and occupation data.
Lok-Dessallien (1996) indicates that some countries have developeda series of employment-related surveys, given the difficulty of captur-ing all aspects of the labour market in developing countries in one sur-vey. These include (a) establishment surveys (to ascertain the size offormal sector employment) (b) household employment surveys (toobtain detailed information on the economically active and inactivepopulations) (c) informal sector surveys (to obtain detailed informa-tion on size and characteristics of the informal sector-usually urbanonly) and (d) household livelihood surveys (to better understand thebroader range of livelihoods of the population, and the coping and adap-tive strategies).
Food consumption and nutrition surveys124
These are based on a small sample size, but often include measurementof food consumption. They can provide detailed information on (a)Types and severity of nutritional deprivation (b) Consumption and
124 Based on UN 1984.
DATA REQUIREMENTS FOR POVERTY MEASUREMENT

140
POVERTY MEASUREMENT: Meanings, Methods and Requirements
production of own produce (they may be the only source of informa-tion on crops such as cassava or yams whose production cannot beeasily calculated through standard agricultural surveys) (c) Weights forcost-of-living indices and estimates of private consumption expendi-ture (d) The effects of food subsidy programmes, for example, the ef-fects of food subsidies on food intake, nonmarket prices, income andthe demand for food.
Agricultural surveys and censuses125
The census of agriculture provides basic information on the organiza-tion and structure of the sector and use of agricultural resources. Itcovers (a) Comprehensive statistics on agricultural land area, crops cul-tivated, irrigation and numbers and kinds of livestock (b) Benchmarksfor improvement of current estimates of crop areas and production,and of livestock resources and production (c) Measures of the state of,and changes in, the structural attributes of agriculture, such as size anddistribution of holdings, extent of various forms of tenancy, agricul-tural resources, production requisites, facilities and practices (d) Basicdata on current use and changes in use of agricultural resources such aspeople, land, livestock and poultry, irrigation, agricultural machineryand implements (e) The coverage of these censuses make it possible touse the data for small areas (communities, administrative units, andagro-ecological zones) which can contribute significantly to povertyassessments, especially where the majority of the poor are involved insubsistence agriculture.
Table 19 relates some of the indicators of poverty identified in chap-ter 2 to the data sources among censuses and surveys.
125 Based on UN 1991.

141
Table 19: Variables related to poverty and human welfare, Census,LSMS and DHSIndicator Census LSMS DHS
HealthAnthropometric measurementsChild mortalityDisability (selected
countries)Education
LiteracyEducational attainmentSchool attendance
EconomicsEconomiccharacteristics
of householdsOccupationStatus in employmentTotal consumptionHousehold income (selected
countries)Total household expensesTotal food expensesAccess to services (selected
countries)Housing
Type of buildingsNumber of rooms, floor spaceWater supplySanitationCooking facilitiesNumber of occupants ( crowding)
Source: Henninger 1998, Appendix 2.
Table 20 below highlights the advantages and limitations of some ofthe household surveys described above in relation to poverty measure-ment.
DATA REQUIREMENTS FOR POVERTY MEASUREMENT

142
POVERTY MEASUREMENT: Meanings, Methods and Requirements
Table 20: Advantages and limitations of household survey typesHousehold Survey Advantage Limitations
Multi-topic surveys Measurement and a Time-intensive (colle-nalysis of different ction and evaluation)poverty dimensions,their inter-relationships, andcorrelates
Demographic and Health-poverty Measurement of otherhealth surveys measurement, health dimensions of poverty
behaviour analyses, limited, diagnosticsbasic poverty limiteddiagnostics
Employment surveys Analysis of Limited use for povertyemployment patterns, measurement andwage income diagnosticsanalysis (link toeducation)
Single-topic surveys Income-poverty Limited diagnosticsmeasurement possible(or one otherdimension)
Rapid monitoring Monitoring of key Income-poverty mea-surveys and service welfare indicators surement not possible,satisfaction surveys limited diagnostics
Source: Coudouel, Hentschel and Wodon (2001)
3.2.2 Qualitative dataThe importance of qualitative data and research in complementing ex-isting quantitative techniques has been highlighted throughout thispaper. In this section I describe some important data collection meth-ods for qualitative and participatory assessment and highlight their usesin poverty measurement and monitoring.

143
Table 21: Data collection methods for qualitative and participatoryassessmentsData Collection in: Methods
Beneficiary Assessments Participant observation and more systematic data
collection methods like structured interview over a
limited time spanEthnographic Investigations Anthropological research techniques, especially
direct observation, to analyse the influence ofethnicity, gender and village stratification on thehousehold and group well-being behavior.
Longitudinal Village Studies Wide variety of methods ranging from direct ob-servation and recording (tabulation), periodic semi-structured interviews with key informants (for ex-ample, health centre staff) and village population,to survey interviews in several different observa-tion periods.
Participatory Assessments Ranking, mapping, diagramming, and scoring meth-ods are prominent besides open interviews and par-ticipant observation. The time horizon of partici-patory assessments is often short. They build onlocal populations describing and analysing theirown reality surrounding poverty and well-being.
Source: Coudouel, Hentschel and Wodon (2001)
The advantages and disadvantages of participatory methods and quali-tative data have been highlighted in the previous chapter. These meth-ods are useful in providing context, or identifying the poor, their chiefshortcomings are the lack of representativeness. This points to the ad-vantages of triangulation: of combining quantitative and qualitative ap-proaches.
Coudouel et al. (2001) provide a list of criteria for assessing the ad-equacy of qualitative data in the use of poverty measurement and moni-toring.
DATA REQUIREMENTS FOR POVERTY MEASUREMENT

144
POVERTY MEASUREMENT: Meanings, Methods and Requirements
Table 22: Criteria for assessing the adequacy of qualitative dataCriteria Adequate requirement
1. Age of data Collected in the past five years
2. Methodologies Participatory methods (PRA), focus
groups better
3. Coverage and scope: All major agro-ecological zones repre-
Geographical sented
Rural and urban Both
Groups consulted Both sexes, youth and elderly, other vul-
nerable groups, major livelihood groups
of the poor
4. Dimensions of poverty Dynamics (esp. seasonality), causality,
gender, age, livelihood
Identification of vulnerable groups
5. Perceptions of Explored
services, infrastructure
and governance
6. Information flows Awareness and understanding of pov-
erty-related policies and programs
7. Priorities of the poor Opportunities and constraints improv-
ing quality of life, priorities for pov-
erty reduction
Source: Coudouel, A., J. Hentschel and Q. Wodon (2001)
3.2.3 Administrative dataAdministrative data are collected (and statistical products produced)by line ministries and specialized agencies in their capacity as regula-tors or monitors of certain activities and functions of government. In-terest in the use of administrative data has at least two sources: (a) in-creasing budgetary pressure to find less expensive ways of collecting

145
data, and (b) the use of geographic information systems in povertymapping which can combine data from many sources spatially.
The Ministry of Health synthesizes data on health services providedthrough hospitals, clinics and health campaigns (for example, vaccina-tions), on such items as the status of child nutrition, disease incidence,inpatient and outpatient visits, etc.
The Ministry of Education collects information on enrolments, teacherand student profiles, educational attainment, repetition and dropoutrates, etc. directly from schools.
In some countries, for example, Viet Nam and China, local recordsare maintained on the poverty status of households, and are synthe-sized by the Ministry of Social Welfare, or the National Statistical Office(NSO).
The Ministry of Public Works has information on water, sanitationand electricity distribution.
Agricultural service records are collected from local administrativeunits or Ministry of Agriculture extension workers. These include dataon: area cultivated, area harvested, estimated yield and production, cropdiseases and agricultural inputs, etc.
Table 3 compares administrative data with data collected by the Na-tional Statistical Office. The advantages of using administrative dataare that (a) they are usually relevant, (b) collected frequently, (c) havecomplete data coverage, that is, is reached by the administrative pro-cess, (d) may include checks on data accuracy, (e) the cost of data collec-tion is much less than for surveys and (f) the response rate is high, andthe response burden is lessened.
The use of administrative data poses problems and challenges: (a)the NSO loses control over data quality (b) technical and legal prob-lems of access (c) problems of comparability between datasets in rela-tion to base years and geographical disaggregation (d) limited coverageof the administrative system.
Achikbache et al. (2001) highlight areas that are likely to be impor-tant for poverty monitoring: (a) health statistics derived from records
DATA REQUIREMENTS FOR POVERTY MEASUREMENT

146
POVERTY MEASUREMENT: Meanings, Methods and Requirements
kept by health centres, clinics and hospitals, (b) education statistics col-lected from schools (c) records pertaining to the social safety netprogramme, (d) vital event registration (e) utilities (water and powerdistribution) and (f) business licensing.
Table 23: Administrative data compared with specific NSS data sys-temsAdministrative data Specific NSS data systems
+ No/minimal cost to NSO - Full cost borne by CSO (except wherethere are partner agencies-rare)
+ Can be very secure in terms of longevity-eg. + Longevity determined largely by NSOcompany taxation; customs; motor vehicle (but increasingly subject to fundingregistrations support through the annual budget process)
- Can be vulnerable to changes in policy eg, + Changes to collection determined byabolition of certain controls NSO
+ May be associated with very strict editing and +/- Editing under control of NSO, but thiscontrols eg, revenue functions like tax and customs can be resource intensive
- Confidentiality-individual records may not be + All records available to NSOavailable to NSO for edit/query
+/- Sometimes very strict reporting requirements eg, + Can impose compulsory response undertax-but others can be unreliable despite apparent statistics legislation-but does this affectstrength (eg, building approvals) data quality?
- Data items set up for non NSO purposes + Data items, definitions, scope determinedby NSO
- Control by host agency, NSO cannot impose changes + NSO has control+ Coverage-normally 100% of target population eg, +/- NSO can aim for 100% coverage, but
tax, customs costs often force use of samples+/- Data accessibility-many are electronic, but some -/+ NSO can determine nature of system
require extensive manual transfer processing, but data processing is oftenburdensome

147
Table 23: Administrative data compared with specific NSS data sys-tems contd.Administrative data Specific NSS data systems
- Flexibility-it can be difficult to persuade other + NSO can vary items and procedures atagencies to change to meet NSO needs its own discretion
+ Minimises respondent burden - Absolute increase in respondent burden+ Can lead to efficiencies in sharing specialist skills
and training+ Can lead to efficiencies in sharing specialist skills
and training+ Establishes NSO links to other agency-maximises
chance of NSO involvement in future developments(can introduce changes at the margin)
Source: Achikbache et al. 2001.
Table 24 below relates different types of poverty measurement andthe data required to construct them to the data source that they aretypically constructed from.
Table 24: Poverty measures, data requirements and data sourcesType of poverty measure Data requirements Typical Source
(Objective-quantitative type) Consumption expenditure, Household budget surveyFGT measures of poverty for use correlates of poverty such asin a standard poverty profile demographic variables,
education, occupation,geographic location, price data
Subjective Respondents assessments on Specialised small-scale surveys, par-minimum incomes, items ticipatory appraisalsessential for well-being, etc.
Chronic and Transitory meaures Consumption expenditure Longitudinal household surveysof poverty and income measures over time,
and their correlates: education,occupation, etc.
DATA REQUIREMENTS FOR POVERTY MEASUREMENT

148
POVERTY MEASUREMENT: Meanings, Methods and Requirements
Table 24: Poverty measures, data requirements and data sourcescontd.Type of poverty measure Data requirements Typical Source
Vulnerability In addition to measures of the Household surveys, demographicincome aspect of vulnerability, and health surveys, agricultural cen-data on food insecurity, natural sus and surveys, participatory data,disasters as well as household information from famine earlylevel vulnerability measures such warning systems and auxiliary dataas death or illness/loss of job of from GIS.breadwinner.
Multidimensional measures Indicators on health, education, Household surveys, demographicaccess to facilities, assets, and health surveys, agricultural cen-
sus and surveys, participatory data,information from famine early warning systems and auxiliary data fromGIS, as well as administrative data.
Intra-household measures Information on health, Household surveys, demographicof poverty education and economic and health surveys, administrative
activities of women and data from the Ministry of Health.children, health status of theelderly
3.2.4 Combining survey and census dataSmall area estimation is a statistical technique, which combines surveyand census data to estimate welfare or other indicators for disaggre-gated geographic units such as municipalities or rural communities (Davisand Siano 2001). The exercise involves predicting a model of consump-tion from household survey data using explanatory variables that arefound in both the household survey and the census. This will include(a) demographic variables such as household size, age, sex composition(b) education and occupation of each family member (c) quality of hous-ing (d) access to public services such as electricity and water and (e)principal language spoken in the house. The parameter estimates fromthe model are then applied to census data to predict probabilities of

149
each household in the census being poor (Hentschel et al. 2000). Themodels should be estimated by statistically-representative regions.Household-level results can then be aggregated by the geographical re-gion of interest by taking the mean of the probabilities for the chosengeographical entities (Davis and Siano 2001). This permits the construc-tion of poverty maps (disaggregated across geographic units). The opti-mal degree of disaggregation depends on (a) the purpose of the map (b)the level at which the household data is estimated and (c) tradeoffsbetween the size of the standard error and policy needs.
Others (Bigman et al. 1999) have estimated similar indicators usingGIS derived indicators (such as climatic suitability, livestock per capita,distance to nearest health facility, number of water pumps per commu-nity) as explanatory variables.
Countries for which poverty maps have been constructed at thehousehold level for targeting and policy making, include Ecuador andNicaragua (Hentschel et al. 2000), Panama (World Bank 2000), and SouthAfrica (Alderman et al. 2000).
Similar exercises can be done at the level of disaggregated geographi-cal units, such as communities or small towns, and have been done forVietnam (Minot 1998), Burkina Faso, India, Kenya and China (Bigmanet al. 2000).
Sources of data for poverty mapsGeographic targeting needs small area data. For this reason, nationalstatistical agencies should make census data available at the lowest geo-graphic aggregation that does not compromise data privacy. Sample sur-veys should be designed with some consideration of geography to en-sure sufficient spatial coverage as well as statistical significance of sur-vey data at relatively low levels of geographic aggregations. This re-quires a combination of population-based sampling with a spatial sam-pling design.
DATA REQUIREMENTS FOR POVERTY MEASUREMENT

150
POVERTY MEASUREMENT: Meanings, Methods and Requirements
Population and housing censusesCensus data can be compiled for small statistical or administrative areasor for communities, towns and villages and provide the basic informa-tion (on population and housing) for poverty maps.
SurveysSurveys such as the World Bank’s Living Standards Measurement Sur-veys (LSMS) and the USAID funded Demographic and Health Surveys(DHS) provide more comprehensive data resulting in several hundredindicators. However, they are not reliable sources of small area infor-mation because they are based on samples which are not meant to bestatistically representative at a very disaggregated level.
Sample survey information on indicators (for example, health out-comes) can be used, together with information on the location of sampleclusters by geographical information systems (GIS) to allow aggrega-tion of survey data for regions other than administrative units (such asagroclimatic zones or regions classified according to access to infra-structure and services).
Information on the location of sample survey points also serve as anindexing system. They allow for the extraction of relevant auxiliarydata (for example, distance to the nearest market town, agroclimaticconditions surrounding it, number of schools or health facilities etc.)that were not used in the survey instrument.
Geographical Information Systems (GIS)GIS are database management systems that use geographic location as areference for each database record. They
Use location to integrate information from heterogeneous sources,for example, for each village in a region, the mean annual rainfall orsoil quality information within a 20-kilometre radius.

151
Can generate information to test hypotheses about neighbourhoodrelationships. For example, do neighbouring farmers share similarhousehold characteristics which point to the existence of signifi-cant clusters caused by some other (exogenous?) factors, diffusionprocesses, or spatial spillovers.Provide powerful visualisation tools that facilitate the analysis ofgeographic data and improve communication of analysis results andpolicy recommendations.
Auxiliary data sourcesGIS is used to develop monitoring systems to assess food security andcoordinate drought relief operations for food security and vulnerabilitymapping. Two such initiatives are the USAID’s Famine Early WarningSystem (FEWS) and the Food Insecurity and Vulnerability Informa-tion and Mapping System (FIVIMS) coordinated by FAO. These sys-tems generate comprehensive, spatially-referenced databases on indica-tors that relate to the level of human well-being in the target regions.
GIS is also used for measuring accessibility. Accessibility to marketsand services is partly determined by the quality of public infrastruc-ture. Using high-resolution census data, information on transport net-works, and the location of service centres, an analyst can estimate, forinstance, the proportion of the population that lives within an accept-able distance or travel time from a school or health clinic. This is usefulin determining gaps in service provision and in deciding on the loca-tion of new facilities.
3.3 Specific data issues3.3.1 Collecting panel data: is it worth it?Panel data are collected regularly in developed countries. For example,USA - PSID, Eurostat manages the European Community HouseholdPanel, with more countries embarking on conducting panel surveys (for
DATA REQUIREMENTS FOR POVERTY MEASUREMENT

152
POVERTY MEASUREMENT: Meanings, Methods and Requirements
example, Ireland).The collection of panel data is difficult and expensive, which makes
many developing countries reluctant to embark on such a project. Inaddition, substantial attrition is likely in areas where there is consider-able mobility because of migration. This may bias the estimates frompanel data, making the exercise worthless. Tests on three developingcountry samples (Bolivia, Kenya and South Africa) conducted by a teamof economists from the World Bank, International Food Policy Re-search Institute, University of Pennsylvania, and the Max-Planck Insti-tute for Demographic Research (Alderman et al. 2000) indicate thatalthough (a) univariate comparisons of critical outcome and family back-ground variables differ significantly between attritors and nonattritors,(b) multivariate estimates of behavioural relations of interest may notbe biased due to attrition.
Several researchers decry the unavailability of panel data (Baulch1996b, Appleton 1996), particularly in order to be able to quantify andanalyse chronic poverty. While there are methodologies that could beused in place of panel data, these are usually second best or worse;several issues cannot be analysed without panel data.
An example of a good panel dataset is the ICRISAT panel survey of211 households in six villages in Maharastra and Andra Pradesh, car-ried out over eight years. Another is by IFPRI (Adams and He 1995), athree-year panel of 727 households in rural Pakistan. Several of theLSMS surveys also have a panel component.
The National Urban Employment Survey (NUES) conducted bythe Mexican National Institute of Statistics, Geography, and Informa-tion conducts extensive quarterly surveys and is structured so as togenerate panels that allow tracking a fifth of the sample across fivequarters. An offshoot of this survey is the Micro-Enterprises Survey(MES) which is also a panel created by identifying 11,000 owners of

153
micro-enterprises from the 1990:4 NUES and reinterviewing them in1991:1 (Maloney 1998).
3.3.2 Non-compatible dataMeasures of consumption are often available from surveys whose defi-nition of consumption may vary. Problems of non-compatibility,though serious (Pradhan 2000) are surmountable, using the appropri-ate methodology (Lanjouw and Lanjouw 1997). This vastly increasesthe possibilities for using existing surveys.
3.4 Poverty information/monitoring systemsWhile many countries regularly collect and publish data on incomepoverty as well as other measures of poverty (human poverty, or basicneeds indicators) several countries have now set up a formalised pov-erty monitoring system (UNDP 2000). Uganda, Benin, Thailand andthe Philippines get special mention in the UNDP Poverty Report 2000(UNDP 2000).
3.4.1 Assessing sources for a poverty monitoring systemFeatures of poverty monitoring systems include (a) large, comparableincome and expenditure surveys at periodic intervals (typically 4-6 years)for example, Household Income and Expenditure Surveys carried outby National Statistical Agencies, and the Living Standards Measure-ment Survey (LSMS) of the World Bank (b) lighter surveys with shorterquestionnaires, smaller sample sizes and information on human pov-erty indicators or proxy indicators for income poverty (for example,UNDP Rapid Poverty Monitoring Survey, CGAP’s Poverty Assess-ment Tool and World Bank’s Core Welfare Indicators Questionnaire)and (c) Participatory Poverty Assessments (UNDP 2000).
Table H2 in Appendix H indicates the type of poverty measure-
DATA REQUIREMENTS FOR POVERTY MEASUREMENT

154
POVERTY MEASUREMENT: Meanings, Methods and Requirements
ment and analysis that can be undertaken, given the different types ofdata available. World Bank (2001) revealed that 85 percent of the world’spopulation lives in countries that have at least 2 income and expendi-ture surveys. The implication is quite clear that much can be done byway of poverty measurement and analysis in many countries.
3.4.2 Maintaining international comparabilityStandardization is important for international comparability. Thus, forexample, the objective of a poverty mapping initiative is to producesubnational maps of poverty indicators that display a high degree ofcomparability from one country to another. This is made difficult by(a) variation in data availability and quality (b) synchronicity of datacollection-internationally as well as between surveys and censuses withina country, which reduces the synergy effects that can be gained bycombining the complete coverage of a census with the rich informa-tion of a survey, (c) and comparability of economic statistics. (Synthe-sis report on the international workshop on poverty mapping, Arendal,Norway, October 14-16, 1998).
Several initiatives are under way to coordinate data collection (andto build up statistical capacity as well) internationally. The MilleniumDevelopment Goals and associated targets and indicators are exampleswhere international consensus was reached on the specific indicators tomonitor progress on these goals. The PARIS21 consortium has themandate to coordinate international efforts in statistical capacity build-ing.
3.4.3 Rationalizing data collection nationallyPart of the trick in using a combination of censuses and sample sur-veys, light/rapid monitoring surveys, qualitative approaches and ad-ministrative data in deriving a poverty information system lies in thetiming.

155
The time spacing of currently established sample surveys in order toobtain maximum use of the data is important. This may involve spac-ing out similar surveys conducted by different agencies, or differentsurveys that obtain similar data, conducted by the same agency (forexample, many surveys collect asset data which can be used to con-struct measures of asset poverty. If the surveys are spaced out at regularintervals there will be an almost continuous flow of information onasset poverty).
It is also important to know which surveys to space together. Forexample, in order to use the synergy effects that can be gained by com-bining the complete coverage of a census with the rich information ofa survey.
Rationalising data collection also involves making importantprioritisations and trade-offs. Rather than conducting expensive multi-topic surveys separately, are there possibilities of adding either (a) asmall expenditure module to a DHS type surveys or to ask (b) assetquestions to a household budget survey which usually has informationon ownership? (c) are there possibilities of including topic-specific mod-ules in a regularly conducted survey?
3.4.4 Features of a poverty information strategyAchikbache et al. (2001) outline the important aspects of a “sequenced”poverty information strategy:
A sequenced information strategy is meant as a management toolfor governments and central statistical agencies to provide an enablingframework for meeting the information needs of poverty reductionstrategies and economic development plans. A well-defined and cost-effective strategy ought to be implemented with secured financial andhuman resources, in accordance with a timeframe.
A strategy pursues by definition, a holistic scope - Poverty reduc-tion, population well-being, takes into account all needs of policy-mak-
DATA REQUIREMENTS FOR POVERTY MEASUREMENT

156
POVERTY MEASUREMENT: Meanings, Methods and Requirements
ers, aims to reach a realistic goal by tackling impediments, evaluatingcosts, and involving all partners, and identifies relevant monitorableobjectives through measurable results; An Information Strategy is gearedtowards generating quantitative and qualitative information relevantto monitoring input, output, outcome and impact of pre-determinedobjectives, an information complying with high quality standards andgenerated in a timely fashion.
A Sequenced Information Strategy establishes information needs hi-erarchy, in terms of scope and in terms of content, which would meetall partners’ expectations, identifies indigenous and exogenous fundingcapacities, and plans a series of actions sequenced in time - short-, me-dium- and long-term interventions - and stemmed on existing systems.
Some examples are given in Appendix H.
3.5 SummaryThis chapter provided information on sources of data for poverty mea-surement that are typically collected within a country. Several newinitiatives were described. These relate to “new” features of traditionaldata collection instruments such as surveys, as well as “new” types ofsurveys, “new” uses for administrative data and “new” ways of combin-ing different types of data (for example, qualitative and quantitative,survey and census).
Several important features emerge from this chapter. Firstly, thedemand for data is much greater than before. This is a demand for data(1) more often and for (2) more types of data. It is also a demand for dataat a (3) more disaggregated level (that is, local is preferred to regional,and regional is preferred to national), with a degree of accuracy thatenables it to be used for targeting purposes. The analysis of poverty inits multiple dimensions and the need to establish causality, has led tothe demand for (4) different types of information for the same households

157
or individuals. Finally, analysis of the dynamics of poverty has led tothe demand for (5) longitudinal data.
These different types of demand have had several impacts on the useof data in poverty measurement. The features (1) and (2) of the demandfor data have led to the consideration of using routinely collected ad-ministratively data for poverty measurement purposes, as well as theuse of data collected from qualitative approaches for triangulation, while(3) has led to a greater use of Geographical Information Systems, andcombining of census data with a variety of other data, including surveydata (4) has seen a change in survey content-moving away from single-topic to multi-topic because of analysis methods (for example, multi-variate regression analysis needs a variety of information for same house-holds (or individuals). This change in content is also evident in thequestionnaire design of censuses. Finally (4) has led to the developmentof panel data sets, the most well-known of which is the LSMS.
A country that is seriously considering improving its poverty infor-mation system thus needs to take into account these different types ofdemand-and their implications for data collection. Priorities need to beestablished, and the relative cost-effectiveness of these data collectionmethods established.
DATA REQUIREMENTS FOR POVERTY MEASUREMENT

158
POVERTY MEASUREMENT: Meanings, Methods and Requirements
The review of poverty measurement practices has made clear that pov-erty measurement has made incredible advances in recent times. Theseare both in terms of (1) consolidation and developing best practice,mainly in relation to monetary and quantitative methods, that tookplace in the fifteen years from the mid 1980s to the end of the lastmillennium, and (2) the recent conceptual and methodological advancesthat have taken place in the first few years of the new millennium.
Some important features of these developments are described be-low. (1) It is now clearly recognised that any single indicator of povertywill not adequately describe or measure the complex phenomenon thatis poverty. Multidimensionality of poverty is now firmly accepted, andwe are much closer to measuring it than we were a decade ago. (2) It isalso evident-although arguably-that any single approach to measuringpoverty will not suffice. The contribution of the monetary approachto poverty measurement is well-known, just as its limitations are evi-dent. The capability approach to poverty measurement by focusing onbasic deprivation, has contributed much to the conceptual resurgencein this field, and thus provides a good theoretical and conceptual basisfor improvements in poverty measurement. However, the social exclu-sion approach has a contribution to make by adding the element ofparticipation or inclusion. Participatory approaches provide the localnon-expert based knowledge that is insufficiently emphasized in theother approaches.
(3) We are also much better at measuring the dynamics of povertythan we were several years ago. The availability of panel data has led tomethodological improvement in distinguishing between the transientlyand permanently poor and tracking movements in and out of poverty.(4) This has also had important implications for the measurement ofvulnerability. (5) The measurement of empowerment, or its absence invoicelessness and powerlessness is still at a somewhat rudimentary stage,but with a growing research agenda. (6) Recent empirical work has fo-cused on comparing results using different approaches (quantitative and
4. CONCLUSIONS AND THE WAY FORWARD

159
qualitative, objective and subjective, monetary and non-monetary, etc.).(7) This has been facilitated by the availability of non-traditional in-struments of data collection. Mainly, the household survey design thatis most useful is a multi-topic, panel survey, where questionnaires in-clude both standard objective data collection questions, as well as thetype of questions on subjective well-being that sociologists have beencollecting for years. An example of such a survey is the British House-hold Panel Survey.126
The fundamental elements of the process of poverty measurementhave not changed, however. The problems of identification and aggre-gation with the attendant choices of indicator, unit of analysis, povertyline and poverty measure are still the basic nuts and bolts of povertymeasurement. A country that is looking to improve its poverty mea-surement methodology needs to pay attention these choices, and de-vise ways of making them. To a large extent, the process of improvinga poverty measurement methodology would consist of (1) determiningwhich dimensions and indicators of poverty are appropriate to thatcountry, using a combination of local knowledge and expert knowl-edge, (2) assuming that income or monetary poverty measurement isretained as an important, though not exhaustive dimension of poverty,improving the measurement of income poverty using the well-estab-lished guidelines on which there is a great deal of consensus (3) deter-mining methodologies for the aggregation of indicators into povertymeasures. This may include easily constructed composite indices, eventhough their disadvantages are well-known, as well as more sophisti-cated methods of statistical analysis such as principal component orfactor analysis, latent variable analysis, as well as developments in theuse of Fuzzy Set Theory, etc. (4) Finally, this will include establishingpriorities in the process of data collection that is required for the pur-pose of poverty measurement.
For future generations to “find less poverty no matter how (they)decide to measure it”, poverty measurement and analysis has also to beintegrating into the policy-making process. This may be the greatestchallenge that lies ahead.
126 See Burchardt 2003 for analysis using this survey.
CONCLUSIONS AND THE WAY FORWARD

160
POVERTY MEASUREMENT: Meanings, Methods and Requirements
Achikbache, B., M. Belkindas, M. Dinc, G. Eele and E. Swanson. 2001.“Strengthening Statistical Systems for Poverty Reduction Strategies”.Cited in Jeni Klugman, (ed.) A Sourcebook for Poverty Reduction Strat-egies, Washington, D.C.: World Bank.
Adams, Richard and J. He. 1995. “Sources of income inequality andpoverty in rural Pakistan”. International Food Policy Research Re-port No. 102. Washington, D.C.: IFPRI.
Ahmed, Akhter U. and Howarth E. Bouis. 2001. “Weighing what’spractical: proxy means testing for targeting food subsidies in Egypt”.FCND Discussion Paper No. 132. Washington, D.C.: IFPRI. Avail-able online at www.ifpri.org/divs/fcnd/dp.htm
Alailima, Patricia. 1997. “Poverty and Unemployment in Sri Lanka”.Colombo: Department of National Planning, Ministry of Financeand Planning.
Alderman, Harold, Jere R. Berhman, Hans-Peter Kohler, John A.Maluccio, and Susan Cott Watkins. 2000. “Attrition in Longitudi-nal Household Survey Data: Some tests for three developing-coun-try samples”. FCND Discussion Paper No. 96. Washington, D.C.:IFPRI. Available online at www.ifpri.org/divs/fcnd/dp.htm
Alderman, Harold et al. 2000. “Combining census and survey data toconstruct a poverty map of South Africa”. In Statistics South Af-rica, Measuring poverty in South Africa. Pretoria: Statistics South Af-rica.
Aleem, Irfan. 1990. “Imperfect Information, Screening and the Costsof Informal Lending: A Study of a Rural Credit Market in Paki-stan”. World Bank Economic Review, 4 (3, September): pp. 329-349.
REFERENCES

161
Aliber, M. 2001. “An overview of the incidence and nature of chronicpoverty in South Africa”. CPRC Working Paper no. 3. Manchester:IDPM, University of Manchester.
Amin, S. Ashok Rai, and Giorgio Topa. 1999. “Does Microcredit reachthe poor and vulnerable? Evidence from Bangladesh”. Working Pa-per No. 28. Boston: Centre for International Development, HarvardUniversity.
Anand, Sudhir, and Christopher Harris. 1990. “Food and the Standardof Living: An Analysis based on Sri Lankan Data”. In J. Dreze andA. Sen, (eds.) The Political Economy of Hunger. Oxford: Oxford Uni-versity Press.
Anand, Sudhir, Christopher Harris and Oliver Linton. 1993. “On theconcept of ultra-poverty”. Centre for Population and DevelopmentStudies Working Paper Series. Cambridge, MA: Harvard Univer-sity.
Anand, Sudhir and Amartya Sen. 2000. “Income Component of theHuman Development Index”. Journal of Human Development, 1(1):pp. 83-106.
Appasamy, P. S. Guhan, R. Hema et al. 1996. “Social Exclusion from aWelfare Rights Perspective in India”. International Institute forLabour Studies and UNDP Research Series 106. Geneva: ILO Pub-lications.
Appleton, Simon. 1996. “Problems of Measuring Changes in Povertyover Time”. IDS Bulletin: Poverty, Policy and Aid, Vol 27, No.1.
Appleton, Simon and Lina Song. 1999. “Income and Human Develop-ment at the Household Level: Evidence from Six Countries”. Ox-ford: Center for the Study of African Economies. Processed. Citedin Kanbur and Squire 2001.
Asian Development Bank and Poverty Impact Monitoring Unit. 2000.“Perceptions of the Poor: Poverty Consultations in Four Districtsin Sri Lanka”. Final Report. Colombo.
REFERENCES

162
POVERTY MEASUREMENT: Meanings, Methods and Requirements
Asra, Abuzar and Vivian Santos-Francisco. 2001. “Poverty line: Eightcountries’ experiences and the issue of specificity and consistency”.Paper presented at the Asia-Pacific Forum on Poverty, ADB, Ma-nila, 5-9 February. Available online at www.adb.org/poverty/fo-rum/pdf/Asra.pdf
Atkinson, Anthony B. 1970. “On the Measurement of Inequality”. Jour-nal of Economic Theory, Vol. 2.
Atkinson, Anthony B. 1987. “On the Measurement of Poverty”.Econometrica 55: pp. 749-64.
Atkinson, Anthony B. 1989. Poverty and Social Security . HemelHempstead: Harvester Wheat sheaf.
Atkinson, Anthony B. 1991. “Comparing Poverty Rates Internation-ally: Lessons from Recent Studies in Developed Countries”. WorldBank Economic Review, 5, January: pp. 3-21.
Atkinson, Anthony B. 1993. “The institution of an official povertyline and economic policy”. Welfare State Programme DiscussionPaper No. 98. London: STICERD, London School of Economics.
Atkinson, Anthony B., B. Canutillo, E. Manlier, and B. Nolan. 2002.Social Indicators: The EU and Social Inclusion. Oxford: Oxford Uni-versity Press.
Australia, Commission of Inquiry into Poverty. 1975. Poverty in Aus-tralia, First Main Report, Canberra: Australian Government Print-ing Service.
Barrette, Christopher B. 2003. “The Economics of Poverty and thePoverty of Economics: A Christian Perspective”. Cornell Univer-sity Department of Applied Economics and Management WorkingPaper WP 2003-15. Ithaca, N.Y.: Cornell University.
Bartholomew, D., F. Steele, I. Moustkaki, and J. Galbraith. 2002. TheAnalysis and Interpretation of Multivariate Data for Social Scientists.London: Chapman and Hall.
Baulch, Bob. 1996a. “Editorial: The New Poverty Agenda: A DisputedConsensus”. IDS Bulletin: Poverty, Policy and Aid, Vol 27, No.1.

163
Baulch, Bob. 1996b. “Neglected Trade-Offs in Poverty Measurement”.IDS Bulletin: Poverty, Policy and Aid, Vol 27, No.1.
Baulch, Bob and N. McCulloch. 1998. “Being Poor and Becoming Poor:Poverty Status and Poverty Transitions in Rural Pakistan”. Insti-tute of Development Studies, Working Paper No. 79.
Bedoui, M. and R. Gouia. 1995. “Patterns and processes of social exclu-sion in Tunisia”. In G. Rodgers, C. Gore and J. Figueiredo, (eds.)Social exclusion: Rhetoric, Reality and Responses”. Geneva: Interna-tional Institute for Labour Studies.
Berghman, J. 1995. “Social exclusion in Europe: Policy context andanalytical framework”. In G. Room (ed.) Beyond the Threshold: TheMeasurement and Analysis of Social Exclusion. Bristol: The PolicyPress.
Bhalla, S. and P. Glewwe. 1986. “Growth and equity in developingcountries: a reinterpretation of the Sri Lankan experience”. WorldBank Economic Review, 1: pp. 35-63.
Bhalla, A.S. and F. Lapeyre. 1997. “Social Exclusion: Toward an Ana-lytical and Operational Framework”. Development and Change, July,: pp. 413-433.
Bhalla, A.S. and F. Lapeyre. 1999. Poverty and Exclusion in a GlobalWorld. Macmillan Press Ltd.
Bhalla, S. 2002. Imagine there’s no country: poverty, inequality and growthin the era of globalisation. Washington, D.C. : Institute for Interna-tional Economics.
Bigman, D., S. Dercon, D. Guillaume and M. Lambotte. (forthcom-ing). “Community Targeting for Poverty Reduction in BurkinaFaso”. In D. Bigman and H. Fofack, (eds.) Geographical Targetingfor Poverty Alleviation: Methodology and Applications.
Böhnke, Petra. 2001.“Reporting on Social Exclusion: Standard of Liv-ing and Social Participation in Hungary, Spain and Germany”. Dis-cussion Paper FS III 01-407, Berlin: Social Science Research Centre.
Bollen, K., J. Glanville, and G. Stecklov. 2002. “Economic status prox-ies in studies of fertility in developing countries: Does the measurematter?”. Population Studies, Vol 56: pp. 81-96.
REFERENCES

164
POVERTY MEASUREMENT: Meanings, Methods and Requirements
Boltvinik, Julio. 1997. “Poverty Measurement Methods-An Overview”.UNDP Technical Support Document. Available online at http://w w w . u n d p . o r g / p o v e r t y / p u b l i c a t i o n s / p o v _ r e d /poverty_measurementmethods.pdf.
Boltvinik, Julio. 1994. “Poverty Measurement and Alternative Indica-tors of Development”. In Rolph van der Hoeven and Richard Anker,(eds.) Poverty Monitoring: An International Concern . London:Macmillan.
Booth, C. 1887. “The inhabitants of Tower Hamlets (School BoardDivision), their condition and occupations”. Journal of the Royal Sta-tistical Society 50: pp. 326-340. Cited in Ruggeri-Laderchi et al. 2003.
Bossert, W., C. D’Ambrosio and V. Peragine. 2003. “Deprivation andSocial Exclusion”. Department of Economics Working Paper.Montreal: University of Montreal.
Bourguignon, François and Satya Chakravarty. 2002. “The Measure-ment of Multidimensional Poverty”. Journal of Economic Inequality.
Bradbury, Bruce, Steven Jenkins, and John Micklewright. 2000. “ChildPoverty Dynamics in Seven Nations”. SPRC Discussion Paper No.108.
Bradley, Steve, Rob Crouchley, and Reza Oskrochi. 2003. “Social ex-clusion and labour market transitions: a multi-state multi-spell analy-sis using the BHPS”. Labour Economics 10: pp. 659-679.
Bradshaw, J. 1993. Household Budgets and Living Standards. JosephRowntree Foundation.
Bradshaw, J., J. Williams, R. Levitas, C. Pantazis, D. Patsios, P.Townsend, D. Gordon and S. Middleton. 2000. “The Relationshipbetween Poverty and Social Exclusion in Britain”. Paper preparedfor the 26th General Conference of the International Association forResearch in Income and Wealth, Cracow, Poland, 27th August to2nd September.
Brandolini, A. and G. d’Alessio. 2001. “Measuring poverty in thefunctioning space”. Paper presented at the conference on “Justiceand Poverty: Examining Sen’s Capability Approach” St. Edmund’sCollege, Cambridge. Cited in Qizilbash 2003.

165
Buhmann, Brigitte, Lee Rainwater, Guenther Schmaus, and TimothyM. Smeeding. 1988. “Equivalence Scales, Well-being, Inequality, andPoverty: Sensitivity Estimates across Ten Countries Using theLuxembourg Income Study (LIS) Database”. Review of Income andWealth, Series 34, No 1, March.
Burchardt, Tania. 2003. “Identifying adaptive preferences using paneldata: subjective and objective income trajectories”. Paper preparedfor 3rd conference on the Capability Approach, Pavia, Italy, 7-9 Sep-tember., London: Centre for Analysis of Social Exclusion, LondonSchool of Economics.
Callan, Tim and Brian Nolan. 1998. “Ireland”. In John Dixon, andDavid Macarov, (eds.) Poverty: A Persistent Global Reality. London:Routledge.
Camara, G., A.M. Monteiro, F.R. Ramos, A. Sposati, and D. Koga.2003. “Mapping Social Exclusion/Inclusion in Developing Coun-tries: Social Dynamics of Sao Paulo in the 1990s”. Sao Paulo: SocialStudies Research Centre, Catholic University of Sao Paulo.
Case, Anne and Angus Deaton. 2002. “Consumption, health, genderand poverty”. Draft paper, Research Programme in DevelopmentStudies. NJ: Princeton University.
Central Bank of Sri Lanka. Various years, Report on Consumer Financesand Socioeconomic Survey. Colombo: Central Bank.
Centre for Poverty Analysis (CEPA). 2003. Proceedings of the firstpreparatory workshop for the regional conference on PovertyMonitoring in Asia, Kandy, February 25th - 27th.
Cerioli, A., and S. Zani. 1990. “A Fuzzy Approach to the Measure-ment of Poverty”. In C. Dagum and M. Zenga, (eds.) Income andWealth Distribution, Inequality and Poverty, Studies in Contempo-rary Economics. Berlin: Springer Verlag.
Chakravarty, Satya, and Conchita D’Ambrosio. 2003. “The Measure-ment of Social Exclusion”. Paper presented at the WIDER confer-ence on Inequality, Poverty and Human Well-being, Helsinki, 30th -31st May.
REFERENCES

166
POVERTY MEASUREMENT: Meanings, Methods and Requirements
Chambers, Robert 1994. “The origins and practice of PRA”. WorldDevelopment 22, no. 7.
Chambers, Robert. 1995. “Poverty and Livelihoods: Whose RealityCounts?”. Environment and Urbanization 7 (April): pp. 173-204.
Chen, Shao-hua, Gaurav Datt and Martin Ravallion. 1995. “Is PovertyIncreasing in the Developing World?” Policy Research Department,the World Bank, Data Appendix, updated version, 40: pp. 359-76.
Chen, Shao-hua and Martin Ravallion. 2000.“How did the world’s poor-est fare in the 1990s?” Policy Research Working Paper No. 2409.Washington, D.C.: World Bank. Available online athttp://econ.worldbank.org
Chen, Shao-hua and Martin Ravallion. 2001. “How did the world’spoorest fare in the 1990s?” Review of Income and Wealth, 47:pp. 283-300.
Cheli, B. and A. Lemmi. 1995. “A “totally” fuzzy and relative approachto the measurement of poverty”. Economic Notes 24(1): pp. 115-134.
Chiappero Martinetti, E. , 1994. “A new approach to the evaluation ofwellbeing and poverty by fuzzy set theory” Giornale DegliEconomistie Annali di Economia 53: pp. 367-388. Cited in Qizilbash2003.
Chiappero Martinetti, E. 2000. “A multidimensional assessment ofwell-being based on Sen’s functioning approach”, Societa Italiana diEconomia Publica Working Paper. Rivista Internazionale di ScienzeSociali, No.2. Cited in Fusco 2003.
Christiaensen, Luc, John Hoddinot and Gilles Bergeron. 2000. “Com-paring Village Characteristics derived from Rapid Appraisals andHousehold Surveys: A Tale from Northern Mali”. IFPRI DiscussionPaper No. 91. Washington, D.C.: IFPRI.
Citro, C.F. and R.T. Michael (eds.). 1995. Measuring Poverty, A NewApproach, Washington, D.C.: National Academy Press.
Clert, C. 1999. “Evaluating the Concept of Social Exclusion in theDevelopment Discourse”. European Journal of Development Research,11, no. 2: pp. 176-199.

167
Comim, Flavio. 2003. “Capability Dynamics: the importance of timeto capability assessments”. Paper prepared for 3rd conference on theCapability Approach, Pavia, Italy, 7-9 September.
Cookson, Richard. 2003. “QALYs and the capability approach”. Paperprepared for 3rd conference on the Capability Approach, Pavia, Italy,7-9 September.
COPLAMAR. 1983. Macroeconomia de las Necesidades Esenciales enMexico, Siglo XXI Editores, Mexico.
Coudouel, A., J. Hentschel and Q. Wodon. 2001. “Poverty Measure-ment”. In Jeni Klugman, (ed.) A Sourcebook for Poverty ReductionStrategies. Washington, D.C.: World Bank. Available online at http://www.worldbank.org/poverty/strategies/chapters/data/data.htm
Cox, David. 1998. “Australia” in Dixon, John and David Macarov, (eds.)Poverty: A Persistent Global Reality. London: Routledge.
D’Agata, Antonio. 2003. “Endogenizing Sen’s Capabilities: An Adap-tive Dynamic Analysis”. Paper prepared for 3rd conference on theCapability Approach, Pavia, Italy, 7-9 September.
DANE (National Administrative Department of Statistics), UNDP and-UNICEF. 1989. La Pobreza en Colombia, Bogòta.
Danziger, S., J. van der Gaag, M. K. Taussig, and E. Smolensky. 1984.“The Direct Measurement of Welfare Levels: How Much Does itCost to make Ends Meet?”. Review of Economics and Statistics 66(3):pp. 500-5.
Davis, Benjamin, and Raffaella Siano. 2001. “Issues and concepts forthe Norway-funded project “Improving Methods for Poverty andFood Insecurity Mapping and Its Use at Country Level” ”, Rome:Food and Agricultural Organisation.
Datt, Gaurav, and Dileni Gunewardena. 1997. “Some Aspects of Pov-erty in Sri Lanka”. Policy Research Working Paper No. 1790, Wash-ington, D.C.: World Bank.
REFERENCES

168
POVERTY MEASUREMENT: Meanings, Methods and Requirements
Deaton, Angus. 1997. The Analysis of Household Surveys. Baltimore: JohnsHopkins University Press.
Deaton, Angus. 2001a. “Counting the World’s Poor”. World Bank Re-search Observer, 16(2, Fall): pp. 125-147.
Deaton, Angus. 2001b. “Survey Design and Poverty Monitoring in In-dia”. Research Program in Development Studies, Princeton Univer-sity, Processed.
Deaton, Angus. 1981. “Three Essays on a Sri Lankan Household Sur-vey”. Living Standards Measurement Study Paper No. 11. Washing-ton, D.C.: World Bank.
Deaton, Angus and Salman Zaidi. 1999. Guidelines for constructing con-sumption aggregates for welfare analysis. Washington, D.C.: WorldBank.
Deleeck, H., K. van den Bosch, and L. Lathouwer (eds.). 1992. Povertyand the Adequacy of Social Security in the EC: A Comparative Analy-sis. Aldershot: Avebury.
Deichmann, Uwe. 1999. “Geographic Aspects of inequality and pov-erty”. Text for the World Bank’s Web Site on Inequality, Poverty,and Socio-Economic Performance: http://www.worldbank.org/poverty/inequal/index.htm
Deininger, Klaus and Lyn Squire. 1996. “A New Data Set MeasuringIncome Inequality”. World Bank Economic Review, Vol 10, (Sep-tember): pp. 565-591.
Deolalikar, Anil, Alex Brilliantes, Raghav Gaiha, Ernesto Pernia andMary Racelis. 2002. “Poverty Reduction and the Role of Institu-tions in Developing Asia”. ERD Working Paper Series No. 10. Ma-nila: Asian Development Bank.
Dercon, S. 1999. “Who benefits from good weather and reforms? Astudy of Ethiopian villages”. Paper presented at the conference onPoverty in Africa: A dialogue on causes and solutions, Oxford: Centrefor the Study of African Economies.

169
Dirven, Henk-Jan, Didier Fouarge and Ruud Muffels. 1998. “Nether-lands” in John Dixon and David Macarov, (eds.) Poverty: A Persis-tent Global Reality. London: Routledge.
DiTomaso, Maria Laura. 2003. “How to measure child wellbeing usinga capability approach? An application to Indian data through aMultiple Indicators Multiple Causes model”. Paper prepared for 3rd
conference on the Capability Approach, Pavia, Italy, 7-9 Septem-ber.
Dixon, John and David Macarov (eds.). 1998. Poverty: A Persistent Glo-bal Reality. London: Routledge.
Douthitt, R.A. 1994. “Time to do the chores? Factoring home produc-tion needs into the measures of poverty”. Discussion paper No. 1030-94. Madison, WI: University of Wisconsin, Institute for Researchon Poverty.
Dreze, Jean and P. Srinivasan. 1995. “Widowhood and Poverty in Ru-ral India: Some inferences from Household Survey Data”. London:London School of Economics.
Duclos, Yves, David Sahn and Steven D. Younger. 2003. “RobustMultidimensional Poverty Comparisons”, Centre interuniversitairesur le risque, les politiques économiques et l’emploi (CIRPÉE),Working Paper 03-04, January.
Duncan, G.J., B. Gustafsson, R. Hauser, G. Schmauss, H. Messinger,B. Nolan and J.C. Ray. 1993. “Poverty Dynamics in Eight Coun-tries”. Journal of Population Economics 6(3): 235-59.
Edirisinghe, Neville. 1987. “Poverty in Sri Lanka: Its Extent, Distribu-tion and Characteristics of the Poor”. Paper submitted to the WorldBank for the Sri Lanka Poverty Alleviation and Employment Project.Washington, D.C.: World Bank.
Erickson, Robert. 1993. “Descriptions of Inequality: The Swedish Ap-proach to Welfare”. In Martha Nussbaum and Amartya Sen, TheQuality of Life. Oxford: Clarendon Press.
REFERENCES

170
POVERTY MEASUREMENT: Meanings, Methods and Requirements
European Union, Social Protection Committee. 2001. Report on Indi-cators in the field of poverty and social exclusion. Available online athttp://europa.eu.int/comm/employment_social/news/2002/jan/report_ind_en.pdf
European Union, Statistical Programme Committee. 1998. Recommen-dations on Social Exclusion and Poverty Statistics. Available online athttp://www1.ibge.gov.br/poverty/pdf/eurostat1.pdf
Falkingham, Jane and Ceema Namazie. 2002. Measuring health and pov-erty: a review of approaches to identifying the poor. London: DFIDHealth Systems Resource Centre.
FAO and WHO. 1973. “Energy and Protein Requirements”. Report ofa Joint FAO/WHO Ad Hoc Expert Committee, WHO TechnicalReport Series No. 522, Geneva: WHO.
Farina, Francesco, Eugenio Peluso and Ernesto Savaglio. 2003. “Rank-ing opportunity sets in the space of functionings”, Paper preparedfor 3rd conference on the Capability Approach, Pavia, Italy, 7-9 Sep-tember, 2003.
Feres, Patricio, Herwig Immervoll, Christine Lietz, Horacio Levy,Daniela Mantovani and Holly Sutherland. 2003. “Indicators for So-cial Inclusion in the European Union: How responsive are they tomacro-level changes?” Paper presented at the WIDER conferenceon Inequality, Poverty and Human Well-being, Helsinki, 30-31 May.
Figueroa, A., T. Altamirano, and D. Sulmont. 1996. “Social Exclusionand inequality in Peru”. International Institute for Labour Studiesand UNDP Research Series 104. Geneva: ILO Publications.
Filmer, Deon and Lant Pritchett. 1998. “Estimating wealth effects with-out income or expenditure data-or tears: Educational enrolment inIndia”. Policy Research Working Paper No. 1994. Washington, D.C.:World Bank. (Also published in Demography 2001, 38:1).
Filmer, Deon and Lant Pritchett. 1999. “The Effect of HouseholdWealth on Educational Attainment: Evidence from 35 Countries”.Population and Development Review 25(1, March): pp. 85-120.

171
Fisher, Gordon. 1999. “An overview of developments since 1995 relat-ing to a possible new U.S. poverty measure”. Poverty MeasurementWorking Papers, U.S. Census Bureau, May.
Foster, James E. and M. Szekely. 2000. “How good is growth?” AsianDevelopment Review, 18, 2: pp. 59-73.
Foster, James E. and Amartya Sen. 1997. “On Economic Inequality af-ter a Quarter Century”. Annexe in On Economic Inequality, expandededition. Oxford: Oxford University Press.
Foster, James E., Joel Greer and Erik Thorbecke. 1984. “A Class ofDecomposable Poverty Measures”. Econometrica 52:pp. 761-776.
Fusco, Alessio. 2003. “On the definition and measurement of poverty:the contribution of multidimensional analysis”, Paper prepared for3rd conference on the Capability Approach, Pavia, Italy, 7-9 Sep-tember, 2003.
Gaiha, Raghav. 1989. “On estimates of rural poverty in India: anassessment”. Asian Survey, 29, 7:pp. 687-697.
Gaiha, Raghav and Anil Deolalikar. 1993. “Persistent, expected andinnate poverty: estimates from semi-arid rural South India”. Cam-bridge Journal of Economics 17(4):pp. 409-421.
Glewwe, Paul and Jacques van der Gaag. 1990. “Identifying the Poor inDeveloping Countries: Do Different Definitions Matter?” WorldDevelopment 18:pp. 803-14.
Glinskaya, Elena. 2003. “An Empirical Evaluation of Samurdhi Pro-gram”. Background Paper for Sri Lanka Poverty Assessment Re-port No. 22-535-CE. Washington, D.C. World Bank.
Gerdes, Karen E. and Kyle Lynn Pehrson. 1998. “Philippines”in JohnDixon and David Macarov (eds.) Poverty: A Persistent Global Real-ity. London, Routledge.
Goedhart, T., V. Haberstadt, A. Kapteyn and B. van Praag. 1977. “ThePoverty Line: Concept and Measurement”. Journal of Human Re-sources 12:pp. 503-20.
Gordon, D, et al. 2000. Poverty and Social Exclusion in Britain. JosephRowntree Foundation.
REFERENCES

172
POVERTY MEASUREMENT: Meanings, Methods and Requirements
Gordon, D. 2002. “Measuring poverty and social exclusion in Britain”.Paper presented at the conference on “The Dynamics of Poverty”,Budapest, 24-25 May.
Grosh, Margaret and J. Munoz. 1996. “A manual for planning andimplementing the Living Standards Measurement Survey”. LSMSWorking Paper No. 126. Washington, D.C.: World Bank.
Grosh, Margaret and Paul Glewwe. 2000. Designing Household SurveyQuestionnaires for Developing Countries: Lessons from 15 Years of theLiving Standards Measurement Study. Washington, D.C.: World Bank.
Gsaenger, Hans. 2003. “Introduction to poverty and poverty monitor-ing”. Presentation at the First Preparatory Workshop for the Re-gional Conference on Poverty Monitoring in Asia, Kandy, Sri Lanka,February 25th-27th.
Gunewardena, Dileni. 2000. Consumption Poverty in Sri Lanka, 1985-1996. Paper written for the Policy Framework for Poverty Allevia-tion in Sri Lanka, Colombo.
Gunewardena, Dileni. 2003. “Child Malnutrition in Sri Lanka”. Draftbackground paper for project on monitoring Millenium Develop-ment Goals (MDGs) in Sri Lanka. July.
Gunewardena, Dileni. 2004a. “Quantitative and Qualitative Approachesto Measuring Poverty: Issues and Challenges in the context of SriLanka”. Paper submitted to the “Regional Conference on PovertyMonitoring in Asia”, Manila, March.
Gunewardena, Dileni. 2004b. Improving Poverty Measurement in SriLanka. Colombo: Centre for Poverty Analysis.
Haddad, Lawrence, and Ravi Kanbur. 1990. “How Serious is the Ne-glect of Intrahousehold inequality?” Policy Research Working PaperNo.296. Washington, D.C.: World Bank.
Haddad, Lawrence, Harold Alderman, Simon Appleton, Lina Song andYisehac Yohannes. 2003. “Reducing Child Malnutrition: How FarDoes Income Growth Take Us?” World Bank Economic Review, 17,1: pp. 107-131.

173
Hagenaars, A. and K. de Vos. 1988. “The Definition and Measurementof Poverty”. The Journal of Human Resources 22(2): pp. 211-21.
Hagenaars, A., K. de Vos and M. Zaidi. 1994. Poverty Statistics in theLate 1980s: Research based on Micro-Data. Luxembourg: Office forOfficial Publications of the European Communities.
Harriss-White, Barbara. 2003. “Destitution in India”, Paper presentedat the WIDER conference on Inequality, Poverty and Human Well-being, Helsinki, 30-31 May.
Haveman, Robert. 2003. “Social Exclusion: Is it a Useful Concept forAnalysing Social Problems or Making Social Policy”, Powerpointpresentation, University of Wisconsin-Madison, available online athttp://www.queensu.ca/sps/forum/qiisp/qiisp-2003/docs2003/roberthaveman.ppt
Hawthorn, Geoffrey (ed.). 1987. The Standard of Living. Cambridge:Cambridge University Press.
Hazell, Peter, Carlos Pomareda and Alberto Valdes (eds.). 1986. CropInsurance for Agricultural Development: Issues and Experience. Balti-more, MD: Johns Hopkins University Press.
Henninger, N. 1998. Mapping and geographic analysis of poverty and hu-man welfare-Review and assessment. Report prepared for the UNEP/CGIAR Initiative on GIS, World Resources Institute, Washington,D.C. Available online at http://www.grida.no/prog/global/pov-erty/index.htm
Henry, C., M. Sharma, C. Lapenu and M. Zeller. 2000. Assessing therelative poverty of microfinance clients: A CGAP operation tool. Wash-ington, D.C.: Consultative Group to Assist the Poorest (CGAP).Available online at http://www.cgap.org/publications/other
Hentschel, J, and P. Lanjouw. 1996. “Constructing an Indicator ofConsumption for the Analysis of Poverty: Principles and Illustra-tions with reference to Ecuador”. LSMS Working Paper No. 124,Policy Research Department. Washington, D.C.: World Bank.
REFERENCES

174
POVERTY MEASUREMENT: Meanings, Methods and Requirements
Hentschel, J., J. Olsen Lanjouw, P. Lanjouw and J. Poggi. 2000. “Com-bining Census and Survey Data to trace the spatial dimensions ofpoverty: a case study of Ecuador”. World Bank Economic Review,Vol. 14, No. 1: pp. 147-65.
Hewett, Paul, and Mark Montgomery. 2001 “Poverty and Public Ser-vices in Developing-Country Cities”. Policy Research Working PaperNo. 154. New York: Population Council.
Hulme, D., K. Moore, and A. Shepherd. 2001. “Chronic poverty: mean-ings and analytical frameworks”. CPRC Working Paper 2. Manches-ter: IDPM, University of Manchester.
Hulme, D. and A. Shepherd. 2003. “Conceptualising Chronic Poverty”.World Development, 31, 3:pp. 403-423.
Jacoby, Hanan, G. and Emmanuel Skoufias. 1997. “Risk, Financial Mar-kets and Human Capital in a Developing Country”. Review of Eco-nomic Studies, 64:pp. 311-335.
Jalan, Jyotsna and Martin Ravallion. 1998. “Transient Poverty inPostreform Rural China”. Journal of Comparative Economics 26(June): pp. 338-57.
Jalan, Jyotsna and Martin Ravallion. 1999. “Are the Poor Less Well-Insured? Evidence on Vulnerability to Income Risk in Rural China”.Journal of Development Economics 58 (February): pp. 61-81.
Jayaraman, Ranee, and Peter Lanjouw. 1998. “The evolution of pov-erty and inequality in Indian villages”. World Bank Policy ResearchWorking Paper no 1870. Washington, D.C.: World Bank.
Kabeer, Naila. 1989. “Monitoring Poverty as if Gender Mattered: AMethodology for Rural Bangladesh”. IDS Discussion Paper 255.Sussex: Institute of Development Studies, University of Sussex. Feb-ruary.
Kabeer, Naila. 1994. Reversed Realities: Gender Hierarchies in Develop-ment Thought. London and New York: Verso.

175
Kanbur, Ravi. 2001a. Summary of proceedings of conference on“Qualitative and Quantitative Poverty Appraisal: omplementarities,Tensions and the Way Forward”. Ithaca, NY: Cornell University,March. Available online at http://www.people.cornell.edu/pages/sk145
Kanbur, Ravi. 2001b. “Economic Policy, Distribution and Poverty: TheNature of the Disagreements”. Ithaca, N.Y.: Cornell University.Available online at http://www.people.cornell.edu/pages/sk145
Kanbur, Ravi and Lyn Squire. 2001. “The Evolution of thinking aboutPoverty”. In Gerald Meier and Joseph Stiglitz (eds.) Frontiers ofDevelopment Economics. New York: Oxford University Press.
Kanbur, Ravi. 2002. “Conceptual Challenges in Poverty and Inequal-ity: One Development Economist’s Perspective”. Working Paper2002-9, Department of Applied Economics and Management, CornellUniversity. Paper presented at the Cornell Conference on Concep-tual Challenges in Poverty and Inequality, April 16-17. Availableonline at http://www.arts.cornell.edu/poverty/kanbur/ConceptualChallenges.pdf)
Kanbur, Ravi and D. Mukherjee. 2003. “Premature mortality and pov-erty measurement”. Working Papers of the Institute for Social andEconomic Research, paper 2003-6. Colchester: University of Essex.Available online at http://www.iser.essex.ac.uk/pubs/workpaps/
Kaseke, Edwin. 1998. “Zimbabwe”in John Dixon and David Macarov(eds.) Poverty: A Persistent Global Reality. London: Routledge.
Klasen, Stephan. 1997. “Poverty, inequality and deprivation in SouthAfrica: an analysis of the 1993 SALDRU survey”. Social IndicatorsResearch 41: pp. 51-94.
Klasen, Stephan. 1998. Social Exclusion and Children in OECD Coun-tries: Some Conceptual Issues. Paris: OECD.
REFERENCES

176
POVERTY MEASUREMENT: Meanings, Methods and Requirements
Klasen, Stephan. 1999. “Social Exclusion, Children and Education:Conceptual and Measurement Issues”. Department of Economics,University of Munich. Background paper for the OECD.
Klasen, Stephan. 2000. “Measuring poverty and deprivation in SouthAfrica”. Review of Income and Wealth 46(1):pp. 33-58.
Klugman, Jeni (ed). 2001. A Sourcebook for Poverty Reduction Strategies.Washington, D.C: World Bank.
Kohl, Jurgen. 1996. “The European Community”. In Oyen, Else, S.M.Miller, and Syed Abdus Samad (eds.) Poverty: A Global Review. Oslo:Scandinavian University Press.
Korale, R.B.M. (ed.). 1987. Income Distribution and Poverty in Sri Lanka.Colombo: Department of Census and Statistics. Unpublished.
Lakshman, W.D. 1997. “Income Distribution and Poverty”. In W.D.Lakshman (ed.) Dilemmas of Development. Colombo: Sri LankaAssociation of Economists.
Lambert, Peter J. 1993. The Distribution and Redistribution of Income:A Mathematical Analysis. Manchester: Manchester University Press.
Lanjouw, Peter and Martin Ravallion. 1995. Poverty and HouseholdSize”. Economic Journal 105 (November): pp. 1415-34.
Leclerc, G., A. Nelson, and E. Knapp. 2000. “The use of unit-levelcensus data for research on poverty: a multiscale approach” CIATHillsides Project Report, http://www.ciat.cgiar.org/andyweb/scale/documents.htm
Lipton, Michael. 1983. “Poverty, Undernutrition and Hunger”. WorldBank Staff Working Papers No. 597, Washington, D.C.: World Bank.
Lok-Dessallien, Renata. 1996. “Review of Poverty Concepts andIndicators”. UNDP Technical Support Document. Available onlineat http://www.undp.org/poverty/publications/pov_red/review_of_poverty_concepts.pdf
Lok-Dessallien, Renata. 1996. “The Data: where to find them”. UNDPTechnical Support Document. Available online at http://www.undp.org/poverty/publications/ pov_red/The_Data.pdf

177
Mack, J, and S. Lansley. 1985. Poor Britain, London: George Allen andUnwin.
MacPherson, Stewart and Richard Silburn. 1998. “The Meaning andMeasurement of Poverty”. In John Dixon and David Macarov (eds.)Poverty: A persistent global reality, London: Routledge.
MacPherson, Stewart. 1998. “Hong Kong” in John Dixon and DavidMacarov (eds.) Poverty: A persistent global reality, London: Routledge.
Malapit, Hazel, Tina Clemente and Cristina Yunzal. 2003. “Does Vio-lent Poverty Make Chronic Poverty More Likely? The MindanaoExperience”. Paper presented at Conference on “Staying Poor:Chronic Poverty and Development Policy” Manchester, April.
Maloney, William. 1998. “Are LDC Labour Markets Dualistic?”. Mimeo.Washington, D.C.: World Bank. Available online at http://econ.worldbank.org
Marga Institute. 1981. An analytical description of poverty in Sri Lanka.Colombo: Marga Institute.
Mathai, Manu V. 2003. “Case Studies: Observations on OperationalizingSen’s Capability Approach”. Paper prepared for 3rd conference onthe Capability Approach, Pavia, Italy, 7-9 September.
McCullock, N. and Bob Baulch. 1999. “Distinguishing the Chronicallyfrom the Transiently Poor: Evidence from Rural Pakistan”. Insti-tute for Development Studies, Working Paper 97.
McGee, Rosemary. 2000. “Analysis of Participatory Poverty Assess-ment and Household Survey Findings on Poverty Trends inUganda”. Mission Report, IDS.
McKay, A. and D. Lawson. 2003. “Assessing the Nature and Extent ofChronic Poverty in Low-Income Countries: Issues and Evidence”.World Development, 31 (3):pp. 425-439.
McKinley, Terry. 1997. “Beyond the poverty line: Implementingcomplementary methods of poverty measurement”. UNDP Tech-nical Support Document. Available online at http://www.undp.org/poverty/publications/tsd/tsd3/tsd3.pdf
REFERENCES
178
POVERTY MEASUREMENT: Meanings, Methods and Requirements
McMurrin, S.M. (ed.). 1980. Tanner Lectures on Human Values. Cam-bridge: Cambridge University Press.
Mearns, R. and S. Sinha. 1999. “Social Exclusion and Land Administra-tion in Orissa, India”. Policy Research Working Paper No. 2124.Washington, D.C.: World Bank.
Miceli, David. 1998. “Measuring Poverty Using Fuzzy Sets”. NationalCentre for Social and Economic Modelling, Faculty of Management,University of Canberra, Discussion Paper no. 38, December.
Micklewright, J. and K. Stewart. 2001. “Child well-being in the EUand enlargement to the East”. In K. Vleminckx and T. Smeeding(eds.) Child Well-being, Child Poverty and Child Policy in ModernNations. Bristol: The Policy Press, pp.129-50.
Micklewright, J. 2002. “Social Exclusion and Children: A EuropeanView for a U.S. Debate”. Innocenti Working Paper No. 90. Flo-rence: UNICEF Innocenti Research Centre.
Midgley, James and Michelle Livermore. 1998. “United States ofAmerica”. In John Dixon and David Macarov (eds.) Poverty: A Per-sistent Global Reality. London: Routledge.
Milbank, Dana. 1995. “Old flaws undermine new poverty-level data”Wall Street Journal. October 5.
Ministry of Plan Implementation. 1997. “Baseline for the SamurdhiProgramme in Sri Lanka”. Colombo.
Ministry of Plan Implementation. 1997. “Poverty among Female HeadedHouseholds in Sri Lanka”. Colombo.
Minot, N. 1998. “Generating Disaggregated Poverty Maps: An Appli-cation to Vietnam”. MSSD Discussion Paper No. 25. Washington,D.C.: IFPRI. Montgomery, M., M. Gragnolati, K. Burke and E.Parades. 2000. “Measuring Living Standards with proxy variables”.Demography, 37(2): pp. 155-74.

179
Morduch, Jonathan. 1990. “Risk, Production, and Saving: Theory andEvidence from Indian Households”. Dept of Economics WorkingPaper. Cambridge, MA: Harvard University.
Moser, C. 1998. “The asset vulnerability framework: reassessing urbanpoverty reduction strategies”. World Development, Vol. 26, No.1:pp. 1-19.
Moser, C. and Holland, J. 1997. Household Responses to Poverty andVulnerability, Volume 4: Confronting Crisis in Chawana, Lusaka, Zam-bia. Washington, D.C.: World Bank.
Muellbauer, John. 1987. “Professor Sen on the Standard of Living”. InG. Hawthorn (ed.) The Standard of Living. Cambridge: CambridgeUniversity Press.
Muller, C. 1997. “Transient, seasonal and chronic poverty of peasants:evidence from Rwanda”. Working paper no. 97-8. Oxxford: Centrefor the study of African Economies, University of Oxford.
Nanayakkara, A.G.W. 1994. “An analysis of poverty in Sri Lanka”. SriLanka Journal of Social Sciences” Vol. 17, (1 and 2): pp. 49-78.
Narayan, Deepa, Robert Chambers, Meera K. Shah, and Patti Petesch.2000. Voices of the Poor: Crying Out for Change. New York: OxfordUniversity Press.
Narayan, Deepa, Raj Patel, Kai Schafft, Anne Rademacher, and SarahKoch-Schulte. 2000. Voices of the Poor: Can Anyone Hear Us? NewYork: Oxford University Press.
Narayan, Deepa and David Nyamwaya. 1996. “Learning from the Poor:A Participatory Poverty Assessment in Kenya.” Environment De-partment Paper 34, Washington, D.C: World Bank.
Navajas, S., M. Schreiner, R. Meyer, C. Gonzalez-Vega andJ. Rodriguez-Meza. 2000. “Microcredit and the poorest of the poor:Theory and evidence from Bolivia”. World Development, Vol. 20,No. 2: pp. 333-46.
REFERENCES

180
POVERTY MEASUREMENT: Meanings, Methods and Requirements
Nolan, Brian and Christopher Whelan. 1996. Resources, Deprivationand Poverty. Oxford: Clarendon Press.
Neef, Rainer. 2002. “Aspects of the informal economy in a transform-ing country: the case of Romania”. International Journal of Urbanand Regional Research 26(2): pp. 299-322.
Noll, Heinz-Herbert. 2001. “A European System of Social Indicators”.Available online at www.gesis.org/en/social_monitoring/social_indicators/EU_Reporting/transsieu.html
Olson Lanjouw. Jean. 1997. “De-mystifying poverty lines”. UNDPTechnical support document. Available online at http://w w w . u n d p . o r g / p o v e r t y / p u b l i c a t i o n s / p o v _ r e d /demystifying_poverty_lines.pdf
Olson Lanjouw, Jean and Peter Lanjouw. 1997. “Poverty Compari-sons with Noncompatible Data”. Policy Research Working Paper No.1709. Washington, D.C.: World Bank.
Oyen, Else, S.M. Miller, and Syed Abdus Samad (eds.). 1996. Poverty: AGlobal Review. Oslo: Scandinavian University Press.
Perez-Mayo, Jesus. 2003. “On Measuring Deprivation in Spain: com-paring some techniques”. Paper prepared for 3rd conference on theCapability Approach, Pavia, Italy, 7-9 September.
Piachaud, D. 1981. “Peter Townsend and the Holy Grail”. New Society,57: pp. 419-421.
Poggi, Ambra. 2003. “Measuring social exclusion using the capabilityapproach”. Paper prepared for 3rd conference on the CapabilityApproach, Pavia, Italy, 7-9 September.
Poppele, Jessica, Sudarno Sumarto, and Lant Pritchett. 1999. “SocialImpacts of the Indonesian Crisis: New Data and Policy Implica-tions”. Social Monitoring and Early Response Unit, Jakarta. Citedin Kanbur and Squire 2001.
Pradhan, Menno. 1999. “Note on comparing CFS and HIES data forconstructing comparable consumption estimates”. Unpublished.

181
Pradhan, Menno. 2000. “How many questions should be in a consump-tion questionnaire? Evidence from a repeated experience in Indone-sia”. Cornell Food and Nutrition Programme Working Paper, No.112, Ithaca, NY: Cornell University Press.
Pradhan, Menno and Martin Ravallion. 2000. “Measuring Poverty us-ing Qualitative Perceptions of Consumption Adequacy”. Review ofEconomics and Statistics, 82(3): pp. 462-471.
Qizilbash, M. 2003. “On the arbitrariness and robustness of multi-dimensional poverty rankings”. Paper presented at the WIDERconference on Inequality, Poverty and Human Well-being, Helsinki,30-31 May.
Rainwater, L. 1974. What Money Buys: Inequality and the Social Meaningof Income. New York: Basic Books.
Rao, Vijayendra. 2002. “Experiments in “Participatory Econometrics”:improving the connection between economic analysis and the realworld”, Economic and Political Weekly, May 18.
Rathnayake, Ishara and Jeevika Weerahewa. 2003. “Intra-HouseholdAllocation of Calories among Low Income Households in Sri Lanka:Impact of Female Sources of Income”. Progress Report of Projecttitled “Globalization and Distribution in Sri Lanka” MIMAP-IDRC.
Ravallion, Martin. 1994. Poverty Comparisons. Fundamentals of Pureand Applied Economics, Volume 56, Chur, Switzerland: Harwood Aca-demic Press.
Ravallion, Martin. 1996. “Issues in measuring and modelling poverty”.Economic Journal, 106 (September): pp. 1328-43.
Ravallion, Martin. 1997. “Good and Bad Growth: The HumanDevelopment Reports”. World Development 25 (5, May): pp. 631-38.
Ravallion, Martin. 1998. “Poverty Lines in Theory and Practice”. Liv-ing Standards Measurement Series Working Paper No. 133. Wash-ington, D.C.: World Bank.
REFERENCES

182
POVERTY MEASUREMENT: Meanings, Methods and Requirements
Ravallion, Martin and Dominique van de Walle. 1991. “Urban-RuralCost of Living Differentials in a Developing Economy”. Journal ofUrban Economics. 29: pp. 113-27.
Ravallion, Martin and Quentin Wodon. 1997. “Poor areas, or only poorpeople?” World Bank Policy Research Working Paper 1798. Avail-able online at http://econ.worldbank.org
Ravallion, Martin. 2003. “The Debate on Globalization, Poverty andInequality: Why Measurement Matters”. World Bank Policy Re-search Working Paper 3038. Available online at http://econ.worldbank.org
Ravallion, Martin and Michael Lokshin. 2001. “Identifying welfare ef-fects from subjective questions”. Economica, 68:pp. 335-357.
Ravnborg, H. 1999. “Poverty and Soil Management-Evidence ofRelationships from Three Honduran Watersheds”. Paper forpresentation at the workshop on “Assessing the Impact of Agricul-tural Research on Poverty Alleviation”, Costa Rica, September 14-16.
Razafindrakoto, Mireille and François Roubaud. 2003. “The multiplefacets of poverty: the case of urban Africa”. Paper presented at theWIDER conference on Inequality, Poverty and Human Well-being,Helsinki, 30-31 May.
Reddy, Sanjay G, and Thomas W. Pogge. 2003. “How not to count thepoor”. Mimeo. New York: Barnard College. Available online atwww.socialanalysis.org
Robb, Carolyn M. 1998. “Can the Poor Influence Policy? Participa-tory Poverty Assessments in the Developing World”. Directions inDevelopment Series. Washington, D.C.: World Bank.
Room, G. (ed.). 1995. Beyond the Threshold: The Measurement and Analysisof Social Exclusion. Bristol: The Policy Press.
Room, G. 1999. “Social exclusion, solidarity and the challenge ofglobalisation”. International Journal of Social Welfare 8 (3): pp. 66-74.

183
Rouse, Cecilia Elena. 1990. “A study of the poor in Sri Lanka”. Inter-nal Discussion Paper No. 165. Washington, D.C.: World Bank.
Rowntree, Seebohm. 1901. Poverty: A Study of Town Life. London:Macmillan.
Ruggeri-Laderchi, C. 1999. “The many dimensions of deprivation inPeru: theoretical debates and empirical evidence”. Working PaperNo. 29. Oxford: Queen Elizabeth House, University of Oxford.
Ruggeri-Laderchi, C, Ruhi Saith and Frances Stewart. 2003. “Does itmatter that we don’t agree on the definition of poverty? A compari-son of four approaches”. Working Paper No. 107. Oxford: QueenElizabeth House, University of Oxford.
Sahn, David. 1984. “An Analysis of Food Consumption and Expendi-ture Patterns in Sri Lanka”. Mimeo. U.S. Agency for InternationalDevelopment.
Sahn, David. 1985. “Food Consumption Patterns and Parameters in SriLanka: the Causes and Control of Malnutrition”. Mimeo. Washing-ton, D.C.: IFPRI.
Sahn, David. 1987. “Changes in the Living Standards of the Poor in SriLanka during a Period of Macroeconomic Restructuring”. WorldDevelopment, Vol. 15(6): pp. 809-30.
Sahn, David. 1988. “The effect of price and income changes on food-energy intake in Sri Lanka”. Economic Development and CulturalChange, Vol. 36: pp. 315-340.
Sahn, David and D. Stifel. 2000. “Poverty comparisons over time andacross countries in Africa”. World Development 28(12): pp. 2123-55.
Saith, Ruhi. 2001a. “Capabilities: the Concept and itsOperationalisation” Working Paper No. 66. Oxford: Queen Eliza-beth House, University of Oxford.
Saith, Ruhi. 2001b. “Social Exclusion: the Concept and Application toDeveloping Countries”. Working Paper No. 72. Oxford: QueenElizabeth House, University of Oxford.
REFERENCES

184
POVERTY MEASUREMENT: Meanings, Methods and Requirements
Salmen, Lawrence F. 1995. “Participatory Poverty Assessment:Incorporating Poor People’s Perspectives into Poverty AssessmentWork”. Environment Department Paper 24, Social Assessment Se-ries. Washington, D.C.: World Bank.
Saunders, Peter. 1997. “Poverty, Choice and Legitimacy”. SPRC Dis-cussion Paper No. 76. March.
Schady, Norbert. 2002. “Picking the poor: Indicators for geographictargeting in Peru”. Review of Income and Wealth, 48 (3, September):pp. 417-433.
Sen, Abhijit. 2000. “Estimates of Consumer Expenditure and ItsDistribution: Statistical Priorities after NSS 55th Round”. Economicand Political Weekly. December 16, pp. 4499-4518.
Sen, Amartya. 1973. On Economic Inequality. Oxford: Clarendon Press.Sen, Amartya. 1976. “Poverty: An Ordinal Approach to Measurement”.
Econometrica, 44: pp. 219-231.Sen, Amartya. 1977. “On weights and measures”. Econometrica, 45.Sen, Amartya. 1980. “Equality of what?” In McMurrin, S.M. (ed.) Tan-
ner Lectures on Human Values, Cambridge: Cambridge UniversityPress.
Sen, Amartya. 1981. Poverty and Famines: An Essay on Entitlement andDeprivation. Oxford: Oxford University Press.
Sen, Amartya. 1983. “Poor, Relatively Speaking”. Oxford Economic Pa-pers 35, July, pp. 153-69.
Sen, Amartya. 1985. Commodities and Capabilities. Amsterdam, NorthHolland.
Sen, Amartya. 1987. “The Standard of Living, Lecture II, Lives andCapabilities”. In G. Hawthorn (ed.) The Standard of Living. Cam-bridge: Cambridge University Press, pp. 20-38.
Sen, Amartya. 1992. Inequality Re-examined. Cambridge, MA: HarvardUniversity Press.
Sen, Amartya. 1993. “Capability and Well-being”. In Martha Nussbaumand Amartya Sen (eds.) The Quality of Life. Study prepared forWIDER. Oxford: Clarendon Press.

185
Sen, Amartya. 1997. “From Income Inequality to Economic Inequal-ity”. Southern Economic Journal 64(2): pp. 384-401.
Sen, Amartya. 1999. Development as freedom. New York: Anchor.Sen, Binayak. 2003. “Drivers of escape and descent: Changing house-
hold fortunes in rural Bangladesh”. World Development, 31 (3): pp.513-534.
Silburn, Richard. “United Kingdom”. In John Dixon and David Macarov(eds.) Poverty: A Persistent Global Reality. London: Routledge.
Slesnick, D.T. 1993. “Gaining ground: poverty in the postwar UnitedStates”. Journal of Political Economy, 101(1): pp. 1-38.
Shorrocks, Anthony. 1995. “Revisiting the Sen Poverty Index”.Econometrica, vol 65.
Short, Kathleen, John Iceland and Joseph Dalaker. 2002. “Defining andRedefining Poverty”. Paper presented at the annual meeting of theAmerican Sociological Association of America. Chicago, Illinois.August.
Slesnick, D.T. 1993. “Gaining ground: poverty in the postwar UnitedStates”. Journal of Political Economy 101(1):pp. 1-38.
Smith, Adam. 1776. An Inquiry into the Nature and Causes of the Wealthof Nations. Everyman Edition. London, Home University Library.
Subramaniam, S. 2003. “Social Groups and Economic Poverty: A prob-lem in measurement”. Paper presented at the WIDER conferenceon Inequality, Poverty and Human Well-being, Helsinki, 30-31 May.
Sumner, Andrew. 2003. “Economic and non-economic well-being: areview of progress on the meaning and measurement of poverty”.Paper presented at the WIDER conference on Inequality, Povertyand Human Well-being, Helsinki, 30-31 May.
Suryahadi, A. and S. Sumarto. 2001. “The chronic poor, the transientpoor, and the vulnerable in Indonesia, before and after the crisis”.SMERU Research Institute Working Paper, May.
Thorbecke, Eric. 2003. “Conceptual and Measurement Issues in Pov-erty Analysis”. Paper presented at the WIDER conference on In-equality, Poverty and Human Well-being, Helsinki, 30-31 May.
REFERENCES

186
POVERTY MEASUREMENT: Meanings, Methods and Requirements
Townsend, Peter. 1979. “The Development of Research on Poverty”.In Department of Health and Social Security, Social Security Research:The Definition and Measurement of Poverty. London: HMSO. Citedin Sen 1983.
Travers, P. and S. Richardson. 1993. Living Decently: Material Well-being in Australia. Melbourne: Oxford University Press.
Tudawe, Indra. 1999. “Review of Data and Data Sources to MonitorPoverty in Sri Lanka”. MIMAP – Sri Lanka Working Paper No. 3.Colombo: Institute of Policy Studies of Sri Lanka.
Tudawe, Indra. 2001. “Chronic poverty and development policy in SriLanka: overview study”. Chronic Poverty Research Centre Work-ing paper No. 9. Manchester Institute of Development Policy andManagement, CPRC. Available online at http://www.chronicpoverty.org/cpreports2.htm
Uphoff, Norman. 2001. “Bridging quantitative-qualitative differencesin poverty appraisal: self-critical thoughts on qualitative approaches”.In Kanbur, 2001.
United Nations. 1984. Handbook of Household Surveys. New York:United Nations.
United Nations. 1991. Household Surveys of Agriculture in Africa: AMethodological Study. New York: United Nations.
United Nations. 1995. The Copenhagen Declaration and Programme ofAction. World Summit for Social Development March 6-12, NewYork: United Nations Department of Publications.
UNDP. 1997. Human Development Report 1997. New York: OxfordUniversity Press.
UNDP. 2000. Poverty Report 2000. New York: Oxford University Press.Van de Walle, Dominique. 1994. “The Distribution of Subsidies through
Public Health Services in Indonesia, 1978-87”. World Bank EconomicReview 8(2, May): pp. 279-309.
Van de Walle, Dominique and Kimberly Nead (eds.). 1995. Public Spend-ing and the Poor: Theory and Evidence. Baltimore, MD: Johns HopkinsUniversity Press.

187
Van den Bosch, T. Callen, J. Estivill, P. Hausman, B. Jeandiddier, R.Muffels and J. Yantopoulous. 1993. “A Comparison of Poverty inSeven European Countries and Regions Using Subjective and Rela-tive Measures”. Journal of Population Economics 6(1): pp. 235-59.
Vidyaratne, Suranjana and K.G. Tilakaratne. 2003. “Sectoral and Pro-vincial Poverty Lines for Sri Lanka”. Colombo: Department of Cen-sus and Statistics.
Waldegrave, Charles and Paul Frater. 1996. “New Zealand: A Searchfor a National Poverty Line”. In Oyen, Else, S.M. Miller, and SyedAbdus Samad (eds.) Poverty: A Global Review. Oslo: ScandinavianUniversity Press.
Walker, R. 1987. “Consensual Approaches to Poverty Lines and SocialSecurity”. Journal of Social Policy 16 (2): pp. 183-211.
Weinberg, Daniel, Kathleen Short, and Donald Hernandez. 1998. “TheCensus Bureau’s Plans for Poverty Measurement Research”. Pov-erty Measurement Working Papers, U.S. Census Bureau, April.Available online at http://www.census.gov/hhes/www/povmeas.html
White, Howard, Jennifer Leavy and Andrew Masters. 2002. “Compara-tive Perspectives on Child Poverty: A Review of Poverty Measures”,Young Lives International Study of Childhood Poverty, WorkingPaper no. 1.
Wodon, Quentin. 1999. “Growth, poverty and inequality: a regionalpanel for Bangladesh”. Background paper for Bangladesh povertyassessment. Washington, D.C., World Bank.
World Bank. 1990. World Development Report 1990. New York: Ox-ford University Press.
World Bank. 1994. “Uzbekistan: Adjusting Social Protection”. ReportNo. 13023-UZ. Washington D.C.: World Bank.
World Bank. 1995a. “Cameroon: Diversity, Growth and Poverty Re-duction”. Economic Report, Africa Region. Washington, D.C.:World Bank.
REFERENCES

188
POVERTY MEASUREMENT: Meanings, Methods and Requirements
World Bank. 1995b. “Ghana: Poverty-Past, Present and Future”.Washington, D.C.: World Bank.
World Bank. 2000. “The geography of poverty: estimation and analysisof small area welfare indicators”. Proposal for funding. Cited in Davisand Siano 2001.
World Bank. 2001. World Development Report 2000/2001. New York:Oxford University Press.
World Bank. 2002a. Poverty and Vulnerability in South Asia. Washing-ton, D.C.: World Bank.
World Bank. 2002b. World Development Report 2002. Washington, D.C.:World Bank.
World Bank. 2003. World Development Report 2003. Washington, D.C.:World Bank. Overview available online at www.worldbank.org
World Health Organization (WHO). 1985. “Energy and ProteinRequirements”. Technical Report Series 724. Geneva: WHO.
World Health Organization (WHO). 1995. WHOQOL 100: The 100questions with response grades. Geneva: WHO.
World Health Organization (WHO). 1999. WHOQOL AnnotatedBibliography. Geneva: WHO.
Yaqub, Shahin. 2002. “Chronic Poverty: Scrutinizing Estimates, Pat-terns, Correlates and Explanations”. Chronic Poverty ResearchCentre Working Paper no. 21. Sussex University.
Zeller, M., M. Sharma, C. Henery and C. Lapenu. 2001. “An opera-tional tool for evaluating poverty outreach of development policiesand projects”. IFPRI Discussion Paper No. 111. Washington, D.C.:IFPRI. Available online at www.ifpri.org/divs/fcnd/dp.htm

189
APPENDICES

190
POVERTY MEASUREMENT: Meanings, Methods and Requirements
Appendix A: Components of a poverty profile for Bangladesh 1996Poverty profiles based on the income methodOne of the main uses of poverty measures calculated under the incomeapproach is to construct a poverty profile which presents the povertycharacteristics of various household groups. The categorisation intogroups is driven by ex-ante knowledge of important dimensions (per-haps using information obtained by qualitative methods) or by dimen-sions which are relevant for policies (geographic location, age, gender,sector of employment).
Poverty profiles can present poverty measures in three ways: pov-erty rates by group, the contribution of each group to poverty and therelative risks of being poor for different groups.
The table below categorises the population by geographic region.The headcount index indicates that Rajshahi division had the highestincidence of poverty, where 62% of the population in Rajshahi werepoor.
The share of all poor is a function of that group’s population shareand the incidence of poverty in that group. Thus, Rajshahi had a 28%share of all the poor, which is higher than its population share, giventhat the poverty incidence in Rajshahi is higher than the national pov-erty incidence (28=24*62/53).
The relative risk of living in a particular geographic region is de-fined relative to all other groups. Thus, urban households in Madagas-car are 39% less likely to be poor than rural households (1-47/77).

191
Table A1: Poverty profile for Bangladesh and Madagascar by geo-graphic regionBangladesh BarisalChittagong Dhaka Khulna Rajshahi National1996
Population Share 7 26 31 12 24 100Headcount Index 60 45 52 52 62 53Share of all poor 8 22 30 12 28 100Relative risk +14% -20% -3% -3% +24%
Madagascar Total Capital Major Other Rural National1994 urban City urban urban
Population Share 21 10 5 7 79 100Headcount Index 47 41 43 59 77 70Share of all poor 14 6 3 6 86 100Relative risk -39% -44% -41% -17% +63%
Source: Coudouel et al. 2001.
APPENDICES

192
POVERTY MEASUREMENT: Meanings, Methods and Requirements
Ap
pen
dix
B:
A c
omp
aris
on o
f fo
ur
app
roac
hes
to
pov
erty
Tab
le B
1: A
com
par
ison
of
fou
r ap
pro
ach
es t
o p
over
tyM
oneta
ry ap
proa
chCa
pabil
ity a
ppro
ach
Socia
l Exc
lusion
Parti
cipat
ory
appr
oach
Uni
t of
Analy
sisCo
ncep
tuall
y th
e in
divi
dual,
inU
suall
y th
e in
divi
dual,
Indi
vidu
als (o
r ho
useh
olds
)G
roup
s an
d in
dividu
als (o
r hou
se-
prac
tice,
the
hous
ehol
dbu
t for
som
e in
dica
tors,
or g
roup
s re
lative
to o
ther
sho
lds)
with
in th
em
the
hous
ehol
d, o
r m
ore
in t
heir
com
mun
ity/
aggr
egat
ed g
eogr
aphi
cso
ciet
y
area
s.
Indi
cato
rIn
com
e or
con
sum
ptio
n.M
any.
Man
y.M
any.
Best
prac
tice
in L
DCs
is
cons
umpt
ion
expe
nditu
re.
Def
initi
on o
fCe
ntra
l elem
ent i
s a
“List
s” o
f dim
ensio
nsRe
fere
nce
to th
ose
Loca
l peo
ple’s
own
Thre
shol
dsm
inim
um f
ood
requ
irem
ent
that
are
nor
mall
ypr
evail
ing
in s
ociet
ype
rcep
tions
of
well-
bein
g
(def
ined
ext
erna
lly, b
yas
sum
ed to
be
and
state
obl
igatio
nsan
d ill
bein
g
“obj
ectiv
e” c
riter
ia. B
est
objec
tively
def
inab
le.
prac
tice
met
hods
use
info
rmat
ion
from
hou
seho
ld
cons
umpt
ion
patte
rns
to
dete
rmin
e m
inim
um le
vel o
f
non-
food
con
sum
ptio
n

193
Ap
pen
dix
B:
A c
omp
aris
on o
f fo
ur
app
roac
hes
to
pov
erty
Tab
le B
1: A
com
par
ison
of
fou
r ap
pro
ach
es t
o p
over
ty c
ontd
.M
oneta
ry ap
proa
chCa
pabil
ity a
ppro
ach
Socia
l Exc
lusion
Parti
cipat
ory
appr
oach
Relat
ive
orBo
th r
elativ
e an
d ab
solu
teU
suall
y ab
solu
teRe
lativ
e, by
def
initi
on, y
etRe
lativ
e
abso
lute
pov
erty
line
s ar
e us
ed, a
lthou
gh te
nden
cy to
use
abs
olut
e
abso
lute
is m
ore
typi
cal i
nde
finiti
ons
in L
DC
LDCs
cont
ext
Sens
itivit
y to
soc
ialN
ot in
trins
ic to
mea
sure
men
tEm
phas
is on
ade
quac
yCe
ntra
l elem
ent
Refle
cted
in th
e wa
y po
or
inst
itutio
nsm
etho
dolo
gy-ty
pica
lly w
ould
rath
er th
an s
uffic
iency
peop
le an
alyse
their
own
rea
lity
be d
ealt
with
in a
nalys
islea
ves
spac
e fo
r
varia
tions
Impo
rtanc
e of
Not
intri
nsic
to m
easu
rem
ent
Not
clea
rO
ne o
f the
main
thru
stsCr
itica
l for
ach
ievem
ent o
f sa
tis-
proc
esse
s m
etho
dolo
gy-ty
pica
lly w
ould
of th
e ap
proa
chfa
ctor
y m
etho
ds
be d
ealt
with
in a
nalys
is
Majo
r co
ncep
tual
Util
ity is
not
an
adeq
uate
Elem
ents
of a
rbitr
arin
esBr
oad
fram
ewor
k,W
hose
per
cept
ions
are
bein
g eli
c-
weak
ness
esm
easu
re o
f we
ll-be
ing;
and
s in
cho
ice o
f bas
icsu
scep
tible
to m
any
ited,
and
how
rep
rese
ntat
ive
and
pove
rty is
not
an
econ
omic
capa
bilit
ies, p
robl
ems
inte
rpre
tatio
ns, d
ifficu
lt to
cons
isten
t are
they
? H
ow d
oes
cate
gory
of a
ddin
g up
com
pare
acr
oss
coun
tries
one
deal
with
disa
gree
men
ts?
APPENDICES

194
POVERTY MEASUREMENT: Meanings, Methods and Requirements
Ap
pen
dix
B:
A c
omp
aris
on o
f fo
ur
app
roac
hes
to
pov
erty
Tab
le B
1: A
com
par
ison
of
fou
r ap
pro
ach
es t
o p
over
ty c
ontd
.M
oneta
ry ap
proa
chCa
pabil
ity a
ppro
ach
Socia
l Exc
lusion
Parti
cipat
ory
appr
oach
Prob
lems
for
Com
para
bilit
y of
sur
veys
, pric
eFe
wer
prob
lems
if ba
sicLi
nes
of s
ocial
exc
lusio
nCu
ltura
l diff
eren
ces
can
mak
e
cros
s-co
untry
indi
ces,
and
natio
nal p
over
tyca
pabi
lities
are
def
ined
are
esse
ntial
ly so
ciety
-ap
prop
riate
pro
cess
es d
iffer
com
paris
ons
line
sex
tern
ally
(“ob
jectiv
ely”)
;spe
cific,
pro
blem
s of
acro
ss s
ociet
ies, r
esul
ts m
ay n
ot
aggr
egat
ing
of d
iffer
ent
aggr
egat
ion
of m
ultip
lebe
com
para
ble
indi
cato
rs le
ads
todi
men
sions
sim
ilar
to
inco
nsist
encie
s wh
ich c
anth
at in
the
case
of
mak
e co
mpa
rison
sca
pabi
lties
mea
ning
less
Man
ner
ofAs
sum
es t
hat
mon
etar
yId
entif
ies in
dica
tors
inId
entif
ies in
dica
tors
inIn
dent
ifies
man
y di
men
sions
of
inco
rpor
atin
g m
ulti-
indi
cato
r ca
n ap
prop
riate
lym
any
dim
ensio
ns, e
ither
man
y di
men
sions
, eith
erpo
verty
. No
atte
mpt
to c
ombi
ne
dim
ensio
nalit
y p
roxy
oth
er a
spec
ts of
pov
erty
.se
para
tely
or a
ggre
gate
dse
para
tely
or a
ggre
gate
d in
to a
sin
gle in
dex.
Exte
nsio
ns o
f th
is ap
proa
ch in
to s
ingle
inde
xin
to s
ingl
e in
dex
inclu
de a
sset
-bas
ed in
dica
tors
?
Dat
a av
aila
bilit
yH
ouse
hold
(inc
ome
and
Dat
a av
ailab
le fro
m a
Dat
a in
term
itten
t, de
pend
sG
ener
ally
only
small
pur
posiv
e
expe
nditu
re)
surv
eys
cond
ucte
dva
riety
of
sour
ces
on in
divi
dual
rese
arch
ers.
sam
ples
. Nev
er a
vaila
ble
natio
n
at in
terv
als. H
H s
urve
ys m
ayin
cludi
ng d
emog
raph
ic I
f bas
ic di
men
sions
are
ally
, met
hodo
logy
mak
es r
epre
-
over
look
impo
rtant
sub
-an
d he
alth
surv
eys,
mul
ti-gr
eed
upon
, dat
a co
uld
bese
ntat
ive
sam
plin
g an
d re
gular
popu
latio
ns s
uch
as th
eto
pic
surv
eys
a c
ollec
ted
regu
larly.
natio
nal d
ata
colle
ctio
n im
pos-
sible
.

195
Ap
pen
dix
B:
A c
omp
aris
on o
f fo
ur
app
roac
hes
to
pov
erty
Tab
le B
1: A
com
par
ison
of
fou
r ap
pro
ach
es t
o p
over
ty c
ontd
.M
oneta
ry ap
proa
chCa
pabil
ity a
ppro
ach
Socia
l Exc
lusion
Parti
cipat
ory
appr
oach
insti
tutio
nalis
ed a
nd t
hean
d ad
min
istra
tive
data
desti
tute
. Con
trove
rsial
use
of
from
Mini
stries
of H
ealth
,
natio
nal i
ncom
e da
ta to
esti
mat
eEd
ucat
ion,
and
pub
lic
in th
e in
terim
-requ
ires
serv
ice p
rovi
ders
(wa
ter,
ass
umpt
ions
abo
ut e
lectri
city,
telec
omm
uni-
dist
ribut
ion.
catio
ns a
nd o
ther
infra
st-
ruct
ure)
. Pro
blem
s of
com
para
bilit
y of
uni
t or
sub-
popu
latio
ns
over
look
ed.
Cost
Repr
esen
tativ
e su
rvey
s wi
thM
uch
data
rou
tinely
Cost
will
depe
nd o
nG
ener
ally
muc
h ch
eape
r th
an
large
sam
ples
are
exp
ensiv
e,co
llect
ed f
orsu
rvey
instr
umen
ts us
ed.
large
sam
ple
surv
eys.
How
ever
analy
tical
cost
s he
avy.
How
ever
,adm
inist
rativ
e pu
rpos
es.
oppo
rtuni
ty c
osts
of p
artic
i-
seve
ral s
urve
ys a
re r
outin
elyAd
ditio
nal d
ata
from
pant
s ar
e ne
ver
inclu
ded
in c
ost
cond
ucte
d.
mul
ti-to
pic
surv
eys
calc
ulat
ions
.
woul
d be
exp
ensiv
e.
APPENDICES

196
POVERTY MEASUREMENT: Meanings, Methods and Requirements
Ap
pen
dix
B:
A c
omp
aris
on o
f fo
ur
app
roac
hes
to
pov
erty
Tab
le B
1: A
com
par
ison
of
fou
r ap
pro
ach
es t
o p
over
ty c
ontd
.M
oneta
ry ap
proa
chCa
pabil
ity a
ppro
ach
Socia
l Exc
lusion
Parti
cipat
ory
appr
oach
Majo
r we
akne
sses
“Arb
itrar
ines
s” o
f “e
xter
nally
”Im
poss
ibili
ty o
f se
tPr
oblem
s wi
th m
ulti-
How
com
para
ble?
How
rep
re-
for
mea
sure
men
t d
eter
min
ed th
resh
olds
and
evalu
atio
n. H
ow t
o de
aldi
men
siona
lity.
Cha
lleng
ese
ntat
ive?
othe
r ele
men
ts.
with
mul
tidim
ensio
nalit
yof
capt
urin
g pr
oces
ses.
even
if o
nly
of b
asic
func
tioni
ngs.
In p
ract
ice, w
hat i
s
mea
sure
d is
func
tioni
ngs,
not
capa
bilit
ies.
Polic
y im
plic
atio
nsEm
phas
is on
gro
wth
and
Inve
stmen
t in
exte
ndin
gFo
ster
proc
esse
s of
Empo
werm
ent o
f th
e po
or.
distr
ibut
ion
of p
erso
nal
basic
cap
abili
ties/
basic
inclu
sion,
in m
arke
ts an
d
mon
etar
y in
com
e. So
cial i
ncom
ene
eds
via
mon
etar
yso
cial p
roce
ss, w
ith
negl
ecte
d.in
com
es a
ndpa
rticu
lar e
mph
asis
on
publ
icser
vice
sfo
rmal
labou
r m
arke
t
Sour
ce:
Ada
pted
by
the
auth
or f
rom
Rug
geri
Lad
erch
i et
al. 2
003,
Cha
rt 1

197
Table B2: Poverty issues and qualitative methods contd.Poverty Issues Qualitative Methods Used
Perceptions and indicators of wealth, well- Wealth and well-being ranking or grouping
being, criteria and indicators
Poverty, vulnerability, powerlessness, local Semi-structured interviews
terminology and correspondence with such Social mapping
concepts. Differences in perception by gender.
Perceptions of change over time in welfare in Timelines (for migration, terms of trade,
dicators, terms of trade environment, and so on)
Access to (and use) services such as health, Institutional diagramming
education, credit; preferences especially where Semi-structured interviews
choice between options is available; perceptions of Trend analysis of services, for example,
services, including views (or awareness) of recent health, education, agricultural extension,
change; differing perceptions and values for men marketing
and women
Assets of rural communities-access to services, Resource mapping
common property resources, other natural resources Focus groups
Institutional (Venn) diagramming
Assets of households Wealth ranking or grouping
Social mapping
Semi-structured interviews
Coping strategies and fallback strategies in Livelihood analysis
times of crisis Semi-structured interviews
Ranking exercises
Perception of consumption level in terms of
food, clothing, and relation to well-being Focus groups Well-being grouping/ranking
Focus groups Social mapping
Focus groups Semi-structured interviews
Community-based support mechanisms for the
rural poor (community safety nets)
APPENDICES

198
POVERTY MEASUREMENT: Meanings, Methods and Requirements
Table B2: Poverty issues and qualitative methodsPoverty Issues Qualitative Methods Used
Local institutions of self-help and support for Semi-structured interviews
the urban poor (for example, market traders Institutional mapping
association, trade associations, churches,
and so on)
Role of community institutions in service and Institutional mapping
infrastructure provision Semi-structured interviews
Long-term environmental trends, for example, Historical transects
declining soil fertility, declining rainfall Community timelines
Resource mapping at different points in time
Trend analysis
Responsibilities, obligations within house holds Semi-structured interviews
(support to children, provision of food, Decision-making matrix
payment of school fees, and so on, by gender)
Source: Klugman 2001

199
Ap
pen
dix
C:
Pov
erty
lin
es f
rom
aro
un
d t
he
wor
ldT
able
C1:
Pov
erty
lin
es i
n e
igh
t A
sian
cou
ntr
ies
Cou
ntry
Sour
ce O
f Dat
aY
ear
Livi
ngC
alor
ieM
etho
dSo
urce
s
Stan
dard
Nor
mU
sed
Indi
cato
r
Bang
lades
hBa
nglad
esh
1981
/82,
Calo
rieA
bsol
ute
pove
rtyD
irect
calo
rie1)
Ahm
ed, F
aizud
din,
"Po
verty
Inc
iden
ce
Bure
au o
f Stat
istic
1983
/84,
inta
ke-2
122
calo
ries
per
inta
ke (D
CI)
in B
angla
desh
99:
Regio
nal a
nd N
ation
al
(BBS
) Hou
seho
ld19
85/8
6,ca
pita
per
day
,Es
timat
es",
Regio
nal S
emin
ar o
n Po
verty
Expe
nditu
re19
88/8
9,H
ardc
ore
pove
rty-
Mon
itorin
g Su
rvey
99,
Dha
ka, 2
1 M
ay
Surv
ey19
91/9
218
05 c
alorie
s pe
r20
00. 2
) Won
don,
Que
ntin
T.,
Food
& 1
995/
96ca
pita
per
day
Ener
gy I
ntak
e an
d Co
st of
Bas
ic N
eeds
:
Bang
lades
hBa
nglad
esh
Bure
au19
81/8
2,pe
r ca
pita
2112
calo
ries
per
Food
ene
rgy
Mea
surin
g Po
verty
in B
angla
desh
. The
of S
tatist
ic (B
BS)
1983
/84,
expe
nditu
reca
pita
per
day
inta
ke (F
EI)
Journa
l of D
evelop
ment
Studie
s, V
ol 3
4,
Hou
seho
ld19
85/8
6,(u
rban
), 21
22N
o 2,
Dec
embe
r 199
7, pp
66-
101.
3)
Expe
nditu
re S
urve
y19
88/8
9,ca
lorie
s pe
rW
odon
, Que
ntin
T.,
Pove
rty in
Ban
glade
sh:
1991
/92
&ca
pita
per
day
Exte
nt a
nd E
volu
tion.
The
Bangl
adesh
1995
/96
(rura
l)De
velopm
ent S
tudies
vol
23,
Sep
t-Dec
Bang
lades
hBa
nglad
esh
Bure
au19
81/8
2,Pe
r ca
pita
2122
calo
ries
per
Cost
of b
asic
1995
, No.
s 3
& 4
. 4) W
orld
Ban
k,
of S
tatist
ic (B
BS)
1983
/84,
expe
nditu
reca
pita
per
day
need
s (C
BN)
Bang
lades
h Fr
om C
ount
ing
the
Poor
to
Hou
seho
ld19
85/8
6,M
akin
g th
e Po
or C
ount
. Pov
erty
APPENDICES

200
POVERTY MEASUREMENT: Meanings, Methods and Requirements
Ap
pen
dix
C:
Pov
erty
lin
es f
rom
aro
un
d t
he
wor
ldT
able
C1:
Pov
erty
lin
es i
n e
igh
t A
sian
cou
ntr
ies
con
td.
Cou
ntry
Sour
ce O
f Dat
aY
ear
Livi
ngC
alor
ieM
etho
dSo
urce
s
Stan
dard
Nor
mU
sed
Indi
cato
r
Expe
nditu
re S
urve
y19
88/8
9,Re
duct
ion
and
Econ
omic
Man
agem
ent
1991
/92
&N
etw
ork,
Sou
th A
sia
1995
/96
Regio
n, 2
9 Ap
ril 1
998.
Chi
naN
atio
nal
Bure
au19
84,1
990.
Per
capi
ta21
00 p
er c
apita
Cost
of
basic
1) W
ang
, Zin
gzui
, et a
l. 20
00. C
hina
of S
tatis
tics
(NBS
)in
com
epe
r da
y-ru
ral
need
s (C
BN)
Pover
ty Pr
ofile.
A R
epor
t Su
bmitt
ed
Rur
al H
ouse
hold
(In t
he a
bsen
ceto
the
Asia
n D
evel
opm
ent
Bank
.
Surv
eyof
an
offic
ialFC
PMC
, Be
ijing
, PR
C.
pove
rty
line,
pas
t
calc
ulat
ions
wer
e
base
d on
UN
DP
& W
B st
udie
s)
In
dia
Nat
iona
l Sa
mpl
eN
atio
nal
Per
capi
ta21
00 c
alorie
sFo
od e
nerg
y1)
Tho
mas
, P.V
. Ind
ia C
ount
ry P
aper
on
Surv
ey (
NSS
)Sa
mpl
eex
pend
iture
per
capi
ta p
er d
ayin
take
(FE
I)Po
vert
y M
easu
rem
ent.
Sem
inar
on
Pove
rty
Surv
ey(u
rban
), 24
00St
atist
ics,
21-2
3 Ju
ne 1
999,
ESC
AP,
Org
anisa
t-ca
lorie
s pe
r ca
pita
Ban
gkok
. 2)
Gove
rnme
nt of
India
, Repo
rt
ion
(NSS
O)
per
day
(rur
al)
on th
e Exp
ert G
roup
on E
stima
tion
of

201
Ap
pen
dix
C:
Pov
erty
lin
es f
rom
aro
un
d t
he
wor
ldT
able
C1:
Pov
erty
lin
es i
n e
igh
t A
sian
cou
ntr
ies
con
td.
Cou
ntry
Sour
ce O
f Dat
aY
ear
Livi
ngC
alor
ieM
etho
dSo
urce
s
Stan
dard
Nor
mU
sed
Indi
cato
r
cont
inuo
u-Pr
oport
ion a
nd N
umbe
r of
Poor.
sly f
rom
Pers
pect
ive
Plan
ning
Div
ision
, Pla
nnin
g
1950
-197
4.Co
mm
issio
n. N
ew D
elhi
, Jul
y 19
93. 3
)
Ther
eaft
er,
Gover
nment
of I
ndia,
Esti
mate
of Po
verty.
data
was
Pres
s In
form
atio
n Bu
reau
. New
Del
hi, 1
1
colle
cted
Mar
ch 1
997.
by a
n in
te-
grat
ed s
ur-
vey
quin
q-
uenn
ially
from
197
2
/73
- 199
3
/199
4.
APPENDICES

202
POVERTY MEASUREMENT: Meanings, Methods and Requirements
Ap
pen
dix
C:
Pov
erty
lin
es f
rom
aro
un
d t
he
wor
ldT
able
C1:
Pov
erty
lin
es i
n e
igh
t A
sian
cou
ntr
ies
con
td.
Cou
ntry
Sour
ce O
f Dat
aY
ear
Livi
ngC
alor
ieM
etho
dSo
urce
s
Stan
dard
Nor
mU
sed
Indi
cato
r
Indo
nesia
Cent
ral B
urea
u19
76, 1
978,
Per
capi
ta21
00 c
alorie
s pe
rCo
st of
bas
ic1)
Asr
a, Ab
uzar
, I.P
. Dav
id a
nd R
.A.
of S
tatist
ics N
ation
al19
80, 1
981,
expe
nditu
reca
pita
per
day
need
s (C
BN)
Viro
la. 1
997.
"Po
verty
Ass
essm
ent
in t
he
Hou
seho
ld S
ocio
-an
d ev
ery
3(u
rban
), 24
00Ph
ilipp
ines
and
Ind
ones
ia: A
Met
hodo
logi
-
Econ
omic
Sur
vey
year
s th
erea
-ca
lorie
s pe
r ca
pita
cal C
ompa
rison
" Jou
rnal o
f Phil
ippine
(SU
SEN
AS)
fter
per
day
(rura
l)De
velop
ment.
Num
ber
44, V
ol. X
XIV
,
No.
2 S
econ
d Se
mes
ter.
2) S
utan
to, A
gus,
P.B.
Ira
wan
and
A. S
aid. 1
999.
Pov
erty
Mea
sure
men
t: Pr
oblem
s an
d D
evelo
pmen
t.
Pape
r Pr
esen
ted
at I
nter
natio
nal
Conf
eren
ce o
n M
etho
dolo
gies
of
Pove
rty
Calcu
latio
ns in
Ind
ones
ia, J
akar
ta, 3
0
Nov
embe
r 19
99. 3
) Bad
an P
usat
Sta
tstik
,
2000
. Pen
guku
ran
Ting
kat
Kem
iskin
an
Indo
nesia
197
6-19
99: M
etod
e BP
S. J
akar
ta

203
Ap
pen
dix
C:
Pov
erty
lin
es f
rom
aro
un
d t
he
wor
ldT
able
C1:
Pov
erty
lin
es i
n e
igh
t A
sian
cou
ntr
ies
con
td.
Cou
ntry
Sour
ce O
f Dat
aY
ear
Livi
ngC
alor
ieM
etho
dSo
urce
s
Stan
dard
Nor
mU
sed
Indi
cato
r
Nep
alCe
ntra
l Bur
eau
of19
95/9
6Pe
r ca
pita
2124
calo
ries
per
Cost
of
basic
1) P
renn
ushi
, Gio
vann
a. N
epal
: Pov
erty
at
Stat
istic
s (C
BS)
expe
nditu
reca
pita
per
day
need
s (C
BN)
the
Turn
of
the
21'st
Cent
ury
Mai
n Re
port
Nep
al L
ivin
gan
d Ba
ckgr
ound
Stu
dies
, Sou
th A
sia
Stan
dard
Sur
vey
Regi
on I
nter
nal D
iscus
sion
Pape
r, Re
port
No.
ID
P 17
4, t
he W
orld
Ban
k, M
ay 1
999.
2) L
anjo
uw, P
., et
al. 1
986.
"Bu
ildin
g
Bloc
ks f
or a
Con
sum
ptio
n- B
ased
Ana
lysis
of P
over
ty in
Nep
al",
n.p
.
Phili
ppin
esN
atio
nal S
tatis
tics
1957
,196
5,Pe
r ca
pita
2000
calo
ries
per
Cost
of
basic
Fran
cisc
o, V
.S.,
Pove
rty
in t
he P
hilip
pine
s.
offic
e (N
SO) F
amily
1971
,198
5in
com
eca
pita
per
day
and
need
s (C
BN)
Janu
ary
2000
. Unp
ublis
hed
Repo
rt t
o A
DB.
Inco
me
and
and
ever
y10
0% o
f th
eN
atio
nal S
tatis
tics
Coo
rdin
atio
n Bo
ard
Exp
endi
ture
Surv
ey3
year
sre
com
men
ded
(NSC
B), 1
997
Phili
ppin
e Po
vert
y
(FIE
S)th
erea
fter
.di
etar
y al
low
ance
sSt
atist
ics,
Phili
ppin
es.
(RD
A)
for
prot
ein
and
80%
of
the
per
capi
ta R
DA
for
vita
min
s
APPENDICES

204
POVERTY MEASUREMENT: Meanings, Methods and Requirements
Ap
pen
dix
C:
Pov
erty
lin
es f
rom
aro
un
d t
he
wor
ldT
able
C1:
Pov
erty
lin
es i
n e
igh
t A
sian
cou
ntr
ies
con
td.
Cou
ntry
Sour
ce O
f D
ata
Yea
rLi
ving
Cal
orie
Met
hod
Sour
ces
Stan
dard
Nor
mU
sed
Indi
cato
r
Thai
land
Nat
iona
l Sta
tistic
s19
75-7
6,Pe
r ca
pita
refe
r fo
otno
te 1
Cost
of b
asic
1) N
atio
nal E
cono
mic
and
Socia
l
Offi
ce (N
SO) S
ocio
-19
81, 1
986
inco
me
need
s (C
BN)
Dev
elopm
ent
Boar
d (N
ESD
B), N
ew
Econ
omic
Sur
vey
and
ever
yPo
verty
Thr
esho
lds
for
Thail
and
with
2 ye
ars
Polic
y A
pplic
atio
n, "
Indic
ators
of W
ell-
ther
eafte
r. B
eing a
nd P
olicy
Analy
sis, V
ol 2
, No.
2,
Mar
ch 1
998.
2)
Kak
wani
, Nan
ak, P
overty
in Th
ailan
d. Sc
hool
of
Econ
omics
the
Uni
vers
ity o
f N
ew S
outh
Wale
s, Sy
dney
,
Aus
tralia
. Und
ated
. 3)
Kak
wani
, Nan
ak
and
Med
hi K
rong
kaew
. 199
8. "
Pove
rty in
Thail
and:
Def
inin
g, M
easu
ring
and
Ana
lysin
g. W
orki
ng P
aper
No.
4.
Dev
elop
men
t Ev
aluat
ion
Div
ision
.
NES
DB.

205
Ap
pen
dix
C:
Pov
erty
lin
es f
rom
aro
un
d t
he
wor
ldT
able
C1:
Pov
erty
lin
es i
n e
igh
t A
sian
cou
ntr
ies
con
td.
Cou
ntry
Sour
ce O
f D
ata
Yea
rLi
ving
Cal
orie
Met
hod
Sour
ces
Stan
dard
Nor
mU
sed
Indi
cato
r
Vie
tnam
Gen
eral
Sta
tistic
s19
92-1
993,
Per
capi
ta21
00 c
alorie
s pe
rCo
st o
f ba
sic1)
Gov
ernm
ent-
Don
or-N
GO
-Wor
king
Off
ice
(GSO
)19
97-1
998
inco
me
capi
ta p
er d
ayne
eds
(CBN
)G
roup
, "A
ttack
ing
Pove
rty"
, V
ietna
m
Vie
tnam
Liv
ing
Deve
lopme
nt R
eport
200
0. C
onsu
ltativ
e
Stan
dard
s Su
rvey
Gro
up M
eetin
g fo
r V
ietn
am, 1
4-15
(VLS
S)D
ecem
ber
1999
. 2)
Gle
ww
e, P
aul,
et al.
"Who
Gai
ned
from
Vie
tnam
's Bo
om in
the
1990
's? A
n A
naly
sis o
f Po
verty
and
Ineq
ualit
y Tr
ends
, " D
evel
opm
ent
Rese
arch
Gro
up, T
he W
orld
Ban
k, U
ndat
ed.
Sour
ce:
Abu
zar
Asr
a an
d V
ivia
n Sa
ntos
-Fra
ncis
co (
2001
)
APPENDICES

206
POVERTY MEASUREMENT: Meanings, Methods and Requirements
Tab
le C
2: P
over
ty l
ines
in
sel
ecte
d d
evel
oped
cou
ntr
ies
Cou
ntry
Off
icia
l P
over
tyD
escr
iptio
nO
ther
pov
erty
Sour
ce fo
rSo
urce
Lin
e ex
ists
?lin
e an
dot
her
pove
rty
desc
ript
ion
line
Aus
tral
iaH
ende
rson
Pov
erty
Pove
rty
thre
shol
d is
the
min
imum
wag
eCo
x 19
98.
Line
(th
e pr
oduc
t of
apl
us f
amily
ben
efits
for
a o
ne-e
arne
r co
uple
Com
miss
ion
of I
nqui
ryw
ith t
wo
child
ren
into
Pov
erty
, cha
ired
bySe
cond
pov
erty
line
, app
lied
afte
r ho
usin
g
Prof
. Ron
ald
Hen
ders
cost
s w
ere
dedu
cted
fro
m in
com
e
on, r
epor
ted
in 1
973
Use
s th
e 19
54 N
ew Y
ork
Fam
ily B
udge
ts
Stan
dard
Equ
ival
ence
sca
le.
Can
ada
1. L
ow in
com
e cu
toff
Stat
istic
s Ca
nada
(Fe
dera
l Dep
artm
ent
line
(LIC
O)
resp
onsib
le f
or c
olle
ctin
g in
com
e da
ta in
2. 5
0 pe
rcen
t of
med
ianCa
nada
). LI
CO (
bega
n in
195
9)
gros
s in
com
e ad
just
edde
term
ines
a p
erce
ntag
e of
inco
me
at
only
for
fam
ily s
ize
whi
ch in
divi
dual
s an
d fa
mili
es m
ay b
e sa
id
to s
pend
a d
ispro
porti
onat
e am
ount
on
esse
ntia
l foo
d, c
loth
ing
and
shel
ter,
leav
ing
little
or
no in
com
e fo
r tr
ansp
orta
tion,
hea
lth
erso
nal c
are,
edu
catio
n, h
ouse
hold
oper
atio
n, r
ecre
atio
n or
insu
ranc
e.

207
Tab
le C
2: P
over
ty l
ines
in
sel
ecte
d d
evel
oped
cou
ntr
ies
con
td.
Cou
ntry
Off
icia
l P
over
tyD
escr
iptio
nO
ther
pov
erty
Sour
ce fo
rSo
urce
Lin
e ex
ists
?lin
e an
dot
her
pove
rty
desc
ript
ion
line
Hon
g K
ong
No.
CSS
A c
ut-o
ff is
(Com
preh
ensiv
e So
cial
Sec
urity
Ass
istan
ce)
Mac
Pher
son
1998
de-f
acto
pov
erty
line
is a
mea
ns t
este
d pr
ogra
mm
e, w
hich
has
been
pro
ved
to b
e in
suff
icie
nt.
Indi
a19
62 W
orki
ng G
roup
No
reco
rds
avail
able
to
reve
al th
e as
s
of t
he G
over
nmen
t of
umpt
ions
or
calc
ulat
ions
impl
icit
in t
his
Indi
a re
com
men
ded
per
figur
e.
capi
ta t
otal
con
sum
ptio
n
expe
nditu
re (
PCTE
) of
Rs. 2
0 pe
r m
onth
in
1960
/61
pric
es.
Ave
rage
per
cap
ita e
xpen
ditu
re le
vel a
t
Plan
ning
Com
mis
sion
whi
ch t
he a
vera
ge p
er c
apita
dai
ly [
calo
rie]
Tota
l co
nsum
ptio
nin
take
is 2
,400
in r
ural
area
s an
d 2,
100
in
expe
nditu
re p
er c
apita
urba
n ar
eas.
Base
d on
the
age
-sex
-act
ivity
-
Rs. 4
9.09
in r
ural
area
sca
lorie
allo
wan
ces
reco
mm
ende
d by
a g
roup
and
Rs. 5
6.64
in u
rban
of n
utrit
ion
expe
rts,
daily
req
uire
men
ts f
or
area
s in
197
3/74
pric
es u
rban
and
rur
al ar
eas
base
d on
the
age-
sex-
occu
patio
nal s
truc
ture
of
the
popu
latio
n.
Con
sum
ptio
n ex
pend
iture
usin
g N
SS
1973
/74
data
.
APPENDICES

208
POVERTY MEASUREMENT: Meanings, Methods and Requirements
Tab
le C
2: P
over
ty l
ines
in
sel
ecte
d d
evel
oped
cou
ntr
ies
con
td.
Cou
ntry
Off
icia
l P
over
tyD
escr
iptio
nO
ther
pov
erty
Sour
ce fo
rSo
urce
Lin
e ex
ists
?lin
e an
dot
her
pove
rty
desc
ript
ion
line
Irel
and
Rel
ativ
e po
vert
yC
alla
n an
d N
olan
lines
of
40, 5
019
98
and
60 p
erce
nt
of t
he a
vera
ge
inco
me.
Kor
eaM
inist
ry o
f H
ealth
and
1973
and
197
8 us
e th
e En
gel m
etho
d an
dE
ngel
, Ley
den,
Bark
199
4O
yen,
Mill
er a
nd
Soci
al A
ffair
s (1
973)
1978
use
s th
e Le
yden
met
hod.
Row
ntre
e,Sa
mad
199
6
and
1978
)E
xpen
ditu
re a
nd
Perc
eptio
n
met
hods
Net
herla
nds
No.
Gen
eral
Ass
istan
ceM
inim
um in
com
e le
vel n
eces
sary
to
live
Nat
iona
l So
cial
Dirv
en et
al.
1998
bene
fits
are
de f
acto
.in
sub
siste
nce.
Dep
end
on t
he c
ompo
sitio
nM
inim
um
of t
he r
ecip
ient
’s ho
useh
old,
his
or h
er a
ge,
Inco
me
Leve
l
and
whe
ther
or
not
he o
r sh
e sh
ares
a(N
ot o
nly
gene
ral
hom
e.as
sista
nce
bene
fits
but
also
holid
ay a
llow
ance
s,
incid
enta
l ben
efits
,

209
Tab
le C
2: P
over
ty l
ines
in
sel
ecte
d d
evel
oped
cou
ntr
ies
con
td.
Cou
ntry
Off
icia
l P
over
tyD
escr
iptio
nO
ther
pov
erty
Sour
ce fo
rSo
urce
Lin
e ex
ists
?lin
e an
dot
her
pove
rty
desc
ript
ion
line
fam
ily a
llow
ance
s
and
stud
ent
gran
ts)
Subj
ectiv
e Po
verty
Line
(ju
dgem
ents
of h
eads
of
hous
ehol
ds a
bout
the
min
imum
inco
me
requ
ired
for
thei
rG
oedh
art
et al
hous
ehol
d).
1977
Phili
ppin
es19
83 S
ocial
Dev
elopm
ent
Rela
tive
pove
rty li
ne o
f th
e bo
ttom
30
Com
mitt
ee (
Cab
inet
perc
ent.
Muc
h cr
itici
sed.
Leve
l bo
dy)
1991
Phi
lippi
nes
last
det
erm
ined
a n
atio
nal a
bsol
ute
pove
rty
Nat
iona
l St
atist
ical
in 1
991.
P3,
675
per
mon
th f
or a
fam
ily o
f
Coo
rdin
atio
n Bo
ard
six. O
ffic
ially
det
erm
ined
min
imum
inc
ome
APPENDICES

210
POVERTY MEASUREMENT: Meanings, Methods and Requirements
Tab
le C
2: P
over
ty l
ines
in
sel
ecte
d d
evel
oped
cou
ntr
ies
con
td.
Cou
ntry
Off
icia
l P
over
tyD
escr
iptio
nO
ther
pov
erty
Sour
ce fo
rSo
urce
Lin
e ex
ists
?lin
e an
dot
her
pove
rty
desc
ript
ion
line
(199
1)ne
eded
by
a fa
mily
to
obta
in a
spe
cific
Phili
ppin
es C
omm
issi
onbu
ndle
of
priv
atel
y pr
ovid
ed f
ood
and
basic
to F
ight
Pov
erty
serv
ices
(he
alth
care
, a s
afe
dwel
ling,
cle
an
(PCF
P) 1
994
wat
er a
nd s
anita
tion
and
clot
ing)
. Foo
d
thre
shol
d is
min
. nut
ritio
nal b
asic
req
t. O
f
2000
calo
ries
a da
y, w
ith u
p to
90
perc
ent
of t
he c
alorie
s de
rived
fro
m g
rain
s.
Uni
ted
No.
But
the
leve
l of
DH
SS 1
988
stud
y on
Low
Inc
ome
Fam
ilies
Silb
urn
1998
Kin
gdom
bene
fits
was
take
n as
an
usin
g an
nual
Fam
ily E
xpen
ditu
re S
urve
y.
impl
icit
pove
rty
line.
Hou
seho
ld f
orm
atio
n us
ed f
or c
alcu
latin
g
mea
ns-te
sted
ben
efit
Post
198
8 50
% o
f av.
DSS
use
d H
ouse
hold
s be
low
ave
rage
Inco
me
inco
me
(HBA
I) t
oget
her
with
res
t of
Eur
opea
n U
nion
(D
SS 1
995)
.

211
Tab
le C
2: P
over
ty l
ines
in
sel
ecte
d d
evel
oped
cou
ntr
ies
con
td.
Cou
ntry
Off
icia
l P
over
tyD
escr
iptio
nO
ther
pov
erty
Sour
ce fo
rSo
urce
Lin
e ex
ists
?lin
e an
dot
her
pove
rty
desc
ript
ion
line
Uni
ted
Stat
esO
rsha
nsky
pov
erty
Pove
rty li
ne o
f U
S$30
00 a
yea
r fo
r a
fam
ily
line
(196
3).
of f
our,
base
d on
the
Dep
t. of
Agr
icul
ture
’s
food
plan
of
1961
. One
thi
rd o
f a
typi
cal
fam
ily’s
expe
nditu
re w
as o
n fo
od, s
o th
e
food
pov
erty
line
was
sca
led
up b
y th
ree.
Pove
rty
thre
shol
ds a
re u
pdat
ed a
nnua
lly
(how
) an
d ad
just
ed f
or in
flatio
n.M
idgl
ey a
nd
Live
rmor
e 19
98
Zim
babw
e19
95 P
over
ty A
sses
smen
tIn
com
e re
quire
dC
ubitt
and
Kas
eke
1998
to s
atisf
y m
inim
-R
idde
ll
um c
onsu
mpt
ion
(197
4)
need
s of
a fa
mily
of g
iven
size
and
com
posit
ion
with
in a
def
ined
envi
ronm
ent
in a
con
ditio
n of
basic
phy
sical
hea
lth a
nd s
ocia
l
dece
ncy.
Nin
e ca
tego
ries:
Food
, clo
thin
g,
fuel
and
lig
htin
g, p
erso
nal c
are
and
heal
th,
APPENDICES

212
POVERTY MEASUREMENT: Meanings, Methods and Requirements
Tab
le C
2: P
over
ty l
ines
in
sel
ecte
d d
evel
oped
cou
ntr
ies
con
td.
Cou
ntry
Off
icia
l P
over
tyD
escr
iptio
nO
ther
pov
erty
Sour
ce fo
rSo
urce
Lin
e ex
ists
?lin
e an
dot
her
pove
rty
desc
ript
ion
line
repl
acem
ent
of h
ouse
hold
good
s, t
rans
port
,
acco
mm
odat
ion,
edu
catio
n an
d
prov
isio
n fo
r po
st-em
ploy
men
t
cons
umpt
ion.
Com
plie
d us
ing
Oye
n 19
96 a
nd D
ixon
199
8.

213
Case Study C1: What can we learn from the U.S. Poverty Line?127
The U.S. poverty line was constructed in 1963 by Mollie Orshansky, acivil servant, in what is now known as the U.S. Department of Healthand Human Services (DHHS). According to Orshansky, her calcula-tions were solely for a survey of the aged, but were misappropriated byPresident Johnson, who was looking for a national poverty measure(Milbank, 1995) in order to measure progress on the “War on Pov-erty”.
How the U.S. Poverty measure was constructed:Orshansky started with a set of minimally-adequate food budgetscalculated for families of various sizes and composition by the U.S.Department of Agriculture (USDA) for 1961.Based on information from the U.S. Department of Agriculture’s1955 household survey of food consumption she determined thatfood represented about one-third of after-tax income for a typicalfamily.The minimally adequate food budgets were scaled up by a factor ofthree to get the total poverty line.They were then adjusted for family size.She obtained 124 poverty thresholds that differed by family size,number of children, age and sex of head and farm and non-farmresidence.In the 1960s, the poverty line was updated to account for inflation,using increases in the prices of food to inflate the minimal foodbudget, maintaining a multiplier of three.In 1969, the U.S. Bureau of the Budget (now the Office of Manage-ment and Budget) adopted the Orshansky measure as the standardgovernment poverty measure, mandating that inflation be measuredusing the Consumer Price Index (CPI) published by the U.S. Bu-reau of Labour Statistics (BLS).
127 Based mainly on Weinberg et al. 1998.
APPENDICES

214
POVERTY MEASUREMENT: Meanings, Methods and Requirements
With only minor modifications (reducing the number of categoriesto 48) the Orshansky thresholds still form the basis for the officialpoverty statistics.It measures pre-tax income only, with no mention of in-kind ben-efits like food stamps, and credits like the Earned Income Tax Credit(EITC). Including these would decrease poverty significantly.It also makes no allowance for child-care and transport expenses,thus understating the number of working poor.It does not consider regional cost-of-living differences, thereforeoverstates rural poverty and understates urban poverty.It also mixes pre-tax income with after-tax spending requirements.
Beginning in 1992, a comprehensive examination of poverty measure-ment in the United States was conducted by the National ResearchCouncil (NRC)’s Panel on Poverty and Family Assistance of the Na-tional Academy of Sciences (NAS) commissioned by the 1988 FamilySupport Act. This panel published their findings a report in May 1995.128
Some recommendations on the revision of the official poverty measure,contained in Citro and Michael (1995):
“The revised measure should comprise a set of poverty thresholdsand a definition of family resources-for comparison with the thresh-olds to determine who is in or out of poverty-that are consistentwith each other and otherwise statistically defensible. The conceptsunderlying both the thresholds and definition of family resourcesshould be broadly acceptable and understandable and operation-ally feasible.”The poverty measure should have the following characteristics:
128 Citro and Michael 1995, Measuring Poverty: A New Approach.

215
It should represent a budget for food, clothing, shelter (includ-ing utilities) and a small additional amount to allow for otherneeds (for example, household supplies, personal care, non-work-related transportation).A threshold for a reference family type should be developedusing actual consumer expenditure survey data and updatedannually to reflect changes in expenditures in food, clothingand shelter over the previous 3 years (using data from the Con-sumer Expenditure Survey, converting data to the current pe-riod using the Consumer Price Index).A second set of updated thresholds should be used for evalua-tion purposes, which only updates for price changes (rather thanconsumption patterns).The reference family threshold should be adjusted to reflect theneeds of different family types and to reflect geographical dif-ferences in housing costs.
Choice of indicator: Family resources should be defined-consistentwith the threshold concept-as the sum of money income from allsources together with the value of near-money benefits (for example,food stamps) that are available to buy these goods and services. Suchexpenses include income and payroll taxes, childcare, and otherwork-related expenses, child support payments to another house-hold, and out-of-pocket medical care costs, including health insur-ance premium.Unit of analysis: Should continue to be Families and unrelated indi-viduals. Definition of families should be extended to include cohab-iting couples.Recommended equivalence scales: children under 18 are treated asconsuming 70 percent as much as adults on average; economies ofscale are computed by taking the number of adult equivalents in a
APPENDICES

216
POVERTY MEASUREMENT: Meanings, Methods and Requirements
family (that is, the number of adults plus 0.7 times the number ofchildren) and raising this number to a power of from 0.65 to 0.75.Spatial cost of living: A cost-of-housing index can be constructedfrom the decennial census, and should be applied to the housingcomponent of the poverty line. Appropriate agencies should con-duct research to determine how the geographic cost of living differ-ences should be calculated between censuses.Risk and vulnerability: Appropriate agencies should work to de-velop one or more “medical-care-risk” indexes that measure the eco-nomic risk to families and individuals having no or inadequate healthinsurance coverage. However such indexes should be kept separatefrom the measure of economic poverty.Choice of measures: In addition to the basic poverty counts and ra-tios for the total population and groups, official poverty series shouldprovide statistics on the average income and distribution of incomefor the poor, as well as on measures that exclude government taxesand transfers (that is, defines pre-tax income, excludes means-tested/all government benefits) so that the effects of government taxes andtransfers can be assessed.Federal and State agencies responsible for assistance programs thatuse poverty guidelines derived from the official poverty threshold(or a multiple) should consider using this proposed measure, andmodifying it if necessary.
Data requirements and research priorities recommended by the panelThe Survey of Income and Program Participation (SIPP) shouldbecome the basis of official U.S. income and poverty statistics inplace of the March income supplement to the Current PopulationSurvey (CPS)129. Priority should be accorded to methodologicalresearch for SIPP that is relevant for improved poverty measure-ment.
129 This recommendation was subsequently modified following a change in the design of theSIPP.

217
The Census Bureau should routinely issue public-use files from bothSIPP and CPS that include the Bureau’s best estimate of disposableincome and its components, so that researchers can obtain povertyrates consistent with the new threshold concept from either sur-vey.
Research priorities:Methods to develop poverty estimates from household surveyswith limited income information that are comparable to theestimates that would be obtained from a fully implemented dis-posable income definition of family resources.Methods to construct small-area poverty estimated from the lim-ited information in the decennial census that are comparablewith the estimates that would be obtained under a fully imple-mented disposable income concept.Consider adding one or two questions to the decennial censusto assist in the development of comparable estimates.The Bureau of Labour Statistics should undertake a compre-hensive review of the Consumer Expenditure Survey to con-sider ways to improve the CES for the purpose of developingpoverty thresholds, for making it possible at a future date tomeasure poverty on the basis of a consumption or expenditureconcept of family resources, and for other analytical purposesrelated to the measurement of consumption, income and sav-ings.Official poverty measures should be derived annually. Othermeasures can be derived for periods that are shorter and longerthan a year, for such purposes as program evaluation. Suchmeasures may include the inclusion of asset values in the familyresources definition.
APPENDICES

218
POVERTY MEASUREMENT: Meanings, Methods and Requirements
The extent of resource-sharing among roommates and otherhousehold and family members to determine if the unit of analy-sis for the poverty measure should be modified in the future.
The Census Bureau responded to the panel’s proposal with a series ofresearch projects (Weinberg 1998 and Fisher 1999), some of which arecompleted. Other organizations involved in research in these areas arethe Bureau of Labour Statistics, General Accounting Office, BrookingsInstitution and Institute for Research on Poverty (IRP). These include
Developing poverty thresholds using expenditure dataWork-related expenditures (mainly child-care and transportation)Valuing housing subsidiesDesigning a Medical Care Risk IndexShifting Family DefinitionsValuing home ownership to add to incomeEquivalence scalesCorrected estimates using out-of-pocket medical care expenses
In 1997 the Office of Management and Budget convened a federal In-teragency Technical Working Group (TWG) to improve the Measure-ment of Income and Poverty. The group formed various subgroups todeal with specific issues. They have compiled a list of research projects,and have provided comments on the Census Bureau’s plans for a reporton experimental poverty measures.
In 1999, the Census Bureau released its first report on experimentalpoverty measures which implemented most of the NAS Panel recom-mendations, as agreed upon by a technical working group on povertymeasurement chaired by the Office of Management and Budget.
A second report was released in 2001.130
The current value of the U.S. poverty line is about $15.05 per per-son per day (Barrett 2003).
130 See Short et al. 2002 for a summary of these reports and current challenges.

219
Appendix D. Asset based indicesComposite indices typically fall into two categories: (a) those that aimto capture the non-income dimensions of poverty in a single measure,or alternatively, to capture a more complete measure of poverty thanincome measures, and (b) those that are used to identify the determi-nants of some other phenomenon, such as fertility or educational at-tainment. The asset-based indices that are reviewed generally fall intothe latter category, although Sahn and Stifel (2001) attempt to con-struct an index of “asset poverty”. In this section I review recent at-tempts to construct indices from asset indicators with a view to provid-ing overall guidance in best practice in constructing composite indices,especially in the area of choosing weights.
Asset-based indices drawn from the Demographic and Health Sur-veys (DHS) have been used in recent research on the determinants ofeducational attainment (Filmer and Pritchett 1998 and 1999), examin-ing fertility (Bollen et al. 2002), fertility, child mortality and children’sschooling (Montgomery et al. 2000), and to construct “asset povertyrates” (Sahn and Stifel 2000). Filmer and Pritchett (1998) found thatwhile there is a correspondence between the classification of house-holds based on consumption expenditure and an asset index, the assetindex was a better proxy for predicting school enrolments (due to pos-sibly being a better predictor of long run welfare or “economic status”)than consumption expenditure. Montgomery et al. (2000) found proxyvariables to be weak predictors of consumption per adult, but to yieldsimilar results to consumption per adult when used as explanatory vari-ables.
Sahn and Stifel (2000) argue that using asset variables to create anindex of asset poverty avoid problems of data collection typically asso-ciated with consumption poverty measures such as such as variable re-call periods (Scott and Amenuvegbe 1990), differences in commoditylists (Pradhan 2000), and the difficulty of finding accurate deflators forintertemporal and spatial comparisons.
APPENDICES

220
POVERTY MEASUREMENT: Meanings, Methods and Requirements
Data on assetsQuestions on asset ownership collected in DHS and LSMS and othersurveys usually take the form “Do you own … (such and such)?” Thisyields a binary variable taking the value 0 or 1 and gives no additionalinformation on the quantity or quality of the assets. For example, doesthe household own one bicycle or many? Is the TV black and white orcolour? How reliable is the supply of services such as electricity andwater? Whether the lack of information on quantity and quality affectsthe outcome (ability to classify households as poor or non poor) is, toa large extent, an empirical question, which will only be definitivelyanswered as more studies are conducted. The use of binary variablesalso poses special problems in constructing an index.
There are also methodological issues in including in a household-based indicator, assets and services that are shared or publicly ownedsuch as well water or pit latrine or connection to electricity supply(Deaton 1997).
Differences in housing quality across regions (geographic, as well asurban and rural) generate problems similar to those posed by widelydiffering consumption patterns in creating a basket for income/expen-diture based poverty lines. For example, urban slum dwellers often livein brick and concrete dwellings, but in far worse conditions (in termsof indoor pollution from a smoking fire, overstressed sewage and wa-ter supply systems) than rural families in mud or thatched houses. Own-ership of household productive assets, such as holdings of land andanimals are appropriate in rural areas, but inappropriate (and in thecase of land, difficult to measure) in urban areas (Hewett andMontogomery 2001).
Does the choice of indicators matter?Filmer and Pritchett (1998), constructing asset-based indices, found thatreducing the number of variables used in the index does not re-classifyhouseholds very much (some of the poorest 40 percent get reclassified

221
into the middle 40 percent, but none are classified as rich). Bollen et al.(2002) examined several proxies and concluded that the choice of proxydoes matter if the focus is on economic status (as is the case when usinga proxy to monitor poverty), but not if the variables are being used toproxy economic status as an explanatory variable in the determinationof some other dependent variable (such as fertility or educational at-tainment). Other studies have found that at the subnational level dif-ferent indicators can lead to alternative poverty or food insecurityrankings (Glewwe and van der Gaag 1990, Hentschel et al. 2000).
What can be done? In choosing indicators, rather than asserting thatone variable-or approach to choosing variables-is better than another,the guiding principle should be to explore the tradeoffs inherent in thechoice of indicators. This will include (a) the assumptions that are made,the practical implications in terms of (b) costs, (c) technical require-ments, (d) errors of inclusion and exclusion and (e) characteristics ofthe chosen population (Davis and Siano 2001).
Limitations of asset indices as proxies for welfareThe indices constructed using these methods cannot be used to mea-sure absolute deprivation or be interpreted in any absolute sense, partlybecause they cannot be used to determine a threshold of poverty.131
They can only be used to rank households, and to group them intopercentiles, that is, measure relative welfare.
Filmer and Pritchett (1998) use data from the Indian 1992/93 Na-tional Family Health Surveys (a survey modelled on the DHS survey)and the asset index thus constructed performs well in terms of internalcoherence, robustness to the assets used, reasonable comparisons withpoverty and output across states, but raise questions in terms of urban/rural comparisons. Rank correlations of this index with consumptionpoverty headcount indices and per capita net state domestic productreveal a high correlation between the three.
131 Sahn and Stifel (2000) implicitly use a threshold, only described as “a certain level in the assetindex distribution.”
APPENDICES

222
POVERTY MEASUREMENT: Meanings, Methods and Requirements
Filmer and Pritchett (1998) point out that both the asset index and ameasure of consumption expenditure are proxies for a household’s longrun “wealth” or economic status. Both these measures are limited. Theproblem with the asset index is not having appropriate weights for theassets, the problem with current expenditure as a proxy for long runwealth is that that would occur only under the unrealistic assumptionof perfect foresight and perfect capital markets.
Although some authors have attempted it, asset indices cannot beused reliably to monitor changes in poverty over time, as there may besignificant changes in household ownership of, or access to, some ofthe index components, which may not necessarily translate into a re-duction in material poverty (Falkingham and Namazie 2002).
Asset indices are typically constructed from a generic list of indica-tors, although findings from qualitative studies indicate that measuresneed to be country/region/area-specific (Moser and Holland 1997;Moser 1998; Bond and Mukherjee 2001).
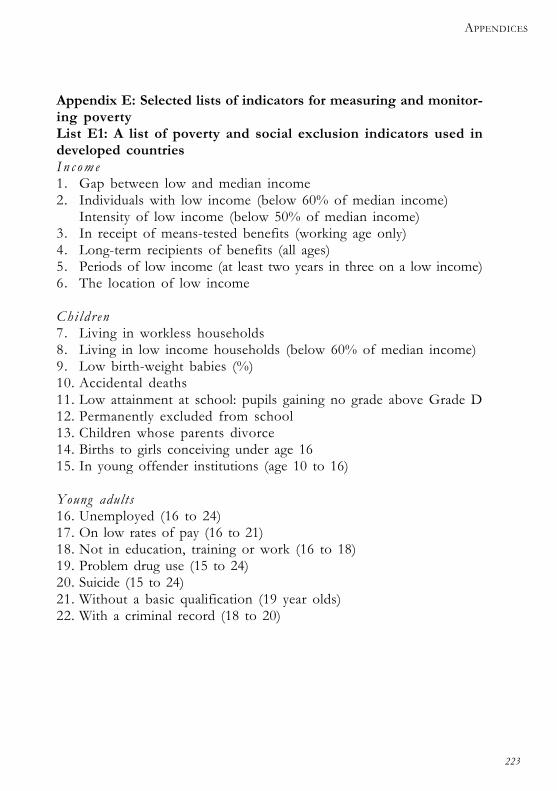
223
Appendix E: Selected lists of indicators for measuring and monitor-ing povertyList E1: A list of poverty and social exclusion indicators used indeveloped countriesI n c o m e1. Gap between low and median income2. Individuals with low income (below 60% of median income)
Intensity of low income (below 50% of median income)3. In receipt of means-tested benefits (working age only)4. Long-term recipients of benefits (all ages)5. Periods of low income (at least two years in three on a low income)6. The location of low income
Chi ldr en7. Living in workless households8. Living in low income households (below 60% of median income)9. Low birth-weight babies (%)10. Accidental deaths11. Low attainment at school: pupils gaining no grade above Grade D12. Permanently excluded from school13. Children whose parents divorce14. Births to girls conceiving under age 1615. In young offender institutions (age 10 to 16)
Young adults16. Unemployed (16 to 24)17. On low rates of pay (16 to 21)18. Not in education, training or work (16 to 18)19. Problem drug use (15 to 24)20. Suicide (15 to 24)21. Without a basic qualification (19 year olds)22. With a criminal record (18 to 20)
APPENDICES

224
POVERTY MEASUREMENT: Meanings, Methods and Requirements
Adults aged 25 to retirement23. Individuals wanting paid work24. Households wanting work for two years or more25. On low rates of pay26. Insecure at work27. Without access to training28. Premature death29. Obesity30. Limited long-standing illness or disability (45-64 year olds)31. Mental health
Older people32. No private income33. Spending on “essentials”34. Excess winter deaths35. Limiting long-standing illness or deaths36. Anxiety (feeling unsafe out at night)37. Help from social services to live at home (%)38. Without a telephone
Commun i t i e s39. Non-participation in civic organizations40. Polarisation of work (%)41. Spending on travel42. Without a bank or building society account43. Burglaries44. Without household insurance45. Dissatisfaction with local area (%)46. Without central heating47. Overcrowding48. Households in temporary accommodation49. Mortgage arrears(Source: Monitoring Poverty and Social Exclusion 2002, Executive Summary. Avail-able online at www.poverty.org.uk).

225
List E2: Core Welfare Indicator questionnaire indicatorsIndicators of Living Standards:
Percentage of households reporting diminishing/increasing land as-sets.Home ownership.Type of home construction.Percentage of households using wood, charcoal or crop residues forcooking fuel.Type of fuel used for lighting.Ownership of selected household goods.Mean number of household members.Percent of adults who are literate.Percent of persons sick or injured in the previous four weeks.Type of sickness or injury.Percent of children who are malnourished.
Access, Utilisation and Satisfaction Indicators:Access to clean water.Access to primary and secondary schools.Access to local market and public transport.Net primary and secondary enrolment rates (by gender).Satisfaction with school services.Percent of children who do not attend school.Reasons for not attending school.Primary and secondary drop out rates (by gender).Access to medical services.Use of medical services by persons sick or injured in previous fourweeks.Satisfaction with local health service.Reason for non-use of medical services.Percent of women with a recent birth who received prenatal care.Percent of births delivered in a health facility.Percent of births supervised by a formally trained health worker.Percent of children who have participated in nutrition programs.
APPENDICES

226
POVERTY MEASUREMENT: Meanings, Methods and Requirements
Percent of children who have participated in weigh-in programs.Percent of persons currently employed.Percent of persons underemployed.Percent of persons unemployed during the previous week.
Source: Achikbache, B., M. Belkindas, M. Dinc, G. Eele and E. Swanson, “Strengthen-ing Statistical Systems for Poverty Reduction Strategies: Technical; Notes and CaseStudies” cited in J. Klugman (ed.), 2001, A Sourcebook for Poverty Reduction Strategies,Washington D. C.
Table E1: Choosing dimensions and indicators for social exclusionArea of activity Consumption Savings Production Political Social
Exclusion Low income Low wealth Lacking Politically Sociallydefined by: Production unengaged isolated
activityIndicators Income under Not an owner- Not in Did not vote in In any one of
half mean occupier, Not employment or the last general five respects,equivalised contributing to self- election and lacks someonehousehold or receiving an employment, not a member who will offerincome occupational or full time of a political or support (listen,
personal education campaigning help in a crisis,pension, and no or training, organisation can relax with,savings over looking after really£2000 children, appreciates
or retired over you, can countpensionable age on to comfort).
Source: Tackling Social Exclusion in Families with Young Children, Summary of
Stage 2, “Measuring Social Exclusion”.

227
Note: Discussions with representatives of Government, voluntary organisations and
families from across the UK reveal marked differences in acceptance of these dimen-
sions and indicators. The first group considered income and unemployment as useful
“hard” measures, the second group emphasized social activity and isolation, while the
third group suggested the importance of perceptions (theirs and others toward them),
to be as important as income. Immediate living conditions (including services) were
more important than owning a home.
Table E2: Indicators for monitoring capability deprivationMeasuring Socio-cultural Political Measuring vulnerability“human” poverty capabilities capabilities
(Voicelessness/Powerlessness)
Undernutrition Analysis of local Self-assessed Physical assets (housing,ranking of powerlessness equipment, land)poverty/well-being (participatory poverty
assessments)Infant and child Evidence of social Survey evidence of Human capital (health andmortality interaction patterns local power relations education)
by gender, ethnicity and their dynamicsand other socialcategories
Maternal mortality Number and degree Surveys of gender Labour, stocks (food, money,of activity of comm balance in decision- valuables)unity-based making at all levelsorganisations
HIV prevalence/AIDS Regulations for Spread riskmortality decentralised
decision-makingCommunity based Income diversificationdisease monitoringindicators
APPENDICES
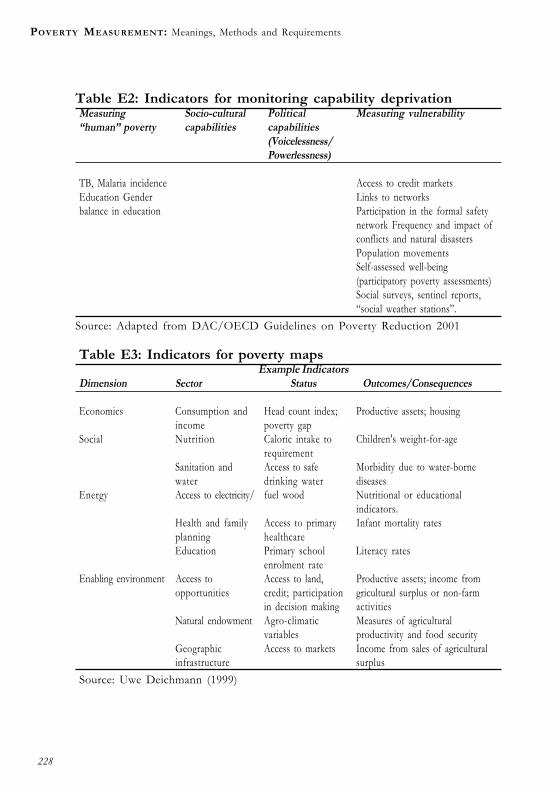
228
POVERTY MEASUREMENT: Meanings, Methods and Requirements
Table E2: Indicators for monitoring capability deprivationMeasuring Socio-cultural Political Measuring vulnerability“human” poverty capabilities capabilities
(Voicelessness/Powerlessness)
TB, Malaria incidence Access to credit marketsEducation Gender Links to networksbalance in education Participation in the formal safety
network Frequency and impact ofconflicts and natural disastersPopulation movementsSelf-assessed well-being(participatory poverty assessments)Social surveys, sentinel reports,“social weather stations”.
Source: Adapted from DAC/OECD Guidelines on Poverty Reduction 2001
Table E3: Indicators for poverty mapsExample Indicators
Dimension Sector Status Outcomes/Consequences
Economics Consumption and Head count index; Productive assets; housingincome poverty gap
Social Nutrition Caloric intake to Children's weight-for-agerequirement
Sanitation and Access to safe Morbidity due to water-bornewater drinking water diseases
Energy Access to electricity/ fuel wood Nutritional or educationalindicators.
Health and family Access to primary Infant mortality ratesplanning healthcareEducation Primary school Literacy rates
enrolment rateEnabling environment Access to Access to land, Productive assets; income from
opportunities credit; participation gricultural surplus or non-farmin decision making activities
Natural endowment Agro-climatic Measures of agriculturalvariables productivity and food security
Geographic Access to markets Income from sales of agriculturalinfrastructure surplus
Source: Uwe Deichmann (1999)

229
Table E4: Indicators of human well-being and povertyDimensions Component Means Examples of Indicators Ends/Outcomes/Capabilities
Examples of Indicators
Economi c Current Number of people below Lack of wealthconsumption poverty line
Head count index (proportion [ -productive assets-land,(monetary expenditures of people below poverty line livestock and equipmentmeasurement) Poverty gap housing
Squared poverty gap consumer goodsOther composite poverty savingsindexesPercentage of householdbudget spent onfood (food ratio)
Income same as aboveSocial Nutrition Calorie intake to requirement Low height-for-age(non- economic Low weight-for-ageor non-monetary Low weight-for heightmeasurement) Body mass index
Low birth weightSanitation and Access to adequate sanitation Morbidity-water borne diseaseswater Access to portable waterEnergy Access to adequate energy supply
Access to electricityHealth and family Access to primary healthcare Mortality-infantplanning Immunization rates Mortality-children under the
age of 5Access to family planning Mortality-maternalBirths attended by trained Morbidity of certain diseaseshealthcare personnel
Contraceptive prevalence ratePercentage of pregnant womenwho are anaemiclife expectancy
APPENDICES

230
POVERTY MEASUREMENT: Meanings, Methods and Requirements
Table E4: Indicators of human well-being and poverty contd.Dimensions Component Means Examples of Indicators Ends/Outcomes/Capabilities
Examples of Indicators
Education Net primary enrolment rate Literacy rate-female/male/adultPrimary school completion rate
Enabling Access to means Limited or no participation ine n v i r o nm en t of production decision making(tries to capture Limited or no social capitalstructural Limited or no access toinequities, and productive assetsprocesses and Limited or no access tosystematic employmentdisadvantages Limited or no access to land
Limited or no access to creditLimited or no access totechnologyLimited or no access toinformation
Vulnerability Poor agricultural endowmentHigh environmental hazard( droughts, floods, etc)Great insecurity (crime, intimidation etc)
Peripheral areas Poor access to marketsPoor access to infrastructurePoor access to publictransportation
Source: Henninger (1998)

231
Table E5: Examples of intermediate and outcome indicatorsGoal Intermediate indicator (input and output)
Outcome/impact indicator
Reduce extreme poverty Expenditure on employment programs Incidence of extremeand expand economic for the poor poverty:opportunities for the Number of beneficiaries of employment percentage of populationpoor. programs for the poor whose consumption falls
below thepoverty line
Poverty gap ratioIncome/expenditure ofthe poorest
20% of the population as ashare of the total income/expenditure of thewhole population
Enhance the capabilitiesof poor men and women Expenditure on primary education as Literacy rates
a share of total expenditure in education Learning achievementExpenditure on primary health care as a Gross/net enrollmentshare of total expenditure on health rate in primary/secondaryNumber of new schools built educationNumber of primary school teachers trained Dropout and repetitionPercentage of population below the ratespoverty line with access to health Infant, child, and undercare facilities five mortality rateNumber of doctors per 100,100 inhabitants Maternal mortality rate
Malnutrition rateReduce the number of Expenditure on safety net programs Number of householdsVulnerable poor. Number of households/individuals made food secure
receiving transfers from the government Percentage of vulnerableNumber of households receiving food aid group (for exampleas a percentage of drought- affected AIDS or orphans)households protected
Additional incomeprovided through safetynet programs
Source: Achikbache et al. in Jen Klugman, (ed.), 2001 A Sourcebook for Poverty Reduc-tion Strategies”, Washington, D.C.
APPENDICES

232
POVERTY MEASUREMENT: Meanings, Methods and Requirements
Table E6: Revised list of monitoring indicatorsIndicators Intended level of disaggregation
Income Poverty
Proportion of people below the poverty line National, regional, district
Number of people in absolute poverty National, regional
Household percentage share of food expenditure National, regional
Proportion of population living under thatched houses National, regional
Dependency ratio National, regional, district
Gini coefficient National, rural/urban
Consumption per capita of poorest 20% National, regional, district
Per capita GDP National
Savings/DGP ratio National
Revenue per capita per district District
Security and Vulnerability
Proportion of households affected by theft or civil disturbances National, regional
Number of people internally displaced National, regional
Number of civilian deaths due to insurgency National, regional
Number of criminal cases reported National, regional
Proportion of households experiencing major income shocks last year National, regional
Refugee and displaced as proportion of district population District
Proportion of households under economic distress selling assets National
Road Network
Road length opened National
Road length up-graded National
Proportion of districts with more than 50% of roads in poor condition National, district
Proportion of area not serviced by roads National, district

233
Table E6: Revised list of monitoring indicators contd.Indicators Intended level of disaggregation
Land
Incidence of poverty by land ownership and tenure National, district
Agriculture
Adoption rate of modern farming methods National, district
Yield rates National, district
Percentage of farmers growing food security crops National, district
Markets
Availability of markets by type National, district
Accessibility of markets National, district
Volume of goods and services handled at a given market National, district
Proportion of households where the sale price of the main
agricultural product is less than 50% of the urban market price National, district
Labor Productivity and Employment
Unemployment rate National, district
Vocational training enrollment National, district
Average hours worked per day National, district
Rural Credit
Growth of micro-finance portfolio National, district
Proportion of population accessing micro-credit National, district
Growth in savings National, district
Credit management (effective use) National, district
Availability of micro-finance services National, urban/rural
Source: Prennushi, G., G. Rubio and K. Subbarao, “Monitoring and Evaluation: Tech-
nical Notes” cited in Jeni Klugman, (ed.), 2001, A Sourcebook for Poverty ReductionStrategies, Washington, D.C.
APPENDICES

234
POVERTY MEASUREMENT: Meanings, Methods and Requirements
Table E7: Proposed indicators for monitoring the PRSP in TanzaniaObjectives Final Indicators Intermediate Indicators
1. Reducing income - Poverty incidence - Real GDP growth
p o v e r t y Proxy Indicators - Investment (physical and human)
- Ownership of household - Investment productivity
assets - Growth in value-added of agriculture
- Type of construction - Development of private sector
materials of dwelling - Seasonal production of hey food and cash crop
units (floors, walls and - Kilometres of rehabilitated rural roads
roofing) - Actual and budgetary allocation for rural roads
- Actual and budgetary allocation for agricultural
extension
2. Improving Quality of life and social well beingA. Health, - Infant and under 5mortality - Proportion of districts with active HIV/AIDS
survival and rates awareness campaigns
nutrition - Percentage of children under - Percentage of births attended by trained
2 years immunized against personnel
measles and DPT - Child feeding practices
- Seropositive rate in pregnant - Implementation of malaria control program
women - Actual and budgetary allocation for primary health
- Maternal mortality care
- Life expectancy - Actual and budgetary allocation for HIV/AIDS
- Malaria-related fatality rate - Actual and budgetary allocation for water and
for children under 5 sanitation
- Burden of disease/morbidity
- Proportion of households
with access to safe drinking
water
- Stunting prevalence
- Wasting prevalence

235
Table E7: Proposed indicators for monitoring the PRSP in Tanza-nia contd.Objectives Final Indicators Intermediate Indicators
B. Education - Literacy rate - Actual and budgetary allocation for basic
- Gender equality in primary education
and secondary education
- Proportion of school age
children successfully
completing primary education
- Net primary school
enrollment rate
- Gross enrollment rate
- Drop out rate
- Transition rate from primary
to secondary
- Proportion of students in
grade seven passing at
specified mark in standard
examination
C. Vulnerability - Built capacity to all - Established database for the vulnerable groups
communities needing safety - Promoted the production of drought resistant
nets programs crops in all drought prone areas
- Promoted community managed irrigation
schemes in all potential irrigation areas
D. Social well-being - Fully implemented poverty - Fully implemented local government
reduction strategy - Ratio of decided to filed court cases
- Average time taken to settle commercial disputes
- Ratio of actual court appeal sessions to planned
sessions
- Number of PRS workshops held and composi-
tion of committees
APPENDICES
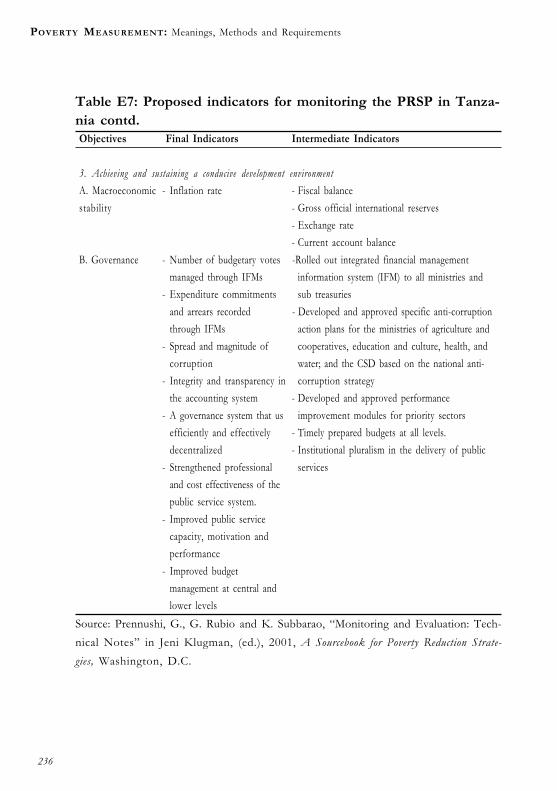
236
POVERTY MEASUREMENT: Meanings, Methods and Requirements
Table E7: Proposed indicators for monitoring the PRSP in Tanza-nia contd.Objectives Final Indicators Intermediate Indicators
3. Achieving and sustaining a conducive development environmentA. Macroeconomic - Inflation rate - Fiscal balance
stability - Gross official international reserves
- Exchange rate
- Current account balance
B. Governance - Number of budgetary votes -Rolled out integrated financial management
managed through IFMs information system (IFM) to all ministries and
- Expenditure commitments sub treasuries
and arrears recorded - Developed and approved specific anti-corruption
through IFMs action plans for the ministries of agriculture and
- Spread and magnitude of cooperatives, education and culture, health, and
corruption water; and the CSD based on the national anti-
- Integrity and transparency in corruption strategy
the accounting system - Developed and approved performance
- A governance system that us improvement modules for priority sectors
efficiently and effectively - Timely prepared budgets at all levels.
decentralized - Institutional pluralism in the delivery of public
- Strengthened professional services
and cost effectiveness of the
public service system.
- Improved public service
capacity, motivation and
performance
- Improved budget
management at central and
lower levels
Source: Prennushi, G., G. Rubio and K. Subbarao, “Monitoring and Evaluation: Tech-
nical Notes” in Jeni Klugman, (ed.), 2001, A Sourcebook for Poverty Reduction Strate-gies, Washington, D.C.

237
Tab
le E
8: I
ndic
ator
s in
the
fin
al r
ecom
men
ded
ques
tionn
aire
Hum
an re
sour
ces
Dw
ellin
gsFo
od s
ecur
ity a
nd v
ulne
rabi
lity
Asse
tsO
ther
s
Age
and
sex
ofN
umbe
r of
roo
ms
Num
ber
of m
eals
serv
ed in
last
Area
and
valu
e of
Non
-clie
nt's
adul
t ho
useh
old
Type
of
roof
ing
two
days
land
owne
das
sess
men
t of
mem
bers
Type
of
exte
rior
Serv
ing
frequ
ency
(we
ekly)
of
Num
ber
and
valu
epo
verty
out
- L
evel
ofw
alls
thre
e lu
xury
foo
dsof
sele
cted
reac
h of
MFI
educ
atio
nliv
esto
ck r
esou
rces
of a
dult
hous
ehol
d T
ype
of f
loor
ing
Ser
ving
fre
quen
cy (w
eekl
y) o
fm
embe
rs O
bser
ved
struc
tura
lone
infe
rior
food
Valu
e of
tran
spo-
Occ
upat
ion
ofco
nditi
on o
f H
unge
r ep
isode
s in
last
one
rtatio
n re
lated
adul
t ho
useh
old
dwel
ling
Hun
ger
episo
des
in la
st tw
elve
asse
tsm
embe
rs T
ype
of e
lectri
cM
onth
s V
alue
of e
lectri
c N
umbe
r of
conn
ectio
n F
requ
ency
of
purc
hase
of
stapl
eap
plian
ces
Child
ren
belo
w T
ype
of c
ooki
nggo
ods
15 y
ears
of a
gefu
el us
ed S
ize o
f sto
ck o
f loc
al sta
ple
inin
the
hous
ehol
dSo
urce
of
drin
king
dwel
ling
Ann
ual c
loth
ing/
wat
erfo
otw
ear
Type
of
latrin
eex
pend
iture
for
all h
ouse
hold
mem
bers
Sour
ce:
Zel
ler,
M.,
M.
Shar
ma,
C.
Hen
ery
and
C.
Lap
enu,
200
1, “
An
oper
atio
nal
tool
for
eva
luat
ing
pove
rty
outr
each
of
deve
lopm
ent
polic
ies
and
proj
ects
”, I
FP
RI
Disc
ussio
n Pa
per
No.
111,
Was
hing
ton,
D.C
.: IF
PR
I.
APPENDICES

238
POVERTY MEASUREMENT: Meanings, Methods and Requirements
List E3: Indicators selected to represent the poverty indexHuman resources1. Maximum level of education in household2. Percent of adults who are wage labourers3. Education level of household head4. Percent of literate adults in household
Dwelling1. Value of dwelling2. Roof made of permanent material3. Walls made of permanent material4. Quality of flooring material5. Electric connection6. Source of cooking fuel7. Latrines in the household8. Number of rooms per person9. Access to water10. Structure of house
Assets1. Irrigated land owned2. Number of TV's3. Number of radios4. Number of fans5. Number of VCR's6. Value of radio7. Value of electronic devises8. Value of vehicles9. Value of assets per person/adult

239
Food security and vulnerability1. Number of meals served in the last two days2. Episodes of hunger during the last 30 days3. Episodes of hunger during the last 12 months4. Number of days with luxury food 15. Number of days with luxury food 26. Number of days with inferior food7. Frequency of purchase of basic good8. Food stock in house9. Use of cooking oil
Miscellaneous indicator1. Per person expenditure on clothingSource: Zeller, M., M. Sharma, C. Henery and C. Lapenu, 2001
APPENDICES

240
POVERTY MEASUREMENT: Meanings, Methods and Requirements
Appendix F : Some well-known composite indicesThe UNDP’s IndicesAlthough the capability poverty measure (CPM) introduced in UNDP(1996) and the Human Poverty Index (HPI) introduced in UNDP 1997are the only measures that specifically include the word poverty intheir title, even the UNDP’s well established Human DevelopmentIndex (HDI) may be considered a poverty index, focusing as it does onhealth and education, two very important dimensions in which depri-vation must be considered poverty.132,133
The HDI is constructed by taking indicators of achievement in thesethree dimensions: life expectancy at birth, adult literacy rate, gross en-rolment ratio (both indicators of achievement in knowledge) and GDPper capita (at adjusted US$ PPP rates), converting them into indicesthat convey information about the relative position of a country (rela-tive to the minimum and maximum) and combining them togetherusing equal weights. Anand and Sen (2000) explain that GDP is beingused in the HDI as a proxy for all the other variables that go into ameasure of human development. Education and health are explicitlyincluded because studies have shown that income is not a very goodproxy for achievement in these dimensions.
The HPI-1 (calculated for developing countries) uses indicators ofdeprivation in the same three dimensions as the HDI: probability atbirth of not surviving to age 40, adult illiteracy rate and two (non-income) indicators of not being able to achieve a decent standard ofliving (percentage of population not using improved water sources, andpercent of children under five who are underweight).
The HPI-2 (calculated for developed countries) uses indicators ofdeprivation in these dimensions as well as an indicator of social exclu-sion. The indicator of deprivation in longevity is the probability at
132 The HDI was introduced in 1990 by Mahbub ul Haq, amidst much criticism (including fromAmartya Sen and Ravi Kanbur, among others) that the conceptual foundations for it were weak.Haq’s response was that the HDI would raise issues of health and education on par with incomein a way that no other measure could, and Sen, and Kanbur have acknowledge that he was right(Kanbur 2002).133 In fact, in the explanation of their derivation in technical note 1 (UNDP 2001) the dimen-sions portrayed in the HDI and the HPI-1 are the same: a long and healthy life, knowledge anda decent standard of living.

241
birth of not surviving to age 60 (reflecting a relatively higher overallachievement in longevity in these countries). Deprivation in knowl-edge is measured by the percentage of adults lacking functional literacyskills, and deprivation in a decent standard of living is measured by thepercentage of people living below the poverty line. The long-term un-employment rate is used as an indicator of social deprivation.
Each component used in the HPIs is either a headcount index or anaverage of headcount indices (Qizilbash 2003), and each term is a “short-fall” so that the overall index is the shortfall in terms of each compo-nent, for n dimensions (3 in the case of HPI-1, 4 in the case of HPI-2).
Equation 4
The weighting rule developed for the Human Poverty Index by Anandand Sen (1997) is to use the formulae given in Equation 4 which differsfrom an unweighted average when ? is not equal to one. The larger is ?,the greater the weight given to the dimension in which there is mostdeprivation. As ? increases, the relative impact of the dimension withthe most deprivation rises very fast. α=3 is chosen because it gives anelasticity of ½, and the relative impact is not unreasonably large. Anandand Sen (1997) admit that there is an “inescapable arbitrariness” in thechoice of ?, and that the best way to deal with this issue is to explainclearly what is being assumed, so that public criticism of this assump-tion is possible.
While the annual Human Development Reports calculate HPIs atthe national level, there is nothing intrinsic in the measure that pre-vents it from being calculated at the sub-national level. In fact, many ofthe National Human Development Reports (NHDRs) that have beenpublished since the late 1990s report these measures at the sub-nationallevel.134 NHDRs also develop their own versions of the HPI, selectingindicators that are best suited to the country.
134 Including the National Human Development Report 1998 for Sri Lanka.
APPENDICES

242
POVERTY MEASUREMENT: Meanings, Methods and Requirements
IFAD’s composite indicesThe International Fund for Agricultural Development (IFAD) calcu-lates five composite indicators: (1) the Food Security Index (FSI) whichfocuses on food production and consumption (2) the integrated pov-erty index (IPI) which is a composite of the headcount ratio, the pov-erty gap and poverty severity and the rate of growth of GNP per capita(3) the basic needs index (BNI) which is a composite of adult literacyand primary school enrolment, population per doctor, infant mortal-ity rate, access to health care, safe water and sanitation, (4) the women’sstatus index (WSI) which is made up of the maternal mortality rate, thepercentage of birth age women using contraception, the adult literacyof females, the female gross primary and secondary enrolments, maleand female wage ratios in agriculture and male and female ratio of labourforce participation, and finally the (5) relative welfare index (RWI) whichis a composite of FSI, IPI and BNI (Sumner 2003).
WHO Quality of Life indicesThe World Health Organization’s (WHO) indicators consider six “qual-ity of life” domains: physical, psychological, independence, social rela-tionships, environment and spiritual. The data for these are collectedin a survey instrument (QOL100 or QOLBREF) where respondentsrate their perceptions of their quality of life on a scale from 1 to 5(WHO 1995, 1999 cited in Sumner 2003).
Unsatisfied basic needsMany Latin American countries have used what is known as Unsatis-fied Basic Needs indices (COPLAMAR 1983, Boltvinik 1997) or theconverse, an Index of Fulfilment of Basic Needs (see Navajas et al. 2000)which comprises about 10 indicators capturing housing quality, accessto public services, education, and access to formal and informal healthservices. The weights are determined by a form of consultative process amongnational poverty experts and policy analysts.
One example is the index produced by FONCODES (the PeruvianSocial Fund) which is used to target its projects. It is based on eightindicators—infant mortality, chronic malnutrition, illiteracy, school-aged children not in school, overcrowded housing, inadequate roofing,

243
and the proportion of the population without access to water, sewer-age, and electricity. Each indicator was standardized by dividing by itsminimum value, chronic malnutrition was multiplied by seven and thenall indicators were aggregated. This had the unintended consequencethat the greatest weight was given to those indicators with the greatestvariance (Schady 2002).
Deprivation indices and subjective deprivation scalesFirst introduced by Townsend (1979) the index measures a household’scapacity to participate in a wide range of customary social activities.Townsend demonstrated that as family income diminished, so did so-cial participation.
The subjective deprivation scale consists of a list of items reflectingpeople’s living conditions. The extent of deprivation is calculated as aweighted sum of the score on each item that the individual considersabsolutely necessary to have. If an item is lacked, it adds one to thedeprivation score, if it is possessed, it subtracts one from the depriva-tion score (weighted by the extent to which the item is possessed orlacked by a reference group). The subjective deprivation poverty line isfound by asking the so-called life-resources evaluation question (Dirvenet al. 1998) which asks households to give a self-assessment of theirsituation from very poor (a score of 1) to very rich (score of 10). Thepoverty line is considered to be 5.5.
APPENDICES

244
POVERTY MEASUREMENT: Meanings, Methods and Requirements
Appendix G: Selected research using proxy measures of economicwelfareAuthor (s) Title Data Source Proxy measure of economic welfare
A.Razzaque, 'Sustained effects of Matlab Additive index of durables, including
N. Alum, L.Wai and the 1974-75 famine Demographic and quilts, hurricane lamps, radio, watchesA. Foster (1990) on infant and child Surveillance System and the receipt of cash remittances.
mortality in a rural
area of Bangladesh',
Population Studies,
44 (1): 145-54
M. Brockerhoff (1990) 'Rural to urban Senegal DHS 1986 Type of toilet facilities and source ofmigration and child drinking water (model also included
survival in Senegal', region, mother's marital status and
Demography, occupation, and spouses occupation).
27(4): 601-16
J. Knodel and 'Family size and Thailand DHS 1987 Wealth index derived from types of
M. Wongsith (1991) children's education vehicles owned, flooring, and toiletin Thailand: evidence facility.
from a national
sample' Demography,
28(1): 119-31
G.Guo and 'Child mortality Demographic and Owns car or TV (model also included
L.Grunmmer- among twins is less Health Surveys urban/rural residence, mother's andStrawn (1993) developed countries', for 26 countries spouse's education, husband's
Population Studies, occupation (agricultural or manual).
47(3): 495-510
K.Bollen, 'Binary outcomes
D. Guilkey and and endogenous
T.Morz (1995) explanatory variables:tests and solutions
with an application to
the demand for
contraceptive use in

245
Appendix G: Selected research using proxy measures of economicwelfare contd.Author (s) Title Data Source Proxy measure of economic welfare
Tunisia', Tunisia DHS 1988 Sum of household assets.
Demography, 'The impact of women's literacy on
32(1): 111-31 child health and it's interaction with
P.Sandiford, access to health Enters number of socio-economic
J.Cassel, services', Population variables separately.
M.Montenegro Studies, 49:5-17
and G.Sanchez
(1995)
I.Speizer (1995) 'A marriage Cameroon DHS Index containing type of flooring,
trichotomy and its 1991 ownership of durables (radio, bicycle,
applications', TV, motorcycle, car, stove, refrigerator),
Demography, access to electricity.
32(4): 533-42
E. Jensen (1996) 'The fertility impact Indonesia DHS Index of ownership of durables and
of alternative family 1991 quality of housing with equal
planning distribution weighting.
channels in
Indonesia',
Demography,
33(2): 153-65
P.Muhuri (1996) 'Estimating Matlab Whether the household owns at least
seasonality effects Demographic and one of five durable goods or receives
on child mortality in Surveillance System remittances.
Bangladesh',
Demography,
33(1): 98-110
APPENDICES

246
POVERTY MEASUREMENT: Meanings, Methods and Requirements
Appendix G: Selected research using proxy measures of economicwelfare contd.Author (s) Title Data Source Proxy measure of economic welfare
D.Guiley and 'Fertility transition in Zimbabwe DHS Sum of the number of consumer
S.Jayne (1997) Zimbabwe: durables as well as indicator variables
determinants of for land ownership, good drinking
contraceptive use and water and good sanitation facilities.
method choice',
Population Studies,
51(2): 173-90
D.Filmer and 'The effect of DHS surveys from Index from (1) a set of six dummy
l.Pritchett (1999) household wealth on the 1990's for 35 variables, each of which is equal to one
educational countries if a member owns a radio, television,
attainment: evidence refrigerator, bicycle, motorcycle, or car
from 35 countries', (2) a set of three dummy variables,
Population and one of which is equal to one if the
Development household’s drinking water is from a
Review, 25 piped source, a well or surface source,
(1, March): 85-120 or another source (3) a set of three
dummy variables one of which is equal
to one if the household has a flush
toilet, a pit toilet latrine, or no/other
toilet facilities (4) a dummy variable
equal to one if the house has electricity
(5) the number of rooms for sleeping
in the dwelling (6) a dummy variable
equal to one if the dwelling’s floors are
made of finished materials such as
cement. Weights are derived using
principal component analysis

247
Appendix G: Selected research using proxy measures of economicwelfare contd.Author (s) Title Data Source Proxy measure of economic welfare
D.Sahn and 'Poverty comparisons DHS data for 12 Asset index using (1) Household
D. Stifel (2000) over and across African countries durables consisting ownership of a
countries in Africa', radio, TV, refrigerator, bicycle, and
World Development, motorized transport, and (2)
28 (12): 2123-55 household characteristics including
source of drinking water (piped or
surface water relative to well water),
toilet facilities (flush or no facilities
relative to pit or latrine facilities), and
floor material (low quality relative to
high quality) and (3) years of education
of household head. Weights derived
using factor analysis.
M.Montogomery, 'Measuring LSMS from five Uses a series of separate indicator
M.Gragnolati, living standards with countries (Ghana, variables for durable goods (radio, TV,
K.Burke and proxy variables', Jamaica, Pakistan, refrigerator, bicycle, motorcycle, car)
E.Paredes (2000) Demography, Peru and Tanzania) and housing quality (access to clean
37(2): 155-74 water and electricity, type of toilet and
flooring).
K.Bollen, 'Economic status LSMS from Compares two alternative measures:
J.Glanville and proxies in studies of Ghana and Peru principal component score of various
G.Stecklov (2001) fertility in developing consumer durable goods; index
countries: does the constructed by summing ownership
measure matter?' of same set of goods.
MEASURE
Evaluation Working
Paper, No.0138
Source: Jane Falkingham and Ceema Namazie (2002), “Measuring health and poverty:
a review of approaches to identifying the poor”, HSRC, London.
APPENDICES

248
POVERTY MEASUREMENT: Meanings, Methods and Requirements
Ap
pen
dix
H:
Dat
a so
urc
es
Fig
ure
H1:
Th
e St
atit
ical
Pro
cess

249
Fig
ure
H2:
Dat
a co
llect
ion
met
hod
s fo
r p
over
ty a
sses
smen
ts
Sour
ce:
Lok
Des
salli
en 1
996
APPENDICES

250
POVERTY MEASUREMENT: Meanings, Methods and Requirements
Tab
le H
1:D
ata
typ
es a
nd
age
nci
esD
ata
Age
ncy
Sour
ceFr
eque
ncy
Nat
iona
l-lev
el da
taCe
ntra
l sta
tistic
al ag
ency
Syste
m o
f na
tiona
l acc
ount
s,M
onth
ly o
r qu
arte
rly w
here
Nat
iona
l acc
ount
s: G
DP,
trade
sta
tistic
spo
ssib
le-tra
de s
tatis
tics,
for
cons
umpt
ion,
inve
stm
ent,
exam
ple;
at le
ast
year
lyex
ports
, im
ports
, and
so
onPu
blic
finan
ce d
ata:
reve
nues
,M
inist
ry o
f fin
ance
, cen
tral
Budg
ets
and
actu
alsM
onth
ly o
r qu
arte
rly w
here
spen
ding
by
cate
gory
statis
tical
agen
cy, s
ecto
ral
poss
ible-
trade
sta
tistic
s, fo
rm
inist
ries
exam
ple;
at le
ast
year
lyCo
nsum
er a
nd p
rodu
cer
price
sCe
ntra
l sta
tistic
al ag
ency
,Pr
ice s
urve
ysM
onth
ly; C
PI b
aske
t up
date
d at
cent
ral b
ank
least
ever
y fiv
e ye
ars
Loca
l-lev
el d
ata
Cons
umer
and
pro
duce
r pr
ices,
Cent
ral s
tatis
tical
agen
cy, c
entra
lPr
ice s
urve
ys, s
yste
ms
ofM
onth
ly; C
PI b
aske
t up
date
d at
clim
atic
data
, nat
iona
l acc
ount
sba
nkna
tiona
l acc
ount
slea
st ev
ery
five
year
sat
reg
iona
l lev
elAv
ailab
ility
of
serv
ices
Loca
l adm
inist
ratio
n, s
ecto
ral
Mul
ti-to
pic
hous
ehol
d su
rvey
s;Y
early
min
istrie
squ
alita
tive
stud
iesU
se o
f se
rvice
sLo
cal s
ervi
ce p
rovi
ders
Rapi
d m
onito
ring
and
Yea
rlysa
tisfa
ctio
n su
rvey
sIn
divi
dual
and
hou
seho
ld-
leve
l dat
aH
ouse
hold
con
sum
ptio
n an
dCe
ntra
l sta
tistic
al ag
ency
, Min
istry
Hou
seho
ld b
udge
t ex
pend
iture
,Ev
ery
thre
e to
fiv
e ye
ars
inco
me;
livin
g co
nditi
ons,
socia
lof
labo
r/em
ploy
men
tin
com
e su
rvey
s, m
ulti-
topi
cin
dica
tors
hous
ehol
d su
rvey
s, de
mog
raph
ican
d he
alth
surv
eys

251
Tab
le H
1:D
ata
typ
es a
nd
age
nci
es c
ontd
.D
ata
Age
ncy
Sour
ceFr
eque
ncy
Popu
latio
n sta
tistic
s, ac
cess
toCe
ntra
l sta
tistic
al ag
ency
Popu
latio
n ce
nsus
Ever
y fiv
e to
ten
year
sse
rvice
s-no
con
sum
ptio
n or
inco
me;
lite
racy
Hou
seho
ld li
ving
sta
ndar
ds-n
oCe
ntra
l sta
tistic
al ag
ency
,Ra
pid
mon
itorin
g an
dY
early
deta
iled
cons
umpt
ion
or in
com
e;M
inist
ry o
f lab
or/e
mpl
oym
ent,
satis
fact
ion
surv
eys,
illne
ss p
atte
rns,
maln
utrit
ion,
othe
rsde
mog
raph
ic an
d he
alth
educ
atio
n pr
ofile
surv
eys
Hou
seho
ld p
riorit
ies, p
erce
ptio
nsCe
ntra
l sta
tistic
al ag
ency
, sec
tora
lQ
ualit
ativ
e st
udies
; rap
idEv
ery
one
to th
ree
year
sof
well
-bein
g, us
er s
atisf
actio
n m
inist
ries,
othe
rsm
onito
ring
surv
eys
Sour
ce:
Cou
doue
l, H
ents
chel
and
Wod
on,
"Wel
l-be
ing
mea
sure
men
t an
d an
alys
is"
cite
d in
Jen
i K
lugm
an,
(ed.
),
2001
A s
ourc
eboo
k of
pov
erty
red
uctio
n str
ateg
ies,
Was
hing
ton
D.C
APPENDICES

252
POVERTY MEASUREMENT: Meanings, Methods and Requirements
Tab
le H
2: I
nco
me
pov
erty
: d
ata
avai
lab
ility
an
d a
nal
yses
too
lsC
ase
Dat
a A
vaila
bilit
yIn
com
e-Po
vert
y M
easu
rem
ent (
IPM
)A
naly
tical
Too
ls
1)N
o su
rvey
s (m
ulti-
orIP
M n
ot p
ossib
le-
Geo
grap
hic
map
s: ac
cess
to s
ervi
ces,
hous
ing
defic
it, li
tera
cy,
singl
e to
pic)
exi
sts. O
nly
GD
P pe
r ca
pita
but
not
inco
me
pove
rtyce
nsus
data
or
-G
eogr
aphi
cal i
ncid
ence
: spe
ndin
g or
enr
olm
ent i
n re
latio
n to
adm
inist
rativ
e da
taac
cess
map
sav
aila
ble
2)O
ne r
ound
of
rapi
dIP
M n
ot p
ossib
le. W
ealth
inde
x ca
nBy
wea
lth q
uint
ile:
mon
itorin
g su
rvey
s ex
istbe
calc
ulat
ed a
s pr
oxy
for
inco
me
-G
eogr
aphi
c m
aps
(dep
ends
on
size
of s
urve
y) u
sing
poor
est
(CW
IQ),
prio
rity
surv
ey(b
ut n
o ab
solu
te li
ne a
pplie
d).
20%
or
40%
of
wealt
h in
dica
tor
-Ri
sk o
f be
ing
in b
otto
m 2
0% o
f we
alth
quin
tile
(by
grou
p,ch
arac
teris
tics)
-Pr
ofile
of
wealt
h re
latio
nshi
ps w
ith e
duca
tion,
enr
olm
ent,
acce
ssan
d sa
tisfa
ctio
n wi
th s
ervi
ces,
basic
ser
vice
acc
ess,
basic
labo
rm
arke
t st
atist
ics-
Incid
ence
ana
lysis
(dist
ribut
ion
of h
ealth
, edu
catio
n, s
pecif
icpr
ogra
m s
pend
ing
by a
rea
and
wealt
h qu
intil
e)3)
One
cro
ss-se
ctio
nIP
M n
ot p
ossib
le. W
ealth
inde
x ca
nBy
wea
lth q
uint
ile:
dem
ogra
phic
and
healt
hbe
calc
ulat
ed a
s pr
oxy
for
inco
me
-G
eogr
aphi
c m
aps
(dep
ends
on
the
size
of s
urve
y) u
sing
wealt
hsu
rvey
(but
no
abso
lute
line
app
lied)
.in
dica
tor
(20%
or
40%
poo
rest)
-Ri
sk o
f be
ing
botto
m 2
0% w
ealth
qui
ntile
(by
grou
p,ch
arac
teris
tics)
-Pr
ofile
of
wealt
h re
latio
nshi
p by
qui
ntile
with
edu
catio
n,en
rolm
ent,
healt
h ou
tcom
e in
dica
tors
, bas
ic se
rvice
s ac
cess
, bas
iclab
or m
arke
t sta
tistic
s-
Incid
ence
ana
lysis(
distr
ibut
ion
of h
ealth
, edu
catio
n, s
pecif
icpr
ogra
m s
pend
ing
by a
rea
and
wealt
h qu
intil
e

253
Tab
le H
2: I
nco
me
pov
erty
: d
ata
avai
lab
ility
an
d a
nal
yses
too
ls c
ontd
.C
ase
Dat
a A
vaila
bilit
yIn
com
e-Po
vert
y M
easu
rem
ent (
IPM
)A
naly
tical
Too
ls
4)Re
peat
ed c
ross
-sec
tion
IPM
not
pos
sible.
Wea
lth in
dex
can
beAs
abo
ve p
lus:
dem
ogra
phic
and
healt
hca
lculat
ed a
s pr
oxy
for
inco
me
(but
no
-Ch
ange
in r
isks,
prof
ile, i
ncid
ence
(by
wea
lth q
uint
ile)
surv
eyab
solu
te li
ne a
pplie
d).
5)O
ne c
ross
-sec
tion
with
IPM
pos
sible-
one
time
perio
dBy
poo
r/no
n-po
or g
roup
s or
by
usin
g in
com
e va
riabl
e:sin
gle-
topi
c su
rvey
(wi
th-
Geo
grap
hic
map
s (d
epen
ds o
n siz
e of
sur
vey)
inco
me/
cons
umpt
ion
-Pr
ofile
(lim
ited)
of
pove
rty g
roup
and
qui
ntile
to la
bor
mar
ket,
varia
ble)
educ
atio
n-
Risk
ana
lysis
-In
ciden
ce (
limite
d)-
Stat
istic
deco
mpo
sitio
n-
corr
elate
s (li
mite
d)6)
Repe
ated
cro
ss-s
ectio
nIP
M p
ossib
le-se
vera
l tim
e pe
riods
As a
bove
plu
s:wi
th s
ingl
e-to
pic
surv
ey-
Dyn
amic
deco
mpo
sitio
n an
alysis
(in
equa
lity
and
grow
th)
(with
inco
me/
-Ri
sk, p
rofil
e, co
rrelat
es, i
ncid
ence
, welf
are
chan
ges
over
tim
eco
nsum
ptio
n va
riabl
e)(li
mite
d)7)
One
cro
ss-se
ctio
n of
IPM
pos
sible-
one
time
perio
dBy
poo
r/no
n-po
or g
roup
s or
by
usin
g in
com
e va
riabl
e:m
ulti-
topi
c su
rvey
-G
eogr
aphi
c m
aps
(dep
ends
on
size
of s
urve
y)-
Prof
ile-
Risk
ana
lysis
-Co
rrel
ates
-St
atic
deco
mpo
sitio
n (in
equa
lity)
-In
ciden
ce
APPENDICES

254
POVERTY MEASUREMENT: Meanings, Methods and Requirements
Tab
le H
2: I
nco
me
pov
erty
: d
ata
avai
lab
ility
an
d a
nal
yses
too
ls c
ontd
.C
ase
Dat
a A
vaila
bilit
yIn
com
e-Po
vert
y M
easu
rem
ent (
IPM
)A
naly
tical
Too
ls
8)Re
peat
ed c
ross
-sec
tion
IPM
pos
sible-
seve
ral t
ime
perio
dsAs
abo
ve p
lus:
of m
ulti
topi
c su
rvey
-D
ynam
ic de
com
posit
ion
of p
over
ty c
hang
es-
Repe
ated
cro
ss-s
ectio
n re
gres
sion
-M
ap, p
rofil
e, ris
k, in
ciden
ce, w
elfar
e ch
ange
s in
tim
e9)
Repe
ated
mul
ti-to
pic
IPM
pos
sible-
seve
ral t
ime
perio
dsAs
cas
e 7)
plu
s cas
e 8)
plu
s:su
rvey
with
pan
el-
Pane
l gro
wth
regr
essio
ns (
dete
rmin
ants)
com
pone
nt-
Mob
ility
vul
nera
bilit
y an
alyse
s, en
try/e
xit
mod
elin
g, d
urat
ion
anal
ysis
Sour
ce:
Cou
doue
l, H
ents
chel
and
Wod
on (
2001
)

255
Examples of poverty monitoring systemsUganda:The monitoring strategy of the Poverty Eradication Action Plan (PEAP)is designed for two main purposes. First, it is essential to monitorprogress in order to continually inform key agents involved in the pro-cess. Encouraging a two-way flow of information between beneficia-ries, service providers, and policy makers is an essential component ofthe PEAP. In this way, the design and implementation strategies can becontinually modified to build on what works, and to avoid repeatingmistakes. Second, the monitoring strategy will help to build account-ability. Where targets are set, the Government will expect to accountfor its successes or failures in achieving them, though it is understoodthat these successes and failure sometimes depend on factors outsideGovernment’s control.
Poverty monitoring involves a large number of institutions includ-ing the Poverty Monitoring Unit, the Uganda Bureau of Statistics, andthe Uganda Participatory Poverty Assessment Project.
Five aspects of the system are worth noting.Household surveys are being used to prepare high-quality estimatesof trends in poverty and the published reports provide much usefulinformation.Participatory work has shed light on numerous aspects of povertyin Uganda and has immediately influenced budgetary allocationson water supply and the priority given to improving security.There is a need to develop indicators for performance in all sectors.This is being done by sectoral ministries, and the Poverty Monitor-ing Unit has also developed a list of indicators in cooperation withthe districts.The institutional provision for monitoring the PEAP is found inthe preparation of the Poverty Status Report. It synthesizes informa-tion on recent poverty trends, and makes recommendations on thepoverty eradication strategy, to be incorporated in future PEAPrevisions. The PEAP will also be revised every two years.
APPENDICES

256
POVERTY MEASUREMENT: Meanings, Methods and Requirements
Finally, there is a proposal for a Geographical Information Systemwhich would link existing sources of data and allow the spatial dis-tribution of poverty to be studied in more detail.
Monitoring is structured at three main levels.First, the monitoring of PEAP outcomes. This will focus on progress
in reducing income poverty, improving health, raising educationalachievement and enhancing the voice and participation of the poor.Most of the information for such outcome monitoring will be drawnfrom household surveys and repeated exercises under the UPPAP.
Second, the strategy will entail monitoring actions or outputs in-tended to achieve these outcomes. Data sources will include both samplesurveys and data from management information systems.
Third, there will be regular monitoring of the inputs required foraction against poverty. This consists mainly in tracking public expen-ditures on poverty reducing activities.
Tanzania“The Poverty monitoring system coordinates/implements collection,analysis and dissemination of: (a) National and sub-national surveysand the census (b) Routine administrative data provided by local gov-ernment and sector ministries (c) In-depth contextual research.” 135
“Information from the Poverty Monitoring System’s differentbranches are assembled in the Tanzania Socio-economic Database” whichis on the web and available on CD-ROM. An Annual Poverty andHuman Development Report is produced, and this is the annual out-put of the poverty monitoring system.
The overall responsibility lies with a “Poverty Reduction StrategyTechnical Committee” and activities are directed by four small techni-cal working groups, on (a) Surveys and the Census (b) Routine DataSystems (c) Research and Analysis (d) Dissemination, Sensitization andAdvocacy.
135 Booth et al. (1998) distinguish between contextual research which “attempts to capture a socialphenomenon within its social, economic and cultural context” and non-contextual research, isdesigned to “collect information untainted by the peculiarities in which it is collected”.
257
The Vice-President’s Office (VPO) will have the overall responsibil-ity for monitoring the implementation and impact of the poverty re-duction strategy. Monitoring and evaluation (M&E) of the poverty re-duction strategy will require indicators or qualitative assessments pitchedat different levels.
First, M&E will require impact and outcome indicators. Impactindicators will describe progress towards overall poverty eradica-tion objectives, while outcome indicators will refer to results ofinterventions (inputs) directed at poverty reduction. The govern-ment has already coordinated a consultative process to draw up alist of poverty and welfare monitoring indicators (PMI), which con-tains many of the required impact and outcome indicators. Theseindicators have been incorporated into the Tanzania Socio-EconomicDatabase (TSED), which contains a wider set of indicators.Second, proxy indicators will be developed to substitute for impactand outcome indicators that are more difficult to measure, or areavailable only at infrequent intervals.Third, intermediate indicators will be used to provide supplemen-tary information for assessment of progress under the poverty re-duction strategy.Fourth, resource allocation for, and expenditure on, priority pov-erty reduction initiatives will be monitored under the PER andMTEF framework.Fifth, M&E will also seek to assess the extent of participatory in-volvement by the poor, as well as other shareholders, in subsequentrevisions of the PRSP and in the implementation, monitoring andevaluation of related programs and projects.Sixth, M&E, supported by well-targeted research, will assess theimpact on the poor of policies that transcend the immediate agendaof the poverty reduction strategy.
APPENDICES

258
POVERTY MEASUREMENT: Meanings, Methods and Requirements
Seventh, A set of gender-oriented indicators will be developed asan integral part of the M&E.Finally, given financial and technical constraints, the M&E systemwill be limited to “core” strategic indicators that can be used readilyby policy makers and other stakeholders.
Moreover, a special effort will be made to include indicators with atleast two observations during the three-year horizon of the povertyreduction strategy.
Source: Adapted from Achikbache, B., M. Belkindas, M. Dinc, G.Eele and E. Swanson, “Strengthening Statistical Systems for PovertyReduction Strategies: Technical Notes and Case Studies” in JeniKlugman, (ed), 2001. A Sourcebook for Poverty Reduction Strategies, Wash-ington, D.C.
Philippines 136
This is part of the CBMS network of MIMAP-PEP (Poverty and Eco-nomic Policy) ongoing initiative of IDRC, Canada.
The Philippines CBMS identified a core set of 14 “basic needs” indi-cators, some of which are a subset of the MDG target indicators, wherethe list is an abbreviation of previous lists.
Data collection takes place at a disaggregated level (Barangay or vil-lage)
Data uses are expected to be local and national government.Enumerators are chosen from within the village/Barangay.Collected information is disaggregated into functional groups.Data collected is reported to higher geopolitical level, and databanks
136 From Reyes, Celia M. and Lani E. Valencia, “Poverty Monitoring Systems in the Philip-pines”, Paper presented at the Regional Conference of Poverty Monitoring in Asia, Feb 24-27,2003, Sri Lanka.

259
are created and maintained at each geopolitical level.The information generated by existing monitoring systems is uti-
lized as a support indicator system.Linked to the provincial government: they have mandated the use
of the data as a basis for planning, synchronised time frame of planningactivities and allocated 20 percent of development fund of local govern-ment units to CBMS based plans, and used CBMS in their first HDR.
APPENDICES

260
POVERTY MEASUREMENT: Meanings, Methods and Requirements
INDEX
Symbols$1-a-day poverty line 36, 39
Aabsolute deprivation 9, 16, 17, 18, 19, 37, 38,
125, 221 absolute poverty 18, 36, 37, 38, 39, 42, 49, 58,
95, 106, 129, 199, 209, 232absolute poverty line 36, 37, 38, 39, 49, 129achievement 8, 12, 13, 14, 21, 64, 66, 75, 89,
92, 94, 99, 95, 105, 193, 231, 240, 241administrative data 144, 145, 146, 147, 148,
154, 156, 195, 252, 256adult equivalence 32, 33, 129aggregation 2, 27, 61, 62, 71, 72, 73, 75, 90,
92, 93, 96, 99, 100, 104, 108, 112, 145,149, 150, 159, 194
aggregative strategies 71Anand 42, 76, 161, 240, 241asset-based indices 62, 76, 219, 220assets 14, 24, 65, 76, 77, 86, 87, 111, 116, 117,
133, 137, 138, 148, 197, 220, 221, 222, 225,227, 228, 229, 230, 232, 234, 237, 238, 245
Atkinson 9, 21, 28, 29, 31, 36, 39, 63, 162
BBangladesh 3, 38, 135, 161, 174, 185, 187, 190,
191, 199, 244, 245basic needs 8, 9, 38, 41, 44, 46, 62, 65, 69, 153,
199, 242, 258Borda rule 97
Ccaloric intake 39, 40, 228calorie intake 21, 39, 41, 42, 46, 229
capabilities 5, 7, 8, 11, 12, 13, 14, 15, 17, 18,28, 29, 62, 64, 78, 88, 89, 90, 91, 92, 93,95, 97, 109, 128, 129, 167, 183, 184, 193,194, 196, 227, 228, 229, 230, 231
capabilities approach 5, 7, 8, 13, 14, 64, 88,89, 91, 93, 95
capability deprivation 14, 23, 62, 63, 65, 227,228
CBN 44, 199, 200, 202, 203, 204, 205census 58, 113, 131, 132, 133, 140, 141, 148,
149, 150, 151, 154, 155, 156, 157, 160, 171,174, 176, 187, 216, 217, 218, 251, 252, 256
Chambers 10, 14, 24, 68, 110, 111, 166, 179child malnutrition 61, 172child poverty 59, 178, 187China 20, 23, 25, 42, 82, 145, 149, 174, 200Choice choice 13, 27, 28, 29, 31, 34, 35, 36, 38, 39, 52,
55, 61, 62, 63, 64, 66, 69, 71, 75, 89, 90,93, 100, 102, 105, 106, 107, 111, 112, 120,121, 122, 135, 159, 184, 193, 197, 215, 216,220, 221, 241, 246
choice of indicator 27, 29, 39, 61, 69, 90, 100,111, 215, 220, 221
choice of poverty line 35, 61, 93, 106, 112choice of unit 27, 31, 39, 93, 105, 112commodities 12, 13, 14, 15, 16, 17, 30, 59, 88,
89, 184common property resources 14, 15, 59, 197comparison 2, 4, 6, 16, 30, 35, 38, 41, 45, 47,
50, 52, 55, 57, 71, 75, 90, 91, 96, 97, 99,112, 113, 118, 119, 137, 152, 169, 180, 181,183, 187, 192, 193, 194, 195, 196, 202, 214,219, 221, 247
complete ordering 73, 96, 97components 43, 48, 52, 65, 66, 69, 77, 79, 81,
84, 118, 122, 190, 217, 222

261
composite indices 69, 73, 75, 91, 98, 115, 159,219, 240, 242
concept 1, 5, 9, 12, 13, 14, 15, 16, 18, 21, 22,24, 26, 32, 42, 52, 53, 70, 74, 88, 89, 90,100, 102, 103, 106, 108, 109, 122, 125, 128,129, 161, 167, 166, 171, 173, 176, 183,197, 214, 215, 217
conflict 10, 17, 18, 19, 24, 228consensual approach 100, 122, 187consumption 7, 14, 15, 25, 29, 30, 31, 32, 33,
34, 39, 40, 41, 43, 45, 46, 48, 49, 50, 51,53, 54, 55, 57, 59, 60, 62, 67, 74, 81, 82,83, 85, 86, 87, 95, 101, 115, 116, 124, 125,133, 134, 136, 137, 138, 139, 140, 141, 147,148, 153, 165, 168, 172, 173, 180, 181, 183,192, 197, 203, 207, 211, 212, 213, 215, 217,219, 220, 221, 222, 226, 228, 229, 231, 232,242, 250, 251, 253
consumption patterns 32, 34, 40, 41, 45, 46,48, 49, 50, 183, 192, 215, 220
continuity 52, 53Core Welfare Indicators Survey 134Cornell 1, 6, 19, 162, 175, 181Cost-of-basic-needs method 44cost-of-living 45, 48, 121, 140, 214credit 24, 25, 87, 88, 104, 119, 133, 160, 197,
214, 228, 230, 233
Ddata requirements 1, 5, 41, 88, 118, 130, 131,
133, 135, 137, 139, 141, 143, 145, 147, 148,149, 151, 153, 155, 157, 216
data sources 120, 131, 140, 147, 148, 151, 186,248, 256
DCI 21, 39, 41, 46, 199Deaton 28, 29, 30, 31, 32, 34, 48, 92, 138, 165,
168, 220decomposability 52, 108
definition 1, 5, 10, 14, 16, 17, 18, 19, 20, 21,22, 23, 24, 25, 26, 32, 36, 37, 38, 39, 41,42, 82, 100, 107, 125, 128, 146, 153, 155,171, 173, 183, 186, 192, 193, 214, 215, 217,218
Demographic and Health Survey 136, 150,219
deprivation 8, 9, 10, 11, 14, 15, 16, 17, 18, 19,20, 22, 23, 24, 26, 28, 37, 38, 54, 58, 60,62, 63, 65, 76, 82, 84, 86, 93, 94, 95, 97,99, 100, 101, 103, 108, 109, 112, 121, 122,125, 126, 127, 130, 139, 158, 164, 175,176, 180, 183, 184, 221, 227, 228, 240, 241,243
DHS 136, 137, 141, 150, 155, 219, 220, 221,244, 245, 246, 247
direct approach 21direct calorie intake 21, 39, 41distribution 10, 16, 20, 23, 37, 50, 51, 56, 59,
64, 72, 97, 107, 118, 140, 145, 146, 165,169, 175, 176,181, 184, 186, 195, 196, 216,221, 245, 252, 256
dominance approach 50dominance partial ordering 96dynamics 9, 22, 26, 27, 28, 58, 78, 79, 84, 86,
100, 105, 108, 113, 130, 144, 157, 158, 164,165, 167, 169, 172227
Eeconomic 1, 6, 7, 8, 9, 14, 17, 24, 37, 59, 67,
69, 86, 109, 120, 128, 131, 135, 136, 141,148, 154, 155, 160, 162, 163, 164, 165,166, 167, 168, 169, 171, 172, 174, 175, 176,178, 179, 181, 182, 183, 184, 185, 186, 187,193, 200, 202, 204, 216, 219, 221, 222, 228,229, 231, 232, 244, 245, 246, 247, 258
economies of scale 32, 33, 34, 92, 121, 215

262
POVERTY MEASUREMENT: Meanings, Methods and Requirements
education 2, 3, 14, 17, 18, 31, 33, 41, 42, 50,59, 60, 64, 65, 66, 67, 69, 76, 77, 82, 87,92, 96, 98, 101, 104, 111, 116, 117, 133,134, 136, 137, 138, 139, 141, 142, 145,146, 147, 148, 176, 195, 197, 206, 212, 223,226, 227, 228, 230, 231, 235, 236, 237, 238,240, 242, 244, 247, 251, 252, 253
employment 9, 68, 86, 102, 104, 111, 116,133, 137, 139, 141, 142, 152, 169, 170, 190,226, 230, 231, 233, 250, 251
empowerment 1, 14, 66, 67, 88, 111, 119, 130,158, 196
ends 117, 122, 123, 125, 126, 167, 229, 230entitlements 35, 36environment 12, 17, 64, 66, 67, 89, 92, 120,
166, 179, 184, 197, 211, 228, 230, 236, 242equity 56, 163equivalence scales 33, 34, 37, 121, 122, 129,
165, 215, 218Europe 9, 39, 163European Community 9, 151, 176European Union 9, 37, 63, 170, 210Eurostat 29, 151, 170evaluation 2, 4, 5, 63, 88, 90, 91, 142, 166,
171, 196, 204, 215, 217, 233, 236, 243, 247,257
exclusion 5, 8, 9, 10, 13, 15, 17, 18, 21, 22, 28,62, 65, 69, 85, 99, 100, 101, 102, 103, 104,105, 106, 107, 108, 109, 110, 116, 121, 126,127, 128, 130, 158, 161, 163, 164, 165, 166,170, 171, 172, 173, 175, 176, 178, 180, 182,183, 192, 193, 194, 195, 196, 221, 223, 224,226, 240
exit rate 79expenditure 29, 30, 31, 32, 34, 35, 36, 38, 39,
40, 41, 42, 43, 44, 45, 46, 48, 49, 50, 51,60, 64, 72, 114, 115, 116, 117, 124, 125,133, 136, 137, 138, 139, 140, 147, 153, 154,155, 170, 183, 184, 192, 194, 199, 200, 202,203, 207, 208, 210, 211, 215, 217, 218, 219,220, 222, 229, 231, 232, 236, 237, 239, 250,256, 257
Ffactor analysis 77, 93, 126, 159, 247Famine Early Warning System 151FEI 46, 47, 199, 200FEWS 151FGT measures 28, 56, 147FIVIMS 151food 18, 25, 33, 39, 40, 41, 42, 43, 44, 45, 46,
47, 49, 50, 65, 67, 68, 69, 83, 86, 87, 111,116, 117, 119, 124, 126, 132, 134, 135, 136,137, 139, 140, 141, 148, 151, 152, 160, 161,167, 181, 183, 192, 197, 198, 199, 200, 206,210, 211, 213, 214, 215, 221, 227, 228, 229,231, 232, 233, 234, 237, 239, 242
food energy intake method 46food poverty line 39, 40, 41, 42, 43, 211food share 42Foster 20, 28, 52, 54, 55, 56, 91, 92, 171, 196,
244France 9, 170, 183freedom 7, 66, 89, 93, 185functionings 8, 12, 13, 18, 59, 89, 90, 91, 92,
93, 94, 95, 96, 99, 100, 104, 106, 170, 196fuzzy set 70, 71, 94, 99, 159, 166, 178
Ggender 2, 3, 33, 59, 64, 91, 105, 143, 144, 165,
174, 190, 197, 198, 225, 227, 228, 235, 258gender bias 91Geographical Information Systems 150, 157geographical targeting 119, 163geography 105, 149, 152, 188gini coefficient 54, 55, 232GIS 148, 149, 150, 151, 173globalisation 9, 163, 182growth 60, 61, 139, 163, 171, 172, 181, 187,
196, 233, 234, 242, 253, 254

263
Hheadcount index 53, 54, 55, 56, 190, 191, 241health 3, 14, 17, 18, 30, 31, 41, 42, 50, 59, 60,
64, 65, 66, 67, 72, 74, 82, 86, 87, 91, 96,98, 100, 102, 104, 117, 118, 120, 124, 133,134, 136, 137, 141, 142, 143, 145, 146, 148,149, 150, 151, 165, 170, 186, 188, 194, 197,206, 208, 210, 211, 213, 215, 219, 221, 225,227, 228, 229, 231, 234, 236, 240, 242, 244,245, 247, 250, 252, 253, 256
HIES 137, 138, 139, 180Household Income and Expenditure Survey
137, 153household survey 7, 30, 40, 41, 44, 50, 60, 85,
113, 116, 133, 138, 141, 142, 147, 148, 250,255, 256
human capital 22, 87, 117, 127, 174, 227human development 8, 75, 91, 101, 108, 161,
186, 240, 241, 256human development index 75, 91, 161, 240Human Development Report 8, 186, 241, 256human poverty index 75, 76, 91, 240, 241
Iidentification 2, 27, 61, 69, 71, 78, 90, 96, 100,
103, 112, 144, 159ill-being 68in-kind benefits 31, 214incentives 120income 3, 7, 9, 11, 12, 14, 16, 17, 20, 21, 22,
23, 25, 29, 30, 31, 32, 34, 36, 37, 38, 39,41, 42, 46, 47, 49, 53, 54, 55, 56, 57, 59,60, 61, 65, 71, 72, 73, 80, 81, 82, 83, 85,86, 87, 88, 90, 91, 92, 95, 97, 100, 101,102, 107, 109, 114, 115, 118, 120, 122, 123,124, 125, 126, 127, 128, 133, 134, 136, 137,139, 140, 141, 142, 147, 153, 154, 159, 160,161, 164, 165, 166, 168, 170, 172, 174, 176,177, 181, 183, 185, 190, 192, 194, 196, 200,203, 204, 205, 206, 208, 209, 210, 211, 214,215, 216, 217, 218, 219, 220, 223, 224, 226,227, 228, 231, 232, 240, 243, 250, 251, 252,253, 254
income-gap ratio 53index 22, 27, 45, 48, 53, 54, 55, 56, 62, 67, 69,
70, 72, 73, 74, 75, 76, 77, 84, 91, 98, 104,107, 113, 117, 150, 161, 168, 185, 190, 191,194, 213, 215, 216, 218, 219, 220, 221, 222,229, 240, 241, 242, 244, 246, 247, 253
India 23, 25, 48, 60, 85, 104, 138, 149, 161,168, 169, 170, 171, 173, 174, 178, 200, 207,221
indicator 2, 13, 18, 27, 29, 31, 32, 39, 41, 46,50, 57, 61, 62, 63, 64, 65, 66, 67, 68, 69,70, 72, 76, 78, 80, 82, 83, 85, 87, 88, 90,91, 92, 93, 94, 99, 100, 104, 107, 108, 110,111, 112, 113, 115, 117, 118, 119, 126, 127,129, 134, 141, 148, 149, 150, 151, 153, 154,158, 159, 162, 164, 169, 170, 173, 175, 176,180, 184, 188, 192, 194, 197, 199, 201, 203,204, 205, 215, 219, 220, 221, 222, 225, 226,227, 228, 229, 230, 231, 232, 233, 234, 235,236, 237, 240, 241, 242, 243, 247, 250, 252,255, 257, 258, 259
indirect approach 21Indonesia 23, 46, 47, 59, 133, 136, 180, 185,
186, 202, 245inequality 1, 11, 16, 20, 21, 26, 29, 32, 53, 54,
56, 59, 108, 118, 120, 137, 160, 162, 163,164, 165, 168, 169, 171, 172, 173, 174, 175,181, 182, 184, 185, 187, 205, 253
infant mortality 118, 228, 242inflation 45, 115, 211, 213, 236information 2, 3, 6, 13, 18, 21, 29, 30, 41, 42,
53, 63, 67, 72, 76, 77, 79, 84, 86, 90, 91,93, 105, 110, 112, 113, 114, 116, 117, 118,119, 120, 122, 126, 131, 132, 133, 134, 136,137, 138, 139, 144, 145, 148, 150, 151, 152,153, 154, 155, 156, 157, 160, 190, 192, 201,213, 217, 220, 230, 236, 240, 255, 256, 257,258
institutions 9, 17, 64, 103, 110, 168, 193, 198,223, 255
intermediate approach 62, 74, 75

264
POVERTY MEASUREMENT: Meanings, Methods and Requirements
international 1, 2, 23, 38, 66, 112, 116, 117,131, 135, 137, 152, 154, 160, 161, 164, 187,202, 242, 236
interpersonal comparisons 90intersection approach 61intra-household inequality 59Ireland 33, 37, 57, 138, 152, 165, 208Italy 165, 167, 169, 170, 171, 177, 180
Jjustice 11, 73, 164
KKanbur 1, 4, 6, 10, 19, 22, 25, 28, 56, 60, 114,
122, 161, 172, 175, 180, 186
Llabour 2, 3, 19, 22, 31, 43, 47, 48, 66, 81, 86,
87, 100, 101, 102, 108, 111, 134, 139, 161,163, 164, 170, 177, 196, 213, 217, 227, 238,242
Labour Force and Employment Survey 139land 25, 60, 65, 66, 68, 87, 104, 133, 140, 178,
220, 225, 227, 228, 229, 230, 233, 237,238, 246
least cost approach 39life expectancy 67, 75, 229, 234, 240Lipton 39, 42, 176literacy 67, 79, 84, 86, 92, 93, 100, 105, 136,
141, 228, 230, 231, 235, 240, 241, 242, 245,251, 252
LSMS surveys 133, 134, 152Luxemburg Income Study 29
Mmalnutrition 16, 17, 61, 67, 79, 83, 84, 118,
119, 135, 172, 183, 231, 242, 243, 251markets 48, 65, 88, 102, 118, 134, 151, 174,
177, 196, 222, 228, 230, 233means 13, 16, 19, 24, 30, 32, 86, 89, 112, 115,
117, 119, 124, 160, 207, 210, 216, 223, 229,230
measurement 1, 2, 3, 4, 5, 6, 7, 8, 9, 10, 11, 13,15, 17, 18, 19, 21, 22, 23, 25, 26, 27, 28,29, 30, 31, 33, 35, 37, 48, 50, 52, 56, 58,61, 64, 70, 71, 72, 75, 78, 79, 84, 88, 90,92, 94, 96, 99, 100, 101, 105, 107, 108,109, 110, 111, 114, 115, 122, 128, 129, 130,131, 132, 133, 137, 138, 139, 141, 142, 143,147, 150, 153, 154, 156, 157, 158, 159, 162,163, 164, 165, 166, 167, 168, 171, 172, 173,175, 176, 177, 181, 182, 184, 185, 186, 187,193, 196, 200, 202, 214, 216, 218, 229, 251,253, 254
measurement error 29, 30, 115Millennium Development Goals 66minimum income question 123monetary approach 5, 7, 19, 22, 26, 28, 57,
59, 61, 69, 72, 92, 96, 101, 120, 130, 158,192, 193, 194, 195, 196
monitoring 2, 3, 4, 5, 35, 36, 57, 58, 67, 110,113, 114, 115, 116, 119, 131, 134, 135, 142,143, 145, 151, 153, 154, 156, 161, 164, 165,168, 172, 174, 172, 180, 199, 223, 224, 227,228, 232, 233, 234, 235, 236, 250, 251, 252,255, 256, 257, 259
monitoring tools 115, 116mortality 17, 56, 61, 67, 93, 101, 118, 141,
175, 219, 227, 228, 229, 231, 234, 242, 244,245
multidimensionality 27, 28, 58, 59, 61, 86, 90,100, 104, 127, 129, 130, 158, 196
NNational Sample Survey 139needs 8, 10, 11, 16, 18, 26, 30, 32, 33, 34, 38,
41, 44, 46, 59, 62, 65, 69, 71, 87, 92, 93,97, 100, 120, 121, 124, 127, 147, 149, 153,155, 156, 157, 159, 169, 196, 199, 200, 202,203, 204, 205, 215, 242, 258
non-food component 39, 43NSS 139, 146, 147, 184, 200, 207nutrition 3, 12, 25, 33, 39, 41, 43, 49, 64, 65,
66, 67, 89, 104, 135, 136, 137, 139, 145,181, 207, 210, 225, 228, 229, 234

265
Oobjective-quantitative 7, 21, 22, 27, 28, 58,
127, 147
PPakistan 80, 152, 160, 163, 177, 247panel data 23, 79, 83, 84, 85, 88, 130, 151,
152, 157, 158, 165PARIS21 66, 154partial ordering 73, 96, 97participation 2, 8, 9, 17, 66, 67, 88, 102, 103,
105, 109, 110, 111, 130, 139, 158, 163, 216,228, 230, 242, 243, 256
participatory appraisals 110participatory approach 3, 5, 10, 14, 15, 18, 19,
21, 28, 109, 110, 111, 112, 113, 121, 129,130, 158, 192, 193, 194, 195, 196
participatory poverty assessments 10, 110,153, 182, 228
participatory wealth ranking 111, 112, 113,121
Perceptions of poverty 121Philippines 153, 171, 202, 203, 209, 210, 258poverty 1, 2, 3, 4, 5, 6, 7, 8, 9, 10, 11, 12, 13,
14, 15, 16, 17, 18, 19, 20, 21, 22, 23, 24,25, 26, 27, 28, 29, 30, 32, 34, 35, 36, 37,38, 39, 40, 41, 42, 43, 44, 45, 46, 47, 48,49, 50, 51, 52, 53, 54, 55, 56, 57, 58, 59,60, 61, 62, 63, 64, 65, 66, 69, 71, 73, 74,75, 78, 79, 80, 81, 82, 83, 84, 85, 86, 89,93, 94, 95, 99, 100, 101, 104, 106, 107,108, 110, 112, 113, 114, 115, 116, 117, 118,119, 120, 121, 122, 123, 125, 127, 129, 130,132, 137, 140, 142, 145, 147, 148, 149, 153,154, 155, 156, 158, 159, 160, 161, 162, 163,164, 165, 166, 167, 168, 169, 170, 171, 172,173, 174, 175, 176, 177, 178, 179, 181, 182,183, 185, 186, 187, 188, 190, 193, 194, 195,197, 199, 200, 201, 202, 203, 204, 205, 206,207, 209, 211, 212, 213, 214, 216, 217, 218,219, 220, 221, 222, 224, 226, 227, 228, 229,231, 232, 234, 238, 240, 242, 243, 252, 254,255, 256, 257, 258
poverty analysis 3, 4, 8, 57, 132, 133, 138,165, 172, 185
poverty comparisons 2, 35, 38, 45, 47, 50, 52,57, 71, 169, 180, 181, 183, 247
poverty gap 53, 54, 55, 228, 229, 231, 242poverty line 2, 3, 7, 13, 16, 18, 19, 20, 21, 22,
23, 27, 32, 34, 35, 36, 37, 38, 39, 40, 41,42, 43, 44, 45, 46, 47, 48, 49, 50, 51, 52,53, 54, 55, 56, 57, 59, 61, 62, 69, 71, 74,80, 81, 82, 84, 85, 91, 92, 93, 100, 106,107, 112, 114, 121, 122, 123, 124, 125, 126,129, 159, 162, 171, 177, 180, 181, 187, 193,199, 200, 201, 202, 203, 204, 205, 206, 207,208, 209, 210, 211, 212213, 216, 218, 220,229, 231, 232, 241, 243
poverty maps 58, 118, 149, 150, 178, 228poverty measure 1, 2, 15, 18, 26, 52, 55, 62,
64, 65, 73, 75, 93, 95, 100, 107, 112, 127,147, 148, 159, 171, 190, 213, 214, 217, 218,219, 240
poverty measurement 1, 2, 4, 18, 26, 27, 28,29, 50, 56, 58, 61, 64, 75, 79, 88, 94, 99,101, 105, 110, 111, 114, 122, 128, 129, 130,131, 132, 139, 141, 142, 143, 147, 153, 156,157, 158, 159, 163, 164, 167, 171, 172, 175,177, 187, 200, 214, 216, 218, 252, 253, 254
poverty profile 2, 3, 34, 35, 50, 57, 83, 147,190, 191, 200
poverty spell 79, 80, 81, 82, 84powerlessness 14, 25, 26, 88, 130, 158, 197,
227, 228price index 45, 48, 84, 213, 215prices 7, 12, 30, 31, 40, 45, 46, 47, 48, 64, 66,
84, 85, 115, 134, 136, 140, 207, 213, 250principal component analysis 77, 93, 246process 3, 5, 8, 9, 10, 14, 22, 23, 31, 40, 76, 78,
86, 114, 131, 145, 146, 151, 159, 161, 163,168, 193, 194, 196, 230, 242, 248, 255, 257
proxy means testing 113, 115, 160public goods 12, 34, 89, 138purchasing power parity poverty line 38

266
POVERTY MEASUREMENT: Meanings, Methods and Requirements
Qqualitative approach 19, 21, 78, 129, 143, 154,
157, 172, 186quality of life 22, 144, 169, 184, 234, 242quantitative approach 18, 21, 27, 28, 58, 78,
79, 129
Rranking 40, 52, 70, 75, 96, 97, 98, 108, 111,
112, 113, 121, 143, 170, 181, 197, 221, 227rapid appraisal 110, 115, 132, 166rapid monitoring surveys 116, 154Ravallion 2, 7, 8, 13, 23, 25, 28, 29, 35, 38, 43,
45, 46, 47, 64, 72, 75, 82, 87, 91, 120, 123,124, 125, 128, 166, 174, 176, 181, 182
relative deprivation 9, 11, 17, 18, 22, 54, 101relative poverty 16, 20, 35, 36, 37, 38, 50, 82,
95, 173, 208, 209relative poverty line 16, 20, 35, 37, 38, 50, 82,
209relativist approach 15rights 9, 29, 65, 100, 104, 161risk 2, 14, 18, 23, 24, 25, 66, 86, 87, 88, 105,
111, 114, 119, 174, 179, 190, 191, 216,218, 227, 252, 253
Romania 38, 180rural 2, 23, 25, 30, 38, 45, 46, 47, 48, 52, 56,
65, 80, 81, 82, 109, 110, 115, 117, 132,144, 148, 152, 160, 163, 169, 171, 174, 177,185, 182, 190, 191, 197, 199, 200, 202, 207,214, 220, 221, 232, 233, 234, 244
Russia 128
Ssecurity 8, 9, 14, 65, 68, 69, 86, 103, 104, 111,
117, 125, 132, 135, 151, 162, 168, 186,187, 207, 228, 232, 233, 237, 239, 242, 255
self-respect 14, 109Sen 7, 11, 12, 13, 15, 16, 17, 19, 20, 21, 23, 28,
31, 52, 53, 54, 76, 87, 88, 91, 92, 109, 125,161, 169, 171, 179, 184, 185, 186, 240, 241
sequential dominance 97small area data 120, 149
social capital 87, 117, 230social exclusion 5, 8, 9, 10, 13, 15, 18, 21, 22,
28, 62, 65, 85, 99, 100, 101, 102, 103, 104,105, 106, 107, 108, 109, 110, 127, 128, 130,158, 161, 163, 164, 165, 166, 170, 171, 173,176, 178, 182, 183, 193, 194, 195, 196, 223,224, 226, 240
social welfare 53, 145, 182South Africa 85, 149, 152, 160, 161, 175Sri Lanka 27, 38, 42, 50, 52, 160, 161, 163,
165, 167, 169, 171, 172, 176, 177, 178, 179,181, 183, 186, 187
subgroup sensitivity 56subjective measures 82, 120subjective poverty line 80, 122, 123, 124, 125subjective well-being 78, 127, 128, 159survey 7, 23, 24, 30, 40, 41, 44, 45, 48, 50, 57,
58, 60, 70, 83, 84, 85, 86, 88, 102, 103,112, 113, 114, 115, 116, 119, 121, 124, 125,126, 128, 131, 132, 133, 134, 135, 137, 138,139, 140, 142, 143, 147, 148, 150, 151, 153,154, 155, 156, 159, 165, 168, 172, 177, 194,195, 199, 200, 204215, 217, 221, 242, 250,251, 252, 253, 256
survey data 40, 44, 57, 60, 85, 115, 138, 148,149, 150, 157, 160, 169, 174, 215
survival 10, 14, 67, 79, 80, 82, 126, 234, 244survival rate 79, 80, 82, 83
TTanzania 234, 235, 236, 247, 256, 257targeting 3, 35, 57, 58, 111, 115, 118, 119, 149,
156, 160, 163, 184Thorbecke 28, 54, 84, 114, 171, 185threshold 2, 3, 16, 18, 19, 27, 35, 38, 46, 61,
69, 70, 71, 73, 74, 75, 93, 94, 95, 99, 106,112, 163, 182, 192, 196, 204, 206, 210, 211,213, 214, 215, 216, 217, 221
transfers 35, 36, 55, 87, 119, 216, 231transient poverty 22, 23, 174transition matrices 80, 81transitory poverty 22, 84

267
UU.S. 9, 19, 20, 29, 36, 37, 41, 50, 171, 178,
183, 187, 213, 216, 218U.S. poverty line 19ultra-poverty 39, 41, 42, 161undernutrition 64, 70, 93, 100, 176, 227UNDP 7, 8, 91, 116, 135, 153, 161, 164, 167,
170, 176, 177, 180, 186, 200, 240unemployment 9, 65, 86, 88, 91, 101, 102,
103, 105, 160, 233, 227, 241unit values 48United Kingdom 185United States 178, 185, 211, 214urban 23, 30, 45, 46, 47, 48, 52, 101, 110, 117,
135, 137, 139, 144, 152, 179, 180, 182, 190,198, 199, 200, 202, 207, 214, 220, 221, 232,233, 244
urban bias 48utility 7, 9, 10, 12, 13, 88, 127, 193
Vvalues 7, 41, 48, 71, 75, 95, 98, 99, 107, 178,
184, 197, 217voicelessness 14, 28, 88, 130, 158, 227, 228vulnerability 11, 14, 24, 25, 26, 28, 69, 66, 81,
85, 86, 87, 88, 111, 130, 132, 148, 151,158, 174, 179, 188, 197, 216, 227, 228, 230,232, 235237, 239, 254
Wweighting 75, 76, 97, 99, 241, 245weights 27, 48, 62, 71, 75, 76, 99, 137, 140,
184, 219, 222, 240, 242, 246welfare function 73, 75, 123well-being 10, 15, 18, 20, 29, 30, 32, 50, 57,
59, 61, 62, 63, 67, 73, 74, 75, 77, 78, 87,88, 89, 90, 91, 97, 98, 111, 113, 119, 121,127, 128, 143, 147, 151, 155, 159, 166, 165,170, 173, 178, 181, 182, 184, 185, 186, 192,193, 197, 227, 228, 229, 230, 235, 251
women 17, 110, 136, 137, 148, 197, 225, 229,231, 234, 242, 245
World Development Report 8, 14, 73, 102,111, 187, 188

268
POVERTY MEASUREMENT: Meanings, Methods and Requirements

Dileni GunewardenaFebruary 2004
POVERTY MEASUREMENT:Meanings, Methods and Requirements
Study Series No. 1 - 2004
29 Gregory’s Road Colombo 7Sri LankaTel: 94 11 2676 955-8 2667 967-8Fax: 94 11 2676 959E-mail: [email protected]
This study was supportedby the German FederalMinistry for EconomicCoorporation andDevelopment (BMZ)through the GermanTechnical Coorporation
ISBN 955-1040-00-7