Diffusional Encounter of Barnase and Barstar
12
Diffusional Encounter of Barnase and Barstar Alexander Spaar,* Christian Dammer,* Razif R. Gabdoulline, yz Rebecca C. Wade, y and Volkhard Helms* *Center for Bioinformatics, Saarland University, Saarbru ¨ cken, Germany; y EML Research GmbH, Heidelberg, Germany; and z Institute of Mathematical Problems in Biology, Moscow, Russia ABSTRACT We present an analysis of trajectories from Brownian dynamics simulations of diffusional protein-protein encounter for the well-studied system of barnase and barstar. This analysis reveals details about the optimal association pathways, the regions of the encounter complex, possible differences of the pathways for dissociation and association, the coupling of translational and rotation motion, and the effect of mutations on the trajectories. We found that a small free-energy barrier divides the energetically most favorable region into a region of the encounter complex above the barnase binding interface and a region around a second energy minimum near the RNA binding loop. When entering the region of the encounter complex from the region near the RNA binding loop, barstar has to change its orientation to increase the electrostatic attraction between the proteins. By concentrating the analysis on the successful binding trajectories, we found that the region of the second minimum is not essential for the binding of barstar to barnase. Nevertheless, this region may be helpful to steer barstar into the region of the encounter complex. When applying the same analysis to several barnase mutants, we found that single mutations may drastically change the free-energy landscape and may significantly alter the population of the two minima. Therefore, certain protein-protein pairs may require careful adaptation of the positions of encounter and transition states when interpreting mutation effects on kinetic rates of association and/or dissociation. INTRODUCTION Association of two or more proteins is one of the most important biochemical processes in biological cells. The association process is typically divided into a process of dif- fusional encounter, which may be accelerated by long-range electrostatic interactions, and the final step of association, where short-range interactions play the most prominent role. For electrostatically attracting proteins, the first process includes the region of free diffusion, when the proteins are far apart, the region of electrostatic steering, and the encounter complex, which can be defined as the minimum of the free-energy landscape in this diffusional regime (for other suitable definitions and for a summary of several structural approaches, see Gabdoulline and Wade (1)). In this encounter complex, the proteins can reorient their interaction patches, which is required for formation of the bound com- plex. This diffusive process is followed by the second step, which includes the formation of the transition state, a possible second intermediate, and the bound complex (2). To get from the encounter complex to the transition state involves a loss of translational and orientational entropy and the main part of the unfavorable desolvation. This is later compensated by the energy gained due to the hydrophobic and van der Waals interactions and by the formation of hydrogen bonds and salt bridges. The diffusive protein motion in the first process can be well modeled by Brownian dynamics (BD) simulations, whereas the modeling of the second step needs more detailed simulation techniques such as molecular dynamics simulations. Over the past years, BD simulations have emerged as a powerful method for the computational analysis of the kinetics of protein-protein interactions. In particular, the cal- culated association rates are in good agreement with exper- imental findings (3). Given this good agreement it should be possible to deduce further information from the simulation data about the association behavior of the proteins: What are the individual association pathways and the regions of the encounter complex? Is there a distinction between associa- tion and dissociation pathways? How strong is the coupling of the translational and rotational motions? And how do mu- tations affect these features? These issues will be addressed in this article. For this work, we chose as a model system the well- studied protein-protein pair of barnase and barstar (see Fig. 1). Barnase is an extracellular ribonuclease and barstar is its intracellular inhibitor. They are rather small proteins with diameters of ;30 A ˚ . The interaction between barstar and barnase is among the strongest known interactions between proteins, with a very fast association rate of 10 8 –10 9 M ÿ1 s ÿ1 at 50 mM ionic strength (4). The binding interface, char- acterized by mutagenic experiments (4,5) and by a crystal structure of the barnase-barstar complex (6), mainly consists of polar and charged residues, and shows a high electrostatic complementarity. Therefore, this protein pair provides a well characterized model system of electrostatically steered asso- ciation between proteins. Their interaction has been exten- sively studied both experimentally and theoretically: First, binding constants and kinetic association rates for wild-type Submitted October 10, 2005, and accepted for publication November 29, 2005. Address reprint requests to Volkhard Helms, Center for Bioinformatics, Saarland University, Im Stadtwald, D-66041 Saarbru ¨cken, Germany. Tel.: 49-681-302-64165; Fax: 49-681-302-64180; E-mail: volkhard.helms@ bioinformatik.uni-saarland.de. Ó 2006 by the Biophysical Society 0006-3495/06/03/1913/12 $2.00 doi: 10.1529/biophysj.105.075507 Biophysical Journal Volume 90 March 2006 1913–1924 1913
Transcript of Diffusional Encounter of Barnase and Barstar

Diffusional Encounter of Barnase and Barstar
Alexander Spaar,* Christian Dammer,* Razif R. Gabdoulline,yz Rebecca C. Wade,y and Volkhard Helms**Center for Bioinformatics, Saarland University, Saarbrucken, Germany; yEML Research GmbH, Heidelberg, Germany;and zInstitute of Mathematical Problems in Biology, Moscow, Russia
ABSTRACT We present an analysis of trajectories from Brownian dynamics simulations of diffusional protein-proteinencounter for the well-studied system of barnase and barstar. This analysis reveals details about the optimal associationpathways, the regions of the encounter complex, possible differences of the pathways for dissociation and association, thecoupling of translational and rotation motion, and the effect of mutations on the trajectories. We found that a small free-energybarrier divides the energetically most favorable region into a region of the encounter complex above the barnase bindinginterface and a region around a second energy minimum near the RNA binding loop. When entering the region of the encountercomplex from the region near the RNA binding loop, barstar has to change its orientation to increase the electrostatic attractionbetween the proteins. By concentrating the analysis on the successful binding trajectories, we found that the region of thesecond minimum is not essential for the binding of barstar to barnase. Nevertheless, this region may be helpful to steer barstarinto the region of the encounter complex. When applying the same analysis to several barnase mutants, we found that singlemutations may drastically change the free-energy landscape and may significantly alter the population of the two minima.Therefore, certain protein-protein pairs may require careful adaptation of the positions of encounter and transition states wheninterpreting mutation effects on kinetic rates of association and/or dissociation.
INTRODUCTION
Association of two or more proteins is one of the most
important biochemical processes in biological cells. The
association process is typically divided into a process of dif-
fusional encounter, which may be accelerated by long-range
electrostatic interactions, and the final step of association,
where short-range interactions play the most prominent
role. For electrostatically attracting proteins, the first process
includes the region of free diffusion, when the proteins
are far apart, the region of electrostatic steering, and the
encounter complex, which can be defined as the minimum
of the free-energy landscape in this diffusional regime (for
other suitable definitions and for a summary of several
structural approaches, see Gabdoulline andWade (1)). In this
encounter complex, the proteins can reorient their interaction
patches, which is required for formation of the bound com-
plex. This diffusive process is followed by the second step,
which includes the formation of the transition state, a
possible second intermediate, and the bound complex (2).
To get from the encounter complex to the transition state
involves a loss of translational and orientational entropy and
the main part of the unfavorable desolvation. This is later
compensated by the energy gained due to the hydrophobic
and van der Waals interactions and by the formation of
hydrogen bonds and salt bridges. The diffusive protein
motion in the first process can be well modeled by Brownian
dynamics (BD) simulations, whereas the modeling of the
second step needs more detailed simulation techniques such
as molecular dynamics simulations.
Over the past years, BD simulations have emerged as
a powerful method for the computational analysis of the
kinetics of protein-protein interactions. In particular, the cal-
culated association rates are in good agreement with exper-
imental findings (3). Given this good agreement it should be
possible to deduce further information from the simulation
data about the association behavior of the proteins: What are
the individual association pathways and the regions of the
encounter complex? Is there a distinction between associa-
tion and dissociation pathways? How strong is the coupling
of the translational and rotational motions? And how do mu-
tations affect these features? These issues will be addressed in
this article.
For this work, we chose as a model system the well-
studied protein-protein pair of barnase and barstar (see Fig.
1). Barnase is an extracellular ribonuclease and barstar is its
intracellular inhibitor. They are rather small proteins with
diameters of ;30 A. The interaction between barstar and
barnase is among the strongest known interactions between
proteins, with a very fast association rate of 108–109 M�1 s�1
at 50 mM ionic strength (4). The binding interface, char-
acterized by mutagenic experiments (4,5) and by a crystal
structure of the barnase-barstar complex (6), mainly consists
of polar and charged residues, and shows a high electrostatic
complementarity. Therefore, this protein pair provides a well
characterized model system of electrostatically steered asso-
ciation between proteins. Their interaction has been exten-
sively studied both experimentally and theoretically: First,
binding constants and kinetic association rates for wild-type
Submitted October 10, 2005, and accepted for publication November 29,
2005.
Address reprint requests to Volkhard Helms, Center for Bioinformatics,
Saarland University, Im Stadtwald, D-66041 Saarbrucken, Germany. Tel.:
49-681-302-64165; Fax: 49-681-302-64180; E-mail: volkhard.helms@
bioinformatik.uni-saarland.de.
� 2006 by the Biophysical Society
0006-3495/06/03/1913/12 $2.00 doi: 10.1529/biophysj.105.075507
Biophysical Journal Volume 90 March 2006 1913–1924 1913

and mutant proteins were extensively measured by the Fersht
group (4,5). Schreiber and Fersht also aimed at predicting the
rate enhancement for various mutants and for varying ionic
strengths using a transition-state-like theory and atomic
modeling (7,8). Gabdoulline and Wade then calculated the
association rates of the wild types and a set of mutants from
BD simulations (3,9) and obtained good agreement with the
experimental association rates. They also analyzed energet-
ically favorable regions by a Boltzmann factor analysis, and
recently studied the binding energetics of these proteins (10).
Complementary to the BD simulations, Camacho et al.
systematically sampled the translational and rotational space
to compute the free-energy landscape, and compared the
contributions of the electrostatic and desolvation energies of
encounter complexes (11). Janin and co-workers performed
an extensive analysis of protein-protein recognition sites for
barnase and barstar and a large series of protein pairs (12).
The electrostatic contribution to the binding stability of
barnase and barstar was analyzed by Zhou and colleagues
(13).
The barnase mutations considered in this article are
located in different regions on the protein surface and
therefore they each have a different impact on the association
and binding behavior of barnase and barstar. The positively
charged residues at the inner region of the binding interface
(K27, R59, R83, and R87) serve for binding and stabilization
of the negatively charged RNA substrate (6). The negatively
charged residues D54 and E60 are located in the periphery of
the interface. Their function is probably to stabilize the
positive charges around the active site of barnase (14).
Residues 57–60 form the guanine binding loop. It was shown
that replacement of the positively charged residues of the
barstar interface reduces the association rate to barstar,
whereas mutations D54A and E60A increase these rates
(4,5,9). An exception to this rule is K66. A replacement of
this positively charged residue by alanine reduces the
association rate only slightly. It is located outside of the
interface and was suggested to be responsible for incorrect
steering of barstar toward barnase (3).
The studies in this article are based on previous work by
Gabdoulline and Wade (3,9), in which they characterize the
association kinetics of barnase and barstar from BD simu-
lations, and on a recent study (15) in which Spaar and Helms
developed a method for uncovering the underlying entropy
and free-energy landscapes from a large set of BD simula-
tions. Here, we focus on the analysis of the free-energy
landscape to analyze the encounter complex regions and the
optimal association/dissociation pathways. It has been pointed
out several times that protein-protein association events are
steered by a funnel-shaped free-energy landscape (11,16,17)
such as protein folding. Therefore one may assume identical
pathways for association and dissociation as long as the free-
energy surfaces are the same. This results from the principle
of detailed balance. Things may look different if one takes
into account induced-fit effects that may alter the free-energy
surface for dissociation. In further computations, we studied
the mean orientation of barstar and the coupling of the
translational and rotational motions. Identifying the actual
pathways of the proteins on the six-dimensional configura-
tion space is one of the features that can only be obtained
from dynamic simulations and not by computing energies on
a grid. To analyze effects of barnase mutations on the asso-
ciation behavior of the proteins, we studied the occupancy
and free-energy landscape in the same way as for the barnase
wild type. In this mutant study, we particularly focused on
the position and shape of the encounter complex region and
the optimal center-of-mass positions for increasing distance
as derived from the occupancy and free-energy landscapes.
In a recent study, Miyashita et al. (18) characterized the
conformations of the encounter and transition states for the
system of cytochrome c2 and reaction center using Monte
Carlo simulations. They assumed that the conformations of
the encounter and transition states are nearly the same for
all mutants and identified spatial regions where the com-
puted free-energy differences between wild type and mutants
matched the experimental values. In the last part of this
article, the question is addressed whether this assumption
holds true for the barnase-barstar system.
MATERIALS AND METHODS
Protein structures
We used the coordinates of barnase and barstar as prepared by Gabdoulline
and Wade (9). The coordinates of the docked wild-type barnase-barstar
complex, determined to 2.0 A resolution by Buckle and co-workers (6), were
taken from the Protein Data Bank (PDB code 1brs). Chain A was used for
barnase and chain D for barstar. The two other pairs of chains in the crystal
structure were used to model the missing side-chain atoms in the A and
FIGURE 1 (A) Barnase and (B) barstar, colored according to their
electrostatic potentials ranging from �7 kT/e (red) to 17 kT/e (blue). The
residues of the interaction patches are drawn as white sticks. The complex
structure can be obtained by placing barstar in panel B rotated by 180�around the vertical axis on top of barnase in panel A. In panel A, the mutated
residues are highlighted in yellow. R59 and E60 are located in the RNA
binding loop (residues 57–60). Residues D54 and K66 have no direct
binding partners on the barstar interface, although D54 is located in the
binding region. The 3D images in this article were generated using the
visualization molecular dynamics program (VMD) (33).
1914 Spaar et al.
Biophysical Journal 90(6) 1913–1924

D chains. Crystallographic water molecules were removed. Mutants were
modeled by replacing the mutated side chain. The barnase mutants con-
sidered here are K27A, D54A, R59A, E60A, D54A/E60A, K66A, K66A/
D54A, R83Q, and R87A. Polar hydrogen atoms were added and their
positions optimized by energy minimization with the CHARMM program
(19) using the QUANTA molecular graphics package (Molecular Simula-
tions, San Diego, 1992). Side-chain conformations were kept the same as in
the barnase-barstar complex.
Computation of forces
The results of our work, the analysis of the association pathways and the
encounter-complex regions, are complementary to the results of recent
studies of association rates on barnase and barstar by Gabdoulline and Wade
(3). To allow a comparison with their results we used the same parameters as
in their work for the computation of forces and the simulations.
For the modeling of the long-range electrostatic interaction of the
proteins, solutions of the linear Poisson-Boltzmann equation were computed
for each protein using the University of Houston Brownian Dynamics
program (UHBD) (21). Partial charges and atomic radii were assigned from
the OPLS data set (22). The protonation states of titrable residues were
assigned according to their standard protonation states at the experimental
pH of 8.0 (5). Grids with dimensions of 1503 1503 150 nodes and a 1.0-A
spacing centered on each of the proteins were used. The ionic strength was
set to 50 mM and the temperature was set to 300 K. The solvent dielectric
was assigned a value of 78.0.
The effective charge method (ECM) (23) was used to derive charges that
represent the external electrostatic potential in a uniform dielectric medium.
The effective charges were fitted to reproduce the electrostatic potential in a
3-A-thick layer starting at the accessible surface defined by a probe of radius
4 A and extending outward of the protein. To compute forces and torques
acting on protein 2(1), the array of effective charges for protein 2(1) is placed
on the electrostatic potential grid of protein 1(2).
Short-range repulsive forces are treated by an exclusion volume
prohibiting van der Waals overlap of the proteins. The exclusion volume
is precalculated on a grid with 0.5-A grid spacing. If a move during the BD
simulation would result in van der Waals overlap, the BD step is repeated
with different random numbers until no overlap occurs. The surface-exposed
atoms of the smaller protein are listed and steric overlap is defined as
occurring when one of the surface-exposed atoms is projected on a grid point
that represents the interior of the larger protein (24).
Charge desolvation penalties are computed in an approximate fashion
that treats the solvation of each charge independently (25) The charge
desolvation penalty of one protein is taken as the sum of desolvation
penalties of each charge of that protein. The desolvation penalty of each
charge is the sum of desolvation penalties due to the low dielectric cavity of
each atom of the other protein. The desolvation energy of protein 1 due to the
presence of protein 2 is approximated as:
DGds ¼ aes � ep
esð2es 1 epÞ+ij
ð11 krijÞ2e�2krijq2
i a3
j
r4
ij
;
where k is the Debye-Huckel parameter, es and ep are the dielectric constantsof the solvent and the protein, respectively, qi is the effective charge on the
ith atom of protein 1, aj is the radius of the jth atom of protein 2, and rij is thedistance between the two atoms. The summation is carried out over all
possible pairs of effective charges on protein 1 and atoms on protein 2. The
scaling factor a for the weighting between electrostatic interaction and
desolvation terms was set to 1.67. The validity of this choice may be
assessed from the electrostatic interaction free-energy calculations shown in
Figs. 1 and 2 of Gabdoulline and Wade (3).
The atom-atom contacts of the reaction patches are assigned in a fully
automated way independent of which residue each atom is in (9). Possible con-
tacts are those pairs between hydrogen-bond donor and acceptor atoms having a
separation distance of,5.0 A in the x-ray structure of the complex.
Brownian dynamics simulations
For the BD simulations we used the software package SDA (26) which was
modified to allow for a detailed analysis of the trajectories. Here, the proteins
are modeled as rigid bodies, and short-range interactions such as van der
Waals forces and the formations of hydrogen bonds and salt bridges are not
modeled. However, these simplifications become important only at small
protein-protein separations.
To get a high statistics for the occupancy maps, 200,000 trajectories were
simulated for each protein pair. The trajectories start with the two proteins at
a center-to-center distance b with randomly chosen orientations, and finish
when the proteins reach a center-to-center distance c. b. In a previous work(15), b was chosen to be 100 A and c 500 A, which are the same values used
by Gabdoulline and Wade (3). These values correspond to 7.4 and 36.8
Debye lengths at 300 K and 50 mM. In the simulations presented here we
decreased c to 110 A since we focused on the analysis of the trajectories and
aimed to get a high statistics instead of improving the association rates. By
that we gained a factor of 10 in computation time, compared to the simu-
lations with c ¼ 500 A.
The diffusion equation is solved by the Ermak-McCammon algorithm
(27). The translational Brownian motion of two interacting proteins is
simulated as the displacement Dr of the relative separation vector r during atime step Dt according to the relation
Dr ¼ DDt
kBTF1R; with ÆRæ ¼ 0 and ÆR2æ ¼ 6DDt;
where F is the systematic interparticle force, kB is the Boltzmann constant, Tis the temperature, and R is the stochastic displacement arising from
collisions of the proteins with solvent molecules. Two analogous formulas
are used to generate the rotational motions of the two proteins in terms of
rotation anglewj¼ (w1j,w2j,w3j), torque Tij acting on protein i due to protein
j, and rotational diffusion constant DiR of each protein i (i, j ¼ 1, 2, i 6¼ j):
Dwi ¼DiRDt
kBTTij 1W i; with ÆW iæ ¼ 0 and
ÆW2
i æ ¼ 6DiRDt:
The diffusional properties of the molecules are assumed to be isotropic.
In Gabdoulline and Wade (3), a relative translational diffusion constant of
0.030 A2/ps was used, based on the individual diffusion constants of 0.015
A2/ps assigned to both barnase and barstar in aqueous solution, and
rotational diffusion constants of 4.0 3 10�5 and 4.5 3 10�5 rad2/ps for
barnase and barstar, respectively.
The time step was set to 1.0 ps for center-to-center distances up to 75 A
and for larger distances it increased linearly with the intermolecular
separation. This corresponds to an average random displacement of 0.4 A at
small and medium separations.
To reduce the computational cost of the simulations, no hydrodynamic
interactions were considered. It was shown that the effect on the protein-
protein association rates is rather small. (28) Also, in previous BD studies
with simplified cytochrome c molecules it was found that hydrodynamics
has only a small influence. (29) Hydrophobic forces are not included, since
they are assumed to become important only at small contact distances.
The simulation software SDA also allows for the computation of asso-
ciation rates. This has been covered in detail in previous work by others
(3,9,30). In our study, we concentrate on the analysis of the trajectories,
largely omitting the computation of association rates.
Computation of the occupancy landscape
The analysis of the trajectories with the aim to compute the occupancy maps,
the entropy and free-energy landscape is described in detail in (15). After
each time step of the simulated trajectories the positional and orientational
coordinates of protein 2 (relative to protein 1) are computed with respect to a
Diffusional Encounter 1915
Biophysical Journal 90(6) 1913–1924

reference coordinate system. During the simulations these coordinates are
assigned to the nodes of a six-dimensional grid on which the occupancy,
energy, and entropy maps are computed. The maps for the positional and
orientational coordinates were computed separately to reduce the compu-
tational effort. At the same time the statistics in two three-dimensional grids
is much higher compared to populating a six-dimensional grid.
The computation of the occupancy maps with respect to the positional
coordinates can be understood as projecting the position of protein 2 onto a
plane that is perpendicular to the center-to-center vector of the proteins in the
bound state of the crystal structure. The origin of these occupancy maps is
the position of protein 2 in the bound state. As a reference system, a spherical
coordinate system was used, u and f denoting the corresponding polar and
azimuthal angles between the center-to-center vector of the proteins at a
trajectory position and the center-to-center vector of the proteins in the
bound state. After each time step, the occupancy value of the grid element
associated with the position of protein 2 is increased by 1. Note that for
positions of protein 2 above the denoted plane (for u # p) and below (for
u $ p), two distinct sets of matrices are needed to represent the upper and
lower half-spheres. Since the matrices are computed with respect to a ‘‘semi-
Cartesian’’ coordinate system, the axes are called fx and fy, which are the x
and y components of the angle f. Here, the x axis is defined by the vector
from the center of the reaction patch of protein 1 to the first atom in the list of
reaction atoms. In the case of barnase wild type this is SER38:OG. Thus, the
negative x axis points approximately in the direction from the patch center
toward the guanine binding loop.
The occupancy maps with respect to the orientational coordinates are
computed similarly. The normal vector of protein 2 is projected onto a plane
that is perpendicular to the normal vector of protein 1. Here, the origin is the
center of the reaction patch of protein 1. The axes are fn,x and fn,y,
according to the azimuthal angle fn between the normal vector of the
interaction patch of protein 2 and that of protein 1. The index n refers to the
normal vectors of the reaction patches. The xn axis is defined analogously to
the x axis using the first reaction atom of protein 1. The normal vector of
protein 1 is defined to point outward from the protein, whereas the normal
vector of protein 2 is defined to point inward, so that in the bound state the
two vectors are approximately parallel. Again, two distinct sets of matrices
are needed to represent the upper and lower half-spheres. The third
orientational coordinate, the angle vn, is given by the rotation of protein 2
around the normal vector of the reaction patch, vn ¼ 0 denoting the
orientation of protein 2 in the bound state. Fig. 2 A displays the resulting
occupancy maps for the positional coordinates. A detailed description is
given in the Results section. The electrostatic and desolvation energies, as
well as the translational and rotational entropy losses (see below) are
recorded in further sets of matrices (not shown). In the matrices assigned to
the electrostatic and desolvation energies, the minimum values for the given
position/orientation are stored, thus allowing us to finally identify the
minimum free-energy paths.
Along the angles fx and fy, as well as fn,x and fn,y, we used a
discretization with 2 3 101 nodes (for the upper and lower half-spheres),
i.e., an average step size of 1.8�. For vn we used a step size of 4�, i.e., 90nodes. Along the distance axis a spacing of 2 A was used over a distance of
80 A. The initial value was set by the center-to-center distance of the
proteins in the bound state. Finally, the occupancy values are normalized
according to the volume of the corresponding element of the configuration
space. In contrast to our previous work, where we compared several defi-
nitions for the so-called contact distance, the distance between the inter-
action patches, throughout this article we are using the center-to-center
distance d1–2 as the reaction coordinate.
Calculation of the entropy landscape
By interpreting the computed occupancy maps as probability distributions,
the contribution of the translational and rotational entropy to the free-energy
landscape is computed by the restriction of the degrees of motional
freedom and by applying a local entropy function. The total entropy loss
FIGURE 2 Maps of the (A) occu-
pancy and (B) free-energy landscapes
for the association of barstar to barnase.
The maps are colored from blue (high
occupancy/low free energy) to red (low
occupancy/high free energy). (C) En-
ergy profiles along the reaction path-
way: the electrostatic energy DEel, the
desolvation energy DEds, the entropy
loss –TDS, and the free energy DG
(from left to right).
1916 Spaar et al.
Biophysical Journal 90(6) 1913–1924

of protein-protein encounter is calculated as the sum of the translational and
rotational entropies DS ¼ DStrans 1 DSrot. The splitting into the translational
and rotational parts allows the separate computation of the entropy maps
with respect to the positional and orientational coordinates.
Since the proteins are simulated as rigid bodies we do not take account
of their internal entropy loss through changes in vibrational modes and side-
chain conformations. However, it can be assumed that this entropy
contribution only becomes important for protein-protein separations of a
few Angstroms, i.e., in a regime where the protein motions are not diffusion-
limited anymore. Also, the entropy of the solvent is not considered here.
Again, this contribution can be assumed to be limited to small protein-
protein distances.
Here, the process of protein encounter is considered as a step-by-step
process on a molecular level, meaning that a protein at a certain position and
with a certain orientation cannot explore the full configuration space within a
Brownian Dynamics time step. Therefore, we are interested in calculating
the position- and orientation-dependent (local) entropy loss, rather than the
total (global) entropy loss during the association process. For the compu-
tation of local entropy loss we only take into account the occupancy values
of all those configurations (positions and orientations) that are reachable
from the particular position and orientation within one Brownian dynamics
time step, i.e., that are within its ‘‘accessible volume’’ of configuration
space. The size of the accessible spatial and angular volumes V and Y should
be in the range of the mean positional and orientational displacements during
a Brownian dynamics time step. We chose V as a sphere around the position
of the protein, and Y as a sphere around its orientation. The corresponding
radii are Dr and Dv, respectively. To compute the local entropy loss at the
given position and orientation from the occupancy of the positions and
orientations (the states) within the accessible volumes V and Y, the occu-
pancy landscape is interpreted as a probability distribution, which allows the
application of the basic entropy formula S ¼ kB+ PnlnPn; where the Pn are
the probabilities for each state n. This configuration-dependent entropy
value is then compared to the entropy with a constant, isotropic probability
distribution, which is the reference state if the proteins are far apart. Note that
the entropy loss is computed separately for all grid nodes of the positional
and orientational space, which together represent the entropy landscape. See
Spaar and Helms (15) for details.
The average translational and rotational displacements of barnase and
barstar during a time step of Dt ¼ 1.0 ps are ;0.4 A and 1.3�, respectively.These represent minimum values for the radii of the accessible volumes V
and Y, in particular for a combined translational and rotational motion. In our
previous work (15), we showed that the entropic contribution is only weakly
dependent on the size of the volumes V and Y. In the simulations, we used
Dr ¼ 3 A and Dv ¼ 3�.
Free-energy landscape
In the sections above we described the computation of the energy and en-
tropy landscapes. The contributions of electrostatic and desolvation ener-
gies, as well as the translational and rotational entropy loss, are stored in
matrices that represent the six-dimensional configuration space. These
matrices have the same grid sizes as the occupancy maps and they are
computed separately for the positional and orientational coordinates. With
the energy and entropy contributions as functions of the translational and
rotational coordinates, the free-energy landscape of the encounter process is
given by the sum of the electrostatic energy, the desolvation energy, and the
translational/rotational entropy:
DG ¼ DEel 1DEds � TDStr; DStr ¼ DStrans 1DSrot:
Fig. 2 B displays maps of the free-energy landscape corresponding to the
occupancy maps in Fig. 2 A. Fig. 2 C shows the energy profiles along the
reaction path, which is defined as the path along the minima of the free-
energy landscape: the electrostatic interaction energy DEel, the desolvation
energy DEds, the (negative) translational and rotational entropy loss –TDS,
and the free energy DG of the protein-protein association.
Calculation of the mean orientation
In each step during the simulation, the position of barstar is assigned to a three-
dimensional grid. In every step, the value of the corresponding grid element
was increased by 1 to count the occupancy. The orientation of barstar was
recorded by storing the components of the normal vector in separate three-
dimensional grids with the same spacing. During the simulation, the values of
the grid nodes are summed; the mean orientation is computed after the
simulation. The spacing of this grid was varied from 1 A to 5 A. The vectors
are scaled according to occupancy of the corresponding grid element and point
from the center-of-mass of barstar to the center of its binding interface.
RESULTS
Several methods were used for analyzing the trajectories of
BD simulations of barnase and barstar to get detailed insight
into the diffusional association behavior of these proteins
and to find the most prominent effects of mutations on the
association. Barnase and barstar are shown in Fig. 1, A and B,with their surfaces colored according to the electrostatic
potential at the surface, ranging from�7 kT/e (red) to17 kT/e(blue). The residues of the interaction patches, defined by a
distance of ,4.5 A between the proteins in the complex
structure, are highlighted in white. Fig. 1 A shows barnase,
with those residues that have been computationally mutated
in this study highlighted in yellow.
Computation of the occupancyand free-energy landscapes
The occupancy and free-energy landscapes were computed
by a detailed analysis of the BD trajectories (15). First, the
particle positions sampled during 200,000 trajectories were
collected in occupancy landscapes for the positional and
orientational space. Due to the high statistics, this occupancy
landscape could then be interpreted as a probability distri-
bution from which we computed the entropy landscape by
applying a locally defined entropy function. The free-energy
landscape was then calculated as the sum of the electrostatic
and desolvation energies and the entropy contributions. Re-
sulting maps of the occupancy landscape of the association
of barstar to barnase (wild type) are shown in Fig. 2 A for
protein-protein separations d1–2 ranging from 32 to 44 A.
The positional coordinates fx and fy are the x and y com-
ponents of the angle f between the vector from the center of
protein 1 to that of protein 2 and the vector between the
centers of the proteins in the bound state. In these maps,
regions of high occupancy are colored in blue, and low-
occupancy regions in red. Complementary to the occupancy
maps, Fig. 2 B shows maps of the free-energy landscape.
Here, the color scale ranges from –4.0 (blue) to 0.0 kcal/mol
(red). The regions of low (high) free energy coincide very
well with the corresponding regions of high (low) occupancy
in Fig. 2 A, demonstrating that the computed free-energy
landscape correctly describes the association behavior of
barnase and barstar as inferred from the analysis of the simu-
lated trajectories.
Diffusional Encounter 1917
Biophysical Journal 90(6) 1913–1924

The high density at the lower left of the maps suggests that
up to a distance of ;40 A barstar is encountering barnase
toward the barnase RNA binding loop (see below). At 36 A
the occupancy cloud has moved to near the center of the
map, with a loose connection to the encountering region on
the left side of the maps at d1–2 $ 40 A. The region of high
occupancy at 32 A corresponds to the encounter-complex
region, i.e., the energetically most favorable region. At shorter
distances, the conformation of barnase converges toward the
bound conformation (the central position of each map lies
perpendicular to the binding patch).
Fig. 2 C shows the energy profiles along the reaction path,
defined as the path along the minima in the free-energy
landscape: the electrostatic energy, the desolvation energy,
the entropy loss (the sum of the translational and rotational
entropy losses), and the free energy (from left to right). The
minimum position in the free-energy profile at 32 A was used
as the definition of the encounter complex. In addition to this
minimum, a shoulder in the free-energy profile can be ob-
served at ;36 A. This shoulder reflects a small barrier,
which is discussed in more detail below.
Encounter-complex regions
Fig. 2 shows the results of a simulation where the motion of
barstar is computed relative to barnase. We added a second
set of simulations using the same input parameters but with
the proteins being exchanged to exclude possible artifacts
arising from this setup. In this simulation the motion of
barnase is modeled relative to barstar. The resulting energy
profiles (not shown) agree very well with the results dis-
played in Fig. 2 C.The ‘‘encounter-complex regions’’ shown in Fig. 3 are de-
duced from the computed occupancy and free-energy land-
scapes from the simulations of barstar to barnase and vice
versa. The encounter-complex regions for barnase (green)and barstar (orange) in Fig. 3, A and B, represent all center-of-mass positions with a free energy less than a certain
threshold. In these images, barnase and barstar are shown in
the bound configuration of the crystal structure as blue and
red ribbons, respectively. The representation and colors
were chosen to allow a direct comparison with Fig. 5 a in
Gabdoulline and Wade (3), where the authors computed
the energetically favorable regions for each protein by a
Boltzmann factor analysis. In Fig. 3 A, the free-energy
threshold was set to –3.0 kcal/mol, just below the above-
mentioned shoulder. The corresponding encounter-complex
region of barstar (barnase) has a volume of 5,338 (6,239) A3
and the average lifetime of the proteins in these regions is
;20 (14) ps. The encounter-complex regions agree well
with the energetically favorable regions as computed by
Gabdoulline and Wade, only the front part of their distribu-
tion is missing. Fig. 3 B shows the same picture with the free-
energy threshold at –2.5 kcal/mol. Now, the whole region
is reproduced, including the part missing before. These
extended encounter-complex regions confirm the results
from the Boltzmann factor analysis. The volume and the
average lifetime increased to 15,870 (20,280) A3 and 24 (16)
ps for barstar (barnase). Isosurfaces of the occupancy land-
scapes for barstar (light brown) and barnase (light gray) aredisplayed in Fig. 3 C. A comparison with Fig. 3 B shows that
these largely overlap with the free-energy isosurfaces. To
analyze the entropic influence on the free-energy landscape
of barstar, we compared the isosurfaces of the free energy
and the enthalpy, which is defined as the sum of the elec-
trostatic and desolvation energies. According to the defini-
tion of the locally defined entropy, the entropy loss is large
where the occupancy is strongly varying. Therefore, the neck
of the association funnel at the position of the small free-
energy barrier gets even more restricted by the effect of the
entropy loss. As already mentioned, the proteins are oriented
in Fig. 3 in such a way as to allow a direct comparison with
Fig. 5 a in Gabdoulline and Wade (3). However, in the fol-
lowing figures, barnase and barstar are shown in an orienta-
tion optimized for the best visualization of our results. In these
images the proteins are slightly tilted compared to Fig. 3.
Association and dissociation pathways
To identify the optimal association pathway of barstar
toward barnase we selected the configurations of maximal
occupancy and minimal free energy from the computed maps
as shown in Fig. 2, A and B, for center-to-center distancesfrom 50 to 28 A. The corresponding center-of-mass positions
FIGURE 3 Encounter-complex regions of barstar and barnase. The
proteins are shown in their bound conformations in the crystal structure as
blue and red ribbons for barnase and barstar, respectively. The orange
isosurface represents the positions of the center-of-mass of barstar in the
encounter-complex region, defined by (A) DG , �3.0 kcal/mol and (B)
DG , �2.5 kcal/mol. Correspondingly, the green isosurface represents the
positions of the center-of-mass of barnase. (C) Occupancy isosurfaces for
barnase and barstar with an isocontour level of 300 events/A3.
1918 Spaar et al.
Biophysical Journal 90(6) 1913–1924
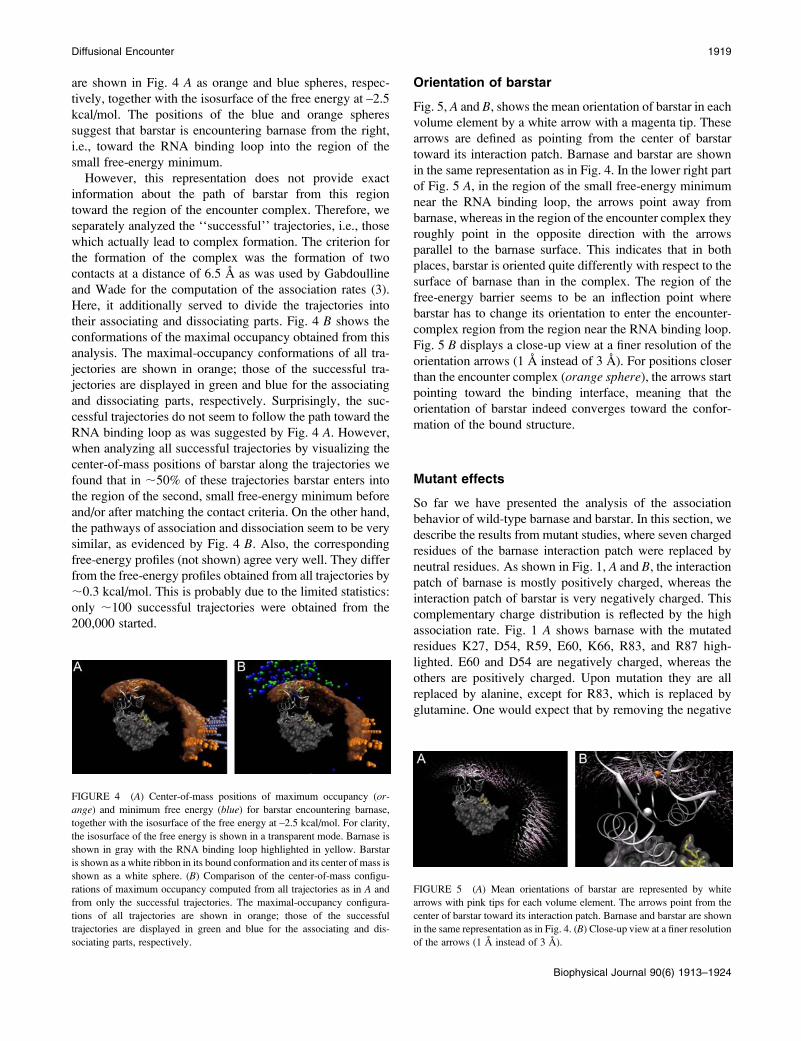
are shown in Fig. 4 A as orange and blue spheres, respec-
tively, together with the isosurface of the free energy at –2.5
kcal/mol. The positions of the blue and orange spheres
suggest that barstar is encountering barnase from the right,
i.e., toward the RNA binding loop into the region of the
small free-energy minimum.
However, this representation does not provide exact
information about the path of barstar from this region
toward the region of the encounter complex. Therefore, we
separately analyzed the ‘‘successful’’ trajectories, i.e., those
which actually lead to complex formation. The criterion for
the formation of the complex was the formation of two
contacts at a distance of 6.5 A as was used by Gabdoulline
and Wade for the computation of the association rates (3).
Here, it additionally served to divide the trajectories into
their associating and dissociating parts. Fig. 4 B shows the
conformations of the maximal occupancy obtained from this
analysis. The maximal-occupancy conformations of all tra-
jectories are shown in orange; those of the successful tra-
jectories are displayed in green and blue for the associating
and dissociating parts, respectively. Surprisingly, the suc-
cessful trajectories do not seem to follow the path toward the
RNA binding loop as was suggested by Fig. 4 A. However,when analyzing all successful trajectories by visualizing the
center-of-mass positions of barstar along the trajectories we
found that in ;50% of these trajectories barstar enters into
the region of the second, small free-energy minimum before
and/or after matching the contact criteria. On the other hand,
the pathways of association and dissociation seem to be very
similar, as evidenced by Fig. 4 B. Also, the corresponding
free-energy profiles (not shown) agree very well. They differ
from the free-energy profiles obtained from all trajectories by
;0.3 kcal/mol. This is probably due to the limited statistics:
only ;100 successful trajectories were obtained from the
200,000 started.
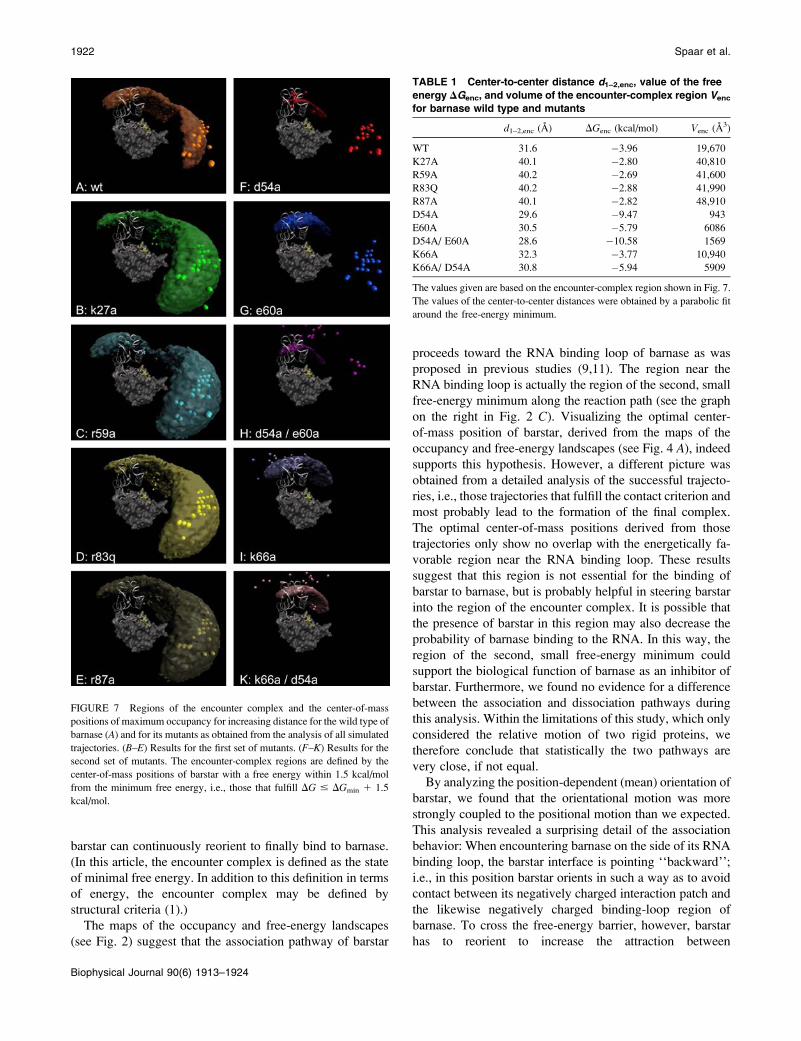
Orientation of barstar
Fig. 5, A and B, shows the mean orientation of barstar in each
volume element by a white arrow with a magenta tip. These
arrows are defined as pointing from the center of barstar
toward its interaction patch. Barnase and barstar are shown
in the same representation as in Fig. 4. In the lower right part
of Fig. 5 A, in the region of the small free-energy minimum
near the RNA binding loop, the arrows point away from
barnase, whereas in the region of the encounter complex they
roughly point in the opposite direction with the arrows
parallel to the barnase surface. This indicates that in both
places, barstar is oriented quite differently with respect to the
surface of barnase than in the complex. The region of the
free-energy barrier seems to be an inflection point where
barstar has to change its orientation to enter the encounter-
complex region from the region near the RNA binding loop.
Fig. 5 B displays a close-up view at a finer resolution of the
orientation arrows (1 A instead of 3 A). For positions closer
than the encounter complex (orange sphere), the arrows startpointing toward the binding interface, meaning that the
orientation of barstar indeed converges toward the confor-
mation of the bound structure.
Mutant effects
So far we have presented the analysis of the association
behavior of wild-type barnase and barstar. In this section, we
describe the results from mutant studies, where seven charged
residues of the barnase interaction patch were replaced by
neutral residues. As shown in Fig. 1, A and B, the interactionpatch of barnase is mostly positively charged, whereas the
interaction patch of barstar is very negatively charged. This
complementary charge distribution is reflected by the high
association rate. Fig. 1 A shows barnase with the mutated
residues K27, D54, R59, E60, K66, R83, and R87 high-
lighted. E60 and D54 are negatively charged, whereas the
others are positively charged. Upon mutation they are all
replaced by alanine, except for R83, which is replaced by
glutamine. One would expect that by removing the negative
FIGURE 4 (A) Center-of-mass positions of maximum occupancy (or-
ange) and minimum free energy (blue) for barstar encountering barnase,
together with the isosurface of the free energy at –2.5 kcal/mol. For clarity,
the isosurface of the free energy is shown in a transparent mode. Barnase is
shown in gray with the RNA binding loop highlighted in yellow. Barstar
is shown as a white ribbon in its bound conformation and its center of mass is
shown as a white sphere. (B) Comparison of the center-of-mass configu-
rations of maximum occupancy computed from all trajectories as in A and
from only the successful trajectories. The maximal-occupancy configura-
tions of all trajectories are shown in orange; those of the successful
trajectories are displayed in green and blue for the associating and dis-
sociating parts, respectively.
FIGURE 5 (A) Mean orientations of barstar are represented by white
arrows with pink tips for each volume element. The arrows point from the
center of barstar toward its interaction patch. Barnase and barstar are shown
in the same representation as in Fig. 4. (B) Close-up view at a finer resolution
of the arrows (1 A instead of 3 A).
Diffusional Encounter 1919
Biophysical Journal 90(6) 1913–1924

charges of residues D54 and E60 from the positive barnase
binding patch, the association rate should increase due to
the enhanced charge complementarity. In the same way, the
other mutations should cause a decrease of the association
rate. Indeed, this effect was observed experimentally (4,5)
and in previous BD simulations (3).
To investigate these effects in more detail, we performed
BD simulations with the same simulation parameters as used
by Gabdoulline andWade (3) and analyzed the trajectories as
described above for barstar and the wild type of barnase. For
a better overview we divided the mutant studies into two
series: one with K27A, R59A, R83Q, R87A, and the other
one with D54A, E60A, D54A/E60A, K66A, K66A/D54A.
Fig. 6, A and B, displays the energy profiles along the min-
imum free-energy pathways for both series. Shown are the
electrostatic and desolvation energies, the translational and
rotational entropy losses, and the free energies resulting from
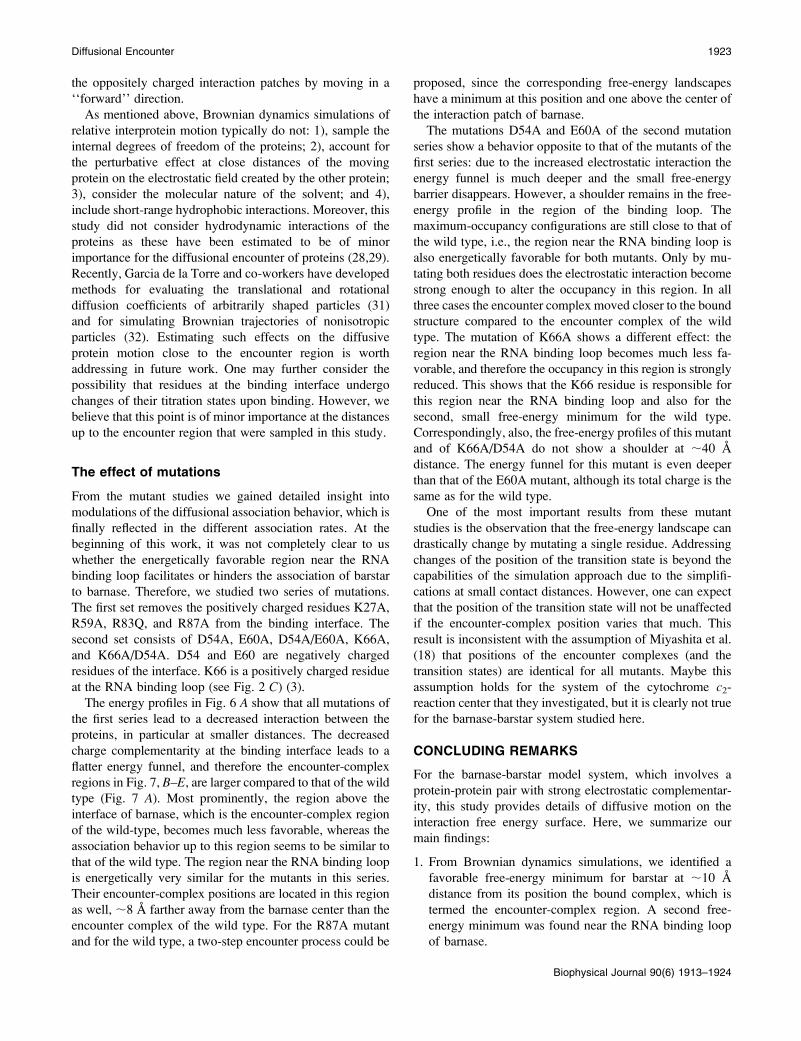
the sum of the three terms. In Fig. 7, the encounter-complex
regions are shown together with the maximum-occupancy
positions for increasing distance in the same representation
as in Fig. 4. Here, the encounter-complex regions are defined
by a threshold of 1.5 kcal/mol above the minimum of the
corresponding free-energy profile in Fig. 6, A and B. Fig. 7,B–E, displays the results obtained from the analysis of all
simulated trajectories for the mutants in the first series; those
of the second series are shown in Fig. 7, F–K. For com-
parison, the encounter-complex region and the optimal asso-
ciation pathway for the wild type are displayed in Fig. 7 A.The maximum-occupancy positions give an indication for
the ‘‘optimal association pathway’’, although real associa-
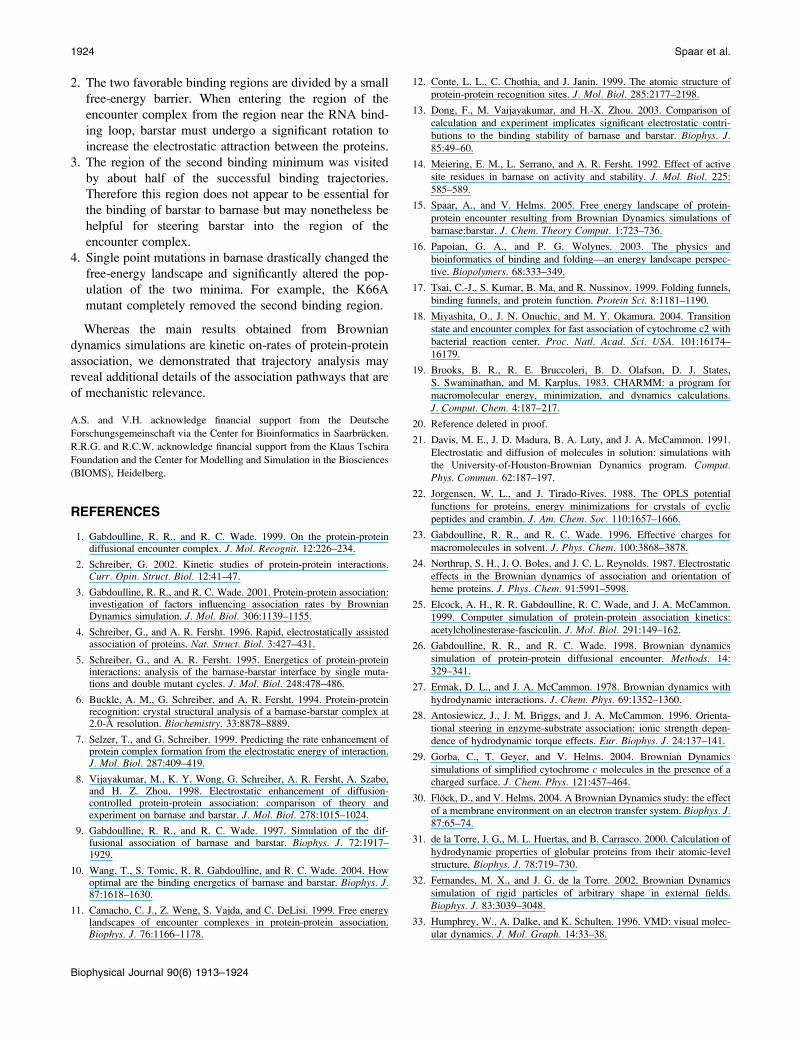
tion pathways may look different (see above). Table 1 lists
the center-to-center distances of the encounter complex, the
values of the free energy in the encounter complex, i.e., at the
minimal position of the free-energy profile, and the volumes
of the encounter-complex regions in Fig. 7 for barnase wild-
type and the mutants from both series. Please note that the
free-energy values only give an indication about the inter-
action strength between the proteins and cannot be correlated
with the free-energy values of the transition state or the
association rate constants.
As expected for the first series, the electrostatic energy
profiles in Fig. 6 A clearly reflect the decreased interaction
due to the decreased charge complementarity, whereas the
profiles of the desolvation energies and of the entropies are
very similar to those of the wild type. Thus, the volume di-
rectly above the interaction patch of barnase (the encounter-
complex region of the wild type) is much less favorable for
these mutants, as indicated by the resulting free-energy pro-
files. The positions of the corresponding encounter com-
plexes are shifted to a center-to-center distance of;40 A, to
the region of the second, small free-energy minimum of the
barnase wild-type. The corresponding free energies are;1.2
kcal/mol higher than that of the wild-type. Fig. 7, B–E,shows that the encounter-complex region of barnase wild
type is energetically less favorable for all mutants in this
series. Correspondingly, the larger parts of the encounter-
complex regions are located in the vicinity of the barnase
RNA binding loop. The resulting encounter-complex regions
are very similar for these mutants. Only the encounter-
complex region of the r59a mutant shows a constricted neck
near the RNA binding loop. The optimal association path-
ways are close to that of the wild type.
The second mutant series shows a different picture. The
corresponding energy profiles and encounter-complex re-
gions are displayed in Figs. 6 B and 7, F–K, respectively.Due to the increased electrostatic interaction, the association
funnels for the E60A and D54A mutants are much deeper
compared to that of the wild type and the encounter-complex
positions are shifted slightly closer to the bound state. These
effects are even more pronounced for double mutants of
both residues. For the D54A/E60A mutant the association
funnel is almost three times deeper compared to the wild
type, and the encounter complex is 3 A closer to the position
of the bound state. Due to the steepness of the energy funnel,
the encounter-complex regions are much more compact.
However, the maximum-occupancy positions indicate that
the region of the second free-energy minimum of the wild
type is still energetically favorable when either the E60 or the
D54 residue is mutated. Only by mutating both residues
does the interaction between barstar and barnase be-
come strong enough to change the optimal association path-
way.
We described above how the mutants of the first set
largely abolish the favorable encounter-complex region of
the wild type. Is it possible to remove the region of the
second minimum as well? Fig. 7 I shows that it is the K66
residue that is responsible for the energetically favorable re-
gion near the RNA binding loop. For a K66A mutant, this
region becomes unfavorable, an effect which is also reflected
by the missing shoulder in the free-energy profile at ;40 A.
The free-energy funnel is almost as deep as that of the wild-
type. This is a surprising effect because the mutation of K66
decreases the electrostatic interaction between the proteins.
The K66A/D54A double mutant, which has the same total
charge as the wild type, shows a behavior similar to that of
K66A, and the energy funnel is even deeper than that of the
E60A mutant.
DISCUSSION
The diffusional association behavior of barstar and barnase
was analyzed in detail. The methods of analysis involved the
computation of the occupancy and the free-energy land-
scapes and were extended for the analysis of specific features
such as the encounter-complex regions, the optimal path-
ways, the difference between the pathways of association
and dissociation, and the coupling of the translational and
rotational motions. In the second part, these methods were
applied to analyzing the effects of various barnase mutations
on the diffusional association behavior.
1920 Spaar et al.
Biophysical Journal 90(6) 1913–1924

Diffusional association behavior of the wild types
The energy profiles resulting from the diffusional association
of barstar with wild-type barnase were discussed extensively
in a previous study (15), which also described in detail the
method for computing the occupancy and free-energy land-
scapes. In this study, we focused attention on the association
behavior of the proteins, in particular with respect to the
small free-energy barrier in the free-energy profile (see Fig. 2
C). We found that this barrier divides the energetically
favorable region into the region near the RNA binding loop
and the region of the encounter complex, which is located
above the interaction patch of barnase and from which
FIGURE 6 Energy profiles for the
wild type of barnase and its mutants,
split into the first (A) and second (B)
sets of mutants: The electrostatic energy
DEel (upper left), the desolvation en-
ergy DEds (lower left), the translational/
rotational entropy loss –TDS (upperright), and, as the sum of all, the free
energy DG (lower right).
Diffusional Encounter 1921
Biophysical Journal 90(6) 1913–1924
barstar can continuously reorient to finally bind to barnase.
(In this article, the encounter complex is defined as the state
of minimal free energy. In addition to this definition in terms
of energy, the encounter complex may be defined by
structural criteria (1).)
The maps of the occupancy and free-energy landscapes
(see Fig. 2) suggest that the association pathway of barstar
proceeds toward the RNA binding loop of barnase as was
proposed in previous studies (9,11). The region near the
RNA binding loop is actually the region of the second, small
free-energy minimum along the reaction path (see the graph
on the right in Fig. 2 C). Visualizing the optimal center-
of-mass position of barstar, derived from the maps of the
occupancy and free-energy landscapes (see Fig. 4 A), indeedsupports this hypothesis. However, a different picture was
obtained from a detailed analysis of the successful trajecto-
ries, i.e., those trajectories that fulfill the contact criterion and
most probably lead to the formation of the final complex.
The optimal center-of-mass positions derived from those
trajectories only show no overlap with the energetically fa-
vorable region near the RNA binding loop. These results
suggest that this region is not essential for the binding of
barstar to barnase, but is probably helpful in steering barstar
into the region of the encounter complex. It is possible that
the presence of barstar in this region may also decrease the
probability of barnase binding to the RNA. In this way, the
region of the second, small free-energy minimum could
support the biological function of barnase as an inhibitor of
barstar. Furthermore, we found no evidence for a difference
between the association and dissociation pathways during
this analysis. Within the limitations of this study, which only
considered the relative motion of two rigid proteins, we
therefore conclude that statistically the two pathways are
very close, if not equal.
By analyzing the position-dependent (mean) orientation of
barstar, we found that the orientational motion was more
strongly coupled to the positional motion than we expected.
This analysis revealed a surprising detail of the association
behavior: When encountering barnase on the side of its RNA
binding loop, the barstar interface is pointing ‘‘backward’’;
i.e., in this position barstar orients in such a way as to avoid
contact between its negatively charged interaction patch and
the likewise negatively charged binding-loop region of
barnase. To cross the free-energy barrier, however, barstar
has to reorient to increase the attraction between
FIGURE 7 Regions of the encounter complex and the center-of-mass
positions of maximum occupancy for increasing distance for the wild type of
barnase (A) and for its mutants as obtained from the analysis of all simulated
trajectories. (B–E) Results for the first set of mutants. (F–K) Results for thesecond set of mutants. The encounter-complex regions are defined by the
center-of-mass positions of barstar with a free energy within 1.5 kcal/mol
from the minimum free energy, i.e., those that fulfill DG # DGmin 1 1.5
kcal/mol.
TABLE 1 Center-to-center distance d1–2,enc, value of the free
energy DGenc, and volume of the encounter-complex region Venc
for barnase wild type and mutants
d1–2,enc (A) DGenc (kcal/mol) Venc (A3)
WT 31.6 �3.96 19,670
K27A 40.1 �2.80 40,810
R59A 40.2 �2.69 41,600
R83Q 40.2 �2.88 41,990
R87A 40.1 �2.82 48,910
D54A 29.6 �9.47 943
E60A 30.5 �5.79 6086
D54A/ E60A 28.6 �10.58 1569
K66A 32.3 �3.77 10,940
K66A/ D54A 30.8 �5.94 5909
The values given are based on the encounter-complex region shown in Fig. 7.
The values of the center-to-center distances were obtained by a parabolic fit
around the free-energy minimum.
1922 Spaar et al.
Biophysical Journal 90(6) 1913–1924
the oppositely charged interaction patches by moving in a
‘‘forward’’ direction.
As mentioned above, Brownian dynamics simulations of
relative interprotein motion typically do not: 1), sample the
internal degrees of freedom of the proteins; 2), account for
the perturbative effect at close distances of the moving
protein on the electrostatic field created by the other protein;
3), consider the molecular nature of the solvent; and 4),
include short-range hydrophobic interactions. Moreover, this
study did not consider hydrodynamic interactions of the
proteins as these have been estimated to be of minor
importance for the diffusional encounter of proteins (28,29).
Recently, Garcia de la Torre and co-workers have developed
methods for evaluating the translational and rotational
diffusion coefficients of arbitrarily shaped particles (31)
and for simulating Brownian trajectories of nonisotropic
particles (32). Estimating such effects on the diffusive
protein motion close to the encounter region is worth
addressing in future work. One may further consider the
possibility that residues at the binding interface undergo
changes of their titration states upon binding. However, we
believe that this point is of minor importance at the distances
up to the encounter region that were sampled in this study.
The effect of mutations
From the mutant studies we gained detailed insight into
modulations of the diffusional association behavior, which is
finally reflected in the different association rates. At the
beginning of this work, it was not completely clear to us
whether the energetically favorable region near the RNA
binding loop facilitates or hinders the association of barstar
to barnase. Therefore, we studied two series of mutations.
The first set removes the positively charged residues K27A,
R59A, R83Q, and R87A from the binding interface. The
second set consists of D54A, E60A, D54A/E60A, K66A,
and K66A/D54A. D54 and E60 are negatively charged
residues of the interface. K66 is a positively charged residue
at the RNA binding loop (see Fig. 2 C) (3).The energy profiles in Fig. 6 A show that all mutations of
the first series lead to a decreased interaction between the
proteins, in particular at smaller distances. The decreased
charge complementarity at the binding interface leads to a
flatter energy funnel, and therefore the encounter-complex
regions in Fig. 7, B–E, are larger compared to that of the wild
type (Fig. 7 A). Most prominently, the region above the
interface of barnase, which is the encounter-complex region
of the wild-type, becomes much less favorable, whereas the
association behavior up to this region seems to be similar to
that of the wild type. The region near the RNA binding loop
is energetically very similar for the mutants in this series.
Their encounter-complex positions are located in this region
as well, ;8 A farther away from the barnase center than the
encounter complex of the wild type. For the R87A mutant
and for the wild type, a two-step encounter process could be
proposed, since the corresponding free-energy landscapes
have a minimum at this position and one above the center of
the interaction patch of barnase.
The mutations D54A and E60A of the second mutation
series show a behavior opposite to that of the mutants of the
first series: due to the increased electrostatic interaction the
energy funnel is much deeper and the small free-energy
barrier disappears. However, a shoulder remains in the free-
energy profile in the region of the binding loop. The
maximum-occupancy configurations are still close to that of
the wild type, i.e., the region near the RNA binding loop is
also energetically favorable for both mutants. Only by mu-
tating both residues does the electrostatic interaction become
strong enough to alter the occupancy in this region. In all
three cases the encounter complex moved closer to the bound
structure compared to the encounter complex of the wild
type. The mutation of K66A shows a different effect: the
region near the RNA binding loop becomes much less fa-
vorable, and therefore the occupancy in this region is strongly
reduced. This shows that the K66 residue is responsible for
this region near the RNA binding loop and also for the
second, small free-energy minimum for the wild type.
Correspondingly, also, the free-energy profiles of this mutant
and of K66A/D54A do not show a shoulder at ;40 A
distance. The energy funnel for this mutant is even deeper
than that of the E60A mutant, although its total charge is the
same as for the wild type.
One of the most important results from these mutant
studies is the observation that the free-energy landscape can
drastically change by mutating a single residue. Addressing
changes of the position of the transition state is beyond the
capabilities of the simulation approach due to the simplifi-
cations at small contact distances. However, one can expect
that the position of the transition state will not be unaffected
if the encounter-complex position varies that much. This
result is inconsistent with the assumption of Miyashita et al.
(18) that positions of the encounter complexes (and the
transition states) are identical for all mutants. Maybe this
assumption holds for the system of the cytochrome c2-reaction center that they investigated, but it is clearly not true
for the barnase-barstar system studied here.
CONCLUDING REMARKS
For the barnase-barstar model system, which involves a
protein-protein pair with strong electrostatic complementar-
ity, this study provides details of diffusive motion on the
interaction free energy surface. Here, we summarize our
main findings:
1. From Brownian dynamics simulations, we identified a
favorable free-energy minimum for barstar at ;10 A
distance from its position the bound complex, which is
termed the encounter-complex region. A second free-
energy minimum was found near the RNA binding loop
of barnase.
Diffusional Encounter 1923
Biophysical Journal 90(6) 1913–1924
2. The two favorable binding regions are divided by a small
free-energy barrier. When entering the region of the
encounter complex from the region near the RNA bind-
ing loop, barstar must undergo a significant rotation to
increase the electrostatic attraction between the proteins.
3. The region of the second binding minimum was visited
by about half of the successful binding trajectories.
Therefore this region does not appear to be essential for
the binding of barstar to barnase but may nonetheless be
helpful for steering barstar into the region of the
encounter complex.
4. Single point mutations in barnase drastically changed the
free-energy landscape and significantly altered the pop-
ulation of the two minima. For example, the K66A
mutant completely removed the second binding region.
Whereas the main results obtained from Brownian
dynamics simulations are kinetic on-rates of protein-protein
association, we demonstrated that trajectory analysis may
reveal additional details of the association pathways that are
of mechanistic relevance.
A.S. and V.H. acknowledge financial support from the Deutsche
Forschungsgemeinschaft via the Center for Bioinformatics in Saarbrucken.
R.R.G. and R.C.W. acknowledge financial support from the Klaus Tschira
Foundation and the Center for Modelling and Simulation in the Biosciences
(BIOMS), Heidelberg.
REFERENCES
1. Gabdoulline, R. R., and R. C. Wade. 1999. On the protein-proteindiffusional encounter complex. J. Mol. Recognit. 12:226–234.
2. Schreiber, G. 2002. Kinetic studies of protein-protein interactions.Curr. Opin. Struct. Biol. 12:41–47.
3. Gabdoulline, R. R., and R. C. Wade. 2001. Protein-protein association:investigation of factors influencing association rates by BrownianDynamics simulation. J. Mol. Biol. 306:1139–1155.
4. Schreiber, G., and A. R. Fersht. 1996. Rapid, electrostatically assistedassociation of proteins. Nat. Struct. Biol. 3:427–431.
5. Schreiber, G., and A. R. Fersht. 1995. Energetics of protein-proteininteractions: analysis of the barnase-barstar interface by single muta-tions and double mutant cycles. J. Mol. Biol. 248:478–486.
6. Buckle, A. M., G. Schreiber, and A. R. Fersht. 1994. Protein-proteinrecognition: crystal structural analysis of a barnase-barstar complex at2.0-A resolution. Biochemistry. 33:8878–8889.
7. Selzer, T., and G. Schreiber. 1999. Predicting the rate enhancement ofprotein complex formation from the electrostatic energy of interaction.J. Mol. Biol. 287:409–419.
8. Vijayakumar, M., K. Y. Wong, G. Schreiber, A. R. Fersht, A. Szabo,and H. Z. Zhou. 1998. Electrostatic enhancement of diffusion-controlled protein-protein association: comparison of theory andexperiment on barnase and barstar. J. Mol. Biol. 278:1015–1024.
9. Gabdoulline, R. R., and R. C. Wade. 1997. Simulation of the dif-fusional association of barnase and barstar. Biophys. J. 72:1917–1929.
10. Wang, T., S. Tomic, R. R. Gabdoulline, and R. C. Wade. 2004. Howoptimal are the binding energetics of barnase and barstar. Biophys. J.87:1618–1630.
11. Camacho, C. J., Z. Weng, S. Vajda, and C. DeLisi. 1999. Free energylandscapes of encounter complexes in protein-protein association.Biophys. J. 76:1166–1178.
12. Conte, L. L., C. Chothia, and J. Janin. 1999. The atomic structure of
protein-protein recognition sites. J. Mol. Biol. 285:2177–2198.
13. Dong, F., M. Vaijayakumar, and H.-X. Zhou. 2003. Comparison of
calculation and experiment implicates significant electrostatic contri-
butions to the binding stability of barnase and barstar. Biophys. J.85:49–60.
14. Meiering, E. M., L. Serrano, and A. R. Fersht. 1992. Effect of active
site residues in barnase on activity and stability. J. Mol. Biol. 225:585–589.
15. Spaar, A., and V. Helms. 2005. Free energy landscape of protein-
protein encounter resulting from Brownian Dynamics simulations of
barnase:barstar. J. Chem. Theory Comput. 1:723–736.
16. Papoian, G. A., and P. G. Wolynes. 2003. The physics and
bioinformatics of binding and folding—an energy landscape perspec-
tive. Biopolymers. 68:333–349.
17. Tsai, C.-J., S. Kumar, B. Ma, and R. Nussinov. 1999. Folding funnels,
binding funnels, and protein function. Protein Sci. 8:1181–1190.
18. Miyashita, O., J. N. Onuchic, and M. Y. Okamura. 2004. Transition
state and encounter complex for fast association of cytochrome c2 with
bacterial reaction center. Proc. Natl. Acad. Sci. USA. 101:16174–
16179.
19. Brooks, B. R., R. E. Bruccoleri, B. D. Olafson, D. J. States,
S. Swaminathan, and M. Karplus. 1983. CHARMM: a program for
macromolecular energy, minimization, and dynamics calculations.
J. Comput. Chem. 4:187–217.
20. Reference deleted in proof.
21. Davis, M. E., J. D. Madura, B. A. Luty, and J. A. McCammon. 1991.
Electrostatic and diffusion of molecules in solution: simulations with
the University-of-Houston-Brownian Dynamics program. Comput.Phys. Commun. 62:187–197.
22. Jorgensen, W. L., and J. Tirado-Rives. 1988. The OPLS potential
functions for proteins, energy minimizations for crystals of cyclic
peptides and crambin. J. Am. Chem. Soc. 110:1657–1666.
23. Gabdoulline, R. R., and R. C. Wade. 1996. Effective charges for
macromolecules in solvent. J. Phys. Chem. 100:3868–3878.
24. Northrup, S. H., J. O. Boles, and J. C. L. Reynolds. 1987. Electrostatic
effects in the Brownian dynamics of association and orientation of
heme proteins. J. Phys. Chem. 91:5991–5998.
25. Elcock, A. H., R. R. Gabdoulline, R. C. Wade, and J. A. McCammon.
1999. Computer simulation of protein-protein association kinetics:
acetylcholinesterase-fasciculin. J. Mol. Biol. 291:149–162.
26. Gabdoulline, R. R., and R. C. Wade. 1998. Brownian dynamics
simulation of protein-protein diffusional encounter. Methods. 14:
329–341.
27. Ermak, D. L., and J. A. McCammon. 1978. Brownian dynamics with
hydrodynamic interactions. J. Chem. Phys. 69:1352–1360.
28. Antosiewicz, J., J. M. Briggs, and J. A. McCammon. 1996. Orienta-
tional steering in enzyme-substrate association: ionic strength depen-
dence of hydrodynamic torque effects. Eur. Biophys. J. 24:137–141.
29. Gorba, C., T. Geyer, and V. Helms. 2004. Brownian Dynamics
simulations of simplified cytochrome c molecules in the presence of a
charged surface. J. Chem. Phys. 121:457–464.
30. Flock, D., and V. Helms. 2004. A Brownian Dynamics study: the effect
of a membrane environment on an electron transfer system. Biophys. J.87:65–74.
31. de la Torre, J. G., M. L. Huertas, and B. Carrasco. 2000. Calculation of
hydrodynamic properties of globular proteins from their atomic-level
structure. Biophys. J. 78:719–730.
32. Fernandes, M. X., and J. G. de la Torre. 2002. Brownian Dynamics
simulation of rigid particles of arbitrary shape in external fields.
Biophys. J. 83:3039–3048.
33. Humphrey, W., A. Dalke, and K. Schulten. 1996. VMD: visual molec-
ular dynamics. J. Mol. Graph. 14:33–38.
1924 Spaar et al.
Biophysical Journal 90(6) 1913–1924