Differential vulnerability of the rat retina, suprachiasmatic nucleus and intergeniculate leaflet to...
14
Brain Research Bulletin 64 (2005) 395–408 Differential vulnerability of the rat retina, suprachiasmatic nucleus and intergeniculate leaflet to malnutrition induced during brain development M.C.R. Vilela a , J.E.F. Mendonc ¸a a , H. Bittencourt a , R.M. Lapa a , M.L.M. Alessio a , M.S.M.O. Costa c , R.C.A. Guedes b , V.L. Silva a , B.L.S. Andrade da Costa a,∗ a Departamento de Fisiologia e Farmacologia, Centro de Ciˆ encias Biol ´ ogicas, Cidade Universit´ aria 50670901 Recife, PE, Brazil b Departamento de Nutri¸ c˜ ao, Centro de Ciˆ encias da Sa ´ ude, Universidade Federal de Pernambuco, Cidade Universit´ aria, Recife, PE, Brazil c Departamento de Morfologia, Centro de Biociˆ encias, Universidade Federal do Rio Grande do Norte, Natal, RN, Brazil Received 22 September 2003; received in revised form 5 April 2004; accepted 6 September 2004 Available online 19 November 2004 Abstract We investigated in young rats the effects of malnutrition on the main structures of the circadian timing system: retina, hypothalamic suprachiasmatic nuclei (SCN), thalamic intergeniculate leaflet, retinohypothalamic- and geniculohypothalamic tracts. Control rats were born from mothers fed a commercial diet since gestation, and malnourished rats from mothers fed a multideficient diet since gestation (GLA group) or lactation (LA group). After weaning, pups received the same diet as their mothers, and were analysed at postnatal days 27, 30–33 and 60–63. Brain sections were processed to visualise in the SCN neuropeptide Y immunoreactivity and terminal labeling after intraocular tracer injections. Nissl staining was used to assess cytoarchitectonic boundaries of the SCN and cell features in retinal whole mounts. Cell counts, morphometric and densitometric analysis were performed. Compared with controls, the total retinal surface was reduced and the topographical distribution of retinal ganglion cells was altered in malnourished rats, with changes in their density. Alterations were also detected in the SCN dimensions in the GLA and LA groups at one and two postnatal months, as well as in the SCN portion occupied by the retinal input in the GLA group at days 30–33, but not in the NPY-containing geniculohypothalamic tract. The present data point to subtle changes, with a low and differential vulnerability to early malnutrition, of structures involved in circadian timing regulation. Furthermore, the present findings suggest that the altered circadian rhythmicity previously documented in malnourished rats cannot be ascribed to impaired development of the retino- and geniculohypothalamic projections to the SCN. © 2004 Elsevier Inc. All rights reserved. Keywords: Circadian timing system; Nutrition; Retinohypothalamic tract; Geniculohypothalamic tract; Retinal ganglion cells; Neuropeptide Y 1. Introduction The problem of infant malnutrition raises growing inter- est, and several studies have aimed to define the relationship between nutritional status and cell growth or maturation in the brain. These studies have indicated a marked vulnera- bility of the developing nervous system to changes in the environment, particularly when these changes occur during ∗ Corresponding author. Tel.: +55 81 21268530; fax: +55 81 21268500/21268350. E-mail address: [email protected] (B.L.S. Andrade da Costa). the so-called “brain growth-spurt period” [44,58,74]. In hu- mans, this corresponds to the period between the last trimester of fetal life and the third postnatal year. In the rat, this pe- riod corresponds to the first three postnatal weeks, i.e., the lactation period, when developmental phenomena such as neurogenesis, gliogenesis and myelination peak, though at different times depending upon the brain region. Malnutri- tion may alter brain histogenesis, causing a variation of the proliferation rates of neural and glial progenitor cells, and can induce alterations in the regulation of several neurotrans- mitters [1,9,17,46,63,65]. Such alterations vary in different brain regions and lead to adaptive changes in metabolic and 0361-9230/$ – see front matter © 2004 Elsevier Inc. All rights reserved. doi:10.1016/j.brainresbull.2004.09.011
Transcript of Differential vulnerability of the rat retina, suprachiasmatic nucleus and intergeniculate leaflet to...
Brain Research Bulletin 64 (2005) 395–408
Differential vulnerability of the rat retina, suprachiasmatic nucleus andintergeniculate leaflet to malnutrition induced during brain development
M.C.R. Vilelaa, J.E.F. Mendonc¸aa, H. Bittencourta, R.M. Lapaa, M.L.M. Alessioa,M.S.M.O. Costac, R.C.A. Guedesb, V.L. Silvaa, B.L.S. Andrade da Costaa,∗
a Departamento de Fisiologia e Farmacologia, Centro de Ciˆencias Biologicas, Cidade Universit´aria 50670901 Recife, PE, Brazilb Departamento de Nutri¸cao, Centro de Ciˆencias da Sa´ude, Universidade Federal de Pernambuco, Cidade Universit´aria, Recife, PE, Brazil
c Departamento de Morfologia, Centro de Biociˆencias, Universidade Federal do Rio Grande do Norte, Natal, RN, Brazil
Received 22 September 2003; received in revised form 5 April 2004; accepted 6 September 2004Available online 19 November 2004
Abstract
We investigated in young rats the effects of malnutrition on the main structures of the circadian timing system: retina, hypothalamics were bornf LA group)o 30–33 and6 ular traceri Cell counts,m pographicald in the SCNd put in theG with a lowa findingss ment of ther©
K
1
ebtbe
f
esterpe-., thech asgh atutri-f theandrans-ntc and
0d
uprachiasmatic nuclei (SCN), thalamic intergeniculate leaflet, retinohypothalamic- and geniculohypothalamic tracts. Control ratsrom mothers fed a commercial diet since gestation, and malnourished rats from mothers fed a multideficient diet since gestation (Gr lactation (LA group). After weaning, pups received the same diet as their mothers, and were analysed at postnatal days 27,0–63. Brain sections were processed to visualise in the SCN neuropeptide Y immunoreactivity and terminal labeling after intraoc
njections. Nissl staining was used to assess cytoarchitectonic boundaries of the SCN and cell features in retinal whole mounts.orphometric and densitometric analysis were performed. Compared with controls, the total retinal surface was reduced and the toistribution of retinal ganglion cells was altered in malnourished rats, with changes in their density. Alterations were also detectedimensions in the GLA and LA groups at one and two postnatal months, as well as in the SCN portion occupied by the retinal inLA group at days 30–33, but not in the NPY-containing geniculohypothalamic tract. The present data point to subtle changes,nd differential vulnerability to early malnutrition, of structures involved in circadian timing regulation. Furthermore, the presentuggest that the altered circadian rhythmicity previously documented in malnourished rats cannot be ascribed to impaired developetino- and geniculohypothalamic projections to the SCN.
2004 Elsevier Inc. All rights reserved.
eywords:Circadian timing system; Nutrition; Retinohypothalamic tract; Geniculohypothalamic tract; Retinal ganglion cells; Neuropeptide Y
. Introduction
The problem of infant malnutrition raises growing inter-st, and several studies have aimed to define the relationshipetween nutritional status and cell growth or maturation in
he brain. These studies have indicated a marked vulnera-ility of the developing nervous system to changes in thenvironment, particularly when these changes occur during
∗ Corresponding author. Tel.: +55 81 21268530;ax: +55 81 21268500/21268350.
E-mail address:[email protected] (B.L.S. Andrade da Costa).
the so-called “brain growth-spurt period”[44,58,74]. In hu-mans, this corresponds to the period between the last trimof fetal life and the third postnatal year. In the rat, thisriod corresponds to the first three postnatal weeks, i.elactation period, when developmental phenomena suneurogenesis, gliogenesis and myelination peak, thoudifferent times depending upon the brain region. Malntion may alter brain histogenesis, causing a variation oproliferation rates of neural and glial progenitor cells,can induce alterations in the regulation of several neurotmitters[1,9,17,46,63,65]. Such alterations vary in differebrain regions and lead to adaptive changes in metaboli
361-9230/$ – see front matter © 2004 Elsevier Inc. All rights reserved.oi:10.1016/j.brainresbull.2004.09.011

396 M.C.R. Vilela et al. / Brain Research Bulletin 64 (2005) 395–408
behavioural patterns[4,26,55]. Therefore, the alterations in-duced by malnutrition can variably dissociate brain structurefrom its function. The severity of the effect depends upon thetiming, intensity and duration of the nutritional disturbance[32,55].
The brain circadian timing system acts as a multioscilla-tory device, playing a key role in the adjustment of the animalto its environment. The suprachiasmatic nucleus of the an-terior hypothalamus (SCN) and the thalamic intergeniculateleaflet (IGL) are important components of this system in-volved in photic and non-photic information processing, usedto entrain behavioural and physiological responses to exoge-nous cues. The timing of the endogenous pacemaker localisedin the SCN is synchronised to the external light–dark cycle.This is achieved primarily through information relayed tothe SCN directly from the retina via the retinohypothalamictract (RHT), and indirectly from the IGL, i.e. via the genicu-lohypothalamic tract (GHT), which contains neuropeptideY (NPY). The GHT- and serotoninergic projections fromthe raphe nuclei are also believed to convey behavioural en-training input to the SCN. Efferent projections of the SCNtransfer rhythmicity to centers subserving the regulation ofendocrine, autonomic and behavioural functions (reviews in[29,39,50,51,76]).
Studies carried out to analyse the effects of malnutrition ont t al-t hased take[a king,e re-d earlyl ud-i ritiono ech-a leep[ r-c rentl th-m edr cor-t ronicp
boves n ofc nt tol is-sh lvedi theira yt 6%c ut sof es ts att -
crease in the number and density of cells immunopositive tovasoactive intestinal polypeptide, vasopressin and glial fibril-lary acidic protein in the SCN of adult rats of 150 days of age.The latter study[2] also described in the SCN a 8% reductionin the number of afferent fibres containing serotonin, while nodifference was observed in the NPY-containing axon termi-nals deriving from the GHT. However, the organisation of theIGL and RHT has not been analysed so far in malnourishedanimals.
The aim of the present study was to investigate in youngrats whether chronic malnutrition induced by a multidefi-cient diet from gestation or lactation could alter the de-velopment of components of the circadian timing systeminvolved in the entrainment of physiological responses tothe light–dark cycle. The multideficient diet adopted in thepresent study is called the “regional basic diet” (RBD) andhas been used as experimental model of malnutrition in sev-eral studies on its neural effects[3,13,32,33,61,73]. RBD isrich in carbohydrates and fibres but poor in vitamins, min-erals, fats, and contains a low concentration of proteins,which derive predominantly from vegetables. RBD repro-duces, in this latter aspect, the diet common in malnour-ished human populations of several developing countries.The RBD-induced malnutrition can lead to significant alter-ations in physiological[7,52,59], metabolic, and behaviouralp ind isedt ectt cellso gesi N.B issls valu-a andt theN ndS
2
2
om2 ancea rin-c oci-e ovedb oft eP cle( dif-f ur-i incel ersf ix-
he temporal organisation of behaviour have pointed ouerations of circadian rhythms in malnourished rats. A pelay was reported in the rhythm of food- and water in
34] and in the plasma level of melatonin[35]. A cosinornalysis of behavioural patterns, such as grooming, drinating, exploring, curling up and lying down, revealed auced amplitude and mesor in malnourished rats during
ife [21]. Using different nutritional paradigms, several stes have demonstrated alterations induced by malnutn the synchronisation of circadian and homeostatic mnisms driving sleep, especially rapid-eye-movement s
18,19,25,30,66]. Aguilar-Roblero et al.[2] analysed the ciadian organisation of drinking behaviour under diffeighting conditions, and observed a splitting of the rhy
icity under the light–dark cycle in chronic malnourishats. Long-lasting alterations in the circadian rhythm ofical temperature oscillation were also detected after chrotein malnutrition[16].
The changes observed in the studies mentioned auggested that malnutrition may affect the expressioircadian rhythmicity in processes such as entrainmeight–dark cycles, coupling among oscillators or transmion of rhythmicity to the effectors[2]. According to thisypothesis, malnutrition may affect the structures invo
n the circadian timing system, such as the SCN and/orfferent and efferent projections[41]. To our knowledge, onl
wo studies, adopting chronic low-protein malnutrition (asein) from 5 weeks before mating, have been carried oar on this subject. Cintra et al.[20] reported a reduction in thize of three cell types in the SCN, especially in young rahe age of 30 days. Aguilar-Roblero et al.[2] observed a de
arameters[10,24,42,62,73]. Considering the RBD proteeficiency, both in quantity and in quality, we hypothes
hat chronic malnutrition induced by this diet could affhe neurogenesis or development of retinal ganglionr IGL neurons containing NPY, or induce plastic chan
n the terminal fields of the RHT or GHT in the SCy using anterograde axonal tracing combined with Ntaining and immunohistochemical approaches, we eted the pattern of organisation of retinofugal terminals
he size of the SCN, retinal ganglion cell density, andPY immunoreactivity pattern of GHT fibres in the IGL aCN.
. Materials and methods
.1. Animals and diets
A total of 168 Wistar rats of both sexes, obtained fr8 litters (six pups per litter), were used. The maintennd use of experimental animals complied with the piples regarding the care and use of animals of the Sty for Neuroscience and the ethical requirements appry the Institutional Animal Care and Use Committee
heCentro de Ciencias Biologicas/Universidade Federal dernambuco. The rats were kept on a 12 h light/dark cylights on 6:00 h) and divided into three groups undererent nutritional conditions: control rats (C), rats malnoshed since gestation (GLA), and rats malnourished sactation (LA). The control animals were born from mothed a commercial lab chow diet containing 22% of a m

M.C.R. Vilela et al. / Brain Research Bulletin 64 (2005) 395–408 397
Table 1Composition of the “regional basic diet”
Ingredients g/100g Protein Carbohydrate Fat Ash Fibres kcal%a
Beansb 18.34 3.99 10.66 0.24 0.57 1.09 60.76Manioc flour 64.81 0.84 48.59 0.12 0.43 5.64 198.80Defatted, dried, salted meatb 3.74 2.74 – 0.06 0.06 – 11.50Fat (from the meat) 0.35 – – 0.35 – – 3.15Sweet potatob 12.76 0.30 9.99 0.03 0.20 0.48 41.43
Total 100.00 7.87 69.24 0.80 1.26 7.21 315.64a Expressed as kcal provided by 100 g of diet.b Cooked, dried and ground.
ture of animal and soy protein (Agribands Purina do Brasil)from the time of mating. After weaning on postnatal day(P) 25, the male and female control rat pups were separatedand fed ad libitum with the same diet as the mothers. Mal-nourished rats were born from mothers fed with the RBD,containing only 8% proteins in a 5:3 proportion of vege-tal to animal proteins[73]. Briefly, the diet was preparedwith beans (Phaseolus vulgaris), manioc flour (Manioc es-culenta), sweet potato (Ipomoea batatas) and dried-saltedmeat (for details, see[73]). The composition of this diet isshown inTable 1.
The mothers of the GLA group received the RBD dietduring the periods of mating, gestation and lactation, whilethe mothers of the LA group received it only during lacta-tion. After weaning (P25), male and female pups of bothmalnourished groups were separated and kept receiving thesame deficient diet ad libitum.
In each group, animals were sampled randomly from dif-ferent litters and housed three per cage in a room maintainedat 22± 2◦C with 67% relative air humidity. They were anal-ysed at three ages: P27 (n= 6 per group), P30–33 (n= 24 C,n= 28 GLA,n= 23 LA) and at two months (P60–63;n= 26 C,n= 27 GLA,n= 17 LA).
2.2. Intraocular tracer injections
tero-g on-s adultp dert lop-m ales)wP and6 ilat-e ra-t nsd ionsoo vit-r ee-d uxo ure,t from
anaesthesia. Post-injection survival times ranged from 3 to5 days.
2.3. Perfusion
At the time of sacrifice, the rats were again anesthetisedwith sodium pentobarbital (40–60 mg/kg, i.p. for malnour-ished rats and 60–80 mg/kg, i.p. for control ones) and per-fused transcardially first with saline (0.9% NaCl) followedby 4% paraformaldeyde in 0.1 M phosphate buffer, pH 7.4(PB). Perfusion was always performed between 12:00 and18:00, with a continuous infusion pump (Harvard equip-ments) through a cannula inserted into the left ventricle. Per-fusion rates were 3.82 and 7.64 ml/min for malnourished andcontrol rats, respectively. The volume of saline and fixativediffered according to the body weight of the animals (20 mlsaline and 200 ml fixative for malnourished rats and 50 mlsaline and 400 ml of fixative for control rats). After perfusion,the brains were dissected out from the prefrontal cortex to theinferior limit of the brainstem (the olfactory bulb, cochleaeand spinal cord were excluded). They were then postfixedfor 2 h in the same fixative, rinsed in PB and weighed (wetweight). Subsequently, the brains were cryoprotected in so-lutions of 10%, 20% and 30% sucrose in PB. The same perfu-sion procedure described above was adopted for control andm wereu CN.
2s
ro-t -n ien-c ar-ra r-c uno-h pH6 erer ce ofC colw abbita 000
The analysis of the RHT was performed using the anrade axonal transport of cholera toxin subunit B (CTb). Cidering that the RHT of well-nourished rats reaches theattern at P30[72], we analysed animals at this age in or
o investigate whether malnutrition could alter the deveent of this tract. The animals (nine females and six mere anesthetised with sodium pentobarbital (CrystaliaR, Saoaulo, Brazil; 30–40 mg/kg, i.p. for malnourished rats0–80 mg/kg, i.p. for control ones) and subjected to unral intraocular injections of CTb (List Biological Labo
ories, Inc., Campbell, CA). The volume of CTb injectioiffered according to the eye size of the animals. Injectf 10�l (for malnourished rats) and 15�l (for control rats)f a 1 mg/ml aqueous CTb solution were made into theeous body using a 0.3 ml syringe. After injection, the nle was left in place for a few minutes to minimize reflf the solution. Immediately after the injection proced
he animals were returned to their cages to recover
alnourished animals at P30–33 and P60–63, whichsed to analyse NPY immunoreactivity in the IGL and S
.4. Immunohistochemical procedures and Nissltaining
Brain blocks were serially cut on a freezing micome (Leitz Wetzlar) into 50�m-thick sections in the coroal plane, throughout the rostrocaudal extent of the dephalon. All sections were collected serially in PB andanged in two series. The atlases of Paxinos and Watson[60],nd Sherwood and Timiras[68] were used to delimit cytoahitectonic regions. The series of sections used for immistochemistry was first treated with 0.01 M citrate buffer,.0, at 60◦C for 2 h. Thereafter, free-floating sections winsed in PB several times. In order to reveal the presenTb or NPY, the avidin–biotin–peroxidase (ABC) protoas adopted. Sections were incubated with polyclonal rnti-CTb antiserum (Sigma, St. Louis, MO) diluted 1:5
398 M.C.R. Vilela et al. / Brain Research Bulletin 64 (2005) 395–408
in PB containing 0.3% Triton X-100 (PBX) and 2% normalgoat serum (NGS) for 48 h at 4◦C. Sections processed to visu-alise NPY immunoreactivity were pre-incubated in 10% NGSfollowed by polyclonal rabbit anti-NPY antiserum (Sigma)diluted 1:8000 in PB containing 1% NGS for 48–72 h at4◦C. The sections were then incubated for 1.5 h in secondaryantiserum (biotinylated goat anti-rabbit IgG; Vector Labs,Burlingame, CA) diluted 1:200 in PBX, and processed forimmunoperoxidase staining using the ABC complex (Stan-dard ABC kit, Vector Labs). The binding of antibodies wasrevealed by the addition of diaminobenzidine tetrahydrochlo-ride 0.05% (Sigma) and 0.01% H2O2 in PB, for 10 min. Sub-sequently, the free-floating sections were rinsed in PB andmounted on gelatin-coated slides. These procedures werecarried out simultaneously in brain sections from controland malnourished animals. As for the control of the stain-ing specificity, some sections were subjected to the immuno-histochemical procedure omitting the primary antiserum. Aminimum of five animals per group were studied using eachantibody. The series of sections used to analyse the cytoar-chitectonic boundaries of the SCN were processed by Nisslstaining with 0.25% cresyl violet, according to a previouslydescribed protocol[71].
2.5. Retinal whole mount preparation and Nissl staining
ento oa 27),a erfu-s –33,a andt werem on oft tinaw lides;N olem rdingt et werep rs im-m h thec sion.T olog-i holem ge ot e forW 0%wo catet nted.
2
Gh sed
to obtain digital images from brain sections and reti-nal whole mounts. Images from the SCN immunoreactedfor CTb or NPY, or stained with cresyl violet, were ob-tained with a 4× microscope objective; the IGL wasanalysed with a 20× objective, and a high power ob-jective (100×) was used for ganglion cell counting inNissl-stained retinal whole mounts. Care was taken toobtain the digital images using the same light intensityconditions.
2.7. Analysis of the retina
The counts of ganglion cells were performed in 0.5–1 mmsteps across the entire retina. The number of sampling ar-eas (frame size = 0.015 mm2) varied with the retinal size. InGLA and LA animals at P27–33, the counts were performedin 16–18 and 22–25 regions of interest, respectively, whilein the matched control group the cell counts were made inabout 28–30 regions of interest. At P60–63, the number ofregions of interest varied from a minimum of 25 in the GLAgroup to a maximum of 50 in the C group. The criteria andprotocol described by Stone[71] were adopted to distinguishganglion cells from neuroglia and from other neuron typesfound in the ganglion cell layer, as well as to construct iso-density lines based on the cell counts. Considering that ins cer-t ceda d. Ine theg fromd
2
neu-r Lab2 ut-l leusc madei outf bero sed.I ionst f theS el oft o an-tI rea-a ed byR tiono tiono CTbl SCNw nder-r und-a ore-
Considering that during rat development the refinemf the RHT occurs between P25 and P30[72], we choose tnalyse the retina at an intermediate day of this period (Ps well as at P30–33 and P60–63. Immediately after pion, the eyes of C, GLA and LA animals at P27 or P30nd of C and GLA animals at P60–63 were enucleated
he retinae dissected in PB. Prior to enucleation, marksade on the temporal side to aid subsequent identificati
he superior and inferior margins of the retina. Each reas processed as a whole mount on gelatin-coated sissl staining was obtained with 0.25% cresyl violet. Whount preparation and Nissl staining were done acco
o a previously described protocol[71]. In order to estimathe shrinkage due to perfusion, six retinal whole mountsrocessed from eyes enucleated before fixation and otheediately after saline perfusion, and then compared wit
ontralateral eyes subjected to paraformaldehyde perfuhe percentage of shrinkage due to perfusion and hist
cal processing was estimated by scanning all retinal wounts after each step. The area of each scanned ima
he retina was evaluated using the software Scion Imagindows. Retinae with overall shrinkage higher than 1ere excluded from analysis. Low power drawings (10×),btained from the outline of each retina, were used to lo
he sampling areas in which the ganglion cells were cou
.6. Data analysis
A Leica DMLS microscope coupled to SAMSUNigh level colour camera (model SHC-410NAD) was u
f
ome instances it is very difficult to be sure whether aain small cell body actually is a ganglion cell or a displamacrine cell, all cells identified as neurons were counteach group, the topographical distribution of neurons inanglion cell layer was analysed in at least six retinaeifferent animals.
.8. Morphometric analysis in brain sections
Cell body area and diameter of NPY-immunoreactiveons in the IGL were measured using the software Image000® (Roberto Carneiro Barro, Brazil), delimiting the o
ines of cell somata, in those cases in which the cell nucould be clearly identified. These measurements weren six animals per group, in the right and left IGL of abour sections per animal. In the IGL, a minimum numf 50 and a maximum of 100 cells were set to be analy
n Nissl-stained and NPY- or CTb-immunoreacted secthrough the hypothalamus, the quantitative analysis oCN was performed in sections through the middle lev
his nucleus, identified as corresponding approximately teroposterior (AP)—1.3 mm from bregma[60]. The softwaremage Lab 2000® was used for densitometry analysis, and diameter measurements of the SCN region occupiHT- and GHT axon terminals, and also for the evaluaf the SCN cytoarchitectonic boundaries. In the evaluaf the area of retinal terminals in the SCN, the sparse
abeling outside the cytoarchitectonic boundaries of theas excluded from the analysis. Considering that no ge
elated difference was found in the cytoarchitectonic bories defined by Nissl staining, the data of CTb immun
M.C.R. Vilela et al. / Brain Research Bulletin 64 (2005) 395–408 399
activity were analysed in three females and two males pergroup.
Statistical analysis was carried out using the Student’st-test, Student–Newman–Keuls test and analysis of variance(ANOVA), followed by the post-hoc Tuckey test when ap-propriate. Statistical significance was accepted at the 95%confidence level (α = 0.05) for comparison between controland malnourished groups.
3. Results
3.1. Body and brain weights
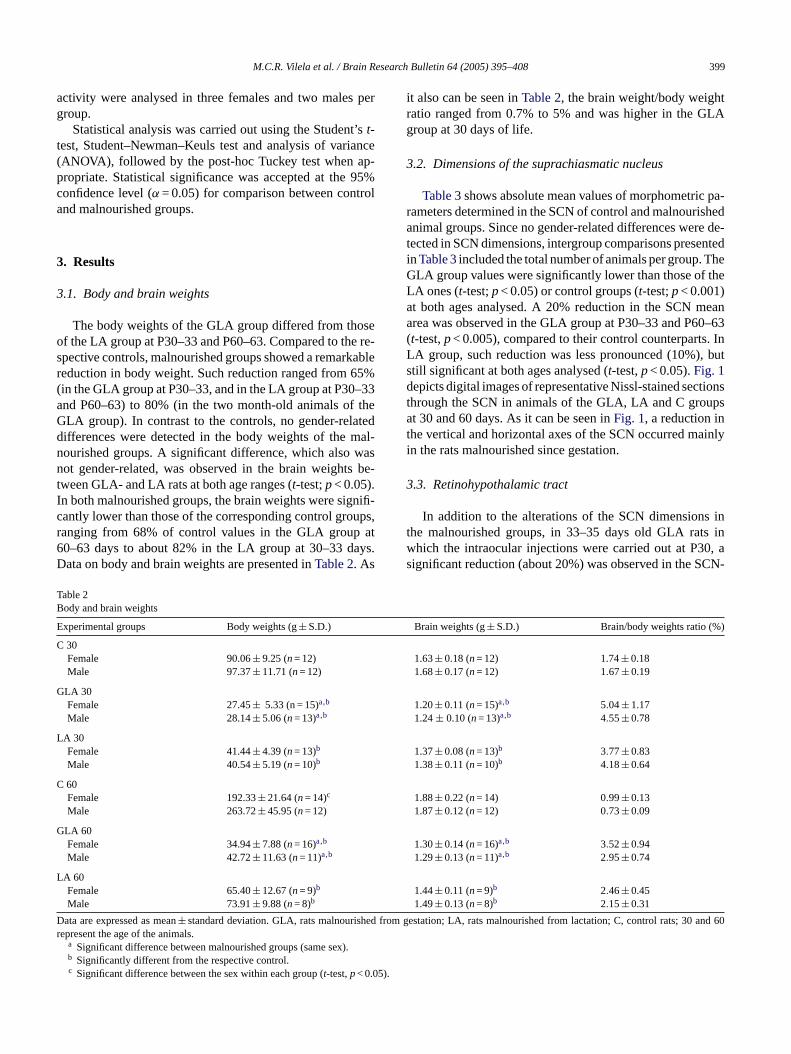
The body weights of the GLA group differed from thoseof the LA group at P30–33 and P60–63. Compared to the re-spective controls, malnourished groups showed a remarkablereduction in body weight. Such reduction ranged from 65%(in the GLA group at P30–33, and in the LA group at P30–33and P60–63) to 80% (in the two month-old animals of theGLA group). In contrast to the controls, no gender-relateddifferences were detected in the body weights of the mal-nourished groups. A significant difference, which also wasnot gender-related, was observed in the brain weights be-tween GLA- and LA rats at both age ranges (t-test;p< 0.05).I nifi-c ups,r at6 ays.D
it also can be seen inTable 2, the brain weight/body weightratio ranged from 0.7% to 5% and was higher in the GLAgroup at 30 days of life.
3.2. Dimensions of the suprachiasmatic nucleus
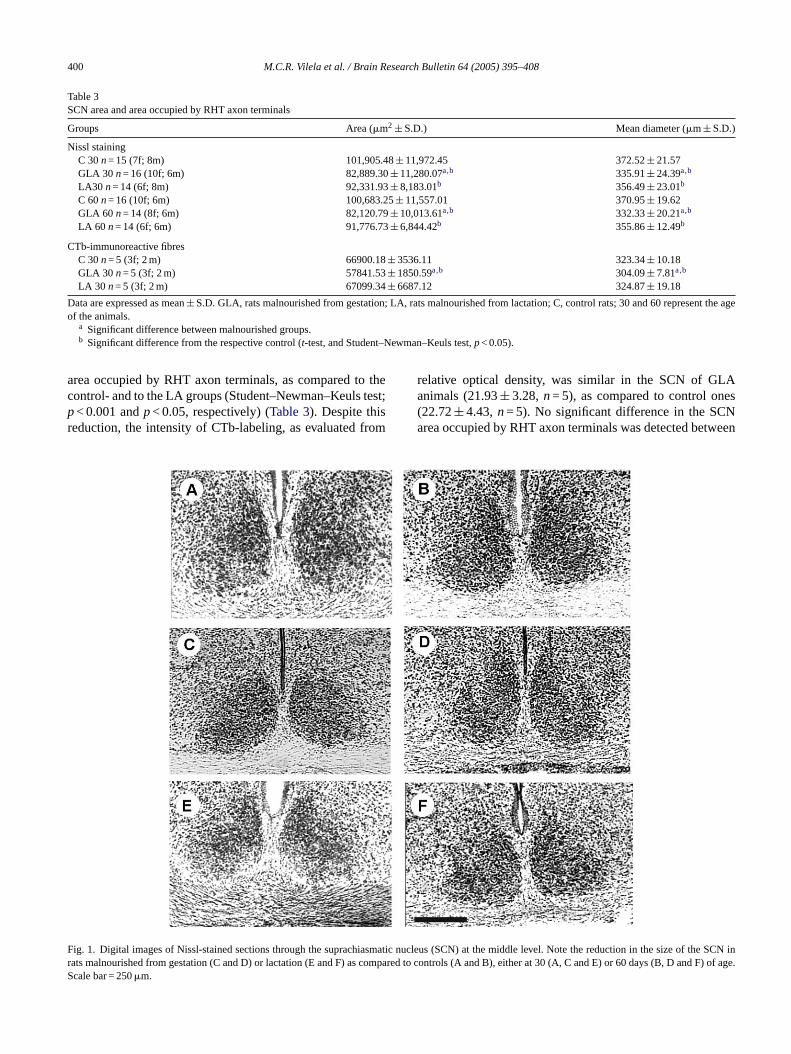
Table 3shows absolute mean values of morphometric pa-rameters determined in the SCN of control and malnourishedanimal groups. Since no gender-related differences were de-tected in SCN dimensions, intergroup comparisons presentedin Table 3included the total number of animals per group. TheGLA group values were significantly lower than those of theLA ones (t-test;p< 0.05) or control groups (t-test;p< 0.001)at both ages analysed. A 20% reduction in the SCN meanarea was observed in the GLA group at P30–33 and P60–63(t-test,p< 0.005), compared to their control counterparts. InLA group, such reduction was less pronounced (10%), butstill significant at both ages analysed (t-test,p< 0.05).Fig. 1depicts digital images of representative Nissl-stained sectionsthrough the SCN in animals of the GLA, LA and C groupsat 30 and 60 days. As it can be seen inFig. 1, a reduction inthe vertical and horizontal axes of the SCN occurred mainlyin the rats malnourished since gestation.
3.3. Retinohypothalamic tract
s int s inw 0, as CN-
TB
E )
C
G
L
C
G
L
D ed fro 0 and 60r
n both malnourished groups, the brain weights were sigantly lower than those of the corresponding control groanging from 68% of control values in the GLA group0–63 days to about 82% in the LA group at 30–33 data on body and brain weights are presented inTable 2. As
able 2ody and brain weights
xperimental groups Body weights (g± S.D.)
30Female 90.06± 9.25 (n= 12)Male 97.37± 11.71 (n= 12)
LA 30Female 27.45± 5.33 (n = 15)a,b
Male 28.14± 5.06 (n= 13)a,b
A 30Female 41.44± 4.39 (n= 13)b
Male 40.54± 5.19 (n= 10)b
60Female 192.33± 21.64 (n= 14)c
Male 263.72± 45.95 (n= 12)
LA 60Female 34.94± 7.88 (n= 16)a,b
Male 42.72± 11.63 (n= 11)a,b
A 60Female 65.40± 12.67 (n= 9)b
Male 73.91± 9.88 (n= 8)b
ata are expressed as mean± standard deviation. GLA, rats malnourishepresent the age of the animals.
a Significant difference between malnourished groups (same sex).b Significantly different from the respective control.
c Significant difference between the sex within each group (t-test,p< 0.05).In addition to the alterations of the SCN dimensionhe malnourished groups, in 33–35 days old GLA rathich the intraocular injections were carried out at P3ignificant reduction (about 20%) was observed in the S
Brain weights (g± S.D.) Brain/body weights ratio (%
1.63± 0.18 (n= 12) 1.74± 0.181.68± 0.17 (n= 12) 1.67± 0.19
1.20± 0.11 (n= 15)a,b 5.04± 1.171.24± 0.10 (n= 13)a,b 4.55± 0.78
1.37± 0.08 (n= 13)b 3.77± 0.831.38± 0.11 (n= 10)b 4.18± 0.64
1.88± 0.22 (n= 14) 0.99± 0.131.87± 0.12 (n= 12) 0.73± 0.09
1.30± 0.14 (n= 16)a,b 3.52± 0.941.29± 0.13 (n= 11)a,b 2.95± 0.74
1.44± 0.11 (n= 9)b 2.46± 0.451.49± 0.13 (n= 8)b 2.15± 0.31
m gestation; LA, rats malnourished from lactation; C, control rats; 3
400 M.C.R. Vilela et al. / Brain Research Bulletin 64 (2005) 395–408
Table 3SCN area and area occupied by RHT axon terminals
Groups Area (�m2 ± S.D.) Mean diameter (�m± S.D.)
Nissl stainingC 30n= 15 (7f; 8m) 101,905.48± 11,972.45 372.52± 21.57GLA 30 n= 16 (10f; 6m) 82,889.30± 11,280.07a,b 335.91± 24.39a,b
LA30 n= 14 (6f; 8m) 92,331.93± 8,183.01b 356.49± 23.01b
C 60n= 16 (10f; 6m) 100,683.25± 11,557.01 370.95± 19.62GLA 60 n= 14 (8f; 6m) 82,120.79± 10,013.61a,b 332.33± 20.21a,b
LA 60 n= 14 (6f; 6m) 91,776.73± 6,844.42b 355.86± 12.49b
CTb-immunoreactive fibresC 30n= 5 (3f; 2 m) 66900.18± 3536.11 323.34± 10.18GLA 30 n= 5 (3f; 2 m) 57841.53± 1850.59a,b 304.09± 7.81a,b
LA 30 n= 5 (3f; 2 m) 67099.34± 6687.12 324.87± 19.18
Data are expressed as mean± S.D. GLA, rats malnourished from gestation; LA, rats malnourished from lactation; C, control rats; 30 and 60 represent the ageof the animals.
a Significant difference between malnourished groups.b Significant difference from the respective control (t-test, and Student–Newman–Keuls test,p< 0.05).
area occupied by RHT axon terminals, as compared to thecontrol- and to the LA groups (Student–Newman–Keuls test;p< 0.001 andp< 0.05, respectively) (Table 3). Despite thisreduction, the intensity of CTb-labeling, as evaluated from
relative optical density, was similar in the SCN of GLAanimals (21.93± 3.28,n= 5), as compared to control ones(22.72± 4.43,n= 5). No significant difference in the SCNarea occupied by RHT axon terminals was detected between
FrS
ig. 1. Digital images of Nissl-stained sections through the suprachiasmaticats malnourished from gestation (C and D) or lactation (E and F) as comparcale bar = 250�m.
nucleus (SCN) at the middle level. Note the reduction in the size of the SCN ined to controls (A and B), either at 30 (A, C and E) or 60 days (B, D and F) of age.

M.C.R. Vilela et al. / Brain Research Bulletin 64 (2005) 395–408 401
Fig. 2. Digital images of coronal sections of rat brain through the suprachi-asmatic nucleus (SCN) at the middle level. CTb-immunostained fibres orterminals are concentrated in the ventral portion of the SCN. Note the simi-larity in the immunoreactivity pattern at P33 among representative sectionsof control rats (A), rats malnourished from gestation (GLA group; B) andrats malnourished from lactation (LA group; C). However, despite the similarpattern, the area of SCN containing CTb immunoreactive fibres in GLA rats(B) is reduced, compared to control and LA animals. Scale bar = 125�m.
the LA and C groups.Fig. 2 shows digital images of repre-sentative sections immunoreacted for CTb in the GLA, LAand C groups at P33.
3.4. Retinal dimensions
Malnourished rats at 27 days of age exhibited a signif-icant reduction of about 30% in the total retinal surfacein the GLA group (27.34± 2.09 mm2; n= 6) and 20% re-duction in the LA group (33.93± 2.19 mm2; n= 6), com-pared to the corresponding control group (41.01± 1.27 mm2;n= 6). At P30–33 and P60–63, malnutrition-induced re-
duction in the retinal surface area was still significant.In the GLA group, a 30% deficit persisted at P30–33(31.93± 3.27 mm2; n= 6) and increased to about 38% atP60–63 (36.77± 3.77 mm2; n= 9), compared to the respec-tive controls (45.18± 4.89 mm2; n= 13 and 59± 2.64 mm2;n= 6 at P30–33 and P60–63, respectively). In the LAgroup a reduction of 20% was also found at P60–63(44.38± 4.2 mm2; n= 6) compared to control animals.
3.5. Topographical distribution of retinal neurons in theganglion cell layer
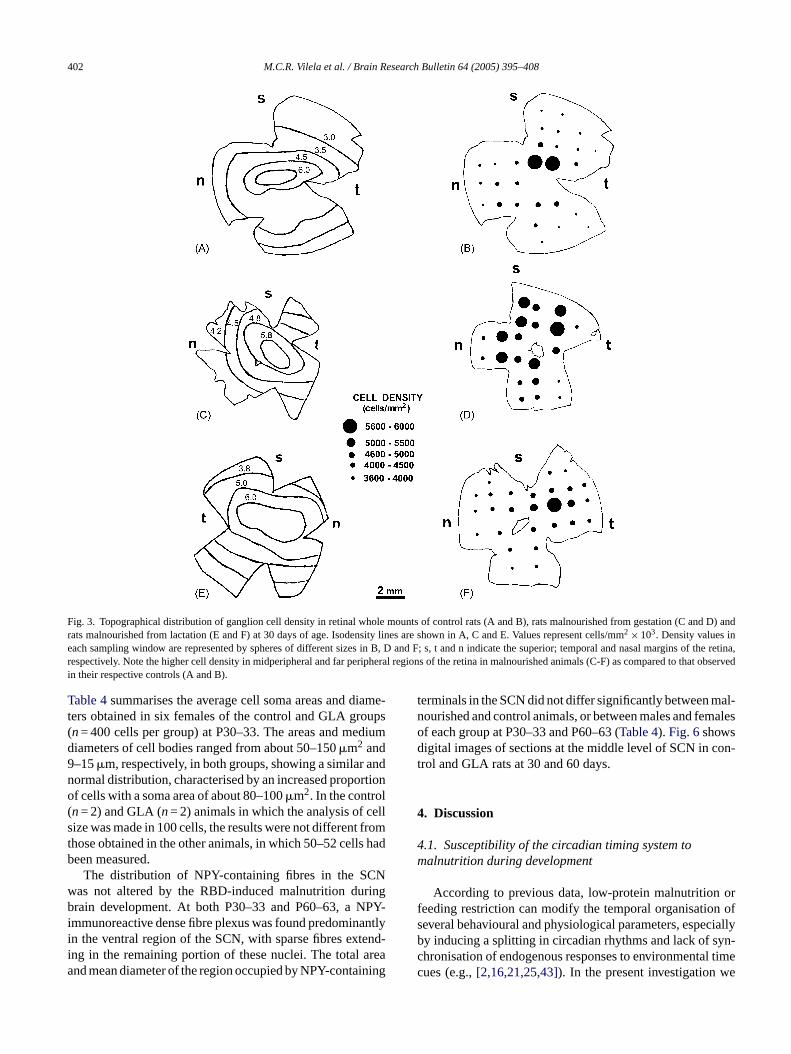
In the C group at 27 or 30–33 days, the ganglion cell den-sity ranged from 2000–2500 cells/mm2 in peripheral regionsof the retina to a maximum of 5500–6200 cells/mm2 in a re-gion at the superior temporal quadrant near the optic disc,as shown inFig. 3A and B, for a representative retina of ananimal at P30.
In retinal whole mounts of GLA rats at P27 or P30–33, thelowest cell density ranged from 3700 to 4000 cells/mm2 inthe peripheral retina, and the highest density corresponded to5800–5900 cells/mm2 in central regions near the optic disc(Fig. 3C and D shows representative retinae of animals atP30). This represented a lower centre-peripheral gradient ofcell density when compared to control retinae. In the GLAg 2 al n theg ionso sl
andh 500a re-s diento up.I lueswas eralr
3a
int r be-t PY-c cau-d ryaa fc andG
dif-f als( ew roup.
roup, a cell density of 4200 cells/mmwas observed overarge extent of the retina. At P60–63 a slight decrease ianglion cell density was detected in far peripheral regf the retina, where 2500–3000 cells/mm2 was estimated a
owest density.In the LA group at P27 or P30–33, the lowest
ighest retinal cell density ranged between 3000–3nd 5700–6000 cells/mm2, respectively. Such values corponded to a slight increase in the centre-peripheral graf cell density compared to that observed in the GLA gro
n most of the retinal tissue however, the isodensity vaere still higher than those observed in control rats (Fig. 3End F shows representative retinae of animals at P30).Fig. 4hows the ganglion cell layer in the central and periphegions of control and GLA rats at 30 days of age.
.6. NPY immunoreactivity in the intergeniculate leafletnd suprachiasmatic nucleus
No difference in the NPY immunoreactivity patternhe IGL was observed between males and females oween control and GLA groups at both ages analysed. Nontaining neurons were observed throughout the rostroal extent of the IGL and exhibited oval or fusiform perikand primary dendrites.Fig. 5 illustrates digital images ooronal sections at the rostral level of the IGL in controlLA rats at P30.The size of NPY-immunoreactive somata did not
er significantly between control and malnourished animANOVA, F (5.45) = 11,p= 2.42). No significant differencas observed between males and females in each g
402 M.C.R. Vilela et al. / Brain Research Bulletin 64 (2005) 395–408
Fig. 3. Topographical distribution of ganglion cell density in retinal whole mounts of control rats (A and B), rats malnourished from gestation (C andD) andrats malnourished from lactation (E and F) at 30 days of age. Isodensity lines are shown in A, C and E. Values represent cells/mm2 × 103. Density values ineach sampling window are represented by spheres of different sizes in B, D and F; s, t and n indicate the superior; temporal and nasal margins of the retina,respectively. Note the higher cell density in midperipheral and far peripheral regions of the retina in malnourished animals (C-F) as compared to that observedin their respective controls (A and B).
Table 4summarises the average cell soma areas and diame-ters obtained in six females of the control and GLA groups(n= 400 cells per group) at P30–33. The areas and mediumdiameters of cell bodies ranged from about 50–150�m2 and9–15�m, respectively, in both groups, showing a similar andnormal distribution, characterised by an increased proportionof cells with a soma area of about 80–100�m2. In the control(n= 2) and GLA (n= 2) animals in which the analysis of cellsize was made in 100 cells, the results were not different fromthose obtained in the other animals, in which 50–52 cells hadbeen measured.
The distribution of NPY-containing fibres in the SCNwas not altered by the RBD-induced malnutrition duringbrain development. At both P30–33 and P60–63, a NPY-immunoreactive dense fibre plexus was found predominantlyin the ventral region of the SCN, with sparse fibres extend-ing in the remaining portion of these nuclei. The total areaand mean diameter of the region occupied by NPY-containing
terminals in the SCN did not differ significantly between mal-nourished and control animals, or between males and femalesof each group at P30–33 and P60–63 (Table 4). Fig. 6showsdigital images of sections at the middle level of SCN in con-trol and GLA rats at 30 and 60 days.
4. Discussion
4.1. Susceptibility of the circadian timing system tomalnutrition during development
According to previous data, low-protein malnutrition orfeeding restriction can modify the temporal organisation ofseveral behavioural and physiological parameters, especiallyby inducing a splitting in circadian rhythms and lack of syn-chronisation of endogenous responses to environmental timecues (e.g.,[2,16,21,25,43]). In the present investigation we

M.C.R. Vilela et al. / Brain Research Bulletin 64 (2005) 395–408 403
Fig. 4. Digital images of the retinal ganglion cell layer in representative Nissl-stained whole mounts of a control rat (A and B) and a rat malnourishedsincegestation (C and D) at central (A and C) and peripheral retinal regions (B and D). Note in D the higher density and the smaller size of the neuronal cell bodiesin the malnourished rat, in the peripheral region of the retina. Scale bar: 25�m.
Fig. 5. NPY immunoreactivity in neuronal cell bodies and processes at the rostral level of the intergeniculate leaflet (IGL) of a representative control rat (A)and of a rat malnourished since gestation (B) at 30 days of age. Note the similar distribution of cells and NPY immunoreactivity pattern in the two animals.Scale bar: 20�m.
Table 4Morphometric parameters of NPY-immunoreactive cells
Groups Area (�m2 ± S.D.) Mean diameter (�m± S.D.)
IGLSoma size
Control (n= 400) 99.64± 28.14 11.35± 1.87GLA (n= 400) 93.70± 24.97 10.92± 1.73
SCNArea of NPY-immunoreactive fibres (�m2 ± S.D.)
C 30n= 7f; 6m 47328.68± 5517.35 256.43± 15.38C 60n= 7f;7m 49983.45± 5592.39 264.18± 14.08GLA 30 n= 6f; 7 m 44999.70± 7090.88 250.01± 20.24GLA 60 n= 7f; 6 m 47595.06± 6092.98 255.37± 16.52
Data are expressed as mean± S.D. GLA, rats malnourished from gestation; C, control rats; 30 and 60 represent the age of the animals. f, females; m, malesIGL, intergeniculate leaflet; SCN, suprachiasmatic nucleus.

404 M.C.R. Vilela et al. / Brain Research Bulletin 64 (2005) 395–408
Fig. 6. Digital images of NPY immunoreactivity through the middle level of the suprachiasmatic nucleus (SCN). NPY-immunoreactive fibres or terminals areconcentrated in the ventral portion of the SCN. Note the similarity in the immunoreactivity pattern between control rats (A and B) and rats malnourished fromgestation (C and D) at postnatal days 33 (A and C) and 63 (B and D). Scale bar = 125�m.
hypothesised that a multideficient diet administered early inlife could affect the structure of some components of thecircadian timing system involved in the entrainment of phys-iological responses to the light–dark cycle. It was expectedthat the RBD could induce at least a developmental delay andalterations in the neuronal organisation of the retina, SCN andIGL, with potential effects on the RHT and GHT.
The results herein reported support the assumption thatRBD, the nutritional paradigm we adopted, induces severemalnutrition in the experimental subjects, especially affect-ing body growth as compared to brain growth. The data alsopoint out a low and differential vulnerability of retina, SCNand IGL to severe malnutrition during the critical period ofbrain development, with subtle changes in these structures. Inparticular, as it will be described below, we could documentin the malnourished rats a reduction of retinal surface andchanges in retinal ganglion cell distribution, as well as alter-ations in the SCN dimensions and extent of the RHT terminalfield in the SCN.
4.2. Changes in the retina after early malnutrition
A 38% maximal reduction of the total retinal dimensionwas observed in malnourished rats. Alterations were morepronounced in the GLA group than in the LA group, beingg reti-n por-t malg allm rease
in the eye dimensions, including their axial diameters (datanot shown), was observed.
In the retina, in control animals at P27–33 the topographi-cal distribution pattern of isodensity lines and the peak of celldensity were similar to those previously described in adult al-bino rats[31,38]. In peripheral regions of the ganglion celllayer, the density values estimated in the present study werehighest than those previously described (e.g. Fukuda[31] re-ported in adult rats a range from 1000–1500 cells/mm2).
The main difference found in the malnourished rats, ascompared to the controls at P27–33 was represented by a de-crease in the centre-peripheral gradient of cell density anda poor definition of anarea centralis, described as a func-tional specialisation of the rat retina[31,38]. In our study, thepeak of cell density in the central retina ranged from 5800to 6200 cells/mm2, and did not differ between malnourishedand control rats. Therefore, the reduction of the cell densitygradient seemed to be mainly due to relatively high cell den-sity in midperipheral and peripheral regions of the retina ofmalnourished rats.
At least three aspects are of interest concerning the dis-cussion of retinal alterations induced by malnutrition. First,in rats a postnatal retinal growth during the lactation pe-riod is more evident in the peripheral regions than in centralones, which is an important feature involved in the centre-p en em-b ionsm ratedi al
reater at P60–63 than at previous time points. Thus, theal surface area of the GLA group did not increase pro
ionally to body weight gain, suggesting an impaired norrowth of the eye due to the multideficient diet. In fact, inalnourished rats analysed in the present study, a dec
eripheral gradient of ganglion cell density[48]. Second, theurogenesis of retinal ganglion cells occurs betweenryonic days (E) 14 and E20, but cells of the central regature and reach their targets earlier than those gene
n peripheral regions[54,64,69]. Third, the density and tot
M.C.R. Vilela et al. / Brain Research Bulletin 64 (2005) 395–408 405
number of ganglion cells are also determined by programmedcell death phenomena. It has been estimated that at birth therat retina contains about 120,000 ganglion cells, but suchnumber is reduced by apoptotic mechanisms, first in centraland then in peripheral regions, predominantly during the firstpostnatal week[37]. In RBD-malnourished rats during thelactation period, analysis of pyknotic cell profiles in retinaltransverse sections did not show differences in the percentageof cell death in the ganglion cell layer between P8 and P30[3]. No similar analysis was performed in rats malnourishedsince gestation, or in retinal whole mounts, and future studiesare needed to address these issues.
Data collected in the present study suggest that severemalnutrition affects the growth rate of the peripheral retina,contributing to a higher cell density in this region. A reductionin the cell body size in the ganglion cell layer was previouslyreported in retinal transverse sections of RBD-malnourishedrats during lactation[4]. Thus, our results indicate that theRBD induces in the ganglion cell layer a cell packing effectsimilar to that described for other regions of the malnourishedbrain[13,56]. As it is well known, the morphological featuresof ganglion cells can provide indications on their neural activ-ity and function. Further studies are needed to verify whetherSCN-projecting ganglion cells, especially those located inperipheral retinal regions, are affected by the cell packinge
oupc atedt riodo ataa ellsd
4
en-s ely,a nths.S e pro-p esem n ofn BD-i
eemt eu-r ratso era ctivei alsort tw lowb b-t sinceg utri-t tory
also indicate that RBD administered since gestation or lacta-tion reduces the number of astrocytes in the SCN at P30 andP60 (unpublished results).
4.4. Changes in the retinal input to the SCN
A reduction in the SCN area containing CTb-labeled RHTaxon terminals in the GLA group at P30 was the main effectobserved in the RHT. Considering that the relative opticaldensity of these axon terminals did not differ significantlybetween malnourished and control rats, it is possible to inferthat the smaller area occupied by RHT in the GLA group wasproportional to the decrease in the size of the SCN detectedby Nissl staining.
The development of RHT has been described in Wistar ratsin previous studies[15,47,53,70,72]. According to Takatsujiet al. [72], who used CTb tracing, the retinohypothalamicprojection is already present at birth, gradually increases be-tween P10 and P20 and reaches the adult pattern between P20and P30, when the tracer labeling decreases in the dorsome-dial part of the SCN. The data obtained in the present study in33-day-old GLA animals suggest that in spite of the reducedarea occupied by RHT, this tract reaches in the SCN a patternsimilar to that observed in control rats. Such results, however,do not rule out the possibility of a developmental delay of thist r lab-o nsityo redt tely3 shedr uldh dayso
tiale sedw enth aineda gestt tot raind
4
alsc rtedi so our-i eadya eryr
eu-r ataw theg rmedr
ffect observed after RBD-induced early malnutrition.The greater effect observed in the retina of the GLA gr
ompared to the LA group, at both ages analysed, indichat alterations were proportional to the severity and pef malnutrition during retinal development. Conversely, dlso indicate a relative “sparing” of retinal ganglion curing this type of insult.
.3. Changes in the SCN
A reduction of about 20% and 10% in the SCN dimions was observed in GLA and LA animals, respectivs compared to controls at one and two postnatal mouch results suggest that the observed alterations werortional to the reduction in the brain dimensions of thalnourished rats, or that the genesis or differentiatioeurons or glial cells in the SCN were affected by the R
nduced malnutrition.The changes detected in the SCN of the GLA group s
o be coherent with a significant reduction in the size of nonal cell bodies in the SCN of chronic 6% casein-fedf 30 and 90 days of life[20]. A decrease in the numbnd density of astrocytes and neurons containing vasoa
ntestinal polypeptide and vasopressin in the SCN waseported in chronic malnourished rats at 150 days[2]. Al-hough in these previous studies[2,20] the low-protein dieas administered starting at 5 weeks prior to mating, theody weight observed at P30[2] is comparable to values o
ained in the present study, suggesting that the RBDestation is equally effective in producing severe maln
ion in rats. Preliminary results obtained in our labora
ract before P30. Indeed, preliminary data obtained in ouratory indicates that at P27 there is an increase in the def retinal terminals in the SCN of GLA animals as compa
o controls (unpublished results). A delay of approximadays in eye opening was observed in RBD-malnouri
ats[3,22]. It remains to be verified whether such delay coave some effect on the development of RHT prior to 30f age.
To our knowledge, this is the first report on the potenffects of malnutrition on the RHT. We have not analyhether the distribution of this tract was modified in adjacypothalamic areas. Nevertheless, the data herein obtnd our preliminary observations in animals at P27 sug
hat the growth of retinal ganglion cell axons projectinghe SCN is not affected by severe malnutrition during bevelopment.
.5. Geniculohypothalamic tract
A similar distribution of geniculohypothalamic terminontaining NPY in the SCN has been previously repon control and 6% casein-fed rats at P150[2]. The resultbtained in the present study indicate that in RBD maln
shed rats since gestation, such distribution is similar alrt P30, indicating that the development of the GHT is vesistant to severe nutritional insults.
The results obtained in the IGL point out that also the nogenesis and differentiation of NPY-immunoreactive somere not modified in GLA animals. During development,eniculate nuclei of several mammalian species are foapidly (neurogenesis starts at E14 and E15 in rats[49] and
406 M.C.R. Vilela et al. / Brain Research Bulletin 64 (2005) 395–408
at E13 in the IGL of hamsters[57]) and ahead of the me-dial thalamus[6]. During this period, thalamic nuclei exhibita full range of soma sizes, including large and small neu-rons comparable to those of adults[6,36,49]. In newbornrats, NPY-immunoreactive fibres are scarce in the SCN, butthe number of these fibres increases greatly between P10 andP15, reaching the adult pattern at P20[72].
4.6. Concluding remarks
The low RHT- and GHT vulnerability to the malnu-trition effects documented in the present study suggeststhat the altered circadian rhythmicity in the entrainment tolight–dark cycle, reported previously in malnourished rats[2,16,18,19,21,30,34,35,66], cannot be ascribed to impaireddevelopment or altered structural features of these tracts in theSCN. The present finding suggests that intrinsic functionalproperties of the retina or SCN and/or efferent projections ofthe SCN could be involved in the above-mentioned circadianchanges. It has been established that the NPY concentrationand its mRNA expression increase in homogenates of thehypothalamus after food restriction or during protein and en-ergy deprivation during gestation or after birth[12,14,75].To our knowledge, no similar studies have been performed inthe IGL, so that it cannot be inferred at the moment whethert vedi lacko
earlyi ionswsh -s thes riodsd ingG ; ther irth.T te tot esec dif-f oups( ortt tiono
etalc y andp nu-tc andl , thata cosa-hT ringf euro-g e
the multideficient composition of RBD, compensatory mech-anisms involved in the materno-fetal mobilisation of nutrientscould contribute to the apparent resistance of neuronal cellpopulations investigated in the present study, and especiallythose of the retina and IGL.
Acknowledgements
The authors are grateful to Z.C. Xavier, M.A. Silvafor technical assistance; to Dr. Luiz Roberto G. Britto forhelpful comments on the manuscript. The collaborationsof Dr. Alexandre Motta Bittencourt and Diogenes Luiz daMota (Departamento de Anatomia-UFPE) for the use ofImage-Lab software and of the LEAAL-Departamento deNutricao-UFPE in performing the analysis of diet compo-sition are gratefully appreciated. The acquisition of somereagents used in this work was supported by MCT-PRONEXto R.C.A.G.; Coordenac¸ao de Aperfeic¸oamento de Pessoalde Nıvel Superior (CAPES-COFECUB, N0296-99/I) andPROPESQ/UFPE to B.L.S.A.C. and M.L.M.A and CAPES-COFECUB N0417/03 to B.L.S.A.C. R.C.A.G and M.L.M.A.This work was partially presented at the XVII Annual Meet-ing of the FESBE, Salvador, BA, August 29–31, 2002, and ispart of a Master‘s thesis presented by M.C.R.V. to the Depar-t azil.R 5).
R
themate
-ias-273
es,tinauck-
B.T.andu-
ofal-
thend
omp.
ofy di-990)
ng-tion393.
he similar pattern of NPY immunoreactivity here obsern malnourished and control rats can be attributed to af effects of RBD-induced malnutrition.
Several studies have demonstrated that malnutritionn life affects mainly the central nervous system reghich undergo a postnatal cell proliferation phase[28,77],uch as the cerebral[11,45]and cerebellar cortices[67], theippocampus[8,27] and the olfactory bulb[5]. Neurogeneis of retinal ganglion cells, SCN and IGL cells starts atame time (about E13-E14) but extends over different peuring gestation. The differentiation of the NPY-containHT fibres reaches the adult pattern earlier than the RHT
etina and SCN are still immature for some time after bherefore, such developmental pattern could contribu
he differential vulnerability to malnutrition observed in thomponents of the circadian timing system. The subtleerences found between the two malnourished animal grGLA and LA) in the retinal and SCN dimensions supphe importance of the lactation period for the differentiaf these regions.
In addition, it should be taken into account that the fonsequences of inadequate maternal intake of energrotein during pregnancy are strongly influenced by the
ritional status of the mother prior to conception[26,55]. Re-ent evidence in RBD malnourished rats during gestation
actation indicates, in membranes of the hypothalamusdequate levels of essential fatty acids, especially doexaenoic acid and arachidonic acid, are maintained[23].hese essential fatty acids are relatively important, du
etal growth and development, in processes such as nenesis, synaptogenesis and myelination[40]. Thus, despit
amento de Fisiologia e Farmacologia, UFPE, Recife, Br.C.A.G. is Research Fellow of CNPq (No. 52.0722/96-
eferences
[1] K.N. Agarwal, C. Prassad, V. Taneja, Protein deprivation andbrain: effect on enzymes and free amino acids related to glutametabolism in rats, Ann. Nutr. Metabol. 25 (1981) 228–233.
[2] R. Aguilar-Roblero, A. Salazar-Juarez, J. Rojas-Castaneda, C. Escobar, L. Cintra, Organization of circadian rhythmicity and suprachmatic nuclei in malnourished rats, AJP- Integ. Comp. Physiol.(1997) 1321–1331.
[3] M.F.L. Almeida, E.N. Yamasaki, A.C.D. Silveira, R.C.A. GuedJ.N. Hokoc, The GABAergic and cholinergic systems in the reare differentially affected by postnatal malnutrition during the sling period, Nutr. Neurosci. 4 (2001) 223–238.
[4] S.S. Almeida, L.H. Duntas, L. Dye, M.L. Nunes, C. Prasad, J.Rocha, P. Wainwright, C.T.B.V. Zaia, R.C.A. Guedes, Nutritionbrain function: a multidisciplinary virtual symposium, Nutr. Nerosci. 5 (2002) 311–320.
[5] C.P. Almli, M.A. Henault, A. Velozco, P.J. Morgane, Ontogenyelectrical of main olfactory bulb in freely-moving normal and mnourished rats, Brain Res. 350 (1985) 1–11.
[6] J. Altman, S.A. Bayer, Development of the diencephalons inrat. IV. Quantitative study of the time of origin of neurons athe internuclear chronological gradients in the thalamus, J. CNeurol. 188 (1979) 455–471.
[7] A.F.D. Andrade, R.C.A. Guedes, N.R. Teodosio, Enhanced ratecortical spreading depression due to malnutrition: prevention betary protein supplementation, Braz. J. Med. Biol. Res. 23 (1889–893.
[8] J.P. Andrade, M.D. Madeira, M.M. Paula-Barbosa, Effects of loterm malnutrition and rehabilitation on the hippocampal formaof the adult rat. A morphometric study, J. Anat. 187 (1995) 379–
M.C.R. Vilela et al. / Brain Research Bulletin 64 (2005) 395–408 407
[9] A. Ballabriga, Some aspects of clinical and biochemical changesrelated to nutrition during brain development in humans, Dev. Neu-robiol. 12 (1989) 271–285.
[10] J.M. Barreto Medeiros, J.E. Cabral Filho, S.L.D. Souza, S.R. Fre-itas Silva, C. Mendes da Silva, T.C.B.J. Deiro, J.M. Monteiro,R.C.A. Guedes, C.M.M.B. Castro, R. Manhaes de Castro, Early mal-nourished rats are not affected by anorexia induced by a selectiveserotonin reuptake inhibitor in adult life, Nutr. Neurosci. 5 (2002)211–214.
[11] N.H. Bass, M.G. Netsky, E. Young, Effects of neonatal malnutritionon developing cerebrum I: microchemical and histological study ofcellular differentiation in the rat, Arch. Neurol. 23 (1970) 289–302.
[12] B. Beck, M. Jhanwar-Uniyal, A. Burlet, M. Chapleur-Chateau, S.F.Leibowitz, C. Burlet, Rapid and localized alterations of neuropeptideY in discrete hypothalamic nuclei with feeding status, Brain Res. 528(1990) 245–249.
[13] J.M.C. Borba, M.S. Araujo, C.W. Picanc¸o-Diniz, R. Manhaes DeCastro, R.C.A. Guedes, Permanent and transitory morphometricchanges of NADPH-diaphorase-containing neurons in the rat visualcortex after early malnutrition, Brain Res. Bull. 53 (2000) 193–201.
[14] L.S. Brady, M.A. Smith, P.W. Gold, M. Herkenham, Altered expres-sion of hypothalamic neuropeptide Y mRNAs in food restricted andfood deprived rats, Neuroendocrinology 52 (1990) 441–447.
[15] S.M. Bunt, R.D. Lund, P.W. Land, Prenatal development of the op-tic projection in albino and hooded rats, Dev. Brain Res. 6 (1983)149–168.
[16] O. Castanon-Cervantes, L. Cintra, Circadian rhythms of occipital-cortex temperature and motor activity in young and old rats underchronic protein malnutrition, Nutr. Neurosci. 5 (2002) 279–286.
[17] J.-C. Chen, J. Tonkiss, J.R. Galler, L. Volicer, Prenatal protein mal-us, J.
[ m
[effectiqueand
1.[ tion
stud.
[ ar-Hal-
, andRatspp.
[ N.R.
les ded de
[r-
dobuco,
[ f theonal.
[ , J.R.sleep-
[26] M. Desai, C.N. Hales, Role of fetal and infant growth in program-ming metabolism in later life, Biol. Rev. 72 (1997) 329–348.
[27] S. Diaz-Cintra, L. Cintra, A. Galvan, A. Aguilar, T. Kemper, P.J.Morgane, Effects of prenatal protein deprivation on postnatal devel-opment of granule cells in the fascia dentata, J. Comp. Neurol. 310(1991) 356–364.
[28] C. Escobar, M. Salas, Neonatal undernutrition and amygdaloid nu-clear complex development: an experimental study in the rat, Exp.Neurol. 122 (1993) 311–318.
[29] L.E. Esseveldt, M.N. Van Lehman, G.J. Boer, The suprachiasmaticnucleus and the circadian time-keeping system revisited, Brain Res.Rev. 33 (2000) 34–77.
[30] W.B. Forbes, C.A. Tracy, O. Resnick, P.J. Morgane, Effect of pro-tein malnutrition during development on sleep behavior of rats, Exp.Neurol. 57 (1977) 440–450.
[31] Y.A. Fukuda, Three-group classification of rat retinal ganglioncells: histological and physiological studies, Brain Res. 119 (1977)327–344.
[32] R.C.A. Guedes, A.F.D. Andrade, J.E. Cabral Filho, Propagation ofcortical spreading depression in malnourished rats: facilitatory effectof dietary protein deficiency, Braz. J. Med. Biol. Res. 20 (1987)639–642.
[33] R.C.A. Guedes, J. Santos-Monteiro, N.R. Teodosio, Malnutrition andbrain function; experimental studies using the phenomenon of corti-cal spreading depression, Rev. Brasil. Biol. 56 (1996) 293–301.
[34] R.D. Hall, W.B. Forbes, W.M. Robertson, The effects of proteinmalnutrition on the rat’s circadian pattern of food and water intake,Nutr. Rep. Int. 18 (1978) 713–720.
[35] D.C. Hebert, R.J. Reiter, Influence of protein-caloric malnutrition onthe circadian rhythm of pineal melatonin in the rat, Proc. Soc. Exp.
[ teral–199.
[ gen-987)
[ lifeitelliVer-.
[ ima,shi,leus,
[ vel-
[ cleus. 13
[ ilho,l
[ the. 30
[ ing
[ un-ain
[ rgywthNutr.
[ ic168
nutrition in rats enhances serotonin release from hippocampNutr. 122 (1992) 2138–2143.
18] L. Cintra, S. Diaz-Cintra, A. Galvan, P.J. Morgane, Circadian rhythof sleep in normal and undernourished rats, Bol. Estud. Med. Biol.Mex. 36 (1988) 3–17.
19] L. Cintra, P. Duran, M.A. Guevara, A. Aguilar, O. Castanon-Cervantes, Pre- and post-natal protein malnutrition alters theof rapid eye movements sleep-deprivation by the platform-technupon the electrocorticogram of the circadian sleep-wake cycleits frequency bands in the rat, Nutr. Neurosci. 5 (2002) 91–10
20] L. Cintra, A. Galvan, S. Diaz-Cintra, C. Escobar, Protein malnutrion suprachiasmatic nucleus cells in rats of three ages, Bol. EMed. Biol. Mex. 42 (1994) 11–19.
21] J. Cipolla Neto, E.G.I.G. Recine, L. Menna-Barreto, N. Mques, S.C. Afeche, C. Schott, G. Fortunato, R.B. Sothern, F.berg, Perinatal Malnutrition, Suprachiasmatic Nuclear LesioningCircadian-Ultradian Aspects of Spontaneous Behavior of AlbinoAdvances in Chronobiology Part B, Wiley-Liss, New York, 1987,473–489 .
22] F.B. Costa, J.A. Costa, J.E. Cabral Filho, R.C.A. Guedes,Teodosio, Indicadores de maduracion nerviosa y somatica en unmodelo experimental de desnutricion, in: Seminario Internaciona“Desnutricion y Funciones Cerebrales Superiores”, ResumenConferencias e Comunicaciones Libres, Santiago, Universidalas Naciones Unidas, 1983, p. 89.
23] S.P.M. Costa, Influencia de uma desnutric¸ao multifatorial nacomposic¸ao dos acidos graxos de fosfolipıdeos do sistema nevoso central e fıgado em diferentes perıodos do desenvolvimentorato. Recife, Master Thesis – Universidade Federal de Pernam2003.
24] E.M. Coutinho, L.P.C.G. Freitas, F.G.G. Abath, The influence oregional basic diet from northeast Brazil on health and nutriticonditions of mice infected withSchistosoma mansoni, Rev. SocBras. Med. Trop. 25 (1992) 13–20.
25] S. Datta, E.H. Patterson, M. Vincitore, J. Tonkiss, P.J. MorganeGaller, Prenatal protein malnourished rats show changes inwake behavior as adults, J. Sleep Res. 9 (2000) 71–79.
Biol. Med. 166 (1981) 360–366.36] T.L. Hickey, P.F. Hitchcock, Genesis of neurons in the dorsal la
geniculate nucleus of the cat, J. Comp. Neurol. 228 (1984) 18637] G.M. Horsburgh, A.J. Sefton, Cellular degeneration and synapto
esis in the developing retina of the rat, J. Comp. Neurol. 263 (1553–566.
38] A. Hughes, The topography of vision in mammals of contrastingstyle: comparative optics and retinal organization, in: F. Cresc(Ed.), Handbook of Sensory Physiology. The Visual System intebrates, vol. VII/5, Springer-Verlag, Berlin, 1977, pp. 613–756
39] Y. Ibata, H. Okamura, M. Tanaka, Y. Tamada, S. Hayashi, N. IijT. Matsuda, K. Munekawa, T. Takamatsu, Y. Hisa, Y. ShigeyoF. Amaya, Functional morphology of the suprachiasmatic nucFrontiers Neuroendocrinol. 20 (1999) 241–268.
40] S.M. Innis, The role of dietary n-6 and n-3 fatty acids in the deoping brain, Dev. Neurosci. 22 (2000) 474–480.
41] D.J. Kennaway, Programming of the fetal suprachiasmatic nuand subsequent adult rhythmicity, Trends Endocrinol. Metab(2002) 398–402.
42] E.S. Lago, N.R. Teodosio, D.C. Pontes Pessoa, J.E. Cabral FDuracion de la vida en ratas desnutridas, utilizando dieta basica denordeste brasileno, Arch. Latinoam. Nutr. 47 (1997) 338–342.
43] A.M.O. Leal, A.C. Moreira, Food and the circadian activity ofhypothalamic-pituitary-adrenal axis, Braz. J. Med. Biol. Res(1997) 1391–1405.
44] D.A. Levistsky, B.J. Strupp, Malnutrition and the brain: changconcepts, changing concerns, J. Nutr. 125 (1995) 2212–2220.
45] P.D. Lewis, R. Balazs, A.J. Patel, A.L. Johnson, The effects ofdernutrition in early life on cell generation in the rat brain., BrRes. 893 (1975) 235–247.
46] M.C. Marin, M.E. Tomas, C. Serres, O. Mercuri, Protein-enemalnutrition during gestation and lactation in rats affects grorate, brain development and essential fatty acid metabolism, J.125 (1995) 1017–1024.
47] C.A. Mason, D.W. Lincoln, Visualization of the retino-hypothalamprojection in the rat by cobalt precipitation, Cell Tissue Res.(1976) 117–131.

408 M.C.R. Vilela et al. / Brain Research Bulletin 64 (2005) 395–408
[48] M.J. Mc Call, S.R. Robinson, B. Dreher, Differential retinal growthappears to be the primary factor producing the ganglion cell densitygradient in the rat, Neurosci. Lett. 79 (1987) 78–84.
[49] J.P. McAllister II, G.D. Das, Neurogenesis in the epithalamus, dorsalthalamus and ventral thalamus of the rat: an autoradiographic andcytological study, J. Comp. Neurol. 172 (1977) 647–686.
[50] S. Michell, C.S. Colwell, Cellular communication and couplingwithin the suprachiasmatic nucleus, Chronobiol. Int. 18 (2001)579–600.
[51] R.E. Mistlberger, Circadian food-anticipatory activity: formal modelsand physiological mechanisms, Neurosci. Biobehav. Rev. 18 (1994)171–195.
[52] F.M.F. Monteiro, J.A. Albuquerque, A.M.S. Cabral, Influence of amultideficient diet from northeastern Brazil on resting blood pressureand baroreflex sensitivity in conscious, freely moving rats, Braz. J.Med. Biol. Res. 34 (2001) 271–280.
[53] R.Y. Moore, Development of the suprachiasmatic nucleus, in: D.C.Klein, R.Y. Moore, S.M. Reppert (Eds.), Suprachiasmatic Nucleus.The Mind’s Clock, Oxford University Press, New York, 1991, pp.391–404.
[54] D.K. Morest, The pattern of neurogenesis in the retina of the rat, Z.Anat. Entwickl. Gesch. 131 (1970) 45–67.
[55] P.J. Morgane, R. Austin-Lafrance, J. Bronzino, J. Tonkiss, S. Diaz-Cintra, L. Cintra, T. Kemper, J.R. Galler, Prenatal malnutritionand development of the brain, Neurosci. Biobehav. Rev. 17 (1993)91–128.
[56] P.J. Morgane, M. Miller, T. Kemper, W. Stern, W. Forbes, R. Hall,J. Bronzinno, J. Kissane, E. Hawrylewicz, O. Resnick, The effectsof protein malnutrition on the developing central nervous system inthe rat, Neurosci. Biobehav. Rev. 2 (1978) 137–230.
[ 994)
[ g-HO93)
[ umtion
[ ates,
[ s,axon
de-
[ ,ecu-
tive generations of rats, Arch. Latinoam. Nutr. 50 (2000) 55–61.
[63] O. Rabin, J.-M. Lefauconnier, C. Chanez, G. Bernard, J.-M. Bourre,Developmental effects of intrauterine growth retardation on cerebralamino acid transport, Pediatr. Res. 35 (1994) 640–648.
[64] B.E. Reese, R.J. Colello, Neurogenesis in the retinal ganglion celllayer of the rat, Neuroscience 46 (1992) 419–429.
[65] O. Resnick, M. Miller, W. Forbes, R. Hall, T. Kemper, J. Bronzino,J.P. Morgane, Developmental protein malnutrition: influences on thecentral nervous system of the rat, Neurosci. Biobehav. Rev. 3 (1979)233–246.
[66] M. Salas, C. Ruiz, C. Torrero, S. Pulido, Neonatal food restriction:its effects on the sleep cycles and vigil behavior of adult rats, Bol.Estud. Med. Biol. Mex. 32 (1983) 209–215.
[67] S.K. Sharma, U. Nayar, M.C. Maheshqari, B. Singh, Effects of un-dernutrition on developing rat cerebellum: some eletrophysiologi-cal and neuromorphological correlates, J. Neurol. Sci. 78 (1987)261–272.
[68] N.M. Sherwood, P.S.A. Timiras, Stereotaxic Atlas of the Develop-ing Rat Brain, University of California Press, Ltd., Los Angeles,California, 1970.
[69] R.L. Sidman, Histogenesis of the mouse retina studied withthymidine-H3, in: G.K. Smelser (Ed.), The Structure of the Eye,1961, pp. 487–506.
[70] J.C. Speh, R.Y. Moore, Retinohypothalamic tract development in thehamster and rat, Dev. Brain Res. 76 (1993) 171–181.
[71] J. Stone, A Guide to the Preparation and Analysis of Retinal WholeMounts, Maitland Publications Pty. Ltd., 1981.
[72] K. Takatsuji, H. Oyamada, M. Tohyama, Postnatal development ofthe substance-P, neuropeptide-Y and serotonin-containing fibers in
f the270.
[ re-per-
[ sen-85–
[ rke,tisolpres-
[ ctive,
[ the976)
57] L.P. Morin, The circadian visual system, Brain Res. Rev. 67 (1102–127.
58] M. Onis, C. de Montiero, J. Akre, G. Clugston, The worldwide manitude of protein-energy malnutrition: on overview from the Wglobal database on child growth, Bull. World Health Org. 71 (19703–712.
59] A.D.O. Paixao, F.A. Nunes, J.C. Monteiro, C.R. Maciel, Low sodichloride content in a multideficient diet induces renal vasodilatain rats, Nutr. Res. 23 (2003) 85–89.
60] G. Paxinos, C. Watson, The Rat Brain in Stereotaxic Coordinsecond edition, Academic Press Inc., California, 1986.
61] C.W. Picanc¸o-Diniz, M.S. Araujo, J.M.C. Borba, R.C.A. GuedeNADPH-diaphorase containing neurons and biocytin-labelledterminals in the visual cortex of adult rats malnourished duringvelopment, Nutr. Neurosci. 1 (1998) 35–48.
62] D.C.N. Pontes Pessoa, E.S. de Lago, N.R. Teodosio, F.M. BionDietary proteins on reproductive performance in three cons
the rat suprachiasmatic nucleus in relation to development oretinohypothalamic projection, Dev. Brain Res. 84 (1995) 261–
73] N.R. Teodosio, E.S. Lago, S.A.M. Romani, R.C.A. Guedes, Agional basic diet from northeast Brazil as a dietary model of eximental malnutrition, Arch. Latinoam. Nutr. 4 (1990) 533–547.
74] R. Uauy, D.R. Hoffman, P. Peirano, D.G. Birch, E.E. Birch, Estial fatty acids in visual brain development, Lipids 36 (2001) 8895.
75] K.E. Warnes, M.J. Morris, M.E. Symonds, I.D. Phillips, I.J. ClaJ.A. Owens, I.C. Mcmillen, Effects of increasing gestation, corand maternal undernutrition on hypothalamic neuropeptide Y exsion in the sheep fetus, J. Neuroendocrinol. 10 (1998) 51–57.
76] D.R. Weaver, The suprachiasmatic nucleus: a 25-year retrospeJ. Biol. Rhythms 13 (1998) 100–112.
77] C.D. West, T.L. Kemper, The effects of a low protein diet onanatomical development of the rat brain., Brain Res. 107 (1221–237.