Development of biocontrol methods for camellia flower blight ...
270
Lincoln University Digital Thesis Copyright Statement The digital copy of this thesis is protected by the Copyright Act 1994 (New Zealand). This thesis may be consulted by you, provided you comply with the provisions of the Act and the following conditions of use: you will use the copy only for the purposes of research or private study you will recognise the author's right to be identified as the author of the thesis and due acknowledgement will be made to the author where appropriate you will obtain the author's permission before publishing any material from the thesis.
-
Upload
khangminh22 -
Category
Documents
-
view
2 -
download
0
Transcript of Development of biocontrol methods for camellia flower blight ...

Lincoln University Digital Thesis
Copyright Statement
The digital copy of this thesis is protected by the Copyright Act 1994 (New Zealand).
This thesis may be consulted by you, provided you comply with the provisions of the Act and the following conditions of use:
you will use the copy only for the purposes of research or private study you will recognise the author's right to be identified as the author of the thesis and
due acknowledgement will be made to the author where appropriate you will obtain the author's permission before publishing any material from the
thesis.

DEVELOPMENT OF BIOCONTROL METHODS
FOR CAMELLIA FLOWER BLIGHT CAUSED BY
CIBORINIA CAMELLIAE KOHN
A thesis submitted in fulfilment
of the requirements of the
Degree of
Doctor of Philosophy
at
Lincoln University
Canterbury
New Zealand
by
R. F. van Toor
2002
Abstract
Abstract of a thesis submitted in fulfilment of the Degree of Doctor
of Philosophy
DEVELOPMENT OF BIOCONTROL METHODS FOR
CAMELLIA FLOWER BLIGHT CAUSED BY CIBORINIA
CAMELLIAE KOHN
by Ron van Toor
Camellia flower blight is caused by the sclerotial-forming fungus Ciborinia camelliae Kohn,
and is specific to flowers of most species of camellias. An investigation was conducted into
the feasibility of a wide range of biological methods for control of the pathogen by attacking
soil-borne sclerotia and thereby preventing apothecial production, and protecting camellia
flowers against ascospore infection.
Two methods were developed to assess the viability of C. camelliae sclerotia for subsequent
use in sclerotial parasitism assays. One method involved washing and rinsing sclerotia twice
in 13.5% NaOCl, followed by immersion in antibiotics, bisection of sclerotia fragments onto
potato dextrose agar, and identification of C. camelliae mycelium after incubation. Another
method used sclerotial softness as an indicator of viability. Softness was determined from the
energy required to push a 2.76 diameter penetrometer with a force of 40 N into a 6 mm thick
segment of healthy sclerotia (17 and 14 Nmm for medium and large sizes). This method was
modified by recording as parasitised those sclerotia that were pierced under a I-kg probe with
a footprint of 6.2 mm2, which delivered a pressure 1.6 MPa.
The known mycoparasites Trichoderma virens, T. hamatum, T. stromaticum, Clonostachys
rosea, Coniothyrium minitans and Sporidesmium sclerotivorum were not effective in reducing
sclerotia viability. However, in screens of 400 candidate microorganisms isolated from
sclerotial baits and decaying sclerotia, two isolates of Trichoderma and an isolate of Fusarium
lateritium reduced the number of viable sclerotia by 38-50%. This indicated that moderately
parasitic micro-antagonists were present in soil under camellia bushes.
A range of soil treatments, which were postulated to stimulate micro-parasitic activity, was
investigated in an attempt to reduce the viability and germination potential of the over
wintering sclerotia. Urea, applied to soil at 50 kg N/ha, with Bio-Start soil conditioners in
February and again in June reduced field populations of sclerotia from 294 to 105 sclerotialm2
by the following November. Covering soil under camellia bushes with 100 mm thick tree
mulches for 9 months resulted in total suppression of apothecia and a 77% reduction in the
population density of soil-borne sclerotia, compared to bare soil. However, tree mulches had
no effect on the new generation of C. camellia sclerotia developing in fallen flowers. Mulches
amended with lignin-degrading white-rot fungi offered potential for decay of newly formed
sclerotia. In laboratory assays, pine (Pinus radiata) sawdust amended with Phanerochaete
cordylines LU900 led to a 77-83% reduction in viability of sclerotia after 12 weeks, compared
to a 1-7% reduction in sclerotia embedded in sawdust alone. Ligninolytic enzymes released
by the isolate were shown to degrade the rinds of sclerotia, exposing them to microbial
parasitism. The practical application of P. cordylines is dependent upon confirmation that it is
non-pathogenic to camellia. Integration of the three soil treatments offers potential for long
term control of camellia blight.
A single application of the fertiliser calcium cyanamide at 500-1000 kglha to soil under
camellia bushes immediately before' flowering (August), gave complete suppression of
apothecial production, and can be used for short-term control of the disease. Potassium
bicarbonate and ammonium bicarbonate at 300 kg/ha was less effective.
Attempts to protect camellia flowers from infection by C. camelliae ascospores were only
partially successful. Although isolates of Bacillus, Pseudomonas, Aureobasidium and
Cladosporium spp. provided almost complete protection against camellia blight in petal
assays, they did not prevent symptoms in whole flowers on camellia bushes, even after
repeated applications with or without adjuvants. Weekly applications of the elicitor
acibenzolar-S-methyl to camellia bushes, 3 weeks before and during flowing to induce
systemic acquired resistance, were also not effective in controlling camellia blight.
The genetic diversity of C. camelliae isolates was investigated using a universally primed
polymerase chain reaction DNA fingerprinting technique. The 27 isolates from four regions in
11

New Zealand were found to be distinctly different to those from United States, which
comprised three isolates each from Georgia, Oregon and Virginia. However, a low level of
genetic variation «20%) existed between isolates, suggesting that biocontrol agents are likely
to be effective for control of all isolates of C. camelliae.
The successful control strategies developed in this study could be integrated into a
programme for effective control of camellia blight. Urea applied to soil beneath camellia
bushes followed by a 100 mm thick layer of tree mulch should result in total suppression of
apothecia, thereby preventing infection in flowers, and resulting in a gradual decline in
numbers of soil-borne sclerotia. Amendment of the mulch with lignin-degrading white-rot
fungi may control newly formed sclerotia developing in fallen flowers that have been infected
by air-borne inoculum from adjacent untreated areas. Alternatively, apothecial production can
be totally suppressed with calcium cyanamide applied to soil under camellia bushes
immediately before flowering each year.
Keywords: Camellia japonica, Ciborinia camelliae, camellia blight, sclerotial pathogen, UP
peR, genetic diversity, canonical variates analysis, mycoparasites, biocontrol agents,
systemic acquired resistance, phylloplane, micro-antagonists, tree mulches, white-rot fungi,
calcium cyanamide, soil conditioners, urea.
111

Contents
Abstract .................................................................................................................. i
Contents ............................................................................................................... iv
List of Tables .................................................................................................... xiii
List of Figures .................................................................................................. xvii
List of Plates ................................................................................................... xviii
Chapter 1 .............................................................................................................. 1
1 General Introduction ....................................................................................... 1
1.1 Camellias ........................................................................................................................ 1
1.1.1 Significance of camellias ........................................................................................ 1
1.1.2 Factors affecting camellia plant health .................................................................... 2
1.2 Camellia flower blight .................................................................................................... 3
1.2.1 Disease distribution ................................................................................................. 3
1.3 Biology of Ciborinia camelliae ...................................................................................... 5
1.3.1 Taxonomy ................................................................................................................ 5
1.3.2 Disease cycle ........................................................................................................... 6
1.3.3 Development of sclerotia ........................................................................................ 9
1.3.3.1 Components ofthe sclerotia .......................................................................... 9
1.3.3.1.1 The rind and cortex ................................................................................. 9
1.3.3.1.2 Medulla ................................................................................................. 10
1.3.3.1.3 Nutrient reserves ................................................................................... 10
1.3.4 Apothecia production ............................................................................................ 10
1.3.5 Pathogen dispersal and camellia susceptibility ..................................................... 11
1.4 Culturing of C. camelliae ............................................................................................. 12
1.4.1 Cultural characteristics .......................................................................................... 12
1.4.2 Growth requirements ............................................................................................. 13
1.4.2.1 Nutrient requirements .................................................................................. 13
1.4.2.2 Media ........................................................................................................... 13
1.4.2.3 Production in vitro of propagules ................................................................ 13
1.4.2.4 Elimination of contamination ...................................................................... 14
1.5 Disease control strategies ............................................................................................. 14
1V

1.5.1 Limiting the spread of the disease ......................................................................... 15
1.5.2 Cultural control ..................................................................................................... 15
1.5.3 Fungicide application ............................................................................................ 16
1.5.3.1 Soil-applied fungicides for control of sclerotia ........................................... 16
1.5.3.2 Foliar application to camellia bushes ........................................................... 17
1.5.3.3 Application to cut blooms ............................................................................ 18
1.6 Biocontrol of sclerotial pathogens ................................................................................ 18
1.6.1 Alternatives to chemicals ...................................................................................... 18
1.6.1.1 Screening ofbiocontrol agents .................................................................... 19
1.6.2 Biocontrol of soil-borne sclerotia .......................................................................... 19
1.6.2.1 Commonly used genera ............................................................................... 20
1.6.2.2 Factors influencing effectiveness ................................................................. 20
1.6.3 Methods for enhancing activity of soil-borne micro-antagonists .......................... 21
1.6.3.1 Soil amendments .......................................................................................... 21
1.6.3.2 Bark and tree mulches .................................................................................. 22
1.6.3.3 Sclerotial degradation by fungus gnats ........................................................ 23
1.6.3.4 Sclerotial degradation by wood white-rot fungi .......................................... 23
1.6.4 Methods for preventing ascospore infection in flowers ........................................ 24
1.6.4.1 Micro-antagonists applied to flowers .......................................................... 24
1.6.4.2 Induction of systemic acquired resistance ................................................... 25
1.7 Project objectives ......................................................................................................... 25
1.7.1 Target the soil-borne sclerotia ............................................................................... 26
1. 7.2 Protect flowers from infection ............................................................................... 26
1.7.3 Genetic homogeneity ............................................................................................. 26
Chapter 2 ............................................................................................................ 28
2 Development of tests to determine viability and parasitism of sclerotia ........................................................................................................... 28
2.1 Introduction .................................................................................................................. 28
2.2 Methods ........................................................................................................................ 30
2.2.1 Sclerotia ................................................................................................................. 30
2.2.2 Stimulation of mycelial production ....................................................................... 30
2.2.2.1 Surface-cleansing of sclerotia ...................................................................... 30
2.2.2.2 Sclerotial dissection and culturing methods ................................................ 31
2.2.3 Sclerotial firmness ................................................................................................. 32
2.2.3.1 Measuring firmness using a penetrometer ................................................... 32
v
2.2.3.2 Detennining parasitism using the I-kg probe method ................................. 32
2.2.4 Statistical analysis ................................................................................................. 33
2.3 Results .......................................................................................................................... 33
2.3.1 Techniques for culturing from sclerotia ................................................................ 33
2.3.1.1 Surface-cleansing of sclerotia ...................................................................... 33
2.3 .1.2 Sclerotial dissection and use of antibiotics .................................................. 34
2.3.1.3 Validation of the selected surface-cleansing method .................................. 35
2.3.1.4 Effect of surface cleansing treatment on rind integrity ................................ 38
2.3.2 Sclerotia firmness .................................................................................................. 39
2.3.2.1 Measuring firmness using the penetrometer ................................................ 39
2.3.2.2 Detennining parasitism using the I-kg probe method ................................. 39
2.4 Discussion .................................................................................................................... 40
2.4.1 Comparison of sclerotial viability techniques ....................................................... 40
2.4.2 Application of the sclerotial viability tests ............................................................ 43
Chapter 3 ............................................................................................................ 44
3 Control of sclerotia by microbial antagonists ............................................ .44
3.1 Evaluation of known mycoparasites ............................................................................. 45
3.1.1 Introduction ........................................................................................................... 45
3.1.1.1 Mycoparasite genera .................................................................................... 45
3.1.1.2 Sclerotial antagonists in New Zealand ......................................................... 47
3.1.2 Methods ................................................................................................................. 48
3.1.2.1 Mycoparasite source and identification ....................................................... 48
3.1.2.2 Trials 1 and 2: Initial evaluation of known mycoparasites on sclerotia in sand and soil assays ................................................................................. 48
3.1.2.2.1 Mycoparasites ....................................................................................... 48
3.1.2.2.2 Sclerotia ................................................................................................ 49
3.1.2.2.3 Trial 1 - sand assay with surface-cleansed sclerotia ............................. 49
3.1.2.2.4 Trial 2 - soil assay ................................................................................. 50
3.1.2.2.5 Detennination of sclerotia viability and parasitism .............................. 50
3.1.2.3 Trials 3 and 4: Amended methods to evaluate mycoparasites on sclerotia in sand and soil assays ................................................................... 51
3.1.2.3.1 Mycoparasites ....................................................................................... 51
3.1.2.3.2 Sclerotia ................................................... ; ............................................ 52
3.1.2.3.3 Trial 3 - sand bioassay .......................................................................... 52
3.1.2.3.4 Trial 4 - soil bioassay ............................................................................ 52
3.1.2.4 Calibration of sclerotia volume/weight ratio ............................................... 53
V1
3.1.2.5 Trial 5: Field evaluation of three known mycoparasites .............................. 53
3.1.2.5.1 Measurements ....................................................................................... 54
3.1.2.6 Statistical analysis ........................................................................................ 55
3.1.2.7 Scanning electron microscopy (SEM) ......................................................... 55
3.1.3 Results ................................................................................................................... 56
3.1.3.1 Trials 1 and 2: Initial evaluation of known mycoparasites on sclerotia in sand and soil assays ................................................................................. 56
3.1.3.1.1 Trial 1 - sand assay with surface-cleansed sclerotia ............................. 56
3.1.3.1.2 Soil assay .............................................................................................. 58
3.1.3.2 Trials 3 and 4: Amended methods to evaluate mycoparasites on sclerotia in sand and soil assays ................................................................... 59
3.1.3.2.1 Sand assay- natural sclerotia ............................................................... 59
3.1.3.2.2 Soil assay .............................................................................................. 60
3.1.3.3 Trial 5: Field evaluation of three known mycoparasites .............................. 60
3.1.3.3.1 Apothecia production by sclerotia ........................................................ 60
3.1.3.3.2 Survival of non-germinated sclerotia .................................................... 61
3.1.3.3.3 Bagged sclerotia .................................................................................... 64
3.1.3.4 Fungi-treated flowers ................................................................................... 64
3.1.3.5 SEM observations of my co parasites on sclerotia ........................................ 64
3.1.4 Discussion ............................................................................................................. 65
3.2 Screening for soil-borne micro-antagonists of sclerotia ............................................... 70
3.2.1 Introduction ........................................................................................................... 70
3.2.2 Methods ................................................................................................................. 71
3.2.2.1 Sclerotial baits .............................................................................................. 71
3.2.2.2 Screening for antagonists ............................................................................. 72 "
3.2.2.2.1 Screen 1 ................................................................................................ 72
3.2.2.2.2 Screen 2 ................................................................................................ 73
3.2.2.2.3 Screen 3 ................................................................................................ 74
3.2.2.3 Statistical analysis ........................................................................................ 74
3.2.3 Results ................................................................................................................... 75
3.2.3.l Sclerotial bait survival and microbial contamination .................................. 75
3.2.3.2 Identifying sclerotial antagonists ................................................................. 76
3.2.3.2.1 Screen 1 ................................................................................................ 76
3.2.3.2.2 Screen 2 ................................................................................................ 76
3.2.3.2.3 Screen 3 ................................................................................................ 77
3.2.4 Discussion ............................................................................................................. 78
3.2.4.l Survival of sclerotia baits in soil.. ................................................................ 78

3.2.4.2 Isolation of successful micro-antagonists from soil .................................... 79
3.2.5 Conclusions ........................................................................................................... 81
Chapter 4 ............................................................................................................ 82
4 Control of sclerotia and apothecia with soil conditioners and fertilisers ......................................................................................................... 82
4.1 Evaluation of Bio-Start ™ soil conditioners for control of sclerotia .............................. 83
4.1.1 Introduction ........................................................................................................... 83
4.1.2 Methods ................................................................................................................. 85
4.1.2.1 Laboratory assays ........................................................................................ 85
4.1.2.1.1 Assay 1 - Bio-Start™ products and urea ............................................... 85
4.1.2.1.2 Assay 2 - urea ....................................................................................... 86
4.1.2.2 Field trial ...................................................................................................... 86
4.1.2.3 Statistical analysis ........................................................................................ 87
4.1.3 Results ................................................................................................................... 87
4.1.3.1 Laboratory assays ........................................................................................ 87
4.1.3.1.1 Assay 1 - Bio-Start™ products and urea ............................................... 87
4.1.3.1.2 Assay 2 - urea ....................................................................................... 88
4.1.3.2 Field trial ...................................................................................................... 88
4.1.4 Discussion ............................................................................................................. 89
4.1.4.1 Bio_Start™ soil conditioners ......................................................................... 89
4.1.4.2 Effect of nitrogenous fertilisers ................................................................... 90
4.2 Suppression of apothecial production using fertilisers ................................................. 93
4.2.1 Introduction ........................................................................................................... 93
4.2.2 Methods ................................................................................................................. 94
4.2.2.1 Statistical analysis ........................................................................................ 94
4.2.3 Results ................................................................................................................... 95
4.2.4 Discussion ............................................................................................................. 97
Chapter 5 .......................................................................................................... 1 00
5 Control of sclerotia using tree mulches ..................................................... 1 00
5.1 Evaluation of tree mulches to control soil-borne sclerotia ......................................... 101
5.1.1 Introduction......................................................................................................... 101
5.1.2 Methods ............................................................................................................... 102
5.1.2.1 Field Trial .................................................................................................. 102
5.1.2.1.1 Treatments .......................................................................................... 102
'1:'111

5.1.2.1.2 Seeding plots with sclerotia ................................................................ 103
5.1.2.1.3 Assessments ........................................................................................ 103
5.1.2.2 Mulch leachate assays ................................................................................ 104
5.1.2.2.1 Measurements ..................................................................................... 105
5.1.2.3 Statistical analysis ...................................................................................... 105
5.1.3 Results ................................................................................................................. 107
5.1.3.1 Field trial. ................................................................................................... 107
5.1.3.2 Mulch leachate assays ................................................................................ 108
5.1.3.2.1 One dayleachates ............................................................................... 108
5.1.3 .2.2 Twenty day leachates .......................................................................... 110
5.1.4 Discussion ........................................................................................................... III
5.2 Degradation of sclerotia in tree mulches amended with wood-rot fungi ................... 117
5.2.1 Introduction ......................................................................................................... 117
5.2.1.1 Degradation of the protective rind ............................................................. 117
5.2.1.2 White-rot fungi .......................................................................................... 118
5.2.1.2.1 Genera and species tested in assays .................................................... 119
5.2.1.3 Brown-rot fungi ......................................................................................... 121
5.2.1.4 Experimental approach .............................................................................. 121
5.2.2 Methods ............................................................................................................... 122
5.2.2.1 Assays ........................................................................................................ 122
5.2.2.1.1 Assay 1 - Sawdust/rye flour mix amended with wood-rot fungi on soil. ...................................................................................................... 122
5.2.2.1.2 Assay 2 - non-sterile sawdust ............................................................. 123
5.2.2.1.3 Assay 3 - sterile sawdust/rye flour mix .............................................. 123
5.2.2.1.4 Assay 4 - mechanism of sclerotia 1 decay ............................................ 124
5.2.2.2 Melaninase activity of white-rot fungi ....................................................... 127
5.2.2.3 Microscopic examination of sclerotial sections ......................................... 127
5.2.2.3.1 TEM .................................................................................................... 128
5.2.2.3.2 Light microscopy ................................................................................ 128
5.2.2.4 Statistical analysis ...................................................................................... 128
5.2.3 Results ................................................................................................................. 129
5.2.3.1 Assays ........................................................................................................ 129
5.2.3.1.1 Assay 1 - Sawdust/rye flour mix amended with wood-rot fungi on soil. ...................................................................................................... 129
5.2.3.1.2 Assay 2 - non-sterile sawdust ............................................................. 130
5.2.3.1.3 Assay 3 - sterile sawdust/rye flour mix .............................................. 130
5.2.3.1.4 Assay 4 - mechanisms of sclerotial decay ......................................... 133
lY

5.2.3.2 Evidence ofmelaninase production and sclerotial decay .......................... 139
5.2.4 Discussion ........................................................................................................... 139
5.2.4.1 Processes involved in parasitism of sclerotia by white-rot fungi .............. 143
5.2.4.2 Field-testing of the white-rot mulch system .............................................. 145
Chapter 6 .......................................................................................................... 149
6 Protecting flowers against infection ........................................................... 149
6.1 Identifying phylloplane antagonists ........................................................................... 149
6.1.1 Introduction......................................................................................................... 149
6.1.2 Methods ............................................................................................................... 150
6.1.2.1 Screening for antagonists in petal assays ................................................... 150
- 6.1.2.1.1 Flower collection ................................................................................ 150
6.1.2.1.2 Isolation of microorganisms from flowers ......................................... 151
6.1.2.1.3 C. camelliae ascospores ...................................................................... 151
6.1.2.1.4 Assayprocedure .................................................................................. 152
6.1.2.1.5 Storage of isolates from the screens ................................................... 153
6.1.2.2 Evaluation of antagonists on camellia bushes ........................................... 153
6.1.2.2.1 Modified assay procedure ................................................................... 153
6.1.2.2.2 Camellias and shadehouse trial design ............................................... 154
6.1.2.2.3 Spray treatments ................................................................................. 155
6.1.2.2.4 Flower infection .................................................................................. 156
6.1.2.2.5 Disease assessment ............................................................................. 156
6.1.2.3 Statistical analysis ...................................................................................... 156
6.1.3 Results ................................................................................................................. 158
6.1.3.1 Screening for antagonists ........................................................................... 158
6.1.3.1.1 Initial screen - Assay 1 ....................................................................... 158
6.1.3.1.2 Repeat screening of isolates - Assays 2 and 3 ....... ; ........................... 159
6.1.3.1.3 Assessment of isolates after cold storage - Assay 4 ........................... 160
6.1.3.2 Evaluation of antagonists on camellia bushes ........................................... 160
6.1.3.2.1 Spray 1 - Established cultures without adjuvants .............................. 160
6.1.3.2.2 Spray 2 - 1 d bacterial cultures and fungal suspensions with no adjuvants ............................................................................................. 161
6.1.3.2.3 Spray 3 - 1 d bacteria cultures, and Break-Thru® added to the suspensions ......................................................................................... 162
6.1.3.2.4 Spray 4 - 1 d bacterial cultures and Codacide added to the suspensions ......................................................................................... 164
6.1.4 Discussion ........................................................................................................... 165
y

6.2 Induction of resistance in camellia flowers to infection using acibenzolar-s-methyl 171
6.2.1 Introduction ......................................................................................................... 171
6.2.1.1 Mode of action of acibenzolar-S-methyl ................................................... 173
6.2.1.2 Application to camellia flowers ................................................................. 173
6.2.2 Methods ............................................................................................................... 174
6.2.2.1 Statistical analysis ...................................................................................... 175
6.2.3 Results ................................................................................................................. 175
6.2.4 Discussion ........................................................................................................... 177
6.2.4.1 Explanations for lack of disease protection ............................................... 177
6.2.4.1.1 Inadequate induction of systemic resistance ....................................... 177
6.2.4.1.2 Inadequate translocation of defence compounds from leaves to flowers ................................................................................................ 178
6.2.4.1.3 Induction of salicylic acid does not induce resistance to C. camelliae infection .............................................................................. 179
Chapter 7 .......................................................................................................... 181
7 Genetic variation in isolates of Ciborinia camelliae from New Zealand and USA ......................................................................................... 181
7.1 Introduction ................................................................................................................ 181
7.1.1 Polymerase chain reaction techniques ................................................................. 182
7.2 Methods ...................................................................................................................... 183
7.2.1 Fungal isolates ..................................................................................................... 183
7.2.2 Generation of C. camelliae mycelia .................................................................... 184
7.2.3 DNA extraction ................................................................................................... 184
7.2.3.1 DNA quantification .................................................................................... 185
7.2.3.2 UP-PCR analysis ........................................................................................ 185
7.2.3.3 Statistical analysis ...................................................................................... 186
7.3 Results ........................................................................................................................ 187
7.3.1 DNA quantification ............................................................................................. 187
7.3.2 DNA banding patterns ......................................................................................... 187
7.3.3 Description of presence/absence data ................................................................. 188
7.3.4 Cluster analysis ................................................................................................... 189
7.3.5 Canonical variates analysis ................................................................................. 189
7.4 Discussion .................................................................................................................. 196
Chapter 8 .......................................................................................................... 200
8 Concluding discussion ................................................................................. 200
Yl

8.1 Future research directions .......................................................................................... 200
8.2 Improved management of camellia blight.. ................................................................ 203
8.3 Conclusions ................................................................................................................ 206
Acknowledgements .......................................................................................... 207
References ......................................................................................................... 209
Publications published from this study ............................................................................. 230
Personal communications ............................................................................... 231
Appendices ........................................................................................................ 232
Appendix 1: Media used in experiments ........................................................................... 232
Appendix 2: Mycoparasitism assay in USA - Chapter 3.1 ............................................... 234
Appendix 3: Sclerotial parasitism screen - Chapter 3.2 .................................................... 235
Appendix 4: Bio-Start™ Material safety data - Chapter 4.1 .............................................. 237
Appendix 5: C. camelliae in camellia stems - Chapter 6.1.. ............................................. 239
Appendix 6: Petal micro-antagonist screen - Chapter 6.1 ................................................ 240
Appendix 7: Isolate and adjuvant petal assays - Chapter 6.1 ............................................ 241
Appendix 8: Jaccard similarity matrix (6 primers) - Chapter 7 ......................................... 245
Appendix 9: UP-PCR data - Chapter 7 ............................................................................. 246
Appendix 10: Canonical variates analysis - Chapter 7 ...................................................... 248
Vll
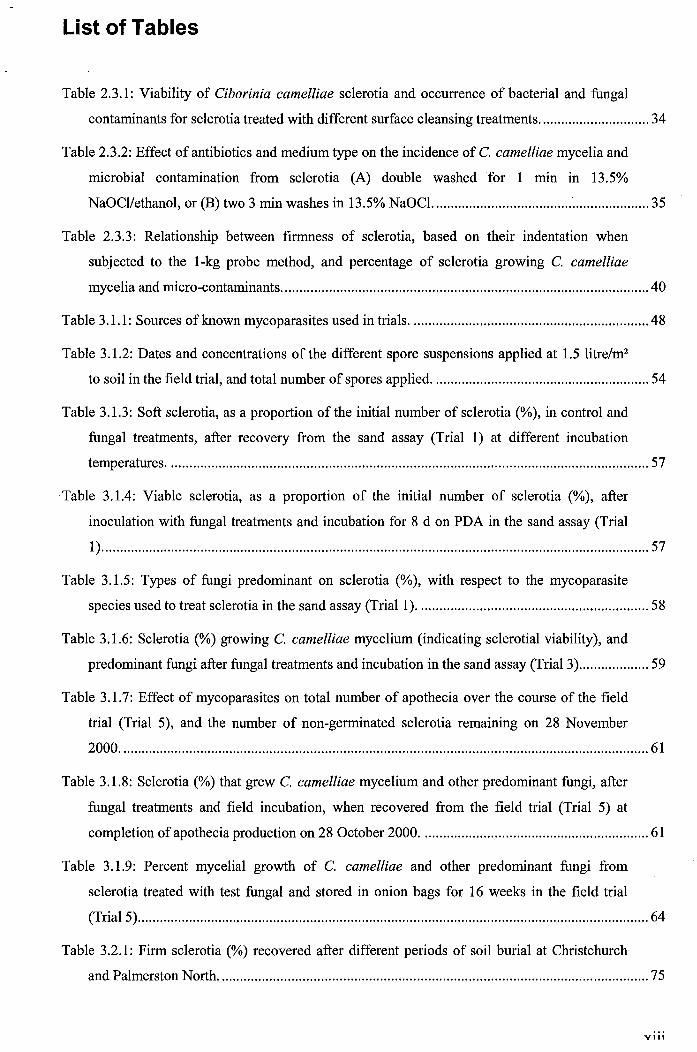
List of Tables
Table 2.3.1: Viability of Ciborinia camelliae sclerotia and occurrence of bacterial and fungal
contaminants for sclerotia treated with different surface cleansing treatments .............................. 34
Table 2.3.2: Effect of antibiotics and medium type on the incidence of C. camelliae mycelia and
microbial contamination from sclerotia (A) double washed for 1 min in 13.5%
NaOCI/ethanol, or (B) two 3 min washes in 13.5% NaOCI. .......................................................... 35
Table 2.3.3: Relationship between firmness of sclerotia, based on their indentation when
subjected to the I-kg probe method, and percentage of sclerotia growing C. camelliae
mycelia and micro-contaminants .................................................................................................... 40
Table 3.1.1: Sources of known mycoparasites used in trials ................................................................. 48
Table 3.1.2: Dates and concentrations of the different spore suspensions applied at 1.5 litre/m2
to soil in the field trial, and total number of spores applied ........................................................... 54
Table 3.1.3: Soft sclerotia, as a proportion of the initial number of sclerotia (%), in control and
fungal treatments, after recovery from the sand assay (Trial 1) at different incubation
temperatures ................................................................................................................................... 57
Table 3.1.4: Viable sclerotia, as a proportion of the initial number of sclerotia (%), after
inoculation with fungal treatments and incubation for 8 d on PDA in the sand assay (Trial
1) ..................................................................................................................................................... 57
Table 3.1.5: Types of fungi predominant on sclerotia (%), with respect to the mycoparasite
species used to treat sclerotia in the sand assay (Trial 1) ............................................................... 58
Table 3.1.6: Sclerotia (%) growing C. camelliae mycelium (indicating sclerotial viability), and
predominant fungi after fungal treatments and incubation in the sand assay (Trial 3) ................... 59
Table 3.1.7: Effect of mycoparasites on total number of apothecia over the course of the field
trial (Trial 5), and the number of non-germinated sclerotia remaining on 28 November
2000 ................................................................................................................................................ 61
Table 3.1.8: Sclerotia (%) that grew C. camelliae mycelium and other predominant fungi, after
fungal treatments and field incubation, when recovered from the field trial (Trial 5) at
completion of apothecia production on 28 October 2000 .............................................................. 61
Table 3.1.9: Percent mycelial growth of C. camelliae and other predominant fungi from
sclerotia treated with test fungal and stored in onion bags for 16 weeks in the field trial
(Trial 5) ........................................................................................................................................... 64
Table 3.2.1: Firm sclerotia (%) recovered after different periods of soil burial at Christchurch
and Palmerston North ..................................................................................................................... 75
Vl11
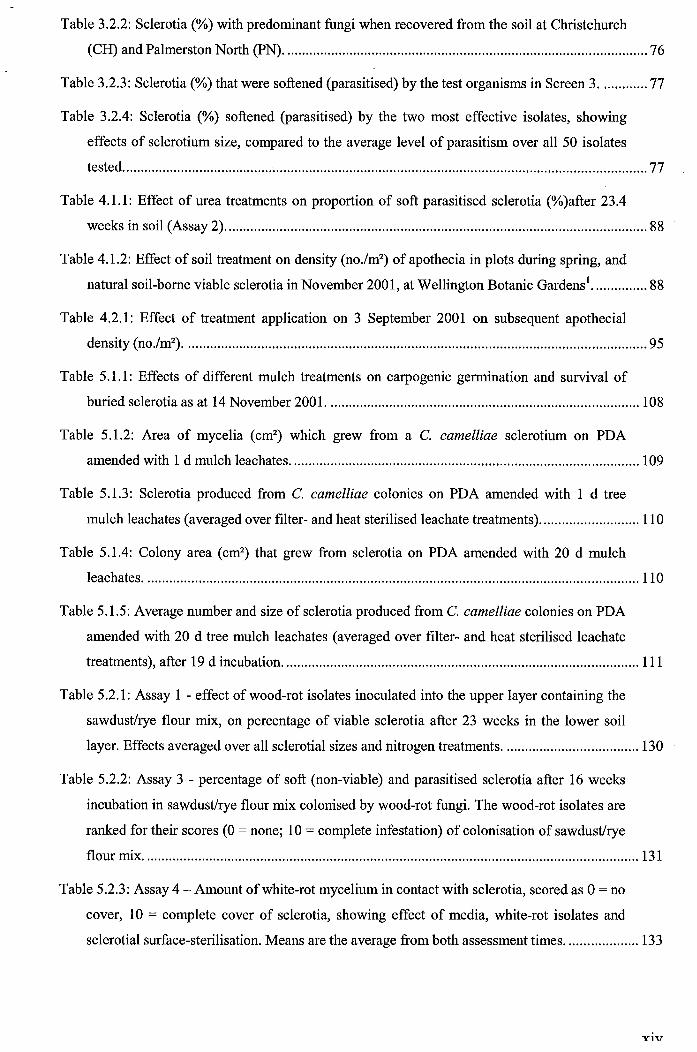
Table 3.2.2: Sclerotia (%) with predominant fungi when recovered from the soil at Christchurch
(CH) and Palmerston North (PN) ................................................................................................... 76
Table 3.2.3: Sclerotia (%) that were softened (parasitised) by the test organisms in Screen 3 ............. 77
Table 3.2.4: Sclerotia (%) softened (parasitised) by the two most effective isolates, showing
effects of sclerotium size, compared to the average level of parasitism over all 50 isolates
tested ............................................................................................................................................... 77
Table 4.1.1: Effect of urea treatments on proportion of soft parasitised sclerotia (% )after 23.4
weeks in soil (Assay 2) ................................................................................................................... 88
Table 4.1.2: Effect of soil treatment on density (no./m2) of apothecia in plots during spring, and
natural soil-borne viable sclerotia in November 2001, at Wellington Botanic Gardensl ............... 88
Table 4.2.1: Effect of treatment application on 3 September 2001 on subsequent apothecial
density (no./m2) .............................................................................................................................. 95
Table 5.1.1: Effects of different mulch treatments on carpogenic germination and survival of
buried sclerotia as at 14 November 2001. .................................................................................... 108
Table 5.1.2: Area of mycelia (cm2) which grew from a C. camelliae sclerotium on PDA
amended with 1 d mulch leachates ............................................................................................... 109
Table 5.1.3: Sclerotia produced from C. camelliae colonies on PDA amended with 1 d tree
mulch leachates (averaged over filter- and heat sterilised leachate treatments) ........................... 110
Table 5.1.4: Colony area (cm2) that grew from sclerotia on PDA amended with 20 d mulch
leachates ....................................................................................................................................... 110
Table 5.1.5: Average number and size of sclerotia produced from C. camelliae colonies on PDA
amended with 20 d tree mulch leachates (averaged over filter- and heat sterilised leachate
treatments), after 19 d incubation ................................................................................................. 111
Table 5.2.1: Assay 1 - effect of wood-rot isolates inoculated into the upper layer containing the
sawdust/rye flour mix, on percentage of viable sclerotia after 23 weeks in the lower soil
layer. Effects averaged over all sclerotial sizes and nitrogen treatments ..................................... 130
Table 5.2.2: Assay 3 - percentage of soft (non-viable) and parasitised sclerotia after 16 weeks
incubation in sawdust/rye flour mix colonised by wood-rot fungi. The wood-rot isolates are
ranked for their scores (0 = none; 10 = complete infestation) of colonisation of sawdust/rye
flour mix ....................................................................................................................................... 131
Table 5.2.3: Assay 4 - Amount of white-rot mycelium in contact with sclerotia, scored as 0 = no
cover, 10 = complete cover of sclerotia, showing effect of media, white-rot isolates and
sclerotial surface-sterilisation. Means are the average from both assessment times .................... 133
V1V

Table 5.2.4: Assay 4 - Main effect of media and efficacy of white-rot isolates on percent killed
sclerotia after 7 weeks incubation, averaged over antagonists ..................................................... 134
Table 5.2.5: Assay 4 - Main effect of sclerotial sterilisation treatments and inoculation with
white-rot isolates alone or in combination with Trichoderma sp. or bacteria, on percent
sclerotia killed after 7 weeks incubation ...................................................................................... 135
Table 5.2.6: Assay 4 - The effect of sclerotium sterilisation treatments and inoculation with
white-rot isolates, alone or in combination with Trichoderma sp. or bacteria added to the
sand or sawdust media on percent of sclerotia killed, after 11 weeks incubation ........................ 136
Table 5.2.7: Assay 4 - Effect of antagonists and media on percent sclerotia killed, after 11
weeks incubation .......................................................................................................................... 137
Table 5.2.8: Assay 4 - Main effect from media and white-rot on percent sclerotia killed after 11
weeks incubation .......................................................................................................................... 137
Table 5.2.9: Assay 4 - Main effect of white-rot and antagonist on percent sclerotia killed after
11 weeks incubation ..................................................................................................................... 137
Table 5.2.10: Assay 4 - Effect of white-rot isolates and antagonists in sawdust/rye flour on
percent non-sterilised sclerotia killed, after 7 and 11 weeks incubation ...................................... 138
Table 6.1.1: Percentage of mean petal necrosis characteristic of C. camelliae infection compared
to the pathogen control (100%), 4 d after inoculation using low levels of ascospore
inoculum ....................................................................................................................................... 159
Table 6.1.2: Assay 4. Percentage of each petal exhibiting camellia blight compared to the
pathogen control (100%), 3 d after low and high levels of inoculation, using isolates from
fresh culture after cold storage ..................................................................................................... 160
Table 6.1.3: Spray 1 - Percentage of each petal exhibiting camellia blight compared to the
pathogen control (100%) in the petal assay. Percentage incidence of flowers infected and
blight scores in bushes sprayed with 14 d bacterial cultures and fungal spore suspensions in
the shadehouse trial. ..................................................................................................................... 161
Table 6.1.4: Spray 2 - Percentage of each petal exhibiting camellia blight compared to the
pathogen control (100%) in the petal assay. Percentage incidence of flowers infected and
blight scores in bushes sprayed with 1 d bacterial cultures and fungal spore suspensions in
the shadehouse trial. ..................................................................................................................... 162
Table 6.1.5: Spray 3 - Percentage of each petal exhibiting camellia blight compared to the
pathogen control (100%) in the petal assay. Percentage incidence of flowers infected and
blight scores in bushes sprayed with 1 d bacterial cultures and 14 d fungal spore
suspensions containing Break-Thru® surfactant in the shadehouse trial. ..................................... 163
YV

Table 6.1.6: Spray 4 - Percentage of each petal exhibiting camellia blight compared to the
pathogen control (100%) in the petal assay. Percentage incidence of flowers infected and
blight scores in bushes sprayed with Id bacterial cultures and 14 d fungal spore suspensions
containing Codacide® adjuvant in the shade ,house trial... ........................................................... 165
Table 6.2.1: Effect of Bion treatments on accumulated number and proportion of flowers
infected with C. camelliae at the 5th, 9th and 16th assessment times ............................................. 176
Table 6.2.2: Effect of Bion treatments on number and total weight of sclerotia produced per
flower, and percentage of sclerotia within each weight range ...................................................... 176
Table 7.2.1: Sources of C. camelliae isolates ...................................................................................... 183
Table 7.2.2: Oligonucleotide primers used and their annealing temperatures ..................................... 186
Table 7.3.1: Scored bands for each region l that were the same for isolates within each group,
but varied between groups ............................................................................................................ 189
Table 7.3.2: Presence (1) or absence (0) of unique scored bands for each primer, and number of
isolates with that grouping within each region Wanganui (Wng), Palmerston North (Prnn),
Wellington (WIg) and Christchurch (Chc) in New Zealand, and Georgia (Geo), Oregon
(Ore) and Virginia (Va) in United States, including the total number of isolates tested per
region ............................................................................................................................................ 192

List of Figures
Figure 1.3.1: Life cycle of C. camelliae . ................................................................................................. 6
Figure 1.7.1: Approach to evaluating the feasibility of strategies for biological control of C.
camelliae ... ...................................................................................................................................... 27
Figure 7.1: Quantification of genomic DNA extracted from representative C. camelliae isolates
in 1% agarose gel electrophoresis. Mass is indicated by the High DNA Mass Ladder at the
left of the ge1. ................................................................................................................................ 190
Figure 7.2: Primer AA2M2; seven polymorphic bands from 10 scored bands ................................... 190
Figure 7.3: Primer AS4; one polymorphic band from 10 scored bands ............................................... 190
Figure 7.4: Primer ASI5; three polymorphic bands from six scored bands ........................................ 191
Figure 7.5: Primer AS 15inv; seven polymorphic bands from 10 scored bands ................................... 191
Figure 7.6: Primer LI5; five polymorphic bands from 14 scored bands ............................................. 191
Figure 7.7: Primer L45; eight polymorphic bands from 12 scored bands ........................................... 191
Figure 7.8: Hierarchical clustering of genetic relatedness using Jaccard's coefficient similarities
and the single-link cluster method, based on UP-PCR fragment analysis of six primers
among isolates of C. camelliae. Isolates are represented from Wellington (WU and WL),
Palmerston North (MP and WP), and Wanganui (GW) in the North Island and Christchurch
(AC and CC) in the South Island of New Zealand, and from Way Cross in Georgia (WG),
Corvalis in Oregon (CO) and Norfolk in Virginia (NV) in USA. ................................................ 193
Figure 7.9: Canonical variates plot of all bands that were not uniform across all isolates,
showing relative spatial separation between isolates from each region. The large symbols
represent the region means, and the small symbols represent the isolates. The lines
represent individual bands (0 at centre, and 1 at end) that had a large influence on the
spatial separation of the isolates: Bands from primer L45 at 600 kb (A), 700 kb (E) and
1400 kb (B), AS15inv at 1600 kb (C), and AS15 at 1250 kb (D). The intersection of the
vectors represented no positive response on any bands, and the end of each vector
represented a positive response on that band and no other positive responses. The centre (0,
0) on the axes represented the mean response of all isolates ........................................................ 195

List of Plates
Plate 1.2.1: Symptoms of camellia blight, showing healthy and blighted flowers on Camellia
japonica . ........................................................................................................................................... 4
Plate 1.2.2: Early C. camelliae infection in a camellia flower (left), and advanced flower
infection showing growth of mycelium at the base (right), which eventually will develop
into sclerotia ..................................................................................................................................... 4
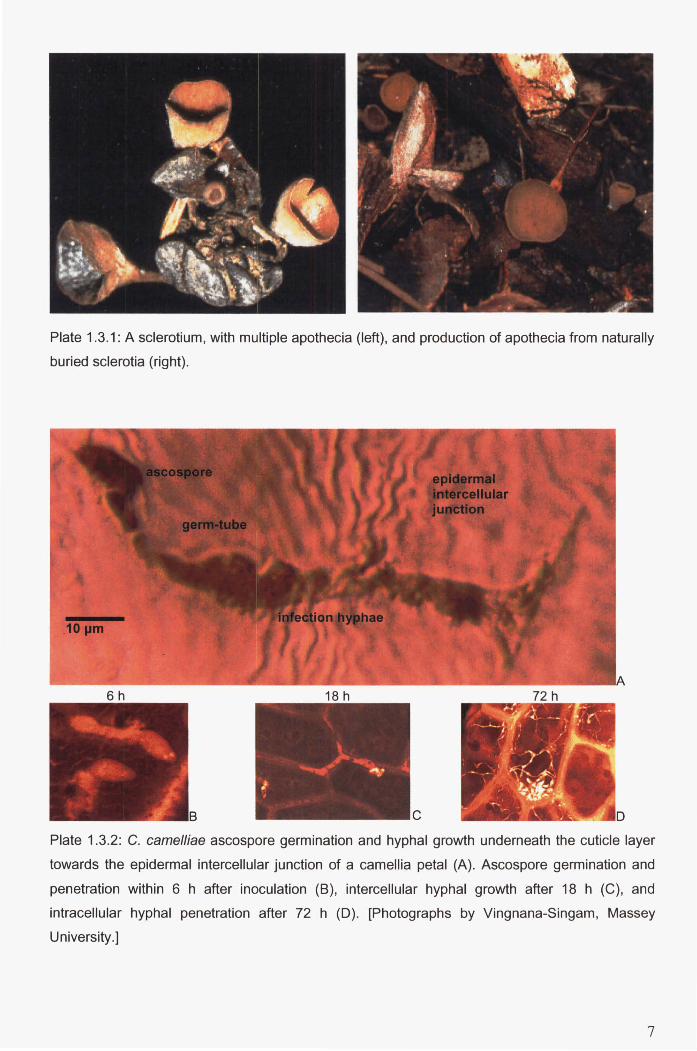
Plate 1.3.1: A sclerotium, with multiple apothecia (left), and production of apothecia from
naturally buried sclerotia (right) ....................................................................................................... 7
Plate 1.3.2: C. camelliae ascospore germination and hyphal growth underneath the cuticle layer
towards the epidermal intercellular junction of a camellia petal (A). Ascospore germination
and penetration within 6 h after inoculation (B), intercellular hyphal growth after 18 h (C),
and intracellular hyphal penetration after 72 h (D). [Photographs by Vingnana-Singam,
Massey University.] ................................................................ ; ......................................................... 7
Plate 1.3.3: Range of sizes (0.1-3.5 g) and morphology of sclerotia ....................................................... 8
Plate 1.3.4: Light micrograph of a C. camelliae sclerotium showing a pigmented peripheral zone
forming a rind (R), a narrow cortex (C) immediately beneath it, and a central medulla (M)
of interwoven hyphae and petal tissue (PT) ..................................................................................... 8
Plate 1.3.5: Stipe formation arising from a small-sized sclerotium ......................................................... 8
Plate 1.4.1: Mycelial growth from dissected sclerotia on PDA (Difco) at 20DC, 12 h day length,
for 8 d ............................................................................................................................................. 12
Plate 2.3.1: Instron 4444 penetrometer used for determining sclerotial firmness, with the probe
shown in the inset (top, left of centre). The area under the graph records the compression
energy required to insert the probe a measured distance into the medulla ..................................... 36
Plate 2.3.2: Uncontaminated C. camelliae mycelium growing from sclerotia double washed in
13.5% NaOCI and antibiotic dip, on PDA. ..................................................................................... 36
Plate 2.3.3: Scanning electron micrographs of C. camelliae sclerotia, showing the wax cuticle
on natural surfaces (left column) apparently reduced by surface-cleansing in two 3 min
washes of 13.5% NaOCl/ethanol and 13.5% NaOCI (right column) ............................................. 37
Plate 2.3.4: Parasitism of soft sclerotia, with mycelium resembling (A) Gliocladium spp., (B)
Clonostachys rosea, (C) a representative of 'other fungi', and (D) Trichoderma spp ................... 38
Plate 3.1.1: Trial 4 layout in shadehouse, showing the trays containing the potting mix and
sclerotia, and their relative position to the camellia bushes. The shade cloth over the left
column of trays is removed to show the trays, more clearly .......................................................... 62
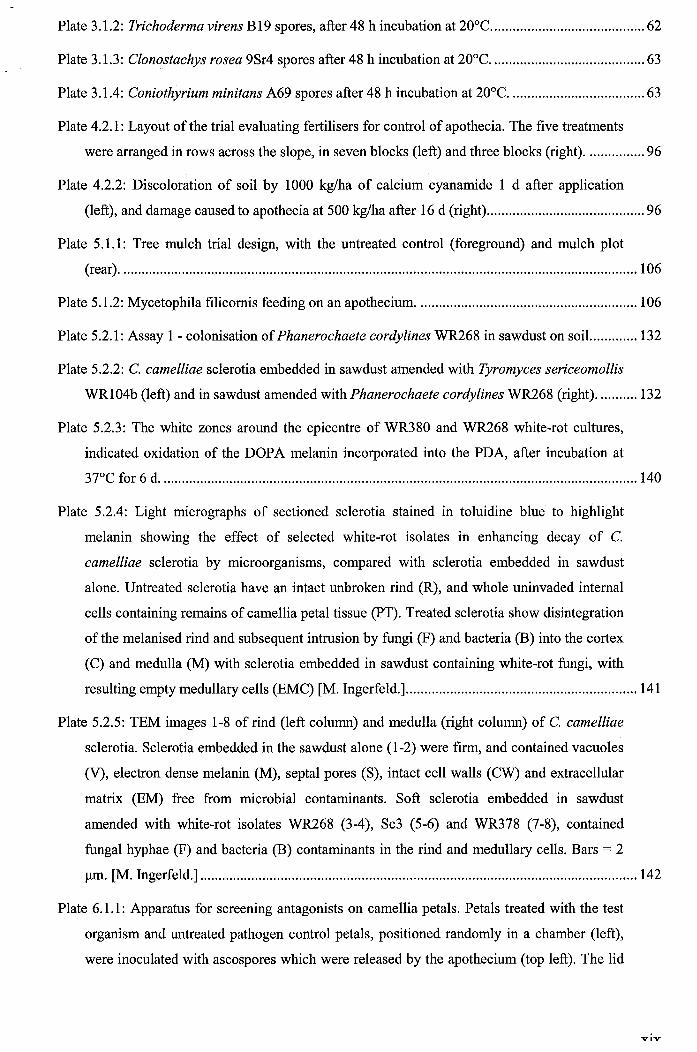
Plate 3.1.2: Trichoderma virens B19 spores, after 48 h incubation at 20DC .......................................... 62
Plate 3.1.3: Clonostachys rosea 9Sr4 spores after 48 h incubation at 20DC . ......................................... 63
Plate 3.1.4: Coniothyrium minitans A69 spores after 48 h incubation at 20DC . .................................... 63
Plate 4.2.1: Layout of the trial evaluating fertilisers for control of apothecia. The five treatments
were arranged in rows across the slope, in seven blocks (left) and three blocks (right) ................ 96
Plate 4.2.2: Discoloration of soil by 1000 kg/ha of calcium cyanamide 1 d after application
(left), and damage caused to apothecia at 500 kg/ha after 16 d (right) ........................................... 96
Plate 5.1.1: Tree mulch trial design, with the untreated control (foreground) and mulch plot
(rear) ............................................................................................................................................. 106
Plate 5.1.2: Mycetophila filicornis feeding on an apothecium ............................................................ 106
Plate 5.2.1: Assay 1 - colonisation of Phanerochaete cordylines WR268 in sawdust on soiL .......... 132
Plate 5.2.2: C. camelliae sclerotia embedded in sawdust amended with Tyromyces sericeomollis
WR104b (left) and in sawdust amended with Phanerochaete cordylines WR268 (right) ........... 132
Plate 5.2.3: The white zones around the epicentre of WR380 and WR268 white-rot cultures,
indicated oxidation of the DOPA melanin incorporated into the PDA, after incubation at
37DC for 6 d .................................................................................................................................. 140
Plate 5.2.4: Light micrographs of sectioned sclerotia stained in toluidine blue to highlight
melanin showing the effect of selected white-rot isolates in enhancing decay of C.
camelliae sclerotia by microorganisms, compared with sclerotia embedded in sawdust
alone. Untreated sclerotia have an intact unbroken rind (R), and whole uninvaded internal
cells containing remains of camellia petal tissue (PT). Treated sclerotia show disintegration
of the melanised rind and subsequent intrusion by fungi (F) and bacteria (B) into the cortex
(C) and medulla (M) with sclerotia embedded in sawdust containing white-rot fungi, with
resulting empty medullary cells (EMC) [M. Ingerfeld.]. .............................................................. 141
Plate 5.2.5: TEM images 1-8 of rind (left column) and medulla (right column) of C. camelliae
sclerotia. Sclerotia embedded in the sawdust alone (1-2) were firm, and contained vacuoles
(V), electron dense melanin (M), septal pores (S), intact cell walls (CW) and extracellular
matrix (EM) free from microbial contaminants. Soft sclerotia embedded in sawdust
amended with white-rot isolates WR268 (3-4), Sc3 (5-6) and WR378 (7-8), contained
fungal hyphae (F) and bacteria (B) contaminants in the rind and medullary cells. Bars = 2
/lm. [M. Ingerfeld.] ....................................................................................................................... 142
Plate 6.1.1: Apparatus for screening antagonists on camellia petals. Petals treated with the test
organism and untreated pathogen control petals, positioned randomly in a chamber (left),
were inoculated with ascospores which were released by the apothecium (top left). The lid
v,v

of the enclosed chamber (right) supported the Petri dish lids, which identified the position
of the treatments in the chamber ................................................................................................... 157
Plate 6.1.2: Camellia bushes and camellia bushes and shadehouse used in the trial. .......................... 157
Plate 6.1.3: C. camelliae ascospore infection of petals in trials using antagonists, Pseudomonas
sp. A3B 1 (left) and P. marginalis GA8Ps4 (right). U = untreated control, P = pathogen
control, M = test microorganism, and M+S = test microorganism plus surfactant. ..................... 158
Chapter 1
1 General Introduction
1.1 Camellias
1.1.1 Significance of camellias
All of the 267 species recorded within the genus Camellia originated from Asia except C.
lanceolatawhich is a native of the Philippines and Indonesia (Savige 1993). Some species are
grown for their economic value. The leaves of C. sinensis L. var. sinensis Kuntze and C.
sinensis var. assamica (Mast.) Kitamura, are used to make tea. Crushed seeds of some species
such as C. oleifera, C. chekiangoleosa, C. reticulata, C. grijsii, C. vietnamensis, C.
crapnelliana and C. gauchowensis are cultivated for production of high quality oils (Rolf
1992). The oil is used in cosmetics and for cooking, while other camellia products are used by
pharmaceutical and manufacturing industries (Xia et al. 1993). In Georgia in the United States
of America, nursery production of tea oil from C. oleifera is currently under investigation for
use in cooking and in the cosmetic industry, with process residues being considered for
livestock feed and insecticide formulations (Ruter 2001).
Most camellias are grown for their ornamental value. Camellia flowers have been selected for
centuries to produce a wide range of colours, flower forms (single, semi-double peony,
anemone, rose-form double and formal double), and sizes (1-23 cm). The most popular
ornamental species of camellia are C. sasanqua Thunb., which flowers in autumn and winter,
and C. japonica L. and C. reticulata Lindl that flower in winter and spring. Inter-specific
hybridisation has led to ca. 5600 hybrids being registered worldwide (Hagiya 1997).
In New Zealand, camellias represent an important part of nursery operations. About $300,000
of camellia plants is exported annually, mainly to Europe (Jim Rumbal pers. comm. 2002).
Duncan and Davis sell 20,000 plants per year at $8-10/plant, which represents 5-10% of the
camellia market share. Therefore, $1.6-4 million worth of camellia plants are sold annually in
New Zealand, making the total export and domestic value of the camellia industry upwards of
$4.5 million.
1
1.1.2 Factors affecting camellia plant health
In New Zealand, strongly growing camellia bushes are generally free from invertebrate pests
and diseases. However, minor plant health problems can occur (Rolfe 1992). Changing the
environmental conditions can usually rectify physiological disorders that result from climatic
changes, inadequate drainage or nutritional imbalances. Chlorosis caused by alkaline soils,
which prevent iron and other nutrients being available in a soluble form, can be ameliorated
by application of acid fertilisers, compost, and iron sulphate. Yellowing between green veins
in the leaves can indicate lack of iron or magnesium, and is readily corrected by application of
sulphate of iron or magnesium sulphate. Potassium deficiency can result in brown patches on
leaves and can be corrected with potassic superphosphate. An excessive build-up of salts in
the soil can result in edges of leaves turning brown, and is usually corrected by thorough
watering to wash the salts from the immediate root zone. Sucking insects include aphids and
scale, which may affect the vigour of young camellia plants, and require treatment with
insecticides. Viruses can infect camellias, but their effect is usually minor and aesthetic, such
as irregular blotches of white on coloured flowers, and irregular blotches of yellow or pale
colour on the foliage (Rolfe 1992).
Fungal diseases may be more serious in camellia plants. The soil-borne fungus Glomerella
cingulata can cause sudden death and wilting of young shoots, and growth of cankers. The
wind-borne fungus Exobasidium spp. affects young leaves at the ends of branches, causing
them to become light green to white, or deep pink to red. Phytophthora cinnamomi can cause
root rot, a disease common in waterlogged non-aerobic soils. Symptoms are expressed in
summer, when leaves become yellow and die, and branches wilt and die back from the tip
until the whole plant dies (Rolfe 1992). Roots of an affected plant will be dark brown and
brittle, and contain few white fibrous roots essential for healthy plants.
Two fungal diseases of flowers are of concern because of the importance of camellias for their
flowers. Botrytis cinerea, which causes botrytis flower blight or grey mould, is characterised
by water-soaked brown spots on the petals (Crawford 2001). The spots spread quickly to form
tan to grey-brown blotches associated with the blighting and decay of blooms. The disease is
prevalent when relative humidity exceeds the threshold of 93% and B. cinerea spores can
infect the petals. Consequently, the disease can be a problem in glasshouse-grown camellias.
The other main flower disease is camellia flower blight; otherwise referred to as camellia
petal blight.
2
1.2 Camellia flower blight
Since camellias are most commonly grown for their attractive flowers, camellia flower blight,
which causes premature browning and fall of infected flowers that detracts from their
aesthetic value, is considered to be the most important disease affecting camellias. The fungus
Ciborinia camelliae Kohn causes the disease. It is a specialist pathogen, which attacks only
the floral parts of species belonging to the genus Camellia (Kohn and Nagasawa 1984) (Plate
1.2.1). It has no apparent detrimental effect on other parts of the plant, including leaves and
stems. There is no published evidence that the disease retards plant vigour.
Symptoms of flower blight begin as small irregular brown specks on petals, which enlarge,
finally encompassing the whole bloom (Plate 1.2.2). While the symptoms of flower blight are
similar to those of Botrytis flower blight, with browning and premature dropping of flowers,
the diseases are easily distinguishable from one another. With flower blight, the entire and
intact whorl of petals (corolla) separates easily from the receptacle, leaving a characteristic
grey ring of fungal hyphae at the point of separation. With Botrytis flower blight, the petals
come away separately, with no sign of grey fungal growth on the broken surfaces (Fullerton et
al. 1999).
1.2.1 Disease distribution
Camellia blight was first identified in Japan in 1919 (Hara 1919), and became widespread by
1975 (Matsumoto 1995). It was first discovered in the United States in California in 1939
(Hansen and Thomas 1940), spreading to most states where camellias are grown within the
next 50 years. Origins of the disease in Georgia, Louisiana and Texas were known to have
been from California by means of imported camellia plants (Gill 1948; Plakidas 1950, 1957).
It is not known how the disease was first introduced into Oregon (Richmond 1949), Virginia
(Brown 1954), North Caroline (Haasis 1953), South Carolina (Baxter and Berly 1956),
Mississippi (Cochran 1962) and Florida (Raabe et al. 1978). In New Zealand, the disease was
first reported in Wellington in 1993 (Stewart and Neilson 1993), and is now widespread,
being present in all regions north of Christchurch (Taylor et al. 1999). Recently, the disease
was reported in England (Cook 1999), Portugal and Spain (Mansilla et al. 1999), France,
Italy, Switzerland and Germany (Peper 1999).
3

Plate 1.2.1 : Symptoms of camellia blight, showing healthy and blighted flowers on Camellia
japonica.
Plate 1.2.2: Early C. camelliae infection in a camellia flower (left), and advanced flower infection
. showing growth of mycelium at the base (right), which eventually will develop into sclerotia.
4
1.3 Biology of Ciborinia camelliae
1.3.1 Taxonomy
Holst-Jensen et al. (1997a) used analyses of ribosomal rDNA gene sequences to place the
genus Ciborinia into the restricted concept of Sclerotiniaceae, a family of plant-infecting
discomycetes (Helotiales) in which apothecia are cup or disk shaped and produced from
stroma or sclerotia (Agrios 1997). The family includes Botryotinia, Ciboria, Coprotin ia ,
Dumontinia, Encoelia, Grovesinia, Monilinia, Myriosclerotinia, Ovulinia, Pycnopeziza,
Sclerotinia, Stromatinia and Valdensinia.
Twenty Ciborinia species are known, all of which are host-specific pathogens, usually limited
to one species or to several species within a genus of plants. Most Ciborinia species attack the
leaves or floral parts of their hosts, with some species also infecting twigs, bark, bulbs and
stolons (Batra and Korf 1959). All members of the genus Ciborinia have an annual life cycle,
with sclerotia forming in infected host tissue over summer and autumn, and then producing
apothecia the following spring (Batra 1960). Most species produce microconidia, although
none have been recorded to produce macroconidia (Kohn 1979).
Whetzel (1945) erected the genus Ciborinia to contain species in which either wholly or
partly digested host tissue was incorporated into the sclerotial medulla, thereby creating a
taxonomic separation between this group and members of the genus Sclerotinia whose
sclerotia do not contain host tissue. When first identified in 1919, the pathogen causing
camellia blight was named Sclerotinia camelliae Hara (Hara 1919), but Kohn (1979) named
isolates of the pathogen from California Ciborinia camellia Kohn, because she believed that
they were separate species. The latter name became adopted after Kohn and Nagasawa (1984)
studied the holotypes of both organisms and concluded that they were the same.
Molecular studies of C. camellia have not yet been reported in the literature, although some
studies have been conducted on the phylogeny of various members of the Sclerotiniaceae,
based on a comparison of their ribosomal DNA sequences (Holst-Jensen et al. 1997a, 1997b).
Carbone and Kohn (1993) concluded from a comparison of the internal transcribed spacer
(ITS) sequences of C. ciborium and C. erythronii, that the genus Ciborinia was a
heterogeneous grouping of species and 'in need of monographic revision'.
5
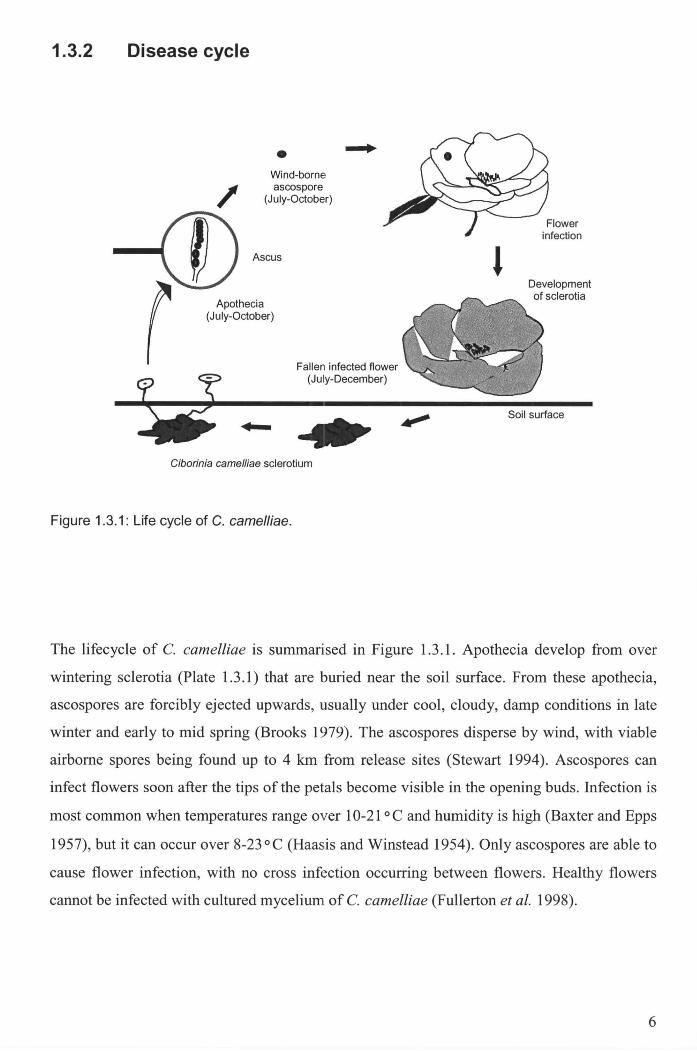
1.3.2 Disease cycle
/ •
Wind-borne ascospore
(July-October)
Ascus
Apothecia (July-October)
Fallen infected flower (July-December)
Ciborinia camelliae sclerotium
Figure 1.3.1: Life cycle of C. camelliae.
Development of sclerotia
Soil surface
The lifecycle of C. camelliae is summarised in Figure 1.3.1. Apothecia develop from over
wintering sclerotia (Plate 1.3.1) that are buried near the soil surface. From these apothecia,
ascospores are forcibly ejected upwards, usually under cool, cloudy, damp conditions in late
winter and early to mid spring (Brooks 1979). The ascospores disperse by wind, with viable
airborne spores being found up to 4 km from release sites (Stewart 1994). Ascospores can
infect flowers soon after the tips of the petals become visible in the opening buds. Infection is
most common when temperatures range over 10-21 °C and humidity is high (Baxter and Epps
1957), but it can occur over 8-23°C (Haasis and Winstead 1954). Only ascospores are able to
cause flower infection, with no cross infection occurring between flowers . Healthy flowers
cannot be infected with cultured mycelium of C. camelliae (Fullerton et at. 1998).
6
...... '.~ ..... . '<~
~ , .,-... ...411) .• •
AA~:' ;' "'I ." ···. 0· ··· ·
Ii ~ , . . '. .. . . . ' • • . '.S·;-' . .'
" '.:.i.i'~' ' . ., .... " I~ .... ~ . "-. . ~: f lo.,:. . '., J,. . .' ~ / ... , )' .,. ' • " .' . ., . ' .'"..... ...... 1 " " . ,; ' , . -li. '
'r " .~\\"\ ~
Plate 1.3.1: A sclerotium, with multiple apothecia (left), and production of apothecia from naturally
buried sclerotia (right).
Plate 1.3.2: C. camelliae ascospore germination and hyphal growth underneath the cuticle layer
towards the epidermal intercellular junction of a camellia petal (A). Ascospore germination and
penetration within 6 h after inoculation (8), intercellular hyphal growth after 18 h (C), and
intracellular hypha I penetration after 72 h (0). [Photographs by Vingnana-Singam, Massey
University.]
7

• • ,
Plate 1.3.3: Range of sizes (0.1-3.5 g) and morphology of sclerotia.
Plate 1.3.4: Light micrograph of a C. camelliae sclerotium showing a pigmented peripheral zone
forming a rind (R), a narrow cortex (C) immediately beneath it, and a central medulla (M) of
interwoven hyphae and petal tissue (PT).
Plate 1.3.5: Stipe formation arising from a small-sized sclerotium.
8

The ascospores germinate and infect petals, symptoms usually appeanng first as small
irregular brown specks (Plate 1.3.2), within 72 h after inoculation (Vingnana-Singam et al.
2000). They gradually enlarge and develop into rotting masses of brown tissue at the flower
centres (Stewart and Neilson 1993). Fungal hyphae then develop in the base of flowers to
form circular grey collars of undifferentiated fungal cells (Stewart 1994) (Plate 1.2.2). These
pseudoparenchyma develop to form black sclerotia that fall with the flowers onto the ground.
The fungus produces an abundance of micro-conidia on the decaying petals, but these
microspores do not disseminate the disease, being required for the sexual reproductive stage
of the fungus (Brooks 1979) .
1.3.3 . Development of sclerotia
Sclerotia develop on senescent petals and sepals. One or more sclerotia can develop from each
infected flower, usually after the flower has dropped to the ground. The number of sclerotia
depends on the form of flower, with one or two large sclerotia developing in simple flowers
and up to about 20 small sclerotia in complex flowers. The sclerotia are irregular in shape
being influenced by the shape of the sepals, and range in size from 3 mm diameter thin discs
to 25 mm diameter rings (Plate 1.3.3).
1.3.3.1 Components of the sclerotia
Sclerotia have a convex dorsal surface and a concave ventral surface. They are composed of a
protective rind, cortex and a medulla (Plate 1.3.4).
1.3.3.1.1 The rind and cortex
The rind consists of a continuous layer of pseudo-parenchymatous melanised cells and the
cortex of 4-6 layers of cream or white, close fitting rounded pseudo-parenchymatous cells
with thick walls (Kohn and Nagasawa 1984). The rind of the dorsal surface is compact,
comprising a layer four to eight cells thick of textura globulosa cells which are 4-8 J.lm
diameter with dark brown, carbonaceous and irregularly thickened walls (Kohn and
Nagasawa 1984). The ventral rind is less compact, comprising a layer of 4-8 globose cells that
are 4-7 J.lm wide. Hyphal tips at the periphery of the developing sclerotium form these cells,
which become closely packed to form a continuous layer. The hyphal tips have 1 J.lm thick
walls and are arranged in chains perpendicular to the surface axis of the sclerotium.
9

The capacity of sclerotia to survive for a number of years in the soil is due to melanin, the
main component of the rind. Melanin is black, and gives the rind its black appearance. In
fungi, melanin provides protection against many environmental stresses such as exposure to
toxic metals, ultra violet light, desiccation, hyperosmosis, temperature extremes, antagonistic
microorganisms, limited nutrients, pH shock and ionising radiation (Butler and Day 1998).
1.3.3.1.2 Medulla
The rind and cortex layers encase a broad medulla of interwoven hyphae of pros-enchymatous
tissue and petal tissue (Plate 1.3.4). The remnants of the host tissue, such as polygonal and
spiral wall thickenings of vessel elements, remain embedded among the cortical and
medullary sclerotial hyphae. These hyphae can be compact or loosely interwoven, and
comprise hyaline textura oblita cells, which are 5-7 /lffi broad with gelatinised walls 2-3 ~m
thick.
1.3.3.1.3 Nutrient reserves
Willetts and Bullock (1992) studied the components of sclerotia. They found that glycogen
and polyphosphate granules are generally present throughout the cytoplasm of cortical and
medullary hyphae, filling spaces between other storage bodies and organelles. Protein bodies,
which make up the major cytoplasmic storage reserve, often containing polyphosphates and
lipids, appear to be the normal constituents of hyphae rather than special storage bodies. The
cell walls contain mainly chitin, plus ~-glucans of 1,3 and 1,6 linkages. These ~-glucans
comprise the highly hydrated polysaccharide mucilage that expands to fill the inter-hyphal
spaces that form the extracellular matrix. While the extracellular matrix provides a large
reserve of carbohydrate, which is utilised during carpogenic germination (Aggab & Cook
1981), it also serves to store water, which allows rapid water uptake and helps prevent
dehydration by drought and high temperatures.
1.3.4 Apothecia production
Sclerotia remain dormant in the mulch and upper soil layer beneath camellia bushes over
summer and autumn. Some, but not all, sclerotia germinate in the season following formation.
Baxter and Thomas (1995) found in a 4 year study that those remaining in the soil may be
viable for at least 4 years. It is not known whether sclerotia that have produced apothecia in
one year will germinate in subsequent years. During mid winter (late July), sclerotia
10
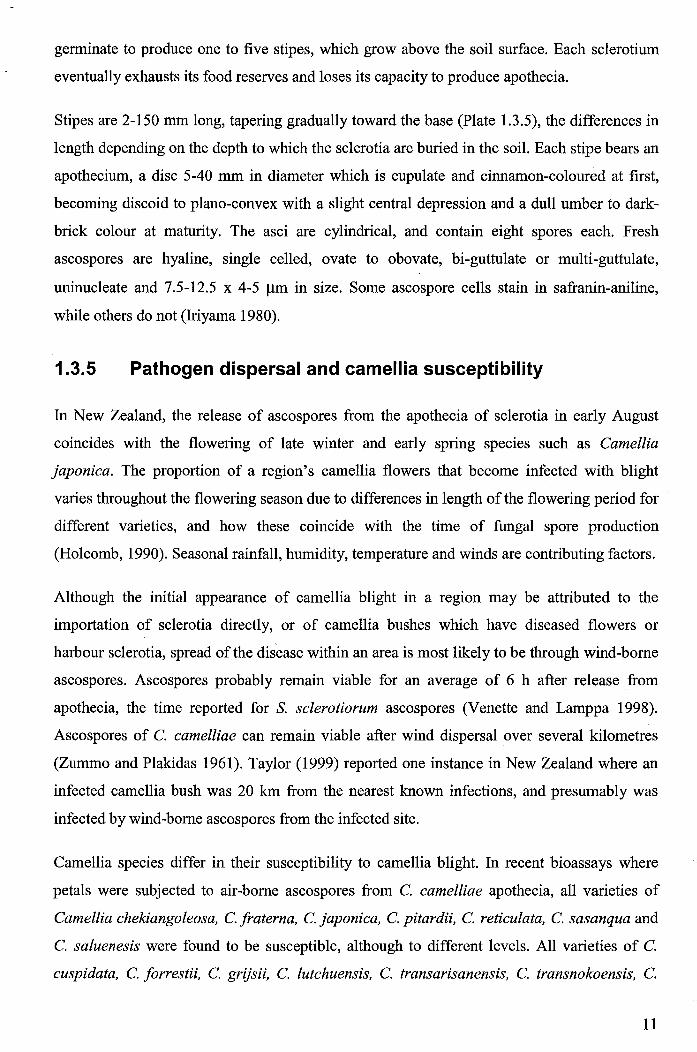
germinate to produce one to five stipes, which grow above the soil surface. Each sclerotium
eventually exhausts its food reserves and loses its capacity to produce apothecia.
Stipes are 2-150 mm long, tapering gradually toward the base (Plate 1.3.5), the differences in
length depending on the depth to which the sclerotia are buried in the soil. Each stipe bears an
apothecium, a disc 5-40 mm in diameter which is cupulate and cinnamon-coloured at first,
becoming discoid to plano-convex with a slight central depression and a dull umber to dark
brick colour at maturity. The asci are cylindrical, and contain eight spores each. Fresh
ascospores are hyaline, single celled, ovate to obovate, bi-guttulate or multi-guttulate,
uninucleate and 7.5-12.5 x 4-5 Ilm in size. Some ascospore cells stain in safranin-aniline,
while others do not (Iriyama 1980).
1.3.5 Pathogen dispersal and camellia susceptibility
In New Zealand, the release of ascospores from the apothecia of sclerotia in early August
coincides with the flowering of late winter and early spring species such as Camellia
japonica. The proportion of a region's camellia flowers that become infected with blight
varies throughout the flowering season due to differences in length of the flowering period for
different varieties, and how these coincide with the time of fungal spore production
(Holcomb, 1990). Seasonal rainfall, humidity, temperature and winds are contributing factors.
Although the initial appearance of camellia blight in a region may be attributed to the
importation of sclerotia directly, or of camellia bushes which have diseased flowers or
harbour sclerotia, spread of the dis'ease within an area is most likely to be through wind-borne
ascospores. Ascospores probably remain viable for an average of 6 h after release from
apothecia, the time reported for S. sclerotiorum ascospores (Venette and Lamppa 1998).
Ascospores of C. camelliae can remain viable after wind dispersal over several kilometres
(Zummo and Plakidas 1961). Taylor (1999) reported one instance in New Zealand where an
infected camellia bush was 20 km from the nearest known infections, and presumably was
infected by wind-borne ascospores from the infected site.
Camellia species differ in their susceptibility to camellia blight. In recent bioassays where
petals were subjected to air-borne ascospores from C. camelliae apothecia, all varieties of
Camellia chekiangoleosa, C. jraterna, C. japonica, C. pitardii, C. reticulata, C. sasanqua and
C. saluenesis were found to be susceptible, although to different levels. All varieties of C.
cuspidata, C. jorrestii, C. grijsii, C. lutchuensis, C. transarisanensis, C. transnokoensis, C.
11
yuhsienensis and C. yunnanensis were found to be resistant to ascospore infection (Taylor and
Long, 1999). C. sasanqua was found to be susceptible, indicating that its commonly accepted
disease free status is most likely due to its early flowering period (July-August) not coinciding
with the later release of C. camelliae ascospores, rather than natural resistance.
1.4 Culturing of C. cameiliae
1.4.1 Cultural characteristics
In vitro tests are important to understand how pathogens behave under a range of
environmental conditions, and for screening potential biological control agents. C. camelliae
can be grown successfully in the laboratory using a number of culturing methods. The fungus
can be isolated into pure culture by placing small pieces cut from the base of recently infected
petals, onto potato dextrose agar (PDA) containing antibiotics, ampicillin at 250 ppm and
rifampicin at 10 ppm, to inhibit bacteria (Fullerton et al. 1998). Alternatively, fungal cultures
can be grown from dissected sclerotia that have been placed on PDA.
Plate 1.4.1: Mycelial growth from dissected sclerotia on PDA (Difco) at 20°C, 12 h day length, for
8 d.
The fungus exhibits a characteristic morphology that can be used to distinguish it from other
organisms in culture. Mycelial growth at 18 0 C on PDA from a dissected sclerotium begins
with an appressed hyaline hyphal mat that covers the sclerotial fragment, then extends radially
12
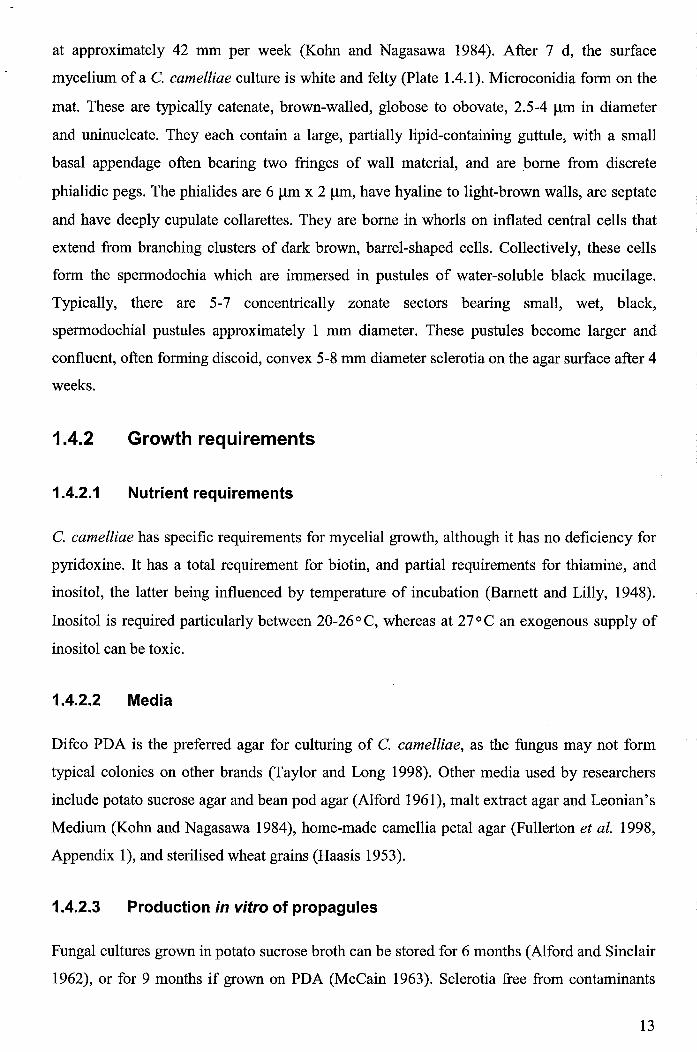
at approximately 42 mm per week (Kohn and Nagasawa 1984). After 7 d, the surface
mycelium of a C. camelliae culture is white and felty (Plate 1.4.1). Microconidia form on the
mat. These are typically catenate, brown-walled, globose to obovate, 2.5-4 Jlm in diameter
and uninucleate. They each contain a large, partially lipid-containing guttule, with a small
basal appendage often bearing two fringes of wall material, and are borne from discrete
phialidic pegs. The phialides are 6 Jlm x 2 Jlm, have hyaline to light-brown walls, are septate
and have deeply cupulate collarettes. They are borne in whorls on inflated central cells that
extend from branching clusters of dark brown, barrel-shaped cells. Collectively, these cells
form the spermodochia which are immersed in pustules of water-soluble black mucilage.
Typically, there are 5-7 concentrically zonate sectors bearing small, wet, black,
spermodochial pustules approximately 1 mm diameter. These pustules become larger and
confluent, often forming discoid, convex 5-8 mm diameter sclerotia on the agar surface after 4
weeks.
1.4.2 Growth requirements
1.4.2.1 Nutrient requirements
C. camelliae has specific requirements for mycelial growth, although it has no deficiency for
pyridoxine. It has a total requirement for biotin, and partial requirements for thiamine, and
inositol, the latter being influenced by temperature of incubation (Barnett and Lilly, 1948).
Inositol is required particularly between 20-26°C, whereas at 27°C an exogenous supply of
inositol can be toxic.
1.4.2.2 Media
Difco PDA is the preferred agar for culturing of C. camelliae, as the fungus may not form
typical colonies on other brands (Taylor and Long 1998). Other media used by researchers
include potato sucrose agar and bean pod agar (Alford 1961), malt extract agar and Leonian's
Medium (Kohn and Nagasawa 1984), home-made camellia petal agar (Fullerton et al. 1998,
Appendix 1), and sterilised wheat grains (Haasis 1953).
1.4.2.3 Production in vitro of propagules
Fungal cultures grown in potato sucrose broth can be stored for 6 months (Alford and Sinclair
1962), or for 9 months if grown on PDA (McCain 1963). Sclerotia free from contaminants
13

can be formed in vitro. Sclerotia can be produced within 14 days from C. camelliae mycelium
isolated directly from infected petals placed on PDA. However, the sclerotia produced are
usually thin, 1-2 mm thick and convex on the agar side, unlike the large robust sclerotia found
in nature. Colonies sub-cultured two or three times cease sclerotial production, instead
producing microspores that do not germinate on artificial media. They continue in that mode
through successive sub-cultures. Larger sclerotia (5-8 mm diameter) can be produced from
mycelium in 3-4 weeks, by inoculating 25 g sterilised wheat containing 40 mL water, with
agar disks containing C. camelliae mycelium, and incubating at 16°C (J. Pay pers. comm.
1999). These cultured sclerotia, if stored at 4°C, can remain viable for more than 14 years
(Holcomb, 1997). Sclerotia incubated on sterile agar comprising Murashige and Skoog salt,
peptone and sucrose (Appendix 1) at lOoC under 12 h fluorescent lighting can produce
apothecia after 1 month (Iriyama 1980).
1.4.2.4 Elimination of contamination
When assessing the efficacy of biocontrol agents or fungicides on sclerotia collected from the
field, microbial contamination can make interpretation of results difficult. Microbial
contamination can be suppressed using agar amended with fungicides and bactericides. Field
collected C. camelliae sclerotia can be selectively grown on Sclerotinia-selective agar, which
contains Czapek-Dox solution, potassium chlorate, yeast extract, casamino acids, quintozene
fungicide, copper sulphate, and lactic acid to pH 3.25 (Appendix 1). Fungal and bacterial
contamination from the sclerotial surface can be minimised by washing the sclerotia in 11 %
sodium hypochlorite (NaOCI) and absolute alcohol (50/50, v/v) for 3 min, followed by four
rinses in sterile water, repeating the wash one day later to kill newly germinating micro
organisms. The antibiotics, ampicillin at 250 ppm plus rifampicin at 10 ppm, may be added to
the medium to control bacterial contamination (Fullerton et al. 1998).
1.5 Disease control strategies
Current control strategies are aimed at interrupting the lifecycle of the pathogen by preventing
formation of sclerotia or apothecia, thereby preventing the release of ascospores, or by
preventing infection of flowers on camellia bushes.
14

1.5.1 Limiting the spread of the disease
The spread of the disease from an endemic area, and its introduction into new locations could
be restricted by only transporting camellia plants that are free of flowers, and as bare-rooted
cuttings or scions (Brown 1983). In some parts of the United States, camellia plants are sold
with all flowers and buds removed, and the public are recommended to change the upper 5 cm
of soil and replace it with a sterile medium (Raabe et al. 1958). These measures aim to
prevent old sclerotia in the soil or potential sclerotia in infected flowers from being
transported along with the plant. It would be extremely effective if adopted, but home
gardeners and many nurserymen often do not recognise that the pathogen is present when
purchasing or transferring cuttings. Home gardeners who select their plants on the appearance
of the flowers are also unlikely to purchase bare-root cuttings that are too young to flower.
Once the disease is established in a region, then the adoption of a number of cultural and
chemical methods to prevent the development of the disease has been suggested.
1.5.2 Cultural control
The disease may be avoided by growing autumn-flowering species such as C. sasanqua, or
cultivars that flower early in the season before apothecia are produced by the soil-borne
sclerotia (mid-late July in New Zealand). While this approach might be effective, most
growers of camellias prefer to have camellias flowering during the spring-summer period,
when apothecial production is at its peak.
The fallen infected camellia flowers may be raked up and burned to kill the developing
sclerotia (Hansen and Thomas 1940). A plastic sheet laid underneath flowering bushes makes
collection of fallen flowers easier, and prevents apothecial development from sclerotia
underneath (Baxter et al. 1983). This approach would be highly effective if adopted
universally, but is practised by only a few camellia growers. Further, home gardeners do not
usually bum the flowers, instead adopting the easier approach of discarding the flower debris
in compost. As sclerotia may survive composting (L. W. Baxter pers. comm. to T. M. Stewart
1994), councilor private green-waste composting schemes can contribute to the spread of the
disease.
Moisture levels on the ground where the sclerotia fall can be reduced, thereby depriving the
sclerotia of moist conditions for subsequent development (Baxter et al. 1987). This can be
15

achieved by trimming the lower camellia branches to about 0.5 m above ground, raking off
loose-leaf litter and weeds to expose bare soil, or by covering the exposed ground with either
black polythene or 75-100 mm thick pine needles (Baxter and Segars 1989). Adding ground
cover could also be effective in smothering the soil-borne sclerotia and suppressing apothecial
production from sclerotia underneath. However, these methods would have limited control of
apothecia produced by sclerotia developing in flowers that fall after the ground cover has
been applied. The apothecia could still form in wet seasons or after periods of rain.
1.5.3 Fungicide application
Fungicides can be applied to soil under camellia bushes to prevent production of apothecia by
sclerotia, or they can be sprayed onto the bushes during flowering to protect blooms from
infection by ascospores. Alternatively, cut blooms can be dipped into fungicide solutions prior
to display at flower shows.
1.5.3.1 Soil-applied fungicides for control of sclerotia
Application of fungicides to soil immediately prior to apothecial production has generally
given effective control of apothecia. In the United States, these fungicides included ferbam
and sulphur (Harvey and Hansen 1950); tebuconazole (Hotchkiss et al. 1997); captan
(Hotchkiss and Baxter 1994); calcium cyanamide and sodium trichloroacetate (Haasis and
Nelson 1953); pentachloronitrobenzene (Tourje 1958). Terraclor® 75WP (750 giL
pentachloronitrobenzene) applied as a soil drench at 1.25 kgl100 L gave a 75% reduction in
apothecia (Tourje 1958) and applied in sand at 224 kg/ha gave a 98% reduction in apothecia
(Haasis and Nelson 1953).
Fungicide trials were recently conducted over two years in Wellington, New Zealand. Alto®
100SL (100 giL cyproconazole) at 4 Llha, or Folicur® 250EC (250 giL tebuconazole) at 2.5
Llha, sprayed onto separate plots in 1000 L waterlha on 22 September 1996, and 21 days
later, reduced viable apothecia by 81-83% (Cooper et al. 1997). A year later, Alto® 100SL or
Shirlan® 500SC (500 giL fluazinam) sprayed onto infested soil at 4 L/ha in 1000 L water/ha,
on 22 August and reapplied 21 days later, were effective in preventing production of
apothecia during August to November (Fullerton et al. 1998). These fungicides reduced the
accumulated number of healthy apothecia by 96%, significantly more than the 67% for
Folicur® 430SC (430 giL tebuconazole), which was applied at the same time and rate. Results
indicate that two applications of these readily available fungicides, 3 weeks apart during
16

August-September, can be used to provide good control of apothecia production. No
fungicides are registered in New Zealand for use against C. camelliae (New Zealand
Agrichemical Manual 2002), so the risk in controlling the pathogen is borne by the user.
1.5.3.2 Foliar application to camellia bushes
Many foliar-applied fungicide sprays have been evaluated n the United States for protection
of flowers against infection by ascospores. These fungicides include omadine disulphide,
cyclohexamide, ferbam, mancozeb and thiram (Alford 1961); bitertanol, benomyl,
chlorothalonil, triadimefon (Holcomb 1990); tebuconazole (Hotchkiss et al. 1997); captan
(Hotchkiss and Baxter 1994); propiconazole and vinclozolin (Baxter et al. 1987); fluazinam
(Holcomb 1997); benzimidazole and 15% thiophanate methyl plus 60% maneb (Holcomb
1976). The level of control of camellia flower blight ranged between 0 and 96%. For any
degree of effective protection, the fungicides needed to be applied repeatedly during
flowering. Bayleton® 5 DF (50 glkg triadimefon), applied at 1 giL water to camellia bushes
weekly during flowering, only reduced numbers of blighted flowers by 31-77% in every
season over six years (Holcomb, 1990).
Some fungicides have been evaluated in New Zealand, but with limited success. Camellia
bushes were sprayed until run-off with either Alto® 100SL at 0.15 mLiL or Shirlan® at 1.0
mLiL water, both containing 0.25% of the surfactant, Contact. Fortnightly applications during
the 8 weeks of flowering gave disease levels similar to that of the untreated control (17%).
Further, the fungicides had a disturbing side effect which was to cause a corresponding
increase in the incidence of Botrytis cinerea infection from 20% in the untreated control to
35-50% in the treated bushes (Fullerton et al. 1999). Results from the trials in New Zealand
suggested that for foliar applications of fungicides onto bushes to be effective, the fungicides
needed to have a broad enough spectrum of activity to allow control of other diseases.
In both New Zealand and the United States, the systemic fungicides such as the triazoles, have
not been shown to be translocated into the camellia flower buds or flowers and provide
protection against ascospore infection (Baxter and Thomas 1994). The systemic fungicides
have not proved any more successful than protectants such as captan, do dine and omadine
disulphide (Taylor and Long 2000). Further, the efficacy of fungicides has not always been
consistent, and can vary between trials (Holcomb 1997; Hotchkiss et al. 1997). Foliar-applied
fungicides do not appear to be a practical solution to controlling camellia blight.
17
1.5.3.3 Application to cut blooms
Dipping camellia blooms into fungicide solutions has been shown to be effective in
preventing infection of cut flowers. Healthy camellia blooms that were dipped into a solution
containing Cereous 250EC (250 giL triadimenol) at 2.0 mLiL water plus a few drops of
washing up detergent, for 1-5 min 1-7 days prior to showing, delayed the onset of the disease
and allowed for 21 % more blooms to be displayed compared to those without the dip
treatment (Scheibert 1996). Edwards (1996) also found that dipping early-emerged buds into
the same solution eradicated blight symptoms in the full bloom such that the flowers were of a
sufficient quality to show. Dipping flowers in a solution of Bayleton 5DF (50 g/kg
triadimefon) at 4.0 mLiL water for 5 min reduced the number of blighted flowers from 70% in
the untreated control to 2 %, five days after treatment (Holcomb, 1990). Spraying fungicide
mists onto cut flowers as an alternative to dipping was also effective. Cereous 250EC (250
giL triadimenol) sprayed at 0.5 mLiL water onto cut flowers until run-off prevented sclerotial
development within the petals for one month. Cereous was significantly more effective than
Benlate (benomyl) at 0.5 giL, Ronilan (vinclozolin) at 2.4 giL and Tilt (propiconazole) at 1
giL water (Baxter et al. 1997).
1.6 Biocontrol of sclerotial pathogens
1.6.1 Alternatives to chemicals
In general, no fungicide has been found to give total control of the disease without repeated
applications (Taylor and Long 2000). Furthermore, chemical fungicides have limited use in
control of C. camelliae on camellias because the plants are used primarily as an amenity
flowering shrub. There is a general reluctance to apply chemicals in amenity areas frequented
by the public. In the Wellington Botanical Gardens, there are about 450 camellia bushes, yet
neither the bushes nor the ground under them have been sprayed with fungicides for control of
camellia blight, despite the disease being recognised there since 1993 (M. Dench pers. comm.
2002). Gardeners might be more willing to adopt biological control of C. camelliae,
particularly if it meant a single application of a biocontrol agent effective in providing
permanent control of sclerotia in the soil, than to apply fungicides at fortnightly intervals.
18
1.6.1.1 Screening of biocontrol agents
Potential biocontrol agents are usually initially identified in laboratory screenings. Mycelial
interactions between the pathogen and candidate antagonists can be evaluated in dual culture
assays on nutrient plates. Viability of sclerotia dipped in spore suspensions of the antagonists
can be monitored under controlled conditions, with the most promising candidates evaluated
under field conditions. Zazzerini and Tosi (1985) demonstrated that in vitro dual culture tests
were useful in screening fungal antagonists against S. sclerotiorum, with Trichoderma spp,
Coniothyrium minitans, and species of Fusarium and Penicillium having strong antagonistic
activity. However, Whipps and Budge (1990) demonstrated that form of antagonist inoculum,
incubation temperature and substrate type had significant effects on the degree of sclerotial
infection and viability for S. sclerotiorum, which indicated the limitations of in vitro screens.
Interactions between a range of pathogens which included S. sclerotiorum and many
antagonistic fungi including Trichoderma harzianum, T. viride, Coniothyrium minitans and
Gliocladium roseum, showed that the growth rate, production of volatile and non-volatile
antibiotic compounds, and hyphal interactions were influenced by tap water, soil extract and
brands of potato dextrose agar (Whipps 1987b). Further, Sandys-Winsch et al. (1994)
reported that a truer indication of a mycoparasite's potential for control of S. sclerotiorum on
sunflower seedlings was obtained from glasshouse trials using sclerotia, than from mycelial
dual plate tests. However, they recommended that both systems be used since the mycelial
tests were an economic way of identifying active isolates with biocontrol potential.
1.6.2 Biocontrol of soil-borne sclerotia
A number of mycoparasites have been reported to control Sclerotinia sclerotiorum, a
widespread plant pathogen affecting many economically important crops (Rabeendran et al.
1998; Jones and Stewart 2000). Although the sclerotia of this pathogen are significantly
smaller than sclerotia of C. camelliae, and unlike the camellia pathogen, S. sclerotiorum has a
broad host range, and the sclerotial medulla does not contain host material, the two pathogens
are closely related (Kohn, 1979). Therefore, those mycoparasites that have demonstrated field
activity against S. sclerotiorum may equally be effective against C. camelliae. The biocontrol
activities of these genera were therefore reviewed to determine which had the greatest
promise for management of camellia blight, by controlling sclerotia in the soil, or preventing
infection of plant tissue by ascospores.
19
1.6.2.1 Commonly used genera
There are four genera or species commonly used for control of sclerotia in soil that warrant
investigation as to their efficacy in controlling sclerotia of C. camelliae. C. minitans is a
natural antagonist against Sclerotinia minor, S. trifoliorum and Sclerotium cepivorum, as well
as S. sclerotiorum although the mycoparasite will not infect sclerotia of Rhizoctonia
tuliparum, Sclerotium delphinii and Typhula incarnata, due to their release of antibiotics
(Whipps et al. 1991). Clonostachys rosea (Schroers), formally named Gliocladium roseum,
has been used successfully in some instances. C. rosea inoculum added to infested soil
provided a 50% reduction in the incidence of S. sclerotiorum compared to the untreated
control in a lettuce field trial in the United Kingdom (Lynch and Ebben, 1986). A number of
Trichoderma spp. have shown promise, with isolates of T. harzianum, and T. koningii
preventing carpogenic germination of sclerotia of S. sclerotiorum, and T. harzianum
completely destroying the sclerotia 60 d after inoculation (Monaco et al. 1998). Sporidesmium
sclerotivorum has been shown to be an effective mycoparasite of sclerotial pathogens in the
United States. S. sclerotivorum was found to be active at low soil temperatures, providing
significant reductions in carpogenic germination of S. sclerotiorum in a sandy loam at 10°C
(Teo et al. 1992).
In New Zealand, Trichoderma spp., Clonostachys rosea and Coniothyrium minitans have
shown promise as effective biocontrol agents of sclerotia. Rabeendran et al. (1999) found in
one trial that isolates of T. virens, T. longipile and C. minitans A69 reduced the incidence of
infection of S. minor on lettuce from 94% in the untreated control plots to 24%, 14% and
14%, respectively. In another trial, C. minitans A69 provided effective control of S.
sclerotiorum in a cauliflower crop in early summer, giving a 41% reduction in disease
compared to the control.
1.6.2.2 Factors influencing effectiveness
A number of factors can contribute to the efficacy of biocontrol agents. The degree of control
can be related to the position of pathogen sclerotia within the crop. In sunflowers, natural
populations of C. minitans were more effective in parasitising sclerotia produced on or inside
the root than those produced in the basal stem. The mycoparasite killed 59% of sclerotia on
the root surface and 76% of sclerotia inside the root, compared to 29% of those killed inside
the stem (Huang 1977).
20

Disease severity and levels of pathogen inoculum can also be a factor. Whipps et al. (1993b)
found that wheat grain inoculum of C. mini tans provided rapid biocontrol action against S.
sclerotiorum in three consecutive lettuce crops in the glasshouse, reducing the disease levels
by 85% overall when disease levels in the untreated controls were moderate. When applied as
a maize-meal perlite mixture to soil pre-planting, C. minitans also gave control of Sclerotinia
disease under moderate disease pressure in lettuce, equivalent to repeated applications of
vinclozolin fungicide spray. At higher inoculum potentials of the pathogen, the fungicide
treatment was more effective than C. minitans, although the antagonist continued to spread in
the soil and degrade sclerotia for more than a year, eventually causing a significant reduction
in apothecial production.
Water and soil insects can aid the dispersal of biocontrol agents. Conidia of C. minitans were
splash-dispersed by irrigation (680 mm waterlh), resulting in the infection of almost all
sclerotia at 0.5 m, and 50% of those at 2 m from inoculum sources (Williams et al. 1998).
Species of Collembola, such as Folsomia candida, have been implicated in transferring C.
minitans between sclerotia, resulting in reduced numbers of apothecia (Whipps 1993). Sciarid
adults were also reported to transfer the mycoparasite (Whipps and Budge 1993).
Factors that influence the efficacy of biocontrol agents, therefore, need to be taken into
consideration when applying mycoparasites to C. camelliae sclerotia.
1.6.3
1.6.3.1
Methods for enhancing activity of soil-borne micro
antagonists
Soil amendments
The addition of soil amendments containing nutrients, fermentation or compost extracts to
soils naturally infested with, or inoculated with, microbial antagonists has been used
successfully to control sclerotial pathogens. The density of Macrophomina phaseolin a
sclerotia declined rapidly in wet soils amended with glucose and NaN03 in C:N ratios of
10:20, with the decline being positively correlated with an increase in the population of soil
microbes (Dhingra and Sinclair 1975). In another example, biphasic composts comprising
peat moss, sawdust and nitrogen-rich cow manure, with the later addition of shrimp waste
inducing a second thermophilic phase, promoted the proliferation of Gram-positive bacteria
antagonistic to oomycete plant pathogens (Labrie et al. 2001).
21
Soil amendments have also been reported to enhance the efficacy of Trichoderma spp. In
biocontrol trials, the colonisation of S. sclerotiorum sclerotia by Trichoderma spp. was
enhanced, and numbers of apothecia were reduced when field soil was amending with 150-
400 ppm fermented agricultural wastes (CF-5) or allyl alcohol (2-propen-l-01) (Huang et al.
1997). In Australia, parasitism of S. sclerotiorum sclerotia by T. koningii was enhanced when
exogenous nutrients were applied with T. koningii inoculum as a pre-sowing treatment in
spring and summer, resulting in significant reductions in the viability of sclerotia (Trutmann
and Keane 1990). Therefore, the effects of soil amendments should be investigated if
Trichoderma isolates are to be investigated for their biocontrol potential against sclerotia of
C. camelliae.
Compounds commonly used as nitrogenous fertilisers can also have a toxic effect on
apothecial production by sclerotia. Of these, calcium cyanamide (CaCN2) has been reported to
inhibit apothecial production in S. sclerotiorum. CaCN2 fertiliser mixed into the soil at 400
kg/1m reduced the total number of apothecia produced by 20 sclerotia from 30
apothecia/sclerotium to 8 apothecia/sclerotium (McQuilken 2001). Apothecial production was
also reduced by applications of CaCN2 at 50 kg/ha in bean, Phaseolus vulgaris (Akai 1981),
and at 500 kg/ha in early spring in caraway, Carum varvi (Verdam et al. 1993). The
application of CaCN2 to the soil to suppress production of apothecia by C. camelliae sclerotia
also warranted investigation.
1.6.3.2 Bark and tree mulches
A control method recommended by Baxter et al. (1987) was to cover the exposed ground
under camellia bushes with pine needles, which resulted in a reduction in apothecial
production by C. camelliae. Gardeners cannot obtain pines needles easily, but bark chips and
other forms of tree mulches from many tree species are readily available through nurseries.
Covering the ground with a thick layer of a bark or tree mulch might produce a similar effect
in suppressing apothecial production to that observed from pine needles. The bark/tree
mulches may smother existing soil-borne sclerotia thereby suppressing formation of
apothecia, and their leachates may enhance the activity of pathogenic fungi and indigenous
microorganisms. Population densities of yeasts, actinomycetes, spore-forming bacteria and
pseudomonads increased III composting Eucalyptus bark mulches (Hardy and
Sivasithamparam 1989). The reduction in pathogenicity of Phytophthora was attributed to the
increase in these organisms (Hardy and Sivasithamparam 1991a). The leachate from the bark
22

mulch was attributed to the inhibition of sporangium production by the pathogen (Hardy and
Sivasithamparam 1991b).
For S. sclerotiorum, leaf and bark extracts from the neem tree were shown to inhibit growth of
the pathogen in artificial media (Singh et al., 1980). Bark extracts and bark powders from
pine trees inhibited growth of S. sclerotiorum on agar, and when used as mulch in a
glasshouse trial, reduced the disease incidence in lintels (Kokalis and Rodriguez 1994).
Therefore, the use of bark mulches for control of C. camelliae sclerotia also warranted
investigation.
1.6.3.3 Sclerotial degradation by fungus gnats
Other organisms can enhance the activity of individual biological control microorganisms
against sclerotia, particularly if they destroy the protective rind of sclerotia. Sclerotia of S.
sclerotiorum buried in soil infested with Trichoderma hamatum degraded rapidly when the
medulla of the sclerotia was completely exposed by larvae of the fungus gnat Bradysia
coprophila (Gracia-Garza et al. 1997a). The larvae fed on the melanised rinds, which
stimulated glucanase production by the mycoparasite, and increased germination of conidia.
Arras and Reeleder (1988) also showed that increasing the organic matter content of soils
from 7 to 80% encouraged colonisation of soil by larvae of the B. coprophila fungus gnat.
Feeding by the gnat resulted in an increase in the susceptibility of the sclerotia to attack by
mycoparasites such as Trichoderma viride, thereby increasing the proportion of damaged
sclerotia.
1.6.3.4 Sclerotial degradation by wood white-rot fungi
. Utilising microorganisms that secrete the enzymes that break down melanin, the main
protective component of the rind, may result in the destruction of the sclerotial rind, to
enhance sclerotial decay. White-rot fungal saprophytes secrete ligninase enzymes, such as
manganese peroxidase, in the process of decaying dead wood. The name 'white-rot' refers to
the white stain of oxidised lignin that occurs after infection of the wood. These fungi are able
to break down fungal melanins (Butler and Day 1998b), and have been shown to cause
extensive destruction of melanised cells of the black yeast Phaeococcomyces sp. (Butler and
Day 1998a). Therefore, white-rot fungi may enhance sclerotial decay when incorporated into
the tree mulches that have been spread under camellia bushes.
23
1.6.4 Methods for preventing ascospore infection in flowers
1.6.4.1 Micro-antagonists applied to flowers
A way of preventing infection of plant tissue is by inhibiting germination of ascospores,
thereby limiting the impact of sclerotial pathogens on their hosts. This strategy was found to
be effective in controlling S. sclerotiorum, which causes white mould in snap beans. Spore
suspensions of Epicoccum purpurascens, applied at flowering, significantly reduced the
incidence of the disease compared to that in the untreated control plots (Zhou and Reeleder,
1989). In other field trials with beans, spore suspensions of Alternaria alternata, a Drechslera
sp. and E. purpurascens, which had been isolated from petals of bean and rapeseed, also gave
significant reductions in white mould (Inglis and Boland, 1992). Foliar sprays of T. viride, G.
roseum and Bacillus subtilis inoculum applied at weekly intervals during flowering of field
bean (Phaseolus vulgaris), reduced the incidence and severity of white mould disease caused
by S. sclerotiorum and increased the marketable yield (Tu 1997). In New Zealand, isolates of
Trichoderma spp., Gliocladium virens and G. roseum reduced S. sclerotiorum infection of
cabbage petioles by more than 75% and completely prevented sclerotial production
(Rabeendran et al. 1998).
However, the level of control provided by micro-antagonists can be greatly influenced by
environmental factors. The ability of fungal antagonists A. alternata, a Drechslera sp., M
verrucaria, T. viride, G. roseum and a pink yeast to control S. sclerotiorum infection of bean
Phaseolus vulgaris, varied under controlled environments of relative humidity (90, 95 and
100%) and air temperature (20, 24 and 28°C) (Hannusch and Boland 1996). Changes of only
4°C or 5% relative humidity influenced white mould control by 25-100%, with only
Epicoccum nigrum being relatively unaffected by the environmental changes.
Despite the limitations of using foliar sprays containing micro-antagonists for control of S.
sclerotiorum ascospores, they do appear sufficiently effective to warrant investigation as a
method of protecting camellia flowers against infection by ascospores of C. camelliae.
Bacteria or yeasts may have the greatest potential for preventing ascospore infection of
flowers, because of their ability to quickly populate petal surfaces. A proven method for
collecting those organisms with potential for biocontrol activity is to bait leaves on camellia
bushes with spore suspensions of C. camelliae (Long and Taylor, 1999).
24

1.6.4.2 Induction of systemic acquired resistance
Another biological strategy that may be effective against C. camelliae is the chemical
induction of host systemic acquired resistance. It involves applying chemical elicitors to
plants that activate a number of defence genes in plants, often resulting in localised necrotic
lesions. This technique has been found to be effective against a wide range of fungi, bacteria
and viruses.
Salicylic acid has been found to be an essential signal in the induction of systemic acquired
resistance (Ward et al. 1991), and was shown to reduce the incidence of disease in treated
plants. When applied weekly as a pre-harvest foliar spray to flowers of Geraldton waxflower
(Chamelaucium uncinatum), salicylic acid delayed the onset of colonisation by an Alternaria
sp. and an Epicoccum sp. on flower tissues (Beasley et al. 1999). Recent studies have
demonstrated that jasmonic acid and ethylene were also important for the induction of non
specific disease resistance through signalling pathways, but were distinct from the classic
systemic acquired resistance response pathway regulated by salicylic acid (Dong 1998). Other
chemicals such as 2,6-dichloroisonicotinic acid (INA) applied to tomatoes (Gorlach et al.
1994) have also been shown to induce this type of resistance. A synthetic benzothiadiazole,
acibenzolar-S-methyl, has also been shown to induce systemic acquired resistance. It induced
systemic resistance in apple seedlings to provide total protection against fire blight, a bacterial
disease caused by Erwinia amylovora (Chin Gouk and Boyd 1999), and reduced powdery
mildew in wheat, resulting in an 18% increase in yield (Gorlach et al. 1996). Acibenzolar-S
methyl may have potential for inducing systemic acquired resistance in camellias to protect
them against petal infection by C. camelliae ascospores. It has been made available
commercially by Novartis, Switzerland as Bion® and Actigard®.
1.7 Project objectives
The aim of this PhD was to investigate the use of a range of biocontrol methods which could
reduce activity of C. camelliae sclerotia, and provide protection from ascospore infection on
camellia flowers, in order to reduce the incidence of camellia flower blight. The key
experimental objectives were to:
25

1.7.1
1.7.2
Target the soil-borne sclerotia
• Develop methods for assessing sclerotial viability, which could be used in testing
the efficacy of microbial parasites of sclerotia.
• Evaluate spore suspensions of known mycoparasites and microorganisms isolated
from C. camelliae sclerotial baits, for their efficacy against C. camelliae sclerotia.
• Evaluate under-canopy tree mulches for their ability to reduce the density of
sclerotia and apothecia, and the effect of adding wood decaying white-rot fungi on
the continued development of sclerotia in infected flowers.
• Evaluate soil-applied fertilisers containing bicarbonate salts and calcium
cyanamide for their ability to suppress production of apothecia.
Protect flowers from infection
• Investigate the effects of a known elicitor in inducing systemic acquired resistance
to ascospore infection of camellia flowers.
• Isolate and screen naturally occurring microorganisms for their antagonism against
C. camelliae ascospores, and prevention of camellia flower blight.
1.7.3 Genetic homogeneity
• Examine DNA profiles of C. camelliae isolates to determine the genetic variability
of C. camelliae populations in New Zealand and the United States.
A flow diagram on the following page demonstrates how these objectives relate to each other
(Figure 1.7.1).
26

Biological control strategies
Prevent ascospore release from soil
+ Develop methods to assess sclerotia I viability and parasitism.
Chapter 2
Target soil-borne sclerotia by
enhancing parasitism
Test known microbial antagonists for parasitism of sclerotia in vitro and in field.
Chapter 3: Section 1
Isolate microbes from naturally decaying sclerotia and testing for sclerotia I parasitism in vitro.
Chapter 3: Section 2
T est known soil amendments and nitrogen for enhancing natural parasitism of sclerotia in vitro and in field.
Chapter 4: Section 1
+ Incorporate white rot fungi into pine mulch for amelioration of sclerotial decay by opportunistic micro-antagonists.
Chapter 5: Section 2
Target apothecia by suppressing production
! Field test bicarbonate salts and calcium cyanamide for suppressing apothecia production by sclerotia.
Chapter 4: Section 2
! Field evaluate pine, manuka and gum tree mulches for suppressing apothecial production and reducing density of sclerotia, and determining the effect of leachates on mycelial growth of C. camelliae in vitro.
Chapter 5: Section 1
Protect flowers against ascospore infection
Isolate microantagonists from camellia flowers, and application to flowering bushes for protection against ascospore infection.
Chapter 6: Section 1
Test foliar application of acibenzolar-Smethyl elicitor to induced systemic resistance in camellia bushes.
Chapter 6: Section 2
D Genetic variability within NZ and USA populations
Chapter 7
Figure 1.7.1: Approach to evaluating the feasibility of strategies for biological control of C. camelliae.
27

Chapter 2
2 Development of tests to determine viability
and parasitism of sclerotia
2.1 Introduction
Interpretation of results from trials that investigate biological control of sclerotia depends
upon reliable methods for determining the viability and parasitism of sclerotia attacked by
biocontrol agents. A common criterion for sclerotial viability is capacity to germinate either
carpogenically by producing apothecia, or vegetatively by producing mycelium. Whipps et al.
(1989) assessed the viability of sclerotia in trials with the pathogen Sclerotinia sclerotiorum,
which is closely related to C. camelliae (Kohn and Nagasawa 1984), by observing apothecial
germination from sclerotia. The sclerotia had been placed onto damp cotton wool sandwiched
between filter paper in Petri dishes, and incubated under warm-white fluorescent lights (25
W/m2, 14 h day length), at 18°C, for 12 weeks. Sclerotia were also considered viable if
mycelium characteristic of S. sclerotiorum grew from surface-sterilised sclerotia which had
been laterally bisected and placed medulla face down on potato dextrose agar (PDA) plates
containing 0.32 giL aureomycin (5.5% chlortetracycline hydrochloride). They were assessed
as parasitised by Coniothyrium minitans and T. harzianum if mycelium characteristic of these
mycoparasites grew from the sclerotial sections.
However, stipe production from C. camelliae sclerotia in vitro is umeliable as a measure of
viability. Carpogenic germination may not occur in young sclerotia that have not undergone a
winter conditioning period. Further, only a small portion of seemingly healthy sclerotia will
form stipes, and then only after 4-5 months incubation in sealed containers, under moist
conditions at lOoC. Not all sclerotia germinate in the season following formation, but they can
remain viable in the soil for more than 4 years, producing apothecia in anyone year in
response to favourable conditions (Baxter and Thomas 1995). Therefore, the presence of
stipes cannot be used as a suitable indicator of sclerotia viability. Production of mycelia by
sclerotia as an indicator of viability is a more reliable method under laboratory conditions.
Before sclerotia can be grown on a nutrient medium, microbial contaminants on the surface of
each sclerotium need to be removed or killed, as they will suppress or mask development of
28
the mycelium. A number of surface-sterilisation techniques based on sodium hypochlorite
(NaOel) have been used to kill microbial contaminants on the sclerotial rind. Hoes and
Huang (1975), surface-cleansed sclerotia of S. sclerotiorum in 4.8% NaOel for 3 min, before
they were bisected and placed on PDA to allow growth of mycelium. A harsher sterilant
treatment, which involved soaking the sclerotia in a mixture of sodium hypochlorite (NaOel),
containing 11% available chlorine, and 95% ethanol (50/50 v/v) for 3 min, followed by
rinsing three times in sterile water, was practised successfully by Whipps et al. (1989).
Fullerton et at. (1998) amended this method to inhibit fungal and bacterial contamination
from the surface of C. camelliae sclerotia, by following the first wash with four rinses in
sterile water, and repeating this procedure one day later to kill any newly germinating micro
organisms. Antibiotics, ampicillin at 250 ppm plus rifampicin at 10 ppm, were also added to
the PDA to control bacterial infection.
However, in the preliminary studies associated with this project, surface sterilisation of C.
camelliae sclerotia using these methods often resulted in very low viability scores, as evident
by the absence of C. camelliae mycelia growing on PDA from bisected surface-sterilised
sclerotia. Microbial contaminants associated with petal tissue incorporated within the medulla
(Kohn and Nagasawa 1984) were not eliminated by the surface sterilisation methods, and as a
consequence, growth of microbial contaminants suppressed or masked growth of C. camelliae
mycelia. This made accurate assessment of sclerotial viability impossible.
The unreliability of carpogenic germination of C. camelliae sclerotia under laboratory
conditions and the high levels of microbial contaminants, confounded initial attempts to
assess the efficacy of sclerotial mycoparasites. Before further trials could be attempted,
improved methods were needed to reliably assess sclerotial viability. This chapter reports on
the development of a more stringent method for surface cleansing C. camelliae sclerotia to
stimulate mycelium production from viable sclerotia. In addition another approach to
determine the viability of sclerotia was also investigated. Parasitised and decaying sclerotia
had regularly been observed to be very soft (A. Stewart, pers. comm. 1999), so in this
approach, firm sclerotia were assumed to be healthy and, therefore, viable. Sclerotia that were
attacked by microbial parasites were assumed to degrade the integrity of the medulla by
varying degrees, and were therefore softer than non-parasitised sclerotia. It was postulated
that sclerotial firmness could be an indicator of viability, with sclerotial softness an indicator
of parasitism. Two methods for assessing sclerotial viability by measuring the firmness of
sclerotia were developed. One method used a penetrometer, which measured the force needed
29
to compress the sclerotial medulla sections. The other method involved an assessment of
whether the sclerotial rind was indented by a probe applied at a standard force to a whole
sclerotium.
2.2 Methods
2.2.1 Sclerotia
Apparently healthy sclerotia were collected from the Wellington Botanic Gardens on 14
August 1999, rinsed over a 4 mm sieve to remove adhering soil and loose sclerotial
fragments, and air-dried. They were then sorted by mean weight into size classes of 160 (5),
490 (8) and 1100 (20) mg for small, medium and large sizes, respectively (standard error of
the means shown in parentheses). The sclerotia were stored at lO o C on moist tissue in sealed
plastic containers, and used within 9 weeks. Since sclerotia can survive in soil for several
years, this duration of storage at a low temperature was not considered to impair sclerotial
viability.
2.2.2 Stimulation of mycelial production
2.2.2.1 Surface-cleansing of sclerotia
In all sterilant washing and rinsing operations, sclerotia were vigorously agitated using a Kika
Labortechnik KS 250 basic orbital shaker (Kika-Werke, Germany) at 300 rpm at room
temperature. Ten sclerotia of medium size were used in each soak treatment. Sclerotia were
soaked in 2 mL of the disinfectant solutions and rinsed three times in total; once in 15 mL of
sterile distilled water (SDW) containing 0.4 mLiL Tween 80 (polyoxyethylene (20) sorbitan
mono-oleate) (BHD Chemicals, Poole, England), and twice in 15 mL SDW. Sclerotia were
then air-dried in open sterile Petri dishes at 25 0 C in a laminar flow cabinet for approximately
1 h before determining viability.
Preliminary tests evaluated sterilant solutions containing 4.8% NaOCl without and with
ethanol (50/50, v/v), for a single 30 min wash and two 10 min washes. However, these washes
were not effective in preventing contamination, and so a series of soak treatments with higher
concentrations of available chlorine were evaluated. These comprised 30% (w/v) chlorine as
calcium hypochlorite (CaOCl) (Scientific Supplies, Auckland, New Zealand), or 13.5%
30

chlorine as NaDCl (Hypostat 135, pH 12.5-13.5, Wilson Chemicals, Christchurch, New
Zealand). These chlorine solutions were tested alone or combined with absolute ethanol
(50/50 v/v) in single sterilant treatments for two time periods, 5 or 20 min. In addition, 3 and
30 min double sterilant treatment, using 13.5% NaOCl, with or without absolute ethanol
(50/50 and 70/30 v/v) in a number of permutations (Table 2.3.1), were also tested.
To determine any structural change to the rind surface due to surface-sterilisation, sclerotia
were examined after a stringent wash which comprised one wash with 13.5% NaOel/ethanol
(50/50, v/v) for 3 min, then 13.5% NaOCl for 3 min, each wash followed by rinsing. Sclerotia
were viewed 24 h after the sterilisation treatment using a Leica S440 scanning electron
microscope (SEM), with an Oxford cold-stage. The sclerotia were mounted on the stage with
the carbon-based lubricant 'Aquadag', frozen to -118°C, and coated with gold at 1 rnA for 6
min, before scanning.
2.2.2.2 Sclerotial dissection and culturing methods
After disinfection treatments, sclerotia were stimulated to produce mycelium by two aseptic
dissection techniques: by bisecting sclerotia, or by sampling a section of the medulla and
avoiding contaminants in the rind. For the bisected sclerotia, one half was soaked for 5 min in
a solution of 20 ppm streptomycin sulphate (SIGMA Chemical Co., St. Louis, USA), 40 ppm
aureomycin (5.5% chlortetracycline, Cyanamid Australia PTY Ltd, West Victoria) and 250
ppm ampicillin (Ampesco, Solon, Ohio, USA). The antibiotic-treated and untreated halves
were placed 40 mm apart from one another, medulla side down onto growth medium. For
sclerotia that were medulla-sectioned, the rind was completely removed by repeated bisection,
with each cut perpendicular to the previous one. The last cuts of the cube-like section were
made from a face where the sterile scalpel blade had not come into contact with the rind,
thereby avoiding smearing micro-contaminants contained in the rind across the surface. of the
medulla. The face of the medulla section that had the last cut was placed onto the growth
medium.
In an attempt to limit microbial contamination, four growth media were tested. They were (1)
PDA (Difco), (2) PDA containing 20 ppm streptomycin, 20 ppm aureomycin and 250 ppm
ampicillin, (3) number 3 Whatman filter paper moistened with 2 mL 0.1 % Murashige and
Skoog (MS) solution, and (4) S. sclerotiorum-selective medium (Bourdot, et al. 2001). Plates
containing the treated sclerotia were arranged in a randomised block design of 20 replicates,
31

and incubated at 15 or 20 ° C and 12 h diumallight. The two temperatures were investigated to
observe which most favoured colonisation of the plates by C. camelliae mycelium in the
presence of possible contamination. After 4-13 d incubation, plates were assessed with the aid
of a Zeiss binocular microscope at 15-40 x magnification for presence of contaminants and C.
camelliae mycelium growing out from the sclerotia.
2.2.3 Sclerotial firmness
2.2.3.1 Measuring firmness using a penetrometer
Two scalpel handles were taped together so that the No. 24 scalpel blades (Swann-Morton
Ltd, Sheffield, England) were 6 mm apart. This twin-bladed knife was used to cut 6 mm thick
medulla segments from each of 300 medium and 300 large healthy sclerotia that had been
surface sterilised twice in 13.5% NaOCl follow by two SDW rinses (Section 2.3.1.3). The
moisture content of the segments was standardised by storing them at 85% relative humidity,
in a desiccator bowl containing saturated sodium chloride, at room temperature for 8 d.
Sclerotial firmness was then determined using an Instron 4444 penetrometer (Instron USA)
(Plate 2.3.1). This measured the force on a 2.76 mm diameter probe travelling at 50 mmlmin,
from initial contact with the face of the sclerotium up to a compression force of 40 N.
Resistance was measured in the centre of the medulla to attenuate the effect of the rind on
resisting penetration. The compression energy in Newton millimetres (Nmm) was calculated
from the area under standard force-deformation curves.
2.2.3.2 Determining parasitism using the 1-kg probe method
This method involved forcing a probe onto the sclerotium to a set pressure, to determine
whether the integrity of the medulla, upon which the continuity of the rind cells depended,
was compromised by parasitism. Medium-sized sclerotia, were rinsed under tap water, and
stored for 12 h in a sealed container at room temperature (20-25°C) to equalise their moisture
content. The thickness of the portion of the whole sclerotium that was intended for the
placement of the probe was measured using a Mitutoyo Absolute Digimatic Calliper Series
No. 500, to determine whether sclerotial thickness influenced the assessment of sclerotial
firmness. Sclerotia were then placed onto a Mettler PE3600 balance and the balance tared. A
steel 2.8 mm diameter rod that had a rounded end and a foot print of 6.2 mm2, was pressed
vertically down by hand until the balance displayed a weight of 1 kg. This force gave an
32
indentation pressure of 1,593 kPa, equivalent to 5% of the compression strength of typical
construction concrete of 30 MPa. Sclerotia were classed as firm if the probe did not indent the
rind or soft if the rind was pierced. This procedure was repeated until 52 sclerotia of each
class had been gathered.
After the sclerotia had been tested for firmness by the I-kg probe method, they were surface
disinfected to kill contaminants in the rind, and cultured to allow for growth of C. camelliae
mycelium to indicate healthy sclerotia, or growth of other microorganisms to indicate
parasitism. This was achieved by placing sclerotia in individual 60 mL specimen bottles. Each
sclerotium was soaked in 1 mL absolute ethanol for 30 sec, with 5 mL of 13.5% NaOCI added
to give an ethanol concentration of 17% (v/v), and agitated on the orbital shaker for 3 min.
The disinfectant solution was drained, and the sclerotia rinsed twice for 15 min each in SDW.
The sclerotia were held at room temperature for 24 h to allow contaminants to germinate, and
washed again in 5 mL 13.5% NaOCI for 3 min, and rinsed two times in SDW. Sclerotia were
bisected aseptically, placed on PDA (Difco), incubated at 20D C, 12 diurnal light, and
inspected after 8 d for C. camelliae mycelium, and bacterial and fungal contamination.
2.2.4 Statistical analysis
Data were analysed using GenStat Release 4.22 (Fifth Edition) (GenStat 2000). Treatment
means were compared by Fisher's least significant difference (LSD) test at P1).05, with 95%
confidence limits given in parentheses. Data on viability of sclerotia were analysed using a
generalised linear model with binomial errors and a logit link (McCullagh and NeIder 1989).
This method was similar to analysis of variance used for normally distributed data, but it
compared treatments with F-tests using analysis of deviance, which were appropriate for data
containing numbers responding out of a total number of units. Data derived from the
penetrometer and probe tests were analysed by analysis of variance.
2.3 Results
2.3.1 Techniques for culturing from sclerotia
2.3.1.1 Surface-cleansing of sclerotia
The surface cleansing tests aimed to eliminate microbial contamination so that viable C.
camelliae mycelium could be identified growing from healthy bisected sclerotia. Results from
33

the range of surface-disinfection treatments (Table 2.3.1) showed that overall, including
ethanol in the wash reduced the number of sclerotia able to produce C. camelliae mycelium
without significantly reducing levels of contamination. The method that provided the highest
incidence of C. camelliae mycelium (80%) and the lowest incidence of microbial
contamination (20%) was the 3 min double wash in 13.5% NaOCl. The single 5 min wash in
NaOCI resulted in 95% of sclerotia classed as viable. However, the high incidence of bacterial
and fungal contamination made positive identification of C. camelliae mycelium uncertain,
which meant that determination of viable sclerotia in subsequent assays could be unreliable.
Table 2.3.1: Viability of Ciborinia camelliae sclerotia and occurrence of bacterial and fungal
contaminants for sclerotia treated with different surface cleansing treatments.
Wash and duration I C. camelliae mycelium Contaminants (%) Bacteria (%) Fungi (%)
Single - 5 min NaOCI 95 (78-99i 75 70 NaOCI/ethanol (50/50) 70 (51-84) 100 10 CaOCI 85 (67-94) 40 75
Single - 20 min NaOCI 60 (41-76) 60 20 NaOCI/ethanol (50/50) 50 (32-68) 80 20 CaOCI 70 (51-84) 60 80
Double - 3 min NaOCI & NaOCI 80 (61-91) 20 20 NaOCI/ethanol (50/50) & NaOCI 80 (61-91) 5 30 NaOCI/ethanol (70/30) & NaOCI 10 (3-29) 15 15 NaOCI/ethanol (70/30) & NaOCI/ethanol (70/30) 5 (1-23) 20 10
Double - 30 min NaOCI/ethanol (50/50) & NaOCI/ethanol (50/50) 0 13 3
I Concentrations: 13.5% NaOCI and 30% CaOCl. 2Lower and upper 95% confidence limits.
2.3.1.2 Sclerotial dissection and use of antibiotics
Sclerotia whose rinds had been removed gave slightly higher incidence (P<O.OI) of the C.
camelliae mycelium in surviving segments than bisected sclerotia, and there was a lower
incidence of bacterial contamination; 34 (27-42)% cf 51 (43-58)% (P<O.OI). However,
because the method was extremely time-consuming and carried a high risk of extracting dead
portions of sclerotial medulla, it was not considered a feasible option for assessment of
sclerotial viability. Bisection of sclerotia was used in subsequent tests. There were no
differences (P>0.05) in the incidence of mycelia from C. camelliae sclerotia incubated at
15 0 and 20 0 C, and so the higher incubation temperature was used in further tests.
34

Antibiotic dips were found to have no effect (P>0.05) on the incidence of C. camelliae
mycelia. However, because the mean incidence of bacterial contamination was reduced from
96 (92-98)% to 89 (84-92)% (P=0.02) by this treatment, the process of dipping sectioned
sclerotia into a solution containing antibiotics was continued.
The addition of antibiotics to the growth medium also had a slight effect on reducing bacterial
contamination. The incidence of C. camelliae mycelia remained the same and the incidence of
bacterial contamination was reduced slightly by PDA amended with antibiotics (Table 2.3.2).
Recovery of C. camelliae colonies on sterile MS filter paper and on S. sclerotiorum-selective
medium was reduced (P<0.05), so their use was discontinued.
Table 2.3.2: Effect of antibiotics and medium type on the incidence of C. camelliae mycelia and
microbial contamination from sclerotia (A) double washed for 1 min in 13.5% NaOCI/ethanol, or
(8) two 3 min washes in 13.5% NaOCI.
Medium C. camelliae (%) Bacteria (%) Fungi (%) Experiment (A) PDA 60 (37-80)1 95 (83-99) 25 (11-47) PDA + antibiotics 65 (41-83) 80 (66-89) 50 (30-70) MS filter paper 20 (7-45) 95 (83-99) 5 (1-27) Experiment (B) PDA 80 (61-91) 20 (8-42) 20 (9-36) S. sclerotiorum-selective agar 30 (16-50) 15 (5-37) 15 (6-34) ILower and upper 95% confidence limits.
2.3.1.3 Validation of the selected surface-cleansing method
One thousand apparently healthy sclerotia, equally represented in small, medium and large
size classes, were washed in 13.5% NaOCI at room temperature (20-25°C) for 3 min
followed by one rinse of SDW containing 0.4 mLiL Tween 80 and two rinses in SDW, and
then the cycle was repeated. The sclerotia were immersed directly in 20 ppm streptomycin, 40
ppm aureomycin and 250 ppm ampicillin for 5 min. They were aseptically bisected wet and
placed medulla-face down onto PDA. After incubation at 20°C for 9 d, 79% of sclerotia had
produced C. camelliae mycelium from at least one segment (Plate 2.3.2), 3% had produced no
growth, and 18% had been contaminated mainly by fungi that resembled Trichoderma species
and C. rosea. These contaminated sclerotia were re-washed in 15 mL 13.5% NaOCl followed
by two rinses in SDW and after incubation for 8 d at 20°C 12 h diumallight, an additional
2.5% of sclerotia were found to have produced C. camelliae mycelium. Because the increase
35
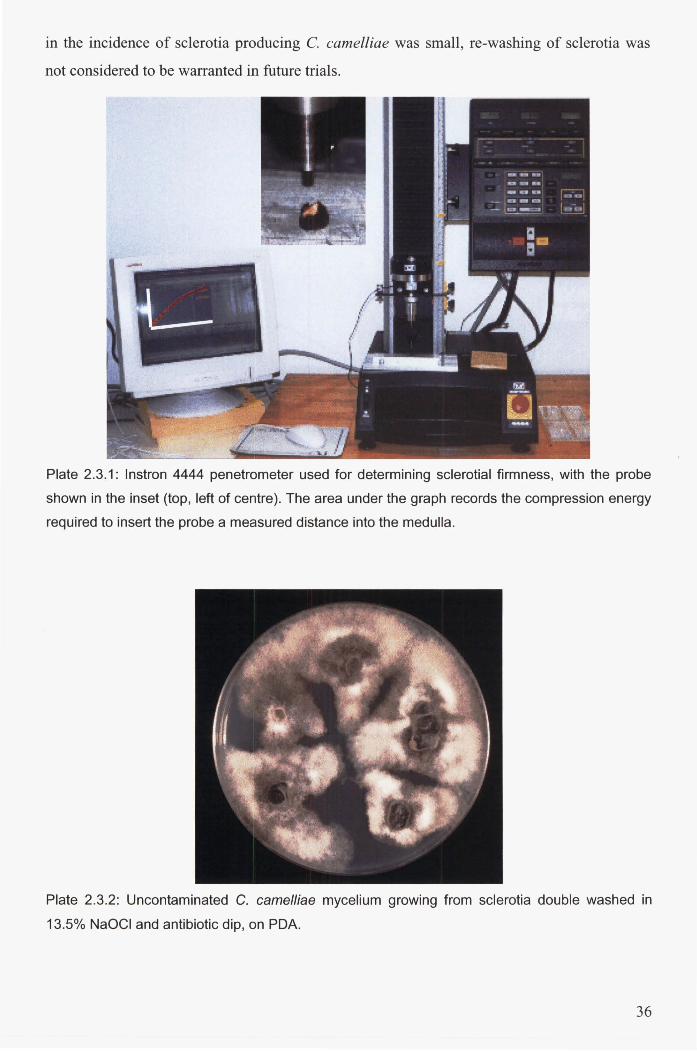
in the incidence of sclerotia producing C. camelliae was small, re-washing of sclerotia was
not considered to be warranted in future trials.
Plate 2.3.1: Instron 4444 penetrometer used for determining sclerotia I firmness, with the probe
shown in the inset (top, left of centre). The area under the graph records the compression energy
required to insert the probe a measured distance into the medulla.
Plate 2.3.2: Uncontaminated C. camelliae mycelium growing from sclerotia double washed in
13.5% NaOel and antibiotic dip, on PDA.
36

Plate 2.3.3: Scanning electron micrographs of C. camelliae sclerotia, showing the wax cuticle on
natural surfaces (left column) apparently reduced by surface-cleansing in two 3 min washes of
13.5% NaOCI/ethanol and 13.5% NaOCI (right column).
37

Plate 2.3.4: Parasitism of soft sclerotia, with mycelium resembling (A) Gliocladium spp., (8)
Clonostachys rosea, (C) a representative of 'other fungi', and (D) Trichoderma spp ..
2.3.1.4 Effect of surface cleansing treatment on rind integrity
The surface of unwashed rind from naturally occurring sclerotia was compared under SEM to
that of the surface-sterilised sclerotia to determine whether the rind was physically damaged
(Plate 2.3 .3).
Two 3 min washes of 13.5% NaOCl/ethanol and 13.5% NaOCI, with a rinse in 0.4 mLlL
Tween 80 and two further rinses in SDW after each wash, appeared to reduce the wax cuticle
of the rind. This surface-sterilisation treatment could therefore have made the sclerotia more
susceptible to microbial antagonism.
38

2.3.2 Sclerotia firmness
2.3.2.1 Measuring firmness using the penetrometer
Measurements of sclerotial firmness showed that segments of medium-size sclerotia were
harder to penetrate (P<0.05) than segments oflarge-size sclerotia. The energy expended when
the probe exerted a force of 40 N was 17.3 Nmm (15.9-18.6) for medium sclerotia and 14.7
Nmm (13.3-16.0) for large sclerotia (95% confidence limits on parentheses). These narrow
confidence limits confirmed that measurements of firmness were uniform. If energy
requirements from a candidate population of prepared sclerotial sections were below the 95%
confidence limits at 40 N force for medium or large sclerotia, then the sclerotia were
considered softer than normal.
2.3.2.2 Determining parasitism using the 1-kg probe method
Measurement of sclerotial firmness using the penetrometer on moisture-conditioned sclerotial
segments was extremely time consuming, taking about 2 min for each sclerotium. In contrast,
placing a sclerotium on a balance, and pressing a standard probe onto the sclerotium until 1
kg was registered, proved to be a quicker and more convenient method for recording firmness.
The entire operation took 5-10 sec for each sclerotium.
The firmness test using the I-kg probe provided a very good indication of viability. Forty
nine of the 52 sclerotia (94%) classed as firm grew C. camelliae mycelium, after surface
cleansing and bisection onto PDA (Table 2.3.3). The thickness of the sclerotial section was
similar for the sclerotia classed firm or soft, and therefore did not influence the assessment of
sclerotial firmness. Sclerotial thickness averaged 5.3 mm (standard error of the mean (SEM) =
1.16). The incidence of contaminants growing from the firm sclerotia was very low, and was
considered to be a reflection of the surface-sterilisation method rather than growth from
parasitised medulla. None of the soft sclerotia produced C. camelliae colonies, with the
majority growing colonies of other fungi, mainly fungi resembling Trichoderma spp. and C.
rosea (Plate 2.3.4). The thickness of the section of sclerotia subjected to the probe was similar
(P>0.05) for both firm and soft sclerotia; averaging 5.3 mm (SEM = 0.11).
39

Table 2.3.3: Relationship between firmness of sclerotia, based on their indentation when
subjected to the 1-kg probe method, and percentage of sclerotia growing C. camelliae mycelia
and micro-contaminants.
C. camelliae Contamination Sclerotial firmness class
Sclerotial thickness (mm) (%) Other fungi (%) Bacteria (%)
Firm Soft
5.2 5.4
LSD(O.05) 0.5
94 (90-97/ o (-i
4 (3-13) 2 (1-5) 96 (86-96) 4 (2-8)
lLower and upper 95% confidence limits in parentheses. 2Confidence limits not calculated.
2.4 Discussion
2.4.1 Comparison of sclerotial viability techniques
Sclerotia have generally been considered viable if characteristic mycelium grew from
sclerotia (vegetative germination), which had been surface-sterilised in NaDCl for 3 min to
eliminate microbial contamination, laterally bisected and placed medulla face down on a
suitable medium containing antibiotics. McQuilken et al. (1997), Whipps et al. (1989) and
Jones and Stewart (2000) used this technique for determining the viability of S. sclerotiorum,
which were assessed as parasitised by other fungi if mycelium characteristic of known
mycoparasites grew from the sclerotial sections. This study showed that by using a more
stringent surface-sterilisation method, by washing the sclerotia of C. camelliae twice in 13.5%
NaDCl for 3 min followed by treatment with antibiotics and culturing on PDA (Section
2.3.1.3), viability of almost 80% of sclerotia could also be determined using this approach.
Unfortunately, with C. camelliae sclerotia, microbial contaminants associated with petal
tissue incorporated within the medulla (Kohn and Nagasawa 1984) could not be fully
eliminated by the commonly used surface-sterilisation techniques, and as a consequence,
contaminant growth suppressed or masked C. camelliae mycelial growth from apparently
healthy sclerotia. Further, mycelial growth by C. camelliae was slower than from the other
sclerotial pathogens such as Sclerotinia and Botrytis spp., which meant that contaminants or
treatment organisms suppressed or masked growth of C. camelliae mycelium, and confused
assessment of sclerotial viability.
40

Other researchers have used alternative methods of surface sterilisation of sclerotia, each
method modified to overcome difficulties in determining sclerotial viability specific to the
sclerotial pathogen. Grendene and Marciano (1999) observed mycelium from bisected
sclerotia of S. sclerotiorum growing on carrots previously sterilised in H20 2 for 30 min, to
identify viable sclerotia. Less concentrated disinfectants have been used in other situations.
Sclerotia of Sclerotium cepivorum that had been incubated with test fungal antagonists, were
washed in 1 % NaOCI for 4 min, and classed as viable if they grew on PDA (Stewart and
Harrison 1988). For sclerotia of S. minor and S. sclerotiorum, Hawthorne and Jarvis (1973)
determined the efficacy of fungicides by washing sclerotia in 1% NaOCI and noting
vegetative germination of sclerotia plated on cornmeal agar. Trutmann and Keane (1990)
surface-sterilised sclerotia of S. sclerotiorum in 5% NaOCI and 95% ethanol for 1 min. These
treated sclerotia were plated out on PDA containing chloramphenicol, and assessed for
myceliogenic germination and growth of the mycoparasite Trichoderma koningii. Sclerotia of
Rhizoctonia solani surface-sterilised in 13.5% NaOCI for 30 sec were plated onto a selective
medium for R. solani to determine viability (Manian and Manibhushanroa 1990). The large
range of surface-sterilisation methods used in determining sclerotial viability illustrates that
consistency in methodology may not be possible.
The method used by Vasantha Devi et al. (1989), which avoided the problem of
contamination on growth media, considered R. solani sclerotia to be viable when they caused
sheath-blight after incubation on the adaxial surface of rice leaves. This method cannot be
used for C. camelliae sclerotia, by using sclerotial sections to cause necrotic lesions when
placed on camellia petals, because flower infection occurs only by the ascospores. The
incorporation of petal tissue and contaminants also precludes use of staining methods. The
two-colour fluorescent viability stain Calcofluor White M2R used by Dijksterhuis et al.
(1999) for determining activity of a bacterial antagonist against a Fusarium sp., can be of
little use in determining parasitism in C. camelliae sclerotia. Although the stains could be
applied to thin sections of C. camelliae sclerotia, and the medulla examined microscopically
to distinguish live tissue (fluorescing red) from dead cells or cell walls (fluorescing blue),
distinguishing live tissue of C. camelliae from that of genuine antagonists and commensal
microorganisms would be difficult.
To overcome the problems associated with microbial contaminants being embedded in the
sclerotial rind and medulla, techniques were needed that could actively remove surface
contamination without reducing sclerotial viability. In this current study, a balance between
41

removal of contaminants without harming the sclerotia was found. The sclerotia of C.
camelliae survived the severe oxidising action from two washes of saturated NaGel that
would have destroyed sclerotia from other pathogens, due to their large size and protection
afforded by the melanised rind.
A second technique used the firmness of the sclerotia as an indicator of parasitism. Parasites
have been reported to soften sclerotia they have panisitised. Tu et al. (1984) found that
hyphae of Coniothyrium minitans grew inter- and intra-cellularly within the sclerotia of S.
sc/erotiorum, eventually proliferating extensively within the sclerotia and forming pycnidia
near the sclerotial surface. At this stage, the sclerotia became flattened, soft and disintegrated,
caused by enzymatic degradation of their cell walls. These symptoms were similar to those
observed for sclerotia of C. camelliae that had been parasitised by many fungal species, in
this study.
This is the first report on using sclerotial firmness as an indicator of parasitism. The I-kg
probe technique can be used to detect firmness in sclerotia treated with biocontrol agents, as
an indirect way of estimating their parasitic activity. The technique offers a quick and reliable
way of assessing parasitism of sclerotia. Further, the efficacy of micro-antagonists in assays
can be assessed quickly, as the sclerotia do not necessarily have to be removed from the
dishes for testing. In a refinement of the technique, the dish containing the sclerotia and test
organisms could simply be placed onto a balance, which is then tared, and the probe then
pushed onto a sclerotium until I kg is registered.
Determining firmness of sclerotia by the I-kg probe method was preferred over measuring
resistance of a penetrometer to penetration into medulla sections. The I-kg probe method had
the advantages of convenience of application, and the results were not influenced as much by
the rind as was the case with the Instron measurements. Since the rind of the medium sized
sclerotium was closer to the centre of the section where measurements were made, than that
of the larger-sized sclerotium, the rinds had a greater influence on resisting penetration in
smaller sclerotia than larger ones. By determining the firmness of sclerotia on portions of the
sclerotium that averaged 5.3 mm thick, as in the I-kg probe test, the biased influence of the
rind on small sclerotia was overcome.
42
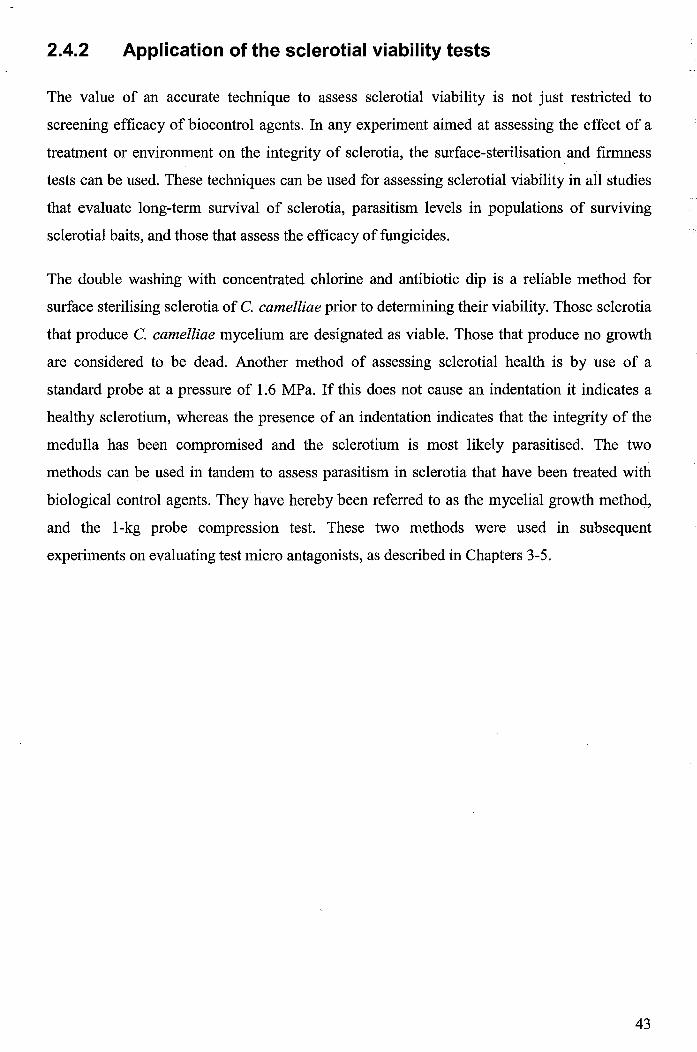
2.4.2 Application of the sclerotial viability tests
The value of an accurate technique to assess sclerotial viability is not just restricted to
screening efficacy of biocontrol agents. In any experiment aimed at assessing the effect of a
treatment or environment on the integrity of sclerotia, the surface-sterilisation and firmness
tests can be used. These techniques can be used for assessing sclerotial viability in all studies
that evaluate long-term survival of sclerotia, parasitism levels in populations of surviving
sclerotial baits, and those that assess the efficacy of fungicides.
The double washing with concentrated chlorine and antibiotic dip is a reliable method for
surface sterilising sclerotia of C. camelliae prior to determining their viability. Those sclerotia
that produce C. camelliae mycelium are designated as viable. Those that produce no growth
are considered to be dead. Another method of assessing sclerotial health is by use of a
standard probe at a pressure of 1.6 MPa. If this does not cause an indentation it indicates a
healthy sclerotium, whereas the presence of an indentation indicates that the integrity of the
medulla has been compromised and the sclerotium is most likely parasitised. The two
methods can be used in tandem to assess parasitism in sclerotia that have been treated with
biological control agents. They have hereby been referred to as the mycelial growth method,
and the I-kg probe compression test. These two methods were used in subsequent
experiments on evaluating test micro antagonists, as described in Chapters 3-5.
43

Chapter 3
3 Control of sclerotia by microbial antagonists
Mycoparasitism of plant pathogens by mycoparasites such as Trichoderma and Gliocladium
species comprises four phases leading to infection (Chet 1990). The first phase involves
chemotrophic growth by the antagonist, in which a chemical stimulus from the target fungus
attracts the antagonist to it. In the second phase, the antagonist specifically recognises the
target fungus as a host, with recognition probably mediated by lectins on the cell surfaces of
both the target fungus and the antagonist. Then, hyphae from the antagonist attach to the host
and may also coil around it. Finally, the antagonist secretes lytic enzymes that degrade the
host cell wall. If any of these phases do not occur in the antagonist-host relationship,
mycoparasitism will not occur. To be a successful biocontrol agent of sclerotial pathogens, a
hyperparasite needs to be most effective against survival structures (Baker and Cook, 1974).
Therefore, for effective parasitism of sclerotia of C. camelliae, potential biocontrol agents will
need to exhibit chemotrophic growth towards the sclerotium, recognise it to be a host, attach
itself to the sclerotium, and destroy the contents of the sclerotial medulla. Enzymes produced
by the antagonist are essential in the parasitic process.
Hydrolytic enzymes produced by Trichoderma harzianum were shown to be effective against
sclerotial fungi. Enzymes secreted by T. harzianum hyphae caused holes in the surface of
Sclerotium rolfsii sclerotia, and were crucial to it breaching the cell walls at sites of attempted
penetration (Elad et al. 1984). Benhamou and Chet (1996) reported that hyphae of this
mycoparasite grew abundantly on the surface of S. rolfsii sclerotia and formed dense branched
mycelia, which developed in the sclerotial cells causing extensive alterations of the host cells.
Cell damage included retraction and aggregation of the cytoplasm and vacuolar breakdown.
The synergistic action of chitinases and B-l,3-g1ucanases was found to be essential for
successful sclerotial colonisation. Strains of T. harzianum that did not secrete as much of
these enzymes as the parasitic strains, were incapable of parasitising the sclerotia. Antibiotics
produced by the parasite were also implicated in mycoparasitism. The medullary cells
exhibited cytoplasmic disorganisation even though the hyphae had not penetrate the damaged
medullary cells, indicating that lytic enzymes were not the only components involved in
sclerotial mycoparasitism.
44
Sclerotia of C. camelliae have effective defence mechanisms against mycoparasites to enable
them to survive many years in soil. The rind affords the sclerotium most of its protection.
Melanin contained in the rind is impervious to all mycoparasites that do not have the capacity
to secrete melaninase, the enzyme that degrades melanin. The sclerotia are large, and
therefore it is possible that non-parasitised portions of a sclerotium may be able to produce
some apothecia, thereby allowing the fungus to continue its lifecycle. Micro-contaminants in
the rind may provide an inadvertent benefit for sclerotial survival by masking the existence of
the sclerotium, so that mycoparasites cannot recognise it to be a host.
In this chapter, known sclerotial mycoparasites were evaluated for their ability to parasitise
sclerotia of C. camelliae. Microorganisms isolated from sclerotia that had been seeded in soil
as baits were also tested for their potential to parasitise sclerotia.
3.1 Evaluation of known mycoparasites
3.1.1 Introduction
There are four genera or species of mycoparasites that are commonly used for control of
sclerotia in soil, and which warrant investigation as to their efficacy in controlling sclerotia of
C. camelliae.
3.1.1.1 Mycoparasite genera
Coniothyrium minitans is a specific sclerotial mycoparasite, and has frequently been found
within sclerotia of Sclerotinia spp. (Whipps et al. 1993a). It is a destructive parasite of S.
sclerotiorum, killing the hyphae and sclerotia (Huang and Hoes 1976) by releasing chitinase
and p,I-3 glucanase (Whipps 1991). After hyphal tips have penetrated cell walls of the host,
without the formation of specialised structures, the host cytoplasm disintegrates and cell walls
collapse as a result of enzyme activity. C. minitans is active at 5-25 0 C, but is most pathogenic
at 20°C (Lynch and Ebben 1986). It therefore favours the temperate soil conditions in which
sclerotia from C. camelliae are frequently found. C. minitans has been found to occur
naturally on the phyllosphere and in numerous crops including sunflowers throughout
Manitoba, USA (Huang 1981), and petals of winter oilseed rape in West Sussex (Whipps et
al. 1993b). When used as a biocontrol agent in Alberta from 1984-1987 by application to the
soil at seeding time, C. minitans reduced apothecial production by S. sclerotiorum in bean,
45
canola, wheat and barley crops (McLaren and Huang, 1996). It has also been reported to
reduce incidence of sclerotinia wilt, caused by S. sclerotiorum, and subsequent loss in seed
yield of sunflower (McLaren et al. 1994). C. minitans spores can also be applied to vegetation
to prevent gennination of S. sclerotiorum ascospores. When used as a foliar spray on beans,
C. minitans reduced the number of S. sclerotiorum sclerotia by 55% compared to the
untreated control plants, and also reduced numbers of apothecia produced, compared to both
the untreated control and the Benlate (benomyl) treated plots (Trutmann et al. 1982). C.
minitans has been found on many crops throughout New Zealand (Jones and Stewart 2000),
and may be present in soils where camellia bushes are grown. C. minitans does not appear to
be a plant pathogen (Turner and Tribe 1975, 1976; Huang 1977), and appears safe for use on
camellia bushes.
Clonostachys rosea, fonnally named Gliocladium roseum, has been reported to provide
effective control of S. sclerotiorum sclerotia. In vitro, isolates of G. roseum were effective in
inhibiting mycelial growth of S. sclerotiorum in dual cultures, and its culture filtrates also
inhibited sclerotial gennination (Shanna et al. 1992). The addition of G. roseum inoculum to
infested soil reduced apothecial development in S. sclerotiorum sclerotia at concentrations as
low as 1.8 x 10⁴ conidia/cm3 soil in Gennany (Luth et al. 1992). The antagonist was also
shown to grow through celery, lettuce and tomato plant tissue from the cut surfaces where it
was inoculated, to inhibit fonnation of sclerotia (Whipps 1987a).
Trichoderma spp. have been shown by many researchers to be effective antagonists of S.
sclerotiorum. In Spain, isolates of T. koningii, T. harzianum and T. pseudokoningii killed 62-
100% of sclerotia of S. sclerotiorum within 25 d in vitro. One isolate of T. koningii killed all
sclerotia within 7 d, under field conditions, when added to infested soil at 1 x 10⁶_108
conidia/g (dos Santo and Dhingra, 1982). A T. viride isolate from India effectively colonised
sclerotia, and reduced its survival and gennination (Kakoti and Saikia 1998). Gennan isolates
of T. hamatum damaged sclerotia, and isolates of T. koningii reduced their apothecial
development (Luth et al. 1992). Isolates of T. harzianum from England grew from cut
surfaces through plant tissues of a number of vegetable species in which they inhibited the
production of sclerotia (Whipps 1987a). In Argentina, the application of T. harzianum in
alginate capsules increased the survival of soybean plants diseased by S. sclerotinia by 40%,
and reduced the number of genninated sclerotia by 63%. In agar plate tests, the chitinase and
1,3-beta-glucanase activities of T. harzianum increased when S. sclerotiorum cell walls were
46

included in the media as the sole carbon source, in comparison to control plates (Menendez
and Godeas 1998).
Sporidesmium sclerotivorum, formerly named Teratosperma sclerotivora, has been shown to
be an effective mycoparasite of sclerotial pathogens in the United States, readily colonising
sclerotia of Sclerotinia spp. in soil and in vitro (Mischke 1998). The mycoparasite caused a
reduction in numbers of Sclerotinia sclerotiorum sclerotia when applied at 20 spores/cm2 soil
in a soybean crop (del Rio et al. 1999), and at 100 spores/g soil in a number of field soils
(Adams and Ayers 1981). In both reports, the researchers concluded that S. sclerotivorum had
potential to become a successful biocontrol agent of Sclero tin ia sclerotiorum. In New Zealand
soils, S. sclerotivorum has not been found, so its use as a biocontrol agent in New Zealand
would require rigorous quarantine procedures for conducting trials and testing of its effect on
plants and beneficial fungi prior to field use.
3.1.1.2 Sclerotial antagonists in New Zealand
In New Zealand, Trichoderma spp., Clonostachys rosea and Coniothyrium minitans have
shown promise as effective biocontrol agents of Sclerotinia sclerotiorum sclerotia. When
formulated with wheat bran or maize perlite substrates, these mycoparasites provided 90-
100% in vitro control of S. sclerotiorum sclerotia (Jones and Stewart 2000). A number of
mycoparasites sourced from soils within Canterbury were evaluated in a cabbage petiole
bioassay (Rabeendran et al. 1998). Those providing the most inhibition of S. sclerotiorum
infection were Trichoderma virens isolates Bl9 and GV4, Trichoderma longipile isolates
SIBYG, 8Sr4-2, 6Sr4 and 3Sr4-2, Trichoderma tomentosum isolate 5Sr2-2, and Clonostachys
rosea [Gliocladium roseum] isolate 9Sr4. In a field trial, T. virens GV4, T. longipile 8Sr4-2,
and Coniothyrium minitans isolate A69 reduced the incidence of infection of Sclerotinia
minor on lettuce from high to low levels (Rabeendran et al. 1999). C. minitans A69 also
provided effective control of S. sclerotiorum in a cauliflower crop in early summer, giving a
41 % reduction in disease compared to the control.
The nine isolates that were most effective against sclerotia of S. sclerotiorum were made
available for testing with Ciborinia camelliae sclerotia. These were T. virens B 19 and GV 4,
T. longipile SIBYG, 8Sr4-2, 6Sr4 and 3Sr4-2, T. tomentosum 5Sr2-2, G. roseum 9Sr4 and C.
minitans A69. These fungi and others were assessed for their ability to parasitise C. camelliae
sclerotia in vitro and in field trials. The ability of Sporidesmium sclerotivorum to invade the
sclerotia of C. camelliae was not tested in New Zealand, as the Environmental Risk
47
Management Authority and quarantine regulations prevented affordable and convenient
introduction of this known mycoparasite into New Zealand for experimental purposes.
3.1.2 Methods
3.1.2.1 Mycoparasite source and identification
The isolates used in the experiments were collected from soils or sclerotia in New Zealand
(Table 3.1.1).
Table 3.1.1: Sources of known mycoparasites used in trials.
Isolate
B19 GV4 SIBYG 8Sr4-2 6Sr4 3Sr4-2 5Sr2-2 9Sr4
A69 WTI-2
3.1.2.2
Species Source of isolate LU Culture collection No.
Trichoderma virens Canterbury soils, 1995 LU556 Trichoderma virens Canterbury soils, 1995 LU555 Trichoderma hamatum Marshlands, 1997 LU595 Trichoderma hamatum Dora, Ashburton, 1997 LU594 Trichoderma hamatum Field site Lincoln, 1997 LU593 Trichoderma hamatum Preston Road, Christchurch, 1997 LU592 Trichoderma spp. Russley, Christchurch 1997 LU596 Clonostachys rosea Organic site, Lincoln, 1997 LUl55 [Gliocladium roseumJ Coniothyrium minitans Pukekohe, ex Sclerotium cepivorum, 1994 LU112 Coniothyrium minitans Lincoln,ex Sclerotinia sclerotiorum, 2000
Trials 1 and 2: Initial evaluation of known mycoparasites on sclerotia
in sand and soil assays
3.1.2.2.1 Mycoparasites
Isolates of T. virens B19 and GV4, T. hamatum SIBYG, 8Sr4-2, 6Sr4 and 3Sr4-2, T.
tomentosum 5Sr2-2, C. rosea 9Sr4, and C. minitans A69 (Rabeendran et al., 1998) were sub
cultured from cultures stored at 4°C onto potato dextrose agar (PDA) (remel) plates and
incubated at 20°C for 3 weeks. For each isolate, conidia or pycnidiospores were removed
from the plates by suspending them in 10 mL of sterile water containing 0.4 mLiL Tween 80,
with the aid of a sterile rod hockey stick. The extracts were filtered through muslin cloth and
spore densities within the filtrates estimated by counting them with a haemocytometer. The
filtrates were diluted with distilled water to obtain a spore suspension containing 1 x 10⁶
48
spores/mL. The spore suspensions were stored at 4 0 C for up to 20 h until inoculation of
sclerotia.
3.1.2.2.2 Sclerotia
Sclerotia of C. camelliae were collected from the Wellington Botanical Gardens on 14 August
1999. They were rinsed in tap water over a 4 mm sieve, air-dried, and sorted into three size
categories, each containing 396 sclerotia. Small sclerotia weighed 0.1-0.69 g, averaging 0.16
g (SEM = 0.005). Medium sclerotia weighed 0.03-0.99, averaging 0.49 g (SEM = 0.008).
Large sclerotia weighed 0.51-2.76, averaging 1.10 g (SEM = 0.020). These sclerotia were
stored in sealed plastic containers at 10 0 C for up to 2 d until treatment application.
3.1.2.2.3 Trial 1 - sand assay with surface-cleansed sclerotia
In this trial, sclerotia were surface-sterilised to remove contaminants that might interfere with
parasitism by the test fungi. A low concentration of NaOCI was used to cause mortality of
contaminants, but without the damaging effects on the rind observed under SEM after use of
higher concentrations of the disinfectant (Section 2.3.1.1). On 10 September 1999, the
sclerotia were surface-sterilised in 4.8% NaOCI (Wilson Chemicals Ltd) and absolute ethanol
(50/50 v/v) with vigorous shaking for 10 min on a wrist-action Chiltern flask shaker, rinsed
four times in SDW, and air-dried for 24 h in a laminar flow cabinet. Silica sand was sterilised
at 160 0 C for 16 h, and 40 mL aliquots placed aseptically into deep Petri dishes (88 mrn
diameter by 20 mrn deep). Field capacity of the dried sand was 5.6 mU100 g, determined by
recording the average duplicate volume of water in 100 g of saturated sand after 4 h at a
suction of 0.1 bar (Cameron and Buchan, 2002). Moisture content of the sand was adjusted to
90% saturation with SDW.
Sclerotia were inoculated by gentle agitation in the spore suspensions, or for the untreated
control, in the Tween 80-SDW solution, for 15-30 min using a Kika Labortechnik KS 250
basic orbital shaker at 200 rpm. Each Petri dish contained four sclerotia, one each of the small
and large categories and two of the medium category. These sclerotia were transferred
aseptically from the suspensions onto the sand of each Petri dish, and arranged equidistantly
from one another. The plates were sealed with oxygen-permeable cling film, and incubated in
separate Contherm Digital incubators at 10, 15 or 20°C, with 12 h diurnal light. The
treatments were replicated six times, and each laid out in a randomised block design. Sclerotia
49

were recovered from the dishes on 18-21 January 2000, after 19 weeks incubation, and their
viability assessed by the method of mycelial growth on agar described in Section 2.2.2.
3.1.2.2.4 Trial 2 - soil assay
In this trial, small, medium and large-sized sclerotia were only rinsed in tap water to remove
adhering soil. The seedling propagation trays used in the assay contained 27 cells, 40 mm
deep and 30 mm in diameter. Cells were each filled with 30 mL of a general potting mix
comprising 1 kg of 4 month release Osmocote Plus (15% N, 3.5% P, 9.1% K, 1.2% Mg,
0.02% B, 0.05% Cu, 0.4% Fe, 0.06% Mn, 0.06% Mo and 0.015% Zn), and 1 kg dolomite lime
in 400 L bark and 100 L sand. On 1 September 1999, the sclerotia were inserted, one per cell,
into the surface of the potting mix so that a third of each sclerotium was exposed. They were
arranged so that nine sclerotia belonging to each size class were aligned in rows, which were
randomly allocated within each tray. Initially, enough tap water was added to each cell to
saturate the potting mix. Then 3 mL of the antagonist spore suspensions (3 x 10⁶ spores) were
micro-pipetted onto each of the 27 sclerotia per tray, with the untreated control receiving 3
mL of Tween 80-SDW. The treatments were replicated four times for each of the test fungi.
The treated trays were transferred to a glasshouse, and arranged in randomised blocks on
capillary matting, which covered the concrete floor of the glasshouse. The trays were covered
with a single layer of Sarlon shade cloth that restricted the light by 50%, to provide a
microenvironment similar to that under camellia bushes. The shade cloth may also have
limited the transfer of spores between trays. The trays were watered daily with a mist nozzle.
Eight weeks after the trays were transferred to the glasshouse, potting mix was added to each
cell to cover any exposed sclerotia with a layer of approximately 1 cm of soil. Two mini data
loggers (Tinytag -40175(125)OC), positioned beside two trays selected at random, recorded
the average temperatures as 15.1°C (SEM = 2.98), with a minimum of 8°C and a maximum of
35°C. Sclerotia were recovered from the plots on 8 December 1999, after 14 weeks
incubation, and their viability assessed by the method of mycelial growth on agar.
3.1.2.2.5 Determination of sclerotia viability and parasitism
The parasitic effect of the antagonists was determined by measuring sclerotial viability and
decay. Sclerotia were rinsed over a 4 mm sieve to remove adhering sand or soil. Sclerotia that
had disintegrated and so passed through the mesh were recorded as not viable. Intact sclerotia
50

were surface sterilised, and viability assessed by attempting to grow C. camelliae mycelium
from the sclerotia, and by measuring sclerotial firmness.
To eliminate microbial contamination, so that viable C. camelliae mycelium could be
identified growing from healthy sclerotia, the sclerotia were surface sterilised using a double
wash in 13.5% NaOCI for 3 min, and antibiotic dip as described in Section 2.3.1.3, except that
the sclerotia were rinsed two times in SDW after each wash in the disinfectant. The plates
were incubated at 20°C with a 12 h diurnal light. After 8 d the mycelium growing from
sclerotia was examined for C. camelliae characteristics. The other fungi growing from or on
sclerotia were identified iftypical of my co parasitic genera used in the assays.
Sclerotial firmness was determined using an Instron 4444 penetrometer (Instron USA) on 6
mm thick medulla segments aseptically cut from medium and large sclerotia, following the
procedure described in Chapter 2. The energy levels recorded when a standard probe exerted a
40 N force for medium and large sclerotia from the untreated controls, were compared to
levels recorded from sclerotia treated with the micro-antagonists.
3.1.2.3 Trials 3 and 4: Amended methods to evaluate mycoparasites on
sclerotia in sand and soil assays
Both sand and soil assays were repeated (Trials 3 and 4), but with some modifications in an
attempt to enhance the efficacy of the mycoparasites and to represent conditions in the field
more closely. Instead of the two T. hamatum isolates 8Sr4-2 and 6Sr4, another strain of C.
minitans, WTI-2 and two fungi isolated from decaying sclerotia; C. rosea CcS7 and
Paecilomyces cavneus CcS5 were used. The sclerotia used in the sand assay were cleaned in
tap water rather than being washed in NaOCl. In the soil assay, sclerotia were buried at least
10 mm under the soil surface to keep them constantly moist, and the dose of the spore
inoculum was increased 10 times.
3.1.2.3.1 Mycoparasites
The isolates of T. virens B19 and GV4, T. hamatum SIBYG and 3Sr4-2, T. tomentosum 5Sr2-
2, C. rosea 9Sr4 and CcS7, C. minitans A69 and WTI-2, and Paecilomyces cavneus CcS5,
were grown on PDA at 20°C for 4 weeks. Spores of these test fungi were removed from the
plates in 10 mL of SDW/Tween 80, filtered through muslin cloth, and the filtrate adjusted to 1
x 107 spores/mL, except for isolate P. cavneus CcS5, which had only 4.3 x 10⁶ spores/mL in ".
51

the original suspension. The spore suspensions were stored at 4 ° C until inoculation of
sclerotia within 24 h.
3.1.2.3.2 Sclerotia
The sclerotia of C. camelliae were collected from the Wellington Botanical Gardens on 18
December 1999. They were rinsed in tap water over a 4 mm sieve, air-dried, and sorted into
small, medium and large size categories. These sclerotia were stored in sealed plastic
containers at 10° C until treatment application. A sub sample of 110 sclerotia for each size
category was randomly selected for weighing. Small sclerotia weighed 0.06-0.48 g, averaging
0.25 g (SEM = 0.009). Medium sclerotia weighed 0.28-1.04, averaging 0.53 g (SEM = 0.012).
Large sclerotia weighed 0.48-2.58, averaging 1.11 g (SEM = 0.034).
3.1.2.3.3 Trial 3 - sand bioassay
The experiment was set up on 15 March 2000. Five sclerotia from each size category were
rinsed under tap water and air-dried. The sclerotia were inoculated by gentle agitation as
before for 1 h in the respective spore suspensions, or for the untreated control, in SDW-Tween
80 solution. The inoculated sclerotia were placed onto 40 mL of sterile silica sand contained
in deep Petri dishes. Moisture content of the sand was adjusted to saturation with 10 mL
SDW. The dishes were sealed with cling film and incubated in a Contherm Precision
Environmental Chamber Version 3.3 at 16°C and 12 h diumallight delivered by 18 Philips
TLD 36W/865 fluorescent tubes. Treatments were replicated four times in a randomised block
design. The sclerotia were recovered on 21 June 2000, after 14 weeks incubation for blocks 1-
2, and 35 weeks incubation for blocks 3-4. Sclerotial viability was assessed by the method of
surface-sterilisation and mycelial growth on PDA described in Section 2.3.1.3.
3.1.2.3.4 Trial 4 - soil bioassay
The general potting mix comprised 500 g 12-14 month release Osmocote Plus, 250 g
dolomite lime in 200 L bark, and 50 L sand. The soil was passed through a 4 mm sieve to
remove bark larger than the smallest sclerotia, to aid recovery of sclerotia at the end of the
trial, and 30 mL added to each propagation cell. The 27 cells per seedling propagation tray
(30 mm diameter by 40 mm deep), each had the 5 mm diameter drainage hole covered by a 2
mm-thick wad of cotton wool to prevent the soil from running out and to retain soil moisture.
The rinsed sclerotia were placed onto the surface of the potting mix, one per cell, and
52

arranged so that the nine sclerotia belonging to each size class were aligned in rows, which
were randomly allocated within each tray. The sclerotia were covered with a further 20 mL of
soil, and the soil in each cell then moistened with 10 mL of tap water. After 2 d, on 13 March
2000,3 mL of the spore suspension (3 x 10⁷ spores) was pipetted onto the soil surface directly
above the sclerotia contained in each cell, with soil in the untreated control receiving 3 mL of
SDW-Tween 80. The treatments were replicated four times. The treated trays were transferred
immediately to a shade house, and arranged in a randomised block design on the concrete
floor. The trays were covered with Sarlon shade cloth (50% light restriction) to limit the
transfer of spores between trays. To provide a microenvironment similar to that under
camellia bushes, 60 potted 3-year old camellia bushes were placed between the trays (Plate
3.1.1). The trays were watered once a week with a mist nozzle, to keep the soil visibly moist.
Each cell was examined weekly during 1 July to 28 November 2000 for production of
apothecia from each sclerotium. Two mini data loggers (Tinytag -40175(125)OC) positioned
beside two trays selected at random recorded the average temperature as 10.1 (SEM =
1.98tC, with a minimum of 2°C and a maximum of 25°C. The sclerotia were recovered
during 28 November - 5 December. The sclerotia were separated from the soil of each cell
over a 4 mm sieve, and rinsed in tap water. The number of firm sclerotia was recorded, as
assessed by the I-kg probe compression test described in Section 2.2.3.2.
3.1.2.4 Calibration of sclerotia volume/weight ratio
The sclerotia of C. camelliae varied greatly in shape and size. Since it was expected that the
degree of parasitism by the mycoparasites would be influenced by the size of the sclerotia, the
sclerotia used in this study were segregated by weight into size classes. To relate the weight of
each sclerotium to its volume, 330 sclerotia representing the full range in sizes were each
weighed, and their volume estimated by recording the amount of water containing 0.04%
Tween 80 that was displaced in a measuring cylinder by each sclerotium.
3.1.2.5 Trial 5: Field evaluation of three known mycoparasites
In this trial, three known mycoparasites of S. sclerotiorum were evaluated under field
conditions. T. virens B19, C. rosea 9Sr4 and C. minitans A69 were cultured on PDA (reme1)
plates incubated at 20°C 12 h diurnal light for 4 weeks. Spore suspensions were made as
described in Section 3.1.2.3.1, and stored at lOOC until spraying of plots within 24 h.
53

The field trial evaluated the abilities of the test fungi to inhibit apothecial production by C.
camelliae sclerotia, and to prevent sclerotial development in fallen flowers, in the camellia
block of the Wellington Botanic Gardens. The treatments were replicated six times in a
randomised block design. Galvanised steel open cylinders 100 mm tall by 357 mm diameter
(0.10 m2), were inserted 30 mm into the soil under camellia bushes where sclerotia were
known to be present. To ensure that sclerotia were present, a further 10 sclerotia collected
from adjacent areas were placed onto the soil surface within each plot. A further 10 sclerotia
were placed into 5 mm mesh plastic onion bags 100 mm long and 30 mm diameter. The ends
of the bags were knotted. The filled bags were each dipped into one of the spore suspensions
to ensure that the sclerotia had a uniform dose of microbial treatments, and buried
immediately outside the plot under 5-10 mm soil and camellia-leaf detritus. Five infected
camellia blooms were placed onto the soil in each plot. Immediately afterwards, 150 mL of
the spore suspensions were applied to the flowers and soil in the designated plots in two lots.
One half was sprayed onto each designated plot using a pump-trigger mist sprayer to provide
even coverage, and other half poured over the surface of the plots in case the spray action had
damaged the spores.
The spore suspensions were applied on 8 July 2000 when the trial was laid down, about 4
weeks before apothecial production began. The suspensions were reapplied on 6 August and 2
September 2000 during the period of apothecial production, which continued through to early
October, to maximise potential effects and determine whether control of apothecial
production was possible. The spore concentration and number of spores applied is listed in
Table 3.1.2.
Table 3.1.2: Dates and concentrations of the different spore suspensions applied at 1.5 Iitre/m2 to
soil in the field trial, and total number of spores applied.
Treatment 8 July 6 August 2 September Total s12ores/mL x 107 spores/mL x 107 spores/mL x 107 No. spores/m2
T. virens B 19 4.67 5.11 0.495 1.54 x 10¹¹ C. rosea 9Sr4 8.75 10.64 0.195 2.94 x 10¹¹ C. minitans A69 2.02 3.18 0.149 8.02 x 10lD
3.1.2.5.1 Measurements
The number of apothecia in each plot was counted on 6 August, 2 and 30 September and 28
October 2000, at completion of apothecial production. Counting was followed by removal of
54

the apothecia and attached sclerotia from plots on each occasion. After the last assessment, all
the sclerotia remaining in each plot were extracted from the top 50 mm of soil with the aid of
a 4 mm sieve and were counted. Twenty of the recovered sclerotia per plot and those
remaining of the 10 sclerotia in each onion bag were assessed for viability by the method of
surface-sterilisation and mycelial growth on PDA, and the I-kg probe compression test, as
described in Chapter 2. At the last field assessment, the treated flowers were also removed
and stored in plastic bags at ambient temperature in a dark room (18-25°C) to allow for
development of sclerotia. Sclerotia were recovered by rinsing off the rotted petals on 8
January 2001. They were then air-dried on tissue, weighed and counted.
3.1.2.6 Statistical analysis
Data were analysed using GenStat Release 4.22 (Fifth Edition). Treatment means were
compared by Fisher's LSD test at P:1>.05, with 95% confidence limits in brackets. For the
sand assays, the proportion of sclerotia recovered and sclerotial viability was analysed by
generalised linear model with binomial errors and a logit link. For the soil assay, sclerotial
hardness, number of sclerotia recovered and viability of sclerotia that survived were analysed
by analysis of variance, with sclerotial size categories being treated as a split plot. For the
field trial, data were analysed by analysis of variance. The relationship between weight of
each sclerotium and its volume was analysed by simple linear regression.
3.1.2.7 Scanning electron microscopy (SEM)
The behaviour of spores from representative genera of the mycoparasites was observed on the
surface of sclerotia using a scanning electron microscope. Sclerotia of C. camelliae collected
from the Wellington Botanic Gardens, and S. sclerotiorum extracted from field bean
Phaseolus vulgaris at Lincoln, were rinsed under tap water to remove adhering soil. To assess
whether spore germination was inhibited by microbial contaminants on the sclerotial surface,
a number of sclerotia were surface-sterilised with 13.5% NaOCl/ethanol (50/50, v/v) for 3
min, rinsed three times in SDW, followed by another wash in 13.5% NaOCI for 3 min and
three rinses. The rinsed and surfaced-sterilised sclerotia were air-dried in the laminar flow
cabinet, and inoculated with spore suspensions of either T. virens B19, C. rosea 9Sr4 or C.
minitans A69 at I x 106 spores per sclerotium. These spore suspensions were also applied to
PDA (Oxoid), unwashed surfaces of sterile wheat (autoclaved twice for 15 min at 121°C), and
cultured sclerotia of C. camelliae and S. sclerotiorum that had been grown on sterile wheat, to
55
ascertain what influence each substrate had on spore gennination. The spore-treated sclerotia,
agar and wheat substrates were incubated on moistened sterile filter paper in sealed Petri
dishes for 24 h at 200 e diumallight. Then, the rind surface was viewed under SEM, using a
Leica S440 with an Oxford cold-stage. Sclerotia were mounted on the stage with the carbon
based lubricant 'Aquadag', frozen to -118°e, coated with gold at 1 rnA for 6 min, and
scanned.
3.1.3 Results
The relationship between the weight of a sclerotium and its volume was given by the
equation: Sclerotia volume (cm3) = sclerotia weight (g) x 0.938 (SE = 0.0242); r2 = 0.82,
(P<O.OOl). The volume of sclerotia for the small, medium and large size classes averaged
0.19,0.48 and 1.04 cm\ respectively.
3.1.3.1 Trials 1 and 2: Initial evaluation of known mycoparasites on sclerotia
in sand and soil assays
In both assays, no sclerotia produced stipes or apothecia. Therefore, efficacy of antagonists
could only be assessed by the growth of C. camelliae mycelium on agar, to indicate sclerotia
viability, and by firmness tests to infer parasitism.
3.1.3.1.1 Trial 1 - sand assay with surface-cleansed sclerotia
Inspection of the sclerotia in the untreated controls while they were in the sand after 18.5
weeks incubation, demonstrated that many had grown sporulating fungi characteristic of
Trichoderma 38 (22-56)%, Clonostachys 10 (4-24)% and other fungi 40 (25-58)%. It was
postulated that the surface-sterilisation process using 4.8% NaOel had damaged the sclerotial
rind, allowing infection from soil fungi, and explained the high proportion of sclerotia in the
untreated controls exhibiting fungal contaminants. Despite the high levels of fungal infection,
99% of sclerotia in the untreated controls were recovered from the dishes at the end of the
trial, after rinsing them under tap water. This recovery was significantly higher (P=0.003)
than the 83 (79-86)% recovered from the treatments with test fungi. There were no significant
differences between test fungi. Thus the fungal treatments had a slight influence on the
disintegration of sclerotia. The incubation temperatures of 10, 15 and 20 ° e influenced
sclerotial recovery independent of the test fungi (P<O.OOl), with the proportion of sclerotia
recovered at those temperatures being 93 (64-99), 87 (81-91) and 76 (69-83)%, respectively.
56
The proportion of recovered sclerotia that had soft medullas, as determined by the
compression test, was affected by an interaction between the temperature and fungal treatment
effects (P<0.05) (Table 3.1.3), with no significant difference between individual fungal
treatments. While the proportion of soft sclerotia in the untreated control was similar for the
three incubation temperatures, those treated with test fungi had three times as many soft
sclerotia at 20°C than at 10°C.
Table 3.1.3: Soft sclerotia, as a proportion of the initial number of sclerotia (%), in control and
fungal treatments, after recovery from the sand assay (Trial 1) at different incubation
temperatures.
Treatment Untreated control Test fungi 195% confidence limits.
38 (16-66)1 20 (13-29)
27 (9-59) 38 (28-48)
30 (11-61) 67 (56-77)
The fungal treatments or temperatures of incubation, as assessed by culturing of the sclerotia,
did not significantly affect sclerotial viability. The interaction between the test fungi and
incubation temperature was significant (P=0.008), although this appears to be due to the
uneven effects of temperature on individual fungi, rather than a definite pattern emerging for
all fungi (Table 3.1.4).
Table 3.1.4: Viable sclerotia, as a proportion of the initial number of sclerotia (%), after inoculation
with fungal treatments and incubation for 8 d on PDA in the sand assay (Trial 1).
Treatment lOoC 15°C 20°C Untreated control 21 (9-40)1 5 (1-24) 9 (2-28) T. virens B19 0 (-i 4 (1-24) 0 (-) T. virens GV4 13 (4-31) 5 (1-25) 5 (1-28) T. hamatum SIBYG 18 (6-41) 14 (5-38) 6 (1-29) T. hamatum 8Sr4-2 14 (5-35) 0 (-) 0 (-) T. hamatum 6Sr4 0 (-) 14 (5-35) 11 (3-34) T. hamatum 3Sr4-2 13 (4-31) 0 (-) 19 (7-43) T. tomentosum 5Sr2-2 5 (1-24) 0 (-) 6 (1-30) C. rosea 9Sr4 0 (-) 0 (-) 0 (-) C. minitans A69 195% confidence limits.
0 (-) 6 (1-29) 2Confidence limits cannot be calculated.
6 (1-32)
The proportion of sclerotia that yielded C. camelliae mycelium was very low in the control
plates (5-21%), due to contaminant fungi dominating the cultures. This microbial
contamination limited assessment of parasitism by the test fungi. Nevertheless, expression of
57

mycelium and conidia characteristic of some test fungi did occur at levels greater than that of
similar looking fungi in the control plates (Table 3.1.5). There was a high representation of
Trichoderma-like fungi in the untreated controls, with the proportion higher on sclerotia
treated with the Trichoderma strains. C. rosea-like fungi dominated cultures of sclerotia
treated with C. rosea, and to a lesser extent, those treated with C. minitans.
Table 3.1.5: Types of fungi predominant on sclerotia (%), with respect to the mycoparasite
species used to treat sclerotia in the sand assay (Trial 1).
Treatment Trichoderma Clonostachys Other fungi No fungi Untreated control 43 (27-60)1 7 (3-18) 14 (7-26) 2 (-) T. virens 65 (51-76) 1 (_)2 2 (-) 0 (-) T. hamatum. 77 (67-83) 3 (1-6) 2 (-) 0 (-) T. tomentosum 69 (50-84) 0 (-) 1 (-) 2 (-) C. rosea 5 (1-22) 80 (68-89) 0 (-) 13 (5-27) C. minitans 3 (-) 26 (16-39) 17 (6-39) 13 (5-29) 195% confidence limits. 2Confidence limits cannot be calculated.
3.1.3.1.2 Soil assay
During the trial, daily irrigation resulted in about half of the sclerotia eventually rising to the
surface. After 8 weeks from the start of the trial, a 1 cm layer of the potting mix was applied
to the trays so that all sclerotia were covered. No apothecia were produced by the sclerotia
during the course of the trial. No treatments had significant effects on the number of sclerotia
recovered after 14 weeks. Fewer of the smaller sized sclerotia were recovered than the
medium and large sizes; 8.2, 8.8 and 9.0 (LSD(o.05)= 0.32) sclerotia, respectively. Of the 1038
sclerotia recovered and bisected on PDA, 81.5 (SEM = 7.80)% grew mycelium characteristic
of C. camelliae, with no significant treatment or sclerotial size effects (P>0.05). The
remaining sclerotia were either dead (2.5%), with no bacterial or fungal growth, or
contaminated (16%), mainly with Trichoderma spp. Sclerotial firmness was unaffected by
any treatment, but differed between the large and medium sizes, with the energy expended to
produce a 40 N force with the penetrometer averaging 17.3 and 14.6 (LSD(o.05) = 1.9) for
medium and large sclerotia, respectively.
58
3.1.3.2 Trials 3 and 4: Amended methods to evaluate mycoparasites on
sclerotia in sand and soil assays
3.1.3.2.1 Sand assay - natural sclerotia
At the two assessment times (12 and 35 weeks), 99.6% of the sclerotia were recovered and
when touched were firm. However, fewer sclerotia (P=0.001) that were harvested at 12 weeks
grew C. camelliae mycelium in culture than those harvested at 35 weeks; 39 (30-49)% c.f 61
(52-70)%. This corresponded to more Trichoderma-like fungi present on sclerotia at the early
harvest, 47 (37-57)%, compared to the late harvest at which there were 23 (16-33)%.
Since there was no significant interaction (P=0.78) between the treatments and times of
assessment in the expression of the mycelium from the various genera growing from the
sclerotia, data for both assessment dates were combined. The proportion of sclerotia that grew
C. camelliae mycelium was not significantly different between treatments, indicating that the
test fungi did not reduce sclerotial viability (Table 3.1.6). Compared to the untreated control,
Trichoderma dominated sclerotia treated with the Trichoderma isolates (P=0.017), and C.
rosea (P<O.OOI) was more prevalent on sclerotia treated with C. rosea isolates, presumably
due to the application of the respective test fungi.
Table 3.1.6: Sclerotia (%) growing C. camelliae mycelium (indicating sclerotial viability), and
predominant fungi after fungal treatments and incubation in the sand assay (Trial 3).
Treatments C. camelliae Trichoderma CIon osta chys Other fungi Untreated control 68 (41-87) 20 (3-70)1 0 (-i 18 (9-35) T. virens B 19 40 (9-81) 68 (42-87) 0 (-) 2 (0-19) T. virens GV 4 25 (4-74) 63 (37-83) 0 (-) 10 (3-26) T. tomentosum 5Sr2-2 50 (14-86) 49 (26-73) 0 (-) 9 (3-24) T. hamatum SIBYG 25 (4-74) 38 (18-64) 0 (-) 20 (10-37) T. hamatum 3Sr4-2 45 (11-84) 58 (32-80) 2 (1-5) 0 (-) C. rosea 9Sr4 60 (19-91) 25 (9-52) 3 (2-7) 12 (4-28) C. rosea CcS7 75 (27-96) 20 (7-47) 7 (4-11) 0 (-) C. mini tans A69 60 (19-91) 20 (7-48) 0 (-) 17 (8-34) C. minitans WTI-2 80 (29-98) 17 (5-44) 0 (-) 18 (9-35) C. minitans C-Mins A69WG 50 (14-86) 25 (9-52) 0 (-) 5 (1-20) P. cavneus CcS5 60 (19-91) 25 (9-52) 2 (2-5) 12 (10-37) 195% confidence limits; 2Confidence limits marked '-' cannot be calculated.
There was a significant isolate and sclerotial size interaction (P=0.015) on the proportion of
sclerotia that grew no mycelium of any species, and were classed as dead. The proportion of
59
dead small sclerotia treated with isolates P. cavneus CcS5, C. rosea 9Sr4 and T. hamatum
SIBYG was 15 (7-29), 25 (14-40) and 40 (26-55)%, respectively. This was compared to the
zero mortality in small sclerotia that had been treated with the other isolates, and the medium
and large sclerotia that had been treated by any isolate. Generally though, the test fungi had
little effect on sclerotial viability.
3.1.3.2.2 Soil assay
Apothecia were first observed on 1 July 2000, 16 weeks after commencement of the trial, with
production of apothecia continuing to 28 November. The production of apothecia was not
significantly affected by the test fungi, but it was affected by the size of the sclerotia.
Averaged over all treatments, sclerotia produced apothecia for an average of 12.6 weeks
(SEM = 3.9). The small, medium and large sclerotia produced apothecia for 6.4, 13.6, and
17.7 weeks (LSD(o.05) = 4.5), respectively. Results confirmed those from the previous soil
assay (Trial 2), which showed that the test fungi did not parasitise sclerotia of C. camelliae.
When the period of apothecial production ceased, and after the sclerotia had been in the soil
for 37 weeks, the remaining sclerotia were recovered from the trays to assess treatment effects
on sclerotial mortality. Overall, a mean of 8.3 sclerotia (SEM = 0.07) were recovered of the 9
sclerotia seeded in the trays, with no significant differences between sclerotia within the size
classes. It was assumed that sclerotia not recovered had either rotted in the soil or had
disintegrated during the washing process at completion of the trial. There was no significant
difference between treatments on the number of viable sclerotia as determined by the I-kg
probe compression test.
3.1.3.3 Trial 5: Field evaluation of three known mycoparasites
3.1.3.3.1 Apothecia production by sclerotia
The analysis of variance of raw data from the field trial showed that the test fungi had no
significant effect on viability of sclerotia, as determined by the number of sclerotia able to
grow mycelium in culture and the proportion that germinated carpogenically (Table 3.1.7).
This result was not altered when the analysis of variance was performed on data transformed
to loge+ 1 to stabilise the error variance. The number of apothecia that was produced during
the season at each sampling date was also unaffected (P>0.05) by the test fungi, and averaged
60

431m2 from 8 July to 6 August, 320/m2 to 2 September, and 881m2 to 30 September at
completion of apothecial production.
Table 3.1.7: Effect of mycoparasites on total number of apothecia over the course of the field trial
(Trial 5), and the number of non-germinated sclerotia remaining on 28 November 2000.
Treatments Untreated control T. virens B 19 C. rosea 9Sr4 C. mini tans A69
LSD(O.05)
Apothecia (no./m2) 555 485 455 308
317
3.1.3.3.2 Survival of non-germinated sclerotia
Non-germinated sclerotia (no./m2) 658 772 593 438
423
Since sclerotia that had germinated carpogenically were removed during the course of the
trial, the sclerotia harvested at completion of apothecial production represented the dormant
sclerotia that had not germinated during the season. The test fungi had no significant effect on
the surviving sclerotia, as the number extracted from the soil was similar for all treatments
(Table 3.1.7). When these sclerotia were bisected and cultured, the proportion from which C.
camelliae mycelium grew was significantly (P=0.025) lower in those treated with T. virens
B19 than for the untreated control and other test fungi (Table 3.1.8). Both Trichoderma- and
Clonostachys-like fungi were more prevalent on sclerotia in plots previously treated with the
related test fungi. This showed that the spores of both test fungi had probably penetrated the
soil to infect sclerotia that were in the plots.
Table 3.1.8: Sclerotia (%) that grew C. camelliae mycelium and other predominant fungi, after
fungal treatments and field incubation, when recovered from the field trial (Trial 5) at completion
of apothecia production on 28 October 2000.
Treatment C. camelliae Trichoderma Clonostachys C. minitans Other fungi Untreated control 57 (35-76)1 11 (3-29) 1 (0-8) o (_)2 6 (2-17) T. virens B 19 20 (8-42) 51 (32-68) 2 (0-8) o (-) 1 (0-13) C. rosea 9Sr4 64 (42-82) 7 (2-25) 11 (6-20) o (-) 4 (1-15) C. minitans A69 53 (32-72) 8 (2-25) 2 (0-8) 195% confidence limits. 2Confidence limits cannot be calculated.
1 (0-2) 10 (4-21)
61
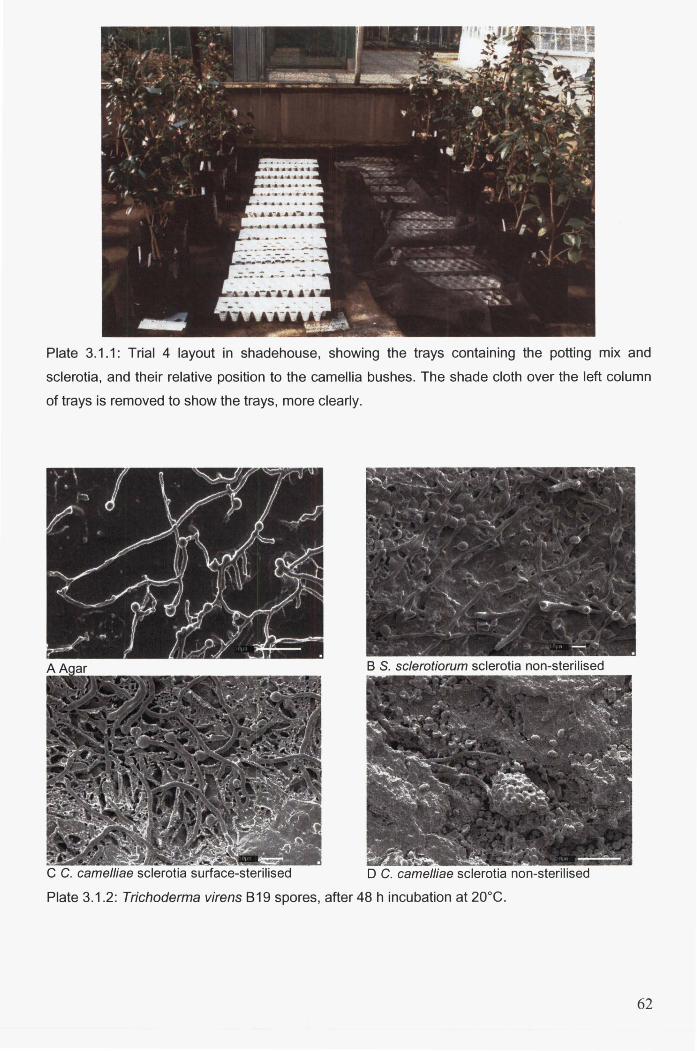
Plate 3.1.1: Trial 4 layout in shadehouse, showing the trays containing the potting mix and
sclerotia, and their relative position to the camellia bushes. The shade cloth over the left column
of trays is removed to show the trays, more clearly.
B S. sclerotiorum sclerotia non-sterilised
C C. camelliae sclerotia surface-sterilised D C. camelliae sclerotia non-sterilised
Plate 3.1.2: Trichoderma virens 819 spores, after 48 h incubation at 20°C.
62
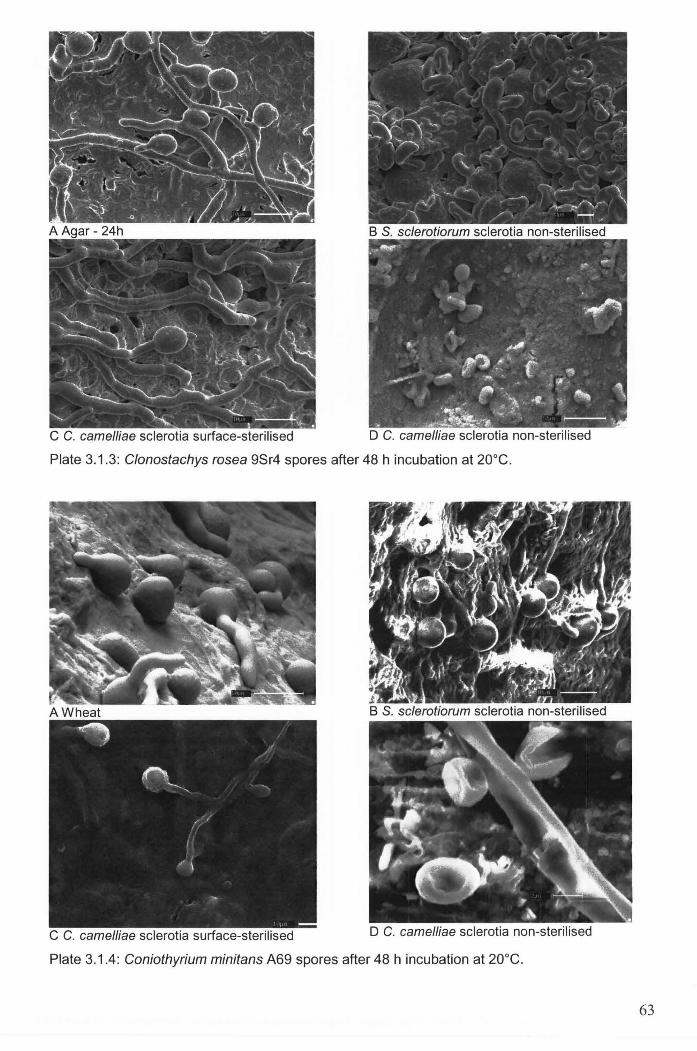
C C. camelliae sclerotia surface-sterilised D C. camelliae sclerotia non-sterilised
Plate 3.1.3: Clonostachys rose a 9Sr4 spores after 48 h incubation at 20°C.
C C. camelliae sclerotia surface-sterilised D C. camelliae sclerotia non-sterilised
Plate 3.1.4: Coniothyrium minitans A69 spores after 48 h incubation at 20°C.
63

3.1.3.3.3 Bagged sclerotia
After 16 weeks in the onion bags, all of the original sclerotia were recovered. All sclerotia
were firm and viable as indicated by the I-kg probe compression test, with no evidence of any
treatment effects. The treatment effects on the genera of fungi growing on cultured sclerotia
were not always significant but followed a similar trend to that observed for the sclerotia
remaining in the soil after apothecia production (Table 3.1.9). C. camelliae mycelium in
culture grew out of fewer sclerotia that were treated with T. virens B 19 than in the untreated
control and other test fungi (P=0.319), either due to parasitism, or to the fast growing fungus
masking expression of the host mycelium. Both Trichoderma (P=0.062) and Clonostachys
like fungi (P<O.OOI) were more prevalent on sclerotia in plots previously treated with the
related test fungi, as were those for C. minitans, to a lesser extent.
Table 3.1.9: Percent mycelial growth of C. camelliae and other predominant fungi from sclerotia
treated with test fungal and stored in onion bags for 16 weeks in the field trial (Trial 5).
Treatment C. camelliae Trichoderma Clonostachys C. minitans Other fungi Untreated control 70 (43-87) 12 (4-32) 0 (_)1 0 (-) 7 (2-20) T. virens B 19 37 (17-62) 42 (24-62) 0 (-) 0 (-) 2 (0-15) C. rosea 9Sr4 55 (29-76) l3 (5-34) 17 (9-28) 0 (-) 3 (1-15) C. minitans A69 53 (31-77) 17 (6-37) 0 (-) 3 (2-7) 12 (5-25) IConfidence limits marked '-' cannot be calculated.
3.1.3.4 Fungi-treated flowers
The fungal treatments had no significant effect on the number or size of sclerotia that
developed from the C. camelliae-infected flowers. On average, 3.0 (SEM = 0.64) discrete
sclerotia were formed per flower, with a total fresh weight of sclerotia being 1.0 g (SEM =
0.25) produced from each flower. For individual sclerotia, their fresh weight averaged 0.32 g
(SEM = 0.069), the smallest being 0.01 g and the largest 3.62 g.
3.1.3.5 SEM observations of mycoparasites on sclerotia
SEM examination of sclerotia surfaces that had been treated with spores of the three
mycoparasites assessed in Trial 5 (section 3.1.3.3), suggested that the rind of field-collected
C. camelliae sclerotia influenced their germination. T. virens B19 (Plate 3.1.2), C. rosea 9Sr4
(Plate 3.1.3) and C. minitans (Plate 3.1.4) germinated on agar or wheat, on non-sterilised
surfaces of S. sclerotiorum and sterilised surfaces of C. camelliae (A, B and C). Yet, for all
64
isolates, there was evidence that many spores did not germinate on non-sterilised rinds of
field-collected C. camelliae sclerotia, as indicated by the puckered appearance of the spores
and lack of germ tubes overall (D).
3.1.4 Discussion
The known mycoparasites of a pathogen closely related to C. camelliae, Sclerotinia
sclerotiorum, which were evaluated in this study provided no effective reduction in the
viability of C. camelliae sclerotia when evaluated in two sand assays, two soil assays, and a
field trial. The test fungi were evaluated under a number of different conditions, with sclerotia
being embedded in sterile sand and natural soil under closely monitored conditions, and in the
natural conditions found under camellia bushes. In all experiments, the sclerotia were treated
with concentrated suspensions of viable spores of the test fungi (Table 3.1.2).
Evidence of parasitism by the test fungi was limited in Assay 1, due to the surface
sterilisation of sclerotia with NaGCI prior to use in trials. All the isolates tested caused minor
reductions in the proportion of sclerotia recovered from sterile sand after 19 weeks
incubation, and an increase in the proportion of sclerotia with soft medullas. A significant
reduction in viability of surviving sclerotia due to activity of the mycoparasites, as determined
by C. camelliae mycelium growing from surface-cleansed sclerotial segments incubated on a
culture medium, was not detected. Either the wash weakened the rind, as inferred by the SEM
evidence described in Section 2.3.1.4, thereby exposing the medulla to micro-antagonists, or
it may have controlled selected contaminants in the rind, enabling the expression of the faster
growing contaminants. The use of oxidative compounds to degrade the rind and enhance the
vulnerability of the sclerotium to attack is explored in Chapter 5.
The surfaces of the sclerotia were left natural and not surface-sterilised in the subsequent
assays. The viability of sclerotia recovered from soil 14 weeks after treatment in the first soil
assay (Trial 2) was unaffected by the mycoparasites, as assessed by mycelium growth on
PDA, or softness of sclerotia, as indicated by resistance to compaction using a penetrometer.
During the trial, daily irrigation caused the sclerotia to float to the surface as the soil around it
subsided, and this may have washed some of the test fungi spores off the sclerotia. In some
cases, the sclerotia were observed to be dry on the soil surface. Covering the sclerotia with
soil after 8 weeks may have been too late to provide adequate moisture to keep the test fungi
viable.
65
~i-·

These two assays were repeated with modifications to the trial designs. The sclerotia were
treated with more highly concentrated spore suspensions of isolates, which included some
new ones (3.1.3.2). Burial of the sclerotia in the soil assay (Trial 4) maintained their position
in the soil and moisture. Yet no treatment had any effect on the proportion of sclerotia
recovered after 8 months, their viability or on the number of sclerotia that produced apothecia.
The sclerotia of C. camelliae tested in these trials varied in size ranging from less than 0.1
cm3 to 2.4 cm3• If parasitism by the mycoparasites had been occurring, then the small sclerotia
would be expected to be parasitised first, as there is less material to degrade than for the larger
sclerotia. Yet differential parasitism based on size of sclerotia was found only in one of the
sand assays (Trial 3, section 3.1.3.2.1). In this assay, an isolate of P. cavneus extracted from a
decaying sclerotium, and an isolate of C. rosea and T. hamatum resulted in a greater mortality
of small sclerotia than that in the untreated controls. Increased mortality of small sclerotia
from these isolates was not detected in the two soil assays.
In the field trial, isolates T. virens B19, C. rosea 9Sr4 and C. minitans A69 that were shown
to be antagonists of S. sclerotiorum sclerotia (Rabeendran et al. 1998), were applied at a very
high dose to soil containing 1066 C. camelliae sclerotialm2 • Yet they failed to have any effect
on apothecial production or on viability of the sclerotia. SEM studies on sclerotia of both S.
sclerotiorum and C. camelliae treated with these isolates did not provide conclusive evidence
to explain the ineffectiveness of these test fungi. SEM showed the spores of these test fungi
which appeared to be dehydrated or dead on the surface of non-sterilised field-collected
sclerotia of C. camelliae, but were able to genninate on the surface of field-collected sclerotia
of S. sclerotiorum and other substrates, 24-48 h after inoculation. The spores may have been
killed, or gennination inhibited, by exudates on the sclerotial surface, which resulted in
collapse of the spores. It is also possible that the procedure used to prepare the specimens for
SEM examination caused partial collapse of some spores, although this does not explain why
spores from the same test fungi were able to genninate on agar or wheat in repeated tests.
SEM examination of the interactions between known mycoparasites and the sclerotial
surfaces needs to be repeated, to verify that the surface of C. camelliae sclerotia affected
spore gennination in some way.
The results of the four assays and the field trial did not give clear evidence that any of the test
fungi was capable of parasitising sclerotia of C. camelliae or reducing their apothecial
production under natural conditions. There was also no evidence that the known sclerotial
66

antagonist, Sporidesmium sclerotivorum, parasitised C. camelliae sclerotia when it was
evaluated on sclerotia, which were collected from Wellington Botanic Gardens, by a
colleague Charles Martinson of Iowa State University (Appendix 2). He used the method
described by Mischke (1998) to assess parasitism, and found that 60% of sclerotia of
Sclerotinia sclerotiorum were parasitised by Sporidesmium sclerotivorum mycelium but none
of the sclerotia of C. camelliae were parasitised.
These results were surpnsmg given the aggressive nature of some biocontrol fungi in
parasitising sclerotia of the closely related S. sclerotiorum, in which they have been reported
to cause up to 100% loss of viability after 3-4 weeks (Jones and Stewart 2000; Rabeendran et
al. 1998). Further, C. minitans has been reported to parasitise apothecia of Sclerotinia
trifoliorum under field conditions and cause total degradation of sclerotia in vitro (Wang and
Vincelli 1997).
The trials reported here were designed to enhance the parasitic effects of the test fungi under a
number of different conditions. Very high doses of viable test fungi were applied either
directly to sclerotia of different sizes in sterile sand in the absence of soil-borne competing
microorganisms, directly to infected flowers containing developing sclerotia, or indirectly to
soil containing undisturbed populations of sclerotia. Assessment of sclerotial viability using
growth of mycelium from sclerotia probably overestimated loss of viability. This was because
sclerotia could have been killed by the surface sterilising method, and mycelial growth on
PDA could have been suppressed or masked by microbial contaminants. Moreover, the
presence of contaminants similar to the test fungi could have enhanced the ability of the test
fungi to kill sclerotia. Thus assessment of sclerotial viability could tend to overestimate the
efficacy of the test fungi. Also, mycelial growth from sclerotia on PDA did not indicate
whether there had been impairment of carpogenic ability, the only indication of viability in
nature. Nevertheless, any potential of the test fungi to affect sclerotia by curtailing
carpogenesis was also not detected in Trials 4 and 5 where apothecia from each sclerotium
were counted. So, if a practical level of parasitism of C. camelliae by the known
mycoparasites had occurred, evidence of parasitism should have been detected in these trials.
Failure by the test fungi to parasitise the sclerotia might have been due to a lack of a specific
recognition factor. Mycoparasite/sclerotium interactions have been reported for a number of
sclerotial pathogens, with mycoparasitic responses to chemical signals secreted by sclerotia
featuring in these studies. Parasitism in Trichoderma spp. is induced by recognition signals of
67

the host. With the sclerotial pathogen Sclerotium rolfsii, lectin present in the host cell wall
served as a recognition signal which induced the fonnation of parasitic structures, secretion of
an adhesive material and chitinolytic enzymes in hyphae of Trichoderma harzianum (Inbar
and Chet 1992, 1994, 1995). Omero et ai. (1999) postulated that the peptide toxin mastoparan
and the activator fluoroaluminate transduced the signal for mycoparasitic behaviour from the
host cell surface, both mediated by cAMP. Cortes et ai. (1998) found that another signal that
regulated production of hydrolytic enzymes by T. harzianum was independent of the
recognition signal mediated by this lectin-carbohydrate interaction. Genes encoding
proteinase and endochitinase were triggered without direct contact during the parasitic
response, by a diffusible molecule found in cell walls of R. soiani. The mycoparasite
produced extracellular cell wall-degrading enzymes, such as ~-1,3 glucanases and chitinases
(Chet and Inbar 1994), which enabled hyphae to grow abundantly on the surface of S. rolfsii
sclerotia, fonning a dense branched mycelium that came into contact with rind through a thin
mucilage (Benhamou and Chet 1996). The hyphae penetrated the rind intracellularly by
means of constricted hyphae.
In Sclerotinia sclerotiorum Grendene and Marciano (1999) showed that exudates from the
sclerotia were required to stimulate spore gennination of C. minitans. Although compounds
secreted by sclerotia may stimulate a mycelial response from the parasite, penetration may
still not occur. Whipps et ai. (1991) noted that mycelial growth of the parasite was stimulated
by sclerotia of Rhizoctonia tuliparum, Sclerotium delphinii and Typhuia incarnata, due to
non-specific leakage of nutrients, but did not result in parasitism of any sclerotia, possibly
because the sclerotia released antibiotics into solution. Macroconidia of Sporidesmium
sclerotivorum were stimulated to genninate in response to a partially water-soluble compound
secreted at low concentrations from the melanized outer layer of Sclerotinia minor sclerotia
(Mischke et ai., 1995). The hydrophobic nature of the secreted molecule meant that in moist
soil it only diffused short distances from a sclerotium. Since an expanding genn tube from a
macroconidium could only extend up to 10 mm without a host, the molecule could only
stimulate gennination in spores that were at a distance sufficient for the tube to reach the
sclerotium and for parasitism to occur (Mischke and Adams 1996). Spores outside that zone
would remain donnant.
There was no evidence from this present study that the test fungi recognised the sclerotia of C.
camelliae as a host. Although all mycoparasites appeared to contribute slightly to the
disintegration of surface-cleansed sclerotia of C. camelliae in sand assays, there was no
68

evidence of sclerotial parasitism by any of the mycoparasitic strains tested in soil. The
effective mycoparasites of S. sclerotiorum were not effective at parasitising and killing
sclerotia of C. camelliae. A more effective approach to biocontrol of sclerotia of C. camelliae
may be to isolate microorganisms from decaying C. camelliae sclerotia and screen them for
potential capacity to degrade sclerotia. This approach is investigated in the following section.
69

3.2 Screening for soil-borne micro-antagonists of
sclerotia
3.2.1 Introduction
To isolate potential micro-antagonists from the diverse soil population, a primary screening
method is needed. One such method used in trials with sclerotial pathogens has been to bait
soils with sclerotia, and then to screen the microorganisms isolated from them in sclerotial
antagonism assays. This method was used successfully by Vannacci et al. (1989), who used
Sclerotinia minor sclerotial baits seeded into soils from several Italian regions, to capture
Fusarium, Trichoderma and Gliocladium isolates. In subsequent assays, these isolates
demonstrated varying degrees of mycoparasitic competence against sclerotia of S.
sclerotiorum, Sclerotium cepivorum, S. rolfsii and Botrytis tulipae. In another project, five
isolates of Trichoderma koningii, two of T. harzianum and three of T. pseudokoningii,
obtained by baiting soils with sclerotia of S. sclerotiorum, killed 62-100% of the pathogen's
sclerotia within 25 days when tested in vitro (dos Santos and Dhingra 1982).
The sclerotial baiting method has also been used to identify new isolates of a particular
mycoparasitic species throughout the world. Sandys-Winsch et al. (1993) baited more than
380 soil samples from a range of countries with S. sclerotiorum sclerotia, in the search for
isolates of Coniothyrium minitans, which were found in soils in 29 countries. Parfitt et al.
(1983) recovered the first United Kingdom isolate of Teratosperma oligocladum from peat
soils by baiting with sclerotia of S. minor.
In this section, young sclerotia of C. camelliae were used as baits in soil in a North Island and
a South Island site, to capture potential parasitic microorganisms. Microorganisms were
isolated from the sclerotial baits at six monthly intervals and screened for their ability to
antagonise C. camelliae sclerotia.
70
3.2.2 Methods
3.2.2.1 Sclerotial baits
During September and October 1999, 1500 flowers infected with C. camelliae were collected
from both the camellia garden at Massey University, Palmerston North, and a residential
garden at 89A Aorangi Road, Bryndwr in Christchurch. Camellia flower blight had been
present at both sites for at least 5 years. The flowers were placed into plastic bins, 40 x 60 cm
by 25 cm deep, with 2 L of water, and incubated outside near their respective collection sites
for 4-5 months over summer (15-22°C) to allow development of sclerotia. These newly
formed sclerotia were used as the initial stock as baits to capture potential micro-antagonists.
In February 2000, the sclerotia were rinsed in tap water to remove loose petal material. Whole
sclerotia greater than 6 mm wide were placed in 4 mm mesh plastic onion bags, with 50
sclerotia per bag, in the camellia garden at Massey University, Palmerston North, and 20
sclerotia per bag in the camellia garden Bryndwr, Christchurch; a total of 1000 sclerotia at
each site. The bag ends were knotted to reduce compartment length between knots to 150 mm.
The sclerotia were spread evenly within each onion bag, and buried 5-10 mm below the soil
surface directly beneath the drip line of the camellia bushes.
At commencement of the trial on 20 February 2000, 100 sclerotia of medium size (ca. 0.5 g)
were randomly selected from each site, surface-sterilised in two washes of NaOCI (Chapter
2), and assessed for firmness and viability. In preparation for the measurements of sclerotial
firmness, 6 mm thick medulla segments were aseptically cut, one from each sclerotium, and
their moisture content standardised (Section 2.2.3). Sclerotial firmness was determined by
measuring the force on a 2.76 mm diameter probe travelling at 50 mmlmin to a compression
force of 40 N, using an Instron 4444 penetrometer. The remaining segments were plated on
PDA (Difco) to assess the viability of each sclerotium and to isolate microorganisms
contained in them as described in Chapter 2.
In the years 2000 and 2001, further random samples of 100 sclerotia per site (two or five
bags) were collected in November, after the period of apothecial production, and in April after
summer microbial activity. At each sampling, the number of sclerotia recovered from each
bag was recorded, and the surviving sclerotia rinsed over a 4 mm sieve to remove adhering
soil. Sclerotia that disintegrated and passed through the mesh were recorded as not viable.
Intact sclerotia were surface sterilised by the double wash in 13.5% NaOCI for 3 min and
71

antibiotic dip method described in van Toor et al. (2000), and Chapter 2. Whole sclerotia or
sclerotial segments were aseptically bisected, with each half placed medulla-face down onto
90 mm diameter PDA (Difco) plates. The plates were incubated at 20 ° C with a 12 h diurnal
light regime, and assessed after 8 d for growth of colonies characteristic of C. camelliae and
fungal or bacterial contamination. Where necessary, a Zeiss binocular microscope at 40 x
magnification was used to confirm identification.
For both sites and all assessment times, microorganisms growing from the surface-sterilised
sclerotia were subcultured, the bacteria onto nutrient agar (NA) (Difco), and the fungi onto
PDA (Oxoid). Cultures were incubated at 20°C for 7 d, and isolated into pure culture by
repeated subculture onto their respective growth medium. The plates were incubated at 20 ° C
under 12 h diurnal light, and colonies identified using standard taxonomic keys (Dormsch et
al. 1980).
Conidia or bacterial cells of these isolates were cultured on PDA (Oxoid) slopes and stored at
4°C. They were also transferred to 1 mL solution of sterile glycerol/water (10% v/v) in
Eppendorf tubes and stored at -80°C. The test organisms screened for their potential to
parasitise C. camelliae sclerotia were made from fresh cultures.
3.2.2.2 Screening for antagonists
Silica sand was dried and sterilIsed at 160°C for 48 h, and when cooled, 60 g was placed into
each of the 90 mm diameter, 21 mm deep Petri dishes. Field capacity of the dried sand was
determined to be 5.6 mLlI00 g, by doing two extractions of the water in 100 g of saturated
sand, at a suction of 0.1 bar for 4 h (Cameron and Buchan 2002).
C. camelliae sclerotia of mixed age were collected during 2000-2001 from Palmerston North,
Bryndwr in Christchurch, and Wellington Botanic Gardens, and stored at 10DC until use. The
sclerotia were washed under tap water, dried, weighed and sorted into small, medium and
large size classes (section 3.1.2.3.2).
3.2.2.2.1 Screen 1
Two untreated controls were used to compare the effect of 28 isolates comprising Aspergillus
sp. (1), Gliocladium spp. (5), Trichoderma spp. (8), other unidentified fungi (2) and bacteria
(12) extracted from the sclerotial baits. The three sizes of sclerotia were all used and acted as
72

replicates in analysis of the treatment effects. For each dish of sand, five sclerotia of one size
were inserted into the sand with one sclerotium in the centre, and the others equidistantly
apart and 10 mm from the edge of the dish. Each isolate was applied to each of five sclerotia
per dish, and the treatments replicated two times for each size class (six replicates in total) to
give 30 sclerotia treated by each isolate. A 1 00 ~l suspension containing the candidate isolate
of 1 x 10⁷ spores or bacterial cells/mL and 0.01 % Tween 80, was applied to each sclerotium.
To encourage microbial activity, 10 mL of SDW water was dribbled evenly over the sand in
each dish. The dishes were covered with their Petri dish lids and weighed. The dishes were
arranged in randomised block design in a Contherm incubator set at 22°C with 12 h diurnal
light. SDW was added weekly to each dish up to the original weight, so as to replace the
amount that had evaporated and to maintain a moisture content equivalent to 90% of field
capacity. The level of sclerotial parasitism was assessed by the I-kg probe compression test
after 11.6 weeks incubation.
3.2.2.2.2 Screen 2
After the first screen, the method was modified to improve detection of potential biocontrol
isolates. Instead of the isolates being applied in solution, they were applied by placing discs of
the agar cultures on top of the sclerotia, and allowing the microorganism to grow from their
nutrient bases. Further, to avoid variation in efficacy of the test organisms, due to sclerotial
size confounding comparative assessments, sclerotia of only one size (medium) was used.
Also, to enable more isolates to be screened, each isolate was applied to five sclerotia in one
dish only.
The 60 g of dried sand was placed into 84 mm diameter, 12 mm deep Petri dishes. Five
medium-sized sclerotia averaging 0.360 g (SEM = 0.006) were inserted into the sand of each
dish and positioned as before. For each isolate, a 6.9 mm diameter plug was cut from the
actively growing culture, or from PDA alone for the untreated controls, and was placed onto
each sclerotium. To limit contamination between plates, 15 mL of SDW was dribbled evenly
over the sand in each dish at commencement of the screen, and the lids were sealed with cling
film for the duration of the trial. A ratio of one untreated control per 10 isolates was
incorporated into the design structure. The 358 isolates tested comprised Aspergillus spp. (4),
Botrytis spp. (2), Gliocladium spp. (37), Trichoderma spp. (99), Fusarium spp. (7),
Cladosporium spp. (8), other unidentified fungi (80), and bacteria (121). The isolates were not
replicated. The dishes were arranged randomly in a Contherm incubator set at 22°C at 12 h
73
diurnal light. The level of sclerotial parasitism was assessed by the I-kg probe compression
test, after 12 weeks incubation. If at least three of the five sclerotia were soft, the isolate was
reassessed in Screen 3.
3.2.2.2.3 Screen 3
Twenty of the isolates selected from Screen 2, and 30 microorganisms isolated from decaying
sclerotia found at the Wellington Botanic Gardens were assayed commencing 28 Oct 2001.
These 50 isolates comprised Aspergillus niger (1), Clonostachys rosea (4), Cylindrocarpon
didymum (1), Fusarium lateritium (2) Paecilomyces cavneus (2), Penicillium spp. (1),
Pythium spp. (3), Trichoderma spp. (11), unidentified fungi (2) Verticillium tenevum (2), and
bacteria (21).
The assay method was modified further to enhance detection of potential parasitism by the
isolates. For each of the small, medium and large size classes, five sclerotia were embedded
into the 50 g of dried sterile silica sand of each deep Petri dish so that about a quarter of each
sclerotium was exposed, and they were equidistantly apart. Enough SDW (15 mL) was added
to the dish so that the surface of the sand just glistened, an indication that water capacity of
the sand had been reached. A 1 cm square agar segment containing the 3 week culture of the
test microorganism was placed mycelium-side down on top of each sclerotium, and the dishes
were sealed with cling film. Treatment with the isolates was replicated six times, with two
replicates for each sclerotial size class. The treatments were arranged in the incubator in a
randomised block design, with the sclerotial size classes randomly apportioned between the
six blocks. The cultures were incubated as before at 22°C in a 12 h diurnal light regime. The
level of sclerotial parasitism was assessed by the I-kg probe compression test after 14 weeks
incubation. The fungal isolates were identified to genus or species level by Dr Ian Harvey of
Plantwise Services, Gerald St, Lincoln, Canterbury.
3.2.2.3 Statistical analysis
Data were analysed using GenStat Release 4.22 (Fifth Edition). Treatment means were
compared by Fisher's LSD test at P1).05, with 95% confidence limits in brackets. The
proportion of sclerotia surviving or parasitised was analysed on non-transformed data by
generalised linear model with a binomial error structure and a logit link. The firmness of
sclerotia as measured by the penetrometer probe was analysed by analysis of variance.
74
3.2.3 Results
3.2.3.1 Sclerotial bait survival and microbial contamination
The newly fonned sclerotia from the Palmerston North site differed from those obtained from
the Christchurch site at commencement of the trial in February 2000. Sclerotia from
Palmers ton North were finner than for those from Christchurch, with the energy expended by
the penetrometer probe of 33.0 and 26.9 (LSD(o.05) = 3.3) Nmm, respectively. Further, 80% of
sclerotia from Palmerston North were viable compared to only 3% of sclerotia from
Christchurch. Nearly all the sclerotia produced from flowers collected from the Christchurch
site were contaminated with Trichoderma, Mucor and bacterial species, which would have
masked the presence of C. camelliae mycelia in culture, potentially resulting in an
underestimate of the proportion of viable sclerotia.
Although this difference in the level of contaminants continued to be expressed in further
assessments, there was no significant difference (P>0.05) between sites in the proportion of
sclerotial that survived (Table 3.2.1). Overall, the proportion of sclerotia recovered from the
soil after 8, 14 and 21 months averaged 74 (61-84)%, 47 (37-60)% and 47 (34-61)%,
respectively. The cause of this decline in sclerotial numbers appeared unrelated to the initial
differences in the incidence of contaminants, as sclerotial mortality was similar at both sites.
Table 3.2.1: Firm sclerotia (%) recovered after different periods of soil burial at Christchurch and
Palmerston North.
Month of harvest Months in soil Site % sclerotia recovered November 2000 8 Christchurch 86 (67-95)1
Palmerston North 62 (43-78) April 2001 14 Christchurch 49 (31-67)
Palmerston North 44 (27-63) November 2001 21 Christchurch 42 (25-61)
Palmerston North 195% confidence limits.
53 (35-71)
In subsequent assessments, the sclerotia recovered from Christchurch exhibited a significantly
higher incidence of micro-contaminants overall than those at Palmerston North (Table 3.2.2).
Colonies that resembled Trichoderma sp. and C. rosea predominated amongst the fungal
contaminants present. About 3% of the cultured sclerotia were infected with bacteria. The
75
isolates extracted from these baits were evaluated in the screens. Microorganisms growing
from the sclerotia were isolated into pure culture for assessment in the screens.
Table 3.2.2: Sclerotia (%) with predominant fungi when recovered from the soil at Christchurch
(CH) and Palmerston North (PN).
Months Site C. camelliae Trichoderma Clonostachys rosea Other fungi in soil % % % % 8 CH 55 (43-65) 27 (18-37) 10 (7-16) 3 (2-6)
PN 65 (51-76) o (-i 10 (6-16) 5 (3-8)
14 CH 45 (32-60) 51 (37-64) 2 (0-7) o (-) PN 78 (63-88) 15 (7-29) 2 (1-8) o (-)
21 CH o (-) 65 (52-76) 17 (12-25) 2 (1-4) PN 51 (39-62) 44 (33-56) 3 (1-7) 3 (1-5)
195% confidence limits; 2cannot be calculated.
3.2.3.2 Identifying sclerotial antagonists
3.2.3.2.1 Screen 1
In the untreated control dishes, 97 (88-100)% of sclerotia remained viable after the 3 month
incubation. Of the 28 isolates evaluated, none resulted in a high incidence of soft sclerotia
(Appendix 3). The highest level of parasitism was caused by a yet unidentified fungus isolate
D6, and a Trichoderma sp., isolate D16, which resulted in 27 (10-53)% and 20 (7-47)% of
sclerotia being parasitised, respectively. The size of the sclerotia had no significant influence
(P>0.05) on the level of parasitism.
3.2.3.2.2 Screen 2
All sclerotia in the 16 untreated control dishes remained firm after 3 months incubation. Of
the 358 isolates evaluated, 20 isolates resulted in at least three of the five sclerotia being soft.
These comprised nine fungi, Trichoderma sp. Bs117.1, Ch302 and Ch333a, and unidentified
fungi BsI0.l, BS73e.l, Bs120b, Ch68, Pn43 and Wla (Appendix 3). They also included 11
bacteria Bs7.1, Bs8h.1, BsIOh.1, Bs73b, Bs120a, Bs120c, BsI24c.l, B125, D208, Pn23a and
Pn317.1 (Appendix 3). These were sub-cultured onto PDA or NA, respectively, in preparation
for inclusion in the repeat assay, with the additional isolates sourced from naturally decaying
sclerotia.
76

3.2.3.2.3 Screen 3
The most efficacious isolates, Trichoderma specIes BS120b.l and BS8hl.l resulted in
approximately 50% of sclerotia being parasitised compared to those in the untreated control
dishes in which 3% were parasitised (Table 3.2.3). These two most efficacious isolates
parasitised a higher proportion of the smaller than larger sclerotia (Table 3.2.4). Overall, more
of the small sized sclerotia were parasitised than the medium and large sizes (P<O.OI), with
the interaction between sclerotial size and isolates being oflesser significance (P=0.06).
Table 3.2.3: Sclerotia (%) that were softened (parasitised) by the test organisms in Screen 3.
Organism Isolate no. % softened Organism Isolate no. % softened {2arasitised) {2arasitised)
Untreated control 3 (0-19) Trichoderma viride (LU570) BS120b.l 53 (30-75)1 Trichoderma sp. D225 15 (6-32) Trichoderma virens (LU569) BS8h.1.l 42 (22-67) Bacteria BS120b.5 13 (3-40) Fusarium lateritium (LUI82) BSI0.1 37 (17-62) Bacteria BS120b.6 13 (3-40) Bacteria BS8h.l 33 (15-59) Bacteria BS120c 13 (3-40) Bacteria D208.2 33 (15-59) Bacteria BS7.1 13 (5-30) Bacteria BS120a 30 (13-56) Bacteria BS73b 13 (3-40) Trichoderma sp. Ch46 30 (13-56) Fusarium lateritium Pn319b.l 13 (3-40) Unidentified fungus BS73e.l.l 30 (13-56) Clonostachys rosea BSI0h.l.l 12 (4-28) Clonostachys rosea BS73e.l.la 27 (11-53) Bacteria BSI20.4.2 10 (2-10) Aspergillus niger BS73e.l 23 (9-49) Bacteria BS120b.4 10 (2-36) Cylindrocarpon didymum Pn43 23 (9-49) Bacteria BS124c.l 10 (3-26) Trichoderma sp. Pn317a.l 23 (9-49) Bacteria D208.l 10 (2-36) Unidentified fungus BS120b 23 (9-49) Paecilomyces cavneus Wla 10 (3-26) Verticillium tenevum D225.l 23 (9-49) Penicillium sp. BS120b.2 10 (2-36) Bacteria B125 20 (7-46) Trichoderma sp. Ch314 10 (2-36) Bacteria BSI0h.l 20 (9-37) Bacteria BS120b.7 8 (3-24) Bacteria BS7a 20 (7-46) Bacteria Wla.l 7 (1-34) Bacteria D208.3 20 (7-46) Clonostachys rosea BS120c.l 7 (2-22) Bacteria Pn23a 20 (9-37) Pythium inegulare Pn319b 7 (1-34) Pythium inegulare Ch68 20 (7-46) Trichoderma sp. Ch333a 7 (1-34) Trichoderma sp. Ch302 20 (7-46) Trichoderma sp. Ch333a.l 7 (1-34) Trichoderma sp. Ch333a.1.l 20 (7-46) Trichoderma sp. Ch333a.2 7 (1-34) Bacteria BSI20.4.1 17 (5-43) Verticillium tenevum D225.2a 7 (1-34) Clonostachys rosea Ch346 17 (5-43) Paecilomyces cavneus BS7.1.1 3 (0-35) Trichoderma s2. BS1l7.1 17 (5-43) Bacteria D208 o {-i 195% confidence limits; 2unable to be calculated.
Table 3.2.4: Sclerotia (%) softened (parasitised) by the two most effective isolates, showing
effects of sclerotium size, compared to the average level of parasitism over all 50 isolates tested.
Isolates Small Trichoderma sp. BS120b.l 80 (35-97)1 Trichoderma sp. BS8hl.l 80 (35-97)
Mean of the 50 isolates tested 22 (18-27) 195% confidence limits; 2cannot be calculated.
Medium 50 (17-83) 20 (3-65) 15 (12-20)
Large 30 (7-71) o (-i
11 (8-15)
77

3.2.4 Discussion
3.2.4.1 Survival of sclerotia baits in soil
About 50% of the young sclerotia buried in soils at Palmerston North and Christchurch
survived after 21 months. The level of decline in numbers of sclerotia observed in this study
is comparable to those reported for other sclerotial pathogens. Populations of Sclerotium
cepivorum sclerotia, in soil in British Columbia, declined by 64% over 16 months (Leggett
and Rahe 1985). In India, the viability of Sclerotinia sclerotiorum sclerotia differed at
different soil depths, with sclerotia surviving up to 7 months on the soil surface, and 8, 7, 6
and 5 months at 5, 10 15 and 20 cm soil depths, respectively (Kakoti and Saikia 1997). In
Israel, the natural populations of S. sclerotiorum sclerotia declined gradually over the fallow
years that followed continuous outbreaks of lettuce drop. By 7 years, the proportion of
recovered sclerotia were 2-6% of the original population, with small sclerotia predominant
over large ones (Ben-Yephet et al. 1993). In Victoria, Australia, recovery of S. sclerotiorum
sclerotia after 35 weeks on the surface of either a sandy clay loam or a sandy loam was 45%
and 90%. When the sclerotia were buried at 4 cm depth, recovery was 0% and 50%,
respectively, with less than 50% of the recovered sclerotia being viable (Merriman 1976).
Under New Zealand horticultural soil conditions, the numbers of sclerotia of Sclerotinia
minor, S. sclerotiorum, Sclerotium rolfsii and S. cepivorum were reduced by 89-91 % after 6'
months, with little difference in survival of all pathogens' sclerotia at depths of 50 and 150
mm (Alexandra and Stewart 1994). In another trial, the viability of S. sclerotiorum sclerotia
buried under 10 cm of soil declined after 2 months at soil temperatures of 23-25°C at Lincoln
in 1997 and 1998, and at Blenheim in 1998 by 5, 47 and 11 %, respectively (Swaminathan et
al. 1999).
The differences observed in firmness and contamination levels of sclerotia from Christchurch
and Palmerston North had no effect on their rate of survival in the field, which was contrary
to the expectations developed from observations made in this research programme (Chapter
2). The reason may have been the differences in moisture levels when the sclerotia were
formed. In Palmerston North, infected flowers were stored in free-draining plastic bins,
whereas in Christchurch, the bins did not drain properly and so allowed rainwater to collect,
covering the bottom layer of flowers, and creating partially anaerobic conditions. Sclerotia are
known to require aerobic conditions for normal development, because utilisation of fatty acids
78

is less under anaerobic conditions. In S. rolfsii, 112 Ilg lipids/mg dry weight in the mycelium
were found to be utilised in the formation of mature sclerotia in aerobic culture, compared
with 4 Ilg lipids/mg dry weight in anaerobic culture (Shapira et al. 1984).
The increased numbers of fungal contaminants in C. camelliae sclerotia formed under
anaerobic conditions in this study, were also reported for sclerotia of Rhizoctonia solani
formed in rice sheaths under flooded soil conditions. The production and viability of sclerotia
was limited, and increased numbers of Gelasinospora, Trichoderma, Fusarium, Aspergillus
and Chaetomium spp. indicated that these fungi could tolerate anaerobic conditions, even
though they were considered to be strongly aerobic (Ulacio et al. 1998).
3.2.4.2 Isolation of successful micro-antagonists from soil
Fungi that were related to known myco-antagonists, such as Trichoderma spp. or C. rosea,
infested many of the sclerotia baits recovered. This indicates that they may have contributed
to the reduction in numbers of recovered sclerotia, during the period they were in the soil. Of
the 400 isolates that were obtained from the screens, two Trichoderma isolates T. viride
BS120b.l (LU570) and T. virens BS8h.1.1 (LU569), Fusarium lateritium BSI0.1 (LUI82)
and bacteria isolates BS8h.l, D208.2 and BS120a killed 30-50% of small to medium sized
sclerotia in vitro. These isolates were considered only to have a moderate level of
pathogenicity against the smaller sclerotia of C. camelliae. The large sized sclerotia were
generally unaffected by these antagonists, although if the assays had been run for a longer
period, sclerotial degradation in these larger sclerotia may have been detected. However,
evaluation of these organisms' capacity to attack sclerotia was conducted in a sterile moist
sand medium, which was considered to be conducive to parasitism. They may be less
effective in the natural soil environment under camellias where they would also need to
compete with other organisms and to survive drier conditions. Nevertheless, these isolates
were effective enough in degrading C. camelliae sclerotia to warrant their further evaluation
as parasites of sclerotia in field conditions, particularly in formulations aimed at enhancing
their pathogenicity.
The inability of these methods to recover more effective potential biological control agents
may have been caused by a number of factors that led to isolation of benign microorganisms.
The procedures used involved growing the microorganisms from the medulla of bisected C.
camelliae sclerotial baits, and culturing them onto PDA and NA, at an incubation temperature
of 20°C. Potential antagonists could have been missed if they were not able to grow on PDA
79
or NA, or their virulence could have been attenuated during the period of growth in culture. In
addition, some of the isolates might have been incorporated into the medulla during the
formation of the sclerotium, and have no pathogenic capabilities.
The method of preparing microbial inoculum has also been found to affect the outcome of
biocontrol trials and assays. Sharma and Singh (1990) found that mycelial preparations of T.
harzianum, T. viride, Gliocladium roseum and Epicoccum nigrum were much more effective
in controlling S. sclerotiorum disease in peas than were conidial preparations of the same
fungi. Lewis and Papavizas (1985) also found that mycelial preparations of eight isolates of
Trichoderma spp. or G. virens were effective in controlling R. solani in soil, but that conidial
preparations with equal numbers ofpropagules were not effective. To take account of this, the
methodology was changed in Screens 2 and 3 so that mycelium of fungal isolates was applied
directly to the C. camelliae sclerotia, enhancing the chance of detecting antagonists, but
without notable success.
Another possible factor to affect these trials was that the conditions of the screens might not
have allowed the strains to express their full virulence. Jones and Stewart (2000) found that
their 39 isolates of C. minitans showed considerable variation in ability to parasitise sclerotia
of S. sclerotiorum in laboratory screens, with five isolates showing high activity but others
little or none. The strain of pathogen can also influence the effectiveness of the antagonist.
Papavizas and Lewis (1989) found that both strains GI-3 and GI-21 of G. virens, which
effectively suppressed disease caused by Sr-l (small sclerotia) of S. rolfsii, were partially
effective against Sr-116 (medium size sclerotia) and ineffective against Sr-3 (large sclerotia).
However, the same screening methods used in this study have been found suitable for
detecting potential micro-antagonists in other studies. Phillips (1986) found an isolate of G.
virens that was effective over a range of soil moistures, pH and temperatures in degrading
sclerotia of S. sclerotiorum and other sclerotial pathogens when applied to the soil at
concentrations of more than 4 x 10⁷ conidiaikg soil.
Although no single micro-antagonist was shown to be highly virulent against sclerotia of C.
camelliae in this study, a number of naturally occurring isolates demonstrated a moderate
level of parasitism. This indicates that micro-antagonists with some potential as antagonists
may occur naturally in soil under camellia plants. However, the results showed that the larger
sclerotia, which are protected by thicker melanised rinds were better able to resist attack. This
may mean that a single microorganism is unable to parasitise the sclerotia effectively. Rather,
80
a mIX of micro-antagonists may be required for effective biocontrol. This would entail
formulating mixtures of parasitic organisms that were compatible.
An alternative to searching for more efficacious micro-antagonists or developing formulations
comprising mixes of micro-antagonists for controlling sclerotia of C. camelliae, could be to
enhance the activity of resident antagonist microorganisms. This might be achieved by
applying soil conditioners to soil under infected camellia bushes. The aim of such an approach
would be to stimulate activity of resident microorganisms, and to possibly aid degradation of
the sclerotial rind, thereby allowing saprophytic naturally occurring soil microorganisms to
continue the sclerotial degradation. The conditioners may also be toxic against the sclerotia,
and prevent carpogenic germination. This approach is discussed in the next chapter.
3.2.5 Conclusions
No known mycoparasites of sclerotia, or micro-antagonists from in vitro screening of over
400 microorganisms isolated from soil-borne sclerotia baits, were found to be highly parasitic
on sclerotia of C. camelliae. The most promising antagonists were isolates Trichoderma
virens LU569 and T. viride LU570, which had the ability to degrade small to medium sized
sclerotia of C. camelliae, providing 50% reduction overall in numbers of viable sclerotia.
These isolates warrant further evaluation under field conditions. Other fungal and bacterial
isolates provided a lesser degree of control. The screens demonstrated that moderately
parasitic micro-antagonists were present in soil under camellia plants, and this indicates the
possibility of manipulating the soil environment to enhance their efficacy in situ.
81

Chapter 4
4 Control of sclerotia and apothecia with soil
conditioners and fertilisers
The physical, chemical and biological characteristics of a soil affect the survival, growth and
metabolism of the microorganisms living within it. For example, soil-borne micro-antagonists
are often pathogenic due to their ability to produce antibiotics, yet very few are known to
produce them in natural environments, even though up to 52% of soil isolates produce
inhibitory substances when first isolated on nutrient-rich media (Williams and Vickers, 1986).
The reason for this appears to be related to the limited availability of carbon or nitrogen in
many soils, for under these circumstances microorganisms often become dormant (Campbell
1989). When soils are amended with small amounts of organic matter or other readily
available carbon sources they may accumulate detectable amounts of antibiotics. However,
even if produced, the antibiotics may be absorbed onto clay or organic colloids, which may
concentrate small amounts to be locally effective, but they will not be high enough for overall
activity throughout the bulk of the soil. Larger amounts of organic amendments applied to soil
can increase the general level of microbial activity by breaking the dormancy imposed by
carbon and nitrogen limitation. The more microbes that are active, the greater the chances that
some of them will be antagonistic to plant pathogens.
The general response of microorganisms to organic matter has been used in the control of
such diseases as potato scab caused by Streptomyces scabies, and to prevent diseases initiated
by sclerotia of Sclerotium rolfsii and Rhizoctonia spp. (Campbell 1989). Shaban et al. (1998)
found that amending three soils of different types (loamy, clay and sandy) with different
carbon sources (glucose, cellulose, starch, chitin and sawdust) caused increases in the total
count of fungi, particularly myco-antagonists. Testing the effect of different C:N ratios (5:1,
10:1,40:1) on soil fungi in a loamy soil sample using glucose or cellulose and NaN03 showed
that a narrow C:N ratio better stimulated the development of the fungal flora in the presence
of glucose. In contrast, a wide C:N ratio was more favourable when cellulose was used as a
carbon source. This showed that sugar fungi and cellulose decomposers responded
differentially. Trichoderma spp. were usually favoured by a wide C:N ratio (40:1) using either
glucose or cellulose as the carbon source, and treatment of soil with chitin increased densities
of T. harzianum.
82

The types of organic matter that accumulate under camellia bushes are largely composed of
petal debris and leaf-litter. Therefore, the soils in the vicinity of infected camellia flowers that
harbour developing sclerotia could be biased towards high carbon to nitrogen (C:N) ratios.
Under these conditions microbial activity could be attenuated. This chapter investigates the
use of amendments applied to soil to stimulate degradation of C. camelliae sclerotia by soil
borne microorganisms. Further, amendments were evaluated for their ability to suppress
production of apothecia.
4.1 Evaluation of Bio-Start ™ soil conditioners for
control of sclerotia
4.1.1 Introduction
The feasibility of using microbial antagonists to control the soil-borne sclerotia as an
alternative to chemical options was tested in laboratory and field experiments in Chapter 3.1.
Mycoparasites found to be effective against S. sclerotiorum (Rabeendran et al. 1999), the
pathogen closely related toc. camelliae, were not able to parasitise sclerotia. However, two
isolates of Trichoderma recovered from natural C. camelliae sclerotia demonstrated a degree
of pathogenicity when applied to healthy sclerotia (Section 3.2.3.2). This suggested that
microbial antagonists were present in the soil, and it was postulated that their activity could be
enhanced with soil amendments.
Addition of soil amendments was used successfully by Dhingra & Sinclair (1975) who
showed that the density of Macrophomina phaseolina sclerotia declined rapidly in wet soils
amended with glucose and NaN03 in C:N ratios of 10:20, a decline that was significantly
correlated with an increase in the population of soil microbes. The addition of glucosinolates
to soils can also improve antagonism by biocontrol agents. T. harzianum was stimulated to
cause total suppression of carpogenic germination of S. sclerotiorum by amending soils with
rapeseed meal containing high glucosinolate concentrations (Dandurand et al. 2000). These
results were similar to those obtained from amending soils with 150-400 ppm CF-5, a liquid
containing extracts from fermented agricultural wastes and 10% (v/v) allyl alcohol (Huang et
al. 1997). This soil amendment controlled carpogenic germination of S. sclerotiorum,
promoted the growth of Trichoderma sp., and led to the reduction of sclerotial populations in
soil. Huang and Sun (1991) also showed that soil amended with a 2% mixture of 4% bagasse,
83

8% rice husks, 4% oyster shell husks, 1% potassium nitrate, 14% calcium superphosphate,
8% urea and 60.5% siliceous slag, reduced the viability of S. sclerotiorum from over 70% in
untreated soils to 20%. The treatments also eliminated carpogenic germination of the
pathogen, and increased the incidence of Fusarium spp. associated with the reduction in
sclerotia. In Australia, parasitism of S. sclerotiorum sclerotia by T. koningii was enhanced
when exogenous nutrients were applied with T. koningii inoculum as a pre-sowing treatment
in spring and summer, resulting in significant reductions in the viability of the sclerotia
(Trutmann and Keane1990). Therefore, the use of soil amendments to stimulate activity of the
soil Trichoderma spp., that might parasitise sclerotia of C. camelliae, warrants investigation.
The concentration and form of nitrogenous compounds influences the composition of
microorganisms in soil. Fang et al. (1988) showed that soil amended with 10 mM of
ammonium compounds such as ammonium sulphate, ammonium nitrate and ammonium
chloride promoted colonisation of sclerotia of S. rolfsii by soil microorganisms such as
Fusarium spp. In contrast, urea, sodium nitrite and potassium nitrite at 100 mM caused the
loss of all the soil microbes except the bacteria.
The Bio-Start™ soil conditioners Mycorrcin.nz and Digester.nz were considered to have
potential for enhancing degradation and decay of C. camelliae sclerotia by stimulating soil
microbial activity. The conditioners contained 280 and 143 mLiL of fermentation extracts,
respectively, and selected minerals, which included N, P and K concentrations of 3, 1 and 2%
(Appendix 4). The active ingredients were created by batch fermentation by selected bacteria
to produce metabolites, although the products themselves did not contain a microbial
inoculum (Gerard Besamusca pers. comm. 2002). Bio-Start Ltd (2001) reported that in some
trials, Mycorrcin.nz increased fungal biomass in soils. In a trial near Blenheim, three
applications of Mycorrcin.nz at 2 L/ha increased fungal biomass from 1 to 32 Ilg/g of soil. In
a trial near Katikati, applications of 15 L/ha in one year and 10 L/ha each year for another two
years increased the fungal biomass from 0.5 at the start of the trial to 5.8 Ilg/g soil at its
completion.
This section reports on a laboratory assay that evaluated mixtures of Bio-Start™ Mycorrcin.nz
and Digester.nz with or without urea, an assay that evaluated urea alone, and a field trial that
evaluated the Bio-Start™ products with urea, for control of soil-borne sclerotia of C.
camelliae.
84
4.1.2 Methods
4.1.2.1 Laboratory assays
Soil, which had earlier been found to contain at least 20 sclerotia/m2, was taken from under
10-year old Camelliajaponica trees and used for the assay. This soil was considered likely to
contain potential micro-antagonists because the soil microorganisms had been exposed to C.
camelliae sclerotia for two years. It was collected to a depth of 50 mm, and passed through a
4 mm sieve. Field capacity of the soil was measured by the tension method (Cameron and
Buchan 2002), and found to be 7.7 mLl100 g soil as determined by recording the average
duplicate volume of water in 100 g of saturated soil after 4 h at a suction of 0.1 bar. The soil
moisture content (water/wet soil) was determined by averaging six samples of approximately
9 g of soil after drying for 48 h at 160°C, and the moisture content of the soil adjusted
throughout the assays to maintain it at 80% of field capacity to encourage microbial activity.
4.1.2.1.1 Assay 1 - Bio-Start™ products and urea
The soil was collected on 29 January 2001. At that time, it had a moisture content (water
weight/wet soil weight) of 35 % (SEM = 1.9), equivalent to a gravimetric moisture content
(water weight/dry soil weight) of 53 % (SEM = 6.2). The screened soil (30 g, equivalent to 70
mL) was placed into each of 84 mm diameter x 20 mm deep Petri dishes. C. camelliae
sclerotia, collected from the Wellington Botanic Gardens during November 2000 and stored at
lOOC until they were used in the assay, were washed under tap water, sorted into small,
medium and large sizes, air-dried, and weighed. The 168 sclerotia needed of each size class
averaged 228 mg (SEM = 7), 477 mg (SEM = 11) and 911 mg (SEM = 17). For each
sclerotium size class, four sclerotia were pressed into the soil in three replicate dishes,
equidistantly across the area, and the dishes shaken from side to side so that the soil covered
the sclerotia.
The soil treatments comprised an untreated control, and Bio-StartTM products applied at the
recommended field rate: Mycorrcin.nz at 8 L/ha (4.43 mg/dish), Digester.nz at 2.5 L/ha (1.39
mg/dish), and Mycorrcin.nz at 8 L/ha plus Digester.nz at 2.5 l/ha. These treatments were also
tested at 10 times the recommended field rate. In addition, the untreated control and all Bio
Start™ treatments were compared with and without urea (46% N) at 50 kg N/ha (60 mg
N/dish). All the ingredients were applied to the soil in the same volume of water (554 J.lI) per
dish on 1 February 2001, followed by 5 mL of non-sterilised tap water dribbled evenly over
85

the soil in each dish, to bring the moisture content to 82% of field capacity. The treatments
were arranged in a randomised block design and incubated at 22°C with a 12 h diurnal light
regime. Tap water, sufficient to replace moisture lost due to evaporation, was added weekly to
each dish. After 12 weeks incubation, sclerotia were extracted from the soil, and assessed for
viability using the I-kg probe compression test.
4.1.2.1.2 Assay 2 - urea
The soil was collected on 21 May 2001. At that time, it had a moisture content (water
weight/wet soil weight) of 46 % (SEM = 1.1), equivalent to gravimetric moisture content
(water weight/dry soil weight) of 87 % (SEM = 4.0). The soil was screened through a 4 mm
sieve, with 50 g (116 mL) placed into 84 mm diameter, 20 mm deep Petri dishes. The friable
organic soil was 20 mm deep. C. camelliae sclerotia, collected from Bryndwr, Christchurch
on 22 May 2001, were washed under tap water, sorted into small, medium and large sizes, air
dried, and weighed. The 480 sclerotia of the small, medium and large size classes averaged
147 mg (SEM = 3.5),360 mg (SEM = 6.1) and 702 mg (SEM = 10.5), respectively. For each
sclerotium size class, five sclerotia were inserted into the soil of a dish, equidistant from one
another and 10 mm in from the edge, with one in the centre. The dishes were shaken on an
orbital vibrator so that the soil came in contact with, and covered, each sclerotium. The
treatments, comprised an untreated control, and urea (46% N) at 100 kg Nlha (120 mg
urea/dish) applied in 5 mL of RO (reverse osmosis) water, which was dribbled evenly over
the soil in each plot, just before beginning incubation. The Petri dish plots were covered with
Petri dish lids and weighed. The treatments were replicated 18 times and arranged in
randomised block design in a Contherm incubator set at 22°C with 12 h diumallight. Tap
water was added weekly to each dish to maintain the original weight. After 23.4 weeks
incubation, the sclerotia were recovered from the soil by washing in tap water over a 4 mm
sieve, and assessed for viability using the I-kg probe compression test.
4.1.2.2 Field trial
On 23 February 2001, a solution of Mycorrcin.nz plus Digester.nz at 8 and 2.5 llha,
respectively, was applied in 1000 1 waterlha with a hand-held garden sprayer, to soil under
camellia bushes in the camellia garden at the Wellington Botanic Gardens. Immediately
afterwards, 109 kg urea prills/ha (50 kg Nlha) were broadcast onto these plots by hand. At this
time, new sclerotia were developing in infected flowers that had dropped to the ground. The
86
treatment was reapplied again on 1 June 2001, prior to apothecial production by existing soil
borne sclerotia. The Bio-Start™lurea treatment was compared to an untreated control. All
treatments had six replicate plots (1.0 x 1.0 m), which were arranged in a randomised block
design.
To ensure that there were sufficient numbers of young healthy sclerotia for assessmg
treatment effects, sclerotia were collected from infected flowers during spring 2000 and
seeded into each plot prior to treatment application in February 2001. Eighty medium-sized
sclerotia were placed into four 200 mm long x 25 mm diameter onion bags (mesh size of 5 x 5
mm), so that each bag contained 20 sclerotia. The bags were positioned equidistantly in the
centre of the plot, 200 mm in from each of the comers, and buried just beneath the soil
surface. The number of apothecia produced in the onion bags, and across the plot from
naturally occurring sclerotia, was recorded on 16 August, 3 and 19 September, and 10 and 19
October 2001. The number of sclerotia remaining in the soil of each plot was estimated on 14
November 2001 by counting all the sclerotia found within a 36 cm diameter soil core (0.1 m2)
to 5 cm depth. Sclerotia remaining in the onion bags were also counted, and assessed for
viability using the I-kg probe compression test.
4.1.2.3 Statistical analysis
Data were analysed using GenStat Release 4.22 (Fifth Edition). Treatment means were
compared by Fisher's LSD test at P1)'05, with 95% confidence limits in brackets. The
proportion of original sclerotia recovered and parasitised in the laboratory assays were
analysed by generalised linear model with a binomial logit link. In the field trial, apothecial
production and density of surviving sclerotia were analysed by analysis of variance on loge
transformed data to stabilise the error variance.
4.1.3 Results
4.1.3.1 Laboratory assays
4.1.3.1.1 Assay 1- Bio-Start™ products and urea
Mycorrcin.nz or Digester.nz had no significant effect (P=0.704) on the proportion of sclerotia
recovered within any size category, which averaged 98 (95-99)%. These conditioners also had
no effect on the proportion of recovered sclerotia that were recorded soft in the firmness test
87

and considered parasitised, which averaged 5 (3-9)%. Only the nitrogen treatment had a
significant effect (P=0.025) on the proportion of parasitised sclerotia, which were 4 (2-6)%
for non-nitrogen treatments and 8 (5-11)% for the nitrogen treatments, averaged over all size
classes.
4.1.3.1.2 Assay 2 - urea
Contrary to results obtained from the previous assay, the interaction between urea and
sclerotial size was significant (P=0.006) in Assay 2. Urea at 100 kg N/ha caused a reduction
in the proportion of viable small sclerotia recovered after almost 6 months incubation, but the
sclerotia in the larger size classes were unaffected by the treatment (Table 4.1.1).
Table 4.1.1: Effect of urea treatments on proportion of soft parasitised sclerotia (%)after 23.4
weeks in soil (Assay 2).
Treatment Untreated control Urea 100 kg N/ha 195% confidence limits.
4.1.3.2 Field trial
Small 8 (5-12)1
27 (21-33)
Medium 11 (7-16) 11 (7-17)
Large 8 (5-13)
13 (9-19)
The Bio-Start™ and urea treatment had no effect (P>0.05) on the numbers of naturally
occurring sclerotia recovered from field plots or on the numbers of apothecia produced (Table
4.1.2). There was also no effect on the number of sclerotia recovered from the onion bags,
since 100% were recovered and viable from both untreated and treated plots.
Table 4.1.2: Effect of soil treatment on density (no./m2) of apothecia in plots during spring, and
natural soil-borne viable sclerotia in November 2001, at Wellington Botanic Gardens 1.
Treatment Untreated control Bio_Start™ and urea
Apothecia 3.49 (32) 3.08 (21)
Sclerotia 5.69 (294) 4.66 (l05)
LSD (P=0.05) 1.56 1.25 1Data are loge transformed means, with back transformed means in parentheses.
88

4.1.4 Discussion
4.1.4.1 Bio-Start ™ soil conditioners
For the Bio-Start products to be effective in controlling camellia blight, the treatment would
need to reduce C. camelliae sclerotial or apothecial densities to negligible levels. Only one
apothecium, which is able to release millions of ascospores, is required to infect a new crop of
camellia flowers and to continue the life cycle. Although the Bio-Start™lurea treatments did
not result in a significant reduction (P>0.05) of sclerotia 9 months after application, sclerotial
population densities were almost a third lower than in the untreated control. The effect of
repeated yearly applications of Bio-Start™lurea may compound, and result in significantly
lower numbers of sclerotia in subsequent years. However, any control of sclerotia would be
offset by the next generation of sclerotia developing in the newly infected flowers. This low
reduction in sclerotia is in contrast to the dramatic reduction in sclerotia of M phaseolina
after application of glucose and NaN03 found by Dhingra & Sinclair (1975). It led them to
postulate that the increased microbial activity destroyed the mycelium of germinating
sclerotia. Since mycelial germination is not common in sclerotia of C. camelliae, the
sclerotium remains protected by the rind and not vulnerable to attack by micro-antagonists via
any exposed hyphae.
Horticulturists have used Digester.nz and Mycorrcin.nz with the intention of improving yields
in fruit crops. The product labels state that 'they contain fermentation extracts and selected
minerals that inhibit soil pathogens and stimulate composting microorganisms.' Mycorrcin
was formulated 'specifically to enhance particle aggregation, and to stimulate activity of
mycorrhizal fungi in order to improve calcium uptake and promote nutritional balance in
trees.' Digester was formulated to 'accelerate breakdown of prunings and leaves through
enhanced cellulose degradation and microbial composting, even in lower temperatures during
winter'. To achieve these effects, Bio-Start NZ Ltd recommends seasonal spraying of selected
products onto soil across the entire growing area. They recommend '4 L/ha Mycorrcin and 1
L/ha Digester sprayed in autumn, 2 L/ha Digester with 30 kg N/ha onto mulched prunings in
winter, and 4 L/ha Mycorrcin in early spring'. They also recommend 'Mycorrcin applied at 5-
10 Llha onto rows of new plantings in late winter, and 2 L/ha Mycorrcin added to the weed
spray during late spring and late summer.' However, at the application rates used in Assay 1
of Mycorrcin.nz at 8 L/ha and Digester.nz at 2.5 L/ha fha, and at 10 times these rates, there
89

was no evidence that micro-parasitism of C. camelliae sclerotia was enhanced by the Bio
Start products alone.
4.1.4.2 Effect of nitrogenous fertilisers
In the assay that evaluated the effect ofMycorrcin.nz and Digester.nz, alone or combined, and
with and without urea on the viability of C. camelliae sclerotia, the small reduction in
sclerotial viability was attributable solely to the effect from urea. One possible reason for the
reduction could have been due to stimulation of microbial activity in the soil. Other studies
have shown the effect of added nitrogen fertilisers in increasing microbial populations and
pathogen propagules. Ammonium sulphate [(NH4)2S04], ammonium nitrate (N~N03),
diammonium phosphate [(NH4)2HP04], or urea applied to soil at field rates of 135 kglha (0.09
mg ofN/g soil to a depth of 15 cm) or Gliocladium virens biomass at a rate of7.5 kglha (0.05
mglg soil to a depth of 15 cm) did not reduce the viability of sclerotia of Sclerotium rolfsii
when each was applied alone (Hoynes et at. 1999). However, when treatment with the
nitrogen fertilisers was combined with G. virens, the viability of sclerotia was reduced by
more than 75%. A similar result was reported from another laboratory study in which the
efficacy of Trichoderma harzianum added to soil in a wheat-bran formulation was more
effective at reducing the viability of S. rolfsii sclerotia when urea was also added to the soil
(Maiti and Sen 1985). In a field trial, Liu et al. (1995) found that ammonium nitrate applied at
220 kg N/ha on creeping bentgrass (Agrostis palustris Huds.) turfled to a 2-3 fold increase in
populations of bacterial and fungal propagules in the thatch and soil. This resulted in control
of dollar spot disease caused by Sclerotinia homoeocarpa.
The reduced sclerotial viability observed in these assays on C. camelliae sclerotia, and the
lower (but not significant, P>0.05) population density of sclerotia in plots treated with Bio
Start plus urea noted in the field trial at Wellington, may have been related to volatilisation of
ammonia from urea. Fang and Liu (1989a) showed that volatile substances from natural soil
amended with urea caused a 100% loss of sclerotial viability in S. rolfsii. They related this
loss in viability to the ammonia released within 1 d on the activity of soil microorganisms, as
no reduction in sclerotial viability was observed in sterilised soil containing urea. The authors
concluded that the effect of urea on sclerotial viability was closely related to the production of
urease by soil microorganisms in response to the added urea (Fang and Liu 1989b). Urease
was required to break down urea with the release of ammonia. They found that the 10
different microorganisms isolated from soil, T. harzianum, Fusarium ventricosum,
90

Penicillium corylophilum and four unidentified fungi all produced urease. When these fungi
were incorporated into the urea-amended soil as conidia or mycelial mats, they inhibited the
germination and viability of S. rolfsii, respectively. The amount of urease secreted by the
microorganisms that was required to inhibit sclerotial germination was 50 )lg/100 g soil
containing 0.06% (w/w) urea. The amount required to killing all sclerotia exceeded 100
)lg/100 g soil containing 0.l2% (w/w) urea.
The 0.12% urea that was found by Fang and Liu (1989a) as necessary for killing sclerotia of
S. rolfsii was less than half the concentration of urea in the soils in the assays of the current
study. The 60 mg of urea mixed in with the 19.5 g of dried soil in Assay 1, and the 120 mg of
urea mixed in with the 26.5 g of dry soil in Assay 2, was equivalent to 0.3% and 0.45% (w/w)
urea in soil, respectively. So, it is possible that the reduction in sclerotial viability and
population of sclerotia observed in the assays and the field trial may have been caused by the
release of ammonia and conversion into ammonium carbonate induced by urease-producing
microorganisms in response to the application of urea. Sclerotia of C. camelliae are
considerably larger than sclerotia of S. rolfsii, which are about 2 mm in diameter, and this size
difference may account for the less dramatic effects from urea observed in the C. camelliae
sclerotial assay. Therefore, the small sclerotia of C. camelliae would be expected to be more
susceptible to the effects of urea and microorganisms than the larger sclerotia. This prediction
was confirmed in Assay 2 (4.1.3.1.2), where only the small sclerotia were softened and so
considered dead, with the sclerotia from the larger size classes unaffected by the application
of the urea 6 months after treatment application.
Huang and Janzen (1991) found that surface application of urea to soil at a rate of 25-150
kg/ha was effective in controlling carpogenic germination of Sclerotinia sclerotiorum
sclerotia. They also concluded that ammonia released from decomposition of the urea was the
key toxic agent responsible for the inhibition of germination, since the treatment was
ineffective in sterile soil without urease. No suppression of C. camelliae apothecia was
observed in the field trial from application of 109 kg urea on 1 June 2001, about 8 weeks prior
to the onset of apothecia production. This time of application was possibly too early for the
effects from ammonia to persist and inhibit apothecial production in this trial.
Since sclerotia of C. camelliae do not generally germinate vegetatively in soil, potential
micro-antagonists would need to be able to attack or penetrate the protective rind to degrade
the sclerotia. In this study, either micro-antagonists were not present in the soil under camellia
91
bushes, or the Bio-Start™lurea treatment did not enhance the pathogenicity of potential micro
antagonists. However, there appears to be enough evidence to support the contention that the
addition of nitrogen to soils can stimulate the activity of beneficial microorganisms to the
detriment of sclerotial pathogens. Although the benefits from this study were not sufficient to
rely on this approach entirely for control of camellia blight, the decrease in numbers of
sclerotia was sufficient to warrant the use of urea to supplement other options for control of
soil-borne sclerotia. The alternative strategy of using the toxic effect of some nitrogenous
fertilisers to suppress production of apothecia is investigated in the following section.
92

4.2 Suppression of apothecial production using
fertilisers
4.2.1 Introduction
While the application of nitrogen to soils in summer and autumn had only a minor effect on
enhancing degradation of C. camelliae sclerotia in soil (Section 4.1.3), an alternative option
would be to apply nitrogen fertilisers to the soil in spring to suppress apothecial production.
The nitrogenous fertiliser, calcium cyanamide (CaCN2), also referred to as a fungicide
because of its affect on inhibiting apothecial production (Section 1.5.3.1), inhibited apothecial
production in C. camelliae when applied to soil in sand at 224-896 kg/ha to reduce the
numbers ofapothecia by 82-98% (Haasis and Nelson 1953). CaCN2 also controlled apothecial
production of the closely related pathogen Sclerotinia sclerotiorum. CaCN2 fertiliser mixed
into the soil at 400 kg/ha, reduced the total number of apothecia produced by 73%
(McQuilken 2001). Apothecial production by this pathogen was also reduced by applications
of CaCN2 at 50 kg/ha in bean, Phaseolus vulgaris (Akai 1981), and at 500 kg/ha in early
spring in caraway (Carum varvi) (Verdam et al. 1993). Application of Nitrolim, which
contained 57% CaCN2, to the soil surface of a pea crop completely inhibited carpogenic
germination of buried or surface sclerotia of S. sclerotiorum, over a period of20 weeks (Jones
and Gray 1973). In contrast, most sclerotia germinated on untreated soil in 5 weeks and
produced apothecia 2-6 weeks later. Huang and Sun (1991) also showed that 3 weeks after
soils were amended with 0.6-2% CaCN2 (Perlka™) there was enhanced bacterial colonisation
of sclerotia of S. sclerotiorum, which destroyed the viability of all sclerotia and prevented
carpogenic germination.
Other nitrogen-based, and carbonate-based fertiliser compounds, have also been effective in
killing sclerotia of Sclerotium rolfsii. Tu et al. (1991) found that sodium nitrite at 125 ppm,
and nitrogen (as urea) and ammonium bicarbonate at 250 ppm, completely inhibited
germination by sclerotia. Punja et al. (1986) found that three applications of either calcium
nitrate at 112 kg Calha, urea at 112 kg N/ha or ammonium bicarbonate at 84 kg N/ha
controlled mycelial production. This led to a reduction in incidence of the disease in carrots
caused by the pathogen, from 17% to 5%. Fang et al. (1988) showed that sclerotial
germination was significantly inhibited by 10 mM soil amendments of ammonium sulphate,
ammonium nitrate or ammonium chloride, and that the sclerotia were killed by sodium nitrite
93
or potassium nitrite urea, or calcium cyanamide. Myalova (1983) found that apothecial
formation by sclerotia of Coccomyces hiemalis Higgins, the cause of a cherry disease was
considerably reduced by treatment of fallen leaves with ammonium nitrate in spring.
In this study, calcium cyanamide (CaCN2), potassium bicarbonate (KHC03) and ammonium
bicarbonate (NH4HC03) were evaluated for their capacity to inhibit apothecial production by
sclerotia of C. camelliae under field conditions. These products were applied to soil under
camellia bushes to suppress apothecia production in C. camelliae, and not to the camellia
foliage, so as to avoid any phytotoxic effects from these compounds.
4.2.2 Methods
On 3 September 2001 at the onset of the main apothecial production period, an area in the
camellia gardens of the Wellington Botanic Gardens known to be infested with C. camelliae
was prepared for the trial. The few existing apothecia were removed by hand hoeing with a
sharp Dutch hoe. Once the loose surface debris such as twigs and senescent flowers were
raked off, the products were then broadcast by hand onto soil. Armicarb 100SR (KHC03) and
Armicarb 300 (NH4HC03) granules (both manufactured by Church & Dwight Co, New
Jersey, USA) were applied at 300 kg/ha. Calcium cyanamide (CaCN2) powder (Aldrich
Chemical Company, Milwaukee, USA) was applied at 500 and 1000 kg/ha. The trial layout is
shown in Plate 4.2.1. The treatments were compared to an untreated control and replicated 10
times in a randomised block design. Plots were 0.6 m x 0.6 m. Numbers of apothecia within
the central area (0.5 x 0.5 m) of each plot were recorded on 19 September and 10 and 19
October 2001. The last assessment coincided with the final stage of apothecial production, 46
d after treatment application.
The soil temperatures at 0-30 mm depth were measured at 3 h intervals by two Tinytag -
40/56(125)OC probes. For the duration of the trial from 1 September to 20 October 2001, the
soil temperatures averaged over both probes were 11.3 °C (SEM=0.10), 7.0°C and 16.7°C for
the mean, minimum and maximum, respectively.
4.2.2.1 Statistical analysis
Data were analysed using GenStat Release 4.22 (Fifth Edition). Treatment means were
compared by Fisher's LSD test at P1).05. Data on the population density of apothecia and
sclerotia was analysed by analysis of variance using a loge+0.5 transformation to stabilise the
94
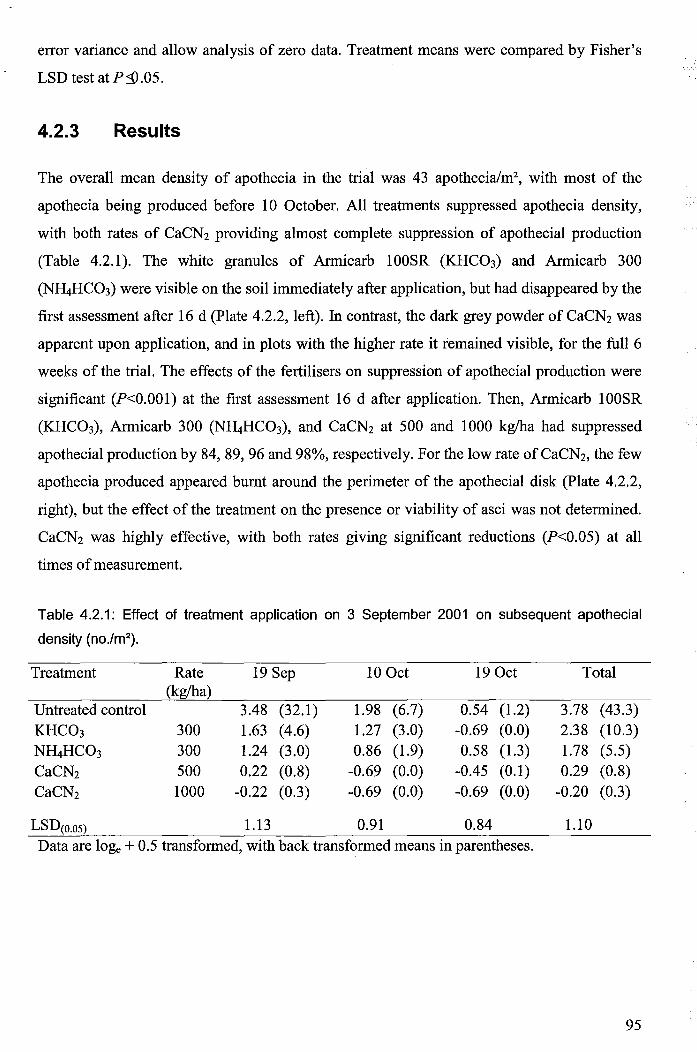
error variance and allow analysis of zero data. Treatment means were compared by Fisher's
LSD test atP1L05.
4.2.3 Results
The overall mean density of apothecia in the trial was 43 apothecia/m2, with most of the
apothecia being produced before 10 October. All treatments suppressed apothecia density,
with both rates of CaCN2 providing almost complete suppression of apothecial production
(Table 4.2.1). The white granules of Armicarb 100SR (KHC03) and Armicarb 300
(NH4HC03) were visible on the soil immediately after application, but had disappeared by the
first assessment after 16 d (Plate 4.2.2, left). In contrast, the dark grey powder of CaCN2 was
apparent upon application, and in plots with the higher rate it remained visible, for the full 6
weeks of the trial. The effects of the fertilisers on suppression of apothecial production were
significant (P<O.OOI) at the first assessment 16 d after application. Then, Armicarb 100SR
(KHC03), Armicarb 300 (NH4HC03), and CaCN2 at 500 and 1000 kglha had suppressed
apothecial production by 84,89,96 and 98%, respectively. For the low rate ofCaCN2, the few
apothecia produced appeared burnt around the perimeter of the apothecial disk (Plate 4.2.2,
right), but the effect of the treatment on the presence or viability of asci was not determined.
CaCN2 was highly effective, with both rates giving significant reductions (P<0.05) at all
times of measurement.
Table 4.2.1: Effect of treatment application on 3 September 2001 on subsequent apothecial
density (no.lm2).
Treatment Rate 19 Sep 10 Oct 19 Oct Total (kglha)
Untreated control 3.48 (32.1) 1.98 (6.7) 0.54 (1.2) 3.78 (43.3) KHC03 300 1.63 (4.6) 1.27 (3.0) -0.69 (0.0) 2.38 (10.3) NH4HC0 3 300 1.24 (3.0) 0.86 (1.9) 0.58 (1.3) 1.78 (5.5) CaCN2 500 0.22 (0.8) -0.69 (0.0) -0.45 (0.1) 0.29 (0.8) CaCN2 1000 -0.22 (0.3) -0.69 (0.0) -0.69 (0.0) -0.20 (0.3)
LSD(o.o5) 1.13 0.91 0.84 1.10 Data are loge + 0.5 transformed, with back transformed means in parentheses.
95

Plate 4.2.1: Layout of the trial evaluating fertilisers for control of apothecia. The five treatments
were arranged in rows across the slope, in seven blocks (left) and three blocks (right).
Plate 4.2.2: Discoloration of soil by 1000 kg/ha of calcium cyanamide 1 d after application (left) ,
and damage caused to apothecia at 500 kg/ha after 16 d (right).
96
4.2.4 Discussion
Although both Armicarb formulations at 300 kg/ha suppressed populations of apothecia by
more than 85% within 2 weeks after application, the level of control was not adequate to
completely prevent production of apothecia and so development of camellia blight. However,
both products at higher rates may provide total suppression of apothecia. The use of higher
rates of these compounds warrants further investigation, but with an element of caution.
Ammonium bicarbonate has been reported to be phytotoxic. In one study, it inhibited
formation of sclerotia by S. rolfsii in vitro, but was phytotoxic when applied as a granule or as
a foliar spray onto groundnut, to control southern stem rot (Brenneman et al. 1990).
Ammonium bicarbonate has been used to contol camellia petal blight in United States (Mark
Crawford pers. comm. 2000). In a greenhouse containing camellia bushes, soil treated in 1999
and 2000 with ammonium bicarbonate suppressed production of apothecia, and resulted in
about a 50% reduction in the incidence of camellia blight in the first year and a 90% reduction
in the second year (unpubl. data).
CaCN2 at 500-1000 kg/ha almost completely inhibited production of apothecia of C.
camelliae in this study. Results from the trial suggested that CaCN2 applied at 500-1000 kg/ha
2 weeks before the onset of apothecia production can provide an effective form of cultural
control of the disease. This result was similar to that obtained by Haasis and Nelson (1953),
where CaCN2 applied to soil in dry sand, at 448 and 896 kg/ha, gave 97 and 98% reduction in
numbers of apothecia, respectively.
The modes of action of CaCN2 in inhibition of apothecia are not well understood. CaCN2
decomposes in water, liberating ammonia and the highly flammable gas, acetylene. In wet soil
CaCN2 is transformed to urea, producing ammonium salts in the process. It is the
intermediary products that appear to be toxic to apothecial production. One of the substances
formed during the transformation from CaCN2 to ammonium salts, dicyandiamide, was found
to be present in the soil 60 days after application of CaCN2, and was thought to be the
substance active against production of apothecia by S. sclerotiorum (Kruger 1980). In further
studies, Kruger (1980) found that dicyandiamide applied to soil at 7.65 g/m2 also inhibited
germination of S. sclerotinia sclerotia. Fink and Bomer (1985) showed that dicyandiamide
applied directly to sclerotia of S. sclerotiorum in 10.2 M solutions significantly inhibited
97
production of apothecia, and that another intennediary product, guanylurea sulphate added in
10.3 M solutions, completely inhibited production of stipes and apothecia. However, they
found that CaCN2 itself was not inhibitory in 10.2-10.4 M solutions. These intermediate
compounds did not adversely affect the mycelia growing from the sclerotia and the ensuing
fonnation of new sclerotia, implying that the intennediary products of CaCN 2 decomposition
only affected the processes in the sclerotia which were involved in stipe fonnation. Another
decomposition product of CaCN2, hydrogen cyanamide (H2CN2), has been shown to inhibit
apothecial production by sclerotia of S. sclerotiorum (Jones and Gray 1973).
Kruger (1980) also found that sclerotia of S. sclerotiorum at 20 mm depth in soil at
temperatures of 10-18°C, fonned fewer apothecia 6 and 18 days after CaCN2 application than
after 0 and 2 days. When the sclerotia were transferred from treated to untreated soil, the
effect of the compound ceased as apothecia were again produced. The inhibition of apothecial
production was greater when the sclerotia were at a soil depth of 10 mm than at 30 mm.
The temperature range measured at the 0-30 mm soil depth at the Wellington trial site was 7-
17°C, and within the temperature range reported by Kruger (1980). Therefore the reaction
times in Kruger's study have relevance to this study. CaCN2 appeared to act near the point of
application, the effects persisting from the time of application to the first assessment after 16
d, and the subsequent assessments. It is likely that in this study, guanylurea sulphate and
dicyandiamide were also fonned and contributed to the persistent effects from CaCN 2 that had
been observed on the inhibition of apothecial production by C. camelliae sclerotia.
Many other fertiliser-type compounds can affect apothecial gennination of sclerotia, but their
efficacy can be dependent on the properties of the soil. Punja and Grogan (1982) found that
the efficacy of various salts on inhibition of sclerotial gennination by S. rolfsii was enhanced
when pH in the solution was in the range of 7-9, and by some types of soluble ions. The
cations calcium, potassium, and sodium were less inhibitory than lithium and ammonium
ions. Acetate, fonnate and phosphate ions reduced gennination, whereas nitrate, sulphate and
chloride ions had no significant effect. Calcium propionate, ammonium acetate, ammonium
molybdate, potassium sorbate, sodium fonnate, lithium chloride, tris(hydroxymethyl)
aminomethane and the carbonate and bicarbonate salts of ammonium, potassium, sodium and
lithium all prevented gennination. The carbonate, bicarbonate and ammonium salts were also
fungicidal at pH 7.5-8.6, apparently due to the prevalence of free C03+2, HC03- and NH3,
respectively. Although not tested in this study, soils under camellia bushes may be acidic
98

because these conditions are known to favour growth of camellias, and the efficacy of these
compounds in suppressing carpogenic germination of C. camelliae sclerotia could be
impaired under these conditions. Therefore, the bicarbonate salts and CaCN2 tested in this
study need to be evaluated further on a range of soil types before being recommended for use
in New Zealand for control of camellia blight.
Another issue for the use of CaCN2 in control of the blight is the one of safety. CaCN2 has a
Hazchem 4YE classification in New Zealand, mainly because it liberates amnionia and
acetylene gas when it comes into contact with water. The calcium and hydrogen compounds
can cause irritation to severe dermatitis in sufferers, causing an erythematous or macular rash
(Canadian Centre for Occupational Health and Safety 2001). Therefore, precautions to
prevent CaCN2 coming into contact with water, and the skin, eyes and respiratory system, will
need to be adopted. In the dust formulation currently available in New Zealand, the fertiliser
needs to be broadcast onto the plots using gloves and a full-face chemical respirator.
Nevertheless, CaCN2 is now available in the USA as a granule fertiliser under the trade name
'Perlka'. This formulation is less hazardous than the dust form, and control of camellia blight
by hobby growers, who use this compound with safety, is now possible. However, Perlka is
only available from one distributor in California, Dormex, USA (Mark Crawford pers. comm.
2002), and the product may be limited in availability for use in New Zealand.
As reported in this chapter, yearly applications to soils under camellias of Armicarb 100SR
(KHC03) and Armicarb 300 (NH4HC03) at rates above 300 kg/ha, and calcium cyanamide at
500-1000 kg/ha, offer potential for immediate cultural control of C. camelliae apothecia.
Commercial formulations of these products with greater ease of application could be imported
into New Zealand, provided that the market is seen as profitable enough to warrant their
importation, and would make the use of these fertilisers for integrated control of camellia
blight a practical reality. Their use could complement or replace annual applications of urea at
50-100 kg/ha, which could reduce numbers of sclerotia through stimulation of soil-borne
micro-antagonists. Furthermore, these products could be used in conjunction with application
of tree-mulch soil amendments, which are discussed in the next chapter, for integrated
management of camellia blight.
99

Chapter 5
5 Control of sclerotia using tree mulches
The strategy evaluated in the previous chapter of enhancing parasitic activity of existing
antagonists in the soil with a single application of urea, did not provide a reduction of soil
borne sclerotia or apothecia sufficient to control camellia blight in the long term. Also, CaCN2
was effective in reducing apothecial numbers but its toxicity was considered to limit its
usefulness. So, alternative strategies were sought that would complement and add to the effect
of enhanced microbial activity induced by the addition of urea. During spring 2000,
population densities of apothecia were observed to differ in different parts of the camellia
garden at the Wellington Botanical Gardens where C. camelliae had been present for at least 7
years (Frampton, 1994). Soil covered with pine bark chips had a total of 20 (SEM = 10)
apothecia/m2, but in adjacent areas where the pine bark was absent, a total of 400 (SEM =
160) and 1630 (SEM = 260) apothecia/m2 were found. This indicated that bark mulches might
have a suppressive effect on sclerotia populations.
Baxter et al. (1987) reported on the effects of tree mulches in reducing populations of C.
camelliae sclerotia. These authors recommended that pine needles be placed 75-100 mm thick
at the base of camellias to control the disease, presumably by suppressing apothecial
production, although the mechanisms of control were not fully understood. Applying bark
mulches under blighted camellia bushes may also be effective in enhancing microbial
degradation of C. camelliae sclerotia previously formed from infected flowers, or in
preventing carpogenic germination of sclerotia and subsequent production of ascospores in
the following spring. In this chapter, the use of tree mulches is investigated, not only to
control populations of existing sclerotia, but also to provide a medium for continued control
of sclerotia developing in infected flowers that have fallen onto the mulch.
100

5.1 Evaluation of tree mulches to control soil-borne
sclerotia
5.1.1 . Introduction
Wood and bark mulches harbour many microorganisms, particularly if a composting stage is
included in production of the mulch. Hardy and Sivasithamparam (1989) found that during
composting of eucalyptus bark mix, CO2 evolution corresponded to high microbial numbers,
and that the pH of the mix increased rapidly from 4 to 7.5 until stabilising at a pH of 6.5,
when many of the soluble and easily-degraded nutrients had been metabolised. Yeasts,
actinomycetes, spore-forming bacteria and pseudomonads dominated the initial populations
but these were joined later by a wide range of bacteria and filamentous fungi that were also
associated with decomposing the bark mix.
Bark composts have been shown to suppress the activity of many soil-borne plant pathogens,
largely through the effects of compounds in the leachate that are produced by the
decomposing microorganisms in the bark mulches (Hoitink and Fahy 1986). In Phytophthora
spp., sporangial production was suppressed by eucalyptus-bark and pine-bark leachates, but
stimulated by the same leachates that had been heat-sterilised (Hardy and Sivasithamparam
1991a). This led the authors to believe that the suppression of Phytophthora root rot disease
appeared to be induced by the microorganisms (Hardy and Sivasithamparam 1991b). This
effect was confirmed by Downer et al. (2001), who applied 150 mm thick eucalyptus wood
and bark mulches to the base of avocado trees in an attempt to control avocado root rot caused
by Phytophthora cinnamomi. Both microbial activity, as assayed by the hydrolysis of
fluorescein diacetate, and saprophytic activity, as assayed by measuring cellulase and
laminarinase enzymes, was found to be higher in the mulch than in bare soil. P. cinnamomi
was concluded to be suppressed by the mulch, because they found much lower rates of
recovery of P. cinnamomi in the mulch and at the mulch-soil interface than in non-mulched
soil.
Mulches have also been used to control diseases caused by soil-borne sclerotial pathogens.
Mycelial germination by sclerotia of Sclerotium rolfsii was reduced when anyone of the
amendments, which included chitin, chaff, bagasse, cattle manure or sawdust compost from
mushroom growing, were incorporated into the soil (Tu et al. 1991). Eucalyptus leaf mulch
has been shown to provide control of onion white rot, caused by Sclerotium cepivorum
101
(Dennis and Armstrong 2001). The growth of Sclerotinia sclerotiorum was inhibited in vitro
by leaf and bark extracts from the neem tree (Singh et al. 1980). Extracts or powders from
pine bark, when applied as mulch to soil in a glasshouse trial, also reduced the disease
incidence in lentils caused by S. sclerotiorum (Kokalis and Rodriguez, 1994).
This chapter investigates the effect of mulches of single and mixed tree species on production
of apothecia by existing soil-borne sclerotia of C. camelliae in the field, and the biochemical
activity of their leachates on mycelial growth of sclerotia in vitro.
5.1.2 Methods
Leaves and branches from each of pine (Pinus radiata D. Don), gum (Eucalyptus leucoxylon)
and kanuka (Kunzea ericoides A. Rich) were mulched in a portable bark chipper by staff of
the Wellington Botanic Gardens. A commercially made mulch comprising material from an
assortment of leaves and branches from available tree species was obtained from the
Wellington City Council. The mulch comprised material from Metrosideros excelsa
(Pohutukawa), Leptospermum scoparium (manuka), Kunzea ericoides (kanuka), Brachyglottis
repanda (Rangiora), Pittosporum eugenioides (Tarata or Lemonwood), Pittosporum
tenuifolium (Kohuhu), Pittosporum ralphii, Pittosporum crassifolium (Karo) , Melicytus
ramiflorus (Mahoe or Whiteywood), Dodonaea viscosa (ake ake) , Psuedopanax spp.,
Hoheria populnea (Lacebark), Geniostoma rupestris, Coprosma spp., Pinus spp., Cupressus
macrocarpa and Eucalyptus spp. (Martin Dench pers. comm. 2001). This mulch was mixed
using a front-end loader to obtain an even distribution of the species within the mix. The
proportion of each tree species in the mix was unknown, and it varied between batches. The
mulches were used in the trials within a week of manufacture.
5.1.2.1 Field Trial
5.1.2.1.1 Treatments
The trial was conducted at the camellia garden of the Wellington Botanical Gardens. The
mulches of pine, gum, kanuka, and the commercial mix were applied in plots bordered by
non-tanalised pine timber 1 x 1 m x 150 mm deep, to a depth of 100 mm (Plate 5.1.1). The
mulches were laid down on 23 February 2001, which allowed time for the treatments to affect
survival and stipe development in the over-wintering population of sclerotia of C. camelliae
102

underneath the mulch. The treatments, which included an untreated control (bare ground),
were replicated six times, in a randomised block design.
The plots were covered with a KFLD white 20 mm plastic bird mesh (Sarlon) to prevent birds
from disturbing the mulches and to collect the new season's infected flowers, which were
removed from the plots.
5.1.2.1.2 Seeding plots with sclerotia
Once the treatments were applied in February, each plot was seeded with eight, 4 mm-mesh
onion bags, each containing 10 C. camelliae sclerotia, formed from cool-stored flowers which
had been collected at the same gardens during spring 2000. The number of sclerotia in each
bag was counted twice to ensure that exactly 10 sclerotia were in each bag. The bags were
buried level with the soil surface in the case of the untreated control, or the mulch surface in
the case of the mulch treatments. Two bags were each positioned equidistantly and 200 mm in
from the comers of each plot.
5.1.2.1.3 Assessments
The temperature at the soil surface was measured from 24 June to 13 November 2001 using
Tinytag -40/75(125tC data loggers. A data logger was buried level with the soil surface in
the middle of each of three untreated control plots at 0-30 mm soil depth. Also, a data logger
was placed in the same position in the soil just below the mulch in each of three plots
containing either the commercial, pine or eucalyptus mulches.
The natural consolidation of each of the mulches was assessed on 19 October 2001. Six
independent measurements of the distance from the top of the timber frame to the top of the
mulch surface were averaged and subtracted from the height of the frame (150 mm) to obtain
the thickness of the mulch.
The number of apothecia produced in the onion bags, and across the plot from naturally
occurring sclerotia, was recorded on 16 August, 3 and 19 September, and 10 and 19 October
2001. Sclerotia, which bore apothecia, were removed from the onion bags or plots after
counting to avoid being counted again. The number of firm (viable) sclerotia in the onion
bags was recorded at completion of the trial on 14 November 2001. During the following 4 d,
the number of sclerotia remaining in the soil of each plot was estimated by counting all the
sclerotia in the centre of each plot within a core of soil 36 em in diameter (0.1 m2) to 5 cm
103
depth. The number of sclerotia with apothecia that had been removed in the preceding
assessments was added to the final count of sclerotia to calculate the total number of
sclerotialm2 in each plot. The I-kg probe compression test described in Section 2.2.3.2 was
used to determine sclerotial firmness.
5.1.2.2 Mulch leachate assays
The effect of bark leachate on mycelial growth was evaluated using sclerotia of C. camelliae
and potato dextrose agar (PDA) in a trial that commenced on 13 March 2001. One litre of
reverse osmosis (RO) water was added to a 100 g sample of each mulch that had been dried at
room temperature for 3 d. The mulches were soaked in the water with occasional mixing at
ambient temperature (20-25°C). Leachate suspensions were withdrawn and tested after 1 and
20 d. On both occasions, the leachates were filtered through a Whatman No.1 filter paper,
and then 100 mL of each leachate was added to 100 mL PDA (Difco). These solutions were
sterilised at 121°C for 15 min. To test whether heat in the process of sterilisation had
denatured any active compounds, a sample of each leachate was also filtered through a 0.22
!lm GP Express membrane with a 250 mL vacuum Steritop flask (Millipore Corporation,
Bedford, Massachusetts). The 100 mL sample of each filtrate was added to 100 mL of heat
sterilised double strength PDA (Difco) to make a recommended single strength of PDA
solution. These media were poured into 90 mm diameter Petri dishes, and each was inoculated
centrally with a C. camelliae sclerotium removed from pure culture on PDA. For each of the
mulches, the treatments comprised a control of PDA alone, and PDA containing filtered or
heat-sterilised leachates (50:50 v/v) (three treatments). The controls used in the 1 d leachate
experiment were heat-sterilised PDA, whereas those used in the 20 d leachate experiment
were filter-sterilised and heat-sterilised PDA. The treatments were replicated eight times for
the 1 d leachates, but replicated 12 times for the 20 d leachates to help overcome the expected
effects of greater variability in treatment effects.
A sclerotial segment, which was free from microbial contaminants, was prepared for
placement onto each treatment medium. C. camelliae sclerotia were surface-sterilised by
washing each sclerotium in 13.5% NaOCI/ethanol (50/50 v/v) for 3 min, rinsed twice in
SDW, and washed again in 13.5% NaOCI for 3 min followed by three rinses in SDW. The
sclerotia were then immersed directly in 20 ppm streptomycin, 40 ppm aureomycin and 250
ppm ampicillin for 5 min. The rind of each sclerotium was completely removed by repeated
aseptic bisection, with each cut perpendicular to the previous one. The last cuts of the cube
like section were made from a face where the sterile scalpel blade had not come into contact
104

with the rind, thereby avoiding smearing micro-contaminants contained in the rind across the
surface of the medulla. The face of the medulla section that had the last cut, was cut to a
standard size of 3 x 3 mm, and placed onto the growth medium. The Petri dish lids were
sealed with food-grade cling film. Cultures were incubated at 20°C with 12 h diumallight.
5.1.2.2.1 Measurements
Mycelial growth was estimated after 5 and 11 d incubation for the 1 d leachates, and after 5, 8
and 10 d for the 20 d leachates. The time for the last assessment on mycelial growth (11 d)
was selected because at that time, the expanding front of the largest colonies were 1-2 cm
from the edge of the agar plates. The diameter of each colony was measured with a Mitutoyo
Absolute Digimat calliper, on two perpendicular planes, and the average of the two was used
to calculate the area of the mycelial mat. For each plate, the presence of bacteria growing
from the original sclerotia was also recorded, since they may have suppressed mycelial
growth. In addition, the number of sclerotia produced from each mycelium was recorded after
11 and 18-19 d incubation, and their cross-section area measured and calculated as for the
mycelial mats after 18-19 d incubation.
5.1.2.3 Statistical analysis
Data were analysed using GenStat Release 4.22 (Fifth Edition). Data on bacterial
contamination in the leachate assay were analysed by generalised linear model with a
binomial logit link. Results were presented as mean percentages, followed by low and high
95% confidence limits in parentheses. Under the priori that the temperature at the soil-surface
was lower under the tree mulch than at the exposed soil surface, temperature data were
analysed by one-way analysis of variance, with significance between treatments ascertained
using the one-tailed T-test. Counts of apothecia and sclerotia were analysed on loge+0.5 -
transformed data, to allow for 0 values and to stabilise the error variance. All other data were
analysed by analysis of variance on untransformed data. Treatment means were compared at
P=0.05 using Fisher's LSD test.
105

Plate 5.1.1: Tree mulch trial design, with the untreated control (foreground) and mulch plot (rear).
Plate 5.1.2: Mycetophila filicornis feeding on an apothecium.
106

5.1.3 Results
5.1.3.1 Field trial
Two Tiny-tag temperature probes were used to determine the temperature of the soil at the 0-
30 mm depth. One probe was placed in each of two untreated-control plots, and one probe
placed under the pine mulch. The other three temperature probes failed during the course of
the trial, and could not be read. The temperatures recorded in the two untreated plots and the
pine mulch plot over the period of apothecial production were different (P3).05), with the
overall means of 10.2 and 9.3°C, respectively.
Consolidation of the mulches, which were initially 100 mm thick, occurred over the 34 weeks
of the trial. On 19 October, the thickness of the commercial, gum, kanuka and pine mulches
was 83, 83, 88 and 70 mm (LSD(o.05) = 11), respectively. This indicated that consolidation was
greater for the pine mulch than for any of the other tree mulches.
Results are presented in Table 5.1.1. The application of tree mulches completely suppressed
production of apothecia, compared to the untreated control during the following spring.
However, in two of the plots, one containing the commercial mulch and the other containing
the pine mulch, birds (black bird or thrushes) had penetrated underneath the mesh. This
resulted in the buried sclerotia being brought to the surface. Apothecia grew only from these
sclerotia.
Numbers of soil-borne sclerotia under the mulch treatments were reduced during the trial.
Compared to the untreated control, all mulches significantly reduced the number of surviving
sclerotia that had not germinated carpogenically from loge 5.69 cf 4.43 (LSD(o.05)=1.03)
sclerotialmZ, i.e. 294 cf 83 sclerotialm2, with no significant difference (P>0.05) in total
sclerotial population density found between the different mulch treatments (Table 5.1.1). All
the sclerotia recovered were firm as indicated by the I-kg probe compression test. When the
numbers of sclerotia that had germinated carpogenically in the untreated control plots were
added to those that had not germinated, the total number of sclerotia in the untreated plots at
the end of the trial was 365 sclerotialm2• Compared to the untreated control, all mulches
totally suppressed apothecial production, and on average reduced the total number of soil
borne sclerotia by 77%.
107

Table 5.1.1: Effects of different mulch treatments on carpogenic germination and survival of
buried sclerotia as at 14 November 2001.
Treatments
Untreated control Commercial mix Gum Kanaku Pine
Total apothecia1
no.lm2
3.49 (32.3) -0.42 (0.2) -0.69 (0.0) -0.69 (0.0) -0.19 (0.3)
Number of viable sclerotia recovered Soil-borne sclerotia 1 Seeded sclerotia
no.lm2 total no.lplot
5.69 (294) 82 5.00 (147) 80 3.85 (47) 79 4.55 (95) 79 4.33 (75) 78
LSD(o.05) 1.1 1.28 3 IData are loge transformed means, with back transformed means in parentheses.
During the course of the trial, the number of sclerotia in the onion bags buried in soil of the
untreated control increased slightly from the 80 originally seeded in each plot to 82 (Table
5.1.1). This was probably because a few sclerotia broke apart during the trial. No apothecia
were produced from the one-year old sclerotia seeded into the onion bags.
5.1.3.2 Mulch leachate assays
5.1.3.2.1 One day leachates
The 1 d leachates from the different mulches had different effects on the growth of C.
camelliae colonies (Table 5.1.2). For each leachate, trends were similar after 5 and 11 d
incubation. In comparison to the size of the colonies on the control plates, the commercial
mix leachate almost completely inhibited growth, whereas the gum and kanuka leachates
significantly enhanced growth for both the filter- and heat-sterilised treatments. However, the
pine leachates gave different results for the two methods of sterilisation, with growth on the
filtered leachate being similar to that on the control plates, but being reduced on plates which
contained the heat-sterilised leachate. This suggests that heat-sterilisation may have caused
accumulation of toxic compounds in the extract.
108
Table 5.1.2: Area of mycelia (cm2) which grew from a C. camelliae sclerotium on PDA amended
with 1 d mulch leachates.
5 d incubation 11 d incubation Sterilisation method: Filter Heat Filter Heat Leachate cm2 cm2 cm2 cm2
None 5.4 24.1 Commercial mix 0.4 0.2 1.2 0.9 Gum 13.8 12.4 47.7 42.5 Kanuka 11.9 10.1 40.5 33.7 Pine 8.3 1.1 35.5 8.8 LSD(o.os) Between leachates 3.5 14.4 Between method of sterilisation 3.7 15.2
The presence of bacteria on the original sclerotial medulla differed between treatments.
Bacteria were found in 44 (30-58)% of the sclerotia on PDA containing the commercial mix
leachate, compared with 3 (1-10)% on sclerotia in the control plates, and no contamination of
sclerotia in the other leachate treatments. Mycelial growth probably suppressed or masked
growth of bacteria. There was also no significant difference (P>0.05) in bacterial
contamination between the methods of sterilisation, showing that the bacteria came from the
original sclerotia rather than the leachate.
Production of sclerotia on C. camelliae mycelium was greater on the gum and kanuka
leachates than on other treatments, averaging 2.0/plate after 11 d incubation (Table 5.1.3).
After 18 d, sclerotia had formed on plates of all leachates except the commercial mix
leachate. The numbers and sizes of sclerotia produced on gum and kanuka leachates were
similar, whereas those produced on the pine leachate medium were significantly fewer and
smaller than on the control plates. There was no significant difference in sclerotial production
between the plates with filter- or heat-sterilised leachates.
109

Table 5.1.3: Sclerotia produced from C. camelliae colonies on PDA amended with 1 d tree mulch
leachates (averaged over filter- and heat sterilised leachate treatments).
11 d incubation 18 d incubation Leachate No. sclerotia No. sclerotia Total surface area of sclerotia (cm2) None 0.1 2.7 1.3 Commercial mix 0.0 0.0 0.0 Gum 2.0 2.7 1.0 Kanuka 2.0 2.4 0.9 Pine 0.0 0.4 0.2 LSD(o.o5) 1.3 2.0 0.8
5.1.3.2.2 Twenty day leachates
The 20 d leachates caused similar suppressive or stimulatory effects on mycelial growth as the
1 d leachates, although there were greater differences between the filter- and heat-sterilised
leachates (Table 5.1.4). In comparison, to the PDA controls, mycelial growth was increased
(P<0.05) by heat-sterilised gum and kanuka leachates, with the effect being more pronounced
after 8 and 10 d incubation periods. Mycelial growth was reduced by the commercial mix
leachate in the heat-sterilised form after 8 d, and both the filtered and heat sterilised forms
after 10 d. Growth was also suppressed by the filtered pine leachate, after 8 and 10 d
incubation. After 10 d, the differences between filtered and sterile leachates were the most
pronounced. Growth on the gum and kanuka leachates was significantly enhanced when they
were sterilised, but unaffected when filtered.
Table 5.1.4: Colony area (cm2) that grew from sclerotia on PDA amended with 20 d mulch
leachates.
5 d incubation 8 d incubation 10 d incubation Sterilisation method: Filter Heat Filter Heat Filter Heat
Leachate None 2.5 1.4 11.9 9.3 19.2 13.2 Commercial mix 1.1 0.3 6.7 2.9 10.2 5.6 Gum 2.6 3.0 12.5 15.9 18.7 27.8 Kanuka 1.6 4.2 9.3 25.2 16.5 41.3 Pine 1.3 2.4 5.3 8.8 6.6 11.6
LSD(o.o5) (incubation periods) 1.3 5.7 8.4
Production of sclerotia on C. camelliae mycelia was completely inhibited by the commercial
mix leachate, and suppressed by the kanuka leachate (Table 5.1.5). There was no significant
difference between filtered or sterilised leachates.
110
Table 5.1.5: Average number and size of sclerotia produced from C. camelliae colonies on PDA
amended with 20 d tree mulch leachates (averaged over filter- and heat sterilised leachate
treatments), after 19 d incubation.
Leachate
None Commercial Gum Kanuka Pine
LSD(o.o5)
No. Sclerotia
1.0 0.0 2.6 0.3 1.0
1.1
Total surface of sclerotia cm2
0.78 0.00 0.63 0.08 0.39
0.43
As with the 1 d leachates, the presence of bacteria on the sclerotia differed between treatments
with the 20 d leachates. Bacteria were found in 25 (12-45)% of plates containing filter
sterilised control and commercialleachates, and the heat sterilised gum leachate, as well as in
17 (6-36)% of plates containing the heat-sterilised commercial leachate. No bacterial
contamination was found in plates containing the other treatments.
Results showed that 20 d leachates of pine mulches contained compound(s) that suppressed
growth of mycelia, those from kanuka mulches suppressed sclerotial formation, and the
commercial mix mulch inhibited production of both mycelia and sclerotia.
5.1.4 Discussion
In the field trial, all of the mulches completely suppressed formation of apothecia from
sclerotia in the soil, thereby preventing release of ascospores and so limiting development of
camellia blight in the surrounding vicinity. The only occasions when carpogenic sclerotia
were found was when birds had removed the bark mulch covering the soil.
Reduction in the numbers of apothecia could have been caused by a number of factors. The
mulches would have contributed to a reduction in light intensity and temperatures at the soil
surface, and an increase in soil moisture. Compared to bare soil, pine bark mulches for
example have been reported to retain water content after irrigation, and maintain the
uniformity of water distribution in the soil (Lakatos et al. 2000). They also lowered soil
temperature in summer at 15 and 25 cm depths by 2-5°C (Pliszka et al. 1997). Conifer bark
chips (25 mm grade) provided a greater level of moisture retention in the soil, applied as
surface mulch at 100 mm deep than 50 mm (Pickering et al. 1998). Any of these factors might
have affected production of stipe and apothecia by the sclerotia in the trial.
111
Sun and Yang (2000) found that in Sclerotinia sclerotiorum, both light intensity and soil
moisture affected the optimal temperature range for carpogenic germination of sclerotia. At
the high light intensity (120-130 mol m2/s) the optimal temperature was 20°C when the soil
moisture level was high, with 80% of sclerotia developing stipe initials in a few days, with
production of apothecia occurring after 160-900 degree days. At the lower light intensity (80-
90 mol m2/s) , 12-18°C was optimum regardless of moisture level, with the incidence of stipe
initials low and taking several weeks to develop. In contrast, sclerotia of Sclerotinia
trifoliorum kept in darkness produced only branched stipes that did not emerge when buried
in soil more than 2 cm deep. The sclerotia only produced apothecia when placed under light,
particularly white light, at a rate proportional to increasing intensity of 20-800 Jlw/cm2
(RaynaI1987).
The sclerotia of C. camelliae are 2-10 times larger than sclerotia of S. sclerotiorum or S.
trifoliorum, and have the capacity to produce longer stipes which can penetrate the 100-150
mm thick mulch layer. Kohn and Nagasawa (1984) reported that C. camelliae sclerotia grew
stipes up to 100 mm in length, compared to stipes produced by S. sclerotiorum which grew to
a maximum of 48 mm from sclerotia buried at 50 mm below the soil surface (Singh and
Tripathi 1996). However, sclerotia of medium to large sizes (0.5-3 g fresh weight) collected
from soils in Wellington or Christchurch for use in the experiments reported in this research
programme, often produced stipes 100-150 mm long. Despite their proven ability to grow
long stipes, no apothecia were observed to penetrate the mulch, which was 70-100 mm thick.
Therefore, although the smothering effect of the mulches may have contributed to carpogenic
suppression, other factors may also have been involved, such as toxic effects from the
leachate, or enhanced micro-antagonism on stipe formation itself or on the viability of
sclerotia at the mulch-soil interface.
The failure of I-year old sclerotia in the onion bags that were embedded in the mulches to
produce stipes did not appear to be due to toxic compounds in the mulches. The bagged
sclerotia in the untreated controls also did not produce stipes. Not all sclerotia produce
apothecia in the year following germination (Baxter and Thomas 1995), so it is possible that
the sclerotia used in the seeding experiment were still too young. This is in contrast to the two
older sclerotia that germinated carpogenically when brought to the surface of the mulch by
birds. Another explanation could be that conditions conducive to production of apothecia by
the bagged sclerotia did not occur. The appearance of C. camelliae apothecia in spring is
dependent on specific conditions of low ambient and soil temperatures coupled with high
relative humidity and soil moisture (Yokohama 1980). However, the environmental
112
conditions had been conducive to carpogenic gennination in earlier trials at the site where
apothecia were produced in large numbers.
Compounds within the mulch leachates may have directly suppressed development of stipes
and apothecia, or they may have suppressed their development indirectly by increasing
mortality of sclerotia. At the end of the mulch treatment period (38 weeks), the total number
of sclerotia recovered from the soil averaged 83 sclerotialm2 for any mulch type, considerably
lower than the 365 sclerotialm2 found in untreated soil. This indicated that all of the tree
mulches enhanced the decay of soil-borne sclerotia equally, the effects independent of the
species of tree used in the mulch, and their different biochemical compositions.
This summation is contrary to the results obtained from the leachate assays, which evaluated
the effect of the leachates from each mulch type on mycelial growth from bisected sclerotia.
The leachates from the different tree species had different effects on mycelial growth. The
gum and kanuka leachates stimulated growth of C. camelliae mycelia from sclerotia, whereas
the commercial mix and the pine leachates caused a reduction in mycelial growth compared to
the controls. These effects were similar for the 1 and 20 d leachates. However, the numbers of
sclerotia that fonned from C. camelliae mycelia differed between leaching and incubation
periods, with only the gum leachate resulting in consistently higher numbers of sclerotia
fonned, and the commercial mix leachate resulting in consistently lower numbers of sclerotia
fonned.
The sterilisation treatments did not give consistent differences in fonnation of sclerotia. Both
the filter- and heat-sterilised leachates from the commercial mix inhibited mycelial
development, showing that heating to 121°C for 15 min did not denature the inhibitory
compounds in the leachates. Conversely, for gum and kanuka mulches, mycelial growth was
enhanced by both filter- and heat-sterilised 1 d leachates, but only the heat-sterilised 20 d
leachate. This suggested that the gum and kanuka leachates contained nutrients rather than
inhibitors, and that these nutrients were heat stable. Furthennore, the stimulatory growth
effects from the 20 d leachates were present only in the heat-sterilised leachate, but not
present when the leachate was passed through a filter membrane of 0.22 /lm pore size.
Therefore, the nutrient molecules were heat stable and might have been attached to particles
larger than 0.22 /lm or bound to the filters. Results for the pine leachates were different. For
the 1 d leachates, filter-sterilisation tended to stimulate growth of mycelia, although not
significantly, while heat-sterilisation inhibited it, with both treatments inhibiting sclerotial
fonnation. For the 20 d leachate the trend was reversed, with filter-sterilisation inhibiting
113

growth of mycelia and heat-sterilisation having no effect, and both treatments had no effect
on sclerotial formation. In the 20 d leachate, different inhibitors were present, ones that were
heat sensitive and able to pass through the 0.22 Ilm filter.
Overall, the commercial mix and pine mulches contained compounds in the 1 and 20 d
leachates that inhibited growth of mycelia and formation of sclerotia. Mori et al. (1997a) also
found the acetone extracts of the bark from 51 different deciduous tree species had weak anti
fungal activity against the sclerotial forming plant pathogens Rhizoctonia solani, and Botrytis
cinerea. The nutrient components of the leachates, particularly from the gum and kanuka,
while shown to stimulate mycelial growth from C. camelliae sclerotia, may also have a
similar effect on development of other microfauna. The environment in the soil amended by
the mulches directly above may have stimulated micro-parasitic activity in the soil against the
soil-borne sclerotia. Enhanced activity by microorganisms that were stimulated by the flush of
nutrients may explain the low numbers of sclerotia found in the soil of plots treated with the
mulches.
To stimulate microfauna to become antagonistic against C. camelliae sclerotia, the mulches
may need to be in a semi-decomposed state. Chung et al. (1988) found that fresh hardwood
bark, which was high in cellulosic substances, increased populations of antagonistic
Trichoderma spp. by up to 100 times in soil, but did not reduce activity of Rhizoctonia
damping-off fungi. Benhamou and Chet (1997) showed that under these circumstances,
transcription of the chitin-degrading enzymes (chitinase, B-l,3- and B-l,6-glucanases,
proteases, and lipases) of Trichoderma spp. was repressed in the presence of the more highly
favoured cellulosic substrate. As the concentration of readily available cellulose diminished
and the degree of saprophytic competitiveness was increased, the repression of gene
transcription in Trichoderma spp. was reversed, with the ability to parasitise R. solani being
re-established. In Poland, Kwasna et al. (2000) also found that populations of T. harzianum
had increased considerably in soil where 9 kg/m2 of pine sawdust had been allowed to
decompose for 2 years. Therefore, for tree mulches to harbour Trichoderma spp. active
against sclerotia of C. camelliae, they need to be partially composted.
The trial in Wellington might not have been continued long enough for the populations of
antagonists such as Trichoderma spp. to have built up sufficiently to be totally effective
against the sclerotia that were buried in the mulches. Although consolidation of the mulches
could have been due to their compaction during the 9 months of the trial, some of the
consolidation would have been due to decomposition of the mulch. Since Trichoderma
114

species pathogenic to C. camelliae sclerotia were shown to be present in soils near Wellington
(Section 3.2.3.2), it is most likely that such micro-antagonists were present in soil at the
mulch field trial. Over time, they might have colonised the tree mulches.
Soil fauna can enhance the direct effects of fungal antagonists on sclerotia, and tree mulches
have been reported to attract fauna such as fungus gnats to the blue-green algae growing on
the mulch surface (van Epenhuijsen et al. 2001). During the course of this field trial,
phytophagous fungus gnats appeared to be attracted to the site and were observed feeding on
sclerotia. The larvae of the endemic fungus gnat Mycetophila filicornis Tonnoir
(Mycetophilidae) were observed feeding on about 1% of C. camelliae apothecia (Plate 5.1.2).
Larvae were found to eat the asci, and so probably helped to provide some reduction in the
numbers of ascospores released. Fly larvae of the genus Lycoriella agraria Felt (Diptera:
Sciaridae), which are considered pests in mushroom farms, were observed eating the medulla
of C. camelliae sclerotia in the Wellington Botanic Gardens (Richard Toft pers. comm. 2001).
Although their effect on controlling camellia blight would be negligible, the combined effect
of these gnats and other phytophagous fly species that feed on sclerotia and are attracted to
the conducive environment provide by the tree mulches, may be significant.
Fungus gnats are known to assist fungal antagonists in parasitism of sclerotia. The
combination of the fungus gnat Bradysia coprophila and the Trichoderma hamatum isolate
TMCS-3 was more effective at degrading sclerotia and reducing sclerotial viability of S.
sclerotiorum than with either organism alone (Gracia-Garza et al. 1997b). The result was
similarly for T. viride isolate (Anas and Reeleder 1988). The predation of sclerotia of S.
sclerotinia by larvae of Bradysia sp. were positively correlated with high levels of organic
matter, with predation occurring between 0-90 mm soil depth (Anas and Reeleder 1987). The
increase in organic matter afforded by the 100 mm thick tree mulches may also have
stimulated the predation of C. camelliae sclerotia at the Wellington site.
It has been demonstrated in this study that covering soil under camellia bushes for 9 months
with any 100 mm thick mulch of either a commercial mix, or single tree species of gum,
kanuka or pine, resulted in total suppression of apothecia and a 77% reduction in numbers of
soil-borne sclerotia. All of these tree mulches provided excellent control of existing sclerotia,
and have potential for use in biocontrol strategies against camellia blight. However, the
mulches were expected to have little effect on the new generation of C. camellia sclerotia that
could develop in fallen flowers if they became infected from external sources of inoculum.
115

Repeated application of tree mulches after each annual flowering period might therefore be
needed for continued control of camellia blight.
An alternative strategy to repeated yearly applications of tree mulches is to amend the
mulches with saprophytic wood-rot fungi, which may result in degradation of surface
sclerotia. The approach of using white-rot fungi to assist in decomposition of woody mulches
was investigated in the following section.
116

5.2
5.2.1
Degradation of sclerotia in tree mulches amended
with wood-rot fungi
Introduction
Since the young sclerotia that had been seeded into the mulches were unaffected by them after
nine months, it was concluded that the tree mulches would be unable to affect the new
generation of C. camellia sclerotia that could develop in fallen flowers. To be more effective
in preventing development of C. camelliae sclerotia, it was considered necessary to widen the
properties of the tree mulches so that they were able to prevent their development or longevity
in the surface layers of the mulch. Irrespective of the size, shape and species of the sclerotia, it
is the rind that enables sclerotia to survive in many different environments over long periods.
Sclerotia of C. camelliae can survive in soils under camellia bushes for at least 4 years
(Baxter and Thomas 1995). Sclerotia of the closely related S. sclerotiorum were reported to
have survived in soil in Israel for up to 7 years (Ben-Yephet, et ai., 1993). Weakening the
protective rind of the sclerotia was considered crucial to reducing the ability of the sclerotia to
survive in the mulches. This could be achieved by extending the properties of the mulch to
include production of enzymes that break down the rinds of sclerotia.
5.2.1.1 Degradation of the protective rind
In the process of decomposing woody material, saprophytic white-rot fungi are known to
secrete lignolytic enzymes. These ligninases have recently been found to degrade melanin, the
main compound in the protective rind of the sclerotia (Butler and Day 1998a). Ligninases
have also been shown to cause extensive destruction of melanised cells of the black yeast
Phaeococcomyces sp. (Butler and Day 1998b).
Melanins are black macromolecules composed of various types of phenolic or indolic
monomers, usually complexed with proteins and carbohydrates (Butler and Day 1998a). The
most common melanin in sclerotia is formed in fungal hyphae via the pentaketide synthesis
pathway through alternating pairs of reduction and dehydration reactions beginning with a
1,3,6,8-tetrahydroxy-naphthalene monomer, and finally forming 1,8 dihydroxy-naphthalene
(DHN), the melanin polymer (Hopwood and Sherman 1990). Melanins are further defined by
their physical characteristics of being insoluble in cold or boiling water and organic solvents,
resistant to degradation by hot or cold concentrated acids, and to bleaching by oxidising
117

agents such as hydrogen peroxide and chlorine, as well as solubilisation and degradation by
hot alkali solutions. When melanin is complexed with chitin of fungal walls, it can inhibit the
activity of polysaccharases (Bull, 1970), and therefore gives increased protection against
enzymes of C. camelliae itself and any other antagonists. The black melanin pigment
therefore gives the healthy sclerotia their colour and protection against microbial attack. If the
melanin within the rind is damaged, sclerotia can become susceptible to microbial attack. For
example, in an aberrant strain of S. sclerotiorum, the tan sclerotia which contained only a
trace of rind melanin had low levels of survival in soil, and were highly susceptible to
infection by the hyperparasite Coniothyrium minitans, compared to black sclerotia of normal
strains (Huang 1983). Musavi et al. (1991) also showed that sclerotia of Botrytis cinerea were
rendered more susceptible to degradation by moulds and mycophilic fungi when treated with
tricyclazole, a compound known to disrupt production of fungal melanin.
Melanin and lignin are heterogeneous polyphenolic polymers with similar biochemical
structures, and both compounds are susceptible to ligninases (Butler and Day 1998b).
Therefore, ligninases secreted by the white-rot fungi that come in contact with the sclerotia in
the amended mulches may also break down the protective melanins in the sclerotial rind, and
expose the sclerotial medulla to microbial degradation. Inclusion of white-rot fungi in the tree
mulches may improve their efficacy, such that they are able to prevent development of
sclerotia and apothecia, thereby providing long-term control of camellia blight.
5.2.1.2 White-rot fungi
White-rot fungi occur within both the Ascomycota and the Basidiomycota, but those of the
Basidiomycete group degrade lignin to carbon dioxide and water more extensively and
rapidly than any other known group of organisms (Cullen 1997). Once the mycelium of
white-rot fungi has penetrated the lumen of a cell, it causes a progressive thinning of the
woody cell walls. The process starts with the innermost S3 layer and continues outwards
through the S2 and SI secondary wall layers to the thin primary wall of loosely arranged
microfibrils, and into the middle lamella between adjacent cells. Because white-rot fungi
utilise nitrogen efficiently, this enables them to grow on media that contains as little as 0.2%
nitrogen (Levi and Cowling 1969), such as in woody materials which are low in nitrogen and
rich in carbon.
The term 'lignin' refers to a range of complex polymers, which are composed of
phenylpropane units (six carbon rings with three-carbon side chains) that are bonded to one
118

another in vanous ways. These polymers can be degraded completely by the enzymes
produced by white-rot fungi, some of which catalyse the cleavage of the aromatic rings, and
others act as oxidants. The enzymes simultaneously degrade cellulose, hemicelluloses and
lignin, so the wood becomes white as it decays. Four classes of extracellular enzymes have
been implicated in lignin degradation; lignin peroxidases, manganese peroxidases, laccases
which reduce molecular oxygen to water and oxidise phenolic compounds, and glyoxal
oxidase which generates hydrogen peroxide (H202) (Cullen 1997). The process is described in
Deacon (1997). Laccase initiates ring cleavage by catalysing the addition of a second
hydroxyl group to phenolic compounds, opening the ring between two adjacent carbon atoms
that bear the hydroxyl groups. A number of enzymes then generate or transfer oxidants.
Glucose oxidase generates H20 2 from glucose. Manganese peroxidase oxidises manganese
(II) to manganese (III), which can then oxidise organic molecules. Ligninase (lignin
peroxidase) catalyses the transfer of singlet oxygen from H20 2 to aromatic rings and is one of
the main initiators of attack on the lignin framework. These initial oxidations involving single
electron transfer set off a chain of chemical oxidations. Because lignin degradation requires a
supply of oxygen, it does not occur in waterlogged or anaerobic conditions.
White-rot fungi have been used extensively in bio-remediation programmes to assist in
degrading wood wastes. They have demonstrated a wide variation in their ability to degrade
woody materials. In a trial using seven different white-rot fungi, Chang et al. (1999) found
that Trametes versicolor [Corio Ius versicolor] could not degrade the seven timber species
used in the trial, while the other six fungi tested either caused partial degradation of some
timber species, or complete degradation of all timbers.
In this study, a number of isolates from a range of white-rot genera were screened for their
effect in degrading sclerotia of C. camelliae. They were selected from a collection of white
rot fungi held at HortResearch Ltd, Lincoln, for their observed characteristics of rapid growth
on malt extract agar and from their reported lignin-degrading activity, properties that were
considered suitable for efficient destruction of sclerotial rinds. A number of unidentified
isolates of white-rot fungi were assessed, in addition to those species and genera described
below.
5.2.1.2.1 Genera and species tested in assays
Ganoderma applanatum, when grown on natural fibres and plant cell wall debris, can
produce a rich mixture of enzymes that have high protoplasting and maceration ability to
119

degrade soluble cellulose and various types of oligo- and polysaccharides (Leal et al. 1994),
as well as micro-crystalline cellulose (Highley 1973).
Phanerochaete spp. includes the species P. chrysosporium, which is the best known producer
of ligninases (Lei sola et al. 1988). Since this particular species has not been found in New
Zealand, a related species Phanerochaete cordylines was evaluated in this project.
Pycnoporus coccineus, when grown on Eucalyptus grandis wood chips, produces hydrolytic
and ligninolytic enzymes capable of degrading lignin at a similar rate to other white-rot fungi
that are known to be aggressive saprophytes of dead wood (Machuca and Ferraz 2001).
Peniophora sacrata is found in most parts of New Zealand north of Otago on many exotic
trees, particularly pines, and native trees and shrubs. It either attacks or progressively destroys
the roots of a host plant to form root cankers, or it directly invades the stem of the host plant,
causing death in most seedling trees it infects. However, the disease is not considered to be of
significant economic importance in New Zealand, and control is not considered necessary
(Dick 1983). Therefore this species was included in the initial screens.
Schizophyllum commune has been reported to be a destructive mycoparasite of several
phyto-pathogenic fungi. Its hyphae can coil around and penetrate host hyphae and fruiting
structures, by either unspecialised hyphae or by penetration pegs that develop from terminal
appressoria, which then develop into trophic hyphae inside the host cells (Tzean and Estey
1978). S. commune was also reported to be a parasite of the sclerotial pathogen Rhizoctonia
solani, secreting endo-beta-l,3( 4)-glucanase and cellulase to hydrolyse cell walls of the host
(Chiu and Tzean 1995).
Phlebiopsis gigantea and Junghuhnia spp. are saprophytes. Iakovlev and Stenlid (2000)
reported that P. gigantea and J. collabens secreted extracellular laccase from mycelia which
was interacting with known sclerotial antagonists on wood, particularly in ,the late stages of
wood decay. The production of extracellular ligninases by these white-rot fungi, in response
to known antagonists of sclerotia such as Trichoderma spp., could have potential in
accelerating decay of sclerotia of C. camelliae embedded in tree mulches. P. gigantea has
been used to quickly degrade stumps, in order to restrict the spread of root rot
(Heterobasidion annosum) during tree thinning in Swedish coniferous forests during the
summer (Westlund and Nohrstedt 2000). In this study, another species of Junghuhnia, J.
vineta, was evaluated.
120
5.2.1.3 Brown-rot fungi
Brown-rot fungi degrade cellulose by the oxidation of hemicelluloses by producing H202,
which diffuses through woody cell walls, causing a generalised decay and leaving the brown
lignin intact. They produce a range of enzymes different to those of white-rot fungi, and do
not produce ligninases. Two species of brown-rot fungi were evaluated for their ability to
degrade the biochemical compounds, other than melanin, in the rind.
Gloeophyllum sepiarium is a polypore fungus found in decaying conifer softwoods and
mahogany hardwoods, able to degrade cellulose, but not lignin, by producing laccase (Ejechi
et at. 1996).
Tyromyces palustris has been shown to secrete a range of cellulases different to those
reported previously (Hishida et at. 1997), and has also demonstrated glyoxylate oxidase
activity (Akamatsu and Shimada 1995).
5.2.1.4 Experimental approach
The assays used aimed to test the principle that bark mulches amended with the white- or
brown-rot fungi, collectively called wood-rot fungi, could break down sclerotial rinds
exposing the medulla and making the sclerotia susceptible to microbial degradation. Since it
was not known whether the fungi used were pathogenic on camellia bushes or other amenity
shrubs, the assessments were conducted in vitro.
Three inoculation methods were used to evaluate the isolates of wood-rot fungi for their
ability to directly degrade sclerotia or to enhance degradation of sclerotia by other
microorganisms. In the first assay, pine sawdust impregnated with the wood-rot fungi was
spread onto the surface of sclerotia-infested soil, with and without additional nitrogen. The
aim was to determine whether the lignolytic enzymes secreted by the wood-rot fungi to
degrade the sawdust, could improve the activity of the soil-borne microbes in degrading the
sclerotia, and whether the microbial activity could be enhanced with nitrogen. In the second
assay, malt extract agar plugs, previously colonised by wood-rot fungi, were placed onto non
sterile pine sawdust containing sclerotia, to assess a relatively simple method for introducing
wood-rot fungi under field conditions. In the third assay, a mix of rye flour and pine sawdust
was sterilised and colonised by the wood-rot isolates before sclerotia were added. The fourth
assay investigated some mechanisms by which selected white-rot isolates might have caused
sclerotial decay.
121
5.2.2 Methods
5.2.2.1 Assays
5.2.2.1.1 Assay 1 - Sawdust/rye flour mix amended with wood-rot fungi on soil
Soil to a depth of 50 nun was collected on 21 May 2001 from under 10 year-old Camellia
japonica trees that had a very minor infestation of camellia blight in 2000. To remove any
sclerotia, the soil was screened through a 4 nun sieve. To encourage microbial activity, the
moisture content of the soil was maintained at 80% of field capacity. The soil moisture
content (water weight/wet soil weight), was determined by drying six samples of
approximately 9 g for 48 h at 160°C, to be 47% (SEM = 2.0), and gravimetric moisture
content (water weight/dry soil weight) was 87% (SEM = 7.0). Field capacity of the moist soil
was measured by the tension method, using a Buchner funnel connected to a hanging water
column (Cameron and Buchan, 2002). Field capacity of the moist soil was 7.7 mLl100 g soil,
as determined by recording the average duplicate volume of water in 100 g samples of
saturated soil by 4 h suction at 0.1 bar. Aliquots of 50 g (116 mL) of the friable organic soil
were then placed into 20 nun deep Petri dishes that had an internal diameter of 84 nun.
C. camelliae sclerotia, collected from 89 Aorangi St, Bryndwr, Christchurch on 20 May 2001,
were washed under tap water, sorted into large, medium and small sizes, air-dried, and
weighed. Sclerotia averaged 702 (SEM = 10.5), 360 (SEM = 6.1) and 147 (SEM = 3.5) mg
for the three sizes, respectively. Soil dishes were set up by inserting five sclerotia of one size
into the soil of each dish, equidistant from one another and 10 mm in from the edge, with one
in the centre. The dishes were shaken for las on a laboratory orbital vibrator set on high to
ensure that the soil came in contact with, and covered, each sclerotium. After inoculation of
the soil, 10 mL of RO water was dribbled evenly over the soil in each Petri dish. Urea (46%
N) was added to half the number of dishes in the irrigation water at a rate equivalent to 100 kg
Nlha (120 mg urea/dish).
The wood-rot isolates, obtained from HortResearch, Christchurch (Table 5.2.1), were
subcultured from the original cultures onto malt extract agar (MEA) and incubated at 20°C for
8 days. To stimulate lignolytic enzyme production, the isolates were transferred aseptically to
250 mL Duran bottles containing 200 mL of a 70/30 (v/v) pine sawdust/rye flour mix, which
had been saturated with 100 mL SDW. The sawdust had been sterilised twice at 121°C for 15
min prior to wetting. The cultures were incubated at 25°C for 21 d and allowed to form large
122
mats of white mycelial growth. On 25 May 2001, 11 mL of the sawdust/wood-rot isolate
culture was broken/up aseptically, and spread onto the top of the soil of each dish. The Petri
dish plots were covered with Petri dish lids and weighed.
The factorial design of the trial comprised an untreated control and the 15 white-rot fungal
isolates, with and without urea, for each of the three sizes of sclerotia. The treatments were
replicated three times. The treatments were arranged in randomised block design in a
Contherm incubator set at 22°C at 12 h diurnal light. Tap water was added weekly to each
dish to maintain the original weight. On 5 November 2001, after 23.4 weeks incubation, the
dishes were inspected for any white-rot mycelium remaining in the sawdust/rye flour mix.
Sclerotia were recovered from the soil by rinsing under tap water over a 4 mm sieve. They
were air-dried for 4 h at room temperature (20-25°C), examined for damage to the rind, and
assessed for viability using the I-kg probe compression test described in Chapter 2.
5.2.2.1.2 Assay 2 - non-sterile sawdust
The treatments were replicated six times and comprised an untreated control and 19 wood-rot
fungal isolates, obtained from HortResearch (Table 5.2.2). The isolates were subcultured from
the original cultures onto MEA, and incubated at 20°C for 8 d. Dry pine sawdust (15 g) was
added to 84 mm diameter Petri dishes that were 20 mm deep. The C. camelliae sclerotia were
collected from Wellington Botanic Gardens during January 2001, sorted to retain only
medium sized classes, and stored at 4°C until use. On 12 June 2001, five medium size
sclerotia were embedded in the sawdust equidistant from one another and 10 mm in from the
edge of the dish. Enough RO water (50 mL) was added to the sawdust just until free water
became visible. Five agar segments (15 x 15 mm) containing mycelium of a wood-rot isolate
were placed on the sawdust surface over the sclerotia in each dish. The dishes were arranged
in a randomised block design, and incubated at 20°C with a 12 h diurnal light regime. A
further 5 mL of RO water was added weekly to replace the water that had been lost to
evaporation. On 17 September 2001, after 13.9 weeks incubation, the sclerotia were recovered
from the soil by washing in tap water over a 4 mm sieve, and assessed for viability using the
I-kg probe compression test.
5.2.2.1.3 Assay 3 - sterile sawdust/rye flour mix
The treatments comprised an untreated control and 19 wood-rot fungal isolates as in Assay 2.
The isolates were subcultured from the original cultures onto MEA, incubated at 20°C for 8 d.
123
Pine sawdust amended 4:1 (v/v) with rye flour was sterilised by heating to 121 °C for 15 min
on 3 consecutive days. The sawdust mix was aseptically transferred in 20 g aliquots to the 84
mm diameter sterile Petri dishes 20 mm deep, and moistened with 50 mL of SDW. On 5 July
2001, five agar segments (15 x 15 mm) containing mycelium of a wood-rot isolate, were
placed on the sawdust surface in each dish, and the fungi incubated for 3 weeks at 20°C with
a 12 h diurnal light regime.
C. camelliae sclerotia that had been collected from Wellington Botanical Gardens, rinsed
under tap water and stored at 4°C since January 2001. Prior to use in the trial, they were held
at room temp (20-24°C) for 14 d to allow for growth of microorganisms from the diseased
sclerotia, which were then discarded. On 25 July, six medium-sized firm and apparently
healthy sclerotia were inserted, equidistantly apart and 10 mm in from the edge, into the
established colonies of wood-rot fungi in each dish. In the untreated controls, six sclerotia
were inserted in the same manner into the sawdust/rye flour mix in each dish. To evaluate the
effects of the sawdust/rye flour mix alone (media control) on the sclerotia, another six
sclerotia were placed in a deep Petri dish containing 5 mL SDW only. The treatments were
replicated five times. The air-dried sclerotia averaged 416 (SEM = 6.9) mg, with each dish
containing a total of 2.5 (SEM = 0.04) g of sclerotia. The Petri dishes were sealed with cling
film and incubated for 16 weeks at 20°C, 12 h diurnal light. On 14-Nov-Ol, after 16 weeks
incubation, the sclerotia were removed from the sawdust, and assessed for the number of
sclerotia parasitised with fungal contaminants, and those that were firm and viable as
determined by the I-kg probe compression test. The sawdust/rye flour mix was scored
visually for colonisation by wood-rot isolates on a scale of 0 (no growth) to 1 0 (complete
colonisation by mycelium). The fungi most commonly isolated from the visibly contaminated
and decaying sclerotia were identified to genus or species level by Dr Ian Harvey.
5.2.2.1.4 Assay 4 - mechanism of sclerotial decay
Trial design. A multi-factorial assay of either natural or surface-sterilised sclerotia,
embedded in either sand or sawdust, with or without four isolates of white-rot fungi, in the
presence or absence of microorganisms isolated from decaying fungi, was conducted to
investigate the mechanisms for sclerotial decay. The presence or absence of surface
sterilisation allowed for investigation of the effects of any microbes that were embedded in
the rind of sclerotia on sclerotial decay in the presence of white-rot fungi. The white-rot
isolates Phanerochaete cordylines WR268 (LU900), Pycnoporus coccineus WR380, WR377
and WR378 were selected from Assay 3 for their fast rate of sawdust colonisation and higher
124
than average ability to kill sclerotia. The white-rot isolates were placed in direct contact with
the sclerotia embedded in either sterile sand or sawdust to evaluate whether the fungi could
parasite the sclerotia directly, or whether the sawdust was required to stimulate production of
enzymes that could degrade the rind. The effect of microbial contaminants on sclerotial decay
was also determined by including inoculum of a mix of either 10 isolates of Trichoderma spp.
or 10 isolates of bacteria that had been recovered from diseased sclerotia of C. camelliae.
These microorganisms were included as a treatment to ascertain whether additional
microorganisms, which were associated with decaying sclerotia, could be added to the media
to enhance sclerotial decay in the presence or absence of the white-rot fungi. The factors are
summarised as:
• Sclerotial surface - non-sterilised and surface sterilised,
• Media - sand and sawdust,
• White-rot - none, WR268, WR377, WR378, and WR380,
• Antagonists - none, Trichoderma spp. and bacteria.
The treatments were replicated five times in a replicated block design.
Treatment application. Medium-sized (416 mg, SEM = 6.9) sclerotia were rinsed in tap
water to remove adhering debris, and randomly allocated to two groups. One group of
sclerotia was untreated and therefore contained rinds with natural levels of micro
contaminants, while the other group was surface-sterilised to eliminate micro-contaminants in
the rind. These sclerotia were washed twice in 13.5% NaOCI for 3 min followed by three
rinses of SDW containing 0.4 mLiI Tween 80, and were then immersed in 20 ppm
streptomycin, 40 ppm aureomycin and 250 ppm ampicillin for 5 min. The air-dried sclerotia
weighed an average of 420 mg (SEM = 7). The four white-rot fungi were subcultured onto
MEA (Difco) and incubated for 14 d at 20°C, 12 h diurnal light regime, until transfer to the
prepared media.
Silica sand was sterilised in a 160°C oven for 3 d. Sterile, deep 84 mm diameter Petri dishes
were filled with 80 g (55 mL) of the dry sterile sand in a laminar flow cabinet. The six I
sclerotia were inserted, equidistant from one another, into the sand medium in each dish.
SDW (20 mL) was added until the sand appeared saturated just at the point at which free
water was visible. The cultured mycelial mats containing the white-rot fungi were cut into
segments 1 x 1 cm, and a segment was placed directly onto each sclerotium in the dishes. The
dishes were held at room temperature for 1 d until application of the antagonists.
125

Fine pine sawdust (passed through a 4 mm sieve) was amended 4:1 (v/v) with rye flour
(20%). The proportion of sawdust to rye flour in the mix was increased from that in the
previous assays, in order to stimulate the white-rot fungi to produce ligninases. The mix was
sterilised twice at 121°C for 15 min on 2 consecutive days, and on the third day at 121°C for
30 min. Sterile, deep 84 mm diameter Petri dishes were each filled with 40 g (111 mL) of the
mix, in a laminar flow cabinet. As for the sand medium, the six sclerotia were inserted,
equidistant from one another, into the dry mix medium in each dish. SDW (40 mL) was added
until the mix appeared saturated just at the point at which free water was visible. Six segments
(1 x 1 cm) of the white-rot mycelium from each isolate were placed directly on the surface of
the sawdust/rye flour mix. The Petri dishes were sealed with food-grade cling film, and
incubated for 2 weeks at 20°C and 12 h diurnal light regime, to enable the white-rot isolates
to colonise the sclerotia and medium, in preparation for the application of the antagonists.
The potential antagonist microorganisms comprised 10 morphologically distinct isolates of
Trichoderma and 10 of bacteria, which had been extracted from decaying C. camelliae
sclerotia, and cultured on PDA (Oxoid) for 3 weeks. The Trichoderma sp. comprised isolates
WR380.1I3, WR31.211, WR54.2/1, WR95a12, WRI62.7/4, WR104b.1/3, WR95a.3l2,
WR95a.1/4, WR60.2/4, and WRI04b.2/3. Equal amounts of these isolates were added to a
suspension. It contained 2.6 x 10⁷ viable spores/mL as determined by serial dilution and
plating on PDA. The bacteria comprised isolates WR380.5/4, Gs5.1I3, WR382.1I3,
WR378.3/2, WRI22d.4/2, PgI04/3, WR382.1/4, WRI62.6/4, WR162.111 and Sc3.3/5. Equal
proportions of these" isolates were mixed in suspension. It contained a total of 2.4 x 10⁸
cells/mL as determined by serial dilution and plating on NA. For dishes allocated treatment
with the microorganisms, 2 mL of either the Trichoderma or bacterial suspensions was poured
onto the surface of the medium.
Enough water (40 mL) was added to each of the dishes so that they could be incubated for the
full duration of the experiment (11 weeks) without replenishment, to limit contamination
between treatments caused by opening the sealed lids for watering. The trial was set up on 11
January 2002. The Petri dishes were sealed with plastic wrap, and placed in a Contherm
incubator in accordance with the randomised blocking structure of the assay, to commence
incubation at 20°C with a 12 h diurnal light regime.
Measurements. The proportions of the sclerotia and the media covered by mycelium of the
white-rot isolates, and viability of sclerotia as determined using the I-kg probe compression
test, were assessed after incubation for 7 and 11 weeks. At the first assessment, sclerotial
126

viability was assessed on each sclerotium while they remained in the dish. The dishes were
placed on a tared Mettler PE3600 balance within a laminar flow cabinet, the lids ofthe dishes
were then removed, and the six sclerotia assessed for viability. The probe used in the viability
test was heat sterilised by holding in a flame until the tip became red, and cooled between
assessment of individual sclerotia. In the final assessment, sclerotia were rinsed under a jet of
tap water over a 4 mm sieve to remove adhering soil. Sclerotia that disintegrated and passed
through the mesh were recorded as not viable. Viability of the remaining sclerotia was
assessed by the I-kg compression test. The sawdust medium was scored visually for white-rot
and other fungi on a scale of 0 (no growth) to 10 (complete colonisation by mycelium).
5.2.2.2 Melaninase activity of white-rot fungi
The method of Butler and Day (1998b) was used to test for production of melaninases. A
melanin suspension was made by adding 500 mg L-3,4-dihydroxyphenylanalanine (DOPA)
melanin (Sigma Chemical Co. USA) and 125 mg KOH to 100 mL RO water and allowing it
to steep for 18 h at 37°C (Appendix 1). The dense brown-black melanin solution that formed
was rinsed by dialysing in dialysis tubing, Membra-cell with a 12-14000 nominal molecular
weight cut off (Gen Lab Supplies, Australia), for 4 h in two changes of 1000 mL RO water, at
room temperature (20-25°C). This rinsed melanin solution was diluted 1: lOin 2% agar,
sterilised at 121°C for 15 min, and poured to 5 mm thick into 90 mm diameter Petri dishes.
The candidate white-rot isolates were incubated in the sterile sawdust/rye flour medium for 14
d at room temperature (20-25°C) until they had established. For each, a 2 g segment cut from
the actively growing part of the white-rot mycelium (with adhering sawdust) was placed in
the centre of the melanin agar, and the plates were incubated for 37°C. After 4 d, the
undersides of the agar plates were inspected for the presence of white zones in the agar
around the mycelial mats. The white zones indicated oxidation of DOPA melanin due to
melaninases. If the agar remained black, this indicated that no oxidation had occurred and,
therefore no melaninases had been secreted. Although DOPA melanins originate from
mammals and contain nitrogen, unlike the fungal DHN melanins that do not, this test was
reported to be a reliable indicator ofmelaninase production (Butler and Day 1998b). The test
was replicated four times for each isolate.
5.2.2.3 Microscopic examination of sclerotial sections
Transmission electron microscopy (TEM) and light microscopy techniques were used to
examine characteristics of the rind from six C. camelliae sclerotia that had been incubated for
127

3 months in sawdust, alone or in sawdust amended with selected white-rot isolates. Manfred
Ingerfeld, University of Canterbury, prepared the sclerotia for examination.
5.2.2.3.1 TEM
Six sclerotia recovered from each of the sawdust alone, and sawdust amended with isolates
WR378, WR268 and Sc3, were fixed in a primary fixative of 3% glutaraldehyde/0.075M
phosphate buffer (v/v) (97% S6rensons buffer) for 3 h (Hayat 1981). They were then washed
three times for 10 min each in 0.075 M phosphate buffer, and post fixed in 1 % osmium
tetroxide/0.075M phosphate buffer (v/v) for 3 h, followed by another 10 min wash in the
phosphate buffer. The specimens were dehydrated for 10 min each in 20, 40, 60 and 80%
acetone/water solutions, followed by three rinses in 100% acetone for 10 min. They were then
infiltrated by soaking in 25% Spurr's Low Viscosity embedding resin in acetone for 2 hand
75% Spurr's resin/acetone for 12 h, and finally embedded in 100% Spurr's resin. Sections of
the sclerotia were cut using an ultra microtome LKB 2128 Ultratome, stained in 50% uranyl
acetate/ethanol and lead citrate (Sato 1967 in Hayat 1981), and assessed using a Jeol Jem
1200EX transmission electron microscope operated at 80 kV.
5.2.2.3.2 Light microscopy
Six sclerotia recovered from the sawdust and sawdust amended with isolates WR31, WR268,
WR378 and WR380 were fixed in 3% glutaraldehyde/0.075M phosphate buffer (v/v) for 3 h,
and dehydrated for 10 min each in 20, 40, 60, 80 and 100% ethanol (Hayat 1981). The
specimens were then embedded in JB 4 resin, sectioned, and stained in a solution containing
0.1 % toluidine blue and 0.1 % borax. Toluidine blue was used to stain for the presence of
metachromatic granules and phenolic compounds (Feder and O'Brian 1968), the latter of
which comprises melanin. Mounted sections were examined and photographed at up to 400 x
magnification using a Leica DM-IRB microscope in bright field or phase contrast modes.
5.2.2.4 Statistical analysis
Data were analysed using GenStat Release 4.22 (Fifth Edition). The proportions of non-viable
and parasitised sclerotia were analysed by generalised linear model with a binomiallogit link.
Results were presented as mean percentages, followed by low and high 95% confidence limits
in parentheses. Scores of colonisation of the substrates by the wood-rot fungi were analysed
by analysis of variance. The relationship between sclerotial viability and colonisation of the
128

media was analysed by linear regression. Treatment means were compared at P=O.05 using
Fisher's LSD test.
5.2.3 Results
5.2.3.1 Assays
5.2.3.1.1 Assay 1 - Sawdust/rye flour mix amended with wood-rot fungi on soil
After 23.4 weeks, mycelium was visible in only the dishes inoculated with white-rot isolates
WR377, WR380, and WR268. Of these three isolates, WR268 appeared the most aggressive
coloniser of the sawdust/rye flour mix (Plate 5.2.1). For the other isolates, mycelium was
observed for only the first 2 months. For none of the wood-rot fungi was there any evidence
that the mycelium present in the sawdust had colonised the soil.
Treatment with white-rot isolates affected the proportion of viable sclerotia recovered,
irrespective of the size of the sclerotia (P>O.05). The proportion of sclerotia recovered was
lowest for isolate WR268, which was 74 (63-84)%, compared with 86 (75-92)% for the
untreated control (Table 5.2.1). Urea had no significant (P>O.05) effect on the proportion of
viable sclerotia recovered, irrespective of sclerotial size, as the interaction between white-rot
isolates and nitrogen was not significant.
129

Table 5.2.1: Assay 1 - effect of wood-rot isolates inoculated into the upper layer containing the
sawdusUrye flour mix, on percentage of viable sclerotia after 23 weeks in the lower soil layer.
Effects averaged over all sclerotial sizes and nitrogen treatments.
Isolate Species % viable sclerotia Untreated control 86 (75-92)1
WR104b Tyromyces sericeomollis 92 (83-97) WR122c Junghuhnia vineta 88 (77-94) WR122d Junghuhnia vineta 79 (67-87) WR162 Peniophora sacrata 82 (71-90) WR268 Phanerochaete cordylines 74 (63-84) WR31 Unidentified species 86 (75-92) WR377 Unidentified species 87 (76-93) WR378 Unidentified species 86 (75-92) WR380 Pycnoporus coccineus 89 (79-95) WR381 Unidentified species 90 (80-95) WR382 Unidentified species 87 (76-93) WR54 Unidentified species 94 (86-98) WR60 Unidentified species 89 (79-95) WR86 Tyromyces sp. 94 (86-98) WR95a Ganoderma applanatum 90 (80-95) 1 95% confidence limits in brackets.
5.2.3.1.2 Assay 2 - non-sterile sawdust
Inoculation with colony segments did not result in colonisation of non-sterile sawdust by any
of the white-rot isolates. These treatments caused no significant effects on the sclerotia
embedded in the sawdust for almost 14 weeks, with 99 (98-99)% being recovered and viable
cf 100% in the untreated controls, after almost 14 weeks incubation. The wood-rot fungi did
not establish in non-sterile sawdust without amendment with rye flour. Therefore, in the
subsequent assays, the wood-rot fungi were established in sterile sawdust/rye flour medium.
5.2.3.1.3 Assay 3 - sterile sawdust/rye flour mix
After 16 weeks of incubation, the sclerotia in many of the dishes treated with the isolates had
become very soft and so were considered non-viable, although there was no significant
difference (P=0.794) between isolates in the proportion of soft, apparently parasitised
sclerotia. Averaged overall, the isolates did cause a significant (P=O. 0 13) reduction in
sclerotial viability compared to the controls. The proportion of soft, non-viable sclerotia was
0% for the water control and 13% for the sawdust control, compared with 49 (41-57)%, which
was the average of all isolates (Table 5.2.2). The proportion of sclerotia which were visibly
. parasitised with sporulating contaminant fungi, some of which were firm, was 0% for the
130

water control and 30% for the sawdust control, compared with 52 (43-61)% for the average of
all wood-rot isolates.
Table 5.2.2: Assay 3 - percentage of soft (non-viable) and parasitised sclerotia after 16 weeks
incubation in sawdusUrye flour mix colonised by wood-rot fungi. The wood-rot isolates are ranked
for their scores (0 = none; 10 = complete infestation) of colonisation of sawdusUrye flour mix.
Sclerotia % Substrate Treatment Soft Parasitised colonisation score Controls Water 0 (-/ 0 (-) 0.0
Sawdust 13 (2-60) 30 (7-72) 0.0
WR268 Phanerochaete cordylines 77 (28-91) 13 . (1-63) 9.6 WR122c Junghuhnia vineta 13 (2-60) 13 (1-63) 6.8 WR122d Junghuhnia vineta 53 (19-85) 73 (30-95) 5.4 WR31 Unidentified fungi 60 (23-88) 60 (22-86) 5.0 WR377 Unidentified fungi 50 (17-83) 63 (24-91) 5.0 WR382 Unidentified fungi 50 (17-83) 60 (22-89) 5.0 WR381 Unidentified fungi 47 (15-81) 47 (14-82) 4.8 WR380 Pycnoporus coccineus 60 (23-88) 63 (24-91) 4.6 Sc3 Schizophyllum commune 60 (33-88) 60 (22-89) 4.0 WR95a Ganoderma applanatum 43 (14-79) 50 (16-84) 4.0 Pg104 Phlebiopsis gigantea 37 (10-75) 50 (16-84) 3.6 WR54 Unidentified fungi 47 (15-81) 53 (18-86) 2.8 WR386 Unidentified fungi 50 (17-83) 47 (14-82) 2.6 Gs5 Gloeophyllum sepiarium 37 (10-75) 47 (14-82) 2.6 WR104b Tyromyces sericeomollis 57 (21-86) 67 (26-92) 2.2 WR378 Unidentified fungi 77 (28-91) 67 (26-92) 2.0 WR86 Tyromyces sp. 37 (10-75) 33 (8-74) 1.6 WR60 Unidentified fungi 57 (21-86) 70 (28-93) 1.4 WR162 Peniophora sacrata 43 (14-79) 50 (16-84) 1.4
LSD(o.05} 2.8 I 95% confidence limits in brackets (cannot be calculated).
The unidentified white-rot fungus WR378 and P. cordylines WR268 resulted in the greatest
reduction in the proportion of firm sclerotia (77%), yet with WR268, only 13% of the
sclerotia were visibly parasitised. The incidence of viable sclerotia in plots treated with the
brown-rot fungi G. sepiarium GS5 and Tyromyces sp. WR86 was not significantly different to
that in plots treated with white-rot isolates, yet their colonisation of the sawdust/rye flour mix
was significantly less than for P. cordylines WR268 (Plate 5.2.2) and J. vineta WR122c,
which exhibited the highest levels of colonisation. There was no significant linear relationship
(P = 0.20) between the proportion of soft non-viable sclerotia and scores of wood-rot fungi
colonisation of the sawdust.
131

Plate 5.2.1: Assay 1 - colonisation of Phanerochaete cordylines WR268 in sawdust on soil.
Plate 5.2.2: C. camelliae sclerotia embedded in sawdust amended with Tyromyces sericeomollis
WR104b (left) and in sawdust amended with Phanerochaete cordylines WR268 (right) .
132
The fungi most commonly isolated from the visibly contaminated and decaying sclerotia were
Aspergillus niger, Clonostachys rosea, Doratomyces stemonitis, Fusarium sp., Fusarium
solani, Humicola juscoatra, Mortierella sp. Paecilomyces elegans, Pestalotiopsis sp.,
Phialocephala sp., Phialophora sp., Trichoderma koningii, T. harzianum, T. viride and
Verticillium sp.
Four of the white-rot isolates, P. cordylines WR268, P. coccineus WR380, WR377 and
WR378, were selected from the other potential candidates for further evaluation in Assay 4,
based on their ability to colonise the sawdust mix and degrade sclerotia.
5.2.3.1.4 Assay 4 - mechanisms of sclerotial decay
Colonisation of sclerotia by white-rot isolates. At both sampling times, there was a similar
(P>0.05) level of colonisation of sclerotia by the white-rot isolates, and so the treatment
means calculated over both assessments are presented. The amount of white-rot mycelia that
came into contact with the sclerotial rind was dependent on the interaction (P=0.005) between
the factors of medium, white-rot isolate and sclerotial surface-sterilisation. Overall, greater
amounts of mycelia come into contact with sclerotia which were surface-sterilised in both
sand and sawdust media, probably because removal of surface contaminants on the rind
increased white-rot mycelial colonisation on the sclerotial surface (Table 5.2.3). Isolate
WR268 provided the greatest contact with sclerotia, on both media.
Table 5.2.3: Assay 4 - Amount of white-rot mycelium in contact with sclerotia, scored as 0 = no
cover, 10 = complete cover of sclerotia, showing effect of media, white-rot isolates and sclerotial
surface-sterilisation. Means are the average from both assessment times.
Medium
Sand
Sawdust
LSD(o.05)
White-rot fungi
WR268 WR377 WR378 WR380
WR268 WR377 WR378 WR380
Sclerotial surface Non-sterilised Surface-sterilised
2.5 6.5 0.3 4.8 0.3 4.2 0.9 3.1
9.6 4.9 6.4 5.7
1.3
9.9 7.0 7.3 8.7
133
~ - - -

Sclerotial viability - 7 week assessment. The significant main effects of the treatments were
expressed within the first 7 weeks of incubation (Table 5.2.4). The effect of medium acted
independently of surface-sterilisation (P=O.OOI) and white-rot isolate (P=O.OOI). The
variability between factors on viability of sclerotia was explained by the interaction of
surface-sterilisation, antagonist and white-rot fungi (P=O.009).
Main effect of media and white-rot isolates. The white-rot isolates did not affect sclerotial
mortality on sand, but in the sawdust/rye flour, the proportion of sclerotia that were killed was
significantly higher in those treated with all the white-rot isolates except WR377 (Table
5.2.4).
Table 5.2.4: Assay 4 - Main effect of media and efficacy of white-rot isolates on percent killed
sclerotia after 7 weeks incubation, averaged over antagonists.
White-rot isolate
None WR268 WR377 WR378 WR380 195% confidence limits.
Sand 48 (30-66)1 51 (33-68) 44 (28-63) 63 (45-79) 51 (33-68)
Medium Sawdust 17 (7-35) 82 (63-92) 43 (26-61) 66 (47-81) 59 (41-76)
Main effect of media and surface-sterilisation. Surface-sterilisation had a significant effect on
the proportion of sclerotia that were killed, resulting in 8 (4-15)% and 95 (89-98)% in sand,
and 46 (37-56)% and 60 (51-69)% in sawdust, for non-sterilised and surface-sterilised
sclerotia, respectively.
Main effects of surface-sterilisation, white-rot isolates and antagonists. The efficacy of the
white-rot isolates on non-sterile sclerotia was not affected by the addition of the antagonists
on non-sterilised sclerotia (Table 5.2.5). Surface-sterilisation resulted in high mortality of
sclerotia in the absence of antagonists, but the addition of Trichoderma sp. alone and bacteria
alone did not significantly increase the level of mortality. Sclerotial mortality for these
treatments was similar to those with white-rot fungi alone
134

Table 5.2.5: Assay 4 - Main effect of sclerotia I sterilisation treatments and inoculation with white-
rot isolates alone or in combination with Trichoderma sp. or bacteria, on percent sclerotia killed
after 7 weeks incubation.
Antagonist White- Sclerotial surface rot fungi Non-sterilised Surface sterilised
None None 5 (0-39) 57 (30-80) WR268 40 (18-67) 80 (51-94) WR377 20 (6-49) 58 (32-81) WR378 50 (25-75) 73 (45-90) WR380 7 (1-39) 93 (61-99)
Trichodenna sp. None 7 (1-39) 73 (45-90) WR268 38 (17-66) 100 (-) WR377 20 (6-49) 77 (48-92) WR378 30 (12-58) 100 (-) WR380 27 (10-55) 95 (61-100)
Bacteria None 7 (1-39) 45 (22-71) WR268 48 (24-73) 90 (60-98) WR377 48 (24-73) 38 (17-66) WR378 37 (16-64) 97 (58-100) WR380 25 (9-54) 87 (55-97)
195% confidence limits; (-) cannot be calculated.
Sclerotial parasitism - 11 weeks incubation. The trends observed at the 7 week assessment
continued until the 11 week assessment, the major difference being improved efficacy by the
white-rot isolates. The lowest order interaction between all factors was not significant (Table
5.2.6). The variability between factors was explained by interactions between factors of media
and surface-sterilisation (P<O.OOl), media and antagonist (P<O.OOl), media and white-rot
isolates (P<O.OOl), and antagonist and white-rot isolates (P=0.006). These combinations of
factors acted independently from one another.
Main effect of media and surface-sterilisation. For non-sterilised and surface-sterilised
sclerotia, the proportion of sclerotia killed was 8 (5-14)% and 98 (94-99)% in sand, and 71
(63-78)% and 84 (78-89)% in sawdust (Table 5.2.6).
l35

Table 5.2.6: Assay 4 - The effect of sclerotium sterilisation treatments and inoculation with white-
rot isolates, alone or in combination with Trichoderma sp. or bacteria added to the sand or
sawdust media on percent of sclerotia killed, after 11 weeks incubation.
Medium Antagonist White- Sclerotial surface rot fungi Non-sterilised Surface sterilised
Sand None None 0 (_)1 90 (61-98) WR268 13 (3-42) 100 (-) WR377 7 (1-38) 100 (-) WR378 30 (12-58) 100 (-) WR380 3 (0-40) 97 (60-100)
Trichoderma sp. None 3 (0-40) 100 (-) WR268 7 (1-38) 100 (-) WR377 13 (3-42) 100 (-) WR378 7 (1-38) 100 (-) WR380 3 (0-40) 100 (-)
Bacteria None 3 (0-40) 97 (60-100) WR268 17 (5-45) 100 (-) WR377 3 (0-40) 87 (58-97) WR378 13 (3-38) 100 (-) WR380 0 (-) 100 (-)
Sawdust None None 13 (3-42) 50 (26-74) WR268 80 (51-94) 100 (-) WR377 40 (18-66) 73 (45-90) WR378 93 (62-99) 97 (60-98) WR380 30 (12-58) 67 (39-86)
Trichoderma sp. None 77 (48-92) 60 (34-82) WR268 97 (55-100) 100 (-) WR377 100 (-) 93 (62-99) WR378 80 (51-94) 90 (61-98) WR380 87 (58-97) 100 (-)
Bacteria None 43 (21-69) 73 (45-90) WR268 83 (60-95) 100 (-) WR377 53 (28-77) 73 (45-90) WR378 87 (58-97) 100 (-) WR380 100 (-) 87 (58-97)
195% confidence limits; (-) cannot be calculated.
Main effect of media and antagonists. Sclerotial mortality was increased by the addition of
both the Trichoderma sp. and bacterial suspensions in sawdust/rye flour mix, but it was not
altered when the suspensions were applied to sand (Table 5.2.7).
136
Table 5.2.7: Assay 4 - Effect of antagonists and media on percent sclerotia killed, after 11 weeks
incubation.
Antagonists
None Trichoderma sp. Bacteria 195% confidence limits.
Sand 54 (40-67)1 53 (40-67) 52 (38-65)
Media Sawdust/rye flour
64 (50-76) 88 (76-95) 80 (50-76)
Main effect of media and white-rot isolate. The white-rot isolates were more effective at
killing sclerotia in sawdust/rye flour than on sand (Table 5.2.8), indicating that the isolates
were not parasitic on the sclerotia by themselves.
Table 5.2.8: Assay 4 - Main effect from media and white-rot on percent sclerotia killed after 11
weeks incubation.
White-rot isolate
None WR268 WR377 WR378 WR380 195% confidence limits.
Sand 49 (32-66)1 56 (39-72) 52 (35-68) 58 (41-74) 51 (34-67)
Media Sawdust/rye flour
53 (36-69) 93 (77-98) 72 (54-85) 91 (75-97) 78 (61-89)
Main effect of white-rot and antagonist. The addition of Trichoderma sp. tended to increase
the efficacy of the low performing white-rot isolates, whereas the addition of the bacterial
suspension had little effect on sclerotial mortality (Table 5.2.9).
Table 5.2.9: Assay 4 - Main effect of white-rot and antagonist on percent sclerotia killed after 11
weeks incubation.
White-rot isolates
None WR268 WR377 WR378 WR380 195% confidence limits.
None 38 (20-61)1 73 (50-88) 55 (33-75) 80 (57-92) 49 (28-70)
Antagonist Trichoderma sp.
60 (37-79) 76 (52-90) 77 (53-90) 69 (46-86) 72 (49-88)
Bacteria 54 (32-74) 75 (51-89) 54 (32-74) 75 (51-89) 72 (48-87)
Levels of sclerotial degradation by white-rot isolates in sawdust over both assessments.
Data from both assessments on viability of non-sterilised sclerotia in sawdust/rye flour
amended with white-rot isolates, with and without the microbial suspensions, were re-
137
calculated to present the overall means of the treatment effects on sclerotial viability at the
two assessment times (Table 5.2.10). The increases in efficacy between 7 and 11 week
incubation was similar (P<O.OOl) for all white-rot isolates. The proportion of sclerotia killed
increased from 46 (36-57)% after 7 weeks to 71 (60-80)% 4 weeks later. Over both
assessments, the proportion of killed sclerotia in sawdust/rye flour that contained no white-rot
fungi averaged 27 (15-44)%, whereas addition of isolates WR268 and WR378 significantly
increased the mortality to 85 (69-93)% and 69 (52-82)%, respectively.
The effect of the white-rot isolates on sclerotial mortality was independent of the effects from
the antagonists. However, the efficacy of the Trichoderma sp. and bacteria suspensions
differed between assessments (P=0.002). Averaged over all white-rot isolates, the proportion
of parasitised sclerotia in the control treatments after 7 and 11 week incubation increased
from 36 (21-55)% to 51 (34-69)%. In addition, the Trichoderma treatments caused increases
from 43 (27-62)% to 88 (71-96)%, and the bacteria treatments caused increases from 60 (42-
76)% to 73 (55-86)% between 7 and 11 weeks. Therefore, only addition of the mixed
Trichoderma isolates caused a reduction in viability of sclerotia. That this effect was more
than doubled between 7 and 11 weeks indicates the long period needed for effective
parasitism to take place. The extra level of control afforded by the bacteria suspension was
not considered significant.
Table 5.2.10: Assay 4 - Effect of white-rot isolates and antagonists in sawdusUrye flour on
percent non-sterilised sclerotia killed, after 7 and 11 weeks incubation.
Incubation Isolate Microorganism Average None Trichoderma sp. Bacteria
7 weeks None 7 (0-56)1 10 (1-55) 13 (2-56) 10 (2-33) WR268 77 (38-95) 77 (38-95) 97 (35-100) 83 (60-94) WR377 33 (10-70) 40 (13-74) 87 (44-98) 53 (32-74) WR378 53 (21-83) 40 (13-74) 60 (26-87) 51 (30-72) WR380 10 (1-55) 50 (19-81) 43 (15-77) 34 (17-57)
11 weeks None 13 (2-56)1 77 (38-77) 43 (15-77) 44 (25-66) WR268 80 (40-96) 97 (35-100) 83 (42-97) 87 (64-96) WR377 40 (13-74) 100 (-) 53 (21-83) 64 (42-82) WR378 93 (44-100) 80 (40-96) 87 (44-98) 88 (64-96) WR380 30 (8-67) 87 (44-98) 100 (-) 72 (49-88)
195% confidence limits; (-) unable to be calculated.
138

5.2.3.2 Evidence of melaninase production and sclerotial decay
Clear zones in the DOPA melanin medium indicated that isolates WR380 and WR268 had
secreted enzymes that oxidised the melanin (Plate 5.2.3). White oxidation zones did not
appear around the other isolates cultured on the medium.
The sclerotial sections observed under light microscopy (Plate 5.2.4), showed the rind and
medullary cells from the sclerotia embedded in sawdust alone were intact, while those
embedded in sawdust amended with white-rot fungi exhibited disintegration and colonisation
by bacteria.
TEM images of sclerotial sections revealed that the firm sclerotia that had been embedded in
sterilised sawdust contained cells free from microbial contaminants (Plate 5.2.5), whereas soft
sclerotia that had been embedded in sawdust amended with the white-rot fungal isolates,
contained fungal hyphae and bacteria in both the rind and medullary cells. Sclerotia
associated with white-rot isolate WR378 appeared to have little melanin remaining in the rind.
5.2.4 Discussion
These four assays demonstrated a number of features inherent in the use of wood-rot fungi for
control of C. camelliae sclerotia. In Assay 1, the addition of nitrogen to the soil did not
facilitate the efficacy of the wood-rot isolates applied to the soil surface in the sawdust/rye
flour mix. Also, the wood-rot isolates inoculated onto the soil remained confined to the
sawdust/rye flour mix and did not migrate into the adjacent soil. This implied that for the
sclerotia to come in contact with the wood-rot mycelium, they needed to be embedded in the
sawdust. The wood-rot isolates may not have colonised the soil while all their nutrient
requirements were contained in the sawdust/rye flour mix, or alternatively, antagonistic or
highly competitive microorganisms in the soil environment may have inhibited them. Greaves
(1972) showed that a mixed population of Trichoderma album, Fusarium solani, Penicillium
decumbens, Cladosporium hordei, Bacillus mycoides and a Streptomyces sp. introduced into
soil in a plantation of Eucalyptus regnans, completely inhibited the Basidiomycete wood-rot
fungi Polyporus palustris and Pyconoporus coccineus, and partially inhibited the white-rot
Fomes lividus. The authors concluded that the inhibition was due to competitive growth by
these antagonists, and the ephemeral secretion of antibiotics.
139
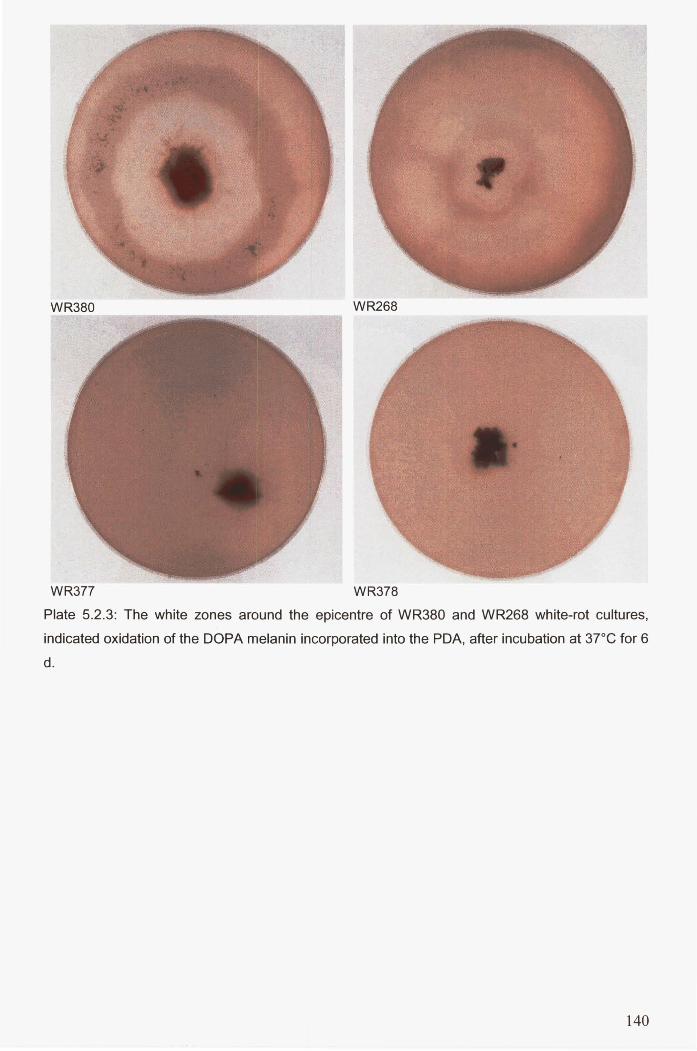
WR380 WR268
WR377 WR378
Plate 5.2.3: The white zones around the epicentre of WR380 and WR268 white-rot cultures,
indicated oxidation of the DOPA melanin incorporated into the PDA, after incubation at 3rc for 6
d.
140
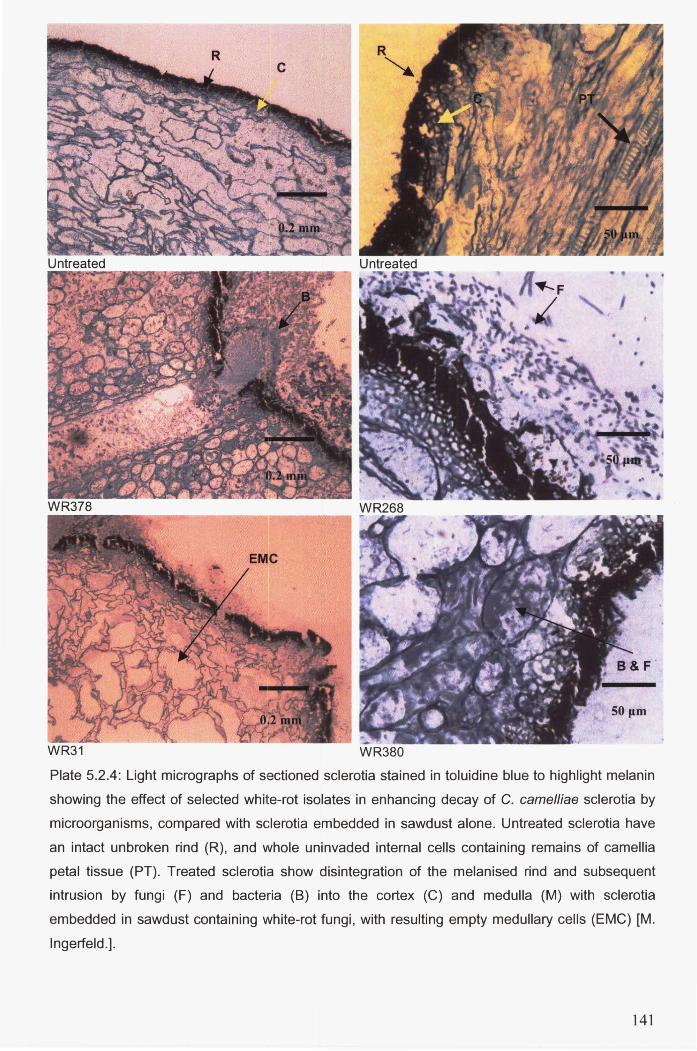
. . , .
• •
•
SO JIm
-WR380
Plate 5.2.4: Light micrographs of sectioned sclerotia stained in toluidine blue to highlight melanin
showing the effect of selected white-rot isolates in enhancing decay of C. camelliae sclerotia by
microorganisms, compared with sclerotia embedded in sawdust alone. Untreated sclerotia have
an intact unbroken rind (R), and whole uninvaded internal cells containing remains of camellia
petal tissue (PT). Treated sclerotia show disintegration of the melanised rind and subsequent
intrusion by fungi (F) and bacteria (8) into the cortex (C) and medulla (M) with sclerotia
embedded in sawdust containing white-rot fungi , with resulting empty medullary cells (EMC) [M.
Ingerfeld.].
141
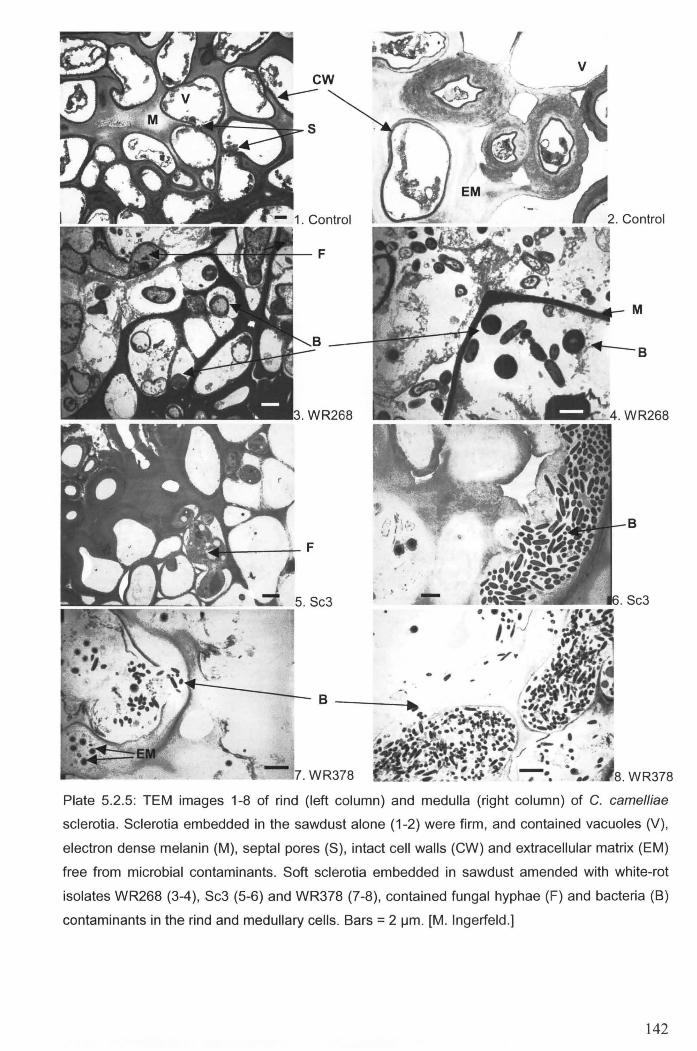
f
B
B
, F
~ '. . Sc3 5. Sc3 ......;:;;;= .....
•
- , B ------I ....
7. WR378 8. WR378
Plate 5.2.5: TEM images 1-8 of rind (left column) and medulla (right column) of C. camelliae
sclerotia. Sclerotia embedded in the sawdust alone (1-2) were firm, and contained vacuoles (V),
electron dense melanin (M), septal pores (S), intact cell walls (CW) and extracellular matrix (EM)
free from microbial contaminants. Soft sclerotia embedded in sawdust amended with white-rot
isolates WR268 (3-4), Sc3 (5-6) and WR378 (7-8), contained fungal hyphae (F) and bacteria (B)
contaminants in the rind and medullary cells . Bars = 2 j..Im. [M . Ingerfeld.]
142

Results from Assay 2 highlighted the fact that sclerotia could survive in moist pine sawdust
for 3 months in the absence of wood-rot fungi. The results also showed that the wood-rot
isolates were not able to establish in non-sterile sawdust from PDA culture segments.
However, colonisation of sawdust by the wood-rot fungi was successfully achieved by
transferring malt extract agar plugs containing the wood-rot cultures into the sterilised pine
sawdust-rye flour mixture. Results from Assay 3 demonstrated that several of the test white
rot fungi, which had pre-colonised the sawdust, could cause a softening or death of sclerotia.
Assessment of sclerotial recovery in Assay 4 showed that high levels of sclerotial parasitism
could be achieved with selected white-rot isolates. In assay 3, the isolates of white-rot fungi
that most readily colonised the sterile sawdustlrye flour mixes, Schizophyllum commune Sc3,
Phanerochaete cordylines WR268, Pycnoporus coccineus WR380, and three yet unidentified
isolates WR31, WR377 and WR378 caused 50-77% mortality of sclerotia 12 weeks after
inoculation. In Assay 4, P. cordylines WR268 and the unidentified white-rot isolate WR378,
established in the saWdust/rye flour mix, were shown to cause almost total mortality of
sclerotia 11 weeks after inoculation.
The sawdust/rye flour mix provided an environment conducive to enhanced mortality of
sclerotia by the Trichoderma spp. antagonists, which had been isolated from decaying C.
camelliae sclerotia. Compared to the control, the suspension of Trichoderma spp. provided no
increase in sclerotial mortality in sand, but applied to the sawdust/rye flour media, increased
sclerotial mortality by 60% (Table 5.2.10).
5.2.4.1 Processes involved in parasitism of sclerotia by white-rot fungi
Assay 4 was conducted to determine whether in the process of colonising tree mulches, the
white-rot fungi also caused decay of sclerotia, which was indicative of these fungi secreting
lignolytic enzymes to digest the wood chips. These ligninases were thought to break down the
rind of sclerotia that came into contact with them, through oxidation of the protective melanin
(Butler and Day 1998b), thereby exposing the sclerotial medulla and increasing its
susceptibility to microbial degradation. In Assay 4, surface-sterilisation of sclerotia using
NaOCI did show that the principle of using a strong oxidising agent to degrade the rind could
result in sclerotia being more susceptible to micro-antagonism of the medulla than non
sterilised sclerotia.
Butler and Day (1998b) showed that ligninase enzymes extracted from white-rot fungi could
achieve total degradation of melanin from the black yeast fungus Phaeococcomyces sp. The
143

authors also demonstrated that melaninases were a type of ligninase. One of the two forms of
ligninases, manganese peroxidase, is known to rapidly degrade fungal DHN melanin (Cullen
1997), and is reported to have a greater role in degradation than the other form, lignin
peroxidase. In this study, melaninases were secreted by P. cordylines WR268 and P.·
coccineus WR380, as demonstrated by the white ring of oxidised melanin surrounding their
mycelia (Plate 5.2.3). The oxidation or bleaching of the black melanin was assumed to be
evidence of melanin degradation (Butler and Day 1998b). If the pigment was no longer black,
it was no longer a melanin, and no longer provided the sclerotium its protective properties.
However, just because there was no colourless halo around the other two white-rot isolates
tested, did not mean that they could not produce melaninases in other circumstances. The
white-rot isolates may have been stimulated to produce enzymes other than melaninase in the
media provided, such as laccases, which is also involved in degradation of lignin (Cullen
1997) but is not known to oxidise melanin (Butler and Day 1998 a).
However, there was no evidence in any of the sclerotia/wood-rot assays that the rind of any
sclerotium became bleached. This implied that the increase in degradation of sclerotia in
sawdust containing the white-rot fungi was not due to oxidation of the melanin in the rind.
Either the melanin was only partially denatured, or other components of the rind were
denatured. This contention was supported by light microscope examination of the stained
sections of rind from firm sclerotia, in sawdust alone, and from soft parasitised sclerotia, from
sawdust amended with the white-rot fungi assessed. The rind from healthy sclerotia appeared
black and continuous, whereas the rind from parasitised sclerotia also appeared black, with no
evidence of discolouration, but with breaks through which microorganisms had colonised the
medulla (Plate 5.2.4).
This evidence suggests that compounds other than melanin could have been involved in
ensuring the integrity of the rind. Backhouse and Willetts (1984) showed that along with a
melanic pigment, rind cells of Botrytis cinerea and B. fabae sclerotia contained chitin and
beta-glucans. It is likely that the rind of C. camelliae sclerotia contains the same biochemical
constituents, and therefore, would be susceptible to enzymes such as glucanases and
chitinases, which are known to be secreted by white-rot fungi and by Trichoderma spp. In
contrast to many isolates of white-rot fungi, the brown-rot isolates G. sepiarium Gs5 and
Tyromyces sp. WR86, which are known to not secrete ligninase (Ejechi et al. 1996; Hishida et
al. 1997), did not colonise the sawdust to any extent, nor did they result in increased
parasitism of sclerotia (Table 5.2.2). This suggested that the brown-rot isolates did not
produce the enzyme suite required for degrading the wood fibre or the sclerotia.
144
Schizophyllum commune has also been reported not to produce ligninolytic enzymes, but
produce cellulolytic and hemicellulolytic enzymes with high activity against Pinus radiata
fibre (Chee 2002). From this study, it appears that the potential of white-rot fungi to produce
the necessary enzymes, probably ligninases is important in the process of biological control of
C. camelliae sclerotia.
5.2.4.2 Field-testing of the white-rot mulch system
To develop this white-rot fungi and sawdust system further, field studies need to be
undertaken to demonstrate that selected white-rot isolates could colonise tree mulches beneath
camellia bushes, and so contribute to the decay of newly formed sclerotia that had fallen onto
the mulch surface. The method used in Assays 3 and 4 (Sections 5.2.2.1.3 and 5.2.2.1.4) to
introduce the white-rot fungal isolates into sawdust could be used for introducing white-rot
fungi into tree mulches in the field. Prior to field inoculation, selected white-rot isolates
would need to be cultured in sterile sawdust/rye flour (5:1, v/v) contained in deep Petri dishes
with similar properties to those used in the assays. Once the white-rot fungi have colonised
the media, plugs of inoculum could be removed, and inserted into freshly laid tree mulches
around each camellia bush. The best time to set up the system would probably be in late
summer, when all flowers infected by C. camelliae from the previous flowering season have
fallen on the soil beneath the camellia bushes. Laying down the tree mulches in late summer
should contribute to the decline in soil-borne sclerotia, as reported in Section 5.1.4. A white
rot isolate could be introduced into the mulch in early autumn when temperature and moisture
conditions would be expected to be favourable for establishment of the fungus. From these
assays, Phanerochaete cordylines WR268 appears to be the preferred white-rot fungus for use
in this system because of its aggressive colonisation of sawdust and its efficacy in degrading
sclerotia. However, isolates Schizophyllum commune Sc3, Pycnoporus coccineus WR380 and
unidentified isolates WR31, WR377 and WR378 also colonised sawdust to provide similar
levels of sclerotial degradation, and warrant further evaluation leading to field studies. In
addition, because a number of white-rot isolates have demonstrated efficacy against C.
camelliae sclerotia, there is scope for evaluating a combination of white-rot isolates in
selected tree mulches. This would provide a safeguard against any particular isolates not
being effective within the external environment throughout the over-wintering period. Since
the different isolates are likely to have preferences for different mulch compounds,
preliminary trials should be run to select those best suited to the selected mulches under field
conditions.
145
Providing that the field tests were successful, the white-rot/tree mulch system offers potential
for effective long-term control of camellia blight. The previous study (Section 5.1) showed
that tree mulches alone gave total suppression of apothecia production and decreased survival
of existing soil-borne C. camelliae sclerotia. The white-rot fungi incorporated into the mulch,
could provide ongoing control of new generations of sclerotia by potentially damaging the
protective rind of C. camelliae sclerotia that develop in the newly fallen flowers, and so allow
parasitism of the medulla by micro-organisms. Additional benefits from the tree mulches
occur from providing an aesthetically pleasing weed-free environment under camellia bushes,
and retaining soil moisture. Algae growing on the surface of the decomposing mulch (van
Epenhuijsen et al. 2001) may attract fungus gnats, the larvae of which were observed feeding
on sclerotia and apothecia, to provide additional suppression of camellia blight (Section
5.1.4). The system may provide continued effective control of camellia blight for as long as
the tree mulch supports the population of white-rot fungi before decomposition of the mulch
renders it unsuitable for sustenance, by which time the tree mulch will need to be replenished.
A major concern of the white-rot tree-mulch system is that the white-rot isolates will
parasitise living desirable shrubs and trees. For example, fungi of the genus Schizophyllum
spp. were reported by Agrios (1997) as being important in rotting wood in standing trees or in
wood products and able to cause white rot in hardwoods. A strain of S. commune has recently
been reported to be pathogenic against camellia bushes in Spain, infecting the bushes through
wounds caused by pruning or breaking shoots, and quickly causing shoot death (Mansilla et
al. 2001). Many trees and shrubs have only weak protection against white-rot fungi. Extracts
from the bark of 51 different deciduous tree species were shown to have only weak anti
fungal activity against Tyromyces palustris, Coriolus versicolor, Pycnoporus coccineus and
Serpula lacrimans (Mori et al. 1997a). However, some amenity trees contain compounds in
their bark to afford them some protection. The extract of Magnolia obovata [Magnolia
hypoleuca] had potent anti-fungal activity against Coriolus versicolor, Lepista sordida and
Pycnoporus coccineus, with the active compounds identified as eudesmols, magnolol and
honokiol (Mori et al. 1997b). Therefore, before the mulch/white-rot system could be applied
throughout New Zealand, any white-rot isolates intended for use in the system will need to be
evaluated for their phyto-pathogenicity. If the white-rot fungi were shown to be pathogenic
against amenity shrubs in general, then the strategy of using a number of isolates to ensure the
survival of the white-rot population will need to be altered, to select for only efficacious
isolates exhibiting no phyto-pathogenicity.
146

Another concern is the persistence of the white-rot fungi in the tree mulches, and their related
ability to survive against parasitic microorganisms, or in competition with other
microorganisms. The assays were not able to determine the persistence of the selected white
rot isolates, and therefore this needs to be evaluated under field conditions. Further evaluation
of formulations to enhance establishment of white-rot fungi into non-sterilised pine mulches
also warrants investigation. Formulations with promise include the pelleted solid substrates
coated with sodium alginate suspensions of fungal spores or mycelial fragments that were cr
successfully used by Lestan and Lamar (1996).
It may be possible to improve the efficacy of the white-rot isolates in the tree mulches by
stimulating ligninase production, and hence melaninase production, with the incorporation of
minerals into the mulch. Vares and Hatakka (1997) found that the addition of manganese
(Mn/ at 120 JlM) and a manganese chelator, sodium malonate, in liquid culture could
enhance production of ligninolytic enzymes and lignin-degrading activity to varying degrees
in 10 species of white-rot fungi. These responses were related to the utilisation of either lignin
peroxidase or manganese peroxidase for lignin depolymerisation.
Altering the size or range of sizes of the wood chips may also influence the activity of the
white-rot fungi and subsequent sclerotial mortality. In the assays, high levels of sclerotial
mortality were obtained by inserting the sclerotia directly into the sawdust colonised by
white-rot fungi. The sawdust comprised granules no more than 4 mm diameter, which
maximised the wood surface available for contact by the white-rot mycelium, and as a
consequence, maximised the potential for ligninase production in an aerated environment.
This in tum would have maximised the amount of contact between the ligninase-producing
white-rot mycelium and the sclerotial surface. If the wood chips had been larger, the surface
to volume ratio of the sawdust would have been smaller, thereby reducing the amount of
wood surface available for colonisation by white-rot fungi, and therefore reducing the surface
area of white-rot mycelium available for contact with the sclerotia. Since the amount of
contact between the sclerotium and white-rot mycelium appears important, wood chip size
also warrants investigation.
The results from these in vitro studies show that the strategy of amending white-rot fungi into
pre-prepared 100 mm thick tree mulches under camellia bushes, has the potential to provide
long-term control of camellia blight. The most effective isolate, Phanerochaete cordylines
WR268, produced melaninases in laboratory trials, indicating potential for ligninase activity
while colonising the mulch. A number of white-rot isolates, such as Schizophyllum commune
147

Sc3 and Pycnoporus coccineus WR380 were also found to be effective in killing sclerotia.
This biocontrol strategy warrants further evaluation. The next step in development of this
strategy would be to evaluate the pathogenicity of these white-rot isolates on a range of potted
amenity plants, including camellia, under conditions in the shadehouse where spread of any
pathogenic isolates could be confined. Only after the white-rot isolates were shown to be non
pathogenic to common amenity shrubs, and then evaluated for control of C. camelliae
sclerotia in the field, could a judgement be made on the potential of this strategy for
practicable control of camellia flower blight.
148
Chapter 6
6 Protecting flowers against infection
A commonly used strategy in plant disease control is to protect susceptible tissue from
infection by the propagules, thereby preventing disease occurrence. For camellia flower
blight, it is the flower petals that need to be protected from infection by ascospores. Protection
of the flowers against infection with biocontrol can be achieved by two strategies. One
strategy is to spray camellia bushes either before or during the flowering period with
biocontrol agents that can colonise the burgeoning blooms to prevent the ascospores from
germinating on the petals, or kill recently germinated ascospores. Another strategy is to
stimulate production by the camellia plant of the defence compounds that are able to prevent
infection by ascospores, or reduce development of the pathogen in newly infected flowers.
Both strategies have not been evaluated before for control of camellia flower blight, and are
investigated in this chapter.
6.1 Identifying phylloplane antagonists
6.1.1 Introduction
Various microorganisms, that were isolated from flowers have been reported to reduce
infection on the phylloplane by ascospores of the pathogen Sclerotinia sclerotiorum, which is
closely related to C. camelliae (Kohn and Nagasawa 1984), or of Botrytis cinerea, another
ascomycete pathogen. These antagonistic microorganisms include bacteria such as
Pseudomonas fluorescens and P. putida (Expert and Digat 1995), as well as filamentous fungi
such as Alternaria alternata and Cladosporium cladosporioides (Boland and Hunter 1988),
Trichothecium roseum, Gliocladium roseum and Trichoderma virens (Peng and Sutton 1991),
Drechslera spp. and Epicoccum purpurascens (Inglis and Boland 1992). Boland and Inglis
(1989) demonstrated that Fusarium graminearum, F. heterosporum and Myrothecium
verrucaria reduced the proportion of bean flowers which developed lesions caused by S.
sclerotiorum by 45-100%. Some yeasts such as Saccharomyces cerevisiae and
Zygosaccharomyces spp. have also demonstrated activity in preventing infection of
ascospores on flowers (Suzzi et al. 1995). In addition, solutions containing a number of
microorganisms from different genera have been shown to sometimes be more effective than
149

monocultures of biocontrol agents. Hutchins and Archer (1994) recommended that
manipulation of petal microflora for biocontrol of S. sclerotiorum was better achieved by
spraying flowers with mixtures of the known antagonists Fusarium, Cladosporium,
Penicillium, Mucor and fluorescent Pseudomonas species, than any of these organisms
applied individually.
For these microorganisms to be effective in preventing the disease establishing in camellia
flowers, they would need to colonise the petal surface before the ascospores landed. C.
camelliae ascospores germinate and form short germ tubes that penetrate the petal cuticle
within 6-18 h after inoculation (Vingnana-Singam et al. 2000). Therefore, there is only a brief
period available for a micro-antagonist to prevent infection by the ascospores. Once
penetration of the petal cuticle has occurred, control of infection would be unlikely, as it
would be difficult for any micro-antagonist to attack the intercellular hyphae growing
underneath the cuticle, before the pathogen caused necrotic destruction of the petals, which
usually occurred within 72 h (Vingnana-Singam et al. 2000).
The potential for C. camelliae mycelium that had grown into the camellia stem from infected
flowers, to infect the next generation of flowers in the following year was considered to be
unlikely (Appendix 5). Therefore, only the feasibility of protecting flowers against ascospore
infection was evaluated in this study. The evaluation was conducted in two discrete phases. In
the first phase, microorganisms were isolated from camellia flowers grown in areas where
camellia blight had occurred for more than 10 years. These microorganisms were then
evaluated in a laboratory petal assay developed specifically to screen isolates rapidly for their
ability to protect petals from ascospore infection. In the second phase, the most efficacious
isolates from the initial screens were evaluated the following year for their ability to control
the incidence of camellia blight on camellia bushes that were in flower.
6.1.2 Methods
6.1.2.1 Screening for antagonists in petal assays
6.1.2.1.1 Flower collection
Camellia japonica flowers that were less than 10% infected with symptoms of camellia blight
were collected from bushes at the Wellington Botanic Gardens, where the disease had been
prevalent for more than 8 years. Five flowers were collected from bushes of each of the
150
cultivars, Ballet Queen, Yodo No Ashi, Lady Clare, Berenice Boddy, Gallant Array and
Emporia of Russia cultivars on 6 August 2000, from Betty Sheffield Supreme and
Anticipation cultivars on 30 September 2000. Flowers were also collected on 2 October 2000
from a C. japonica bush in Bryndwr, Christchurch, a site in which camellia blight had been
prevalent for at least 3 years. The flowers were picked aseptically into individual 200 x 300
mm plastic bags, placed in cool storage at 4°C, and held for no more that 4 d before the
micro-organisms were isolated from the flowers.
6.1.2.1.2 Isolation of microorganisms from flowers
The method of isolating the microorganisms from the flowers followed that of Inglis and
Boland (1990). Twenty millilitres of sterile 0.01 M phosphate buffer at pH 7 (5.8 mL 1 M
Na2HP04 to 4.2 mL 1 M NaH2P04 in 100 mL) containing 0.01 % Tween 80 was added to
each individually bagged flower. Each bag was paddle-agitated in a Colworth Stomacher 400
for 1 min, and the wash liquid dispensed aseptically into a sterile Universal bottle.
The suspensions were serially diluted from 10-1 - 10-5
, with 0.1 mL of each suspension spread
over each 90 mm diameter Petri plate. Yeasts and filamentous fungi at the 10-1 and 10-2
dilutions were isolated on potato dextrose agar (PDA) (Merck) amended with 100 ppm
chlortetracycline (aureomycin) (Cyanamide Australia PTY Ltd, West Victoria, Australia) and
2.5 mLiL lactic acid (PH 3.5). The more common bacteria were isolated from 10-4 and 10-5
dilutions on nutrient agar (NA) (remel) amended with 0.2 giL Terraclor® 75 WP (750 g/kg
quintozene). Spore-forming Bacillus spp. were isolated by incubating a 1.5 mL aliquot of the
undiluted suspension in a plastic microtube (1.5 mL) at 80°C for 20 min, with 0.1 mL of the
treated suspension spread directly onto NA (remel). Triton X 100 at 2 mLiL was added to all
agar types to cause colonies to form discrete clumps. Each dilution was replicated three times.
Plates were air-dried in a laminar flow cabinet for 30 min to dry the agar surface before
inoculation. Fungi were incubated at 20°C for 10 d, and the bacteria at 25°C for 2 d, both
under 12 h diurnal light. Morphologically distinct colonies of yeasts and fungi were
subcultured onto PDA (remel) and bacteria onto NA (Oxoid) from plates containing 10-300
colonies, to obtain pure colonies.
6.1.2.1.3 C. camelliae ascospores
Sclerotia bearing apothecia were collected during August-October 2000 from under camellia
bushes at Wellington Botanical Gardens and at the previously used site in Bryndwr,
151
Christchurch. The apothecia were bundled into lots of 1-5, depending on size, their combined
surface area totalling approximately 20 mm diameter. The sclerotia and stipes were wrapped
in damp tissue and stored in sealed plastic containers at 4 ° C until required within 5 days.
6.1.2.1.4 Assay procedure
Unblemished petals were removed from flowers collected from bushes of C. japonica cvar.
Willimena, in an area where camellia blight had not been observed. Each petal was placed
onto a 70 mm filter paper disc pre-wetted with sterile distilled water (SDW), contained in a 90
mm diameter Petri dish. The exposed petal surfaces averaged 12.3 (SEM = 0.34) cm2• Spores
or cells of the candidate micro-organisms were aseptically transferred using a glass 'hockey
stick', from the cultures to micro-sprayers containing 15 mL SDW plus 0.01% Tween 80,
with their concentration determined with a haemocytometer. For each isolate, suspensions
containing approximately 1 x 10⁷ spores or cells/mL were sprayed onto four petals at 0.5
mLipetal, equivalent to 4 x 10⁵ cells-spores/cm2• In the initial screen (Screen assay 1), the
non-ionic organo-siloxane surfactant Break-Thru® S240 was added to the remaining 10 mL in
the micro-sprayer at 0.01 % to increase coverage of the spray droplets, and this was applied to
another four petals. Lids were placed onto the Petri dishes immediately after application. The
control treatments comprised four untreated petals (left outside the inoculation chamber) and
four pathogen-treated petals that had not been sprayed with any test microorganism. The 12
petals in the dishes that were to be treated with C. camelliae ascospores, comprised four
replicates each of the pathogen control, test organism, and test organism plus surfactant. They
were placed in a plastic box 290 x 400 mm x 110 mm deep, with each treatment arranged in a
randomised block design (Plate 6.1.1), and the box sealed with an airtight lid. The candidate
organisms were allowed to colonise the petal surface for 16-20 h at 20-22°C, before exposing
the petals to C. camelliae ascospores.
F or ascospore inoculation, the lids of the Petri dishes were removed, and a prepared bundle of
apothecia, which had been conditioned for at least 2 h at 20°C, was placed in each box that
had a 42 mm diameter hole in the centre of one end. The apothecia were propped up against a
comer of the box, and the box lid closed. The compartment was allowed to adjust to the
ambient temperature outside, which was measured at 20-22°C and 20% relative humidity.
After 2-4 h, the lid was removed, and the sudden change in air pressure in the box caused by
the air being sucked through the hole, induced the asci to release their ascospores. As soon as
the spore cloud was observed, the lid was replaced, and the ascospores circulated within the
chamber by directing a jet of air from a hair drier through the hole in the box. The ascospores
152

were allowed to settle onto the petals for 2-5 min before the Petri dishes were closed with
their respective lids and sealed with cling film.
After incubation for 4 d at 200 e under a 12 h diumallight regime, the petals were assessed for
camellia blight. The level of C. camelliae infection was estimated as the proportion of petal
area that had characteristic necrotic lesions of camellia blight. The proportion of the petal with
camellia blight was assessed by comparison to standard area diagrams. In the initial screen,
278 isolates were tested in batches of 10-12 isolates at a time. Isolates that provided greater
than 80% reduction in petal necrosis were re-tested twice using the same system (Screen
assays 2 and 3), except that the surfactant treatment was not evaluated further. Petals that had
been treated by another isolate were placed in the inoculation chamber in the positions that
would have otherwise been taken by petals that had received the surfactant treatment.
6.1.2.1.5 Storage of isolates from the screens
Isolates that provided greater than 80% reduction in petal necrosis in the first screen (Screen
assay 1) were stored by two methods. Bacterial isolates were subcultured from the original
plates onto NA (Difco) slopes, and fungal isolates onto PDA (Oxoid) slopes, and stored at
4°e. These isolates were sub-cultured to fresh slopes every 6 months. In addition, the isolates
were transferred to a 1 mL solution of sterile glycerol/water (10% v/v) contained in
Eppendorf tubes, and stored at -80°C.
6.1.2.2 Evaluation of antagonists on camellia bushes
6.1.2.2.1 Modified assay procedure
Prior to spraying camellia bushes, selected bacteria and fungi isolates, which had been stored
at -800 for 11 months, were plated onto NA or PDA, respectively, formulated in the SDW
Tween 80 solution as described in Section 6.1.2.1.4, and evaluated in a petal assay (Assay 4).
This assay had been modified from the one described in Section 6.1.2.1.4, with the modified
assay also used to assess the efficacy of the test organisms in the formulations that were
sprayed onto camellia bushes during the flowering period (Spray assays 1-4).
In the modified assay, six petals were used in each treatment instead of four, and low and high
ascospore inoculum levels were used instead of just one level. A duplicate set of six
unblemished petals of C. japonica cvar. Willimena were either unsprayed or sprayed with
each spore/cell suspension of the test organism. For each duplicate set, the 12 unsprayed or
153
sprayed petals were randomly positioned in a chamber, and held at room temperature (21-
25°C) for 2 h before being batch-treated with air-deposited ascospores. One set of petals was
treated with a low inoculation level and the other to a high inoculum level. To provide a low
level of inoculum, ascospores were discharged from one C. camelliae apothecium for 30 sec.
A high level of inoculum was provided by using four apothecia, from which ascospores were
discharged at least once over a 4 h period. Immediately after treatment with the ascospores,
the dishes were sealed with cling film. After the high inoculum treatment had been completed,
the petals, which had been subjected to both inoculum levels, were incubated at 20°C. They
were assessed after 3 and 6 d for camellia blight, estimated as a proportion of petal area
infected.
6.1.2.2.2 Camellias and shadehouse trial design
For this trial, 50, 5 year-old 1-1.8 m tall potted plants of eight cultivars of Camellia japonica,
were re-potted 2 months before treatment application in 10 L bags with a general potting mix.
The mix comprised 500 g of 12-14 month release Osmocote Plus (15% N, 3.5% P, 9.1% K,
1.2% Mg, plus traces ofB, Cu, Fe, Mn, Mo and Zn) and 250 g dolomite lime in 200 L of bark
and 50 L of sand. The insecticide Attack® (25 giL permethrin, 475 gil primiphos-methyl and
375.4 gil hydrocarbon liquid), was applied once to camellia bushes in the previous autumn, to
control the scale insect Pulvinaria floccifera Westwood. However, by the following spring,
the scale insect had increased in numbers and was present on the underside of most leaves, at
12 (SEM = 1.8) scale/apicalleaf during the flowering period.
The nine treatments comprised an untreated control and one application of each of eight
antagonists (Table 6.1.2), which had provided a high level of protection in at least one of the
repeat assays, and provided a representation of four classes of genera. The treatments were
replicated five times in a randomised block design. Each of the five blocks of 10 plants
contained two untreated controls. Blocks 1 and 3 contained 10 plants of Gwenneth Morey and
Wi lamina, respectively. Because there were not enough plants within each of the other
cultivars, blocks 2, 4 and 5 contained five plants each of Demi-Tasse and Dona Herzilia de
Frietas Magalhaes, Nuccio's Pearl and Sir Victor Davis, and Little Michael and Wedding
Cake, respectively. The treatments were randomly allocated to each plant, with an untreated
control represented for each cultivar. To limit transfer of the biocontrol agents between
treatments, the bushes were placed in the shadehouse in blocks with the distance between
outermost leaves of neighbouring plants being at least 1 m.
154

The bushes were kept in a shade-house (Plate 6.1.2), except when being sprayed when they
were moved outside and grouped together into their respective treatments to prevent spray
drift to bushes of the other treatments. The bushes were sprayed with their suspension of the
test organism until run-off (200 mLlbush) on 12 and 20 September, and 3 and 18 October
2001 for Sprays 1-4, respectively. Suspensions of the test organisms, prepared as described in
Section 6.1.2.2.3, were applied using a knapsack sprayer containing a hollow cone 26 nozzle
with a size D2 aperture. The bushes were sprayed in zero to light winds in temperatures of 12-
20°C. Once the leaves had dried, the bushes were returned to their original positions in the
shade-house.
6.1.2.2.3 Spray treatments
The suspensions of the bacterial antagonists were prepared by incubating 20 III of each of the
-80°C glycerol/water (10% v/v) cultures in 20 mL nutrient broth (NB) (Difco) at 20-22°C
with gentle agitation on a Kika Labortechnik KS 250 basic orbital shaker at 200 rpm. After 48
h, the 20 mL culture was added to 1.5 L NB for incubation at room temperature, with gentle
agitation on a Gallenkamp orbital shaker set at 150 rpm, and this comprised the spray
solution. Suspensions of the Cladosporium and yeast isolates were prepared by floating off
spores or cells from PDA plates to which SDW containing 0.04% Tween 80 had been added,
and filtering the spore suspension through sterile muslin, and making the filtrate up to 1 L.
The formulation of antagonist suspensions was varied slightly at each spray application, in an
attempt to improve the efficacy of the antagonists. After each application, the treated flowers
were assessed for disease and removed prior to the next application. The application cycles
were discrete so that the effect of each treatment was not confounded by the previous
treatment. At Spray 1, the liquid bacterial cultures were incubated at 24-26 °C for 14 d to
stimulate production of endospores, and sprayed directly onto the camellia bushes. At Sprays
2-4, the liquid bacterial cultures were incubated for 24 h to produce only vegetative cells.
Spray 1 and 2 used only water and Tween 80 to carry the inoculum. Spray 3 contained 0.1
mLil Break-Thru® S240 surfactant, and Spray 4 contained 2 mLil Codacide organic adjuvant
oil (860g/1 canola oil) (Cobbett PTY Ltd, Hornsby, NSW, Australia).
At each spray event, a sample of each formulation was taken, and assessed within 2 h for
concentration of viable cells by serial dilution and culturing on NA (Difco) and PDA (Oxoid).
In addition, the spore concentrations of the Cladosporium and yeast isolates were counted by
155

haemocytometer. The efficacy of the test organisms in controlling camellia blight was also
tested in the petal assay described in section 6.1.2.1.4.
6.1.2.2.4 Flower infection
The flowers were inoculated with C. camelliae ascospores by apothecia that were introduced
into the shadehouse 6 h after each application of the test organisms. This was achieved by
placing six sealed plastic containers, each containing 10 apothecia with their stipes and
sclerotia individually wadded in damp tissue, onto the shadehouse floor. The containers were
distributed amongst the camellia bushes so that the source of inoculum was no more than 3 m
from any bush. The apothecia released ascospores as soon as the containers were opened, and
were observed to release their inoculum for at least another 3 d. The spent apothecia were
replaced with fresh apothecia at the beginning of each of the four spray and assessment
cycles. All infected flowers were removed from each bush before subsequent spray
treatments. This left only young flowers or flowering buds about to bloom, to be infected by
the new release of ascospores.
6.1.2.2.5 Disease assessment
The flowering camellia bushes were inspected 4 and 8 d after the day the treatments were
sprayed onto the camellia bushes. The number of healthy and infected flowers on each bush
and the number that had fallen, were recorded. To reflect a camellia grower's assessment on
camellia blight infestation, the flowers on each bush were scored, from 0 = no blight to 10 =
all flowers infected.
6.1.2.3 Statistical analysis
All data except that obtained from screen assays 1, which was averaged over replicates, were
analysed using GenStat Release 4.22 (Fifth Edition). The incidence of camellia blight in the
petal assays and the proportion of flowers infected in the shadehouse trials were analysed by
analysis of deviance using a generalised linear model with binomial errors and a logit link
(McCullagh and NeIder 1989). For the shadehouse trial, the number of total and infected
flowers per bush and overall camellia blight scores were analysed by analysis of variance.
Treatment means were compared at P<O.05, with 95% confidence limits in brackets.
156

Plate 6.1.1: Apparatus for screening antagonists on camellia petals. Petals treated with the test
organism and untreated pathogen control petals, positioned randomly in a chamber (left), were
inoculated with ascospores which were released by the apothecium (top left). The lid of the
enclosed chamber (right) supported the Petri dish lids, which identified the position of the
treatments in the chamber.
Plate 6.1.2: Camellia bushes and camellia bushes and shadehouse used in the trial.
157

u P M M+S u P M M+S
Plate 6.1.3: C. camelliae ascospore infection of petals in trials using antagonists, Pseudomonas
sp. A3B1 (left) and P. marginalis GA8Ps4 (right). U = untreated control, P = pathogen control, M
= test microorganism, and M+S = test microorganism plus surfactant.
6.1.3 Results
6.1.3.1 Screening for antagonists
6.1.3.1.1 Initial screen - Assay 1
The 278 isolates evaluated in the first assay comprised 34 Bacillus spp, 100 other bacteria, 57
yeasts, 23 Cladosporium spp., 10 Gliocladium spp., 5 Trichoderma spp., 3 Penicillium spp, 1
Botrytis sp., 1 Colletotrichum sp., and 44 other fungi (Appendix 6). The surfactant was
observed to markedly improve droplet cover on the petals, and had no significant effect on the
incidence of C. camelliae infection compared to petals treated with solutions not containing
the surfactant; 72.6 cf 73 .5 (LSD(o.05) = 2.3)%, respectively.
Twenty isolates gave more that 75% reduction in petal area infected compared with the
pathogen-treated control (Table 6.1.1 ; Assay 1). The isolates that provided more than 90%
reduction in infection were Bacillus sp. ChlBacl, Pseudomonas sp. A3B1 , P. marginalis
GA8Ps4, P. jluorescens LC8Ps1 , Cladosporium sp. YnA2F1, ER3F2b and Ch1Fl , and an
unidentified fungus GA3F6.
158
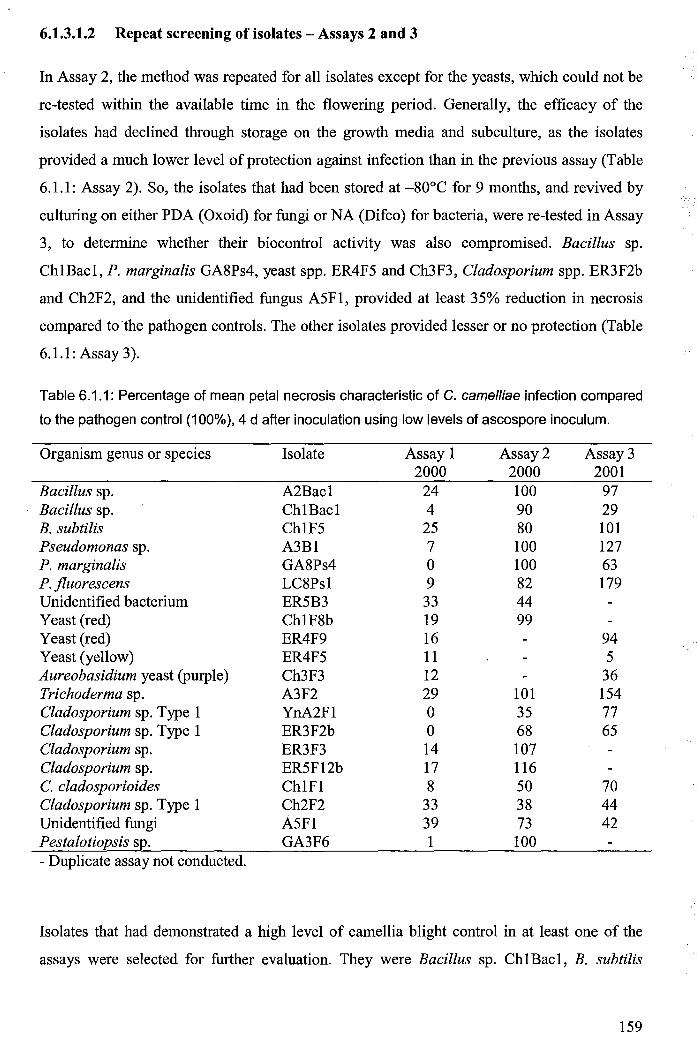
6.1.3.1.2 Repeat screening of isolates - Assays 2 and 3
In Assay 2, the method was repeated for all isolates except for the yeasts, which could not be
re-tested within the available time in the flowering period. Generally, the efficacy of the
isolates had declined through storage on the growth media and subculture, as the isolates
provided a much lower level of protection against infection than in the previous assay (Table
6.1.1: Assay 2). So, the isolates that had been stored at -80D C for 9 months, and revived by
culturing on either PDA (Oxoid) for fungi or NA (Difco) for bacteria, were re-tested in Assay
3, to determine whether their biocontrol activity was also compromised. Bacillus sp.
Ch1Bacl, P. marginalis GA8Ps4, yeast spp. ER4F5 and Ch3F3, Cladosporium spp. ER3F2b
and Ch2F2, and the unidentified fungus A5F1, provided at least 35% reduction in necrosis
compared to the pathogen controls. The other isolates provided lesser or no protection (Table
6.1.1: Assay 3).
Table 6.1.1: Percentage of mean petal necrosis characteristic of C. camelliae infection compared
to the pathogen control (100%),4 d after inoculation using low levels of ascospore inoculum.
Organism genus or species Isolate Assay 1 Assay 2 Assay 3 2000 2000 2001
Bacillus sp. A2Bac1 24 100 97 Bacillus sp. Ch1Bac1 4 90 29 B. subtilis Ch1F5 25 80 101 Pseudomonas sp. A3B1 7 100 127 P. marginalis GA8Ps4 a 100 63 P. fluorescens LC8Ps1 9 82 179 Unidentified bacterium ER5B3 33 44 Yeast (red) Ch1F8b 19 99 Yeast (red) ER4F9 16 94 Yeast (yellow) ER4F5 11 5 Aureobasidium yeast (purple) Ch3F3 12 36 Trichoderma sp. A3F2 29 101 154 Cladosporium sp. Type 1 YnA2F1 a 35 77 Cladosporium sp. Type 1 ER3F2b a 68 65 Cladosporium sp. ER3F3 14 107 Cladosporium sp. ER5F12b 17 116 C. cladosporioides Ch1Fl 8 50 70 Cladosporium sp. Type 1 Ch2F2 33 38 44 Unidentified fungi A5F1 39 73 42 Pestalotiopsis sp. GA3F6 1 100 - Duplicate assay not conducted.
Isolates that had demonstrated a high level of camellia blight control in at least one of the
assays were selected for further evaluation. They were Bacillus sp. Ch1Bac1, B. subtilis
159
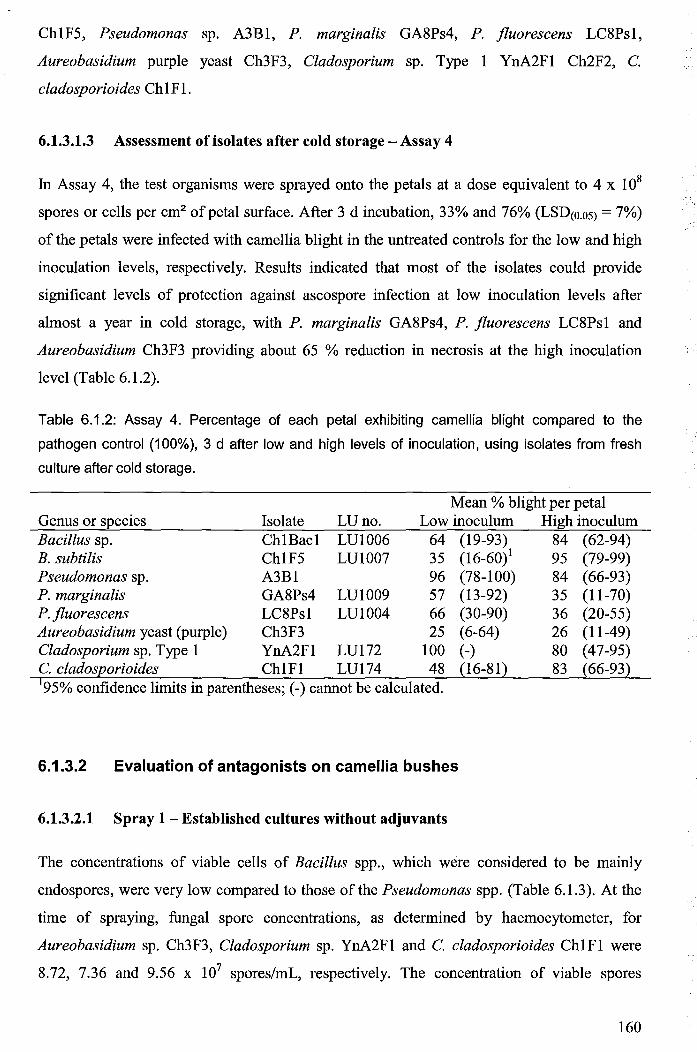
ChlF5, Pseudomonas sp. A3Bl, P. marginalis GA8Ps4, P. fluorescens LC8Psl,
Aureobasidium purple yeast Ch3F3, Cladosporium sp. Type 1 YnA2Fl Ch2F2, C.
cladosporioides ChlF1.
6.1.3.1.3 Assessment of isolates after cold storage - Assay 4
In Assay 4, the test organisms were sprayed onto the petals at a dose equivalent to 4 x 10⁸
spores or cells per cm2 of petal surface. After 3 d incubation, 33% and 76% (LSD(o.05) = 7%)
of the petals were infected with camellia blight in the untreated controls for the low and high
inoculation levels, respectively. Results indicated that most of the isolates could provide
significant levels of protection against ascospore infection at low inoculation levels after
almost a year in cold storage, with P. marginalis GA8Ps4, P. fluorescens LC8Psl and
Aureobasidium Ch3F3 providing about 65 % reduction in necrosis at the high inoculation
level (Table 6.1.2).
Table 6.1.2: Assay 4. Percentage of each petal exhibiting camellia blight compared to the
pathogen control (100%), 3 d after low and high levels of inoculation, using isolates from fresh
culture after cold storage.
Mean % blight per petal Genus or species Isolate LU no. Low inoculum High inoculum Bacillus sp. ChlBacl LUI006 64 (19-93) 84 (62-94) B. subtilis ChlF5 LUI007 35 (16-60)1 95 (79-99) Pseudomonas sp. A3Bl 96 (78-100) 84 (66-93) P. marginalis GA8Ps4 LUI009 57 (13-92) 35 (11-70) P.fluorescens LC8Psl LUlO04 66 (30-90) 36 (20-55) Aureobasidium yeast (purple) Ch3F3 25 (6-64) 26 (11-49) Cladosporium sp. Type 1 YnA2Fl LU172 100 (-) 80 (47-95) C. cladosporioides ChlFl LU174 48 (16-81) 83 (66-93) 195% confidence limits in parentheses; (-) cannot be calculated.
6.1.3.2 Evaluation of antagonists on camellia bushes
6.1.3.2.1 Spray 1 - Established cultures without adjuvants
The concentrations of viable cells of Bacillus spp., which were considered to be mainly
endospores, were very low compared to those of the Pseudomonas spp. (Table 6.1.3). At the
time of spraying, fungal spore concentrations, as determined by haemocytometer, for
Aureobasidium sp. Ch3F3, Cladosporium sp. YnA2Fl and C. cladosporioides ChlFl were
8.72, 7.36 and 9.56 x 10⁷ spores/mL, respectively. The concentration of viable spores
160
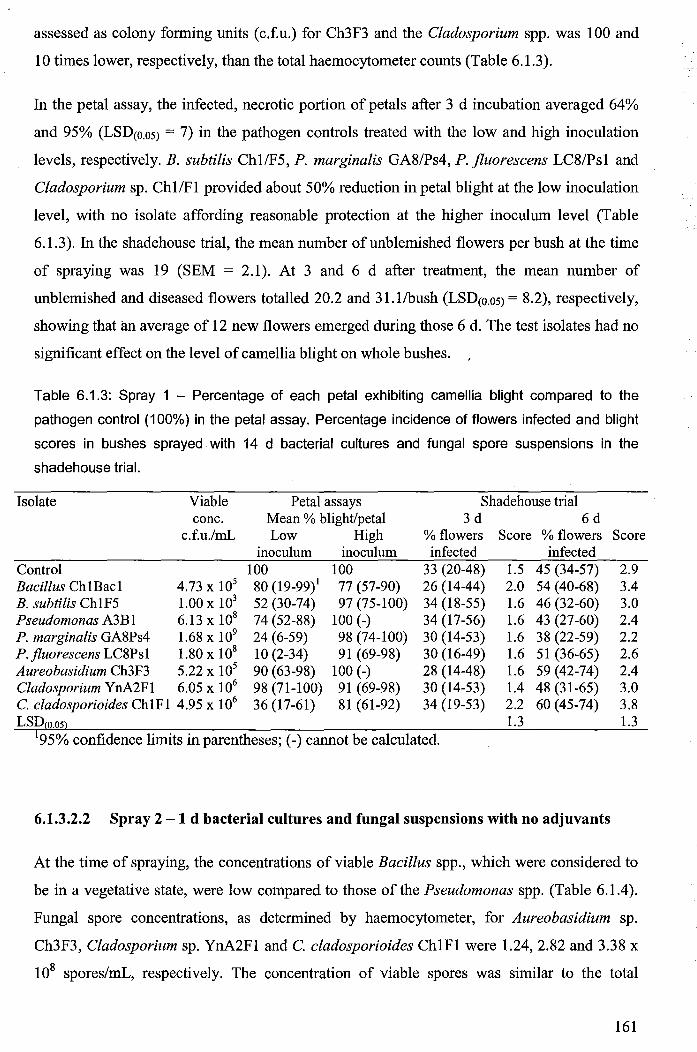
assessed as colony forming units (c.f.u.) for Ch3F3 and the Cladosporium spp. was 100 and
10 times lower, respectively, than the total haemocytometer counts (Table 6.1.3).
In the petal assay, the infected, necrotic portion of petals after 3 d incubation averaged 64%
and 95% (LSD(o.05) = 7) in the pathogen controls treated with the low and high inoculation
levels, respectively. B. subtilis Chl/F5, P. marginalis GA8/Ps4, P. fluorescens LC8/Psl and
Cladosporium sp. ChllFl provided about 50% reduction in petal blight at the low inoculation
level, with no isolate affording reasonable protection at the higher inoculum level (Table
6.1.3). In the shadehouse trial, the mean number of unblemished flowers per bush at the time
of spraying was 19 (SEM = 2.1). At 3 and 6 d after treatment, the mean number of
unblemished and diseased flowers totalled 20.2 and 31.1/bush (LSD(o.05) = 8.2), respectively,
showing that an average of 12 new flowers emerged during those 6 d. The test isolates had no
significant effect on the level of camellia blight on whole bushes.
Table 6.1.3: Spray 1 - Percentage of each petal exhibiting camellia blight compared to the
pathogen control (100%) in the petal assay. Percentage incidence of flowers infected and blight
scores in bushes sprayed with 14 d bacterial cultures and fungal spore suspensions in the
shadehouse trial.
Isolate Viable Petal assays Shadehouse trial conc. Mean % blight/petal 3d 6d
c.f.u./mL Low High % flowers Score % flowers Score inoculum inoculum infected infected
Control 100 100 33 (20-48) 1.5 45 (34-57) 2.9 Bacillus Ch1Bac1 4.73 x 10⁵ 80 (19-99)1 77 (57-90) 26 (14-44) 2.0 54 (40-68) 3.4 B. subtilis Ch1F5 1.00 x 10³ 52 (30-74) 97 (75-100) 34 (18-55) 1.6 46 (32-60) 3.0 Pseudomonas A3B 1 6.13 x 10⁸ 74 (52-88) 100 (-) 34 (17-56) 1.6 43 (27-60) 2.4 P. marginalis GA8Ps4 1.68 x 10⁹ 24 (6-59) 98 (74-100) 30 (14-53) 1.6 38 (22-59) 2.2 P. fluorescens LC8Psi 1.80 x 10⁸ 10 (2-34) 91 (69-98) 30 (16-49) 1.6 51 (36-65) 2.6 Aureobasidium Ch3F3 5.22 x 10⁵ 90 (63-98) 100 (-) 28 (14-48) 1.6 59 (42-74) 2.4 Cladosporium YnA2Fl 6.05 x 10⁶ 98 (71-100) 91 (69-98) 30 (14-53) 1.4 48 (31-65) 3.0 C. cladosporioides ChlFI 4.95 x 10⁶ 36(17-61) 81 (61-92) 34 (19-53) 2.2 60 (45-74) 3.8 LSD(o.05l 1.3 1.3
195% confidence limits in parentheses; (-) cannot be calculated.
6.1.3.2.2 Spray 2 - 1 d bacterial cultures and fungal suspensions with no adjuvants
At the time of spraying, the concentrations of viable Bacillus spp., which were considered to
be in a vegetative state, were low compared to those of the Pseudomonas spp. (Table 6.1.4).
Fungal spore concentrations, as determined by haemocytometer, for Aureobasidium sp.
Ch3F3, Cladosporium sp. YnA2Fl and C. cladosporioides ChlFI were 1.24,2.82 and 3.38 x
108 spores/mL, respectively. The concentration of viable spores was similar to the total
161
concentration of spores of Aureobasidium sp. Ch3F3, but was lower compared with the
haemocytometer counts by a factor of 10 for the other two isolates (Table 6.1.4).
In the petal assay, the infected, necrotic portion of petals after 3 d incubation averaged 53%
and 78% (LSD(o.os) = 10%) in the pathogen controls for the low and high inoculation levels,
respectively. All isolates provided some degree of protection against camellia blight, at the
low and high inoculum levels, except Bacillus sp. Ch1Bacl (Table 6.1.4). In the shadehouse
trial, the mean number of unblemished flowers per bush at the time of spraying was 16 (SEM
= 1.6). At 3 and 6 d after treatment, the mean number of flowers per bush was 42 and 41
(LSD(o.os) = 8), respectively. Therefore, on average 26 new flowers per bush emerged in that 6
d period. No isolate was effective in suppressing the camellia blight as measured by the
incidence of infected flowers, or the camellia blight scores (Table 6.1.4).
Table 6.1.4: Spray 2 - Percentage of each petal exhibiting camellia blight compared to the
pathogen control (100%) in the petal assay. Percentage incidence of flowers infected and blight
scores in bushes sprayed with 1 d bacterial cultures and fungal spore suspensions in the
shadehouse trial.
Isolate Viable Petal assays Shadehouse trial conc. % mean blight/petal 3 d 6 d
c.f.u./mL Low High % flowers Score % flowers Score inoculum inoculum infected infected
Control 100 100 25 (18-35) 2.6 71 (61-79) 4.6 Bacillus Ch1Bac1 1.70 x 10⁴ 79 (56-92)' 98 (66-100) 16 (9-28) 1.8 69 (57-79) 6.0 B. subtilis Ch1F5 3.02 x 10³ 58 (35-77) 44 (24-66) 31 (21-43) 4.2 77 (60-88) 5.0 Pseudomonas A3B1 4.00 x 10¹³ 66 (33-89) 35 (14-62) 23 (14-36) 1.6 60 (48-71) 5.2 P. marginalis GA8Ps4 3.18 x 10¹⁰ 39 (13-73) 67 (32-89) 22 (13-34) 1.6 76 (63-86) 6.4 P.fluorescens LC8Ps1 1.54 x 10¹⁰ 28 (11-55) 12 (3-35) 17 (9-31) 1.6 53 (39-66) 5.6 Aureobasidium Ch3F3 5.10 x 10⁸ 77 (1-100) 79 (52-93) 29 (15-48) 4.0 71 (52-85) 5.9 Cladosporium YnA2F1 1.32 x 10⁷ 82 (51-95) 92 (67-98) 40 (23-60) 3.2 64 (44-79) 4.2 C. cladosporioides Ch1F1 2.12 x 10⁷ 10 (0-81) 67 (37-87) 24 (15-36) 2.2 75 (64-84) 4.8 LSD(o.os) 2.3 2.3
195% confidence limits in parentheses; (-) cannot be calculated.
6.1.3.2.3 Spray 3 -1 d bacteria cultures, and Break-Thru® added to the suspensions
At the time of spraying, the concentrations of viable vegetative Bacillus spp. cells were
considerably lower than those of the Pseudomonas spp. Fungal spore concentrations, as
determined by haemocytometer for Aureobasidium sp. Ch3F3, Cladosporium sp. YnA2F1
and C. cladosporioides Ch1F1 were 3.04, 1.65 and 4.28 x 10⁸ spores/mL, respectively. The
concentration of viable spores was lower than the haemocytometer counts by a factor of 10
for fungal isolates CH3F3 and YnA2F1, whereas for Ch1F1, it was unaltered (Table 6.1.5).
162
In the petal assay, the infected, necrotic portion of petals after 3 d incubation averaged 35%
and 85% (LSD(o.05) = 9%) in the pathogen controls for the low and high inoculation levels,
respectively. The addition of the surfactant to the cell/spore suspensions enhanced the efficacy
of some isolates compared to the previous spray formulation. Bacillus sp. ChIBac1, B.
subtiUs ChIF5, Pseudomonas sp. A3BI and P. fluorescens LC8PsI provided almost complete
protection against camellia blight at both the low and high inoculum levels, whereas P.
marginalis GA8Ps4 and Cladosporium sp. Ch1F1 provided almost total protection at the low
level of inoculation only (Table 6.1.5). In the shadehouse trial, the mean number of
unblemished flowers per bush at the time of spraying was 17 (SEM= 1.5). At 3 and 6 dafter
treatment, there were 30 and 37 flowerslbush (LSD(o.05) = 8). Therefore, an average of20 new
flowers emerged per bush in that 6 d period. Although many of the isolates afforded high
levels of protection against camellia blight in the petal assays, there was no evidence from the
proportion of infected flowers or camellia blight scores that these isolates reduced the
incidence of camellia blight (Table 6.1.5). However, the scores on the severity of camellia
blight suggested that the impact of camellia blight appeared to be lower for bushes treated
with Cladosporium YnA2F1 at both assessment times.
Table 6.1.5: Spray 3 - Percentage of each petal exhibiting camellia blight compared to the
pathogen control (100%) in the petal assay. Percentage incidence of flowers infected and blight
scores in bushes sprayed with 1 d bacterial cultures and 14 d fungal spore suspensions
containing Break-Thru® surfactant in the shadehouse trial.
Isolate Viable Petal assays Shadehouse trial conc. Mean % blight/petal 3d 6d
c.f.u./mL Low High % flowers Score % flowers Score inoculum inoculum infected infected
Control 100 100 41 (31-53) 3.9 73 (63-80) 5.4 Bacillus Ch1Bac1 1.00 x 10² 0(_)1 9 (3-25) 42 (29-56) 4.2 81 (68-89) 6.8 B. subtilis Ch1F5 1.00 x 10² 4 (0-37) 4 (0-26) 47 (27-67) 3.0 72 (51-86) 4.6 Pseudomonas A3B 1 6.51 x 10¹³ 0(-) 0(0-68) 43 (31-57) 2.4 66 (54-76) 5.0 P. marginalis GA8Ps4 1.31 x 10¹³ 4 (0-42) 78 (60-90) 39 (24-56) 2.6 74 (57-86) 5.0 P. fluorescens LC8Ps 1 1.28 x lOIS 1 (0-40) 1 (0-24) 31 (19-47) 3.0 70 (55-82) 5.6 Aureobasidium Ch3F3 1.16 x 10⁷ 58 (19-89) 89 (73-96) 40 (20-65) 2.0 67 (48-81) 4.0 Cladosporium Y nA2F 1 7.06 x 10⁶ 66 (45-82) 73 (55-86) 34 (17-57) 1.6 66 (47-81) 3.8 C. cladosporioides Ch1F1 1.80 x 10⁹ 0(-) 45 (24-68) 46 (32-60) 4.4 82 (70-90) 6.4 LSDf OS) 1.8 1.8
95% confidence lImIts In parentheses; (-) cannot be calculated.
The addition of Break-Thru to the spray mix resulted in pigmentosis in the petal assay, in
which the outside portion of the pink petals appeared purple or white. The effect was only
observed on petals treated with the bacterial isolates A3B1, Ch1Bac1, Ch1F5, GA8Ps4 and
163

LC8Ps1, where 33, 10, 10, 17 and 20% (LSD(o.05) = 15%) of the petal area exhibited
symptoms of pigmentosis 3 d after spraying and treated with the low pathogen inoculum.
Isolates A3B1, ChlBac1, Ch1F5 and LC8Psl also induced necrosis (brown staining) of petal
tissue of 5,2,4 and 5% (LSD(o.05) = 4) compared to the other isolates where no necrosis was
observed. No symptoms of phytotoxicity or pigmentosis were observed during the
assessments on camellia bushes in the shadehouse trial.
6.1.3.2.4 Spray 4 - 1 d bacterial cultures and Codacide added to the suspensions
At the time of spraying, the concentrations of viable Bacillus spp. were 100 times lower than
those of the Pseudomonas spp. (Table 6.1.6). Fungal spore concentrations, as determined by
haemocytometer, for Aureobasidium sp. Ch3F3, Cladosporium sp. YnA2F1 and C.
cladosporioides ChlFl were 3.41, 2.33 and 2.35 x 10⁸ spores/mL, respectively. The
concentration of viable spores was lower than the haemocytometer counts by a factor of 10
(Table 6.1.6).
In the petal assay, the infected, necrotic portion of petals after 3 d incubation averaged 90%
and 100% (LSD(o.05) = 6%) in the pathogen controls for the low and high inoculation levels,
respectively. Bacillus sp. ChlBacl, B. subtilis ChIF5, and both isolates of Cladosporium sp.
provided at least 50% reduction in the incidence of camellia blight, but only at the low
inoculum level (Table 6.1.6). In the shadehouse trial, the mean number of unblemished
flowers per bush at the time of spraying was 12 (SEM = 1.3). At 3 and 6 d after treatment,
there averaged 15 and 16 flowers per bush (LSD(o.05) = 8), indicating that on average only 4
new flowers per bush emerged in that period. Only B. subtilis Ch1F5 provided some
protection against camellia blight 3 and 6 d after treatment, reducing the proportion of
infected flowers from 53-59% in the pathogen control to 20-28%. However, this level of
control was not reflected in the blight scores.
164
Table 6.1.6: Spray 4 - Percentage of each petal exhibiting camellia blight compared to the
pathogen control (100%) in the petal assay. Percentage incidence of flowers infected and blight
scores in bushes sprayed with 1 d bacterial cultures and 14 d fungal spore suspensions
containing Codacide® adjuvant in the shade house trial.
Isolate Viable Petal assays Shadehouse trial conc. Mean % blight/petal 3d 6d
c.f.u./mL Low High % flowers Score % flowers Score Inoculum inoculum infected infected
Control 100 100 53 (39-67) 4.5 59 (45-73) 6.2 Bacillus ChlBac1 1.72 x 10⁶ 31 (17-50)1 100 (-) 51 (29-73) 6.0 49 (28-70) 6.5 B. subtilis ChlF5 1.44 x 10⁵ 15 (5-36) 97 (79-100) 20 (6-49) 3.2 28 (12-52) 5.6 Pseudomonas A3Bl 5.67 x 10⁸ 88 (70-96) 95 (78-99) 50 (32-68) 5.0 54 (37-71) 4.8 P. marginalis GA8Ps4 5.67 x 10⁸ 71 (53-85) 100 (-) 62 (31-86) 5.0 65 (29-89) 7.0 P.fluorescens LC8Psi 1.00 x 10⁸ 66 (47-81) 95 (79-99) 64 (36-85) 4.4 70 (37-90) 5.6 Aureobasidium Ch3F3 1.74 x 10⁷ 97 (79-100) 100 (-) 74 (47-90) 4.2 56 (30-79) 5.8 Cladosporium YnA2Fl 1.16x10⁷ 47 (27-67) 72 (54-86) 53 (31-74) 2.6 47 (27-68) 4.8 C. cladosporioides ChlFl 1.31 x 10⁷ 30 (15-51) 55 (37-72) 54 (29-72) 5.8 62 (41-79) 6.0 LSD\o.05) 2.4 2.4
95% confidence lImIts m parentheses; (-) cannot be calculated.
6.1.4 Discussion
The approach of spraying camellia bushes with microorganisms that can protect camellia
flowers against ascospore infection was evaluated comprehensively on flowering camellia
bushes in the shadehouse trials, but there was little evidence of its success for control of
camellia blight. Some of the test organisms reduced lesion severity in the petal assays, but
results were inconsistent between repeat assays. This inconsistency could have been caused
by a number of factors. In the first three assays (Assays 1-3), there was difficulty in regulating
the discharge of viable ascospores and therefore their distribution on the petals. In assays
where large numbers of ascospores were released, spores would be more likely to land on
portions of the petal that were not colonised by the test microorganism. Only one C·camelliae
ascospore is required to give total infection of the petal, so once penetration occurred, the
opportunity for any micro-organism to suppress C. camelliae mycelium would be limited.
This issue was addressed in subsequent assays (Spray assays 1-4) that were run in conjunction
with the shadehouse trial, by comparing the efficacy of the test organisms under low and high
ascospore inoculation levels. While the efficacy of all test isolates was generally lower with
high pathogen inoculation level than low levels in the petal assays, there were exceptions. In
Assay 3, the isolates Bacillus sp. ChlBacl, B. subtilis ChlF5, Pseudomonas sp. A3Bl and P.
fluorescens LC8Psi gave almost complete protection against ascospore infection with both
165
intensities of ascospore deposition (Table 6.1.5), indicating that under favourable conditions,
these isolates could protect the petal irrespective of disease pressure.
Another contributing factor was the different concentrations of cells or spores in the isolate
suspensions between experiments. Although the concentration of the test organisms was kept
at about 1 x 10⁷ units/mL in the screens, it differed between assays and between isolates
within assays over all of the four shadehouse trials. The minimum concentrations usually
needed for micro-antagonists to be effective as biocontrol agents are 1 x 10⁸ for bacteria and 1
x 106 for fungal spores (A. Stewart pers. comm. 2002). These concentrations were achieved
and in most cases exceeded for all isolates except the Bacillus sp., where concentrations in the
spray solution were measured at 1 x 10² viable cells/mL (Table 6.1.5) to 1.7 x 10⁶ viable
cells/mL (Table 6.1.6). Nevertheless, both Bacillus isolates were able to provide almost
complete protection of camellia blight in one petal assay (Table 6.1.5). This implied that
either the bacteria were very potent at low concentrations, or that the methods used to count
the viable cells of Bacillus spp. were not entirely suitable. The most likely reason for the low
detection of viable cells was that the PDA medium used to grow the Bacillus spp. colonies
was not conducive to their growth. When NA was used for plating the serially diluted 1 d
cultures of B. subtilis ChlF5 for example, a concentration of 4.6 x 10⁸ viable cells/mL was
recorded (Appendix 7). Therefore, the measurements of the concentration of viable Bacillus
spp. cells, in the assays conducted in conjunction with the four Spray cycles, probably
underestimated the actual concentration of viable Bacillus cells applied to the bushes.
Control of camellia blight by the efficacious test organisms in the petal assays was likely to be
by inhibition of ascospore germination, since C. camelliae ascospores germinate and form
short germ tubes that penetrate the petal cuticle within 6-18 h after inoculation (Vingnana
Singam et al. 2000). In many cases in the assays, protection from infection was absolute, and
remained that way for at least 6 d. Once the germ tube had penetrated the petal cuticle and
grew intercellular hyphae, prevention of petal necrosis by the antagonist would be difficult.
There was also no evidence from the petal assays associated with the spray cycles 1-4 to
support the presence of antagonism at the subcuticular level. If the inhibition of the
subcuticular hyphae had occurred, the size of any necrotic lesion would be expected to remain
stable. Necrotic lesions would have remained unaltered in size between the 3 d and 6 d
assessments. However, in all of these assays, partial control of camellia blight by all of the
antagonists recorded in the first assessment was followed by an increase in the proportion of
necrotic tissue, as recorded in the second assessment after 6 d.
166

The strategy used by antagonists of suppressing gennination of pathogen spores on the
phylloplane, rather than by attacking the hyphae as it advances through host tissue, has been
reported elsewhere. A suspension of a Pseudomonas sp. at 108 cells/mL protected apples
against grey mould during storage, by inhibiting spore gennination and genn tube elongation
of Botrytis cinerea rather than by inhibiting mycelial growth (Sobiczewski and Bryk 1999).
Pseudomonas jluorescens applied to the leaves of castor bean 0-48 h before inoculation with
Alternaria ricini spores, inhibited gennination of the spores by antibiosis, to control
Alternaria leaf spot (Silva et al. 1998).
The means by which the potential antagonists of this study suppressed gennination of
pathogen spores on the petal surface probably varied between the isolates. The antagonists
represented four disparate genera or types - Bacillus, Pseudomonas, Cladosporium and yeasts.
There is a wide diversity of organisms from which are effective phylloplane antagonists has
been reported in many studies (Expert and Digat 1995; Boland and Hunter 1988; Peng and
Sutton 1991). This implies that there would be a number of different antifungal mechanisms
involved in preventing gennination of ascospores from plant pathogens that inhabit the
phylloplane. Indeed, a number of anti-fungal mechanisms have been identified. Production of
siderophores, lytic enzymes, antibiotics, and cyanide were identified as mechanisms by which
Bacillus subtilis and Pseudomonas jluorescens inhibited growth of Verticillium dahliae to
reduce the incidence of verticillium wilt in a crop of rape (Berg et al.1994; 1998). Often
antibiotics are involved in antagonism. The antibiotics, pyocyanin, pyrrolnitrin and phenazine
carboxamide, isolated from P. jluorescens, were shown to inhibit growth of Botrytis cinerea
and spore gennination of Cladosporium cucumerinum (Dahiya et al. 1988). Rhamnolipid B, a
glycolipid antibiotic secreted by P. aeruginosa was found to lyse genninating spores of
Phytophthora capsici on pepper to provide control against phytophthora blight, and to inhibit
gennination of Colletotrichum orbiculare spores to control anthracnose on leaves of
cucumber plants (Kim et al. 2000).
Competition for nutrients on the surface of the phylloplane could also have occurred. The
means by which Pseudomonas spp. reduced genn tube development and branching by
Colletotrichum coccodes on velvetleaf, was attributed to competition for carbon and nitrogen
sources by the antagonist (Fernando et al. 1996). Pseudomonas spp. and the yeast
Sporobolmyces were shown to inhibit gennination of Botrytis cinerea conidia after 24 h in
water droplets on leaves, to a level directly proportional to their consumption of amino acids
from nutrient solutions (Brodie and Blakeman 1976). The mechanisms for inhibition by
Cladosporium spp. may also be associated with competition. C. cladosporioides was
167
implicated in inhibition of white mould of bean, which affected gennination of ascospores of
Sclerotinia sclerotiorum, by prior colonisation of senescent petals thereby preventing
establishment of the pathogen, through competition for nutrients rather than by parasitism or
antibiosis (Boland and Hunter 1988).
Campbell (1989) reported that where the test organisms inhibited gennination of ascospores
by competing for nutrients, high humidities are necessary. A drop of water was required
around the antagonist spore for competitive uptake of nutrients. This lack of moisture has
been used to explain why antagonism by nutrient competition does not nonnally occur under
field conditions. Bisiach et al. (1985) found that conidial suspensions of Trichoderma viride,
T. hamatum, T. harzianum, Cladosporium sp. and Aureobasidium sp. reduced the incidence of
B. cinerea in the field, but the effect varied greatly with the weather conditions, cultivar,
vineyard and antagonist used in the 4-6 applications during the growing season.
In the petal assays of this study, some antagonists completely covered inoculated surfaces of
petals in conditions of moderate temperature, high humidity and low ultraviolet light levels.
Under these conditions, the fonnulations of Bacillus spp. Ch1Bac1 and Ch1F5, Pseudomonas
spp. A3Bl, GA8Ps4 and LC8Ps1 and Cladosporium sp. Ch1F1 were able to provide partial or
complete protection from camellia blight. However, in the shadehouse trials, none of the
isolates gave protection against the disease on whole flowers. To be effective under these
conditions, the test microorganisms were required to rapidly colonise the petal surfaces in
order to provide protection against ascospore infection, while being sUbjected to fluctuating
temperatures, humidities and much higher ultraviolet levels than experienced in the petal
assays. They were applied about 6 h before C. camelliae apothecia were brought into the
vicinity of the flowering camellia bushes, which meant that the test organisms had only about
6 h to colonise the unblemished blooms. Since new flowers were also emerging during each
of the spray cycles, it is likely that results would only have been statistically significant if they
too were colonised by the test organisms.
Enough colony fonning units of the test organism needed to survive on the pre-emerging
buds, and to migrate or be dispersed from the bud sepals onto the emergent blooms, in
sufficient quantities to enable colonisation of the surface of each petal in the bloom if they
were to prevent gennination of C. camelliae ascospores. The colonisation of the bloom would
need to occur from bud opening, to cover a very large area of petal phylloplane within 1-2 d.
For example, a bloom of C. japonica cvar. Little Michael comprises 22 petals, which average
12 cm2/petal, giving a total surface area of about 500 cm2. The more complex blooms of other
168

cultivars have a much greater surface area of phylloplane. The rapid colonisation of the
blooms that would be required to cover the petal surfaces would be difficult to achieve by the
antagonists. Inadequate cover of petal surfaces by the antagonists alone could explain why no
control of camellia blight was observed in the shadehouse trials.
Unlike the situation in the shadehouse trials where the ascospores were released 6 h after the
test organisms were applied, under field conditions the ascospores could be released
throughout the day, and contact petals anytime after spray application. To provide adequate
protection against ascospore infection in practice, the test organisms would therefore need to
colonise the total petal surfaces immediately after application, and remain viable for the
duration of the bloom, until flower senescence or the next spray application. The test
organisms would have also needed to be extremely ruderal, and to colonise the burgeoning
bloom against competing microorganisms at a rate that met or exceeded the incursion of any
competitors. Inglis and Boland (1990) found that the number of yeasts and filamentous fungi
from freshly-opened bean and rapeseed petals averaged 3.0 x 10³ and 5.7 x 10² c.f.u./mg
corolla (dry weight) and increased 1700- and 263-fold, respectively, as petals aged. Bacteria
initially averaged 1.1 x 10⁴ c.f.u./mg corolla and increased 446-fold as the petals aged.
Therefore, rapid colonisation of the burgeoning blooms by the test organisms, while
competing against microorganisms vying for the same space on the phylloplane, is a major
challenge.
In this current study, adjuvants were tested to enhance colonisation of the test organisms on
the petal phylloplane, but were not shown to be of benefit. In the initial screen, although
0.01 % Break-Thru® surfactant markedly improved spreadability of the spray droplets on the
petals after 4 d incubation, it did not enhance the efficacy of the isolates by reducing the
incidence of C. camelliae infection. This implied that in the assays, coverage of the test
organisms over the petals was high enough in sprays where the surfactant was not added, to
provide the maximum potential protection. Under field conditions though, coverage of the
petals by the biocontrol agents would be appreciably less, and a surfactant added to the spray
formulation might have helped spread the test organism over the whole petal. However, none
of the eight isolate suspensions sprayed onto camellia bushes controlled camellia blight, even
when formulated with either 0.01% Break-Thru® organo-silicon surfactant or Codacide®
ultraviolet protectant sticker-oil. Elad (2000) also found that the addition of the adjuvant JMS
Stylet-Oil to Trichoderma harzianum T39 did not contribute to the control of foliar diseases
in tomato or cucumber greenhouse crops caused by Botrytis cinerea, Sclerotinia sclerotiorum
and Cladosporiumfulvum.
169

The inability of the test antagonists to control camellia blight in this study is in contrast to the
many positive reports of Sclerotinia and Botrytis diseases being controlled by using isolates
of Bacillus, Pseudomonas, Cladosporium and yeast species, that support the contention that
biocontrol of ascospore-generated pathogens can be successful. Liao and Luo (2000) reported
that six isolates of Bacillus spp. obtained from petals and stamens of rape (Brassica napus)
were shown to be effective against infection by S. sclerotiorum on rape plants. In another
study, four protective foliar sprays of Bacillus subtilis cells applied to white bean (Phaseolus
vulgaris) weekly over the flowering period for 4 years, controlled S. sclerotiorum white
mould. Success of the method increased incrementally each year, providing a significant
decrease in incidence and severity of the disease, which was reflected in improved clean seed
yields (Tu 1997). In another example of successful biocontrol, one isolate each of Bacillus
pumilus and Pseudomonas fluorescens were as effective or more so than application of
standard dichlofluanid sprays in protecting strawberry plants against grey mould under field
conditions (Swadling and Jeffries 1996). Gould et al. (1996) recovered a strain of P.
fluorescens from the surface of Petunia plants that reduced the incidence of Botrytis blight in
Petunia flowers by 77% over seven trials.
However, application of antagonists shown to be effective in preventing infection in petal
assays, to foliage of camellia bushes to control camellia blight, does not appear promising. A
related strategy that might hold more promise is to be investigated by Peter Long (pers.
comm. 2002). It involves foliar application of calcium bicarbonate to provide a favourable
environment to enhance the efficacy of micro-antagonists that exist on the flower phylloplane.
Inglis and Boland (1990) have reported suppression of ascospore germination by indigenous
microflora. Under greenhouse conditions, they found that the natural microflora of bean
(Phaseolus vulgaris) petals used to protect bean leaves, inhibited germination of ascospores
of S. sclerotiorum, and resulted in 66-84% fewer initial white mould lesions than in
unprotected leaves.
In this study, although isolates of Bacillus sp., Pseudomonas sp., Aureobasidium sp. and
Cladosporium sp. provided partial or complete control of camellia blight by inhibiting
ascospore infection by C. camelliae in a repeat in vitro petal assay, their efficacy could not be
duplicated when applied to flowers on camellia bushes. There was no evidence of even partial
control of camellia blight in situ to justify the inconvenience of repeated applications of
microbial antagonists to camellia bushes in flower. An alternative strategy of stimulating the
defence mechanisms of camellia plants to prevent infection by C. camelliae ascospores is
investigated in the following section.
170

6.2
6.2.1
Induction of resistance in camellia flowers to
infection using acibenzolar-s-methyl
Introduction
Oostendorp et al. (2001) reported that plants can be induced to become more resistant to
diseases through effects of various biotic or abiotic factors. The biological inducers of
resistance include necrotising pathogens, non-pathogens or root colonising bacteria. Through
a network of signal pathways, they have been reported to induce resistance spectra and marker
proteins characteristic of the different plant species and activation systems. The most well
known signal pathways for systemically induced resistance are those involved in systemic
acquired resistance. These are characterised by induction of protein complexes in plants, and
frequently a dependence on salicylic acid, which provides for protection against a broad range
of pathogens. Various chemicals have been discovered that seem to mimic all or parts of the
biological activation of resistance at various points in these metabolic pathways. Probenazole
(Oryzemate) has been used on rice to induce resistance against two pathogens causing rice
blast and bacterial leaf blight. Beta-aminobutyric acid and extracts from plants and
microorganisms have also been described as resistance inducers.
Chemical induction of systemic acquired resistance using salicylic acid has been shown to be
effective against some fungal pathogens on flowers. Reglinski et al. (2001) found that pre
treatment of leaves of kiwifruit vines with salicylic acid or pre-inoculation with Sclerotinia
sclerotiorum induced resistance to a challenge inoculation with the pathogen 4 d later, and
resulted in lesions half the size to those on untreated controls. Resistance was induced in
adjacent leaves in the direction of the trunk but not in the direction of the shoot tip. In general,
salicylic acid does not affect the pathogen itself, but stimulates production of glucanase and
chitinase enzymes that can be translocated to distal plant parts to degrade fungal or bacterial
cell walls (Kessmann et al. 1996). Beasley et al. (1999) found that eight weekly, pre-harvest
foliar sprays of salicylic acid, applied at 2 mg/L to Geraldton waxflower (Chamelaucium
uncinatum) plants reduced colonisation by Alternaria sp. and Epicoccum sp. on flower tissue,
but led to an associated increase in infection by Botrytis cinerea and Cladosporium sp.,
indicating that the induced response was species-specific and not active against all pathogens.
An analogue of salicylic acid, the synthetic benzothiadiazole acibenzolar-S-methyl (S-methyl
benzo[I,2,3]thiadiazole-7-carbothioate), has been the most studied resistance activator.
Acibenzolar-S-methyl is translocated systemically in plants and can take the place of salicylic
171

acid in the natural systemic acquired resistance signal pathway, inducing the same spectrum
of resistance and the same set of molecular markers (Oostendorp et al. 200 I). Acibenzolar-S
methyl appears more mobile than salicylic acid. The signal(s) that induced resistance in
cucumber plants against scab caused by Cladosporium cucumerinum after treatment with
acibenzolar-S-methyl were rapidly transferred from treated leaves to untreated upper and
lower leaves where systemic resistance was elicited, whereas exogenously applied salicylic
acid induced only localised acquired resistance (Narusaka et al. 1999a).
Acibenzolar-S-methyl has been developed by Novartis (Kessmann et al. 1996), and was
marketed in the mid 1990's as a plant activator to control powdery mildew in wheat (Ruess et
al. 1996). It has since been shown to be effective in inducing resistance in a number of plants,
against diseases of economic importance. The commercial formulation CGA 245704 (Bion)
containing 50% of acibenzolar-S-methyl has since been shown to activate resistance in many
crops against a broad spectrum of diseases caused by fungi, bacteria and viruses. Bion
systemically protected tomato plants against Pseudomonas syringes pv. tomato and pepper
plants against Xanthomonas campestris pv. vesicatoria (Scarponi et al. 2001a). Bertona et al.
(2000) reported that Bion applied to foliage at 2.5 g a.i.lhL to tomato and kidney beans
(Phaseolus vulgaris) or at 100 g a.i.lha on pear against Pseudomonas spp., gave protection
superior to the standard copper hydroxide. Bion treatments resulted in 25% more marketable
peach fruit when applied weekly to peach tree foliage, from first leaf bud break to fruit
harvest, to control bacterial spot (Xanthomonas campestris pv. pruni) (Campbell et al. 1997).
Bion was also reported to limit the growth of Sclerotinia sclerotiorum, a pathogen closely
related to C. camelliae, to reduce white mould symptoms on soya bean leaves by 60% after
four applications (Dann et al. 1998).
Bion has also been shown to be effective applied as a drench to soil or to the foliage of target
plants. Applied as a soil drench at 1 and 1000 Ilg acibenzolar S-methyl/mL, it induced
resistance in sugarcane against red rot disease caused by Colletotrichum falcatum (Sundar et
al. 2001). When applied as a soil drench or a foliar spray, Bion inhibited development of
sheath blight caused by Rhizoctonia solani on inoculated rice sheaths and its spread to the
younger sheaths, but the protective effects occurred within different times (Robilla et al.
2002). When absorbed through roots, the protective effect of acibenzolar-S-methyl was
visible after 1 h, but when applied to foliage, the protective effect could be detected after only
24 h. However, Tosi et al. (1999) found that Bion provided 80-82% protection against
Plasmopara helianthi with no phytotoxicity evident in sunflower plants when applied as a soil
drench at 150-200 mg/kg soil, and as a foliar spray 3 d before inoculation.
172

6.2.1.1 Mode of action of acibenzolar-S-methyl
Acibenzolar-S-methyl does not act on the pathogens themselves, but stimulates a pathogen
host interaction. Ishii et al. (1999) found no anti-fungal activity by acibenzolar-S-methyl on
mycelial growth and conidial germination in vitro for several pathogens of cucumber and
Japanese pear diseases. However, in potted plants it provided rapid protection against
anthracnose (Colletotrichum lagenarium) and scab (Cladosporium cucumerinum) of
cucumber, and in the field it suppressed the occurrence of rust (Venturia nashicola) and scab
(Gymnosporangium asiaticum) on Japanese pear, suggesting that control of the pathogen was
by activation of the plant's defences. The activator appears to provide the best protection
against pathogens if applied to the plant at least 24 h before inoculation of the pathogen.
Rohilla et al. (2002) observed that the degree of protection afforded by acibenzolar against
sheath blight caused by R. solani was greater if applied before 24-48 h from inoculation of the
pathogen. Ziadi et al. (2001) also found that acibenzolar-S-methyl applied to foliage of
cauliflower seedlings 1 d after inoculation with Peronospora parasitica reduced sporulation
of downy mildew by 50%, but if inoculated 2 d after treatment with the activator gave
complete protection from the disease. It appears that signal compounds can be translocated to
distal parts of plants within 2 d after application of acibenzolar-S-methyl to discrete parts of
the plant, after which time they degrade rapidly, to become undetectable after 3 d (Scarponi et
al.2001a).
The types of compounds produced by plants treated with acibenzolar-S-methyl and the time
period of the responses differ between plant species. Brisset et al. (2000) attributed the 50%
reduction of fire blight in Golden Delicious apple seedlings sprayed with acibenzolar-S
methyl at 100 or 200 mg/l and artificially inoculated with Erwinia amylovora, to the
accumulation ofbeta-l,3-glucanases and peroxidases that could be detected in leaves up to 17
d after application. In other instances chitinase production can be important. Narusaka et al.
(1999b) found resistance against scab caused by Cladosporium cucumerinum was associated
with the accumulation of chitinase, which was induced in cucumber plants after treatment
with acibenzolar-S-methyl.
6.2.1.2 Application to camellia flowers
This study evaluated Bion (500 g a.i.lL acibenzolar-S-methyl as a wettable granule, Syngenta
Crop Protection), for protection of camellia flowers from C. camellia ascospore infection.
Previously, Bion sprayed at 300 mg/L onto apple seedlings 7 d before inoculation, effectively
173
controlled Erwinia amylovora (fire blight) in pipfruit in New Zealand (Gouk & Boyd 1999).
Based on these results, the distributor recommended Bion be applied weekly to camellias at a
rate of 500 mg/L during flowering (G. Follas, pers. comm. 2000).
6.2.2 Methods
Forty, 1-1.5 m tall, potted plants of Camellia japonica, were used in the trial. The 4 year-old
plants were re-potted 2 months before treatment application in 10 L bags with a general
potting mix. The mix comprised 500 g of 12-14 month release Osmocote Plus (15% N, 3.5%
P, 9.1% K, 1.2% Mg, plus traces ofB, Cu, Fe, Mn, Mo and Zn) and 250 g dolomite lime in
200 L of bark and 50 L of sand.
The four treatments were (1) an untreated control, (2) three applications of Bion sprayed at
500 mg/L until run-off, before flower bud burst on 4, 18 and 25 July 2000, (3) 12 applications
every 7 d from commencement of flowering on 1 August 2000, and (4) all 15 applications
before and during flowering (treatments 2 and 3). The treatments were replicated 10 times in a
randomised block design. Each of the 10 blocks contained four bushes of one of the eight
camellia cultivars, Demi-Tasse, Dona Herzilia de Frietas Magalhaes, Little Michael, Nuccio's
Pearl, Sir Victor Davis and Wedding Cake; with two blocks containing a cultivar of either
Gwenneth Morey or Wilamina in common with two other blocks.
The bushes were kept in a shade-house, but those intended for spraying were moved outside
to eliminate spray drift to other bushes. Bion was applied using a knapsack sprayer containing
a hollow cone 26 nozzle with a size D2 aperture. Once the leaves had dried, the bushes were
returned to their original positions in the shade-house. At the times of spraying, in zero to
light winds, temperature ranged from 7-24°C and relative humidity from 24-70%.
During winter 2000, 1512 sclerotia were buried 10 mm deep in general camellia potting mix
within 56 trays (150 x 450 mm). The trays were distributed on the shade-house floor amongst
the camellia bushes, so that the potential inoculum sources were no more than 2 m from any
bush. Production of apothecia was monitored, and from 1 July 2000, 4 d before flowering, to
14 November 2000 at completion of flowering; 247 of the sclerotia produced a total of 384
apothecia that released enough ascospores to provide primary inoculum for infection of the
flowers during the full flowering period.
The camellia flowers were inspected once a week for disease. Each newly emerged flower
was identified with a numbered 20 mm diameter label paper-clipped to an adjacent leaf. For
174
each flower, the number of infected petals, the proportion of the flower infected, were
recorded. The proportion of petals infected was calculated by dividing the number of infected
petals per flower by the total number of petals (including stamenoids) per flower, for each
cultivar. For 10 flowers per cultivar, Gwenneth Morey averaged 87 petals, Wilamina 64,
Demi-Tasse 38, Dona Herzilia de Frietas Magalhaes 167, Little Michael 22, Nuccio's Pearl
96, Sir Victor Davis 68 and Wedding Cake 86.
The dropped flowers were placed on the soil of each pot containing the bush from which they
originated, and allowed to decay. On 6 December 2000, 7 weeks after the last flowering, the
rotting flowers were placed into individual plastic bags, and stored in a dark room at 15-18°C
for 12 weeks to allow for development of sclerotia. Sclerotia were recovered from the rotted
petals on 28 February 2001 by washing the petal matter over a 4 mm sieve. The sclerotia were
air-dried on tissue until their surfaces appeared dry, then weighed, sorted into weight classes
of 1-50, 51-250,251-700 and >701 mg, representative of small to large sclerotia, and counted.
During early flowering, the scale insect Pulvinaria floccifera Westwood was observed on the
underside of most leaves, averaging 2.3 (SEM = 0.36) scale/leaf. To prevent excessive
damage by scale, all bushes were sprayed on 2 August with Attack® (25 giL permethrin, 475
gil primiphos-methyl and 375.4 gil hydrocarbon liquid) at 1 mLiL water, until run-off.
6.2.2.1 Statistical analysis
All data were analysed using GenStat Release 4.22 (Fifth Edition). The incidence of camellia
blight and proportion of sclerotia within the weight categories were analysed by analysis of
deviance using a generalised linear model with binomial errors and a logit link (McCullagh
and Nelder 1989). The number of flowers per bush, duration of flowering, and the number
and weight of sclerotia per plant were analysed by analysis of variance. Treatment means
were compared at P:1).05, with 95% confidence limits in brackets.
6.2.3 Results
Bion showed no phytotoxic effects on camellia leaves and flowers during the trial. There was
no significant effect of Bion on the duration of flowering which averaged 9 weeks (SEM =
0.4), or on the number of flowers produced which averaged 19 per bush (SEM = 1.4).
Treatment with Bion had no significant effect on the incidence of camellia blight at any
assessment date (Table 6.2.1). During early flowering (5 th assessment), the proportion of
175
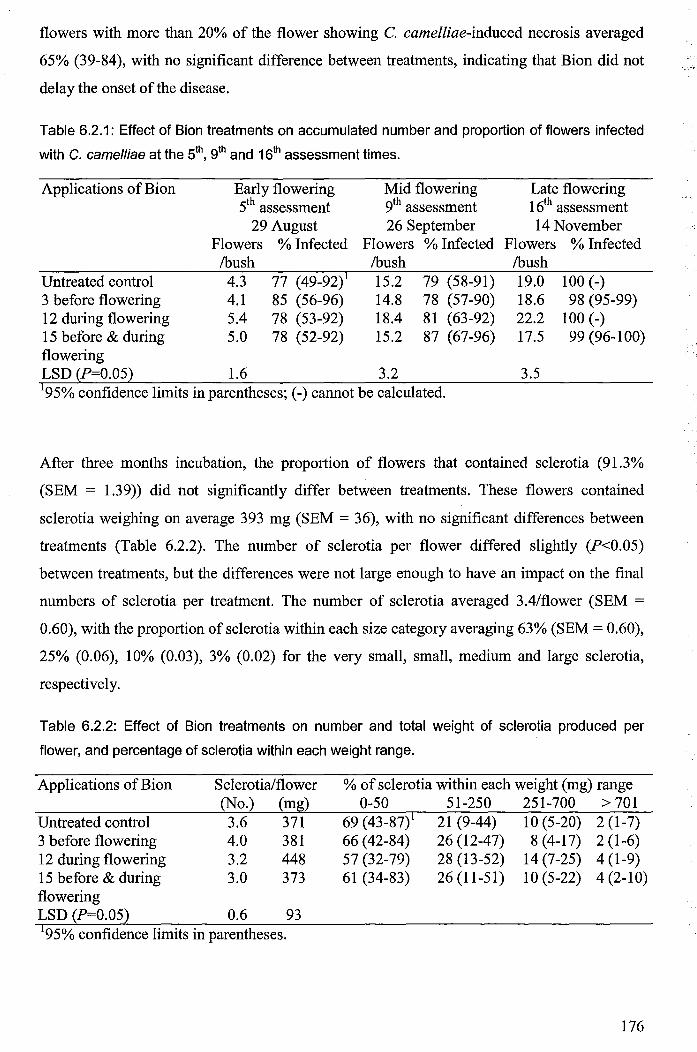
flowers with more than 20% of the flower showing C. camelliae-induced necrosis averaged
65% (39-84), with no significant difference between treatments, indicating that Bion did not
delay the onset of the disease.
Table 6.2.1: Effect of Bion treatments on accumulated number and proportion of flowers infected
with C. camelliae at the 5th, 9th and 16th assessment times.
Applications of Bion Early flowering Mid flowering Late flowering 5th assessment 9th assessment 16th assessment
29 August 26 September 14 November Flowers % Infected Flowers % Infected Flowers % Infected !bush !bush !bush
Untreated control 4.3 77 (49-92)1 15.2 79 (58-91) 19.0 100 (-) 3 before flowering 4.1 85 (56-96) 14.8 78 (57-90) 18.6 98 (95-99) 12 during flowering 5.4 78 (53-92) 18.4 81 (63-92) 22.2 100 (-) 15 before & during 5.0 78 (52-92) 15.2 87 (67-96) 17.5 99 (96-100) flowering LSD {P=0.05) 1.6 3.2 3.5 195% confidence limits in parentheses; (-) cannot be calculated.
After three months incubation, the proportion of flowers that contained sclerotia (91.3%
(SEM = 1.39» did not significantly differ between treatments. These flowers contained
sclerotia weighing on average 393 mg (SEM = 36), with no significant differences between
treatments (Table 6.2.2). The number of sclerotia per flower differed slightly (P<0.05)
between treatments, but the differences were not large enough to have an impact on the final
numbers of sclerotia per treatment. The number of sclerotia averaged 3.4/flower (SEM =
0.60), with the proportion of sclerotia within each size category averaging 63% (SEM = 0.60),
25% (0.06), 10% (0.03), 3% (0.02) for the very small, small, medium and large sclerotia,
respectively.
Table 6.2.2: Effect of Bion treatments on number and total weight of sclerotia produced per
flower, and percentage of sclerotia within each weight range.
Applications of Bion
Untreated control 3 before flowering 12 during flowering 15 before & during flowering
Sclerotia/flower (No.) (mg) 3.6 371 4.0 381 3.2 448 3.0 373
LSD (P=0.05) 0.6 93 195% confidence limits in parentheses.
% of sclerotia within each weight (mg) range 0-50
69 (43-87)1 66 (42-84) 57 (32-79) 61 (34-83)
51-250 21 (9-44) 26 (12-47) 28 (13-52) 26 (11-51)
251-700 10 (5-20) 8 (4-17)
14 (7-25) 10 (5-22)
> 701 2 (1-7) 2 (1-6) 4 (1-9) 4 (2-10)
176

6.2.4 Discussion
From this study it did not appear that Bion applied to Camellia japonica bushes induced
systemic acquired resistance that gave significant protection of flowers against ascospore
infection by Ciborinia camelliae. The bushes were sprayed weekly before and/or during
flowering, but all untreated and treated flowers became infected with camellia blight to much
the same degree. The small difference in the number of sclerotia/flower observed between
treatments was probably an artefact of the blocking structure in the trial, because the number
of sclerotia was influenced greatly by the shape of the flowers from each cultivar.
In this study, Bion was applied to the foliage of potted camellia bushes until run-off.
Consequently, some of the elicitor would have collected in the soil of the pots and potentially
been taken up through the root system of the plants. Results from other studies indicate that
this would have enhanced any responses in systemic resistance. (Sundar et al. 2001; Rohilla et
al. 2002; Tosi et al. 1999).
6.2.4.1 Explanations for lack of disease protection
Possible reasons for the lack of efficacy of Bion on camellia blight include inadequate
induction of systemic resistance, inadequate translocation of plant defence compounds or
signal molecules from leaves to flower tissue, or induction through the salicylic acid
dependent pathway might not induce resistance to C. camelliae infection. These reasons are
discussed in tum.
6.2.4.1.1 Inadequate induction of systemic resistance
Some induction of resistance may have occurred but it was not sufficient to overcome the
high disease pressure that occurred in the trial. Although the density of apothecia present in
the trial was similar to that observed in camellia gardens in the North Island, conditions in the
shadehouse may have allowed for a greater expression of the disease. The C. camelliae
ascospores would have been contained around the camellia bushes to a certain extent by the
screen of the shadehouse. The disease pressure in the trial was high considering the proportion
of blighted flowers, which averaged 81 % of flowers during early and mid flowering, and 99%
during late flowering (Table 6.2.2). However, this is considered similar to garden conditions
in most parts of New Zealand where camellia blight has been present for more than 10 years,
since general observations indicate that the majority of flowers on camellia bushes are
blighted with C. camelliae during mid to late flowering.
177
With most systemic chemicals there is a dose-related response. However, the treatments with
the highest number of applications had no effect and the rate (500 mg/L) was near the
maximum recommended by Syngenta Crop Protection NZ (George Follas pers. comm. 2000).
Thus if no significant control of camellia blight was observed at the inoculation levels in the
shadehouse trial, then it is expected to have little practical use under normal circumstances.
6.2.4.1.2 Inadequate translocation of defence compounds from leaves to flowers
The evolutionary selection pressure on camellia plants to produce flowers containing anti
fungal compounds would not be high. In performing their natural function of producing
genetically viable seed, camellia flowers need only survive in a pristine state long enough to
enable the transfer of pollen from the anthers of one flower to the stamen on the same or
different flowers for sexual reproduction. The flowers are monoecious and capable of self
pollination, although insects attracted to the blooms can be important for ensuring species
diversity. However, there is no evidence to suggest that long-lasting flowers are needed to
ensure pollination. Consequently, there would be little evolutionary advantage in camellia
plants having flowers with petals containing defence compounds, and little selection pressure
for the plant to develop pathways for the transfer of defence compounds from the leaves or
stems to petals to enhance their longevity.
However, many flowers contain essential oils, and these have been shown to have anti-fungal
properties. The essential oil of Chrysanthemum coronarium flower heads contained camphor
(29.2%), alpha-pinene (14.8%), beta-pinene (9.5%) and lyratyl acetate (9.8%) and
chamazulene (0.5%), which reduced fungal hyphal growth of Sclerotinia sclerotiorum and
Botrytis cinerea, compared with the control, when applied directly and when exposed to the
volatile components of the oil (Alvarez-Castellanos et al. 200 I). Camellia petals also contain
compounds known to have anti-fungal properties. C. Taylor (pers. comm. 2002) demonstrated
that petals of both susceptible and resistant species of camellia contain aglycones of
glycosidically-bound phenolics. However, the concentration of these compounds remained
unaltered in petals 0, 24, 48 or 72 h after inoculation with ascospores of C. cam ellia e,
suggesting that these compounds were not implicated in a response to infection by the
pathogen.
178
6.2.4.1.3 Induction of salicylic acid does not induce resistance to C. camelliae infection
Induction of the salicylic acid dependent pathway might not induce resistance to C. camelliae
infection for a number of reasons. Acibenzolar-S-methyl has been shown to induce resistance
to diseases caused by some pathogens but not others. Ishii et al. (1999) found that
acibenzolar-S-methyl applied to cucumber plants, controlled anthracnose caused by
Colletotrichum lagenarium and scab caused by Cladosporium cucumerinum, but not
Fusarium wilt caused by Fusarium oxysporum f.sp. cucumerinum. The elicitor reduced the
occurrence of rust on Japanese pear trees caused by Gymnosporangium asiaticum, but not
black spot caused by Alternaria alternata, and on melons, it had no effect on the incidence of
melon gummy stem blight caused by Didymella bryoniae, possibly because acibenzolar-S
methyl was rapidly converted to the metabolite benzo(1,2,3)thiadiazole-7-carboxylic acid,
which was shown to be ineffective in vitro against melon isolates of D. bryoniae. The elicitor
also had little effect on grey mould caused by Botrytis cinerea when applied to grapevines.
This might also be the case for ascospores and hyphae of C. camelliae, and they may not be
susceptible to induced resistance by acibenzolar-S-methyl.
Another reason could be that anti-fungal compound(s) or signal(s) induced in the leaves did
not persist long enough in the flowers after translocation from the leaves. Scarponi et al.
(2001b) found that the maximum amount of acibenzolar-S-methyl, along with its
benzothiadiazole acid derivative, that was translocated from treated leaves to untreated leaves,
was 40% of the amount applied, and this was achieved within 8 h. Moreover, residues of the
elicitor and its derivative reached negligible levels in both treated and untreated leaves after
72 h. If the same situation occurred in camellia plants, then the elicitor-induced compounds
would need to accumulate in petal tissue within 3 d before their decomposition in the leaves,
and in sufficient quantities to inhibit infection in the flowers. Results from this study indicated
that anti-fungal compounds did not accumulate in camellia petals in sufficient quantities and
in time to inhibit germination of the C. camelliae ascospores. Nevertheless, a study has shown
that micro toxins can accumulate quickly enough before decomposition to provide protection
against diseases. The 50% reduction in the incidence of fire blight in apple seedlings caused
by Erwinia amylovora was directly related to the local and systemic accumulation of defence
related enzymes induced by acibenzolar-S-methyl applied at 100 or 200 mg/L (Brisset et al.
2000). The accumulation of these enzymes, peroxidases and beta-l,3-glucanases, was
sustained in the upper untreated leaves for at least 17 days.
179
Finally, activation of pathways other than the salicylic acid dependent pathway might be
required to induce resistance to C. camelliae infection. This was shown to occur when
acibenzolar-S-methyl induced resistance in tomato to Botrytis cinerea did not affect
Sclerotinia sclerotivorum, and instead, exogenous application of jasmonate was necessary to
activate another defence pathway for induced resistance to S. sclerotiorum (Hofte et al. 200 I).
Latunde-Dada and Lucas (2001) also found that acibenzolar-S-methyl markedly inhibited
penetration by Colletrotrichum destructivum in cowpea seedlings, caused in part by a rapid
and transient increase in activities of the defence pathway enzymes phenylalanine ammonia
lyase (PAL) and chalcone isomerase (CHI), accompanied by enhanced accumulation of the
phytoalexin phaseollidin. Verification of whether defence proteins could be activated in
camellia petals via the jasmonate, PAL or CHI pathways to provide protection against C.
camelliae ascospore infection, could warrant further investigation.
Elicitors other than acibenzolar-S-methyl are available and require testing against infection of
camellia flowers by C. camelliae before induction of systemic acquired resistance can be
dismissed as a method for controlling camellia blight. Foliar application of DL-beta-amino-n
butyric acid at 4 giL to sunflower plants gave an equivalent level of control against downy
mildew infection in leaves caused by Plasmopara helianthi as did acibenzolar-S-methyl at 0.2
giL, 1 d after inoculation (Tosi and Zazzerini 2000). The two elicitors appeared to activate
different pathways. Salicylic acid and acibenzolar-S-methyl both induced production of at
least eight pathogenesis-related proteins in sunflower leaf discs 1-4 d after inoculation with P.
helianthi, whereas DL-beta-amino-n-butyric acid induced none of these compounds (Tosi et
al.2000).
While other elicitors could be evaluated for protection of flowers against ascospore infection
by Ciborinia camelliae, based on results from this study, the use of acibenzolar-S-methyl for
control of camellia blight does not appear promising.
180
Chapter 7
7 Genetic variation in isolates of Ciborinia
camelliae from New Zealand and USA
7.1 Introduction
The genetic variation within a pathogen population can influence selection of potential
strategies for control. A genetically variable population may exhibit heterogeneity in tolerance
or resistance to a particular control strategy, making it necessary to employ combined control
options, or to target genetically discrete popUlations with specific treatments. However, for a
homogeneous population, a single effective control option will be equally efficacious against
all strains. The genetic diversity of pathogen populations can be a critical factor in
determining efficacy of biological control strategies. Since this had not been done for C.
camelliae in New Zealand, it was considered an essential component of this study.
Infection of the camellia flowers in an area is likely due to be from both resident inoculum
and that dispersed from nearby areas. In C. camelliae, sclerotia are formed in flowers infected
by one or a number of germinated ascospores, each borne through meiotic production of
ascospores, which may be from different sclerotia. However, the hyphae of potentially
different strains compete with each other for use of the flower substrate and in formation of
the sclerotia. Compatible hyphae of dominant strains will be incorporated into the developing
sclerotia, providing the genetic material for the development of ascospores. Genetic diversity
within the sclerotia from a single flower is therefore likely to be quite low, but the genetic
variation within the popUlation of sclerotia produced within a discrete garden area is related to
the genetic diversity of the pathogen in the geographic region.
The source of the first introduction of C. camelliae into New Zealand is unknown. However,
camellia blight was first reported in Japan in 1919 (Hara 1919), and in California USA in
1939 (Hansen and Thomas 1940), and either of these countries could have been the sources of
its introduction into New Zealand. It was first reported in New Zealand in 1993 (Stewart and
Neilson 1993), most likely introduced through importation of infected flowers, sclerotia in
potting mix, or sclerotia adhering to shoes of travellers or imported goods such as the tyre
tread of Japanese used cars (Taylor and Long 2000). The disease is known to be capable of
181

rapid dissemination, and its spread throughout New Zealand in regions north of Christchurch,
was probably due to introduction of sclerotia into new locations by human activity, and its
spread within each region by dispersal of wind-borne ascospores. The existing evidence is
consistent with a single point of introduction (Taylor and Long 2000), and since the disease is
likely to have been here for only 10-15 years, the population of C. camelliae in New Zealand
is likely to be relatively homogeneous.
This assumption is in contrast to the wide genetic variation in populations of S. sclerotiorum
in New Zealand, the pathogen closely related to C. camelliae, but which has a very wide host
range, and has been in New Zealand since 1906 (Pennycook 1989). Out of the 75 isolates of
S. sclerotiorum collected from vegetable fields in the South Island, 28 distinct strains were
identified (Carpenter et at. 1999), and 51 were identified out of 78 isolates collected from
kiwifruit orchards in the North Island (Hoyte et at. 2001). This level of genetic diversity was
similar to that identified amongst Canadian field populations of the same pathogen, where 32
distinct strains were identified from 63 isolates (Kohn et at. 1991).
7.1.1 Polymerase chain reaction techniques
PCR-based techniques are routinely used to determine genetic variability within fungal
populations. The technique is suitable for amplifying DNA templates from specific genes or
random fragments from whole genomes. Fast-evolving regions can be selected for studies on
population structure within species, providing a range of markers which can be used for
reconstructing phylogenies of genes, species and populations (Baker, 2000). The Randomly
Amplified Polymorphic DNA (RAPD) technique uses 10 base pair (bp) primers of arbitrary
sequence to randomly amplify portions of the genome, and allows for inexpensive and simple
detection of polymorph isms between individuals (Hseu et at. 1996). However, the unreliable
reproducibility of RAPD caused by minor changes in reaction conditions, reagents and
equipment, and the unknown DNA sequence of the RAPD bands precludes precise
determination of band homology between taxa (Brown 1996). These factors limited its use in
determining variation in C. camelliae populations.
The universally primed PCR (UP-PCR) technique has advantages over the RAPD technique.
As with RAPDs, single primers generate multiple amplification products from any organism
without previous knowledge of the DNA sequences. Unlike the random probes used in
RAPDs, the universal primers designed for fungi consist of 15-20 base pairs (bp) , and
primarily target intergenic and more variable areas of genomes (Bulat et at. 1998). Higher
182
annealing temperatures of 52-56°C result in greater reproducibility and the generation of more
complex banding patterns improves the chances for identification of isolate-specific and
pathotype-specific bands (Lubeck et al. 1998). The UP-PCR technique was used recently to
detect genetic diversity within New Zealand populations of Sclerotium cepivorum, a sclerotial
pathogen which causes onion white rot (Tyson et al. 2002).
The UP-PCR technique was used in this study to determine genetic diversity within isolates of
C. camelliae, to provide information which might be used in selection of biological control
agents specific for C. camelliae. The genetic variation within New Zealand isolates collected
from four disparate regions was compared to isolates obtained from three states into USA, to
determine whether the New Zealand population could have originated from there.
7.2 Methods
7.2.1 Fungal isolates
C. camelliae sclerotia were collected from each of five sites within three cities in the North
Island and two sites in one city in the South Island of New Zealand during May 2001 (Table
7.2.1). The six isolates collected in Wellington and in Palmerston North, and the 12 isolates
collected in Christchurch, provided an estimate of the variability within the cities. The sites in
Wellington were approximately 70 m apart from one another and in Palmerston North and
Christchurch they were approximately 5 km apart from one another. Sclerotia were also
obtained from camellia gardens in the western state of Oregon, and from the eastern states of
Georgia and Virginia in the USA.
Table 7.2.1: Sources of C. camelliae isolates.
Region NZ Christchurch
Palmerston North
Wanganui Wellington
USA Oregon Virginia Georgia
Location 89 Aorangi St, Bryndwr 28 Colombo St, Beckenham 34 A Manson St, Massey University, Whaieiata Glenologie Botanic Gardens, Thomdon
Corvalis Norfolk Way Cross
Source Code AC CC MP WP GW WL WU
CO NY WG
Isolate number 4,5, 7, 8, 9, 10 2,3,4, 7, 8,9 2,3,5 1,2,6 3,4,5 1,2,3 2,4,5
1,2,5 3,4,6 2,3,5
183

7.2.2 Generation of C. camelliae mycelia
Sclerotia were surface-sterilised twice in 13.5% NaOCI and absolute ethanol (50/50; v/v) for
3 min, followed by two 15 min rinses in 0.4 mLiL Tween 80 in sterile distilled water (SDW).
They were then immersed for 5 min in an antibiotic-SDW solution containing 20 ppm
streptomycin sulphate (SIGMA Chemical Co., St. Louis, USA) and 20 ppm aureomycin
(chlortetracycline hydrochloride, Cyanamid, Australia PTY Ltd, Crows Nest, NSW,
Australia), 250 ppm ampicillin sodium salt (Ampesco, Solon, Ohio) and 0.4 mLiL Tween 80.
The sclerotia were air-dried in a laminar flow cabinet, and aseptically bisected. The sclerotia
were aseptically cut perpendicular from the exposed medulla face, the blade flamed, with
another cut made perpendicular to the last cut to expose a face absent of microbial
contaminants. Medulla segments were aseptically removed from the clean face, placed onto
PDA (Difco Laboratories, Detroit, Michigan, USA) plates, and incubated at 20°C with a 12 h
diurnal light. After 6-10 d, a 6 mm diameter plug from the actively growing region of C.
camelliae mycelium was transferred to potato dextrose broth (PDB (Difco Laboratories,
Detroit, Michigan, USA)) and incubated at 22°C with a 12 h diurnal light for 5 d. When
hyphae had grown to a radius of approximately 20 mm, the mycelium was removed from the
PDB onto sterile Miracloth (CalBiochem®, California, USA), and separated from the agar
plug. The excess water was removed by pressing the mycelium in a fold of Miracloth between
paper towels. The mycelium was then sealed in aluminium foil, labelled, frozen in liquid
nitrogen and stored at -80 ° C until use. This whole process was duplicated for each of the
isolates, using two separate cultures of each isolate.
7.2.3 DNA extraction
The extraction method followed that Paterson and Bridge (1994), which was adapted from the
method of Raeder and Broda (1985). The frozen sample was placed in a small volume of
liquid nitrogen and ground to a fine powder using a pestle and mortar. The freshly ground
mycelium (50 mg) was immediately homogenised by stirring into 500 JlL oflysis buffer (200
mM Tris-HCL (PH 8.5), 250 mM NaCl, 25 mM EDTA and 0.5% sodium dodecyl sulphate),
using a wide-bore pipette tip. The protein within the solution was extracted with the addition
of 350 JlL buffer saturated phenol (Invitrogen, Maryland, USA) and 150 JlL analytical grade
chloroform (CHCh, Prolabo), and the samples were placed on ice for 15-30 min. The samples
were then centrifuged at 13000 G for 60 min. The aqueous phase was transferred to a clean
tube and 2.0 JlL of 20 mg/mL ribonuclease A (Boehringer Mannheim, GmbH, Germany)
184

added, and the solution incubated for 30 min at 37°C. An equal volume of chloroform was
added, the solution centrifuged at 13000 G for 10 min, and the supernatant removed to a clean
tube. Ice-cold isopropanol (162 ilL) was added to 350 ilL of the supernatant to precipitate the
DNA. The precipitate was pelleted by centrifuging at 17000 G at 4°C for 15 min, washed
three times in 150 ilL 70% ice-cold ethanol, air-dried, and re-dissolved in 30 ilL SDW.
7.2.3.1 DNA quantification
The quantity of genomic DNA (gDNA) was estimated using 1 % agarose gel electrophoresis.
TAE buffer, loading dye and the agarose gel were prepared according to Sambrook et al.
(1989). A 1 % agarose gel was prepared by combining 1 g agarose (Roche Diagnostics,
Mannheim, Germany) with 100 mL TAE buffer (40 mM Tris acetate, 2 mM Na2EDTA, pH
8.5), and dissolved by boiling for 5-10 min. The molten agarose was poured into a gel tray (E
C Apparatus Corporation, New York, USA) (10 x 21 cm) and allowed to set. DNA samples
were prepared for electrophoresis by combining 2 ilL of the DNA solution, 3 ilL of 6 x
loading dye (0.25% bromophenol blue, 0.25% xylene cyanol FF, 40% (w/v) sucrose in water),
and 10 ilL SDW. The samples were transferred to wells in the prepared agarose gel. The DNA
was separated by electrophoresis at 10 V/cm for approximately 40 min, and compared with 2
ilL High DNA Mass™ Ladder (Invitrogen, Maryland, USA). The gel was stained in 0.5 Ilg
ethidium bromide/mL for 20-30 min, and photographed under ultra violet light using a
Polaroid camera and 667 Polaroid instant film (Polaroid (UK) Ltd., Hertfordshire, England).
All DNA samples were then diluted to a final working concentration of 5 ng/Ill.
7.2.3.2 up-peR analysis
Each 25 ilL reaction volume contained 10 mM Tris (PH 8.5), 200 11M each of dGTP, dCTP,
dATP and dTTP, 20 pmoles of one of the six primers (Table 7.2.2), 2.0 mM of MgC}z, 1.25
units of Taq DNA polymerase (Roche Diagnostics, Mannheim, Germany) and lOng genomic
DNA. Amplification was performed using a Mastercycler Gradient® apparatus (Eppendor~,
Hamburg, Germany). The thermal cycler was programmed as follows: denaturing at 94°C for
5 min, five cycles of 94°C for 50 s, annealing at the respective temperature for each of the six
primers (Table 7.2.2) for 2 min and primer extension at 72°C for 1 min. This was followed by
34 cycles of 94°C for 50 s, annealing at the respective annealing temperature for 90 sand
primer extension at 72°C for 1 min, with a final extension at 72°C for 10 min.
185

Table 7.2.2: Oligonucleotide primers used and their annealing temperatures.
Primer AA2M2 AS15 AS 15inv AS4 L15 L45
Primer sequence 5'CTGCGACCCAGAGCGG3'
5'GGCT AAGCGGTCGTTAC3'
5'CATTGCTGGCGAA TCGG3'
5'TGTGGGCGCTCGACAC3'
5'GAGGGTGGCGGTTCT3'
5'GTAAAACGACGGCCAGT3'
Annealing temperature °C 50 52 52 50 52 51
UP-PCR amplification products were visualised by 1% agarose gel electrophoresis as
described in section 7.2.3.1, except that 200 mL of molten agarose was prepared and poured
into a 20 x 21 cm gel tray (E-C Apparatus corporation, New York, USA). Five microlitres of
the 5 J.!L PCR product was combined with 1 J.!L of 6 x loading dye and transferred to wells in
the gel. The products were separated by electrophoresis at 6 V/cm for approximately 3 h, and
compared with 5 J.!L of the 1 Kb DNA Ladder (Invitrogen, Maryland, USA). The gel was
stained and photographed as described in section (7.2.3.1). Band profiles were analysed from
Polaroid prints of the duplicate agarose gels.
The whole process, from generation of C. camelliae mycelia, DNA extraction, and
quantification, and UP-PCR analysis, was repeated on portions of medulla that were cut from
the sclerotium of each isolate. Bands from the duplicate band profiles were scored only if they
were strongly amplified, clear, and reproducible. Fragments that met the band-scoring criteria
were scored as present (1) or absent (0) for each isolate, and used to compile a
presence/absence matrix.
7.2.3.3 Statistical analysis
Cluster analysis was used to look for groupings of similar isolates, and the relationships
between groupings and the regional source of the isolates. Pair-wise similarities were
calculated between isolates using Jaccard's coefficient of similarity Sj = a/(n-d), where a
represents number of 1-1 matches, d the number of 0-0 matches and n the total number of
bands compared in the pair-wise manner. The similarity matrix that was generated was
analysed using the single linkage cluster method (Sneath and SokaI1973). The combined data
generated from UP-PCR analysis were used to generate a Jaccard similarity matrix with a
single linkage (Appendix 8) to determine the genetic relationship between isolates.
186
Cluster analysis does not allow differences between known groupmgs to be explored.
Canonical variates analysis (Krzanowski 1990) allows identification of factors, which give
greatest separation between known groups, such as location, and so the data were also
examined by this method. Canonical variates analysis compares the within-group variances
and co-variances between the bands with the between-group variances and co-variances. The
analysis calculates the combination of the bands that gives greatest separation between the
groups, and then the next independent combination in another direction that gives the next
greatest separation between the groups, and so on. This allowed for presentation of the data in
a manner that described the patterns amongst the locations.
The single linkage cluster analysis and the canonical variates analysis were conducted using
GenStat for Windows, Release 4.2, Fifth Edition (GenStat Committee 2000, GenStat 2000).
7.3 Results
7.3.1 DNA quantification
DNA extracted from C. camelliae mycelia was of high quality and purity as shown by the
strong and clear single bands for each isolate on 1% agarose gel electrophoresis. No
additional bands or smearing effects were visible, indicating that no co-purification of RNA
had occurred and so no residual proteins or polysaccharides were present in the extract. Initial
quantification using the High DNA Mass Ladder market (LifeTechnologies) and
electrophoretic yield gels allowed all DNA samples to be diluted to 5 ng/JlI (Figure 7.1).
7.3.2 DNA banding patterns
Banding profiles from each of the 36 C. camelliae isolates from Christchurch (AC and CC),
Wanganui (GW) , Palmerston North (MP and WP) and Wellington (WL and WU), Georgia
(WG), Oregon (CO) and Virginia (NV) were generated using the six UP-PCR primers
(Appendix 9). The following six figures show the UP-PCR banding patterns of C. camelliae
isolates amplified by each of six primers, and separated in agarose 1 % gel electrophoresis.
Mass is given by the I kb DNA ladder at the left of each figure, which specifies the number of
base pairs corresponding to the scored bands at the right of each figure.
The individual primers generated different numbers of scored clear and reproducible band
fragments of different sizes, which could be classed into differing distinct groups. These were:
187
• Primer AA2M2; 7 polymorphic of 10 bands (450-2100 bp); 8 groups (Figure 7.2).
• Primer AS4; 1 polymorphic of 10 bands (550-1700 bp); 2 groups (Figure 7.3).
• Primer ASI5; 3 polymorphic of6 bands (450-3500 bp); 4 groups (Figure 7.4).
• Primer AS 15inv; 7 polymorphic of 10 bands (450-1600 bp); 10 groups (Figure 7.5).
• Primer L15; 5 polymorphic of 14 bands (750-3100 bp); 12 groups (Figure 7.6).
• Primer L45; 8 polymorphic of 12 bands (517-2200 bp); 11 groups (Figure 7.7).
7.3.3 Description of presence/absence data
The number of isolates that produced unique banding patterns from each primer was
calculated for each site (Table 7.3.2). Primers AS4 and AS15 provided less information to
distinguish between the locations than the other four primers. Within the 27 New Zealand
isolates, 24 contained some distinct DNA sequences and banding patterns. Isolates CC3 from
the South of Christchurch, and AC5 and AC7 from the North of Christchurch were identical
to each other, as were isolates WU2 from the upper and WL2 from the lower sampling points
at the Wellington Botanic Gardens. For the isolates from United States, the three isolates from
Oregon (CO 1, 2, 5) were distinctly different from those from Virginia (NV 3, 4, 6) and
Georgia (WG 2, 3, 5).
Of the 63 scored bands for the six primers, 32 were identical across all isolates and
represented 50% of the total number of scored bands. Three bands were excluded for primers
AA2M2 and ASI5, four for AS15inv and L45, and nine for AS4 and L15. Seven bands varied
in response between locations but were identical within locations (Table 7.3.1). These bands
represented 23% of the 31 bands that differed between isolates. The responses for each of
these seven bands were identical for all four New Zealand locations. None of the patterns
from the New Zealand locations matched those from United States. Georgia and Virginia had
contrasting bands in the AS15inv bands, 1800 and 600 bp. Oregon had more similarity to
New Zealand, with four of the seven bands the same.
188
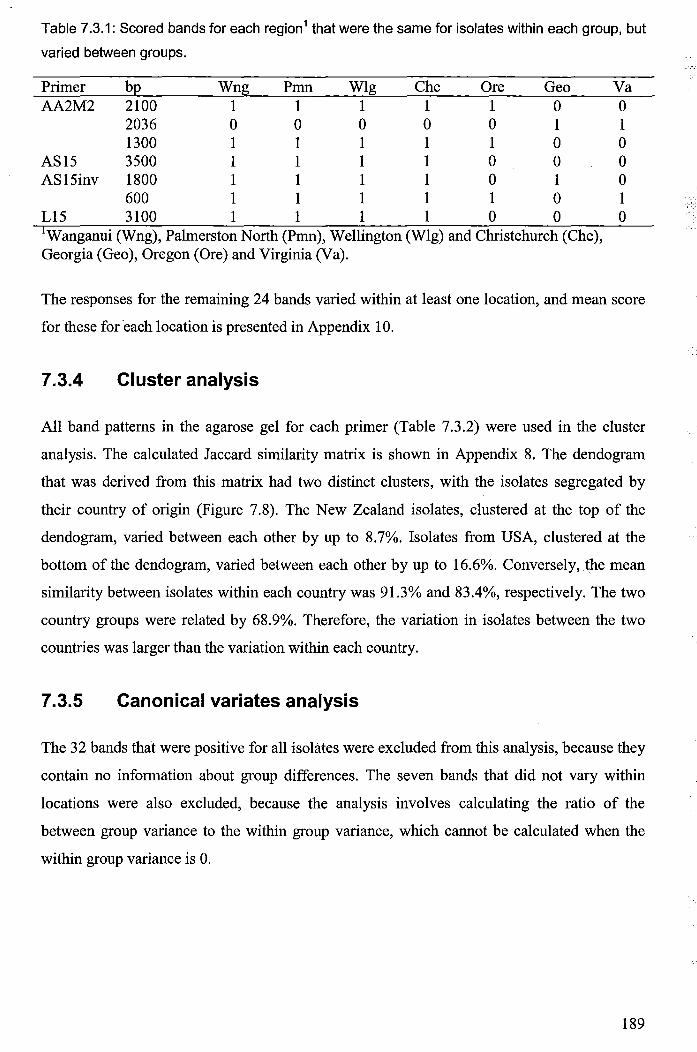
Table 7.3.1: Scored bands for each region 1 that were the same for isolates within each group, but
varied between groups.
Primer bp Wng Pmn WIg Chc Ore Geo Va AA2M2 2100 1 1 1 1 1 0 0
2036 0 0 0 0 0 1 1 1300 1 1 1 1 1 0 0
AS15 3500 1 1 1 1 0 0 0 AS15inv 1800 1 1 1 1 0 1 0
600 1 1 1 1 1 0 1 L15 3100 1 1 1 1 0 0 0 IWanganui (Wng), Palmerston North (Pmn), Wellington (WIg) and Christchurch (Chc), Georgia (Geo), Oregon (Ore) and Virginia (Va).
The responses for the remaining 24 bands varied within at least one location, and mean score
for these for each location is presented in Appendix 10.
7.3.4 Cluster analysis
All band patterns in the agarose gel for each primer (Table 7.3.2) were used in the cluster
analysis. The calculated Jaccard similarity matrix is shown in Appendix 8. The dendogram
that was derived from this matrix had two distinct clusters, with the isolates segregated by
their country of origin (Figure 7.8). The New Zealand isolates, clustered at the top of the
dendogram, varied between each other by up to 8.7%. Isolates from USA, clustered at the
bottom of the dendogram, varied between each other by up to 16.6%. Conversely, the mean
similarity between isolates within each country was 91.3% and 83.4%, respectively. The two
country groups were related by 68.9%. Therefore, the variation in isolates between the two
countries was larger than the variation within each country.
7.3.5 Canonical variates analysis
The 32 bands that were positive for all isolates were excluded from this analysis, because they
contain no information about group differences. The seven bands that did not vary within
locations were also excluded, because the analysis involves calculating the ratio of the
between group variance to the within group variance, which cannot be calculated when the
within group variance is o.
189
",-.-,

If) N ('") ll) ('") ..r ('") N ('") ll) ..- co If) ll) "- ~ ~
('") ..r co (,9 (,9 (,9 0.. 0.. ro () () () () 0 0 0.. > > > ::2: ~ ~ () () () () (,9 (,9 ::2: z z z ~ ~ ~ ~ ~ ng
100
40
20
10
Figure 7.1: Quantification of genomic DNA extracted from representative C. camelliae isolates in
1 % agarose gel electrophoresis. Mass is indicated by the High DNA Mass Ladder at the left of the
gel.
bp
Figure 7.2: Primer AA2M2; seven polymorphic bands from 10 scored bands.
2036 1636
1018
517
Figure 7.3: Primer AS4; one polymorphic band from 10 scored bands.
190

c.n ~~N W 0-
'"T1 c.n ~N 0- '"T1 c.n ~ ~N W 0- '"T1 c.n ~~ NW 0- '"T1 ~ o Ol 0 0 "0 -...J ~WW c.n
cO" ~ 0 Ol 0 "0 cO" ~ 0 010 0 "0 cO" o Ol 00 "0 cO" (Xl Ol Ol -I>--...J ~ WW -...J ~ WW c.n -...J ~W W c.n C (Xl en Ol C (Xl Ol Ol -I>- C (Xl Ol Ol-l>- C ..., ..., ..., ..., CD CD CD CD Mass -..J Mass -..J Mass :--J Mass
-..J AC4 ~ AC4 en AC4 (J1 ~
AC5 AC4 -U AC5 -U AC5 -U AC5
-U AC7 ..., ..., ..., ..., 3" AC7 3" AC7 3" AC7 3" AC8 CD AC8 CD AC8 CD
AC8 CD
AC9 ..., ..., ..., ..., r AC9 r AC9 » AC9 » AC10 ~ AC10 -" AC10 (f) (f) (J1 (J1 -" AC10 -" CC2 CD CC2 :!! CC2 ~ CC2
(J1
cO" CC3 < CC3 ~ - CC3 CD < CC3 ~ CC4 ~
CC4 CC4 ..., - "0 CJ) CC4 CD
"0 CC7 0 CC7 CD CD CC7 0 -< < CC7 "0 CC8 -< CC8 3 CC8 CD 0
~ CC8 3 CC9 0 CC9 -< CC9 0 ..., "0 CCg 3 MP2 ...,
C01 "0
C01 0 "0 ~ -< C01 0
MP3 ~ n" ..., n" CO2 CO2 3 CO2 "0
0- 0 ~ MP5 0- C03 0) C03 ..., C03 n" 0) GW3 ~ GW3 "0
0-NV3
~ Cl. ~ GW3 Cl. GW3 CJ) GW4 n" 0) NV4
GW3 ~ CJ) - 0- Cl. NV6 - GW5 ...,
GW5 ..., 0 0) GW5 CJ)
CO2 0 MP2 3 MP2 ~ -3 Cl. MP2 a MP3 -" MP3 CJ) C03
-" ~ - MP3 3 C05 N MP5 CJ) MP5 ...,
CJ) 0 MP5 CJ) NV3
C") NV3 3 x" GW3
C") 0 NV3 0 NV4
..., NV4 -" CJ) GW4 ..., CD
0 NV4 C") CD Cl. 0 GW5 Cl. NV6 0- NV6 CJ) NV6
..., C") CD WG2 0- WG2 0) WG2 0 WG2 Cl.
0) ~ ..., WG3 ~ WG3 Cl. WG3 CD WG3 0-
Cl. ~ Cl. 0)
~ WG5 WG5 WG5 ~ WG5 0- Cl.
WP1 WP1 0) WP1 ~ WP1 ~
WP2 WP2 Cl. WP2 WP2
WP6 WP6 ~ WP6 WP6
WL1 WL1 WL1 WL1
WL2 WL2 WL2 WL2 WL3 WL3 WL3 WL3 WU2 WU5 WU2 WU2 WU4 WU4 WU4 WU4 WU5 WU5 WU5 WU5
::> 111111111 II I I II - 111111111111 1111 II 11111111

Table 7.3.2: Presence (1) or absence (0) of unique scored bands for each primer, and number of
isolates with that grouping within each region Wanganui (Wng), Palmerston North (Pmn),
Wellington (Wig) and Christchurch (Chc) in New Zealand, and Georgia (Geo), Oregon (Ore) and
Virginia (Va) in United States, including the total number of isolates tested per region.
Primer Presence (I) and absence (0) of bands for No. isolates within each region Group each fragment size (bp) Wng Pnm Wig Chc Geo Ore Va
3 6 6 12 3 3 3
0 \0 0 0 0 0 00
AA2m2 0 '" 0 0 II) 0 0 ~ !: ~ :; 0
N N
0 0 0 I 0 0 I 0 0 0 I 0 I 2 0 I 0 I 1 0 0 0 I 0 I I 0 I I 0 0 0 I 0 2 5 6 5 I 0 0 I 0 I 2
0 0 I 0 0 I 0 0 7
0 AS4 0
0 I 7 2 5 6 5 3 3 3
0 0
ASI5 0 II) 0 II) ~ II)
!:!:l :!I: 0 0 0 0 I 0 3 3 0 I 1 1 3 6 6 12
0 0 0 0 0
ASI5inv 0 0 0 0 0 8 0 00 ~ on :; S 0
00 \0
0 0 0 0 0 0 0 I 0 0 0 0 I I 0 I 3 1 0 0 0 0 I 1 0 0 0 1 I I 2 5 1 1 0 0 0 0 0
1 0 0 0 I 1 2 4 5 I 0 0 1 1 I 7 1 I 0 0 0 0 2
0 0 0 0 0
Ll5 0 0 0 0 0
00 .,. ~ \0
'" N N -0 1 0 0 0 3 3 0 I 0 0 1 0 1 0 I 0 0 1 I 0 I
0 0 0 0 0 0 I 0 0 0 0 2 I 0 I 1 0 3 1 0 0 0
0 1 0 2 I 0 0 I I 0 6
0 0 8 00 0 0 - 0 0 0 r--
!.A5 N :! 0 on 0 0 -N N r-- r- \0 OJ")
0 I 0 0 1 0 0 0 0 I 0 0 1 0 0 3 0 I 0 0 I 0 1 I 0 1 0 I 0 0 0 0 3 0 I 0 1 I 0 0 0 5 0 1 0 I 0 0 3 9 0 I I 0 I 0 0 0 I I 0 I 0 I
0 0 0 0 I 1 0 0 0 I 2 2 0 I 0 2
192

"'0 C
J!1 ro Cll N ~ Cll Z
AC4 GW3 AC10
CC3 AC7 ACS CC4 CC9
GWS AC9 WP1 CC8 CC2 AC8 WP2 CC7 MPS WP6 WU2 WL2 WUS WL3 WU4 MP2 MP3 WL1 GW4 C01 C02 COS NV6 NV3 NV4
WGS WG3 WG2
I
I
I I
100 95
I I
I
I I
90 85 80
Degree of similarity (%)
Figure 7.8: Hierarchical clustering of genetic relatedness using Jaccard's coefficient similarities
and the single-link cluster method, based on UP-PCR fragment analysis of six primers among
isolates of C. camelliae. Isolates are represented from Wellington (WU and WL), Palmerston
North (MP and WP), and Wanganui (GW) in the North Island and Christchurch (AC and CC) in
the South Island of New Zealand, and from Way Cross in Georgia (WG), Corvalis in Oregon (CO)
and Norfolk in Virginia (NV) in USA.
193

The canonical variate plot of all isolates and location means using the first two canonical
variates is presented in Figure 7.9 These canonical variates accounted for 95.5% of the group
differences, and so a plot of the first two dimensions showed the majority of the explained
differences. Vectors described the level of importance that each band contributed to the plot,
its length, and its direction towards each region within the two-dimensional plot. In the plot,
the importance of each band corresponds to the length of the line. The angular position of
each vector, measured clockwise from vertical (0°), can be used to identify the unlabelled
vectors in the plot.
The first canonical variate was mainly associated with differences between countries and to a
lesser extent differences within New Zealand. The second canonical variate was associated
with the differences between Georgia and the other two locations within United States, and
some further differences within New Zealand. The first canonical variate accounted for 86.6%
of the total variation between locations. The second canonical variate represented the genetic
variation between isolates within each country, and accounted for another 8.9% of the total
variation. Four other canonical variates explained the remainder 4.4% of the variation; 2.4,
1.1,0.5 and 0.4% for the 3-6 variates, respectively. The canonical variates plot indicated that
the genetic variability between isolates within each location was low compared to the large
genetic difference between the two countries. This degree of variation implied that the isolates
of C. camelliae from New Zealand were genetically different than those from United States.
Of the bands that contributed most to the analysis, the 600, 700 and 1400 bp bands obtained
from primer L45, and the 1250 bp band from ASI5, had a greater influence on separating
isolates between the countries than within countries. Whereas the 1600 bp band from
AS 15inv contributed most to the genetic variation within the countries, but not between them.
In New Zealand, the isolates from Christchurch were more closely related to those from
Palmerston North than those from the two other regions in the North Island. In USA, the
isolates from Georgia were less related than the isolates from Oregon and Virginia. The
degree of separation for isolates from Wanganui and Wellington in New Zealand was similar
as that for Georgia and the other two locations in Oregon and Virginia. The range of genetic
variation between isolates within any of the regions was low, with the isolates readily
grouping into the discrete regions.
194
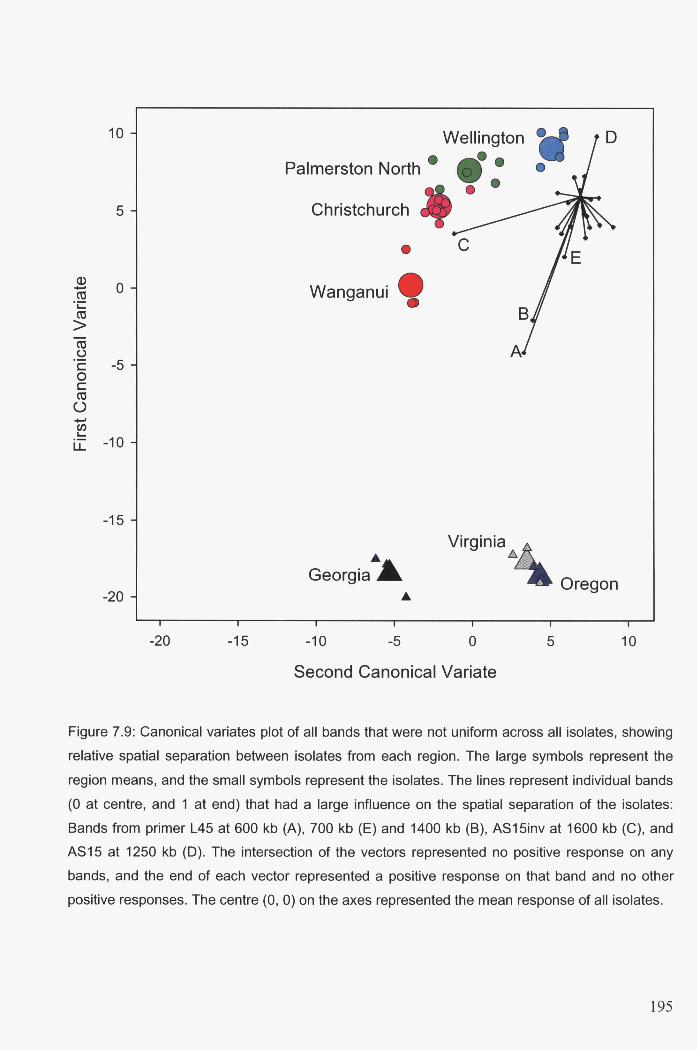
10
5
Q) 0 ......
co ·c co > co c..> c -5 0 c co U ...... en ~
LL -10
-15
-20
-20 -15
Wellington
Palmerston North - fI--t · · Christchurch
-e Wanganui •
• Georgia ~
• -10 -5
C
Virginia b.
o
Second Canonical Variate
V -
Oregon
5 10
Figure 7.9: Canonical variates plot of all bands that were not uniform across all isolates, showing
relative spatial separation between isolates from each region. The large symbols represent the
region means, and the small symbols represent the isolates. The lines represent individual bands
(0 at centre, and 1 at end) that had a large influence on the spatial separation of the isolates:
Bands from primer L45 at 600 kb (A), 700 kb (E) and 1400 kb (B), AS15inv at 1600 kb (C), and
AS15 at 1250 kb (0). The intersection of the vectors represented no positive response on any
bands, and the end of each vector represented a positive response on that band and no other
positive responses. The centre (0, 0) on the axes represented the mean response of all isolates.
195

7.4 Discussion
DNA fingerprinting with the UP-PCR technique was used to detennine the degree of genetic
variation within isolates of C. camelliae, in part to gauge how specific biological control
agents needed to be in identifying C. camelliae as a host. Results from this study indicated
that isolates of C. camelliae in New Zealand were distinctly different from the isolates
obtained from the United States, but the genetic variation in populations of C. camelliae
within each country was low. The findings were drawn from two methods of statistical
analysis. Cluster analysis indicated that there were two distinct groupings, with isolates from
New Zealand more closely related to each other than to those from United States (Figure 7.8).
Canonical variate analysis showed that the majority (87%) of the genetic variation within
locations was associated with the difference between the two countries, with only 9% of the
total variation associated with the genetic variation within the countries (Figure 7.9).
Cluster analysis had indicated that there was less genetic variability within the isolates
collected in New Zealand (9%) than in those collected from United States (17%). This
difference between the two countries could have been due to a number of factors. The initial
inoculum in New Zealand may have originated from a single source, while that in United
States could have originated from a number of introductions, to account for the larger
variation in USA. Alternatively, differential selection pressures between the countries may
have caused a divergence in genotypes having the best fit in their respective environments.
Conversely, a similar selection pressure has occurred between the populations between the
two countries, but over a different duration. In New Zealand, only 8 years have elapsed since
the first reported sighting of C. camelliae in Wellington in 1993 and collection of the isolates
used in this study, in 2001. In the USA however, polymorphism in isolates of C. camelliae
could have occurred during the 43-63 years from the first reported sighting in Oregon in 1949,
and in Georgia in 1938 and Virginia in 1958, and collection of the isolates in 2001. The
canonical variates analysis indicated that isolates from Oregon and Virginia were more
closely related to each other than to isolates from Georgia (Figure 7.9), indicating that the
distribution of genetic differences was not random and was to some degree related to
geographical position. However, for the seven bands that did not vary within locations, there
was more similarity between Georgia and Virginia than between either of these two and
Oregon.
196

If the inoculum of C. camelliae in New Zealand had been introduced from the USA, the
degree of genetic diversity within the pathogen would be expected to be similar for both
countries. Since the C. camelliae genotypes were distinctly different between countries, the
New Zealand isolates were either derived from an untested source in United States, or from
another country. The most likely alternative source of the pathogen inoculum into New
Zealand is Japan, since Japan was the only other country to be reported to contain the
pathogen in 1993 when it was first reported here (Taylor and Long 2000). The hypothesis that
the pathogen was introduced into New Zealand from Japan, rather than from United States,
could be verified by comparing the genetic variation of C. camelliae in Japan to that of
isolates in New Zealand.
The initial introduction of the pathogen into New Zealand was thought to be in Wellington in
the North Island where it was first sighted (Taylor and Long 2000). Thus the transfer of the
pathogen to the South Island probably originated from the North Island. The canonical
variates plot indicated that the isolates from Christchurch were more closely related to those
from Palmerston North than to those from the other two regions in the North Island (Figure
7.9), thus suggesting that C. camelliae may have been imported to Christchurch from
Palmerston North.
Even though cluster analyses indicated that only 3 out of the 36 isolates tested had identical
genotypes, the genetic diversity within C. camelliae populations in New Zealand (9%) and in
United States (17%), was low compared to the variation accepted as defining a species. Wyss
and Bonfante (1993) classed isolates of arbuscular-mycorrhizal fungi as belonging to the
same species if the variation of RAPD fragment patterns of the same size differed by less than
60%, and represented a different species if the variation was more than 70%.
The genetic variation in C. camelliae, which has a very narrow host specificity, was low
compared with that in New Zealand populations of the closely related pathogen S.
sclerotiorum, which has a non-specific host range. The proportion of distinct strains In
populations of S. sclerotiorum in New Zealand ranged from 37% in vegetable fields in the
South Island (Carpenter et al. 1999), to 65% in kiwifruit orchards in the North Island (Hoyte
et al. 2001). In Canada, 51 % of field populations comprised distinct strains (Kohn et al.
1991). Genetic diversity in the population was influenced by whether S. sclerotiorum was
subjected to an agricultural or natural regime. Kohn (1995) found that in cultivated plant
populations, genetic diversity was high with 22% genotypes recovered, with no out-crossing
or segregation detected. The large number of clones was randomly dispersed spatially as a
197
result of immigration and mixing of inoculum in air. This was in contrast to the low
fingerprint diversity (2%), out-crossing, and highly localised inbreeding associated with
isolated wild populations.
In C. camelliae, its host specificity to camellias, dispersal of sclerotia by people over a large
geographical area, and the random mixing of air-borne ascospores, would tend to produce
geographically distinct populations of genetically similar isolates, as for the agricultural
situation in S. sclerotiorum. This tenet was supported by the canonical variates plot (Figure
7.9), which showed that the genetic variability between isolates was low within each region,
compared to the larger variation between regions.
The choice and number of primers influenced the genetic diversity of C. camelliae detected in
this study to some extent. The use of more primers might have detected a greater diversity
within isolates. Nevertheless, the number of primers used was sufficient to provide a
qualitative estimate of genetic variation with the population. The six universal primers used in
the PCR detected a wide range of genetic variation between isolates, and demonstrated that
UP-PCR was a suitable technique for detecting variation in populations of C. camelliae. All
the bands used in the analysis were repeatable in duplicate assays and therefore robust. To
prevent replication of contaminant DNA, the precaution was taken to exclude it from the UP
PCR sample, by aseptic coring of the medulla. The risk of microorganisms associated with
host petal tissue embedded in the medulla of C. camelliae sclerotia influencing results, was
minimised by duplicating the analysis with DNA that had been extracted from different
segments from the same sclerotium. This reduced the risk of contaminant DNA affecting
banding patterns, since a contaminant band in one assay would be unlikely to occur in the
same position in the duplicate assay.
The conclusions drawn from this study were based on the relatively small number of isolates
sampled from each region. Sampling at least 15 isolates from each region would have
increased the likelihood of detecting genetic similarities or differences between isolates within
regions, to determine regional population structures. Other researchers evaluated genetic
variation in populations of S. sclerotiorum with twice the number of isolates than used in the
current study, using 63-78 isolates in total (Carpenter et al. 1999; Hoyte et al. 2001; Kohn et
al. 1991). Tyson et al. (2002) used three times this number of isolates to determine genetic
diversity in New Zealand populations of Sclerotium cepivorum. Nevertheless, because
selection of the isolates from each region was random, the main conclusions made in this
198
study based on the genetic variation between and within New Zealand and United States are
considered to be valid.
Results obtained from using the cluster analysis were similar to those using canonical variates
analysis, even though the two statistical approaches provided different explanations from use
of the same data. Cluster analysis used the banding patterns to identify groups of isolates that
had a high degree of similarity, whereas canonical variates analysis determined which
banding patterns gave the greatest separation between the groups within each location.
However it appears that other researchers have not used canonical variates analysis to
interpret data from DNA fingerprints. A literature search through Current Index to Statistics
and CAB Abstracts did not obtain any references to other researchers using canonical variates
analysis on presence or absence of bands derived from genetic fingerprinting methods using
PCR, RAPD's or molecular markers. However, canonical variates analysis has been used by
researchers to analyse other presence/absence data, for example, to analyse cranial
measurements for determination of speciation in British water voles (Corbet et al. 1970). The
method is also used extensively in ecological studies.
Results from this study indicated that isolates of C. camelliae in New Zealand were distinctly
different from the isolates obtained from the United States. Furthermore, the genetic variation
in populations of C. camelliae in New Zealand was low (9%). The high polymorphism within
strains of Sclerotinia sclerotiorum was recognised as having implications for plant breeding
and control of the pathogen (Briard et al. 1997). In contrast, the low genetic variation in New
Zealand populations of C. camelliae suggests that any control system effective for control of a
few selected isolates are also likely to be effective for all isolates within C. camelliae
populations in this country.
199

Chapter 8
8 Concluding discussion
8.1 Future research directions
This study evaluated many strategies for biological control of camellia blight. The least
successful strategy that was evaluated was to protect camellia flowers from infection from C.
camelliae ascospores. Isolates of Bacillus, Pseudomonas, Aureobasidium and Cladosporium
species that had shown promise in control of camellia blight petal assays, were not effective
in reducing the incidence of the disease in flowers when applied directly to camellia bushes.
Attempting to induce systemic acquired resistance in camellia bushes with the elicitor
acibenzolar-S-methyl was also not effective in controlling camellia blight. Therefore,
investing in further research effort into these strategies is not considered to be productive.
The strategies that targeted the soil-borne sclerotia of C. camelliae proved more successful.
Moderately parasitic micro-antagonists were shown to be present in soil under camellia
plants, with the antagonists having the highest efficacy against sclerotia belonging to the
Trichoderma genus. Their existence allowed for the possibility of manipulation of the soil
environment to enhance micro-parasitic activity in sclerotia by various means.
The application of urea to soil at 50-100 kg N/ha was implicated in the enhanced decay of
sclerotia, probably by stimulating the parasitic activity of resident microorganisms. Calcium
cyanamide at 500-1000 kglha applied in late winter to bare soil beneath camellia bushes was
found to give almost complete suppression of apothecia production. This fertiliser could be
used to provide short-term control of the disease by preventing the production of ascospores
that infect the next generation of flowers. In addition it could also contribute to enhanced
degradation of soil-sclerotia as it decomposed to urea in the soil. Repeated annual applications
of calcium cyanamide would be required to completely inhibit apothecial production in the
long term. The commercial availability of CaCN2 in a granular formulation (,Perlka'), which
is safer to use than the dust form it replaces, could encourage the adoption of this strategy by
camellia growers. Higher rates of Armicarb 100SR (KHC03) and Armicarb 300 (NH4HC03),
than the 300 kglha tested may inhibit apothecia production to a similar extent to that achieved
by calcium cyanamide. However, it is not known what effect repeated applications of these
fertilisers would have on growth of camellia plants, which could be affected by excess
200

nitrogen or changes in soil pH. The effect of these compounds on camellia bushes and control
of camellia blight warrants further evaluation before their use under camellia plants is
recommended.
Other compounds could also be effective in suppression of apothecial production in C.
camellia sclerotia, and warrant investigation for this purpose. Amendment of soil with either a
formulation of fermented agricultural wastes (CF-5) or allyl alcohol (2-propen-l-ol) at 150-
400 ppm was found to suppress carpogenic germination and apothecial production of
Sclerotinia sclerotiorum sclerotia, and enhanced colonisation of the sclerotia by Trichoderma
spp. (Huang et al. 1997).
The use of tree mulches from a number of tree species was shown to prevent the emergence of
apothecia, and resulted in a significant reduction in numbers of soil-borne sclerotia. In
addition, the ability of the mulches to attract fungus gnats that may have a significant impact
on population densities of sclerotia, suggests a potential synergism between the gnat and
natural, soil-borne mycoparasites, and so warrants further study. Although the mulch
leachates were shown in this study to inhibit mycelial growth from C. camelliae sclerotia,
their effects on inhibiting carpogenic germination of sclerotia, or stimulating parasitic activity
of soil-borne microorganisms, was not evaluated. These effects warrant investigation to
understand the mechanisms involved in the reduction of soil-borne sclerotia under the
mulches, with a view to enhancing the effectiveness of the mulches in control of sclerotia.
However, in this current study, these tree mulches had little effect on the new generation of C.
camellia sclerotia developing in fallen flowers.
Amending tree mulches with the wood-decaying white-rot fungi was shown to offer potential
in killing these new sclerotia. When sawdust-grown inoculum of the fungi, Phanerochaete
cordylines WR268 and Pycnoporus coccineus WR380 were placed onto agar media amended
with melanin, melaninase activity was demonstrated, probably from the enzymes released to
decay the wood fibre. It seemed likely that these enzymes could degrade the melanin in the
rinds of sclerotia, thereby exposing them to microbial parasitism. In laboratory trials,
degradation and parasitism of sclerotia was also enhanced by other white-rot isolates that did
not appear to secrete melaninases, and also by the addition of a suspension containing a mix
of Trichoderma isolates, in the absence of the white-rot fungi. These findings support the
contention that enzyme systems, other than melaninase, are involved in sclerotial parasitism.
Discovering which enzymes or compounds are involved in the degradation of the rind would
be useful in understanding the mechanisms responsible for the loss of sclerotial viability.
201

Young and Ashford (1992) found the permeability of rinds of Sclerotinia minor sclerotia
could be assessed using an apoplastic tracer sulphorhodamine, as the tracer passed through
damaged rind, with the rind becoming progressively more permeable to the tracer as the
thickness of the rind decreased. This method could be applied to sclerotia of C. camelliae to
ascertain whether the rind was increasing in permeability with increasing concentrations of
various compounds. Compounds requiring testing include the components of the tree mulch
leachates, particularly enzymes secreted from white-rot fungi and micro-antagonists of
sclerotia. Sclerotia containing permeable rinds could be tested for increased susceptibility to
parasitism by microorganisms.
The white-rot tree mulch system may act equally well for all sclerotial pathogens, since all
black sclerotia are protected by melanin. This was confirmed in an in vitro study by Madsen
(2002), which showed that sclerotia of both C. camelliae and S. sclerotiorum were degraded
during incubation for 8 weeks in sawdust which was amended with Phanerochaete
cordy lines .
Since the white-rot system has been evaluated only in vitro, many questions remain
unanswered on how to best incorporate white-rot fungi into tree mulches, for control of C.
camelliae sclerotia under camellia bushes. It is envisaged that the white-rot fungi will be
introduced into tree mulches prepared under camellias from sawdust-grown plugs of white-rot
mycelium, which is grown in aerobic cultures similar to the 20 mm deep Petri dishes used in
this assay. However, this method has not been tested under field conditions.
A crucial requirement would be for the white-rot fungus to be non-pathogenic against
camellia bushes. As camellia bushes may be regularly pruned, the white-rot fungus would
need to be completely saprophytic, and not exploit open wounds of camellia wood or root
tissue. Under this criterion, isolates of Schizophyllum commune, which gave good control of
sclerotia in the assays, would be rejected because it is known to be a pathogen of camellias
(Mansilla et al. 2001).
In a practical sense, the fact that the white-rot fungi need to be incorporated into the tree
mulch, can help limit the spread of the fungi to other trees and shrubs. The white-rot fungi
were shown not to establish in soil (Section 5.2.3.1.1), instead requiring pine sawdust for
establishment. Therefore, they may remain contained in the tree mulch, and not spread to
adjacent areas where there is no mulch. However, the containment of the white-rot fungi
would probably depend on the amount of organic matter present in soil, and the pH, moisture,
nutrients and structure of the soil.
202
The tree mulches could be amended with known mycoparasites that are not pathogenic to
camellia bushes, as an alternative to amendment with white-rot fungi. Although Trichoderma
spp. are not known to break down melanin, as found by Metzler (1986), when the only
sclerotial component in Typhula incarnata that was not destroyed by T. viride was a melanin
like substance, their inclusion in sawdust mulches warrants investigation. The addition of
Trichoderma spp. alone to pine sawdust was shown in Chapter 5.2, Assay 4 to reduce
viability of C. camelliae sclerotia. However, Chatonnet et al. (1994) noted that Trichoderma
spp. were incapable of degrading the heartwood lignin of oak through enzyme systems
because they did not possess ligninase activity, but they did possess strong oxido-reductase
activity. This indicated that they can produce oxidative compounds that degrade some
components of wood, and so perhaps some biochemical components of sclerotia. By
acidolysis and chemical oxidation of the lignin polymer, they could reduce the phenolic
aldehyde vanillin, to vanillyl alcohol, which is usually degraded rapidly to vanillic acid by
per-oxidation. Unlike the white-rot fungi, Trichoderma spp. are not known to be pathogenic
to many of the shrubs and trees common in ornamental gardens. The Trichoderma isolates T.
virens BS8h1.1 (LU569) and T. viride BS120b.l (LU570), which were shown in this study to
parasitise 50% of C. camelliae in vitro when added to tree mulches, could be suitable
candidates for control of C. camelliae sclerotia. The addition of urea-based compounds to the
mulches to stimulate microbial activity also warrants further study. Nwufo and Oghenah
(2001) found that urea formaldehyde incorporated into the sawdust mulch, enhanced
degradation of the mulch by enhancing the activity of the cellulytic fungi, Phoma sp.,
Curvularia sp. and T. viride.
The soil amendment options described here could be integrated into a soil management
programme, potentially providing long-term control of camellia blight. The strategy could
consist of applying tree mulches to soil beneath camellia bushes that had been previously
treated with urea, to prevent apothecia production and enhance decay of the existing soil
borne sclerotia. White-rot fungi or Trichoderma species could also be incorporated into the
mulch to kill sclerotia that form in the subsequent generations of flowers.
8.2 Improved management of camellia blight
The findings of this study can be incorporated into tentative recommendations for integrated
control of camellia blight. These suggestions will need to be tested under field conditions
before firm recommendations can be given.
203

In January-February, to aid in applying the tree mulch, the woody litter under bushes and the
lower branches of camellia bushes up to 50 cm from ground level should be removed. Lush
undergrowth can be removed with a sharp spade or sprayed with a contact herbicide. Infected
camellia flowers can be left, as removing them invites transfer of the disease to another
locality. Urea should be applied at 100 kg/ha (46 kg N/ha) to soil under camellia bushes
immediately prior to application of the tree mulch, to facilitate degradation of soil-borne
sclerotia by enhanced activity of soil-borne micro-antagonists. However, it is unknown
whether the application of nitrogen to soil in combination with tree mulches is likely to cause
additional mortality of sclerotia over and above the benefits of the bark mulches.
A 100 mm thick layer of any commercially available tree mulch can be applied to the soil in
January-March, after all flowers have fallen. It is envisaged that the best time to apply the
white-rot mycelial plugs to the tree mulches would be in March, when temperatures are still
warm and rainfall is adequate to enable establishment of the white-rot fungi before the
flowers become infected in the following spring. This would also allow about 3 months after
pruning of camellias, which is usually done in late spring in the previous year. It should allow
enough time for the pruning wounds to cauterise and provide protection against any risk of
white-rot attack. Phanerochaete cordylines demonstrated aggressive colonisation of the
sawdust and highest efficacy against C. camelliae sclerotia in vitro, and so is currently the
preferred white-rot isolate for use under field conditions. Although P. cordylines has not been
reported to be pathogenic to shrubs or trees, it must still be included in pathogenicity tests,
prior to use in the field.
Recommendations for the use of calcium cyanamide for application to soils under amenity
shrubs, needs to be subject to its safe form, 'Perlka', being registered in New Zealand for this
purpose. Application of 'Prelka' at 500 kg/ha to bare soil in July-August, prior to the
emergence of buried apothecia, should provide a short-term option in control of camellia
blight. It could also be applied to the tree mulch to prevent carpogenic germination of
sclerotia brought to the surface by birds, or the new generation of sclerotia developing in
flowers that have fallen to the surface of the mulch. However, calcium cyanamide applied
onto white-rot fungi growing in the mulch may result in a temporary reduction in secretion of
ligninase, as presence of some nitrogen compounds has been reported to hinder its production.
Ligninase production is impaired by the accumulation of water-soluble lignin-degradation
products (Zech et al. 1994). Any urea applied to the soil prior to application of the mulch
would not be expected to impede ligninase production by white-rot fungi, as these fungi
would most likely be contained in the mulch and remain separate from the soil environment.
204

For any control option to be effective, it must be integrated with measures to limit the spread
of the disease, as new infections can be blown in from neighbouring properties despite the
owners' precautions. Although some cultural and fungicidal strategies are effective in
controlling the disease on individual properties, they can have little impact on containing the
disease unless the control is coordinated within the community. Since camellias are primarily
amenity shrubs, there is little financial incentive for home gardeners to control the disease.
Therefore any control options developed in this study need to be simple to use if they are to
be accepted by home gardeners. Simplicity would also increase their acceptance by a co
ordinating group, such as the Camellia Society, as well as those responsible for public gardens
and by nurserymen growing camellias for sale. An education programme, promulgated by the
Camellia Society and producers of mulches, is probably the best organisation to co-ordinate
growers in the implementation ofbiocontrol strategies.
The spread of camellia blight from infected areas to areas free of the disease by human
activity is very difficult to prevent. A policy that encouraged the purchase of plants without
flowers, either bare-rooted or grown in sclerotia-free soil, would be required. However, this is
not likely to succeed since home gardeners generally purchase only those plants that
demonstrate the preferred flowering characteristics. If the spread of sclerotia by human
activity can be prevented, the only source of the disease into unaffected areas will be from
wind-blown ascospores. From what is known at present, areas more than 30 km in the
direction of the prevailing wind from the closest site of infection should be reasonably safe
from infection. Under this scenario, only growers within an area that already has camellia
blight would need to be targeted for the further implementation of control strategies.
Examples of discrete areas where camellia blight is confined include all gardens where
camellias are grown in Christchurch, Nelson and Wanganui, and the area encompassing
Palmerston North and Massey University. These areas could be targeted one at a time, or
simultaneously.
The white-rot mulch system could also have application in kiwifruit Actinidia deliciosa
orchards, which are susceptible to field rot caused by S. sclerotiorum. The pathogen affects
immature fruits on the vines, and is one of the three most important diseases in this crop in
New Zealand (Pennycook 1985). Goh et al. (1992) found that the natural levels of sclerotia (c.
0-0.13 sclerotialkg soil) present in soil in kiwifruit orchards during pre and post blossom,
increased during pre-harvest to 0.4-0.8 sclerotialkg soil. Viability of sclerotia buried in
orchard soil decreased by 48% after 208 d, with species of Trichoderma and Gliocladium
implicated in the decline. Therefore, the use of tree mulches with or without white-rot and
205
Trichoderma fungi, coupled with soil pre-treatment with urea, to stimulate microbial activity,
could be used for control of S. sclerotiorum. Stipe and apothecia production occurs from
sclerotia buried beneath kiwifruit vines (Hoyte et al. 1992), so that the width of the tree mulch
layer would need to extend beyond the drip line of the vines. The system would be expected
to only suit perennial crops where the mulch and white-rot fungi could be established without
disruption. It would not be suitable in annual crops, where regular tillage of the soil would
destroy the niche established by the white-rot fungi in the mulch.
8.3 Conclusions
This study has provided a number of leads for effective control of camellia flower blight. The
most successful strategy was to reduce the viability and germination potential of the over
wintering C. camelliae sclerotia by using various soil treatments. A single application of
calcium cyanamide to soil under camellia bushes immediately before flowering, to inhibit
apothecial production, could be used for short-term control of the disease. For long-term
control of camellia blight, an integration of three soil treatments offers potential. Urea can be
applied to soil beneath camellia bushes to cause a slight reduction in numbers of sclerotia,
probably by stimulating parasitic activity by natural soil-borne microorganisms. Covering the
soil under camellia bushes with tree mulches can provide additional control by causing total
suppression of apothecia and significant reductions in the population density of soil-borne
sclerotia. Although the tree mulches had no effect on the new generation of C. camellia
sclerotia developing in fallen flowers, their amendment with white-rot fungi such as
Phanerochaete cordylines, or selected isolates of Trichoderma spp., offers potential for decay
of newly formed sclerotia. The practical application of these fungi is dependent upon
confirmation that they are not pathogenic to camellia and amenity plants, and that they will be
effective under field conditions.
This study has demonstrated that camellia blight will be difficult to manage in private and
public gardens, as well as in plant nurseries. The production of wind-dispersed ascospores
from home gardens is likely to provide continuous, plentiful inoculum, which cannot be
completely guarded against. Professional gardeners and nurserymen will require great
vigilance with the use of a range of cultural, biological and chemical control methods if they
are to be successful in keeping their camellia plants free of this disfiguring flower blight.
206

Acknowledgements
Professor Alison Stewart and the people that work with her provided the stimulating and
fulfilling learning environment for me to develop intellectually and hone my skills as a
scientist. Alison has been an excellent supervisor, a wonderful mentor, and one who has
provided additional resources and funds to meet the demands of the revised research
programme.
My associate supervisors Dr Marlene Jaspers, who's patient coaching improved my writing
ability, and Dr Hayley Ridgway who taught me DNA fingerprinting techniques and
presentation of results. My external associate Dr Peter Long, at Massey University, for his
support and assistance in running some trials in the North Island, and Judith Pay for her
technical advice and assistance in supplying the necessary resources.
I am indebted to my wife Ruth Butler, for her love and dedicated support, for without it, my
involvement in this PhD project would not have been possible. As a statistician, Ruth also
provided me with professional statistical advice.
There are many other people and organisations that made valuable contributions to this
project:
The New Zealand Camellia Society and the Brian Mason Scientific and Technical Trust
provided financial assistance. Dr Vince Neall, chairman of the New Zealand Camellia Society
Trust, for his warm hospitality, and enabling me to share in a wonderful weekend in
Palmerston North with members of the Camellia Society.
Products used in trials were supplied by BioStart Ltd with the Bio-Start™ soil conditioners
Mycorrcin.nz and Digester.nz; Jordan's Nursery, Ashburton for supply of the camellia
bushes; George Follas, Syngenta Crop Protection NZ, for supply ofCGA245704 50WG.
Nimal Rabeendran at Lincoln University, who supplied the sclerotial mycoparasites, Monika
Walter, Nick Waipara and Annette Ah Chee, HortResearch (The Horticulture and Food
Research Institute ofNZ), Lincoln, Canterbury, for supply of wood-rot fungi.
Collaborative support was provided by Dr Charlie Martinson, Dept. Plant Pathology, 329
Bessy Hall, Iowa State University, Ames, IA 500ll, USA, who evaluated parasitism by
Sporidesmium sclerotivorum on sclerotia of Ciborinia camelliae.
207

Christine Taylor of Massey University, Palmerston North, a colleague undertaking a PhD
project on the same pathogen, with whom I had informative discussions on methods of
controlling camellia blight, and who also supplied C. camelliae isolates and serviced sclerotial
baits that were used in North Island trials.
Richard Toft and Rosa Henderson of LandcareResearch, for identification of fungus gnats,
and a scale insect, respectively.
Gerard Besamusca for providing technical information on the contents of the Bio-Start™ soil
conditioners Mycorrcin.nz and Digester.nz.
Manfred Ingerfeld and Neil Andrews, Department of Plant and Microbial Sciences at
University of Canterbury, Christchurch, for preparation of the sclerotia, and operation and
photography using the transmission electron microscope, and scanning electron microscope,
respectivel y.
Mark Morgenstern, for instruction on using the Instron 4444.
Mark Crawford, Manager, Biological Services, Griffin LLC, 2509 Rocky Ford Rd, Valdosta,
GA 31601, USA, for supply of isolates of C. camelliae from America.and for information on
control of the pathogen in the USA.
Win and Pat Clancy, to allow me to collect C. camelliae isolates from their property in
Christchurch, and for their warm hospitality.
Martin Dench, the manager of the Camellia Garden at the Wellington Botanic Gardens, who
gave technical assistance with the bark mulch and fertiliser trials, and collected specific data.
Neil Christenson, Jeff Paris and other staff gave additional help, and made servicing the trials
there very enjoyable.
At Lincoln University, Mervyn Spurway and Brent Richards for their diligent maintenance of
camellia bushes that were used in shade house trials, and those essential discussions on the
meaning of life during the lunch and coffee breaks. Richard Sedcole for providing statistical
support. Brenda Lord for formatting and preparing this manuscript for publication.
I am especially grateful for the companionship, enthusiastic encouragement and the
supportive learning environment given unquestioningly by fellow students in Plant Pathology,
particularly Belinda Sleight, Brenda Pottinger, Sonia Whiteman, Nimal Rabeendran, Jo
Steyaert, Stuart Card, Jayanthi Swaninathan and Steven Wakelin.
208
References
Adams, P. B. and Ayers, W. A. 1981. Sporidesmium sclerotivorum: distribution and function in
natural biological control of sclerotial fungi. Phytopathology 71 (1): 90-93.
Aggab, A. M. and Cook, R. C. 1981. Carbohydrate changes in germinating sclerotia of Sclerotinia
curreyana. Transactions of the British mycological Society 76: 147-149.
Agrios, G. N. 1997. Plant pathology. Fourth edition. San Diego, United States, Academic Press. 635 p.
Akai, J. 1981. Studies on the epidemiology and control of Sclerotinia disease of beans caused by
Sclerotinia sclerotiorum (Lib.) De Bary. Report of Hokkaido Prefectural Agricultural
Experiment Stations. No. 36: 86 p.
Akamatsu, Y. and Shimada, M. 1995. Some characteristics of the glyoxylate oxidase system of the
brown-rot fungus Tyromyces palustris and the occurrence of the enzyme system in wood-rotting
fungi. Mokuzai Gakkaishi -Journal of the Japan Wood Research Society 41 (2): 242-245.
Alexandra, B. J. R. and Stewart, A. 1994. Survival of sclerotia of Sclerotinia and Sclerotium spp. in
New Zealand horticulture soil. Soil Biology and Biochemistry 26: 1323-1329.
Alford, D. M. 1961. Studies on camellia flower blight. Unpublished MSc thesis, Louisiana State
University, Baton Rouge, Louisiana, United States. 37 p.
Alford, D. M. and Sinclair, J. B. 1962. Sclerotinia camelliae cultures remain viable in liquid medium.
Phytopathology 52: 175-177.
Alvarez-Castellanos, P. P., Bishop, C. D. and Pascual-Villalobos, M. J. 2001. Antifungal activity of
the essential oil of flowerheads of garland chrysanthemum (Chrysanthemum coronarium)
against agricultural pathogens. Phytochemistry 57 (1): 99-102.
Anas, o. and Reeleder, R. D. 1987. Recovery of fungi and arthropods from sclerotia of Sclerotinia
sclerotiorum in Quebec muck soils. Phytopathology 77 (2): 327-331.
Anas, O. and Reeleder, R. D. 1988. Consumption of sclerotia of Sclerotinia sclerotiorum by larvae of
Bradysia coprophila: influence of soil factors and interactions between larvae and Trichoderma
viride. Soil Biology and Biochemistry 20 (5): 619-624.
Backhouse, D. and Willetts. H. J. 1984. A histochemical study of sclerotia of Botrytis cinerea and
Botrytisfabae. Canadian Journal of Microbiology 30 (2): 171-178.
Baker, A. J. 2000. Molecular Ecology. In A. J. Baker (Ed). Molecular Methods in Ecology (pp. 1-6).
Osney Mead, Oxford: Blackwell Science Ltd.
Baker, K. F. and Cook, R. J. 1974. Biological control of plant pathogens. American Phytopathology
Society, St Paul, MN, 433 pp.
Barnett, H. I. and Lilly, V. G. 1948. The interrelated effects of vitamins, temperature, and pH upon
vegetative growth of Sclerotinia camelliae. American Journal of Botany 35: 297-302.
209
Batra, L. R. 1960. The species of Ciborinia pathogenic to Salix, Magonolia and Quercus. American
Journal of Botany 47: 819-827.
Batra, L. R. and Korf, R. P. 1959. The species of Ciborinia pathogenic to herbaceous angiosperms.
Americanjournal of botany 46: 441-450.
Baxter, L. W. and Berly, J. A. 1956. Flower blight of camellia in South Carolina. Plant Disease
Reporter 40: 831.
Baxter, L. W. and Epps, W. M. 1957. Camellia flower blight. American Camellia Yearbook 1957: 43-
53.
Baxter, L. W. and Segars, S. B. 1989. A note on the camellia flower blight fungus. The Camellia
Journal 44 (4): 9.
Baxter, L. W. and Thomas, C. A. 1994. Studies with Lynx for controlling camellia flower blight and
rose black spot. The Camellia Journal 49 (2): 14-15.
Baxter, L. W. and Thomas, C. A. 1995. Control of certain camellia and rose problems, especially
camellia flower blight (with Lynx). The Camellia Journal 50 (1): 24.
Baxter, L. W., Fagan, S. G. and Mitchell, P. A. 1983. Observations on camellias. The Camellia
Journal 38 (3): 34-35.
Baxter, L. W., Hotchkiss, B. and Thomas, C. 1997. Camellia flower blight, an old disease. The
Camellia Journal 52 (1): 7-8.
Baxter, L. W., Segars, S. B. and Fagan, S. G. 1987. Better control of camellia flower blight caused by
Ciborinia camelliae Kohn. The Camellia Journal 42 (3): 22-24.
Beasley, D. R., Joyce, D. c., Coates, L. M. and Wearing, A. H. 1999. Effect of salicylic acid treatment
on postharvest diseases of Geraldton waxflower. Proceedings of the 1 i h Australasian Plant
Pathology Society: 222.
Benhamou, N. and Chet, 1. 1996. Parasitism of sclerotia of Sclerotium rolfsii by Trichoderma
harzianum: Ultrastructural and cytochemical aspects of the interaction. Phytopathology 86 (4):
405-416.
Benhamou, N. and Chet, 1. 1997. Cellular and molecular mechanisms involved in the intersection
between Trichoderma harzianum and Pythium ultimum. Applied Environmental Microbiology
63: 2095-2099.
Ben-Yephet, Y., Genizi, A. and Siti, E. 1993. Sclerotial survival and apothecial production by
Sclerotinia sclerotiorum following outbreaks oflettuce drop. Phytopathology, 83 (5): 509-513.
Berg, G., Knaape, c., Ballin, G. and Seidel, D. 1994. Biological control of Verticillium dahliae Kleb.
by natural occurring rhizosphere bacteria. Archives of Phytopathology and Plant Protection 29
(3): 249-262.
210

Berg, G., Marten, P. and Bahl, H. 1998. Population dynamics of bacteria including antifungal species
in the rhizosphere of oilseed rape during its life cycle. Archives of Phytopathology and Plant
Protection 31 (3): 215-224.
Bertona, A, Liguori, R, Bassi, R, Fili, V., Filippi, G., Saporiti, M. and Casola, F. 2000. Activation of
natural defense with CGA 245704: a tool for self-defence of plants against pathogens. Aui
Giornatefitopatologiche Perugia 16-20 aprile (2): 27-32.
Bio_Start™ 2001: The biological key to productivity. Bio-Start Limited, Takapuna, New Zealand.
www.bio-start.co.nz (21102/02).
Bisiach-M., Minervini G., Vercesi, A and Zerbetto F. 1985. Research on protection against Botrytis in
viticulture using microbial competitors. Difesa delle Piante 8 (4): 429-439.
Boland, G. J. and Hunter, J. E. 1988. Influence of Alternaria alternata and Cladosporium
cladosporioides on white mold of bean caused by Sclerotinia sclerotiorum. Canadian Journal
of Plant Pathology 10: 172-177.
Boland, G. J. and Inglis, G. D. 1989. Antagonism of white mold (Sclerotinia sclerotiorum) of bean by
fungi from bean and rapeseed flowers. Canadian Journal of Botany 67: 1775-1781.
Bourd6t, G. W., Hurrell, G. A, Saville, D. J. and De Jong, M. D. 2001. Risk analysis of Sclerotinia
sclerotiorum for biological control of Cirisium arvense in pasture: Ascospore dispersal.
Biocontrol Science and Technology 11(1): 119-139.
Brenneman, T. B., Csinos, A S. and Phipps, P. M. 1990. Evaluation of ammonium bicarbonate for
control of soilborne peanut pathogens. Peanut Science 17 (1): 28-31.
Briard, M., Dutertre, M. and Brygoo, Y. 1997. News on Sclerotinia. Three species, but what
variability. Phytoma 490: 15-19.
Brisset, M. N., Cesbron, S., Thomson, S. V. and Paulin, J. P. 2000. Acibenzolar-S-methyl induces the
accumulation of defense-related enzymes in apple and protects from fire blight. European
Journal of Plant Pathology 106 (6): 529-536.
Brodie, I. D. S. and Blakeman, J. P. 1976. Competition for exogenous substrates in vitro by leaf
surface micro-organisms and germination of conidia of Botrytis cinerea. Physiological Plant
Pathology 9 (3): 227-239.
Brooks, A 1979: Camellia flower blight. Garden 104: 214-216.
Brown, A C. 1954. Camellia flower blight. American Camellia yearbook 1954: 34-40.
Brown, J. K. M. 1996. The choice of molecular marker methods for population genetic studies of plant
pathogens. New Phytologist 133: 183-195.
Brown, M. H. 1983. Camellia flower blight - what is it? The Camellia Journal 38 (3): 32-33.
Bulat S. A, Libeck, M., Mironenko, N. V., Jensen, D. F. and Libeck, P.S. 1998. UP-PCR analysis
and ITS 1 ribotyping of strains of Trichoderma and Gliocladium. Mycological Research 102:
933-943.
211

Bull, A T. 1970. Inhibition ofpolysaccharases by melanin: enzyme inhibition in relation to mycolysis.
Archives of Biochemistry and Biophysics 137: 345-356.
Butler, M. J. and Day, A W. 1998a. Fungal melanins: a review. Canadian Journal of Microbiology
44: 1115-36.
Butler, M. J. and Day, A W. 1998b. Destruction of fungal melanins by ligninases of Phanerochaete
chrysosporium and other white rot fungi. International Journal of Plant Sciences 159 (6): 989-
995.
Cameron, K.C. and Buchan, G.D. 2002. Porosity and pore-size distribution. In 'Encyclopedia of Soil
Science', Agropedia series. NY: Marcel Dekker Inc. 1031-1034.
Campbell, L. Moss, B., Pitts, J., Boozer, B., Bannon, J. and Wilson, M. 1997. New chemical may
provide answer to control of bacterial spot of peach. Highlights of Agricultural Research
Alabama Agricultural Experiment Station 44 (4): 18-19.
Campbell, R. 1989. Biological control of microbial plant pathogens. Cambridge university Press,
Cambridge CB2 lRP, UK. 78-84 of218 p.
Canadian Centre for Occupational Health and Safety. 2001. Cheminfo: Calcium cyanamide. CAS
Registry Number 156-62-7. Issue: 2001-2. http://ccinfoweb.ccohs.ca/cheminfo/Action.lasso
(10-05-2001).
Carbone, 1., and Kohn, L. M. 1993. Ribosomal DNA sequence divergence within Internal Transcribed
Spacer 1 of the Sclerotiniaceae. Mycologia 85: 415-427.
Carpenter, M. A, Frampton, C. and Stewart, A 1999. Genetic variation in New Zealand populations
of the plant pathogen Sclerotinia sclerotiorum. New Zealand Journal of Crop and Horticultural
Science 27: 13-21.
Chang, S. T., Wu, C. L. and Chang, H. T. 1999. Effects of various wood-rotting fungi on the
evaluation of decay resistance of wood. Forest Products Industries 18 (4): 355-362.
Chatonnet, P., Boidron, J. N., Dubourdieu, D. and Pons, M. 1994. Changes in the composition of
polyphenolic compounds in oak wood during drying. Preliminary results. Journal International
des Sciences de la Vigne etdu Vin. 28 (4): 337-357.
Chee, A A. 2002. Basidiomycete wood decay fungi from Pinus radiata; biology and biological
control. Unpubl. PhD thesis, Lincon University, Lincoln, New Zealand. 237 p.
Chet,1. 1990. Mycoparasitism - recognition, physiology and ecology. In R. R. Baker and P. E. Dunn
(eds), New Directions in Biological control: Alternatives for Suppressing Agricultural Pests and
Diseases. Alan Liss, New York, pp. 725-733.
Chet, 1. and Inbar, J. 1994. Biological control of fungal pathogens. Applied Biochemistry and
Biotechnology 48: 37-43.
Chin Gouk, S. and Boyd, R. J. 1999. Using an elicitor to induce systemic acquired resistance against
fire blight of pip fruit. Proceedings of the lih Australasian Plant Pathology Society: 237.
212
Chiu, S. C. and Tzean, S. S. 1995. Glucanolytic enzyme production by Schizophyllum commune Fr.
during mycoparasitism. Physiological and Molecular Plant Pathology 46 (2): 83-94.
Chung, Y. R, Hoitink, H. A J., Dick, W. A and Herr, L. J. 1988. Effects of organic matter de
composition level and cellulose amendment on the inoculum potential of Rhizoctonia solani in
hardwood bark media. Phytopathology 78: 836-840.
Cochran, J. H. 1962. A report of the occurrence of camellia flower blight in Mississippi. Plant Disease
Reporter 46: 617.
Cook, R 1999. Fight the blight. Horticulture WeekAugust 12: 20-21.
Cooper, K, Manning, M. and Fullerton, B. 1997. Camellia flower blight. International Camellia
Society Congress, Auckland, New Zealand. 29 Aug-2 Sep. Technical papers. Pp. 36-44.
Corbet, G. B., Cummins, J., Hedges, S. R, Krzanowski, W. 1970. The taxanomic status of British
Water voles, genus Arvicola. Journal oJZoology 161: 301-316.
Cortes, C., Gutierrez, A, Olmedo, V., Inbar, J., Chet, I., and Herrera-Estrella, A 1998. The expression
of genes involved in parasitism by Trichoderma harzianum is triggered by a diffusible factor.
Molecular and General Genetics 260 (2-3): 218-225.
Crawford, M. 2001. Distinguishing between botrytis flower blight and camellia petal blight. American
Camellia Yearbook 2001: 89-91.
Cullen, D. 1997. Recent advances on the molecular genetics of ligninolytic fungi. Journal oj
Biotechnology 53: 273-289.
Dahiya, J. S., Woods, D. L. and Tewari, J. P. 1988. Control of Rhizoctonia solani, causal agent of
brown girdling root rot of rapeseed, by Pseudomonas fluorescens. Botanical Bulletin oj
Academia Sinica, Taiwan 29 (3): 135-141.
Dandurand, L. M., Mosher, R D. and Knudsen, G. R, 2000. Combined effects of Brassica napus seed
meal and Trichoderma harzianum on two soil-borne plant pathogens. Canadian Journal oj
Microbiology 46 (11): 1051-1057.
Dann, E., Diers, B., Byrum J. and Hammerschmidt, R 1998. Effect of treating soybean with 2,6-
dichloroisonicotinic acid (INA) and benzothiadiazole (BTH) on seed yields and the level of
disease caused by Sclerotinia sclerotiorum in field and greenhouse studies. European Journal oj
Plant Pathology 104 (3): 271-278.
Deacon, J. W. 1997. Modem mycology - 3rd edition. Blackwell Science Ltd, Oxford OX2 OEL UK.
303 pp.
del Rio, L., Martinson, C. A, Yang, X. B., Nelson, B. D. (ed.) and Gulya-TJ. 1999. Control of
Sclerotinia stem rot of soybeans with Sporidesmium sclerotivorum. Proceedings oj the 1998
International Sclerotinia Workshop, Fargo, ND, 9-12 September, 1998: 64-65.
Dennis, J. J. and Armstrong, J. 2001. Progress towards an integrated control strategy for onion white
root rot disease, including the use of artificial germination stimulants. Proceedings of the
213
Second International Symposium on Edible Alliaceae, Adelaide, Australia, 1997. Acta
Horticulturae 555: 117-121.
Dhingra, O. D. and Sinclair, J. B. 1975. Survival of Macrophomina phaseolina sclerotia in soil: effects
of soil moisture, carbon:nitrogen ratios, carbon sources, and nitrogen concentrations.
Phytopathology 65 (3): 236-240.
Dick, M. 1983. Peniophora root and stem canker. Forest Pathology in New-Zealand, Forest Research
Institute, New-Zealand. 3: 4 pp.
Dijksterhuis, J., Sanders, M., Gorris, L.G.M. and Smid, E.J. 1999. Antibiosis plays a role in the
context of direct interaction during antagonism of Paenibacillus polymyxa towards Fusarium
oxysporum. Journal of Applied Microbiology, 86: 13-21.
Dong, X. N. 1998. SA, JA, ethylene, and disease resistance in plants. Current Opinion in Plant
Biology 1 (4): 316-323.
Dormsch, K. H., Gams, W. and Anderson, T, H. 1980. Compendium of soil fungi. Academic Press,
London.
dos Santos, A. F. and Dhingra, O. D. 1982. Pathogenicity of Trichoderma spp. on the sclerotia of
Sclerotinia sclerotiorum. Canadian Journal of Botany 60: 472-475.
Downer, A. J., Menge, J. A. and Pond, E. 2001. Association of cellulytic enzyme activities In
eucalyptus mulches with biological control of Phytophthora cinnamomi. Phytopathology 91:
847-855.
Edwards, J. K. 1996. Petal blight control. The Camellia Journal 51 (4): 17-19.
Ejechi, B. 0., Obuekwe, C. 0., andOgbimi, A. O. 1996. Microchemical studies of wood degradation
by brown rot and white rot fungi in two tropical timbers. International Biodeterioration and
Biodegradation 38 (2): 119-122.
Elad, Y. 2000. Trichoderma harzianum T39 preparation for biocontrol of plant diseases - control of
Botrytis cinerea, Sclerotinia sclerotiorum and Cladosporium fulvum. Biocontrol Science and
Technology 10 (4): 499-507.
Elad, Y., Barak, R., and Chet, I. 1984. Parasitism of sclerotia of Sclerotium rolfsii by Trichoderma
harzianum. Soil Biology Biochemistry 16: 381-386.
Expert, J. M. and Digat, B. 1995. Biocontrol of Sclerotinia wilt of sunflower by Pseudomonas
jluorescens and Pseudomonas putida strains. Canadian Journal of Microbiology 41: 685-691.
Fang, H. C. and Liu, T. M. E. 1989a. Effect of urea and nitrogenous compounds on the sclerotial
germination and viability of the Sclerotium rolfsii in soil and its relationship with soil
microorganisms. Plant Protection Bulletin Taiwan 30 (3): 235-244.
Fang, H. C. and Liu, T. M. E. 1989b. Mechanisms of suppression of Sclerotium rolfsii by soil
amendment with urea. Plant Protection Bulletin Taiwan 31 (2): 163-174.
214

Fang, H. C. Liu, T. M. E. and Tu, C. C. 1988. Effect of chemical fertilisers and nitrogenous
compounds on the sclerotia of Sclerotium rolfsii in soil. Plant Protection Bulletin Taiwan 30
(2): 101-110.
Feder N. and O'Brian T. P., 1968. Plant microtechnique: some principles and new methods. American
Journal of Botany 55: 123-142.
Fernando, W. G. D., Watson, A. K. and Paulitz, T. C. 1996. The role of Pseudomonas spp. and
competition for carbon, nitrogen and iron in the enhancement of appressorium formation by
Colletotrichum coccodes on velvetleaf. European Journal of Plant Pathology 102 (1): 1-7.
Fink, G. and Borner, H. 1985. Effect on the sclerotial germination of Sclerotinia sclerotiorum the rape
white stalk pathogen, of transformation products of calcium cyanamide. ZeitschriJt fur
Pjlanzenkrankheiten und Pjlanzenschutz 92 (2): 449-454.
Frampton, R 1994. New disease on camellias in Wellington. New Zealand Camellia Bulletin 117: 4-5.
Fullerton, R A., Roberts, Y. J. and Hurst, R 1998. Studies on the biology and control of camellia
petal blight (Ciborinia camelliae Kohn). Report to the Camellia Memorial Trust. HortResearch
Client Report No. 1998/75. 19 p.
Fullerton, R A.; Hurst, R; Bryne R 1999: Use of foliar applied fungicides to control camellia flower
blight (Ciborinia camelliae Kohn). Report to the Camellia Memorial Trust. HortResearch Client
Report No. 1999/158. 7 p.
GenStat (2000) GenStat for Windows. Release 4.2. Fifth Edition. VSN. International Ltd., Oxford.
GenStat Committee 2000. GenStat Release 4.2 Reference Manual, Parts 1-3. Numerical Algorithms
Group Ltd, Oxford.
Gill, D.L. 1948. Camellia flower blight in the south. Plant Disease Reporter 32: 317-318.
Goh, H. H., Lyons, S. N. and Popay, A. J. 1992. Survival and viability of sclerotia of Sclerotinia
sclerotiorum in two kiwifruit orchards in the Bay of Plenty. Proceedings of the 45th New
Zealand Plant Protection Conference: 184-187.
Gorlach, J., Schmid, J. and Amrhein, N. 1994. Abundance of transcripts specific for genes encoding
enzymes of the prechorismate pathways in different organs of tomato (Lycopersicon esculentum
L.) plants. Planta 193: 216-223.
Gorlach, J., Volrath, S., Knauf-Beiter, G., Hengy, G., Beckhove, u., Kogel, K.H., Oostendorp, M.,
Staub, T., Ward, E., Kessmann, H., and Ryals, J. 1996. Benzothiadiazole, a novel class of
inducers of systemic acquired resistance, activates gene expression and disease resistance in
wheat. The Plant Cell 8: 629-643.
Gouk, S. C. and Boyd, RJ. 1999: Using an elicitor to induce systemic acquired resistance against fire
blight of pip fruit. Proceedings 12th Australasian Plant Pathology Conference: 237.
Gould, A. B., Kobayashi, D. Y. and Bergen, M. S. 1996. Identification of bacteria for biological
control of Botrytis cinerea on Petunia using a petal disk assay. Plant Disease 80 (9): 1029-1033.
215

Gracia-Garza, 1. A, Bailey, B. A, Paulitz, T. c., Lumsden, R. D., Releder, R. D. and Roberts, D. P.
1997a. Effect of sclerotial damage of Sclerotinia sclerotiorum on the mycoparasitic activity of
Trichoderma hamatum. Biocontrol Science and Technology 7 (3): 401-413.
Gracia-Garza, 1. A, Reeleder, R. D. and Paulitz, T. C. 1997b. Degradation of sclerotia of Sclerotinia
sclerotiorum by fungus gnats (Bradysia coprophila) and the biocontrol fungi Trichoderma spp.
Soil Biology and Biochemistry 29 (2): 123-129.
Greaves H. 1972. Influence of mixed microbial population on basidiomycete decay. Material und
Organismen 7 (1): 11-25.
Grendene, A. and Marciano, P. 1999. Interaction between Sclerotinia sclerotiorum and Coniothyrium
minitans strains with different aggressiveness. Phytoparasitica 27 (3): 201-206.
Haasis, F. A and Nelson, E. G. 1953. Control of flower blight disease of camellias with eradicant
fungicides. American Camellia Yearbook 1953: 119-123.
Haasis, F. A and Winstead, N. N. 1954. Some characteristics of two Sclerotinia pathogens and their
relationship to flower blight of camellia. American Camellia Yearbook 1954: 22-33.
Haasis, F. A.l953. Flower blight of camellias. American Camellia Yearbook 1953: 111-119.
Hagiya, K 1997. Bright future of camellias by hybridising distant relatives. New Zealand Camellia
Journal 50 (1): 7-8.
Hannusch D. J. and Boland, G. J. 1996. Influence of air temperature and relative humidity on
biological control of white mold of bean (Sclerotinia sclerotiorum). Phytopathology 86 ( 2):
156-162.
Hansen, H. H. and Thomas, H. E. 1940. Flower blight of camellias. Phytopathology 30: 166-170.
Hara, K 1919. A sclerotial disease of camellia (Camelliajaponica). Dianppon Sanrin Kaiho 436: 29-
31. As cited in Kohn & Nagasawa (1984).
Hardy, G. E. St. J. and Sivasithamparam, K, 1989. Microbial, chemical and physical changes during
composting of eucalyptus (Eucalyptus calophylla and Eucalyptus diversicolor) bark mix.
Biological Fertility Soils 8: 260-270.
Hardy, G. E. St. J. and Sivasithamparam, K, 1991a. Suppression of Phytophthora root rot by a
composted eucalyptus bark mix. Aust. J Bot. 39: 153-159.
Hardy, G.E.St.1. and Sivasithamparam, K, 1991b. Effects of sterile and non-sterile leachates extracted
from composted eucalyptus bark and pine-bark container media on Phytophthora spp .. Soil
Biology Biochemistry 23 (1): 25-30.
Harvey, 1. M. and Hansen, H. H. 1950. Camellia flower blight and its control. Phytopathology 40:
965-966.
Hawthorne, B. T. and Jarvis, W. R. 1973. Differential activity of fungicides on various stages in the
life cycle of Sclerotinia spp. N. Z. Journal of Agricultural Research 16: 551-557.
216
Hayat, M. A . 1981. Fixation for Electron Microscopy p69. In: Principles and techniques of electron
microscopy. Biological applications. Edward Arnold, London WClB 3DQ; UK. 522 pp.
Highley, T. L. 1973. Influence of carbon source on cellulase activity of white-rot and brown-rot fungi.
Wood and Fiber 5 (1), 50-58.
Hishida, A Suzuki, T. Iijima, T. and Higaki, M. 1997. An extracellular cellulase of the brown-rot
fungus, Tyromyces palustris. Mokuzai Gakkaishi -Journal of the Japan Wood Research Society
43 (8): 686-691.
Hoes, J. A and Huang, H. C., 1975. Sclerotinia sclerotiorum: Viability and separation of sclerotia
from soil. Phytopathology 65: 1431-1432.
Hofte, M., Poppe, L., Achuo, E.A and Audenaert, K. 2001. Potential of induced resistance to control
tomato leaf pathogens. Proceedings of the 5th Congress of European Foundation for Plant
Pathology: 496-498.
Hoitink, H. A J. and Fahy, P. C., 1986. Basis for the control of soilborne plant pathogens with
composts. Annual Review Phytopathology 24: 93-114.
Holcomb, G. E. 1976. Fungicide sprays offer control of camellia flower blight. The Camellia Journal
31 (3): 13.
Holcomb, G. E. 1990. Camellia flower blight: a summary of nine years of tests with flower protectant
fungicides. American Camellia Yearbook 1990: 169-173.
Holcomb, G. E. 1997. Louisiana flower blight control tests in 1997. American Camellia Yearbook
1997: 32-33.
Holst-Jensen, A, Kohn L. M., and Schumacher, T. 1997a. Nuclear rDNA phylogeny of
Sclerotiniaceae. Mycologia 89: 885-899.
Holst-Jensen, A, Kohn, L. M., Jakobsen, K. S. and Schumacher, T. 1997b. Molecular phylogeny and
evolution of Monilinia (Sclerotiniaceae) based on coding and noncoding rDNA sequences.
American Journal of Botany 84: 686-701.
Hopwood, D. A and Shennan, D. H. 1990. Molecular genetics of polyketidies and its comparison to
fatty acid biosynthesis. Annual Review Genetics. 24: 37-66.
Hotchkiss, B. and Baxter, L.W. 1994. Camellia flower blight studies. The Camellia Journal 49 (3): 15.
Hotchkiss, B., Priester, W. and Baxter, L.W. 1997. Flower blight studies at Massee Lane 1996-97.
American Camellia Yearbook 1997: 34-36.
Hoynes, C. D., Lewis, J. A, Lumsden, R. D. and Bean, G. A 1999. Biological control agents in
combination with fertilisation or fumigation to reduce sclerotial viability of Sclerotium rolfsii
and disease of snap beans in the greenhouse. Journal of Phytopathology 147 (3): 175-182.
Hoyte, S. M., Bedford, R. J., Gouk, S. C. and Popay, A J. 1992. Field observations of Sclerotinia
sclerotiorum: apothecial development and sclerotial production. Proceedings of the 45th New
Zealand Plant Protection Conference: 188-192.
217
Hoyte, S. M., Carbone, I. and Kohn, L. M. 200 I. Isolate variability amongst Sclerotinia sclerotiorum
from New Zealand kiwifruit orchards. Proceedings from the XI International Sclerotinia
Workshop, York, 8-12 July 2001: 97-98.
Hseu, R. R., Wang, H. H. and Wang, H. F. 1996. Differentiation and grouping of isolates of the
Ganoderma lucidum complex by random amplified polymorphic DNA-PCR compared with
grouping on the basis of internal transcribed spacer sequences. Applied and Environmental
Microbiology 62 (4): 1354-1363.
Huang H. C. 1983. Pathogenicity and survival of the tan-sclerotial strain of Sclerotinia sclerotiorum.
Canadian Journal of Plant Pathology 5 (4): 245-247.
Huang, H. C. 1977. Importance of Coniothyrium minitans in survival of sclerotia of Sclerotinia
sclerotiorum in wilted sunflower. Canada Journal of Botany 85: 289-295.
Huang, H. C. and Janzen, H. H. 1991. Control of carpogenic germination of sclerotia of Sclerotinia
sclerotiorum by volatile substances from urea. Plant Protection Bulletin, Taiwan 33: 3: 283-289.
Huang, H. C. and Sun, S. K. 1991. Effects ofS-H mixture or Perika™ on carpogenic germination and
survival of sclerotia of Sclerotinia sclerotiorum. Soil Biology and Biochemistry 23 (9): 809-813.
Huang, H. C., Huang, J. W., Saindon, G. and Erickson, R. S. 1997. Effect of allyl alcohol and
fermented agricultural wastes on carpogenic germination of sclerotia of Sclerotinia sclerotiorum
and colonisation by Trichoderma spp. Canadian Journal of Plant Pathology 19 (1): 43-46.
Huang, H.C. 1981. Distribution of Coniothyrium minitans in Manitoba sunflower fields. Canadian
Journal of Plant Pathology 3: 219-222.
Huang, H.C. and Hoes, 1976. Penetration and infection of Sclerotinia sclerotiorum by Coniothyrium
minitans. Canadian Journal of Botany 54: 406-410.
Hutchins, J.D. and Archer, S.A. 1994. Biocontrol of Sclerotinia sclerotiorum by manipulation of petal
microflora. Brighton Crop Protection Conference -Pests and Diseases (2): 935-936.
lakovlev, A. and Stenlid, J. 2000. Spatiotemporal patterns of laccase activity in interacting mycelia of
wood-decaying basidiomycete fungi. Microbial Ecology 39 (3): 236-245.
Inbar, J. and Chet, L 1992. Biomimics of cell-cell recognition by use of lectin-coated nylon fibres.
Journal of Bacteriology 174 (3): 1055-1059.
Inbar,1. and Chet, L 1994. A newly isolated lectin from the plant pathogen fungus Sclerotium ro/fsii:
purification, characterisation and the role on mycoparasitism. Microbiology reading 140 (3):
651-657.
Inbar, J. and Chet, L 1995. The role of recognition in the induction of specific chitinases during
mycoparasitism by Trichoderma harzianum. Microbiology-reading 141 (11): 2823-2829.
Inglis, G. D. and Boland G. J. 1990. The microflora of bean and rapeseed petals and the influence of
rnicroflora of bean petals on white mold. Canadian Journal of Plant Pathology 12: 129-134.
218

Inglis, G. D. and Boland G. J. 1992. Evaluation of filamentous fungi isolated from petals of bean and
rapeseed for suppression of white mold. Canadian Journal of Microbiology 38: 124-129.
Iriyama, K. 1980. Camellia petal blight research in Japan. American Camellia Yearbook 1980: 95-101.
Ishii, H., Tomita, Y., Horio, T., Narusaka, Y., Nakazawa, Y., Nishimura, K. and Iwamoto, S. 1999.
Induced resistance of acibenzolar-S-methyl (CGA 245704) to cucumber and Japanese pear
diseases. European Journal of Plant Pathology 105 (1): 77-85.
Jones, D. and Gray, E. G. 1973. Factors affecting germination of sclerotia of Sclerotinia sclerotiorum
from peas. Transactions of the British Mycological Society 60 (3): 495-500.
Jones, E. E. and Stewart, A. 2000. Selection of mycoparasites of sclerotia of Sclerotinia sclerotiorum
isolated from New Zealand soils. New Zealand Journal of Crop and Horticultural Science 28:
105-114.
Kakoti, R. K. and Saikia, U. N. 1997. Sclerotia1 survival of Sclerotinia sclerotiorum (Lib.) de Bary in
soil. Journal of Agricultural Science Society of North East India, 10 (2): 265-267.
Kakoti, R. K. and Saikia, U. N. 1998. Soil-borne mycoflora associated with the sclerotia of Sclerotinia
sclerotiorum (Lib.) de Bary. Annals of Agricultural Bio-Research 3 (2): 203-205.
Kessmann, H., Oostendorp, M. and Staub, T. 1996: CGA 2455704: Mode of action of a new plant
activator. Brighton Crop Protection Conference - Pests & Diseases: 961-966.
Kim, B. S., Lee, J. Y. and Hwang, B. K. 2000. In vivo control and in vitro antifungal activity of
rhamnolipid B, a glycolipid antibiotic, against Phytophthora capsici and Colletotrichum
orbiculare. Pest Management Science 56 (12): 1029-1035.
Kohn, L. M. 1979. Delimitation of the economically important plant pathogenic Sclerotinia species.
Phytopathology 69 (8): 881-886.
Kohn, L. M. 1995. The clonal dynamic in wild and agricultural plant-pathogen populations. Canadian
Journal of Botany 73 (1): 1231-1240.
Kohn, L. M. and Nagasawa, E. 1984. A taxonomic reassessment of Sclerotinia camelliae Hara =
Ciborinia camelliae Kohn, with observations on flower blight in Japan. Transactions of the
Mycological Society of Japan 25: 149-161.
Kohn, L. M., Stasovski, E., Carbone, I., Royer, J. and Anderson, J. B. 1991. Mycelial incompatibility
and molecular markers identify genetic variability in field populations of Sclerotinia
sclerotiorum. Phytopathology 81 (4): 480-485.
Koka1is, B. N., and Rodriguez, K. R. 1994. Effects of pine bark extracts and pine bark power on
fungal pathogens, soil enzyme activity, and microbial populations. Biological Control 43: 269-
276.
Kruger, W. 1980. On the effect of calcium cyanamide on the development of apothecia of Whetzeliana
sclerotiorum (Lib.) Korf & Dumont, the agent of stalk rot of rape. Nachrichtenblatt des
Deutschen Pjlanzenschutzdienstes, 32 (2): 17-21.
219

Krzanowski, W. J. 1990. Incorporating group structure: descriptive methods. In Principles of
multivariate analysis: A user's perspective. Chapter 11: 289-322.
Kwasna, H., Sierota, Z. and Bateman, G. L. 2000. Fungal communities in fallow soil before and after
amending with pine sawdust. Applied Soil Ecology 14 (2): 177-182.
Labrie, c., Leclerc, P., Cote, N., Roy, S., Brzezinski, R, Hogue, R and Beaulieu, C. 2001. Effect of
chitin waste-based composts produced by two-phase composting on two oomycete plant
pathogens. Plant and Soil 235 (1): 27-34.
Lakatos, T., Buban, T., Muller, W. (ed.), Polesny, F. (ed.), Verheyden, C. (ed.) and Webster, A. D.
2000. Effectiveness of different groundcover materials to preserve soil water content in a young
apple orchard. Proceedings of the international conference on integrated fruit production,
Leuven, Belgium, 27 July-l August 1998. Acta Horticulturae (525): 425-426.
Latunde-Dada, A. O. and Lucas, J. A. 2001. A chemical defence activator primes cowpea seedlings for
rapid induction of resistance to anthracnose caused by Colletotrichum destructivum.
Proceedings of the 5"1 Congress of European Foundation for Plant Pathology: 349-352.
Leal, D. P., Isla, M. I., Vattuone, M. A. and Sampietro, A. R 1994. Production of plant protoplasts by
enzymes from selected wood-destroying fungi. Applied Microbiology and Biotechnology 41 (1):
58-61.
Leggett, M. E. and Rahe, J. E. 1985. Survival of sclerotia of Sclerotium cepivorum Berk. Factors
affecting survival of sclerotia of Sclerotium cepivorum in the Fraser Valley of British Columbia.
Annals of Applied Biology 106: 255-263.
Leisola, M., Waldner, R, Zadrazil, F. (ed.) and Reiniger, P. 1988. Production, characterization and
mechanism of lignin peroxidases. Treatment of lignocellulosics with white rot fungi: 37-42. In:
Elsevier Applied Science Publishers Ltd, Barking, Essex, UK.
Lestan, D. and Lamar, R 1996. Development of fungal inoula for bioaugmentation of contaminated
soils. Applied and Environmental Microbiology 62: 2045-2052.
Levi, M. P. and Cowling, E. B. 1969. Role of nitrogen in wood deterioration. VII. Physiological
adaptation of wood-destroying and other fungi to substrates deficient in nitrogen.
Phytopathology 59: 460-468.
Lewis, J. A. and Papavizas, G. C. 1985. Effect of mycelial preparations of Trichoderma and
Gliocladium on populations of Rhizoctonia solani and the incidence of damping-off.
Phytopathology 75 (7): 812-817.
Liao, X. I. and Luo, K. 2000. Isolation of bacteria on rape flower and their antagonism to Sclerotinia
sclerotiorum. Journal of Hunan Agricultural University 26 (4): 296-298.
Liu, L. x., Hsiang, T., Carey, K. and Eggens, J. L. 1995. Microbial populations and suppression of
dollar spot disease in creeping bentgrass with inorganic and organic amendments. Plant Disease
79: 144-147.
220

Long, P. and Taylor, C. 1999. Research on camellia flower blight in New Zealand. International
Camellia Congress 1999. Mar 20-Mar 31, Miyazaki, Japan. Pp 48-51.
Lubeck, M., Alekhina, I. A, Lubeck, P. S. and Bulat, S. A 1998. UP-PCR genotyping and rDNA
analysis of Ascochyta pisi Lib. Journal of Phytopathology 146: 51-55.
Luth, P., Pfeffer, H. and Schulz, R. R. 1992. The influence of different fungus species and isolates on
the formation of apothecia of Sclerotinia sclerotiorum under simulated spring conditions.
Zentralblatt fur Mikrobiologie 147 (6): 368-377.
Lynch, J.M. and Ebben, M.H. 1986. The use of micro-organisms to control plant disease. Journal of
Applied Bacteriology Symposium Supplement: 115S-126S.
Machuca, A. and Ferraz, A 2001. Hydrolytic and oxidative enzymes produced by white- and brown
rot fungi during Eucalyptus grandis decay in solid medium. Enzyme and Microbial Technology
29 (6-7): 386-391.
Madsen, M. 2002. Potential of Coniothyrium minitans isolate A69 as a biological control agent of
sclerotia of Sclerotinia sclerotiorum and Ciborinia camelliae in different media. Thesis to
fullfill requirements of a BSc at Lincoln University, New Zealand (unpubl.): 19 pp.
Maiti, D. and Sen, C. 1985. Integrated biocontrol of Sclerotium rolfsii with nitrogenous fertilisers and
Trichoderma harzianum. Indian Journal of Agricultural Sciences 55 (7): 464-468.
Manian, S. and Manibhushanroa, K. 1990. Influence of some factors on the survival of Rhizoctonia
solani in soil. Tropical Agriculture 67 (3): 207-208.
Mansilla, J. P., Aguin, 0., Vela, P. and Salinero, M. C. 2001. Fungal Diseases affecting camellia in
Galicia in NW Spain. American Camellia Yearbook 2001: 18-21.
Mansilla, J. P., Pintos, C. and Salinero, C. 1999. Detecci6n en Espana de Ciborinia camelliae Kohn.
Phytoma 109: 24-27. (In Spanish.)
Matsumoto, S. 1995. How we are coping with flower blight in Japan. New Zealand Camellia Bulletin "-
122: 38-41.
McCain, A H. 1963. Longevity of Sclerotinia camelliae cultures. Plant Disease Reporter 47: 444.
McCullagh, P. and NeIder, J.A (1989). Generalized linear models (second edition). Chapman and
Hall, London.
McLaren, D. L., Huang, H. C., Kozub. G. C. and Rimmer, S. R. 1994. Biological control of sclerotinia
wilt of sunflower with Talaromyces flavus and Coniothyrium minitans. Plant Disease, 78 (3):
231-235.
McLaren, D.L. and Huang, H.C. 1996. Control of apothecial production of Sclerotinia sclerotiorum by
Coniothyrium minitans and Talaromycesflavus. Plant Disease, 80 (12): 1373-1378.
McQuilken, M. P. 2001. Integrated control of Sclerotinia disease in field-grown lettuce in Scotland.
The xi" International Sclerotinia Workshop. 8-12 July 2001, Central Science Laboratory, York,
UK.
221

McQuilken, M. P., Budge, S. P. and Whipps, J. M. 1997. Production, survival and evaluation of liquid
culture-produced inocula of Coniothyrium minitans against Sclerotinia sclerotiorum. Biocontrol
Science and Technology 7: 23-26.
Menendez, A B., and Godeas, A 1998. Biological control of Sclerotinia sclerotiorum attacking
soybean plants. Degradation of the cell walls of this pathogen by Trichoderma harzianum
(BAFC 742). Mycopathologia 142 (3): 153-160.
Merriman, P.R. 1976. Survival of sclerotia of Sclerotinia sclerotiorum in soil. Soil Biology and
Biochemistry (85): 385-389.
Metzler, B. 1986. Ultrastructure of sclerotia formation of Typhula incarnata. Berichte der Deutschen
Botanischen Gesellschaft 99 (1-2): 59-65.
Mischke, S. and Adams, P. B. 1996. Temporal and spatial factors affecting germination of
macroconidia of Sporidesmium sclerotivorum. Mycologia 88 (2): 271-277.
Mischke, S., 1998. Mycoparasitism of selected sclerotia-forming fungi by Sporidesmium
sclerotivorum. Canadian Journal of Botany 76 (3): 460-466.
Mischke, S., Mischke, C. F. and Adams, P. B. 1995. A rind-associated factor from sclerotia of
Sclerotinia minor stimulates germination of a mycoparasite. Mycological Research 99 (9):
1063-1070.
Monaco, C. 1, Rollan, M. C. and Nico, A 1 1998. The effect of mycoparasites on the reproductive
ability of sclerotia of Sclerotinia sclerotiorum. Revista Iberoamericana de Micologia 15 (2): 81-
84.
Mori, M., Aoyama, M. and Doi, S. 1997b. Antifungal constituents in the bark of Magnolia obovata
Thunb. Holz als Roh und Werkstoff 55 (4): 275-278.
Mori, M., Aoyama, M., Doi, S., Kanetoshi, A and Hayashi, T. 1997a. Antifungal activity of bark
extracts of deciduous trees. Holz als Roh und Werkstoff 55 (2): 130-132.
Musavi, M. A, D'yakov, Y. U. T. and Chaika, M. N. 1991. Effect oftricyclazol on sclerotia formation
in the fungi Botrytis cinerea Pers. and Sclerotinia sclerotiorum. Lib Prikladnaya Biokhimiya I
Mikrobiologiya 27: 255-260.
Myalova, L. A 1983. Development of the ascus state of Coccomyces hiemalis Higgins, causing a
cherry disease. Mikologiya i Fitopatologiya 17 (2): 140-143.
Narusaka, Y., Narusaka, M., Horio, T. and Ishii, H. 1999a. Comparison of local and systemic
induction of acquired disease resistance in cucumber plants treated with benzothiadiazoles or
salicylic acid. Plant and Cell Physiology 40 (4): 388-395.
Narusaka, Y., Narusaka, M., Horio, T. and Ishii, H. 1999b. Induction of disease resistance in
cucumber by acibenzolar-S-methyl and expression of resistance-related genes. Annals of the
Phytopathological Society of Japan 65 (2): 116-122.
222

New Zealand Agrichemical Manual 2002. New Zealand Agrichemical Manual, WHAM Media
Limited, Wellington, New Zealand. www.spraybible.com (02108/2002).
Nwufo, B. T. and Oghenah, B. O. 2001. Biodegradation of urea formaldehyde modified saw-dust by
cellulolytic fungi I. Global Journal of Pure and Applied Sciences 7 (2): 297-302.
Omero, e. Inbar, 1., Rocha-Ramirez, V., Herrera-Estrella, A. and Chet, I. and Horwitz, B. A. 1999. G
protein activators and cAMP promote mycoparasitic behaviour in Trichoderma harzianum.
Mycological Research 103 (12): 1637-1642.
Oostendorp, M., Kunz, W., Dietrich, B. and Staub, T. 2001. Induced disease resistance in plants by
chemicals. Special Issue Induced Resistance to Plant Diseases Papers presented at an
International Symposium held in Corfu 22-27 May, 2000. European Journal of Plant Pathology
107 (1): 19-28.
Papavizas, G. C. and Lewis, J. A. 1989. Effect of Gliocladium and Trichoderma on damping-off and
blight of snapbean caused by Sclerotium rolfsii in the greenhouse. Plant Pathology 38 (2): 278-
286.
Parfitt, D., Coley-Smith, J. Rand Jeves, T. M. 1983. Teratosperma oligocladum, a mycoparasite of
fungal sclerotia. Plant Pathology 32 (4): 459-460.
Paterson, RRM. and Bridge, P.D. 1994. Biochemical techniques for filamentous fungi. In: IMI
Technical Handbooks No.1, pp 125.
Peng, G. and Sutton, J.e. 1991. Evaluation of microorganism for biocontrol of Botrytis cinerea in
strawberry. Canadian Journal of Plant Pathology 13,' 247-257.
Pennycook, S. R 1985. Fungal fruit rots of Actinidia deliciosa (kiwifruit). New Zealand Journal of
Experimental Agriculture 13: 4, 289-299.
Pennycook, S. R 1989. Plant diseases recorded in New Zealand, Volume 1. Plant Diseases Division,
DSIR, Auckland New Zealand. 108 p.
Peper, K. 1999. Die Braunfaulen der Kamelienbliite: Ciborinia camelliae Kohn. die Kamelie Nr. 1
November 1999. 24 p.
Phillips, A. 1. L. 1986. Factors affecting the parasitic activity of Gliocladium virens on sclerotia of
Sclerotinia sclerotiorum and a note on its host range. Journal of Phytopathology 116 (3): 212-
220.
Pickering, J. S., Kendle, A. D. Hadley, P. and Szmidt, R A. K. 1998. The suitability of composted
green waste as an organic mulch: effects on soil moisture retention and surface temperature.
Proceedings of the international symposium on composting and use of composted materials for
horticulture, Auchincruive, April 1997. Acta Horticulturae (469): 319-324.
Plakidas, A. G. 1950. Camellia flower blight in Louisiana. Plant Disease Reporter 34: 118.
Plakidas, A. G. 1957. Camellia flower blight found in Texas. Plant Disease Reporter 41: 547.
223

Pliszka, K., Scibisz, K., Rojek, H., Zakowicz, S., Yarborough, D. E. (ed.) and Smagula, J. M. 1997.
Effect of soil management and water stress upon growth and cropping of the highbush
blueberry. Proceedings of the sixth international symposium on Vaccinium culture, Orono,
Maine, USA, 12-17 August, 1996. Acta Horticulturae (446): 487-495.
Punja, Z. K. and Grogan, R G. 1982. Effects of inorganic salts, carbonate-bicarbonate amons,
ammonia, and the modifying influence of pH on sclerotial germination of Sclerotium rolfsii.
Phytopathology 72 (6): 635-639.
Punja, Z. K. Carter, J. D., Campbell, G. M. and Rossell, E. L. 1986. Effects of calcium and nitrogen
fertilisers, fungicides, and tillage practices on incidence of Sclerotium rolftii in processing
carrots. Plant Disease 70 (9): 819-824.
Raabe, R D., McCain, A. H. and Paulus, A. O. 1978. Disease and pests. In: Feathers, D. L. and
Brown, M. H. ed. The camellia. Its history, culture, genetics and a look into its future
development. Columbia, South Carolina. United States, American Camellia Society. Pp. 221-
231.
Raabe, RD., Plakidas, A. G., and Baxter, L. W. 1958. Flower blight of camellia. In: Tourje, E.C. ed.
Camellia culture. California, United States, Southern Californian Camellia Society, Inc. Pp.
279-285.
Rabeendran, N., Jones E. E. and Stewart, A. 1998. Isolation and in vitro screening of soil fungi for
biological control of Sclerotinia sclerotiorum. New Zealand Plant Protection 51: 102-106.
Rabeendran, N., Jones, E.E., Moot, D., Pay, J., and Stewart, A. 1999. Biological control of Sclerotinia
diseases of vegetables using fungal antagonists. Proceedings o/the First Australasian Soilborne
Disease Symposium: 99-100.
Raeder, U. and Broda, P., 1985. Rapid preparation of DNA from filamentous fungi. Letters in Applied
Microbiology 1: 17-20.
Raynal, G. 1987. Factors acting on apothecia formation of Sclerotinia trifoliorum Eriks. under
controlled conditions. Agronomie 7 (9): 715-725.
Reglinski, T. Whitaker, G., Cooney, J. M., Taylor, J. T., Poole, P. R, Roberts, P. B. and Kim, K. K.
2001. Systemic acquired resistance to Sclerotinia sclerotiorum in kiwifruit vines. Physiological
and Molecular Plant Pathology 58 (3): 111-118.
Richmond, R G. 1949. Camellia flower spot in Oregon. Plant Disease Reporter 33: 404.
Rohilla, R, Singh, U. S. and Singh, R L. 2002. Mode of action of acibenzolar-S-methyl against sheath
blight of rice, caused by Rhizoctonia solani Kuhn. Pest Management Science 58 (1): 63-69.
Rolfe, J. 1992. Gardening with camellias: A New Zealand guide. Godwit Press Ltd, Mount Eden,
Auckland, New Zealand. 176 pp.
224
Ruess, W., Mueller, K., Knauf-Beiter, G., Kunz, W. and Staub T. 1996. Plant activator CGA 245704:
an innovative approach for disease control in cereals and tobacco. Brighton Crop Protection
Conference: 53-60.
Ruter, J. M. 2001. Nursery production of tea oil camelliae (c. oleifera) under different light levels.
2001 American Camellia Year Book: 13-15.
Sambrook, l, Fritsch, E. F. and Maniatis, T. 1989. Molecular cloning. A laboratory manual. 2nd ed.
Cold Spring Harbour Laboratory Press. Vol. 1-4.
Sandys-Winsch, C., Whipps, l M., Gerlagh, M. and Kruse, M. 1993. World distribution of the
sclerotial mycoparasite Coniothyrium minitans. Mycological Research 97 (10): 1175-1178.
Sandys-Winsch, D.C., Whipps, J.M., Fenlon, lS. and Lynch, J. M. 1994. The validity of in vitro
screening methods in the search for fungal antagonists of Sclerotinia sclerotiorum causing wilt
of sunflower. Biocontrol Science and Technology 4: 269-277.
Savige, T.J. 1993. International Camellia Resister. Volume I. Sydney, Australia, The International
Camellia society. 1104 p.
Scarponi, L., Buonaurio, Rand Martinetti, L. 2001b. Persistence and translocation of a
benzothiadiazole derivative in tomato plants in relation to systemic acquired resistance against
Pseudomonas syringae pv. tomato. Pest Management Science 57 (3): 262-268.
Scarponi, L., Buonaurio, R, and Bertona, A. 2001a. Persistence of acibenzolar-S-methyl and SAR
induction in tomato and pepper plants. Proceedings of the 5th Congress of European Foundation
for Pant Pathology: 388-390.
Scheibert, D. 1996. Camellia petal blight control. The Camellia Journal 51 (4): 23-26.
Shaban G. M., Fadl-Allah, E. M. and Yaser, M. 1998. Effect of C:N ratio on numbers and types of
fungi in Egyptian soil. Egyptian Journal of Microbiology 33 (3): 339-352.
Shapira, R, Henis, Y., Sklan, D. and Chet, I. 1984. Changes in fatty acids during morphogenesis in
Sclerotium rolfsii. Journal of General Microbiology 130 (5): 1183-1191.
Sharma, B. K. and Singh, B.M., 1990. Biological control of white rot of pea caused by Sclerotinia
sclerotiorum (Lib.) de Bary. Journal of Biological Control 4 (2): 132-134.
Sharma, B. K., Singh, B. M. and Sugha, S. K. 1992. Fungal antagonists of Sclerotinia sclerotiorum
(Lib.) de Bary. Mysore Journal of Agricultural Sciences 26 (3): 271-275.
Silva, F. de A. G. da, Peixoto, C. do N., Assis, S. M. P. de, Mariano, R de L. Rand Padovan, 1, P.
1998. Potential of fluorescent Pseudomonas spp. for biological control of Alternaria ricini on
castor bean. Brazilian Archives of Biology and Technology 41 (1): 91-102.
Singh, Rand Tripathi, N. N. 1996. Effect of soil type on apothecial production of Sclerotinia
sclerotiorum (Lib) De Bary. Indian Journal of Agricultural Research 30 (3-4): 191-196.
Singh, U. P., Singh, H. B. and Singh, R B. 1980. The fungicidal effect ofneem (Azadirachta indica)
extracts on some soil-borne pathogens of gram (Cicer arietinum). Mycologia 726): 1077-1093.
225

Sneath, P. H. A. and Sokal, R. R. 1973. Numerical taxonomy; The principles and practice of numerical
classification. San Francisco, W.H. Freeman, USA, 573 pp.
Sobiczewski, P. and Bryk, H. 1999. The possibilities and limitations of biological control of apples
against gray mold and blue mold with bacteria Pantoea agglomerans and Pseudomonas sp.
Progress in Plant Protection 39 (1): 139-147.
Stewart, A. and Harrison Y. A. 1988. Mycoparasitism of sclerotia of Sclerotium cepivorum.
Australasian Plant Pathology 18 (1): 10-14.
Stewart, T. M. 1994: Camellia flower blight -life history and control. New Zealand Camellia Bulletin
118: 10-13.
Stewart, T. M. and Neilson, H. 1993. Flower blight, a new disease of camellias in New Zealand. New
Zealand Camellia Bulletin 116: 29-33.
Sun, P. and Yang, X. B. 2000. Light, temperature, and moisture effects on apothecium production of
Sclerotinia sclerotiorum. Plant Disease 84 (12): 1287-1293.
Sundar, A. R., Viswanathan, R. and Padmanaban, P. 2001. Induction of systemic resistance to
Colletotrichum falcatum in sugarcane by a synthetic signal molecule, acibenzolar -S- methyl
(CGA 245704). Proceedings of the 63rd Annual Convention of the Sugar Technologists'
Association of India, Jaipur, India: AI12-AI34.
Suzzi, G., Romano, P., Ponti, 1. and Montuschi, C. 1995. Natural wine yeasts as biocontrol agents.
Journal of Applied Bacteriology 78: 304-308.
Swadling, 1. R. and Jeffries, P. 1996. Isolation of microbial antagonists for biocontrol of grey mould
disease of strawberries. Biocontrol Science and Technology 6 (1): 125-136.
Swaninathan, J., McLean, K. L., Pay, J. M. and Stewart, A. 1999. Soil solarisation: a cultural practice
to reduce viability of sclerotia of Sclerotinia sclerotiorum in New Zealand soils. NZ Journal of
Crop and Horticultural Science, 27: 4, 331-335.
Taylor, C. H. 1999. Studies of Camellia Flower Blight (Ciborinia camelliae) in New Zealand.
Unpublished MSc thesis, Massey University, Palmerston North, New Zealand. 187 p.
Taylor, C. H. and Long, P. G. 1998. Isolation and culture of Ciborinia camelliae. Proceedings of the
5FI NZ Plant Protection Conference: 264.Poster, Abstract.)
Taylor, C. H. and Long, P. G. 1999. Screening for resistance to camellia flower blight. Proceedings of
the 52nd NZ Plant Protection Conference: 273.Poster, Abstract.)
Taylor, C. H. and Long, P. G. 2000: Review of literature on camellia flower blight caused by
Ciborinia camelliae. New Zealand Journal of Crop and Horticultural Science 28: 123-138.
Taylor, C. H., Long, P. G. and Bradshaw, R. E. 1999. 1998 survey shows camellia flower blight is
widespread in New Zealand. Proceedings of the 52nd NZ Plant Protection Conference: 25-28.
226
Teo, B. K. Verma, P. R. and Morrall, R. A. A. 1992. The effects of herbicides and mycoparasites at
different moisture levels on carpogenic germination in Sclerotinia sclerotiorum. Plant and Soil
139 (1): 99-107.
Tosi, L. and Zazzerini, A. 2000. Interactions between Plasmopara helianthi, Glomus mosseae and two
plant activators in sunflower plants. European Journal of Plant Pathology 106 (8): 735-744.
Tosi, L. Luigetti, R. and Zazzerini, A. 2000. Occurrence of PR proteins in sunflower (Helianthus
annuus L.) treated with some plant activators and inoculated with Plasmopara helianthi Novot.
AUi, Giornate fitopatologiche, Perugia 16-20 aprile 2000 (2): 283-290.
Tosi, L., Luigetti, R. and Zazzerini, A. 1999. Benzothiadiazole induces resistance to Plasmopara
helianthi in sunflower plants. Journal of Phytopathology 147 (6): 365-370.
Tourje, E. C. 1958. Camellia flower blight: report on control measures. American Camellia Yearbook
1958:97-102.
Trutmann, P. and Keane, P. J. 1990 Trichoderma koningii as a biological control agent for Sclerotinia
sclerotiorum in southern Australia. Soil Biology and Biochemistry 22 (1): 43-50.
Trutmann, P., Keane, P. J. and Merriman P.R. 1982. Biological control of Sclerotinia sclerotiorum on
aerial parts of plants by the hyperparasite Coniothyrium minitans. Trans. Br. Mycology. Society
783): 521-529.
Tu, C. C., Hsieh, T. F. and Tsai, W. H. 1991. Effects of temperature, moisture and amendments on the
occurrence of lily southern blight caused by Sclerotium rolfsii Sacco Plant Protection Bulletin
Taipei 33(1): 80-94.
Tu, J. C. 1984. Mycoparasitism by Coniothyrium minitans on Sclerotinia sclerotiorum and its effect
on sclerotial germination. Phytopathologische ZeitschriJt 109 (3): 261-268.
Tu, J. C., 1997. Biological control of white mould in white bean using Trichoderma viride,
Gliocladium roseum and Bacillus subtilis as protective foliar spray. Proceedings of the 49th
International Symposium on Crop Protection, Gent, Belgium, 6 May, 1997, Part IV, 62 (3b):
979-986.
Turner, G. S. and Tribe, H. T. 1975. Preliminary field plot trials on biological control of Sclerotinia
trifoliorum by Coniothyrium minitans. Plant Pathology 24: 109-113.
Turner, G. S. and Tribe, H. T. 1976. On Coniothyrium minitans and its parasitism of Sclerotinia
species. Trans. Br, Mycology Society 66: 97-105.
Tyson, J. L., Ridgway, H. J., Fullerton, R. A. and Stewart, A. 2002. Genetic diversity in New Zealand
Populations of Sclerotium cepivorum. New Zealand Journal of Crop and Horticultural Science
30: 37-48.
Tzean, S. S. and Estey, R. H. 1978. Schizophyllum commune FI. as a destructive mycoparasite.
Canadian Journal of Microbiology 24 (7): 780-784.
227

Ulacio, D., Nass, H., Pineda, J. and Carrasco A. 1998. Viability of Rhizoctonia solani Kuhn AG1-IA
under flooding conditions. I. Mycoflora associated to the pathogen in Oryza sativa tissue.
Bioagro 10 (2): 40-47.
van Epenhuijsen, C. W., Page, B. B. C. and Koolaard, P. J. 2001. Preventative treatments for control
of fungus gnats and shore flies. New Zealand Plant Protection 54: 42-46.
Vannacci, G., Pecchia, S. and Resta, E. 1989. Presence of Sclerotinia minor jagger antagonists in soils
from different Mediterranean areas. II. Sclerotia decaying fungi. Acta Horticulturae 255: 293-
302.
Vares, T. and Hatakka, A. 1997. Lignin-degrading activity and ligninolytic enzymes of different
white-rot fungi: effects of manganese and malonate. Canadian Journal of Botany 75 (1): 61-71.
Vasantha Devi, T., Malar Vizhi, R., Sakthivel, N. and Gnanamanickam, S. S. 1989. Biological control
of sheath-blight of rice in India and antagonistic bacteria. Plant and Soil 119: 325-330.
Venette, J. R. and Lamppa, R.S. 1998. Airborne ascospores of Sclerotinia sclerotiorum. Proceedings
of the 10th Sclerotinia Workshop, Fargo, North Dakota: 38-39.
Verdam, B., Gerlagh, M. and van de Geijn, H. M. 1993. Biological control of Sclerotinia sclerotiorum
in caraway (Carum carvi). Mededelingen van de Faculteit Landbouwwetenschappen,
Universiteit Gent. 58 (3b): 1343-1347.
Vingnana-Singam, V., Long, P.G. and Rowland, R.E. 2000. Infection processes of Ciborinia
camelliae on camellia flower tissue. New Zealand Plant Protection 53: 151-156.
Wang, L. and Vincelli, P. 1997. Coniothyrium minitans on apothecia of Sclerotinia trifoliorum. Plant
Disease 81 (6): 695.
Ward, E. R., Uknes, S. J., Williams, S.c., Dincher, S. S., Wiederhold, D. L., Alexander, D. C., Ahl
Goy, P., Metraux, J. P. and Ryals, J. A. 1991. Coordinate gene activity in response to agents that
induce systemic acquired resistance. The Plant Cell 3: 1085-1094.
Westlund, A. and Nohrstedt, H. O. 2000. Effects of stump-treatment substances for root-rot control on
ground vegetation and soil properties in a Picea abies forest in Sweden. Scandinavian Journal
of Forest Research 15 (5): 550-560.
Whetzel, H. H. 1945. A Synopsis of the genera and species of the Sclerotiniaceae, a family of
stromatic inoperculate discomycetes. Mycologia 37: 648-714.
Whipps, J. M. 1987a. Behaviour of fungi antagonistic to Sclerotinia sclerotiorum on plant tissue
segments. Journal of General Microbiology 133 (6): 1495-1501.
Whipps, J. M. 1987b. Effect of media on growth and interactions between a range of soil-borne
glasshouse pathogens and antagonistic fungi. New Phytologist 107 (1): 127-142.
Whipps, J. M. 1991. Concepts in mycoparasitism and biological control of plant diseases. In New
approaches in biological control of soil-borne diseases: 54-59. Proceedings Workshop,
Copenhagen, Denmark 1991. Eds D.F. Jensen, J. Hockenhull and N.J. Fokkema.
228

Whipps, J. M. 1993. Growth of the collembolan Folsomia candida on cultures of the mycoparasite
Coniothyrium minitans and sclerotia of Sclerotinia sclerotiorum. Mycological Research, 9710):
1277-1280.
Whipps, J. M. and Budge, S. P. 1990. Screening for sclerotial mycoparasites of Sclerotinia
sclerotiorum. Mycological Research 945): 607-612
Whipps, J. M. and Budge, S. P. 1993. Transmission of the mycoparasite Coniothyrium minitans by
collembolan Folsomia candida (Collembola: Entomobryidae) and glasshouse sciarid Bradysia
sp. Diptera: Sciaridae). Annuals of Applied Biology, 123: 165-171.
Whipps, J. M., Budge, S. P. and Ebben, M. H. 1989. Effect of Coniothyrium minitans and
Trichoderma harzianum on Sclerotinia disease of celery and lettuce in the glasshouse at a range
of humidities. In Integrated Pest Management in Protected Vegetable Crops. Proceedings of the
CEC-IOBC Joint Experts Meeting, Cabrils, 27-29 May, 1987 ed. R. Cavalloro and C. Pelerents,
pp. 233-243. Rotterdam, The Netherlands: AA Balkema.
Whipps, J. M., Budge, S. P. and Mitchell, S. J. 1993a. Observations on sclerotial mycoparasite of
Sclerotinia sclerotiorum. Mycological Research, 97 (6): 697-700.
Whipps, J. M., Grewal, S. K. and van der Goes, P. 1991. Interactions between Coniothyrium minitans
and sclerotia. Mycological Research 95 (3): 295-299.
Whipps, J. M., McQuilken and Budge, S. P. 1993b. Use of fungal antagonists for biocontrol of
damping-off and Sclerotinia diseases. Pesticide Science. 37: 309-313.
Willetts, H. J. and Bullock, S. 1992. Developmental biology of sclerotia. Mycology Research 96 (10):
801-816.
Williams, R. H., Whipps, J. M. and Cooke, R. C. 1998. Splash dispersal of Coniothyrium minitans in
the glasshouse. Annuals of Applied Biology 132: 77-90.
Williams, S. T. and Vickers, J. C. 1986. The ecology of antibiotic production. Microbial Ecology (12):
43-52.
Wyss, P. and Bonfante, P. 1993. Amplification of genomic DNA of arbusculal-mycrorhizal (AM)
fungi by PCR using short arbitrary primers. Mycological Research 97: 1075-1082.
Xia, L. F., Zhang, A L. and Xiao, T. J. 1993. An introduction to the utilization of camellia oil in
China. American Camellia Yearbook 1993: 12-15.
Yokohama, D. M. 1980. Epidemiology of camellia flower blight incited by Sclerotinia camelliae
Hara. Unpublished MAppSc thesis, California State Polytechnic University, Pomona, United
States. 40 p.
Young, N. and Ashford, A E. 1992. Changes during development in the permeability of sclerotia of
Sclerotinia minor to an apoplastic tracer. Protoplasma 167: 205-214.
Zazzerini, A. and Tosi, L. 1985. Antagonistic activity of fungi isolated from sclerotia of Sclerotinia
sclerotiorum. Plant Pathology 34: 415-421.
229

Zech, W., Guggenberger, G. and Schulten, H. R 1994. Budgets and chemistry of dissolved organic
carbon in forest soils: effects of anthropogenic soil acidification. Science of the Total
Environment 152 (1): 49-62.
Zhou, T. and Reeleder, R D. 1989. Application of Epicoccum purpurascens spores to control white
mould of snap bean. Plant disease 73: 639-642.
Ziadi, S., Barbedette, S., Godard, J. F., Monot, C., Ie Corre, D. and Silue, D. 2001. Production of
pathogenesis-related proteins in the cauliflower (Brassica oleracea var. botrytis)-downy mildew
(Peronospora parasitica) pathosystem treated with acibenzolar-S-methyl. Plant Pathology 50
(5): 579-586.
Zummo, N. and Plakidas, A. G. 1959. Petal blight is a community problem. American Camellia
Yearbook 1959: 114-116.
Zummo, N. and Plakidas, A G. 1961. Spread of petal blight of camellias by air-borne ascospores of
Sclerotinia camelliae. Phytopathology 51: 69.
Publications published from this study
Butler, R. C., Arnold, G., van Toor, R. F., Ridgway, H. J., and Stewart, A. 2002. Investigating
genetic differences between populations of Ciborinia camelliae collected from different
locations. Proceedings of the Australian Genstat Conference 2002, Western Australia:
18 (Abstact).
van Toor, RF., Jaspers, M.Y. and Stewart, A, 2001. Evaluation ofacibenzolar-s-methyl for induction
of resistance in camellia flowers to Ciborinia camelliae infection. New Zealand Plant Protection
54: 209-212.
van Toor, RF., Jaspers, M.V. and Stewart, A, 2001. Identifying microbial antagonists which protect
camellia flowers from infection by Ciborinia camelliae. 131h Biennial Conference Plant
Pathology Conference: 109.
van Toor, RF., Jaspers, M.V. and Stewart, A, 2002. Evaluation of Bio_Start™ soil conditioners for
control of sclerotia of Ciborinia camelliae. New Zealand Plant Protection 55: 146-149.
van Toor, RF., Jaspers, M.V. and Stewart, A, 2003. Integrated control of Ciborinia camelliae using
soil amendments. 81h International Congress of Plant Pathology: (in press).
van Toor, RF., Pay, J.M., Jaspers, M.V. and Stewart, A, 2000. Developing tests to determine viability
of Ciborinia camelliae (Kohn) sclerotia. New Zealand Plant Protection 53: 147-150.
230

Personal communications
Christine Taylor, PhD Student, Department of Plant Science, Massey University, Palmerston
North, New Zealand 10 July 2002.
Dr Ian Harvey, Plant Pathologist, PlantWise Ltd., Lincoln, New Zealand, March 2002.
Dr Peter Long, Scientist, Department of Plant Science, Massey University, Palmerston North,
New Zealand, August 2000 and August 2001.
Dr Richard Toft, Scientist, Landcare Research, Nelson, New Zealand, 15 March 2002.
Dr T. M: Stewart, Scientist, Department of Plant Science, Massey University, Palmerston
North, New Zealand, 1994.
George Follas, Manager, Crop Protection, Syngenta, Auckland, New Zealand, 16 December
1999.
Gerard Besamusca, Agricultural Consultant, Bio-Start Ltd, New Zealand, 19 July 2002.
Jim Rumbal, Nursery Manager, Duncan and Davis New Plymouth Ltd, New Plymouth, New
Zealand, 16, July 2002.
Judith Pay, Technical Officer, Soils, Plant and Ecological Sciences Division, Lincoln
University, Lincoln, New Zealand, 1999-2002.
Mark Crawford, Manager, Biological Services, Griffin LLC, Valdosta, GA31601, USA, 14
February 2002.
Martin Dench, Camellia Garden Manager, Wellington Botanic Gardens, Wellington, New
Zealand, August and November 2001.
Monica Walter, Scientist, HortResearch, Lincoln, New Zealand, February 2001.
Professor Alison Stewart, Soils, Plant and Ecological Sciences Division, Lincoln University,
Lincoln, New Zealand, 1999-2002.
231

Appendices
Appendix 1: Media used in experiments
Potato dextrose agar (PDA)
Add distilled water to 39 g of potato dextrose agar manufactured by DIFCO Laboratories,
Detroit MI 48232-7058 USA, to make to 1 L in aIL Duran bottle, and autoclave at 121°C for
15 min.
Water agar (WA)
Add distilled water to 1 g bacteriological agar (GIBCO Ltd), to make to 1 L in aIL Duran
bottle, and autoclave at 121°C for 15 min.
Camellia petal infusion and agar (Fullerton et aI1998).
Camellia petal infusion. Rinse 20 g petals and place in 1 I volumetric flask with 400 mL
distilled water, and autoclave for 15 min.
Camellia agar. 200 mL camellia infusion plus 3 g plain agar, and autoclave.
Camellia and potato dextrose agar. 200 mL camellia infusion plus 7.8 g DIFCO PDA.
Sclerotinia sclerotiorum selective agar (John Knight, AgResearch, Lincoln, New Zealand)
To aIL Duran bottle, add: 49 g Czapek-Dox solution agar (GIBCO Ltd)
15 g potassium chlorate or chloride (The British Drug Houses Ltd BDH) Poole England.
1 g yeast extract (Y-400) (SIGMA Chemical Co., St Louis, USA)
1 g Cas amino acids (dehydrated) (DIFCO Laboratories, Detroit, USA) and make up to 1 L
with hot tap water to dissolve ingredients.
Autoclave at 121°C to 15 min, along with two 100 mL volumetric flasks and three 100 mL
beakers to store the additive stock solutions:
Lactic acid: 5 mL lactic acid (BHD).
Terraclor® 75WP or Newturf quintozene DG (750 giL quintozene).
To a 100 L volumetric flask, add 21.4 mL of 95% ethanol plus 80 mL water to give a 20%
ethanol solution, and 1 g Terraclor. Store at 4°C and use within two days.
Copper sulphate: 90 mL distilled water added to 109 CUS04, and dissolved in a 50°C water
bath.
232
While working in a laminar flow cabinet, pour the stock solutions into the sterile beakers.
Syringe 3 mL Terraclor® solution (30 mLlL), 7 mL copper sulphate solution (0.7 giL) to 1 L
of the media, and adjust the pH to 3.25 by adding the lactic acid. Store plates for up to two
months at 4°C.
DOPA melanin agar (Butler and Day 1998a)
500 mg L-3,4-dihydroxyphenylanalanine (DOPA) melanin (Sigma Chemical Co. USA) plus
125 mg KOH incubated in 100 mL RO water for 18 hat 37DC.
One meter of dialysis tubing membra-ce1112-14000 nominal molecular cut off weight 25 mm
flat width (Gen Lab Supplies, Australia) was prepared for dialysis by boiling in RO water for
5 min, leaving to cool overnight at room temperature (20-25 DC).
The dense brown-black melanin suspension that formed was dialysed against two 4 h changes
of 1000 mL RO water, at room temperature (20-25 DC).
50 mL of the dialysed melanin was added to 20 g agar (2%) in 1000 mL RO water (1:20
melanin solution: water dilution), and sterilised at 121 DC for 15 min.
Once cooled, the DOPA agar was poured 5 mm thick into 86 mm dia Petri dishes.
Murashige and Skoog stock solutions
giL MS Macro 20X (add 50ml/L)
NH4N03 33.0 KN03 38.0
CaCh.2H20 8.8 KH2P04 3.4
MgS04.7H20 7.4
MS Micro 200X (add 5ml/L) H3B03 1.24
MnS04.4H20 4.46 ZnS04.7H20 1.72
KI 0.166 NaMo04.2H20 0.05
CuS04.5H20 0.005 CoCh.6H20 0.005
gllOOml Vitamins 200x (add 5ml/L)
Inositol 2.00 Nicotinic Acid 0.010
Pyridoxine HCl 0.010 Thiamine HCl 0.002
Glycine 0.040
Iron Stock 200X (add 5ml/L) NaFeEDTA 8.0
To final L of medium, add 50 mL ofM&S macro, 5 mL each of micro, iron and vitamins, 20g
sucrose, ariy plant growth regulators, and 7g of agar. Adjust pH to 5.8, and sterilise.
233

Appendix 2: Mycoparasitism assay in USA - Chapter 3.1
Parasitism of Sporidesmium sclerotivorum on C. camelliae sclerotia
Introduction
This appendix supports information in Chapter 3.1. Sporidesmium sclerotivorum is a known
sclerotial parasite. Therefore it had potential for invading the sclerotia of C. camelliae, but
because this organism does not occur in New Zealand, a colleague Charles Martinson of Iowa
State University, tested the fungus in the USA on field- collected sclerotia.
Methods
Following the method described by Mischke (1998), 40 medium-sized sclerotia of C.
camelliae and 40 sclerotia of Sclerotinia sclerotiorum (collected in USA) were incubated in
separate experiments in soil previously found to be naturally infested with approximately
1000 Sporidesmium sclerotivorum spores/g of moist soil. The sclerotia were in intimate
contact with the soil, at a rate of 50 mg sclerotia per gram of soil. After 4 weeks incubation in
the soil at 22°C, the sclerotia were rinsed in running water, surface-sterilised with 11%
NaOCI for 30 sec, rinsed in sterile water, and incubated at 22°C for 2 weeks on sterile moist
filter paper. The sclerotia were then inspected for S. sclerotivorum mycelium growing from
the rind, to indicate parasitism.
Results
Sixty percent of sclerotia of Sclerotinia sclerotiorum were parasitised by Sporidesmium
sclerotivorum mycelium but none of the sclerotia of C. camelliae were parasitised. However,
some C. camelliae sclerotia were soft, and yielded mycelia and spores characteristic of
Trichoderma and Fusarium spp. The absence of mycoparasitic infection, and stimulation of
Sporidesmium sclerotivorum spore germination in the presence of C. camelliae sclerotia,
confirmed that C. camelliae is not a host for Sporidesmium sclerotivorum.
234

Appendix 3: Sclerotial parasitism screen - Chapter 3.2
Screen 1: % soft sclerotia after incubation for 12 weeks.
Microorganis Isolate % soft Microorganism Isolate % soft m ControlA ContA 0 Gliocladium Pn11 0 ControlB ContB 7 Pn8 7 Aspergillus Pn4b 0 Pn1b 0 Bacteria 015 13 Pn12 13
018 7 Pn1a 7 019 0 Trichoderma Ch12 7 02 0 Ch17 7 025 7 Ch3 0 04 7 Ch7 0 05 7 013 0 07 13 016 20 08 7 017 7 09 7 024 0 Pn1c 13 OtherFungi 06 27 Pn1d 0 Pn4a 0
Screen 2: No. firm sclerotia of 5/dish after incubation for 12 weeks
Organism Isolate Plot No! Organism Isolate Plot No! Organism Isolate Plot No! Organism Isolate Plot No! dish dish dish dish
Other fungi bs35a 287 5 Gliocladium pnm1b 89 4 Other fungi bs28c.1 267 5 Gliocladium pn62 177 5 Other fungi bs35b.3 258 5 Gliocladium w1 189 3 Other fungi bs28d 373 4 Gliocladium pn8 105 5 Other fungi bs73e.1 233 2 Gliocladium w2b.1 138 5 Other fungi bs28e 326 5 Gliocladium pn84 160 4 Other fungi bs28 343 5 Gliocladium pn341 169 5 Other fungi bs125b.1 262 4 Gliocladium pn321 182 3 Other fungi bs28b 342 5 Gliocladium pn59 92 5 Other fungi bs125c 316 3 Gliocladium pn340 172 3 Other fungi bs120.1 290 4 Gliocladium ch86 150 4 Other fungi bs73f 309 5 Other fungi ch82b.1 190 5 Other fungi bs120a 286 4 Gliocladium d206 174 5 Other fungi bs79.1 355 5 Other fungi ch85c 145 5 Other fungi bs120a.1 325 5 Gliocladium d79a 152 4 Other fungi bs79.3 337 5 Other fungi d10a 364 5 Other fungi bs120a.2 322 5 Gliocladium pn 158 5 Other fungi bs79b 369 5 Other fungi d12 173 5 Other fungi bs120b 234 0 Gliocladium pn11 91 5 Other fungi bs79d.1 346 4 Other fungi d13 171 5 Other fungi bs120b.1 239 5 Gliocladium pn12 90 5 Other fungi bs7b 305 4 Other fungi d2 154 5 Other fungi bs120e 315 5 G/iocladium pn13 94 5 Other fungi bs7c 282 5 Other fungi d204a 175 5 Other fungi bs120e.1 327 5 Gliocladium pn14 101 4 Other fungi bs7d 332 4 Other fungi d210 202 5 Other fungi bs124.1 306 5 Gliocladium pn1a 108 5 Other fungi bs8 320 5 Other fungi d3 170 4 Other fungi bs124a 268 3 Gliocladium pn230 93 5 Other fungi bs8f.1 272 5 Other fungi d9 166 4 Other fungi bs124b 186 5 Gliocladium pn304a 180 3 Other fungi bs8h 323 4 Other fungi pn305a 162 5 Other fungi bs124c 280 5 Gliocladium pn304a.1 363 4 Other fungi ch38 179 4 Other fungi ch68 230 0 Other fungi bs125b 261 5 Gliocladium ~n313 181 5 Other fungi ch66 259 4
235
Organism Isolate Plot Nol Organism Isolate Plot Nol Organism Isolate Plot Nol Organism Isolate Plot Nol dish dish dish dish
Aspergillus bs8e 310 5 Trichoderma B19 311 4 Bacteria bs8g.1 265 5 Trichoderma d124 40 5 Aspergillus pn4c 157 5 Trichoderma bs117 198 5 Bacteria bs8h.1 235 2 Trichoderma D14a 2 4 Aspergillus pn4e 155 5 Trichoderma bs117.1 204 2 Bacteria ch11 214 5 Trichoderma d210a 208 5 Aspergillus pn4h 159 5 Trichoderma bs117a.1 188 5 Bacteria ch11a 129 4 Trichoderma d213 62 5 Bacteria b125 247 2 Trichoderma ch12 31 5 Bacteria ch306 144 4 Trichoderma d217 17 5 Bacteria bs10 219 5 Trichoderma ch15 361 5 Bacteria ch308a 229 5 Trichoderma d217a 9 5 Bacteria bs100a 263 5 Trichoderma ch16.1 344 4 Bacteria ch333a.1 206 5 Trichoderma d225 54 4 Bacteria bs100b 264 5 Trichoderma ch17 70 5 Bacteria ch336b.2 137 4 Trichoderma d225a 35 5 Bacteria bs10a 232 3 Trichoderma ch22 38 5 Bacteria ch4a.1 128 5 Trichoderma d7a.1 313 5 Bacteria bs10e 223 5 Trichoderma ch23 209 4 Bacteria d114 140 5 Trichoderma pn304 81 5 Bacteria bs10f.1 356 4 Trichoderma ch23a 192 5 Bacteria d114a.1 210 5 Trichoderma pn304.1 321 5 Bacteria bs10f.2 351 5 Trichoderma ch24 32 5 Bacteria d114a.2 218 4 Trichoderma pn304a 374 5 Bacteria bs10h.1 252 0 Trichoderma ch3 69 5 Bacteria d115 112 3 Trichoderma pn304a.2 362 5 Bacteria bs115c 354 5 Trichoderma ch301 21 5 Bacteria d118 86 5 Trichoderma pn310 53 5 Bacteria bs117f.1 370 5 Trichoderma ch301a 11 5 Bacteria d119 88 5 Trichoderma pn311 46 4 Bacteria bs117g 292 5 Trichoderma ch301b 26 5 Bacteria d125 87 5 Trichoderma pn312 56 5 Bacteria bs118 236 5 Trichoderma ch302 29 2 Bacteria d1a 136 5 Trichoderma pn315 30 5 Bacteria bs118a 338 5 Trichoderma ch303 28 5 Bacteria d205 193 5 Trichoderma pn315a.2 366 5 Bacteria bs118b.1 279 5 Trichoderma ch303a 350 5 Bacteria d208 111 2 Trichoderma pn318 16 5 Bacteria bs120 253 5 Trichoderma ch309 14 5 Bacteria d208a 196 4 Trichoderma pn32 13 5 Bacteria bs120.1 340 5 Trichoderma ch312 37 5 Bacteria d208b 207 4 Trichoderma Pn322a 1 3 Bacteria bs120a 294 0 Trichoderma ch314 27 3 Bacteria d209 119 5 Trichoderma pn323 122 5 Bacteria bs120a.1 371 5 Trichoderma ch315 10 4 Bacteria d209a 120 5 Trichoderma pn33 67 5 Bacteria bs120c 237 1 Trichoderma ch316 36 5 Bacteria d215a 195 5 Trichoderma pn336 95 4 Bacteria bs120c.1 334 5 Trichoderma ch318 55 5 Bacteria d218 126 4 Trichoderma pn33a 66 5 Bacteria bs12_0c.2 335 5 Trichoderma ch318b 63 5 Bacteria d219 84 5 Trichoderma pn4a 58 5 Bacteria bs124 203 5 Trichoderma ch323 24 5 Bacteria d220 130 4 Botrytis pn1 123 5 Bacteria bs124c.1 201 2 Trichoderma ch327 76 5 Bacteria d5 78 5 Botrytis pn1a 372 5 Bacteria bs124d 227 4 Trichoderma ch327a 75 5 Bacteria d5a 197 5 Cladosporium bs35d.1 220 5 Bacteria bs124e 187 5 Trichoderma ch331 7 5 Bacteria d79b 147 5 Cladosporium d220a 115 5 Bacteria bs125a 255 4 Trichoderma ch331b 48 3 Bacteria d79b.1 148 4 Cladosporium d222 113 5 Bacteria bs28a 269 5 Trichoderma ch331c 25 5 Bacteria d8 83 5 Cladosporium d222a 114 5 Bacteria bs28c 260 5 Trichoderma ch332 6 4 Bacteria pn1c 79 5 Cladosporium d6 118 5 Bacteria bs28d.1 276 5 Trichoderma ch333a 205 2 Bacteria pn23 125 4 Cladosporium pn337 132 5 Bacteria bs28e.1 328 5 Trichoderma ch334 49 4 Bacteria pn23a 77 2 Cladosporium pn344 143 3 Bacteria bs28e.2 360 5 Trichoderma ch336a 291 5 Bacteria pn306 194 5 Cladosporium pn42 133 5 Bacteria bs35b.1 250 4 Trichoderma ch338 59 5 Bacteria pn309a 85 4 Control Control 270 5 Bacteria bs35c 212 5 Trichoderma ch340 57 5 Bacteria pn309b 139 5 Control Control 271 5 Bacteria bs35c.1 211 5 Trichoderma ch341 45 5 Bacteria pn316a 216 4 Control Control 277 5 Bacteria bs7.1 238 2 Trichoderma ch341a 72 5 Bacteria pn316a.1 121 5 Control Control 278 5 Bacteria bs73 273 5 Trichoderma ch343 5 5 Bacteria pn317a 242 1 Control Control 288 5 Bacteria bs73a 226 4 Trichoderma ch343a 73 3 Bacteria pn317b 215 3 Control Control 289 4 Bacteria bs73a.1 243 3 Trichoderma ch344 39 5 Bacteria pn321 116 5 Control Control 300 5 Bacteria bs73b 231 2 Trichoderma ch344a 15 5 Bacteria pn321a 127 5 Control Control 301 5 Bacteria bs73b.1 224 5 Trichoderma ch345 44 5 Bacteria pn325a 141 4 Control Control 329 5 Bacteria bs73c.1 248 3 Trichoderma ch345a 297 4 Bacteria pn325b 146 4 Control Control 330 4 Bacteria bs73d 256 3 Trichoderma ch349 34 5 Bacteria pn325c 142 4 Control Control 347 5 Bacteria bs73d.2 245 4 Trichoderma ch349a 368 5 Bacteria pn329a 217 5 Control Control 348 4 Bacteria bs73e 240 5 Trichoderma ch35 22 5 Bacteria pn52a 199 5 Control Control 352 5 Bacteria bs73f.1 275 5 Trichoderma ch352 74 5 Bacteria w2b 131 5 Control Control 353 5 Bacteria bs73g 246 5 Trichoderma ch352a 64 5 Bacteria w2c 134 5 Control Control 358 5 Bacteria bs79.3 336 5 Trichoderma ch37 4 5 Bacteria w2c.1 135 5 Control Control 359 5 Bacteria bs79a.1 339 5 Trichoderma ch37a 23 5 Other fungi A69 312 4 Fusarium ch26 80 5 Bacteria bs79c 357 4 Trichoderma ch38a 12 5 Other fungi bs10.1 221 2 Fusarium ch27 103 5 Bacteria bs79d.2 341 5 Trichoderma ch44 61 5 Other fungi bs10.2 303 5 Fusarium ch328 110 5 Bacteria bs79d.3 367 4 Trichoderma ch46 71 5 Other fungi bs100 365 4 Fusarium ch350 82 5 Bacteria bs79dA 345 5 Trichoderma ch46b 19 4 Other fungi bs10b 308 5 Fusarium ch81a 96 5 Bacteria bs7a 222 3 Trichoderma ch46c 20 5 Other fungi bs10c.1 307 4 Fusarium ch82a 97 4 Bacteria bs7a.1 228 5 Trichoderma ch47 60 5 Other fungi bs10d 317 5 Fusarium pn4f1 185 3 Bacteria bs8.1 298 5 Trichoderma Ch55 3 5 Other fungi bs10f 324 4 Gliocladium 9Sr4 302 5 Bacteria bs828a.1 283 5 Trichoderma ch58 33 5 Other fungi bs10f.2 266 5 Gliocladium ch13 104 5 Bacteria bs8a.1 295 3 Trichoderma ch7 8 5 Other fungi bs10g 349 5 Gliocladium ch28 109 3 Bacteria bs8a.2 257 3 Trichoderma ch75a 51 5 Other fungi bs10h 318 5 Glioc/adium ch29 98 5 Bacteria bs8b 296 4 Trichoderma ch75b 65 5 Other fungi bs10j 225 4 Gliocladium ch34b 168 3 Bacteria bs8c 333 4 Trichoderma ch76a 52 5 Other fungi bs10k 249 5 Gliocladium ch42 107 4 Bacteria bs8c.1 241 5 Trichoderma ch76b 42 4 Other fungi bs115a 254 4 Gliocladium ch43 106 5 Bacteria bs8d.1 293 5 Trichoderma ch78a 47 5 Other fungi bs117b 200 4 Gliocladium ch44d 100 5 Bacteria bs8d.2 314 5 Trichoderma ch80a 50 5 Other fungi bs117c 284 5 Gliocladium ch46a 99 5 Bacteria bs8e 244 4 Trichoderma ch80b 43 5 Other fungi bs117d.1 304 5 Gliocladium
l ch78b 102 5
Bacteria bs8e.3b 299 5 Trichoderma d11 124 4 Other fungi bs117d.2 213 4 Gliocladium ch81b 183 5 Bacteria bs8f 274 5 Trichoderma d113 68 5 Other fungi bs117e 281 5 Glioc/adium ch82b 161 3 Bacteria bs8f.2 251 4 Trichoderma d116 41 5 Other fungi bs117g.1 319 5 Gliocladium ch85a 149 5 Bacteria bs8g 285 5 Trichoderma d 117 18 5 Other fungi bs120 331 5 Gliocladium ch85b 153 4
236

Appendix 4: Bio-Start™ Material safety data - Chapter 4.1
Mycorrcin.nz
Manufacturers Name
Product Description
Minerallngredients/L
Physical Data
Health and Hazard Information
Emergency First Aid Procedures Special Protective Storage
Bio-Start Limited, POBox 66, Morrinsville, New Zealand Telephone 64 7 887 8871, Fax 64 7 887 8872 Bio-Start Mycorrcin is a balanced formulation of natural humates and biologically produced enzymes designed to improve soil structure, soil nutrient release and plant uptake. Fermentation Extracts Kelp Humic Acid Copper Sulphate Zinc Sulphate Magnesium Chloride Magnesium Sulphate Ferrous Sulphate Manganese Sulphate Ammonium Laurel Sulphate Acetic Acid Citric Acid Propionic Acid Boron (elemental) Cobalt Sulphate Sodium Molybdate Sodium Benzoate Potassium Hydroxide Potassium Sorbate EDTA Manganese EDTAlron EDTA Zinc EDTA Copper EDTA Cobalt N= P= K= Appearance:
280 13.89 13.89 0.21 1.39 1.39 5.56 0.69 1.39 2.78 0.56 13.89 0.21 3.61 0.07 0.69 0.56 0.97 0.69 0.04 0.04 0.03 0.01 0.01 3%w/v 1% w/v 2%w/v Brown liquid
ml gm gm gm gm gm gm gm gm ml ml gm ml gm gm gm gm ml ml gm gm gm gm gm
Pack size: Boiling point:
5 litre, 10 litre, 20 litre 100 degrees Celsius
Specific gravity: 1.10 gm/mL Melting point: Electrical Conductivity: (Symptoms of overexposure)
N/A 19m/L = 0.36
Inhalation: N/A
3gm/L = 0.66 5gm/L = 0.92
Skin contact: Classified as non-irritant Skin absorption: Not known Eye contact: Mild irritant Ingestion: LD50 is greater than 5000 mg/kg Eye and skin: Flush or wash with water Ingestion: Dilute by drinking 1 - 2 cups of water or milk Personal protective equipment not required Store at room temperature; Keep out of reach of children; Keep container tightly closed; Do not store diluted product
237

Digester .nz
Manufacturers Name
Product Description
Mineral IngredientslL
Physical Data
Health and Hazard Information
Emergency First Aid Procedures Special Protective Storage
Bio-Start Limited, POBox 66, Morrinsville, New Zealand Telephone 64 7 887 8871, Fax 64 7 887 8872 Bio-Start Digester is a non-viable crop residue digester containing enzymes and metabolites derived from a biological fermentation process and plant extracts. Fermentation Extracts Kelp Humic Acid Copper Sulphate Zinc Sulphate Magnesium Sulphate Ferrous Sulphate Manganese Sulphate Citric Acid Acetic Acid Propionic Acid Boron Cobalt Sulphate Sodium Benzoate Potassium Sorbate Ammonium Laurel Sulphate EDT A Manganese EDTAIron EDTAZinc EDTACopper EDTACobalt N= P= K= Appearance: Pack size: Boiling point: Specific gravity: Melting point:
143.0 12.86 14.29 0.01 22.86 8.57 22.86 8.57 7.14 14.29 0.71 0.01 0.07 0.57 1.00 2.86 0.04 0.04 0.03 0.01 0.01 3%w/v l%w/v 2%w/v Brown liquid 5 litre, 10 litre, 20 litre 100 0
1.125grn1mL N/A
ml gm gm gm gm gm gm gm gm ml ml gm gm gm ml ml gm gm gm gm gm
Electrical Conductivity: (Symptoms of overexposure) Inhalation:
19rn1L=0.40 3 grnIL=O. 89 5grn1L=1.15
N/A Skin contact: Classified as non-irritant Skin absorption: Not known Eye contact: Mild irritant Ingestion: LD50 is greater than 5000 mg/kg Eye and skin: Flush or wash with water Ingestion: Drink 1-2 cups of water or milk Personal protective equipment not required Store at room temperature; Keep out of reach of children; Keep container tightly closed; Do not store diluted product
238
Appendix 5: C. camelliae in camellia stems - Chapter 6.1
Introduction
Currently, it is unknown whether C. camelliae mycelium will invade the stem connected to infected
flowers. If the pathogen penetrates the camellia stem, it could survive to infect the next generation of
flowers vegetatively, rather than by ascospore infection of flowers. This would have implications for
biological control, as any successful micro-antagonist would also need to attack the pathogen in the
stem. During the course of this study, some apical leaf buds adjacent to infected flowers became
chlorotic and appeared to be infected with a fungal disease. Therefore, it was important to ascertain
whether these stems contained C. camelliae hyphae, which would had indicated that C. camellia
mycelium had intruded into the stems from infected flowers. In this study, sections of stem below
infected flowers were tested for the presence of C. camelliae mycelium to confirm that the blight was
confined to the flowers.
Methods
Fifteen stems from Camellia japonica bushes infected with camellia blight were collected from
Bryndwr, Christchurch, New Zealand, on 29 September 2000. The stems were stored at lOoC until
washing within 5 d. Infected flowers, the apical buds that produced new seasons leaf and stem growth
and the petiole ofthe first leaf that were adjacent to the infected flower, and the outermost 20, 10 mm
segments of stem, were separated with a sterile scalpel. The segments were surface sterilised in 95%
ethanol for 30 sec followed by 3% NaOCI for 3 min and 95% ethanol for 30 s. They were then air
dried in the laminar flow for 1 h on filter paper that had been previously sterilised under ultraviolet
light for 20 min. The surface-dried segments were bisected and placed onto PDA (Difco). After
incubated at 20°C for 7 d, the segments were inspected for presence or absence of growth by C.
camelliae mycelium.
Results and discussion
C. camelliae mycelium was present in the apical buds adjacent to and in the stem 20, 30 and 60 mm
below the base of the flower calyx of three of the 15 stems that were tested for mycelial incursion. C.
camelliae mycelium was not isolated from any of the other stem segments, nor in the sub axial buds or
in any of the leaf petioles. The potential for C. camelliae mycelium that had grown into the camellia
stem from infected flowers, to infect the next generation of flowers in the following year was
considered to be unlikely. Mycelium of C. camelliae was found in the stem no more than 60 mm down
from infected flowers, and therefore was not considered able to colonise the new woody growth in the
apical and terminal flowering buds to infect subsequent flowering.
239

Appendix 6: Petal micro-antagonist screen - Chapter 6.1
Percent infection of camellia blight compared with the pathogen treated control (100%)
Isolate % Isolate % Isolate % Isolate % Isolate % 390_3/F2 0 B88_5/Bac1 52 EoR_4/F2-R 80 EOR_2/F3-R 100 EoR_1/B4 100 390 8/P84 0 EoR_1/F2-R 53 EoR_2/Bac1 80 390 3/B3 100 EoR_1/Bac3 100 Eo~3/F2b-R 0 YnA_2/F4 55 CH_2/F5-R 80 390::)/F6-R2 100 EoR_1/F1-R 100 YnA_2/F1 0 390_3/F3a 56 CH_2/F3-R 81 390_3/F8 100 EoR_1/F5-R 100 390_2/F8a-R5 1 LC_8/Ps2 56 LC 8/Ps1-R5 82 390_3/F9 100 EoR_21B3 100 390_3/F6 1 8scL-/98r4 56 EoR_3/Bac1 82 390_7/Ps1 100 EoR_2/Bac2 100 CH_1/Bac1 4 N_5/F1 57 A_1/Bac1 82 390_7/Ps2 100 EOR_3/B1 100 A_3/B1 7 CH_3/B1 62 A_3/F5 83 390 8/B2 100 EoR_3/F20-R 100 YnA_2/F3 8 CH_1/Bac3 63 B88_4/B6 83 390:::: 8/Ps4-R2 100 EoR_4/B2 100 CH_1/F1-R 8 EoR_5/F10-R 64 B88_4/B8 83 390_ 8/Ps4-R3 100 EoR_4/B4 100 LC 8/Ps1 9 LC_4/F3 65 A 5/F2-R3 84 A_2/Bac1-R1 100 EoR_4/B5 100 EOR_4/F5-R 11 YnA_1/F1 65 EOR_2/F5-R 84 A_2/Bac1-R2 100 EoR_ 4/F1-R 100 CH_3/F3-R 12 A_3/B1-R5 66 LC_8/Ps1-R3 85 A_2/Bac3 100 EOR_4/F6-R 100 BO_1/B1 13 CH_5/F3-R 68 EoR_3/F1-R 85 A 2/Bac-R3 100 EoR_ 4/F7-R 100 EoR_3/F3-R5 14 N_6/Ps2 68 EoR_5/F12a-R 86 A::::3/B1 100 EOR_5/B2 100 EOR_4/F9-R 16 EOR_3/F2b-R5 68 B88_5/B7 86 A_3/F4 100 EoR_5/F14b-R 100 CH_1/F7-R 17 CH_2/F4-R 69 BB_3/F1 86 A_ 4/F1 100 EoR 5/F17-R 100 EoR_5/F12b-R 17 EoR_5/F6-R 69 CH_3/F1-R 86 A_5/B5 100 EoR::::5/F19a-R 100 CH_1/F8b-R 19 B88_5/B1 70 390_3/B2 86 A_5/Bac1 100 EoR_5/F19b-R 100 A 2/Bac1 24 A 1/B1 70 CH 5/F1a-R 87 A_5/F1-Dup 100 EoR_5/F1-R 100 6t1/F5-R 25 6U/F8-R 71 EOR_5/F8-R 87 A_5/F1-R2 100 EoR_5/F4-R 100 8scL-/B19 26 B88_2/B1 72 390_3/F3b 88 A_5/F2 100 LC_8/P81-R2 100 A_3/F2-R5 29 A_5/F1-R5 73 EoR_5/F3-R 88 BB_1/P82 100 YnA_2/F1-R1 100 EoR_5/B3 33 EoR_5/F9b-R 73 EoR_3/F6-R 88 BB_5/Ps1 100 YnA_2/F1-R2 100 YnA_2/F1-R5 33 A_4/B2 74 EOR_1/F6-R 88 A_5/B4 138 LC_10/F1 140 CH_2/F2-R 33 EoR_1/Bac2 74 A_2/B2 89 390_3/F4b 139 A_1/Bac4 142 A_5/B1 35 CH_5/B1 74 CH_5/F4-R 90 LC_4/B1 184 B88_1/Bac3 196 YnA_2/F1-R3 36 YnA_2/F2 75 CH_1/Bac1-R5 90 EoR_3/B4 191 N_5/F4 208 EoR_2/F4-R 37 CH 2/F7-R 76 CH_1/Bac2 90 A_3/Bac2 247 EoR 5/F14a-R 287 A_1/Bac2 38 Eo~ 1/F8-R 76 EoR_5/F13-R 91 LC_4/F2 251 BO_2/F1 291 CH_2/F2-R5 38 EoR_5/F11a-R 76 A_1/Bac3 91 A_5/B3 281 B88_5/B5 325 A_5/F1-R3 39 BB_1/B1 76 EoR_2/B4 91 LC_6/F1 286 LC_2/B2 339 CH_3/B2 40 EoR_1/Bac1 76 EoR_5/F5-R 92 BO_2/F2 638 390_8/B1 131 309_1/B1 42 B88_1/Bac2 77 LC_8/Ps1-R1 92 EoR_3/F3-R 107 390_1/B2a 133 A 3/Bac3 43 CH 1/F4-R 77 EoR_4/B3 92 EoR_21B2 108 A 5/B6 146 EOR_5/B3-R5 44 Eo~1/F3-R 78 CH_5/F1-R 92 EoR_ 4/F3-R 109 BB_4/Ps3 156 B88_2/B2 45 390_8/Ps3 78 A_1/F1 93 B88_1/B4 110 CH_4/F4-R 158 CH 2/F8a-R 45 BB_9/P83 78 EoR 1/F9-R 93 B88_1/Bac4 110 A_4/F2 160 EOR_5/F16-R 45 CH_2/Bac2 78 390.3/F3c 93 A_5/B2 110 N_6/Ps1 161 A_2/Bac2 45 EoR_3/B2 79 A_3/Bac1 93 390_1/B2b 111 EoR_2/F2-R 175 CH_1/F3-R 45 EoR_5/Bac2 79 EoR_ 4/B1 93 EoR 5/F7-R 111 A_2/Bac1-R5 182 CH_1/F1-R5 50 CH_5/B2 80 CH_5/F1b-R 94 N_5iF"2 113 BO_7/B1 222 EoR_3/F4-R 51 CH_1/F5-R5 80 YnA_ 4/F1b 94 390_ 8/Ps4-R5 114 390_3/F4 225 390_8/F1 95 BB 5/Ps2 100 YnA_2/F1-R2 100 EoR_5/F12b-R5 116 B88 1/Bac1 356 EOR_4/F8-R 95 BB::::9/P81 100 YnA_3/P81 100 EoR_1/F4-R 117 CH3/B1 518 A_4/B1 96 BO_3/F2 100 YnA_4/F1 100 390_3/F1 117 B88_5/B6 523 EoR 4/Bac1 96 BO_6/P81 100 YnA_4/F4 100 CH_2/F6-R 119 N_5/F3 608 EoR::::5/F2-R 96 BO_7/P81 100 YnA_9/B1 100 390_1/B3 120 EoR 5/F5b-R 96 BO_9/F1 100 B88_5/B8 100 CH_3/Bac1 120 CH3/F2-R 96 BO_9/F3 100 CH_5/Bac1 100 YnA_ 4/F1-R5 126 CH_2/F9-R 97 B88_1/B1 100 390_3/F6-R3 101 CH_1/Bac1-R1 97 B88 4/B1 100 BO 3/B1 101 N_5/F5 98 B88::::4/B2 100 A_3!F2 101 A_5/F2-R5 98 B88_4/B7 100 EoR_4/F4-R 101 A 2/B1 98 B88_5/B3 100 B88 5/Bac2 101 EOR_4/B6 98 CH_1/F2-R 100 YnA'::::2/F5 101 CH_5/F5-R 98 CH_2/B1 100 CH_1/F8a-R 101 CH 4/B1 99 CH 2/B2 100 CH 4/Bac1 101 390-=-3/F5 99 CH::::2/B3 100 CH::::5/B4 101 EOR_5/F11 b-R 99 CH_2/F1-R 100 EOR_5/F15-R 102 YnA 4/F1-R3 99 CH_3/B3 100 EOR_3/B3 103 B88 -:'1/Bac5 99 CH_3/F2-R 100 390_3/B4 103 CH_1/F6-R 99 CH_3/F4-R 100 B88_2/B3 104 EoR_4/Bac2 99 CH_5/B3 100 EOR_5/B1 104 A_5/F1-R1 99 EoR_1/B1 100 CH_ 4/F1-R 105 EOR_5/F18-R 99 EoR_1/B2 100 EoR_2/B1 106 BO 3/F1 100 EoR 1/B3 100 LC 5/Ps1 106
240

Appendix 7: Isolate and adjuvant petal assays - Chapter 6.1
Methods
An assay was conducted to determine the effect of the adjuvants on petal necrosis and
pigmentosis in the absence of C. camelliae ascospores, and enhanced efficacy of three
bacterial isolates for control of camellia blight in the presence of the pathogen. Pseudomonas
sp. A3B1, B. subtilis ChlFS and P. fluorescens LC8Psl were selected for this assay, as they
had appeared to contribute to phytotoxicity in previous assays. The assay comprised a full
factorial of two factors. The factor isolate consisted of sterile distilled water, nutrient broth
alone, and nutrient broth with either A3B1, ChlFS or LC8Psl. The factor adjuvant consisted
of none, 0.1 mLlI Break-Thru® S240, and 2 mLlI Codacide. Treatments were replicated six
times in a randomised block design. They were applied on 26 October 2002 to unblemished
petals from C. japonica cvar. Willimena that had been placed onto moistened 70 mm filter
paper in 90 mm diameter Petri dishes. A SOO III of solution of each spray treatment was
applied by micro-sprayer to each designated petal. hnmediately after each treatment
application, the Petri dishes were covered with their lids. Petals that were not treated with
ascospores of the pathogen were incubated at 20°C at a 12 h diurnal light regime. Petals
designated for inoculation with the pathogen were placed in the ascospore chamber in blocks,
each containing the full compliment of treatments. The Petri dish lids were removed, and the
petals treated with a cloud of C. camelliae ascospores emitted by one apothecium per
chamber. The dishes were then sealed and incubated as for the non-pathogen infected set of
petals. The petals were assessed for percent area necrosis and pigmentosis after 3 and 6 d.
Concentration of viable cells in each suspension of the test organism at the time of application
was estimated by serial dilution and culturing on NA (Difco).
Results
Pseudomonas sp. A3B1, P. fluorescens LC8Psl and B. subtilis ChlFS were sprayed onto the
petals in a nutrient broth suspension containing 6.8 x 10¹³, S.O X 1013 and 4.6 x 10⁸ viable
cells/mL, respectively.
Necrosis. Necrosis was attributed to Botrytis cinerea infection and destruction of the petal
tissue from the wound where the petal was removed from the calyx. Three days after
treatment, the proportion of petal exhibiting necrosis was lower in petals sprayed with nutrient
broth alone, with the portion of the petal necrotic averaging 2S, Sand 27% (LSD(o.05) = lS%)
for water, nutrient broth and bacterial isolates, respectively. The high incidence of necrosis in
241

petals treated with water only was due to enhanced infection by B. cinerea under the humid
conditions in the Petri dishes. The broth provided protection from tissue damage. The effect
was not influenced (P>0.05) by the adjuvants, for the portion of the petal necrotic averaged
16, 27 and 24% (LSD(o.05) = 14%) for none, Break-Thru and Codacide treatments,
respectively. The effects from the isolates continued to 6 d after treatment, with the portion of
the petal necrotic averaging 68, 18 and 48% (LSD(o.05) = 17%) for water, nutrient broth and
bacteria. The adjuvant effect became pronounced with the portion of each petal averaging 32,
42 and 63% (LSD(o.05) = 17%) for none, Break-Thru and Codacide treatments, respectively.
Adjuvant Assay - Effect of adjuvants with selected bacterial isolates on petal necrosis (%) in the
absence of camellia blight, 3 and 6 d after inoculation.
Assessment· Isolate
3 d Water
6d
Nutrient broth A3Bl ChlF5 LC8Psi LSD(O.05) Water Nutrient broth A3Bl ChlF5 LC8Psi LSD(O.05)
None 28 0 17 11 24
62 1
30 27 44
% necrosis Break-Thru Codacide Average
25 24 26 3 13 5
46 39 34 19 21 17 41 25 30 31 18 63 79 68 3 49 18
56 55 47 43 58 42 48 76 56 37 21
Pigmentosis. Pigmentosis symptoms included purple or white discoloration of the pink
pigment contained in the petal. Symptoms of pigmentosis appeared at the isolate and adjuvant
levels, with both factors acting independently from one another. The area of the petal with
pigmentosis 3 d after treatment, averaged 0, 0.8 and 2.4% (LSD(o.05) = 1.9%) for water,
nutrient broth and bacteria, and 1.6, 2.7 and 0.5% (LSD(o.05) = 1.8) for none, Break-Thru® and
Codacide, respectively. The same effects continued 6 d after treatment, averaging 1, 9 and
11 % (LSD(o.05) = 5%) for water, nutrient broth and bacteria, and 8, 14 and 4% (LSD(o.05) = 5)
for none, Break-Thru® and Codacide.
242

Adjuvant Assay: Effect of adjuvants with selected bacterial isolates on petal pigmentosis (%) in
the absence of camellia blight, 3 and 6 d after inoculation.
Assessment Isolate None Break-Thru Codacide Average 3 dat Water 0.0 0.0 0.0 0.0
Nutrient broth 0.0 2.5 0.0 0.8 A3BI 5.0 5.0 1.7 3.9 ChlF5 1.7 3.3 0.0 1.7 LC8PsI 1.7 2.5 0.8 1.7 LSD(o.05) 4.1 2.4
6 dat Water 0 2 0 I Nutrient broth 8 17 I 9 A3BI 10 17 9 12 ChlF5 13 13 6 11 LC8PsI 7 22 3 10 LSD{o.05} 11 6
Camellia blight control. The dark shiny-brown necrotic tissue induced by the treatments was
easily discernible from mottled lighter-brown tissue damage caused by C. camelliae. Three
days after treatment, only P. fluorescens LC8Ps 1 significantly reduced the level of infection.
The adjuvants had no significant effect on improving the efficacy of the three isolates tested.
These trends altered 6 d after treatment. The nutrient broth, Pseudomonas sp. A3Bl and P.
fluorescens LC8Psl provided a significant level of control with or without Break-Thru. B.
subtilis ChlF5 was inhibited by the surfactant. Codacide added to the water alone reduced the
level of infection.
Adjuvant Assay: Effect of adjuvants with selected bacterial isolates on controlling camellia blight,
3 and 6 d after inoculation.
Assessment Isolate % camellia blight None Break-Thru Codacide Average
3 dat Water 25 13 4 14 Nutrient broth 11 8 6 8 A3BI 9 3 18 10 ChlF5 2 21 5 9 LC8PsI 3 0 I I LSDm.o5) 16 9
6 dat Water 100 88 46 78 Nutrient broth 55 36 75 55 A3BI 23 6 38 22 ChlF5 40 80 63 61 LC8PsI 13 0 8 7 LSDm.o5} 32 19
243

244

Appendix 8: Jaccard similarity matrix (6 primers) - Chapter 7
Bryndwr, Christchurch I
Beckenham, Christchurch Carvalis, Oregon I Glenlogie, Wanganul Manson St, Norfolk, Virginia Way Cross. Gargla I Thomdon. Wellington Whalelata. Palmerston Palmerston
Isolate AC4 AC5 AC7 AC8 ACS AC10 CC2 CC3 CC4 CC7 CC8 CCS C01 CO2 C05 GW3 GW4 GW5 MP2 MP3 MP5 NVl NV4 NV6 WG2 WG3 WG5 WL1 WL2 WL3 WU2 WU4 WU5 WP1 WP2 WP6
AC4 1.000
AC5 0.S62 1.000
AC7 0.962 1.000 1.000
AC8 0.923 0.925 0.925 1.000
AC9 0.961 0.962 0.962 0.923 1.000
AC10 0.980 0.981 0.981 0.942 0.942 1.000
CC2 0.941 0.906 0.906 0.980 0.941 0.923 1.000
CC3 0.962 1.000 1.000 0.925 0.962 0.981 0.906 1.000
CC4 0.942 0.981 0.981 0.906 0.942 0.962 0.887 0.981 1.000
CC7 0.887 0.925 0.925 0.961 0.923 0.906 0.941 0.925 0.906 1.000
CC8 0.941 0.906 0.906 0.904 0.904 0.923 0.922 0.906 0.923 0.904 1.000
CC9 0.906 0.943 0.943 0.942 0.942 0.925 0.923 0.943 0.962 0.942 0.923 1.000
COl 0.737 0.712 0.712 0.737 0.737 0.724 0.750 0.712 0.724 0.737 0.782 0.754 1.000
CO2 0.690 0.667 0.667 0.690 0.690 0.678 0.702 0.667 0.678 0.690 0.732 0.707 0.940 1.000
C05 0.655 0.633 0.633 0.655 0.655 0.644 0.667 0.633 0.644 0.655 0.696 0.672 0.663 0.918 1.000
GW3 0.980 0.943 0.943 0.942 0.942 0.962 0.961 0.943 0.925 0.906 0.961 0.925 0.754 0.707 0.672 1.000
GW4 0.922 0.887 0.887 0.885 0.922 0.904 0.902 0.887 0.904 0.885 0.940 0.904 0.796 0.745 0.709 0.904 1.000
GW5 0.870 0.907 0.907 0.906 0.906 0.889 0.887 0.907 0.925 0.942 0.923 0.962 0.786 0.737 0.672 0.889 0.904 1.000
MP2 0.904 0.906 0.906 0.904 0.868 0.923 0.885 0.906 0.887 0.868 0.885 0.887 0.719 0.672 0.667 0.923 0.830 0.852 1.000
MP3 0.922 0.887 0.887 0.885 0.885 0.904 0.902 0.887 0.868 0.849 0.902 0.868 0.732 0.684 0.679 0.941 0.846 0.833 0.980 1.000
MP5 0.849 0.887 0.887 0.922 0.885 0.868 0.902 0.887 0.868 0.960 0.865 0.904 0.702 0.655 0.849 0.868 0.846 0.904 0.902 0.882 1.000
NV3 0.690 0.667 0.667 0.690 0.690 0.678 0.702 0.667 0.678 0.690 0.732 0.707 0.830 0.846 0.774 0.707 0.745 0.737 0.672 0.684 0.655 1.000
NV4 0.684 0.661 0.661 0.684 0.684 0.672 0.696 0.661 0.672 0.655 0.696 0.702 0.827 0.843 0.769 0.702 0.709 0.702 0.667 0.679 0.621 0.880 1.000
NV6 0.644 0.650 0.650 0.672 0.644 0.661 0.655 0.650 0.661 0.672 0.684 0.690 0.846 0.827 0.755 0.661 0.696 0.719 0.655 0.638 0.638 0.900 0.898 1.000
WG2 0.696 0.672 0.672 0.696 0.696 0.684 0.709 0.672 0.684 0.696 0.741 0.714 0.808 0.788 0.717 0.714 0.755 0.745 0.849 0.661 0.661 0.788 0.857 0.840 1.000
WG3 0.714 0.690 0.690 0.714 0.714 0.702 0.727 0.690 0.672 0.714 0.727 0.702 0.792 0.774 0.704 0.732 0.741 0.732 0.667 0.679 0.679 0.808 0.878 0.860 0.936 1.000
WG5 0.690 0.667 0.667 0.690 0.690 0.678 0.702 0.667 0.650 0.690 0.702 0.678 0.796 0.811 0.741 0.707 0.714 0.707 0.644 0.655 0.655 0.811 0.880 0.827 0.938 0.958 1.000
WLl 0.865 0.888 0.868 0.940 0.865 0.885 0.920 0.888 0.885 0.902 0.882 0.922 0.745 0.696 0.661 0.885 0.863 0.885 0.920 0.900 0.900 0.696 0.691 0.679 0.673 0.661 0.638 1.000
WL2 0.904 0.906 0.906 0.941 0.888 0.923 0.922 0.906 0.887 0.904 0.885 0.887 0.719 0.672 0.638 0.923 0.830 0.852 0.960 0.940 0.902 0.672 0.667 0.655 0.849 0.667 0.644 0.959 1.000
WL3 0.904 0.906 0.906 0.904 0.888 0.923 0.885 0.906 0.887 0.904 0.922 0.887 0.750 0.702 0.667 0.923 0.865 0.887 0.960 0.940 0.902 0.702 0.667 0.684 0.679 0.696 0.672 0.920 0.960 1.000
WU2 0.904 0.906 0.906 0.941 0.868 0.923 0.922 0.906 0.887 0.904 0.885 0.887 0.719 0.672 0.638 0.923 0.830 0.852 0.960 0.940 0.902 0.672 0.667 0.655 0.849 0.667 0.644 0.959 1.000 0.960 1.000
WU4 0.902 0.868 0.868 0.902 0.865 0.885 0.920 0.868 0.849 0.902 0.920 0.849 0.745 0.696 0.661 0.922 0.863 0.849 0.920 0.939 0.900 0.696 0.661 0.649 0.673 0.691 0.667 0.918 0.959 0.959 0.959 1.000
WU5 0.885 0.887 0.887 0.922 0.849 0.904 0.902 0.887 0.868 0.922 0.902 0.888 0.732 0.684 0.649 0.904 0.846 0.868 0.940 0.920 0.920 0.884 0.649 0.667 0.661 0.679 0.655 0.939 0.980 0.980 0.980 0.979 1.000
WPl 0.941 0.906 0.906 0.941 0.941 0.923 0.960 0.906 0.887 0.941 0.960 0.923 0.762 0.732 0.696 0.961 0.940 0.923 0.885 0.902 0.902 0.732 0.696 0.884 0.741 0.759 0.732 0.882 0.885 0.922 0.885 0.920 0.902 1.000
WP2 0.904 0.906 0.906 0.980 0.904 0.923 0.960 0.906 0.887 0.980 0.922 0.923 0.750 0.702 0.667 0.923 0.902 0.923 0.885 0.865 0.940 0.702 0.667 0.684 0.709 0.727 0.702 0.920 0.922 0.922 0.922 0.920 0.940 0.960 1.000
WP6 0.940 0.904 0.904 0.940 0.940 0.922 0.959 0.904 0.885 0.940 0.920 0.885 0.745 0.696 0.661 0.922 0.939 0.885 0.846 0.863 0.900 0.696 0.661 0.649 0.704 0.722 0.696 0.880 0.882 0.882 0.862 0.918 0.900 0.959 0.959 1.000

Appendix 9: UP·PCR data· Chapter 7
Following tables: Presence (1) or absence (0) of bands scored for each universal primer used in PCR for cluster and canonical varieties analysis for regions: Wanganui
(Wan), Palmerston North (Pal), Wellington (Wei) and Christchurch (Chr), Georgia (Geo), Oregon (Ore) and Virginia (Va).
Country Area Isolate AA2M2 AS4 AS15 ASI5 inv 2100 2036 1800 1700 1550 1300 1100 1018 950 450 1700 1500 1400 1300 1100 950 800 700 600 550 3500 3054 1600 1250 950 450 1800 1600 1500 1300 11 00 1000 900 800 700 600 450
NZ Chr AC4 0 0 0 1 0 0 1 1 0 0 1 NZ Chr AC5 0 1 0 0 0 1 1 0 0 1 NZ Chr AC7 0 1 0 0 0 1 1 0 0 )
NZ Chr AC8 0 0 0 0 ) 1 1 0 0 0 NZ Chr AC9 0 ) 0 0 0 I 1 0 0 0 NZ Chr AC)O 0 0 0 0 0 1 ) 0 0 )
NZ Chr CC2 0 0 0 0 ) 1 I I I 0 0 0 NZ Chr CC3 0 1 0 0 0 1 1 1 ) 0 0 I NZ Chr CC4 0 1 0 0 0 1 I ) ) 0 0 )
NZ Chr CC7 0 1 0 0 ) 1 1 ) ) ) 0 0 0 NZ Chr CC8 0 0 0 1 0 ) 1 1 1 ) ) 0 0 )
NZ Chr CC9 0 ) 0 1 0 ) 1 1 1 ) ) 0 0 0 USA Ore CO) 0 0 1 1 0 I 0 ) I 0 0 ) ) 0 USA Ore CO2 1 0 0 1 0 1 ) 0 1 0 0 0 ) ) 0 USA Ore C05 1 0 0 I 0 1 ) 0 0 0 0 0 I I 0 I NZ Wan GW3 1 0 0 0 I 0 1 1 1 1 I 0 0 I I NZ Wan GW4 I 0 0 0 1 0 0 1 I I I 0 0 0 I NZ Wan GW5 1 0 1 0 ) 0 I 1 1 1 I 0 0 0 I NZ Pal MP2 ) 0 0 0 1 I 0 ) 1 1 I 0 0 0 1 I NZ Pal MP3 I 0 0 0 1 0 ) I I 1 I 0 0 0 1 I I NZ Pa l MP5 1 0 1 0 1 0 ) 1 1 1 1 I 0 0 0 I I USA Va NV3 0 I 0 0 0 1 1 0 I 0 0 0 I I 0 ) )
USA Va NV4 0 1 0 0 0 1 ) 0 1 0 0 0 ) 0 0 0 )
USA Va NV6 0 1 0 0 0 0 ) 0 I 0 0 0 ) ) 0 0 )
USA Geo WG2 0 1 0 1 0 0 ) 0 1 0 ) ) 0 0 0 0 0 USA Geo WG3 0 1 0 0 0 0 I 0 I 0 ) ) ) 0 0 0 0 USA Geo WG5 0 1 0 ) 0 1 I 0 1 0 ) I ) 0 0 0 0 NZ Wei WLI ) 0 0 0 1 0 ) 1 1 1 ) 0 0 0 0 1 )
NZ Wei WL2 1 0 0 0 1 0 ) I 1 I ) 0 0 0 I I )
NZ We) WL3 1 0 0 0 I 0 ) 1 1 I ) 0 0 0 ) ) )
NZ Wei WU2 1 0 0 0 1 0 ) 1 I 1 I 0 0 0 ) I )
NZ Wei WU4 1 0 0 0 I 0 ) 1 I 0 0 0 ) ) )
NZ We) WUS 0 0 0 0 ) 1 ) 0 0 0 1 1 I NZ Pa) WP) 0 0 0 0 ) ) I ) 0 0 0 I I NZ Pal WP2 0 0 0 0 ) ) ) ) 0 0 0 I NZ Pa l WP6 0 0 0 0 0 I ) ) 0 0 0 I

Country Area Iso late LI5 L45 3100 2800 2400 2200 2000 1900 1700 1600 1250 1050 1000 850 800 750 2200 2100 2000 1636 1400 1200 1018 900 750 700 600 517
NZ Chr AC4 I 0 1 1 1 1 0 1 I I I I 0 0 0 0 NZ Chr AC5 1 I 1 I 1 0 I I 1 I 0 0 0 0 NZ Chr AC7 1 I I 1 I 0 I I 1 1 0 0 0 0 NZ Chr AC8 0 I I I ) 0 I 1 I 0 0 0 0 NZ Chr AC9 1 0 I I I 0 I 1 I 0 0 0 0 NZ Chr ACIO I I I I I I 0 I I 1 0 0 0 0 NZ Chr CC2 0 0 ) I 1 I 0 1 I ) 0 0 0 0 NZ Chr CC3 I I ) 1 I I 0 I I 1 0 0 I 0 0 NZ Chr CC4 I I I I I ) 0 I I 1 0 0 0 0 0 NZ Chr CC7 I 0 I I 1 0 1 0 1 I I 0 0 I 0 0 NZ Chr CC8 I I 0 I I 0 I 0 1 I I 0 I 0 I 0 0 0 NZ Chr CC9 I I I I 1 I 1 0 I I I 0 I 0 I 0 0 0 USA Ore CO l 0 1 0 1 1 0 1 0 I I I 1 0 I I 0 0 I USA Ore CO2 0 I 0 I I 0 I 0 I I I I 0 I I 0 I 0 I USA Ore C05 0 I 0 I 1 0 I 0 I I I I 0 0 I 0 0 I I I NZ Wan GW3 I I 0 1 I I I 0 I I 0 I 0 I I I 0 0 I NZ Wan GW4 I I 0 1 I 0 1 0 I I 0 I 0 1 0 I 0 I I NZ Wan GW5 I I I I I 0 I 0 I I 0 I I 0 I 0 0 I NZ Pal MP2 1 I I 1 I 1 1 0 1 1 0 I 0 I I 0 0 0 0 NZ Pal MP3 1 1 0 1 1 I I 0 I 0 1 0 I I 0 0 0 0 NZ Pal MP5 I 0 I 1 I 0 I 0 I 0 I 0 1 I 0 0 0 0 USA Va NV3 0 1 0 I 1 0 1 I I 0 1 1 I 0 0 1 I USA Va NV4 0 I 0 I I 1 1 0 I I 0 I I 0 ·0 I 1 USA Va NV6 0 1 1 I 1 0 I 1 1 0 I I 0 0 I 1 USA Geo WG2 0 L 0 L I 0 I 0 I 0 1 I 0 0 1 I USA Geo WG3 0 1 0 I I 0 1 0 I 0 I I I 0 I I USA Geo WG5 0 1 0 I I 0 0 I I 0 I I 1 0 I I NZ Wei WLI 1 0 I I 1 I 0 I 0 I 0 1 0 0 0 0 NZ Wei WL2 1 0 1 I I I 0 1 0 I 0 I 1 0 0 0 NZ Wei WL3 I 1 I I 0 0 I 0 I 0 I I 0 0 0 NZ Wei WU2 0 I I 1 I 0 I 0 I 0 I I 0 0 0 NZ Wei WU4 0 0 I I 0 0 1 0 I 0 I - I 0 0 0 NZ Wei WU5 0 I I I 0 0 I 0 I 0 I I 0 0 0 NZ Pal WPI I 0 I I 0 0 I 0 I 0 I I 0 0 I NZ Pal WP2 0 I 1 I 0 0 I 0 1 0 1 I 0 0 I NZ Pal WP6 0 0 1 I 0 0 1 0 I 0 I I 0 0 1

Appendix 10: Canonical variates analysis - Chapter 7
Mean score for all bands used in canonical variates (CVs) analysis. Vectors indicate each band,
with the clockwise angle (0° at top) and length of the vectors shown in the plot for Wanganui
(Wng), Palmerston North (Pmn), Wellington (WIg) and Christchurch (Chc), Georgia (Geo),
Oregon (Ore) and Virginia (Va), including the number of isolates sampl~d per region.
Mean band score/region (no. isolates) Vector Primer Band Wng Pmn Wig Chc Geo Ore Va °Angle Overall CV 1 CV2
bp 3 6 6 12 3 3 3 1st axis 2nd axis
AA2M2 1800 0.33 0.17 0 0.58 0 0 0 169.2 1.14 1.12 0.21 1700 0 0 0 0 0.67 1 0 163.6 2.07 1.99 0.59 1550 1 1 1 1 1 0.33 1 357.6 0.45 0.45 0.02 1018 0 0 0 0 0.33 0.67 0.67 103.5 0.68 0.16 0.66
AS4 1100 0.67 0.83 1 0.42 1 1 207.4 2.68 2.38 1.23
AS15 1250 1 1 1 1 1 0.67 1 15.0 4.02 3.88 1.04 450 1 1 1 1 0 0.33 0 357.6 0.45 0.45 0.02
AS15inv 1600 1 0.67 0 1 1 0 0 253.6 8.47 2.39 8.12 1500 0 0 0 0 0.67 1 1 133.1 2.86 1.96 2.09 1300 0 0 0 0 0 1 0.67 173.3 2.68 2.66 0.31 1000 0.33 0.33 0.83 0.58 0 0 0 199.1 2.01 1.90 0.66 800 1 1 1 1 0 1 0.33 342.2 1.32 1.26 0.40
L15 2800 1 0.5 0.17 0.75 1 1 1 279.6 1.49 0.25 1.47 2400 0.33 0.5 0.83 0.67 0 0 0.33 11.5 1.36 1.33 0.27 1900 0.33 0.33 0.5 0.8 0 0 0.33 217.1 2.49 1.99 1.50 1600 0 0 0 0 0 0 0.67 173.3 2.68 2.66 0.31
L45 2200 0 0 0 0 1 1 0.67 162.2 1.32 1.26 0.40 2100 1 1 1 1 0 0 0.33 342.2 1.32 1.26 0.40 1400 0.33 0 0 0 1 0.67 1 201.1 8.56 7.99 3.08 1018 0.33 1 0.83 0.75 0.67 0 0 243.7 0.90 0.40 0.80 750 1 0.5 1 1 1 0.67 1 93.5 1.17 0.07 1.17 700 0 0 0 0 0 0.33 0 195.0 4.02 3.88 1.04 600 0.33 0 0 0 1 1 1 199.9 10.76 10.11 3.66 517 1 0.5 0 1 1 1 1 146.1 2.20 1.83 1.23
The vector length conveys the absolute length of each vector in the canonical variates plot associated with
each band with reference to the first two canonical variates, and indicates the importance of that isolate in
separating the groups within the plot. Therefore, bands with the largest vectors varied the most between
groups. The length of the first canonical variate (CV 1) on the Y-axis measures how important that band
was in calculating the first canonical variate. The length of the second canonical variate on the X-axis
measured how important that band was in calculating the second canonical variate. The angle of vector in
the plot, measured clockwise from vertical (0°), gave the angular spread of each vector.
248