Municipal Solid Waste Management: A Bibliography of U.S. ...

M. Karamouz, et al. Development of a master...
Received 1 November 2005; revised 4 April 2006; accepted 25 May 2006; available online 25 June 2006
*Corresponding author, Email: [email protected] Tel.: +9821-8855 5884; Fax: +9821-8870 1507
Development of a master plan for industrial solid waste management
1M. Karamouz, 1B. Zahraie, 1R. Kerachian, 2N. Mahjouri and 3A. Moridi
1Center of Excellence in Infrastructure Engineering and Management, School of Civil Engineering, University of Tehran, Tehran, Iran
2School of Environmental Engineering, University of Tehran, Tehran, Iran
3School of Civil and Environmental Engineering, Amirkabir University, Tehran, Iran
ABSTRACT: Rapid industrial growth in the province of Khuzestan in the south west of Iran has resulted indisposal of about 1750 tons of solid waste per day. Most of these industrial solid wastes including hazardous wastesare disposed without considering environmental issues. This has contributed considerably to the pollution of theenvironment. This paper introduces a framework in which to develop a master plan for industrial solid waste management.There are usually different criteria for evaluating the existing solid waste pollution loads and how effective themanagement schemes are. A multiple criteria decision making technique, namely Analytical Hierarchy Process (AHP),is used for ranking the industrial units based on their share in solid waste related environmental pollution and determiningthe share of each unit in total solid waste pollution load. In this framework, a comprehensive set of direct, indirect, andsupporting projects are proposed for solid waste pollution control. The proposed framework is applied for industrialsolid waste management in the province of Khuzestan in Iran and a databank including GIS based maps of the studyarea is also developed. The results have shown that the industries located near the capital city of the province, Ahwaz,produce more than 32 percent of the total solid waste pollution load of the province. Application of the methodology alsohas shown that it can be effectively used for development of the master plan and management of industrial solid wastes.
Key words: Industrial solid waste management, analytical hierarchy process, multiple criteria decision making
INTRODUCTION Disposal of industrial solid wastes which include awide range of hazardous pollutants is one of the mainenvironmental issues especially in the developingcountries. There are a limited number of studies relatedto the industrial solid waste management, especially inconnection with the development of a master plan forregional industrial solid waste pollution control. Robergeand Baetz, (1994) proposed a model for planning theimplementation of industrial waste reduction and wastemanagement strategies. Their model was based onminimizing the overall cost of waste reduction and wastemanagement for an industrial facility over a specific timehorizon. The optimization model was formulated as ageneral mixed integer linear programming problem, wherethe objective function included capital and operatingcosts and was subject to a number of constraints thatdefined the system under consideration. Raleigh et al.,(1995) proposed a comprehensive non-hazardous
industrial waste classifying scheme based on theavailable information. This classification method wassubjected to less data limitations than the previouslydeveloped models. Hogland and Stenis, (2000) had anoverview of an industrial system and proposed a methodof organizing an industrial waste management system.The developed model optimized the waste managementpolicies with regard to energy, economy andenvironmental impacts in separate evaluations. Thestudy included: (1) the existing system (used as abenchmark), (2) an energy-recovery system, and (3) amaterial-recovery system. The second system wasfound to be preferable with regard to energy, costs andenvironmental impacts. Morrissey and Browne (2004)reviewed different types of models that were being usedin the area of municipal and industrial waste managementand highlighted some major shortcomings of thesemodels. Based on their research, most of the modelsidentified in the literature were the decision supportmodels. They showed that the shortcomings of the waste
Int. J. Environ. Sci. Tech., 3 (3): 229-242, 2006ISSN: 1735-1472© Summer 2006, IRSEN, CEERS, IAU
M. Karamouz, et al. Development of a master...
230
management models included concerns regarding therefinements of the evaluation steps rather thanaddressing the decision making process. In addition,while many models recognize that for a wastemanagement model to be sustainable, it must considerenvironmental, economic and social aspects. None ofthe models examined by them, considered all threeaspects together in the application. Karamouz et al.,(2003) proposed a framework for developing a masterplan for water resources pollution control using MCDMtechniques. They proposed an integrated set of direct,indirect, and supporting water pollution control projects.Source reduction, demand management, capacityexpansion, human resources development, developmentof monitoring and sampling network, research andtechnology transfer, institutional changes, andimprovement of legal framework have been the majorinitiatives for the master plan. This research was done atAmirkabir University (Tehran Polytechnic), Tehran, Iranin 2003.
MATERIALS AND METHODS This paper introduces a new framework in which todevelop a master plan for industrial solid wastemanagement. There are usually different criteria forevaluating the existing solid waste pollution loads andtheir management schemes. A multiple criteria decisionmaking technique called AHP is used for ranking theindustrial units and determining the share of each unitin the total solid waste pollution load. In this framework,a comprehensive set of direct, indirect, and supportingprojects are proposed for industrial solid waste pollutioncontrol. The flowchart of the activities required fordeveloping an industrial solid waste pollution controlmaster plan is presented in Fig. 1. The main steps indeveloping a master plan for industrial solid wastemanagement can be listed as follows:• Data gathering: Detailed data and information, which
are required for evaluating each industry, should begathered by visiting the sites, sending questionnaires,and reviewing related reports. Data deficiencies maybe tackled via engineering judgment and using experts’opinions.
• Iden tifica tion of the pol lut ion sources:Identification of the main industrial pollutionsources is the first step in developing the masterplan. Different criteria such as industrial solid wastequantity and quality, number of workers and water
use can be used for classification of the industriesinto small and large units.
• Determination of the evaluation criter ia: Acomprehensive set of indicators should be selectedfor evaluating the pollution load, environmentalimpacts, and solid waste management in eachindustrial unit. Indicators can be classified to two maincriter ia, namely solid waste generation andmanagement. For these criteria, some sub-criteriarelated to the separation, storage, transfer, anddisposal of different types of domestic, non-hazardous, and hazardous industrial solid wastes canbe defined.
• Determination of the share of each industry inenvironmental pollution through solid waste disposal:Ranking of industries based on a hierarchy structureof indicators is important for identifying the mainpollution sources and the critical zones. The proposedhierarchy structure of indicators presented in Fig. 2can be used for this purpose. The related weights ofthe criteria and sub-criteria in each level should bedetermined using a pair wise comparison. As statedby Pomerol and Barba-Romero (2000), the idea ofintroducing pair-wise comparisons between differentcriteria is to make comparisons between a pair at atime rather than assigning weights to the whole set ofcriteria. In order to incorporate the engineeringjudgments of the group of decision-makers andexperts, a group decision-making method developedby Aczel and Saaty (1983) should be used. In thismethod, the geometric mean of each element ofdifferent pair-wise comparison matrixes is estimated.
AHP which is well defined in the literature can beused for ranking of industries as well as determiningtheir relative share of solid waste pollution, becauseof the nature of the problem and the hierarchystructure of the relevant criteria.
• Development of a GIS-based data bank and MIS: thegathered data should be stored in a data bank withthe capabilities of statistical analysis and generationof management reports. The GIS-based maps of thestudy area including the location of industries,pollution loads and solid waste characteristics are forevaluating the spatial and temporal variations of thesolid waste pollution loads.
• Proposing solid waste pollution control projects: Themajor projects of the master plan are selected and rankedbased on how effective they are in reducing theenvironmental pollution through solid waste disposal.

M. Karamouz, et al. Development of a master...
231
Fig. 1: The flowchart of the activities required for developing an industrial solid waste pollution control master plan(adopted from Karamouz et al., 2006)
Abadan Oil Refinery Monitoring and Evaluation
Adaptable Planning Approaches
Adjustments Considering Changing Needs
Development of Monitoring and Evaluation Criteria
Major Steps
Identification of Systems Components and the Interactions among them
Data Gathering by Reviewing the Reports and using Questionnaires
Development of a GIS-based Data Bank.
Analysis of Economic, Social, and Political Consequences of the Solid Waste Pollution
Firs
t Pha
se: P
robl
em Id
entif
icat
ion
Seco
nd P
hase
: Mas
ter P
lan
Dev
elop
men
t and
of
Act
ion
Item
s
Selection of a Comprehensive Set of Indicators, which Show Different Aspects of the Industrial Solid Waste Pollution Load and Management Schemes.
Determination of the Spatial and Temporal Variation of the Waste Pollution Loads
Ranking of the Pollution Sources and Determining the Share of each Industry in Environmental Pollution through Solid Waste Disposal
Proposing a set of direct, indirect and supporting projects considering the relative share of industrial complexes or units
Evaluation of the effectiveness of the proposed projects in pollution control in the study area
Budget Associated with Each Proposed Project
Priority of Implementation of Projects
Environmental Impacts of Current and Ongoing Projects and Budget Allocated to
them
Time Table of Action Items
Time Table for Budget Spending
Socio-Economic Impacts of Proposed Projects
Cross Sectoral Cooperation and Public Framework
Third
Pha
se: M
onito
ring
an
d Ev
alua
tion

M. Karamouz, et al. Development of a master...
Fig.
2: P
ropo
sed
hier
arch
y st
ruct
ure
of in
dica
tors
and
thei
r rel
ativ
e w
eigh
ts fo
r ran
king
of i
ndus
tries
bas
ed o
n th
eir
solid
was
te g
ener
atio
n an
d m
anag
emen
t sch
emes
232
Obj
ectiv
e: D
eter
min
atio
n of
th
e sha
re o
f eac
h in
dustr
y in
th
e tot
al so
lid w
aste
po
llutio
n
Solid
was
te
man
agem
ent
(0.5
6)
Solid
was
te
gene
ratio
n (0
.44)
Haza
rdou
s (0
.23)
Non-
haza
rdou
s (0
.77)
Haz
ardo
us
(0.3
)
Non-
haza
rdou
s (0
.7)
Ord
inar
y (0
.34)
Spec
ial (
0.66
)
Ord
inar
y (0
.34)
Spec
ial
(0.6
6)
Dom
estic
(0.3
8)
Indu
stria
l (0.
62)
Dom
estic
(0
.38)
Indu
stria
l (0
.62)
In fl
amm
able
(0
.31)
Expl
osiv
e (0
.69)
Chem
ical
(0.4
6)
Biol
ogic
al
(0.5
4) Sepa
ratio
n (0
.17)
Stor
age (
0.21
)
Tran
spor
tatio
n (0
.24)
Disp
osal
(0.3
8)
Sepa
ratio
n (0
.14)
Stor
age (
0.26
)
Tran
spor
tatio
n (0
.29)
Disp
osal
(0.3
1)
Sepa
ratio
n (0
.27)
Stor
age (
0.12
)
Tran
spor
tatio
n (0
.11)
Disp
osal
(0.2
3)
Sepa
ratio
n (0
.31)
Stor
age (
0.21
)
Tran
spor
tatio
n (0
.19)
Disp
osal
(0.2
9)
Recy
clin
g (0
.27)
Leve
l 1
Leve
l 2
Leve
l 3
Leve
l 4
Leve
l 5

M. Karamouz, et al. Development of a master...
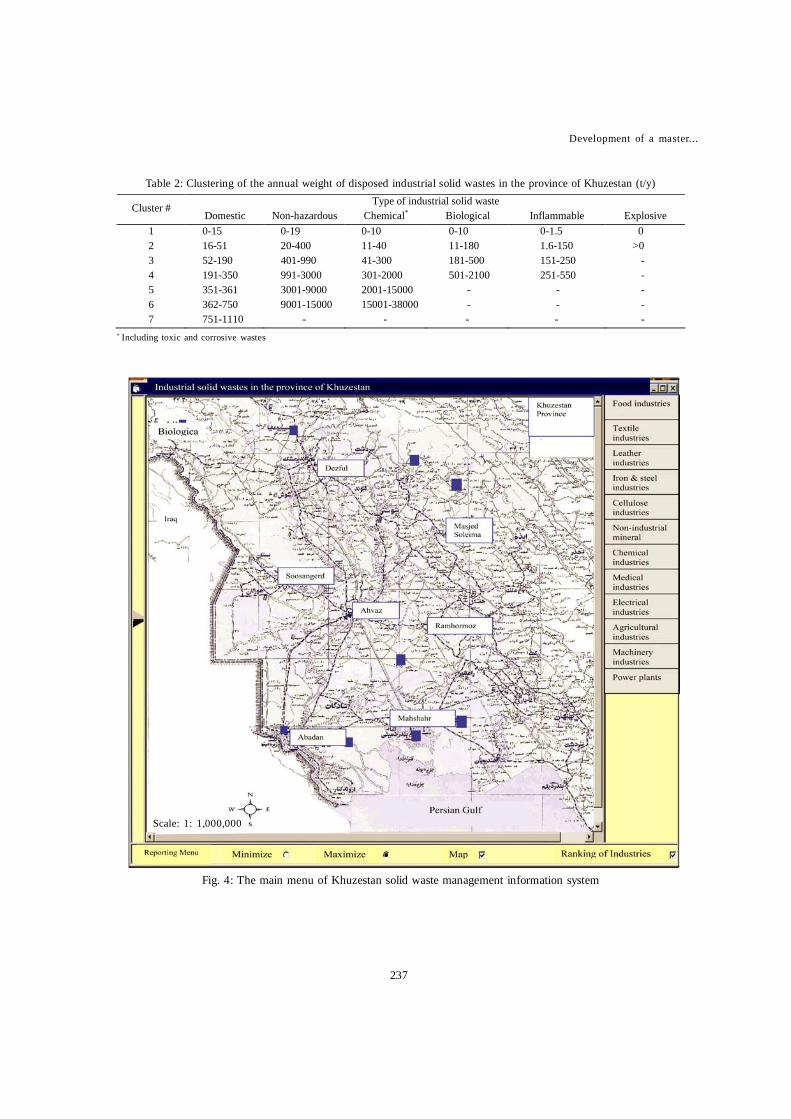
Fig. 3: The studied area and the location of the large industries
• Proposing solid waste pollution control projects: Themajor projects of the master plan are selected andranked based on how effective they are in reducingthe environmental pollution through solid wastedisposal. The projects are usually proposed bydifferent agencies and industries located in the studyarea, then they are prioritized considering theirimpacts on the overall master plan. Finally, the most
effective projects are selected in three classes,namely, direct, indirect, and supporting projects.
Direct projects, which can directly reduce the solidwaste disposal pollution load, can be categorized asfollows:Source reductionSolid waste recycling and reuseSolid waste treatment
233
20 Km

M. Karamouz, et al. Development of a master...
Solid waste disposal considering environmental issues Other projects, which have an indirect impact onsolid waste pollution control as well as the projectsaimed to improve the effectiveness of the direct andindirect projects are usually proposed as indirect andsupporting projects, respectively. The supportingprojects are proposed considering the following generalthemes:
Integrated sampling and monitoring networkResearch and technology transferHuman resources capacity building and improvementof legal frameworkMonitoring and evaluation
The AHP method was first developed by Saaty (1980and 1994) and has been widely used in both fields oftheory and practice. this method is based on pair-wisecomparison of the importance of different criteria andsub-criteria and the consistency of comparisons shouldbe verified. The difference between the dominant
eigenvalue, maxλ , and k (dimension of pair-wisecomparison matrix) is used by Saaty (1980 and 1994) indefining the Inconsistency Index, II:
1-
-maxk
kII
λ= (1)
The Inconsistency ratio (IR) is then defined as:
CRIIIIR /= (2) Where, CRI is the Inconsistency Index of the randommatrix obtained by calculating II for randomly filled n byn matrix (Table 1). If IR < 10%, then the consistencycriterion is satisfied otherwise the decision makershould be asked to revisit the pair-wise comparisons.This procedure continues until all pair-wisecomparisons satisfy the consistency criterion. The eigenvector of pair-wise comparison matrix isthen used for estimating the relative weight (importanceor priority) of different alternatives. For this purpose,the following relations can be used:
[ ]∑=
∑=
××= ⎟⎠⎞
⎜⎝⎛n
j
im
k kjwkicjwaiw
1 1 ,, (3)
∑=
= m
jajw
aiwa
iW
1
(4)
Where:wi
a: Weight of alternative (sector) iwj: Relative weight of basic criterion j which is the jth
element of eigenvector for the pair-wise comparisonmatrix of basic criteriacj, k: Value of sub-criterion k for alternative i divided bythe maximum value of that sub-criterion for allalternativeswj, k: Relative weight of sub-criterion k of the basiccriterion jwi
a: Relative weight of alternative im/n: Total number of alternatives/basic criteriamj: Number of sub-criteria defined for basic criteria i The selected criteria and sub-criteria for this studyare shown in Fig. 2. Different large industries areconsidered as alternatives. The relative weight ofalternative i (wj
a), which is calculated based on theproposed method can show the share of the industry iin contaminating the environment through solid wastedisposal.
RESULTS The proposed methodology is applied forclassification and ranking of the industrial solid wastesources and proposing a set of pollution controlprojects in the Khuzestan province. Khuzestanprovince with an area of 64236 km2 is one of the biggestprovinces located in South-West of Iran. More than 4million people are living in this province. Ahwaz,Khorramshahr, Abadan, Dezful, and Masjed Soleimanare the important cities of the Khuzestan province, withindustrial activities. More than 1580 industrial unitsare located in this strategic province. Fig. 3 shows thelocation of the main cities, rivers, and large industriesin the study area. Based on the classification of theIranian Management and Planning Organization(IMPO), Khuzestan has more than 130 large industries,based on the criterion of having 50 or more personnel.Most of the Khuzestan large industries are locatedalong the Karoon and Dez rivers with a total annualflow of 20 billion cubic meters. These rivers supply 717million cubic meters of industrial water demand, whichis 30 percent of the annual industrial water consumptionin the province. The partially treated wastewaters aswell as the leachate from industrial landfills are the mainsources of the pollution of surface and groundwaterresources in the study area. The share of industrialwastewater disposal in the pollution of the Karoon andDez rivers is about 23 percent (Karamouz, 2002).
234

M. Karamouz, et al. Development of a master...
Table 1: Inconsistency index of random matrixes (Saaty, 1990)n 1 2 3 4 5 6 7 8 9 10
CRI 0 0 0.58 0.9 1.12 1.24 1.32 1.41 1.45 1.45
n: dimension of random matrix
The total annual solid waste in the study area is about634,000 tons; in which industries have a significantcontribution in generating such a high amount of solidwastes. In this study, by revising an existingquestionnaire of the Iranian Department of theEnvironment (DOE), a more comprehensivequestionnaire was designed for gathering the basicdata related to the main characteristics of industrialsolid wastes and their disposal in the study area. Themain criteria proposed for the industrial solid wasteclassification as appeared in the American ResourceConservation Recovery Act (ARCRA) are consideredin developing the new questionnaire. Thequestionnaires were filled up by evaluating thequalitative and quantitative characteristics of the solidwastes as well as the processes utilized for separation,packing, transportation, incineration, and disposal ofthe hazardous and non-hazardous wastes in eachindustrial unit. Some additional data such as the numberof staff and workers, water use, wastewater flow rate,and the method of wastewater treatment are alsogathered. This information can present the compositionof the industrial solid wastes such as the relative weighof the domestic, non-hazardous, hazardous (toxic,biological, inflammable, corrosive, and explosive)wastes in each industry as well as the province. Theresults show that 98 percent of the total weight of theindustrial solid wastes is due to the waste disposalfrom steel industries located in the study area. Forranking the industries based on their solid wastegeneration and management practices as well asdetermining the spatial distribution of the industrialsolid waste pollution in the study area, a hierarchystructure of indicators is proposed (Fig. 2). As it isshown in this fig., in the first level of the structure,there are two main criteria for evaluating the solid wastegeneration and management. These two criteria areevaluated based on the characteristics of the hazardousand non-hazardous industrial solid wastes. In thisstructure, some sub-criteria such as separation, storage,transportation, and disposal of different types ofindustrial solid wastes are used which are related tothe solid waste management criterion. The relativeweights of the criteria are calculated based on pair-
wise comparisons set by the decision-makers andexperts familiar with the system. These comparisonsare usually presented in form of pair-wise comparisonmatrices. Decision-makers can assign a consistentweight when only two criteria are involved; howeverwhen there are several criteria, the weighting andjudgments about their importance in environmentalpolluting through solid waste disposal are ratherdifficult and could result in inconsistent assessments.The geometric mean method is used in this study tofind the group judgment about the relative importanceof sub-indicators, which resulted in the weights shownin Fig. 2. As an example, the following matrix shows the groupjudgments for the sub-criteria of the non-hazardoussolid waste:
As it can be seen in this matrix, the group judgmentsare inconsistent. For example, the relative importanceof separation compared with storage is 2.3 and therelative importance of storage compared withtransportation is 1. If the decision-makers comparisonswere consistent, the relative importance of separationcompared with transportation would be 2.3× 1=2.3 butthe decision maker indicated it as 2.45. Therefore, thematrix looks inconsistent. In this study, theinconsistency of pair-wise comparison matrices isquantified using the inconsistency index for the pair-wise comparison matrix of the basic criteria (IIb). IIb forthe above matrix is equal to 0.001 which is less than0.1, so it is considered to be consistent. As the numberof industries is more than 9, application of ordinaryAHP method will be limited as Saaty (1990) suggested.Therefore, the value of the indicators located in thethird level of the hierarchy structure is clustered into 7classes considering their range of variations. Table 2presents the characteristics of the selected classes forranking the large industries located in the Province of
235
( )( )
( )( )( )
S ST T D R
Seperation S 1 2.3 2.45 1.17 1Storage ST 0.43 1 1 2 2.5
Transportation T 0.4 1 1 2 2.5Disposal D 0.85 0.5 0.5 1 1
Re cycling R 1 0.4 0.4 1 1
⎡ ⎤⎢ ⎥⎢ ⎥⎢ ⎥⎢ ⎥⎢ ⎥⎢ ⎥⎣ ⎦
Seperation (s)Storage (ST)Transportation (T)Disposal (D)Recycling (R)
R

M. Karamouz, et al. Development of a master...
Khuzestan. The total score (grade) of each industry iscalculated by summation of a partial grade (PG) relatedto each criterion located in the last level of hierarchystructures. PG is calculated as follows:
MAXIwIwIndw
PG*
= (5)
where:wI: Weight of the interval I that the evaluator scorefalls intowInd: Weight of the indicator in the last level (Fig. 2),which is the relative importance of the indicatorcompared to the others.
MAXIw : The maximum weight of the intervals related tothe corresponding criterion The relative weight of each industry (its share inenvironmental pollution through solid waste disposal)is calculated for each alternative (industry) by thesummation of partial grades of the indicators locatedin the last level and the final ranking is obtained.The overall inconsistency index )(II is estimated bycombining the inconsistency index of basic criteria andthe effects of sub-criteria as follows:
[ ] [ ]
[ ] [ ]
[ ] [ ]⎥⎥⎦
⎤
⎢⎢⎣
⎡⎥⎦
⎤⎢⎣
⎡
⎥⎦
⎤⎢⎣
⎡⎥⎦
⎤⎢⎣
⎡
⎥⎦
⎤⎢⎣
⎡⎥⎦⎤
⎢⎣⎡
+
+++
++=
qII
pII
nII
mII
kII
iII
hII
gII
fII
eII
cIIbII
aIIII
65.035.062.038.0
66.034.07.03.0
77.023.044.056.0
Where:IIa: Inconsistency index of the pair-wise comparison
matrix of the basic criteria located in level 1.IIb, IIc: inconsistency indices of the pair-wise
comparison matrices of the indicators located inlevel 2, which are related to the Solid WasteGeneration and Solid Waste Management criteria,respectively.
IIe, IIf, IIg, IIh: inconsistency indices of the pair wisecomparison matrices of the indicators located inlevel 3.
(6)
236
IIi, IIk , IIm, IIn, IIp, IIq: inconsistency indices of the pairwise comparison matrices of the indicators locatedin level 4.
The overall random inconsistency index of thehierarchy structure CRI is then estimated similar to II ,but in equation 6, IIi, which is the inconsistency indexof matrix i, is replaced with CRIn. CRIn is theinconsistency index of a nn× random matrix and n isthe dimension of the pair-wise comparison matrix.Therefore, considering the value of the inconsistencyindex of the random matrices presented in Table 1, CRIcan be calculated as:
The overall IR is then estimated using Equation 2as 0.04, which is less than 10 percent. Therefore, thegroup judgments in matrices are used for estimatingthe share of different industries in pollution of thesystem due to waste disposal. Table 3 presents themain characteristics of solid waste generation andmanagement in different industries in the Khuzestanprovince. Tables 4 and 5 present the shares ofcontamination for different industrial zones as well asdifferent industries, which are estimated usingEquations 4 and 5. As it can be seen in Table 5, theAhwaz region produces the highest load of industrialsolid waste disposal. Table 6 presents the share ofindustries considering different relative weights forsolid waste generation and management. As it can beseen in this table, the share of each industry in pollutingthe environment is not considerably dependent on therelative weight of the criteria. Therefore, the calculatedshare of industries in polluting the environment canbe properly used in developing the master plan.
[ ]
[ ] [ ]
[ ] [ ]
[ ] [ ]
[ ] 96.1012.1
9.068.038.0
9.0
9.066.034.000
2
265.035.0
4
462.038.0
4
466.034.0
2
27.03.0
2
277.023.0
2
244.056.02
=++
++=+
+
+++
+=
⎥⎦
⎤⎢⎣
⎡
⎥⎦
⎤⎢⎣
⎡⎥⎦
⎤⎢⎣
⎡
⎥⎦
⎤⎢⎣
⎡⎥⎦
⎤⎢⎣
⎡
⎥⎦
⎤⎢⎣
⎡⎥⎦
⎤⎢⎣
⎡
⎥⎦
⎤⎢⎣
⎡
CRI
CRI
CRI
CRI
CRI
CRI
CRI
CRI
CRI
CRI
CRI
CRICRICRI
(7)
5
62 94
M. Karamouz, et al. Development of a master...
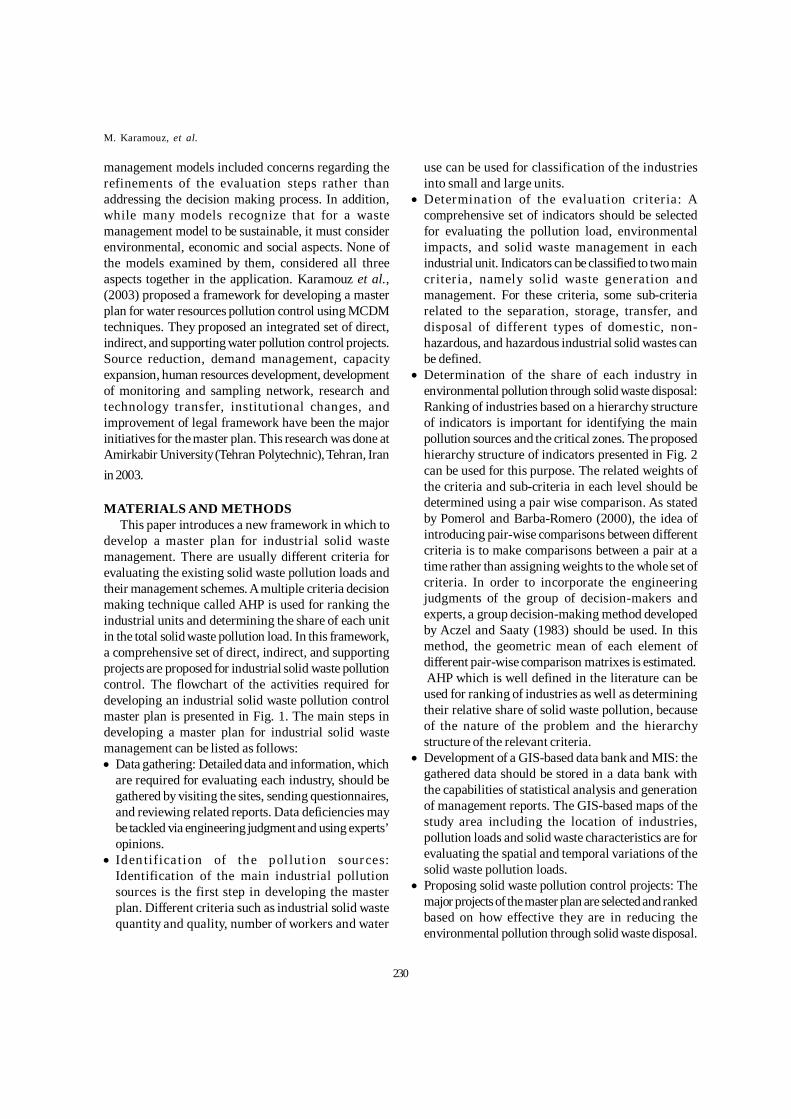
Table 2: Clustering of the annual weight of disposed industrial solid wastes in the province of Khuzestan (t/y)Type of industrial solid waste
Cluster # Domestic Non-hazardous Chemical* Biological Inflammable Explosive
1 0-15 0-19 0-10 0-10 0-1.5 0 2 16-51 20-400 11-40 11-180 1.6-150 >0 3 52-190 401-990 41-300 181-500 151-250 - 4 191-350 991-3000 301-2000 501-2100 251-550 - 5 351-361 3001-9000 2001-15000 - - - 6 362-750 9001-15000 15001-38000 - - - 7 751-1110 - - - - -
Fig. 4: The main menu of Khuzestan solid waste management information system
237
* Including toxic and corrosive wastes
Scale: 1: 1,000,000

M. Karamouz, et al. Development of a master...
Tabl
e 3:
The
ave
rage
d cl
uste
r num
ber f
or d
iffer
ent s
elec
ted
crite
ria re
late
d to
the
solid
was
te g
ener
atio
n an
d m
anag
emen
t in
diff
eren
t ind
ustri
es in
the
Khu
zest
an p
rovi
nce
238
Solid
was
te g
ener
atio
n So
lid w
aste
man
agem
ent
Spec
ial
was
tes
Ord
inar
y w
aste
s Sp
ecia
l was
te
Haz
ardo
us w
aste
N
on-h
azar
dous
in
dust
rial w
aste
D
omes
tic w
aste
Type
of i
ndus
try
Explosive
Inflammable
Biological
Chemical
Non-hazardous industrial waste
Domestic waste
Disposal
Transportation
Storage
Separation
Disposal
Transportation
Storage
Separation
Recycling
Disposal
Transportation
Storage
Separation
Disposal
Transportation
Storage
Separation
Oil
indu
strie
s 1
1 1
1 5
2 1
1 1
1 1
1 1
1 1
2 1
3 2
1 1
1 2
Agr
o in
dust
rial
1 1
1 1
2 1
1 1
1 1
1 1
1 1
1 3
1 2
2 1
1 1
2
Iron
and
steel
indu
strie
s 1
1 1
1 1
1 1
1 1
1 1
1 1
1 1
1 1
1 1
2 1
1 2
Che
mic
al in
dustr
ies
1 1
1 1
2 1
1 1
1 1
1 1
1 1
1 1
1 1
1 1
1 1
1
Food
indu
strie
s 1
1 1
1 1
2 1
1 1
1 1
1 1
1 1
3 1
2 3
2 1
3 2
Elec
trica
l and
Pow
er in
dust
ries
1 1
1 2
2 7
1 1
1 1
2 1
2 4
1 3
1 1
2 2
1 1
3
Cha
lk a
nd C
emen
t ind
ustri
es
1 1
1 1
2 6
1 1
1 1
1 1
1 1
1 3
1 3
2 1
1 1
3
Misc
ella
neou
s 1
1 1
1 1
5 1
1 1
1 1
1 1
1 1
1 1
1 1
1 1
1 2

M. Karamouz, et al. Development of a master...
Fig. 5: The main data retrieval menu for each industry
DISCUSSION AND CONCLUSION The main objective of this master plan is to complywith the regulations developed by the IDE during a 2-year time horizon in processes such as industrial solidwaste separation, storage, transportation, and disposal.It is assumed that all existing and implementingindustrial projects such as the second phase of Abadanrefinery will satisfy the existing guidelines andstandards and their environmental impacts due to solid
Table 4: Share of contamination of solid waste disposal of the industries located in different regions in the province of Khuzestan (%)
Rank Region (City) Share (%) Rank Region (City) Share (%) 1 Ahwaz 32.1 6 Khorramshahr 5.2 2 Abadan 19 7 Dezful 4.4 3 Shooshtar 16.9 8 Imam Khomeini Port 1.8 4 Shoosh 10.5 9 Ramhormoz 1.6 5 Behbahan 7.2 10 Haft tappeh 1.3
waste disposal are not considered in this study. Themajor projects of the master plan are selected and rankedbased on how effective they are in reducing theenvironmental impacts through solid waste disposalin the study area. The projects are initially proposedby different industries, then, they are prioritizedconsidering their impact toward the objective of thisstudy. Finally, the most effective projects are selectedas follows:• Equipping all industries in the study with industrial
solid wastes collection, separation, and storagesystems based on the IDE standards and theguidelines proposed in this master plan
• Equipping industries for transportation of theindustrial solid wastes
• Improving the production processes of someindustries to reduce the value of the generated solidwastes and produce the solid wastes, which arerecyclable
• Disposing the domestic solid waste generated in theindustries in municipal landfills
• Developing a comprehensive MIS for industrial solidwaste generation and management in the studiedarea.
• Proposing and implementing the research projectsrelated to the industrial solid waste recycling.
• Developing local regulations and guidelines forindustrial solid waste collection, separation, storage,transportation, and disposal considering the existingnational regulations
Table 5: Share of contamination of solid waste disposal of thetop10 polluting industries in the province of Khuzestan (%)
Rank Region (City) Share (%) 1 Imam Khomeini Port 14.6 2 Ahwaz 11.9 3 Abadan 7.2 4 Ahwaz 4.98 5 Ahwaz 4.86 6 Shoosh 3.3 7 Shooshtar 3.3 8 Ahwaz 2.96 9 Ahwaz 2.836
10 Ahwaz 2.7
239

M. Karamouz, et al. Development of a master...
Fig. 6: The main menu of data and information report generation
Table 6: Share of industries in environmental polluting considering different weights for solid waste generation and management
Type of Industry WSM: 0.36, WSP: 0.64
WSM: 0.46, WSP: 0.54
WSM: 0.56, WSP: 0.44
WSM: 0.66, WSP: 0.34
WSM 0.76, WSP: 0.24
Oil industries 15.5 16 15.9 16.7 17.2 Agro industries 32.1 31.5 30.5 30.3 29.9 Iron and steel industries 18.4 16.4 15.3 12.7 10.8 Chemical industries 1.4 1.7 2 2.3 2.6 Food industries 14.1 16.2 18.5 20.5 22.5 Electrical and power industries 11.4 10.2 9 7.8 6.6 Chalk and cement industries 3.4 4 4.5 5.1 5.5 Miscellaneous 3.7 4 4.3 4.6 4.9 Sum 100 100 100 100 100
WSM: weight of solid waste managementWSP: weight of solid waste production
240
Scale: 1: 1,000,000

M. Karamouz, et al. Development of a master...
• Developing the human resources for solid wasterecycling in industries
• Training the staff of the solid waste managementsystems in different industrial units
• Monitoring and evaluation of the solid wastemanagement systems in the industries
The effectiveness of the proposed projects isevaluated using the hierarchical structure of the criteriaand their relative weights, calculated in this study (Fig.2). As mentioned before, the collected data should bestored in a data bank with the capabilities of statisticalanalysis and generating management reports. In thisstudy, a data bank and GIS-based maps of the studyarea has been developed. The main menu of this systemis shown in Fig. 4. This Fig. represents a map of theprovince of Khuzestan including the main industries.The main categories of the industries are shown in theright hand side of the map. By selecting each category,the main related industries are appeared in the provincemap. By clicking on each industry, some informationrelated to the selected industry such as solid wastequantity and quality, solid waste separation, storage,transportation, and disposal are presented (Fig. 5). Inorder to generate reports, a menu has been developed(Fig. 6). The Reports include all data, which has beenstored in the data bank. In this paper, different aspectsof development of a master plan in industrial solid wastepollution reduction are discussed. Definition ofobjectives, system identification and action items as wellas the projects needed for pollution reduction areconsidered and described in the context of a case studyfor Khuzestan Province in Iran. In order to estimate theeffects of different industries as well as industrial zoneson the environmental pollution in the study area, aMCDM technique, namely the AHP method is used.Subjective information about relative importance ofdifferent criteria is also incorporated in this analysis.The inconsistency in engineering judgments were alsoassessed and incorporated in finding the relativeimportance of different water quality indicators byutilizing the AHP method. An economic analysis canalso be used instead of the proposed AHP based methodconsidering the cost associated with the environmentalimpacts of the pollution load of different industries andhow cost effective the waste pollution control projectsare. The economic-based methods, especially in thedeveloping countries, suffer from data deficiencies anduncertainties in inflation and interest rates over the long-
term planning horizon. The proposed MCDM methodcan easily incorporate the available limited data, experts’opinions, and engineering judgments in defining thecriteria and their relative weights in many developingcountries in which the economic data is not usuallyavailable. The main objective of the master plan for thestudy area has been to comply with the existingregulations and standards in a 2 year time horizon.Pollution load reduction, development of industrial solidwaste separation, storage, transportation and disposalsystems, human resources development, developmentof monitoring and sampling networks, research andtechnology transfer, institutional changes andimprovement of the legal framework have been the majorproposed projects for the master plan. Subjectiveinformation as well as engineering judgment has beenused to overcome the data deficiencies for this type ofanalysis. Breakdown of the total percentage of wastepollution generated through the activities of differentindustries, the cost associated with different projects,and the estimated rate of pollution reduction by differentprojects have been determined. The total budget neededfor improving the environmental problems of industrialsolid wastes in the Ahwaz region in a 2 year time horizonis estimated as 13.967 Billion Iranian Rials (1.552 MillionDollars). The variation of budget depends on an estimateof the process of approval, construction period, and thewaiting period for the full operation. Most of the requiredbudget should be expended during the first two yearsafter implementing the master plan. The results of application of the proposed frameworkin the province of Khuzestan show that thismethodology can be effectively used for developmentof a master plan for industrial solid waste pollutioncontrol.
ACKNOWLEDGMENTS This study was partially funded by the KhuzestanDepartment of the Environment. Contribution ofmanagers and engineers of this Department is herebyacknowledged.
Notations The following symbols are used in this paper:λ = Eigen value of pair-wise comparison matrix
maxλ = Dominant eigenvalue
A = Pair-wise comparison matrix
ijc = Value of criterion i for alternative j
241

M. Karamouz, et al. Development of a master...
242
ija = Elements of pair-wise comparison matrix
nCRI = Inconsistency index for randomly filled matrixes with dimension n = Inconsistency Index = Inconsistency index for basic criteria = Inconsistency Ratio
n1 m,,m = index of sub-criteria
N = umber of decision-makers
ijr = Elements of row i and column j in the dimensionless decision matrixw = Eigen vector of pair-wise comparison matrix
aiw = Weight of alternative i
w i = Weight of alternative iaiw = Relative weight of alternative i
wMAXI : The maximum weight of the intervals related
to the corresponding criterion
using MCDM techniques: a case study. J.Wat. Int., 28 (4),478-490.
Karamouz, M., (2002). Development of a master plan forpollution control of Karoon River in Iran. Technical Report,Khuzestan the School of Environmental Engineering, Ahvaz,Iran.
Karamouz, M., (2003). Identification and classification of thesolid wastes of large industries in the province of Khuzestan,Iran. Technical Report, Khuzestan Department of theEnvironment, Ahvaz, Iran.
Karamouz, M., Zahraie, B., Kerachian, R., Jaafarzadeh, N. andMahjuri, N., (2006). Developing amaster plan for hospital solidwaste management: Acase study, Waste Manag., 26 (in press).
Morrissey, J. and Browne, J., (2004). Waste management modelsand their application to sustainable waste management.Waste Manag., 24 (3), 297-308.
Pomerol, J. C. and Barba-Romero, S., (2000). Multicriteriondecision in management: principles and practice, KluwerAcademic Publishers.
Roberge, H. D. and Baetz, B. W., (1994). Optimizationmodeling for industrial waste reduction planning, WasteManag., 14 (1), 35-48.
Raleigh, L. H., Knox, R. C. and Canter, L. W., (1995). Proposednon-hazardous industrial-waste classification scheme. J.Environ. Eng., ASCE., 121 (5), 402-410.
Saaty, T. L., (1980). The analytical hierarchy process, planning,priority, resource allocation. RWS Publication, USA.
Saaty, T. L., (1990). The analytical hierarchy process,McGraw-Hill, New York.
Saaty, T. L., (1994). Highlights and critical points in the theoryand application of the analytical hierarchy process. Europ.J. Operat. Res., 74 , 426-447.
AUTHOR (S) BIOSKETCHESKaramouz, M., Ph.D. is a professor at the School of Civil Engineering, University of Tehran,Tehran, Iran, Email: [email protected]
Zahraie, B., Ph.D. is an assistant professor at the School of Civil Engineering, University ofTehran, Tehran, Iran, Email: [email protected]
Kerachian, R., Ph.D. is an assistant professor at the School of Civil Engineering, University ofTehran, Tehran, Iran, Email: [email protected]
Mahjouri, N., is a Ph.D. Student at the Department of Environment, University of Tehran, Tehran,Iran, E-mail: [email protected]
Moridi, A., is a Ph.D. candidate at the School of Civil and Environmental Engineering, AmirkabirUniversity, Tehran, Iran, Email: [email protected]
This article should be referenced as follows:Karamouz, M., Zahraie, B., Kerachian, R., Mahjouri, N., and Moridi, A., (2006). Development ofa master plan for industrial solid waste management. Int. J. Environ. Sci. Tech., 3 (3), 229-242.
REFERENCESAczel, J. and Saaty, T., (1983). Procedure for synthesizing
ratio judgments. J.Math. Psyco., 27 , 93-102.Hogland, W. and Stenis, J., (2000). Assessment and system
analysis of industrial waste management. Waste Manag., 2(7), 537-543.
Karamouz, M., Zahraie, B. and Kerachian, R., (2003).Development of a master plan for water pollution control
IIIIhIR
Copyright © 2022 FDOKUMEN