(Affiliated to University of Mumbai) Jambhul Phata, Ambernath ...
MIDDLE EAST JOURNAL OF FAMILY MEDICINE • VOLUME 7 , ISSUE 10 �
Chief Editor:Abdulrazak AbyadMD, MPH, AGSF, AFCHSEEmail: [email protected]
Ethics Editor and PublisherLesley Pocockmedi+WORLD International 11 Colston Avenue, Sherbrooke 3789 AUSTRALIAPhone: +61 (3) 9005 9847Fax: +61 (3) 9012 5857Email: [email protected]
Editorial enquiries:[email protected]
Advertising enquiries:[email protected] The South Asia Journal of Family Medicine (SAJFM) is the Journal of the South Asia Primary Care Research Network (SAPCRN)
While all efforts have been made toensure the accuracy of the infor-mation in this journal, opinions expressed are those of the authors and do not necessarily reflect the views of The Publishers, Editor or the Editorial Board. The publishers, Editor and Editorial Board cannot be held responsible for errors or any consequences arising from the use of information contained in this journal;or the views and opinions expressed.Publication of any advertisements does not constitute any endorse-ment by the Publishers and Editors of the product advertised.
The contents of this journal arecopyright. Apart from any fair deal-ing for purposes of private study, re-search, criticism or review, as permit-ted under the Australian Copyright Act, no part of this program may be reproduced without the permission of the publisher.
ISSN 1448-4196 August 2010 - Volume1, Issue 4
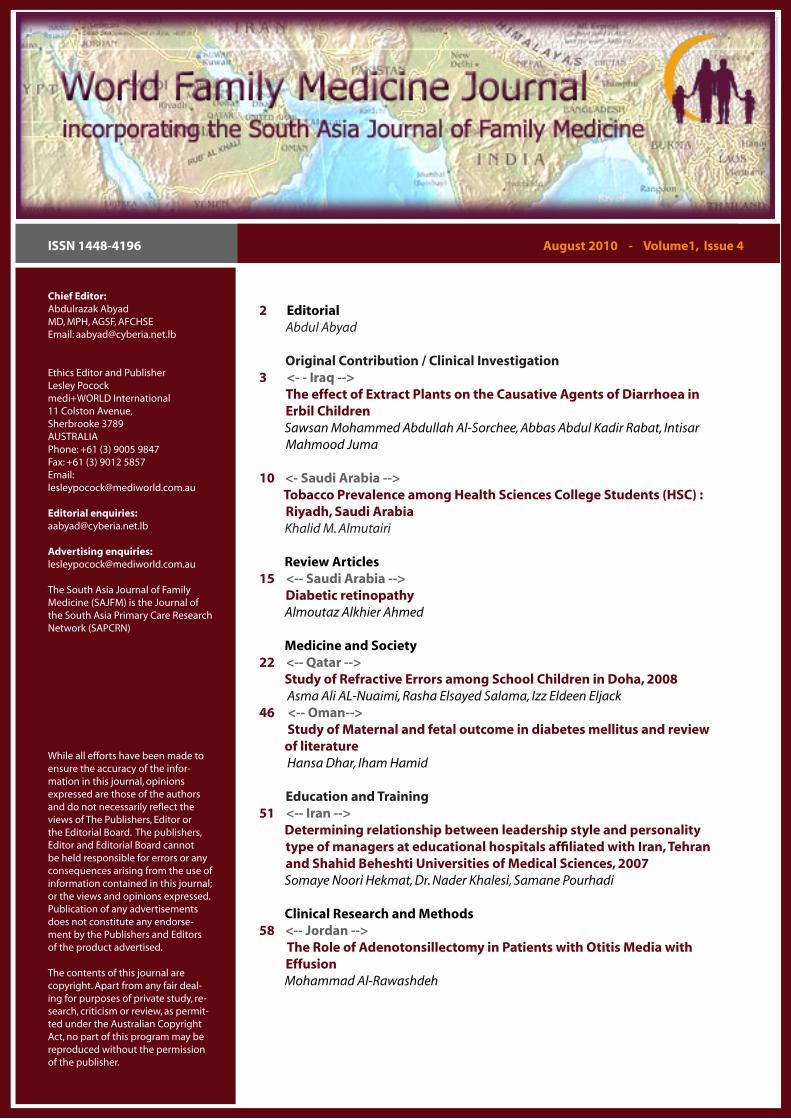
2 Editorial Abdul Abyad
Original Contribution / Clinical Investigation3 <- - Iraq -->
The effect of Extract Plants on the Causative Agents of Diarrhoea in Erbil Children
Sawsan Mohammed Abdullah Al-Sorchee, Abbas Abdul Kadir Rabat, Intisar Mahmood Juma
10 <- Saudi Arabia --> Tobacco Prevalence among Health Sciences College Students (HSC) :
Riyadh, Saudi Arabia Khalid M. Almutairi
Review Articles15 <-- Saudi Arabia -->
Diabetic retinopathy Almoutaz Alkhier Ahmed
Medicine and Society22 <-- Qatar --> Study of Refractive Errors among School Children in Doha, 2008 Asma Ali AL-Nuaimi, Rasha Elsayed Salama, Izz Eldeen Eljack 46 <-- Oman--> Study of Maternal and fetal outcome in diabetes mellitus and review of literature Hansa Dhar, Iham Hamid
Education and Training51 <-- Iran --> Determining relationship between leadership style and personality
type of managers at educational hospitals affiliated with Iran, Tehran and Shahid Beheshti Universities of Medical Sciences, 2007
Somaye Noori Hekmat, Dr. Nader Khalesi, Samane Pourhadi
Clinical Research and Methods 58 <-- Jordan --> The Role of Adenotonsillectomy in Patients with Otitis Media with
Effusion Mohammad Al-Rawashdeh

MIDDLE EAST JOURNAL OF FAMILY MEDICINE • VOLUME 7 , ISSUE 10�
In this issue of the journal various paper discussed important issues in family medicine from leadership style to school health. A paper from Iran looked at “Determining relationship between leadership style and personality type of managers at educational hospitals affiliated with Iran, Tehran and Shahid Beheshti Universities of Medical Sciences, 2007”. The sample comprised 44 managers. The data was collected by a questionnaire. The authors revealed that there is relationship between personality type and leadership styles. Most of the top managers of hospitals have used the consultative style. This Study showed us that personality impact on leadership style and managers should pay attention to this factor as an important variable in organizations.
A paper from Saudi Arabia reviewed Diabetic retinopathy and diabetic macular oedema. The author stressed that they are the leading causes of blindness in the working age population of the developed world. The increasing numbers of individuals with diabetes suggests that retinopathy would continue to be a major preventable challenge.
A cross sectional study was carried out targeting all school children registered in Doha primary schools from both genders. The aim was to measure the prevalence of Refractive Errors among primary school children in Doha and to identify risk factors for Refractive Errors among them. The prevalence of RE was found to be high among primary school children in Doha, accounted to be 19.7%. The authors revealed an association between RE and gender and age and there were no associations between RE and the following: family income, family history of RE, having chronic diseases and physical activity.
From the Editor
FROM THE EDITOR
Abdulrazak Abyad(Chief Editor)
A paper from Iraq studied the effect of aqueous and ethanolic extract of Quercus infectoria galls and the effect on the elimination (curing) of antimicrobial resistance genes (plasmid). A total of five hundred samples of stool were collected from patients with diarrhoea. The authors concluded that the SMIC of Quercus infectoria galls used in the current study affected the Escherichia.coli O157:H7 as curing agents on resistance genes and reduced the resistance to anti-microbial agents.
A prospective randomised study was conducted at Prince Zaid Ben Al-Hussein Hospital in Jordan attempt to evaluate the efficacy of adenotonsillectomy at the time of myringotomy with insertion of tympanostomy tube on the impact of otitis media with effusion in comparison with tympanostomy-tube placement only. The authors concluded that adenotonsillectomy combined with myringotomy and insertion of tympanostomy tube appears to be more effective in reducing the episodes of otitis media than myringotomy and insertion of tympanostomy tube alone.
A paper from Riyadh College of Health Sciences, King Saud University examined the prevalence of tobacco use and influences of personal, social, environmental factors, and knowledge on smoking among Riyadh Health Sciences College students. The consistent research results shows tobacco use among youth in Saudi Arabia reflects a need for continued monitoring of the behavior and the need for intervention to change this behavior. This study examines tobacco use among young people in Saudi Arabia and examines factors that can be addressed to reduce initiation and continued use of tobacco among young people.
MIDDLE EAST JOURNAL OF FAMILY MEDICINE VOLUME 8 ISSUE 3
South Asia Journal of Family Medicine
SAJFM Volume 1 Issue 2, June 20102 SAJFM Volume 1 Issue 3, July 2010
EDITORIAL BOX Chief Editor:Abdulrazak AbyadMD, MPH, AGSF, AFCHSEEmail: [email protected]
Ethics Editor and PublisherLesley Pocock
medi+WORLD International 11 Colston Avenure, Sherbrooke 3789 AUSTRALIAPhone: +61 (3) 9005 9847Fax: +61 (3) 9012 5857Email: [email protected]
NATIONAL EDITORS
BangladeshProf Falahuzzaman Prof. Aminul Haque University of Dhaka
IndiaProf Vinod ShahCMC, Vellore
IranProf Mohsen RezaeianRafsanjan Medical SchoolRafsanjan
IraqProf Thamer Kadum Yousif Al HilfyAlkindy College of MedicineBaghdad
Nepal Dr Binita Pradhan Editorial Team,Drs Ashis Shrestha, Katrina Butterworth, Mark Zimmerman, Bruce Hayes)C/o Nick Simons InstituteEmail: [email protected]
Pakistan Dr Manzoor ButtMaqbool ClinicRawalpindi
Sri LankaDr. Anthony de Seneviratne University of sri jayawardenepura,NugegodaEditorial Team Drs Sarath Paranavitane, Prasanna Siriwardene
Advertising and general enquiries:[email protected]
SAJFM Volume 1 Issue 4, August 2010
MIDDLE EAST JOURNAL OF FAMILY MEDICINE • VOLUME 7 , ISSUE 10 �
SPECIAL ANNOUNCEMENT: MEJFM DOCTOR OF THE YEARSouth Asia Journal of Family Medicine
3 SAJFM Volume 1 Issue 4, August 2010
The effect of Extract Plants on the Causative Agents of Diarrhoea in Erbil Children
Sawsan Mohammed Abdullah Al-Sorchee (�),Abbas Abdul Kadir Rabat (�),Intisar Mahmood Juma (3)
(1) Instructor of Microbiology, College of Education (Ibn Al Haitham), Baghdad, Iraq(2) Assistant Professor of Pediatrics, College of Medicine, Hawler Medical University,Erbil, Iraq(3) Intisar Mahmood Juma , Assistant Professor of Microbiology, College of health and medical technology, Baghdad University, Iraq
CorrespondenceSawsan Mohammed Abdullah Al-SorcheeEmail: [email protected]
Introduction Diarrhoea is defined either as watery stool or increased frequency, or both when compared to a normal case (1). Acute diarrhoeal episodes subside within 72 hours of onset, while diarrhoea lasting 14 days or more is considered to be chronic (2). Diarrhoea may be caused by a number of conditions, including bacterial, viral, parasites infection and an intestinal disease (1). Bacterial infections are very important causes of diarrhoea in infants and young children worldwide (3). The principal microorganisms implicated are Salmonella (4), Shigella (5), Vibrio cholerae (6) and serotypes of Escherichia coli including Enteropathogenic Escherichia coli (EPEC), Shiga toxin producing Escherichia coli (STEC), Entero aggregative Escherichia coli (EAEC), Enteroinvasive Escherichia coli (EIEC) and Enterohemorrhagic Escherichia coli (EHEC) (7). The use of alternative medical therapy has increased the interest of pharmacologists and herbalists over the past decades. There is increasing use of herbal products all over the world; in the USA, it reached 38% between 1990 and 1997 (8). Therefore, instead of antibiotic therapy, there is a continuing search for new antimicrobials from other sources including plant extracts. The risk of E.coli O157:H7 occurs in its plasmid, because of its ability to transfer plasmids to other bacteria or other strains of E.coli by transformation, conjugation and transduction processes (9). Curing process means elimination of plasmids from host cells. This process may occur spontaneously during the cell division or by treatments that inhibit plasmid replication while not affecting host cell reproduction. The inhibited plasmids are slowly diluted out of
ABSTRACT Objectives : Study of the effect of aqueous and ethanolic extract of Quercus infectoria galls and the effect on the elimination (curing) of antimicrobial resistance genes (plasmid).
Methods : Five hundred samples of stool were collected from patients with diarrhoea (infants and children under ten years of age) admitted to the Pediatric and Maternity Hospital in Erbil City from March 2007 to September 2007.
Results : To reduce or remove these genes that are responsible for antibiotic resistance, the aqueous and ethanolic extracts of Q.infectoria were used, and by SMIC determination, the results revealed that it had a reducing effect (curing) on these
genes. These results indicate that this plant’s extracts were highly efficient in reducing the Escherichia.coli O157:H7 antibiotic resistance and this was proved using gel electrophoresis.
Conclusion : The SMIC of Quercus infectoria galls used in the current study affected the Escherichia.coli O157:H7 as curing agents on resistance genes and reduced the resistance to anti-microbial agents
MIDDLE EAST JOURNAL OF FAMILY MEDICINE • VOLUME 7 , ISSUE 10�
ORIGINAL CONTRIBUTION AND CLINICAL INVESTIGATION
MIDDLE EAST JOURNAL OF FAMILY MEDICINE VOLUME 8 ISSUE 3
South Asia Journal of Family Medicine
4 SAJFM Volume 1 Issue 2, June 2010 SAJFM Volume 1 Issue 3, July 2010
the growing bacterial population (10; 11). The galls of Q.infectoria have also been pharmacologically documented to possess astringent, anti-diabetic (12), antitremorine, local anesthetic (13), antiviral (14), antibacterial (15) antifungal (8), larvicidal (16) and anti-inflammatory (17) activities. The pattern of P.farcta flavonoids were investigated in branches, leaves, roots and pods without seeds. Sixteen constant phenolic compounds were identified in P.farcta plant material.
Methods A total of 500 stool samples were collected in clean disposable plastic containers from diarrhoeal patients (infants and children, below ten years of age) admitted to the Pediatric and Maternity Hospital in Erbil City from March 2007 to September 2007 and the relevant information was recorded from each patient including age, sex, geographical area, clinical symptoms and type of feeding. Samples were then sent for direct macroscopical and microscopical examination in the laboratory of the Maternity and
Children Hospital to be checked for the presence of red blood cells, white blood cells and parasites and their stages. Then the sample was cultivated on suitable culture media (Mac Conkey and blood agar) and incubated at 37°C overnight. The growing colonies were cultured on further selective and differential media. The growing bacteria were selected and transferred to nutrient agar slants and incubated at 37°C overnight. The slants were kept at 4°C until used for microbiological analysis. (API- 20 E Test and Antisera)(9).To study the effect of different antimicrobials on all isolates of bacteria, both nutrient and Mueller-Hinton agar were used as growth media, and after sterilization and cooling at 45°C, final concentration of antibiotics was added to media and poured into sterile Petri dishes. After solidification, the plates were inoculated by streaking method with bacterial isolates, then incubated at 37°C for 24 hours. The results were recorded next day (10).
Preparation of aqueous crude extracts The aqueous gall extracts were prepared according to (11) as follows: Fifty grams of powdered plant was put in a conical flask. Two hundred fifty ml of double D.W. was added to the flask then placed on a magnetic stirrer, and left to mix by magnetic bar at room temperature. After 72 hours, the solution was filtered by muslin cloth, then by filter paper. The above steps were repeated 3-5 times to the residue, until a clear colorless supernatant extraction liquid was obtained indicating that no more extraction from the plant material was possible. The extracted liquid was subjected to a Rota-evaporation to remove the water and the temperature adjusted at 55ºC. The extracts were stored in air-tight jars at 4ºC until further use.
Preparation of alcoholic (ethanolic) crude extracts The alcoholic gall extract was prepared as aqueous crude extracts while using 80g of crude powdered plant and 320ml absolute ethanol instead of double D.W. (11).
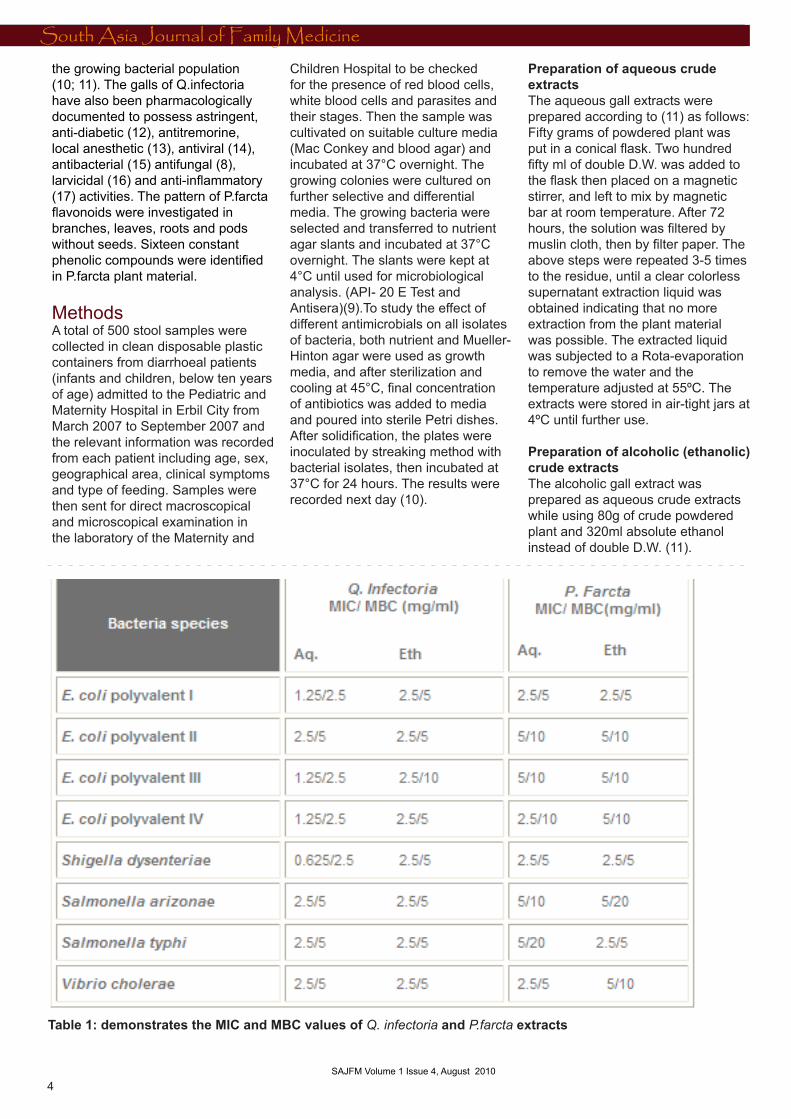
Table 1: demonstrates the MIC and MBC values of Q. infectoria and P.farcta extracts
SAJFM Volume 1 Issue 4, August 2010

MIDDLE EAST JOURNAL OF FAMILY MEDICINE • VOLUME 7 , ISSUE 10 �
ORIGINAL CONTRIBUTION AND CLINICAL INVESTIGATION
MIDDLE EAST JOURNAL OF FAMILY MEDICINE VOLUME 8 ISSUE 3
South Asia Journal of Family Medicine
5 SAJFM Volume 1 Issue 2, June 2010 SAJFM Volume 1 Issue 4, August 2010
Chemical detection methodsAlkaloids detection: The method followed was described by (12). Ten ml of plant extract was acidified with 36% HCl and was tested by adding some drops of picric acid extract. Yellow precipitate refers to alkaloids.
Glycosides detection: Two parts of Fahleing’s reagent was mixed with plant extract, and left in a boiling water bath for 10 minutes. Appearance of red color indicates presence of glycosides (12).Flavonoids detection: Ten ml of 50% ethanol was added to 10ml 50% KOH then this solution was mixed with equal volumes of plant extract. Yellow color refers to presence of flavonoids (12). Tannins detection: Ten ml from plant extract was divided into two equal parts and then drops of 1% CH3COOH were added to the first part. Appearance of white pillete means presence of tannins. To the second part, drops of 1% FeCl3were added. Formation of green bluish color refers to presence of tannins (12).Saponin detection: Five ml of plant extract was shaken well for half a minute, and then left in vertical position for 15 minutes. Appearance of foam indicates presence of saponin (12).Resins detection: Ten ml of acidified D.W. with 36% HCl was added to 10 ml of plant extract. If turbidity appears, it refers to the presence of resins (12).Phenols detection: Three ml of plant extract was added to 2 ml of 1.0M potassium hexacyanoferrate and 2 ml of 0.5M FeCl3. Appearance of green bluish color indicates presence of phenols (12).
Determination of MIC and MBC valuesThe minimum inhibitory concentration (MIC) of the extracts was determined for isolates using the two fold serial microdilution method with saline at a final concentration ranging from 20mg/ml to 0.0195 mg/ml. The tested extracts were added to sterile nutrient broth in microtiter plates before the diluted bacterial suspension (final inoculum of 106
bacteria/ml) was added. Each extract was assayed in triplicate. The bacterial suspensions were used as positive control and extracts in broth were used as negative control, then the plate was covered with a sterile plate sealer. Contents of each were mixed on plate shaker at 300 rpm for 20 seconds and then incubated at appropriate temperature for 24 hours. Microbial growth was determined at 600nm using the ELX800 universal microplate reader. The MIC was defined as the lowest concentration of the compounds to inhibit the growth of microorganisms. The MBC was determined by the subculture of the well showing no apparent growth. The least concentration showing no visible growth on agar subculture was considered as MBC value (13). SMIC was used as a curing agent.
Plasmid curingPlasmid curing was performed using (14) method. Curing of plasmids with plant extract was done by transferring colonies (15): SMIC and 0.1 ml of overnight bacterial suspension were added to 10 ml nutrient broth then incubated at 37ºC for 24 hours. Next day, 0.1 ml was spread on nutrient agar plate and incubated for 24 hours at 37ºC. After incubation, 100 colonies were transferred to the antibiotic agar plate. After incubation overnight at the same temperature, viable colonies were recorded, and then the percentages of curing colonies were calculated. Agarose Gel Electrophoresis (16) was used in this study.
Results The MIC of the aqueous and ethanolic extracts of nutgall for E.coli I, E.coli II, E.coli III, E.coli IV were determined and were 1.25-2.5mg/ ml and 2.5mg/ ml. MBC were 2.5-5mg/ ml and 2.5-10mg/ ml, respectively. Concerning Shigella dysenteriae, Salmonella arizonae, Salmonella typhi and Vibrio cholerae the MIC and MBC of the aqueous and ethanolic extracts ranged from 0.6-2.5mg/ ml 2.5-5mg/ ml and 2.5, 5mg/ ml, respectively. Whereas, the MIC for the aqueous and ethanolic extracts of Prosopis farcta (pods) against bacterial isolates ranged from 2.5-5mg/ ml and the MBC were
5-10mg/ ml for the aqueous and ethanolic extracts against the four serotypes of E.coli and 5-20mg/ ml for the rest of the strains Table 1 (opposite page)
Curing the plasmid DNA in E.coli O157:H7 isolates by Q.infectoria extractsResults of Table 2 (next page) show the cured bacteria by transferring colonies method demonstrating the curing percent of isolates to antibiotics. The aqueous and ethanolic extracts of Q.infectoria affected all antibiotics genes in E.coli O157:H7 at 0.625 mg/ ml and 1.25mg/ ml (SMIC), respectively. The percentage of curing process had a range of 7-100 and 4-100 for the aqueous and ethanolic extract, respectively. Figure 1 proved the curing process where some bands disappeared after treatment with the aqueous and ethanolic extracts of Q.infectoria.
(Curing percentage of plasmid DNA of E.coli O157 H7 isolates by Q.infectoria extracts at 1.25mg/ml for aqueous extracts a and 2.5mg/ml for alcoholic extract).
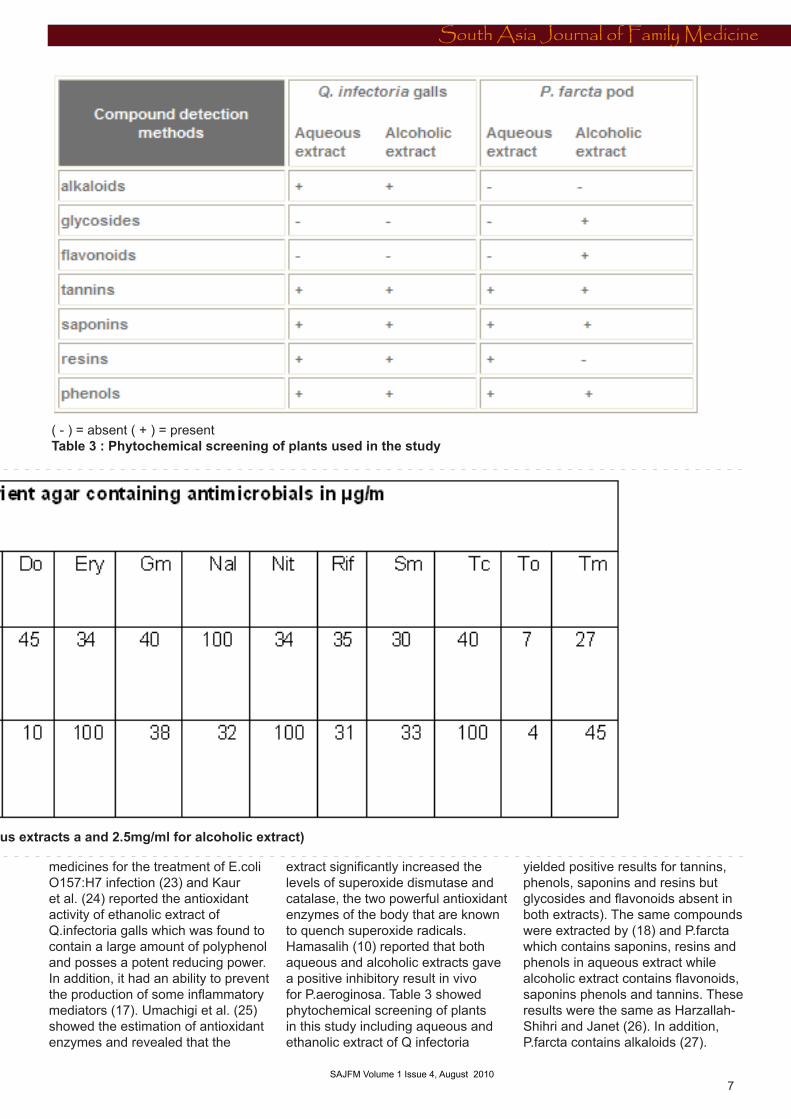
Phytochemical screening of plantsTable 3 (page 7) shows the chemical composition of the plants used in this study, which may have anti- bacterial effect including phenols, alkaloids, flavonoids, tannins and glycosides.
Discussion Table 1 show the results of MIC and MBC of the aqueous and ethanolic extracts from the galls of Q.infectoria against E.coli polyvalent isolates which were 1.25-2.5mg/ ml, 2.5 mg/ ml and 2.5-5, 5-10, respectively, while the MIC-MBC for S.dysenteriae were 0.625-2.5mg/ ml, 2.5mg/ ml and 5mg/ ml of the aqueous and ethanol extracts, respectively. The crude extract, however, of Q.infectoria galls (aqueous and ethanol) showed higher MIC and MBC values range, 2.5mg/ml and 5 mg/ml, respectively, for S.typhi, S.arizonae and V.cholerae. Basri and Fan (13) reported that Q.infectoria galls possess antibacterial activity against S.typhimurium and S.aureus. In addition, Mekseepralard et al (19)

MIDDLE EAST JOURNAL OF FAMILY MEDICINE • VOLUME 7 , ISSUE 10�
ORIGINAL CONTRIBUTION AND CLINICAL INVESTIGATION
MIDDLE EAST JOURNAL OF FAMILY MEDICINE VOLUME 8 ISSUE 3
South Asia Journal of Family Medicine
6 SAJFM Volume 1 Issue 2, June 2010 SAJFM Volume 1 Issue 3, July 2010
Lane A: without plasmid of E.coli DH5a strain
Lane B: DNA ladder 10,000 base pairs
Lane C: plasmid of E.coli O157:H7 isolate 4
Lane D: DNA isolated from E.coli O157:H7 isolate 4 treated with aqueous extract of Q.infectoria
Lane E : DNA isolated from E.coli O157:H7 isolate 4 treated with alcoholic extract of Q.infectoria
showed that the galls had higher antimicrobial activity against E.coli, S.typhi, V.cholerae, Klebsiella pneumoniae and Pseudomonas aeruginosa. Voravuthikunchai et al. (20) recorded activity of the ethanol extracts of galls against all important pathogens including E.coli, Salmonella spp., S.flexneri and others where the MIC was 62.5 to 1000 µg/ ml and MBC values of 125-500µg/ ml. These values are
less than those recorded in the current study. Voravuthikunchai et al. (21) recorded the MIC and MBC values of fraction Q13 and Q14 ethanol extracts and demonstrated them to be highly effective against E.coli O157:H7 (MIC values of 28 and 56µg/ ml and the MBC values of 56 and 112µg/ ml, respectively) and were proved to be very active against EHEC and depressed the VT production. Nimri et al. (22)
showed that the ethanol extract of galls exhibited broad spectrum antibacterial activity where MIC ranged from 4-32 mg/ ml and MBC of active extracts ranged from 8-62 mg/ ml. Both aqueous and ethanolic extracts of Q.infectoria was highly effective against E.coli O157:H7 with the best MIC and MBC values of 0.09, 0.78 and 0.19, 0.39 mg/ ml, respectively. These plants may provide alternative bioactive
Figure 1: Agarose gel electrophoresis of E.coli O157:H7 isolate 4 DNA
Table 2: (Curing percentage of plasmid DNA of E.coli O157 H7 isolates by Q.infectoria Extracts at 1.25mg/ml for aqueous extracts a and 2.5mg/ml for alcoholic extract)
SAJFM Volume 1 Issue 4, August 2010
MIDDLE EAST JOURNAL OF FAMILY MEDICINE • VOLUME 7 , ISSUE 10 �
ORIGINAL CONTRIBUTION AND CLINICAL INVESTIGATION
MIDDLE EAST JOURNAL OF FAMILY MEDICINE VOLUME 8 ISSUE 3
South Asia Journal of Family Medicine
7 SAJFM Volume 1 Issue 2, June 2010 SAJFM Volume 1 Issue 3, July 2010
Figure 1: Agarose gel electrophoresis of E.coli O157:H7 isolate 4 DNA
Table 2: (Curing percentage of plasmid DNA of E.coli O157 H7 isolates by Q.infectoria Extracts at 1.25mg/ml for aqueous extracts a and 2.5mg/ml for alcoholic extract)
medicines for the treatment of E.coli O157:H7 infection (23) and Kaur et al. (24) reported the antioxidant activity of ethanolic extract of Q.infectoria galls which was found to contain a large amount of polyphenol and posses a potent reducing power. In addition, it had an ability to prevent the production of some inflammatory mediators (17). Umachigi et al. (25) showed the estimation of antioxidant enzymes and revealed that the
extract significantly increased the levels of superoxide dismutase and catalase, the two powerful antioxidant enzymes of the body that are known to quench superoxide radicals. Hamasalih (10) reported that both aqueous and alcoholic extracts gave a positive inhibitory result in vivo for P.aeroginosa. Table 3 showed phytochemical screening of plants in this study including aqueous and ethanolic extract of Q infectoria
yielded positive results for tannins, phenols, saponins and resins but glycosides and flavonoids absent in both extracts). The same compounds were extracted by (18) and P.farcta which contains saponins, resins and phenols in aqueous extract while alcoholic extract contains flavonoids, saponins phenols and tannins. These results were the same as Harzallah-Shihri and Janet (26). In addition, P.farcta contains alkaloids (27).
( - ) = absent ( + ) = presentTable 3 : Phytochemical screening of plants used in the study
SAJFM Volume 1 Issue 4, August 2010

MIDDLE EAST JOURNAL OF FAMILY MEDICINE • VOLUME 7 , ISSUE 10�
ORIGINAL CONTRIBUTION AND CLINICAL INVESTIGATION
MIDDLE EAST JOURNAL OF FAMILY MEDICINE VOLUME 8 ISSUE 3
South Asia Journal of Family Medicine
8 SAJFM Volume 1 Issue 2, June 2010 SAJFM Volume 1 Issue 3, July 2010
The minimum inhibition concentration (MIC) and minimum bactericidal concentration (MBC) of P.farcta aqueous and alcoholic extract was 2.5, 5 mg/ ml and 5, 10 mg/ ml, respectively for E.coli polyvalent I while MIC values of aqueous and alcoholic against E.coli polyvalent II, III, and IV were 5, 5, 2.5 mg/ ml and 5mg/ ml respectively and MBC value of aqueous extract were 10mg/ml and 10mg/ml value of alcoholic extract. The MIC and MBC of aqueous extract against S.dysenteriae, S.arizonae, S. typhi and V.cholerae were 2.5, 5, 5, 2.5 and 5, 10, 10, 5 mg/ ml respectively while MIC and MBC for the alcohol extract were 2.5, 5, 2.5, 5 mg/ ml and 5, 20, 5, 10 mg/ ml, respectively. The inhibitory effect of Julifloricine on Gram-negative bacteria such as the species of Salmonella, Shigella, and Klebsiella, Proteus, Pseudomonas, Enterobacter, Aeromonas and Vibrio was almost insignificant (28). Prosopis juliflora was used in Guatemala for the treatment of gonorrhea which appeared most active against Neisseria gonorrhea isolates from symptomatic patients (29). Mahasneh et al. (30) reported petroleum ether, methanol, hexane, butanol and aqueous crude extracts of the whole aerial parts of Prosopis farcta and others exhibited variable degrees of antimicrobial activity against four bacterial and two fungal species compared with that exerted by antibiotics. Aqueous and alcoholic extracts show some antibacterial activity, but the antibiotic and antifungal activity appears unimportant (27). The variation in MIC and MBC in the present study with other similar studies may be due to the method of extraction of medicinal plants, method of antibacterial study, genetic variation of plants, age of plants, variations of the concentration of chemical compounds between species or the environment (31). Prosopis spp. contain harman, prosopine, tyramin and prosopinine (28). These compounds are called alkaloids attributed to their ability to intercalate with DNA (8). On the other hand, the Prosopis spp. have caffeic acid derivative (26) which have activities against viruses, bacteria and fungi
(8) as well as containing quercetien 3-o-glucoside and quercetin 3-o-galactoside (26) which had the ability to bind with extra cellular and soluble proteins and to complex bacterial cell walls. More lipophilic flavonoids may also disrupt microbial membranes (8). Shin et al. (32) reported that flavonoids (quercetin and naringenin) are the main constituents of herbal medicines which have inhibited the growth of Helicobacter pylori. Our results demonstrate that the alcoholic and aqueous extracts of P.farcta displayed antimicrobial activity against all isolates and may thus be a source that could be useful in the treatment of infections caused by these organisms. During the last two decades, pharmacological industries have produced a number of antimicrobial agents due to an increasing development of drug resistance for pathogenic microorganisms as well as the appearance of undesirable side effects of certain antibiotics and the emergence of previously uncommon infections. In general, bacteria have the genetic ability to transmit and acquire resistance to drugs which are utilized as therapeutic agents (33). Curing means elimination of the plasmid that carries antibiotic resistance genes, by plant extracts. In this study, 19 types of antibiotics were used against E.coli O157:H7 isolates revealing its resistance to 17 antibiotics. For this reason, Q.infectoria extracts (aqueous and alcoholic) was used as curing agents to eliminate antibiotic resistance genes. The selection of this plant was based on the information gathered from ethnopharmocologists, herbal drug sellers and rural native healers who previously reported it to have antimicrobial activity against different bacterial strains. The results of Table 2 show the effect of using plant extract to decrease resistance to antibiotics on some genes. The curing percentages of aqueous Q.infectoria to Cef, Nal, Nit, Rif, and Sm were 100 %. As for Amk, Amc, Aug, Amp, Cep, Cex, Cm, Cip, Do, Ery, Gm, Tc, To and Tm were 27, 7, 40, 30, 35, 34, 40, 34, 45, 44, 43, 25, 45, and 42 respectively while curing percentages of alcoholic Q.infectoria to Aug, Cex, Cef, Do, Nal, Nit, Rif,
To and Tm were 100% and for Amk, Amc, Amp, Cep, Cm, Cip, Ery, Gm, Sm and Tc were 45, 4, 33, 31, 32, 38, 10, 38, 12, and 35, respectively. Figure 1 proved the curing process where some bands disappeared after treatment with the aqueous and ethanolic extracts of Q.infectoria. The effect of tested medicinal plant extracts and acting as antimicrobial or curing effects for decreasing antibiotic resistance activity in E.coli O157:H7 isolate may be due to its containing active components such as phenols, tannins and alkaloids. The site (s) and number of hydroxyl group on the phenol group are thought to be related to their relative toxicity to microorganisms, with evidence that increased hydroxylation results increased toxicity. In addition some authors have found that more highly oxidized phenols have more inhibitory effect. The mechanisms mentioned may be responsible for phenolic toxicity to microorganisms including enzymes inhibition by the oxidized compounds possibly through reaction with sulfhydral groups or through more non-specific interactions with the proteins.(8).
Conclusion The chemical composition of the plant aqueous and ethanolic extracts revealed the presence or absence of phenols, alkaloids, flavonoids, tannins, saponins, resins and glycosides. The SMIC of medicinal plants (Q.infectoria) used in the current study affected the bacteria as curing agents on resistance genes and reduced the resistance to anti-microbial agents.
References 1. En Espanol. Digestive disorder, diarrhoea. University of Virginia Health System (Web site) pobox 800224, Charlottesville 2006.2. Schwartz, M.N.; Bell, L.M.; Bingham, P.M.;et al., The 5-Minute Pediatric. Consult. 4th Philadelphia, PA19106USA 2005; :26.3. Nelson, E.W.; Berhman, E.R.; Kligman, M.R.et al., Nelson Textbook of Paediatrics. 2004; 15th ed. Vol.1. W.B. Saunders, USA. pp. 935-1123.Bacteriol. Todar’s online textbook of Bacteriology 2005.
SAJFM Volume 1 Issue 4, August 2010
MIDDLE EAST JOURNAL OF FAMILY MEDICINE • VOLUME 7 , ISSUE 10 �
ORIGINAL CONTRIBUTION AND CLINICAL INVESTIGATION
MIDDLE EAST JOURNAL OF FAMILY MEDICINE VOLUME 8 ISSUE 3
South Asia Journal of Family Medicine
9 SAJFM Volume 1 Issue 2, June 2010 SAJFM Volume 1 Issue 3, July 2010
4. Todar, K. Salmonella and Salmonellosis, University of Wisconsin-Madison, Dept. Bacteriol. Todar’s online textbook of Bacteriology 2005.5. Sureshbabu, J.; MBS and MRCPCH. Shigella infection. Honcode principles of the health of the net foundation. Web MD 2006.6. Wikipedia Cholera, Wikipedia foundation, Inc. http://en.wikipedia.org/org/cholera 2008.7. Rouhonen, P. Other strains of E.coli, E.coli outbreak. Pritzker Law Firm 2008.8. Cowan, M.M.C Plant products as antimicrobial agents. Am. Soc. Microbiol. 1999; 12(4): 546-582.9. Jawetz, E.; Melnick, J.L.; Adelberg, E.A.; et al ; Medical Microbiology. 23rd ed. McGraw-Hill, USA 2004.10. Madigan, M.T.; Martinko, J.M. and Parker, J. Brock Biology of Microorganisms, 9th ed. Prentice-Hall, Inc.USA. 2000.11. Prescott, L.M.; Horley, J.P. and Klein, D.A. Microbiology, 5th ed. McGraw-Hill Company. Inc. USA. 2002.12. Hwang, J.K.; Kong, T.W.; Baek, N.I. et al ; ? -Glycosidase inhibitory activity of hexagalloylglucose from the galls of Quercus infectoria. Planta Med. J. 2000; 66: 273-274.13. Dar, M.S; Ikram, M. and Fakouh, T. Pharmacology of Quercus infectoria. J. Pharmacol. Soc. 1976; 65: 1791-1794 14. Hussein, G.H; Miyashiro, N.; Nakamura, N.; et al ; Inhibitory effect of Sudanese Medicinal plant extracts on hepatitis C virus protease. Phytotherap. Res. 2000; 14: 510-516.15. Basri, D.F. and Fan, S.H. The potential of aqueous and acetone extracts of galls of Quercus infectoria as antibacterial agents. Ind. J. Pharmacol. 2005; 37(1): 26-29.16. Redwane, A.; Lazrek, H.B.and Bouallam, S. Larvicidal activity of extract from Quercus lusitania var. infectoria galls (olive). J. Ethnopharmacol. 2002; 79: 261-263.nfectoria as antibacterial agents. Ind. J. Pharmacol. 37(1): 26-29.17. Kaur, G.; Hamid, H.; Ali, A.; et al; Anti inflammatory evaluation of alcoholic extract of Q.infectoria. J. Ethnopharmacol. 2004; 90: 285-292.
18. Pengelly, A. Constituents of medicinal plants, an Introduction to the chemistry and therapeutics of medicine, 2nd ed. Sunflower Herbals Companies. India , 2007.19. Mekseepralard, C.; Boriboonkaset, S. and Kamkaen, N. Screening of antimicrobial activity of Kaempferia agulanga and Quercus infectoria against eight reference strain Microorganisms. Planta Med. 2007 : 73. (abstract).20. Voravuthikunchai, S.P.; Limsuwan, S. and Subhadhirasakul, S. Screening for medicinal plants with broad spectrum of antibacterial activity. 17th European Congress of Clinical Microbiology and Infectious Disease (ESCMID) ICC, Munich, Germany 2007.21. Voravuthikunchai, S.P.; Suwalak, S.P. and Supawita, T. Antibacterial activity of fractions of Q. infectoria (nut galls) against enterohemorrhagic E. coli 16th European Congress of Clin. Microbiol.Infectious Disease (ESCMID) Nice, France 2006.22. Nimri, L.F.; Megdam, M.M. and Alkofahi, A. Antibacterial activity of Jordanian medicinal plants. Pharmaceutical Biol. (Formerly Interant. J. Pharmacognosy). 1999 ; 37(3): 196-201.23. Voravuthikunchai, S.; Lortheeranuwat, A.; Jeeju, W.; et al ; . Effective medicinal plants against enterohemorrhagic Escherichia coli O157:H7. J. Enteropharmacol. 2004; 94(1): 49-54.24. Kaur, G.I.; Athar, M. and Alam, M.S. Quercus infectoria galls possess antioxidant activity an d abrogates oxidative stress-induced functional alternations in Murine Macrophages. Chemicobiol. Interact. 2007 ; 171(3): 272-282.25. Umachigi, S.P.; Jayaveera, K.N.; Kumar, C.K.A.; et al ; Studies on wound healing properties of Quercus infectoria. Trop. J. Pharmaceut. Res. 2008 ; 7(1): 913-919.26. Harzallah-Shhiri, F.and Jannet, H.B.. Flavonoids Diversification in organs of two Prosopis farcta (Banks and sol). (Leguminosa, Mimosoida) population occurring in the Northeast and the Southeast of Tunisia. J. Appl. Sci. Res.2005; 1(2):130-136.
27. Pasieczniki, N.M.; Felker, P.; Harris, P.J.C.; et al ; . The Prosopis julifera - Prosopis pallida complex: A monograph. HDRA, Coventry, UK , 2001.28. Aqeel, A.K.; Khursheed, A.K.; Viqarnddin, A. et al ; . Antimicrobial activity of Julifloricine isolated from Prosopis juliflora. Arzneimittel-Forschung. 1989 ; 39(6): 652-655.29. Cuceres, A.; Menedez, H.; Mendez, E.; et al ;.Antigonorrhoeal activity of plants used in Guatemala for treatment of sexually transmitted disease. J. Ethnopharmacol. 1995 ; 48(2): 85-88.30. Mahasneh, A.M.; Abbas, J.A. and El-Oqlah, A.A. Antimicrobial activity of extracts of herbal plants used in the traditional medicine of Bahrain. Wiley Inter. Sci. J. 1996 ; 10(3): 251-253.31. Salah, H.F. Effect of some medicinal plant extracts on antibiotic resistance by plasmid of Escherichia coli isolated from different sources. M.Sc. Thesis, College of Education, University of Salahaddin , 2007.32. Shin, J.E.; Kim, J.E.; Bae, E.A.; et al ; . In vitro inhibitory effect of flavonoids on growth, infection and vacuolation of Helicobacter pylori. Plant. Med. 2005 ; 71(3): 197-201.33. Ibrahim, M.; Khan, A.A.; Habeeb, M.A.; et al ;. Antibacterial activity of Sapindus mukorossi and Rheum edmodi extract against Helicobacter pylori, two Gram-positive bacteria (Staphylococcus aureus and Bacillus subtilis), and two Gram-negative bacteria (Escherichia coli and Proteus vulgaris): In vitro and in vivo studies. World J. Gastroenterol., 2006 ; 12 (44): 7136-7142.
SAJFM Volume 1 Issue 4, August 2010
MIDDLE EAST JOURNAL OF FAMILY MEDICINE • VOLUME 7 , ISSUE 10�0
ORIGINAL CONTRIBUTION AND CLINICAL INVESTIGATION
MIDDLE EAST JOURNAL OF FAMILY MEDICINE VOLUME 8 ISSUE 3
South Asia Journal of Family Medicine
10 SAJFM Volume 1 Issue 2, June 2010 SAJFM Volume 1 Issue 3, July 2010
Tobacco Prevalence among Health Sciences College Students (HSC) : Riyadh, Saudi Arabia
Khalid M. Almutairi, Ph. D.
Head of Emergency Medical Services DepartmentRiyadh College of Health SciencesKing Saud University
Email: [email protected]
Introduction Tobacco use is a major public health concern and has been identified as the single most important cause of preventable mortality and morbidity worldwide. (1) In the United States, estimates have shown that directly or indirectly, tobacco causes more than 400,000 deaths annually, a figure that represents nearly 20 % of all U.S. deaths. (2)
According to a study published by the British Medical Journal, the rate of tobacco-related mortality throughout the entire developed world also averages about 20 percent of all deaths.(3)World Health Organization (WHO) estimated that five million each year will die from tobacco related causes by the end of 2010. Half of those who will die will be in their productive period of middle age (35-69 Years).(4) However, this number will increase to more than 10 million by 2020, and 70.0% of these deaths will occur in developing countries.(5)
A fifth of the world’s population is Muslim and most Muslims live in areas where the prevalence of smoking is high and often increasing.(6) In Arabic countries (Egypt, Tunis, Jordan, and Syria) the overall prevalence of smoking is estimated at almost 30.0%.(7) Sheesha is one of the most popular forms of tobacco delivery used in the Middle East.(8) However, Sheesha smoking (also known as water-pipe smoking, hubble-bubble, argila and hookah) has old traditions and is widely used in the Middle East.(9)
In Saudi Arabia, cigarette smoking is widespread and increasing, despite the country being neither a tobacco grower nor cigarette manufacturer.(10) While there has been no national study explaining the prevalence of smoking in Saudi
ABSTRACT Objective: This paper examines prevalence of tobacco use and influences of personal, social, environmental factors, and knowledge on use among Riyadh Health Sciences College students.
Methods:A survey questionnaire was distributed to a random sample of male and female students selected from Riyadh Health Sciences College. A total of 939 students aged 19 - 25 completed the survey.
Results:About one third (32.7%) of male and 6% of female students indicated that they currently smoked cigarettes. Twenty nine percent of male students and 5.6% of female students smoked sheesha. Almost a third (29%) of the male students and 7.6% of female students had tried smoking before age of 17. More than half of the students reported that their friends smoked. About a quarter (26.9%) of students reported smoking a whole packet of cigarettes a day, and 29.5% of smokers reported having tried quitting smoking. Parents, peers, and knowledge about the dangers of tobacco were the most significant factors affecting smoking behavior.
Around 86.0% of smokers were found to have more knowledge about the harm of tobacco use.
Conclusion This paper builds on other studies that have found that tobacco use among youth in Saudi Arabia is a common phenomenon. The consistent research results showing tobacco use among youth in Saudi Arabia reflects a need for continued monitoring of the behavior and the need for intervention to change this behavior. This study examines tobacco use among young people in Saudi Arabia and examines factors that can be addressed to reduce initiation and continued use of tobacco among young people in the country.
Our findings highlight the need for smoking control interventions aimed at young people. Smoking is a major, yet preventable cause of morbidity and mortality.
SAJFM Volume 1 Issue 4, August 2010
MIDDLE EAST JOURNAL OF FAMILY MEDICINE • VOLUME 7 , ISSUE 10 ��
ORIGINAL CONTRIBUTION AND CLINICAL INVESTIGATION
MIDDLE EAST JOURNAL OF FAMILY MEDICINE VOLUME 8 ISSUE 3
South Asia Journal of Family Medicine
11 SAJFM Volume 1 Issue 2, June 2010 SAJFM Volume 1 Issue 3, July 2010
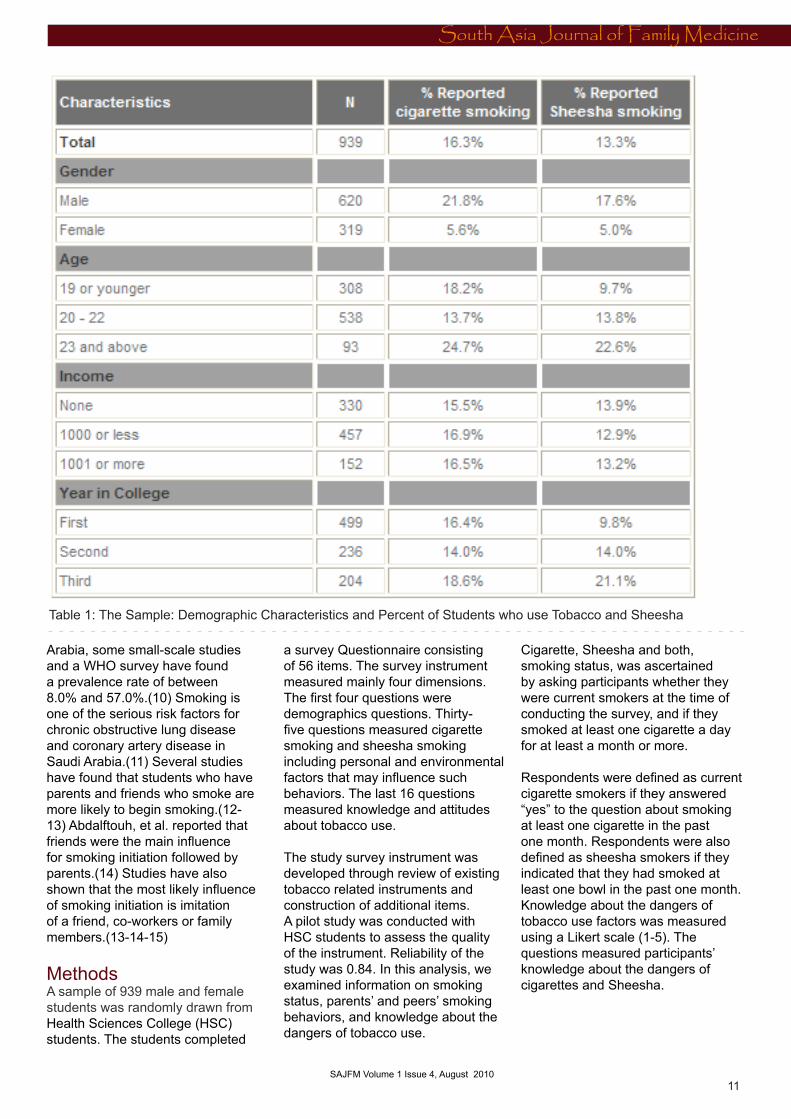
Table 1: The Sample: Demographic Characteristics and Percent of Students who use Tobacco and Sheesha
Arabia, some small-scale studies and a WHO survey have found a prevalence rate of between 8.0% and 57.0%.(10) Smoking is one of the serious risk factors for chronic obstructive lung disease and coronary artery disease in Saudi Arabia.(11) Several studies have found that students who have parents and friends who smoke are more likely to begin smoking.(12-13) Abdalftouh, et al. reported that friends were the main influence for smoking initiation followed by parents.(14) Studies have also shown that the most likely influence of smoking initiation is imitation of a friend, co-workers or family members.(13-14-15)
MethodsA sample of 939 male and female students was randomly drawn from Health Sciences College (HSC) students. The students completed
a survey Questionnaire consisting of 56 items. The survey instrument measured mainly four dimensions. The first four questions were demographics questions. Thirty-five questions measured cigarette smoking and sheesha smoking including personal and environmental factors that may influence such behaviors. The last 16 questions measured knowledge and attitudes about tobacco use.
The study survey instrument was developed through review of existing tobacco related instruments and construction of additional items. A pilot study was conducted with HSC students to assess the quality of the instrument. Reliability of the study was 0.84. In this analysis, we examined information on smoking status, parents’ and peers’ smoking behaviors, and knowledge about the dangers of tobacco use.
Cigarette, Sheesha and both, smoking status, was ascertained by asking participants whether they were current smokers at the time of conducting the survey, and if they smoked at least one cigarette a day for at least a month or more.
Respondents were defined as current cigarette smokers if they answered “yes” to the question about smoking at least one cigarette in the past one month. Respondents were also defined as sheesha smokers if they indicated that they had smoked at least one bowl in the past one month. Knowledge about the dangers of tobacco use factors was measured using a Likert scale (1-5). The questions measured participants’ knowledge about the dangers of cigarettes and Sheesha.
SAJFM Volume 1 Issue 4, August 2010

MIDDLE EAST JOURNAL OF FAMILY MEDICINE • VOLUME 7 , ISSUE 10�� MIDDLE EAST JOURNAL OF FAMILY MEDICINE VOLUME 8 ISSUE 3
South Asia Journal of Family Medicine
12 SAJFM Volume 1 Issue 2, June 2010 SAJFM Volume 1 Issue 3, July 2010
Statistical Analysis Data was analyzed using SPSS (version 15). Missing values were excluded from each analysis. Descriptive statistics from the analysis are presented in Table 1 (previous page) including the percentage of students who reported smoking cigarettes and sheesha. Logistic regression was used to assess the relationship between students’ smoking behavior and environmental and personal factors.
Results Nine hundred and thirty nine students completed the questionnaire. After assessing the data from the survey, all 939 were used in the analysis.
Smoking and AgeDescriptive statistics show that 28.7% of males and 7.6% of females tried smoking cigarettes before that age of 17. Almost 13.0% of both male and female students tried smoking before age 13 while 8.1% became regular smokers when they were between 14-17 years old. The majority of smokers (30.3%) didn’t begin smoking until they were 18 years old and older (43.5% of males and 4.7% of female). Almost 37.1% of students reported that smoking among friends was generally acceptable (31.9% of males and 5.2% of females).
Cigarette Smoking:This study uses the U.S Center for Diseases Control and Prevention Youth Risk Behavior Survey definition of a cigarette smoker: a cigarette smoker is someone who smoked cigarettes at least once in the last one month. (15) Almost 33.0% of males and 6.0% of females smoked cigarettes, 30.0% of males and 5.6% of females smoked Sheesha.
Sheesha Smoking:Sheesha smokers were defined as students who smoked at least one bowl of sheesha a day at least once in the last one month. Descriptive results show that almost 30.0% of males and 5.6% of females were sheesha smokers.
Logistic Regression Analysis Logistic regression analysis was used to examine the factors that may influence cigarette smoking and sheesha smoking among the students. These factors include peers’ smoking behavior, parents’ smoking behavior, and knowledge of the danger of smoking and smoke-free rules in their homes. The model also includes demographic factors such as gender, income, education level and age. (see next page)
Conclusion This study examined smoking behavior among students in HSC. This study examined cigarette and sheesha smoking behaviors among students with a focus on factors that influence the behaviors. It examined the influence of parents’ and peers’ smoking behavior, and knowledge about the dangers of tobacco use in influencing students’ smoking behavior in Saudi Arabia. The results show that cigarettes smoking is prevalent among students with higher rates reported among male students (32.7%) compared to female students (6%). Similarly, male students (29.3%) were more likely to smoke sheesha than females (5.6%).
The prevalence of smoking found in this study was higher than those reported elsewhere in students in Saudi Arabia (Al-Yousaf and Karim, 2001; Siddiqui and Ogbeide, 2001; Almutairi, 2004). (16-17-19) The actual prevalence may be higher than what was reported in this study. Students were more likely to engage in survey satisfiying(?) as smoking in Saudi Arabia has been banned by government on religious principles since 1962. To appear to be in conformity with religious, cultural, and social norms, most students may have been discouraged from reporting their smoking habits (Siddiqui, Ogbeide, and Al Khalifa, 2000). (20)
A number of studies have investigated factors that may influence young people’s tobacco use behavior. Most studies have identified parental and peer behavior,
and attitudes toward smoking, and knowledge about the dangers of tobacco use as risk factors for tobacco use among young people (Hameed et al., 2002; Bahr et al., 1993; Newman and Ward, 1989; Almas et al., 2002; Ma et al., 2002; Koenig et al., 1998; Sugathan et al., 1998; Moody et al., 1999; Memom et al., 2000; Siddiqui, Ogbeide, and Al Khalifa, 2000; Saeed, Khoja, and Khan, 1996; Saeed, Al-Johali, and Al-Shahry, 1993; Al-Faris, Al-Rajhi, and Al-Nour, 1995; Al-Yousaf, and Karim, 2001). (16-17-19-20-21-22-22-24-25-27-28-29-31-30-32) In this study we explored these factors that may influence smoking among college students in Saudi Arabia.
Parents’ Smoking BehaviourLogistic regression results have shown that there is a significant relationship between parents’ smoking behavior and students’ smoking behavior. Students who reported that their parents smoked were more likely to smoke than those whose parents did not smoke. These results suggest the need to target parental smoking behavior as one of the intervention measures to prevent youth smoking. In developing educational and media intervention programs to prevent smoking among young people, it is important to target the students as well as their parents. Parental smoking behavior sets a clear standard about tobacco use and may be an important predicator of student’s intentions to smoke (Eiser, Morhan, Gammage, and Gary, 1989).(33) Therefore, programs developed to prevent and reduce tobacco use by young people that also target parents’ behavior including smoking in the presence of their children are needed. It is also important that parents begin to talk to their children about smoking to make sure their children know of their disapproval (Newman and Ward, 1989).(22)
Peers’ Smoking BehaviourThe influence of peers’ smoking behavior has been well documented (Abolfotouh et al., 1998; Al-Faris, Al-Rajhi, and Al-Nour, 1995; Al-Yousaf, and Karim, 2001; Jarallah et al., 1999; Memon et al., 2000; Moody et
SAJFM Volume 1 Issue 4, August 2010
MIDDLE EAST JOURNAL OF FAMILY MEDICINE • VOLUME 7 , ISSUE 10 ��
ORIGINAL CONTRIBUTION AND CLINICAL INVESTIGATION
MIDDLE EAST JOURNAL OF FAMILY MEDICINE VOLUME 8 ISSUE 3
South Asia Journal of Family Medicine
13 SAJFM Volume 1 Issue 2, June 2010 SAJFM Volume 1 Issue 3, July 2010
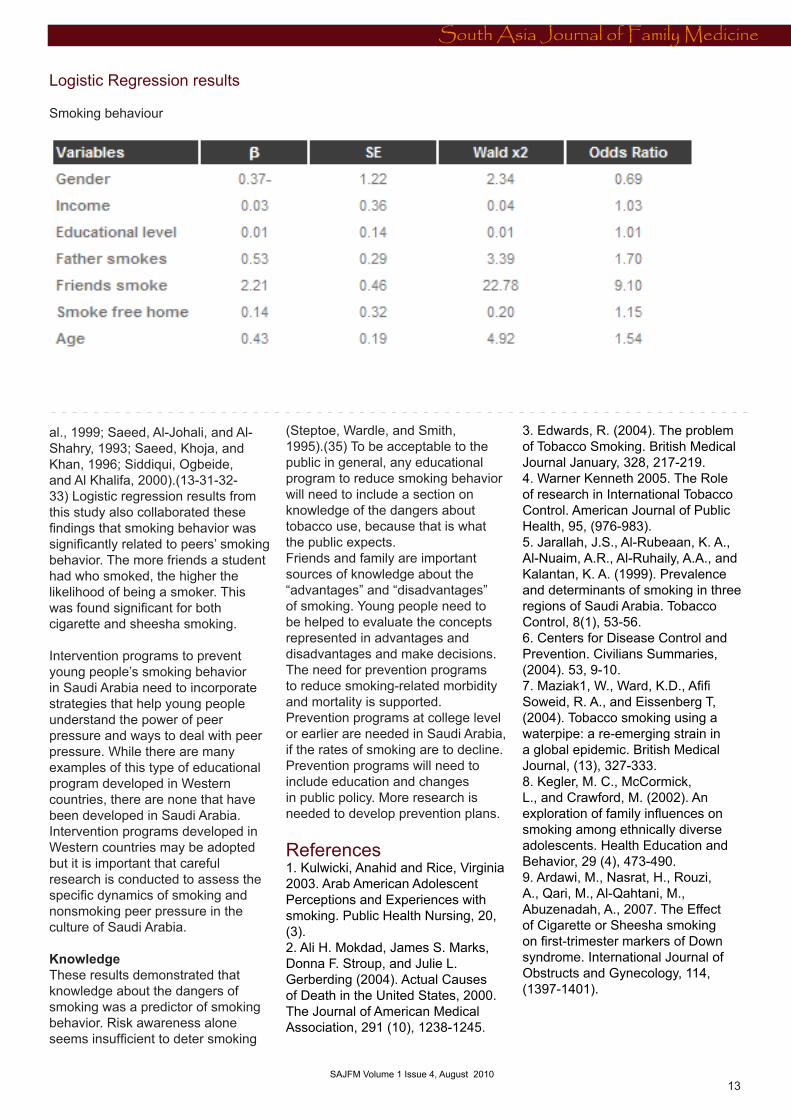
Logistic Regression results
Smoking behaviour
al., 1999; Saeed, Al-Johali, and Al-Shahry, 1993; Saeed, Khoja, and Khan, 1996; Siddiqui, Ogbeide, and Al Khalifa, 2000).(13-31-32-33) Logistic regression results from this study also collaborated these findings that smoking behavior was significantly related to peers’ smoking behavior. The more friends a student had who smoked, the higher the likelihood of being a smoker. This was found significant for both cigarette and sheesha smoking.
Intervention programs to prevent young people’s smoking behavior in Saudi Arabia need to incorporate strategies that help young people understand the power of peer pressure and ways to deal with peer pressure. While there are many examples of this type of educational program developed in Western countries, there are none that have been developed in Saudi Arabia. Intervention programs developed in Western countries may be adopted but it is important that careful research is conducted to assess the specific dynamics of smoking and nonsmoking peer pressure in the culture of Saudi Arabia.
KnowledgeThese results demonstrated that knowledge about the dangers of smoking was a predictor of smoking behavior. Risk awareness alone seems insufficient to deter smoking
(Steptoe, Wardle, and Smith, 1995).(35) To be acceptable to the public in general, any educational program to reduce smoking behavior will need to include a section on knowledge of the dangers about tobacco use, because that is what the public expects.Friends and family are important sources of knowledge about the “advantages” and “disadvantages” of smoking. Young people need to be helped to evaluate the concepts represented in advantages and disadvantages and make decisions.The need for prevention programs to reduce smoking-related morbidity and mortality is supported. Prevention programs at college level or earlier are needed in Saudi Arabia, if the rates of smoking are to decline. Prevention programs will need to include education and changes in public policy. More research is needed to develop prevention plans.
References 1. Kulwicki, Anahid and Rice, Virginia 2003. Arab American Adolescent Perceptions and Experiences with smoking. Public Health Nursing, 20, (3).2. Ali H. Mokdad, James S. Marks, Donna F. Stroup, and Julie L. Gerberding (2004). Actual Causes of Death in the United States, 2000. The Journal of American Medical Association, 291 (10), 1238-1245.
3. Edwards, R. (2004). The problem of Tobacco Smoking. British Medical Journal January, 328, 217-219. 4. Warner Kenneth 2005. The Role of research in International Tobacco Control. American Journal of Public Health, 95, (976-983).5. Jarallah, J.S., Al-Rubeaan, K. A., Al-Nuaim, A.R., Al-Ruhaily, A.A., and Kalantan, K. A. (1999). Prevalence and determinants of smoking in three regions of Saudi Arabia. Tobacco Control, 8(1), 53-56.6. Centers for Disease Control and Prevention. Civilians Summaries, (2004). 53, 9-10.7. Maziak1, W., Ward, K.D., Afifi Soweid, R. A., and Eissenberg T, (2004). Tobacco smoking using a waterpipe: a re-emerging strain in a global epidemic. British Medical Journal, (13), 327-333. 8. Kegler, M. C., McCormick, L., and Crawford, M. (2002). An exploration of family influences on smoking among ethnically diverse adolescents. Health Education and Behavior, 29 (4), 473-490.9. Ardawi, M., Nasrat, H., Rouzi, A., Qari, M., Al-Qahtani, M., Abuzenadah, A., 2007. The Effect of Cigarette or Sheesha smoking on first-trimester markers of Down syndrome. International Journal of Obstructs and Gynecology, 114, (1397-1401).
SAJFM Volume 1 Issue 4, August 2010

MIDDLE EAST JOURNAL OF FAMILY MEDICINE • VOLUME 7 , ISSUE 10��
ORIGINAL CONTRIBUTION AND CLINICAL INVESTIGATION
MIDDLE EAST JOURNAL OF FAMILY MEDICINE VOLUME 8 ISSUE 3
South Asia Journal of Family Medicine
14 SAJFM Volume 1 Issue 2, June 2010 SAJFM Volume 1 Issue 3, July 2010
10. Schultz, H., Ezzat, A., Allam, A., & Gary, A. (1996). Smoking and health: insights and recent developments. Annals of Saudi Medicine, 18 (1), 1-411. Sabra AA; Taha AZ; Al-Sebiany AM; Al-Kurashi NY; Al-Zubier AG (2007). Coronary heart disease risk factors: prevalence and behavior among male university students in Dammam City, Saudi Arabia. The Journal Of The Egyptian Public Health Association, 82 (1-2), 21-42.12. http://www.acde.org/common/Tobacco.htm2,2008.,,jkhgkhgvV91 No. 10 13. Chassine, L., Presson, C., Rose, J., Sherman, S. J., and Prost, J. (2002). Parental Smoking Cessation and adolescent smoking. Journal of Pediatric Psychology, 27 (6), 485-496.14. Abolfotouh, M.A., Abdel Aziz, M., Alakija, W., Al-Safy, A., Khattab, M. S., Mirdad, S., Al-Juhani, A. R., and Al-Humaidi, M. (1998). Smoking habit of king sang university students in Abha, Saudi Arabia. Annals of Saudi Medicine.18(3) 212-216.15. Friestad, C., and Klepp, K. I. (1997). Social Influences on the development of boys’ and girls’ smoking behavior. Journal of Gender, Culture, and Health, 4, 287-304.16. Omer, S. (200). Smoking in the Third World. World Health, 48 (4), 28-30.17. Al-Yousaf, M. A., and Karim, A. (2001). Prevalence of smoking among high school students. Saudi Medical Journal, 22(10),862-874.18. Siddiiqui, S., and Ogbeide, D. O. (2001). Profile of smoking amongst health staff in a primary care unit at a general hospital in Riyadh, Saudi Arabia. Saudi Medical Journal, 22(12), 1101-110419. Almutairi, K. (2004). Predicting smoking behavior among male Saudi Arabian college students. University of Nebraska.20. Siddiqu, S., Ogbeide, D. O., and Al Khalifa, I. (2000) Smoking in a Saudi Community: Prevalence, Influencing Factors, and Risk Perception. Family Medicine, 33(5), 367-370.21. Hameed, A., Jalil, M. A., Noreen, R., Mughal, I. and Rauf, S. (2002). Role of Islam in Prevention of Smoking. Journal of Ayub Medical College, 14 (1), 23-25.
22. Bahr, S., hawks, R and Wang, G. (1993). Family and religious influences on adolescent substance abuse. Youth and Society, 24(4), 443-465.23. Newman I. M, Ward, J.M. (1989). The influence of parental attitude and behavior on early adolescent cigarette smoking. Journal of School Health, 59(4), 150-152.24. Almas, K., Maroof, F., McAllister, C., and Freeman, R. (2002).Smoking behavior and knowledge in high school students in Riyadh and Belfast. Tropical Dental Journal 25(98), 40-44.25. Ma, G. X., Yin, Feeley, R. M., and Thomas, P. (2002). Perceived risks of certain types of cancer and heart among Asian American Smokers and non-smokers. Journal of Community Health, 27(4), 233-246.26. Koenig, H. G., George, L. K., and Cohen, H. J. (1998). The relationship between religious activities and cigarette smoking in older adults. Journal of Gerontology: Series A : Biological Sciences and Medical Sciences,53(6), 426-434.27. Sugathan, T. N., Moody, P. M., Al-Bustan, M. A., and El-Gerges, N. S. (1998). Age patterns of smoking initiation among Kuwait university male students. Social Sciences and Medicine, 47(11):1855-8.28. Moody, P. M., Memon, A., Sugathan, T. N., El-Gerges, N.S.,and Al-Bustan, M.(1999). Factors associated with the imitation of smoking by Kuwaiti males. Journal of Substance Abuse, 10(4), 375-384.29. Memon, A., Moody, P., Sugathn, T., El-Gerges, N., Al-Bustan, M., and Al-Shatti, A. (2000) Epidemiology of smoking among Kuwaiti adults: prevalence, characteristics, and attitudes. Bulletin of the World Health organization, 78(11) 1306-1315.30. Saeed, A., Khoja, T., and Khan, S. (1996). Smoking behavior and attitudes among adult Saudi nationals in Riyadh, Saudi Arabia. Tobacco Control, 5,215-219.31. Seed A. A., Al-Johali, E.A., and Al-Shahry, A. H. (1993) Smoking habits of students in secondary health institutes in Riyadh City, Saudi Arabia. Journal of the Royal Society of Health. 113(3), 132-135.
32. Al-Faris, E. A., Al-Rajhi, M., and Al-Nour, M. (1995). Smoking among females attending a health center in Riyadh, Saudi Arabia. Annals of Saudi Medicine, 15(5)525-528.33. Eiser, J.R., Morgan, M., Gammage , P., and Gray, E. (1989). Adolescent smoking: Attitude, norms and parental influence. British Journal Social Psychology, 28, 193-2002.34. Jarallah, J.S., Al-Rubeaan, K. A., Al-Nuaim, A. R., Al-Ruhaily, A. A., and Kalantan, K. A. (1999). Prevalence and determinants of smoking in three regions of Saudi Arabia. Tobacco Control, 8(1), 53-56.35. Steptoe, A., Wardle, J., and Smith, H. (1995). Tobacco smoking in young adults from 21 European countries: association with attitudes and risk awareness. Addiction, 90, 571-582.
SAJFM Volume 1 Issue 4, August 2010

MIDDLE EAST JOURNAL OF FAMILY MEDICINE • VOLUME 7 , ISSUE 10 ��
ORIGINAL CONTRIBUTION AND CLINICAL INVESTIGATION
MIDDLE EAST JOURNAL OF FAMILY MEDICINE VOLUME 8 ISSUE 3
South Asia Journal of Family Medicine
15 SAJFM Volume 1 Issue 2, June 2010 SAJFM Volume 1 Issue 3, July 2010
Diabetic retinopathy
Dr. Almoutaz Alkhier Ahmed,
Pg Dip in DiabetesGuryat North Diabetes CenterSaudi Arabia Email: [email protected]
Introduction Diabetic retinopathy and diabetic macular oedema are the leading causes of blindness in the working age population of the developed world.(1) The increasing numbers of individuals with diabetes suggests that retinopathy will continue to be a major preventable challenge.
There is evidence that retinopathy begins to develop at least 7 years before the clinical onset of the disease.(2) The control of diabetes associated metabolic abnormalities (hyperglycaemia, hyperlipidaemia and hyperten-sion) have been identified as risk factors for retinopathy and their management has emerged as important tools in the improvement of this condition.(1)
Why screen? Diabetic retinopathy can progress to a sight-threatening stage with few symptoms.(3) Treatments are more effective at preventing than at reversing visual loss(4) while clinical outcomes are better if intervention is undertaken early, hence the need for screening.(5)
There are various screening methods and this varies regionally. It is mainly dependant on the local expertise and staff availability.(6,7) Screening for diabetic retinopathy has been shown to be cost-effective in health econom-ic terms(8-11) which has improved further by the use of modern screen-ing techniques with higher sensitivity and specificity.(6)
Methods of screening:1. Visual acuity and fundoscopy done by direct ophthalmoscopyVisual acuity testing should be done as a routine part of eye surveillance programs.(12) This method is com-monly used but its accuracy varies widely.(13) Also, it has poor sensitiv-ity of <50% to detect proliferative retinopathy.(14,15)
2. Fundus photography “ Mydriatic/non-mydriatic stereoscop-ic digital retinal imaging and colour fundal photography is a sensitive and specific method for screening and diagnosis of diabetic retinopathy.(16) “ Digital fundus photography provides an efficient and cost effective screen-ing method for diagnosing and clas-sifying diabetic retinopathy.(17) “ Single-field fundus photography helps to identify patients with retinop-athy for referral towards ophthalmic evaluation and management but it is not a substitute for a comprehensive ophthalmic examination.(18)
3. Fluorescein angiography It helps to identify the location or ex-tent of vascular involvement, differen-tiate IRMA from neovascularisation, determine the presence of clinically significant macular oedema, detect retinal ischemia in the presence of subtle neovascularisation and assist the ophthalmologist in planning laser treatment.
4. B-scan ultrasoundIt is useful in detecting retinal de-tachment, fibrovascular membrane formation and vitreous haemorrhage. It is used when biomicroscopy cannot be used or Fluorescein angiography is not tolerated and correlates well with their results.(19)
The NICE 2008 guideline(22) recom-mended performing eye screening at the time of diagnosis of diabetes and then repeating eye surveillance annually. It didn’t clearly differenti-ate between types of diabetes in its recommendations for screening nor did it recommend any age for the initiation of screening in patients with Type 1 diabetes.
The Canadian Diabetes Association 2008 guideline(23) differentiates be-tween Type 1 and Type 2 diabetes on the timing of initial screening. It rec-ommends initiating screening 5 years after diagnosis of Type 1 diabetes in all individuals >15 years of age and in all those with Type 2 diabetes at the time of diagnosis. The guideline didn’t make any recommendation for women with gestational diabetes.
Although most guidelines recom-mend at least annual screening, there is evidence that less frequent screening may be appropriate for patients with no retinopathy.(23-24)
Diabetic retinopathy classification and stagingIt is vital to screen and classify pa-tients with diabetes for diabetic retin-opathy as this was well documented in the Early Treatment of Diabetic Retinopathy Study (ETDRS) and the Diabetic Retinopathy study (DRS).
The screening for diabetic retinopa-thy should be carried out by retinal photography as it is proven to be the best modality to detect retinopathy with high sensitivity and specif-ity.(26,27) The classification of diabetic retin-opathy is developed from the Airlie House classification which is used in
SAJFM Volume 1 Issue 4, August 2010
MIDDLE EAST JOURNAL OF FAMILY MEDICINE • VOLUME 7 , ISSUE 10��
MEDICINE AND SOCIET Y
MIDDLE EAST JOURNAL OF FAMILY MEDICINE VOLUME 8 ISSUE 3
South Asia Journal of Family Medicine
16 SAJFM Volume 1 Issue 2, June 2010 SAJFM Volume 1 Issue 3, July 2010
the ETDRS in 1991, then the Royal College of Ophthalmologists had its revised form of this classification which is currently adopted by most countries (England, Wales & Ireland)(28) with some differences with other classifications (Scotland, American Academy of ophthalmology) mainly in the level of retinopathy and naming but all of them agree on the major 2 mechanisms of loss of vision:
A. Retinopathy with risk of new vessel formation. B. Maculopathy with risk of damage to central vision.
Summary of diabetic retinopathy changes
A. RetinopathyThis is graded into 2 categories according to the presence of new vessels formation as each has a different prognosis.
Non-proliferative diabetic retinopathy (NPDR) 1. Background (level R1) more common in type 2 diabetes with evidence of:- Microaneurysm: small round dots- Haemorrhages- Hard exudates: waxy yellow exudates
2. Pre-proliferative (level R2) characterised by:- Venous dilatation- Cotton wool spots: white fluffy lesions associated with nerve fibre ischaemia due to occlusion ofpre-capillary arterioles so seen only on posterior retina. - Deep dark flame shaped haemorrhages- Intra retinal microvascular abnormalities (IRMA): represent small shunts between arterioles and venules Background Retinopathy.
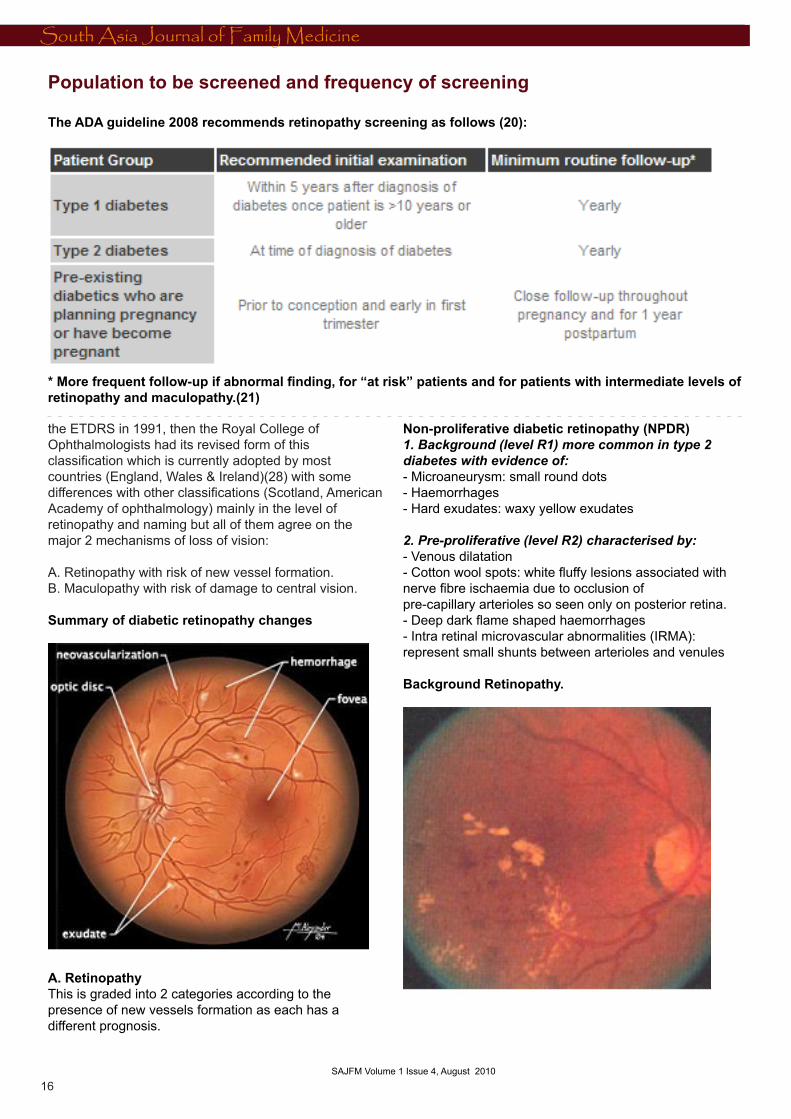
Population to be screened and frequency of screening
The ADA guideline 2008 recommends retinopathy screening as follows (20):
* More frequent follow-up if abnormal finding, for “at risk” patients and for patients with intermediate levels of retinopathy and maculopathy.(21)
SAJFM Volume 1 Issue 4, August 2010

MIDDLE EAST JOURNAL OF FAMILY MEDICINE • VOLUME 7 , ISSUE 10 ��
MEDICINE AND SOCIET Y
MIDDLE EAST JOURNAL OF FAMILY MEDICINE VOLUME 8 ISSUE 3
South Asia Journal of Family Medicine
17 SAJFM Volume 1 Issue 2, June 2010 SAJFM Volume 1 Issue 3, July 2010
Pre-proliferative Retinopathy
Proliferative diabetic retinopathy (PDR)
Characterized by new vessels formation at the disc or at 1 disc diameter or anywhere in the retina or presence of vitreous haemorrhage.
It is further divided according to severity into mild, moderate and severe according to area covered with new vessels.
Proliferative Retinopathy
B. Maculopathy
Visual loss from maculopathy results from macular oedema so it is classified into:
1. Focal exudative oedema2. Diffuse oedema3. Ischemic 4. Mixed
When maculopathy occurs within one disc diameter of the fovea it is termed as clinically significant macular edema (CSME)
Maculopathy
Evidence-based management of diabetic retinopathy in type 1 and type 2 diabetes
Evidence-based management of diabetic retinopathy in type 1 and type 2 diabetes
Standard Therapy
A- Normal or minimal NPDR: (see Table 1 next page) B- Mild to moderate NPDR (Background DR) without macular edema:
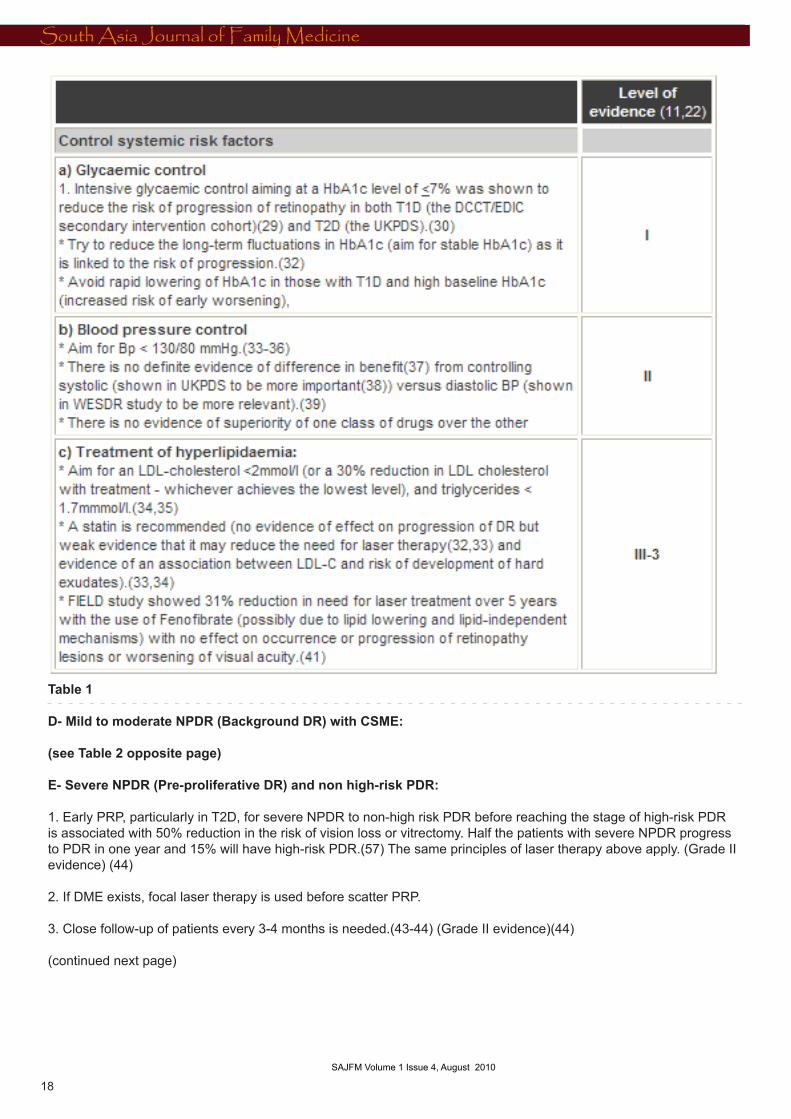
1- Control systemic risk factors
2- Follow up in 6-12 months(42-44)(grade IV evidence(44)).
C- Mild-moderate NPDR (Background DR) with macular oedema that is clinically insignificant: 1- Control systemic risk factors
2- Re-examine the patient in 3-6 months (increased risk of progression) (42-44)(grade II evidence) (44)
3- Consider pan-retinal laser photocoagulation (PRP) for those who are non-compliant and will be lost to follow up, have long duration of diabetes and are in poor metabolic control, and according to the status of the fellow eye. Weigh the benefit versus the risks (vision damage).(44)
SAJFM Volume 1 Issue 4, August 2010
MIDDLE EAST JOURNAL OF FAMILY MEDICINE • VOLUME 7 , ISSUE 10��
MEDICINE AND SOCIET Y
MIDDLE EAST JOURNAL OF FAMILY MEDICINE VOLUME 8 ISSUE 3
South Asia Journal of Family Medicine
18 SAJFM Volume 1 Issue 2, June 2010 SAJFM Volume 1 Issue 3, July 2010
Table 1 D- Mild to moderate NPDR (Background DR) with CSME:
(see Table 2 opposite page)
E- Severe NPDR (Pre-proliferative DR) and non high-risk PDR:
1. Early PRP, particularly in T2D, for severe NPDR to non-high risk PDR before reaching the stage of high-risk PDR is associated with 50% reduction in the risk of vision loss or vitrectomy. Half the patients with severe NPDR progress to PDR in one year and 15% will have high-risk PDR.(57) The same principles of laser therapy above apply. (Grade II evidence) (44)
2. If DME exists, focal laser therapy is used before scatter PRP.
3. Close follow-up of patients every 3-4 months is needed.(43-44) (Grade II evidence)(44)
(continued next page)
SAJFM Volume 1 Issue 4, August 2010
MIDDLE EAST JOURNAL OF FAMILY MEDICINE • VOLUME 7 , ISSUE 10 ��
MEDICINE AND SOCIET Y
MIDDLE EAST JOURNAL OF FAMILY MEDICINE VOLUME 8 ISSUE 3
South Asia Journal of Family Medicine
19 SAJFM Volume 1 Issue 2, June 2010 SAJFM Volume 1 Issue 3, July 2010
Recommendation Level of evidence (22)
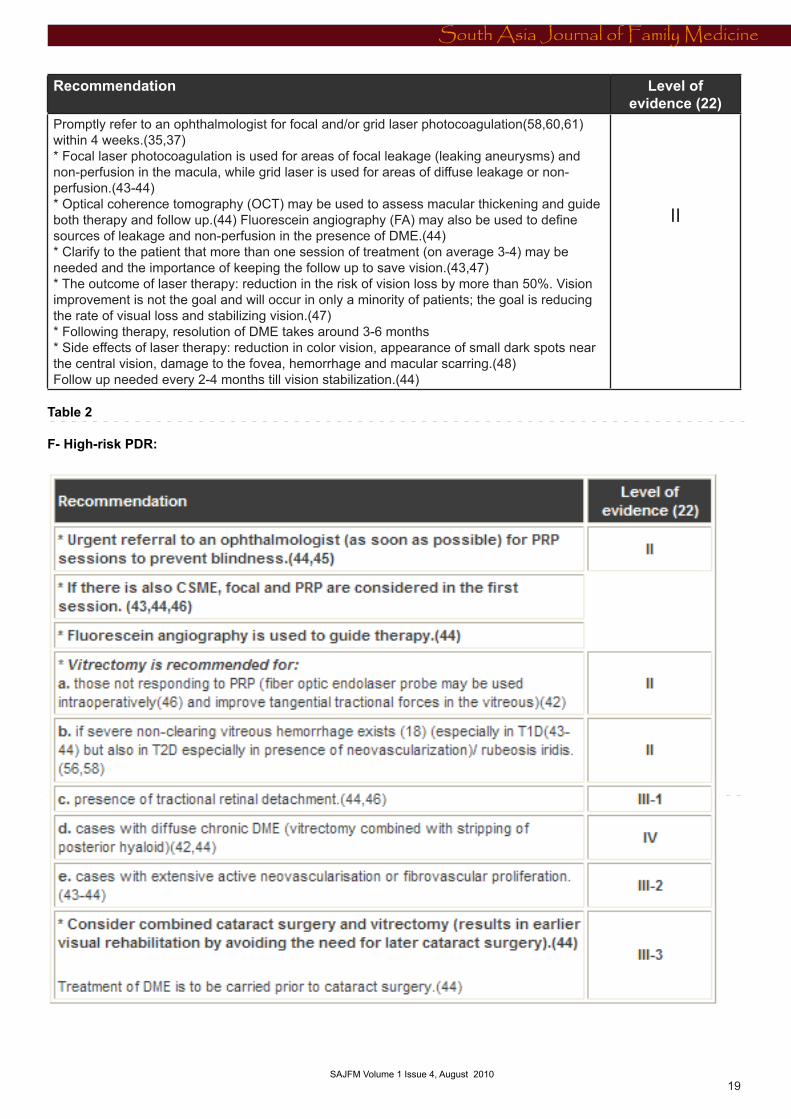
Promptly refer to an ophthalmologist for focal and/or grid laser photocoagulation(58,60,61) within 4 weeks.(35,37)* Focal laser photocoagulation is used for areas of focal leakage (leaking aneurysms) and non-perfusion in the macula, while grid laser is used for areas of diffuse leakage or non-perfusion.(43-44) * Optical coherence tomography (OCT) may be used to assess macular thickening and guide both therapy and follow up.(44) Fluorescein angiography (FA) may also be used to define sources of leakage and non-perfusion in the presence of DME.(44) * Clarify to the patient that more than one session of treatment (on average 3-4) may be needed and the importance of keeping the follow up to save vision.(43,47) * The outcome of laser therapy: reduction in the risk of vision loss by more than 50%. Vision improvement is not the goal and will occur in only a minority of patients; the goal is reducing the rate of visual loss and stabilizing vision.(47)* Following therapy, resolution of DME takes around 3-6 months* Side effects of laser therapy: reduction in color vision, appearance of small dark spots near the central vision, damage to the fovea, hemorrhage and macular scarring.(48)Follow up needed every 2-4 months till vision stabilization.(44)
II
Table 2
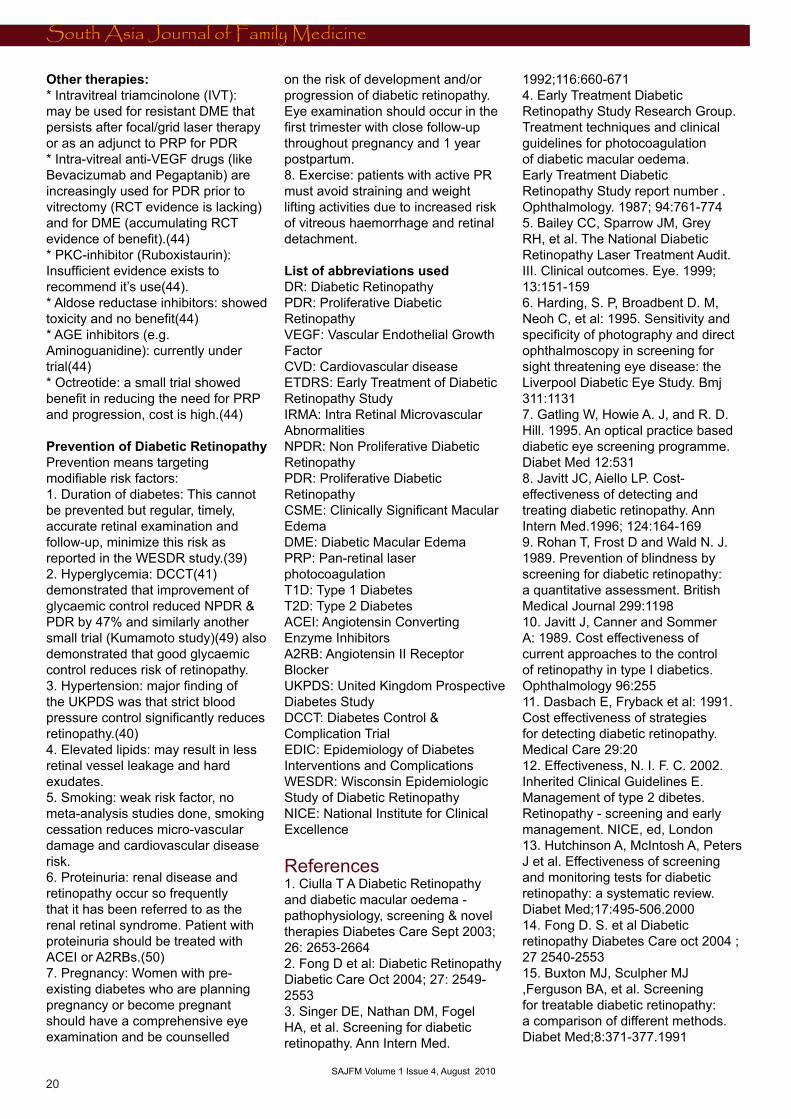
F- High-risk PDR:
SAJFM Volume 1 Issue 4, August 2010
MIDDLE EAST JOURNAL OF FAMILY MEDICINE • VOLUME 7 , ISSUE 10�0
South Asia Journal of Family Medicine
20 SAJFM Volume 1 Issue 2, June 2010 SAJFM Volume 1 Issue 3, July 2010
Other therapies:* Intravitreal triamcinolone (IVT): may be used for resistant DME that persists after focal/grid laser therapy or as an adjunct to PRP for PDR* Intra-vitreal anti-VEGF drugs (like Bevacizumab and Pegaptanib) are increasingly used for PDR prior to vitrectomy (RCT evidence is lacking) and for DME (accumulating RCT evidence of benefit).(44) * PKC-inhibitor (Ruboxistaurin): Insufficient evidence exists to recommend it’s use(44).* Aldose reductase inhibitors: showed toxicity and no benefit(44)* AGE inhibitors (e.g. Aminoguanidine): currently under trial(44)* Octreotide: a small trial showed benefit in reducing the need for PRP and progression, cost is high.(44)
Prevention of Diabetic RetinopathyPrevention means targeting modifiable risk factors:1. Duration of diabetes: This cannot be prevented but regular, timely, accurate retinal examination and follow-up, minimize this risk as reported in the WESDR study.(39)2. Hyperglycemia: DCCT(41) demonstrated that improvement of glycaemic control reduced NPDR & PDR by 47% and similarly another small trial (Kumamoto study)(49) also demonstrated that good glycaemic control reduces risk of retinopathy.3. Hypertension: major finding of the UKPDS was that strict blood pressure control significantly reduces retinopathy.(40)4. Elevated lipids: may result in less retinal vessel leakage and hard exudates.5. Smoking: weak risk factor, no meta-analysis studies done, smoking cessation reduces micro-vascular damage and cardiovascular disease risk.6. Proteinuria: renal disease and retinopathy occur so frequently that it has been referred to as the renal retinal syndrome. Patient with proteinuria should be treated with ACEI or A2RBs.(50)7. Pregnancy: Women with pre-existing diabetes who are planning pregnancy or become pregnant should have a comprehensive eye examination and be counselled
on the risk of development and/or progression of diabetic retinopathy. Eye examination should occur in the first trimester with close follow-up throughout pregnancy and 1 year postpartum.8. Exercise: patients with active PR must avoid straining and weight lifting activities due to increased risk of vitreous haemorrhage and retinal detachment.
List of abbreviations used DR: Diabetic RetinopathyPDR: Proliferative Diabetic RetinopathyVEGF: Vascular Endothelial Growth FactorCVD: Cardiovascular diseaseETDRS: Early Treatment of Diabetic Retinopathy StudyIRMA: Intra Retinal Microvascular AbnormalitiesNPDR: Non Proliferative Diabetic RetinopathyPDR: Proliferative Diabetic RetinopathyCSME: Clinically Significant Macular EdemaDME: Diabetic Macular EdemaPRP: Pan-retinal laser photocoagulationT1D: Type 1 DiabetesT2D: Type 2 DiabetesACEI: Angiotensin Converting Enzyme InhibitorsA2RB: Angiotensin II Receptor BlockerUKPDS: United Kingdom Prospective Diabetes StudyDCCT: Diabetes Control & Complication TrialEDIC: Epidemiology of Diabetes Interventions and ComplicationsWESDR: Wisconsin Epidemiologic Study of Diabetic RetinopathyNICE: National Institute for Clinical Excellence
References 1. Ciulla T A Diabetic Retinopathy and diabetic macular oedema -pathophysiology, screening & novel therapies Diabetes Care Sept 2003; 26: 2653-26642. Fong D et al: Diabetic Retinopathy Diabetic Care Oct 2004; 27: 2549-25533. Singer DE, Nathan DM, Fogel HA, et al. Screening for diabetic retinopathy. Ann Intern Med.
1992;116:660-671 4. Early Treatment Diabetic Retinopathy Study Research Group. Treatment techniques and clinical guidelines for photocoagulation of diabetic macular oedema. Early Treatment Diabetic Retinopathy Study report number . Ophthalmology. 1987; 94:761-7745. Bailey CC, Sparrow JM, Grey RH, et al. The National Diabetic Retinopathy Laser Treatment Audit. III. Clinical outcomes. Eye. 1999; 13:151-1596. Harding, S. P, Broadbent D. M, Neoh C, et al: 1995. Sensitivity and specificity of photography and direct ophthalmoscopy in screening for sight threatening eye disease: the Liverpool Diabetic Eye Study. Bmj 311:11317. Gatling W, Howie A. J, and R. D. Hill. 1995. An optical practice based diabetic eye screening programme. Diabet Med 12:5318. Javitt JC, Aiello LP. Cost-effectiveness of detecting and treating diabetic retinopathy. Ann Intern Med.1996; 124:164-1699. Rohan T, Frost D and Wald N. J. 1989. Prevention of blindness by screening for diabetic retinopathy: a quantitative assessment. British Medical Journal 299:119810. Javitt J, Canner and Sommer A: 1989. Cost effectiveness of current approaches to the control of retinopathy in type I diabetics. Ophthalmology 96:25511. Dasbach E, Fryback et al: 1991. Cost effectiveness of strategies for detecting diabetic retinopathy. Medical Care 29:2012. Effectiveness, N. I. F. C. 2002. Inherited Clinical Guidelines E. Management of type 2 dibetes. Retinopathy - screening and early management. NICE, ed, London13. Hutchinson A, McIntosh A, Peters J et al. Effectiveness of screening and monitoring tests for diabetic retinopathy: a systematic review. Diabet Med;17:495-506.200014. Fong D. S. et al Diabetic retinopathy Diabetes Care oct 2004 ; 27 2540-255315. Buxton MJ, Sculpher MJ ,Ferguson BA, et al. Screening for treatable diabetic retinopathy:a comparison of different methods. Diabet Med;8:371-377.1991
SAJFM Volume 1 Issue 4, August 2010
MIDDLE EAST JOURNAL OF FAMILY MEDICINE • VOLUME 7 , ISSUE 10 ��
South Asia Journal of Family Medicine
21 SAJFM Volume 1 Issue 2, June 2010 SAJFM Volume 1 Issue 3, July 2010
16. Ahmed J, Ward TP et al. The sensitivity and specificity of non - mydriatic digital stereoscopic retinal imaging in detecting diabetic retinopathy. Diabetes Care; 29:2205-2209.200617. Liesenfeld B. A telemedical approach to the screening of diabetic retinopathy: Digital fundus photography. Diabetes Care. 2000;23(3):345-34818. Williams GA, Scott IU et al. Single field fundus photography for diabetic retinopathy screening: a report by the American Academy of Ophthalmology .Ophthalmology 111:1055-62. 200419. Lai JC, Stinnett SS and Jaffe GJ. B-scan ultrasonography for the detection of macular thickening. Am J Ophthalmol 2003; 136(1): 55-6120. American Diabetes Association (ADA). Standards of medical care in diabetes. VI. Prevention and management of diabetes complications. Diabetes Care 2008 Jan; 31(Suppl 1):S24-33.21. Younis N, Broadbent D M, Harding S P. et al: 2003. Incidence of sight-threatening retinopathy in Type 1 diabetes in a systematic screening programme. Diabet Med 20:75822. Effectiveness, N. I. F. C. 2002. Inherited clinical guidelines E. Management of type 2 diabetes. Retinopathy - Screening and early management. NICE, ed, London23. Canadian Diabetes Association 2008 Clinical Practice Guidelines: http://www.diabetes.ca/for-professionals/resources/2008-cpg/24. Kohner E, Stratton S, Aldington J et al: 2001. Relationship between the severity of retinopathy and progression to photocoagulation in patients with Type 2 diabetes mellitus in the UKPDS (UKPDS 52). Diabet Med 18:17825. Early photocoagulation for diabetic retinopathy. ETDRS report number 9. Early Treatment Diabetic Retinopathy Study Research Group. Ophthalmology. 1991 May;98(5 Suppl):766-85.26. Hutchinson A, McIntosh A, Peters J et al: Effectiveness of screening and monitoring tests for diabetic retinopathy--a systematic review. Diabet Med. 2000 Jul;17(7):495-506.27. Lopez-Bastida J, Cabrera-Lopez F, Serrano-Aguilar P. Sensitivity and specificity of digital retinal imaging for
screening diabetic retinopathy. Diabet Med. 2007 Apr; 24(4): 403-7.28. Royal OC. Guidlenes od Diabetic Retinopathy. Royal College of Opthalmologist; 2005; Available from: http://www.rcophth.ac.uk/about/publications/#PubGuide 29. The Diabetes Control and Complications Trial/Epidemiology of Diabetes and Complications Research Group: Retinopathy and nephropathy in patients with type I diabetes four years after a trail of intensive therapy. N Engl J Med. 2000; 342:381-389. 30. The UKPDS study group. Intensive blood-glucose control with sulphonylureas or insulin compared with conventional treatment and risk of complications in patients with type 2 diabetes (UKPDS 33): U.K. Prospective Diabetes Study (UKPDS) Group. Lancet. 1998; 352:837-853. 31. Diabetes Control and Complications Trial/Epidemiology of Diabetes Interventions and Complications Research Group. Prolonged Effect of Intensive Therapy on the Risk of Retinopathy Complications in Patients With Type 1 Diabetes Mellitus: 10 Years After the Diabetes Control and Complications Trial. Arch Ophth 2008; 126(12): 1707-1715.32. Kilpatrick ES, Rigby AS and Atkin SL. A1C Variability and the Risk of Microvascular Complications in Type 1 Diabetes: data from the Diabetes Control and Complications Trial. Diabetes Care 2008; 31(11):2198-202. 33. ADA standards of medical care in diabetes. Diabetes Care 2009; 32 (Supplement 1): S13-S61.34. The All Wales consensus group. Management of adults with diabetes mellitus across Wales. March 2009; available at http://wales.gov.uk/dhss/publications/health/guidance/diabetesconsensus/diabetese.pdf?lang=en 35. NICE guidelines: Management of Type 2 Diabetes: National clinical guideline for management in primary and secondary care. 2008; available at http://www.nice.org.uk/nicemedia/pdf/CG66FullGuideline0509.pdf 36. Donaghue KC, Chiarelli F, Trotta D, Allgrove J, Dahl-Jorgensen K. ISPAD clinical practice guidelines: Microvascular and macrovascular complications associated with
diabetes in children and adolescents. Pediatric Diabetes 2009; 10 (Suppl. 12): 195-203. 37. Royal college of Ophthalmology guidelines for Diabetic Retinopathy. 2005; available at http://www.rcophth.ac.uk/docs/publications/publishedguidelines/DiabeticRetinopathyGuidelines2005.pdf38. Quresh M, Gillies MC and Wong TY. Management of diabetic retinopathy: A systematic review. JAMA 2007; 298(8): 902-916. 39. Klein R, Klein BE, Moss SE and Cruickshanks KJ: The Wisconsin Epidemiologic Study of Diabetic Retinopathy. XV. The long-term incidence of macular edema. Ophthalmology 1995; 102:7-16.40. The United Kingdom Prospective Diabetes Study Group: Tight blood pressure control and risk of macrovascular and microvascular complications in type 2 diabetes: United Kingdom Prospective Diabetes Study report no. 38. BMJ 1998; 317: 703-713.41. Keech AC, Mitchell P, Summanen PA, O’Day J et al. Effect of fenofibrate on the need for laser treatment for diabetic retinopathy (FIELD study): a randomized controlled trial. Lancet 2007; 370: 1687-1697.42. Fong DS, Aiello LP, Ferris III FL and Klein R. Diabetic retinopathy- technical review. Diabetes Care 2004; 27(10): 2540-2553.43. Chalam KV, Lin S and Mostafa S. Management of diabetic retinopathy in the twenty first century. Northeast Florida Medicine. 2005; 8-15.44. Australian government national health and medical research council. Guidelines for management of diabetic retinopathy. 2008; available at http://www.nhmrc.gov.au/_files_nhmrc/file/publications/synopses/di15.pdf45. ADA position statement. Retinopathy in diabetes. Diabetes Care 2004; 27(supplement 1): S84-S87.46. Ciulla TA, Amador Ag and Zinman B. Diabetic retinopathy and diabetic macular edema. Pathophysiology, screening and novel therapies. Diabetes Care 2003; 26(9): 2653-2664. (continued p 60)
SAJFM Volume 1 Issue 4, August 2010
MIDDLE EAST JOURNAL OF FAMILY MEDICINE • VOLUME 7 , ISSUE 10��
South Asia Journal of Family Medicine
22 SAJFM Volume 1 Issue 2, June 2010 SAJFM Volume 1 Issue 3, July 2010
Study of Refractive Errors among School Children in Doha, �00�
Dr. Asma Ali AL-Nuaimi, (�)Dr. Rasha Elsayed Salama (�)Dr. Izz Eldeen Eljack (�)
(1) Specialist in Community Medicine Hamad Medical CorporationDoha, QatarTel. +974/ Fax: +974/Cell phone: +974/5859053Email: aalnuaimi1@ hotmail.com
(2) (Salama RE, M.Sc., M.D.) Community Medicine LecturerTel. +974/4473215 Fax: +974/4473223Cell phone: +974/5973314Email: [email protected]
(3) Consultant in Community medicineCoordinator Community Medicine Department
ABSTRACT Objectives : This study was carried out to measure the prevalence of Refractive Errors among primary school children in Doha and to identify risk factors for Refractive Errors among them.
Methodology: This is a cross sectional study which was carried out through the year 2008 and targeted all school children registered in Doha primary schools from both genders. Multistage random sample was used. Primary sampling units are schools that were divided in strata according to gender. Secondary sampling units were classes and one class from each grade out of five classes has been selected for data. A total of 670 students was divided proportionately according to male and female schools and accordingly two schools were selected randomly for males and three schools for females. Each grade in schools have five classes, one was selected randomly from grade one, two, three, four, five and six
respectively for males and females. Data was collected by using questionnaire and optometric examination.
Results: The results of this study showed that the prevalence of RE was 19.7% among primary school children in Doha; myopic astigmatism was found to be the most prevalent type of RE, and visual acuity of 6/12 is the most frequent measure. There was an association between RE with gender and age and there were no associations between RE and the following: family income, family history of RE, having chronic diseases and physical activity.
Conclusion: The prevalence of RE was found to be high among primary school children in Doha, accounted to be (19.7%); Myopic astigmatism was found to be the most prevalent type of RE followed by myopia, hypermetropic astigmatism, astigmatism and finally hypermetropia and the visual
acuity of 6/12 is the most frequent measure, followed by visual acuity of 6/9. There was an association between RE and gender and age and there was no association between RE and the following: family income, family history of RE, having chronic diseases and physical activity.
SAJFM Volume 1 Issue 4, August 2010
MIDDLE EAST JOURNAL OF FAMILY MEDICINE • VOLUME 7 , ISSUE 10 ��
South Asia Journal of Family Medicine
23 SAJFM Volume 1 Issue 2, June 2010 SAJFM Volume 1 Issue 3, July 2010
1.1 Introduction 1.1 BackgroundBlindness and visual impairment are critical public health problems worldwide. Refractive errors (RE) are an emerging important cause of visual impairment and blindness that has been recognized only recently with the increasing use of presenting visual acuity for defining blindness. [1, 2]
RE is a health-related condition of the eye that causes visual impairment and may lead to blindness if not early detected and corrected [3, 4]. It is a disorder that occurs when parallel rays of light entering the non-accommodating eye are not focused on the retina.[3-8] RE is classified into three categories: myopia (nearsightedness) - this is difficulty in seeing distant objects clear, hyperopia also known as hypermetropia (farsightedness) - this is difficulty in seeing close objects clearly, and astigmatism - this is distorted vision resulting from an irregularly curved cornea.[6, 9-12]
RE is one of the most common determinants of visual impairment worldwide, particularly among children, and frequently remains undiagnosed for long periods. [6] Other diseases leading to blindness include trachoma and river blindness, which are prevalent primarily in less developed areas of the world. Three other eye conditions have emerged in many middle income and industrialized countries; these are diabetic retinopathy, glaucoma and Age-related macular degeneration. [1, 2]
Childhood visual impairment due to RE is a significant problem among school children and has a considerable impact on public health. [9]
Recent data suggest that a large number of people are blind in different parts of the world, due to high RE because they are not using appropriate refractive correction. [1]
The impact of blindness due to refractive error is considered in terms of blind-person-years, a person
becoming blind due to refractive error at a young age, and which is not corrected, would suffer many more years of blindness than a person becoming blind from cataract in old age and would place a greater socioeconomic burden on society. [9]
Visual impairment and Blindness due to refractive error can hinder education, personality development, and career opportunities, in addition to causing an economic burden on society. [1]
RE have been listed, along with cataract, trachoma, onchocerciasis and childhood blindness, among eye problems whose prevention and cure should provide enormous savings and facilitate societal development. [14, 15]
RE is multifactorial health condition. Risk factors include both genetic and environmental factors. [8, 9] Genetic factors include hereditary characteristics shared within family members while environmental factors represent the most common and modifiable determinants of RE. Near work is the major environmental risk factor for RE along with education, socioeconomic status, longer time watching television, playing computer games, age, gender and ethnicity.[6, 16-18]
RE can be detected through routine examination of patients who present to clinics, or through vision screening of the population at large. The former approach may work satisfactorily in developed countries, but the latter is necessary in developing countries because a large majority of the population does not have access to reasonable quality eye care services. Vision screening is most commonly carried out on schoolchildren, which is a valuable method of identifying potentially treatable ocular abnormalities, including blindness due to refractive errors. Community vision screening is another approach that involves door-to-door surveys by trained field workers to assess visual acuity and identify people with vision problems. [1]
RE is the most easily treatable cause of visual impairment following an appropriate refractive correction, such as spectacles, contact lenses, or refractive surgery. Spectacles are the most commonly used form of refractive correction since they are the most inexpensive and the simplest of the three options; as such, they are the most appropriate treatment for RE in developing countries. However, all three forms of treatment for RE are relatively easily available and more affordable to individuals in developed countries. [1, 19, 20]
Blindness due to refractive errors and visual impairment in any population suggests that eye care services in general are inadequate since treatment of RE is perhaps the simplest and most effective form of eye care. [1]
Due to increasing realization of the enormous need for correction of RE worldwide, RE has been considered one of the priorities of the recently launched global initiative for the elimination of avoidable blindness: VISION 2020 - The Right to Sight. [1, 16, 21]
1.2 Rationale* RE is a preventable health condition leading to blindness if not detected early and corrected. Blindness due to RE is a substantial public health problem worldwide. RE is among the most common determinants of visual impairment worldwide, particularly among children, and frequently remains undiagnosed for long periods.
* RE is prevalent in early years of life and the prevalence increases with age. Therefore, it is worthwhile to be detected early in order to decrease blind-person-years. Early detection provides the best opportunity for effective, inexpensive management.
* Visual impairment from uncorrected RE can have immediate, long-term consequences in children including lost educational, and employment opportunities, lost economic gain for individuals, families and societies, and impaired quality of life.
SAJFM Volume 1 Issue 4, August 2010
MIDDLE EAST JOURNAL OF FAMILY MEDICINE • VOLUME 7 , ISSUE 10��
South Asia Journal of Family Medicine
24 SAJFM Volume 1 Issue 2, June 2010 SAJFM Volume 1 Issue 3, July 2010
* Community based survey to determine the burden of RE will be useful to improve the provision of preventive services as well as eye care services.
* In Qatar RE is considered as an iceberg phenomenon that needs to be screened thoroughly to determine the size of the problem.
* Up to my recent knowledge there is no published data regarding community based studies addressing prevalence rate of RE among schoolchildren in Qatar.
1.3 AimTo study the burden of refractive errors among primary school children in Qatar
1.4 Specific Objectives:1- To measure the prevalence of Refractive Errors among primary school children in Doha2- To identify risk factors for Refractive Errors among primary school children in Doha.
2. Literature Review2.1 Historical backgroundVision is one of our most important senses that is a burdenwhen lost.However there are nearly 45 million people worldwide who are blind [22]. A further 135 million people are visually disabled, and are dependent on family and governmental support systems on a daily basis. These numbers are projected to double early this century as the population grows and will increase dramatically as policy-makers and health care providers recognize that even moderate vision loss severely limits many people from fulfilling their personal and economic potential. [23-25]
WHO records showed that the global profile of blindness and visual impairment is undergoing major changes. Most tropical eye diseases have been progressively fading out, mainly because of the improving socioeconomic situation and more recently because of significant expansion in infectious diseases control. Contrasting with this reduction in infectious eye
diseases, chronic non-communicable conditions associated with socio-demographic changes are on increase everywhere, while cataract remains the global leading cause of blindness despite impressive progresses in surgical services in many countries. Uncorrected RE is considered as one of the common causes of blindness as it is now recognized as the second cause, followed by glaucoma. RE is now becoming a major problem in Asia, Middle East and Latin America. Despite a rapidly increasing demand, low vision services are dramatically lacking in most countries. [23, 25]
Large number of people are blind in different parts of the world due to high RE because they are not using appropriate refractive correction. RE as a cause of blindness has been recognized only recently with the increasing use of presenting visual acuity for defining blindness.[23,25,26]
Blindness presence implies inadequate eye care services in the population concerned since treatment of refractive errors is probably the simplest and most effective of eye care interventions. Elimination of avoidable blindness due to refractive errors requires that the following is to be considered: A clear definition of blindness should be used, good-quality population-based data be available on the various aspects of refractive errors-related blindness, adequate numbers of trained personnel, effective screening programs be developed to detect refractive error-related blindness in the population, provision of affordable reasonable-quality spectacles. [1]
Long-term success in reducing refractive errors-related blindness worldwide depends on attention being paid to these issues within the context of comprehensive approaches to reduce all causes of avoidable blindness. [1]
2.2 Definitions and ConceptsThe approach to RE identification, control and prevention intervention is mainly based on finding clear
understandable definitions. The following definitions are obtained from a trustful source (ICD-10): I- Blindness: Blindness is defined as the level of visual acuity of <3/60 or < 6/60 in the better eye. [23, 25, 26]II- Visual impairment:Visual impairment is defined as visual acuity of less than 6/18 in the better eye that could be improved to equal to or better than 6/18 by refraction or pinhole.III- Refractive Error:RE is an optical defect of the eye that prevents effective focus of images, most of the associated visual impairment is correctable with the use of spectacles.
Also it is defined as a state in which the optical system of the non accommodating eye fails to bring parallel rays of light to focus on the retina. [5]
2.3 Classifications of REVisual disorders are multifactorial health problems that need to be classified into groups according to their clinical characters:a- Visual Impairment: Visual impairment is categorised into mild visual impairment (presenting visual acuity of 6/6-6/18), moderate visual impairment (presenting visual acuity less than 6/18 but equal to or better than 6/60) and severe visual impairment (presenting visual acuity less than 6/60 but equal to or better than 3/60). [27-29]b- Refractive Errors:RE is classified into three categories as follows:
Myopia: is a nearsightedness in which the eye images are formed in front of the retina resulting in a blurred image. This leads to difficulty in seeing distant objects clearly. It is the most common RE in childhood. The commonest presenting symptoms include squinting, frowning and inabilityto see distant objects.
Hypermetropia: is a farsightedness, and occurs when images are formed behind the retina resulting in a blurred image [9, 14]. This leads to difficulty in seeing close objects clearly. It may cause lack of interest
SAJFM Volume 1 Issue 4, August 2010
MIDDLE EAST JOURNAL OF FAMILY MEDICINE • VOLUME 7 , ISSUE 10 ��
South Asia Journal of Family Medicine
25 SAJFM Volume 1 Issue 2, June 2010 SAJFM Volume 1 Issue 3, July 2010
in reading, rubbing of the eyes, or even headache, dizziness, or nausea.
Astigmatism: Is the condition associated with blurring of vision especially when looking at close and far objects as well. It is distorted vision resulting from an irregularly curved cornea. Astigmatism may be simple (i.e., not combined with hypermetropia or myopia), or a compound defect in which the eye has both myopia and astigmatism or hypermetropia and astigmatism. The majority of the presenting clinical features include: visual fatigue, headache, frowning, and squinting. [9, 10, 14]
2.4 Impact of RE on HealthI- Physically:The sense of vision is essential for proper physical development and educational progress in the growing child. The visual system in the young child is not fully mature. Equal input from both eyes is required for proper development of the visual centers in the brain. If a growing child’s eye does not provide a clear focused image to the developing brain, then permanent irreversible loss of vision may result. Therefore, early detection provides the best opportunity for effective, inexpensive treatment. [30]
It is estimated that around 90% of visually impaired children in low-income countries are deprived of schooling [31]. This may be related to various socio-economic and physical barriers that led to inadequate access to basic education and health services. [32]
II- Psychologically:Visual impairment from uncorrected refractive errors can have immediate and long-term consequences in children and adults, such as lost educational and employment opportunities, lost economic gain for individuals, families and societies, and impaired quality of life causing an economic burden on society. It also has an impact on social independence and social isolation, and psychological functioning [33]
The impact of blindness due to RE is considered in terms of blind-person-years. A person may become blind due to RE at a young age, and if not corrected early he/she would suffer many more years of blindness than a person becoming blind from cataract in old age, and would place a greater socioeconomic burden on society. [13, 34]
It was estimated that blindness due to refractive error resulted on an average of 30 years of blindness for each person as compared with 5 years of blindness due to untreated cataract for each person. [4, 14]
Study carried out by Frick and Foster estimates the costs of global blindness and low vision at $42 billion. Without a decrease in the prevalence of blindness and low vision, it was projected that the total annual costs would rise to $110 billion by 2020. However, with an effective VISION2020 intervention, this would be reduced to only $57 billion in 2020. [35]
Visual impairment and blindness due to uncorrected RE can hinder education, personality development, and career opportunities. [2]
Most causes of blindness and visual impairment are detectable and preventable. [5-7]
2.5 Epidemiology of REIn many parts of the world RE would become the second largest cause of preventable blindness after cataract. [9, 36, 37]
WHO released new global figures that estimate that 153 million people around the world have uncorrected refractive errors. Currently, severe RE has been estimated to account for about 5 million blind people. [8]
The number of visually impaired persons in the world is about 259 million. This estimate includes 98 million persons with visual impairment due to uncorrected refractive error. [2, 14]
Blindness that is associated with uncorrected or inadequately corrected RE is found to be more
common among the younger age as compared to cataract, which manifests itself in old age. [20]
About 80% of children are hyperopic at birth because of the shortness of the eye; approximately 5% are myopic. During the years between ages 2 and 25, there is a gradual decrease in hyperopia; myopia usually increases somewhat during the teen years, and levels off at around age 25, regardless of lighting, rest, amount of close work, or vitamins taken.[6]
Some experts estimate that approximately one in 20 preschool children and one in four school-aged children have an eye problem that could cause permanent vision loss if left untreated. [21]
It was estimated that blindness due to refractive error resulted in an average of 30 years of blindness for each person as compared with 5 years of blindness due to untreated cataract for each person. [9]
RE occurs worldwide. The prevalence varies considerably from one geographic area to another and that it has been increasing over the past few decades.
A- Global Prevalence:Evidence suggests that blindness due to uncorrected or under corrected RE is a significant problem in both developing and developed countries. Recent data suggest that a large number of people are blind in different parts of the world due RE because they are not following appropriate refractive correction. [38]
The prevalence of vision problems in children in the USA is estimated to be 5-10%. In a study in India, 5.1% of children in schools had a visual acuity of <6/12 in the better eye. In Botswana, a survey of children in schools and in the community showed that 1.5% of children aged 5-15 years had a visual acuity of < 6/18 in the better eye due to RE. [39]
In Asia, the prevalence of RE was found to be 80%, especially among the student population [38]
SAJFM Volume 1 Issue 4, August 2010
MIDDLE EAST JOURNAL OF FAMILY MEDICINE • VOLUME 7 , ISSUE 10��
South Asia Journal of Family Medicine
26 SAJFM Volume 1 Issue 2, June 2010 SAJFM Volume 1 Issue 3, July 2010
In Uganda a study was conducted to determine the prevalence of RE among school children attending lower primary school and the frequency of the various types of refractive errors. A significant RE occurring among primary school children aged 6 to 9 years at a prevalence of approximately 12% was detected. It was also found that astigmatism was the most frequent RE, accounting for 52% of all the errors, followed by hypermetropia, with myopia as the least frequent RE. [40]
The Refractive Error Study in Children (RESC), developed and supported by the WHO, was designed to assess the prevalence of refractive errors and vision impairment in children of different ethnic origins and cultural backgrounds. The RESC surveys have already been conducted in Chile, China, India, Malaysia, Nepal and South Africa. [41]
The study conducted in Chile found that RE associated with myopia is a major cause of reduced vision in school-age children. It was found that the prevalence of uncorrected RE was 15.8%. RE was the cause in 56.3% of the reduced vision, myopia in either eye was present in 3.4% of 5-year-old children, increasing to 19.4% in males and 14.7% in females by age 15. Over the same age range, hyperopia decreased from 22.7% to 7.1% in males and from 26.3% to 8.9% in females. Females had a significantly higher risk of hyperopia than males.[42]
In China, it was found that the prevalence of uncorrected RE was 22.3% .RE was the cause in 94.9% of reduced vision among school children; it also found that females had a significantly higher risk of myopia. The prevalence of reduced vision because of myopia is high in school-age children; it was 78.4% in 15 year olds and 5.7% in 5 year old children. Hyperopia of 5-year-olds was 17.0%. The prevalence of hyperopia was below 1% in 15-year-olds. Astigmatism was present in 42.7%. [43]
The study that was conducted in southern India found that the prevalence of uncorrected RE was 2.7%. RE was the main cause of visual impairment in children aged between 7 and 15 years in rural India. RE was the cause in 61% of eyes with vision impairment. Myopia in one or both eyes was present in 4.1% of the children. Myopia risk was associated with female gender and having a father with a higher level of schooling. Hyperopia in at least one eye was present in 0.8% of children. [44] In urban areas of India the prevalence of uncorrected RE among school children 5 to 15 years of age was found to be 6.4%. RE was the main cause in 81.7% of eyes with vision impairment. Also it was found in the same study that hyperopia was present in 7.7% of children and myopia in 7.4%.
Hyperopia was associated with female gender. Myopia was more common in children of fathers with higher levels of education. [45]
In Nepal the prevalence of uncorrected RE was 2.9%. RE was the cause in 56% of persons with reduced uncorrected vision. Myopia in either eye or hyperopia was observed in less than 3% of children. Hyperopia risk was associated with female gender and myopia risk with older age. [46]
In Malaysia the prevalence of uncorrected RE was 17.1%. RE was the cause in 87.0% of visually impaired children. Myopia was present in 10% of children 7 years of age; increasing to 32.5% in 15-year-olds. It was associated with older age, female gender, higher parental education, and Chinese ethnicity. Hyperopia varied from 3.8% in 7-year-olds, to less than 1% by age 15. Hyperopia was associated with younger age and “other” ethnicity. Astigmatism was present in 21.3%.[47]
In the South Africa Door to Door survey it was found that most causes of low vision among school children were due to uncorrected RE. The prevalence of uncorrected RE was 1.4%. RE was the cause in 63.6% of
person with reduced vision. Myopia in one or both eyes was present in 4.0% of children. Beginning with an upward trend at age 14, myopia prevalence reached 9.6% at age 15. Myopia was also associated with increased parental education. Hyperopia in at least one eye was present in 2.6% of children. [48]
Myopia has reached epidemic proportions in many countries such as Japan, Hong Kong, Taiwan and Singapore. [49]
B- Refractive Errors in EMRO region:A survey was conducted in Cairo, Egypt to detect the prevalence of refractive error (RE) and low vision among schoolchildren aged 7-14 years and found the prevalence of RE to be high - 22.1% of school students at that age. In addition, it found that myopia was the most prevalent type of RE among the screened schoolchildren (55.7%), followed by hypermetropia (27.3%), and astigmatism (17.0%). [50]
A study that was conducted in Jordan, Amman city among school students aged 12-17 years found the prevalence of myopia among them to be 17.6%. The prevalence of myopia was significantly associated with age, being the lowest in the youngest age group. Children with a family history of myopia were more likely to have myopia. With regard to activities outside of school, myopic children spent significantly more time in computer work and reading and writing and less time in sports activities. [51]
In Southern Jordan, a study was carried out between May 2001 and April 2002 in Prince Ali Hospital among patients aged 6-14 years visiting the pediatric clinics and were examined by a pediatrician for their visual acuity (VA) via Snellen’s E-chart for non-ophthalmologic complaints. The study also found out that RE was the cause of all bilateral visual impairment, and a substantial proportion of those with unilateral impairment of vision. [52]
SAJFM Volume 1 Issue 4, August 2010
MIDDLE EAST JOURNAL OF FAMILY MEDICINE • VOLUME 7 , ISSUE 10 ��
South Asia Journal of Family Medicine
27 SAJFM Volume 1 Issue 2, June 2010 SAJFM Volume 1 Issue 3, July 2010
The study that was conducted in Iran found out that the prevalence of uncorrected RE was 3.8% among schoolchildren. [53]
In Oman the prevalence of RE among school children differs according to age and gender. Prevalence of myopia among females was 14.5% among age 6-17 years and among males was 22.43% among age 6-17 years. While regarding hypermetropia among females it was found to be 0.91% and among males was 1.54% among ages 6-17. [54]
A visual screening program was carried out among preschool children in Jeddah, Saudi Arabia which had found out that the prevalence rate of vision disorders detected is 10.7% , RE 9%, hypermetropia 3.6% , myopia 1.8% and astigmatism was 1.3%.[55] Also in Saudi Arabia, prevalence of ocular disorders among schoolboys was studied in five villages in the Al-Baha region where it was found that the main causes of visual impairment were RE (7.2%).[56]
C- Refractive Errors in Qatar:The population Census in Qatar (2007) estimated the total population to be exceeding one million. Children < 15 years old constitute 23% of the population.
In Qatar there are no population based data regarding the actual prevalence of RE among schoolchildren, although there is a screening program that was implemented recently to detect RE among schoolchildren and vision problems in neonates. There is an estimation prevalence for RE. It was reported that the prevalence of blindness in Qatar was estimated to be 0.8% and low vision 2.4%. The major causes of blindness in Qatar include the following: glaucoma (29.8%), cataract (22.7%), RE (15%), non-trachomatous opacity (8.6%) and diabetic retinopathy (5.5%). [57]
2.6 Risk FactorsRE is a multi-factorial health condition. Risk factors are both genetic and environmental. [58-60]
a- Genetic Factors:Genetic factors include hereditary characters shared within family members. RE has been shown to aggregate strongly in families. Reports estimated of heritability (the proportion of the population variance due to inherited factors) range from 50% to 90% across a variety of population groups [61-65]. There is also evidence that myopia is influenced by genetic factors. A study done among the Old Order Amish population to determine the heritability of RE reported that up to 70% of the variability in refractive error among the Old Order Amish population, a group with less near-work activity than that of the general U.S. population, is due to genetic factors. These data are derived from a large, environmentally homogenous cohort containing large extended families, making it ideal for family-based genetic studies. [66]
A study done among Omani schoolchildren found that myopia in students was significantly associated with myopia in parents and their siblings. [67] Also in the study that was done in Egypt among school children it was found that the prevalence of RE was significantly higher among students with a positive family history of RE (80%) compared with no family history. [17]
A study conducted in Jordan among school children found a total of 54.6% of children had a family history of myopia and also found that the prevalence among children varied according to the family history based on who was affected and the number of persons affected in the family. The prevalence was 8.7% for those who had no family history, and was highest for those with 2 myopic parents and with at least 1 myopic sibling (43.2%). [51]
b- Environmental Factors:Although there may be a small genetic contribution to schoolchildren’s RE, environmental change appears to be the major factor increasing the prevalence of RE around the world. [67, 69]
The environmental factors include:
1. Near work is the major environmental risk factor for RE. Several studies showed a positive association between RE and near-work activity such as reading and writing [51]. Study done to determine environmental risk factors for refractive errors among Egyptian school children found the prevalence of RE and low vision was significantly higher among students exposed to near-work for >5 hours/day (23.4%) compared with those exposed for < 5 hours/day (17.1%). There was a significant positive correlation between the prevalence of RE and the hours of near-work [17]. A Jordanian study found that myopic children spent significantly more time reading and writing outside school and in computer work compared with non-myopic children, also myopic children spent significantly less time (1.87 hours per day) playing sports compared to non-myopic children (4.04 hours per day) and that the odds of having myopia increased by 16% and 24% for each additional 1 hour spent on computer work and writing/reading outside of school respectively [51]. In Hong Kong the risk of myopia tended to be greatest in those who had started school at youngest age and who had spent the most time per day reading and writing before the age 12. Also myopia was more common in children who had had a television before they were 12 year, and risk increased with the time per day spent watching TV [70].
2. Education is another risk factor; an American study has found that educational level and educational stream were positively related to RE [71].
There are many studies which showed that the correlation between level of academic achievement and the prevalence and progress of RE is strong [72-74]. In the European population a study found that educational length and IQ-test score were related to myopia [75].
3. Socioeconomic status was found to be associated with RE. It could be related to increases in the hours of
SAJFM Volume 1 Issue 4, August 2010
MIDDLE EAST JOURNAL OF FAMILY MEDICINE • VOLUME 7 , ISSUE 10��
South Asia Journal of Family Medicine
28 SAJFM Volume 1 Issue 2, June 2010 SAJFM Volume 1 Issue 3, July 2010
near work per day. Students of high socioeconomic status may spend a longer time watching television and playing computer games, while those from low socioeconomic status spend longer studying their lessons in badly illuminated, crowded rooms [51, 71]. Study done to determine environmental risk factors for RE among Egyptian school children found the prevalence of RE was significantly higher among students of high and low socioeconomic status compared with those of middle status [17].
4. Age is one of the risk factors associated with RE. RE occurs early in life and the prevalence increases with older age groups [51, 54, 71]. Study done to determine environmental risk factors for refractive error among Egyptian schoolchildren found that the prevalence of RE was significantly higher among the students aged >12 years (20.7%) compared to those with age < 12 years (15.5%).[17] Also the same result was found in Amman, that Myopia was significantly related to age. The prevalence was lowest for the youngest age group (7.8%) and increased until it reached 20.6% for 14-year-old children [51].
5. Gender is found to be associated with RE. Females have RE more commonly than males [6, 51, 54, and 71]. Study done to determine environmental risk factors for RE among Egyptian schoolchildren found that the prevalence of RE was significantly higher among the female students (21.4%) compared with males (13.6%) [17]. Also the study conducted in Jordan found the same result, that the prevalence of myopia was significantly higher in females (20.3%) compared to males (15.9%) [51]
6. Ethnicity is another risk factor associated with RE. Studies showed that prevalence of myopia among Asians is high (18.5%), followed by Hispanics (13.2%). Whites had the lowest prevalence of myopia (4.4%), which was not significantly different from African Americans (6.6%). Prevalence of hypermetropia is high among whites (19.3%), followed by
Hispanics (12.7%). Asians had the lowest prevalence of hypermetropia (6.3%) and were not significantly different from African Americans (6.4%). Asians and Hispanics had the highest prevalence of astigmatism (33.6% and 36.9%, respectively) [76].
2.7 Detection of RERE can be easily diagnosed, measured and corrected with spectacles or other refractive corrections to attain normal vision. If however it is not corrected or the correction is inadequate, RE may become a major cause of low vision and even blindness [77].
RE can be detected early through routine examination of patients who present to clinics, or through vision screening of the general population. The former approach may work satisfactorily in developed countries, but the latter is necessary in developing countries because a large majority of the population does not have access to reasonable quality eye care services. Vision screening is most commonly carried out on school children, which is a valuable method of identifying potentially treatable ocular abnormalities, including blindness due to refractive error.
Community vision screening can also be carried out as door-to-door surveys by trained field workers to assess visual acuity and identify individuals with vision problems [1].Diagnosis of RE is mainly clinical based on the symptoms that are experienced by the affected person. Further clinical assessment includes testing VA and using computer assessment technology [1].
VA tests include:1. Snellen chart (eye chart): This is a large card or lighted box that displays rows of letters in smaller and smaller sizes. The chart is read from a standard distance. The degree of visual acuity is determined by the size of the row of letters that the person can read. For those who are unable to read, a modified chart can be used in which the letters are represented by an upper case “E,” which is rotated randomly. The person is asked to describe the
way the “E” is facing. Vision loss categories according to visual acuity are from mild to severe [29].
2. Automated refraction: is performed with machines that determine the refractive error of the eye by measuring how light is changed when it enters the eye. The person sits in front of the auto refractor, a beam of light is emitted from the device, and the eye’s response is measured. The machine uses this information to calculate the lens prescription needed to correct the person’s refractive error. This measurement takes only a few seconds.
3. A phoropter: is the device commonly used, in conjunction with a Snellen chart, to determine the best corrective lenses for a person being assessed for eyeglasses or contact lenses. The phoropter contains a complete range of corrective lenses, allowing the person to compare different levels of correction while viewing the chart. The ophthalmologist will use the phoropter to refine the information obtained from the auto refractor before prescribing lenses [78].
2.8 Control and Prevention for REWorldwide, RE is considered one of the priorities of the recently launched global initiative for the elimination of avoidable blindness: VISION 2020 - The Right to Sight. In general, refractive error can be easily corrected with spectacles, which makes it imperative that effective strategies be developed to eliminate this easily treatable cause of blindness [79].
In 1999, VISION 2020, an initiative of WHO and the International Agency for the Prevention of Blindness (IAPB), highlighted blindness in children as one of its priority areas for control and consider uncorrected RE which iseasily diagnosed and can be inexpensively corrected with spectacles, as the most important cause of vision impairment in school-age children.
Primary eye care initiatives, such as school screening programs in Oman
SAJFM Volume 1 Issue 4, August 2010
MIDDLE EAST JOURNAL OF FAMILY MEDICINE • VOLUME 7 , ISSUE 10 ��
South Asia Journal of Family Medicine
29 SAJFM Volume 1 Issue 2, June 2010 SAJFM Volume 1 Issue 3, July 2010
and Mexico, concentrate on diagnosis and treatment of specific eye disorders, in particular RE in school students [80, 81].
Oman has an active blindness prevention program funded by the Ministry of Health. Priority areas for blindness control among children are correction of RE and provision of low vision devices. School-based screening is a convenient way of identifying children who need spectacles. Regular school screening was introduced in Oman in 1983, initially to detect trachoma. In 1992 the screening program expanded to include detection of refractive errors. Screening is provided in government and in private schools. Children are screened annually when they enter school in first grade at the age of five to six years and in grades four, seven and ten. Children are screened for visual impairment, trachoma and receive education on ocular health. Children with low vision are referred to low vision care services. School eye teams receive specific training, school registers, forms and equipment, and supplies to perform the screening.
Children are refracted at school and spectacles provided there if needed.
The school screening is monitored by regional eye health care supervisors. Regions prepare annual reports of their activities, achievements, coverage, results, interpretation and recommendations for the next year’s program. A national report is also prepared and submitted to members of the National Eye Health Care Committee. The health information and management system of the Ministry of Health includes school screening data. In 2005/2006 over 97% of school children (185,665) and over 81% of children in the community were screened for visual impairment [80, 81].
On the other hand, Mexico as one of the developing countries in which access to all basic healthcare services is severely restricted in addition to extreme poverty and inadequate transport, the RE Program was implemented “between”
October 2001 to November 2006, and funded by USAID-funded Child Vision. An educational organization interred to the Mexican government with technical assistance provided by Helen Keller International (HKI). Its objectives were to:
1- Increase local commitment and capacity to address RE in children by forming a local coalition dedicated to addressing primary eye care.
2- Increase capacity of HKI and partner staff to implement and conduct a sustainable RE screening program by training local staff to implement, monitor and evaluate the program.
3- Implement a school-based RE screening program by conducting school-based screening campaigns and to assess these in terms of quality of spectacles and level of spectacle-wear and satisfaction with spectacles among students.
4- Improve eye health through increasing awareness of eye diseases in communities, using behavior change and communication strategies.
The school-based RE program addressed the primary eye care needs of primary and secondary school children throughout Mexico. Teachers in primary and secondary schools, who were provided with a visual acuity chart and a written protocol, generally conducted the initial visual acuity screening. Children with a visual acuity of 6/12 or less in either eye were referred for refraction and further examination by HKI team comprising an optometrist and support staff. An optometrist refracted all referred children, and prescribed spectacles if required. Students in need of further care were referred to the ophthalmologist. 700,000 children were screened during the five-year program.
An ever-growing number of projects are working towards the VISION 2020 objective of eliminating avoidable blindness in children [80, 81].
2.9 RE Preventive Strategies in QatarThe National Committee for the Prevention of Blindness introduced a five-year national plan to eliminate and control blinding eye disorders including RE. It was approved by Government in 2005 and implemented in 2006. The financial support was assured by the Government and WHO. Prevention of blindness includes many activities such as: training of more eye care staff, public health education as well as school eye health education that cover primary, elementary & high schools and celebrations with activities to increase public awareness and distribution of leaflets about the eye diseases.
As part of control and preventive measures to eliminate the child blindness; newborn eye screening for the full term and for the preterm is implemented.
Another screening is carried out for six weeks, six months and three years of age. The vision-screening program is integrated within primary health care.
This is supported by continuous training of physicians and nursing staff in health centers to focus on common eye diseases [57].
In coordination with Ministry of Education and School Health department, the vision screening program is implemented for preschool children and school children, and it includes eye examination for school children in first, third, fifth, seventh and ninth grades. The examination for RE for school children is done by qualified School health nurse who is referring the RE cases to the ophthalmologist in the school health clinic for more investigations.
The National Committee for Prevention of Blindness recruits 55 Ophthalmologists; 32 of them are male and 23 are female; two Optometric Technicians, six female Optometrists, 59 ophthalmic nurses and two low vision workers. The
SAJFM Volume 1 Issue 4, August 2010

MIDDLE EAST JOURNAL OF FAMILY MEDICINE • VOLUME 7 , ISSUE 10�0
South Asia Journal of Family Medicine
30 SAJFM Volume 1 Issue 2, June 2010 SAJFM Volume 1 Issue 3, July 2010
percentage of population with eye care coverage in the Year 2007 was 98.4% [57].
Eye care data in a national plan program for prevention of blindness is collected and evaluated annually. [57].
3. Methodology This study was conducted among school children in the primary schools at Qatar in and in order to explore the RE problem in this particular age group, the following methodological steps were taken.
3.1 Study Design: A cross-sectional study design was used.
3.2 Study Setting: The study was conducted in Primary schools in Doha. There are 35 primary schools in Doha city, 27 are governmental schools and 8 are independent schools. These schools are supervised by the Ministry of Education and they are linked with the health services through the School Health program within the Primary Health Care department.
3.3 Study Population: The study targeted all school children registered in Doha primary schools (governmental and independent schools) from both genders. There are 5,554 students in male governmental schools and 6,052 students in female governmental schools. In independent schools there are 762 males and 3,270 females
3.4 Sampling Method:3.4.1 Sample Size: The sample size of students based on the representative primary schools was estimated by using EPI info version 10, according to the available prevalence in the literature review 22% [50] and precision 5% with 95% C.I. The sample size was found to be 268.
The following sample equation was applied:
Za = 1.96 (C.I: 95%)P = expected prevalence (in decimal point)q = 1-Pd = deviation 5%
Design effect was taken as 2.5; and accordingly the sample size was computed to be 670 students approximately.
3.4.2 Sampling Technique: Multistage random sample was used. Primary sampling units are schools that were divided in strata according to gender. Secondary sampling units were classes and one class from each grade out of five classes has been selected for data.
Total 670 students was divided proportionately according to male, female schools and accordingly two schools were selected randomly for male and three schools for female. Each grade in school has five classes, and one was selected randomly from grade one, two, three, four, five and six respectively for males and females.
3.5 Method of data Collection: Data was collected by using questionnaire and optometric examination as follows:
1- Questionnaire was formulated for data collection and was distributed to children included in the study and was answered by parents. [Appendix- 1]
The following items were included in the questionnaire:a- Demographic data: age, sex, nationality, socioeconomic status.b- Educational level includes Grade, performance in school.c- Out of school hours activities
include:* Student behaviors and activities after school* Physical activitiesd- Medical Conditions include: Chronic diseases, vision and ocular history, family history of refractive error2- Optometric Examination: This was conducted by a trained ophthalmologist and optometrist in the ophthalmic clinic at school and the data of RE was obtained. Eye examination was carried out using a specific chart for assessing RE (snellon chart) and auto refractor machine that was callipered before starting the examination and its accuracy was approved by Topcon company.
Data was collected by two phases as follows: (see top of page 31)
3.7 Data Entry and Analysis:The data were coded and entered into a computer and processed on an IBM-PC compatible computer using the Statistical Package of Social Science [SPSS], Windows version No.15. Frequency distributions, and one and two-way tabulations were obtained. Student-t test was used to ascertain the significant differences between mean values of two continuous variables. Chi-square analysis was performed to test for differences in proportions of categorical variables between two or more groups. In 2x2 tables, the Fisher’s exact test (two-tailed) replaced the chi-square test if the assumptions underlying chi-square violated, namely in the case of small sample size and where the expected frequency is less than 5 in any of the cells. The level p<0.05 was considered as the cut-off value for significance. [82]
3.8 Ethical Consideration: * Approval from the research committee was obtained.[ Appendix- 2]* Permission from school administration as well as School Health was obtained. [ Appendix- 3] [Appendix- 4]* Permission from nursing department at primary health care center was obtained. [Appendix-5]
SAJFM Volume 1 Issue 4, August 2010

MIDDLE EAST JOURNAL OF FAMILY MEDICINE • VOLUME 7 , ISSUE 10 ��
South Asia Journal of Family Medicine
31 SAJFM Volume 1 Issue 2, June 2010 SAJFM Volume 1 Issue 3, July 2010
* Written consent from parents. [Appendix-7] * Students were assured for follow up and treatment.
3.9 Limitation of the Study:One hinderer to the study was that there was only one ophthalmologist doctor in the school health department and one optometrist who were assigned to investigate all patients attending the ophthalmologist clinic and this lead to shortening of the appointment time allocated for the children under the study.
The most considerable limitation of this study was the presence of subjective variables such as: computer use, watching TV and electronic games. Although these variables have considerable effects on RE they are still subjective variables that cannot be analyzed.
An additional limitation was that the data collection phase started close to the beginning of the school holidays which had lead to the investigator being restricted to a limited time.
Another limitation of the study was that the measurement of the extent of near accommodation was not conducted and that physical activity levels among the studied children were subjectively assessed through asking their parents, rather than having a detailed assessment of intensity, frequency and duration of physical activity of their children.
4. Results Primary school children from all grades at Doha city were enrolled in this study. A required sample size of 670 had been estimated.700 questionnaires were handed out to compensate for non-response and 694 were eventually completed and returned. The response rate was 99.1%.
Socio-demographic characteristics are shown in Table 1 (next page). A percentage of 48.7 of the study sample was 8-10 years of age, while 27.5% were <8 years and 23.8% were more than 10 years. Males represented 48.3% while females were 51.7%. The Qatari students represent 77.4% and non Qatari
students were 22.6%. The estimated monthly income of the house hold was found to be high in 56.8%, moderate in 32.7% and only 6.2% were found to have low income. There were no significant differences in age according to gender for males (9.0±1.9) and females (8.7±1.7) using student t-test. p=0.315.
As is shown in Figure 1, (page 33) a percentage of 40.5% were from grade one and two, while the students of grade three and four represented 32.7%, grade fives were 11.5% and grade six were 15.5%.
The distribution of the RE types among the studied groups is shown in Table 2. A percentage of 80.3 were found not to have RE, while 19.7% of the primary school children included in the study had RE. The classification of RE was shown according to the following distribution: myopic astigmatism is the most prevalent RE; accounting for 9.5% followed by myopia 5% then 2.4% hypermetropic astigmatism, 1.9% astigmatism and finally hypermetropia 0.9%. The rest of the
SAJFM Volume 1 Issue 4, August 2010
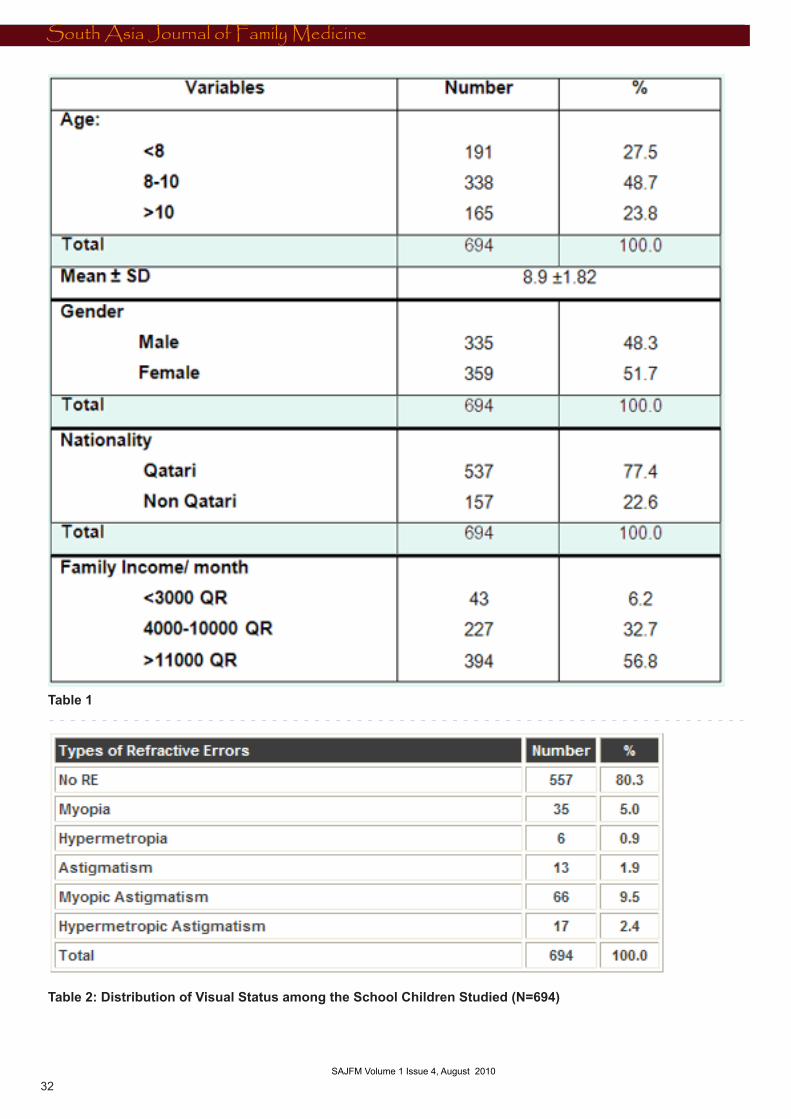
MIDDLE EAST JOURNAL OF FAMILY MEDICINE • VOLUME 7 , ISSUE 10��
South Asia Journal of Family Medicine
32 SAJFM Volume 1 Issue 2, June 2010 SAJFM Volume 1 Issue 3, July 2010
Table 1
Table 2: Distribution of Visual Status among the School Children Studied (N=694)
SAJFM Volume 1 Issue 4, August 2010
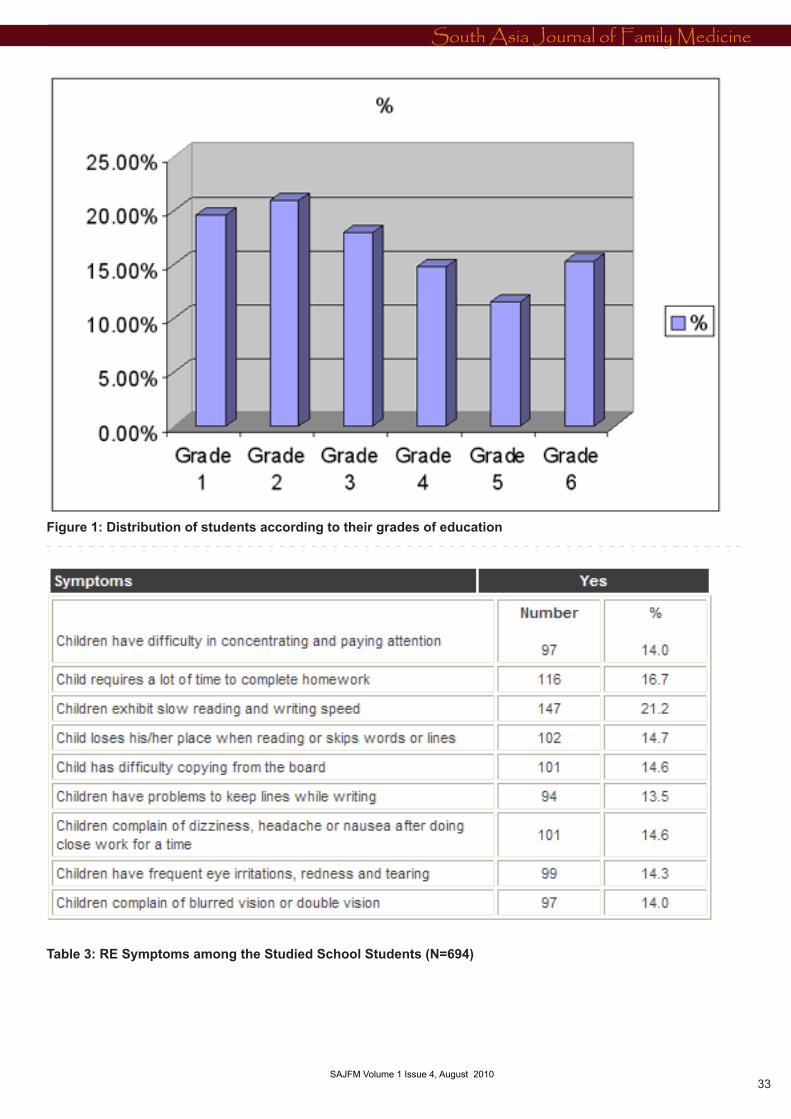
MIDDLE EAST JOURNAL OF FAMILY MEDICINE • VOLUME 7 , ISSUE 10 ��
MEDICINE AND SOCIET Y
MIDDLE EAST JOURNAL OF FAMILY MEDICINE VOLUME 8 ISSUE 3
South Asia Journal of Family Medicine
SAJFM Volume 1 Issue 2, June 2010 33 SAJFM Volume 1 Issue 3, July 2010
Figure 1: Distribution of students according to their grades of education
Table 3: RE Symptoms among the Studied School Students (N=694)
SAJFM Volume 1 Issue 4, August 2010
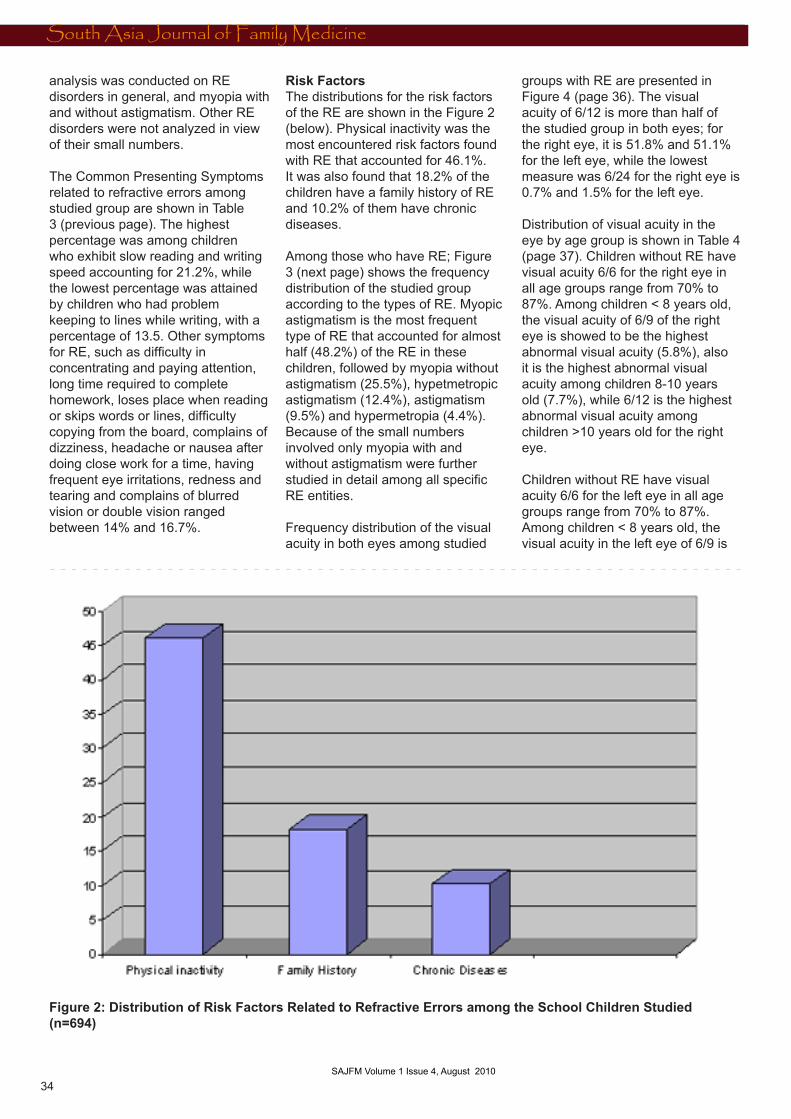
MIDDLE EAST JOURNAL OF FAMILY MEDICINE • VOLUME 7 , ISSUE 10��
ALTERNATIVE MEDICINE
MIDDLE EAST JOURNAL OF FAMILY MEDICINE VOLUME 8 ISSUE 3
South Asia Journal of Family Medicine
SAJFM Volume 1 Issue 2, June 201034
SAJFM Volume 1 Issue 3, July 2010
analysis was conducted on RE disorders in general, and myopia with and without astigmatism. Other RE disorders were not analyzed in view of their small numbers.
The Common Presenting Symptoms related to refractive errors among studied group are shown in Table 3 (previous page). The highest percentage was among children who exhibit slow reading and writing speed accounting for 21.2%, while the lowest percentage was attained by children who had problem keeping to lines while writing, with a percentage of 13.5. Other symptoms for RE, such as difficulty in concentrating and paying attention, long time required to complete homework, loses place when reading or skips words or lines, difficulty copying from the board, complains of dizziness, headache or nausea after doing close work for a time, having frequent eye irritations, redness and tearing and complains of blurred vision or double vision ranged between 14% and 16.7%.
Risk Factors The distributions for the risk factors of the RE are shown in the Figure 2 (below). Physical inactivity was the most encountered risk factors found with RE that accounted for 46.1%. It was also found that 18.2% of the children have a family history of RE and 10.2% of them have chronic diseases.
Among those who have RE; Figure 3 (next page) shows the frequency distribution of the studied group according to the types of RE. Myopic astigmatism is the most frequent type of RE that accounted for almost half (48.2%) of the RE in these children, followed by myopia without astigmatism (25.5%), hypetmetropic astigmatism (12.4%), astigmatism (9.5%) and hypermetropia (4.4%). Because of the small numbers involved only myopia with and without astigmatism were further studied in detail among all specific RE entities.
Frequency distribution of the visual acuity in both eyes among studied
groups with RE are presented in Figure 4 (page 36). The visual acuity of 6/12 is more than half of the studied group in both eyes; for the right eye, it is 51.8% and 51.1% for the left eye, while the lowest measure was 6/24 for the right eye is 0.7% and 1.5% for the left eye.
Distribution of visual acuity in the eye by age group is shown in Table 4 (page 37). Children without RE have visual acuity 6/6 for the right eye in all age groups range from 70% to 87%. Among children < 8 years old, the visual acuity of 6/9 of the right eye is showed to be the highest abnormal visual acuity (5.8%), also it is the highest abnormal visual acuity among children 8-10 years old (7.7%), while 6/12 is the highest abnormal visual acuity among children >10 years old for the right eye.
Children without RE have visual acuity 6/6 for the left eye in all age groups range from 70% to 87%. Among children < 8 years old, the visual acuity in the left eye of 6/9 is
Figure 2: Distribution of Risk Factors Related to Refractive Errors among the School Children Studied (n=694)
SAJFM Volume 1 Issue 4, August 2010
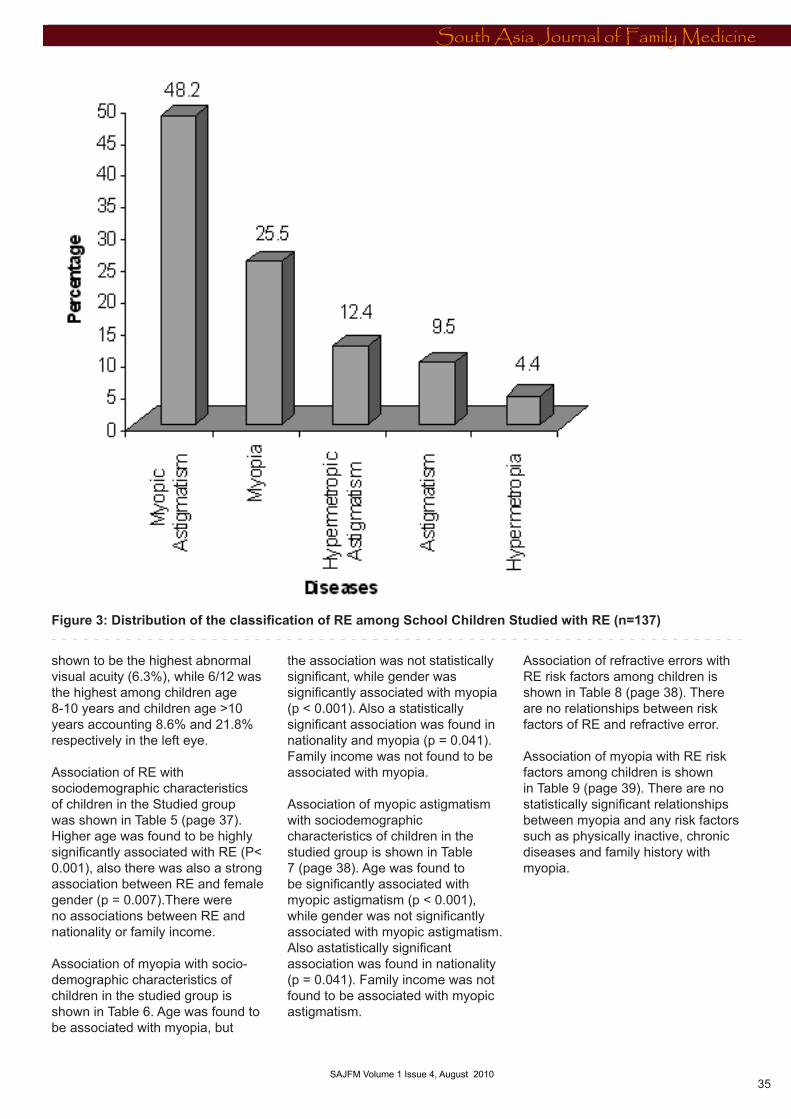
MIDDLE EAST JOURNAL OF FAMILY MEDICINE • VOLUME 7 , ISSUE 10 ��
ALTERNATIVE MEDICINE
MIDDLE EAST JOURNAL OF FAMILY MEDICINE VOLUME 8 ISSUE 3
South Asia Journal of Family Medicine
SAJFM Volume 1 Issue 2, June 2010 35 SAJFM Volume 1 Issue 3, July 2010
shown to be the highest abnormal visual acuity (6.3%), while 6/12 was the highest among children age 8-10 years and children age >10 years accounting 8.6% and 21.8% respectively in the left eye.
Association of RE with sociodemographic characteristics of children in the Studied group was shown in Table 5 (page 37). Higher age was found to be highly significantly associated with RE (P< 0.001), also there was also a strong association between RE and female gender (p = 0.007).There were no associations between RE and nationality or family income.
Association of myopia with socio-demographic characteristics of children in the studied group is shown in Table 6. Age was found to be associated with myopia, but
the association was not statistically significant, while gender was significantly associated with myopia (p < 0.001). Also a statistically significant association was found in nationality and myopia (p = 0.041). Family income was not found to be associated with myopia.
Association of myopic astigmatism with sociodemographic characteristics of children in the studied group is shown in Table 7 (page 38). Age was found to be significantly associated with myopic astigmatism (p < 0.001), while gender was not significantly associated with myopic astigmatism. Also astatistically significant association was found in nationality (p = 0.041). Family income was not found to be associated with myopic astigmatism.
Association of refractive errors with RE risk factors among children is shown in Table 8 (page 38). There are no relationships between risk factors of RE and refractive error.
Association of myopia with RE risk factors among children is shown in Table 9 (page 39). There are no statistically significant relationships between myopia and any risk factors such as physically inactive, chronic diseases and family history with myopia.
Figure 3: Distribution of the classification of RE among School Children Studied with RE (n=137)
SAJFM Volume 1 Issue 4, August 2010
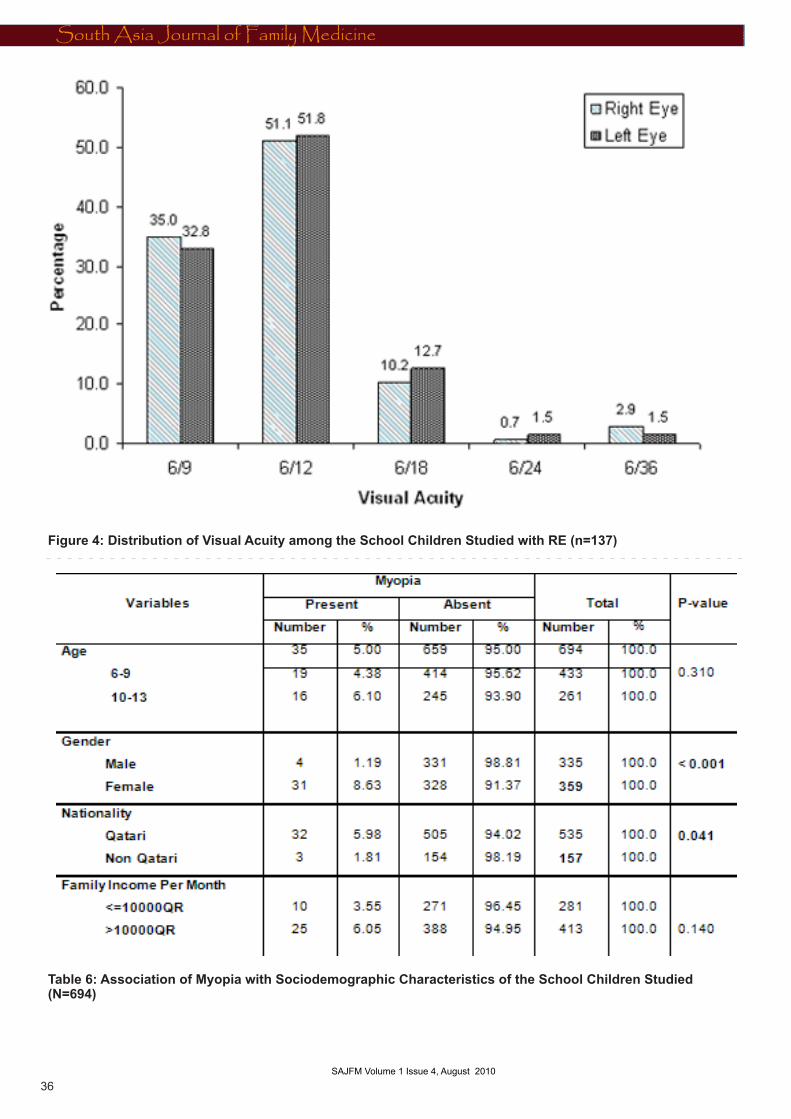
MIDDLE EAST JOURNAL OF FAMILY MEDICINE • VOLUME 7 , ISSUE 10��
ALTERNATIVE MEDICINE
MIDDLE EAST JOURNAL OF FAMILY MEDICINE VOLUME 8 ISSUE 3
South Asia Journal of Family Medicine
SAJFM Volume 1 Issue 2, June 201036
SAJFM Volume 1 Issue 3, July 2010
Figure 4: Distribution of Visual Acuity among the School Children Studied with RE (n=137)
Table 6: Association of Myopia with Sociodemographic Characteristics of the School Children Studied (N=694)
SAJFM Volume 1 Issue 4, August 2010
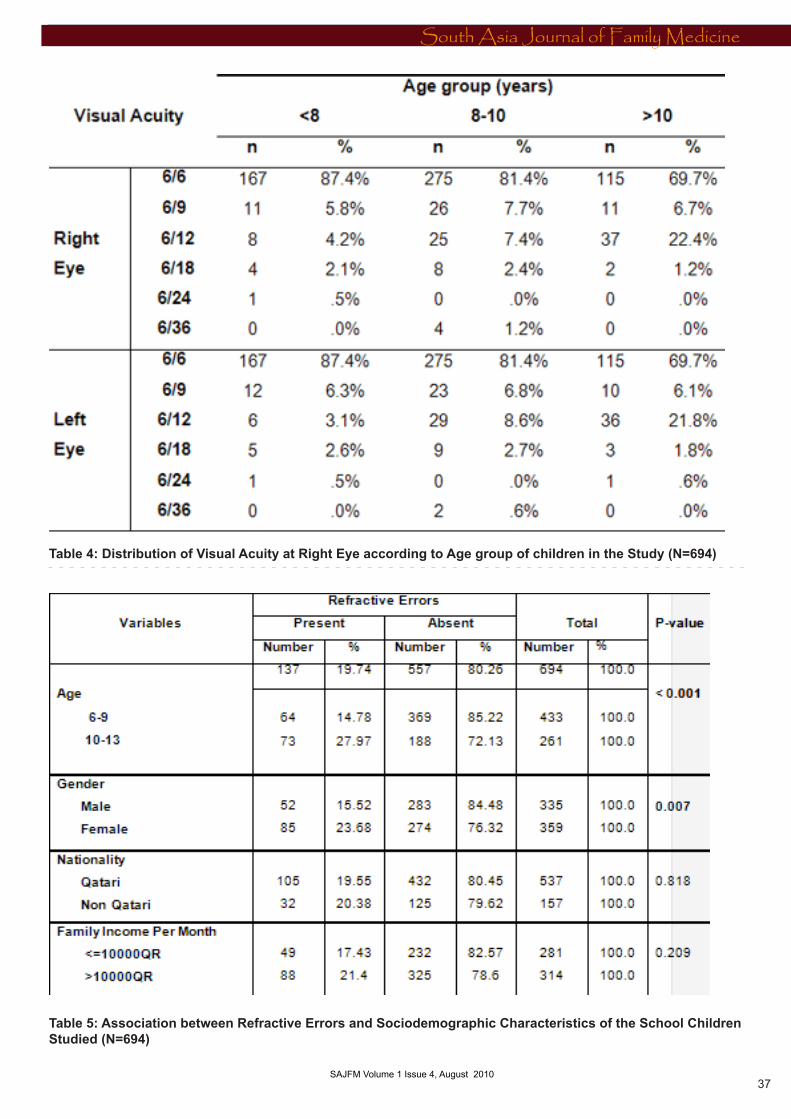
MIDDLE EAST JOURNAL OF FAMILY MEDICINE • VOLUME 7 , ISSUE 10 ��
ALTERNATIVE MEDICINE
MIDDLE EAST JOURNAL OF FAMILY MEDICINE VOLUME 8 ISSUE 3
South Asia Journal of Family Medicine
SAJFM Volume 1 Issue 2, June 2010 37 SAJFM Volume 1 Issue 3, July 2010
Table 4: Distribution of Visual Acuity at Right Eye according to Age group of children in the Study (N=694)
Table 5: Association between Refractive Errors and Sociodemographic Characteristics of the School Children Studied (N=694)
SAJFM Volume 1 Issue 4, August 2010
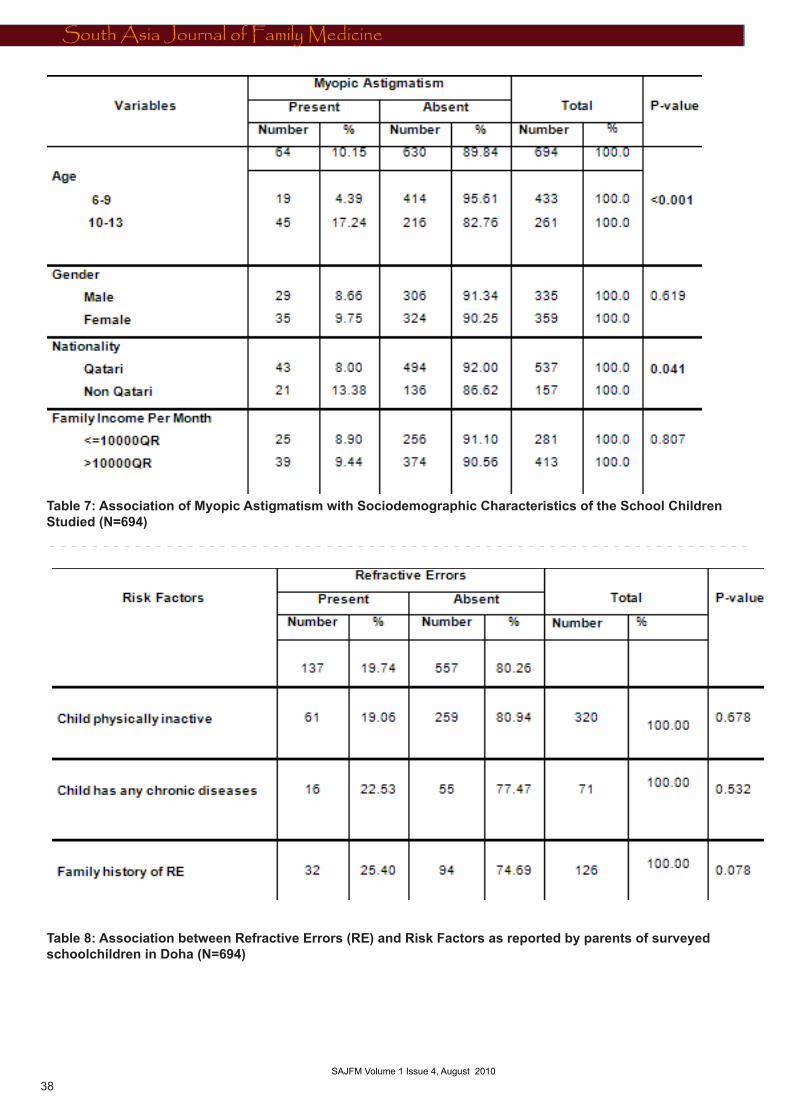
MIDDLE EAST JOURNAL OF FAMILY MEDICINE • VOLUME 7 , ISSUE 10��
ALTERNATIVE MEDICINE
MIDDLE EAST JOURNAL OF FAMILY MEDICINE VOLUME 8 ISSUE 3
South Asia Journal of Family Medicine
SAJFM Volume 1 Issue 2, June 201038
SAJFM Volume 1 Issue 3, July 2010
Table 7: Association of Myopic Astigmatism with Sociodemographic Characteristics of the School Children Studied (N=694)
Table 8: Association between Refractive Errors (RE) and Risk Factors as reported by parents of surveyed schoolchildren in Doha (N=694)
SAJFM Volume 1 Issue 4, August 2010
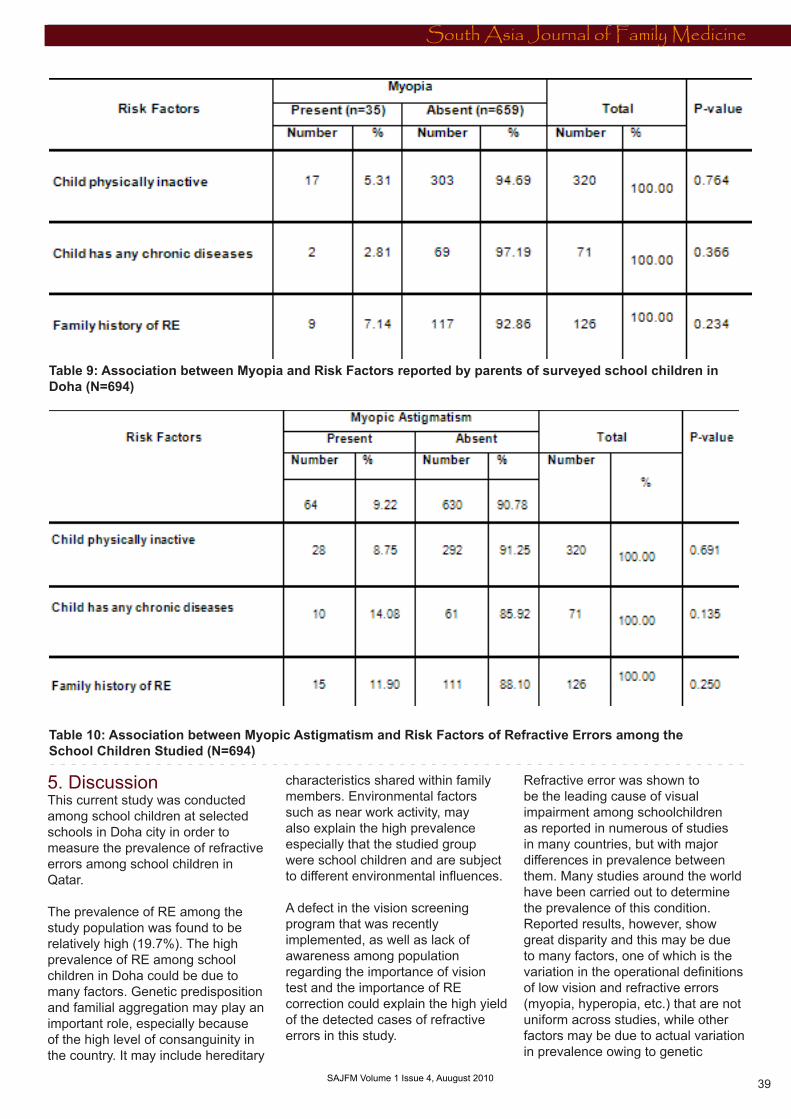
MIDDLE EAST JOURNAL OF FAMILY MEDICINE • VOLUME 7 , ISSUE 10 ��
ALTERNATIVE MEDICINE
MIDDLE EAST JOURNAL OF FAMILY MEDICINE VOLUME 8 ISSUE 3
South Asia Journal of Family Medicine
SAJFM Volume 1 Issue 2, June 2010 39 SAJFM Volume 1 Issue 4, Auugust 2010
Table 9: Association between Myopia and Risk Factors reported by parents of surveyed school children in Doha (N=694)
Table 10: Association between Myopic Astigmatism and Risk Factors of Refractive Errors among the School Children Studied (N=694)
5. Discussion This current study was conducted among school children at selected schools in Doha city in order to measure the prevalence of refractive errors among school children in Qatar.
The prevalence of RE among the study population was found to be relatively high (19.7%). The high prevalence of RE among school children in Doha could be due to many factors. Genetic predisposition and familial aggregation may play an important role, especially because of the high level of consanguinity in the country. It may include hereditary
characteristics shared within family members. Environmental factors such as near work activity, may also explain the high prevalence especially that the studied group were school children and are subject to different environmental influences.
A defect in the vision screening program that was recently implemented, as well as lack of awareness among population regarding the importance of vision test and the importance of RE correction could explain the high yield of the detected cases of refractive errors in this study.
Refractive error was shown to be the leading cause of visual impairment among schoolchildren as reported in numerous of studies in many countries, but with major differences in prevalence between them. Many studies around the world have been carried out to determine the prevalence of this condition. Reported results, however, show great disparity and this may be due to many factors, one of which is the variation in the operational definitions of low vision and refractive errors (myopia, hyperopia, etc.) that are not uniform across studies, while other factors may be due to actual variation in prevalence owing to genetic

MIDDLE EAST JOURNAL OF FAMILY MEDICINE • VOLUME 7 , ISSUE 10�0
factors and environmental influences between the studied children.
The prevalence in this study was compatible with the estimated prevalence in Qatar reported in the National Report to Eliminate and Control Blinding Eye Disorders, conducted by the National committee for the prevention of blindness in 2007, which determined the refractive errors prevalence to be 15%. [57] Consistently, the prevalence determined in this study was also more or less analogous with other studies accomplished in some countries such as: Egypt [50], China [43], Malaysia [47] and Chile [42]; 22.1%, 22.3%, 17.1% and 15.8% respectively. It is obvious from all these studies that the schoolchildren’s age represents a high risk group for refractive errors.
On the other hand, the RE prevalence in this study was reported to be much more than that found in some countries like USA [39,83] where RE prevalence is low (5-10%), as well as in India [41,44], Botswana [84], Nepal [46], Ethiopia [39] and South Africa [48]; 5%,1.5%, 2.9%, 7.6% and1.4% respectively. This finding could be due to using different visual acuity (<6/12) cut off points in these countries to determine RE in the aforementioned studies, while in the current study the visual acuity of (<6/9) was used to determine RE. Another explanation may be differences in genetic susceptibility of a disorder like refractive errors that vary largely between different races and ethnicities.
The prevalence of RE in this study was also found to be higher than the prevalence reported in Uganda [40] (12%) where the study was conducted among the age of 6-9 years, while in this study the age of studied groups was 6-13 years. In a study carried in Saudi Arabia in Albaha region the prevalence of RE among school children was (7.2%); lower than the prevalence in this study [55], that may be due to the age of the studied group included in Albaha study which was 15 years old. Another study in Jeddah reported a lower prevalence of RE than
the current study (9%), and this is because only the preschool children were included in the study [54]. The RE prevalence in Oman was lower than that found in this study (4.5%). This finding could be due to the fact that only students in the first grade from the three levels of school were studied in Oman and the study was restricted to boys only [85]. In the current study all grades in the primary level and both genders were included.
RE prevalence in the present study was found to be less than tha found in some countries as in Tunisia where the prevalence was (57.2%) [86] and (25.1%) was in Kolkata province [13]. The prevalence of refractive errors among children, as it shows, is currently attracting worldwide attention as many recent studies report dramatic increases over the last decades. The difference in the prevalence level in the aforementioned studies and ours may be contributed to the fact of studying different age groups.
It is during this period of life, the children are at risk of developing refractive errors, because they are actively growing and subjected to the strain of near work due to demanding academic schedules. Such a population is likely to have a highernumber of myopics. Prevalence of myopia, however, varies in different parts of the world. In this study myopic astigmatism and myopia were found to be the most frequent types of RE. Although there is not much data available on the prevalence, types and associated risk factors of refractive errors in children in developing countries to make comparisons, there is a general truth that as age increases from preschool age to early adolescence, an increasing number of children who would manifest their myopia will be observed [91]. This fact was entirely supported by the finding of our study which is also agreeing with the international trend.
The findings of this study were found to be largely compatible with most countries as in Egypt [50], Jordan [51], Oman [85], USA [87],
Malaysia [47], India [44] and Chile [42]. In some other countries myopia reached an epidemic level such as: Japan [88], Hong Kong [89], Taiwan and Singapore [49]. This confirms the fact that a sufficient frequency of myopic refractive error exists, often in high yet varying amounts, throughout different population groups and occasionally in subpopulation clusters.Astigmatism and hypermetropia were the least frequent types of RE in this study. This is not going with the findings reported from Saudi Arabia, where most of the studied groups are preschool children. The visual acuity of 6/12 is the most frequent measure, followed by visual acuity of 6/9. This result differs from Egypt where visual acuity of 6/9 is the most frequent one [17].In the present study less than a quarter of the school children present in each different symptoms for RE such as: difficulty in concentrating and paying attention, require a lot of time to complete homework, exhibit slow reading and writing speed, loses place when reading or skips words or lines, difficulty copying from the board, problems to keep to lines while writing, frequent eye irritations, redness and tearing and complains of blurred vision or double vision. The current study showed a significant association between RE and gender. RE is higher among females students than males and this result is compatible with other countries as in Egypt where the prevalence of RE was significantly higher among the female students compared to males [17], On the other hand this result is different than the study done in India, Kolkata province and Australia where there is no association between the prevalence of RE and the gender of school children [13].
In the current study Myopia is higher significantly among females more than males. This finding is similar to the study conducted in Jordan that the prevalence of myopia was significantly higher in females compared to males [51]. On the other hand this finding was against the one in Oman where the prevalence of myopia is higher in males than
South Asia Journal of Family Medicine
40 SAJFM Volume 1 Issue 4, Auugust 2010

MIDDLE EAST JOURNAL OF FAMILY MEDICINE • VOLUME 7 , ISSUE 10 ��
than females [54]. This difference could be due to the difference in the studied group in Oman in which the result was obtained from the screening test for students in grade one and four of primary schools and first grade from preparatory and secondary schools. This finding could be explained by both a structural phenomena and environmental factors. It was proved through research that girls tend to have steeper cornea, steeper crystalline lens and shorter eye sight compared to boys. [92] Moreover, girls tend to stay indoors more than do boys; consequently they may watch television for longer periods of time, and carry out more near work activities.
In the present study there was a high significant association between RE and the age of the studied group; RE was found to be significantly higher between the ages of 10 and 13 than in the younger age. This finding is similar to other studies as in that conducted in Egypt that found the prevalence of RE was significantly higher among the students aged >12 years compared to those with age < 12 years [17]. Also it is similar to the study conducted in India, Kolkata[13] that found increase in the prevalence of RE with increase of age.
The study showed the highly significant association between myopic astigmatism and age of the studied group. It is found to be common in older ages of school children. Conversely there was no significant association between myopia and the age of school children; this result was against the finding in Jordan where myopia was significantly related to age; the prevalence was lowest for the youngest age group and increased in older children [51]. This difference could be explained by the fact that most myopic children have astigmatism as well, so they were classified as myopic astigmatism. But the association of age and the prevalence of RE might be explained by other environmental confounders, such as higher school level and greater hours of near-work per day. The significant association between
refractive errors and age in general is explained by the fact that dynamic changes in refractive status are a function of age (illustrated with emmetropitization as the eye grows in axial length, where hyperopia diminishes and myopia, if present, continues to increase until the eye stops growing.[93]
In the present study a significant association between the prevalence of myopia as well as myopic astigmatism and nationality was determined. The prevalence was high in Qatari children, and this finding could be attributed to the fact of genetic disposition and hereditary liability of these children to have the condition more than their peers from other nationalities. Qataris are better off than non-Qataris and therefore have more video games and personal computers, hence are at higher risk.
The current study showed that around half of the students were physically inactive, but there was no significant association between not doing physical activity and RE. This finding was not matched with the one in Jordan [51] that found an inverse association between playing sports and myopia. A trend of lower rates of myopic progression was observed in schoolchildren reporting more time spent on sports and outdoor activities, [94] and an association between high levels of outdoor activity and more hyperopic refractive errors has recently been described in children. [95] Another cross-sectional study revealed that people with myopia spent significantly less time engaged in sports activities and that the amount of time engaged in sports was independently associated with myopia. [96] Most recently, Jones at al. [97] have reported that greater weekly participation in sports and outdoor activities in third-grade children is associated with reduced odds of having myopia by the eighth grade.
In this study, the level of physical activity was based on subjective assessment through asking parents, which may have not been an accurate way of assessing it,
consequently leading to the inability to determine the association between physical activity and RE proved through other studies.
Poor vision in childhood affects all children’s activities, their performance in school, and has a negative influence on their future life. An important factor that could have been studied more elaborately is the effect of near accommodation on books and screens induced by forcing the eye to permanently near focus on the relatively high refractive errors prevalence determined in this study.
There was no significant association between RE and family history of RE in the present study, although in many studies there were a strong association between RE and family history of RE as in Egypt [17], Jordan [51] and Oman [98] and there was no clear explanation for this finding.
This discussion, overall, contributes to the general agreement between this study and others that refractive errors are public health related problem of the eye among school children that need much attention both from authorities and public.
6. Conclusion and Recommendations 6.1 Conclusion:This cross sectional study was conducted in Doha among primary school children, to study the burden of refractive error-related blindness. The prevalence of RE among primary school children in Doha was measured, also the environmental risk factors for RE were identified.The present study reaches the following conclusion:* The prevalence of RE was found to be high among primary school children in Doha accounted to be 19.7%.* Myopic astigmatism was found to be the most prevalent type of RE followed by myopia, hypermetropic astigmatism, astigmatism and finally hypermetropia and the visual acuity of 6/12 is the most frequent measure, followed by visual acuity of 6/9.* There was an association between RE with gender and age.
South Asia Journal of Family Medicine
41 SAJFM Volume 1 Issue 4, Auugust 2010
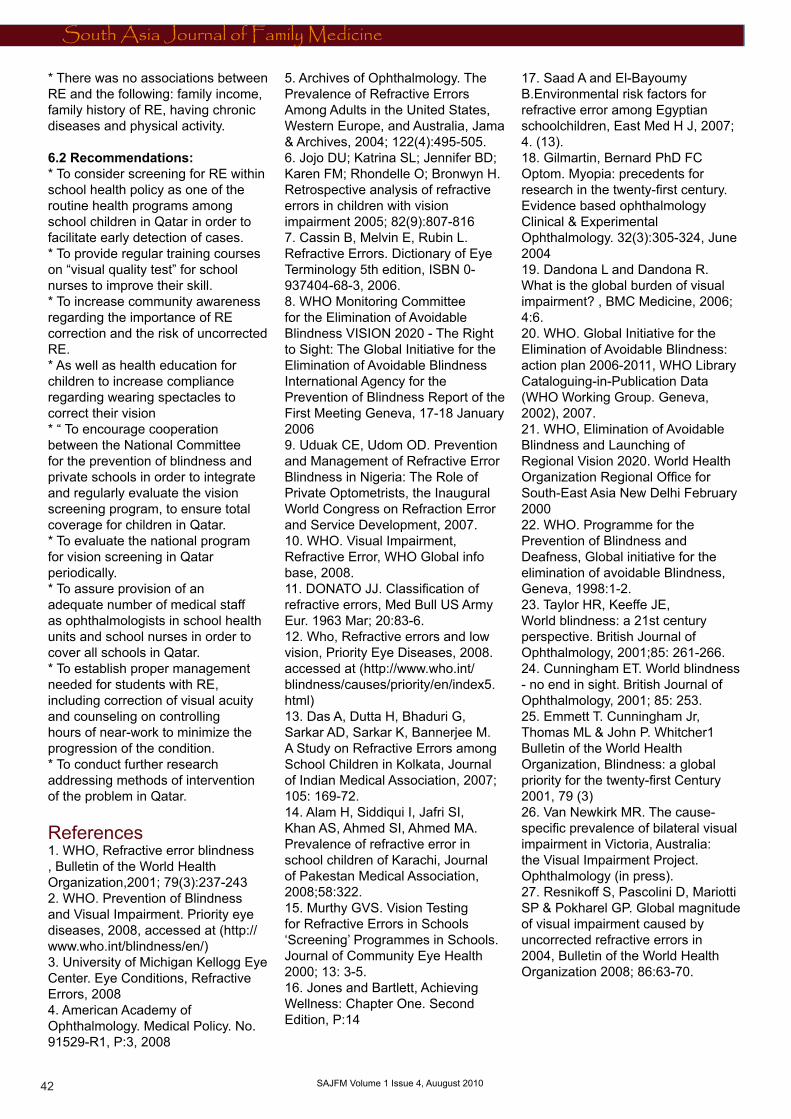
MIDDLE EAST JOURNAL OF FAMILY MEDICINE • VOLUME 7 , ISSUE 10��
South Asia Journal of Family Medicine
42 SAJFM Volume 1 Issue 4, Auugust 2010
* There was no associations between RE and the following: family income, family history of RE, having chronic diseases and physical activity.
6.2 Recommendations:* To consider screening for RE within school health policy as one of the routine health programs among school children in Qatar in order to facilitate early detection of cases.* To provide regular training courses on “visual quality test” for school nurses to improve their skill. * To increase community awareness regarding the importance of RE correction and the risk of uncorrected RE. * As well as health education for children to increase compliance regarding wearing spectacles to correct their vision * “ To encourage cooperation between the National Committee for the prevention of blindness and private schools in order to integrate and regularly evaluate the vision screening program, to ensure total coverage for children in Qatar. * To evaluate the national program for vision screening in Qatar periodically.* To assure provision of an adequate number of medical staff as ophthalmologists in school health units and school nurses in order to cover all schools in Qatar.* To establish proper management needed for students with RE, including correction of visual acuity and counseling on controlling hours of near-work to minimize the progression of the condition. * To conduct further research addressing methods of intervention of the problem in Qatar.
References 1. WHO, Refractive error blindness , Bulletin of the World Health Organization,2001; 79(3):237-2432. WHO. Prevention of Blindness and Visual Impairment. Priority eye diseases, 2008, accessed at (http://www.who.int/blindness/en/)3. University of Michigan Kellogg Eye Center. Eye Conditions, Refractive Errors, 20084. American Academy of Ophthalmology. Medical Policy. No. 91529-R1, P:3, 2008
5. Archives of Ophthalmology. The Prevalence of Refractive Errors Among Adults in the United States, Western Europe, and Australia, Jama & Archives, 2004; 122(4):495-505.6. Jojo DU; Katrina SL; Jennifer BD; Karen FM; Rhondelle O; Bronwyn H. Retrospective analysis of refractive errors in children with vision impairment 2005; 82(9):807-816 7. Cassin B, Melvin E, Rubin L. Refractive Errors. Dictionary of Eye Terminology 5th edition, ISBN 0-937404-68-3, 2006. 8. WHO Monitoring Committee for the Elimination of Avoidable Blindness VISION 2020 - The Right to Sight: The Global Initiative for the Elimination of Avoidable Blindness International Agency for the Prevention of Blindness Report of the First Meeting Geneva, 17-18 January 20069. Uduak CE, Udom OD. Prevention and Management of Refractive Error Blindness in Nigeria: The Role of Private Optometrists, the Inaugural World Congress on Refraction Error and Service Development, 2007. 10. WHO. Visual Impairment, Refractive Error, WHO Global info base, 2008. 11. DONATO JJ. Classification of refractive errors, Med Bull US Army Eur. 1963 Mar; 20:83-6. 12. Who, Refractive errors and low vision, Priority Eye Diseases, 2008. accessed at (http://www.who.int/blindness/causes/priority/en/index5.html) 13. Das A, Dutta H, Bhaduri G, Sarkar AD, Sarkar K, Bannerjee M. A Study on Refractive Errors among School Children in Kolkata, Journal of Indian Medical Association, 2007; 105: 169-72. 14. Alam H, Siddiqui I, Jafri SI, Khan AS, Ahmed SI, Ahmed MA. Prevalence of refractive error in school children of Karachi, Journal of Pakestan Medical Association, 2008;58:322. 15. Murthy GVS. Vision Testing for Refractive Errors in Schools ‘Screening’ Programmes in Schools. Journal of Community Eye Health 2000; 13: 3-5. 16. Jones and Bartlett, Achieving Wellness: Chapter One. Second Edition, P:14
17. Saad A and El-Bayoumy B.Environmental risk factors for refractive error among Egyptian schoolchildren, East Med H J, 2007; 4. (13). 18. Gilmartin, Bernard PhD FC Optom. Myopia: precedents for research in the twenty-first century. Evidence based ophthalmology Clinical & Experimental Ophthalmology. 32(3):305-324, June 2004 19. Dandona L and Dandona R. What is the global burden of visual impairment? , BMC Medicine, 2006; 4:6.20. WHO. Global Initiative for the Elimination of Avoidable Blindness: action plan 2006-2011, WHO Library Cataloguing-in-Publication Data (WHO Working Group. Geneva, 2002), 2007.21. WHO, Elimination of Avoidable Blindness and Launching of Regional Vision 2020. World Health Organization Regional Office for South-East Asia New Delhi February 2000 22. WHO. Programme for the Prevention of Blindness and Deafness, Global initiative for the elimination of avoidable Blindness, Geneva, 1998:1-2.23. Taylor HR, Keeffe JE, World blindness: a 21st century perspective. British Journal of Ophthalmology, 2001;85: 261-266. 24. Cunningham ET. World blindness - no end in sight. British Journal of Ophthalmology, 2001; 85: 253. 25. Emmett T. Cunningham Jr, Thomas ML & John P. Whitcher1 Bulletin of the World Health Organization, Blindness: a global priority for the twenty-first Century 2001, 79 (3) 26. Van Newkirk MR. The cause-specific prevalence of bilateral visual impairment in Victoria, Australia: the Visual Impairment Project. Ophthalmology (in press).27. Resnikoff S, Pascolini D, Mariotti SP & Pokharel GP. Global magnitude of visual impairment caused by uncorrected refractive errors in 2004, Bulletin of the World Health Organization 2008; 86:63-70.
MIDDLE EAST JOURNAL OF FAMILY MEDICINE • VOLUME 7 , ISSUE 10 ��
South Asia Journal of Family Medicine
43 SAJFM Volume 1 Issue 4, Auugust 2010
28. WHO. Prevention of Blindness and Deafness, Consultation on development of standards for characterization of vision loss and visual functioning, Geneva, 2003: 4-529. Monica Chaudhry, Low Vision Aids: The examination and evaluation. First edition. Publisher: Jaypee Brothers Medical Publishers LTD, 2006 P: 26.30. Aaby AA , Holland DR , Bock C J. Pediatric Ophthalmology. About your vision: Vision screening, Copyright © 2002 Eye Health Northwest, 2003.31. International Council for Education of People with Visual Impairment. ICEVI - Fact Sheet Annual Report 2004. (http://www.icevi.org/publications/Annual%20Report%202004.htm)32. The Millennium Development Goals and Vision 2020: The Global Initiative for the Prevention of Blindness. Fact sheet: 2028, 2006.33. Broman AT, Munoz B, Rodriguez J. The impact of visual impairment and eye disease on vision-related quality of life in a Mexican-American population: Proyecto VER. Invest Ophthalmol Vis Sci 2002; 43:3393-8.34. Helen Keller International. Refractive Error, Spirit of Helen Keller Gala, 2008. 35. Frick KD, Foster A. The Magnitude and Cost of Global Blindness: An Increasing Problem That Can Be Alleviated, American Journal Of Ophthalmology, 2003; 135 (4):473-476.36. Eye Care America. Low Vision, The foundation of the American Academy of Ophthalmology, 200737. Meeting on the Management Of Cataract Within Primary Health System. Denpasar, Indonesia, World Health Organization & Organisation Mondiale De La Sante,1986 (WHO/PBL/87.13).38. Lin LL. Epidemiologic study of the prevalence and severity of myopia among schoolchildren in Taiwan in 2000. Journal of the Formosan Medical Association, 2001, 100(10):684-9139. Kassa T, Alene GD. Prevalence of refractive errors in pre-school and school children of Debark and Kola Diba towns, North-western Ethiopia, Ethiop.J.Health Dev. 17(2):117-124.
40. Kawuma M, Mayeku R. A survey of the prevalence of refractive errors among children in lower primary schools in Kampala district. Afr Health Sci. 2002 August; 2(2): 69-72. 41. World Council of Optometry. Refractive Error Study in Children, Vision 2020, the right to sight, 2008.42. Maul E, Barroso S, Munoz SR, Sperduto RD, Ellwein LB. Refractive Error Study in Children: results from La Florida, Chile. American Journal of Ophthalmology, 2000; 129(4), 445 - 54. 43. He M, Zeng J, Liu Y, Xu J, Pokharel GP, Ellwein LB. Refractive error and visual impairment in urban children in southern china. Investigative Ophthalmology & Visual Science, 2004; 45(3), 793 - 9.44. Dandona R, Dandona L, Srinivas M, Sahare P, Narsajah S, Munoz SR, Pokharel GP, Ellwein LB. Refractive error in children in a rural population in India. Investigative Ophthalmology & Visual Science, 2002; 43(3), 615 - 22.45. Murthy GV, Gupta SK, Ellwein LB, Munoz SR, Pokharel GP, Sanga L, Bachani D. Refractive error in children in an urban population in New Delhi. Investigative Ophthalmology & Visual Science, 2002; 43(3), 623 - 31. 46. Pokharel GP, Negrel AD, Munoz SR, Ellwein LB. Refractive Error Study in Children: results from Mechi Zone, Nepal. American Journal of Ophthalmology, 2000; 129(4), 436 - 44.47. Goh PP, Abqariyah Y, Pokharel GP, Ellwein LB. Refractive error and visual impairment in school-age children in Gombak District, Malaysia. Ophthalmology, 2005; 112(4),678 - 85. 48. Naidoo KS, Raghunandan A, Mashige KP, Govender P, Holden BA, Pokharel GP, Ellwein LB. Refractive error and visual impairment in African children in South Africa. Investigative Ophthalmology & Visual Science, 2003; 44(9), 3764 - 70.49. SM. Academic achievement, close up work parameters, and myopia in Singapore military conscripts. British journal of ophthalmology, 2001, 85:855-60.
50. El-Bayoumy B, Saad A and Choudhury A. Prevalence of refractive error and low vision among schoolchildren in Cairo.Health Journal, 2007;13(3) 51. Khader YS, Batayha WQ, Abdul-Aziz SMI and Al-Shiekh-Khalil MI. Prevalence and Risk Indicators of Myopia among Schoolchildren in Amman, Jordan. East Med H J, 2006; 12 (3/4).52. Maaita JF, Sunna LF, Al-Madani MV, Horrani SM. Eye diseases in children in Southern Jordan. Saudi Med J 2003; 24 (2):p53-55.53. Fotouhi A, Hashemi H, Khabazkhoob M, Mohammad K. The Prevalence of Refractive Errors among Schoolchildren in Dezful, Iran. British Journal of Ophthalmology 2007; 91:287-292.54. General of Health Affairs Ministry of Health, Oman. National Burden of Disease (NBD) Study: Oman. Department of Surveillance & Disease Control Sultanate Oman, Ministry of Health, 2003;12(1)55. Bardisi WM, Bin Sadiq BM. Vision screening of preschool children in Jeddah, Saudi Arabia, Saudi medical journal, 2002; 23(4): 445-449.56. Al Faran MF. Prevalence of ocular disorders among schoolboys in five villages in Al-Baha region, Annual Saudi Medi, 1992 Jan; 12(1):3-7.57. National Health Authority State of Qatar. The National Report to Eliminate and Control Blinding Eye Disorders, Doha, National committee for the prevention of blindness: 2007. 58. Grosvenor TP. Primary care optometry: anomalies of refraction - Heinemann, 1996:76-9. 59. Sorsby A, Sheridan M, Leary GA. Refraction and its components in twins, MRC, HMSO London,1962; 30360. Wu MM, Edwards MH. The effect of having myopic parents: an analysis of myopia in three generations. Optometry and vision science, 1999, 76(6):387-92.61. Alsbirk PH. Refraction in adult West Greenland Eskimos: a population study of spherical refractive errors, including oculometric and familial correlations. Acta Ophthalmol (Copenh). 1979; 57:84-95.

MIDDLE EAST JOURNAL OF FAMILY MEDICINE • VOLUME 7 , ISSUE 10��
South Asia Journal of Family Medicine
44 SAJFM Volume 1 Issue 4, Auugust 2010
62. Bear JC, Richler A, Burke G. Nearwork and familial resemblances in ocular refraction: a population study in Newfoundland. Clin Genet. 1981;19:462-472.63. Lee KE, Klein BE, Klein R, Fine JP. Aggregation of refractive error and5-year changes in refractive error among families in the Beaver Dam Eye Study. Arch Ophthalmol. 2001; 119:1679-1685. 64. Hammond CJ, Snieder H, Gilbert CE, Spector TD. Genes and environment in refractive error: the twin eye study. Invest Ophthalmol Vis Sci. 2001; 42:1232-1236. 65. Lyhne N, Sjolie AK, Kyvik KO, Green A. The importance of genes and environment for ocular refraction and its determiners: a population based study among 20-45 year old twins. Br J Ophthalmol. 2001; 85:1470-1476. 66. Jon A. Peet, Mary-Frances Cotch, Robert Wojciechowski, Joan E. Bailey-Wilson, and Dwight Stambolian. Heritability and Familial Aggregation of Refractive Error in the Old Order Amish, Invest Ophthalmol Vis Sci, 2007 September; 48(9): 4002-4006. 67. Khandekar R; Al Harby S; Mohammed AJ. Determinants of Myopia among Omani School Children: A Case-Control Study. Ophthalmic Epidemiology, 2005 June; 12(3):207-13.68. Morgan I, Rose K. How genetic is school myopia?, Prog Retin Eye Res, pubmed, 2005 Jan;24(1):1-38.69. Richler A, Bear JC. Refraction, nearwork and education. A population study in Newfoundland. Acta ophthalmologica, 1980, 58(3):468-78.70. Wong L, Coggon D, Cruddas M, and Hwang C H. Education, reading, and familial tendency as risk factors for myopia in Hong Kong fishermen, Journal of epidemiology and community health 1993; 47:50-53.71. Sperduto RD. Prevalence of myopia in t United States. Archives of ophthalmology, 1983, 101:405-7.72. Wong TY. Variation in ocular biometry in an adult Chinese population in Singapore: the Tanjong Pagar Survey. Investigative ophthalmology & visual science, 2001, 42:73-80
73. Saw SM. Factors related to the progression of myopia in Singaporean children. Optometry and vision science, 2000; 77:549-54.74. Tay MT. Myopia and educational attainment in 421,116 young Singaporean males. Annals of the Academy of Medicine, Singapore, 1992; 21:785-91. 75. Jacobsen N, Jensen H, Goldschmidt E. The prevalence of myopia in young Danish men from 1880 to 2004, Acta Ophthalmologica Scandinavica 2006; 283 (48):413-03.76. Robert N. Refractive Error and Ethnicity in Children. Arch Ophthalmology. 2003; 121(8):1141-1147.77. Resnikoff S, Pascolini D, Mariotti SP , Pokharel GP. Global magnitude of visual impairment caused by uncorrected refractive errors in 2004, Bulletin of the WHO, 2008; 86 (1):1-80.78. The Merck Manual of Medical Information. Merck& Co., Inc. Eye Disorders, 2nd edition2006.79. WHO. Vision 2020 Regional Planning Workshop and Launching of Vision 2020 in Egypt Cairo, Egypt, 14-17 December 2003. World Health Organization, Regional office for Eastern Mediterranean Region, 2003;23 80. Khandekar R, Al Harby S, Abdulmajeed T, Helmi SA and Shuaili IS. Validity of vision screening by school nurses in seven regions of Oman, Eye health care manual, Muscat, Oman, Ministry of Health and United Nations Children’s Fund, 2004;10(4/5):528-536.81. Vision 2020 The Right to sight. Vision for Children, A Global Overview of Blindness, Childhood and, VISION 2020, The Right to Sight. P: 5-10.82. Norusis MJ. SPSS Inc. SPSS/PC+ for Windows, Base System and advanced Statistic User’s Guide, Window version No.15.0. Chicago, Illinois, 1998. 83. Murthy GVS. Vision Testing for Refractive Errors in schools. J comm Eye health 2000; 33(3)3-4. 84. Gilbert C. A pilot study to evaluate the methods and logistics for a prevalence and causes survey of visual impairment and hearing impairment in children. Community eye health: 2000; 13(33):3.
85. Khandekar B, Abdu-Helmi S. Magnitude and determinants of RE in omani school children, Saudi Med J, 2004; 25(10): 1388-1393.86. Ayed T, Sokkah M, Charfi O, El Matri L. Epidemiologic study of refractive errors in schoolchildren in socioeconomically deprived regions in Tunisia. J. Fr. Ophtalmol., 2002; 25 (7): 712-717.87. Kleinstein RN, Jonnes LA, Hullett S, Kwon S, Lee RJ, Friedman NE, Manny RE, Mutti DO, Yu JA, Zadnik K; Collaboration Longitudinal Evaluation of Ethnicity and Refractive Error Study Group. Refractive error and ethnicity in children; Arch Ophthalmol, 2003; 121(8):1141-7.88. Matsumura H, Hirai H. Prevalence of myopia and refractive changes in students from 3 to 17 years of age, Surv Ophthalmo, 1999;44:S109-115.89. Fan DS, Lam DS, Lam RF, Lau JT, Chong KS, Cheung EY, Lai RY, Chew SJ. Prevalence, incidence, and progression of myopia of school children in Hong Kong, Invest Ophthalmol Vis Sci, 2004; 45(4):107-5.90. Mahmoud TA. Eye manifestations in visual display terminal workers. Egypt. Journal of occupational medicine, 1988, 12(2):135-44.91. Murthy G.V.S. Vision Testing for Refractive Errors in schools. J comm Eye health 2000;3(33)3-4.92. Mohidin N, Akhir SM, Ali BM, Mohammed Z, The Association between Myopia and Gender in Indian Schoolchildren in Kuala Lumpur. Journal Sains Kesihatan Malaysia 3 (2) 2005: 49-5493. Dunaway D, Berger I. Worldwide Distribution of Visual Refractive Errors and What to Expect at a Particular Location. Presentation to the International Society for Geographic and Epidemiologic Ophthalmology. In focus Center for Primary Eye Care Development. 2006)94. Parssinen O, Lyyra AL. Myopia and myopic progression among schoolchildren: a three-year follow-up study. Invest Ophthalmol Vis Sci. 1993;34:2794-2802.95. Rose K, Morgan I, Smith W, Mitchell P. Myopia: prevalence, risk factors and natural history. Ophthalmic Physiol Opt. 2006;26:1-67. (continued page 60)
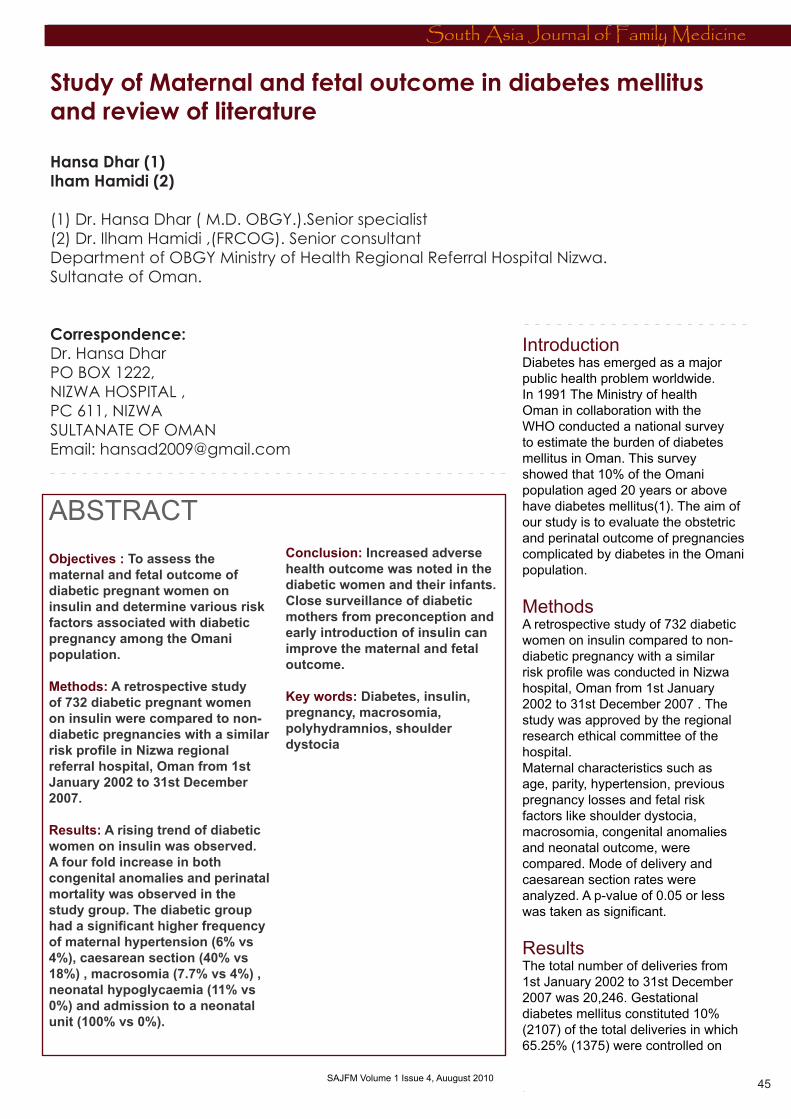
MIDDLE EAST JOURNAL OF FAMILY MEDICINE • VOLUME 7 , ISSUE 10 ��
South Asia Journal of Family Medicine
45 SAJFM Volume 1 Issue 4, Auugust 2010
Study of Maternal and fetal outcome in diabetes mellitus and review of literature
Hansa Dhar (�)Iham Hamidi (�)
(1) Dr. Hansa Dhar ( M.D. OBGY.).Senior specialist(2) Dr. Ilham Hamidi ,(FRCOG). Senior consultantDepartment of OBGY Ministry of Health Regional Referral Hospital Nizwa.Sultanate of Oman.
Correspondence:Dr. Hansa DharPO BOX 1222, NIZWA HOSPITAL ,PC 611, NIZWASULTANATE OF OMANEmail: [email protected]
Introduction Diabetes has emerged as a major public health problem worldwide. In 1991 The Ministry of health Oman in collaboration with the WHO conducted a national survey to estimate the burden of diabetes mellitus in Oman. This survey showed that 10% of the Omani population aged 20 years or above have diabetes mellitus(1). The aim of our study is to evaluate the obstetric and perinatal outcome of pregnancies complicated by diabetes in the Omani population. Methods A retrospective study of 732 diabetic women on insulin compared to non-diabetic pregnancy with a similar risk profile was conducted in Nizwa hospital, Oman from 1st January 2002 to 31st December 2007 . The study was approved by the regional research ethical committee of the hospital.Maternal characteristics such as age, parity, hypertension, previous pregnancy losses and fetal risk factors like shoulder dystocia, macrosomia, congenital anomalies and neonatal outcome, were compared. Mode of delivery and caesarean section rates were analyzed. A p-value of 0.05 or less was taken as significant.
Results The total number of deliveries from 1st January 2002 to 31st December 2007 was 20,246. Gestational diabetes mellitus constituted 10% (2107) of the total deliveries in which 65.25% (1375) were controlled on
ABSTRACT Objectives : To assess the maternal and fetal outcome of diabetic pregnant women on insulin and determine various risk factors associated with diabetic pregnancy among the Omani population.
Methods: A retrospective study of 732 diabetic pregnant women on insulin were compared to non-diabetic pregnancies with a similar risk profile in Nizwa regional referral hospital, Oman from 1st January 2002 to 31st December 2007.
Results: A rising trend of diabetic women on insulin was observed. A four fold increase in both congenital anomalies and perinatal mortality was observed in the study group. The diabetic group had a significant higher frequency of maternal hypertension (6% vs 4%), caesarean section (40% vs 18%) , macrosomia (7.7% vs 4%) , neonatal hypoglycaemia (11% vs 0%) and admission to a neonatal unit (100% vs 0%).
Conclusion: Increased adverse health outcome was noted in the diabetic women and their infants. Close surveillance of diabetic mothers from preconception and early introduction of insulin can improve the maternal and fetal outcome.
Key words: Diabetes, insulin, pregnancy, macrosomia, polyhydramnios, shoulder dystocia

MIDDLE EAST JOURNAL OF FAMILY MEDICINE • VOLUME 7 , ISSUE 10��
South Asia Journal of Family Medicine
46 SAJFM Volume 1 Issue 4, Auugust 2010
diet and 34.75% (732) on insulin, which was our study group (Figure 1).
Figure 1 98.90% (724) of the study group were Omanis and the rest were from other countries. A rising trend of diabetic women on insulin was seen as the incidence increased from 11.05% (233) in 2002 to 17.41% (367) in 2007 with a peak of 21.97% (463) in 2006 (Figure 2).
Figure 2 Incidence of diabetes increased with increasing parity. 32.36% (233) of women in the diabetic group compared to 8.6% (63) in the control group were women with parity 9 or more, (Table 1 - opposite page) , p (<0.001)
Mean maternal age in the diabetic group was 40 years. Incidence of diabetes increased with maternal age of > 45 years, as in the diabetic group there were 10. 38% (76) women with maternal age > 45 years compared to 1.5% (11) women in the control group (Table 2 - opposite page) p (<0.001) .
Mean maternal age at delivery in the study group was 37.5 weeks. 42.6% (312) delivered at 37 weeks and 57.10% (420) at >37weeks in the study group compared to 96.6% (707) and 3.4% (25)respectively in the control group, (Table 3 opposite page), p(<0.001).
There was a significant increase in the fetal weight with rising maternal age, parity and uncontrolled diabetes as observed in our study. Fetal weight of 4kg or more was considered as macrosomia. The percentage of fetal weight more than 4kg was 7.7 in the study group
compared to 2.5% in the control group . The heaviest baby born was 5.2 kgs who suffered shoulder dystocia, Erb’s palsy and birth asphyxia, (Table 4 - page 48). Perinatal mortality in the diabetic group was 16.43% compared to 4.09% in the control group.
Indications for elective and emergency caesarean section are shown in Figures 3 and 4.
Figure 3
Figure 4
Rate of congenital anomalies 2.3% (12) and 0.5% (4) were observed in the two groups, (Table 5 page 48) Maternal complications, fetal complications and neonatal complications in the study and control groups are shown in Tables 6, 7and 8 respectively - (page 49).
Discussion Pregnancy is a diabetogenic state manifested by insulin resistance and hyperglycaemia (2). Untreated diabetes during pregnancy is associated with increased maternal and perinatal morbidity and increased perinatal mortality (3) . Increasing parity and maternal age in our study was associated with increased incidence of diabetes mellitus and increased complications like macrosomia and polyhydramnios. Maternal obesity could be an independent and more potent risk factor for large infants as high prevalence of diabetes, obesity, hypertension and high cholesterol exist in the Omani population. In Oman the rising rates of diabetes has been attributed to a change in dietary patterns, physical activity and life style associated with urbanization(4).
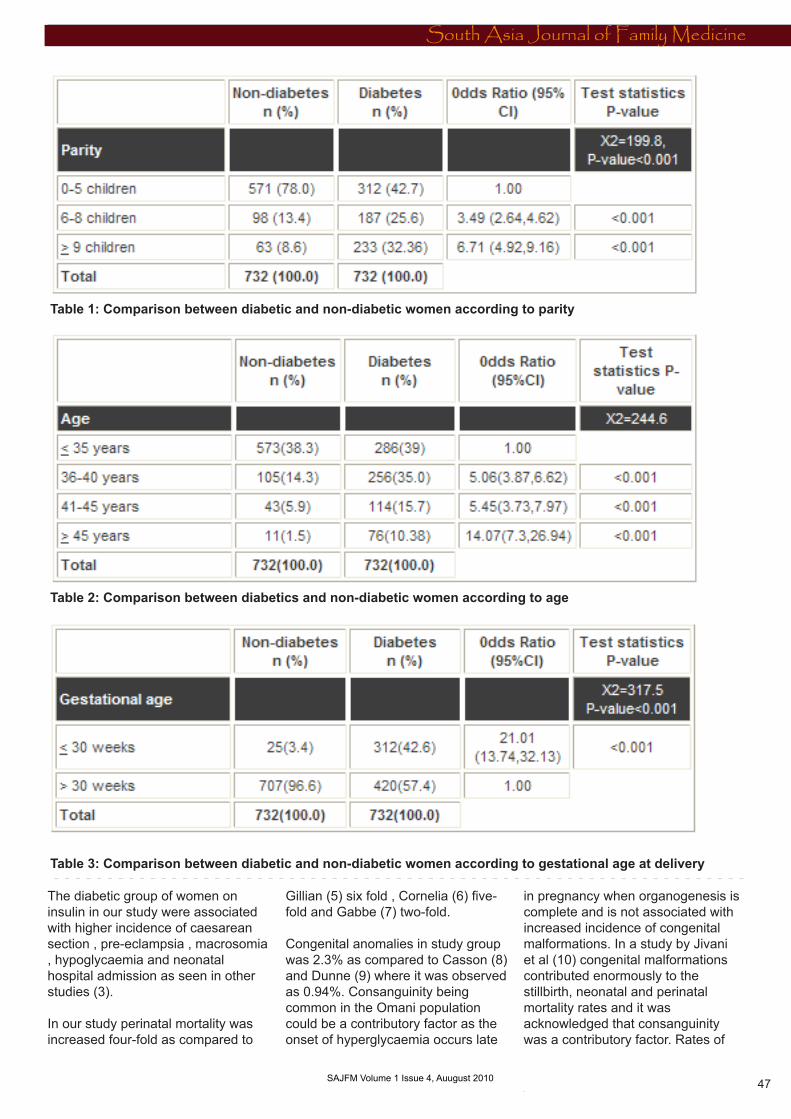
MIDDLE EAST JOURNAL OF FAMILY MEDICINE • VOLUME 7 , ISSUE 10 ��
South Asia Journal of Family Medicine
47 SAJFM Volume 1 Issue 4, Auugust 2010
The diabetic group of women on insulin in our study were associated with higher incidence of caesarean section , pre-eclampsia , macrosomia , hypoglycaemia and neonatal hospital admission as seen in other studies (3).
In our study perinatal mortality was increased four-fold as compared to
Gillian (5) six fold , Cornelia (6) five-fold and Gabbe (7) two-fold.
Congenital anomalies in study group was 2.3% as compared to Casson (8) and Dunne (9) where it was observed as 0.94%. Consanguinity being common in the Omani population could be a contributory factor as the onset of hyperglycaemia occurs late
in pregnancy when organogenesis is complete and is not associated with increased incidence of congenital malformations. In a study by Jivani et al (10) congenital malformations contributed enormously to the stillbirth, neonatal and perinatal mortality rates and it was acknowledged that consanguinity was a contributory factor. Rates of
Table 1: Comparison between diabetic and non-diabetic women according to parity
Table 2: Comparison between diabetics and non-diabetic women according to age
Table 3: Comparison between diabetic and non-diabetic women according to gestational age at delivery

MIDDLE EAST JOURNAL OF FAMILY MEDICINE • VOLUME 7 , ISSUE 10��
South Asia Journal of Family Medicine
48 SAJFM Volume 1 Issue 4, Auugust 2010
Table 4: Comparison between diabetics and non-diabetics according to fetal weight
Table 5: Fetal congenital anomalies
malformations as high as 10% (11) and 6.1% (12) in the United States and 8% (13) in the United Kingdom have been reported.
Literature scanned have reported as high as 40% (14) malformations of the cardiovascular system (3) compared to 12% (3) in our study. Gestational diabetes mellitus is associated with macrosomia. Early introduction of insulin could reduce the frequency of macrosomia (2) .
In the present study insulin was started late in most of the cases due to non-acceptance and poor compliance. Macrosomia is a single complication from which many other complications arise (14). This resulted in shoulder dystocia and genital injuries like tears and spontaneous symphysiotomy (2). The rate of shoulder dystocia was observed in 2% of the study group compared to 0.8% in the control group . The incidence of fracture clavicle in the two groups was
(0.40% vs 0.13%) and that of Erb’s palsy was (0.5% vs 0%) in our study as compared to Nasser et al (15) who reported incidence of 8% of serious trauma (brachial plexus injuries or clavicular fractures). Neonatal hypoglycaemia occurred in 11% of the diabetic group and none in the control as compared to 24%(3).
Mathew et al (16) reported correlation between diabetes mellitus and polyhydramnios of 15%
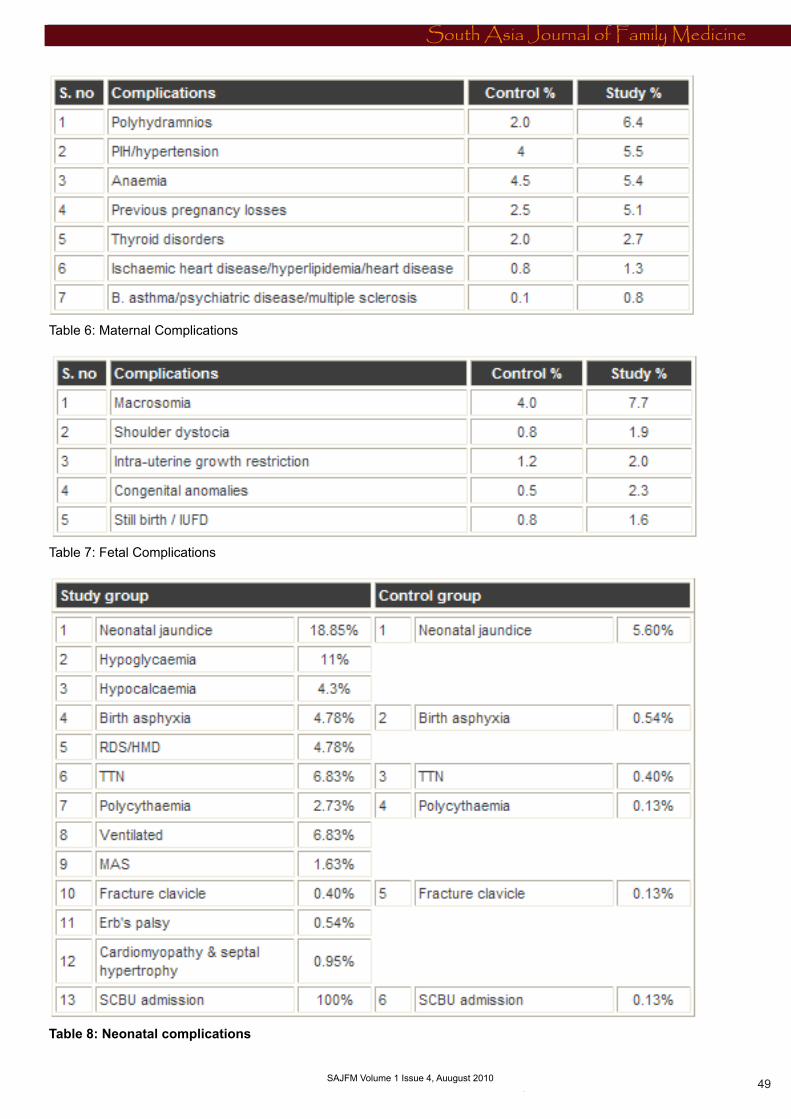
MIDDLE EAST JOURNAL OF FAMILY MEDICINE • VOLUME 7 , ISSUE 10 ��
South Asia Journal of Family Medicine
49 SAJFM Volume 1 Issue 4, Auugust 2010
Table 6: Maternal Complications
Table 7: Fetal Complications
Table 8: Neonatal complications
MIDDLE EAST JOURNAL OF FAMILY MEDICINE • VOLUME 7 , ISSUE 10�0
South Asia Journal of Family Medicine
50 SAJFM Volume 1 Issue 4, Auugust 2010
compared to a rate of 6.4% in our study.
Anaemia, common in developing countries accounted for 5.4% in our study as compared to 21.6% in other studies (17) probably due to poor dietary habits and non compliance in taking haematinics.
Hypertension with superimposed pre-eclampsia accounted for 5.5% in our study as compared to 20% in other studies (3) despite treatment of maternal hypertension. The mode of delivery by induction of labour was 21.31% as compared to 61% in other studies (3).
In our study increased operative deliveries by caesarean section of 40.30% was the same as in the study by Emmanuel et al(2) that showed that caesarean section in mothers with gestational diabetes was twice as likely to be for big babies and obstructed labour.
Conclusion Diabetic structured education can improve maternal and fetal outcomes in the Omani population. Perinatal mortality reflects the problem confronting obstetricians in managing pregnant women with diabetes. The pregnancy loss is less with early introduction of insulin. Better uptake of preconceptional care may improve maternal and fetal outcome. Poor compliance and refusal to take insulin due to poor knowledge of maternal diabetes probably was the reason for delay in initiating and accepting insulin early to avoid maternal and neonatal complications in our study .
References 1. Jawad A. Al- Lawati , Ali J. Mohammed , Diabetes in Oman : Annals of Saudi Medicine ,vol 20,no1.2000. 2. Emmanuel Odar , Julius Wandabwa , Paul Kiondo . African Health Sciences vol 4 No 1 April 2004.3. Jensen DM , Sorensen B, Feil berg - Jorgensen N , Westergaard JG , Beck - Nielsen H. Diabet Med .2000 Apr; 17(4):281-6
4. Asfour MG et al . High prevalence of Diabetes mellitus and impaired glucose tolerance in the Sultanate of Oman : results of the 1991 national survey . Diabet Med 1995; 12: 1122-55. Gillian Hawthrone , consultant physician , S Robson , professor of fetal medicine , EA Ryall , consultant Obstetrician , D Sen , research midwife et al . BMJ 1997; 315: 279-281(2 August).6. Cornelia R. Graves . MD clinical obstetrics And Gynaecology volume 50 , number 4 . 1007-1013.7. Gabbe SG , Mestman JH , Freeman RK . et al Am J Obstet Gynecol , 1977 Dec 1 ; 129(7) : 723-32.8. I F Casson , Consultant Diabetologist , CA Clark , emeritus professor , CV Howard , head of research group et al . BMJ 1997 ; 315: 275-27(2 August).9. F.P.Dunne , PA Brydon , M . Proffitt, T. Smith et al Q J Med 2000; 93: 813-818.10. Jivani SK , Asian neonatal mortality in Blackburn , Arch Dis Child 1986; 61: 510-12.11. Albert TJ. Landon MB , Wheller JJ, Samuels P, Cheng et.al Prenatal detection of fetal abnormalities in pregnancies complicated by insulin - dependent diabetes mellitus . Am J Obstet Gynecol 1996; 174:1424-8.12. Rosenn B. Miodovnik M, Combes CA , Khoury J , et al. Glycaemic thresholds for spontaneous abortion and congenital malformations in insulin dependent diabetes mellitus . Obstet Gynecol 1994 ; 84: 515-20.13. Dunlop DC , Purewal TS , Kelly LC , O’ Hare JP . Folic acid and diabetic pregnancy : are we giving the correct advice ? results of a nation wide Survey . Diabet Med 1996 ; 13(suppl 3): 844.14. Casey BM, Lucas MJ , McIntire DD, Leveno JK . Pregnancy outcomes in women with gestational diabetes compared with the general obstetric population . Obstet Gynecol 1997; 90: 869-873.15.Nassar AH , Usta IM , Khalil AM , et al : Fetal macrosomia (?4500g) : Perinatal outcome of 231 cases according to the mode of delivery : J Perinatal 2003; 23: 136-141.
16.Mariam Mathew , Lovina Machado , Rahma Al -Ghabshi et al Saudi Med J 2005; vol . 26(1) : 96-100.17. Mariam Mathew , Shabnam Saquib , Syed G. Rizvi Saudi Med J 2008 ; vol .29 (2): 256-260.
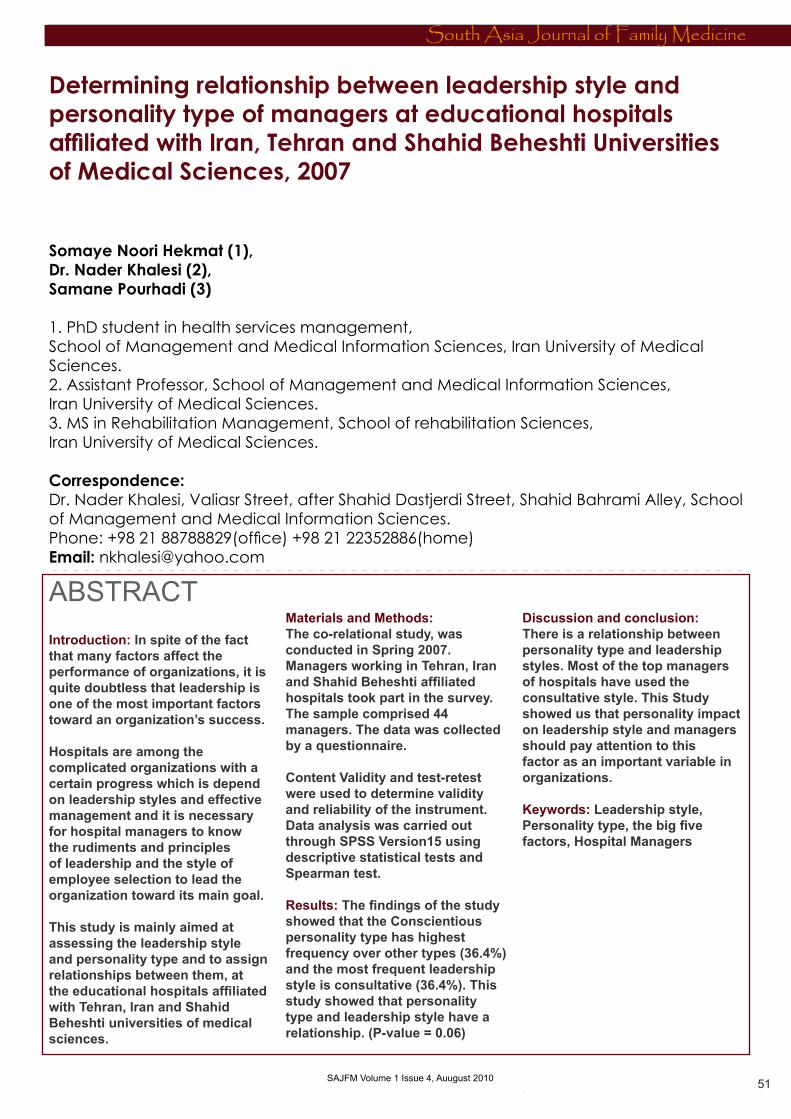
MIDDLE EAST JOURNAL OF FAMILY MEDICINE • VOLUME 7 , ISSUE 10 ��
South Asia Journal of Family Medicine
51 SAJFM Volume 1 Issue 4, Auugust 2010
Determining relationship between leadership style and personality type of managers at educational hospitals affiliated with Iran, Tehran and Shahid Beheshti Universities of Medical Sciences, �00�
Somaye Noori Hekmat (�), Dr. Nader Khalesi (�), Samane Pourhadi (�)
1. PhD student in health services management, School of Management and Medical Information Sciences, Iran University of Medical Sciences.2. Assistant Professor, School of Management and Medical Information Sciences,Iran University of Medical Sciences.3. MS in Rehabilitation Management, School of rehabilitation Sciences,Iran University of Medical Sciences.
Correspondence: Dr. Nader Khalesi, Valiasr Street, after Shahid Dastjerdi Street, Shahid Bahrami Alley, School of Management and Medical Information Sciences. Phone: +98 21 88788829(office) +98 21 22352886(home) Email: [email protected]
ABSTRACT Introduction: In spite of the fact that many factors affect the performance of organizations, it is quite doubtless that leadership is one of the most important factors toward an organization’s success.
Hospitals are among the complicated organizations with a certain progress which is depend on leadership styles and effective management and it is necessary for hospital managers to know the rudiments and principles of leadership and the style of employee selection to lead the organization toward its main goal.
This study is mainly aimed at assessing the leadership style and personality type and to assign relationships between them, at the educational hospitals affiliated with Tehran, lran and Shahid Beheshti universities of medical sciences.
Materials and Methods: The co-relational study, was conducted in Spring 2007. Managers working in Tehran, Iran and Shahid Beheshti affiliated hospitals took part in the survey. The sample comprised 44 managers. The data was collected by a questionnaire.
Content Validity and test-retest were used to determine validity and reliability of the instrument. Data analysis was carried out through SPSS Version15 using descriptive statistical tests and Spearman test.
Results: The findings of the study showed that the Conscientious personality type has highest frequency over other types (36.4%) and the most frequent leadership style is consultative (36.4%). This study showed that personality type and leadership style have a relationship. (P-value = 0.06)
Discussion and conclusion:There is a relationship between personality type and leadership styles. Most of the top managers of hospitals have used the consultative style. This Study showed us that personality impact on leadership style and managers should pay attention to this factor as an important variable in organizations.
Keywords: Leadership style, Personality type, the big five factors, Hospital Managers

MIDDLE EAST JOURNAL OF FAMILY MEDICINE • VOLUME 7 , ISSUE 10��
South Asia Journal of Family Medicine
52 SAJFM Volume 1 Issue 4, Auugust 2010
Introduction Leadership and its different styles are pertinent to researchers and managers. Several lots of research have been done after World War II in order to determine patterns or desirable and effective styles. Which style is the best?
Personality is one of the effective factors in the creation of individual differences of leaders. The highest usage of personality theories in work environments is from identifying features which are directly related to the work environment; features such as control center, magnanimity and amount of people’s tendency to succeed.
Hospitals need effective and skillful leaders like every other organization, either in the whole of organization or in parts thereof. This is impossible unless managers of these centers select their leadership style to be well-proportioned with appropriate conditions and the hospital’s aims. Type of organizations, circumstances and even personnel can limit the style of a leaders’ behavior.Study on what research has been done on relations between leadership style and organization characteristics showed that research had been done in relation to leadership style and organization’s health, leadership style and organizational maturity, personality types and optimism, pessimism and big factors in personality types, in Iran. It seems essential to do research in order to study on leadership and between leadership style and hospital managers’ personality types. This study is mainly aimed at assessing the relationship between leadership style and personality type of managers at the educational hospitals affiliated with lran, Tehran and Shahid Beheshti universities of medical sciences.
We prepared the special goals below in order to achieve this goal:
1. Identifying personality types of research population separately for each demographic variable among samples research.2. Identifying leadership styles
separately for each demographic variable among samples research.3. Determining relationship between personality variables and different styles of leadership.
Materials and Methods The co-relational study, was conducted in Spring of 2007. Managers working in Tehran, Iran and Shahid Beheshti affiliated hospitals took part in the survey. Research samples were not selected by sampling because of limitation in the number of the research population.
This research used the Blake and Mouton model to determine leadership style of managers. People’s answers to every ingredient of decision-making (beliefs, differences, conflicts, sense of humor, effort and endeavor, temper and perspiration) showed their leadership styles (such as team, country club, task orientation, middle-of-the-road and laissez-faire management styles) in this model.The instruments of data collection were two questionnaires: “leadership style of manager by Renesis Likert” (1967) and the big five factors by Roy Costa and Mc Crac (1987). At first we determined technical validity in order to assess validity of research instrument. Questionnaire was translated to Persian by a translator. Then, the Persian version was translated by another translator to English again. Therefore, we sent questionnaires to Professors and specialists of health services management, psychologists and three managers of hospitals and we used their opinions in order to correct the questionnaire’s deficiencies.
We used test-retest method in order to measure the reliability of the questionnaire. We distributed and collected questionnaire among 15 people from the research population, then, we did that again on the same people after 10 days. Correlation coefficient gained 0.75 for the determining leadership style questionnaire and 0.85 in determining personality type questionnaire, which meant the reliability was confirmed.
Determining personality type had 44 questions and it was as follows:- Neurotic personality type: empiricism, irritable, nervous, variable manner, upset about affairs and unhappy.- Conscientious personality type: programmer, commander, attentive to details, task oriented, goal oriented, very meticulous person and regular.- Extrovert personality type: energetic, talkative, beginner of discussion and argument, stimulus and encourager of others, being comfortable in association, cooperation with others. - Open personality type: art lover, adventurer, wide vocabulary limitation, curious, dynamic imagination, quick understanding of subjects, full of excellent idea and beliefs, emotional.- Agreeable personality type: compatible, participatory and consultative, sympathy with co-workers, mild, perception in other’s feelings.
We explained the esearch samples and how to fill out the questionnaire. We also talked about their freedom in participation in this research and their answers would be confidential.
Grading and scoring methods:Scoring method of determining leadership style questionnaire:Determining leadership style included 18 questions. There were 4 options (“nothing”, “approximately”, “considerable”, “complete”) in each question that had 1 score. Scores of each column were added and the column with the highest score is the dominant leadership style of the person.
Scoring method of determining personality type questionnaire:In order to determine personal type we used the big five factors which included 44 questions. The following scheme was used to determine dominant dimension of people’s personality: - Extroversion dimension was calculated by the mean of 8 questions.(1+6+11+16+21+26+31+36/8)
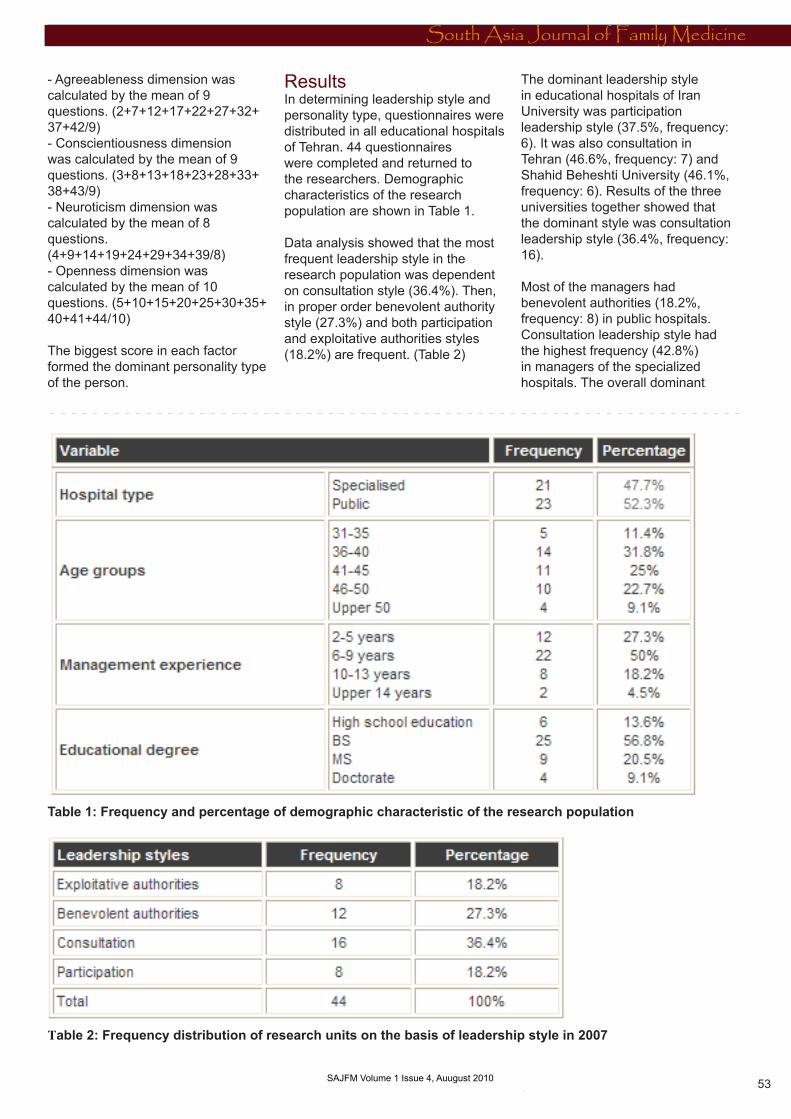
MIDDLE EAST JOURNAL OF FAMILY MEDICINE • VOLUME 7 , ISSUE 10 ��
South Asia Journal of Family Medicine
53 SAJFM Volume 1 Issue 4, Auugust 2010
Table 1: Frequency and percentage of demographic characteristic of the research population
Table 2: Frequency distribution of research units on the basis of leadership style in 2007
- Agreeableness dimension was calculated by the mean of 9 questions. (2+7+12+17+22+27+32+37+42/9)- Conscientiousness dimension was calculated by the mean of 9 questions. (3+8+13+18+23+28+33+38+43/9)- Neuroticism dimension was calculated by the mean of 8 questions.(4+9+14+19+24+29+34+39/8)- Openness dimension was calculated by the mean of 10 questions. (5+10+15+20+25+30+35+40+41+44/10)
The biggest score in each factor formed the dominant personality type of the person.
Results In determining leadership style and personality type, questionnaires were distributed in all educational hospitals of Tehran. 44 questionnaires were completed and returned to the researchers. Demographic characteristics of the research population are shown in Table 1.
Data analysis showed that the most frequent leadership style in the research population was dependent on consultation style (36.4%). Then, in proper order benevolent authority style (27.3%) and both participation and exploitative authorities styles (18.2%) are frequent. (Table 2)
The dominant leadership style in educational hospitals of Iran University was participation leadership style (37.5%, frequency: 6). It was also consultation in Tehran (46.6%, frequency: 7) and Shahid Beheshti University (46.1%, frequency: 6). Results of the three universities together showed that the dominant style was consultation leadership style (36.4%, frequency: 16). Most of the managers had benevolent authorities (18.2%, frequency: 8) in public hospitals. Consultation leadership style had the highest frequency (42.8%) in managers of the specialized hospitals. The overall dominant
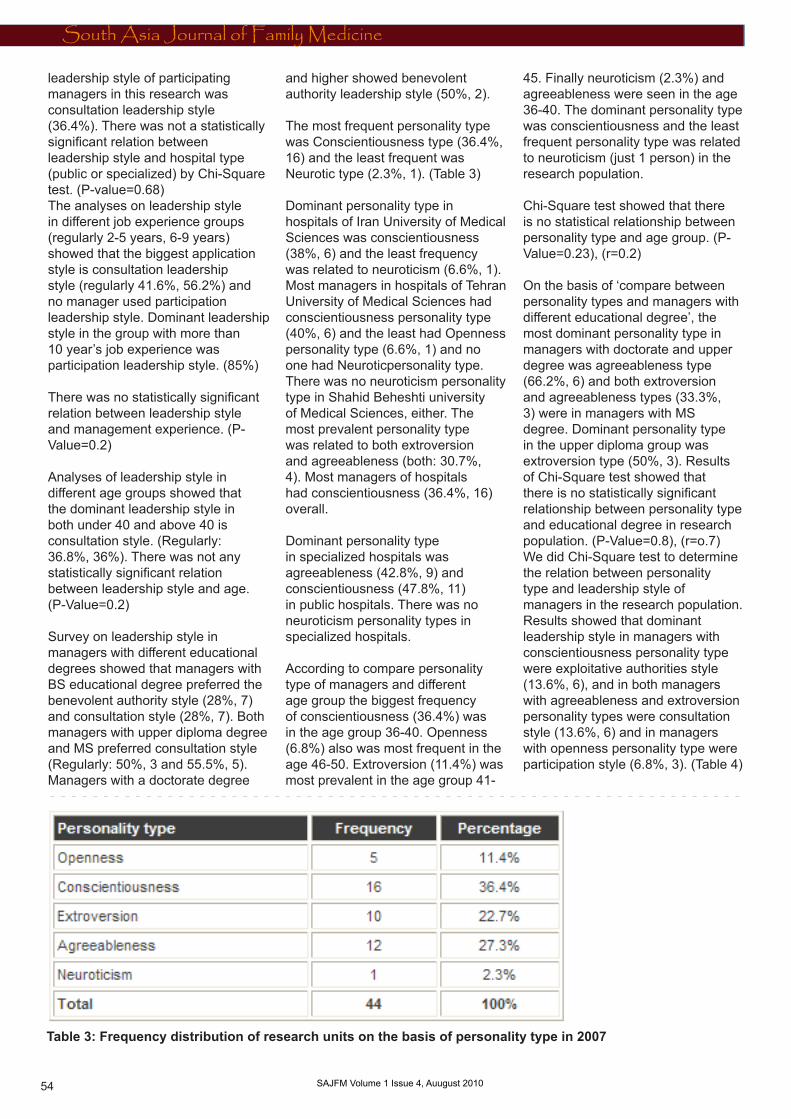
MIDDLE EAST JOURNAL OF FAMILY MEDICINE • VOLUME 7 , ISSUE 10��
South Asia Journal of Family Medicine
54 SAJFM Volume 1 Issue 4, Auugust 2010
leadership style of participating managers in this research was consultation leadership style (36.4%). There was not a statistically significant relation between leadership style and hospital type (public or specialized) by Chi-Square test. (P-value=0.68)The analyses on leadership style in different job experience groups (regularly 2-5 years, 6-9 years) showed that the biggest application style is consultation leadership style (regularly 41.6%, 56.2%) and no manager used participation leadership style. Dominant leadership style in the group with more than 10 year’s job experience was participation leadership style. (85%)
There was no statistically significant relation between leadership style and management experience. (P-Value=0.2)
Analyses of leadership style in different age groups showed that the dominant leadership style in both under 40 and above 40 is consultation style. (Regularly: 36.8%, 36%). There was not any statistically significant relation between leadership style and age. (P-Value=0.2)
Survey on leadership style in managers with different educational degrees showed that managers with BS educational degree preferred the benevolent authority style (28%, 7) and consultation style (28%, 7). Both managers with upper diploma degree and MS preferred consultation style (Regularly: 50%, 3 and 55.5%, 5). Managers with a doctorate degree
and higher showed benevolent authority leadership style (50%, 2).
The most frequent personality type was Conscientiousness type (36.4%, 16) and the least frequent was Neurotic type (2.3%, 1). (Table 3)
Dominant personality type in hospitals of Iran University of Medical Sciences was conscientiousness (38%, 6) and the least frequency was related to neuroticism (6.6%, 1). Most managers in hospitals of Tehran University of Medical Sciences had conscientiousness personality type (40%, 6) and the least had Openness personality type (6.6%, 1) and no one had Neuroticpersonality type. There was no neuroticism personality type in Shahid Beheshti university of Medical Sciences, either. The most prevalent personality type was related to both extroversion and agreeableness (both: 30.7%, 4). Most managers of hospitals had conscientiousness (36.4%, 16) overall.
Dominant personality type in specialized hospitals was agreeableness (42.8%, 9) and conscientiousness (47.8%, 11) in public hospitals. There was no neuroticism personality types in specialized hospitals.
According to compare personality type of managers and different age group the biggest frequency of conscientiousness (36.4%) was in the age group 36-40. Openness (6.8%) also was most frequent in the age 46-50. Extroversion (11.4%) was most prevalent in the age group 41-
45. Finally neuroticism (2.3%) and agreeableness were seen in the age 36-40. The dominant personality type was conscientiousness and the least frequent personality type was related to neuroticism (just 1 person) in the research population.
Chi-Square test showed that there is no statistical relationship between personality type and age group. (P-Value=0.23), (r=0.2)
On the basis of ‘compare between personality types and managers with different educational degree’, the most dominant personality type in managers with doctorate and upper degree was agreeableness type (66.2%, 6) and both extroversion and agreeableness types (33.3%, 3) were in managers with MS degree. Dominant personality type in the upper diploma group was extroversion type (50%, 3). Results of Chi-Square test showed that there is no statistically significant relationship between personality type and educational degree in research population. (P-Value=0.8), (r=o.7)We did Chi-Square test to determine the relation between personality type and leadership style of managers in the research population. Results showed that dominant leadership style in managers with conscientiousness personality type were exploitative authorities style (13.6%, 6), and in both managers with agreeableness and extroversion personality types were consultation style (13.6%, 6) and in managers with openness personality type were participation style (6.8%, 3). (Table 4)
Table 3: Frequency distribution of research units on the basis of personality type in 2007

MIDDLE EAST JOURNAL OF FAMILY MEDICINE • VOLUME 7 , ISSUE 10 ��
South Asia Journal of Family Medicine
55 SAJFM Volume 1 Issue 4, Auugust 2010
Table 4: Frequency distribution of research units on the basis of personality type and leadership style in 2007
Chi-Square test showed that there can be a statistically significant relationship between leadership style and personality type because test criterion is close to significant level. (P-Value=0.06), (r=0.8)
Conclusion This research studied the relation between personality type and leadership style of managers at educational hospitals affiliated with Iran, Tehran and Shahid Beheshti universities, according to necessity of manager’s familiarity with leadership theories, models and contexts. Considering that the complexity of organizations like hospitals, such as variety, multiplicity of services and specialties, commitment to people’s health and gigantic expenses of management hospitals, it seems
that little attention is paid to effective factors in managing hospitals activity and this can help managers to increase effectiveness of hospitals’ performance. Personality is one of the effective factors in making personal differences and some of the personality characteristics are related to effectiveness of leadership, so, this research is to the researcher, validated.
Much research has been done to evaluate and determine personality types in Iran. but, the instrument (“The big five factor” questionnaire) used in this research had not been used before to evaluate hospitals managers’ personality. This questionnaire’s value is its high power to identify different personality types.
We tried to identify 5 personality types (extroversion, conscientiousness, openness, agreeableness, neuroticism) and 4 leadership styles (Exploitative authorities, benevolent authorities, consultation and participation) with two standard instruments (“the big five factors” of Mc Crac and Roy Costa and “determining managers leadership style “ of Renesis Likert ).
We saw two processes in data analyses. As the managers’ progress scales and promotional ability increased, they tended to use team and task orientation styles more than country club and middle-of-the-road styles.
The dominant leadership style in managers with “openness personality type” was “participation” in this
MIDDLE EAST JOURNAL OF FAMILY MEDICINE • VOLUME 7 , ISSUE 10��
South Asia Journal of Family Medicine
56 SAJFM Volume 1 Issue 4, Auugust 2010
research. Sosik also showed that inventive and bold people understand their subordinates’ abilities better than others and give them more authority.
The dominant leadership styles in managers with “conscientiousness personality type” were “exploitative authorities and benevolent authorities styles”. People with conscientiousness personality type are less flexible in decision making and doing organizational duties. They have less trust of their subordinates’ abilities and give them less authority. Kipnis, Patiar and Raup also emphasized these points in their research.
The dominant leadership style in managers with “neuroticism personality type” was “benevolent authority”. These people usually were very empirical. They emphasize their own experiences and can hardly trust others, so they always try to control their subordinates’ jobs. The dominant leadership style in managers with “extroversion and agreeableness leadership styles” was “consultation”. Keegan, Liu, Suutari, Muller and Eden had found similar findings in their research. Keegan in his research conclusion said people with “agreeableness” personality type tend to attract others’ agreement. We also found when these people make decisions they tend to know their co-workers’ opinion and make decisions according to their votes. Liu also said these people tend to help others and they are not selfish toward them. Suutari discussed that having “agreeableness” personality type is directly related to job success. Consultation leadership style is the progressive leadership style in many management references. So, one probable reason that makes the agreeable people choose this leadership style is their tendency to group succession in an organization.Research results demonstrated that the dominant leadership style of managers in this research population was “consultation” style and then regularly was “benevolent authorities” style, “exploiting authorities” style, then “participation” style. Chi-Square test showed there is a
relation between personality type and leadership style. Although these research results do not show their relation exactly, it seemed that in a bigger population it may be statistically significant because test criterion is too close to critical number. (P-Value<0.05)
Health service managers are expected to have enough specialties to manage a hospital so they should act very tactfully and scientifically in employing human resources. They should both use personnel specialties and achieve organization goals. “John Holand” in his theory about proportion between job and people personality said people who have a proper job matched to their personality are more satisfied and have higher performance in their job. It seems that if we use instruments such as the big five factors they can help decision makers and administrators to recognize managers before their appointment and to predict the managers’ future performanc especially in the leadership zone of human resources in hospitals.
Some practical solutions are as follows:- holding educational workshops about leadership styles and explaining good qualities, defects and application situation of each leadership style in order to inform managers of the Ministry of Public Health, Medical Care and Medical Education.- Informing managers about their leadership style and its effectiveness on subordinate employees’ performance. - Informing managers and supervisors about different personality types and individual differences of subordinates.
References 1. Mäkilouko. M. Coping with multicultural projects: the leadership styles of Finnish project managers. International Journal of Project Management, Volume 22, Issue 5, July 2004, Pages 387-3962. Kalma. A, et al Sociable and aggressive dominance: Personality differences in leadership style?. The
Leadership Quarterly, Volume 4, Issue 1, Spring 1993, Pages 45-64.3. Green. S, Nebeker. N. The effects of situational factors and leadership style on leader behavior. Organizational Behavior and Human Performance, Volume 19, Issue 2, August 1977, Pages 368-3774. McColl-Kennedy. J. R, Anderson. R. D. Subordinate-manager gender combination and perceived leadership style influence on emotions, self-esteem and organizational commitment. Journal of Business Research, Volume 58, Issue 2, February 2005, Pages 115-1255. Fey. C, Adaeva. M, Vitkovskaia. A. Developing a model of leadership styles: what works best in Russia?. International Business Review, Volume 10, Issue 6, December 2001, Pages 615-6436. Weed. S, Mitchell. T, Moffitt. W. Leadership style, subordinate personality, and task type as predictors of performance and satisfaction with supervision. Journal of Applied Psychology, Volume 61, Issue 1, February 1976, Pages 58-66.7. Lajavardi. F. Management procedures of private and public hospitals in Tehran and its influence on patients’ satisfaction. Free Islamic University. Research science unit. Thesis of health service management.1996.8. Minett. D, Yaman. H, Denizci. B. Leadership styles and ethical decision-making in hospitality management. International Journal of Hospitality Management, In Press, Corrected Proof, Available online 23 February 2009.9. Shahabi. Z. A survey on A, B personality types and pessimism and optimism in employees of governmental offices in Tehran. Thesis of MS. Schools of training sciences. 2006.10. Taghinasab. A. A survey on relationship between management’s leadership and organizational health in boys’ junior high schools at Robatkarim. Thesis of MS. Shahid Beheshti School of training sciences.2006.11. Sedighi. K. Relationship among managers’ leadership style, personality type and amount

MIDDLE EAST JOURNAL OF FAMILY MEDICINE • VOLUME 7 , ISSUE 10 ��
South Asia Journal of Family Medicine
57 SAJFM Volume 1 Issue 4, Auugust 2010
of employees’ stress in jahade Sazandegi and keshavarzi organizations at Hamedan province. Tarbiat Modares University. Tehran. 1997. 12. Sridhar. G.R, et al. Electronic medical records and hospital management systems for management of diabetes. Diabetes and Metabolic Syndrome: Clinical Research and Reviews, Volume 3, Issue 1, January-March 2009, Pages 55-5913. Byszewski. A, et al. Evaluation of in-hospital management of fracture risk in older patients: A chart review study of tertiary prevention. Archives of Gerontology and Geriatrics, Volume 42, Issue 3, May-June 2006, Pages 319-32814. Kenneth. H, Gill. L, Schwartz. R. Gaining hospital administrators’ attention: Ways to improve physician-hospital management dialogue. Surgery, Volume 137, Issue 2, February 2005, Pages 132-14015. Mills. A, Broomberg. J. A Comparative Analysis of Hospital Management Systems in South Africa. Advances in Health Care Management, Volume 5, 2005, Pages 73-10016. Forgionne.G. A, Kohli. R. The decision value of management support systems for strategic hospital management. International Transactions in Operational Research, Volume 2, Issue 4, October 1995, Pages 355-37317. Raup. G. H. The Impact of ED Nurse Manager Leadership Style on Staff Nurse Turnover and Patient Satisfaction in Academic Health Center Hospitals. Journal of Emergency Nursing, Volume 34, Issue 5, October 2008, Pages 403-40918. Jensen. T. D, et al. Impact of gender, hierarchial position, and leadership styles on work-related values. Journal of Business Research, Volume 20, Issue 2, March 1990, Pages 145-152.19. Darabi. J. Personality psychology theories, Ayij publisher. First edition. 2005.20. Sosik. J, Dinger. S. L. Relationships between leadership style and vision content: The moderating role of need for social approval, self-monitoring, and need
for social power. The Leadership Quarterly, Volume 18, Issue 2, April 2007, Pages 134-15321. Kipnis. D. The effects of leadership style and leadership power upon the inducement of an attitude change. Journal of Abnormal and Social Psychology, Volume 57, Issue 2, September 1958, Pages 173-18022. Patiar. A, Mia. L. Transformational leadership style, market competition and departmental performance: Evidence from luxury hotels in Australia. International Journal of Hospitality Management, Volume 28, Issue 2, June 2009, Pages 254-26223. Raup. G. The Impact of ED Nurse Manager Leadership Style on Staff Nurse Turnover and Patient Satisfaction in Academic Health Center Hospitals. Journal of Emergency Nursing, Volume 34, Issue 5, October 2008, Pages 403-40924. Keegan. A, Den Hartog. D. Transformational leadership in a project-based environment: a comparative study of the leadership styles of project managers and line managers. International Journal of Project Management, Volume 22, Issue 8, November 2004, Pages 609-61725. Liu. W, et al. Matching leadership styles with employment modes: strategic human resource management perspective. Human Resource Management Review, Volume 13, Issue 1, 2003, Pages 127-15226. Suutari. V, Riusala. K. Leadership styles in Central Eastern Europe: Experiences of Finnish expatriates in the Czech Republic, Hungary and Poland. Scandinavian Journal of Management, Volume 17, Issue 2, June 2001, Pages 249-28027. Müller. R, Turner. J. Matching the project manager’s leadership style to project type. International Journal of Project Management, Volume 25, Issue 1, January 2007, Pages 21-3228. Eden. D, et al. Implanting pygmalion leadership style through workshop training: Seven field experiments. The Leadership Quarterly, Volume 11, Issue 2, 1 June 2000, Pages 171-210
29. Bourantas. D. Leadership styles, need satisfaction and the organizational commitment of Greek managers. Scandinavian Journal of Management, Volume 4, Issues 3-4, 1988, Pages 121-134
MIDDLE EAST JOURNAL OF FAMILY MEDICINE • VOLUME 7 , ISSUE 10��
South Asia Journal of Family Medicine
58 SAJFM Volume 1 Issue 4, Auugust 2010
The Role of Adenotonsillectomy in Patients with Otitis Media with Effusion
Mohammad Al-Rawashdeh
Correspondence:Mohammad Al-Rawashdeh, MDDepartment of ENT at Prince Zaid Ben Al-Hussein Hospital of the Royal Medical Services. Email: [email protected]
ABSTRACT Introduction: To evaluate the efficacy of adenotonsillectomy at the time of myringotomy with insertion of tympanostomy tube on the impact of otitis media with effusion in comparison with tympanostomy-tube placement only.
Patients and methods: A prospective randomised study that was conducted at Prince Zaid Ben Al-Hussein Hospital in Tafela city in southern Jordan during the period between August 2006 and August 2008. One hundred and fifty patients with Otitis media with effusion were enrolled in the study. Patients were randomised into two groups of 75 patients in each group. The study group had adenotosillectomy at the time of myringotomy with insertion of tympanostomy tube while the control group had myringotomy with insertion of tympanostomy tube alone. The occurrence rate of acute otitis media after surgery was compared in both groups. Patients were followed up for 2 years after operation.
Results: The mean age of patients was 3.3 years (range 8 months to 14.6 years) with a male to female ratio of 1.1:1. The mean annual rate of episodes of acute otitis media after surgery was 1.1 and 2.4 in study and control group respectively compared to 3.7 and 3.6 before surgery.
Conclusion: Adenotonsillectomy combined with myringotomy and insertion of tympanostomy tube appears to be more effective in reducing the episodes of otitis media than myringotomy and insertion of tympanostomy tube alone.
Keywords: otitis media, effusion, adenotonsillectomy and myringotomy
Introduction Otitis media is one of the most common disorders of childhood and commonly followed by frequent recurrence or otitis media with effusion (1-3). Standard treatment of the latter is myringotomy with insertion of a tympanostomy tube to facilitate drainage of fluid and to prevent otitis media (4-6).
In several randomised trials adenotonsillectomy performed at the time of myringotomy with insertion of tympanostomy tubes better outcomes were obtained (7-9). On the other hands some trials did not show this evidence (10-11).
The aim of the study was to evaluate the efficacy of adenotonsillectomy at the time of myringotomy with insertion of tympanostomy tube on the impact of otitis media with effusion in comparison with tympanostomy-tube placement only. Methods This was a prospective randomised study that was conducted at Prince Zaid Ben Al-Hussein Hospital in Tafela city at southern Jordan during the period between August 2006 and August 2008. One hundred and fifty patients with Otitis media with effusion were enrolled in the study. Patients were randomised into two groups of 75 patients in each group. The study group had adenotosillectomy at the time of myringotomy with insertion of tympanostomy tube while the control group had myringotomy with insertion of tympanostomy tube alone. Exclusion criteria included patients
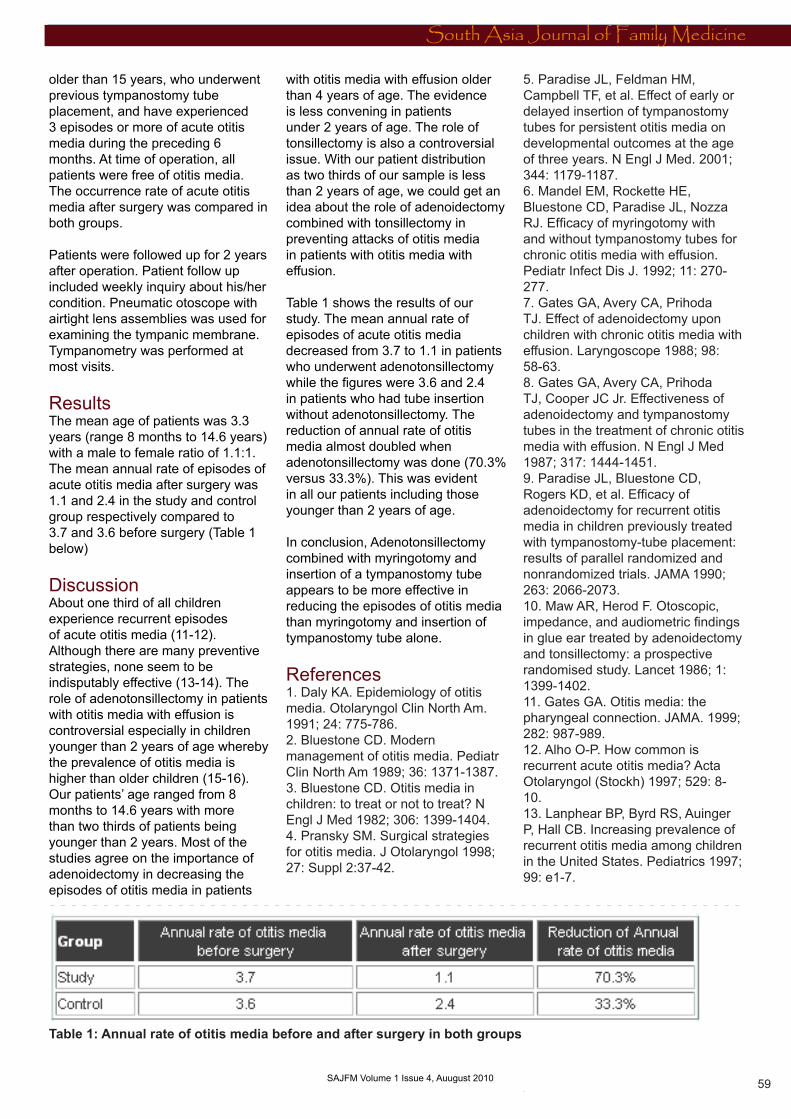
MIDDLE EAST JOURNAL OF FAMILY MEDICINE • VOLUME 7 , ISSUE 10 ��
South Asia Journal of Family Medicine
59 SAJFM Volume 1 Issue 4, Auugust 2010
older than 15 years, who underwent previous tympanostomy tube placement, and have experienced 3 episodes or more of acute otitis media during the preceding 6 months. At time of operation, all patients were free of otitis media. The occurrence rate of acute otitis media after surgery was compared in both groups.
Patients were followed up for 2 years after operation. Patient follow up included weekly inquiry about his/her condition. Pneumatic otoscope with airtight lens assemblies was used for examining the tympanic membrane. Tympanometry was performed at most visits.
Results The mean age of patients was 3.3 years (range 8 months to 14.6 years) with a male to female ratio of 1.1:1. The mean annual rate of episodes of acute otitis media after surgery was 1.1 and 2.4 in the study and control group respectively compared to 3.7 and 3.6 before surgery (Table 1 below)
Discussion About one third of all children experience recurrent episodes of acute otitis media (11-12). Although there are many preventive strategies, none seem to be indisputably effective (13-14). The role of adenotonsillectomy in patients with otitis media with effusion is controversial especially in children younger than 2 years of age whereby the prevalence of otitis media is higher than older children (15-16). Our patients’ age ranged from 8 months to 14.6 years with more than two thirds of patients being younger than 2 years. Most of the studies agree on the importance of adenoidectomy in decreasing the episodes of otitis media in patients
with otitis media with effusion older than 4 years of age. The evidence is less convening in patients under 2 years of age. The role of tonsillectomy is also a controversial issue. With our patient distribution as two thirds of our sample is less than 2 years of age, we could get an idea about the role of adenoidectomy combined with tonsillectomy in preventing attacks of otitis media in patients with otitis media with effusion.
Table 1 shows the results of our study. The mean annual rate of episodes of acute otitis media decreased from 3.7 to 1.1 in patients who underwent adenotonsillectomy while the figures were 3.6 and 2.4 in patients who had tube insertion without adenotonsillectomy. The reduction of annual rate of otitis media almost doubled when adenotonsillectomy was done (70.3% versus 33.3%). This was evident in all our patients including those younger than 2 years of age.
In conclusion, Adenotonsillectomy combined with myringotomy and insertion of a tympanostomy tube appears to be more effective in reducing the episodes of otitis media than myringotomy and insertion of tympanostomy tube alone.
References 1. Daly KA. Epidemiology of otitis media. Otolaryngol Clin North Am. 1991; 24: 775-786.2. Bluestone CD. Modern management of otitis media. Pediatr Clin North Am 1989; 36: 1371-1387. 3. Bluestone CD. Otitis media in children: to treat or not to treat? N Engl J Med 1982; 306: 1399-1404. 4. Pransky SM. Surgical strategies for otitis media. J Otolaryngol 1998; 27: Suppl 2:37-42.
5. Paradise JL, Feldman HM, Campbell TF, et al. Effect of early or delayed insertion of tympanostomy tubes for persistent otitis media on developmental outcomes at the age of three years. N Engl J Med. 2001; 344: 1179-1187. 6. Mandel EM, Rockette HE, Bluestone CD, Paradise JL, Nozza RJ. Efficacy of myringotomy with and without tympanostomy tubes for chronic otitis media with effusion. Pediatr Infect Dis J. 1992; 11: 270-277.7. Gates GA, Avery CA, Prihoda TJ. Effect of adenoidectomy upon children with chronic otitis media with effusion. Laryngoscope 1988; 98: 58-63. 8. Gates GA, Avery CA, Prihoda TJ, Cooper JC Jr. Effectiveness of adenoidectomy and tympanostomy tubes in the treatment of chronic otitis media with effusion. N Engl J Med 1987; 317: 1444-1451. 9. Paradise JL, Bluestone CD, Rogers KD, et al. Efficacy of adenoidectomy for recurrent otitis media in children previously treated with tympanostomy-tube placement: results of parallel randomized and nonrandomized trials. JAMA 1990; 263: 2066-2073. 10. Maw AR, Herod F. Otoscopic, impedance, and audiometric findings in glue ear treated by adenoidectomy and tonsillectomy: a prospective randomised study. Lancet 1986; 1: 1399-1402. 11. Gates GA. Otitis media: the pharyngeal connection. JAMA. 1999; 282: 987-989. 12. Alho O-P. How common is recurrent acute otitis media? Acta Otolaryngol (Stockh) 1997; 529: 8-10. 13. Lanphear BP, Byrd RS, Auinger P, Hall CB. Increasing prevalence of recurrent otitis media among children in the United States. Pediatrics 1997; 99: e1-7.
Table 1: Annual rate of otitis media before and after surgery in both groups
MIDDLE EAST JOURNAL OF FAMILY MEDICINE • VOLUME 7 , ISSUE 10�0
South Asia Journal of Family Medicine
60
14. Sade J, Luntz M. Adenoidectomy in otitis media-a review. Ann Otol Rhinol Laryngol 1991; 100: 226-31.15. Casselbrant ML, Kaleida PH, Rockette HE, Paradise JL, Bluestone CD, Kurs-Lasky M. Efficacy of antimicrobial prophylaxis and of tympanostomy tube insertion for prevention of recurrent acute otitis media: results of a randomized clinical trial. Pediatr Infect Dis J 1992; 11: 278-86.16. Teele DW, Klein JO, Rosner B. Epidemiology of otitis media during the first seven years of life in children in greater Boston: a prospective, cohort study. J Infect Dis. 1989; 160: 83-94.
References continued from page 21 - Diabetic Detinopathy)
47. AliFA. A review of diabetic macular oedema. Digital Journal of ophthalmology 1997:3(6): 48. Dowler JGF. Laser management of diabetic retinopathy. Journal of the royal society of medicine 2003; 96(277): 277-279. 49. Ohkubo Y, Kishikawa H, Araki E. et al: Intensive insulin therapy prevents the progression of diabetic microvascular complications in Japanese patients with non-insulin-dependent diabetes mellitus: a randomized prospective 6-year study. Diabetes Res Clin Pract 1995; 28: 103-11750. Klein R, Zinman B, Gardiner R. et al: The Relationship of Diabetic Retinopathy to Preclinical Diabetic Glomerulopathy lesions in Type 1 Diabetic Patients. Diabetes. February 2005 54:527-533
References continued from page 44 - Study of Refractive Errors among schoolchildren in Doha) 96. Mutti DO, Mitchell GL, Moeschberger ML, et al. Parental myopia, near work, school achievement, and children’s refractive error. Invest Ophthalmol Vis Sci. 2002;43:3633-3640. 97. Jones LA, Sinnott LT, Mutti DO, et al. Parental history of myopia, sports and outdoor activities, and future myopia. Invest Ophthalmol Vis Sci. 2007;48:3524-3532.98. Khandekar R, Al Harby S, Mohammed AJ. Determinants of Myopia among Omani School Children: a Case-Control study, Ophthalmic Epidemiol, 2005; 12 (3): 207-13.
Copyright © 2022 FDOKUMEN