Determinants of Time to Treatment Dropout among ...
15
Determinants of Time to Treatment Dropout among Tuberculosis Patients in Buno-Bedele and Illu Ababora Zones, Oromia Regional State, Ethiopia WOLDEMARIAM GOBENA ( [email protected] ) Mettu University DEREJE ABABU Mettu University AZMERAW GETANEH Mettu University Research Article Keywords: Tuberculosis, HIV co-infection, Cox-regression Posted Date: April 30th, 2021 DOI: https://doi.org/10.21203/rs.3.rs-322443/v1 License: This work is licensed under a Creative Commons Attribution 4.0 International License. Read Full License
-
Upload
khangminh22 -
Category
Documents
-
view
0 -
download
0
Transcript of Determinants of Time to Treatment Dropout among ...
Determinants of Time to Treatment Dropout amongTuberculosis Patients in Buno-Bedele and IlluAbabora Zones, Oromia Regional State, EthiopiaWOLDEMARIAM GOBENA ( [email protected] )
Mettu UniversityDEREJE ABABU
Mettu UniversityAZMERAW GETANEH
Mettu University
Research Article
Keywords: Tuberculosis, HIV co-infection, Cox-regression
Posted Date: April 30th, 2021
DOI: https://doi.org/10.21203/rs.3.rs-322443/v1
License: This work is licensed under a Creative Commons Attribution 4.0 International License. Read Full License
v
Determinants of Time to Treatment Dropout among Tuberculosis Patients in
Buno-Bedele and Illu Ababora Zones, Oromia Regional State, Ethiopia
Woldemariam Erkalo 1* (Email: [email protected]; ORCID iD: 0000-0002-0215-3436)
Dereje Gebeyehu 2 (Email: [email protected])
Azmeraw Misganaw 3 (Email: [email protected])
ABSTRACT
Objective: The study was aimed to investigate the determinants of time to drop out of treatment
for TB patients.
Results: From 375 patients who started TB treatments about 24.8% dropout and 75.2% censored
at the end of the study and the median survival time of TB patients were 199 days. The Log-rank
results showed that marital status, HIV co infection, Diabetic mellitus, Cancer and Anemia cases
had significant difference between the survival experience at 5% level of significance, whose
different levels have an impact in the survival time of TB patients; whereas Sex, Phase of TB
treatment, TB type, TB category, previous TB status, co-morbidity, and physical inactive had not
significant difference between the survival experience at 5% level of significance. Finally, the
result of Cox-proportion hazard model showed that, age, HIV co-infection and Anemia had a
significant effect on tuberculosis patients during the study period.
Keywords: Tuberculosis; HIV co-infection; Cox-regression
2
Introduction
Tuberculosis (TB) is a chronic infectious disease caused by Mycobacterium tuberculosis (MTB).
TB typically affects the lungs (pulmonary tube) but, can affect other parts of the body as well
(extra pulmonary tube). The Global tuberculosis report showed that TB now ranks above HIV as
a leading cause of death worldwide [2]. An estimated incidence for the year 2015 of TB in
Ethiopia was 191/100,000 population. In addition, as the national surveys on the burden of TB
epidemic showed 31% - 41% of TB patients are HIV positive [3]. The previous study shows that
the prevalence of delayed presentation for HIV care among TB/HIV co-infected patients was
59.9 %. The study also shows tobacco non-users of TB/HIV co-infected participants were also
50 % less likely to present late for HIV care compared to tobacco users. The relative odds of
delayed presentation among Tb/HIV co-infected patients with ambulatory and bedridden
functional status was higher than with working status [4]. The aim of this study is to identify risk
factors that affect Survival Time to Drop out treatment among TB patients in case of Buno-
Bedele and Illu Aba Bora zones, Oromia, Ethiopia.
Methods:
Secondary data was used from 375 TB patients of the selected health stations and hospitals at
Buno-Bedele and Illu Aba Bora Zones. The response variable for this study was the survival time
(Time to dropout the treatment among TB patients) measured in days and the covariates were
gender of the patient, marital status, HIV co-infection, Phase of TB treatment, TB type, TB
category, Previous TB history, HIV Co infection, Anemia and Physical inactivity.

3
Survival function
In order to estimate the survival function, the estimator proposed by Kaplan and Meier takes into
account for censoring by adjusting the number of subjects at risk,
𝑆𝑘𝑚(𝑡)= ∏ [1 − 𝑑𝑖𝑛𝑖]𝑖:𝑡(𝑖)≤𝑡 (1)
Where 𝑡(𝑖)denote the distinct ordered times of Drop out and, 𝑑𝑖 and 𝑛𝑖 denote the number of
events and the number of individuals still at risk at time 𝑡𝑖, respectively.
Comparison of Survival Curves
Kaplan-Meier method for estimating survival curves and the log-rank test for comparing two
estimated survival curves are the most frequently used statistical tools in medical reports on
survival data.
Log-rank test
The log rank test is a non-parametric test for comparing two or more independent survival
curves. The log rank test statistic for comparing two groups is given by:
𝑄 = [∑ 𝑤𝑖(𝑑1𝑖−𝑒1�̂�)𝑚𝑖=1 ]2∑ 𝑤𝑖𝑣1�̂�𝑚𝑖=1 (2)
Where: 𝑚 is the number of rank ordered event times, 𝑑1𝑖 is the observed number of events in
group one at event time 𝑡𝑖, 𝑒1�̂� = 𝑛1𝑖−𝑑𝑖𝑛𝑖 is the expected number of events corresponding to 𝑑1𝑖, 𝑛1𝑖 is the number of individuals at risk in group1 just prior to event time 𝑡𝑖,𝑛2𝑖 is the number
of individuals at risk in group 2 just prior to event time 𝑡𝑖, 𝑣1�̂� = 𝑛1𝑖𝑛2𝑖𝑑𝑖(𝑛𝑖−𝑑𝑖)𝑛𝑖2(𝑛𝑖−1) (3)
4
is the variance of the number of events d1i at time ti , ni and di are the number of individuals at
risk and number of vascular complication in both groups ( i.e., group 1 and group 2) just prior to
event time ti, respectively.
The Cox (‘Semi-Parametric’) Proportional Hazards Model
It is a survival analysis regression model, which describes the relation between the event
incidence as expressed by the hazard function and a set of covariates. Mathematically, the Cox
model is written as;
h(t)= h0(t)*exp (b1x1
+ b2
x2
+…..+bp
xp
) (4)
where the hazard function h(t) is dependent on (or determined by) a set of p covariates (x1, x2,
…, xp), whose impact is measured by the size of the respective coefficients (b1, b2,.., bp). The
term h0 (t) is called the baseline hazard, and is the value of the hazard if all the xi are equal to
zero (the quantity exp (0) equals 1). The‘t’ in h (t) reminds us that the hazard may (and probably
will) vary over time.
RESULTS
Descriptive Statistics
A total of 375 TB patients those treated during the study period were included in the study for
which data for variables of interest are complete. Of all 375 TB patients 282(75.2%) were
censored or not experienced the event and 93(24.8%) were patients dropout. The estimated
median survival time of TB patient was 199(182.144, 215.856) days. Of the total of 375 patients
included, 184 (49.3%) and 189(50.7%) were Females and males respectively and their median of
survival time was 198 and 220 days respectively. See table 1.
5
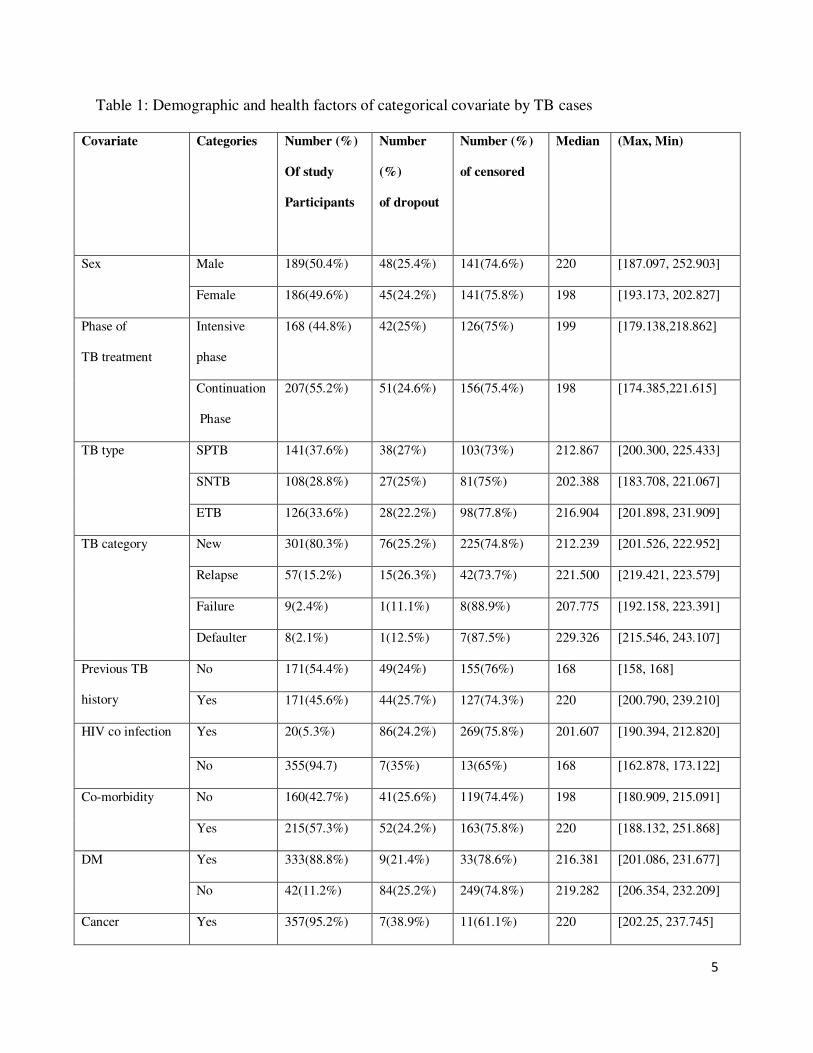
Table 1: Demographic and health factors of categorical covariate by TB cases
Covariate Categories Number (%)
Of study
Participants
Number
(%)
of dropout
Number (%)
of censored
Median (Max, Min)
Sex Male 189(50.4%) 48(25.4%) 141(74.6%) 220 [187.097, 252.903]
Female 186(49.6%) 45(24.2%) 141(75.8%) 198 [193.173, 202.827]
Phase of
TB treatment
Intensive
phase
168 (44.8%) 42(25%) 126(75%) 199 [179.138,218.862]
Continuation
Phase
207(55.2%) 51(24.6%) 156(75.4%) 198 [174.385,221.615]
TB type SPTB 141(37.6%) 38(27%) 103(73%) 212.867 [200.300, 225.433]
SNTB 108(28.8%) 27(25%) 81(75%) 202.388 [183.708, 221.067]
ETB 126(33.6%) 28(22.2%) 98(77.8%) 216.904 [201.898, 231.909]
TB category New 301(80.3%) 76(25.2%) 225(74.8%) 212.239 [201.526, 222.952]
Relapse 57(15.2%) 15(26.3%) 42(73.7%) 221.500 [219.421, 223.579]
Failure 9(2.4%) 1(11.1%) 8(88.9%) 207.775 [192.158, 223.391]
Defaulter 8(2.1%) 1(12.5%) 7(87.5%) 229.326 [215.546, 243.107]
Previous TB
history
No 171(54.4%) 49(24%) 155(76%) 168 [158, 168]
Yes 171(45.6%) 44(25.7%) 127(74.3%) 220 [200.790, 239.210]
HIV co infection Yes 20(5.3%) 86(24.2%) 269(75.8%) 201.607 [190.394, 212.820]
No 355(94.7) 7(35%) 13(65%) 168 [162.878, 173.122]
Co-morbidity No 160(42.7%) 41(25.6%) 119(74.4%) 198 [180.909, 215.091]
Yes 215(57.3%) 52(24.2%) 163(75.8%) 220 [188.132, 251.868]
DM Yes 333(88.8%) 9(21.4%) 33(78.6%) 216.381 [201.086, 231.677]
No 42(11.2%) 84(25.2%) 249(74.8%) 219.282 [206.354, 232.209]
Cancer Yes 357(95.2%) 7(38.9%) 11(61.1%) 220 [202.25, 237.745]
6
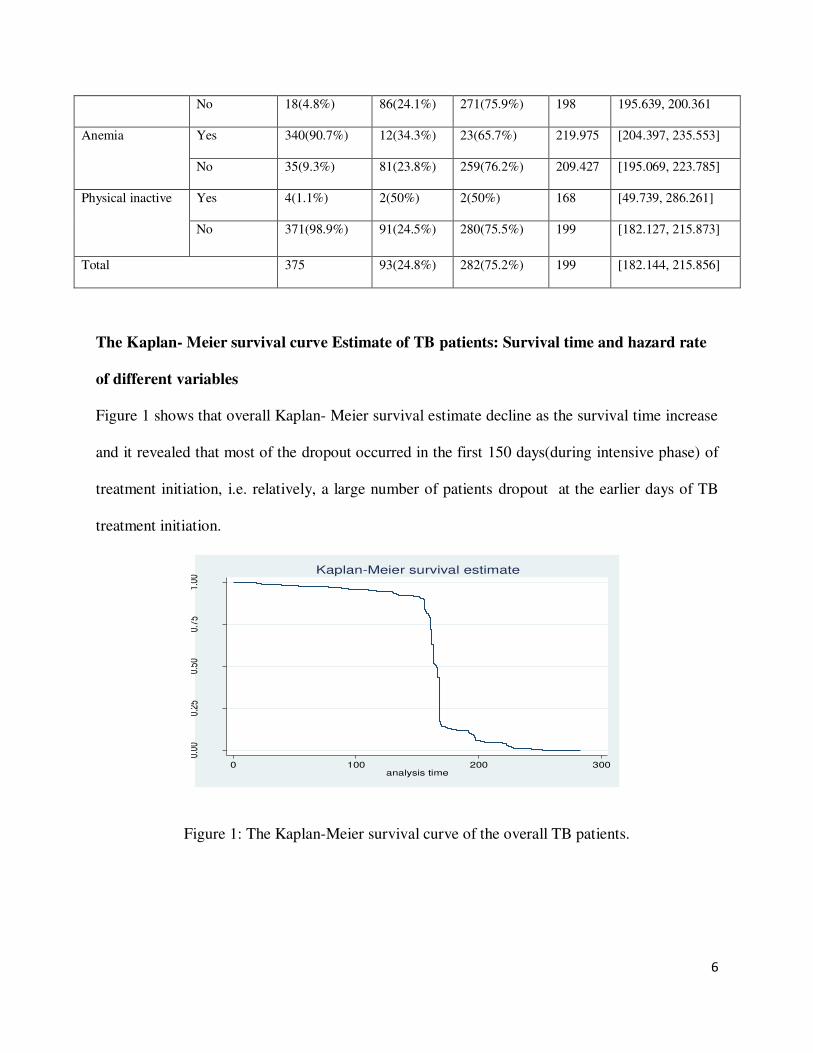
No 18(4.8%) 86(24.1%) 271(75.9%) 198 195.639, 200.361
Anemia Yes 340(90.7%) 12(34.3%) 23(65.7%) 219.975 [204.397, 235.553]
No 35(9.3%) 81(23.8%) 259(76.2%) 209.427 [195.069, 223.785]
Physical inactive Yes 4(1.1%) 2(50%) 2(50%) 168 [49.739, 286.261]
No 371(98.9%) 91(24.5%) 280(75.5%) 199 [182.127, 215.873]
Total 375 93(24.8%) 282(75.2%) 199 [182.144, 215.856]
The Kaplan- Meier survival curve Estimate of TB patients: Survival time and hazard rate
of different variables
Figure 1 shows that overall Kaplan- Meier survival estimate decline as the survival time increase
and it revealed that most of the dropout occurred in the first 150 days(during intensive phase) of
treatment initiation, i.e. relatively, a large number of patients dropout at the earlier days of TB
treatment initiation.
Figure 1: The Kaplan-Meier survival curve of the overall TB patients.
0.00
0.25
0.50
0.75
1.00
0 100 200 300analysis time
Kaplan-Meier survival estimate
7
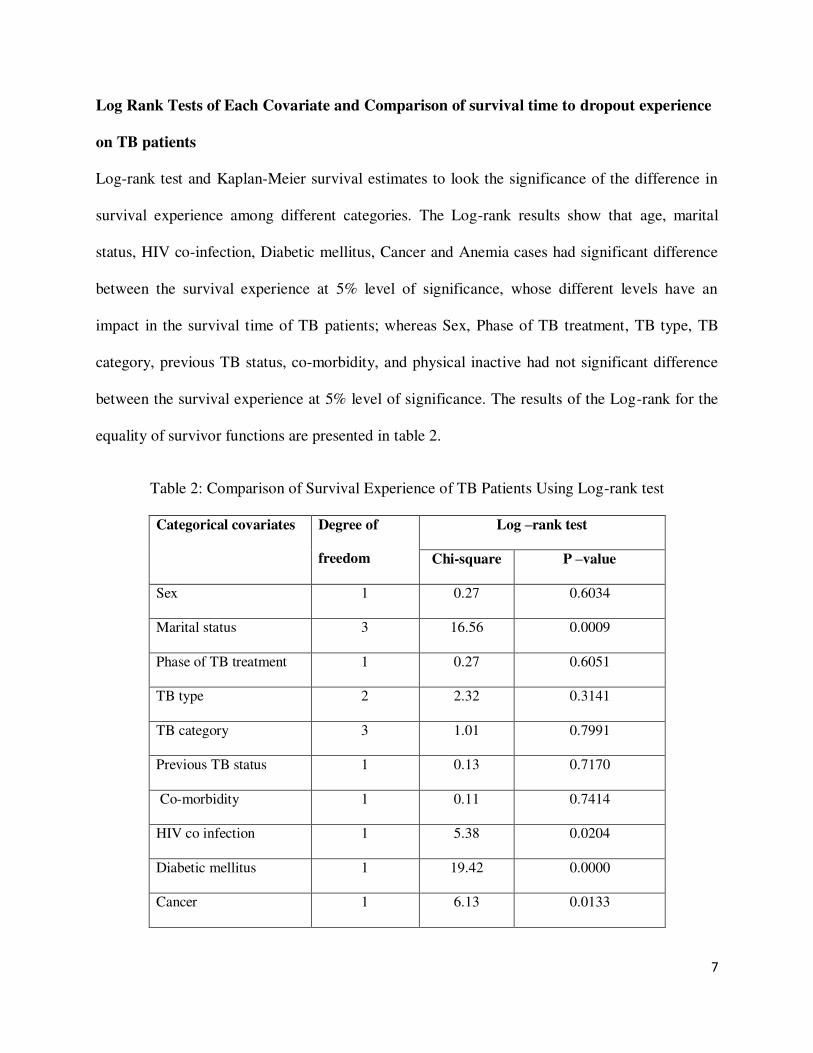
Log Rank Tests of Each Covariate and Comparison of survival time to dropout experience
on TB patients
Log-rank test and Kaplan-Meier survival estimates to look the significance of the difference in
survival experience among different categories. The Log-rank results show that age, marital
status, HIV co-infection, Diabetic mellitus, Cancer and Anemia cases had significant difference
between the survival experience at 5% level of significance, whose different levels have an
impact in the survival time of TB patients; whereas Sex, Phase of TB treatment, TB type, TB
category, previous TB status, co-morbidity, and physical inactive had not significant difference
between the survival experience at 5% level of significance. The results of the Log-rank for the
equality of survivor functions are presented in table 2.
Table 2: Comparison of Survival Experience of TB Patients Using Log-rank test
Categorical covariates Degree of
freedom
Log –rank test
Chi-square P –value
Sex 1 0.27 0.6034
Marital status 3 16.56 0.0009
Phase of TB treatment 1 0.27 0.6051
TB type 2 2.32 0.3141
TB category 3 1.01 0.7991
Previous TB status 1 0.13 0.7170
Co-morbidity 1 0.11 0.7414
HIV co infection 1 5.38 0.0204
Diabetic mellitus 1 19.42 0.0000
Cancer 1 6.13 0.0133
8
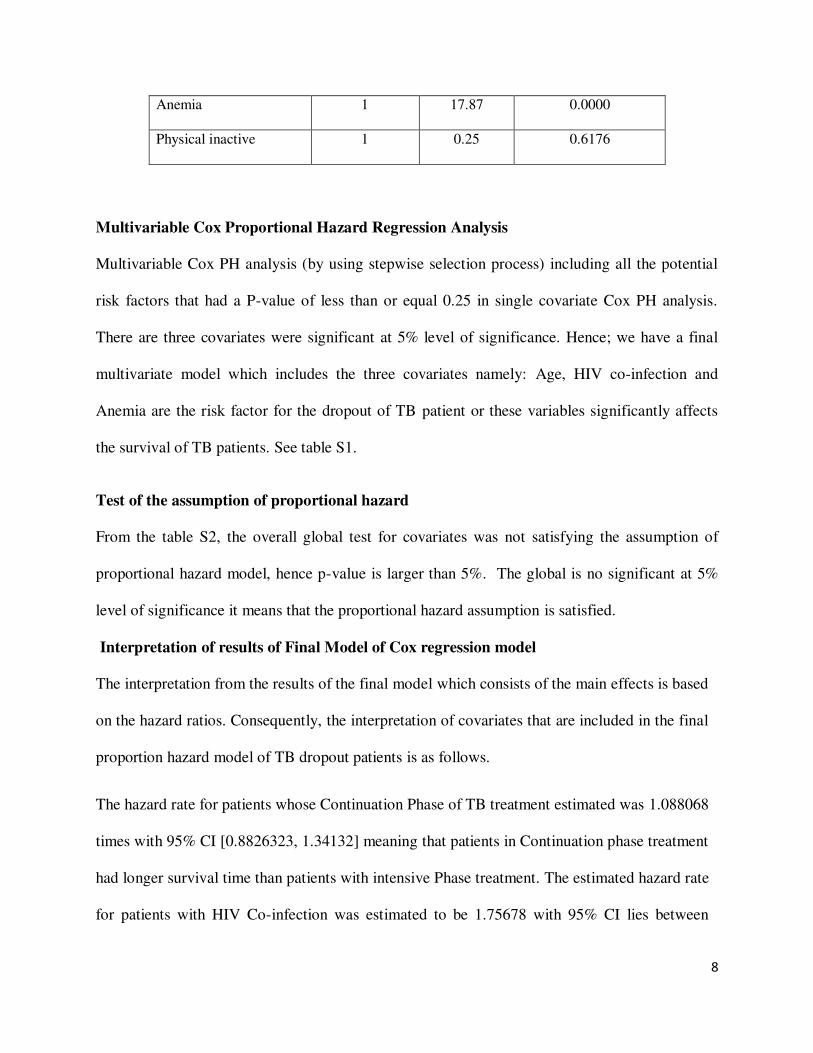
Anemia 1 17.87 0.0000
Physical inactive 1 0.25 0.6176
Multivariable Cox Proportional Hazard Regression Analysis
Multivariable Cox PH analysis (by using stepwise selection process) including all the potential
risk factors that had a P-value of less than or equal 0.25 in single covariate Cox PH analysis.
There are three covariates were significant at 5% level of significance. Hence; we have a final
multivariate model which includes the three covariates namely: Age, HIV co-infection and
Anemia are the risk factor for the dropout of TB patient or these variables significantly affects
the survival of TB patients. See table S1.
Test of the assumption of proportional hazard
From the table S2, the overall global test for covariates was not satisfying the assumption of
proportional hazard model, hence p-value is larger than 5%. The global is no significant at 5%
level of significance it means that the proportional hazard assumption is satisfied.
Interpretation of results of Final Model of Cox regression model
The interpretation from the results of the final model which consists of the main effects is based
on the hazard ratios. Consequently, the interpretation of covariates that are included in the final
proportion hazard model of TB dropout patients is as follows.
The hazard rate for patients whose Continuation Phase of TB treatment estimated was 1.088068
times with 95% CI [0.8826323, 1.34132] meaning that patients in Continuation phase treatment
had longer survival time than patients with intensive Phase treatment. The estimated hazard rate
for patients with HIV Co-infection was estimated to be 1.75678 with 95% CI lies between
9
[1.112293 and 2.774715]. P-value is less than 0.05, Meaning, patients with HIV Co-infection
had 1.75678 times higher risk of TB treatment drop out than patients who didn’t have HIV Co-
infection.
Parametric Regression Analysis
For the data on TB patients, the parametric models were fitted. The common applicable criterion
to select the model is the AIC statistic proposed by Akaikie (1983). From table S3, the Weibul
regression model has the least AIC value which shows that the Weibul regression model well
fitted to data TB patients.
Discussion
This research was conducted to identify predictors of drop out of treatment among TB patients.
The Covariate included in the study were Sex, Age, Marital status, Anemia, Cancer, DM, Co-
morbidity, HIV Co-infection, Previous TB history, TB category, TB type, Physical inactive and
Phase of TB treatment. The outcome of the interest was survival time of TB patient measured by
days. The result of Cox regression analysis shows that age, HIV co-infection and Anemia were
significant covariates of TB treatment drop out.
Of all 375 TB patients 282 (75.2%) were censored or not experienced the event and 89 (24.8%)
were patients dropout. The estimated median survival time of TB patient was 199 (182.144,
215.856) days. TB patients with HIV Co-infection had 1.75678 times higher risks of TB
treatment drop out than TB patients who didn’t have HIV Co-infection. This finding is consistent
with study conducted by [5, 6, 7]. It is important to highlight the high percentage (63.7%) of
individuals who did not undergo the anti-HIV test, even though the Ministry of Health's
recommendation to perform the anti-HIV test in tuberculosis programs was established. It is
10
estimated, in Brazil, that although the offer of anti-HIV test is approximately 70%, only 50% of
individuals have access to the result in due time; among these there is a prevalence of positivity
of 15%. In addition, tuberculosis is the major cause of death among people living with HIV, with
a 20% death rate from co-infection. [6, 7].
TB patients who had anemia were 1.79 more likely to anti-TB treatment drop out than those TB
patients who had not anemia. This finding supports the study conducted by SW Lee et al. [8].
They confirmed that anemia is a common hematological abnormality in patients with TB.
Because TB-associated anemia is usually mild and resolves with anti-TB treatment, close
observation is sufficient without other cause of the anemia.
Conclusions
The main aim of this study was investigating the determinants of time to drop out of treatment
for TB patients. Secondary data was used from 375 TB patients of the selected health stations
and hospitals at Buno-Bedele and Illu Aba Bora Zones. The response variable for this study was
the survival time (Time to dropout the treatment among TB patients) measured in days and the
covariates were gender of the patient, marital status, HIV co-infection, Phase of TB treatment,
TB type, TB category, Previous TB history, HIV Co infection, Anemia and Physical inactivity.
Descriptive statistics, Kaplan-Meier Estimation method, Semi-parametric survival models and
parametric survival models were used for the analysis of time to TB treatment dropout dataset.
The result of this study revealed that among 375 patients who started TB treatments about 24.8%
dropout and 75.2% censored at the end of the study and the median survival time of TB patients
were 199 days. The Log-rank results showed that marital status, HIV co infection, Diabetic
mellitus, Cancer and Anemia cases had significant difference between the survival experience at
5% level of significance, whose different levels have an impact in the survival time of TB
11
patients; whereas Sex, Phase of TB treatment, TB type, TB category, previous TB status, co-
morbidity, and physical inactive had not significant difference between the survival experience at
5% level of significance. Finally, the result of Cox-proportion hazard model showed that, age,
HIV co-infection and Anemia had a significant effect on tuberculosis patients during the study
period. It is suggested that for reducing TB treatment drop out, due emphasis should be given in
improving the knowledge and practice of TB patient’s for appropriate use of treatment till the
patient is cure.
Abbreviations
AIC: Akaike Information Criterion; DM: Diabetic Mellitus; HIV: Human Immunodeficiency
Viruses; TB: Tuberculosis; WHO: World Health Organization.
Declarations
Funding: No funding was obtained for this study.
Ethics approval and consent to participate: Not applicable
Consent for publication: Not applicable
Competing of interests: The authors declare that they have no competing interests
Availability of data and materials: We can provide the dataset that has been used to do
this study up on reasonable request.
Authors’ contribution: All authors contributed equally to the study. WE conceived the idea,
DG; AM contributed in the design analyses and interpretation, WE the corresponding author drafted the
manuscript. All authors read and approved the final manuscript.
12
Acknowledgments: The authors gratefully acknowledge all health sectors in Illu- Ababora
and Buno-Bedelle Zones, Oromia Regional State, Ethiopia for allowing us to use the data.
Author details:
1, 2, 3 Department of Statistics, Faculty of Natural and Computational Sciences, Mettu University,
Mettu, Ethiopia.
REFERENCE
[1]. Akaike.1983.Information Measures and Model Selection, Bulletin of the International
Statistical Institute, 50, 277–290. Accessed on July 03, 2014.
[2]. Hosmer DW, Lemeshow S. Regression modeling of time-to-event data. Wiley, NewYork.
1999.
[3]. World Health Organization (WHO). 2016.. “Global Tuberculosis Report: global actions
and investments fall far short of those needed to end the global TB”, Geneva
[4]. Hailay Gesesew , Birtukan Tsehaineh, Desalegn Massa, Amanuel Tesfay, Hafte Kahsay
and Lillian Mwanri (2016). The prevalence and associated factors for delayed presentation
for HIV care among tuberculosis/HIV co-infected patients in Southwest Ethiopia: a
retrospective observational cohort. DOI 10.1186/s40249-016-0193-y
[5]. Garrido MdS, Penna ML, Perez-Porcuna TM, Souza ABd, Marreiro LdS, et al. (2012)
Factors Associated with Tuberculosis Treatment Default in an Endemic Area of the
Brazilian Amazon: A Case Control-Study. PLoS ONE 7(6): e39134.
doi:10.1371/journal.pone.0039134
13
[6]. PF Silva, GS Moura, AJM Caldas, (2014). Factors associated with pulmonary TB
treatment dropout in Maranhão State, Brazil, from 2001 to 2010.
https://doi.org/10.1590/0102-311X00124513
[7]. Department of Epidemiological Surveillance, Secretariat of Health Surveillance, Ministry
of Health. Manual of recommendations for tuberculosis control in Brazil. Brasília: Ministry
of Health; 2011.
[8]. Sei Won Lee, Young Ae Kang, Young Soon Yoon, Sang-Won Um, Sang Min Lee, Chul-
Gyu Yoo, Young Whan Kim, Sung Koo Han, Young-Soo Shim, and Jae-Joon Yim. The
Prevalence and Evolution of Anemia Associated with Tuberculosis. J Korean Med Sci. 2006
Dec; 21(6): 1028–1032doi: 10.3346/jkms.2006.21.6.1028

Figures
Figure 1
The Kaplan-Meier survival curve of the overall TB patients.
Supplementary Files
This is a list of supplementary �les associated with this preprint. Click to download.
SupplementarymaterialsTB.docx