detection of tree roots in an urban area with the use of ground ...
9
Transport and Telecommunication Vol. 17, no. 4, 2016 362 Transport and Telecommunication, 2016, volume 17, no. 4, 362–370 Transport and Telecommunication Institute, Lomonosova 1, Riga, LV-1019, Latvia DOI 10.1515/ttj-2016-0032 DETECTION OF TREE ROOTS IN AN URBAN AREA WITH THE USE OF GROUND PENETRATING RADAR Alexander Krainyukov 1 , Igor Lyaksa 2 1,2 Transport and Telecommunications Institute Lomonosova iela 1, LV-1019, Riga, Latvia 1 Tel.:+371 67100634, e-mail: [email protected] 2 Tel.:+371 67100634, e-mail: [email protected] The paper is devoted to using ground penetrating radar (GPR) for the detection of tree roots in an urban area, since GPR allow detect the hidden objects in non invasive way. It is necessary exactly to know the growth direction, thickness and depth of the roots of the tree to confidently assert about the tree root influence on the technical condition of engineering objects and structures: of the buildings, of pavements, of roadway, of engineering communications and etc. The aim of the given research was experimentally to evaluation the possibilities of detection of tree roots in an urban area with the use of GPR on frequency 400 MHz and of algorithms of secondary processing of GPR signals. Results of interpretation of radar profile and evacuation of soil around tree show the possibility of detection of the tree roots and the determination of their parameters using one or two radar concentric profiles. Keywords: ground penetrating radar, tree roots, radar profile, secondary signals processing 1. Introduction Root systems of big trees consist of the two kinds roots: primary thin roots that have the function of water and nutrient uptake and secondary thick roots that have a woody structure. The root system of trees can cause the destruction of engineering objects and structures in urban areas, if the tree grows near these objects. Direct damage to building foundations, gas or sewage pipes, road structures and other objects, may be caused through direct contact with tree roots. The trees roots can cause also indirectly structural damages to engineering objects. In the dry season the tree roots find their way to a moisture content higher than the surrounding soil. The tree roots growing close to engineering objects and pavement go to these foundations, where a moisture content higher always. As a result, the foundation soil moisture decreases, it causes a various decrease in the volume of soil under the object. Differential subsidence in the soil causes lesions in the objects and road structures that are above. However, it is necessary to know the direction of the thickness and depth of the roots of the tree to confidently assert that the roots of the tree degree of influence on the technical condition of engineering objects and structures. Usually, tree root systems are identified with using destructive techniques: excavation and coring, which are destructive, costly, time consuming, laborious and bring harm to the trees. At present an efficient and inexpensive method does not yet exist for mapping tree root systems or for identifying the presence of individual large roots. For years, the radar probing is widely used to detect the hidden objects in subsurface. Ground penetrating radars successfully provide detection of different subsurface objects: abandoned storage tanks, disturbed soil, buried pipes, artifacts, caves and land mines. Ground penetrating radar has also been used to detect tree roots and map root systems (Hruška et al., 1999; Čermák et al., 2000; Wielopolski et al., 2000) and to determine root biomass (Butnor et al., 2001, 2003). Because the radar probing method is a technique non-invasive and non-destructive, GPR allows repeated measurements that allow follow the temporal assessment of root system development. However, the trees roots are detected non-real time by radar method. To detect tree roots initially GPR signals are subjected secondary processing using one or more algorithms, and then two-dimensional or three-dimensional images of subsurface area are formed with employment of the set of processed signals. Despite the results of the use of GPR to detect the trees roots, there are a need and actuality of further research in this area of subsurface sounding. This is explained as follow; most tree roots detection results were obtained in a laboratory using a prepared root samples or in a comfortable environment in the absence of other hidden reflected objects; probability of detection of the roots and the errors of determination the root diameters do not correspond to practical problems.
-
Upload
khangminh22 -
Category
Documents
-
view
3 -
download
0
Transcript of detection of tree roots in an urban area with the use of ground ...
Transport and Telecommunication Vol. 17, no. 4, 2016
362
Transport and Telecommunication, 2016, volume 17, no. 4, 362–370 Transport and Telecommunication Institute, Lomonosova 1, Riga, LV-1019, Latvia DOI 10.1515/ttj-2016-0032
DETECTION OF TREE ROOTS IN AN URBAN AREA WITH THE USE OF GROUND PENETRATING RADAR
Alexander Krainyukov 1, Igor Lyaksa 2
1,2Transport and Telecommunications Institute Lomonosova iela 1, LV-1019, Riga, Latvia
1Tel.:+371 67100634, e-mail: [email protected] 2 Tel.:+371 67100634, e-mail: [email protected]
The paper is devoted to using ground penetrating radar (GPR) for the detection of tree roots in an urban area, since GPR
allow detect the hidden objects in non invasive way. It is necessary exactly to know the growth direction, thickness and depth of the roots of the tree to confidently assert about the tree root influence on the technical condition of engineering objects and structures: of the buildings, of pavements, of roadway, of engineering communications and etc. The aim of the given research was experimentally to evaluation the possibilities of detection of tree roots in an urban area with the use of GPR on frequency 400 MHz and of algorithms of secondary processing of GPR signals. Results of interpretation of radar profile and evacuation of soil around tree show the possibility of detection of the tree roots and the determination of their parameters using one or two radar concentric profiles.
Keywords: ground penetrating radar, tree roots, radar profile, secondary signals processing
1. Introduction
Root systems of big trees consist of the two kinds roots: primary thin roots that have the function of water and nutrient uptake and secondary thick roots that have a woody structure. The root system of trees can cause the destruction of engineering objects and structures in urban areas, if the tree grows near these objects. Direct damage to building foundations, gas or sewage pipes, road structures and other objects, may be caused through direct contact with tree roots. The trees roots can cause also indirectly structural damages to engineering objects. In the dry season the tree roots find their way to a moisture content higher than the surrounding soil. The tree roots growing close to engineering objects and pavement go to these foundations, where a moisture content higher always. As a result, the foundation soil moisture decreases, it causes a various decrease in the volume of soil under the object. Differential subsidence in the soil causes lesions in the objects and road structures that are above.
However, it is necessary to know the direction of the thickness and depth of the roots of the tree to confidently assert that the roots of the tree degree of influence on the technical condition of engineering objects and structures. Usually, tree root systems are identified with using destructive techniques: excavation and coring, which are destructive, costly, time consuming, laborious and bring harm to the trees. At present an efficient and inexpensive method does not yet exist for mapping tree root systems or for identifying the presence of individual large roots.
For years, the radar probing is widely used to detect the hidden objects in subsurface. Ground penetrating radars successfully provide detection of different subsurface objects: abandoned storage tanks, disturbed soil, buried pipes, artifacts, caves and land mines. Ground penetrating radar has also been used to detect tree roots and map root systems (Hruška et al., 1999; Čermák et al., 2000; Wielopolski et al., 2000) and to determine root biomass (Butnor et al., 2001, 2003). Because the radar probing method is a technique non-invasive and non-destructive, GPR allows repeated measurements that allow follow the temporal assessment of root system development. However, the trees roots are detected non-real time by radar method. To detect tree roots initially GPR signals are subjected secondary processing using one or more algorithms, and then two-dimensional or three-dimensional images of subsurface area are formed with employment of the set of processed signals.
Despite the results of the use of GPR to detect the trees roots, there are a need and actuality of further research in this area of subsurface sounding. This is explained as follow;
most tree roots detection results were obtained in a laboratory using a prepared root samples or in a comfortable environment in the absence of other hidden reflected objects;
probability of detection of the roots and the errors of determination the root diameters do not correspond to practical problems.
Transport and Telecommunication Vol. 17, no. 4, 2016
363
In urban conditions perennial big trees are the greatest threat to the engineering objects and transport communications due to the location of the trees roots and a possible fall of these trees. The roots of urban trees are found in the layer of soil that may contain stones, metal objects, building waste, construction waste, debris, empty, pipe and even animal burial and etc. Such subsurface objects are sources of additional reflections that complicate radar profile and make it difficult to detection of the roots of trees.
The aim of the given research was to evaluate experimentally the possibility of detection of tree roots in an urban area with the use of GPR on frequency 400 MHz and algorithms of secondary processing of GPR signals, as well as determination of the parameters detected roots. We tested the ability to detect the oak roots using the subsurface radar profile of one concentric circle around oak. Comparison results of interpretation of radar profile and Excavated Profile around tree show the possibility of detection of the tree roots and the determination of their parameters using one or two radar concentric profiles.
2. Object and method of GPR survey
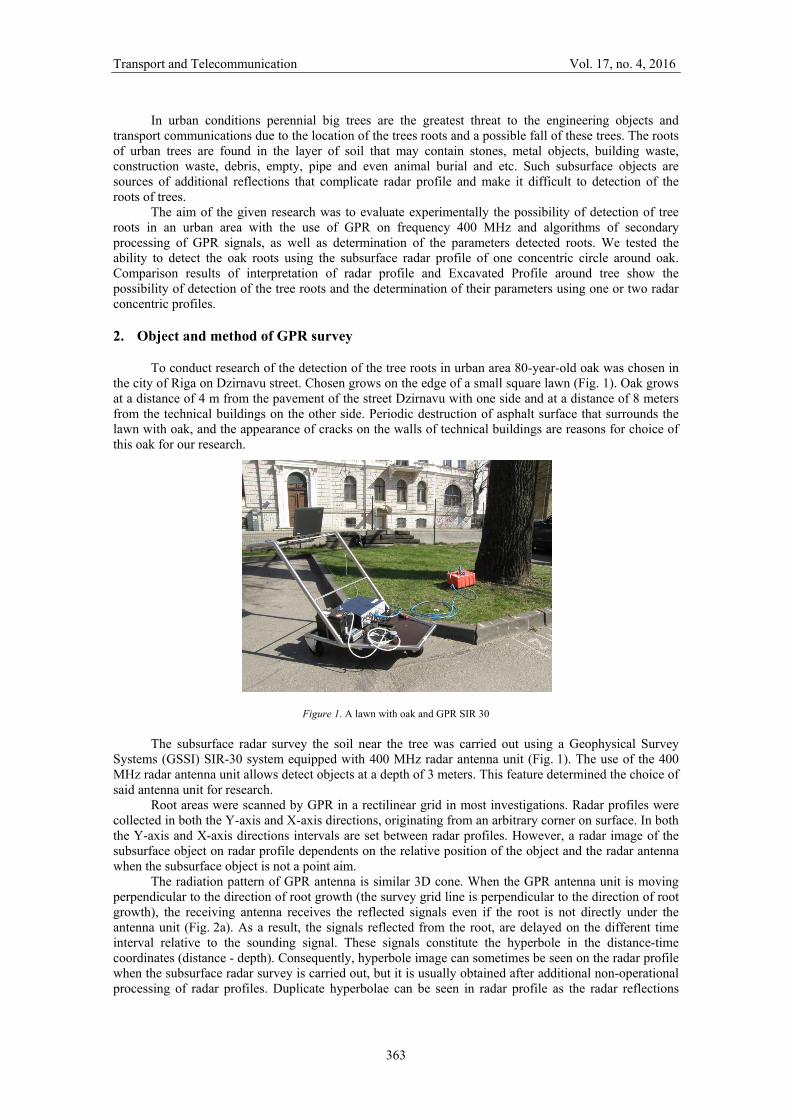
To conduct research of the detection of the tree roots in urban area 80-year-old oak was chosen in the city of Riga on Dzirnavu street. Chosen grows on the edge of a small square lawn (Fig. 1). Oak grows at a distance of 4 m from the pavement of the street Dzirnavu with one side and at a distance of 8 meters from the technical buildings on the other side. Periodic destruction of asphalt surface that surrounds the lawn with oak, and the appearance of cracks on the walls of technical buildings are reasons for choice of this oak for our research.
Figure 1. A lawn with oak and GPR SIR 30
The subsurface radar survey the soil near the tree was carried out using a Geophysical Survey Systems (GSSI) SIR-30 system equipped with 400 MHz radar antenna unit (Fig. 1). The use of the 400 MHz radar antenna unit allows detect objects at a depth of 3 meters. This feature determined the choice of said antenna unit for research.
Root areas were scanned by GPR in a rectilinear grid in most investigations. Radar profiles were collected in both the Y-axis and X-axis directions, originating from an arbitrary corner on surface. In both the Y-axis and X-axis directions intervals are set between radar profiles. However, a radar image of the subsurface object on radar profile dependents on the relative position of the object and the radar antenna when the subsurface object is not a point aim.
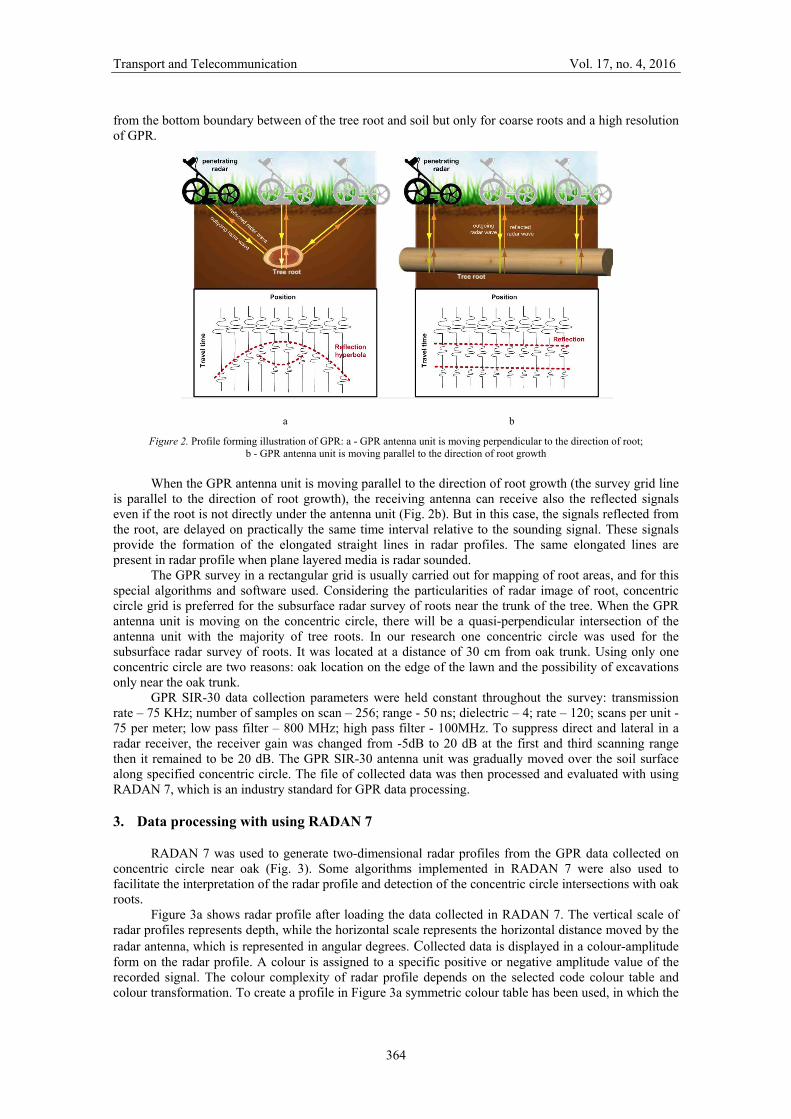
The radiation pattern of GPR antenna is similar 3D cone. When the GPR antenna unit is moving perpendicular to the direction of root growth (the survey grid line is perpendicular to the direction of root growth), the receiving antenna receives the reflected signals even if the root is not directly under the antenna unit (Fig. 2a). As a result, the signals reflected from the root, are delayed on the different time interval relative to the sounding signal. These signals constitute the hyperbole in the distance-time coordinates (distance - depth). Consequently, hyperbole image can sometimes be seen on the radar profile when the subsurface radar survey is carried out, but it is usually obtained after additional non-operational processing of radar profiles. Duplicate hyperbolae can be seen in radar profile as the radar reflections
Transport and Telecommunication Vol. 17, no. 4, 2016
364
from the bottom boundary between of the tree root and soil but only for coarse roots and a high resolution of GPR.
a b
Figure 2. Profile forming illustration of GPR: a - GPR antenna unit is moving perpendicular to the direction of root; b - GPR antenna unit is moving parallel to the direction of root growth
When the GPR antenna unit is moving parallel to the direction of root growth (the survey grid line is parallel to the direction of root growth), the receiving antenna can receive also the reflected signals even if the root is not directly under the antenna unit (Fig. 2b). But in this case, the signals reflected from the root, are delayed on practically the same time interval relative to the sounding signal. These signals provide the formation of the elongated straight lines in radar profiles. The same elongated lines are present in radar profile when plane layered media is radar sounded.
The GPR survey in a rectangular grid is usually carried out for mapping of root areas, and for this special algorithms and software used. Considering the particularities of radar image of root, concentric circle grid is preferred for the subsurface radar survey of roots near the trunk of the tree. When the GPR antenna unit is moving on the concentric circle, there will be a quasi-perpendicular intersection of the antenna unit with the majority of tree roots. In our research one concentric circle was used for the subsurface radar survey of roots. It was located at a distance of 30 cm from oak trunk. Using only one concentric circle are two reasons: oak location on the edge of the lawn and the possibility of excavations only near the oak trunk.
GPR SIR-30 data collection parameters were held constant throughout the survey: transmission rate – 75 KHz; number of samples on scan – 256; range - 50 ns; dielectric – 4; rate – 120; scans per unit - 75 per meter; low pass filter – 800 MHz; high pass filter - 100MHz. To suppress direct and lateral in a radar receiver, the receiver gain was changed from -5dB to 20 dB at the first and third scanning range then it remained to be 20 dB. The GPR SIR-30 antenna unit was gradually moved over the soil surface along specified concentric circle. The file of collected data was then processed and evaluated with using RADAN 7, which is an industry standard for GPR data processing.
3. Data processing with using RADAN 7
RADAN 7 was used to generate two-dimensional radar profiles from the GPR data collected on concentric circle near oak (Fig. 3). Some algorithms implemented in RADAN 7 were also used to facilitate the interpretation of the radar profile and detection of the concentric circle intersections with oak roots.
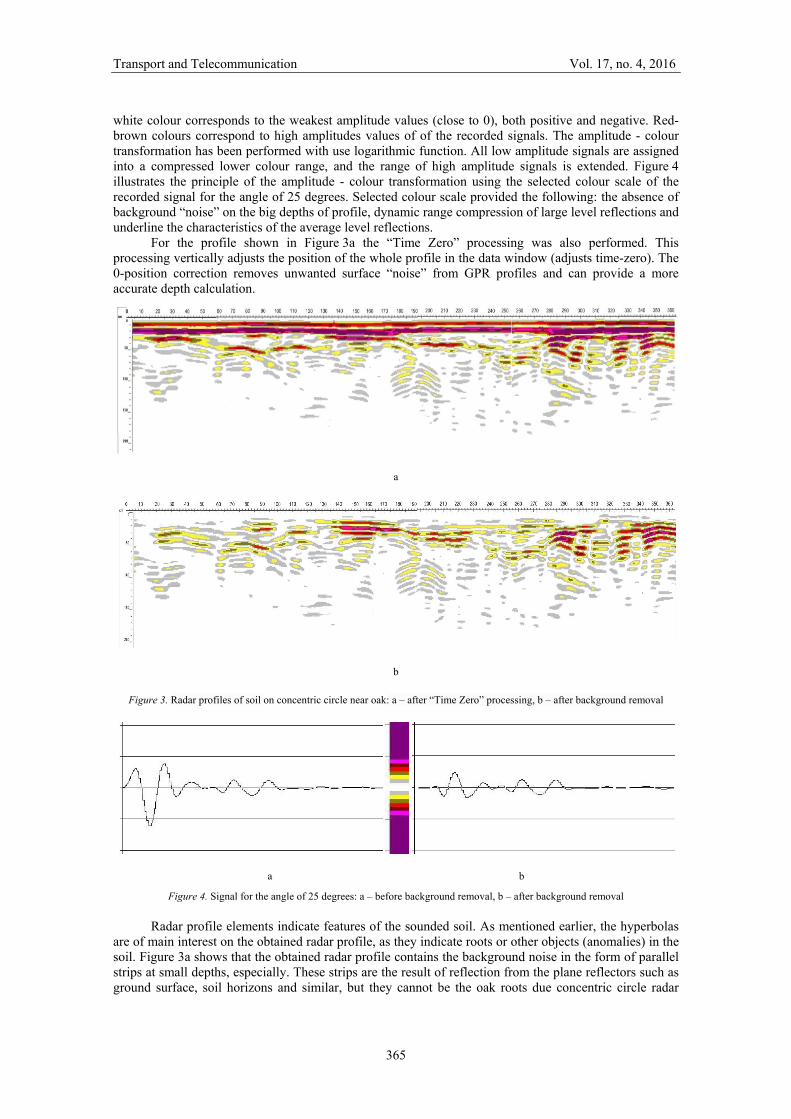
Figure 3a shows radar profile after loading the data collected in RADAN 7. The vertical scale of radar profiles represents depth, while the horizontal scale represents the horizontal distance moved by the radar antenna, which is represented in angular degrees. Collected data is displayed in a colour-amplitude form on the radar profile. A colour is assigned to a specific positive or negative amplitude value of the recorded signal. The colour complexity of radar profile depends on the selected code colour table and colour transformation. To create a profile in Figure 3a symmetric colour table has been used, in which the
Transport and Telecommunication Vol. 17, no. 4, 2016
365
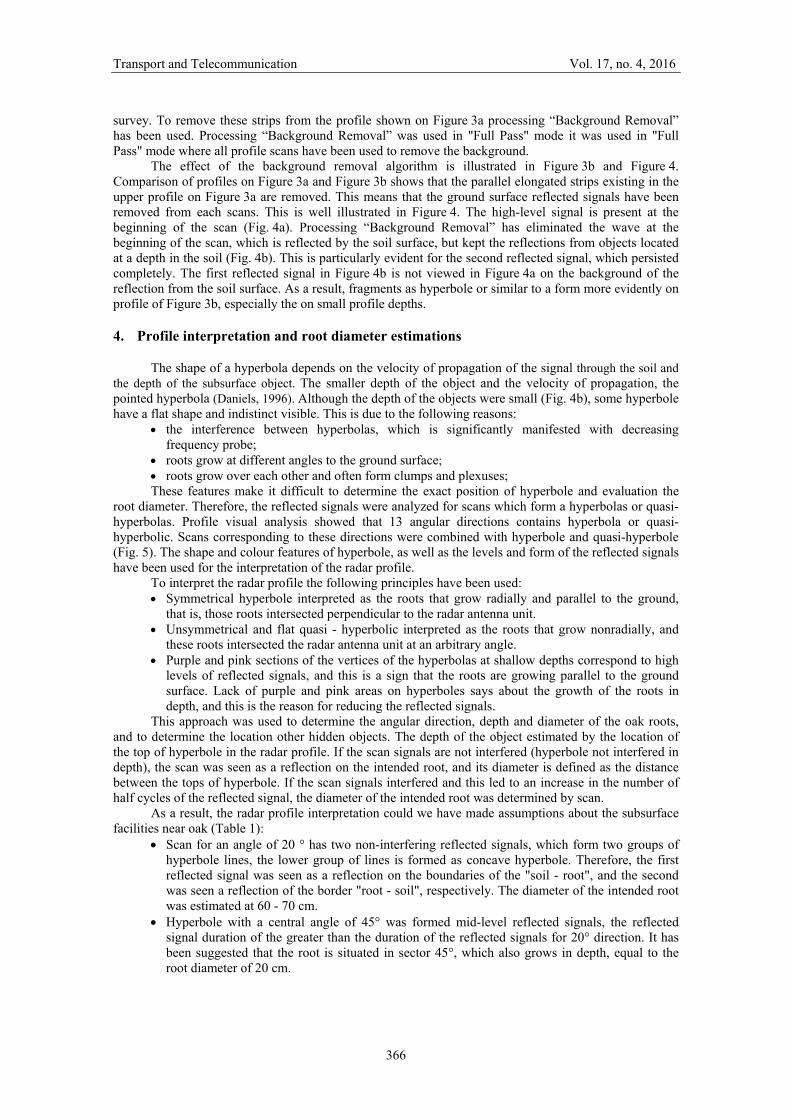
white colour corresponds to the weakest amplitude values (close to 0), both positive and negative. Red-brown colours correspond to high amplitudes values of of the recorded signals. The amplitude - colour transformation has been performed with use logarithmic function. All low amplitude signals are assigned into a compressed lower colour range, and the range of high amplitude signals is extended. Figure 4 illustrates the principle of the amplitude - colour transformation using the selected colour scale of the recorded signal for the angle of 25 degrees. Selected colour scale provided the following: the absence of background “noise” on the big depths of profile, dynamic range compression of large level reflections and underline the characteristics of the average level reflections.
For the profile shown in Figure 3a the “Time Zero” processing was also performed. This processing vertically adjusts the position of the whole profile in the data window (adjusts time-zero). The 0-position correction removes unwanted surface “noise” from GPR profiles and can provide a more accurate depth calculation.
a
b
Figure 3. Radar profiles of soil on concentric circle near oak: a – after “Time Zero” processing, b – after background removal
a b
Figure 4. Signal for the angle of 25 degrees: a – before background removal, b – after background removal
Radar profile elements indicate features of the sounded soil. As mentioned earlier, the hyperbolas are of main interest on the obtained radar profile, as they indicate roots or other objects (anomalies) in the soil. Figure 3a shows that the obtained radar profile contains the background noise in the form of parallel strips at small depths, especially. These strips are the result of reflection from the plane reflectors such as ground surface, soil horizons and similar, but they cannot be the oak roots due concentric circle radar
Transport and Telecommunication Vol. 17, no. 4, 2016
366
survey. To remove these strips from the profile shown on Figure 3a processing “Background Removal” has been used. Processing “Background Removal” was used in "Full Pass" mode it was used in "Full Pass" mode where all profile scans have been used to remove the background.
The effect of the background removal algorithm is illustrated in Figure 3b and Figure 4. Comparison of profiles on Figure 3a and Figure 3b shows that the parallel elongated strips existing in the upper profile on Figure 3a are removed. This means that the ground surface reflected signals have been removed from each scans. This is well illustrated in Figure 4. The high-level signal is present at the beginning of the scan (Fig. 4a). Processing “Background Removal” has eliminated the wave at the beginning of the scan, which is reflected by the soil surface, but kept the reflections from objects located at a depth in the soil (Fig. 4b). This is particularly evident for the second reflected signal, which persisted completely. The first reflected signal in Figure 4b is not viewed in Figure 4a on the background of the reflection from the soil surface. As a result, fragments as hyperbole or similar to a form more evidently on profile of Figure 3b, especially the on small profile depths.
4. Profile interpretation and root diameter estimations
The shape of a hyperbola depends on the velocity of propagation of the signal through the soil and the depth of the subsurface object. The smaller depth of the object and the velocity of propagation, the pointed hyperbola (Daniels, 1996). Although the depth of the objects were small (Fig. 4b), some hyperbole have a flat shape and indistinct visible. This is due to the following reasons:
the interference between hyperbolas, which is significantly manifested with decreasing frequency probe;
roots grow at different angles to the ground surface; roots grow over each other and often form clumps and plexuses; These features make it difficult to determine the exact position of hyperbole and evaluation the
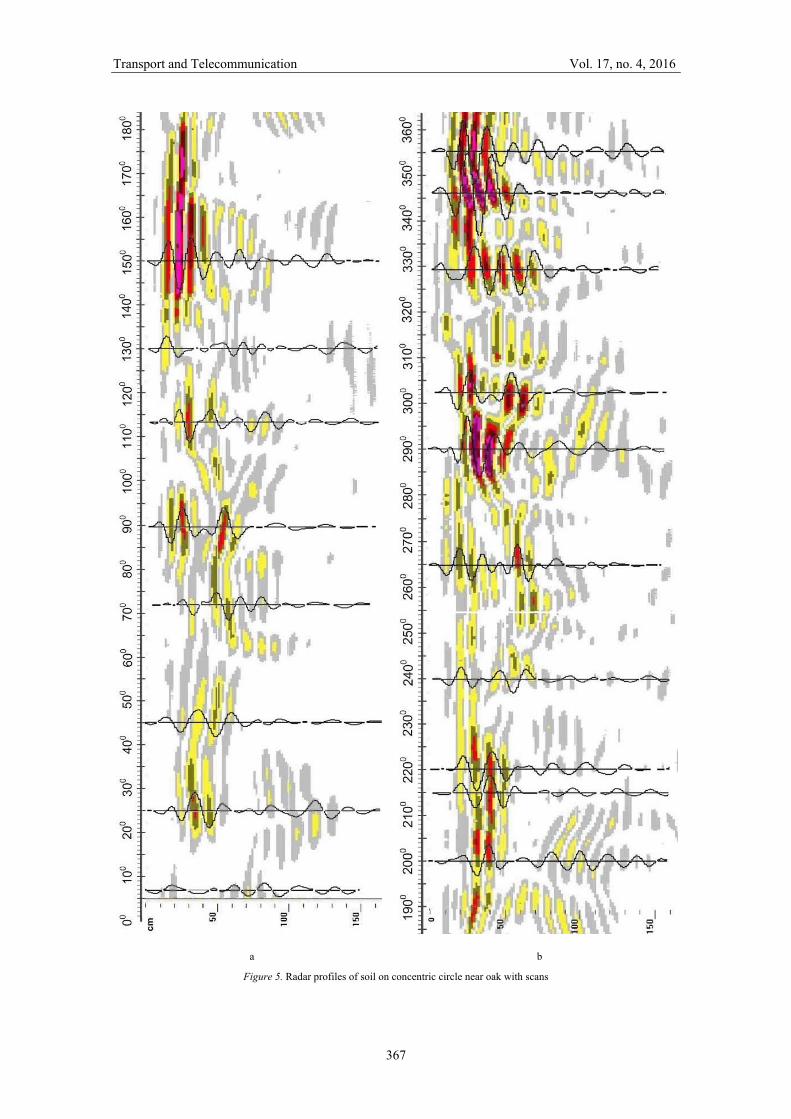
root diameter. Therefore, the reflected signals were analyzed for scans which form a hyperbolas or quasi-hyperbolas. Profile visual analysis showed that 13 angular directions contains hyperbola or quasi-hyperbolic. Scans corresponding to these directions were combined with hyperbole and quasi-hyperbole (Fig. 5). The shape and colour features of hyperbole, as well as the levels and form of the reflected signals have been used for the interpretation of the radar profile.
To interpret the radar profile the following principles have been used: Symmetrical hyperbole interpreted as the roots that grow radially and parallel to the ground,
that is, those roots intersected perpendicular to the radar antenna unit. Unsymmetrical and flat quasi - hyperbolic interpreted as the roots that grow nonradially, and
these roots intersected the radar antenna unit at an arbitrary angle. Purple and pink sections of the vertices of the hyperbolas at shallow depths correspond to high
levels of reflected signals, and this is a sign that the roots are growing parallel to the ground surface. Lack of purple and pink areas on hyperboles says about the growth of the roots in depth, and this is the reason for reducing the reflected signals.
This approach was used to determine the angular direction, depth and diameter of the oak roots, and to determine the location other hidden objects. The depth of the object estimated by the location of the top of hyperbole in the radar profile. If the scan signals are not interfered (hyperbole not interfered in depth), the scan was seen as a reflection on the intended root, and its diameter is defined as the distance between the tops of hyperbole. If the scan signals interfered and this led to an increase in the number of half cycles of the reflected signal, the diameter of the intended root was determined by scan.
As a result, the radar profile interpretation could we have made assumptions about the subsurface facilities near oak (Table 1):
Scan for an angle of 20 ° has two non-interfering reflected signals, which form two groups of hyperbole lines, the lower group of lines is formed as concave hyperbole. Therefore, the first reflected signal was seen as a reflection on the boundaries of the "soil - root", and the second was seen a reflection of the border "root - soil", respectively. The diameter of the intended root was estimated at 60 - 70 cm.
Hyperbole with a central angle of 45° was formed mid-level reflected signals, the reflected signal duration of the greater than the duration of the reflected signals for 20° direction. It has been suggested that the root is situated in sector 45°, which also grows in depth, equal to the root diameter of 20 cm.
Transport and Telecommunication Vol. 17, no. 4, 2016
367
а b
Figure 5. Radar profiles of soil on concentric circle near oak with scans
Transport and Telecommunication Vol. 17, no. 4, 2016
368
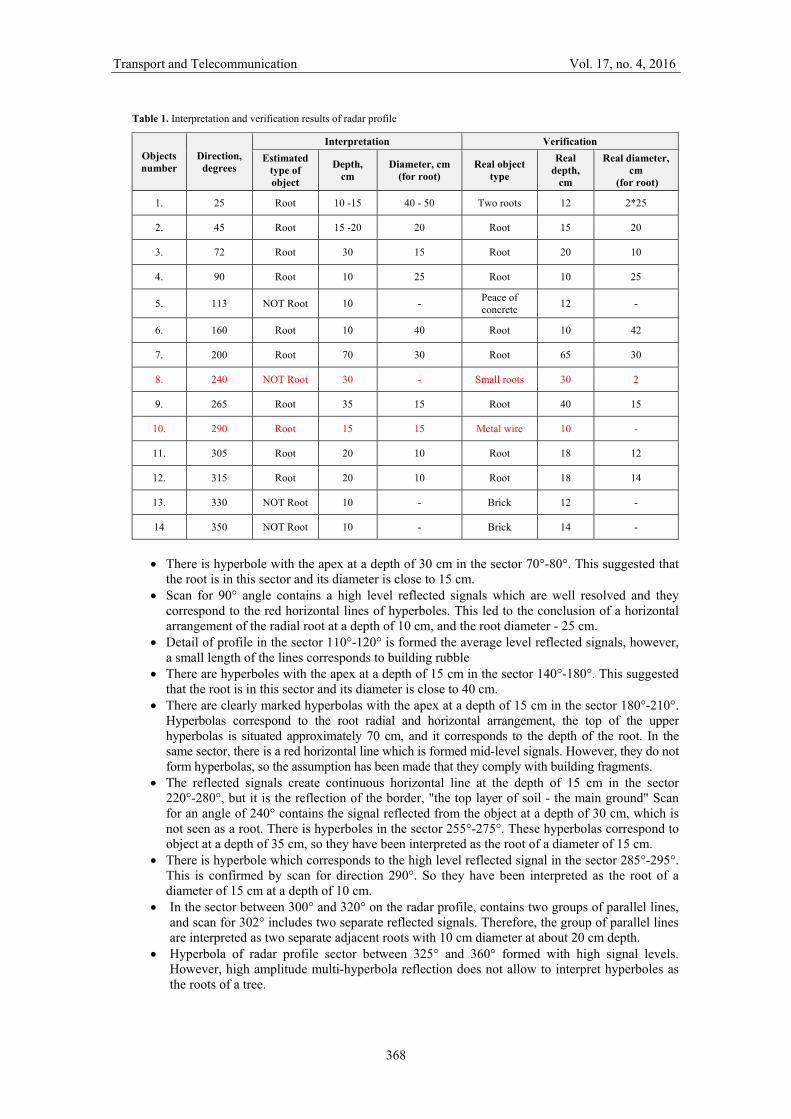
Table 1. Interpretation and verification results of radar profile
Objects number
Direction, degrees
Interpretation Verification
Estimated type of object
Depth, cm
Diameter, cm (for root)
Real object type
Real depth,
cm
Real diameter, cm
(for root)
1. 25 Root 10 -15 40 - 50 Two roots 12 2*25
2. 45 Root 15 -20 20 Root 15 20
3. 72 Root 30 15 Root 20 10
4. 90 Root 10 25 Root 10 25
5. 113 NOT Root 10 - Peace of concrete
12 -
6. 160 Root 10 40 Root 10 42
7. 200 Root 70 30 Root 65 30
8. 240 NOT Root 30 - Small roots 30 2
9. 265 Root 35 15 Root 40 15
10. 290 Root 15 15 Metal wire 10 -
11. 305 Root 20 10 Root 18 12
12. 315 Root 20 10 Root 18 14
13. 330 NOT Root 10 - Brick 12 -
14 350 NOT Root 10 - Brick 14 -
There is hyperbole with the apex at a depth of 30 cm in the sector 70°-80°. This suggested that
the root is in this sector and its diameter is close to 15 cm. Scan for 90° angle contains a high level reflected signals which are well resolved and they
correspond to the red horizontal lines of hyperboles. This led to the conclusion of a horizontal arrangement of the radial root at a depth of 10 cm, and the root diameter - 25 cm.
Detail of profile in the sector 110°-120° is formed the average level reflected signals, however, a small length of the lines corresponds to building rubble
There are hyperboles with the apex at a depth of 15 cm in the sector 140°-180°. This suggested that the root is in this sector and its diameter is close to 40 cm.
There are clearly marked hyperbolas with the apex at a depth of 15 cm in the sector 180°-210°. Hyperbolas correspond to the root radial and horizontal arrangement, the top of the upper hyperbolas is situated approximately 70 cm, and it corresponds to the depth of the root. In the same sector, there is a red horizontal line which is formed mid-level signals. However, they do not form hyperbolas, so the assumption has been made that they comply with building fragments.
The reflected signals create continuous horizontal line at the depth of 15 cm in the sector 220°-280°, but it is the reflection of the border, "the top layer of soil - the main ground" Scan for an angle of 240° contains the signal reflected from the object at a depth of 30 cm, which is not seen as a root. There is hyperboles in the sector 255°-275°. These hyperbolas correspond to object at a depth of 35 cm, so they have been interpreted as the root of a diameter of 15 cm.
There is hyperbole which corresponds to the high level reflected signal in the sector 285°-295°. This is confirmed by scan for direction 290°. So they have been interpreted as the root of a diameter of 15 cm at a depth of 10 cm.
In the sector between 300° and 320° on the radar profile, contains two groups of parallel lines, and scan for 302° includes two separate reflected signals. Therefore, the group of parallel lines are interpreted as two separate adjacent roots with 10 cm diameter at about 20 cm depth.
Hyperbola of radar profile sector between 325° and 360° formed with high signal levels. However, high amplitude multi-hyperbola reflection does not allow to interpret hyperboles as the roots of a tree.
Transport and Telecommunication Vol. 17, no. 4, 2016
369
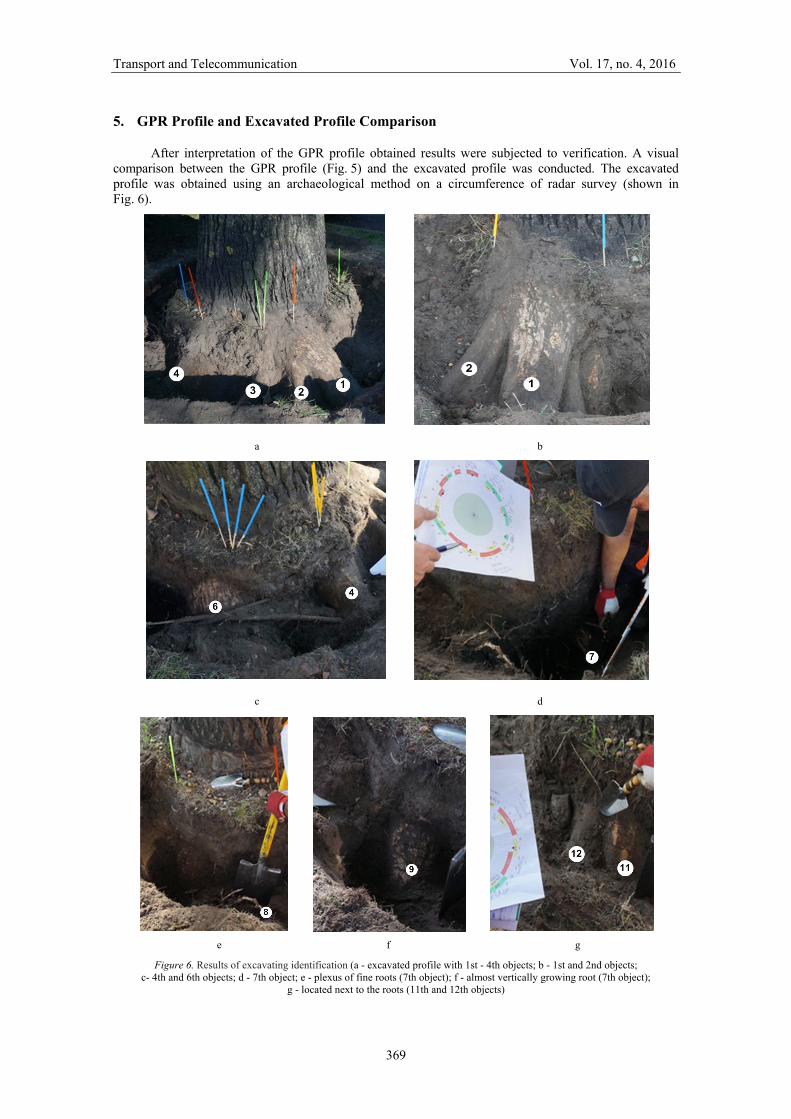
5. GPR Profile and Excavated Profile Comparison
After interpretation of the GPR profile obtained results were subjected to verification. A visual comparison between the GPR profile (Fig. 5) and the excavated profile was conducted. The excavated profile was obtained using an archaeological method on a circumference of radar survey (shown in Fig. 6).
а b
с d
e f g
Figure 6. Results of excavating identification (a - excavated profile with 1st - 4th objects; b - 1st and 2nd objects; c- 4th and 6th objects; d - 7th object; e - plexus of fine roots (7th object); f - almost vertically growing root (7th object);
g - located next to the roots (11th and 12th objects)
Transport and Telecommunication Vol. 17, no. 4, 2016
370
Soil was removed in each sector to a depth according to the depth of objects which are placed in the Table 1. All tree roots and any objects were exposed. For each assumed object in Table 1 we have the actual type of the object, its real depth and real root diameter (see more in Table 1. "Verification" columns).
Figure 6a. shows the first four objects, which are really roots. The third root growing nonradially, unlike the others. The first object is few roots, which are arranged one below the other, and it explains the general large diameter. Object №3 is the root which are rejected of the radius and directed into the depth, the depth of the root upper borders is 20 cm and thickness of root is 10 cm.
Objects №6 and №7 were also the roots (Fig. 6c and Fig. 6d), which growing radially and their real characteristics are similar to the assumed. In the sector from 180° till 210° at shallow depths were fragments of bricks that correspond to profile horizontal red lines. In the sector from 220° till 280° top layer of soil in the range 10-15 cm was different from the downstream ground and it included elements of construction waste. On Figure 6e seen that the top layer of soil differ in colour, so on the profiles in this sector is a continuous horizontal line at the 15 cm depth. The object №8 is interweaving of several fine roots at the 30 cm depth, although on the profile this object is not interpreted as root. Object №9 is root at a 40 cm depth, with 15 cm diameter, which grows almost vertical in depth (Fig. 6f). Objects №11 and №12 is located near roots (Fig. 6h).
GPR profile and excavated profile comparison – only two objects was wrongly interpreted.
6. Conclusions
The results of the above research allow making the following conclusions: base data of signals, reflected from the oak roots, is formed; the subsurface radar survey of roots on one concentric circle provided a high probability of
detection of oak roots; to improve the speed and accuracy of interpretation of radar profiles of the soil around the tree
is necessary to perform radar surveys along two or three concentric circles; to determine the tree roots diameter is necessary to solve the inverse searching problem of
subsurface radar sounding.
References
1. Butnor, J.R., Doolittle, J.A., Kress, L., Cohen, S., Johnsen, K.H. (2001) Use of Ground-Penetrating Radar to Study Tree Roots in the Southeastern United States. Tree Physiol 21, pp. 1269–1278.
2. Butnor, J.R., Doolittle, J.A., Johnsen, K.H., Samuelson, L., Stokes, T., Kress, L. (2003) Utility of Ground-Penetrating Radar as a Root Biomass Survey Tool in Forest Systems. Soil Sci Soc Am J 67, pp. 1607–1615.
3. Čermák, J., Hruška, J., Martinková, M., Prax, A. (2000) Urban Tree Root Systems and their Survival Near Houses Analyzed Using Ground Penetrating Radar and Sap Flow Techniques. Plant Soil 219, pp. 103–116.
4. Daniels, D.J. (2004) Ground Penetrating Radar, 2nd ed. Institution of Electrical Engineers, London. 654 p.
5. Hruška, J., Čermák, J., Sustek, S. (1999) Mapping Tree Root Systems with Ground-Penetrating Radar. Tree Physiol 19, pp 125–130.
6. Wielopolski, L., Hendrey, G., Daniels, J., McGuigan, M. (2000) Imaging Tree Root Systems in Situ. In: Noon DA, Stickley GF, Longstaff D (eds) GPR 2000: Proceedings of the Eighth International Conference on Ground Penetrating Radar, vol 4084. Proceedings of the Society of PhotoOptical Instrumentation Engineers (SPIE), pp 642–646.