Design of an integrated evaluation index for recreational beaches
11
This article appeared in a journal published by Elsevier. The attached copy is furnished to the author for internal non-commercial research and education use, including for instruction at the authors institution and sharing with colleagues. Other uses, including reproduction and distribution, or selling or licensing copies, or posting to personal, institutional or third party websites are prohibited. In most cases authors are permitted to post their version of the article (e.g. in Word or Tex form) to their personal website or institutional repository. Authors requiring further information regarding Elsevier’s archiving and manuscript policies are encouraged to visit: http://www.elsevier.com/copyright
-
Upload
independent -
Category
Documents
-
view
0 -
download
0
Transcript of Design of an integrated evaluation index for recreational beaches
This article appeared in a journal published by Elsevier. The attachedcopy is furnished to the author for internal non-commercial researchand education use, including for instruction at the authors institution
and sharing with colleagues.
Other uses, including reproduction and distribution, or selling orlicensing copies, or posting to personal, institutional or third party
websites are prohibited.
In most cases authors are permitted to post their version of thearticle (e.g. in Word or Tex form) to their personal website orinstitutional repository. Authors requiring further information
regarding Elsevier’s archiving and manuscript policies areencouraged to visit:
http://www.elsevier.com/copyright

Author's personal copy
Design of an integrated evaluation index for recreational beaches
Omar Cervantes a, Ileana Espejel b,*
a Facultad de Ciencias Marinas, Universidad Autonoma de Baja California, California, Carretera Tijuana-Ensenada Km 103,
CP 22800, Ensenada, Baja California, Mexicob Facultad de Ciencias, Universidad Autonoma de Baja California, Carretera Tijuana-Ensenada Km 103, CP 22800, Ensenada,
Baja California, Mexico
Available online 1 February 2008
Abstract
An integrated index to evaluate recreational sand beaches (IBVI) was designed using descriptive beach indicators (BI), beach user’s percep-tion (KI) and indicators of beach economic value (MI). This index was applied in five urban sandy beaches with similar physiographic features,but economically and socio-culturally different (Ensenada, Rosarito and Mazatlan in Mexico; Copacabana in Brazil; and Oceanside in SouthernCalifornia in USA). According to the IBVI evaluation, Oceanside was the best beach, all values rating high, followed by Copacabana with highBI and KI but low MI. Mazatlan was rated medium, although user’s perception was high. Poorly developed beaches, such as Ensenada, wererated medium for BI, KI and low for MI. The IBVI value at Rosarito was rated mediumelow because both the BI and KI values were low. IBVIincorporates three visions for beach awards in one and can be useful to compare tourist sand beaches around the world.� 2008 Elsevier Ltd. All rights reserved.
1. Introduction
Sand beaches are among the most valuable ecosystemsused for outdoor recreation worldwide. Incorporated as parksand gardens in coastal cities, leisure and relaxed activities,such as watching wildlife and birds, walking or practicing wa-ter sports are common at beach areas [1]. As a natural resourceof the coastal zone, sand beaches are perfect laboratories forthe implementation of coastal zone management paradigms.Sand beaches are considered multifaceted study objects thatcan be managed by designing environmental management in-struments with an integrated approach, meaning integratingphysical, biological, socio-cultural and economic values [2].
Urban beaches play an important role in defining the devel-opment of large projects of tourist infrastructure that yieldlarge economic inflow which benefits both local and interna-tional businesses. For example, California (USA) providesboth direct and indirect services worth 27,000 million dollars,representing 3% of the state economic activity [3,4]. Houston
[5] established that for each dollar invested in beach mainte-nance in the USA, $600 return as taxes paid by national tour-ism and $20 by foreign tourists.
Nevertheless, and particularly in traditional beach coun-tries, economic values have targeted a unidirectional develop-ment, largely dominated by mass tourism [6,7] which hascaused beach development to drift from sustainability. Someenvironmental impacts reported are erosion, pollution, andlandscape loss e the latter essentially being the main motiveto start the development itself [7e13].
In the last 10 years, important attempts have been made toevaluate sand beaches to seek beach awards as a promotionaltool [14]. Receiving national or international certificationssuch as Blue Flag [15], Blue Wave [16], National HealthyBeach Campaign [17] or Seaside Award (replaced by theQuality Coast Award in 2007 [18]) has motivated researchers,consultants and decision makers to design models, suggest setsof variables, select indicators and develop integrated schemesto collect beach data in comparable ways, which will identifythe best beaches in a nation, a region or even worldwide.
Most sand beach evaluations are based on either simple orcomplex combinations of characteristics for beach classifica-tion and recommendations for common management. Chaverri[19] classified sand beaches of Costa Rica using a subjective
* Corresponding author. Tel.: þ52 (646) 174 59 25x126; fax: þ52(646) 174
45 60.
E-mail addresses: [email protected] (O. Cervantes), [email protected]
(I. Espejel).
0964-5691/$ - see front matter � 2008 Elsevier Ltd. All rights reserved.
doi:10.1016/j.ocecoaman.2008.01.007
Available online at www.sciencedirect.com
Ocean & Coastal Management 51 (2008) 410e419www.elsevier.com/locate/ocecoaman

Author's personal copy
evaluation technique based on more than 100 characteristics.Short [20] classified Australian sand beaches where surfingis common using risks indicators such as currents, tides, reefs,strong winds, and wave patterns. Williams et al. [21] proposeda classification scheme using 50 biophysical and socioeco-nomic characteristics. Williams and Morgan [22] and Morgan[23] later modified it by identifying the importance of beachusers’ preferences and priorities when choosing those charac-teristics. Leatherman [24] designed a quantitative scheme sim-ilar to that of Williams et al. [21] to compare and classifyrecreational sand beaches by using 50 criteria divided intobiological and physical impacts and human use categories.These categories are scored from 1 (most negative) to 5(most positive).
Beach evaluations are used for international certification[15e18] and are based on the fulfillment of specific criteriafor sand beaches (26 in the case of blue flag). They are relatedto water quality, environmental information and education pro-grams, compliance with environmental laws, and the presenceof safety corps and other services. The certificate is reissuedannually to ensure fulfillment of criteria [15].
These certification schemes provide a technical view thatdoes not consider the ever-changing expectations of users(who also watch the landscape, sunbathe, eat, or rest afterswimming). Besides, these schemes apply mainly to urbansand beaches, which have infrastructure and services such asrestrooms, waste deposits, signs, and so on. Recently, new cer-tification schemes have been developed for rural beaches withconservation objectives [18,25].The World Health Organiza-tion (WHO) [26], jointly with the United States EnvironmentalProtection Agency (EPA) proposed a scheme that integratesmicrobiological measures, population, age demographics, riv-erine inputs, proximity to outfalls and flushing rates. Micallefand Williams [10,11,13] developed a scoring and classificationsystem for swimming areas called Bathing Area ClassificationSystem (BARE ). This system uses 45 different indicators forboth rural and urban sand beaches. The indicators are groupedinto safety categories, bathing water quality, infrastructure andcleanliness, beach influence area (hinterland), and trash quan-tification. These authors [10,13], and Pereira et al. [9], selectedbeach characteristics and ranked them in order of importanceby distributing surveys among beach users. The two elements(descriptive beach features and users’ perception) were thenused to design management plans tailored for each beach.
Micallef and Williams [10] recommended considering eco-nomic characteristics to evaluate and classify sand beaches.Contingency values, hedonic prices, and travel costs havebeen published [27e32] but, in most beach evaluation litera-ture, monetary values have been underestimated, given littleweight, or not considered, e.g. the increase of real estate valuesin coastal zones [10]. Therefore, as in a previous exercise inseven Mexican beaches [33], in this work we used similar cri-teria to describe beaches and users’ perception as they appearin the literature, but we added a monetary value by incorporat-ing three economic indicators for urban beaches.
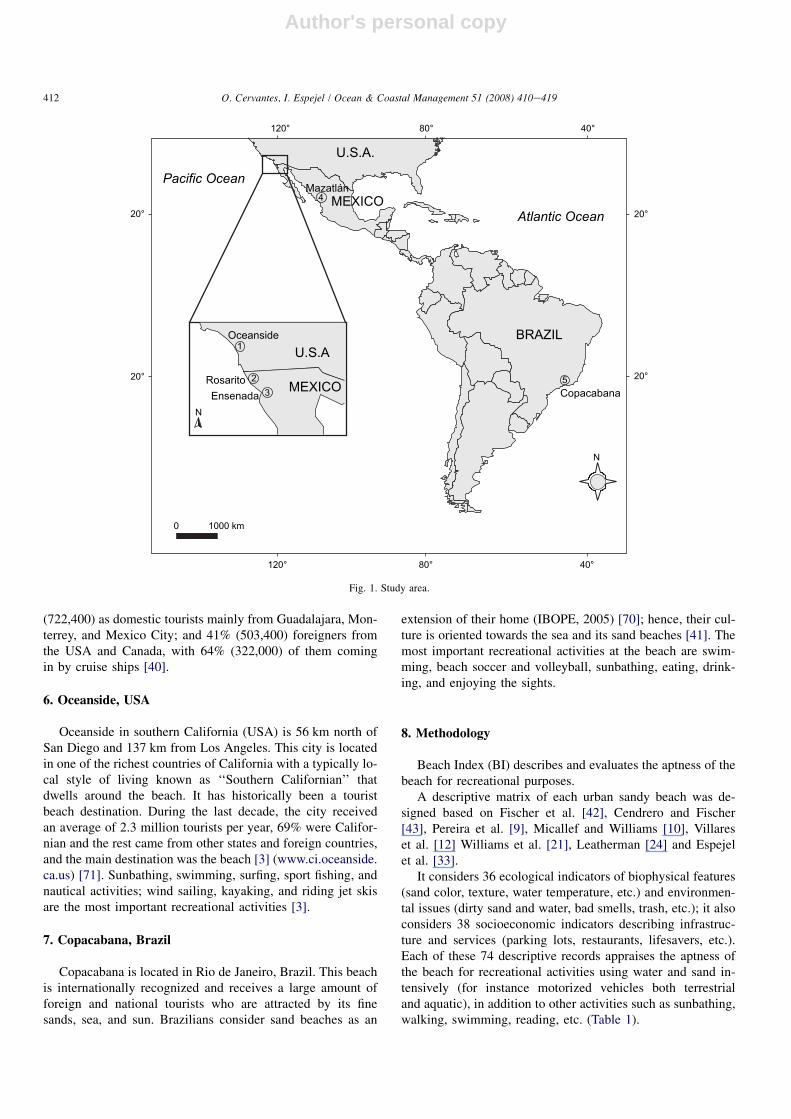
The index was applied to five urban beaches in America(Fig. 1) in order to identify the main factors affecting the
integral quality of recreational beaches in different socioeco-nomic environments.
2. Study area
Five urban beaches with similar physiographic characteris-tics (sandy, wide, and extensive) but with marked differencesin terms of socio-cultural and economic features were se-lected. Three sandy beaches of northwestern Mexico were in-cluded in the study, two in semiarid (Ensenada and Rosarito)and one in tropical climate (Mazatlan), a beach in tropicalRio de Janeiro, Brazil (Copacabana), and one in semiaridSouthern California, USA (Oceanside).
3. Rosarito, Mexico
Rosarito, in Baja California, Mexico, is one of the maintourist destinations of the state because of its strategic locationonly 15 km away from the MexicoeUSA border with Califor-nia, one of the richest states in the USA [34]. This has at-tracted tourism since 1920, which turned into the mostimportant local activity; so important that it supports and en-courages other activities such as commerce and real estate[7]. There are 11 km of sand beaches in Rosarito that representthe natural resource visited by tourists [35]. In 2002, the cityhad 2220 rooms in 31 hotels [36]. This sector employs morethan 65% of the economically active population [37]. Touristsarrive mainly from the state of California, USA. This flow hasbeen classified as cross-border tourism [38] by the WorldTourism Organization (UNWTO) based on the length oftime of their stay (24e72 h).
4. Ensenada, Mexico
Ensenada, in Baja California, Mexico, depends on tourismas one of its main income sources, employing 54% of the eco-nomically active population [34]. Tourists come primarilyfrom the USA (68%), especially from southern California. In1998, the city had 70 hotels, with a total of 2769 rooms [39]and this has slowly grown until recently, when residential tour-ism is being promoted. Visitors, attracted by climate (27%),beach (15%), and shopping (14%), arrive in Ensenada mainlyby land. However, an important segment does come in by seaeither on cruises or in private boats [36].
5. Mazatlan, Mexico
Mazatlan, Sinaloa (Mexico) is a traditional beach destina-tion in North America. Located on the coast of the Gulf ofCalifornia, its tropical climate and 17 km of continuous sandybeaches are the main tourist attraction. Sport fishing, surfing,beach sports, jogging, swimming, sunbathing, sightseeing, eat-ing, and drinking are the main recreational activities [40].
Tourism (62%), commerce, and fishing (CONAPO, 2006)[69] are the most important economic activities. The city hasinfrastructure of 139 hotels offering 9410 rooms in differentcategories [40]. In 2002, it received 1,225,800 visitors; 59%
411O. Cervantes, I. Espejel / Ocean & Coastal Management 51 (2008) 410e419
Author's personal copy
(722,400) as domestic tourists mainly from Guadalajara, Mon-terrey, and Mexico City; and 41% (503,400) foreigners fromthe USA and Canada, with 64% (322,000) of them comingin by cruise ships [40].
6. Oceanside, USA
Oceanside in southern California (USA) is 56 km north ofSan Diego and 137 km from Los Angeles. This city is locatedin one of the richest countries of California with a typically lo-cal style of living known as ‘‘Southern Californian’’ thatdwells around the beach. It has historically been a touristbeach destination. During the last decade, the city receivedan average of 2.3 million tourists per year, 69% were Califor-nian and the rest came from other states and foreign countries,and the main destination was the beach [3] (www.ci.oceanside.ca.us) [71]. Sunbathing, swimming, surfing, sport fishing, andnautical activities; wind sailing, kayaking, and riding jet skisare the most important recreational activities [3].
7. Copacabana, Brazil
Copacabana is located in Rio de Janeiro, Brazil. This beachis internationally recognized and receives a large amount offoreign and national tourists who are attracted by its finesands, sea, and sun. Brazilians consider sand beaches as an
extension of their home (IBOPE, 2005) [70]; hence, their cul-ture is oriented towards the sea and its sand beaches [41]. Themost important recreational activities at the beach are swim-ming, beach soccer and volleyball, sunbathing, eating, drink-ing, and enjoying the sights.
8. Methodology
Beach Index (BI) describes and evaluates the aptness of thebeach for recreational purposes.
A descriptive matrix of each urban sandy beach was de-signed based on Fischer et al. [42], Cendrero and Fischer[43], Pereira et al. [9], Micallef and Williams [10], Villareset al. [12] Williams et al. [21], Leatherman [24] and Espejelet al. [33].
It considers 36 ecological indicators of biophysical features(sand color, texture, water temperature, etc.) and environmen-tal issues (dirty sand and water, bad smells, trash, etc.); it alsoconsiders 38 socioeconomic indicators describing infrastruc-ture and services (parking lots, restaurants, lifesavers, etc.).Each of these 74 descriptive records appraises the aptness ofthe beach for recreational activities using water and sand in-tensively (for instance motorized vehicles both terrestrialand aquatic), in addition to other activities such as sunbathing,walking, swimming, reading, etc. (Table 1).
5
4
N
0 1000 km
20°
N
2
EnsenadaRosarito
Oceanside1
3
U.S.A
MEXICO
Mazatlán
BRAZIL
MEXICO
U.S.A.
Copacabana
Pacific Ocean
Atlantic Ocean
20°
120° 80° 40°
40°80°120°
20°
20°
Fig. 1. Study area.
412 O. Cervantes, I. Espejel / Ocean & Coastal Management 51 (2008) 410e419

Author's personal copy
One investigator (the same one) walked the four beachesand observed all attributes in the descriptive card, these wereanalyzed by qualifying them into three categories [44e46] as-signing a value of 3 if it were favorable, 2 if indifferent, and 1if unfavorable for recreational activities (BI) (Table 2).
9. Knowledge Index (KI; users’ perception)
To determine the users’ perception of these beaches, previ-ous work by Pereira et al. [9] on the coast of Brazil , McLeodet al. [8] on rural Irish and Portuguese sand beaches , and Mor-gan et al. [47] in the United Kingdom was used as reference.The questionnaires used to establish user’s perception wereadapted and modified through a series of pilot tests thus gen-erating a 36-question survey.
Chadwick [48] suggests that this piloting exercise must bedone at a site similar to the study area. The municipal beach(Conalep in Ensenada, Mexico) was selected for this purpose[33]. The final questionnaire was prepared in Spanish andEnglish versions to be randomly applied to beach users.
The questionnaire focused on three main aspects:
(1) The user profile, in which age, schooling, sex, marital sta-tus, occupation, and origin are determined.
(2) The user’s attitude towards the beach, for example, favor-ite activities, preferred season to visit, reasons for attend-ing, and their chosen company, among others.
(3) The user’s opinion about the biotic and abiotic attributes ofthe beach and conditions of infrastructure and services.
Both attitude and opinion represent the user’s perceptionand define the knowledge index (KI).
The minimum number of surveys for statistic significancewas determined by the probabilistic expression of Snedecorand Cochran [49] proposed by Ibarra [50] for infinite universes(N¼ 1000) or finite non-accounted for the content of floatingelements was used. The survey was applied to beach users
during weekends and days off, when beaches receive the great-est number of visitors.
Repetitions in the answers to questionnaires were detected,thus isovariance curves were used to stop surveying. Cochranand Cox [51] and Solana-Sansores and Arreguın-Sanchez [52]suggest this method to check if the number of surveys isoptimal.
The survey was analyzed as follows:
1. The frequency of response types was calculated. Fre-quency analysis allowed us to obtain a first picture ofthe users’ opinion and attitude towards the beach.
2. Value ranks were defined. The answers were described inthree categories (favorable: 3, regular: 2, and unfavorable:1) which are commonly used among beach researchers[44e46]. Based on previous publications [10,11,21,24]a worldwide favorite beach for urban recreation and tourismdevelopment was described. This ‘‘ideal’’ beach has sand, itis not deep, the temperature of the water is pleasant, it lacksdangerous animals, sand and water are clean, no bad odorsor discharges are present, it is not dangerous, and it has basicinfrastructure and services (access, bathrooms, security,lifeguards, shade, and small shopping areas) (Table 2).
For Rio de Janeiro, a previous survey by the Brazilian In-stitute of Public Opinion and Statistics (IBOPE, 2005) at Co-pacabana beach was used as a reference to define user’sperception.
10. Monetary Index (MI; economic value)
To assess the effect [33] of the beach on the economic in-dicators defined by both the market and private interests or bythose established by public and institutional interests we se-lected the following parameters:
(1) Property tax per square meter.
Table 1
Example of the evaluation form to define the beach index (BI)
Given value
for recreational beach aptitude
Biophysical and pollution indicators
Beach width (m) <5 5e10 10e30 50e80 >80 2
Sediment color Dark Gray Brown Light gold White 3
Morphodynamics Reflective Intermediate Dissipative 2
Vegetation cover (%) <10 10e20 20e30 <30 Absent 2
Dangerous animals Present Absent 1
Trash Too much Moderate Few None 2
Sewage outfalls Present Absent 3
Infrastructure and services indicators
Beach use intensities Saturated Moderate Low 2
Garbage collectors None 1e5 6e10 >10 3
Public restrooms None 1e3 3e5 >5 2
Sport facilities Absent Present 3
Car parking distance >500 200e500 100e200 <100 2
Favorable (3), indifferent (2), unfavorable (1) attributes for active and passive recreation.
In bold some actual Copacabana beach features.
413O. Cervantes, I. Espejel / Ocean & Coastal Management 51 (2008) 410e419
Author's personal copy
(2) Price per square meter of land in the real estate market.(3) Three-star hotel room rates.
Spaces with and without beach front, at two blocks or 200 mdistance inland or towards the urban areas from the physicallimit of the sandy part of the beach. Each of these values wasconverted into US currency (USD) to compare values.
To compare indexes the numerical values were standard-ized using the Nijkamp and Rietveld [53] non-parametric sta-tistic defining three classes: high, medium, and low. Finally, allthe indexes (BI, KI, MI) were compiled in a matrix andbeaches were arranged from the lowest to the highest valueintegrating the IBVI index (Table 6).
11. Results
11.1. Beach Index (BI)
Copacabana beach presented the highest values based onthe quality of its physical attributes, zoning of beach activitiesand infrastructure and services offered by municipal and hotelareas (Table 3). Mazatlan and Oceanside were medium ratedbeaches. Although in Mazatlan the physical conditions ofthe beach are reasonably good, public services are insufficient.On the contrary, in Oceanside physical conditions are poor(cold water and chronic beach erosion) but beach infrastruc-ture is fairly good. Ensenada and Rosarito were rated the low-est because beach activities are chaotic: vehicles, horses,salespeople and drunkards mix in with peaceful families andtourists, and beach infrastructure is incipient or inexistent.
11.2. Knowledge Index (KI)
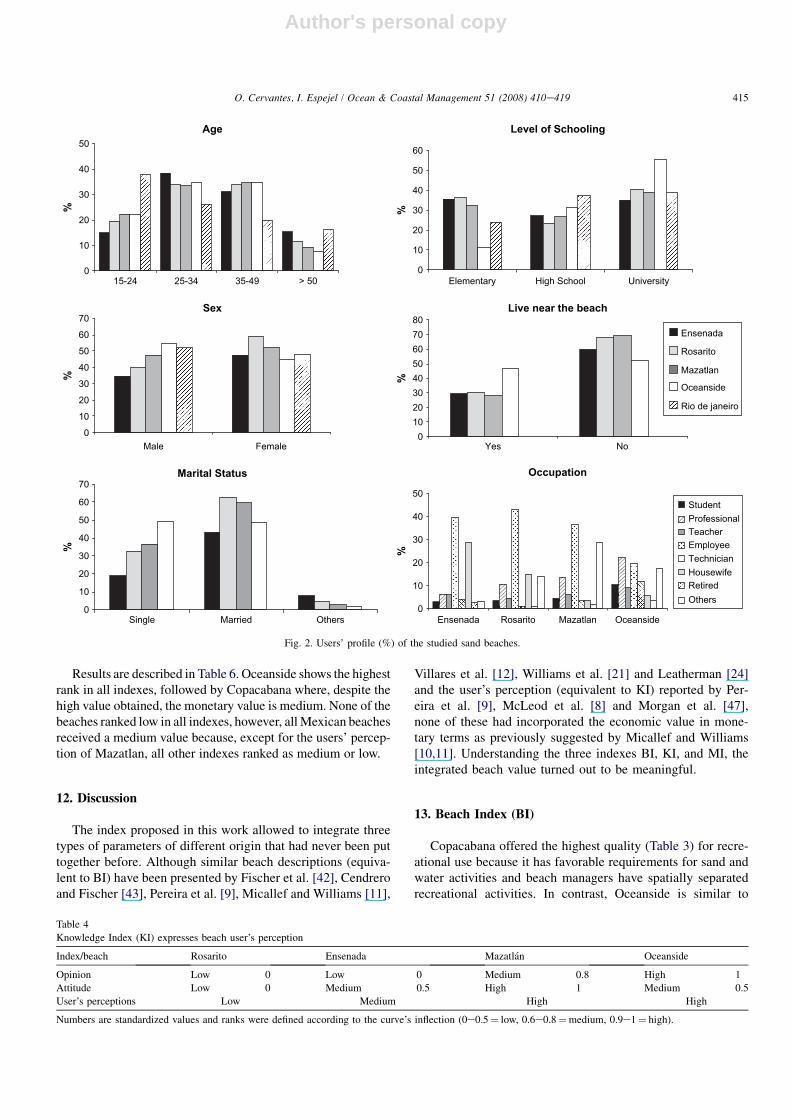
Sand beaches are mainly used by married couples, usuallyemployees, aged between 25 and 49 years. Oceanside visitorshave higher education (56%) while in Rio de Janeiro the studylevel reaches high school (37%) and in Rosarito, Ensenada and
Mazatlan (37, 36, 32%, respectively) visitors have only had el-ementary schooling (Fig. 2).
Mazatlan and Oceanside had high ranking, while Ensenadaand Rosarito were only given medium and low value, respec-tively (Table 4). In spite of the chronic erosion and cold watermentioned in the BI description of Oceanside, most users agreethat it classifies within the concept of the ‘‘ideal beach’’. Payinglittle attention to sewage runoff odors and the lack of services,Mazatlan users attached importance to the physical conditionssuch as warm water and tropical climate. Ensenada and Rosaritocannot be classified as tourist beaches yet, though they are ap-preciated by local residents for some of their favorable physicalattributes; especially for walking or resting rather than forswimming. Beach users mentioned the absence of infrastructureand pointed out danger caused by the presence of trash, by someusers’ behavior and other uncontrolled activities.
11.3. Monetary index (MI; economic value)
In Oceanside, monetary value is ranked high (Table 5) be-cause all values except hotel room rates were high. On theother hand, Mazatlan, Ensenada and Rosarito ranked mediumin MI value. Copacabana shows a low value in two of the threemonetary indicators.
11.4. Integrated beach value index (IBVI)
The index is: IBVI¼ BI, KI, MI,where,
IBVI¼ integrated beach value index.BI¼ beach index: expresses the recreational capacity of thebeach according to its biophysical and environmental attri-butes and its infrastructure and services.KI¼ knowledge index: evaluates opinion and the attitudeof the users on the beach.MI¼monetary ndex: estimates the economic value of thebeach in monetary terms.
Table 2
Example of response classifications according to favorability analysis (KI)
Index Categories Question Answer Favorability Classes
Opinion Beach conditions Water temperature Nice/normal pleasant 3 High
Warm 2 Medium
Cold 1 Low
Beach public services The public services (restrooms showers etc.)
of this beach are:
Adequate 3 High
Inadequate 2 Medium
Nonexistent 1 Low
Attitude Recreation habits You prefer to come to the beach on Weekends 2 Medium
Both 3 High
Weekdays 1 Low
Table 3
Beach Index (BI)
Index/beach Ensenada Rosarito Mazatlan Copacabana Oceanside
Recreational aptitude of the beach (BI) Medium 0.38 Low 0 Medium 0.88 High 1 Medium 0.70
Describes the urban sandy beaches by 29 of biophysical, 38 infrastructure and services and 7 environmental quality attributes. Numbers are standardized values in
three ranks (0e0.18¼ low, 0.19e0.88¼medium; 0.89e1¼ high).
414 O. Cervantes, I. Espejel / Ocean & Coastal Management 51 (2008) 410e419
Author's personal copy
Results are described in Table 6. Oceanside shows the highestrank in all indexes, followed by Copacabana where, despite thehigh value obtained, the monetary value is medium. None of thebeaches ranked low in all indexes, however, all Mexican beachesreceived a medium value because, except for the users’ percep-tion of Mazatlan, all other indexes ranked as medium or low.
12. Discussion
The index proposed in this work allowed to integrate threetypes of parameters of different origin that had never been puttogether before. Although similar beach descriptions (equiva-lent to BI) have been presented by Fischer et al. [42], Cendreroand Fischer [43], Pereira et al. [9], Micallef and Williams [11],
Villares et al. [12], Williams et al. [21] and Leatherman [24]and the user’s perception (equivalent to KI) reported by Per-eira et al. [9], McLeod et al. [8] and Morgan et al. [47],none of these had incorporated the economic value in mone-tary terms as previously suggested by Micallef and Williams[10,11]. Understanding the three indexes BI, KI, and MI, theintegrated beach value turned out to be meaningful.
13. Beach Index (BI)
Copacabana offered the highest quality (Table 3) for recre-ational use because it has favorable requirements for sand andwater activities and beach managers have spatially separatedrecreational activities. In contrast, Oceanside is similar to
0
10
20
30
40
50
60
Elementary High School University
Level of Schooling
0
10
20
30
40
50
15-24 25-34 35-49 > 50
Age
0
10
20
30
40
50
60
70
Single Married Others
Marital Status
01020304050607080
Yes No
Live near the beach
0
10
20
30
40
50
60
70
Male Female
Sex
Ensenada
Rosarito
Mazatlan
Oceanside
Rio de janeiro
0
10
20
30
40
50
Ensenada Rosarito Mazatlan Oceanside
Occupation
StudentProfessionalTeacherEmployeeTechnicianHousewifeRetiredOthers
%%
%
%%
%
Fig. 2. Users’ profile (%) of the studied sand beaches.
Table 4
Knowledge Index (KI) expresses beach user’s perception
Index/beach Rosarito Ensenada Mazatlan Oceanside
Opinion Low 0 Low 0 Medium 0.8 High 1
Attitude Low 0 Medium 0.5 High 1 Medium 0.5
User’s perceptions Low Medium High High
Numbers are standardized values and ranks were defined according to the curve’s inflection (0e0.5¼ low, 0.6e0.8¼medium, 0.9e1¼ high).
415O. Cervantes, I. Espejel / Ocean & Coastal Management 51 (2008) 410e419

Author's personal copy
Copacabana in terms of the spatial distribution of activities butthe quality for recreation was ranked medium because the sea-water is polluted and the beach is being eroded due to the con-struction of the adjacent navy base and dams [3,54] (www.spl.usace.army.mil) [73]. Besides, the San Luis Rey River, whichacts as natural drainage of the highly urbanized area [55], dimin-ishes water quality, which in turn limits beach activities, espe-cially during the rainy season [56]. In agreement withHanemann et al. [57], these authors report that the main problemin the San Diego County and southern California sand beaches isthe bad quality of the water used by swimmers.
Mazatlan was ranked medium because, although it is a fa-vorite beach for Mexican tourists, services are not well orga-nized and almost no infrastructure for recreational support ispresent. Ensenada also ranked medium. It was registered ashaving cold water, which is due to the presence of the coldCalifornia Current. Therefore, the beach is preferred by resi-dents for walking and for the ‘‘ocean view’’ rather than forswimming and sunbathing. Besides, it has litter [58] and defor-ested sand dunes. The lowest value for BI was recorded inRosarito because, although physical features are fairly good,lack of infrastructure and services and polluted water andsand are important descriptors for the evaluation of recrea-tional sandy beaches [16e18,59].
If, in the near future, beaches are monitored with themethod presented in this work, the evaluations for Ensenadaand Rosarito will radically change since huge ocean-view ur-banization plans are coming up in the next 5e10 years.
This index can be compared to others that are found in lit-erature, mostly checklists like Leatherman [24], Pereira et al.[9], Williams et al. [21], Villares et al. [12], but the BI isa more similar index to those presented by Fischer et al.[42], Cendrero and Fischer [43] and Micallef and Williams[10,11] in which all descriptors are evaluated. These authorshave evaluated coastal areas for conservation (rural beachesfor others) and developed areas. In Mexico, Enriquez [59] de-termined beach recreational capacities by comparing the spe-cific requirements of an activity and the existing attributes on
the used beaches in a similar format as the one used in thisresearch.
Nevertheless, our proposal can be considered advantageousbecause it allows to define the recreational aptitude of any typeof beach, be it in a mass tourist area or in a wild isolated site.The index allows to detect the attributes that do or do not favorthe recreational aptitude of any beach. It is possible to directlyidentify the missing elements make it an ideal beach and to de-sign strategies or actions directed to recover or improve thoseelements which, if compiled, would bring about an increase inthe recreational offerings and attractiveness of the beach.
14. Knowledge Index (KI)
According to IBOPE (2005), an opinion as well as an atti-tude gives a high value to Copacabana. This survey, in accor-dance with Fessler et al. [41] and Gomes [60], refers to theculture and sense of belonging to this beach, which was inter-preted as of high value. The survey mentions that walking,running, swimming, sunbathing, and sports like football, vol-leyball, and frescobol (a kind of beach tennis) are the mainactivities in Copacabana beach. Similarly, Mazatlan andOceanside were highly ranked by users but for different rea-sons. The user’s perception of Oceanside beach considersthe beach as part of the ‘‘social imaginary’’ and ‘‘Californialifestyle’’ [3,55,57]. The user’s perception of the beach at Ma-zatlan corresponds with an idea of a worldwide favorite beachfor urban recreational and tourism development [38,61]. Visi-tors are attracted by climate, carnival and some nationwidesports events [40].
KI has seldom been used or included as part of beach eval-uations and classification schemes [14] because it is difficult todefine. Currently, effective international schemes with greatinfluence on beach certification like Blue Flag, Blue Wave,and Seaside Award focus only on fulfilling technical character-istics as the BI presented above, but are limited in user’sperception aspects. Fischer et al. [42], Chaverri [19], Cendreroand Fischer [43] and Leatherman [24] raised other issues todescribe and evaluate beaches, but it is only recently that Per-eira et al. [9] in Brazil and Micallef et al. [11,13] in Malta andCroatia, elaborated new schemes incorporating ecological andperceptional aspects in only one instrument to classify andevaluate sand beaches in an integrated way. In these schemes,the selection and order of importance of the characteristicswere determined from previous surveys of beach users.
This lack of information about beach users’ perception hasled to the discovery that users of certified sites with a BlueFlag scheme do not know the difference between a certified
Table 5
Monetary Index (MI) reflects the economic value of the beach
Copacabana Ensenada Mazatlan Rosarito Oceanside
Property tax Low 0.11 Medium 0.22 Low 0 High 1 High 0.76
Real Estate Low 0.05 Low 0 Medium 0.27 Medium 0.54 High 1
Room rates Medium 0.44 High 0.5 High 1 Low 0 Low 0.16
Rank (MI) Low 0.6 Low 0.72 Medium 1.27 Medium 1.54 High 1.92
Numbers are standardized values, the class rank is given by the curves inflexion points (for MI it is 0.6e0.72¼ low, 0.73e1.54¼medium, 1.55e1.96¼ high).
Table 6
Beach rating based on the Integrated beach value index (IBVI)
Index Ensenada Rosarito Mazatlan Copacabana Oceanside
Beach index (BI) Medium Low Medium High High
Knowledge index (KI) Medium Low High High High
Monetary index (MI) Medium Medium Medium Medium High
Integrated beach
value index (IBVI)
Medium Medium High Medium High
416 O. Cervantes, I. Espejel / Ocean & Coastal Management 51 (2008) 410e419

Author's personal copy
beach and an uncertified one [14]. Some even interpret thephysical presence of the blue flag as a sign of risk or danger[14]. Other results showed that people’s opinion on beach cer-tification was not key for the decision to use it [14].
In the present comparative study we found that the user’sprofile is homogenous at all sites despite the different socio-cultural patterns, as Pereira et al. [9] mention. Schoolingdoes reflect the economic asymmetries in the three countries,where the USA appears over Brazil and Mexico (Fig. 2). Over-all, users at all sites liked the sand and agreed that the seawaterand the sand beaches were clean. This agrees with Dinius [62]and Smith et al. [63] who mention that user’s perception re-garding cleanliness or pollution is influenced by visual factors;the user associates absence of litter with clean water. Theyalso state that evidence of a drain or discharge is related toquestionable water quality. At all studied sites there are dis-charges in the beach, however, they are not visible and thususers do not relate them to water quality.
Answers to surveys in low-ranked beaches (see opinion in-dex in Table 4) indicated that users are sensitive to the lack ofrestrooms, showers, security, and cleaning services whichseem to be a common deficiency in sand beaches around theworld [8,9,47,57,64,65].
Oceanside, a well-known and much visited beach in south-ern California, with a million visitors every year and high in-come from tourism [3,4,55] (www.ci.oceanside.ca.us) [71] isthe beach with greatest infrastructure and with highest servicedemands from the users in this research. BI results indicatethat this beach is well equipped and has good infrastructure,much of which does not exist in other sand beaches, and usersare aware of it. Nevertheless, users expressed that the beachrequires more and better services.
15. Monetary Index (MI; economic value)
Oceanside has the highest MI despite the low room rates.This is because Oceanside is more of a residential, not somuch a tourist, urban beach, and this is reflected in the highvalues of real estate and property tax. This may change, asin other regional beaches (Ensenada and Rosarito amongthem), because there are plans for hotel and commercial devel-opment in the near future.
Rosarito and Mazatlan rank with a medium MI becauseeach of the three indicators has a different value. In Rosarito,high local property taxes are related to high demand for hous-ing, mainly by US citizens from California, and not because ofthe beach itself. Living near the seashore is highly regarded bySouthern Californians, but the soaring real estate values andtaxes in California (1% of the sale price [29]) (www.sdcounty.ca.gov/ttc) [74] raise the value of property toa much higher level than in Mexico. This has turned theBaja California coast, especially the TijuanaeRosaritoeEnse-nada tourist corridor, into one of the best areas to acquire realestate with an ocean view [38]. It is on this strip of land wherereal estate areas have been defined as particularly high sincethey offer better infrastructure and services than other areas
of the Rosarito municipality [7]. In addition, there is the pos-sibility of acquiring properties with exclusive and private sandbeaches, which strongly influences their value and conse-quently that of real estate.
In the case of Mazatlan, although one of its main attractionsis the beach, this is not considered when defining and assess-ing valuable zones. This assessment only contemplates avail-able services and socioeconomic value of the site. Hotelrates reflect the economic value of the beach and itsimportance as part of the traditional tourist attraction [66,67](Table 5).
Both Ensenada and Copacabana ranked low in MI and realstate value. The city of Ensenada is an example where thebeach is not considered part of the tourist offering, nor is itconsidered a recreational space of the city and for that reasonit does not influence in real state values. This situation willprobably change due to a municipal program that is being ap-plied to the development of commercial and residential areason the beachfront.
In Copacabana, real estate values are low (Table 5) becauseRio de Janeiro does not show demand for oceanfront real es-tate. In addition, Brazilian laws stipulate limitless access tosand beaches (www.rio.rj.gov.br) [72] and do not permit theestablishment of exclusive or private zones.
The resulting score for each beach allowed to assess thebeach effect on private and public economic indicators ateach site [29,68]. This is clearly shown by each of the eco-nomic indicators selected to establish the economic index(MI) of a beach, which agree with other indicators.
16. Final considerations
The low value of the presently analyzed Mexican beachesreflects a lack of interest in beaches as a natural resourcewhen there is no tourism development. This is interpreted asthe result of a lack of sense of belonging to the beach in En-senada, Rosarito and Mazatlan, which contrasts with thestrong sense of belonging and beach value in Copacabanaand Oceanside.
Most international beach certification processes comparebeaches around the world without taking into account physiog-nomic, social or economic differences. Therefore, this evalua-tion index was purposefully used on sand beaches withparticular cultural and socioeconomic features that wouldmake them seem not very comparable. In conclusion, thismethod allows to compare rather different beaches and obtainresults that may be applied worldwide.
If Copacabana and Oceanside are regarded as the best ur-ban beaches for recreational activities, Mexican beach man-agers could apply this information to improve the threeMexican beaches analyzed in this paper.
Acknowledgments
This work is a contribution of project FON-CNA-2004-01-009 funded by CNA/CONACyT (Mexico) and UABC grants(8a y 9a. Convocatoria Interna). The first author wishes to
417O. Cervantes, I. Espejel / Ocean & Coastal Management 51 (2008) 410e419

Author's personal copy
thank CONACyT for the scholarship granted during his PhDstudies. The authors wish to thank Dr. Jose Jımenez for hisuseful comments. Dr. Ellis Glazier edited the first version ofthe English-language text. The final version of the Englishmanuscript was corrected by Isabel Perez Montfort.
References
[1] Kline JD, Swallow SK. The demand for local’s access to coastal recrea-
tion in Southern New England. Coastal Management 1998;26:177e90.
[2] James R. From sand beaches to beach environments: linking the ecology,
human-use and management of sand beaches in Australia. Ocean and
Coastal Management 2000;43:495e514.
[3] King PG, Potepan M. The economic value of California’s sand beaches.
Technical report. Public Research Institute for California State Govern-
ment; 1997. 40 p.
[4] King PG. The fiscal impact of sand beaches in California. Technical re-
port. Public Research Institute for California State Government; 1999.
40 p.
[5] Houston J. The economic value of sand beaches. A 2002 update. Shore
and Beach 2002;70(1):9e12.
[6] Leon C. Piezas de un rompecabezas: dimension socioeconomica de las
costas de Mexico. In: Riviera Evelia, et al., editors. El Manejo Costero
en Mexico. Mexico: Universidad Autonoma de Campeche-EPOMEX;
2004. p. 5e25.
[7] Bringas N. Polıticas de desarrollo turıstico en dos zonas costeras del
Pacıfico mexicano. Region y Sociedad 1999;11(17):3e52.
[8] Mcleod M, Da Silva CP, Cooper JAG. A comparative study of the percep-
tion and value of sand beaches in rural Ireland and Portugal: implications
for coastal zone management. Journal of Coastal Research
2002;18(1):14e24.
[9] Pereira LCC, Jimenez JA, Madeiros C, Marinho Da Costa R. The influ-
ence of environmental status of Casa Caiada and Rio Doce sand beaches
(NE-Brazil) on beach users. Ocean and Coastal Management 2003;46:
1011e30.
[10] Micallef A, Williams AT. Application of function analysis to bathing
areas in the Maltese islands. Journal of Coastal Conservation
2003;9:147e58.
[11] Micallef A, Williams AT. Application of a novel approach to beach clas-
sification in the Maltese islands. Ocean and Coastal Management
2004;47:225e42.
[12] Villares M, Roca E, Serra J, Montori C. Social perception as a tool for
beach planning: a case study on the catalan coast. Journal of Coastal Re-
search 2006;48:118e23 [Special Issue].
[13] Micallef A, Williams AT, Radic M, Ergin A. Application of a novel bath-
ing area evaluation technique e a case study of Croatian Island sand
beaches. World Leisure 2004;4:5e21.
[14] Nelson C, Morgan R, Willians AT, Wood J. Beach awards and manage-
ment. Ocean and Coastal Management 2000;(43):87e98.
[15] FEE. Blue flag campaign. In: Official web page for foundation for envi-
ronmental education; 2002. 40 p. <www.blueflag.org>.
[16] Clean Beaches Council. Blue wave campaign. In: Official web page for
clean beaches council; 1998. <www.cleanbeaches.org/bluewave>.
[17] National Healthy Beach Campaign (NHBC). In: Official web page for
NHBC; 2005. <www.ihrc.fiu.edu/nhbc>.
[18] Seaside Award. In: Official web page for Quality Coast Award; 2006.
<www.qualitycoast.org>.
[19] Chaverri R. Coastal management: The costa rica experience. In:
Magoon Jr OT, editor. Proceedings Coastal Zone ‘89. 5th Symposium
on Coastal and Ocean Management. Amer. Soc. Civ. Eng 1989;5:
1112e24.
[20] Short A. Sand beaches of New South Wales Coast. Australian Beach
Safety and Management Programme 1993:358 p.
[21] Williams AT, Leatherman SP, Simmons SL. Beach aesthetics values: the
South West Peninsula, UK. In: Sterr H, Hofstide J, Plag P, editors.
Interdisciplinary discussions of coastal research and coastal management
issues and problems. Frankfurt: Peter Lang; 1992. p. 240e50.
[22] Williams AT, Morgan R. Beach Awards and rating systems. Shore and
Beach 1995;63(4):29e33.
[23] Morgan R. A novel, user-based rating system for tourist beaches. Tour-
ism Management 1999;20:393e410.
[24] Leatherman SP. Beach rating: a methodological approach. Journal of
Coastal Research 1997;3(1):253e8.
[25] Ministry of the Economy. Norma Mexicana que establece los requisitos y
especificaciones de sustentabilidad de calidad de playas NMX-AA-120-
SCFI-2006. Mexico. Official Newspaper of the Federation 6 July
2006:46e90.
[26] World Health Organization (WHO). In: Bartram Jamie, Rees Gareth, ed-
itors. A practical guide to the design and implementation of assessments
and monitoring programmes. London and New York: E and FN Spon;
2000. p. 337.
[27] Edwards SF. Estimating the value of beach recreation from property
values: an exploration with comparisons to nourishment costs. Ocean
and Coastal Management 1991;15:37e55.
[28] Pompe JP, Rinehart JR. Estimating the effect of wider beaches on coastal
housing prices. Ocean and Coastal Management 1994;22:141e52.
[29] King PG. Economic analysis of beach spending and the recreational ben-
efits of beaches in the city of San Clemente. Technical report submitted
to US Army Corps of Engineers (USACE) and the City of San Clemente;
2001. 39 p.
[30] Blakemore FB, Williams AT, Coman C, Micallef A, Unal O. Aspects of
beach economics: Malta, Romania and Turkey. Journal of World Leisure
2002;2:29e41.
[31] Nelson C, Botterill D. Evaluating the contribution of beach quality
awards to the local tourism industry in Wales e the Green Coast Award.
Ocean and Coastal Management 2002;45:157e70.
[32] Parsons GR, Noailly J. A value capture property tax for financing beach
nourishment projects: an application to Delaware’s ocean beaches. Ocean
and Coastal Management 2004;47:49e61.
[33] Espejel I, Espinoza-Tenorio A, Cervantes O, Popoca I, Mejia A,
Delhumeau S. Proposal for an integrated risk index for the planning of
recreational beaches: use at seven Mexican arid sites. Journal of Coastal
Research 2007;50:47e51 [Special Issue].
[34] COCOTREN. Actualizacion del programa regional de desarrollo urbano,
turıstico y ecologico del corredor TijuanaeRosaritoeEnsenada. Bringas
Rabago NL, coordinator. Reporte Tecnico para la Secretaria de Obras
Publicas del Gobierno del estado de Baja California; 2000.
[35] Lizarraga-Arciniega R, Appendini-Albretchsen Ch, Fischer DW. Plan-
ning for beach erosion: a case study, Playas de Rosarito, B.C., Mexico.
Journal of Coastal Research 2001;17(3):636e44.
[36] Baja California State Tourism Secretariat (SECTUR). Estudio del perfil
del visitante a Baja California. Technical report. IMERK S.C. Tijuana,
Mexico; 2005. 107 p.
[37] Lizarraga Arciniega JR. Cambios espacio-temporales de playa en Playas
de Rosarito, Baja California, Mexico. In: Published PhD doctorate disser-
tation. Universidad Autonoma de Baja California, Mexico; 2005. p. 159.
[38] Bringas N. Algunos aspectos sobre el turismo en la frontera norte de
Mexico. En: Jose Manuel Valenzuela Arce (Ed). Por las fronteras del
norte. Consejo Nacional para la Cultura y las Artes e Fondo de Cultura
Economica. Mexico; 2003. p. 272e301.
[39] Bringas N. Inventario de centros turısticos del corredor costero TijuanaeEnsenada. Secretaria del Estado de Baja California-El Colegio de la
Frontera Norte; 1997. 40 p.
[40] Tourism Board of Sinaloa. Playas de Sinaloa. Technical report. Coordi-
nacion General de Turismo del Estado de Sinaloa; 2004. 20 p.
[41] Fessler LV, Knierbein S, Guerra WM. Der offentliche Raum in der Pla-
nungspolitik. Studien aus Rio de Janeiro und Berlin. Weimar. Germany:
Verlag der Bauhaus-Universitat; 2006.
[42] Fischer DW, Coling JF, Henningsen DE, Joy D. Florida sandy beach: an ac-
cess guide. Office of Coastal Studies. University of West Florida; 1985. 218 p.
[43] Cendrero A, Fischer DW. A procedure for assessing the environmental
quality of coastal areas for planning and management. Journal of Coastal
Research 1997;13:732e44.
418 O. Cervantes, I. Espejel / Ocean & Coastal Management 51 (2008) 410e419
Author's personal copy
[44] Cendrero A. Planificacion ambiental y ordenacion de usos del territorio.
In: Ayala F, Jorda J, editors. Geologıa Ambiental. Madrid: ITGE; 1989.
p. 25e33.
[45] Espejel I, Fischer DW, Hinojosa A, Garcia C, Leyva C. Land-use plan-
ning for the Guadalupe Valley, Baja California, Mexico. Landscape
and Urban Planning 1999;45:219e32.
[46] Bermudez-Zavala R, Ferman-Almada JL, Delgado-Gonzalez, Garcıa-
Gastelum A, Seingier G. Analisis del cambio de uso de suelo a partir
de imagenes de satelite: caso de estudio municipio de playas de Rosarito,
Mexico: Aula y Ambiente, in press.
[47] Morgan R, Jones TC, Williams AT. Opinions and perceptions of England
and Wales Heritage Coast beach users: some management implications
for the Glamorgan Heritage Coast Wales. Journal of Coastal Research
1993;9(4):1083e93.
[48] Chadwick BA. Social science research methods. USA: Prentice-Hall
Inc.; 1984.
[49] Snedecor GW, Cochran WG. Statistical methods. 6th ed. Ames, Iowa,
USA: Iowa State University Press; 1967.
[50] Ibarra MO. Estadıstica para la administracion turıstica. Mexico: Diana;
1998. 274 p.
[51] Cochran WG, Cox GM. Dise~nos experimentales. Mexico: Trillas; 1965.
p. 66e118 [Cap. 3].
[52] Solana-Sansores R, Arreguın Sanchez F. Dise~no de un muestreo probabi-
listico para la pesquerıa con chinchorro playero en el puerto de Calestun,
Yucatan, Mexico. Ciencias Marinas 1990;16(4):43e60.
[53] Nijkamp P, Rietveld P. Multicriteria evaluation in physical planning. Am-
sterdam, The Netherlands: Elsevier Science Publications; 1990. 219 p.
[54] SANDAG San Diego Association of Governments. San Diego regional
beach sand project. SANDAG Bulletin April 2001.
[55] Lew DK, Larson DM. Valuing recreation and amenities at San Diego
County sand beaches. Coastal Management 2005;33:71e86.
[56] Hilger J. The impact of water quality on Southern California beach rec-
reation: a finite mixture model approach. University of California: Job
Market Paper; 2005.
[57] Hanemann M, Linmwood P, Mohn C, Hilger J, Kurisawa K, Layton D,
et al. Using revealed preference models to estimate the effect of coastal
water quality on beach choice in Southern California. Technical Report
submitted to US Department of Commerce, National Oceanic and Atmo-
spheric Administration (NOAA), US Department of the Interior: mineral
Management Service, CA Department of Fish and Game: office of Spill
Prevention and Response (OSPR), CA State Water Resources Control
Board, and Santa Monica Bay Restoration Commission September;
2004. 80 p.
[58] Silva-I~niguez L, Fischer DW. Quantification and classification of marine
litter on the municipal beach of Ensenada, Baja California, Mexico.
Marine Pollution Bulletin 1991;23:437e41.
[59] Enrıquez HG. Criterios para evaluar la aptitud recreativa de las playas en
Mexico: una propuesta metodologica. Instituto Nacional de Ecologıa
(INE). Gaceta Ecologica 2003;68:55e68.
[60] Gomes P. A condic~ao Urbana-Ensaios de geopolıtica da Cidade. Rio de
Janeiro, Brasil: Bertrand Press; 2002. 304 p.
[61] Martın del Campo D. Los Mares de Mexico. Cronicas de la Tercera Fron-
tera. Era-UAM, Mexico; 1987. 237 p.
[62] Dinius SH. Public perceptions in water quality evaluation. Water
Resources Bulletin 1981;17(1):116e21.
[63] Smith DG, Cragg AM, Croker GF. Water clarity criteria for bathing waters
based on user perception. Environmental Management 1991;33:285e99.
[64] De Ruyck AMC. Factors influencing human beach choice on three South
African Sand beaches: a multivariate analysis. Geojournal 1995;36:
345e52.
[65] Rodrigues SI, Friedrich AC, Wallner-Kersanach MW, Fillmann G. Influ-
ence of socio-economic characteristics of beach users in litter generation.
Ocean and Coastal Management 2005;48:742e52.
[66] Santamarıa-Gomez A. El nacimiento del turismo en Mazatlan 1923e
1971. Mazatlan, Mexico: Universidad Autonoma de Sinaloa; 2002.
[67] Santamarıa Gomez A, Barbosa Jasso MB. Cuatro casos de analisis com-
parativo de destinos turısticos en Mexico. IV Congreso de Investigacion
Turıstica Mexico; 2002. 20 p.
[68] Ariza E, Jimenez JA, Sarda R. A critical assessement of beach manage-
ment on the catalan coast. Ocean and Coastal Management
2008;51:141e60.
[69] Consejo Nacional de Poblacion (CONAPO). Indicadores demograficos
basicos, Mexico, 2006; February 2006. <www.conapo.gob.mx>.
[70] Instituto Brasile~no de Opinion Publica y Estadıstica (IBOPE). Pesquisa
de opiniao publica sobre quiosques na orla maritima do rio de janeiro
do leme a prainha. Rio de Janeiro, Brazil, 2005; November 2005.
<www.orlario.com/ibop1.htm>.
[71] City of Oceanside, California, USA. Community, leisure and govern-
ment; November 2005. <www.ci.oceanside.ca.us>.
[72] City of Rio de Janeiro, Brazil, Riotur, Rio de Janeiro, Brazil, 2003; Feb-
ruary 2006. <www.rio.rj.gov.br>.
[73] US Army Corps of Engineers. Los Angeles District, San Diego County
Shoreline Feasibility Study. Los �Angeles, United States February 2006.
<www.spl.usace.army.mil>.
[74] County of San Diego Treasurer-Tax Collector. San Diego, United States
October 2006. <www.sdcounty.ca.gov/ttc>.
419O. Cervantes, I. Espejel / Ocean & Coastal Management 51 (2008) 410e419