Design and Development of a CAD/CAM System for Foot Orthotics
10
Design and Development of a CAD/CAM System for Foot Orthotics Paul Omari Mogeni, Vickneswari A/P Durairajah, Suresh Gobee Asia Pacific University Technology Park Malaysia Bukit Jalil, Kuala Lumpur 57000 Malaysia [email protected], [email protected], [email protected] ABSTRACT The aim of the project is to design, develop and test scanning equipment to acquire three dimensional data of a foot sole surface, and to use CAD and CAM tools to design a digital orthoses shell with its geometry adapted from digital 3D scan data. Experimental tests are also done to test the reliability and repeatability of foot surface where data generated from 30 sets of measurements is analyzed using various statistical tools such as standard deviation, correlation and regression analyses. Results show that a strong positive and linear correlation exist between computer generated measurements and the mean of manual measurement. KEYWORDS: Orthoses, Point cloud, Mesh, Cad-Cam 1. INTRODUCTION Foot orthotics is a branch of the medical field that is concerned with the analysis, design and manufacture of devices used to guide and to reduce the weight bearing forces as experienced when conduction daily activities . Generally speaking, orthoses are used to control aid or assist in functional or structural movements of the skeletal system of concern. Orthoses can either be pre- fabricated where they are mass produced and available off the shelf for as general purpose, or they can be customized to meet individual cases. In both cases, a detailed analysis of the patient’s foot must be taken in order to detail the correct correctional specification. This project proposes an effective approach that aims to address the efficiency of the design phase of customized correctional shoe inserts or lasts for infant foot orthotics in terms of development time, cost and degree of simplicity. The aim of the project is to design, develop and test a CAD/CAM system for to acquire three dimensional data of a foot sole surface and to use this data for foot orthotic design and morphology purposes. To achieve this, the following objectives are to be met: To scan the foot sole surface and produce its digital image. This involves capturing the digital three dimensional data of the foot sole surface using scanning equipment using the principle of laser triangulation with low cost and off the shelf equipment. To process raw scan data and visualize it in 3D space. The data processing involves integrating mathematical models and computational algorithms to the analysis and 3D solid modeling stages. To test the reliability of computer generated measurements against manual measurements. To generate machine tool instructions based on the 3D digital model of the orthoses. 2. PREVIOUS WORK A fundamental significance of applying principles of CAD/CAM in the design and development of foot orthoses equipment is to optimize on time and cut down on design and development costs. In article [1] a podiatrist who previously relied on traditional method of design and fabrication of sport related orthoses implemented a CAD/CAM system that comprised of a 3D contact digitizer, image processing software ISBN: 978-0-9891305-4-7 ©2014 SDIWC 90
Transcript of Design and Development of a CAD/CAM System for Foot Orthotics

Design and Development of a CAD/CAM System for Foot Orthotics
Paul Omari Mogeni, Vickneswari A/P Durairajah, Suresh Gobee
Asia Pacific University
Technology Park Malaysia
Bukit Jalil, Kuala Lumpur 57000
Malaysia
[email protected], [email protected], [email protected]
ABSTRACT
The aim of the project is to design, develop and
test scanning equipment to acquire three
dimensional data of a foot sole surface, and to
use CAD and CAM tools to design a digital
orthoses shell with its geometry adapted from
digital 3D scan data. Experimental tests are also
done to test the reliability and repeatability of
foot surface where data generated from 30 sets
of measurements is analyzed using various
statistical tools such as standard deviation,
correlation and regression analyses. Results
show that a strong positive and linear correlation
exist between computer generated measurements
and the mean of manual measurement.
KEYWORDS:
Orthoses, Point cloud, Mesh, Cad-Cam
1. INTRODUCTION
Foot orthotics is a branch of the medical
field that is concerned with the analysis,
design and manufacture of devices used to
guide and to reduce the weight bearing
forces as experienced when conduction daily
activities . Generally speaking, orthoses are
used to control aid or assist in functional or
structural movements of the skeletal system
of concern. Orthoses can either be pre-
fabricated where they are mass produced
and available off the shelf for as general
purpose, or they can be customized to meet
individual cases. In both cases, a detailed
analysis of the patient’s foot must be taken
in order to detail the correct correctional
specification. This project proposes an
effective approach that aims to address the
efficiency of the design phase of customized
correctional shoe inserts or lasts for infant
foot orthotics in terms of development time,
cost and degree of simplicity. The aim of the
project is to design, develop and test a
CAD/CAM system for to acquire three
dimensional data of a foot sole surface and
to use this data for foot orthotic design and
morphology purposes. To achieve this, the
following objectives are to be met: To scan
the foot sole surface and produce its digital
image. This involves capturing the digital
three dimensional data of the foot sole
surface using scanning equipment using the
principle of laser triangulation with low cost
and off the shelf equipment. To process raw
scan data and visualize it in 3D space. The
data processing involves integrating
mathematical models and computational
algorithms to the analysis and 3D solid
modeling stages. To test the reliability of
computer generated measurements against
manual measurements. To generate machine
tool instructions based on the 3D digital
model of the orthoses.
2. PREVIOUS WORK
A fundamental significance of applying
principles of CAD/CAM in the design and
development of foot orthoses equipment is
to optimize on time and cut down on design
and development costs. In article [1] a
podiatrist who previously relied on
traditional method of design and fabrication
of sport related orthoses implemented a
CAD/CAM system that comprised of a 3D
contact digitizer, image processing software
ISBN: 978-0-9891305-4-7 ©2014 SDIWC 90
and a host computer in the design of
orthoses. Subsequently an efficacy of over
97% was reached as a result of a more
efficient design and modeling process.
Orthoses design encompasses foot
measurement or classification as a primary
objective for instance, [2] applied CAD by
using a 3D scanner to develop a new sizing
system for Taiwanese males. Anatomical
landmarks physically placed on the foot
assisted in acquiring foot measurements
after which K – Means cluster and principle
component analysis techniques were applied
to classify feet of male. Overall, an
agreement of 72.96% was reached. [3] also
categorized foot scans according to their
characteristics and highlighted the
advantages (improved comfort) of this
approach in the design of customized foot
orthotics. In contrast to [2], [3] implemented
posture and geometry analysis using CAD
software and used this to evaluate similarity
of 3D shoe lasts. In both studies, the positive
outcomes reflect by having reduced
development times and light computational
processes as measurements can be readily
extracted from similar and existing designs
stored in a database. Other primary uses of a
scanning system other that capturing 3D
data include classifying feet [3] according to
geometry deriving measurements. A viable
technique is to use physical anatomical
markers to assist the data acquisition system
in locating and collecting foot
anthropometric data as described by [4].
With the markers fixed at known positions
on the foot, the system developed by this
author was able to compute the required
dimensions and classify foot shapes
according to [5] the principle component
analysis algorithm. According to the study,
use of markers increases the accuracy of
results but with a tradeoff between the
degrees of consistency and increased lead
times. Foot shape, form and size can be
determined using image processing
techniques such as surface or edge detection.
Such an approach has been experimented by
[6] where the authors combined boundary
mesh detection and the region growing
method of the edge and face based
techniques respectively, a hybrid approach
used to detect both sharp and smooth edges.
The boundary mesh is detected using the
cost criterion algorithm. Also placing
anatomical points on the foot before
scanning may be necessary for data
acquisition and also to check for
repeatability or consistency of results.
During implementation phase, acquired
measurements will also be compared to
manual measurement in order to test for
accuracy reliability of the results.
3. METHODOLOGY
3.1 Point Registration - Concept
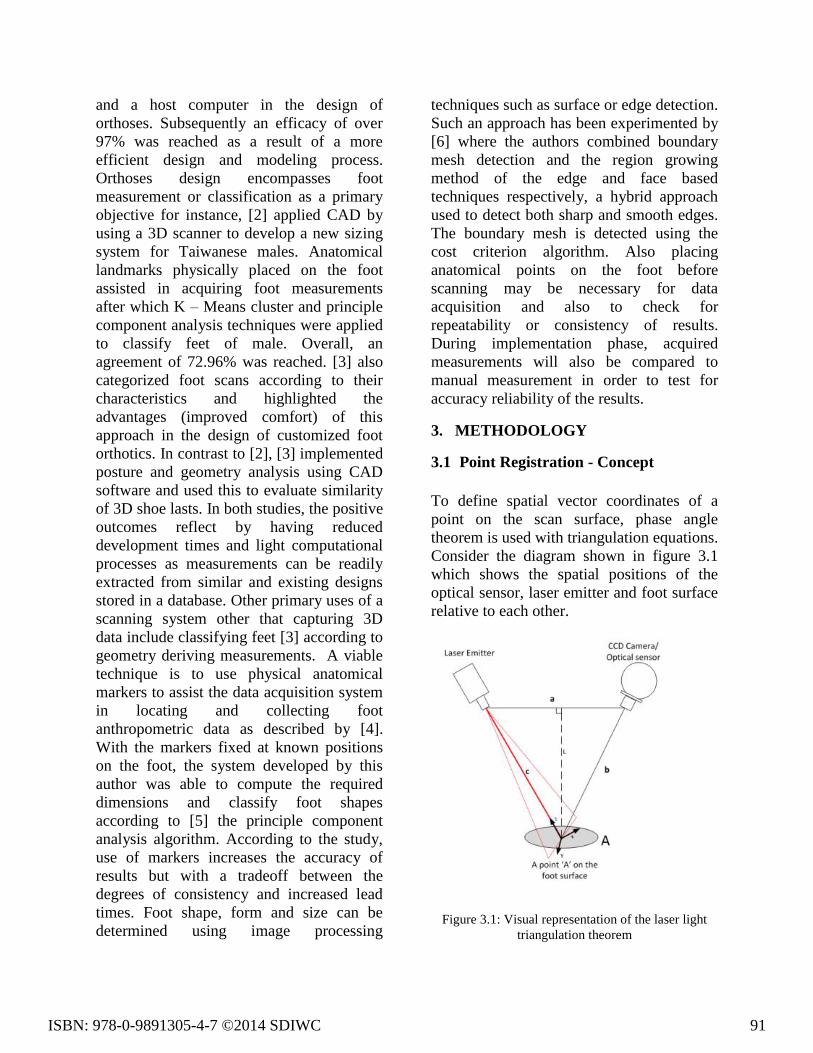
To define spatial vector coordinates of a
point on the scan surface, phase angle
theorem is used with triangulation equations.
Consider the diagram shown in figure 3.1
which shows the spatial positions of the
optical sensor, laser emitter and foot surface
relative to each other.
Figure 3.1: Visual representation of the laser light
triangulation theorem
ISBN: 978-0-9891305-4-7 ©2014 SDIWC 91
To determine the vector notation of a point
A on the surface, the shortest distance l
between the baseline and the point is first
determined according to equation 3-1:
(3-1)
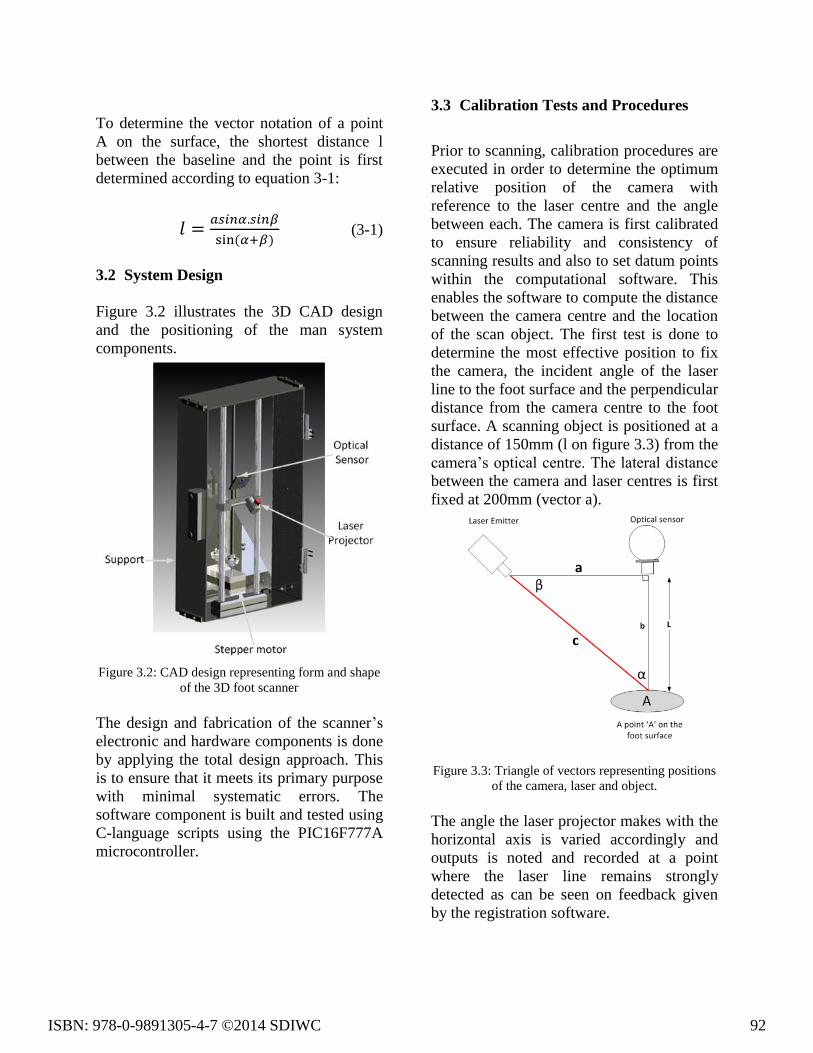
3.2 System Design
Figure 3.2 illustrates the 3D CAD design
and the positioning of the man system
components.
Figure 3.2: CAD design representing form and shape
of the 3D foot scanner
The design and fabrication of the scanner’s
electronic and hardware components is done
by applying the total design approach. This
is to ensure that it meets its primary purpose
with minimal systematic errors. The
software component is built and tested using
C-language scripts using the PIC16F777A
microcontroller.
3.3 Calibration Tests and Procedures
Prior to scanning, calibration procedures are
executed in order to determine the optimum
relative position of the camera with
reference to the laser centre and the angle
between each. The camera is first calibrated
to ensure reliability and consistency of
scanning results and also to set datum points
within the computational software. This
enables the software to compute the distance
between the camera centre and the location
of the scan object. The first test is done to
determine the most effective position to fix
the camera, the incident angle of the laser
line to the foot surface and the perpendicular
distance from the camera centre to the foot
surface. A scanning object is positioned at a
distance of 150mm (l on figure 3.3) from the
camera’s optical centre. The lateral distance
between the camera and laser centres is first
fixed at 200mm (vector a).
Figure 3.3: Triangle of vectors representing positions
of the camera, laser and object.
The angle the laser projector makes with the
horizontal axis is varied accordingly and
outputs is noted and recorded at a point
where the laser line remains strongly
detected as can be seen on feedback given
by the registration software.
ISBN: 978-0-9891305-4-7 ©2014 SDIWC 92

4. GEOMETRY CAPTURE AND
ORTHOSES DESIGN
Foot sole scanning tests are conducted using
the experimental set up shown in figures
4.1a and 4.1b. Experimental tests are done to
analyze the reliability and repeatability of
using the laser triangulation theorem to
capture 3D surface data of the foot sole
surface. A repeatability test is conducted to
in order to gauge whether the system’s
instruments are operating as expected. To
conduct such a test, successive scans are
taken while maintaining the alignment of the
foot specimen and the scanning equipment.
Figure 4.1a: Foot sole sample used for testing
purposes
Figure 4.1b: Experimental set up used to perform foot
surface scans
Once a scanning cycle is complete, cloud
point data is imported into the post-
processing software where mesh and surface
profiles are generated to create a 3D surface
model.
4.1 CAD/CAM APPLICATION
CAD/CAM tools are used to process raw
scan data to a useful form. As illustrated in
figure 4.2. The first step of this process
involves eliminating background noise and
unwanted detail from the 3D cloud data,
next is to filter the point cloud data if
necessary after which a polygon mesh is
generated. Edge detection and NURB (Non
Uniform Rational B-Splines) constructing
tools are then be used to highlight edges,
boundary extraction and model any curved
surfaces respectively. Once the 3D surface
model is defined, it is used to design foot
orthoses that can be used as a correctional
insole when manufactured. To facilitate the
production of such a product, machine tool
programming may be required. Generation
of machining instructions is also done and is
based on the scanned foot profile
Figure 4.2: Image processing procedure
The collection of surface vector points in 3D
space is shown in figure 4.2.
Figure 4.2: Cloud point data
ISBN: 978-0-9891305-4-7 ©2014 SDIWC 93
Using the cloud point data, a mesh surface is
created where the iterative closest point
algorithm [7] embedded within the software
is used to interconnect adjacent points or
vertices to form a mesh of triangles. Surface
profiles are then created as illustrated in
figure 4.3.
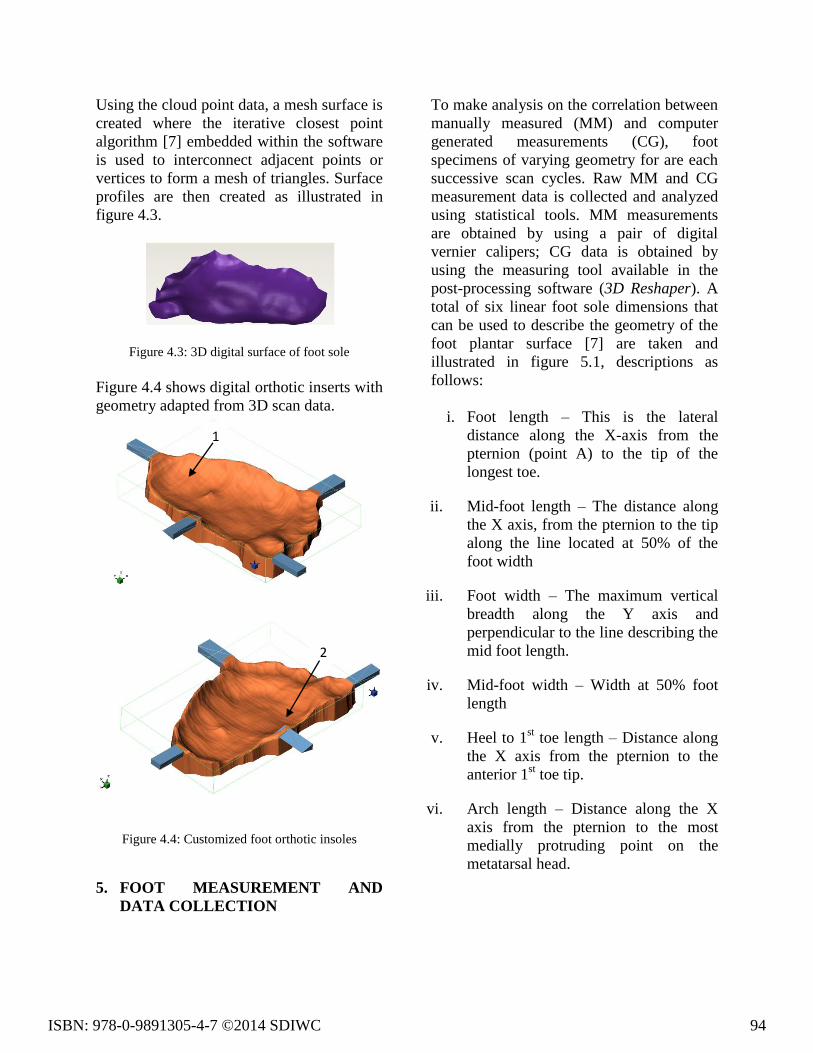
Figure 4.3: 3D digital surface of foot sole
Figure 4.4 shows digital orthotic inserts with
geometry adapted from 3D scan data.
Figure 4.4: Customized foot orthotic insoles
5. FOOT MEASUREMENT AND
DATA COLLECTION
To make analysis on the correlation between
manually measured (MM) and computer
generated measurements (CG), foot
specimens of varying geometry for are each
successive scan cycles. Raw MM and CG
measurement data is collected and analyzed
using statistical tools. MM measurements
are obtained by using a pair of digital
vernier calipers; CG data is obtained by
using the measuring tool available in the
post-processing software (3D Reshaper). A
total of six linear foot sole dimensions that
can be used to describe the geometry of the
foot plantar surface [7] are taken and
illustrated in figure 5.1, descriptions as
follows:
i. Foot length – This is the lateral
distance along the X-axis from the
pternion (point A) to the tip of the
longest toe.
ii. Mid-foot length – The distance along
the X axis, from the pternion to the tip
along the line located at 50% of the
foot width
iii. Foot width – The maximum vertical
breadth along the Y axis and
perpendicular to the line describing the
mid foot length.
iv. Mid-foot width – Width at 50% foot
length
v. Heel to 1st toe length – Distance along
the X axis from the pternion to the
anterior 1st toe tip.
vi. Arch length – Distance along the X
axis from the pternion to the most
medially protruding point on the
metatarsal head.
1
2
ISBN: 978-0-9891305-4-7 ©2014 SDIWC 94
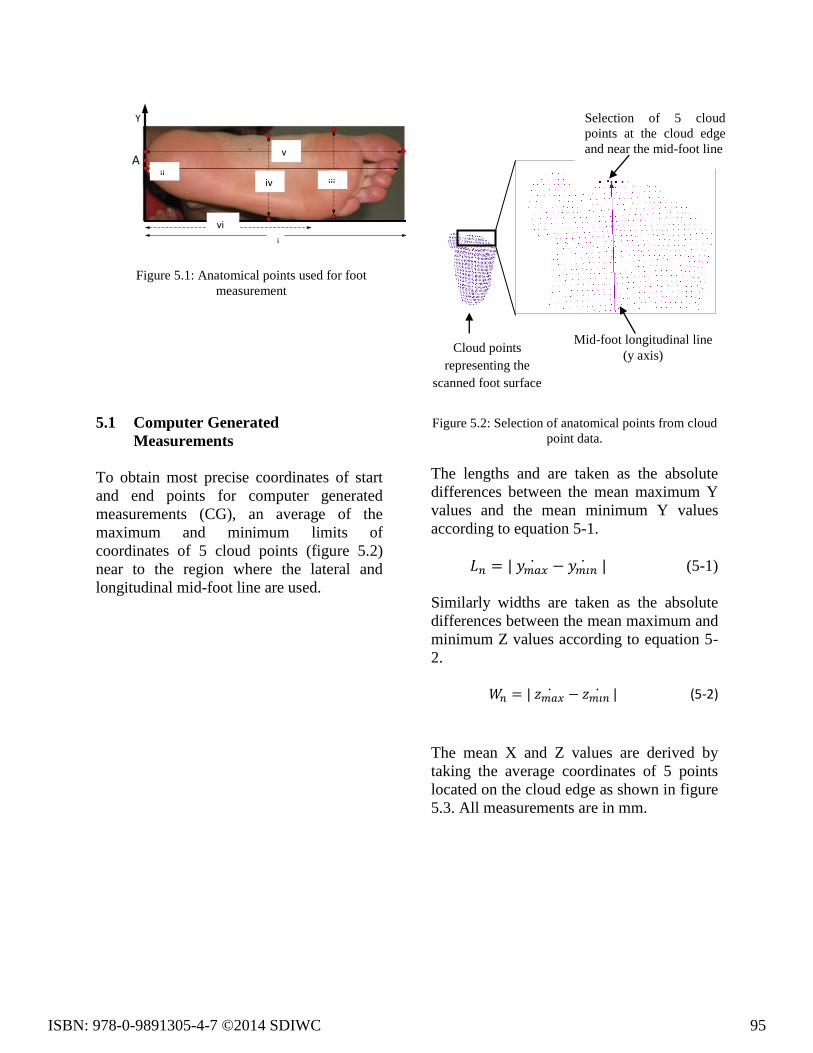
Figure 5.1: Anatomical points used for foot
measurement
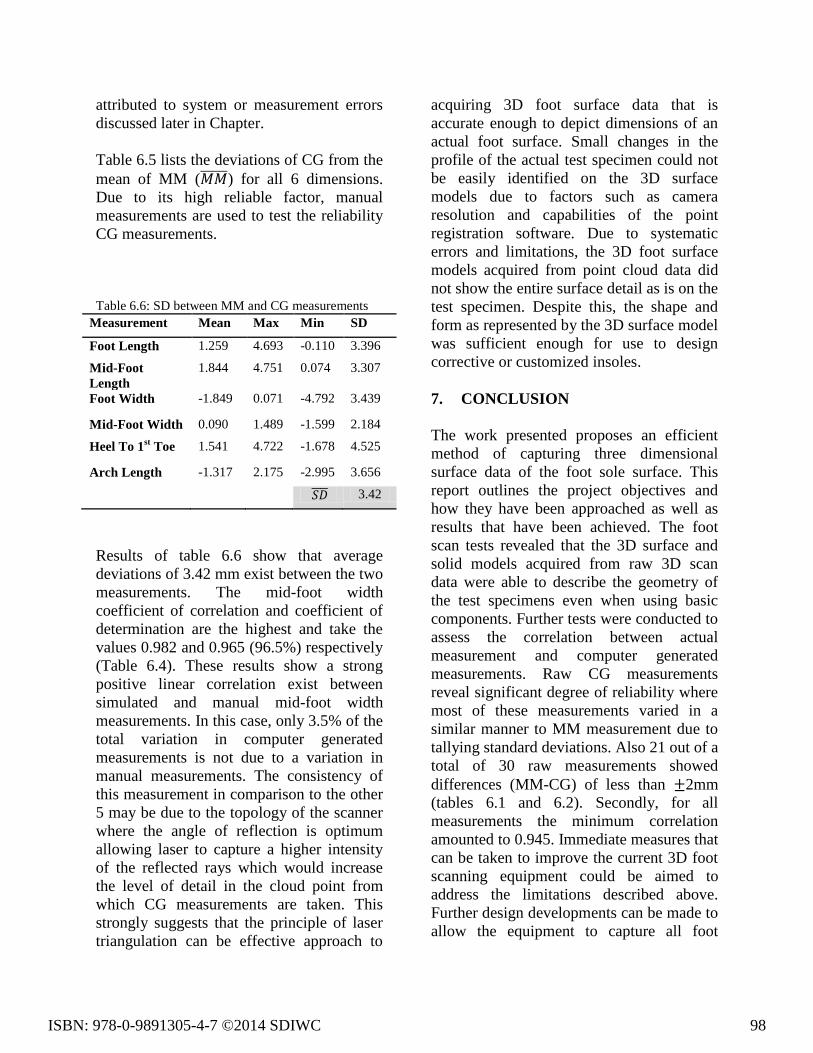
5.1 Computer Generated
Measurements
To obtain most precise coordinates of start
and end points for computer generated
measurements (CG), an average of the
maximum and minimum limits of
coordinates of 5 cloud points (figure 5.2)
near to the region where the lateral and
longitudinal mid-foot line are used.
Figure 5.2: Selection of anatomical points from cloud
point data.
The lengths and are taken as the absolute
differences between the mean maximum Y
values and the mean minimum Y values
according to equation 5-1.
(5-1)
Similarly widths are taken as the absolute
differences between the mean maximum and
minimum Z values according to equation 5-
2.
(5-2)
The mean X and Z values are derived by
taking the average coordinates of 5 points
located on the cloud edge as shown in figure
5.3. All measurements are in mm.
Selection of 5 cloud
points at the cloud edge
and near the mid-foot line
Mid-foot longitudinal line
(y axis) Cloud points
representing the
scanned foot surface
i
ii iii iv
v
vi
ISBN: 978-0-9891305-4-7 ©2014 SDIWC 95

Figure 5.3: Computer generated measurement for an
infant’s foot sample
6. ANALYSIS AND DISCUSSION OF
RESULTS
The shells shown in figure 4.4 show some of
the key orthoses features such as the heel
‘cup’ (1) which has the purpose of
preventing the foot arch from collapsing,
and to improve the effectiveness of the arch
support by increasing the surface area of
contact and distributing pressure, and the
metatarsal pads (2) to redirect forefoot
plantar pressure. Standard deviation results
in table 6.3 show that MM and CG foot
width measurements, MM for the arch
length and CG for foot lengths varied by up
to 3 mm from their mean values. MM and
CG for heel to 1st toe, MM and CG for mid-
foot length, MM for mid foot width and MM
for foot length varied by an average of 2mm.
The least degree of variation occurred for
CG of mid-foot widths with an average of
1mm variations from the mean.
Table 6.1: Statistics obtained from Computer Generated measurement test (mm)
Measurement Sample 1 Sample 2 Sample
3
Sample 4 Sample
5
Sum Mean
Foot Length 51.187 53.440 54.424 55.990 58.065 273.106 54.6212
Mid-Foot Length 49.149 51.623 52.366 53.826 53.316 260.280 52.0560
Foot Width 35.992 35.739 32.933 31.129 29.450 165.243 33.0486
Mid-Foot Width 28.505 27.985 26.768 26.451 29.539 139.248 27.8496
Heel To 1st Toe 51.998 54.019 54.893 56.589 58.398 275.897 55.1794
Arch Length 25.725 28.983 30.053 30.428 30.895 146.084 29.2168
Table 6.2: Statistic obtained from Manual Measurement tests (mm)
Measurement Sample
1
Sample
2
Sample
3
Sample
4
Sample
5
Sum Mean
Foot Length 53.6 55.3 55.8 57.3 57.4 279.4 55.9
Mid-Foot Length 51.5 52.5 54.3 55.3 55.9 269.5 53.9
Foot Width 34.8 33.9 30.3 28.6 28.4 156.0 31.2
Mid-Foot Width 31.2 29.0 27.3 26.2 26.0 139.7 27.9
Heel To 1st Toe 54.2 55.8 55.7 58.1 59.8 283.6 56.7
Arch Length 23.5 27.2 28.5 29.1 31.2 139.5 27.9
ISBN: 978-0-9891305-4-7 ©2014 SDIWC 96

Table 6.3: Descriptive statistics obtained from MM and CG techniques (mm)
Measurement
Max Min Mean SD
MM CG MM CG MM CG MM CG
Foot Length 57.4 58.065 53.6 51.187 55.9 54.621 1.5707 2.5962
Mid-Foot Length 55.9 53.826 51.5 49.149 53.9 52.056 1.8601 1.8340
Foot Width 34.8 35.992 28.4 31.129 31.2 33.049 2.9858 2.8526
Mid-Foot Width 31.2 29.539 26.0 26.451 27.9 27.850 2.1767 1.2677
Heel To 1st Toe 59.8 58.398 54.2 51.998 56.7 55.179 2.2152 2.4442
Arch Length 31.2 30.895 23.5 25.725 27.9 29.217 2.8522 2.0754
Table 6.4: Coefficients of correlation and determination between CG and MM
Coefficient of correlation , r Coefficient of determination, r2
Foot Length 0.963 0.927
Mid-Foot Length 0.982 0.964
Foot Width 0.939 0.881
Mid-Foot Width 0.982 0.964
Heel To 1st Toe 0.961 0.923
Arch Length 0.945 0.893
Table 6.5: Differences between mean of MM and CG measurements (mm)
Measurement -
CG1
-
CG2
-
CG3
-
CG4
-
CG5
Sum Mean
Foot Length 55.880 4.693 2.440 1.456 -0.110 -2.185 6.294 1.259
Mid-Foot Length 53.900 4.751 2.277 1.534 0.074 0.584 9.220 1.844
Foot Width 31.200 -4.792 -4.539 -1.733 0.071 1.750 -9.243 -1.849
Mid-Foot Width 27.940 -0.565 -0.045 1.172 1.489 -1.599 0.452 0.090
Heel To 1st Toe 56.720 4.722 2.701 1.827 0.131 -1.678 7.703 1.541
Arch Length 27.900 2.175 -1.083 -2.153 -2.528 -2.995 -6.584 -1.317
CG measurements for the mid-foot widths
had the least variance (Table 6.3). Of all 5
foot surface samples, the MM foot widths
were varied the most (2.98mm). This is also
reflected in the CG measurements where
foot width measurements exhibited the
highest deviations (2.85mm). For mid-foot
lengths, the standard deviations for MM and
CG measurements are nearly similar at
1.86mm and 1.83mm respectively. A similar
case occurs for heel to 1st toe measurements
where the deviations are 2.21mm and
2.44mm respectively. From these
observations, it can be deduced that changes
in foot width, mid-mid foot length, foot
width and heel to 1st toe MM lengths are
reflected in CG measurements. However, for
mid-foot width and foot lengths, the
standard deviations for MM and CG
measurements do not correlate. This means
that for these particular measurements,
changes in MM cannot be readily used to
explain changes in CG; they can be
ISBN: 978-0-9891305-4-7 ©2014 SDIWC 97
attributed to system or measurement errors
discussed later in Chapter.
Table 6.5 lists the deviations of CG from the
mean of MM ( ) for all 6 dimensions.
Due to its high reliable factor, manual
measurements are used to test the reliability
CG measurements.
Table 6.6: SD between MM and CG measurements
Measurement Mean Max Min SD
Foot Length 1.259 4.693 -0.110 3.396
Mid-Foot
Length
1.844 4.751 0.074 3.307
Foot Width -1.849 0.071 -4.792 3.439
Mid-Foot Width 0.090 1.489 -1.599 2.184
Heel To 1st Toe 1.541 4.722 -1.678 4.525
Arch Length -1.317 2.175 -2.995 3.656
3.42
Results of table 6.6 show that average
deviations of 3.42 mm exist between the two
measurements. The mid-foot width
coefficient of correlation and coefficient of
determination are the highest and take the
values 0.982 and 0.965 (96.5%) respectively
(Table 6.4). These results show a strong
positive linear correlation exist between
simulated and manual mid-foot width
measurements. In this case, only 3.5% of the
total variation in computer generated
measurements is not due to a variation in
manual measurements. The consistency of
this measurement in comparison to the other
5 may be due to the topology of the scanner
where the angle of reflection is optimum
allowing laser to capture a higher intensity
of the reflected rays which would increase
the level of detail in the cloud point from
which CG measurements are taken. This
strongly suggests that the principle of laser
triangulation can be effective approach to
acquiring 3D foot surface data that is
accurate enough to depict dimensions of an
actual foot surface. Small changes in the
profile of the actual test specimen could not
be easily identified on the 3D surface
models due to factors such as camera
resolution and capabilities of the point
registration software. Due to systematic
errors and limitations, the 3D foot surface
models acquired from point cloud data did
not show the entire surface detail as is on the
test specimen. Despite this, the shape and
form as represented by the 3D surface model
was sufficient enough for use to design
corrective or customized insoles.
7. CONCLUSION
The work presented proposes an efficient
method of capturing three dimensional
surface data of the foot sole surface. This
report outlines the project objectives and
how they have been approached as well as
results that have been achieved. The foot
scan tests revealed that the 3D surface and
solid models acquired from raw 3D scan
data were able to describe the geometry of
the test specimens even when using basic
components. Further tests were conducted to
assess the correlation between actual
measurement and computer generated
measurements. Raw CG measurements
reveal significant degree of reliability where
most of these measurements varied in a
similar manner to MM measurement due to
tallying standard deviations. Also 21 out of a
total of 30 raw measurements showed
differences (MM-CG) of less than ±2mm
(tables 6.1 and 6.2). Secondly, for all
measurements the minimum correlation
amounted to 0.945. Immediate measures that
can be taken to improve the current 3D foot
scanning equipment could be aimed to
address the limitations described above.
Further design developments can be made to
allow the equipment to capture all foot
ISBN: 978-0-9891305-4-7 ©2014 SDIWC 98

surface dimensions. Further research into the
field of foot orthotics using three
dimensional foot scans can be used for other
diagnostics purposes apart from foot
deformities. For instance, analysis can be
made to study the feasibility of using similar
scanning equipment to acquire accurate
measurements infants’ foot prints and
determine whether computer generated
measurements can be used as a substitute for
birth weight when determining infants’
maturity at birth. This project in particular is
an example of how engineering practices
have been used to develop a solution and
therefore it is likely that it has an impact on
the social and economic scale. Once the
prototype is developed to suit the market
needs, it is likely that the social and
economic wellbeing on the target users will
be improved.
ACKNOWLEDGEMENT
I would like to acknowledge the guidance
and assistance that has been offered to me
by my project supervisor Mr. Suresh Gobee,
Mrs. Vickneswari A/P Durairajah and Asia
Pacific University School of Engineering
Laboratory staff.
REFERENCES
[1] Boardman, S., 2007. Practice
development: The economic case for
CAD/CAM custom foot orthoses. Podiatry
Now: pp. 40-41.
[2] Yu-Chee, L., (2012). Foot Shape
Classification Using 3D Scanning Data. 9-
12 July 2012. Langkawi, IEEE, pp. 1-6
[3] Hwang, J. T., Lee, K. & Oh, Y. T.,(
2005). Derivation of template shoe-lasts for
efficient fabrication of custom ordered shoe
lasts. Computer Aided Design, Volume 37,
Issue 12, pp. 1241-1250.
[4] Lee, Y.-C., Chao, W.-Y. & Wang, M.-
J., (2012). Foot Shape Classification Using
3D Scanning Data, 9-12 July 2012.
Langkawi, IEEE, p. 16.
[5] Lee, Y., Park, S., Jun, Y. & Choi, C.
W., (2004). A Robust Appoach to Edge
Detection of Scanned Point Data. The
International Journal of Advanced
Manufacturing Technology, 23(3-4), pp.
263-271.
[6] Witana, C., Xiong, S., Zhao, J. &
Goonetilleke, R., (2006). Foot
measurements from three-dimensional
scans: A comparison and evaluation
methods. International Journal of Industrial
Ergonomics, 36(9), pp. 789-807.
[7] Chetverikov, D., Svirko, D., Stepanov,
D. & Pavel, K., (2002). The Trimmed Closet
Point Algorithm. Hungray., IEEE, p.
545.548.
ISBN: 978-0-9891305-4-7 ©2014 SDIWC 99