Dependability Analysis of Diffusion Protocols in Wireless Networks with Heterogeneous Node...
10
Dependability Analysis of Diffusion Protocols in Wireless Networks with Heterogeneous Node Capabilities Paolo Masci, Silvano Chiaradonna, Felicita Di Giandomenico Italian National Research Council, ISTI Dept., via Moruzzi 1, I-56124, Italy E-mail:{masci,chiaradonna,digiandomenico}@isti.cnr.it Abstract Wireless networks are starting to be populated by in- terconnected devices that reveal remarkable hardware and software differences. This fact raises a number of questions on the applicability of available results on dependability-related aspects of communication proto- cols, since they were obtained for wireless networks with homogeneous nodes. In this work, we study the impact of heterogeneous communication and compu- tation capabilities of nodes on dependability aspects of diffusion protocols for wireless networks. We build a detailed stochastic model of the logic layers of the communication stack with the SAN formalism. The model takes into account relevant real-world aspects of wireless communication, such as transitional regions and capture effect, and heterogeneous node capabili- ties. Dependability-related metrics are evaluated with analytical solutions techniques for small networks, while simulation is employed in the case of large networks. 1. Introduction and Related Work The research community is devoting a big effort in the analysis of wireless network since many years. A hot topic concerns the study of variants of protocols that allow to exploit key characteristics of the wireless environment to improve the quality of the provided service. For instance, recent works have explored op- timisations of low-level communication protocols to improve end-to-end delay [17]. Several studies are performed through model-based techniques, i.e., relevant characteristics of the real world are pointed out and used to build a model of the system which can be studied in a controlled environment. In [3] and [2], the wireless network is modelled with n identical stochastic processes, and mathematical techniques are employed to tackle com- plexity for large networks. In [15] and [7], diffusion protocols are analysed with the probabilistic model checker PRISM: a formal specification is provided, and a number of quantitative analyses are performed for rather small networks. In [14], a mathematical model is proposed to represent the stochastic behaviour of a diffusion protocol executed in a wireless network where nodes may appear and disappear at any instant of time. In [6], a novel approach to improve protocol reliability is proposed and evaluated via simulation. A recurrent assumption made in model-based analy- sis of protocols for wireless networks is that all devices have the same capabilities and execute the same appli- cation. Nevertheless, thanks to the rapid advances in hardware and software design, and thanks to the grow- ing number of services provided to end-users, wireless networks are starting to be populated by interconnected devices that reveal remarkable differences. Therefore, device heterogeneity is becoming a relevant aspect in many application sectors, and tackling issues linked to heterogeneity is therefore increasingly crucial. Many studies are currently on-going. For instance, the EU project CONNECT [12] addresses the challenge of interoperability in heterogeneous evolving systems to assure eternal communication in networked systems. Despite this, studies that analyse the behaviour of wireless protocols and take into account heterogeneous node capabilities are still rather isolated [8]. In this work, we study the impact of heterogeneous communication and computation capabilities of nodes on aspects related to dependability [1] of a gossip- based diffusion protocol. Regarding computation het- erogeneity, we consider scenarios in which nodes respond to the protocol with different promptness levels. This may happen, for instance, in the case of hardware heterogeneity (e.g., nodes may have different processing speed), software heterogeneity (e.g., nodes may execute applications that keep their communica- tion and/or computation resources busy), and protocol heterogeneity (e.g., nodes may use adaptation layers to be able to connect to new services). Regarding com-
-
Upload
independent -
Category
Documents
-
view
1 -
download
0
Transcript of Dependability Analysis of Diffusion Protocols in Wireless Networks with Heterogeneous Node...
Dependability Analysis of Diffusion Protocolsin Wireless Networks with Heterogeneous Node Capabilities
Paolo Masci, Silvano Chiaradonna, Felicita Di GiandomenicoItalian National Research Council, ISTI Dept., via Moruzzi 1, I-56124, Italy
E-mail:{masci,chiaradonna,digiandomenico}@isti.cnr.it
Abstract
Wireless networks are starting to be populated by in-terconnected devices that reveal remarkable hardwareand software differences. This fact raises a number ofquestions on the applicability of available results ondependability-related aspects of communication proto-cols, since they were obtained for wireless networkswith homogeneous nodes. In this work, we study theimpact of heterogeneous communication and compu-tation capabilities of nodes on dependability aspectsof diffusion protocols for wireless networks. We builda detailed stochastic model of the logic layers of thecommunication stack with the SAN formalism. Themodel takes into account relevant real-world aspectsof wireless communication, such as transitional regionsand capture effect, and heterogeneous node capabili-ties. Dependability-related metrics are evaluated withanalytical solutions techniques for small networks,while simulation is employed in the case of largenetworks.
1. Introduction and Related Work
The research community is devoting a big effort inthe analysis of wireless network since many years. Ahot topic concerns the study of variants of protocolsthat allow to exploit key characteristics of the wirelessenvironment to improve the quality of the providedservice. For instance, recent works have explored op-timisations of low-level communication protocols toimprove end-to-end delay [17].
Several studies are performed through model-basedtechniques, i.e., relevant characteristics of the realworld are pointed out and used to build a modelof the system which can be studied in a controlledenvironment. In [3] and [2], the wireless network ismodelled with n identical stochastic processes, andmathematical techniques are employed to tackle com-plexity for large networks. In [15] and [7], diffusion
protocols are analysed with the probabilistic modelchecker PRISM: a formal specification is provided, anda number of quantitative analyses are performed forrather small networks. In [14], a mathematical modelis proposed to represent the stochastic behaviour ofa diffusion protocol executed in a wireless networkwhere nodes may appear and disappear at any instantof time. In [6], a novel approach to improve protocolreliability is proposed and evaluated via simulation.
A recurrent assumption made in model-based analy-sis of protocols for wireless networks is that all deviceshave the same capabilities and execute the same appli-cation. Nevertheless, thanks to the rapid advances inhardware and software design, and thanks to the grow-ing number of services provided to end-users, wirelessnetworks are starting to be populated by interconnecteddevices that reveal remarkable differences. Therefore,device heterogeneity is becoming a relevant aspect inmany application sectors, and tackling issues linked toheterogeneity is therefore increasingly crucial. Manystudies are currently on-going. For instance, the EUproject CONNECT [12] addresses the challenge ofinteroperability in heterogeneous evolving systems toassure eternal communication in networked systems.Despite this, studies that analyse the behaviour ofwireless protocols and take into account heterogeneousnode capabilities are still rather isolated [8].
In this work, we study the impact of heterogeneouscommunication and computation capabilities of nodeson aspects related to dependability [1] of a gossip-based diffusion protocol. Regarding computation het-erogeneity, we consider scenarios in which nodesrespond to the protocol with different promptnesslevels. This may happen, for instance, in the case ofhardware heterogeneity (e.g., nodes may have differentprocessing speed), software heterogeneity (e.g., nodesmay execute applications that keep their communica-tion and/or computation resources busy), and protocolheterogeneity (e.g., nodes may use adaptation layers tobe able to connect to new services). Regarding com-
munication heterogeneity, we consider scenarios wherenodes have different communication ranges. In real-world urban environments this is already a frequentsituation, since obstacles may reflect and attenuate theradio signal. Furthermore, this may happen also whennodes use power saving strategies that setup differenttransmission power depending on the depletion levelof their batteries [4].
The major contributions of this paper are: (i) thedevelopment of a modelling framework able to capturethe behaviour of diffusion protocols under differentaspects of heterogeneity, and (ii) a quantitative as-sessment of dependability and performance indicatorshelpful in guiding the setup of wireless networkspopulated by heterogeneous nodes. The rest of thepaper is structured in two main parts. The first partis dedicated to the description of diffusion protocolsand the supporting communication layers (Sections 2,3), as well as the description of the models developedfor their analysis (Section 4). The second part focuseson the evaluation of the models to derive quantitativeresults with respect to specific case studies (Section 5).Conclusions are drawn in Section 6.
2. Diffusion Protocols
Diffusion protocols are routing methods used todeliver packets from a source node to all other nodesin the network. In wireless networks, they represent akey building block for many services, such as routingtree discovery [16], clock synchronisation [19] andnetwork reprogramming [10]. In this work, we focuson a diffusion protocol based on gossip (hereafter,“gossip protocol”).
The gossip protocol for wireless networks is speci-fied as follows: whenever a node receives a packet to bedelivered to all nodes for the first time, the packet getsre-transmitted with probability ptx [9]. Despite its sim-ple specification, the gossip protocol shows complexbehaviour when executed in the network. Indeed, aninteresting aspect is what happens for different valuesof ptx. If ptx is lowered down, the utilisation of thewireless channel is reduced since the overall numberof transmissions is decreased. It has been shown thata critical value exists, such that if ptx is above thecritical value then the percentage of nodes reachedwith the protocol is barely reduced. If ptx is belowthe critical value, the protocol dies out quickly, andthe packet is delivered only to a small percentage ofnodes in the network. This phenomenon is known asphase transition. The critical value which triggers thephase transition represents the optimal configuration ofthe protocol, since it gives the best trade-off between
performance and reliability. This value is not easy toobtain, since it depends on many characteristics of thewireless network, such as its density and diameter.
3. Communication in Wireless Networks
A wireless network is a set of nodes interconnectedthrough wireless links. Differently from wired links,wireless links are not provided by physical connectionsbetween nodes, but they are defined on the basis of thephysical distance between nodes and by the character-istics of the environment in which nodes are placed.In the following, we recall the relevant aspects of thecommunication on wireless links that are included inour model of the network.
The maximum distance that allows direct communi-cation between nodes is referred to as communicationrange: a wireless link between two nodes i and j existsif j is in the communication range of i. Nodes mayhave different communication ranges, e.g., becausethey use different transmission power. Furthermore,the region delimited by the communication range isgenerally far from being regular and does not havesharp edges and binary connectivity. Indeed, wirelesslinks are characterised by different degrees of relia-bility, and real-world experimental studies [20], [22]have pointed out that three main connectivity regionscan be evidenced: a connected region, with symmetric,stable and good quality links (reliability above 85%);a transitional region, with asymmetric and intermittentlink quality; a disconnected region.
Besides the distance between nodes, the quality ofwireless links depends also on the level of activity ofneighbouring nodes. Indeed, wireless communicationis performed over a shared medium, and concurrenttransmission may cause collisions between packets.When a collision occurs, packets may get corrupteddue to mutual interference; in the best case, at mostone of the concurrent packets has a positive chance tobe correctly received. This phenomenon is known ascapture effect [22]. The probability of capture effectcan be quite high, and depends on many factors,including bitrate [13] and packet encoding [17].
In order to limit the number of collisions, nodes fol-low a protocol to access the wireless channel. Possibleapproaches are schedule-based and contention-based.In schedule-based approaches, access to the wirelesschannel is given by a schedule of pre-allocated timeslots. In contention-based approaches, on the otherhand, nodes may transmit at any time. In this work weconsider contention-based protocols, which are usuallyadopted in wireless networks due to their flexibility

Figure 1. Model of the Wireless Network.
and effective tradeoff between complexity and per-formance. In contention-based approaches, each nodeperforms a collision avoidance protocol before trans-mitting a packet [4]. The protocol can be summarisedas follows. First, the node waits an initial randombackoff interval. Second, the node checks the state ofthe wireless channel to detect if other nodes in thecommunication range are already transmitting. Thisactivity is called carrier sensing. Nodes are able tosense transmissions within a limited distance, known ascarrier sense range, by measuring the received signalstrength. Carrier sense range and transmission rangemay differ. Third, if no transmission is sensed, then thenode may start its transmission immediately; otherwisethe transmission is deferred, and a new transmissionattempt is performed after a random backoff.
4. Model of the Wireless Network
The model of the wireless network has been de-veloped with the SAN [18] formalism, and is splitinto a number of sub-models that interact throughshared variables. Each sub-model identifies a differentlogic layer of the communication stack: network layer(diffusion protocol), and the underlying MAC, Link,and Physical layers. The composition of the layersdescribes the behaviour of a single node, while thebehaviour of the entire wireless network is obtainedby replicating N times the model of a node, where Nis the number of nodes in the network. The overallmodel of the system is shown in Figure 1: sub-models are represented with labelled dark boxes, thecomposition between sub-models is obtained throughthe Join operator, and the Rep operator creates Nreplicas of the composed model. The Join and theRep operators allow interaction between sub-modelsthrough shared variables.
Sub-models were built on the basis of two keymetrics of interest for diffusion protocols: network
Figure 2. Source Logic.
Figure 3. Gossip Logic.
coverage and end-to-end delay. Network coverage isa reliability metric of the protocol that gives thepercentage of nodes reached by an injected packet.End-to-end delay is a performance metric that gives abound to the time needed to reach a certain percentageof nodes; this metric is specially relevant for real-timeapplications that require hard / soft deadlines.
Diffusion Protocol. In diffusion protocols, nodes mayact either as source nodes or relay nodes. Source nodesgenerate packets to be diffused in the network, whilerelay nodes actually apply the diffusion protocol. Here,we are interested in modelling a network where asingle piece of information is sent from a source nodeto all other nodes in the network.
Source nodes are modelled through thesource_logic layer (see Figure 2). The identifierof the modelled node is stored in node_id. Any nodecan be selected as source node; this choice is madeat init time through model parameters. Initially, onlysource nodes have a token in source_ready. Thetimed activity traffic_generator models therandom time to transmit a packet. Place send is sharedwith the underlying layers of the communication stack.A token in send represents the actual transmissionof a packet.
Relay nodes are modelled through thegossip_logic layer (see Figure 3). Initially, allplaces have zero tokens, except first_message,which contains one token, and node_id, whichstores the identifier of the modelled node. Thisconfiguration corresponds to the state of a node whichhas not yet received the packet to be diffused withthe gossip protocol. A token in receive representsthe event of successful packet reception. Whenreceive and first_message have both onetoken, response_time gets enabled: the tokens are
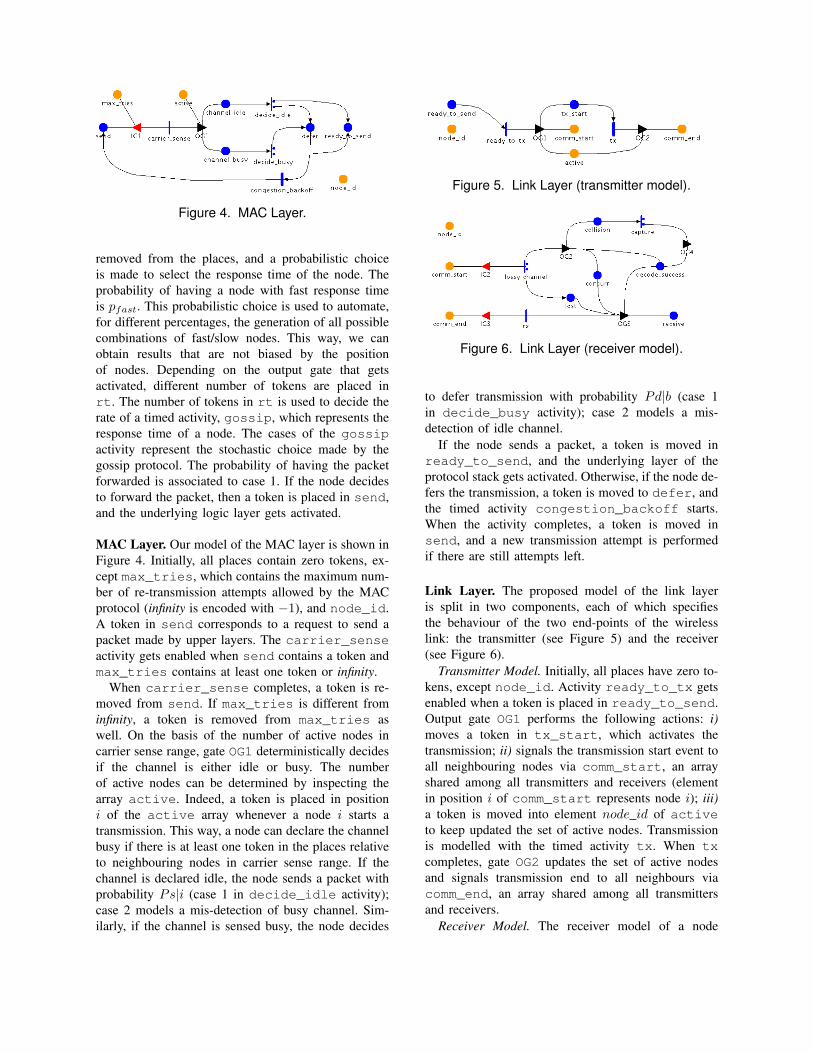
Figure 4. MAC Layer.
removed from the places, and a probabilistic choiceis made to select the response time of the node. Theprobability of having a node with fast response timeis pfast. This probabilistic choice is used to automate,for different percentages, the generation of all possiblecombinations of fast/slow nodes. This way, we canobtain results that are not biased by the positionof nodes. Depending on the output gate that getsactivated, different number of tokens are placed inrt. The number of tokens in rt is used to decide therate of a timed activity, gossip, which represents theresponse time of a node. The cases of the gossipactivity represent the stochastic choice made by thegossip protocol. The probability of having the packetforwarded is associated to case 1. If the node decidesto forward the packet, then a token is placed in send,and the underlying logic layer gets activated.
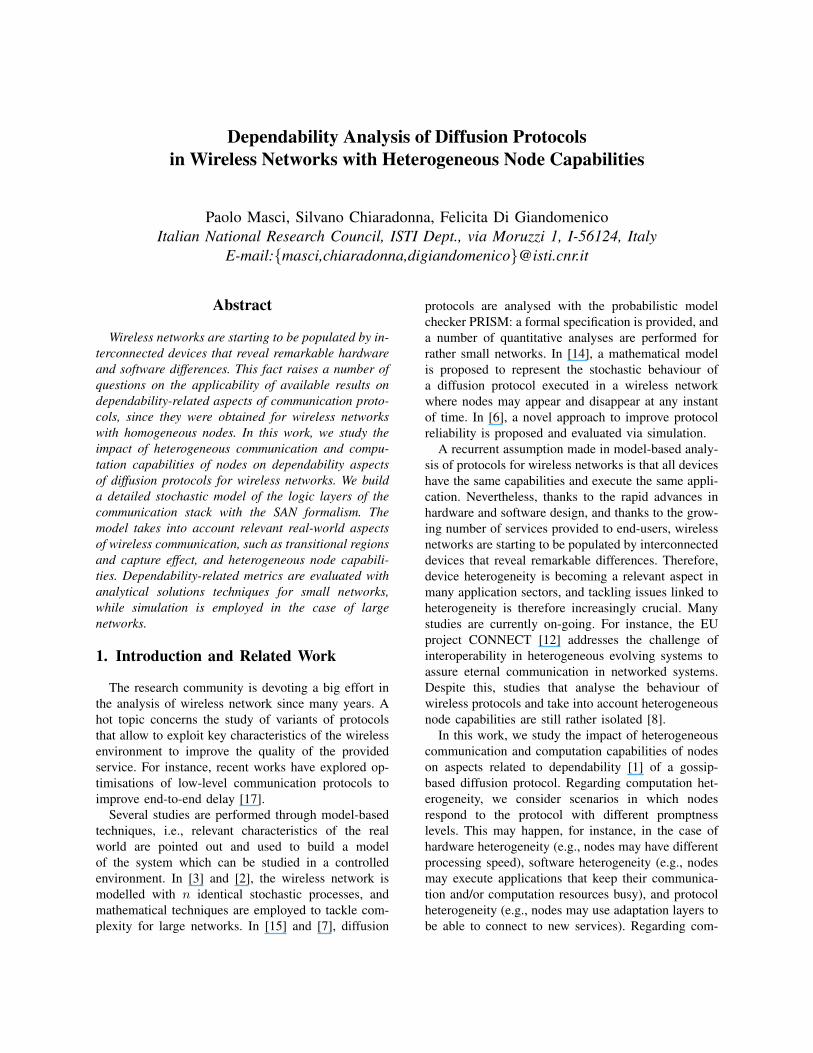
MAC Layer. Our model of the MAC layer is shown inFigure 4. Initially, all places contain zero tokens, ex-cept max_tries, which contains the maximum num-ber of re-transmission attempts allowed by the MACprotocol (infinity is encoded with −1), and node_id.A token in send corresponds to a request to send apacket made by upper layers. The carrier_senseactivity gets enabled when send contains a token andmax_tries contains at least one token or infinity.
When carrier_sense completes, a token is re-moved from send. If max_tries is different frominfinity, a token is removed from max_tries aswell. On the basis of the number of active nodes incarrier sense range, gate OG1 deterministically decidesif the channel is either idle or busy. The numberof active nodes can be determined by inspecting thearray active. Indeed, a token is placed in positioni of the active array whenever a node i starts atransmission. This way, a node can declare the channelbusy if there is at least one token in the places relativeto neighbouring nodes in carrier sense range. If thechannel is declared idle, the node sends a packet withprobability Ps|i (case 1 in decide_idle activity);case 2 models a mis-detection of busy channel. Sim-ilarly, if the channel is sensed busy, the node decides
Figure 5. Link Layer (transmitter model).
Figure 6. Link Layer (receiver model).
to defer transmission with probability Pd|b (case 1in decide_busy activity); case 2 models a mis-detection of idle channel.
If the node sends a packet, a token is moved inready_to_send, and the underlying layer of theprotocol stack gets activated. Otherwise, if the node de-fers the transmission, a token is moved to defer, andthe timed activity congestion_backoff starts.When the activity completes, a token is moved insend, and a new transmission attempt is performedif there are still attempts left.
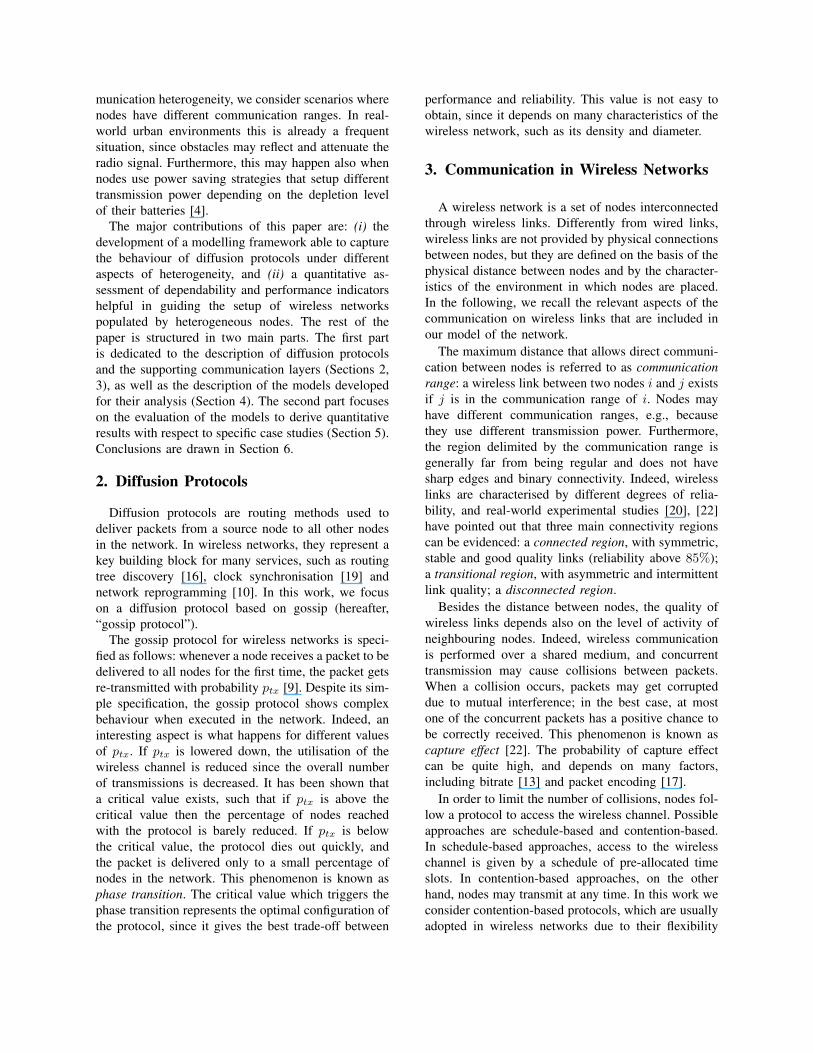
Link Layer. The proposed model of the link layeris split in two components, each of which specifiesthe behaviour of the two end-points of the wirelesslink: the transmitter (see Figure 5) and the receiver(see Figure 6).
Transmitter Model. Initially, all places have zero to-kens, except node_id. Activity ready_to_tx getsenabled when a token is placed in ready_to_send.Output gate OG1 performs the following actions: i)moves a token in tx_start, which activates thetransmission; ii) signals the transmission start event toall neighbouring nodes via comm_start, an arrayshared among all transmitters and receivers (elementin position i of comm_start represents node i); iii)a token is moved into element node id of activeto keep updated the set of active nodes. Transmissionis modelled with the timed activity tx. When txcompletes, gate OG2 updates the set of active nodesand signals transmission end to all neighbours viacomm_end, an array shared among all transmittersand receivers.
Receiver Model. The receiver model of a node
has two main branches. One branch is activated byneighbouring transmitters when a transmission starts,the other when a transmission ends. Initially, all placescontain zero tokens, except node_id. On transmis-sion start, a token is placed in position node_idof array comm_start, and, as a consequence, theinstantaneous activity lossy_channel gets enabledfor node node_id. The activity decides with a cer-tain probability if the signal strength of the transmit-ted packet is above the noise threshold (case 1 inlossy_channel). In this case, the packet actuallyarrives at the node and gate OG2 is activated toperform a decode attempt. In the other case, the packetgets lost and a token is placed in lost. Gate OG2deterministically decides if there is a collision betweenpackets on the basis of the number of concurrenttransmissions. Such number is derived by the numberof tokens in concurr. If concurr contains zerotokens, packet decoding proceeds without errors: atoken is moved in decode_success, and a tokenis added to concurr. Otherwise, a collision occurs:a token is moved in collision, and a token isadded to concurr. A token in collision enablesan instantaneous activity, capture, that models thecapture effect. The capture activity decides withprobability pcapture that packet decoding can continuewithout errors. In this case, a token is placed indecode_success. On transmission end, a token isplaced in position node_id of array comm_end, andthe instantaneous activity rx gets enabled for nodenode_id. Output gate OG3 decides that a packet hasbeen correctly decoded if lost contains zero tokensand decode_success contains a token. In suchcase, OG3 moves a token in receive to signal asuccessful reception to gossip_logic.
Physical Layer. The wireless network topology isrepresented with a connected matrix, which speci-fies stable links, and with a transitional matrix,which specifies intermittent links. For each matrix, rownumber i is associated with node i, and elements inrow i represent the set of neighbours of i. The matrixis stored in a shared variable which can be accessed bythe different layers of the communication stack. Thisway, network topology is not hard-wired in the SANmodel and the topology can be generated either withexternal software tools or based on data gathered fromreal-world deployments.
5. Analysis
This section presents the results obtained throughthe solution of the proposed SAN models using the
tool Mobius [5]. The goal of the analysis is many-fold:(i) to validate the developed model for the diffusionprotocol by performing the analysis in the same con-ditions as in other studies and comparing the obtainedresults; (ii) to explore the impact of newly includedheterogeneous aspects on the selected dependabilityand performance indicators; (iii) to assess the precisionof the results obtained via simulations with respect toanalytical solutions; (iv) to explore the scalability ofthe proposed model by analysing larger networks.
5.1. Validation of the Model
To validate our model, we considered a recentrelated work presented in [7], which performs theanalysis of the gossip protocol, and checked that ourmodel is capable of reproducing the same results.In [7], the analysis of the gossip protocol is performedwith the probabilistic model-checker PRISM [11]. Ourchoice was guided by the fact that the available specifi-cation allows us to derive all assumptions introduced inthe model of the wireless environment, e.g., collisionmodel and link quality. This is important to ensurethat the two analyses are made under similar enoughconditions to be comparable. Of course, there aredifferences between the two models, but we managedto make them not relevant for the sake of the compar-ison. Furthermore, the results shown in [7] representexact solutions of the model, hence we have a precisereference point.
The PRISM model developed in [7] does not con-sider some real-world aspects, such as delays intro-duced by the layers of the protocol stack. This is dueto the fact that, in [7], the authors are only interestedin assessing network coverage and, hence, they donot need to accurately model such details. Results fornetwork coverage are shown in the case of synchronousnodes, i.e., under the assumption that nodes are ableto react exactly at the same time when they receivea packet from a common neighbour. Results for theasynchronous case report upper and lower boundsof possible results. The analysis is performed withPRISM on a regular grid network with 9 nodes.
Our model includes several details of the underlyinglayers of the communication stack, since we intend toanalyse both coverage and end-to-end delay. Moreover,our model is inherently asynchronous, since nodesreact after a stochastic time. Nevertheless, by properlysetting model parameters, we were able to derive amodel of the network which is almost equivalent tothe PRISM model for the coverage metric of interest.For instance, to mimic a synchronous behaviour ofthe network, we used deterministic times for timed

0 0.1 0.2 0.3 0.4 0.5 0.6 0.7 0.8 0.9
1
1 2 3 4 5 6 7 8Pro
babi
lity
of r
ecei
ving
a p
acke
t
node ID
Figure 7. Cross-validation of results (N = 9).
activities, and to disable the MAC layer we simplyunplugged the relative sub-model from the model of anode.
Some results are shown in Figure 7. The figureshows the percentage of received packets for eachgossiping node multiplied by the value of ptx adoptedby nodes. Although different formalisms are used anddifferent solution techniques are adopted (simulationin our case, model checking in [7]), we found thatour results are almost coincident with those shownin [7]. This cross-validation exercise reinforced ourconfidence on the correct definition of the model.
5.2. Impact of Node Heterogeneity
We evaluate separately the impact of communica-tion and computation heterogeneity on the metrics ofinterest. Regarding communication heterogeneity, wesetup a study where nodes in the network have differentre-broadcast probabilities ptx, each of which dependson the number of neighbours. Regarding computationheterogeneity, we setup a study where nodes havedifferent response time that depends on the speed ofthe node. The results shown in this section are obtainedvia simulation.
Network Setup. In order to consider a realistic sce-nario, we derived the wireless network topology fromavailable information on real-world deployments ofwireless nodes. Specifically, we consider a testbeddeployed at the UVA Computer Science Departmentof the University of Virginia. The network, composedof 48 wireless sensor nodes, has been recently usedby other research groups to study optimisations ofMAC protocols to improve the time needed to spreada message in the network [17].
Table 1 reports the main parameters considered inthe model and their values for the different studies.
102030405060708090
100
0.1 0.2 0.3 0.4 0.5 0.6 0.7 0.8 0.9 1.0
% C
over
ed N
odes
(M
ean)
ptx
k=2k=1k=0
k=-1k=-2
Figure 8. Covered nodes for different ptx (N = 48).
Some parameters are made varying in a range of valuesduring our studies, since we are interested in assessingthe sensitivity of the measure of interest with respect tosuch parameters. Regarding wireless connectivity, forstable links we selected a probability prxS = 0.92 ofreceiving a packet when the channel is idle, while forintermittent links we chose prxI = 0.5. In the case ofconcurrent transmissions, the probability of receivinga packet in the face of a collision is pcapture = 0.1.These are reasonable values for low power wirelessdevices [21], [13], [4], [20].
Analysis of Communication Heterogeneity. The ob-jective of this study is to understand if network cov-erage can be improved by exploiting communicationheterogeneity. Specifically, we intend to assess theimpact of different communication ranges by setting-up different probabilities ptx for each node accordingto the number of neighbours of the node. Let nsi bethe number of neighbours of i with stable links, andptxi
be the re-broadcast probability of i. We consideredboth direct and inverse relations between ptxi
and nsi.Basically, in direct relations, we assign high ptxi
tonodes that have large nsi. In order to compare resultsfor different relations, we enforce that the differentconfigurations have the same average probability toforward the packet (Σptxi
N = ptx, where N is thenumber of nodes in the network).
Figure 8 shows the results of coverage (in percent-age) when nodes have different ptx. In the figure, thecurve for k = 0 corresponds to the coverage obtainedwhen all nodes have the same ptx, while curves forpositive k correspond to the coverage in case of adirect proportionality (k = 1), either linear or quadraticrelation (k = 2), between ptxi
and ni. Similarly, anegative k corresponds to an inverse proportionality,either linear or quadratic, between ptxi
and ni. We

Table 1: Network Setup
Parameter Value Description
N 12, 48, 200, 500 Network sizeptx from 0.1 to 1.0 Re-broadcast probability of gossipprxS 0.92 Probability of receiving a packet on stable linksprxI 0.5 Probability of receiving a packet on intermittent linkspcapture 0.1 Probability of receiving a packet in the case of collisionpfast* from 0.1 to 1 Probability of having a fast node in the networktxrate 1 Transmission ratestdrate 1 Processing speed of a standard nodefastrate 1000 Processing speed of a fast noderetry limit 5 Maximum number of re-transmissions performed by the MAC layer*this parameter is set to 0 when not relevant in the study.
0 5
1015202530354045
0.1 0.2 0.3 0.4 0.5 0.6 0.7 0.8 0.9 1.0
traf
fic (
Mea
n)
ptx
k=2k=1k=0
k=-1k=-2
Figure 9. Overall traffic generated in the networkfor different values of ptx (N = 48).
can appreciate the impact of heterogeneous ptx oncoverage, and we can notice that there is an improve-ment in coverage for direct relations. Intuitively, this isjustified by the fact that nodes with many neighboursbasically act as hubs in the network, and hence thereis a higher probability of reaching more nodes if theyforward the packet. Of course, a same coverage valuecan be obtained through more that one distributionfor ptx (e.g., 60% coverage can be obtained withptx = 0.45 for k = 2, and with ptx = 0.7 fork = 0). Nevertheless, different levels of traffic aregenerated in the wireless channel for the two cases.Figure 9 shows the mean of the traffic generated(in number of packets) by nodes over the wirelesschannel for the different configurations. In wirelessnetworks nodes are usually battery operated, hence theresults obtained for coverage and traffic should be readtogether. By understanding the reciprocal effects of ptx
on coverage and channel traffic, appropriate assign-
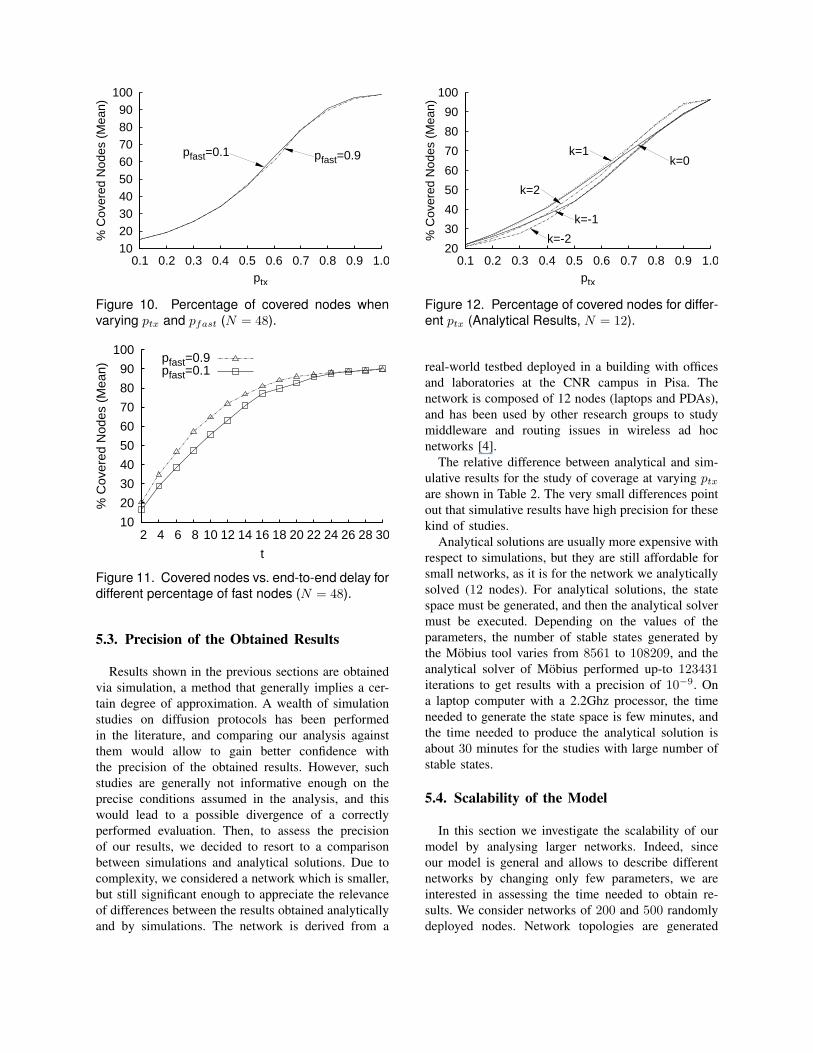
ment of ptx distributions can be devised to optimisethe efficiency of the gossip protocol. However, otherfactors may influence coverage, such as the numberof nodes and the quality of links between nodes. Forexample, for the topology considered in Section 5.3,the highest value of k does not correspond to the bestcoverage for all ptx (see in Figure 12). Therefore, thespecific settings of the system under analysis need tobe considered.
Analysis of Computation Heterogeneity. The impactof different computation speeds is assessed by setting-up the promptness of nodes in taking a decision ongossiping. We consider two possible speeds: fast andstandard. In our setup, fast nodes are three orders ofmagnitude faster than standard nodes. The percentageof fast nodes that populate the network is pfast. Inorder to have a fair comparison between results fordifferent configurations, we enforce that the averagenetwork coverage is the same when the protocol ends(see Figure 10).
Figure 11 shows the coverage for different time stepst (the actual value of t can be expressed in secondsonce bitrate and packet size are given). In the figure, wereport the percentage of covered nodes for two cases:10% of fast nodes (pfast = 0.1) and 90% of fast nodes(pfast = 0.9). The value on the x axis represents theend-to-end delay to reach a corresponding percentageof coverage (on the y axis). Not surprisingly, theconfiguration with a higher percentage of fast nodesperforms better that the other until a certain value oft, after which the curves overlap. This kind of analysisis useful to give a quantitative assessment of differentnetwork configurations, and is specifically useful toproperly setup the network in presence of deadlinesimposed by real-time applications.
102030405060708090
100
0.1 0.2 0.3 0.4 0.5 0.6 0.7 0.8 0.9 1.0
% C
over
ed N
odes
(M
ean)
ptx
pfast=0.1 pfast=0.9
Figure 10. Percentage of covered nodes whenvarying ptx and pfast (N = 48).
10
20
30
40
50
60
70
80
90
100
2 4 6 8 10 12 14 16 18 20 22 24 26 28 30
% C
over
ed N
odes
(M
ean)
t
pfast=0.9pfast=0.1
Figure 11. Covered nodes vs. end-to-end delay fordifferent percentage of fast nodes (N = 48).
5.3. Precision of the Obtained Results
Results shown in the previous sections are obtainedvia simulation, a method that generally implies a cer-tain degree of approximation. A wealth of simulationstudies on diffusion protocols has been performedin the literature, and comparing our analysis againstthem would allow to gain better confidence withthe precision of the obtained results. However, suchstudies are generally not informative enough on theprecise conditions assumed in the analysis, and thiswould lead to a possible divergence of a correctlyperformed evaluation. Then, to assess the precisionof our results, we decided to resort to a comparisonbetween simulations and analytical solutions. Due tocomplexity, we considered a network which is smaller,but still significant enough to appreciate the relevanceof differences between the results obtained analyticallyand by simulations. The network is derived from a
20
30
40
50
60
70
80
90
100
0.1 0.2 0.3 0.4 0.5 0.6 0.7 0.8 0.9 1.0
% C
over
ed N
odes
(M
ean)
ptx
k=-2
k=-1
k=0k=1
k=2
Figure 12. Percentage of covered nodes for differ-ent ptx (Analytical Results, N = 12).
real-world testbed deployed in a building with officesand laboratories at the CNR campus in Pisa. Thenetwork is composed of 12 nodes (laptops and PDAs),and has been used by other research groups to studymiddleware and routing issues in wireless ad hocnetworks [4].
The relative difference between analytical and sim-ulative results for the study of coverage at varying ptx
are shown in Table 2. The very small differences pointout that simulative results have high precision for thesekind of studies.
Analytical solutions are usually more expensive withrespect to simulations, but they are still affordable forsmall networks, as it is for the network we analyticallysolved (12 nodes). For analytical solutions, the statespace must be generated, and then the analytical solvermust be executed. Depending on the values of theparameters, the number of stable states generated bythe Mobius tool varies from 8561 to 108209, and theanalytical solver of Mobius performed up-to 123431iterations to get results with a precision of 10−9. Ona laptop computer with a 2.2Ghz processor, the timeneeded to generate the state space is few minutes, andthe time needed to produce the analytical solution isabout 30 minutes for the studies with large number ofstable states.
5.4. Scalability of the Model
In this section we investigate the scalability of ourmodel by analysing larger networks. Indeed, sinceour model is general and allows to describe differentnetworks by changing only few parameters, we areinterested in assessing the time needed to obtain re-sults. We consider networks of 200 and 500 randomlydeployed nodes. Network topologies are generated
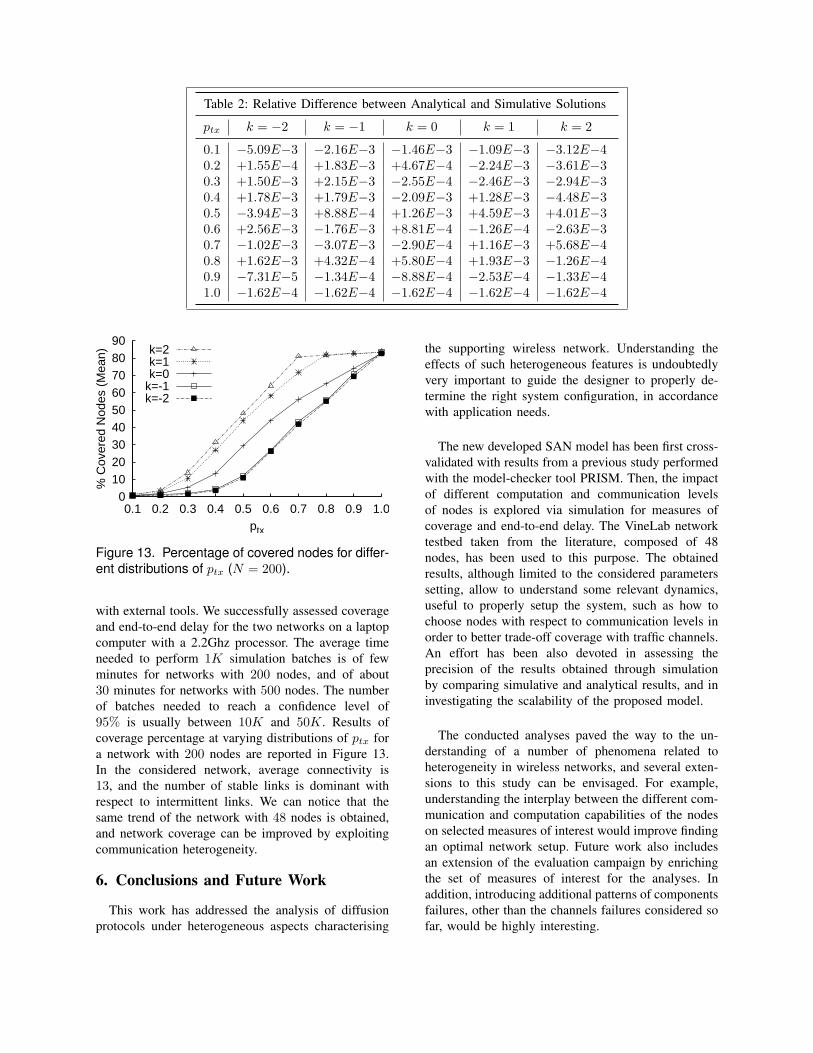
Table 2: Relative Difference between Analytical and Simulative Solutions
ptx k = −2 k = −1 k = 0 k = 1 k = 2
0.1 −5.09E−3 −2.16E−3 −1.46E−3 −1.09E−3 −3.12E−40.2 +1.55E−4 +1.83E−3 +4.67E−4 −2.24E−3 −3.61E−30.3 +1.50E−3 +2.15E−3 −2.55E−4 −2.46E−3 −2.94E−30.4 +1.78E−3 +1.79E−3 −2.09E−3 +1.28E−3 −4.48E−30.5 −3.94E−3 +8.88E−4 +1.26E−3 +4.59E−3 +4.01E−30.6 +2.56E−3 −1.76E−3 +8.81E−4 −1.26E−4 −2.63E−30.7 −1.02E−3 −3.07E−3 −2.90E−4 +1.16E−3 +5.68E−40.8 +1.62E−3 +4.32E−4 +5.80E−4 +1.93E−3 −1.26E−40.9 −7.31E−5 −1.34E−4 −8.88E−4 −2.53E−4 −1.33E−41.0 −1.62E−4 −1.62E−4 −1.62E−4 −1.62E−4 −1.62E−4
0102030405060708090
0.1 0.2 0.3 0.4 0.5 0.6 0.7 0.8 0.9 1.0
% C
over
ed N
odes
(M
ean)
ptx
k=2k=1k=0
k=-1k=-2
Figure 13. Percentage of covered nodes for differ-ent distributions of ptx (N = 200).
with external tools. We successfully assessed coverageand end-to-end delay for the two networks on a laptopcomputer with a 2.2Ghz processor. The average timeneeded to perform 1K simulation batches is of fewminutes for networks with 200 nodes, and of about30 minutes for networks with 500 nodes. The numberof batches needed to reach a confidence level of95% is usually between 10K and 50K. Results ofcoverage percentage at varying distributions of ptx fora network with 200 nodes are reported in Figure 13.In the considered network, average connectivity is13, and the number of stable links is dominant withrespect to intermittent links. We can notice that thesame trend of the network with 48 nodes is obtained,and network coverage can be improved by exploitingcommunication heterogeneity.
6. Conclusions and Future Work
This work has addressed the analysis of diffusionprotocols under heterogeneous aspects characterising
the supporting wireless network. Understanding theeffects of such heterogeneous features is undoubtedlyvery important to guide the designer to properly de-termine the right system configuration, in accordancewith application needs.
The new developed SAN model has been first cross-validated with results from a previous study performedwith the model-checker tool PRISM. Then, the impactof different computation and communication levelsof nodes is explored via simulation for measures ofcoverage and end-to-end delay. The VineLab networktestbed taken from the literature, composed of 48nodes, has been used to this purpose. The obtainedresults, although limited to the considered parameterssetting, allow to understand some relevant dynamics,useful to properly setup the system, such as how tochoose nodes with respect to communication levels inorder to better trade-off coverage with traffic channels.An effort has been also devoted in assessing theprecision of the results obtained through simulationby comparing simulative and analytical results, and ininvestigating the scalability of the proposed model.
The conducted analyses paved the way to the un-derstanding of a number of phenomena related toheterogeneity in wireless networks, and several exten-sions to this study can be envisaged. For example,understanding the interplay between the different com-munication and computation capabilities of the nodeson selected measures of interest would improve findingan optimal network setup. Future work also includesan extension of the evaluation campaign by enrichingthe set of measures of interest for the analyses. Inaddition, introducing additional patterns of componentsfailures, other than the channels failures considered sofar, would be highly interesting.
Acknowledgement
This work is partially supported by the EuropeanCommission Framework Program 7 project CON-NECT (FP7–231167).
References
[1] A. Avizienis, J.-C. Laprie, B. Randell, andC. Landwehr. Basic concepts and taxonomy ofdependable and secure computing. IEEE Transactionson Dependable and Secure Computing, 1(1):11–33,2004.
[2] Rena Bakhshi, Lucia Cloth, Wan Fokkink, andBoudewijn R. Haverkort. Meanfield analysis for theevaluation of gossip protocols. SIGMETRICS Perform.Eval. Rev., 36(3):31–39, 2008.
[3] Rena Bakhshi, Daniela Gavidia, Wan Fokkink, andMaarten van Steen. An analytical model of informationdissemination for a gossip-based protocol. ComputerNetworks, 53(13):2288–2303, 2009.
[4] Eleonora Borgia, Marco Conti, Franca Delmastro, andLuciana Pelusi. Lessons from an ad hoc network test-bed: Middleware and routing issues. Ad Hoc & SensorWireless Networks, 1(1-2), 2005.
[5] David Daly, Daniel D. Deavours, Jay M. Doyle,Patrick G. Webster, and William H. Sanders. Mobius:An extensible tool for performance and dependabilitymodeling. In TOOLS ’00: Proceedings of the 11thInternational Conference on Computer PerformanceEvaluation: Modelling Techniques and Tools, pages332–336, London, UK, 2000. Springer-Verlag.
[6] Vadim Drabkin, Roy Friedman, Gabriel Kliot, and MarcSegal. RAPID: Reliable probabilistic disseminationin wireless ad-hoc networks. In Reliable DistributedSystems, 2007. SRDS 2007. 26th IEEE InternationalSymposium on, pages 13–22, 2007.
[7] A. Fehnker and P. Gao. Formal verification andsimulation for performance analysis for probabilisticbroadcast protocols. In Proc. 5th International Con-ference on Ad-Hoc, Mobile, and Wireless Networks(ADHOC-NOW’06), volume 4104 of LNCS, pages 128–141. Springer, 2006.
[8] Roy Friedman, Daniela Gavidia, Luis Rodrigues,Aline Carneiro Viana, and Spyros Voulgaris. Gossipingon manets: the beauty and the beast. SIGOPS Oper.Syst. Rev., 41(5):67–74, 2007.
[9] Zygmunt J. Haas, Joseph Y. Halpern, and Li Li.Gossip-based ad hoc routing. IEEE/ACM Trans. Netw.,14(3):479–491, 2006.
[10] C. Han, R. Kumar, R. Shea, and M. B. Srivastava.Sensor network software update management: a sur-vey. International Journal of Network Management,15(1099-1190):283–294, 2005.
[11] A. Hinton, M. Kwiatkowska, G. Norman, andD. Parker. PRISM: A tool for automatic verification ofprobabilistic systems. In H. Hermanns and J. Palsberg,editors, Proc. 12th International Conference on Toolsand Algorithms for the Construction and Analysis ofSystems (TACAS’06), volume 3920 of LNCS, pages441–444. Springer, 2006.
[12] V. Issarny, B. Steffen, B. Jonsson, G. Blair, P. Grace,M. Kwiatkowska, R. Calinescu, P. Inverardi, M. Tivoli,A. Bertolino, and A. Sabetta. Connect challenges:Towards emergent connectors for eternal networkedsystems. Engineering of Complex Computer Systems,IEEE International Conference on, 0:154–161, 2009.
[13] Kyle Jamieson, Bret Hull, Allen K. Miu, and Hari Bal-akrishnan. Understanding the Real-World Performanceof Carrier Sense. In ACM SIGCOMM Workshop on Ex-perimental Approaches to Wireless Network Design andAnalysis (E-WIND), Philadelphia, PA, August 2005.
[14] Thomas Krieger, Martin Riedl, Johann Schuster, andMarkus Siegle. A view-probability-matrix approach tothe modelling of gossiping protocols. SIGMETRICSPerform. Eval. Rev., 36(3):23–30, 2008.
[15] Marta Kwiatkowska, Gethin Norman, and DavidParker. Analysis of a gossip protocol in PRISM.SIGMETRICS Perform. Eval. Rev., 36(3):17–22, 2008.
[16] P. Levis, N. Lee, M. Welsh, and D. Culler. TOSSim:accurate and scalable simulation of entire TinyOS ap-plications. In Proc. Intl. Conf. on Embedded NetworkedSensor Systems, pages 126–137. ACM Press, 2003.
[17] Jiakang Lu and Kamin Whitehouse. Exploiting the cap-ture effect for low-latency flooding in wireless sensornetworks. In SenSys ’08: Proceedings of the 6th ACMconference on Embedded network sensor systems, pages409–410, New York, NY, USA, 2008. ACM.
[18] W. H. Sanders and J. F. Meyer. Stochastic activitynetworks: Formal definitions and concepts. In Lectureson Formal Methods and Performance Analysis, volume2090 of LNCS, pages 315–343. Springer Verlag, 2001.
[19] Weilian Su and Ian F. Akyildiz. Time-diffusion syn-chronization protocol for wireless sensor networks.IEEE/ACM Trans. Netw., 13(2):384–397, 2005.
[20] Alec Woo, Terence Tong, and David Culler. Tamingthe underlying challenges of reliable multihop routingin sensor networks. In SenSys03, pages 14–27, NewYork, NY, USA, 2003. ACM Press.
[21] J. Zhao and R. Govindan. Understanding packet de-livery performance in dense wireless sensor networks.In Proc. Intl. Conf. on Embedded Networked SensorSystems, pages 1–13, New York, USA, 2003. ACM.
[22] Jerry Zhao and Ramesh Govindan. Understandingpacket delivery performance in dense wireless sensornetworks. In SenSys ’03: Proceedings of the 1st in-ternational conference on Embedded networked sensorsystems, pages 1–13, New York, NY, USA, 2003. ACM.