Department of Public Works – Vote 5 – Annual Report 2008/09
173
Department of Public Works – Vote 5 – Annual Report 2008/09 - 1 - EASTERN CAPE DEPARTMENT OF PUBLIC WORKS VOTE 5 ANNUAL REPORT 2008/09
-
Upload
khangminh22 -
Category
Documents
-
view
0 -
download
0
Transcript of Department of Public Works – Vote 5 – Annual Report 2008/09

Department of Public Works – Vote 5 – Annual Report 2008/09
- 1 -
EASTERN CAPE
DEPARTMENT OF PUBLIC WORKS
VOTE 5
ANNUAL REPORT 2008/09

Department of Public Works – Vote 5 – Annual Report 2008/09
- 2 -
TABLE OF CONTENTS
SUBMISSION OF THE ANNUAL REPORT TO THE EXECUTIVE AUTHORITY ........... 4
PART 1: GENERAL INFORMATION .............................................................................. 5
Introduction by the Head of Department ..................................................................... 5
Information on the Ministry .......................................................................................... 8
Vision and Mission ...................................................................................................... 11
Legislative and Other Mandates ................................................................................. 11
PART 2: PROGRAMME PERFORMANCE ................................................................... 13
Voted Funds ................................................................................................................ 13
Aim of the Vote ............................................................................................................ 13
Key Measurable objectives ......................................................................................... 13
Programmes ................................................................................................................ 13
Achievements .............................................................................................................. 14
Programme 1: Administration – Sub-Programme: Office of the MEC .................... 14
Programme 1: Administration – Sub-Programme: Management ............................ 15
Programme 1: Administration – Sub-Programme: Corporate Service ................... 19
Programme 2: Public Works – Other Infrastructure ................................................ 26
Programme 2: Public Works – Programme Office Support ..................................... 27
Programme 2: Public Works – Property Management ............................................. 31
Programme 3: Expanded Pubic Works Programme – Sub-Programme:
Programme Office Support ......................................................................................... 36
Service Delivery Environment and Challenges ......................................................... 39
Overview of the organisational environment for 2008/09 ......................................... 43
Policy development and legislative changes ............................................................ 44
Collection of departmental revenue ........................................................................... 44
Departmental expenditure .......................................................................................... 44
Capital investment & maintenance ............................................................................ 45
Asset Management ...................................................................................................... 45
PART 3: REPORT OF THE AUDIT COMMITTEE ........................................................ 49

Department of Public Works – Vote 5 – Annual Report 2008/09
- 3 -
PART 4: ANNUAL FINANCIAL STATEMENTS .......................................................... 52
Report by the Accounting Officer to the Executive Authority and Provincial
Legislature of the Eastern Cape Province ................................................................. 53
Report of the Auditor-General .................................................................................... 67
Appropriation Statement ............................................................................................ 68
Notes to the Appropriation Statement ....................................................................... 76
Statement of Financial Performance .......................................................................... 78
Statement of Financial Position ................................................................................. 79
Cash Flow Statement .................................................................................................. 80
Accounting Policies .................................................................................................... 81
Notes to the Annual Financial Statements ................................................................ 89
Disclosure notes to the Annual Financial Statements............................................ 100
ANNEXURES .............................................................................................................. 110
PART 5: HUMAN RESOURCE MANAGEMENT ........................................................ 119
Introduction ............................................................................................................... 119
Expenditure ............................................................................................................... 119
Employment and vacancies ..................................................................................... 123
Job evaluation ........................................................................................................... 126
Employment changes ............................................................................................... 128
Employment equity ................................................................................................... 135
Signing of Performance Agreements by SMS Members ........................................ 141
Performance rewards ................................................................................................ 143
Foreign workers ........................................................................................................ 148
Leave utilisation for the period 1 April 2008 to 31 March 2009 .............................. 149
HIV/AIDS & Health promotion programmes ............................................................ 152
Labour relations ........................................................................................................ 154
Utilisation of consultants .......................................................................................... 158

Department of Public Works – Vote 5 – Annual Report 2008/09
- 4 -
SUBMISSION OF THE ANNUAL REPORT TO THE EXECUTIVE AUTHORITY
It is with great pleasure that I present this Annual Report of the Department of Public Works for
the year ended 31 March 2009.
Mr B Gxilishe
Acting Head of Department
Date:

Department of Public Works – Vote 5 – Annual Report 2008/09
- 5 -
PART 1: GENERAL INFORMATION
Introduction by the Head of Department
The financial year under review posed real challenges whilst it also presented us with exhilarating
opportunities that tested our mettle and steadfastness to discharge our mandate of serving our
clients and thus deliver services to the best of our abilities. The huge infrastructure investment by
government, which was boosted by the 2010 soccer World Cup, has stimulated both the private
and the public sectors to even greater heights, in their endeavour to surmount any debilitating
challenges to thwart their efforts of delivering services to the destitute masses of our country. The
Department of Public Works has not been left behind in all this enthralling excitement; it has been
in the forefront in the struggle to defeat the twin scourges of unemployment and poverty in the
Province.
As a Department, we thrive on challenges and we always relish opportunities to overwhelm any
stumbling blocks that seek to prevent us from attaining our predetermined objectives. We have
thus faced these challenges head on by initiating novel processes and procedures, ventured into
unchartered terrains and adopted innovative ways to mitigate these challenges in our quest to
render services equitably, effectively and efficiently. We also understand that in order for us to
succeed in all our efforts we need to strive to work collectively, to perceive the organisation as a
holistic system, constituted by invaluable individual members that contribute to the whole. This is
the essence of the learning organisation that we are striving to become.
At this stage let us provide a synoptic view of a few noteworthy achievements and challenges
emanating from the financial year under review:
With regards to job creation, through the Expanded Public Works Programme, the
Department managed to increase the number of jobs created from the target figure of 40
000 to 52 000, and training targets surged from 35 650 to 39 000, which is a huge
increase by any given standards. In addition to that we also managed to create 53 500
job opportunities, targeting the youth, women and 422 for people with disabilities. In total
28 203 of person days training were held in the Province. We are the second best
achievers in the entire country with regards to these targets. The Department is also
charged with the responsibility of coordinating EPWP projects in all spheres of
government, in addition to its contribution to the job creation utilising its own resources.
As far as the flagship project of the Department is concerned, namely the Accelerated
Professional and Trade Competencies Development Programme (APTCoD), we are
vigorously implementing our objectives of empowering our people to enable them to
acquire skills that would make them compete equitably in the job market. Consequently,

Department of Public Works – Vote 5 – Annual Report 2008/09
- 6 -
in the year under consideration 34 trainee artisans passed trade test. This is a sterling
achievement if one takes cognisance of the stringency associated with passing trade
tests, which has resulted in very few people realising this dream in the past.
Another high point of the last financial year pertains to the Construction Incubator
Programme. We are ecstatic to pronounce that we have made tremendous strides in this
venture. The fact that the Department managed to recruit 162 companies into this
programme bears testimony to this assertion. Additionally, to further stimulate their
growth trajectory the Department awarded 84 contracts to these companies which, in
monetary terms, amounts to R 103 755 096 cash injection.
The Department has embarked on an earnest drive to ensure that the prescripts of the
Government Immovable Asset Management Act (GIAMA) become a cornerstone upon
which all property related decisions that seek to provide support to our client
Departments underscore this Act. In this regard, the support provided by the Department
in the development of their User Asset Management Plans (U-AMPS) so as to enable us
to complete the Custodian Asset Management Plan (C-AMP) is ample evidence that no
efforts would be spared to ensure that GIAMA becomes a reality. This endeavour would
certainly assist us in developing our Infrastructure Maintenance Strategy.
The issue of the credible Immovable Asset Register, which has long been perceived as
our Achilles‟ heel has progressed dramatically over the period under review. The
Department can now pride itself with an Asset Register that is readily available and has
been boosted by capturing 5737 more properties during the year under review.
Regarding the Rates and Taxes, which was a mandate that was devolved to our
Department we have managed to pay all invoices that were submitted to us by the
various municipalities. We are not only focusing on just paying them what is due to them,
we are also in the process of devising mechanisms of providing technical assistance to
the ailing municipalities that require urgent intervention in their billing systems.
We have also managed to complete huge projects that would have profound spin-offs for
the province and the people who would be served by these projects. The conversion of
the old Pick „n Pay Building into government offices in Bhisho, the house of Traditional
Leaders, which has just been completed. The Eastern Cape Legislature Chambers, to
name a few are just a sample of infrastructure projects we undertook to do and we
ultimately managed to complete.
As our contribution to the national crisis of energy shortages we also took energy saving
initiatives, in partnership with ESKOM we have rolled out these initiatives in all the
government buildings, starting with Qhasana, Dukumbana, Tyamzashe, and the
Legislature. To add impetus to that initiative, we also signed a Memorandum of
Understanding with a private enterprise, Eveready South Africa, to procure energy

Department of Public Works – Vote 5 – Annual Report 2008/09
- 7 -
saving lamps and turbines from them, whilst they undertook to sell to sub-contractors at
reduced prices to ensure that they are sustainable.
Last but not least, in the financial year under review the Department went out of its way
to ensure that corporate governance is enhanced. One of the mechanisms designed to
address this issue relates to the appointment of Senior Managers, in general, but Top
Management, in particular. In order to fully grapple with this issue the Department had to
first acquire the services of a Chief Financial Officer (CFO) to ensure that the
organisation is on a sound footing with regards to discharging its fiscal responsibilities.
Subsequently, other key positions like the Senior Manager for Internal Audit, the post of
Regional Director for the Ukhahlamba Region, which was hitherto largely neglected,
were duly filled. Notwithstanding those attempts, there are still challenges of filling other
important positions, especially with women and people with disabilities, which we are still
struggling to overcome. However, all attempts are being made to ensure that
employment equity targets that seem to be elusive are strictly adhered to.
We would be failing in our duty if we do not acknowledge our indebtedness to the
dedicated employees of the Department of Public Works, without whose contribution we
would not have achieved any of the above achievements. We are also greatly indebted
to the Portfolio Committee for Public Works, who relentlessly and indefatigably provided
their profound support to ensure that there is, in the Department, what the Japanese
refer to as Kaizen, which implies continuous improvement.
Mr B Gxilishe
Acting Head of Department
Date:

Department of Public Works – Vote 5 – Annual Report 2008/09
- 8 -
Information on the Ministry
This brief report on the ministry provides the public with information regarding the work of the
MEC‟s office during the past financial year. The ministry‟s purpose is to provide political
leadership and strategic guidance to the department in respect of its efforts in executing its
mandate in pursuit of the attainment of broad government policy and service delivery objectives.
During the reporting period the ministry has been engaged in a variety of activities whose
substance finds resonance in the following themes:
Continuous provision of leadership to the Expanded Public Works Programme (EPWP)
Accelerated Professional and Trade Competency Development Programme (APTCoD)
Properties
Public Private Partnership (PPP‟s)
Taking government to the people
Bettering our relations with the media
The importance of our parliamentary democracy
Advance international relations to advance development
In pursuit of the Departments goal of turning the tide against poverty, the greatest enemy in our
time, the ministry has during the 2008/09 financial year committed itself to upscale the impact of
EPWP. This has resulted that the target of 52 000 employment opportunities being exceeded with
41 741.
Significant progress has thus been made in contributing towards the EPWP goal of creating 1
million employment opportunities nationally.
The Department had a very successful maiden EPWP month during September 2007. We visited
various communities throughout the province to highlight the successes and challenges of
EPWP. The departmental interventions through EPWP has not only provided employment and
skills to poor communities, but further strengthened the economic backbone of a number of small
towns.
Accelerated Professional and Trade Competency Development Programme (APTCoD)
Our Accelerated Professional and Trade Competency Development Programme (APTCoD),
which is a skills development programme - is showing signs of success. The business processes
has been completed and a protocol for APTCoD exists and is being implemented.

Department of Public Works – Vote 5 – Annual Report 2008/09
- 9 -
The Incubator Programme, targeting 10 emerging contractors in each region with special
emphasis on youth and women owned contractors, has assisted in the targeted shifting from
lower grades on the CIDB register to higher grades. Some of the emergent contractors can now
compete for tenders of high value within the public and private sector. Contractors remain in this
programme for three years with full business mentorship.
To address the skills shortage we have currently 60 bursars who are at various tertiary institutions
in South Africa. A total of 16 bursary holders completed their studies at the end of the 2007
academic year and are being absorbed within the Department.
The Department targeted 500 young people throughout the Province who will receive short term
employment opportunities and training within the built environment, in line with the National Youth
Service programme.
Properties
The Department does have an operational asset register and is currently in the process of
implementing the Government Immovable Asset Management Act (GIAMA), Act 19 of 2007 in the
Province. In terms of the Act, the Department will facilitate the preparation of User Asset
Management Plans for all the 12 User Departments by 1 May 2010 and a Custodian Asset
Management Plan by the end of July 2010.
The process of implementing GIAMA includes further development and maintenance of a
consolidated asset register, which will contain at least 15 600 properties, which makes the
Eastern Cape Provincial Department the largest landlord in the Provincial and National
Governments, as well as certain parastatal organizations. This upgrading of the asset database
includes the verification of various property registers from both the Province and National
Government.
Public Private Partnership (PPP’s)
Due to a very high demand for suitable office accommodation at both Bhisho and Mount Ayliff,
the Eastern Cape Government agreed in 2006 to construct offices – Bhisho (39 000 square
meters) and Mount Ayliff (20 000 square meters) using the PPP model.
These PPP projects are aimed at addressing the Government‟s objective of providing integrated
office accommodation in order to contribute to the efficiency of the Provincial Government in
terms of workflow. The feasibility study is in process and will be completed in 5 months.

Department of Public Works – Vote 5 – Annual Report 2008/09
- 10 -
Taking government to the people
The ministry has embarked on several imbizo‟s throughout the province. The intended outcome is
to take government to the people and to make a difference in the quality of life of individuals and
communities. The ministry has also been taking part in presidential and provincial Executive
Council imbizo‟s. The responses of the people were overwhelming. They interrogated the
political leadership and senior government officials; which is a clear indication that communities
do participate in our vibrant democracy.
Bettering our relations with the media
Several engagements with the media on departmental and political matters have been achieved.
These included media statements on critical operational matters, media briefings on substantive
policy and programmatic issues, and radio talk shows on key achievements and information
sharing. We engaged the media and public with a number of adverts and newspaper
supplements. We will continuously have to improve in this area in order to create an
understanding amongst the public of government programmes.
The importance of our parliamentary democracy
Our engagement with parliament or the Legislature is fundamental in order to improve our young
parliamentary democracy. The ministry has responded well to parliamentary questions. The MEC
also contributed through debates that ensued in the house which were on various developmental
issues.
Advance international relations to advance development
The MEC undertook study visits to Madagascar and China. The focus of these visits was on
infrastructure and economic development. Being the infrastructure delivery department, the
experience from these study trips has enriched the department‟s perspectives on the
infrastructure delivery paradigms. In this regard, we are continuously improving our service
delivery mandate.
Ms P Majodina
Member of the Executive Council
Date:

Department of Public Works – Vote 5 – Annual Report 2008/09
- 11 -
Vision and Mission
Vision
A public institution that ensures the provision of sustainable, high quality and accessible
Infrastructure in the Eastern Cape Province
Mission
To achieve the optimal efficiency, convenience, lifespan, economic viability, safety and
appearance of any building of structure within our custodianship, by embodying the most
effective, labour intensive and economic means at our disposal, while contributing to the broader
government goals of job creation, poverty alleviation and fight against HIV and AIDS pandemic
Legislative and Other Mandates
In order to fulfil its legislative and other mandated functions, the department has, inter alia, the
following responsibilities.
To provide and manage infrastructure and accommodation requirements for the line
departments
To coordinate, monitor and evaluate the implementation of the Expanded Public Works
Programme in the Province
Schedule 4 of the Constitution, 1996 (Act 108 of 1996) lists Public Works as a functional area of
concurrent national and provincial legislative competence.
The following legislation is applicable to the department:
Constitution of the Republic of South Africa (Act 108/1996)
Eastern Cape Land Disposal Act
General Law Amendment Act (Act 102/1972)
Government Immoveable Management Act (Act 19/2007)
Construction Industry Development Board Act (Act 43/2000)
Preferential Procurement Policy Framework Act (Act 5/2000)
Division of Revenue Act (Act 1 of 2005)
Labour Relations Act (Act 66/1995)
Employment Equity Act (Act 55/1998)
Promotion of Access to Information Act (Act 2/2000)
Public Services Act (Act 103/1994) 1994

Department of Public Works – Vote 5 – Annual Report 2008/09
- 12 -
Occupational Health and Safety Act (Act 85/1993)
Promotion of Administrative Justice Act (Act 3/2000)
Public Finance Management Act (Act 1/1999)
Inter-Governmental Relations Framework Act (Act 13/2005)
Eastern Cape Land Administration Act (Act 7/2000)
Property Transformation Charter
Supply Chain Management Framework

Department of Public Works – Vote 5 – Annual Report 2008/09
- 13 -
PART 2: PROGRAMME PERFORMANCE
Voted Funds
Appropriation Main Appropriation
Adjusted Appropriation
Actual Amount Spent
Under Expenditure
968,801 968,801 915,292 53,509
Responsible Minister MEC for Public Works
Administering Dept Department of Public Works
Accounting Officer Head of Department
Aim of the Vote
The aim of the Department of Public Works is to provide and manage the accommodation,
housing, land and infrastructure needs of Provincial Government Departments, to drive the
implementation of the Expanded Public Works Programme and to promote the development and
transformation of the construction and property industries.
Key Measurable objectives
Strategic Goal Detail
1 To promote good governance
2 To improve service delivery within Public Works and contribute to improved
service delivery by client departments
3 To lead transformation of the construction and property industries of the
Eastern Cape and contribute to economic growth
4 To reduce poverty and unemployment
5 Create sustainable immoveable provincial assets through effective and efficient
immoveable asset management
Programmes
The department has structured itself into three programmes to enable the achievement of its
mandate and strategic goals. The programmes are:
Programme Sub-programme
1. Administration 1.1. Office of the MEC
1.2. Management
1.3. Corporate Services
2. Public Works 2.1. Programme Support
2.2. Property Management
2.3. Other Infrastructure
3. Community Based Public Works 3.1. Programme Support Office

Department of Public Works – Vote 5 – Annual Report 2008/09
- 14 -
Achievements
The achievements of the department throughout the 2008/09 year have been individually detailed
within this part of the annual report under individual programmes. They are best addressed in the
context of the programme focus and goals established at the outset of the year.
Programme 1: Administration – Sub-Programme: Office of the MEC
Sub-
Programme:
MEC’s
Office
Strategic
objective
Output/Measurable
Objective Output performance measures/service delivery indicators
Actual performance against target
Target Actual
Office of the
MEC
Provide
sound
strategic
leadership in
implementing
the
departmental
mandate
Ensure effective
communication
between the
Executing Authority,
the Accounting
Officer and the
department
Number of
monthly meetings
with the HoD and
Managers
facilitated
12 25
Monitor responses
to parliamentary
questions at all
times
% of parliamentary
questions
responded to
100% 100%
Monitor
implementation of
cabinet, house
resolutions, and
Portfolio committee
recommendations
% of
recommendations
implemented by
the department
100% 100%
To organize
community outreach
programme/Imbizo's
Number of
Imbizo's organized
6 20
Reasons for major variations/Comments: Unscheduled meetings are held on a weekly basis
between the MEC and the HOD. The Top management minutes are discussed with the MEC.
Interventions and planning are derived from these interactions. The MEC upscaled his
engagements with the external stakeholders as part of his role as champion for Operation
Ixingephi.

Department of Public Works – Vote 5 – Annual Report 2008/09
- 15 -
Programme 1: Administration – Sub-Programme: Management
Sub-
programme:
HOD’s
Office
Strategic
objective
Output/Measurable
objective Output performance measures/service delivery indicators
Actual
performance
against target
Target Actual
Office of the
Head of
Department
Provide
effective and
efficient
strategic
leadership
and
administrative
support to the
department
Develop and
implement
approved policies to
ensure
administrative
support
Policies
developed:
Yes/No
Yes Yes
Policies approved:
Yes/No
Yes Yes
Policies
implemented:
Yes/No
Yes Yes
Monitor the
implementation of
the audit plan to
address audit
queries
% of audit queries
addressed
70% 70%
Monitor the
development of
strategic plan, APP,
and operational
plans
Plans developed
to the required
quality: Yes/No
Yes Yes
Plan developed to
the required
formats: Yes/No
Yes Yes
Plans submitted
on time period:
Yes/No
Yes Yes
Monitor the
development and
submission of
reports
Reports developed
according to the
required quality:
Yes/No
Yes Yes
Reports developed
to the required
formats: Yes/No
Yes Yes
Reasons for major variations/Comments: Audit queries are addressed but not in good quality,
quality and time still remains as a problem.

Department of Public Works – Vote 5 – Annual Report 2008/09
- 16 -
Sub-
Programme
Strategic
objective
Output/Measurable
objective
Output
performance
Measure /
Service delivery
indicator
Actual performance
against target
Target Actual
Strategic
Planning and
Research
Strengthen
planning
monitoring,
evaluation
and
reporting in
DPW
Establishing 5
Regional Strategic
planning Units by
2009.
Number of
resourced
strategic planning
units in regions.
5 3
Annual Coordination
and submission of
completed plans as
per Provincial
stipulated timeframes
% of extent of
adherence to
deadlines
100% 100%
Collaborate with HR
in implementing three
change management
Programme by 2009
Number of
change
management
activities
3 3
Conduct training on
credible planning to
all senior managers
by end 2009
% of senior
managers trained
on credible
planning
90% 90%
% credibility of
plans produced.
70% 70%
Improve reporting by
60% by 2009.
% report
submitted on time
50% 50%
4 Quarterly
reports
submitted.
4 4
1 annual report
submitted
1
1
% compliance to
quality criteria of
reporting
80% 30%

Department of Public Works – Vote 5 – Annual Report 2008/09
- 17 -
Sub-sub-
Programmes Strategic
Objective
Output/Measurable
Objective
Output
performance
Measure /
Service delivery
indicator
Actual performance
against target
Target Actual
M & E
Promote and
implement
Monitoring
and
Evaluation
and
Reporting
Systems.
Develop M&E
capacity for the
department by 2009
% of Managers
trained in M & E
50% 30%
Number of
valuable reports
submitted
4 2
Ensure Alignment to
provincial priorities
like PGDP, HIPPs,
ASGISA and 24
APEX priorities by
2009
% Programme
plans aligned to
Provincial
Priorities.
60% 60%
Incorporate M&E
system in to
Programme planning
by 2009
% Programme
plans with M&E
plan incorporated
50% 0%
Sub –sub -
Programe
Strategic
Objective
Output/Measurable
Objective
Output
performance
Measure /
Service delivery
indicator
Actual performance
against target
Target Actual
Communica-
tions
Revitalize
the
communi-
cation unit
of the
department
Develop
departmental
communication
strategy by 2008
Communication
strategy
approved:
Yes/No
Yes No
Strategy
implemented:
Yes/No
Yes Yes
(partially
implem-
ented)
Implement 4
campaigns that would
contribute to building
a positive image of
the department by
2009
Number of
campaigns
implemented
4 5
Produce 4 different
communication
products to enhance
effective internal
communication in the
department by 2009
Number of
internal
communication
products
produced
4 2
Facilitate 4
stakeholder/commun-
Number of
Imbizo/
4 4

Department of Public Works – Vote 5 – Annual Report 2008/09
- 18 -
ity engagements stakeholder
forum facilitated
Reasons for major deviations/Comments: Quality in reports is still a problem; we are going to
pay more attention next financial year focusing on improving quality of report. Challenge
experienced to recruit disabled people with Technical Skills. The incorporation of M& E systems
into program planning started a bit late. This resulted in it being moved to the next financial year.
Sub –sub -
Programme
Strategic
Objective
Output/Measurable
Objective
Output
performance
Measure /
Service delivery
indicator
Actual performance
against target
Target Actual
Research
Obtain
evidence
based
information
on
construc-
tion and
property
industry in
order to
formulate
appropriate
intervention
and
prioritize
accordingly
Develop research
strategy for the
Department by June
2008
Approved
research strategy
1 0
Implement research
strategy fully by 2009
% of
implementation
on strategy
50% 0%
Conduct research on
appropriate priority
research areas
emanating from
research strategy by
March 2009
no. of research
reports
completed
2 0
Convene quarterly
seminars on topical
issues
Number of
seminars
conducted
4 0
Establish research
links, partnerships
and collaborations
with different social
partners
MoU's signed
with relevant
partners: Yes/No
2
partner-
ship
agree-
ments
1
partner-
ship
agree-
ments
Special
Programmes
Unit
Co-
ordinate
Integration
of Gender,
Disabled
persons,
Youth,
Children
and elderly
sector
groups in
Programm-
es planning
and
implement-
Establish SPU's in all
Regions by March
2009.
Number of
established
SPU's in regions
5 3
Monitor the
implementation of
target beneficiation of
all special groups in
all Programmes by
2009
no. of women
benefited to
realize equity
30 29
Number of
disabled persons
benefited to
realise equity
20 12
Ensure
mainstreaming of
Special Programmes
into all Departmental
Number of
Programme plans
addressing
Gender,
2 1
(Gender)

Department of Public Works – Vote 5 – Annual Report 2008/09
- 19 -
Programme 1: Administration – Sub-Programme: Corporate Service
Sub –sub -
Programme
Strategic
Objective
Output/Measurable
Objective
Output
performance
Measure / Service
delivery indicator
Actual performance
against target
Information
Communication
Technology
To support
organiza-
tional
strategy
through
effective
Information
Manage-
ment,
Systems
and
Technology
(IMST).
To fully implement
IT Governance
Framework by
2009.
% review of ISS
policies and
procedures
50% 100%
% of computer user
that have signed
user acceptance
form
80% 44%
To facilitate
effective network
infrastructure
maintenance by
2009
% of DPW offices
connected to
government
network
80% 100%
To ensure uptake
of Email (as a
business tool) by
2009.
User perception
survey - negative,
positive, excellent
Positive Positive
To ensure timeous
and effective IT
operations by 2009.
LAN & Desktop
Support rate (per
SITA ARS System
Reports)
70% 80%
User satisfaction
survey results
(negative, positive,
excellent)
Positive Positive
Support, research,
implementation and
maintenance of
systems by 2009
Systems
requirements
research report:
Yes/No
Yes Yes
Develop annually
post research
action plan
Post research
action plan
developed: Yes/No
Yes Yes
Reasons for major variations/Comments: A full review of ISS policies and procedures was
undertaken with the assistance of the Internal Audit and Risk Management Units. Detailed training
sessions were held on the ICT Acceptable Use Guideline and all users were issued with the form
tation Programmes. Disability, Youth
issues
Reasons for major deviations/Comments: Quality in reports is still a problem; we are going to
pay more attention next financial year focusing on improving quality of report. Challenge
experienced to recruit disabled people with Technical Skills. We had inadequate capacity to do
research within the department. Consequently, we decided to abandon the objective until we
develop enough capacity.

Department of Public Works – Vote 5 – Annual Report 2008/09
- 20 -
Sub –sub -
Programme
Strategic
Objective
Output/Measurable
Objective
Output
performance
Measure / Service
delivery indicator
Actual performance
against target
for signature. However, as at 31 March 09 only 44% of the users had returned signed ICT
Acceptable Use Guideline forms to the DGITO Office.
100% of Regional Offices are connected to the Government Network. Only 40% of Sub-Regional
offices are connected. Sub-Regional offices have a limited number of Administrative Staff Members
and a cost versus benefit analysis deemed full connectivity of these offices uneconomical.
Currently alternative technology is being pursued to bring cost effective connectivity to these
offices."
Sub-
Programme
Strategic
objective
Output/Measurable
objective
Output
performance
measure / Service
delivery indicator
Actual performance
against target
Target Actual
Human
Resource
Management
Develop
effective
Human
Resource
Manage-
ment
practices in
line with
organisa-
tional
develop-
ment and
transforma-
tion
policies
Co-ordinate
management and
monitoring the
performance of
personnel on a
quarterly and
annual basis
Performance
contract signing
rate
85% 83%
Quarterly
Performance
Review completion
rate
85% 79%
Annual
performance
moderation in
place: Yes/No
Yes Yes
Moderation plan
implemented
Yes Yes
Moderation plan
reviewed
Yes No
Review the current
EE Plan by 2009
Current EE plan
reviewed: Yes/No
Yes No
Update workplace
analysis report
1 0
Implement the
reviewed EE plan
by 2009
% overall
compliance with
EE plan
40% 30%
Implement
employment equity
plan by 2009
% compliance with
EE targets
employed
50% 53%
% EE beneficiaries
(women) employed
25% 52%
% EE (black)
beneficiaries
employed
25% 99%

Department of Public Works – Vote 5 – Annual Report 2008/09
- 21 -
Sub-
Programme
Strategic
objective
Output/Measurable
objective
Output
performance
measure / Service
delivery indicator
Actual performance
against target
Target Actual
% disabled
persons employed
(Employment
Equity)
1.5% 0.7%
% of youth
employed
25% 70%
Implement best
practice HR
policies, plan and
procedures by 2009
HR plan in place
by 2008: Yes/No
Yes Yes
HR plan
implemented:
Yes/No
Yes Yes
HR plan reviewed:
Yes/No
No Yes
Organogram
responsive to the
departmental
strategy in place:
Yes/NO
Yes Yes
% posts per post
level evaluated
90% 70%
% reduction in
HRM related audit
queries concerning
leave, housing
subsidies, copies
of personnel
documents on file
65% 80%
% employee exits
finalized within 2
weeks.
85% 90%
Resolve 70%
disciplinary cases
within 3 months
% of disciplinary
cases resolved
within 3 months
70% 88%
% of supervisors
and managers
trained and able to
handle misconduct
and grievances
75% 11.7%
Conduct 4
awareness
campaigns for
employees
Number of
awareness
campaigns
conducted for
employees
4 6
To reduce the rate rate of <5% <1%

Department of Public Works – Vote 5 – Annual Report 2008/09
- 22 -
Sub-
Programme
Strategic
objective
Output/Measurable
objective
Output
performance
measure / Service
delivery indicator
Actual performance
against target
Target Actual
of staff absenteeism
absenteeism
Employee
assistance
responsive rate
<25
working
days
<10
working
days
Conduct 4 life skills
programmes by
March 2009
Number of life
skills programmes
conducted
4 11
Conduct 3
HIV/AIDS
awareness
campaigns by
March 2009
Number of
HIV/AIDS
awareness
campaigns
conducted
4 9
Condom
distribution rate.
24 000 23 000
Number of OH&S
incidents reported
<20 6
Create
environ-
ment
conducive
to
attracting
and
retaining
competent
staff
Reduce vacancy
rate to <8.5 by 2011
Skills development
Plan and report in
place
1 1
Staff developed in
keeping with
workplace skills
plan
HRD strategy in
place by 2009
1 0
HRD plan in place 1 0
Award Bursaries
according to scarce
skills category.
Number of
bursaries awarded
in scarce skills
categories
65 53
Monitor employees
making use of
development
opportunities in line
with their personal
development
% employees
making use of
development
opportunities that
are aligned with
their personal
development plan.
65% 20.5%
Skills audit report
in place
1 0
Reasons for major variations/Comments: The directorate‟s functioning was curtailed by a lack of
funds which ran out during the third quarter of the financial year. In this regard the planned skills
audit by an expert service provider could not take place. Similarly, staff was not allowed to go to
Regions and depots to ensure performance agreements are signed, validated, and reviews are
done. The planned training of managers and supervisors in handling misconduct cases could not
be completed after making a modest start. The department‟s recruitment plan had to be placed on
hold with appointments coming to a halt because of a lack of funds. This, in turn, affected the
closing of the employment equity gaps in race, sex, disability and youth. The bursary funds

Department of Public Works – Vote 5 – Annual Report 2008/09
- 23 -
Sub-
Programme
Strategic
objective
Output/Measurable
objective
Output
performance
measure / Service
delivery indicator
Actual performance
against target
Target Actual
remained static for the second year whilst the cost of studies and accommodation increased.
Consequently, fewer bursaries were allocated compared to the previous years. The lack of funds
also impacted adversely on other training programmes with fewer training opportunities than
previous years.
Sub-
Programme
Strategic
objective
Output/Measurable
objective
Output
performance
measure / Service
delivery indicator
Actual performance
against target
Target Actual
Finance Provide
strategic
financial
manage-
ment
support to
the
Accounting
Officer and
delegated
officials
Spend 100% of
budget allocation
with variance of less
than 1.5% for the
year
% expenditure to
budget allocation
98%
Expendi-
ture
100%
% difference
between
expenditure and
budget allocation
to total budget
allocation
2%
Variance
2%
To eliminate
unauthorised,
fruitless, wasteful
and irregular
expenditure of
100% budget
expenditure to be
<1% every year.
% budget
expenditure
98% 100.5%
% fruitless
expenditure
0% 0%
% unauthorized
expenditure
0% 0 %
%irregular
expenditure
0% 1.79%
To ensure that
creditors payments
are done within 30
days after receipt of
an invoice by 2009
number of invoices paid within 30 days of receipt OR
Average number of days that all invoices received
are paid
27 days 26 days
Monitor
implementation of
audit queries
number of audit
queries
implemented by
various
programmes
Accord-
ing to
target.
Work in
progress
to
resolve
the
matters.
80% of
the work
done.
Procure 80% goods
and services from
BEE entities by
% tenders
awarded to BEE
companies
70% 74.5%
Department of Public Works – Vote 5 – Annual Report 2008/09
- 24 -
Sub-
Programme
Strategic
objective
Output/Measurable
objective
Output
performance
measure / Service
delivery indicator
Actual performance
against target
Target Actual
2009
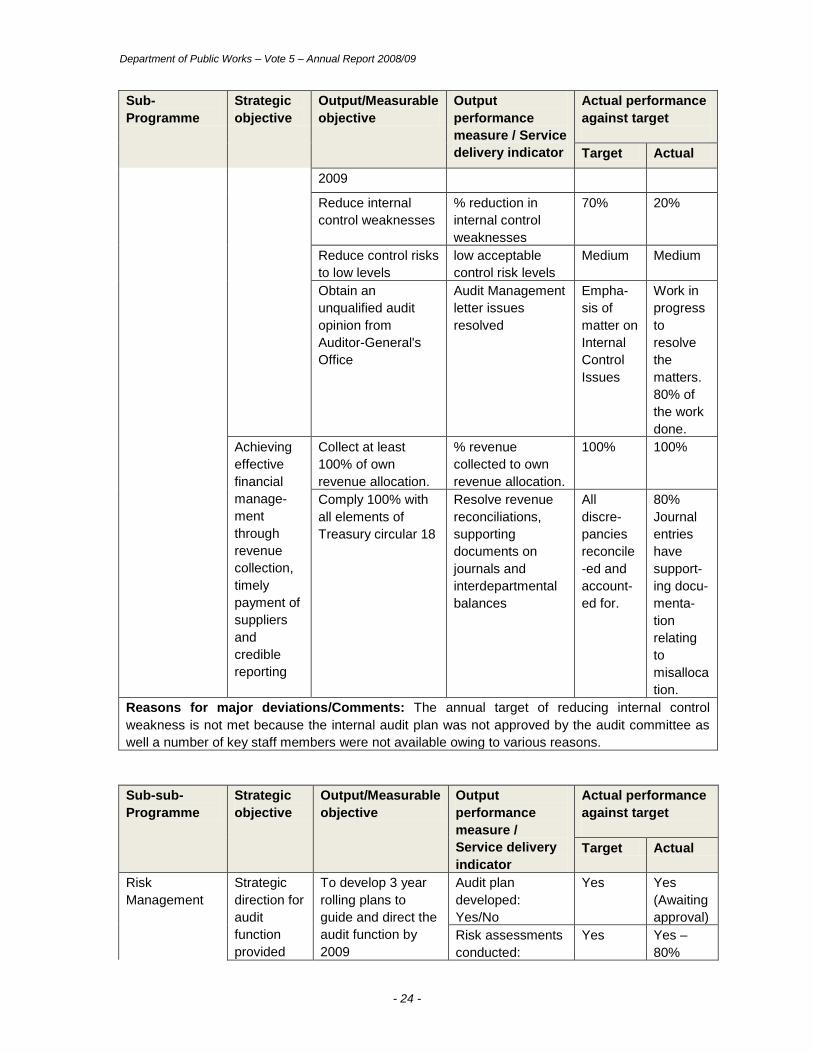
Reduce internal
control weaknesses
% reduction in
internal control
weaknesses
70% 20%
Reduce control risks
to low levels
low acceptable
control risk levels
Medium Medium
Obtain an
unqualified audit
opinion from
Auditor-General's
Office
Audit Management
letter issues
resolved
Empha-
sis of
matter on
Internal
Control
Issues
Work in
progress
to
resolve
the
matters.
80% of
the work
done.
Achieving
effective
financial
manage-
ment
through
revenue
collection,
timely
payment of
suppliers
and
credible
reporting
Collect at least
100% of own
revenue allocation.
% revenue
collected to own
revenue allocation.
100% 100%
Comply 100% with
all elements of
Treasury circular 18
Resolve revenue
reconciliations,
supporting
documents on
journals and
interdepartmental
balances
All
discre-
pancies
reconcile
-ed and
account-
ed for.
80%
Journal
entries
have
support-
ing docu-
menta-
tion
relating
to
misalloca
tion.
Reasons for major deviations/Comments: The annual target of reducing internal control
weakness is not met because the internal audit plan was not approved by the audit committee as
well a number of key staff members were not available owing to various reasons.
Sub-sub-
Programme
Strategic
objective
Output/Measurable
objective
Output
performance
measure /
Service delivery
indicator
Actual performance
against target
Target Actual
Risk
Management
Strategic
direction for
audit
function
provided
To develop 3 year
rolling plans to
guide and direct the
audit function by
2009
Audit plan
developed:
Yes/No
Yes Yes
(Awaiting
approval)
Risk assessments
conducted:
Yes Yes –
80%

Department of Public Works – Vote 5 – Annual Report 2008/09
- 25 -
Sub-sub-
Programme
Strategic
objective
Output/Measurable
objective
Output
performance
measure /
Service delivery
indicator
Actual performance
against target
Target Actual
Yes/No complete
Audit methodology
approved
Yes Yes
Indepen-
dent,
objective
audit
services
provided to
add value
and
improve
department
-tal
operations
To execute audit
services as per
audit plan per
financial year.
% of
implementation of
audits planned
100% 20%
Respond to ad hoc
assignments as per
requests by Audit
Committee and
management
Execution of
requests rate
80% 100%
Good
governance
processes
and ethical
behavior
enhanced
To co-ordinate
establishment of
governance
committees
% functionality of
committees.
100% 50%
No. of awareness
road shows
conducted.
4 4
Timely submission
of quarterly
progress reports to
the Audit Committee
Progress reports
presented at each
Audit Committee
quarterly
meetings.
4 3
Presentation of
quarterly progress
reports to
management
Progress reports
presented
quarterly
management
meetings.
4 2
Conduct follow-ups
on action plans by
management (both
from Internal Audit
& AG reports)
Control
improvements in
the areas of
concern
100% 50%
To conduct good
conduct and ethical
awareness
programs
throughout the
department
At least 4
awareness
programs per
annum (workshop,
published articles,
etc)
4 0
Effective
risk
manage-
To develop the
fraud prevention
plan by March 2009
Fraud prevention
plan developed.
Yes/No
1 1

Department of Public Works – Vote 5 – Annual Report 2008/09
- 26 -
Sub-sub-
Programme
Strategic
objective
Output/Measurable
objective
Output
performance
measure /
Service delivery
indicator
Actual performance
against target
Target Actual
ment
processes
ensured
Develop risk
management
strategy by March
2009
Risk management
plan developed
Yes Yes
Risk management
workshop
conducted.
Yes Yes
To monitor the
implementation of
fraud prevention
and risk
management plan
by 2009
No. of risk reports
produced
4 4
Risk register in
place: Yes/No
Yes Yes
Fraud and
corruption reports
produced
4 2
Reasons for major deviations/Comments: The reasons for the deviations can be attributed
largely to two primary causes i.e.
(i) Lack of leadership in the internal audit and risk management units owing to the Senior
Manager – Internal Audit and Risk Manager positions being vacant for the major part of the
year.
(ii) Budgeting constraints.
Programme 2: Public Works – Other Infrastructure
Sub
Programme
Strategic
objective
Output/Measurable
Objective
Output
performance
measure /
Service delivery
indicator
Actual performance
against target
Target Actual
Buildings
Maintenance
Effective
utilization
of in house
unit
focusing on
optimal
service
delivery
Repair and
renovations of 114
government houses
by 2009
Number of
government
houses
renovated
114 89
Projects,
65
complet-
ed and
24 under
construc-
tion
Implemen-
tation of
EPWP in
all building
Mainte-
nance
projects.
Major renovation of
26 Offices and depot
using EPWP
principles by 2009
Number of offices
and depots
renovated
26 41
Projects,
24
compet-
ed and
17 under
construc-
tion.

Department of Public Works – Vote 5 – Annual Report 2008/09
- 27 -
Sub
Programme
Strategic
objective
Output/Measurable
Objective
Output
performance
measure /
Service delivery
indicator
Actual performance
against target
Target Actual
Install energy saving
technology for lights
in all government
administration
buildings by 2009
% of buildings
fitted with the
technologies
30% 30%
Implement
the
Building
Mainten-
ance Unit
Program-
me
Train 120 personnel
in-house team by
2009
Number of
personnel trained
120 0
Number of
personnel
assessed
551 551
Maintain 12 client
department buildings
by 2009
Number of client
department
buildings
maintained
12 12
Reasons for major variations/Comments: Inadequate Professional/ Technical staff. Lack of
expertise/mentorship for emerging contractors and Establishment of Prestige Unit at Head office.
Achievement:
Allocated Budget(R232,136,000)for the years is fully spent(R232,664,340)
Out of Major projects 24 are completed and 17 under construction
Out of 89 houses 65 are completed and 24 under construction
Total number of jobs created-2599
16 Projects have been implemented based on EPWP guideline and created 279 jobs of which 156 Youth and 89 Women
Various Adhoc maintenance contracts provided opportunity to previously disadvantaged contractors to get into the stream of construction
Installed around 250 air conditioners in various offices to improve the working condition/environment to officials
Proper planning is being done for 2009/10
Programme 2: Public Works – Programme Office Support
Sub
Programme
Strategic
objective
Output/Measurable
Objective
Output
performance
measure /
Service delivery
indicator
Actual performance
against target
Target Actual
Programme
Office Support
New Works
Roll-out
Infrastruc-
ture
Delivery
Improve-
ment
Program-
me (IDIP)
Develop plans for
client departments
Infrastructure
Programme
implementation
plan developed
N/A Draft
IPIP
awaiting
final
IPMP
from
DOE.
DOH

Department of Public Works – Vote 5 – Annual Report 2008/09
- 28 -
Sub
Programme
Strategic
objective
Output/Measurable
Objective
Output
performance
measure /
Service delivery
indicator
Actual performance
against target
Target Actual
IPIP for
2008/09
financial
year has
been
develop-
ed and it
is now in
use.
Assist 5 client
department in
developing IPMP's for
infrastructure
Programme
development Plans
(IPMP‟s) by 2009.
Number of
IPMP's
developed.
5 The
IPMP for
DOE is in
draft
DOH was
assisted
to
develop
its IPMP
for
2008/09
financial
year
One
IPMP
has been
develop-
ed for
“other
client
depart-
ments”
Number of
IPMP's approved.
5 The
IPMP for
DOE is in
draft
DOH
IPMP
develop-
ed for
2008/09
financial
year

Department of Public Works – Vote 5 – Annual Report 2008/09
- 29 -
Sub
Programme
Strategic
objective
Output/Measurable
Objective
Output
performance
measure /
Service delivery
indicator
Actual performance
against target
Target Actual
One
IPMP
has been
approved
for “other
client
depart-
ments”
Develop IPIP's for 5
client departments
DPW implements for
by 2009
Number of IPIP's
developed.
5 Draft
IPIP
awaiting
final
IPMP
from
DOE.
DOH
IPIP for
2008/09
financial
year has
been
develop-
ed and it
is now in
use.
Number of IPIP's
approved
5 Draft
IPIP
awaiting
final
IPMP
from
DOE.
DOH
IPIP for
2008/09
financial
year has
been
formally
submit-
ed to
DOH for

Department of Public Works – Vote 5 – Annual Report 2008/09
- 30 -
Sub
Programme
Strategic
objective
Output/Measurable
Objective
Output
performance
measure /
Service delivery
indicator
Actual performance
against target
Target Actual
adoption
and
approval
Develop 10 DPW /
Client department
Service Level
Agreements by 2009.
Number of SLA's
developed.
10 2
Number service
level agreements
signed
10 2
Assist 5 client
departments in
developing
infrastructure
management
plans
N/A 3
Implement
projects for the
client department
N/A DOE:
Projects
imple-
mented
and
various
stages of
comple-
tion.
DOH: 36
clinics
have
been
complet-
ed and 5
hospital
phases
have
been
complet-
ed and
have
been
handed
over
during
the
2008/09
financial
year.

Department of Public Works – Vote 5 – Annual Report 2008/09
- 31 -
Sub
Programme
Strategic
objective
Output/Measurable
Objective
Output
performance
measure /
Service delivery
indicator
Actual performance
against target
Target Actual
Other
client
depart-
ments:
48
projects
complet-
ed and
handed
over
Develop and sign
DPW/DoE
department SLA
N/A 1
Reasons for major variations/Comments: Lack of co-ordination between DPW and client
departments.
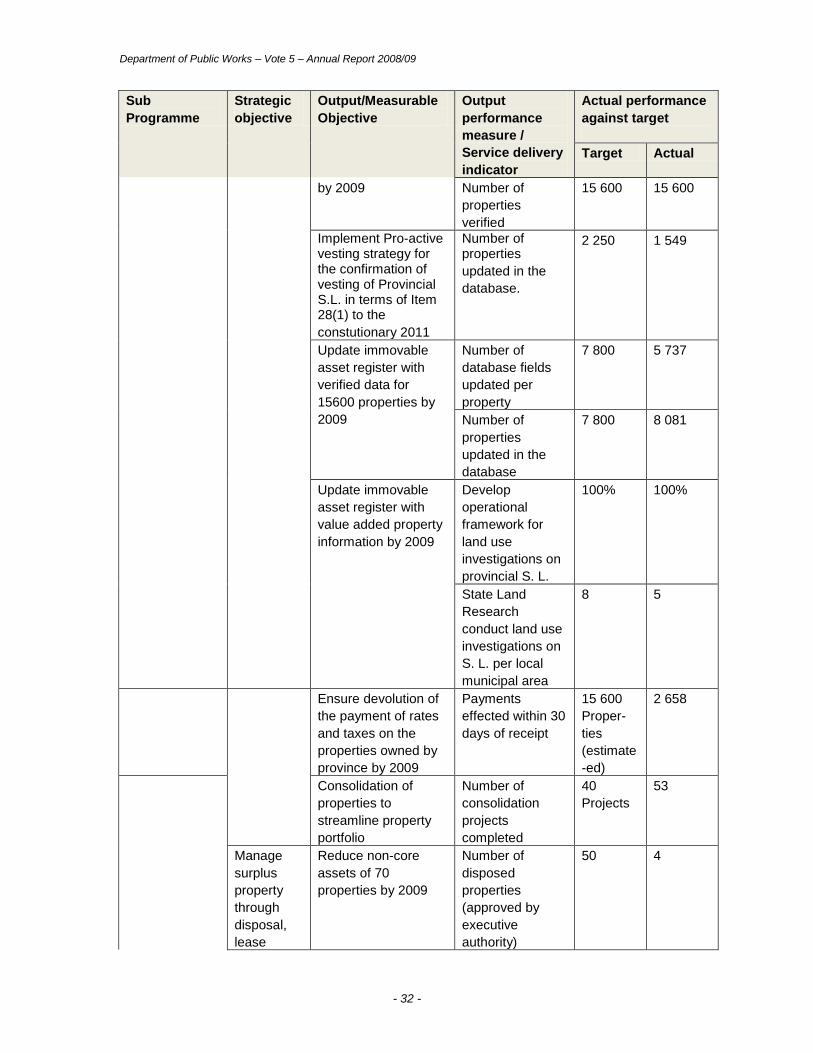
Programme 2: Public Works – Property Management
Sub
Programme
Strategic
objective
Output/Measurable
Objective
Output
performance
measure /
Service delivery
indicator
Actual performance
against target
Target Actual
Property
Management
Implement
best
practice
asset
manage-
ment
systems to
achieve
sound
property
administra-
tion and
manage-
ment
Ensure alignment of
disposal policy to
PGDP, Property
Transformation
Charter and National
policy directives by
2009
Revised disposal
policy approved
1 Policy 1 Policy
Develop 3
administration
policies (Leases,
Acquisition and
Housing Allocation)
by 2009
Number of
policies
developed
3 4
Number of
policies approved
3 0
Consolidate
provincial asset
registers and
migration to IE-works
Number of asset
registers verified
11
Provin-
cial and 4
National
4
National,
6 Provin-
cial.
Department of Public Works – Vote 5 – Annual Report 2008/09
- 32 -
Sub
Programme
Strategic
objective
Output/Measurable
Objective
Output
performance
measure /
Service delivery
indicator
Actual performance
against target
Target Actual
by 2009
Number of
properties
verified
15 600 15 600
Implement Pro-active vesting strategy for the confirmation of vesting of Provincial S.L. in terms of Item 28(1) to the
constutionary 2011
Number of properties
updated in the
database.
2 250 1 549
Update immovable
asset register with
verified data for
15600 properties by
2009
Number of
database fields
updated per
property
7 800 5 737
Number of
properties
updated in the
database
7 800 8 081
Update immovable
asset register with
value added property
information by 2009
Develop
operational
framework for
land use
investigations on
provincial S. L.
100% 100%
State Land
Research
conduct land use
investigations on
S. L. per local
municipal area
8 5
Ensure devolution of
the payment of rates
and taxes on the
properties owned by
province by 2009
Payments
effected within 30
days of receipt
15 600
Proper-
ties
(estimate
-ed)
2 658
Consolidation of
properties to
streamline property
portfolio
Number of
consolidation
projects
completed
40
Projects
53
Manage
surplus
property
through
disposal,
lease
Reduce non-core
assets of 70
properties by 2009
Number of
disposed
properties
(approved by
executive
authority)
50 4

Department of Public Works – Vote 5 – Annual Report 2008/09
- 33 -
Sub
Programme
Strategic
objective
Output/Measurable
Objective
Output
performance
measure /
Service delivery
indicator
Actual performance
against target
Target Actual
manage-
ment and
conversion
Number of
properties
identified for
conversion
20 54
Strategic
govern-
ment
accommod
ation
Program-
me
developed
Acquisition of 2 sites
for the
implementation of 2
PPP (Bhisho & Mt
Ayliff office parks) by
2009
Land registered
in the name of
Eastern Cape
Provincial
Government
2 sites 0
Provide professional
and technical support
for site clearing as
per request.
Number of sites
cleared
2 sites 0
Implement office
accommodation plan
to procure space of
by 20 000m² 2009
% of office space
procured
80% 115%
Facilitate the signing
of 1200 lease
agreements by 2009
Number of lease
agreement
signed
(depending on
expiring date)
1 200 1 023
Develop 5 custodian
asset management
plans with GIAMA
compliance for 5
client departments by
2009
Number of
custodian asset
management
plans compliant
to GIAMA (Act 17
of 2007)
developed
5 1
Conduct survey of un
-surveyed provincial
S. L. for 60 properties
by 2009
Number of
properties
surveyed
60
proper-
ties
42
proper-
ties
State Land
Research :
conduct land use
investigation on
state land per
local municipal
area
8 reports 5 reports
Investigation and
establishment of a
departmental GIS by
2009
Linkage of 25%
of the alpha-
numeric property
records to the
25% of
provincial
proper-
ties
25%

Department of Public Works – Vote 5 – Annual Report 2008/09
- 34 -
Sub
Programme
Strategic
objective
Output/Measurable
Objective
Output
performance
measure /
Service delivery
indicator
Actual performance
against target
Target Actual
GIS linked.
Implement
strategies
and
Program-
mes to
support
SMME
develop-
ment and
empower-
ment
Implement incubator
Programme catering
for 10 SMME's per
region targeting
women and youth in
property industry by
2009
Number of
SMME's
developed.
5
SMME‟s
1
SMME‟s
Implement 3 business
or tourist related
projects targeting
women & youth by
2009
% of women
participating
15% 15%
Number of
properties
identified and
released for such
projects
9 proper-
ties
3
Implement 1
distributed B&B
concept targeting
youth & women by
2009
Number of
distributed B&B
1 0
Reasons for major variations/Comments: Besides the draft disposal policy, four additional draft
policies (Housing Allocation, Hiring & Letting, Acquisition and Maintenance) were developed and
are awaiting approval. 2 658 invoices with a value of R53 million were received only from
September 2008. The conditional grant of R119 million for rates and taxes was only devolved in
mid-September 2008 (1st of four batches). At least 80% of invoices were paid within 30 days. It
should be noted the invoices are receive on an annual basis from local municipalities, after the
various valuation rolls have been approved. The Department first verifies provincial ownership,
before payment is done. It has been a huge challenge for both the Department and the 38 local
municipalities to reconcile these invoices. At least 10 smaller municipalities were not in a position to
bill the State for rates, due to capacity problems in the municipalities and/or the fact that the
municipal valuation process was not complete. In the cases were invoices were not paid within 30
days after receipt, the challenges were mainly of difficulty in the verification process and invoices
that are incomplete or inaccurate with regard to property and valuation details
Although more than 300 properties have been identified for disposal only four was approved by the
Executive Authority for transfer. The disposal policy is still in draft format, and general disposals to
the open market were put on hold until the said policy is approved. A number of superfluous
properties identified for disposal were subject to land restitution claims and therefore the
Department was not in a position to proceed with such disposal submissions. Some properties
were also targeted for conversion and/or reallocation through lease agreements to other organs of
State and therefore not transferred.

Department of Public Works – Vote 5 – Annual Report 2008/09
- 35 -
Sub
Programme
Strategic
objective
Output/Measurable
Objective
Output
performance
measure /
Service delivery
indicator
Actual performance
against target
Target Actual
The Mt Ayliff property (Erf 188/R) is subject to a land restitution claim and transfer could not occur
in terms of the Restitution of Land Rights Act, Act 22 of 1994. The Municipal Council of the Buffalo
City Municipality delayed approval for the release of the Bhisho site, Erf 4785/R, due to concerns
on the capacity of bulk services and the manner of disposal. The Council was not in favour of a
donation of the land and negotiations are continuing. The municipality insists on full market value
to an amount of R1 825 000. The Department however concluded the topographical and geo-
technical surveys of both sites as part of the feasibility studies conducted by the Transactional
Advisor.
The Department intended to procure only 16 000m², based on achievements in previous financial
years. However, due to increasing demand for office space by User Departments and the fact that
some Departments provided funding for such additional space, the Department was in a position to
procure 23 026m² of office space – 3 026m² more than planned.
The signing of income (revenue) lease is the responsibility of the Regions, who experience many
difficulties from occupants and tenants in the signing of these contracts. The Department
experience reluctance from many tenants in the Amathole Region to sign market related lease
agreements. Tenants were used to pay nominal rental in previous years and were now forced to
pay market rental as per PFMA requirement.
The development of User Asset Management Plans is the responsibility of the various User
Departments and not Public Works. The Department of Public Works only assists in the mentoring
of User Departments to develop such plans. Public Works is only responsible for the single User
Asset Management Plan, which is an amalgamation and analytical response to the various User
Asset Management Plans. The Department developed 4 trial User Asset Management Plans as a
pilot exercise, as per implementation plan from directive of National Public Works. Two additional
plans were 80% complete by the end of the Financial Year. The trail Custodian Plan (based on the
four 100% completed U-AMPs) was successfully completed. The GIAMA is only operational from 1
April 2010 in Provinces and the full U-AMPs and C-AMP were therefore not due during the period
under review.
The Property Incubator Programme only introduced late 2008 in the Province. Although various
properties and opportunities have been identified for such projects, implementation thereof will only
materialize in the next Financial Year. The Department has an existing lease with a woman who is
operating a tourism operation (camping and holiday resort) in Port St Johns. At least three
properties were made available to projects which has a social connotation.

Department of Public Works – Vote 5 – Annual Report 2008/09
- 36 -
Sub
Programme
Strategic
objective
Output/Measurable
Objective
Output
performance
measure /
Service delivery
indicator
Actual performance
against target
Target Actual
Security
Management
Optimally
provide
building
services to
the
Provincial
govern-
ment
clients
To provide
continuous and
effective asset
protection services
Minimizing of
departmental
losses
Provin-
cial
tender.
Tender
awarded
RFID
system
tender
In
progress
Installa-
tion of 30
alarms
and 39
trelli-
doors.
Complet-
ed
In-house
security
manage-
ment and
adminis-
tration.
Complet-
ed
Vetting of
the
Security
Manager
by NIA.
Complet-
ed
Reasons for major variations/Comments: No major variations from the target have been
identified.
Programme 3: Expanded Pubic Works Programme – Sub-Programme: Programme Office
Support
Sub
Programme
Strategic
objective
Output/Measurable
Objective
Output
performance
measure /
Service delivery
indicator
Actual performance
against target
Target Actual
EPWP Drive
Implementa
tion of
EPWP in all
sectors
Create 52000 job
opportunities by Up
scaling, EPWP
projects by 2009.
Number of Jobs
created.
52 000 93 741
Expand Training to
cover 390 000
person days by
2009.
Number of Person
days.
390 000 28 203
Enhance internal
capacity of
Number of EPWP
compliant projects
2 500 2 425

Department of Public Works – Vote 5 – Annual Report 2008/09
- 37 -
Sub
Programme
Strategic
objective
Output/Measurable
Objective
Output
performance
measure /
Service delivery
indicator
Actual performance
against target
Target Actual
Provincial
Government and
Municipalities by
appointing 2
technical support
staff to service 6
districts and 1 metro
by 2009.
registered.
Number of
technical support
staff appointed.
2 0
Number of
Municipalities
serviced.
7 0
Contribute to
National Youth
Service (NYS) by
appointing 322
youth to APTCoD
by 2009.
Number of Youth
appointed.
322 422
Profiling of
EPWP to
all levels of
government
operating
within the
Eastern
Cape and
to the
Private
Sector.
Enhance the profile
of EPWP through
media by
conducting
awareness
campaigns by 2009.
Number Outreach
campaigns
conducted.
2 19
Production of the
EPWP Bulletin
4 1
% of EPWP
boards on site
100% 70%
Developme
nt of
systems to
ensure
integrity of
qualitative
data and
the
production
of quality
reports.
To develop a
system to ensure
integrity of quality
data submitted by
2009.
EPWP Data
management
Information
System developed
& implement
Develop
and
impleme
nt
Develope
d and
impleme
nt-ed on
115
Projects
(in
progress
stage.)
Reasons for major variations/Comments: Appointing 2 technical staff supports staff to service 6
districts and 1 metro by 2009. Although we could not appoint the service providers due to financial
constraints. Nevertheless, we managed to get assistance from the National Department of Public
Works, whereby all 6 district municipalities, the metro and 17 local municipalities were provided
with technical support that ultimately contributed in the EPWP target being exceeded
Expand Training to cover 390 000 person days by 2009. Training in the EPWP is supposed to be
paid by the Department of Labour. In the 2008/09 financial year the Department of Labour did not
provide funds for training.

Department of Public Works – Vote 5 – Annual Report 2008/09
- 38 -
Sub
Programme
Strategic
objective
Output/Measurable
Objective
Output
performance
measure /
Service
delivery
indicator
Actual
performance
against target
Target Actual
Construction
Industry
Development
Programme
To contribute
and implement
National
Contractor
Development
Programme.
Facilitate the
improvement on
registration status of
contractors in grade 1-
6 targeting 125 of
registered contractors
by 2009.
No of
contractors
graduated to
the next level.
125 383
Develop 2 competitive
affirmable professional
firms by 2009.
Number of
firms develop
2 0
Develop 20 competent
small specialist
contractors by 2009.
Number of
specialist
contractor
developed
20 20
Facilitate
establishment of 1
competitive in-situ
materials
manufactures by 2009.
No of
competitive in-
situ materials
established.
1 1
Facilitate
establishment of 1
material virtual
warehouse by 2009.
No of materials
virtual
warehouse
established.
1 0
To implement
the
Accelerated
Professional
and Trade
Competencies
Development
(APTCoD)
Programme as
an intervention
to the scarcity
of artisans and
professionals.
Develop 300 Artisans
by 2009.
No of Artisans
trained
300 422
No of Artisans
passed trade
test.
30 22
Train 10 professionals
by 2009.
No of
professionals
trained
10 21
To implement
strategies and
Programmes
to support
SMME
Implement incubator
Programme catering
for 11 SMME's per
region targeting
women, youth and
No of youth
SMME's in
incubator
Programme
per region.
5 25

Department of Public Works – Vote 5 – Annual Report 2008/09
- 39 -
Sub
Programme
Strategic
objective
Output/Measurable
Objective
Output
performance
measure /
Service
delivery
indicator
Actual
performance
against target
Target Actual
development
and
empowerment.
disabled in
construction and
property industries by
2009.
No of women
SMME's in
incubator
Programme
per region
4 34
No of disabled
SMME's in
incubator
Programme
per region
2 10
Number of
incubator
contractors
19 68
Reason for major variation/Comments: Develop 20 competitive affirmable professional firms
by 2009. There were no projects to for the development of affirmable professional firms by 2009.
The variance in the no of materials virtual warehouse established is due to budget constraints
The variance for no of professionals trained is due to the recruitment of more professionals and
bursary holders.
Service Delivery Environment and Challenges
The Department of Public Works exists to contribute to the national effort of fighting poverty,
unemployment and underdevelopment within the context of stimulating economic growth and
development. This is done by effectively executing its mandate and responsibility of providing
provincial buildings infrastructure and maintaining the same, and exercising custodianship of
provincial property portfolio. In executing this mandate however, it has to ensure that the
construction industry, which is the vehicle to deliver this infrastructure, is transformed and
adequately developed and capacitated to do so. Similarly, the department has to ensure that
property is transformed so as to allow participation by the previously disadvantaged sections of
the population, the majority of which are women and young people.
Our province which is over 70% rural is synonymous to underdevelopment whose main feature is
infrastructure underdevelopment. The last decade however, has seen encouraging commitment
by government in the form of massive capital injection in infrastructure development. For
example, the total construction spend in 2002 exceeded R575,5 billion, of which 29,5% came
from public sector orders and tenders, 13% from public corporations and 56,9% from private
sector. The amount spent in South Africa on construction and construction related activities in
2002 amounted to 5,1% of GDP, up from 4,9% in 2001. Private sector spending has increased in

Department of Public Works – Vote 5 – Annual Report 2008/09
- 40 -
real terms in the last three years. Similarly, public sector spending has increased from R18bn in
2000 to R24,8bn in 2002 at constant price.
Investment perspectives hold that the current activity in the building industry amounts to some
R24,9bn per annum, and is expected to grow to between R32bn and R35bn by 2010. Similarly,
the current activity in engineering works is some R20,5bn and is expected to grow to about
R30bn by 2010.
The massive current and future investment in construction outlined above has brought with it a
number of interesting developments and challenges alike in the construction industry, but has
also encouraged new thinking within government and stimulated fresh innovative approaches in
the Department of Public Works in particular.
Currently the industry is experiencing a number of challenges in the wake of this huge
investment. These challenges include the capacity of the industry to absorb such massive capital
works and contractors that are drowning with work. There is however an interesting development
amidst this scenario playing itself out in an interesting paradoxical manner. While big and
established companies with the capacity are drowning because they cannot handle numerous
works, small and emerging contractors are finding it hard to benefit from this investment because
of the very capacity and their skills base.
Small and Emerging contractors are the hardest hit by the capacity and skills challenge
experienced by the entire industry. The CIDB registration process revealed that there are only
two contractors that can handle work of up to R100m, one contractor with no limit, while the
majority of emerging contractors can only handle work of up to R200 000.
Grade Limit (Rm) Active Suspended
1 0.2 533 73
2 0.5 61 7
3 1.5 14 4
4 3.0 38 4
5 5.0 10 1
6 10.0 16 2
x7 30.0 9 1

Department of Public Works – Vote 5 – Annual Report 2008/09
- 41 -
Grade Limit (Rm) Active Suspended
8 100.0 2 0
9 No Limit 1 0
TOTAL 776 92
Another challenge is in the area of infrastructure skills, artisans, and professionals.
According to the illustration above the country has been experiencing a decline in artisan
registration since the last 5 to six decades hitting lowest proportions in the 21st century. The
situation is similar with professionals (Engineering, Architects & Quantity Surveyors).
Both illustrations highlight the challenge that the country and the industry is faced with regarding
this skills base which inevitably impacts on the absorptive capacity of the industry in relation to
the investment injected by both private and public sectors. Various options have been pondered
as a response to this situation and these include developing comprehensive programmes and
plans to produce the required skills. This option points to sourcing ready made capacity form
abroad, in other words, import the skills.
88EX Allyson Lawless
ENGINEERS ENGINEERS
& TECHNOLOGISTS& TECHNOLOGISTS
0 50 100 150 200 250 300
24
29
34
39
44
49
54
59
64
69
Ag
e
Number per age group
Black
White
Provincial Government

Department of Public Works – Vote 5 – Annual Report 2008/09
- 42 -
The department of Public Works has chosen the former i.e. developing a comprehensive plan as
a response to this predicament, hence infrastructure skills development programme the flagship
of which is the acceleration of the development if Professional and Trade Competencies. The
Accelerated Professional and Trade Competencies Development (APTCoD) programme is
intended to produce professional, artisans, small specialist contractors, and small contractor
integrators. In this way, the response is not only the production of individual skills, but also the
development of capable and quality contractors.
The property industry is booming with property prices shooting the roof at a very high pace.
Economists speculate that this is going to be the case for some time in the period towards 2010
after which the prices will stabilise. The increases in house (property) prices over the last few
years have been phenomenal. These increases have spurred even more demand for property,
which, in turn, have driven prices even higher. The average increase in the price of houses sold
(new and old) form 2000 to 2003 was 17% a year. During the first three quarters of 2004 it cost
17% more to build a new house than it did last year. According to ABSA‟s statistics, the average
cost of buying a new house in South Africa in 1993 was R434 303. It is obvious that a sharp
increase in house prices is being caused by activity in the market for higher- priced properties. It
seems that much of the purchase of houses in the high end of the housing [property] market,
especially new developments, is speculative. Properties are changing hands fairly often.
Confirming this assertion and making some speculation the CIDB report says that the high rate of
vacancies in the office buildings is also affecting the performance of non-residential sector. The
number of building plans approved by local authorities and the number of completed works
suggests that the building [property] sector will make a bigger contribution to GDP growth in the
short term. In short, the property industry is contributing a lot to economic development of the
country right now. However, the ownership patterns are reflective of a highly untransformed
industry. The vast section of the population is not participating and therefore not benefiting from
this boom. The introduction of the property charter provides a platform and a tool to transform the
industry.
With its huge property portfolio the department of Public Works is charged with the responsibility
to lead not transformation in the industry, but also use its property muscle to stimulate economic
development and beneficiation in the disadvantaged communities. Our strategies programme,
and systems are therefore geared towards realising this objective. However, once again, the
department is challenged in the areas of the requisite skills and capacity befitting the property
sector. The department is nonetheless engaged in aggressive recruitment drive to address this
challenge.

Department of Public Works – Vote 5 – Annual Report 2008/09
- 43 -
Overview of the organisational environment for 2008/09
The Department‟s core area of business falls within the construction industry. The same industry
is heavily impacted by a severe shortage of skills. This same constraint has remained a negative
force against which the department has laboured for the past few reporting years. The skills
shortage is both an internal and external force with an apparent impact on service providers to
the department and also scarcity of required skills within the department itself. During this time
the department has implemented various processes and plans to mitigate the effect of not having
access to all the required professional skills needed to properly fulfil the mandated
responsibilities. An overview of the extent of the problem can be seen in the table below which
clearly portrays the vacancies that exist within the current department, specific to the construction
industry are spread thinly across the many projects and processes which the department drives
annually. The department has in response to this challenge developed a turnaround strategy.
This strategy will reduce the vacancy rate significantly and 2009/10 will be a better year.
Staff Categories
Number Average Annual
Change 2007/08 2008/09 2009/10
Total Staff Compliment 1993 1854 0 0
Prof and Managerial Posts 193 405 0 0
Prof and Managerial Posts Filled 187 216 0 0
Number of excess staff 19 0 0 0
Vacancies Table
The department is also responsible for a portfolio of state properties which are currently used as
residential properties. Rentals derived from these properties are collected by the department and
handed over to the Provincial Treasury on a monthly basis. The department is currently struggling
with the management of the resulting debtor accounts for which no comprehensive BAS
integrated lease & debtor management system is currently available. Consequently, a mix of
system and manual processes are employed to provide an interim solution to the system gap.
The Department has functioned without a senior manager of finance for the 2008/09 financial
year. This has left a noticeable gap in the finance department with existing personnel having to
step in and fill the gap. The finance unit has managed to perform well considering the key
vacancy. The department has also functioned with an acting head of the department for the 2008-
09 financial year.

Department of Public Works – Vote 5 – Annual Report 2008/09
- 44 -
Policy development and legislative changes
The department has spent much of the year preparing itself for the implementation of the
Government Immovable Asset Management Act (GIAMA), Act 19 of 2007. Preparation for this
has included various projects aimed at raising the availability and quality of information regarding
the state property portfolio for which the department is responsible. Some of these projects are
still underway and will continue into the 2009-10 financial year. The department will be
continuously updating the quality and integrity of its information and information management
processes.
Collection of departmental revenue
The department has collected well against its budgeted revenue. These collections are comprised
of lease revenue, sale of tender documents and scrap. The majority of the revenue relates to
lease income derived from state properties currently subject to leases. The collections have
shown steady improvement over the past few years. As the department improves its information
base and processes, the collection rates improve. The department is aware that there is still
much room for improvement and is confident that its collections will continue to improve.
Departmental Own
Actual
Collections
R’000
Budget
Collections
R’000
% Deviation
from
2008/09 2008/09 Target
Non- tax revenue
(Rentals, Tender Documents, Scrap)
12 270
11 910
3%
TOTAL DEPARTMENTAL RECEIPTS 12 270 11 910 3%
Departmental expenditure
The total expenditure for the 2008/09 financial year was within 0.2% of the target budget. The
actual expenditure per programme is detailed in the table below:

Department of Public Works – Vote 5 – Annual Report 2008/09
- 45 -
Programmes
Voted for
2008/09
R’000
Roll-overs
and
adjustments
R’000
Virement
R’000
Total
voted
R’000
Actual
Expenditure
R’000
Variance
R’000
Administration 203 182 - 806 203 988 203 988 -
Public Works 739 221 - (314) 738 907 685 398 53 509
Community Based
Public Works
26 398 - (492) 25 906 25 906 -
Total 968 801 - - 968 801 915 292 53 509
Capital investment & maintenance
The nature of the mandate of the Department of Public Works requires that the focus of the
department be on capital projects. These projects include both new works and maintenance and
form the core of Programme 2. The target and performance of the Department with regards to
capital investment and maintenance relating to both own premises and the required agency
functions performed on behalf of the client department are discussed in detail in the detailed
performance tables.
Asset Management
Regarding immovable asset management, the asset register has been populated with an
additional 5 737 properties. Valuations (market and rental values) have been completed for 574
properties during the year under review. Information on provincial state functions (school, clinics,
hospitals, etc) has been consolidated by the respective user departments. The custodianship of
provincial immovable properties has been delegated on the 13th June 2007 to the honourable
MEC for Public Works. This is in line with other provincial governments. The centralization of the
provincial asset register and land administration functions will contribute towards the fast tracking
in the release of superfluous state land for development purposes. The Department has also
embarked to migrate to iE-Works and is playing a leading role in its development and role-out to
all provinces.

Department of Public Works – Vote 5 – Annual Report 2008/09
- 46 -
The department also refocused its role and responsibility in the intergovernmental Provincial
State Land Committee (PSLDC) and is playing a leading role in the Committee. The confirmation
of vesting through item 28(1) to the Constitution is a very high priority for the Department as it is
the building block for the verification of the asset register. The department is very much
concerned with the slow pace of issuing of the certificates by the National Department of Land
Affairs. The department has however committed itself to fast track the process and verified 1200
properties through the PSLDC for vesting purposes. The Eastern Cape Province is still the
second best after Kwazulu- Natal with the number of properties confirmed vested, but a lot of
work is still to be done, especially in the areas of the former Transkei where there is a large
pockets of unsurveyed state land.
Four of the draft land administration related policies that were developed by the Directorate:
Property Management was adopted by the GIAMA Task Team on Policy Development for the
development similar policies on a national level.
The procurement of office accommodation will in future be guided by the results of the User Asset
Management Plans of User Departments and the subsequent allocation of budget by Provincial
Treasury to the User Departments. The Department will continue to assist User Department with
the procurement of lease accommodation with regard to local and satellite offices, although the
budget for these short to medium term leases are with the User Departments.
The Department commenced with the introduction of the Property Incubator Programme (PIP) in
the Province. Through this fascinating programme, the Department contributes to the objectives
of the Property Transformation Charter, in assisting and promoting black ownership and
entrepreneurs in the property sector. A very successful Property Transformation Seminar was
held on 9 March 2009 in Port Elizabeth. Although the Department has a BEE percentage of 26%
in its expense lease portfolio, the MEC set a target of 50% BEE representation by the end of the
next Financial Year. A number of white landlords already reacted very positive to this initiative
and is in process of setting up partnerships or disposal transactions with prospective individuals
from the designated groups.
The asset register has currently 8 081 properties (as on 31 March 2009). Since April 2007 the
asset register was cleaned (through reconciliations and ad hoc verifications) in-house and the
number of properties increased from 1 130 to the current figure (an increase of 6 951 records).
This is 3 293 more properties as on 30 September 2008, when the honorable Premier included
the enhancement of the asset in his Provincial Turnaround Plan.

Department of Public Works – Vote 5 – Annual Report 2008/09
- 47 -
The Department is currently in process of adding the properties used by user department to the
asset register. In terms of the turnaround strategy the records of six User Departments will be
captured by the end of the Financial Year. It is anticipated that at least 11 600 records will be in
the asset register after the reconciliation process is completed.
The verification process commenced in 2007 with the reconciliation of data received from Land
Affairs (PUBLAND-database of 25 000 records). It has been established that at least 10 368
records (registered land) falls within the custodianship of the Province. This excluded unsurveyed
and unregistered land. Records of 15 600 properties from the National Department of Public
Works which were used for the payment of rates and taxes were also received and verified in-
house. At least 4 200 properties were found not to be provincial state land for various reasons
and the verification of this list is currently continuing.
The asset register fields are now 100% complaint with the minimum standards of National
Treasury. The current properties in the asset register are at least 40% compliant with the GIAMA
minimum standards – this is on target as per milestone by National Public Works. The asset
register is therefore also GRAP-compliant. The asset register fields have been extended to cater
for additional information, e.g. land claim data, vesting data, etc. The fields in the asset register
were increased from 47 to 137 in co-operation with SITA.
The confirmation of vesting in terms of Item 28(1) to Schedule 6 of the Constitution (Act 108 of
1996) is a constitutional obligation to confirm ownership of State land in ether the National or
Provincial Government. An asset register can only be truly completed once the vesting exercise is
completed. The Minister for Agriculture and Land Affairs is responsible for the issuing of such
vesting (ownership) Certificates. It is the building block of any asset register and a prerequisite
before any transaction can occur on a Title Deed. The completion of at least 50% of the vesting is
part of the exemption that was given by the Auditor-General to Provinces on immovable assets.
The Department has confirmed the status of vesting of the properties in the asset register by
verifying it against the updated vesting list received from Land Affairs (Directorate: Public Land
Support Services) in October. The current status is that approximately 40% of the properties in
the asset register is confirmed vested or in the process of being issued with Item 28(1)
Certificates.
The challenge remains for those properties located in the communal areas, where the slow
process of surveying and the implementation of the Communal Land Rights Act will delay vesting.
These processes are unfortunately not in control of the Department. The Department engaged
with Land Affairs to identify mechanisms and strategies to fast track the confirmation of vesting.

Department of Public Works – Vote 5 – Annual Report 2008/09
- 48 -
Since October only 64 signed Certificates were received back from the DLA. The slow process of
receiving signed Certificates is a matter of concern which requires political intervention. The
outstanding Item 28(1) Certificates have a severe negative impact on the enhancement of the
asset register and the delivery of land for development such as small town revitalization.
An electronic internet-based vesting system has now been developed by National Land Affairs in
an effort to fast track and monitor vesting applications. The Eastern Cape played an instrumental
role in the developing phases of this system through sharing best practices. According to DLA the
roll-out of the system will commence from 1 May 2009. The implementation thereof will assist the
Province to monitor delays in the vesting process and fast track the issuing of certificates, as the
draft certificates will be generated electronically.

Department of Public Works – Vote 5 – Annual Report 2008/09
- 49 -
PART 3: REPORT OF THE AUDIT COMMITTEE
Report of the Audit Committee for the year ended 31 March 2009
We are pleased to present our report for the financial year ended 31st March 2009
1. Audit Committee Members and Attendance.
Name of the members Number of meetings attended
Ms T. Fuzani (Chairperson) 3 of 3
Mr S Nxusani (Member) 3 of 3
Mr S. Zamisa (Member) 2 of 3
Mr Zamisa resigned as an audit committee member on 29th August 2008.
One closed meeting was also held with the Office of Auditor-General during the year under
review.
2. Audit Committee Responsibility
The Audit Committee adopted the Audit Committee Charter read in conjunction with the internal
audit charter, as its terms of reference in discharging all its responsibilities as regulated therein.
The charter stipulates that it will be updated annually; comply with principles of good governance,
requirements of the PFMA and the Treasury Regulations.
The audit committee has an oversight function with regards to:
Financial Management and other reporting practices,
Internal controls and management of risks
Compliance with laws and regulations
The external audit and
The internal audit function
3. Report on the operations of the Audit Committee
The audit committee reports that it has complied with the Public Finance Management Act
(PFMA) and National Treasury regulations.

Department of Public Works – Vote 5 – Annual Report 2008/09
- 50 -
4. Internal audit risk and Risk management
The internal audit function was not effective during year under review. Risk based 3 year rolling
and annual audit plan was not in place during the year under review due risk management
strategy and risk assessment methodology not being in place. However an interim audit plan that
was based on AG findings from the previous year, Audit intervention completed projects and
management request was in place and approved by the audit committee.
Fraud prevention strategy was also not in place during the year under review. This has been
subsequently approved by management.
Issues mentioned above were also brought to the attention of the MEC and Provincial Treasury.
CFO support is assisting in finalization of risk assessment strategy and risk identification. This
will be used to formulate a risk based 3 year rolling and annual audit plan.
Furthermore the Fraud, audit, and risk management committee was also not effective during the
year under review.
5. The Effectiveness of Internal Control
The Audit Committee is of the opinion, based on the information given by management, the
internal auditors and discussion with independent external auditors that there is a huge
improvement in internal controls of the department.
However there are still areas of concern in internal controls that the department has to improve
on.
The audit committee has drawn attention of the department to issues raised under significant
findings in the report of the Auditor General in the previous years. Management has committed in
addressing these issues.
The position of the CFO which was vacant for the better part of the year under review was also
filled in March 2009. This will contribute in improving financial internal controls within the
department.
The audit committee is committed in assisting the department in improving its internal controls.

Department of Public Works – Vote 5 – Annual Report 2008/09
- 51 -
6. Evaluation of Annual Financial Statements
The Audit Committee has:
Reviewed the annual financial statements to be included in the annual report
Reviewed changes in accounting policies and practices;
The audit committee is not in a position to either concur with or accept the conclusion of the
Auditor General on the financial statements as the final reports have not been discussed with the
Auditor General and Management
THEMBISA FUZANI
CHAIRPERSON
DATE: 29 MAY 2009

Department of Public Works – Vote 5 – Annual Report 2008/09
- 52 -
PART 4: ANNUAL FINANCIAL STATEMENTS
EASTERN CAPE
DEPARTMENT OF PUBLIC WORKS
VOTE 5
Annual Financial Statements For the year ended 31 March 2009

EASTERN CAPE DEPARTMENT OF PUBLIC WORKS
VOTE5
REPORT ON THE FINANCIAL STATEMENTS
for the year ended 31 March 2009
- 53 -
Report by the Accounting Officer to the Executive Authority and Provincial Legislature of the
Eastern Cape Province
The Department presents this report in terms of the Public Finance Management Act and relevant
Treasury Regulations. This report offers the Accounting Officer an opportunity to fully account on the
financial activities for the year under review and the results thereof that are contained in detail in the
Annual Report. The Annual Financial Statements have been prepared in terms of the Guide to the
preparation of Annual Reports and Specimen Annual Financial Statements issued by National
Treasury.
1. General review of the state of financial affairs
1.1 Government Immovable Asset Management Act (GIAMA)
GIAMA was enacted in the 2007/08 year, its real practical and operational implications have
taken effect during the year under review in terms of the three year implementation timeframe set
out by the Proclamation of the President in April 2009. In view of these implications the
department has taken strategic decisions to begin implementing the Act, although it only
becomes enforceable during the 2010/2011 financial year. These include the review of
improvements in institutional arrangement of the entire directorate, upgrading it to a chief
Directorate to allow for specialisation and greater focus. Six policies have since been reviewed
and aligned to be complaint with the Act, including the Disposal Policy.
The Department has continued to provide assistance to client departments in the development of
the User Asset Management Plans (U-AMPS) to enable the completion of the Provincial
Custodial Asset Management Plan, of which a key deliverable is the Provincial Asset Register.
This will contribute to the development of a comprehensive Infrastructure Maintenance Strategy.
The Department has completed 5 trial U-AMPS.
1.2 Devolution of Rates and Taxes
The National Department of Public Works has through the Division of Revenue Act (DORA),
devolved the payment of rates and taxes to the department. Challenges with regard to the
payment of rates and taxes on properties that were not registered, ownership that could not be
been verified and municipalities that are unable to invoice the Department has prevented the full

EASTERN CAPE DEPARTMENT OF PUBLIC WORKS
VOTE5
REPORT ON THE FINANCIAL STATEMENTS
for the year ended 31 March 2009
- 54 -
implementation of this conditional grant. The approval to apply a portion of the grant to
operational costs related to its implementation was not forthcoming and this impacted negatively
on progress.
In an attempt to address the above, the department is has developed a Policy on the Payment of
Rates and Taxes and is finalising Service Level Agreements with Local Municipalities on the
payment of Rates and Taxes. The service level agreements (SLA) aim to govern the relationship
between the department and municipalities in terms of the operational process of paying rates
and taxes for properties identified through the Devolution of Rates and Taxes Conditional Grant.
The SLA governs the payment of rates and taxes on properties that are not owned by the
province, although utilised by government and for properties that the individual municipalities
have not been able to invoice the department for to date. The SLA also governs the process that
leads to the turning off of water and electricity to provincial buildings in periods of dispute. This
approach will help resolve a number of blockages, and challenges that may inconvenience and
compromise service delivery programmes of each partner amicably.
1.3 Infrastructure Delivery
During the year under review the Provincial Executive Council took a decision that confirmed the
department of Public Works as a preferred infrastructure implementing agency in the province.
This resolution has placed Public Works as the leading partner to drive infrastructure delivery in
the province. This will be achieved through the continued implementation of the Infrastructure
Delivery Improvement Plan (IDIP). Public Works funding constraints, duplication of effort and
resources across departments are proving to be significant challenges for Public Works delivering
on its mandate. This means among other things, reviving engagements with the client
departments who have since established their own infrastructure delivery capacity, with a view to
have this capacity transferred to Public Works. This will ensure that capacity within Public Works
is enhanced.
As a first step, the beefing up of the department‟s own capacity, reviewing its recruitment and
retention strategies and the continued use of its Project Management Teams (PMT) will be further
addressed in pursuit of its expanded mandate.

EASTERN CAPE DEPARTMENT OF PUBLIC WORKS
VOTE5
REPORT ON THE FINANCIAL STATEMENTS
for the year ended 31 March 2009
- 55 -
1.4 Transformation of the Property Industry
In line with the national programme to transform the property industry, the department is
implementing the Property Incubator Programme. This is a programme meant to develop
emerging property owners wherein the department is aiming at enforcing ownership and/ or
partnership in this industry through its lease portfolio. The department is finalising recruitment for
the first intake of the Property Incubator Programme. In terms of this programme there will be no
more leases or renewals for landlords who are not BEE Compliant.
The Department has, and will continue to convene Property Conferences to develop a
comprehensive strategy to address challenges in its attempts to transform the sector.
1.5 Office Accommodation for Client Departments
Public Works continues to champion the Strategic Government Accommodation initiatives which
seek to provide adequate accommodation to client departments while at the same time
contributing to the economic development of key nodes within underdeveloped towns in the
province.
The provision of office space is a major challenge for the department and indeed for the entire
provincial government. Various options are explored to resolve this challenge; key among these
is enforcing proper space planning. To achieve this, the department is finalising all departments
office space needs plans for the MTEF period. This also includes rationalising and reorganising
office accommodation according to the new developments. To pursue the long term solution for
space provision, the departments will once again present to EXCO the feasibility study for Bhisho
Government Complex (PPP) and Mt Ayliff One-Stop-Centre.
1.6 Transfer of the Roads function to Public Works Functions
The incumbent provincial administration has taken a decision to reconfigure departments. In
terms of this reconfiguration, the department of Public Works will be merged with Roads.
A Joint Task Team chaired by the Head of the recipient department, supported by the Provincial
Treasury and the Office of the Premier will facilitate the seamless migration of the departments to
the desired state.

EASTERN CAPE DEPARTMENT OF PUBLIC WORKS
VOTE5
REPORT ON THE FINANCIAL STATEMENTS
for the year ended 31 March 2009
- 56 -
1.7 Significant events that have taken place during the year
The Property Incubator Programme is meant to develop emerging property owners wherein the
department is aiming at enforcing ownership and/ or partnership in this industry through its lease
portfolio. The department is finalising recruitment for the first intake of the Property Incubator
Programme.
Public Works organised a Provincial Contractors Conference. The conference resolutions were
used to inform programmes that would facilitate the development of contractors in the province.
1.8 Major projects undertaken or completed during the year
Project Status Location
EC legislature Chamber Complete Bhisho
Pick „n Pay Building
converted to office
accommodation
Complete Bhisho
State House phase 1 Complete Bhisho
Amathole Office Block A Complete East London
UKhahlamba Regional Office Complete Sterkspruit
1.9 Spending Trends
The spending trends for the financial year can be summarised as follows:
Programme 2008/2009 2008/2009 Difference Difference
Reasons for Over/Under Expenditure
R’000 R’000 R’000 % R’002
Budgeted Actual
Administration 203,988 203,988 0 100% None
Public Works 738,907 685,398 53,509 93%
The Devolution of Rates and Taxes Conditional
Grant will be rolled over to the next financial year.
The overspend on HRoPT cases has reduced the underspend amount on
the programme
Community Based Public Works Programme
25,906 25,906 0 100% None
Total 968,801 915,292 610,627 94%

EASTERN CAPE DEPARTMENT OF PUBLIC WORKS
VOTE5
REPORT ON THE FINANCIAL STATEMENTS
for the year ended 31 March 2009
- 57 -
The comparison to prior year budgets can be summarised below:
Programme 2008/2009 2008/2009 2007/2008 Reasons for increase in budget allocation
R’000 R’000 R’000
Budgeted Actual Actual
Administration 203,988 203,988 156,426
The HRoPT allocation for the financial year has resulted in the
increased budget for the programme
Public Works 738,907 685,398 432,645
The Devolution of Rates and Taxes Conditional Grant, PPP funds and
the increased Accommodation Lease Expenditure has resulted in
the increased budget for the financial year
Community Based Public Works Programme 25,906 25,906 21,556
The increased focus on Accelerated Professional and Trade
Competencies Development (AptCoD) students has resulted in
the increased budget for the financial year
Total 968,801 915,292 610,627
Revenue
The departmental revenue collection budget was increased by 28% over the last financial year‟s
budget and the department through the initiation of the implementation of market related rentals
and the enforcement of escalations has marginally exceeded the budget by R360k.
Bank overdraft
The department has made exceptional progress this financial year in reducing its overdraft
position from R62,901k in the 2007/08 financial year to R3,619k in the 2008/09 financial through
sound financial governance.

EASTERN CAPE DEPARTMENT OF PUBLIC WORKS
VOTE5
REPORT ON THE FINANCIAL STATEMENTS
for the year ended 31 March 2009
- 58 -
Virement
Virements of R 5,177k was made between programme 2 „Public Works‟ and Programme 3
„Community Based Public Works Programme‟. The first virement of R4 371k was to shift the
budget for the payment of stipend for APTCoD students which was originally allocated as part of
projects budget in programme 2 to programme 3 compensation of employees where this
programme is managed. The application to shift the funds was included as part of adjustment
estimate which was tabled by the Provincial Treasury to Legislature. The second virement, in the
amount of R806k was undertaken to shift funds from Programme 2&3 to Programme 1 to defray
over-expenditure.
2. Service rendered by the department
2.1 In line with the core functions and responsibilities the main services rendered by the
department include the following;
1. Provision of technical support and technical advisory support, project and contracts
management services to and on behalf of client departments. This service includes
quality control through provision of inspectorate services.
2. Give assistance to client departments in respect of routine and planned maintenance.
3. Acquisition and disposal of State owned properties through efficient negotiating and
management of leases on behalf of government departments.
4. Provide coordinating support to the implementation of the Expanded Public Works
Programme (EPWP)
5. Coordinate initiatives and programmes that would contribute towards the transformation
of the Construction of Property Industries.
6. Provide assistance to the emerging businesses in the construction and property sectors
towards their growth and development.
7. In carrying out its mandate, the Department of Public Works embodies the following
values
8. Employees‟ diversity and the continuous development
9. Professional and excellent customer service
10. Upholding and promotion of Batho Pele Principles

EASTERN CAPE DEPARTMENT OF PUBLIC WORKS
VOTE5
REPORT ON THE FINANCIAL STATEMENTS
for the year ended 31 March 2009
- 59 -
2.2 Tariff policy
The department has been involved in the process to ensure that the cabinet decision of 2001 on
property rentals is implemented in context of GIAMA. The department maintains a tariff register
and is subject to update as the property registers are improved with new valuation information.
2.3 Free Services
There were no free services provided by the department during the year under review.
2.4 Inventories
The total inventories on hand at the close of the financial year was R1 689k from a previous year
figure of R1380k.
3. Capacity constraints
Capacity Constraints have been felt within the department throughout the year as budget has not
been available to fill established posts. The mandate from EXCO that the department extend its
scope from office accommodation to the preferred implementer of choice for the province in terms
of infrastructure has also exacerbated the capacity strain on the department.
Further to this the unfunded mandates of GIAMA and Devolution of Rates and Taxes has resulted
in severe capacity constraints for this financial year and for further financial years.
Further to this the shortage of contractors at the CIDB grades 4 to 9 within the construction
industry remains a concern to the department.
4. Utilisation of donor funds
No donor funds were used during the 2008/09 financial year.
5. Trading entities and public entities
The Department has no trading or public entity obligations nor does it have any listed or unlisted
investments/entities.

EASTERN CAPE DEPARTMENT OF PUBLIC WORKS
VOTE5
REPORT ON THE FINANCIAL STATEMENTS
for the year ended 31 March 2009
- 60 -
6. Organisations to whom transfer payments have been made
The Devolution of Property Rates Grant was received by the Department for the first time in the
current financial year and amounted to R 119,638k of which R60 100k was paid to municipalities.
This presented implementation challenges for the Department as it was an unfunded mandate.
The Department was therefore unable to build the required capacity to administer the grant and
had to utilise the resources available.
At financial year end ten of the municipalities had not yet invoiced the Department for a variety of
reasons. The bulk of the under expenditure amounting to R 57,066k has been requested to be
rolled over to 2010 financial year. Included in this figure is an amount of R 13,000k for
Compensation of Employees and Goods and Services. Should this figure of R 13,000k be
approved it will greatly assist the Department in fast tracking the expenditure on the grant.
The table below contains a list of amounts paid to municipalities at financial year end.
Municipality Paid
R’000
Baviaans 223
Blue Crane Route 688
Buffalo City 22,276
Cacadu 10
Camdeboo 888
Engcobo 26
Ingquza 456
Inkwanca 204
Intsika Yethu 89
Inxuba Yethemba 1,411
King Sabata
Dalindyebo 12,381
Kouga 601
Koukamma 10
Lukhanji 2,079
Makana 2,605
Maletswai 242
Mnquma 274

EASTERN CAPE DEPARTMENT OF PUBLIC WORKS
VOTE5
REPORT ON THE FINANCIAL STATEMENTS
for the year ended 31 March 2009
- 61 -
Municipality Paid
R’000
Ndlambe 176
Nelson Mandela Bay 13,956
Nkonkobe 1,065
Port St Johns 12
Sundays River Valley 207
Tsolwana 60
Umzimvubu 71
Total 60,010
7. Public private partnerships (PPP)
The Bhisho- King Williamstown revitalisation programme was enhanced with cabinet approval of
a PPP proposal and its registration with National Treasury. The PPP proposal includes the
funding of a Bhisho Government Office Park as a part of the Bhisho Development precinct.
Following the signing of the PPP terms of reference with the Transactional Advisor in February
2008, the following has been delivered to the department by the project team:
1. Needs Assessment Report has been completed
2. Options Analysis Report has been complete
3. The full feasibility study report will be presented to EXCO within the first quarter of the
new financial year
8. Corporate governance arrangements
Corporate Governance has been further enhanced during the financial year with the appointment
of a Head of Internal Audit. Internal Audit has played a significant role in the supporting internal
controls and the development and implementation of the Audit Intervention Plan.
The Audit Committee periodically meets with management, external auditors and internal
auditors. The Audit Committee has a written charter and terms of reference approved by the
Head of Department and has substantively fulfilled its mandate this year. Risk management plans
are drawn up and progress is monitored against these plans continually. Risk Assessment
workshops were conducted with all directorates to promote a proactive culture and accountability
with respect to risks. An ongoing process for identifying, evaluating and managing the significant
risks faced by the department has been in place for the year ended 31 March 2009.

EASTERN CAPE DEPARTMENT OF PUBLIC WORKS
VOTE5
REPORT ON THE FINANCIAL STATEMENTS
for the year ended 31 March 2009
- 62 -
Management structures are also functional with Top Management, Senior Management Services,
Budget and Expenditure Committee, Budget Advisory Committee and Supply Chain Management
Committees fully functional.
9. Discontinued activities/activities to be discontinued
No programmes were discontinued during the year.
10. New/proposed activities
New Activity Cost Implication
Implementation of GIAMA This is currently an unfunded mandate and the department has
engaged ECPT and NPW for adequate funding for the
implementation of the mandate. Preliminary estimates indicate that
costs of implementation for the next two financial years will be
approximately R55 000k
Implementation of Devolution of
Rates and Taxes
This is currently an unfunded mandate and the department has
engaged ECPT and NPW for adequate funding for the
implementation of the mandate. Preliminary estimates indicate that
costs of implementation for the next two financial years will be
approximately R30 000k
11. Asset management
The movable asset register is GRAP compliant and complete and meets with the minimum
requirements set by National Treasury. The custodial asset register for the province has not been
fully updated as the implementation of GIAMA will become enforceable in the 2010/2011 financial
year for all provincial departments
12. Events after the reporting date
Merger of DPW and Road Function The merger will require new office
accommodation and a due diligence will be
needed to be undertaken to quantify the
financial requirements of the proposed

EASTERN CAPE DEPARTMENT OF PUBLIC WORKS
VOTE5
REPORT ON THE FINANCIAL STATEMENTS
for the year ended 31 March 2009
- 63 -
merger
Request for the approval of the Roll-over of
the unspent portion of the Rates and Taxes
Conditional Grant
Due to the differing financial year-ends
between the department and the
municipalities, claims for the 08/09 rates and
taxes is still being received. Furthermore, the
need for the approval that a portion of the
grant be used for the operational costs linked
to the implementation of the grant.
13. Performance information
Good corporate governance requires that the department plan effectively, monitor performance
fairly and report accurately. The department has refined its goals and focussed on improved
alignment with well conceived and established objectives. The department has also managed to
develop a Performance Measurement Framework. This framework is in line with the treasury
reporting framework and further tracks implementation of departmental priorities. The framework
also outlines dataflow within the department as well as the integrated performance monitoring
role of finance and M&E. These changes have already shown positive results with improved
planning, performance measurement and reporting. Going forward, the framework will be
completed by the planning and budgeting framework which has just been finalised.
14. SCOPA resolutions
There were no SCOPA resolutions
15. Prior modifications to audit reports
Following the audit outcome for the financial year 2007-2008 a series of debriefs were held with
various roles players including the Auditor General. The preliminary planning for the audit process
for the financial year 2008-2009 began in August 2008 with a 2 day which included the MEC –
DPW and the Provincial Auditor - OAG.
Following the process undertaken above detailed plans have been finalised for the following
areas.

EASTERN CAPE DEPARTMENT OF PUBLIC WORKS
VOTE5
REPORT ON THE FINANCIAL STATEMENTS
for the year ended 31 March 2009
- 64 -
Financial
Management
Supply Chain Management Property Management Transversal Projects
Journal
Management
Movable Asset Management
Immovable Asset
Management
Document
Management
Debtor Management
Retention of Exemption
Expense Lease
AFS Compilation Rates and Taxes
Management
Audit Management Revenue Management
These detailed plans focus on both the audit intervention and the process to be followed in the
forthcoming year.
To manage the implementation of the projects as identified, committees have been formed.
The following committee‟s have been formed to manage the Audit Intervention Programme:
Audit Steering Committee
The Audit Steering Committee‟s role will be the strategic management of the audit intervention.
The responsibilities of the Audit Steering Committee will be:
1. To mediate a resolution on any interpretation issues between the Auditor General and the
Department
2. To manage and resolve any disputes between the Auditor General and the Department
3. To review progress and give strategic direction where necessary in terms of the audit to
date
4. To remove risks and issues identified by the operational committee timeously so as not
effect deliverable timetables
5. To sample progress within projects through the internal audit function against reported
progress
6. To address matters of non performance or under performance immediately
Audit Intervention Project Committee
The Audit Intervention Project Committee will report to the Audit Steering Committee both on an
adhoc basis as well as formally at the monthly meetings of the Audit Steering Committee.
The Audit Intervention Project Committee will be by members who will be appointed by the
General Management of the Relevant Programs.
The Audit Intervention Project Committee (AIPC) will be responsible for the following:
1. Implementation of the projects identified above

EASTERN CAPE DEPARTMENT OF PUBLIC WORKS
VOTE5
REPORT ON THE FINANCIAL STATEMENTS
for the year ended 31 March 2009
- 65 -
2. Responding to the Auditor General‟s (AG) Requests for Information (RFI‟s)
3. Management of internal resources and documentation management requirements for the
audit
4. Daily interaction with the AG
5. Representation on the Audit Working Committee
The Audit Technical Working Committee (AWC)
The Audit Technical Working Committee (AWC) will be responsible for the interaction and
relationship management with the Auditor General. The AWC will interact directly with the Audit
Manager and his delegates.
The AWC will be responsible for the following:
1. Ensuring operational differences between the department and the AG are resolved
2. Managing the relationship with AG to aid in a smooth audit for both parties
3. Responding to both audit and housekeeping requests of the AG
4. Resolve operational issues relating to availability of documentation timeously
16. Exemptions and deviations received from the National Treasury
The National Treasury issued an exemption to all Public Works Departments within South Africa
on the 16 May 2008 for a period of three financial years aimed at the implementation of GIAMA
and the development of Provincial Asset Registers by provincial Departments of Public Works.
The exemption has onerous milestones laid out that the departments needed to meet to ensure
that the exemption is retained. The impact of the exemption has meant that the Asset Register
would not be audited for the current financial year provided certain milestones were met. In terms
of the exemption milestones, the Department has committed itself to attaining these milestones
and submitted an application for the retention of the exemption to National Treasury via the
Eastern Cape Provincial Treasury.
In response to the application the National Treasury issued a letter dated to 31 March, headed
ACCOUNTING AND DISCLOSURE OF IMMOVABLE ASSETS FOR THE 2008/09 FINANCIAL
YEAR, received 7 May 2009 by the department. The content of the letter has resulted in a
dramatic change of scope for the Departments of Public Works to retain the exemption in terms of
disclosure. The National Treasury now requires a full disclosure of the custodial asset register for
this financial year. These new disclosure requirements are further exacerbated by National
Treasury‟s not issuing Accounting Policies and more critically the valuation models required to
update the Asset Registers of the provincial departments in terms of the future implementation of
GIAMA.

EASTERN CAPE DEPARTMENT OF PUBLIC WORKS
VOTE5
REPORT ON THE FINANCIAL STATEMENTS
for the year ended 31 March 2009
- 66 -
Coupled to National Treasury not delivering the valuation models for the valuation of fixed assets
it is believed that the Provincial Department will not be able to fulfil the new disclosure
requirements and thus will not be able be able to retain the exemption. This will result in the
Department receiving a qualified audit report for the financial year of 2008/09 if the current view of
GIAMA implementation is enforced by National Treasury.
These issues that would result in us not being able to achieve the revised requirements as per
the National Treasury letter has been communicated proactively to the Eastern Cape Treasury as
per the prescripts of the PFMA. In light of the real implementation issues highlighted above the
department thus aligned itself with meeting the milestone objectives for the financial year in
review even though the GIAMA mandate remained unfunded. We believe that we have achieved
all milestones that are within the provinces sphere of influence. However in accordance with the
new requirements emanating from the National Treasury the need to disclose all assets that are
custodially verified to belong to the province in an asset register is unrealistic as the disclosure
requires a valuation which needs to be based on an approved valuation model which has not
been forthcoming from the National Treasury.
Due to the Government Infrastructure Asset Management Act (GIAMA) being operationalised
provincially in the 2010/2011 financial year the department for the current financial year has
reverted back to the Governing Legislation in terms of Disclosure of Immovable Assets, the
Generally Recognized Accounting Principles (GRAP) and specifically GRAP (17)(11).
17. Other
None.
18. Approval
The Annual Financial Statements set out on pages 17 to 66 have been approved by the
Accounting Officer.
………………………………
B. Gxilishe
Acting Head of Department
29 May 2009

EASTERN CAPE DEPARTMENT OF PUBLIC WORKS
VOTE5
REPORT ON THE FINANCIAL STATEMENTS
for the year ended 31 March 2009
- 67 -
Report of the Auditor-General

EASTERN CAPE DEPARTMENT OF PUBLIC WORKS
VOTE5
APPROPRIATION STATEMENT
for the year ended 31 March 2009
- 68 -
Appropriation Statement
Appropriation per programme
2008/09 2007/08
APPRORIATION STATEMENT Adjusted
Appropriation
Shifting of
Funds
Virement Final
Appropriation
Actual
Expenditure
Variance Expenditure
as % of
final
appropriation
Final
Appropriation
Actual
Expenditure
R'000 R'000 R'000 R'000 R'000 R'000 % R'000 R'000
1. Administration
Current payment 193,187 390 804 194,381 194,381 - 100% 144,571 145,682
Transfers and subsidies 5,053 (395) - 4,658 4,658 - 100% 6,936 7,697
Payment for capital assets 3,614 28 2 3,644 3,644 - 100% 4,195 2,095
2. Public Works
Current payment 575,262 - (744) 574,518 581,208 (6,690) 101.2% 420,489 418,688
Transfers and subsidies 120,638 - (139) 120,499 60,871 59,628 50.5% - 59
Payment for capital assets 43,321 - 569 43,890 43,319 571 98.7% 12,965 13,898
3. Community Based Public
Works Programme
Current payment 26,398 - (492) 25,906 25,906 - 100% 21,576 21,540
Payment for capital assets - - - - - - - 100 16
Subtotal 967,473 23 - 967,496 913,987 53,509 94.5% 610,832 609,675
Statutory Appropriation
Current payment 1,328 (23) - 1,305 1,305 - 100% 880 926
TOTAL 968,801 - - 968,801 915,292 53,509 94.5% 611,712 610,601

EASTERN CAPE DEPARTMENT OF PUBLIC WORKS
VOTE5
APPROPRIATION STATEMENT
for the year ended 31 March 2009
- 69 -
2008/09 2007/08
Final
Appropriation
Actual
Expenditure
Final
Appropriation
Actual
Expenditure
Reconciliation with statement of financial performance
ADD
Departmental receipts 360 - 2,474 -
Actual amounts per statement of financial performance (total revenue) 969,161 614,186
Actual amounts per statement of financial performance (total expenditure) 915,292 610,601

EASTERN CAPE DEPARTMENT OF PUBLIC WORKS
VOTE5
APPROPRIATION STATEMENT
for the year ended 31 March 2009
- 70 -
Appropriation per economic classification
2008/09 2007/08
Adjusted
Appropriation
Shifting of
Funds
Virement Final
Appropriation
Actual
Expenditure
Variance Expenditure
as % of final
appropriation
Final
Appropriation
Actual
expenditure
R'000 R'000 R'000 R'000 R'000 R'000 % R'000 R'000
Current payments
Compensation of employees 318,135 22 (105) 318,052 322,837 (4,785) 101.5% 241,134 241,236
Goods and Services 476,712 368 (327) 476,753 477,214 (461) 100.1% 345,502 344,674
Financial transactions in assets and
liabilities
- - 571 571 1,444 (873) 252.9% - -
Transfers and subsidies
Provinces & Municipalities 119,638 - 119,638 60,010 59,628 50.2% - 9
Households 6,053 (395) (139) 5,519 5,519 - 100% 6,936 7,747
Payments for capital assets
Buildings and other fixtures - 39,194 - 39,194 39,194 - 100% 12,282 13,644
Machinery and Equipment 46,935 (39,166) - 7,769 7,769 - 100% 4,978 2,365
Total 967,473 23 - 967,496 913,987 53,509 94.5% 610,832 609,675
Statutory Appropriation
2008/09 2007/08
Direct changes against the
National/Provincial Revenue Fund
Adjusted
Appropriation
Shifting of
Funds
Virement Final
Appropriation
Actual
Expenditure
Variance Expenditure
as % of final
appropriation
Final
Appropriation
Actual
expenditure
R'000 R'000 R'000 R'000 R'000 R'000 % R'000 R'000
Member of executive committee /
parliamentary officers
1,328
(23)
-
1,305
1,305
-
100%
880
926
Total 1,328 (23) - 1,305 1,305 - 100% 880 926

EASTERN CAPE DEPARTMENT OF PUBLIC WORKS
VOTE5
APPROPRIATION STATEMENT
for the year ended 31 March 2009
- 71 -
Detail per Programme 1 – Administration
2008/09 2007/08
Detail per sub-programme Adjusted
Appropriation
Shifting of
Funds
Virement Final
Appropriation
Actual
Expenditure
Variance Expenditure
as % of final
appropriation
Final
Appropriation
Actual
expenditure
R'000 R'000 R'000 R'000 R'000 R'000 % R'000 R'000
1.1 Office of the MEC
Current payment 2,275 519 381 3,175 3,175 - 100% 2,557 3,200
Payment for capital assets - - - - - - - 76 -
1.2 Management
Current payment 72,157 (2,013) - 70,144 70,144 - 100% 63,613 61,367
Transfers and subsidies - 160 - 160 160 - 100% - 146
Payment for capital assets 2,009 (205) - 1,804 1,804 - 100% 1,578 756
1.3 Corporate Support
Current payment 118,755 1,884 423 121,062 121,062 - 100% 78,401 81,115
Transfers and subsidies 5,053 (555) - 4,498 4,498 - 100% 6,936 7,551
Payment for capital assets 1,605 233 2 1,840 1,840 - 100% 2,541 1,339
Total 201,854 23 806 202,683 202,683 - 100% 155,702 155,474

EASTERN CAPE DEPARTMENT OF PUBLIC WORKS
VOTE5
APPROPRIATION STATEMENT
for the year ended 31 March 2009
- 72 -
Detail per Programme 1 – Administration
2008/09 2007/08
Economic classification Adjusted
Appropriation
Shifting of
Funds
Virement Final
Appropriation
Actual
Expenditure
Variance Expenditure
as % of final
appropriation
Final
Appropriation
Actual
expenditure
R'000 R'000 R'000 R'000 R'000 R'000 % R'000 R'000
Current payments
Compensation of employees 125,098 22 - 125,120 125,120 - 100% 85,593 85,933
Goods and services 68,089 368 804 69,261 69,261 - 100% 58,978 59,749
Transfers and subsidies
Provinces and municipalities - - - - - - - - 9
Households 5,053 (395) - 4,658 4,658 - 100% 6,936 7,688
Payments for capital assets
Buildings and other fixed structures - - - - - - - - 3
Machinery and equipment 3,614 28 2 3,644 3,644 - 100% 4,195 2,092
Total 201,854 23 806 202,683 202,683 - 100% 155,702 155,474

EASTERN CAPE DEPARTMENT OF PUBLIC WORKS
VOTE5
DETAIL PER PROGRAMME
for the year ended 31 March 2009
- 73 -
Detail per Programme 2 – Public Works
2008/09 2007/08
Detail per sub-programme Adjusted
Appropriation
Shifting of
Funds
Virement Final
Appropriation
Actual
Expenditure
Variance Expenditure
as % of final
appropriation
Final
Appropriation
Actual
expenditure
R'000 R'000 R'000 R'000 R'000 R'000 % R'000 R'000
2.1 Programme Office Support
Current payment 6,002 - (350) 5,652 11,166 (5,514) 197.6% 5,633 6,329
Payment for capital assets 43,321 (929) 569 42,961 42,390 571 98.7% 630 614
2.2 Property
Current payment 161,165 (1,326) (394) 159,445 159,445 - 100% 146,364 146,454
Transfers and subsidies 120,638 (37) (139) 120,462 60,834 59,628 50.5% - 59
Payment for capital assets - - - - - - - 2,598 3,568
2.3 Security
Current payment 408,095 1,326 - 409,421 410,597 (1,176) 100.3% 268,492 265,905
Transfers and subsidies - 37 - 37 37 - 100% - -
Payment for capital assets - 929 - 929 929 - 100% 9,737 9,716
Total 739,221 - (314) 738,907 685,398 53,509 92.8% 433,454 432,645

EASTERN CAPE DEPARTMENT OF PUBLIC WORKS
VOTE5
DETAIL PER PROGRAMME
for the year ended 31 March 2009
- 74 -
Detail per Programme 2 – Public Works
2008/09 2007/08
Economic classification Adjusted
Appropriation
Shifting of
Funds
Virement Final
Appropriation
Actual
Expenditure
Variance Expenditure
as % of final
appropriation
Final
Appropriation
Actual
expenditure
R'000 R'000 R'000 R'000 R'000 R'000 % R'000 R'000
Current payments
Compensation of employees 172,800 - 29 172,829 177,614 (4,785) 102.8% 146,343 146,050
Goods and services 402,462 - (773) 401,689 402,150 (461) 100.1% 274,146 272,638
Financial transactions in assets and liabilities
-
-
571
571
1,444
(873)
252.9%
-
-
Transfers and subsidies to:
Provinces and municipalities 119,638 - - 119,638 60,010 59,628 50.2% - -
Households 1,000 - (139) 861 861 - 100% - 59
Payment for capital assets
Buildings and other fixed structures - 39,194 - 39,194 39,194 - 100% 12,282 13,641
Machinery and equipment 43,321 (39,194) (2) 4,125 4,125 - 100% 683 257
Total 739,221 - (314) 738,907 685,398 53,509 92.8% 433,454 432,645

EASTERN CAPE DEPARTMENT OF PUBLIC WORKS
VOTE5
DETAIL PER PROGRAMME
for the year ended 31 March 2009
- 75 -
Detail per Programme 3 – Community Based Public Works Programme
2008/09 2007/08
Detail per sub-programme Adjusted
Appropriation
Shifting of
Funds
Virement Final
Appropriation
Actual
Expenditure
Variance Expenditure
as % of final
appropriation
Final
Appropriation
Actual
expenditure
R'000 R'000 R'000 R'000 R'000 R'000 % R'000 R'000
3.1 Programme Office Support
Current payment 26,398 - (492) 25,906 25,906 - 100% 21,576 21,540
Payment for capital assets - - - - - - - 100 16
Total 26,398 - (492) 25,906 25,906 - 100% 21,676 21,556
Detail per Programme 3 – Public Works Programme
2008/09 2007/08
Economic classification Adjusted
Appropriation
Shifting of
Funds
Virement Final
Appropriation
Actual
Expenditure
Variance Expenditure
as % of final
appropriation
Final
Appropriation
Actual
expenditure
R'000 R'000 R'000 R'000 R'000 R'000 % R'000 R'000
Current payments
Compensation of employees 20,237 - (134) 20,103 20,103 - 100% 9,198 9,253
Goods and services 6,161 - (358) 5,803 5,803 - 100% 12,378 12,287
Payment for capital assets
Machinery and equipment - - - - - - - 100 16
Total 26,398 - (492) 25,906 25,906 - 100% 21,676 21,556

EASTERN CAPE DEPARTMENT OF PUBLIC WORKS
VOTE5
NOTES TO THE APPROPRIATION STATEMENT
at ended 31 March 2009
- 76 -
Notes to the Appropriation Statement
1. Detail of transfers and subsidies as per Appropriation Act (after Virement):
Detail of these transactions can be viewed in note 7 (Transfers and subsidies) and
Annexure 1 (A-C) to the Annual Financial Statements.
2. Detail of specifically and exclusively appropriated amounts voted (after Virement):
Detail of these transactions can be viewed in note 1 (Annual Appropriation) to the Annual
Financial Statements.
3. Detail on financial transactions in assets and liabilities
Detail of these transactions per programme can be viewed in note 6 (Financial transactions in
assets and liabilities) to the Annual Financial Statements.
4. Explanations of material variances from Amounts Voted (after Virement):
4.1 Per Programme Final
Appropriation
Actual
Expenditure
Variance
R’000
Variance as a % of
Final Appropriation
Programme 1:
Administration
202,683 202,683 - 0%
No material variance
Programme 2: Public Works 738,907 685,398 53,509 7%
Payment of rates and taxes to municipalities can only be made once ownership, existence and value have
been established. 15,000 properties were devolved from National Public Works and the Department is
systematically verifying the properties. The financial year of municipalities and provincial government differ
as the municipal financial year only closes on 30 June of each year. As a result invoicing takes place late in
the financial year and at year end 10 municipalities had not yet invoiced the department for rates and taxes.
The department has applied for a roll over of the conditional grant.
Programme 3: Community
Based Public Works
Programme
25,906 25,906 - 0%
No material variance

EASTERN CAPE DEPARTMENT OF PUBLIC WORKS
VOTE5
NOTES TO THE APPROPRIATION STATEMENT
at ended 31 March 2009
- 77 -
4.2 Per Economic classification Final
Appropriation
Actual
Expenditure
Variance Variance as a
% of Final
Appropriation
R’000 R’000 R’000 R’000
Current payments:
Compensation of employees 318,052 322,837 (4,785) (2)%
Goods and services 476,753 477,214 (461) 0%
Financial transactions in assets and
liabilities
571 1,444 (873) (153)%
Transfers and subsidies:
Provinces and municipalities 119,638 60,010 59,628 50%
Households 5,519 5,519 - 0%
Payments for capital assets:
Buildings and other fixed structures 39,194 39,194 - 0%
Machinery and equipment 7,769 7,769 - 0%

EASTERN CAPE DEPARTMENT OF PUBLIC WORKS
VOTE5
STATEMENT OF FINANCIAL PERFORMANCE
for the year ended 31 March 2009
- 78 -
Note 2008/09 2007/08
R'000 R'000
REVENUE
Annual appropriation 1 967,496 610,832
Statutory appropriation 2 1,305 880
Departmental revenue 3 360 2,474
TOTAL REVENUE 969,161 614,186
EXPENDITURE
Current expenditure
Compensation of employees 4 324,142 242,162
Goods and services 5 477,214 344,674
Financial transactions in assets and liabilities 6 1,444 -
Total current expenditure 802,800 586,836
Transfers and subsidies 65,529 7,756
Transfers and subsidies 7 65,529 7,756
Expenditure for capital assets
Tangible capital assets 8 46,963 16,009
Total expenditure for capital assets 46,963 16,009
TOTAL EXPENDITURE 915,292 610,601
SURPLUS/(DEFICIT) FOR THE YEAR 53,869 3,585
Reconciliation of Net Surplus/(Deficit) for the year
Voted funds 53,509 1,111
Departmental revenue 13 360 2,474
SURPLUS/(DEFICIT) FOR THE YEAR 53,869 3,585

EASTERN CAPE DEPARTMENT OF PUBLIC WORKS
VOTE5
STATEMENT OF FINANCIAL POSITION
at ended 31 March 2009
- 79 -
Note 2008/09 2007/08
R'000 R'000
ASSETS
Current assets 37,849 38,493
Fruitless and wasteful expenditure 10 30,543 30,543
Receivables 11 7,306 7,950
TOTAL ASSETS 37,849 38,493
LIABILITIES
Current liabilities 37,849 38,493
Voted funds to be surrendered to the Revenue Fund 12 25,650 (27,859)
Departmental revenue to be surrendered to the
Revenue Fund
13 1,464 (1,339)
Bank overdraft 14 3,619 62,901
Payables 15 7,116 4,790
TOTAL LIABILITIES 37,849 38,493
NET ASSETS - -
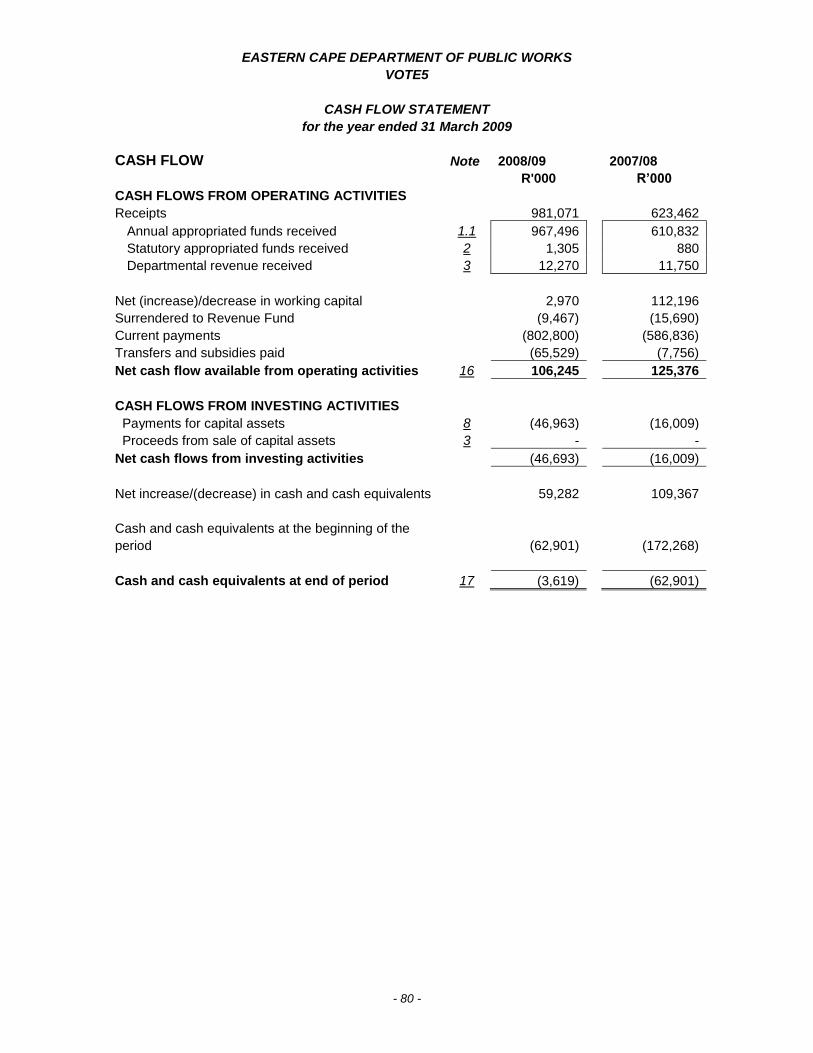
EASTERN CAPE DEPARTMENT OF PUBLIC WORKS
VOTE5
CASH FLOW STATEMENT
for the year ended 31 March 2009
- 80 -
CASH FLOW Note 2008/09 2007/08
R'000 R’000
CASH FLOWS FROM OPERATING ACTIVITIES
Receipts 981,071 623,462
Annual appropriated funds received 1.1 967,496 610,832
Statutory appropriated funds received 2 1,305 880
Departmental revenue received 3 12,270 11,750
Net (increase)/decrease in working capital 2,970 112,196
Surrendered to Revenue Fund (9,467) (15,690)
Current payments (802,800) (586,836)
Transfers and subsidies paid (65,529) (7,756)
Net cash flow available from operating activities 16 106,245 125,376
CASH FLOWS FROM INVESTING ACTIVITIES
Payments for capital assets 8 (46,963) (16,009)
Proceeds from sale of capital assets 3 - -
Net cash flows from investing activities (46,693) (16,009)
Net increase/(decrease) in cash and cash equivalents 59,282 109,367
Cash and cash equivalents at the beginning of the
period
(62,901)
(172,268)
Cash and cash equivalents at end of period 17 (3,619) (62,901)

EASTERN CAPE DEPARTMENT OF PUBLIC WORKS
VOTE5
ACCOUNTING POLICIES
for the year ended 31 March 2009
- 81 -
The Financial Statements have been prepared in accordance with the following policies, which
have been applied consistently in all material aspects, unless otherwise indicated. However,
where appropriate and meaningful, additional information has been disclosed to enhance the
usefulness of the Financial Statements and to comply with the statutory requirements of the
Public Finance Management Act, Act 1 of 1999 (as amended by Act 29 of 1999), and the
Treasury Regulations issued in terms of the Act and the Division of Revenue Act, Act 2 of 2008.
1. Presentation of the Financial Statements
1.1 Basis of preparation
The Financial Statements have been prepared on a modified cash basis of accounting, except
where stated otherwise. The modified cash basis constitutes the cash basis of accounting
supplemented with additional disclosure items. Under the cash basis of accounting transactions
and other events are recognised when cash is received or paid.
1.2 Presentation currency
All amounts have been presented in the currency of the South African Rand (R) which is also the
functional currency of the department.
1.3 Rounding
Unless otherwise stated all financial figures have been rounded to the nearest one thousand
Rand (R‟000).
1.4 Comparative figures
Prior period comparative information has been presented in the current year‟s financial
statements. Where necessary figures included in the prior period financial statements have been
reclassified to ensure that the format in which the information is presented is consistent with the
format of the current year‟s financial statements.
1.5 Comparative figures - Appropriation Statement
A comparison between actual amounts and final appropriation per major classification of
expenditure is included in the Appropriation Statement.
2. Revenue
2.1 Appropriated funds
Appropriated funds are recognised in the financial records on the date the appropriation becomes
effective. Adjustments to the appropriated funds made in terms of the adjustments budget
process are recognised in the financial records on the date the adjustments become effective.

EASTERN CAPE DEPARTMENT OF PUBLIC WORKS
VOTE5
ACCOUNTING POLICIES
for the year ended 31 March 2009
- 82 -
Total appropriated funds are presented in the Statement of Financial Performance.
Unexpended appropriated funds are surrendered to the Provincial Revenue Fund. Amounts
owing to the Provincial Revenue Fund at the end of the financial year are recognised in the
Statement of Financial Position.
2.2 Statutory Appropriation
Statutory appropriations are recognised in the financial records on the date the appropriation
becomes effective. Adjustments to the statutory appropriations made in terms of the adjustments
budget process are recognised in the financial records on the date the adjustments become
effective.
Total statutory appropriations are presented in the Statement of Financial Performance.
Unexpended statutory appropriations are surrendered to the Provincial Revenue Fund. Amounts
owing to the National/Provincial Revenue Fund at the end of the financial year are recognised in
the Statement of Financial Position.
2.3 Departmental revenue
All departmental revenue is paid into the Provincial Revenue Fund when received, unless
otherwise stated. Amounts owing to the Provincial Revenue Fund at the end of the financial year
are recognised in the Statement of Financial Position.
Amounts receivable at the reporting date are disclosed in the disclosure notes to the annual
financial statements.
2.3.1 Sales of goods and services other than capital assets
The proceeds received from the sale of goods and/or the provision of services is recognised in
the Statement of Financial Performance when the cash is received.
2.3.2 Sale of capital assets
The proceeds received on sale of capital assets are recognised in the Statement of Financial
Performance when the cash is received.
2.3.3 Financial transactions in assets and liabilities
Repayments of loans and advances previously extended to employees and public corporations
for policy purposes are recognised as revenue in the Statement of Financial Performance on
receipt of the funds.

EASTERN CAPE DEPARTMENT OF PUBLIC WORKS
VOTE5
ACCOUNTING POLICIES
for the year ended 31 March 2009
- 83 -
Cheques issued in previous accounting periods that expire before being banked are recognised
as revenue in the Statement of Financial Performance when the cheque becomes stale. When
the cheque is reissued the payment is made from Revenue.
3. Expenditure
3.1 Compensation of employees
3.1.1 Short-term employee benefits
Salaries and wages comprise payments to employees (including leave entitlements, thirteenth
cheques and performance bonuses). Salaries and wages are recognised as an expense in the
Statement of Financial Performance when final authorisation for payment is effected on the
system (by no later than 31 March of each year). Capitalised compensation forms part of the
expenditure for capital assets in the Statement of Financial Performance.
All other payments are classified as current expense.
Short-term employee benefits that give rise to a present legal or constructive obligation are
disclosed in the disclosure notes to the financial statements. These amounts are not recognised
in the Statement of Financial Performance or Position.
3.1.2 Post retirement benefits
The department provides retirement benefits (pension benefits) for certain of its employees
through a defined benefit plan for government employees. These benefits are funded by both
employer and employee contributions.
Employer contributions (i.e. social contributions) to the fund are expensed when the final
authorisation for payment to the fund is effected on the system (by no later than 31 March of each
year). No provision is made for retirement benefits in the financial statements of the department.
Any potential liabilities are disclosed in the financial statements of the Provincial Revenue Fund
and not in the financial statements of the employer department.
The department provides medical benefits for certain of its employees. Employer contributions to
the medical funds are expensed when final authorisation for payment to the fund is effected on
the system (by no later than 31 March of each year).
3.1.3 Termination benefits
Termination benefits such as severance packages are recognised as an expense in the
Statement of Financial Performance as a transfer (to households) when the final authorisation for
payment is effected on the system (by no later than 31 March of each year).

EASTERN CAPE DEPARTMENT OF PUBLIC WORKS
VOTE5
ACCOUNTING POLICIES
for the year ended 31 March 2009
- 84 -
3.1.4 Other long-term employee benefits
Other long-term employee benefits (such as capped leave) are recognised as an expense in the
Statement of Financial Performance as a transfer (to households) when the final authorisation for
payment is effected on the system (by no later than 31 March of each year).
Long-term employee benefits that give rise to a present legal or constructive obligation are
disclosed in the disclosure notes to the financial statements. These amounts are not recognised
in the Statement of Financial Performance or Position.
3.2 Goods and services
Payments made for goods and/or services are recognised as an expense in the Statement of
Financial Performance when the final authorisation for payment is effected on the system (by no
later than 31 March of each year). The expense is classified as capital if the goods and services
were used for a capital project or an asset of R5000 or more is purchased. All assets costing less
than R5000 will also be reflected under goods and services.
3.3 Interest and rent on land
Interest and rental payments are recognised as an expense in the Statement of Financial
Performance when the final authorisation for payment is effected on the system (by no later than
31 March of each year). This item excludes rental for the use of buildings or other fixed
structures.
3.4 Financial transactions in assets and liabilities
Debts are written off when identified as irrecoverable. Debts written-off are limited to the amount
of savings and/or under spending of appropriated funds. The write off occurs at year-end or when
funds are available. No provision is made for irrecoverable amounts but amounts are disclosed as
a disclosure note.
All other losses are recognised when authorisation has been granted for the recognition thereof.
3.5 Transfers and subsidies
Transfers and subsidies are recognised as an expense when the final authorisation for payment
is effected on the system (by no later than 31 March of each year).
3.6 Unauthorised expenditure
When discovered unauthorised expenditure is recognised as an asset in the statement of
financial position until such time as the expenditure is either approved by the relevant authority,
recovered from the responsible person or written off as irrecoverable in the Statement of
Financial Performance.

EASTERN CAPE DEPARTMENT OF PUBLIC WORKS
VOTE5
ACCOUNTING POLICIES
for the year ended 31 March 2009
- 85 -
Unauthorised expenditure approved with funding is recognised in the Statement of Financial
Performance when the unauthorised expenditure is approved and the related funds are received.
Where the amount is approved without funding it is recognised as expenditure, subject to
availability of savings, in the Statement of Financial Performance on the date of approval.
3.7 Fruitless and wasteful expenditure
Fruitless and wasteful expenditure is recognised as expenditure in the Statement of Financial
Performance. If the expenditure is recoverable it is treated as an asset until it is recovered from
the responsible person or written off as irrecoverable in the Statement of Financial Performance.
3.8 Irregular expenditure
Irregular expenditure is recognised as expenditure in the Statement of Financial Performance. If
the expenditure is not condoned by the relevant authority it is treated as an asset until it is
recovered or written off as irrecoverable in the Statement of Financial Performance.
3.9 Expenditure for capital assets
Payments made for capital assets are recognised as an expense in the Statement of Financial
Performance when the final authorisation for payment is effected on the system (by no later than
31 March of each year).
4. Assets
4.1 Cash and cash equivalents
Cash and cash equivalents are carried in the Statement of Financial Position at cost.
For the purposes of the Cash Flow Statement, cash and cash equivalents comprise cash on
hand, deposits held, other short-term highly liquid investments and bank overdrafts.
4.2 Receivables
Receivables included in the Statement of Financial Position arise from cash payments made that
are recoverable from another party.
Receivables outstanding at year-end are carried in the Statement of Financial Position at cost.
4.3 Inventory
Inventories purchased during the financial year are disclosed at cost in the notes.

EASTERN CAPE DEPARTMENT OF PUBLIC WORKS
VOTE5
ACCOUNTING POLICIES
for the year ended 31 March 2009
- 86 -
4.4 Capital assets
4.4.1 Movable assets
A capital asset is recorded on receipt of the item at cost. Cost of an asset is defined as the total
cost of acquisition. Where the cost cannot be determined accurately, the movable capital asset is
stated at fair value. Where fair value cannot be determined, the capital asset is included in the
asset register at R1.
Subsequent expenditure of a capital nature is recorded in the Statement of Financial
Performance as “expenditure for capital asset” and is capitalised in the asset register of the
department on completion of the project.
Repairs and maintenance is expensed as current “goods and services” in the Statement of
Financial Performance.
4.4.2 Immovable assets
A capital asset is recorded on receipt of the item at cost. Cost of an asset is defined as the total
cost of acquisition. Where the cost cannot be determined accurately, the immovable capital asset
is stated at R1 unless the fair value for the asset has been reliably estimated.
Work-in-progress of a capital nature is recorded in the Statement of Financial Performance as
“expenditure for capital asset”. On completion, the total cost of the project is included in the asset
register of the department that legally owns the asset.
Repairs and maintenance is expensed as current “goods and services” in the Statement of
Financial Performance.
5. Liabilities
5.1 Voted funds to be surrendered to the Revenue Fund
Unexpended appropriated funds are surrendered to the National/Provincial Revenue Fund.
Amounts owing to the Provincial Revenue Fund at the end of the financial year are recognised in
the Statement of Financial Position.
5.2 Departmental revenue to be surrendered to the Revenue Fund
Amounts owing to the Provincial Revenue Fund at the end of the financial year are recognised in
the Statement of Financial Position at cost.
5.3 Bank overdraft
The bank overdraft is carried in the Statement of Financial Position at cost.

EASTERN CAPE DEPARTMENT OF PUBLIC WORKS
VOTE5
ACCOUNTING POLICIES
for the year ended 31 March 2009
- 87 -
5.4 Payables
Recognised payables mainly comprise of amounts owing to other governmental entities. These
payables are recognised at historical cost in the Statement of Financial Position.
5.5 Contingent liabilities
Contingent liabilities are included in the disclosure notes to the financial statements.
5.6 Commitments
Commitments are not recognised in the Statement of Financial Position as a liability or as
expenditure in the Statement of Financial Performance but are included in the disclosure notes.
5.7 Accruals
Accruals are not recognised in the Statement of Financial Position as a liability or as expenditure
in the Statement of Financial Performance but are included in the disclosure notes.
5.8 Employee benefits
Short-term employee benefits that give rise to a present legal or constructive obligation are
disclosed in the disclosure notes to the financial statements. These amounts are not recognised
in the Statement of Financial Performance or the Statement of Financial Position.
5.9 Lease commitments
Lease commitments are not recognised in the Statement of Financial Position as a liability or as
expenditure in the Statement of Financial Performance but are included in the disclosure notes.
Operating and finance lease commitments are expensed when the payments are made. Assets
acquired in terms of finance lease agreements are disclosed in the annexures and disclosure
notes to the financial statements.
6. Receivables for departmental revenue
Receivables for departmental revenue are disclosed in the disclosure notes to the annual
financial statements.
7. Related party transactions
Specific information with regards to related party transactions is included in the disclosure notes.

EASTERN CAPE DEPARTMENT OF PUBLIC WORKS
VOTE5
ACCOUNTING POLICIES
for the year ended 31 March 2009
- 88 -
8. Key management personnel
Compensation paid to key management personnel including their family members, is included in
the disclosure notes.
9. Public private partnerships
A description of the PPP arrangement, the contract fees and current and capital expenditure
relating to the PPP arrangement is included in the disclosure notes.
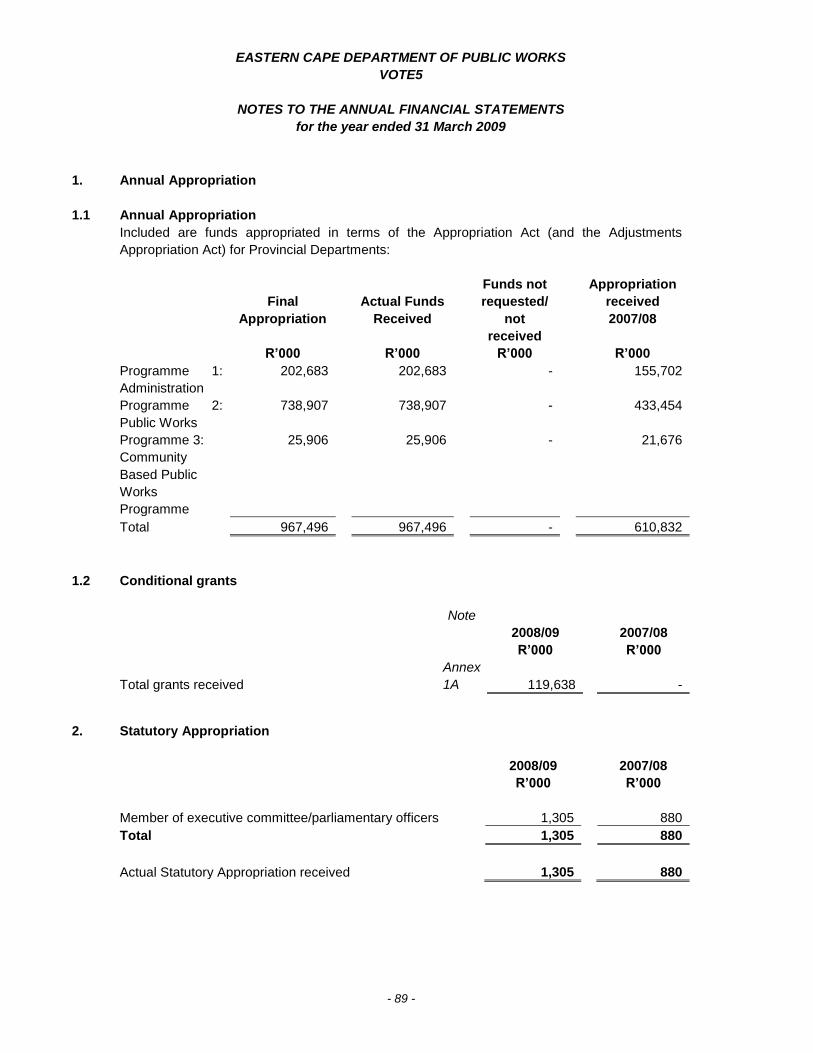
EASTERN CAPE DEPARTMENT OF PUBLIC WORKS
VOTE5
NOTES TO THE ANNUAL FINANCIAL STATEMENTS
for the year ended 31 March 2009
- 89 -
1. Annual Appropriation
1.1 Annual Appropriation
Included are funds appropriated in terms of the Appropriation Act (and the Adjustments
Appropriation Act) for Provincial Departments:
Final
Appropriation
Actual Funds
Received
Funds not
requested/
not
received
Appropriation
received
2007/08
R’000 R’000 R’000 R’000
Programme 1:
Administration
202,683 202,683 - 155,702
Programme 2:
Public Works
738,907 738,907 - 433,454
Programme 3:
Community
Based Public
Works
Programme
25,906 25,906 - 21,676
Total 967,496 967,496 - 610,832
1.2 Conditional grants
Note
2008/09 2007/08
R’000 R’000
Total grants received
Annex
1A
119,638
-
2. Statutory Appropriation
2008/09 2007/08
R’000 R’000
Member of executive committee/parliamentary officers 1,305 880
Total 1,305 880
Actual Statutory Appropriation received 1,305 880

EASTERN CAPE DEPARTMENT OF PUBLIC WORKS
VOTE5
NOTES TO THE ANNUAL FINANCIAL STATEMENTS
for the year ended 31 March 2009
- 90 -
3. Departmental revenue
Note 2008/09 2007/08
R’000 R’000
Tax revenue
Sales of goods and services other than capital
assets
3.1
11,763
10,466
Interest, dividends and rent on land 3.2 - 1
Financial transactions in assets and liabilities 3.3 507 1,283
Total revenue collected 12,270 11,750
Less: Own revenue included in appropriation 13 11,910 9,276
Departmental revenue collected 360 2,474
3.1 Sales of goods and services other than capital assets
Note 2008/09 2007/08
R’000 R’000
Sales of goods and services produced by the
department
11,680
10,418
Other sales 11,680 10,418
Sales of scrap, waste and other used current goods 83 48
Total 11,763 10,466
3.2 Interest, dividends and rent on land
Note 2008/09 2007/08
R’000 R’000
Rent on land - 1
Total - 1
3.3 Financial transactions in assets and liabilities
Note 2008/09 2007/08
R’000 R’000
Receivables 56 790
Stale cheques written back 117 -
Other Receipts including Recoverable Revenue 334 493
Total 507 1,283

EASTERN CAPE DEPARTMENT OF PUBLIC WORKS
VOTE5
NOTES TO THE ANNUAL FINANCIAL STATEMENTS
for the year ended 31 March 2009
- 91 -
4. Compensation of employees
4.1 Salaries and Wages
Note 2008/09 2007/08
R’000 R’000
Basic salary 229,646 172,182
Performance award 4,467 4,406
Service Based 680 102
Compensative/circumstantial 10,394 2,139
Other non-pensionable allowances 39,275 30,800
Total 284,462 209,629
4.2 Social contributions
Note 2008/09 2007/08
R’000 R’000
Employer contributions
Pension 26,108 21,123
Medical 13,516 11,356
Bargaining council 56 54
Total 39,680 32,533
Total compensation of employees 324,142 242,162
Average number of employees 1,847 1,844
5. Goods and services
Note 2008/09 2007/08
R’000 R’000
Administrative fees 112 58
Advertising 2,293 4,438
Assets less then R5,000 5.1 242 1,002
Bursaries (employees) 416 298
Catering 1,705 2,004
Communication 11,208 8,431
Computer services 5.2 11,175 7,411
Consultants, contractors and agency/outsourced
services
5.3 63,048 17,898
Audit cost – external 5.4 3,022 3,028
Inventory 5.5 3,288 4,007
Maintenance, repairs and running costs 212,397 157,871

EASTERN CAPE DEPARTMENT OF PUBLIC WORKS
VOTE5
NOTES TO THE ANNUAL FINANCIAL STATEMENTS
for the year ended 31 March 2009
- 92 -
Operating leases 92,380 72,485
Owned and leasehold property expenditure 5.6 26,446 20,900
Transport provided as part of the departmental
activities
16,631
9,291
Travel and subsistence 5.7 22,965 19,414
Venues and facilities 2,335 2,546
Training and staff development 2,681 4,057
Other operating expenditure 5.8 4,870 9,535
Total 477,214 344,674
5.1 Assets less than R5,000
Note 2008/09 2007/08
R’000 R’000
Tangible assets 242 997
Machinery and equipment 242 997
Intangible assets - 5
Total 242 1,002
5.2 Computer services
Note 2008/09 2007/08
R’000 R’000
SITA computer services 11,173 7,411
External computer service providers 2 -
Total 11,175 7,411
5.3 Consultants, contractors and agency/outsourced services
Note 2008/09 2007/08
R’000 R’000
Business and advisory services 24,638 9,834
Infrastructure and planning 38,005 7,214
Legal costs 405 747
Contractors - 103
Total 63,048 17,898
5.4 Audit cost – External
Note 2008/09 2007/08
R’000 R’000
Regularity audits 3,022 3,028
Total 3,022 3,028

EASTERN CAPE DEPARTMENT OF PUBLIC WORKS
VOTE5
NOTES TO THE ANNUAL FINANCIAL STATEMENTS
for the year ended 31 March 2009
- 93 -
5.5 Inventory
Note 2008/09 2007/08
R’000 R’000
Fuel, oil and gas 21 2
Other consumable materials 1,119 1,520
Maintenance material 13 -
Stationery and printing 2,135 2,485
Total 3,288 4,007
5.6 Owned and leasehold property expenditure
Note 2008/09 2007/08
R’000 R’000
Municipal services 16,083 13,992
Property management fees 10,363 6,908
Total 26,446 20,900
5.7 Travel and subsistence
Note 2008/09 2007/08
Local 22,948 19,371
Foreign 17 43
Total 22,965 19,414
5.8 Other operating expenditure
Note 2008/09 2007/08
R’000 R’000
Learnerships 3,802 8,837
Professional bodies, membership and subscription
fees
34
19
Resettlement costs 801 679
Other 233 -
Total 4,870 9,535

EASTERN CAPE DEPARTMENT OF PUBLIC WORKS
VOTE5
NOTES TO THE ANNUAL FINANCIAL STATEMENTS
for the year ended 31 March 2009
- 94 -
6. Financial transactions in assets and liabilities
Note 2008/09 2007/08
R’000 R’000
Debts written off 6.1 1,444 -
Total 1,444 -
6.1 Debts written off
Note 2008/09 2007/08
R’000 R’000
Nature of debts written off
Staff debtors 1,444 -
Total 1,444 -
6.2 Detail of theft
Note 2008/09 2007/08
R’000 R’000
Nature of theft
Computer and other equipment 45 -
Total 45 -
7. Transfers and subsidies
2008/09 2007/08
R’000 R’000
Note
Provinces and municipalities Annex 1B 60,010 9
Households Annex 1C 5,519 7,747
Total 65,529 7,756
8. Expenditure for capital assets
Note 2008/09 2007/08
R’000 R’000
Tangible assets 46,963 16,009
Buildings and other fixed structures 31.1 39,194 13,644
Machinery and equipment 29.1 7,769 2,365
Total 46,963 16,009

EASTERN CAPE DEPARTMENT OF PUBLIC WORKS
VOTE5
NOTES TO THE ANNUAL FINANCIAL STATEMENTS
for the year ended 31 March 2009
- 95 -
8.1 Analysis of funds utilised to acquire capital assets – 2008/09
Voted funds Aid
assistance
Total
R’000 R’000 R’000
Tangible assets 46,963 - 46,963
Buildings and other fixed structures 39,194 39,194
Machinery and equipment 7,769 - 7,769
Total 46,963 - 46,963
8.2 Analysis of funds utilised to acquire capital assets – 2007/08
Voted funds Aid
assistance
Total
R’000 R’000 R’000
Total assets acquired 16,009 - 16,009
9. Unauthorised expenditure
9.1 Reconciliation of unauthorised expenditure
Note 2008/09 2007/08
R’000 R’000
Opening balance - 115,510
Less: Amounts approved by Parliament/Legislature
(with funding)
-
(115,510)
Unauthorised expenditure awaiting authorisation - -
10. Fruitless and wasteful expenditure
10.1 Reconciliation of fruitless and wasteful expenditure
Note 2008/09 2007/08
R’000 R’000
Opening balance 30,543 30,517
Less: Amounts condoned - 26
Current 25.1 - 26
Fruitless and wasteful expenditure awaiting
condonement
30,543
30,543

EASTERN CAPE DEPARTMENT OF PUBLIC WORKS
VOTE5
NOTES TO THE ANNUAL FINANCIAL STATEMENTS
for the year ended 31 March 2009
- 96 -
Analysis of awaiting condonement per economic
classification
Current 30,543 30,543
Total 30,543 30,543
11. Receivables
2008/09 2007/08
R’000 R’000 R’000 R’000 R’000
Note
Less
than one
year
One to
three
years
Older
than
three
years
Total
Total
Claims recoverable 11.1
Annex
3
402
1,687
-
2,089
1,687
Recoverable
expenditure
11.2
149
-
-
149
-
Staff debt 11.3 646 2,275 1,774 4,695 6,179
Other debtors 11.4 373 - - 373 84
Total 1,570 3,962 1,774 7,306 7,950
11.1 Claims recoverable
Note 2008/09 2007/08
R’000 R’000
National departments 5 -
Provincial departments 2,084 1,687
Total 2,089 1,687
11.2 Recoverable expenditure (disallowance accounts)
Note 2008/09 2007/08
R’000 R’000
Salary Deductions- Pension 149 -
Total 149 -

EASTERN CAPE DEPARTMENT OF PUBLIC WORKS
VOTE5
NOTES TO THE ANNUAL FINANCIAL STATEMENTS
for the year ended 31 March 2009
- 97 -
11.3 Staff debt
Note 2008/09 2007/08
R’000 R’000
Staff Debtors 4,639 5,975
Clearing account 56 204
Total 4,695 6,179
11.4 Other debtors
Note 2008/09 2007/08
R’000 R’000
Other debtors 373 84
Total 373 84
12. Voted funds to be surrendered to the Revenue Fund
Note 2008/09 2007/08
R’000 R’000
Opening balance (27,859) (28,970)
Transfer from statement of financial performance 53,509 1,111
Closing balance 25,650 (27,859)
13. Departmental revenue to be surrendered to the Revenue Fund
Note 2008/09 2007/08
R’000 R’000
Opening balance (1,339) 2,601
Transfer from Statement of Financial Performance 360 2,474
Own revenue included in appropriation 11,910 9,276
Paid during the year (9,467) (15,690)
Closing balance 1,464 (1,339)
14. Bank Overdraft
Note 2008/09 2007/08
R’000 R’000
Consolidated Paymaster General Account 17 3,619 62,901
Total 3,619 62,901

EASTERN CAPE DEPARTMENT OF PUBLIC WORKS
VOTE5
NOTES TO THE ANNUAL FINANCIAL STATEMENTS
for the year ended 31 March 2009
- 98 -
15. Payables – current
Description
Note 2008/09
Total
2007/08
Total
Amounts owing to other entities
3,523
-
Advances received 15.1 3,527 3,323
Clearing accounts 15.2 60 218
Other payables 15.3 6 1,249
Total 7,116 4,790
15.1 Advances received
Note 2008/09 2007/08
R’000 R’000
Advances received 3,527 3,323
Total 3,527 3,323
15.2 Clearing accounts
Note 2008/09 2007/08
R’000 R’000
Clearing accounts 60 218
Total 60 218
15.3 Other payables
Note 2008/09 2007/08
R’000 R’000
Other payables 6 1,249
Total 6 1,249
16. Net cash flow available from operating activities
Note 2008/09 2007/08
R’000 R’000
Net surplus/(deficit) as per Statement of Financial
Performance
53,869
3,585
Add back non cash/cash movements not deemed
operating activities
52,376
121,791

EASTERN CAPE DEPARTMENT OF PUBLIC WORKS
VOTE5
NOTES TO THE ANNUAL FINANCIAL STATEMENTS
for the year ended 31 March 2009
- 99 -
(Increase)/decrease in receivables – current 644 548
(Increase)/decrease in other current assets (61,086) 115,510
Increase/(decrease) in payables – current 2,326 (3,836)
Proceeds from sale of capital assets - -
Expenditure on capital assets 46,963 16,009
Surrenders to Revenue Fund (9,467) (15,690)
Own revenue included in appropriation 11,910 -
Other non-cash items 61,086 9,250
Net cash flow generated by operating activities 106,245 125,376
17. Reconciliation of cash and cash equivalents for cash flow purposes
Note 2008/09 2007/08
R’000 R’000
Consolidated Paymaster General account 14 (3,619) (62,901)
Total (3,619) (62,901)

EASTERN CAPE DEPARTMENT OF PUBLIC WORKS
VOTE5
DISCLOSURE NOTES TO THE ANNUAL FINANCIAL STATEMENTS
for the year ended 31 March 2009
- 100 -
These amounts are not recognised in the Annual Financial Statements and are disclosed to
enhance the usefulness of the Annual Financial Statements.
18. Contingent liabilities
Note 2008/09 2007/08
R’000 R’000
Liable to Nature
Motor vehicle guarantees Employees Annex
2A
25 25
Housing loan guarantees Employees Annex
2A
1,424 1,424
Claims against the department Annex
2B
110,761 15,110
Other departments (interdepartmental unconfirmed
balances)
Annex
4
2,296
30
Total 114,506 16,589
19. Commitments
Note 2008/09 2007/08
R’000 R’000
Current expenditure
Approved and contracted 84,687 29,978
Approved but not yet contracted - 82,644
84,687 112,622
Capital expenditure
Approved and contracted 95,537 119,758
95,537 119,758
Total Commitments 180,224 232,380
20. Accruals
2008/09 2007/08
R’000 R’000
Listed by economic classification
30 Days 30+ Days Total Total
Compensation of employees - 57,497 57,497 -
Goods and services 19,719 16,061 35,780 22,169
Buildings and other fixed
structures
-
2,959
2,959
-
Machinery and equipment - - - 474
Total 19,719 76,517 96,236 22,643

EASTERN CAPE DEPARTMENT OF PUBLIC WORKS
VOTE5
DISCLOSURE NOTES TO THE ANNUAL FINANCIAL STATEMENTS
for the year ended 31 March 2009
- 101 -
Note 2008/09 2007/08
R’000 R’000
Listed by programme level
Administration 63,867 8,972
Public Works 32,191 13,540
Community Based Public Works Programme 178 131
Total 96,236 22,643
Note 2008/09 2007/08
R’000 R’000
Confirmed balances with other departments Annex 4 2,577 3,621
Total 2,577 3,621
21. Employee benefits
Note 2008/09 2007/08
R’000 R’000
Leave entitlement 12,049 11,606
Thirteenth cheque 8,948 7,525
Performance awards 4,339 4,394
Capped leave commitments 87,301 86,052
Total 112,637 109,577
22. Lease commitments
22.1 Operating leases expenditure
2008/09
Land
Buildings
and other
fixed
structures
Machinery
and
equipment
Total
Not later than 1 year - 77,435 3,871 81,306
Later than 1 year and not later
than 5 years
-
149,465
-
149,465
Later than five years - 4,322 - 4,322
Total lease commitments - 231,222 3,871 235,093

EASTERN CAPE DEPARTMENT OF PUBLIC WORKS
VOTE5
DISCLOSURE NOTES TO THE ANNUAL FINANCIAL STATEMENTS
for the year ended 31 March 2009
- 102 -
2007/08
Land
Buildings
and other
fixed
structures
Machinery
and
equipment
Total
Not later than 1 year - 66,766 3,137 69,903
Later than 1 year and not later
than 5 years
-
52,912
-
52,912
Later than five years - 6,057 - 6,057
Total lease commitments - 125,735 3,137 128,872
22.2 Finance leases expenditure
2008/09
Land
Buildings
and other
fixed
structures
Machinery
and
equipment
Total
Not later than 1 year - - 4,518 4,518
Later than 1 year and not later
than 5 years
-
-
4,436
4,436
Total present value of lease
liabilities
-
-
8,954
8,954
2007/08
Land
Buildings
and other
fixed
structures
Machinery
and
equipment
Total
Not later than 1 year - - 3,776 3,776
Later than 1 year and not later
than 5 years
- -
7,821
7,821
Later than five years - - 132 132
Total present value of lease
liabilities
-
-
11,729
11,729
Leases are renewable at the option of the department. No purchase options are available for
leases and the escalation rate is 10% per annum on every anniversary of the lease. There is no
restriction imposed on the department through any lease agreements.

EASTERN CAPE DEPARTMENT OF PUBLIC WORKS
VOTE5
DISCLOSURE NOTES TO THE ANNUAL FINANCIAL STATEMENTS
for the year ended 31 March 2009
- 103 -
23. Receivables for departmental revenue
Note 2008/09 2007/08
R’000 R’000
Sales of goods and services other than capital assets 3,912 3,875
Total 3,912 3,875
23.1 Analysis of receivables for departmental revenue
Note 2008/09
R’000
Opening balance 3,875
Less: amounts received (10,397)
Add: amounts recognised 10,434
Closing balance 3,912
24. Irregular expenditure
24.1 Reconciliation of irregular expenditure
Note 2008/09 2007/08
R’000 R’000
Opening balance 68,719 115,139
Add: Irregular expenditure – relating to current year 17,389 18,505
Less: Amounts condoned (18,434) (64,925)
Less: Amounts not recoverable (not condoned) - -
Irregular expenditure awaiting condonation 67,674 68,719
Analysis of awaiting condonation per age
classification
Current year 343 18,505
Prior years 67,331 50,214
Total 67,674 68,719

EASTERN CAPE DEPARTMENT OF PUBLIC WORKS
VOTE5
DISCLOSURE NOTES TO THE ANNUAL FINANCIAL STATEMENTS
for the year ended 31 March 2009
- 104 -
24.2 Details of irregular expenditure – current year
Incident Disciplinary steps taken/criminal
proceedings
2008/09
R’000
Coega Development Corporation No disciplinary steps or criminal
proceedings taken
629
Consulting services No disciplinary steps or criminal
proceedings taken
12,342
Lease agreements No disciplinary steps or criminal
proceedings taken
4,075
Security and cleaning service No disciplinary steps or criminal
proceedings taken
269
Other goods and services No disciplinary steps or criminal
proceedings taken
74
Total 17,389
24.3 Details of irregular expenditure condoned
Incident Condoned by (condoning authority) 2008/09
R’000
Lease agreements Accounting Officer 4,075
Coega Development Corporation Accounting Officer 629
Consulting services Accounting Officer 13,730
Total 18,434
25. Related party transactions
The department performs administrative and project management functions on behalf of other
provincial department with respect to infrastructure projects. These administrative and project
management function performed by departmental officials are performed at zero value.
The procedures inherent in the procurement processes of the department require officials to
report any interest which they may have in any departmental transactions. No instances of
related party transactions have been identified by the department for the 2008/09 financial year.

EASTERN CAPE DEPARTMENT OF PUBLIC WORKS
VOTE5
DISCLOSURE NOTES TO THE ANNUAL FINANCIAL STATEMENTS
for the year ended 31 March 2009
- 105 -
26. Key management personnel
No. of
Individuals
2008/09 2007/08
R’000 R’000
Political office bearers 1 1,327 926
Officials:
Level 15 to 16 1 801 811
Level 14 (incl. CFO if at a lower level) 2 771 1,929
Family members of key management
personnel
-
-
82
Total 2,899 3,748
27. Public Private Partnership
Due to a very high demand for office accommodation in both Bhisho and Mt Ayliff, the
department submitted an application to the national treasury department for the registration of
two PPP projects to address this need. This application was granted in May 2007 and the
process of securing a suitable Transaction Advisor commenced in July 2007. The department
successfully secured the services of such an advisor in February 2008. This advisor is currently
in progress with the feasibility study of the PPP project.
Note 2008/09 2007/08
R’000 R’000
Current Expenditure
Goods and services (excluding lease payments) 10,066 -
Total 10,066 -
28. Provisions
Note 2008/09 2007/08
R’000 R’000
Potential irrecoverable debts
Staff debtors 2,408 3,196
Total 2,408 3,196

EASTERN CAPE DEPARTMENT OF PUBLIC WORKS
VOTE5
DISCLOSURE NOTES TO THE ANNUAL FINANCIAL STATEMENTS
for the year ended 31 March 2009
- 106 -
29. Movable Tangible Capital Assets
MOVEMENT IN MOVABLE TANGIBLE CAPITAL ASSETS PER ASSET REGISTER FOR THE YEAR
ENDED 31 MARCH 2009
Opening
balance
Curr Year
Adjust-
ments to
prior year
balances
Additions Disposals Closing
Balance
R’000 R’000 R’000 R’000 R’000
MACHINERY AND EQUIPMENT 5,489 - 7,769 - 13,258
Computer equipment 4,587 - - - 4,587
Furniture and office equipment 902 - 4,204 - 5,106
Other machinery and equipment - - 3,565 - 3,565
TOTAL MOVABLE TANGIBLE
CAPITAL ASSETS
5,489
-
7,769
-
13,258
29.1 Additions
ADDITIONS TO MOVABLE TANGIBLE CAPITAL ASSETS PER ASSET REGISTER FOR THE YEAR
ENDED 31 MARCH 2009
Cash Non-cash (Capital
Work in
Progress
current
costs and
finance
lease
payments)
Received
current, not
paid
(Paid
current
year,
received
prior year)
Total
R’000 R’000 R’000 R’000 R’000
MACHINERY AND
EQUIPMENT
7,769 - - - 7,769
Furniture and office
equipment
4,204 - - - 4,204
Other machinery and
equipment
3,565 - - - 3,565
TOTAL ADDITIONS TO
MOVABLE TANGIBLE
CAPITAL ASSETS
7,769
-
-
-
7,769

EASTERN CAPE DEPARTMENT OF PUBLIC WORKS
VOTE5
DISCLOSURE NOTES TO THE ANNUAL FINANCIAL STATEMENTS
for the year ended 31 March 2009
- 107 -
29.2 Movement for 2007/08
MOVEMENT IN MOVABLE TANGIBLE CAPITAL ASSETS PER ASSET REGISTER FOR
THE YEAR ENDED 31 MARCH 2008
Opening
balance
Current Year
Adjustments
to prior year
balances
Additions Closing
balance
R’000 R’000 R’000 R’000
MACHINERY AND EQUIPMENT 9,627 (6,503) 2,365 5,489
Computer equipment 5,665 (2,687) 1,609 4,587
Furniture and office equipment 3,962 (3,816) 756 902
TOTAL MOVABLE TANGIBLE
ASSETS
9,627 (6,503) 2,365 5,489
29.3 Minor assets
MINOR ASSETS OF THE DEPARTMENT FOR THE YEAR ENDED 31 MARCH 2009
Intangible
assets
Heritage
assets
Machinery
and
equipment
Biological
assets
Total
R’000 R’000 R’000 R’000 R’000
Minor assets - - 1,760 - 1,760
TOTAL - - 1,760 - 1,760
Intangible
assets
Heritage
assets
Machinery
and
equipment
Biological
assets
Total
Number of minor assets - - 3,309 - 3,309
TOTAL - - 3,309 - 3,309

EASTERN CAPE DEPARTMENT OF PUBLIC WORKS
VOTE5
DISCLOSURE NOTES TO THE ANNUAL FINANCIAL STATEMENTS
for the year ended 31 March 2009
- 108 -
30. Intangible Capital Assets
30.1 Movement for 2007/08
MOVEMENT IN INTANGIBLE CAPITAL ASSETS PER ASSET REGISTER FOR THE YEAR
ENDED 31 MARCH 2008
Opening
balance
Current Year
Adjustments
to prior year
balances
Disposals Closing
balance
R’000 R’000 R’000 R’000
COMPUTER SOFTWARE 449 (449) - -
TOTAL 449 (449) - -
31. Immovable Tangible Capital Assets
MOVEMENT IN IMMOVABLE TANGIBLE CAPITAL ASSETS PER ASSET REGISTER FOR THE
YEAR ENDED 31 MARCH 2009
Opening
balance
Current
Year
Adjust-
ments to
prior year
balances
Additions Disposals Closing
Balance
R’000 R’000 R’000 R’000 R’000
BUILDINGS AND OTHER FIXED
STRUCTURES
-
636,866
39,194
-
676,060
Dwellings - 3,732 - - 3,732
Non-residential buildings - 13,099 39,194 - 52,293
Other fixed structures - 620,035 - - 620,035
LAND AND SUBSOIL ASSETS - 384 - 384
Land - 384 - - 384
TOTAL IMMOVABLE TANGIBLE
CAPITAL ASSETS
-
637,250
39,194
-
676,444

EASTERN CAPE DEPARTMENT OF PUBLIC WORKS
VOTE5
DISCLOSURE NOTES TO THE ANNUAL FINANCIAL STATEMENTS
for the year ended 31 March 2009
- 109 -
31.1 Additions
ADDITIONS TO IMMOVABLE TANGIBLE CAPITAL ASSETS PER ASSET REGISTER FOR THE YEAR
ENDED 31 MARCH 2009
Cash Non-cash (Capital
Work in
Progress
current
costs and
finance
lease
payments)
Received
current, not
paid
(Paid
current
year,
received
prior year)
Total
R’000 R’000 R’000 R’000 R’000
BUILDING AND OTHER
FIXED STRUCTURES
Non-residential buildings 39,194 - - - 39,194
TOTAL ADDITIONS TO
IMMOVABLE TANGIBLE
CAPITAL ASSETS
39,194
-
-
-
39,194
31.2 Immovable assets valued at R1
IMMOVABLE ASSETS VALUED AT R1 IN THE ASSET REGISTER FOR 31 MARCH 2009
Buildings
and other
fixed
structures
Heritage
assets
Land and
subsoil
assets
Investment
property
Total
R R R R R
R1 Immovable assets 666 - 7 - 673
TOTAL 666 - 7 - 673

Department of Public Works – Vote 5 – Annual Report 2008/09
- 110 -
ANNEXURE 1A
STATEMENT OF CONDITIONAL GRANTS RECEIVED
NAME OF
DEPARTMENT
GRANT ALLOCATION SPENT 2007/08
Division of
Revenue
Act/
Provincial
Grants
Roll
Overs
DORA
Adjustment
s
Other
Adjustment
s
Total
Available
Amount
received
by
departmen
t
Amount
spent by
departmen
t
% of
available
funds
spent by
departmen
t
Division
of
Revenue
Act
Amount
spent by
department
R’000 R’000 R'000 R'000 R’000 R'000 R'000 % R’000 R’000
Devolution of
Property Rate
Funds Grant
119,638
-
-
-
119,638
119,638
60,010
50.2%
-
-
Total 119,638 - - - 119,638 119,638 60,010 50.2% - -

Department of Public Works – Vote 5 – Annual Report 2008/09
- 111 -
ANNEXURE 1B
STATEMENT OF UNCONDITIONAL GRANTS AND TRANSFERS TO MUNICIPALITIES
NAME OF
MUNICIPALITY
GRANT ALLOCATION TRANSFER SPENT 2007/08
Amount
Roll
Overs
Adjust-
ments
Total
Available
Actual
Transfer
% of
Available
funds
Transferre
d
Amount
received
by
municipali
ty
Amount
spent by
municipalit
y
% of
available
funds
spent by
municipali
ty
Total
Available
R’000 R’000 R'000 R'000 R'000 % R'000 R'000 % R’000
Claims against
State Provincial
Departments
-
-
-
-
-
-
-
-
-
9
Mun B/Acc: Mun
Rates and Taxes
20,571
-
-
20,571
-
0%
-
-
100%
-
Nelson Mandela
Bay
32,750
-
-
32,750
13,955
43%
13,955
13,955
100%
-
Camdeboo 1,932 - - 1,932 888 46% 888 888 100% -
Blue Crane
Route
761 - - 761 688 90% 688 688 100% -
Ikwezi 259 - - 259 - 0% - - 100% -
Makana 10,558 - - 10,558 2,605 25% 2,605 2,605 100% -
Ndlambe 273 - - 273 176 64% 176 176 100% -
Sundays River
Valley
801
- -
801
207
26%
207
207
100%
-
Baviaans 217 - - 217 223 103% 223 223 100% -
Kouga 622 - - 622 602 97% 602 602 100% -
Koukamma 83 - - 83 10 12% 10 10 100% -
Cacadu
Municipalities
10
-
-
10
10
100%
10
10
100%
-

Department of Public Works – Vote 5 – Annual Report 2008/09
- 112 -
NAME OF
MUNICIPALITY
GRANT ALLOCATION TRANSFER SPENT 2007/08
Amount
Roll
Overs
Adjust-
ments
Total
Available
Actual
Transfer
% of
Available
funds
Transferre
d
Amount
received
by
municipali
ty
Amount
spent by
municipalit
y
% of
available
funds
spent by
municipali
ty
Total
Available
R’000 R’000 R'000 R'000 R'000 % R'000 R'000 % R’000
Mbhashe 27 - - 27 - 0% - - 100% -
Mnquma 246 - - 246 274 111% 274 274 100% -
Great Kei 123 - - 123 - 0% - - 100% -
Amahlathi 270 - - 270 - 0% - - 100% -
Buffalo City 23,509 - - 23,509 22,276 95% 22,276 22,276 100% -
Ngqushwa 273 - - 273 - 0% - - 100% -
Nkonkobe 1,980 - - 1,980 1,065 54% 1,065 1,065 100% -
Nxuba 654 - - 654 - 0% - - 100% -
Inxuba
Yethemba
1,973 - - 1,973 1,411 72% 1,411 1,411 100% -
Tsolwana 119 - - 119 60 50% 60 60 100% -
Inkwanca 444 - - 444 204 46% 204 204 100% -
Lukhanji 2,146 - - 2,146 2,079 97% 2,079 2,079 100% -
Intsika Yethu 114 - - 114 89 78% 89 89 100% -
Emalahleni 110 - - 110 - 0% - - 100% -
Engcobo 106 - - 106 26 25% 26 26 100% -
Sakhisizwe 114 - - 114 - 0% - - 100% -
Elundini 482 - - 482 - 0% - - 100% -
Senqu 276 - - 276 - 0% - - 100% -
Maletswai 252 - - 252 242 96% 242 242 100% -
Gariep 1,127 - - 1,127 - 0% - - 100% -
Ntabankulu 976 - - 976 - 0% - - 100% -
Port St Johns 162 - - 162 12 7% 12 12 100% -
Nyandeni 194 - - 194 - 0% - - 100% -

Department of Public Works – Vote 5 – Annual Report 2008/09
- 113 -
NAME OF
MUNICIPALITY
GRANT ALLOCATION TRANSFER SPENT 2007/08
Amount
Roll
Overs
Adjust-
ments
Total
Available
Actual
Transfer
% of
Available
funds
Transferre
d
Amount
received
by
municipali
ty
Amount
spent by
municipalit
y
% of
available
funds
spent by
municipali
ty
Total
Available
R’000 R’000 R'000 R'000 R'000 % R'000 R'000 % R’000
Mhlontlo 190 - - 190 - 0% - - 100% -
King Sabata
Dalindyebo
14,722
-
-
14,722
12,381
84%
12,381
12,381
100%
-
Ingquza - - - - 456 0% 456 456 100% -
Umzimvubu 209 - - 209 71 34% 71 71 100% -
119,638 - - 119,638 60,010 50% 60,010 60,010 100% 9

Department of Public Works – Vote 5 – Annual Report 2008/09
- 114 -
ANNEXURE 1C
STATEMENT OF TRANSFERS TO HOUSEHOLDS
HOUSEHOLDS
TRANSFER ALLOCATION EXPENDITURE 2007/08
Adjusted
Appropriat
ion
Act
Roll
Overs
Adjust-
ments
Total
Available
Actual
Transfer
% of
Available
funds
Transferre
d
Appro-
priation
Act
R'000 R'000 R'000 R'000 R'000 % R'000
Transfers
Social Benefits 3,696 - - 3,696 3,696 100% 5,876
Bursaries Non-employees 999 - - 999 999 100% 1,871
Claims Against the State 824 - - 824 824 100% -
Total 5,519 - - 5,519 5,519 100% 7,747

Department of Public Works – Vote 5 – Annual Report 2008/09
- 115 -
ANNEXURE 2A
STATEMENT OF FINANCIAL GUARANTEES ISSUED AS AT 31 MARCH 2008 – LOCAL
Guarantor
institution
Guarantee in
respect of
Original
guaranteed
capital
amount
Opening
balance
1 April
2008
Guarantees
draw
downs
during the
year
Guarantees
repayments/
cancelled/
reduced/
released
during the
year
Revaluations Closing
balance
31 March
2009
Guaranteed
interest for
year ended
31 March
2009
Realised
losses not
recoverable
i.e. claims
paid out
R’000 R’000 R’000 R’000 R’000 R’000 R’000 R’000
Motor vehicles
ABSA 125,465 25 - - - 25 - -
Housing
Various - 1,424 - - - 1,424 - -
Total 125,465 1,449 - - - 1,449 - -

Department of Public Works – Vote 5 – Annual Report 2008/09
- 116 -
ANNEXURE 2B
STATEMENT OF CONTINGENT LIABILITIES AS AT 31 MARCH 2009
Nature of Liability
Liabilities incurred
during the year
Liabilities paid/cancelled/reduced during the
year
Liabilities recoverable(Provide
details hereunder)
Opening Closing
Balance Balance
01/04/2008 31/03/2009
R’000 R’000 R’000 R’000 R’000
Claims against the department
Claims against the department 15,110 97,160 (1,509) - 110,761
Total
15,110
97,160
(1,509)
- 110,761

Department of Public Works – Vote 5 – Annual Report 2008/09
- 117 -
ANNEXURE 3
CLAIMES RECOVERABLE
Government Entity
Confirmed balance outstanding
Unconfirmed balance outstanding Total
31/03/2009 31/03/2008 31/03/2009 31/03/2008 31/03/2009 31/03/2008
R’000 R’000 R’000 R’000 R’000 R’000
Department Education - - 6 6,893 6 6,893 Office of the Premier - 50 73 - 73 50 National Public Works - - 1,377 1,377 1,377 1,377 Social Development - - 175 54 175 54 Health - - 2 6 2 6 Local Government - - 14 - 14 - Sport, Recreation, Arts & Culture - - 149 - 149 - Provincial Treasury - - 12 - 12 - Other - - 281 - 281 -
TOTAL -
50 2,089
8,330
2,089 8,380

Department of Public Works – Vote 5 – Annual Report 2008/09
- 118 -
ANNEXURE 4
INTER-GOVERNMENT PAYABLES
GOVERNMENT ENTITY
Confirmed balance outstanding Unconfirmed balance outstanding TOTAL
31/03/2009 31/03/2008 31/03/2009 31/03/2008 31/03/2009 31/03/2008
R’000 R’000 R’000 R’000 R’000 R’000
DEPARTMENTS Current Justice 2,139 2,520 1,635 - 3,774 2,520 Health - 380 205 - 205 380 Public Works - - 48 27 48 27 Office of the Premier – Eastern Cape
-
10
10 -
10 10
Provincial Treasury – Eastern Cape 340
195
-
-
340 195
Roads & Transport 98 381 308 - 406 381 South African Police Services - - 35 3 35 3 Safety and Liaison - 135 - - - 135 Provincial Treasury – Free State
-
-
5
-
5 Office of the Premier – Limpopo
-
-
10
-
10 Community and Safety – Western Cape
-
-
32
-
32 Social Development - - 8 - 8
Total 2,577 3,621 2,296 30
4,873
3,651

Department of Public Works – Vote 5 – Annual Report 2008/09
- 119 -
PART 5: HUMAN RESOURCE MANAGEMENT
Introduction
The statistics and information published in this part of the annual report are required in terms of Chapter 1, Part III J.3 of the Pubic Service Regulations, 2001
and have been prescribed by the Minister for the Public Service and Administration for all departments within the Public Service.
The statistical tables provide high-level information on key human resource issues. The information aims to empower legislatures, the media, the public and
other key stakeholders to monitor whether the Department of Public Works:
Is exercising the powers granted under Public Service and Public Finance legislation responsibly
Is achieving national transformation priorities
Annual reports are produced after the end of the financial year. This is aimed at strengthening the accountability of the Department to key stakeholders.
Expenditure
HR OVERSIGHT - APRIL 2008 to MARCH 2009 - Eastern Cape - Public Works
Table 5.2.1: Personnel Costs by Programme
Programme Total Voted
Expenditure
(R'000)
Compensation
of Employees
Expenditure
(R'000)
Training
Expenditure
(R'000)
Professional
and Special
Services
(R'000)
Compensation
of Employees
as percent of
Total
Expenditure
Average
Compensation
of Employees
Cost per
Employee
(R'000)
Employment
Programme 1: Administration 126,448 126,425 1959 0 63 72 1854
Programme 3:Community based
Public Works programme 20,103 20,103 0 0 74.9 9 1854
Programme 2: Public Works 172,829 177,614 0 0 25.6 94 1854
Total as on Financial Systems (BAS) 319,380 324,142 1,959 0 35.5 175 1854

Department of Public Works – Vote 5 – Annual Report 2008/09
- 120 -
HR OVERSIGHT - APRIL 2008 to MARCH 2009 - Eastern Cape - Public Works
TABLE 5.2.2 - Personnel costs by Salary band
Salary Bands Compensation of Employees Cost (R'000)
Percentage of Total Personnel
Cost for Department
Average Compensation
Cost per Employee (R)
Total Personnel Cost for
Department including Goods
and Transfers (R'000)
Number of Employees
Lower skilled (Levels 1-2) 26,573 8.2% 76 333,996 348
Skilled (Levels 3-5) 59,138 18.2% 107 333,996 553
Highly skilled production (Levels 6-8) 136,783 42.2% 206 333,996 665
Highly skilled supervision (Levels 9-12) 69,607 21.5% 328 333,996 212
Senior management (Levels 13-16) 12,175 3.8% 553 333,996 22
Contract (Levels 1-2) 20 0.0% 0 333,996 0
Contract (Levels 3-5) 725 0.2% 81 333,996 9
Contract (Levels 6-8) 3,966 1.2% 180 333,996 22
Contract (Levels 9-12) 6,424 2.0% 338 333,996 19
Contract (Levels 13-16) 2,536 0.8% 634 333,996 4
Abnormal Appointment 6,195 1.9% 18 333,996 344
TOTAL 324,142 100% 147 333,996 2,198

Department of Public Works – Vote 5 – Annual Report 2008/09
- 121 -
HR OVERSIGHT - APRIL 2008 to MARCH 2009 - Eastern Cape - Public Works
TABLE 5.2.3 - Salaries, Overtime, Home Owners Allowance and Medical Aid by Programme
Programme Salaries
(R'000)
Salaries as
% of
Personnel
Cost
Overtime
(R'000)
Overtime as
% of
Personnel
Cost
HOA
(R'000)
HOA as %
of
Personnel
Cost
Medical Ass.
(R'000)
Medical
Ass. as % of
Personnel
Cost
Total
Personnel
Cost per
Programme
(R'000)
Programme 1:
Administration 80,376 72.8 621 0.6 2,716 2.5 4,581 4.1 110,444
Programme 2: Public Works 144,229 70.3 19 0 6,606 3.2 8,179 4 205,240
Programme 3: Community
based Public Works
programme 8,583 46.9 0 0 229 1.3 490 2.7 18,311
TOTAL 233,188 69.8 640 0.2 9,551 2.9 13,250 4 333,995

Department of Public Works – Vote 5 – Annual Report 2008/09
- 122 -
HR OVERSIGHT - APRIL 2008 to MARCH 2009 - Eastern Cape - Public Works
TABLE 5.2.4 - Salaries, Overtime, Home Owners Allowance and Medical Aid by Salary Band
Salary bands Salaries
(R'000)
Salaries as
% of
Personnel
Cost
Overtime
(R'000)
Overtime
as % of
Personnel
Cost
HOA
(R'000)
HOA as %
of
Personnel
Cost
Medical
Ass.
(R'000)
Medical
Ass. as %
of
Personnel
Cost
Total
Personn
el Cost
per
Salary
Band
(R'000)
Lower skilled (Levels 1-2) 18,427 68 39 0 1,881 7 1,593 6 27,198
Skilled (Levels 3-5) 42,837 72 190 0 2,996 5 3,110 5 59,615
Highly skilled production (Levels 6-
8) 99,124 71 333 0 3,574 3 6,466 5 140,322
Highly skilled supervision (Levels 9-
12) 49,890 68 74 0 842 1 1,813 3 73,439
Senior management (Levels 13-16) 9,874 74 0 0 250 2 250 2 13,403
Contract (Levels 1-2) 20 100 0 0 0 0 0 0 20
Contract (Levels 3-5) 713 99 4 1 0 0 0 0 717
Contract (Levels 6-8) 3,911 99 0 0 0 0 0 0 3,944
Contract (Levels 9-12) 5,991 90 0 0 8 0 19 0 6,627
Contract (Levels 13-16) 2,401 93 0 0 0 0 0 0 2,580
TOTAL 233,188 71 640 0 9,551 3 13,251 4 327,865

Department of Public Works – Vote 5 – Annual Report 2008/09
- 123 -
HR OVERSIGHT - APRIL 2008 to MARCH 2009 - Eastern Cape - Public Works
Employment and vacancies
TABLE 5.3.1 - Employment and Vacancies by Programme at end of period
Programme Number of
Posts
Number of
Posts Filled
Vacancy Rate Number of
Posts Filled
Additional to
the
Establishment
Programme 1: Administration 851 540 36.5 88
Programme 2: Public Works 2602 1267 51.3 198
Programme 3: Community based Public Works programme 104 47 54.8 3
TOTAL 3557 1854 47.9 289
TABLE 5.3.2- Employment and Vacancies by Salary Band at end of period
Salary Band Number of
Posts
Number of
Posts Filled
Vacancy Rate Number of
Posts Filled
Additional to
the
Establishment
Lower skilled (Levels 1-2), Permanent 1193 669 43.9 92
Skilled (Levels 3-5), Permanent 818 298 63.6 49
Highly skilled production (Levels 6-8), Permanent 1087 617 43.2 95
Highly skilled supervision (Levels 9-12), Permanent 377 194 48.5 8
Senior management (Levels 13-16), Permanent 28 22 21.4 1
Contract (Levels 3-5), Permanent 9 9 0 9
Contract (Levels 6-8), Permanent 23 23 0 22
Contract (Levels 9-12), Permanent 20 20 0 11
Contract (Levels 13-16), Permanent 2 2 0 2
TOTAL 3557 1854 47.9 289

Department of Public Works – Vote 5 – Annual Report 2008/09
- 124 -
HR OVERSIGHT - APRIL 2008 to MARCH 2009 - Eastern Cape - Public Works
TABLE 5.3.3 - Employment and Vacancies by Critical Occupation at end of period
Critical Occupations Number of
Posts
Number of
Posts Filled
Vacancy Rate Number of Posts
Filled Additional to
the Establishment
Administrative related, Permanent 68 46 32.4 2
All artisans in the building metal machinery etc., Permanent 1549 700 54.8 107
Appraisers-valuers and related professionals, Permanent 86 43 50 2
Architects town and traffic planners, Permanent 27 14 48.1 2
Artisan project and related superintendents, Permanent 42 27 35.7 1
Attorneys, Permanent 1 0 100 0
Auxiliary and related workers, Permanent 7 1 85.7 1
Building and other property caretakers, Permanent 44 14 68.2 2
Bus and heavy vehicle drivers, Permanent 55 32 41.8 3
Cartographers and surveyors, Permanent 6 5 16.7 0
Cartographic surveying and related technicians, Permanent 51 24 52.9 2
Cleaners in offices workshops hospitals etc., Permanent 176 139 21 73
Client inform clerks, Permanent 5 2 60 0
Communication and information related, Permanent 3 2 33.3 0
Emergency services related, Permanent 1 1 0 0
Engineering sciences related, Permanent 21 11 47.6 6
Engineers and related professionals, Permanent 51 20 60.8 7
Finance and economics related, Permanent 1 0 100 0
Financial and related professionals, Permanent 91 45 50.5 0
Financial clerks and credit controllers, Permanent 105 60 42.9 7
Fire fighting and related workers, Permanent 2 2 0 0

Department of Public Works – Vote 5 – Annual Report 2008/09
- 125 -
Critical Occupations Number of
Posts
Number of
Posts Filled
Vacancy Rate Number of Posts
Filled Additional to
the Establishment
Mechanical engineering technicians, Permanent
5
3
40
0
Messengers porters and deliverers, Permanent
5
4
20
0
Motor vehicle drivers, Permanent 11 9 18.2 0
Other administrator & related clerks and organisers,
Permanent
6
3
50
0
Other administrative policy and related officers, Permanent 7 4 42.9 0
Other information technology personnel., Permanent 14 9 35.7 2
Other occupations, Permanent 1 1 0 0
Quantity surveyors & related professionals not classed
elsewhere, Permanent
32 20 37.5 9
Risk management and security services, Permanent 17 8 52.9 0
Road trade workers., Permanent 1 1 0 1
Road workers, Permanent 11 8 27.3 8
Safety health and quality inspectors, Permanent 13 6 53.8 1
Secretaries & other keyboard operating clerks, Permanent 33 23 30.3 3
Security officers, Permanent 387 198 48.8 0
Senior managers, Permanent 31 26 16.1 4
TOTAL 3557 1854 47.9 289

Department of Public Works – Vote 5 – Annual Report 2008/09
- 126 -
HR OVERSIGHT - APRIL 2008 to MARCH 2009 - Eastern Cape - Public Works
Job evaluation
TABLE 5.4.1-Job Evaluation
Salary Band Number of
Posts
Number of
Jobs
Evaluated
% of Posts
Evaluated
Number of
Posts
Upgraded
% of
Upgraded
Posts
Evaluated
Number of
Posts
Downgraded
% of
Downgraded
Posts Evaluated
Lower skilled (Levels 1-2) 1193 0 0 0 0 0 0
Contract (Levels 3-5) 9 0 0 0 0 0 0
Contract (Levels 6-8) 23 0 0 0 0 0 0
Contract (Levels 9-12) 20 0 0 0 0 0 0
Contract (Band B) 1 0 0 0 0 0 0
Contract (Band D) 1 0 0 0 0 0 0
Skilled (Levels 3-5) 818 0 0 0 0 0 0
Highly skilled production (Levels 6-8) 1087 0 0 0 0 0 0
Highly skilled supervision (Levels 9-
12) 377 1 0.3 0 0 0 0
Senior Management Service Band A 8 0 0 0 0 0 0
Senior Management Service Band B 18 0 0 0 0 0 0
Senior Management Service Band C 2 0 0 0 0 0 0
TOTAL 3557 1 0 0 0 0 0
TABLE 5.4.2 - Profile of employees whose positions were upgraded due to their posts being upgraded
Beneficiaries African Asian Coloured White Total
Female 0 0 0 0 0
Male 0 0 0 0 0
Total 0 0 0 0 0
Employees with a Disability 0 0 0 0 0

Department of Public Works – Vote 5 – Annual Report 2008/09
- 127 -
HR OVERSIGHT - APRIL 2008 to MARCH 2009 - Eastern Cape - Public Works
TABLE 5.4.3 - Employees whose salary level exceed the grade determined by Job Evaluation [i.t.o PSR 1.V.C.3]
Occupation Number of
Employees
Job Evaluation
Level
Remuneration
Level
Reason for
Deviation
No of
Employees in
Dept
0 0 0 0 0 0
0 0 0 0 0 0
Total 0 0 0 0 0
Percentage of Total Employment 0 0 0 0 0
TABLE 5.4.4 - Profile of employees whose salary level exceeded the grade determined by job evaluation [i.t.o. PSR 1.V.C.3]
Beneficiaries African Asian Coloured White Total
Female 0 0 0 0 0
Male 0 0 0 0 0
Total 0 0 0 0 0
Employees with a Disability 0 0 0 0 0

Department of Public Works – Vote 5 – Annual Report 2008/09
- 128 -
HR OVERSIGHT - APRIL 2008 to MARCH 2009 - Eastern Cape - Public Works
Employment changes
TABLE 5.5.1 - Annual Turnover Rates by Salary Band
Salary Band Employment at
Beginning of
Period (April
2008)
Appointments Terminations Turnover Rate
Lower skilled (Levels 1-2), Permanent 727 9 20 2.8
Skilled (Levels 3-5), Permanent 257 24 39 15.2
Highly skilled production (Levels 6-8), Permanent 650 57 25 3.8
Highly skilled supervision (Levels 9-12), Permanent 135 11 8 5.9
Senior Management Service Band A, Permanent 17 1 0 0
Senior Management Service Band B, Permanent 1 0 2 200
Contract (Levels 1-2), Permanent 0 2 2 0
Contract (Levels 3-5), Permanent 7 47 44 628.6
Contract (Levels 6-8), Permanent 15 34 25 166.7
Contract (Levels 9-12), Permanent 12 11 6 50
Contract (Band A), Permanent 1 1 0 0
Contract (Band C), Permanent 1 0 0 0
TOTAL 1823 197 171 9.4

Department of Public Works – Vote 5 – Annual Report 2008/09
- 129 -
HR OVERSIGHT - APRIL 2008 to MARCH 2009 - Eastern Cape - Public Works
TABLE 5.5.2 - Annual Turnover Rates by Critical Occupation
Occupation Employment at
Beginning of
Period (April
2008)
Appointments Terminations Turnover Rate
Administrative related, Permanent 40 6 3 7.5
All artisans in the building metal machinery etc., Permanent 856 7 44 5.1
Appraisers-valuers and related professionals, Permanent 1 1 1 100
Architects town and traffic planners, Permanent 0 3 0 0
Artisan project and related superintendents, Permanent 55 0 2 3.6
Building and other property caretakers, Permanent 9 0 0 0
Bus and heavy vehicle drivers, Permanent 45 0 3 6.7
Cartographers and surveyors, Permanent 4 0 0 0
Cartographic surveying and related technicians, Permanent 10 1 0 0
Cleaners in offices workshops hospitals etc., Permanent 68 9 4 5.9
Communication and information related, Permanent 5 1 0 0
Computer programmers., Permanent 0 0 0 0
Custodian personnel, Permanent 8 0 0 0
Engineering sciences related, Permanent 28 5 4 14.3
Engineers and related professionals, Permanent 22 1 2 9.1
Finance and economics related, Permanent 0 0 0 0
Financial and related professionals, Permanent 38 4 1 2.6
Financial clerks and credit controllers, Permanent 16 10 3 18.8
Fire fighting and related workers, Permanent 3 0 0 0
Food services aids and waiters, Permanent 1 0 0 0
Housekeepers laundry and related workers, Permanent 0 2 0 0
Human resources & organisational development & relate
professionals, Permanent 11 8 2 18.2
Human resources clerks, Permanent 36 2 3 8.3
Human resources related, Permanent 8 8 4 50

Department of Public Works – Vote 5 – Annual Report 2008/09
- 130 -
Occupation Employment at
Beginning of
Period (April
2008)
Appointments Terminations Turnover Rate
Inspectors of apprentices works and vehicles, Permanent 79 5 6 7.6
Library mail and related clerks, Permanent 17 52 47 276.5
Light vehicle drivers, Permanent 2 0 0 0
Logistical support personnel, Permanent 30 17 3 10
Material-recording and transport clerks, Permanent 24 2 2 8.3
Mechanical engineering technicians, Permanent 1 1 0 0
Messengers porters and deliverers, Permanent 4 0 0 0
Meteorologists statistical & related technicians, Permanent 1 0 0 0
Motor vehicle drivers, Permanent 5 2 0 0
Other administrators & related clerks and organisers,
Permanent 35 4 4 11.4
Other administrative policy and related officers, Permanent 96 2 1 1
Other information technology personnel., Permanent 7 4 0 0
Other occupations, Permanent 58 0 1 1.7
Quantity surveyors & related professionals not classed
elsewhere, Permanent 3 12 7 233.3
Rank: Unknown, Permanent 2 0 0 0
Regulatory inspectors, Permanent 1 0 0 0
Risk management and security services, Permanent 0 1 0 0
Road trade workers., Permanent 1 0 0 0
Road workers, Permanent 21 0 0 0
Safety health and quality inspectors, Permanent 5 0 0 0
Secretaries & other keyboard operating clerks, Permanent 29 9 7 24.1
Security guards, Permanent 24 0 2 8.3
Security officers, Permanent 64 16 9 14.1
Senior managers, Permanent 16 2 2 12.5
Trade labourers, Permanent 28 0 4 14.3
Trade related, Permanent 3 0 0 0

Department of Public Works – Vote 5 – Annual Report 2008/09
- 131 -
Occupation Employment at
Beginning of
Period (April
2008)
Appointments Terminations Turnover Rate
Water plant and related operators, Permanent 3 0 0 0
TOTAL 1823 197 171 9.4
TABLE 5.5.3 - Reasons why staff are leaving the department
Termination Type Number Percentage of
Total
Resignations
Percentage of
Total
Employment
Total Total
Employment
Death, Permanent 40 23.4 2.2 171 1832
Resignation, Permanent 14 8.2 0.8 171 1832
Expiry of contract, Permanent 75 43.9 4.1 171 1832
Discharged due to ill health, Permanent 2 1.2 0.1 171 1832
Dismissal-misconduct, Permanent 7 4.1 0.4 171 1832
Retirement, Permanent 33 19.3 1.8 171 1832
TOTAL 171 100 9.3 171 1832
Resignations as % of Employment
9.3

Department of Public Works – Vote 5 – Annual Report 2008/09
- 132 -
HR OVERSIGHT - APRIL 2008 to MARCH 2009 - Eastern Cape - Public Works
TABLE 5.5.4 - Promotions by Critical Occupation
Occupation Employment at
Beginning of
Period (April
2008)
Promotions to
another Salary
Level
Salary Level
Promotions as
a % of
Employment
Progressions
to another
Notch within
Salary Level
Notch
progressions
as a % of
Employment
Administrative related 40 8 20 17 42.5
All artisans in the building metal machinery etc. 856 14 1.6 476 55.6
Appraisers-valuers and related professionals 1 5 500 1 100
Architects town and traffic planners 0 0 0 2 0
Artisan project and related superintendents 55 6 10.9 31 56.4
Building and other property caretakers 9 0 0 10 111.1
Bus and heavy vehicle drivers 45 0 0 41 91.1
Cartographers and surveyors 4 0 0 3 75
Cartographic surveying and related technicians 10 0 0 3 30
Cleaners in offices workshops hospitals etc. 68 0 0 31 45.6
Client inform clerks 1 0 0 0 0
Communication and information related 5 0 0 0 0
Computer programmers. 0 0 0 0 0
Custodian personnel 8 0 0 2 25
Engineering sciences related 28 8 28.6 2 7.1
Engineers and related professionals 22 2 9.1 5 22.7
Finance and economics related 0 0 0 0 0
Financial and related professionals 38 7 18.4 15 39.5
Financial clerks and credit controllers 16 4 25 15 93.8
Fire fighting and related workers 3 0 0 2 66.7
Human resources & organisational development & related
professionals 11 2 18.2 12 109.1
Human resources clerks 36 2 5.6 23 63.9
Human resources related 8 9 112.5 8 100
Inspectors of apprentices works and vehicles 79 17 21.5 22 27.8

Department of Public Works – Vote 5 – Annual Report 2008/09
- 133 -
Occupation Employment at
Beginning of
Period (April
2008)
Promotions to
another Salary
Level
Salary Level
Promotions as
a % of
Employment
Progressions
to another
Notch within
Salary Level
Notch
progressions
as a % of
Employment
Language practitioners interpreters & other communicators 0 1 0 0 0
Library mail and related clerks 17 0 0 7 41.2
Light vehicle drivers 2 0 0 4 200
Logistical support personnel 30 5 16.7 24 80
Material-recording and transport clerks 24 0 0 13 54.2
Mechanical engineering technicians 1 0 0 0 0
Messengers porters and deliverers 4 0 0 3 75
Meteorologists statistical & related technicians 1 0 0 1 100
Motor vehicle drivers 5 2 40 2 40
Other administrators & related clerks and organisers 35 1 2.9 17 48.6
Other administrative policy and related officers 96 0 0 17 17.7
Other information technology personnel. 7 0 0 1 14.3
Other occupations 58 0 0 21 36.2
Quantity surveyors & related professionals not classed 3 1 33.3 2 66.7
Rank: Unknown 2 0 0 0 0
Regulatory inspectors 1 0 0 0 0
Risk management and security services 0 1 0 1 0
Road trade workers. 1 0 0 1 100
Road workers 21 0 0 7 33.3
Safety health and quality inspectors 5 1 20 5 100
Secretaries & other keyboard operating clerks 29 1 3.4 4 13.8
Security guards 24 0 0 8 33.3
Security officers 64 6 9.4 46 71.9
Senior managers 16 0 0 9 56.3
Trade labourers 28 0 0 13 46.4
Trade related 3 1 33.3 0 0
Water plant and related operators 3 0 0 1 33.3
TOTAL 1823 104 5.7 928 50.9

Department of Public Works – Vote 5 – Annual Report 2008/09
- 134 -
HR OVERSIGHT - APRIL 2008 to MARCH 2009 - Eastern Cape - Public Works
TABLE 5.5.5 - Promotions by Salary Band
Salary Band Employment
at
Beginning
of Period
(April 2008)
Promotions
to another
Salary
Level
Salary Level
Promotions
as a % of
Employment
Progressions
to another
Notch within
Salary Level
Notch
progressions
as a % of
Employment
Lower skilled (Levels 1-2), Permanent 373 0 0 217 58.2
Skilled (Levels 3-5), Permanent 556 12 2.2 327 58.8
Highly skilled production (Levels 6-8), Permanent 669 22 3.3 322 48.1
Highly skilled supervision (Levels 9-12), Permanent 176 67 38.1 52 29.5
Senior management (Levels 13-16), Permanent 20 2 10 9 45
Contract (Levels 6-8), Permanent 21 0 0 1 4.8
Contract (Levels 9-12), Permanent 14 1 7.1 0 0
Contract (Levels 13-16), Permanent 3 0 0 0 0
TOTAL 1832 104 5.7 928 50.7

Department of Public Works – Vote 5 – Annual Report 2008/09
- 135 -
HR OVERSIGHT - APRIL 2008 to MARCH 2009 - Eastern Cape - Public Works
Employment equity
TABLE 5.6.1 - Total number of Employees (incl. Employees with disabilities) per Occupational Category (SASCO)
Occupational Categories Male,
African
Male,
Colour-
ed
Male,
Indian
Male,
Total
Blacks
Male,
White
Female,
African
Female,
Colour-
ed
Female,
Indian
Female
Total
Blacks
Female,
White
Total
Legislators, senior officials and
managers, Permanent 9 3 1 13 5 2 0 0 2 1 21
Professionals, Permanent 187 11 3 201 27 189 7 1 197 8 433
Clerks, Permanent 61 0 0 61 1 119 4 2 125 3 190
Service and sales workers,
Permanent 109 1 0 110 2 19 0 0 19 0 131
Craft and related trades workers,
Permanent 803 12 0 815 14 33 0 0 33 0 862
Plant and machine operators and
assemblers, Permanent 53 0 0 53 0 0 0 0 0 0 53
Elementary occupations, Permanent 114 0 0 114 0 49 0 0 49 0 163
Other, Permanent 1 0 0 1 0 0 0 0 0 0 1
TOTAL 1337 27 4 1368 49 411 11 3 425 12 1854
Employees with disabilities 11 0 0 11 0 3 0 0 3 0 14

Department of Public Works – Vote 5 – Annual Report 2008/09
- 136 -
HR OVERSIGHT - APRIL 2008 to MARCH 2009 - Eastern Cape - Public Works
TABLE5. 6.2 - Total number of Employees (incl. Employees with disabilities) per Occupational Bands
Occupational Bands Male,
African
Male,
Colour-
ed
Male,
Indian
Male,
Total
Blacks
Male,
White
Female,
African
Female,
Colour-
ed
Female,
Indian
Female,
Total
Blacks
Female,
White
Total
Top Management, Permanent 1 1 0 2 1 1 0 0 1 0 4
Senior Management, Permanent 8 1 2 11 4 2 1 0 3 0 18
Professionally qualified and
experienced specialists and mid-
management, Permanent 127 10 1 138 21 48 1 1 50 3 212
Skilled technical and academically
qualified workers, junior management,
supervisors, foremen, Permanent 396 13 1 410 14 223 8 2 233 7 664
Semi-skilled and discretionary
decision making, Permanent 488 0 0 488 2 63 0 0 63 0 553
Unskilled and defined decision
making, Permanent 300 0 0 300 1 48 0 0 48 0 349
Contract (Top Management),
Permanent 1 0 0 1 0 0 0 0 0 0 1
Contract (Senior Management),
Permanent 1 1 0 2 0 0 0 0 0 1 3
Contract (Professionally qualified),
Permanent 7 1 0 8 6 4 0 0 4 1 19
Contract (Skilled technical),
Permanent 6 0 0 6 0 15 1 0 16 0 22
Contract (Semi-skilled), Permanent 2 0 0 2 0 7 0 0 7 0 9
TOTAL 1337 27 4 1368 49 411 11 3 425 12 1854

Department of Public Works – Vote 5 – Annual Report 2008/09
- 137 -
HR OVERSIGHT - APRIL 2008 to MARCH 2009 - Eastern Cape - Public Works
TABLE 5.6.3 – Recruitment
Occupational Bands Male,
African
Male,
Colour-
ed
Male,
Indian
Male,
Total
Blacks
Male,
White
Female,
African
Female,
Coloured
Female,
Indian
Female,
Total
Blacks
Female,
White
Total
Senior Management, Permanent 0 0 0 0 1 0 0 0 0 0 1
Professionally qualified and
experienced specialists and mid-
management, Permanent 7 1 0 8 1 2 0 0 2 0 11
Skilled technical and academically
qualified workers, junior management,
supervisors, foremen, Permanent 18 0 1 19 0 37 1 0 38 0 57
Semi-skilled and discretionary
decision making, Permanent 18 0 0 18 0 6 0 0 6 0 24
Unskilled and defined decision
making, Permanent 1 0 0 1 0 8 0 0 8 0 9
Contract (Senior Management),
Permanent 0 0 0 0 0 0 0 0 0 1 1
Contract (Professionally qualified),
Permanent 5 0 0 5 2 4 0 0 4 0 11
Contract (Skilled technical),
Permanent 11 0 0 11 0 22 1 0 23 0 34
Contract (Semi-skilled), Permanent 10 0 0 10 0 37 0 0 37 0 47
Contract (Unskilled), Permanent 1 0 0 1 0 1 0 0 1 0 2
TOTAL 71 1 1 73 4 117 2 0 119 1 197

Department of Public Works – Vote 5 – Annual Report 2008/09
- 138 -
HR OVERSIGHT - APRIL 2008 to MARCH 2009 - Eastern Cape - Public Works
TABLE 5.6.4 - Promotions
Occupational Bands Male,
African
Male,
Colour-
ed
Male,
Indian
Male,
Total
Blacks
Male,
White
Female,
African
Female,
Colour-
ed
Female,
Indian
Female,
Total
Blacks
Female,
White
Total
Top Management, Permanent 0 0 0 0 1 0 0 0 0 0 1
Senior Management, Permanent 7 0 2 9 0 1 0 0 1 0 10
Professionally qualified and
experienced specialists and mid-
management, Permanent 69 6 0 75 16 26 1 1 28 0 119
Skilled technical and academically
qualified workers, junior management,
supervisors, foremen, Permanent 244 7 0 251 7 82 3 0 85 1 344
Semi-skilled and discretionary decision
making, Permanent 318 0 0 318 2 19 0 0 19 0 339
Unskilled and defined decision making,
Permanent 192 0 0 192 0 25 0 0 25 0 217
Contract (Professionally qualified),
Permanent 1 0 0 1 0 0 0 0 0 0 1
Contract (Skilled technical), Permanent 0 0 0 0 0 1 0 0 1 0 1
TOTAL 831 13 2 846 26 154 4 1 159 1 1032
Employees with disabilities 8 0 0 8 0 2 0 0 2 0 10

Department of Public Works – Vote 5 – Annual Report 2008/09
- 139 -
HR OVERSIGHT - APRIL 2008 to MARCH 2009 - Eastern Cape - Public Works
TABLE 5.6.5 - Terminations
Occupational Bands Male,
African
Male,
Colour-
ed
Male,
Indian
Male,
Total
Blacks
Male,
White
Female,
African
Female,
Colour-
ed
Female,
Indian
Female,
Total
Blacks
Female,
White
Total
Senior Management, Permanent 2 0 0 2 0 0 0 0 0 0 2
Professionally qualified and experienced
specialists and mid-management,
Permanent 5 1 0 6 1 1 0 0 1 0 8
Skilled technical and academically
qualified workers, junior management,
supervisors, foremen, Permanent 20 1 0 21 1 3 0 0 3 0 25
Semi-skilled and discretionary decision
making, Permanent 35 0 0 35 0 4 0 0 4 0 39
Unskilled and defined decision making,
Permanent 18 0 0 18 0 2 0 0 2 0 20
Contract (Professionally qualified),
Permanent 4 0 0 4 1 1 0 0 1 0 6
Contract (Skilled technical), Permanent 11 0 0 11 0 13 1 0 14 0 25
Contract (Semi-skilled), Permanent 8 0 0 8 0 36 0 0 36 0 44
Contract (Unskilled), Permanent 1 0 0 1 0 1 0 0 1 0 2
TOTAL 104 2 0 106 3 61 1 0 62 0 171

Department of Public Works – Vote 5 – Annual Report 2008/09
- 140 -
HR OVERSIGHT - APRIL 2008 to MARCH 2009 - Eastern Cape - Public Works
TABLE 5.6.6 - Disciplinary Action
Disciplinary action Male,
African
Male,
Colour-
ed
Male,
Indian
Male,
Total
Blacks
Male,
White
Female,
African
Female,
Colour-
ed
Female,
Indian
Female,
Total
Blacks
Female,
White
Total
Dismissal 5 0 0 5 0 1 0 0 1 0 6
Final written warning 10 0 0 10 0 6 0 0 6 0 16
No outcome 6 0 0 6 0 0 0 0 0 0 6
Suspended without payment 6 0 0 6 1 0 0 0 0 0 7
Written warning 0 0 0 0 1 0 0 0 0 0 1
TOTAL 27 0 0 27 2 7 0 0 7 0 36
TABLE 5.6.7 - Skills Development
Occupational Categories Male,
African
Male,
Colour-
ed
Male,
Indian
Male,
Total
Blacks
Male,
White
Female,
African
Female,
Coloure
d
Female,
Indian
Female,
Total
Blacks
Female,
White
Total
Legislators, Senior Officials and Managers 0 0 0 0 0 0 0 0 0 0 0
Professionals 0 0 0 0 0 0 0 0 0 0 0
Technicians and Associate Professionals 0 0 0 0 0 0 0 0 0 0 0
Clerks 0 0 0 0 0 0 0 0 0 0 0
Service and Sales Workers 0 0 0 0 0 0 0 0 0 0 0
Skilled Agriculture and Fishery Workers 0 0 0 0 0 0 0 0 0 0 0
Craft and related Trades Workers 0 0 0 0 0 0 0 0 0 0 0
Plant and Machine Operators and
Assemblers 0 0 0 0 0 0 0 0 0 0 0
Elementary Occupations 0 0 0 0 0 0 0 0 0 0 0
TOTAL 0 0 0 0 0 0 0 0 0 0 0
Employees with disabilities 0 0 0 0 0 0 0 0 0 0 0

Department of Public Works – Vote 5 – Annual Report 2008/09
- 141 -
HR OVERSIGHT - APRIL 2008 to MARCH 2009 - Eastern Cape - Public Works
Signing of Performance Agreements by SMS Members
TABLE No. 5.7.1 – Signing of performance agreements by SMS Members as on 30 September 2008
SMS Level Total Number of Funded SMS Posts Per Level
Total Number of SMS Members Per Level
Total Number of Signed Performance Agreements Per Level
Signed Performance Agreements as % of Total Number of SMS Members Per Level
Director-General/Head of Department
1 (level 15) 1 (level 14 employee acting in the post)
1 100%
Salary Level 16, but not HOD n/a n/a n/a n/a
Salary Level 15 1 1 1 100%
Salary Level 14 3 2 2 100%
Salary Level 13 22 18 18 100%
TOTAL 27 22 22 100%
TABLE No. 5.7.2 – Reasons for not having concluded Performance Agreements for SMS members as on 30 September 2008
1. -
2. -
TABLE No. 5.7.3 – Disciplinary steps taken against SMS members for not having concluded Performance Agreements for SMS members as on 30
September 2008
1. -
2. -

Department of Public Works – Vote 5 – Annual Report 2008/09
- 142 -
HR OVERSIGHT - APRIL 2008 to MARCH 2009 - Eastern Cape - Public Works
TABLE No. 5.7.4 –SMS posts information as on 31 March 2009
SMS Level Total Number of Funded SMS Posts Per Level
Total Number of SMS Posts Filled Per Level
% of SMS Posts Filled Per Level
Total Number of SMS posts Vacant Per Level
% of SMS Posts Vacant Per Level
Director-General/Head of Department
1 (level 15) 1 (secondment from National Dept of Public Works)
100% 0 0%
Salary Level 16, but not HOD
n/a n/a n/a n/a n/a
Salary Level 15 1 1 100% 0 0%
Salary Level 14 5 2 40% 3 60%
Salary Level 13 24 22 92% 2 8%
TOTAL 31 26 84% 5 16%

Department of Public Works – Vote 5 – Annual Report 2008/09
- 143 -
HR OVERSIGHT - APRIL 2008 to MARCH 2009 - Eastern Cape - Public Works
Performance rewards
TABLE 5.8.1 - Performance Rewards by Race, Gender and Disability
Demographics Number of Beneficiaries
Total Employment Percentage of Total
Employment
Cost (R'000) Average Cost per Beneficiary
(R’000)
African, Female 167 408 9.01% 1,395 8
African, Male 323 1326 17.42% 2,472 8
Asian, Female 1 3 0.05% 5 5
Asian, Male 2 4 0.11% 56 28
Coloured, Female 5 11 0.27% 78 16
Coloured, Male 9 27 0.49% 127 14
Total Blacks, Female 173 422 9.33% 1,478 9
Total Blacks, Male 334 1357 18.02% 2,656 8
White, Female 5 12 0.27% 37 7
White, Male 18 49 0.97% 264 15
Employees with a disability 4 14 0.22% 32 8
TOTAL 534 1854 56.15% 4,467 8

Department of Public Works – Vote 5 – Annual Report 2008/09
- 144 -
HR OVERSIGHT - APRIL 2008 to MARCH 2009 - Eastern Cape - Public Works
TABLE 5.8.2 - Performance Rewards by Salary Band for Personnel below Senior Management Service
Salary Band Number of
Beneficiaries
Total
Employment
Percentage of
Total
Employment
Cost (R'000) Average Cost
per
Beneficiary (R)
Lower skilled (Levels 1-2) 74 348 21.3 250 3,378
Skilled (Levels 3-5) 134 553 24.2 578 4,313
Highly skilled production (Levels 6-8) 228 665 34.3 2,004 8,789
Highly skilled supervision (Levels 9-12) 95 212 44.8 1,465 15,421
Contract (Levels 3-5) 0 9 0 0 0
Contract (Levels 6-8) 0 22 0 0 0
Contract (Levels 9-12) 1 19 5.3 18 18,000
Abnormal Appointment 0 344 0 0 0
TOTAL 532 2172 24.5 4,315 8,111

Department of Public Works – Vote 5 – Annual Report 2008/09
- 145 -
HR OVERSIGHT - APRIL 2008 to MARCH 2009 - Eastern Cape - Public Works
TABLE 5.8.3 - Performance Rewards by Critical Occupation
Critical Occupations Number of Beneficiaries
Total Employment
Percentage of Total
Employment
Cost (R'000)
Average Cost per
Beneficiary (R'000)
Administrative related 28 59 47.46% 368 13
All artisans in the building metal machinery etc. 149 731 20.38% 857 6
Appraisers-valuers and related professionals 7 17 41.18% 76 11
Architects town and traffic planners 2 6 33.33% 15 8
Artisan project and related superintendents 23 58 39.66% 281 12
Building and other property caretakers 7 16 43.75% 24 3
Bus and heavy vehicle drivers 20 42 47.62% 104 5
Cartographers and surveyors 2 5 40.00% 37 18
Cartographic surveying and related technicians 4 9 44.44% 37 9
Civil engineering technicians 0 1 0.00% 0 0
Cleaners in offices workshops hospitals etc. 32 91 35.16% 120 4
Client inform clerks 1 1 100.00% 5 5
Communication and information related 0 4 0.00% 0 0
Computer programmers. 1 1 100.00% 5 5
Custodian personnel 2 2 100.00% 39 19
Engineering sciences related 10 27 37.04% 189 19
Engineers and related professionals 8 24 33.33% 143 18
Finance and economics related 0 1 0.00% 0 0
Financial and related professionals 28 54 51.85% 330 12
Financial clerks and credit controllers 12 55 21.82% 103 9
Fire fighting and related workers 1 2 50.00% 6 6
General legal administration & rel. professionals 0 1 0.00% 0 0
Housekeepers laundry and related workers 0 2 0.00% 0 0
Human resources & organisational development & relate professionals 14 32 43.75% 155 11
Human resources clerks 24 38 63.16% 158 7

Department of Public Works – Vote 5 – Annual Report 2008/09
- 146 -
Critical Occupations Number of Beneficiaries
Total Employment
Percentage of Total
Employment
Cost (R'000)
Average Cost per
Beneficiary (R'000)
Human resources related 16 37 43.24% 270 17
Information technology related 1 1 100.00% 38 38
Inspectors of apprentices works and vehicles 27 68 39.71% 257 10
Language practitioners interpreters & other communicators 0 2 0.00% 0 0
Library mail and related clerks 6 24 25.00% 41 7
Light vehicle drivers 3 4 75.00% 13 4
Logistical support personnel 26 75 34.67% 234 9
Material-recording and transport clerks 7 19 36.84% 36 5
Mechanical engineering technicians 0 3 0.00% 0 0
Messengers porters and deliverers 2 3 66.67% 7 4
Meteorologists statistical & related technicians 0 1 0.00% 0 0
Motor vehicle drivers 1 6 16.67% 7 7
Other administrators & related clerks and organisers 9 28 32.14% 54 6
Other administrative policy and related officers 20 44 45.45% 242 12
Other information technology personnel. 2 8 25.00% 16 8
Other occupations 3 28 10.71% 13 4
Quantity surveyors & related professional not classed elsewhere 1 15 6.67% 5 5
Rank: Unknown 0 1 0.00% 0 0
Risk management and security services 1 5 20.00% 10 10
Road trade workers. 0 1 0.00% 0 0
Road workers 1 12 8.33% 7 7
Safety health and quality inspectors 3 6 50.00% 26 9
Secretaries & other keyboard operating clerks 3 23 13.04% 28 9
Security guards 2 15 13.33% 9 5
Security officers 19 107 17.76% 76 4
Senior managers 0 20 0.00% 0 0
Trade labourers 5 14 35.71% 20 4
Trade quality controllers 1 1 100.00% 5 5

Department of Public Works – Vote 5 – Annual Report 2008/09
- 147 -
Critical Occupations Number of Beneficiaries
Total Employment
Percentage of Total
Employment
Cost (R'000)
Average Cost per
Beneficiary (R'000)
Trade related 0 3 0.00% 0 0
Water plant and related operators 0 1 0.00% 0 0
TOTAL 534 1854 28.80% 4,467 8.37
TABLE 5.8.3 - Performance Rewards by Critical Occupation (Continued)
Critical Occupations Number of
Beneficiaries
Total
Employment
Percentage
of Total
Employment
Cost
(R'000)
Average
Cost per
Beneficiary
(R)
Senior managers 0 20 0 0 0
Trade labourers 5 14 35.7 20 4,000
Trade quality controllers 1 1 100 5 5,000
Trade related 0 3 0 0 0
Water plant and related operators 0 1 0 0 0
TOTAL 25 146 17.1 99 3,960
TABLE 5.8.4 - Performance Related Rewards (Cash Bonus) by Salary Band for Senior Management Service
SMS Band Number of
Beneficiaries
Total
Employment
Percentage
of Total
Employment
Cost
(R'000)
Average
Cost per
Beneficiary
(R)
% of SMS
Wage Bill
Personnel
Cost SMS
(R'000)
Band A 2 0 0 48 2,400 0.4 10,814
Band B 0 21 0 0 0 0 0
Band C 0 2 0 0 0 0 0
Band D 0 3 0 0 0 0 0
TOTAL 2 26 7.7 48 2,400 0.4 10,814

Department of Public Works – Vote 5 – Annual Report 2008/09
- 148 -
HR OVERSIGHT - APRIL 2008 to MARCH 2009 - Eastern Cape - Public Works
Foreign workers
TABLE 5.9.1 - Foreign Workers by Salary Band
Salary Band Employment
at Beginning
Period
Percentage
of Total
Employ-
ment at
End of
Period
Percentage
of Total
Change
in
Employ-
ment
Percentage
of Total
Total
Employment
at Beginning
of Period
Total
Employment
at End of
Period
Total
Change in
Employ-
ment
Highly skilled supervision
(Levels 9-12) 5 45.5 1 10 -1 100 11 10 -1
Contract (Levels 9-12) 5 45.5 9 90 0 0 11 10 -1
TOTAL 10 90.9 10 100 -1 100 11 10 -1
TABLE 5.9.2 - Foreign Workers by Major Occupation
Major Occupation Employment
at Beginning
Period
Percentage
of Total
Employ-
ment at
End of
Period
Percentage
of Total
Change
in
Employ-
ment
Percentage
of Total
Total
Employment
at Beginning
of Period
Total
Employment
at End of
Period
Total
Change in
Employ-
ment
Professionals and managers 5 45.5 10 100 -1 100 11 10 -1
TOTAL 5 45.5 10 100 -1 100 11 10 -1

Department of Public Works – Vote 5 – Annual Report 2008/09
- 149 -
HR OVERSIGHT - APRIL 2008 to MARCH 2009 - Eastern Cape - Public Works
Leave utilisation for the period 1 April 2008 to 31 March 2009
TABLE 5.10.1 - Sick Leave for Jan 2008 to Dec 2008
Salary Band Total Days % Days with
Medical
Certification
Number of
Employees
using Sick
Leave
% of Total
Employees
using Sick
Leave
Average
Days per
Employee
Estimated
Cost
(R'000)
Total
number of
Employees
using Sick
Leave
Total
number of
days with
medical
certification
Lower skilled (Levels 1-2) 1819 93.6 197 17.6 9 340 1119 1703
Skilled (Levels 3-5) 2637 95.5 289 25.8 9 606 1119 2518
Highly skilled production (Levels 6-
8) 3750 87.7 455 40.7 8 1,786 1119 3287
Highly skilled supervision (Levels 9-
12) 1109 86.4 137 12.2 8 974 1119 958
Senior management (Levels 13-16) 66 95.5 11 1 6 146 1119 63
Contract (Levels 3-5) 13 38.5 5 0.4 3 4 1119 5
Contract (Levels 6-8) 62 54.8 18 1.6 3 27 1119 34
Contract (Levels 9-12) 32 87.5 5 0.4 6 36 1119 28
Contract (Levels 13-16) 6 0 2 0.2 3 17 1119 0
TOTAL 9494 90.5 1119 100 8 3,936 1119 8596

Department of Public Works – Vote 5 – Annual Report 2008/09
- 150 -
HR OVERSIGHT - APRIL 2008 to MARCH 2009 - Eastern Cape - Public Works
TABLE 5.10.2 - Disability Leave (Temporary and Permanent) for Jan 2008 to Dec 2008
Salary Band Total Days % Days with
Medical
Certification
Number of
Employees
using
Disability
Leave
% of Total
Employees
using
Disability
Leave
Average
Days per
Employee
Estimated
Cost
(R'000)
Total
number of
days with
medical
certification
Total
number of
Employees
using
Disability
Leave
Lower skilled (Levels 1-2) 145 100 10 25.6 15 27 145 39
Skilled (Levels 3-5) 143 100 17 43.6 8 35 143 39
Highly skilled production (Levels 6-
8) 264 100 10 25.6 26 134 264 39
Highly skilled supervision (Levels 9-
12) 85 100 2 5.1 43 57 85 39
TOTAL 637 100 39 100 16 253 637 39
TABLE 5.10.3 - Annual Leave for Jan 2008 to Dec 2008
Salary Band Total Days
Taken
Average days
per Employee
Number of
Employees
who took leave
Lower skilled (Levels 1-2) 9809.16 26 372
Skilled (Levels 3-5) 15090.32 26 580
Highly skilled production (Levels 6-8) 16331 23 705
Highly skilled supervision (Levels 9-12) 4923 22 224
Senior management (Levels 13-16) 475 20 24
Contract (Levels 3-5) 41 3 12
Contract (Levels 6-8) 213 11 20
Contract (Levels 9-12) 234 12 20
Contract (Levels 13-16) 63 16 4
TOTAL 47179.48 24 1961

Department of Public Works – Vote 5 – Annual Report 2008/09
- 151 -
HR OVERSIGHT - APRIL 2008 to MARCH 2009 - Eastern Cape - Public Works
TABLE 5.10.4 - Capped Leave for Jan 2008 to Dec 2008
Salary Band Total days of
capped leave
taken
Average
number of
days taken per
employee
Average
capped leave
per employee
as at 31
December
2008
Number of
Employees
who took
Capped leave
Total number
of capped
leave available
at 31
December
2008
Number of
Employees as
at 31
December
2008
Lower skilled (Levels 1-2) 466 8 137 59 41962 306
Skilled (Levels 3-5) 864 11 169 80 80636 476
Highly skilled production (Levels 6-8) 475 8 181 63 88247 488
Highly skilled supervision (Levels 9-12) 88 5 151 17 19904 132
TOTAL 1893 9 165 219 230749 1402
TABLE 5.10.5 - Leave Payouts
Reason Total Amount
(R'000)
Number of
Employees
Average
Payment per
Employee (R)
Capped leave payouts on termination of service for
2008/09 728 124 5871
Current leave payout on termination of service for
2008/09 18 6 3000
TOTAL 746 130 5738

Department of Public Works – Vote 5 – Annual Report 2008/09
- 152 -
HR OVERSIGHT - APRIL 2008 to MARCH 2009 - Eastern Cape - Public Works
HIV/AIDS & Health promotion programmes
TABLE 5.11.1 - Steps taken to reduce the risk of occupational exposure
Units/categories of employees identified to be at high risk of contracting HIV & related diseases (if any) Key steps taken to
reduce the risk
Employees disclose their status voluntarily. None disclosed. -
TABLE 5.11.2 - Details of Health Promotion and HIV/AIDS Programmes
Question Yes No Details, if yes
1. Has the department designated a member of the SMS to implement
the provisions contained in Part VI E of Chapter 1 of the Public Service
Regulations, 2001? If so, provide her/his name and position.
Yes
CJJ Heydenrych, Senior Manager: HRM
2. Does the department have a dedicated unit or have you designated
specific staff members to promote health and well being of your
employees? If so, indicate the number of employees who are involved
in this task and the annual budget that is available for this purpose. Yes
8 units; R2,528,671
3. Has the department introduced an Employee Assistance or Health
Promotion Programme for your employees? If so, indicate the key
elements/services of the programme. Yes
Prevention; advocacy; information sharing sessions; information booklets,
posters, presentations, build-up events; observation of calendar events, e.g.
STIs, condom week, world AIDS day. Men's health awarenesses; TB
awarenesses; breast cancer awarenesses; peer education training
presentations; candle light; care and support
4. Has the department established (a) committee(s) as contemplated
in Part VI E.5 (e) of Chapter 1 of the Public Service Regulations,
2001? If so, please provide the names of the members of the
committee and the stakeholder(s) that they represent. Yes Safety officers; coordinators; peer educators; lay councillors
5. Has the department reviewed the employment policies and
practices of your department to ensure that these do not unfairly Yes
A systematic review is underway

Department of Public Works – Vote 5 – Annual Report 2008/09
- 153 -
Question Yes No Details, if yes
discriminate against employees on the basis of their HIV status? If so,
list the employment policies/practices so reviewed.
6. Has the department introduced measures to protect HIV-positive
employees or those perceived to be HIV-positive from discrimination?
If so, list the key elements of these measures. Yes
Prevention; advocacy; information sharing sessions; information booklets,
posters, presentations, build-up events; participation in calendar events, e.g.
STIs, condom week, world AIDS day. Men's health awarenesses; TB
awarenesses; breast cancer awarenesses; peer education training
presentations; candle light; care and support
7. Does the department encourage its employees to undergo
Voluntary Counselling and Testing? If so, list the results that you have
achieved. Yes Ability to better assist the affected employees and their families
8. Has the department developed measures/indicators to monitor &
evaluate the impact of your health promotion programme? If so, list
these measures/indicators. Yes Not yet documented
TABLE 5.12 - Collective Agreements
Subject Matter Date
0 0
TABLE 5.13 - Misconduct and Discipline Hearings Finalised
Outcomes of disciplinary hearings Number Percentage of
Total
Total
Dismissal 6 16.2 37
Final written warning 16 43.2 37
No outcome 7 18.9 37
Suspended without payment 7 18.9 37
Written warning 1 2.7 37
TOTAL 37 100 37

Department of Public Works – Vote 5 – Annual Report 2008/09
- 154 -
HR OVERSIGHT - APRIL 2008 to MARCH 2009 - Eastern Cape - Public Works
Labour relations
TABLE 5.14.1 - Types of Misconduct Addressed and Disciplinary Hearings
Type of misconduct Number Percentage of
Total
Total
Absent from work without reason or permission 5 13.5 37
Assault/attempts or threatens to assault a person 1 2.7 37
Conduct self in improper/unacceptable manner 1 2.7 37
Contravenes any code of conduct for state 5 13.5 37
Fails to comply with or contravenes an act 7 18.9 37
Possesses or wrongfully uses property of state 2 5.4 37
Steals bribes or commits fraud 12 32.4 37
Wilfully or negligently mismanages finances 4 10.8 37
TOTAL 37 100 37
TABLE 5.14.2 - Grievances Lodged
Number of grievances addressed Number Percentage of
Total
Total
Not resolved 14 73.7 19
Resolved 5 26.3 19
TOTAL 19 100 19
TABLE 5.14.3 - Disputes Lodged
Number of disputes addressed Number % of total
Upheld 0 0
Dismissed 0 0
Total 0 0

Department of Public Works – Vote 5 – Annual Report 2008/09
- 155 -
HR OVERSIGHT - APRIL 2008 to MARCH 2009 - Eastern Cape - Public Works
TABLE 5.14.4 - Strike Actions
Strike Actions Total
Total number of person working days lost 0
Total cost(R'000) of working days lost 0
Amount (R'000) recovered as a result of no work no pay 0
TABLE 5.14.5 - Precautionary Suspensions
Precautionary Suspensions Total
Number of people suspended 0
Number of people whose suspension exceeded 30 days 0
Average number of days suspended 0
Cost (R'000) of suspensions 0

Department of Public Works – Vote 5 – Annual Report 2008/09
- 156 -
HR OVERSIGHT - APRIL 2008 to MARCH 2009 - Eastern Cape - Public Works
TABLE 5.14.6 – Training Needs identified
Occupational Categories Gender Employment Learnerships Skills
Programmes
& other short
courses
Other forms
of training
Total
Legislators, senior officials and managers Female 3 0 4 - 4
Male 19 0 18 - 18
Professionals Female 82 0 47 - 47
Male 97 0 53 - 53
Technicians and associate professionals Female 100 0 36 - 36
Male 103 0 54 - 54
Clerks Female 121 0 59 - 59
Male 69 0 26 - 26
Service and sales workers Female 5 0 54 - 54
Male 101 0 31 - 31
Skilled agriculture and fishery workers Female 0 0 0 - 0
Male 0 0 0 - 0
Craft and related trades workers Female 45 0 19 - 19
Male 888 0 247 - 247
Plant and machine operators and assemblers Female 0 0 0 - 0
Male 53 0 53 - 53
Elementary occupations Female 41 0 20 - 20
Male 127 0 41 - 41
Gender sub totals Female 397 0 239 - 239
Male 1457 0 523 - 523
Total 1854 0 762 - 762

Department of Public Works – Vote 5 – Annual Report 2008/09
- 157 -
HR OVERSIGHT - APRIL 2008 to MARCH 2009 - Eastern Cape - Public Works
TABLE 5.14.7 - Injury on Duty
Nature of injury on duty Number % of total
Required basic medical attention only 2 66.7
Temporary Total Disablement 1 33.3
Permanent Disablement 0 0
Fatal 0 0
Total 3

Department of Public Works – Vote 5 – Annual Report 2008/09
- 158 -
6. Utilisation of consultants
Schedule of appointment of Consultants
Built – Environment Consultants are appointed to manage projects for DPW and client
departments such as Department of Education and the Department of Health.
The appointment of consultants is based on gazetted fee rates that regulate the fees that
consultants are paid.
Consultant Ref No. Brief Description Date Appointment Amount – R
Adendorff Architects Arch SCMU5-08/09-0539 Architectural services 09/12/2008 1 000 000
Afri-Coast Engineers EE 0846(1)-07/08 Electrical Engineer 26/05/2008 75 000
Afri-Coast Engineers EE 0846(1)-07/08 Electrical Engineer 26/05/2008 75 000
Afrika Dynamics JV Ikhwezi V3
CE & SE SCMU5-08/09-0570
Civil and Structural Engineering Services 09/12/2008 1 400 000
Afrikon CE SCMU5-08/09-0597 Civil Engineering Services 12/03/2008 200 000
Afriplan Associates Architects Arch 0846(1)-07/08 Architect 26/05/2008 150 000
Afriplan Associates Architects Arch 0846(1)-07/08 Architect 27/05/2008 150 000
Afriplan Associates Architects
Arch SCMU5-08/09-0532 Architectural Services 08/08/2008 600 000
Afriplan Associates Architects
Arch SCMU5-08/09-0585 Architectural Services 18/9/2008 500 000
Afriplan Associates Architects
Arch SCMU5-08/09-0583 Architectural Services 09/12/2008 250 000
Africa Geo Enveronmental Services (EL)
GE SCMU5-08/09-0656
Geotechnical Engineering Services 31/03/2009 30 000
Albrecht Knight Mvulana & Associates
ME SCMU5-08/09-0548
Mechanical Engineering Services 27/08/2008 120 000
Albrecht Knight Mvulana & Associates
ME SCMU5-08/09-0549
Mechanical Engineering Services 27/08/2008 120 000
Albrecht Knight Mvulana and Associates
EE SCMU5-08/09-0578
Electrical Engineering Services 09/12/2008 415 125
Albrecht Knight Mvulana and Associates
EE SCMU5-08/09-0574
Electrical Engineering Services 18/9/2008 639 516
Albrecht Knight Mvulane
EE SCMU5-06/07-0025
Electrical Engineering Services 09/12/2008 25 000
Albrecht Knight Mvulane
ME SCMU5-08/09-0640
Mechanical Engineering Services 17/02/2009 23 000
Albrecht Knights Mvulana & Associates
EE SCMU5-08/09-0556
Electrical Engineering Services 08/12/2008 110 000
Albrecht Knights Mvulana & Associates
ME SCMU5-08/09-0537 Mechanical Engineering 08/05/2008 82 000

Department of Public Works – Vote 5 – Annual Report 2008/09
- 159 -
Consultant Ref No. Brief Description Date Appointment Amount – R
Albrecht Knights Mvulana & Associates
ME SCMU5-08/09-0550 Mechanical Engineering 08/12/2008 120 000
Albretch Knight Mvulana EE 0504-08/09
Appoint Albrecth Knight Mvulana as Electrical / Mechanical Engineers on the Project 06/03/2008 250 000
Albretch Knight Mvulana EE 0504-08/09 05/05/2008 250 000
Albretch Knight Mvulana EE 0543-06/07
Electrical Engineering Services 24/07/2008 56 000
Anthony Rudman Consulting
EE SCMU5-08/09-0532
Electrical Engineering Services 08/05/2008 80 000
Anthony Rudman Consulting
EE SCMU5-08/09-0564
Electrical Engineering Services 09/12/2008 100 000
Anthony Rudman Consulting
EE SCMU5-08/09-0588
Electrical Engineering Services 09/12/2008 250 000
Archworxs Architects and Project Managers
Arch SCMU5-08/09-0337 Architectural Services 16/02/2009 7 485 000
Archworxs cc Arch SCMU5-08/09-0584 Architectural Services 09/12/2008 150 000
Arcus Gibbs EE SCMU5-08/09-0508
Electrical Engineering Services 08/05/2008 150 000
Arcus Gibbs EE SCMU5-08/09-0540
Electrical Engineering Services: 09/12/2008 110 000
Arcus Gibbs CE SCMU5-08/09-0597 Civil Engineering Services 17/02/2009 200 000
Arthur T. Bisiwe Quantity Surveyors
QS SCMU5-08/09-0620( A) Quantity Surveyors Services 02/06/2009 17 500
Aseda Consulting Engineers
SE SCMU5-08/09-0534 SE
Structural Engineering services 08/12/2008 180 000
Aseda Consulting Engineers
SE SCMU5-08/09-0556
Structural Engineering services 08/12/2008 137 500
Bartsch Architects cc Arch 0844(1)-07/08 Architectural School building 20/04/2008 20 000
Bartsch Architects cc Arch SCMU5-08/09-0591
Architectural Engineering Services 09/11/2008 100 000
Bham Tayob Khan Marunda QS 0501(1)-08/09 Quantity Surveyors Services 16/04/2008 180 000
Bham Tayob Khan Matunda
QS SCMU5-08/09-0592 Quantity Surveying Services 10/07/2008 1 000 000
Bham Tayob Khan Matunda QS 0501(1)-08/09 Quantity Surveying Services 06/03/2008 180 000
Bham Tayob Khan Matunda QS 0818(1)-07/08
Quantity Surveying Fencing: Fencing to Schools 27/05/2008 60 000
Bham Tayob Khan Matunda QS 0780(1)-07/08
Quantity Surveying Services for the fore mentioned district 13/06/2008 400 000
Bham Tayob Khan Matunda
QS SCMU5-08/09-0506 Quantity Surveying Services 08/05/2008 400 000
Bham Tayob Khan Matunda QS
QS SCMU5-08/09-0645 Quantity Surveying Services 03/12/2009 300 000
Bham Tayob Khan Matunda QS
QS SCMU5-08/09-0554 Quantity Surveying Services 08/12/2008 500 000

Department of Public Works – Vote 5 – Annual Report 2008/09
- 160 -
Consultant Ref No. Brief Description Date Appointment Amount – R
Bham Tayob Khan Matunda QS
QS SCMU5-08/09-0555 Quantity Surveying Services 08/12/2008 330 000
Bham Tayob Khan Matunda QS
QS SCMU5-08/09-0557 Quantity Surveying services 08/12/2008 300 000
Bham Tayob Khan Matunda QS
QS SCMU5-08/09-0614 Quantity Surveying Services 26/01/2009 48 000
Bham Tayob Khan Matunda QS
QS SCMU5-08/09-0643 Quantity Surveying Services 03/12/2009 250 000
Bigen Afrika CE SCMU5-08/09-0598 Civil Engineering Services 12/03/2008 300 000
Bigen Afrika SE SCMU5-08/09-0539
Structural Engineering services 09/12/2008 40 000
Bisiwe van Niekerk QS SCMU5-08/09-0524 Quantity Surveying Services 08/05/2008 23 000
Bowie Lloyd & Huebsh
QS SCMU5-08/09-0597 Quantity Surveying Services 12/03/2008 200 000
Bowie Lloyd & Huebsh
PV SCMU5-08/09-0545
Property Valuation services in Grahamstown for 13 Sites 08/12/2008 45 500
Bowie Lloyd & Huebsh
PV SCMU5-08/09-0611 Property Valuing Services 12/03/2008 7 000
Brinkman Ndayi Mc Call
Arch SCMU5-08/09-0538 Architectural Services 09/08/2008 100 000
Brinkman Ndayi Mc Call
Arch SCMU5-08/09-0557 Architectural Services 16/01/2009 200 000
Brinkman Ndayi Mc Call
QS SCMU5-08/09-0582 Quantity Surveying Services 09/12/2008 250 000
BVI Consulting CE&SE SCMU5-08/09-0592
Civil and Structural Engineering Services 10/07/2008 800 000
BVI Consulting Engineers
EE SCMU5-08/09-0607
Electrical Engineering Services 12/03/2008 200 000
BVI Consulting Engineers
EE SCMU5-08/09-0583
Electrical Engineering Services 09/12/2008 75 000
C A Du Toit EE SCMU5-08/09-0608
Electrical Engineering Services 12/03/2008 200 000
C&R Consulting Engineers
EE SCMU5-08/09-0539
Electrical Engineering services 09/12/2008 250 000
C.A. Du Toit EE SCMU5-08/09-0576
Electrical Engineering Services 09/12/2008 790 950
C.A. Du toit EE SCMU5-08/09-0587
Electrical Engineering Services 09/12/2008 400 000
C.A. Du toit ME SCMU5-08/09-0587
Mechanical Engineering Services 09/12/2008 200 000
CA Du Toit ME SCMU5-08/09-0592
Mechanical Engineering Services 10/07/2008 200 000
Camdekon Engineers
CE&SE SCMU5-08/09-0508
Civic and Structural Engineering Services 08/05/2008 150 000
Carifro EE SCMU5-08/09-0541
Electrical / Mechanical Engineering Services 09/12/2008 20 000
Carifro EE SCMU5-08/09-0542
Electrical Engineering Services 08/12/2008 400 000
Carifro Consulting EE SCMU5-08/09-0538
Electrical Engineering Services 08/05/2008 100 000
Carifro Consulting Engineers EE 0500(1)-08/09
Electrical / Mechanical Engineer for Security, access control & monitoring 13/06/2008 30 000

Department of Public Works – Vote 5 – Annual Report 2008/09
- 161 -
Consultant Ref No. Brief Description Date Appointment Amount – R
Carifro Consulting Engineers
ME SCMU5-08/09-0552 Mechanical Engineering 08/12/2008 500 000
Carifro Consulting Engineers
EE SCMU5-08/09-0581
Electrical Engineering Services 09/12/2008 619 643
Carifro Consulting Engineers
EE SCMU5-08/09-0585
Electrical Engineering Services 18/9/2008 100 000
Carifro Electrical and Engineers
SCMU5-08/09-0576 EE
Electrical Engineering Services 16/01/2009 790 950
Clarence Bobbie & Partners
QS SCMU5-08/09-0570 Quantity Surveying Services 09/12/2008 1 200 000
Clarence Bobbie & Partners
QS SCMU5-08/09-0615 (A) Quantity Surveying Services 02/06/2009 14 000
Clarence Bobbies & Partners
QS SCMU5-08/09-0632© Quantity Surveying Services 02/11/2009 30 000
Clarence Bobbies & Partners
QS SCMU5-08/09-0626 Quantity Surveying Services 02/11/2009 5 000
Clarence Bobbies & Partners
QS SCMU5-08/09-0526 Quantity Surveying Services 08/05/2008 23 000
Clarence Bobby & Partners
QS SCMU5-08/09-0647 Quantity Surveying Services 03/12/2009 500 000
Clarence Bobby & Partners
QS SCMU5-08/09-0563 Quantity Surveying Services 08/12/2008 200 000
Clincscales Maughan Brown
EE SCMU5-08/09-0515
Electrical Engineering Services 08/05/2008 396 000
Clincscales Maughan Brown
EE SCMU5-08/09-0517
Electrical Engineering Services 08/05/2008 759 000
Clincscales Maughan Brown
EE SCMU5-08/09-0536
Electrical Engineering services 07/08/2008 100 000
Clincscales Maughan Brown
ME SCMU5-08/09-0547
Mechanical Engineering Services 09/12/2008 180 000
Clincscales Maughan Brown
ME SCMU5-08/09-0564
Mechanical Engineering Services 09/12/2008 50 000
Clincscales Maughan Brown
EE SCMU5-08/09-0586
Electrical Engineering Services 18/9/2008 100 000
Clincscales Maughan Brown ME 0846 (1)- 07/08 Mechanical Engineering 26/05/2008 50 000
Clincscales Maughan Brown ME 0846(1)-07/08 Mechanical Engineering 26/05/2008 50 000
Clincscales Maughan Brown ME 0848(1)-07/08
Mechanical / Electrical Eng. For Kitchen Equipment & Services 06/03/2008 45 000
Clincscales Maughan Brown ME 0848-07/08
Mechanical / Electrical Eng. For Kitchen Equipment & Services 16/04/2008 45 000
Consult Three Arch 0780(1)-07/08 Architectural Services 13/06/2008 400 000
COSEC SE SCMU5-08/09-0571
Structural Engineering services 08/08/2008 180 000
COSEC SE/CE SCMU5-08/09-0647
Civil and Structural Engineering Services 03/12/2009 200 000
D A Architectural Design CC
Arch SCMU5-08/09-0556
Architectural Engineering Services 08/12/2008 137 500

Department of Public Works – Vote 5 – Annual Report 2008/09
- 162 -
Consultant Ref No. Brief Description Date Appointment Amount – R
DA Architectural Design cc (Mthatha Office)
Arch SCMU5-08/09-0596 Architectural Services 11/11/2008 450 000
Daniels and Costa SCMU5-08/09-0532 SE/CE
Civil and Structural Engineering Services 16/01/2009 500 000
DFR Engineers EE 0844(1)-07/08 Electrical Engineering Service 19/9/2008 10 000
DFR Engineers EE 0832(1)-07/08 Electrical School building 30/06/2008 40 000
DFR Engineers EE 0809(1)-07/08 Electrical Engineering Services for Cofimvaba 13/06/2008 100 000
DFR Engineers EE 0841(1)-07/08 Electrical School building 29/05/2008 20 000
DFR Engineers EE 0841(1)-07/08
Electrical Engineering Services for the fore mentioned Schools 13/06/2008 20 000
DFR Engineers EE 0842(1)-07/08
Electrical Engineer Services for the fore mentioned Schools 13/06/2008 30 000
DFR Engineers EE SCMU5-08/09-0579
Electrical Engineering Services 09/12/2008 611 857
DFR Engineers EE SCMU5-08/09-0577
Electrical Engineering Services 09/12/2008 790 950
Digaan Sambumbu & Associates Arch 0505-08/09
Appoint Digaan Sambumbu & Associates as Architects & Principal Agents 13/06/2008 600 000
DLV Phambili EE 0765-07/08 Electrical and upgrade of Itembelihle Clinic in Cala 13/04/2008 72 000
Dombo Du Plessis & Partners
CE/SE SCMU5-08/09-0607
Civil and Structural Engineering Services 12/03/2008 400 000
Dombo Du Plessis & Partners
SE&CE SCMU5-08/09-0585
Structural & Civil Engineering Services 18/9/2008 150 000
DPV Quantity Surveyors QS 0574(1)-06/07
Quantity Surveyors Services for Design of the forementioned centre at Mount Frere 30/06/2008 120 000
DPV Quantity Surveyors
QS SCMU5-08/09-0617 ( b) Quantity Surveying Services 02/06/2009 17 500
Dubbber & Associates cc
SE & CE SCMU5-08/09-0586
Structural and Civil Engineering Services 18/9/2008 150 000
Element Consulting Engineers
ME SCMU5-08/09-0539 Mechanical Engineering 09/12/2008 300 000
ESB Architects Arch SCMU5-08/09-0608 Architectural Services 23/03/2009 1 200 000
Eye Sizwe Consulting Engineers EE 0834(1)-07/08 Electrical School building 29/05/2008 30 000
Eyesizwe Consulting Engineers
EE SCMU5-08/09-0555
Electrical Engineering Services 08/12/2008 110 000
Eyesizwe Consulting Engineers
EE SCMU5-08/09-0591
Electrical Engineering Services 09/11/2008 50 000
Eyesizwe Consulting Engineers
ME SCMU5-08/09-0546
Mechanical Engineering Services 27/08/2008 120 000
Eyesizwe Consulting Engineers
ME SCMU5-08/09-0547
Mechanical Engineering Services 27/08/2008 120 000

Department of Public Works – Vote 5 – Annual Report 2008/09
- 163 -
Consultant Ref No. Brief Description Date Appointment Amount – R
Eyesizwe Consulting Engineers
ME SCMU5-08/09-0570
Mechanical Engineering Services 09/12/2008 1 000 000
Francis William Jones Kgole
QS SCMU5-08/09-0629(A) Quantity Surveying Services 02/11/2009 10 000
Francis William Jones Kgole
QS SCMU5-08/09-0627 Quantity Surveying Services 02/11/2009 10 000
Francis William Jones Kgole
EE SCMU5-08/09-0558
Electrical Engineering Services 08/12/2008 300 000
Francis William Jones Kgole
QS SCMU5-08/09-0615( B) Quantity Surveying Services 02/06/2009 10 500
Francis William Jones Kgole QS SCMU-08/09-0528 Quantity Surveying Services 08/05/2008 23 000
Francis William Jones Kgole
QS SCMU5-08/09-0621 (b) Quantity Surveying Services 02/06/2009 17 500
Francis William Jones Kgole
QS SCMU5-08/09-0562 Quantity Surveying Services 08/12/2008 200 000
Francis William Jones Kgole Quantity Surveyors
QS SCMU5-08/09-0649 Quantity Surveying Services 03/12/2009 500 000
FST Consulting CE 0574(1)-06/07
Civil Engineering Services for Design of the forementioned centre at Mount Frere 30/06/2008 36 000
FST Consulting SE SCMU5-08/09-0597
Structural Engineering Services 12/03/2008 120 000
FST Consulting SE SCMU5-08/09-0598
Structural Engineering services 12/03/2008 120 000
FST Consulting CE 0576(1)-06/07
Civil Engineering Services for Design of the forementioned centre at Qumbu 30/06/2008 36 000
FST Consulting CE 06/07-0575
Civil Engineering Services for Design of abovementioed centre at Idutywa 30/06/2008 36 000
FST Engineers CE SCMU5-08/09-0509
Civil Engineering services at S.S.Gida Hospital 30/06/2008 40 000
Gerald Fitzpatrick Quantity Surveyors QS 0505-08/09
Appoint Gerald Fitzpatrick Quantity Surveyors as QS on the Project 13/06/2008 500 000
GG&G Consulting Engineers
CE SCMU5-08/09-0537 Civil Engineering 08/05/2008 80 000
GG&G Consulting Engineers
CE SCMU5-08/09-0573 Civil Engineering Services 09/11/2008 300 000
GG&G Consulting Engineers SE 0504-08/09
Appoint GG & G Consulting Engineers as Structural / Civil Engineers on the Projects 13/06/2008 250 000
GG&G Consulting Engineers SE 0504-08/09
Appoint GG & G Consulting Engineers as Structural / Civil Engineers on the Projects 05/05/2008 250 000
GG&G Consulting Engineers
CE SCMU5-08/09-0538 Civil Engineering Services 03/12/2009 400 000
Hepple Property Valuers
PV SCMU5-08/09-0545
Property Valuation services in Port Elizabeth 08/12/2008 17 500
HHO Afrika SE/CE SCMU5-08/09-0648
Civil and Structural Engineering Services 03/12/2009 200 000

Department of Public Works – Vote 5 – Annual Report 2008/09
- 164 -
Consultant Ref No. Brief Description Date Appointment Amount – R
HHO Afrika (Mthatha Office)
SE SCMU5-08/09-0596
Structural Engineering services 11/11/2008 100 000
Hlubi Property Valuers
PV SCMU5-08/09-0545 Property Valuation services in 08/12/2008 10 500
HSC Consulting CE SCMU5-08/09-0565 Civil Engineering Services 27/08/2008 50 000
HSC Consulting CE & SE SCMU5-08/09-0591
Civil and Structural Engineering Services 09/11/2008 50 000
HSC Consulting SE SCMU5-08/09-0542
Structural Engineering services 08/12/2008 350 000
HSC Consulting SE SCMU5-08/09-0558
Structural Engineering services 08/12/2008 300 000
Ikamva Architects Arch 0733-07/08
An architect to provide basic architectural services and designs 13/04/2008 90 000
Ikamva Architects Arch 0837(1)-07/08
Architectural Services for the fore mentioned School Building 13/06/2008 60 000
Ikamva Architects Arch 0839(1)-07/08
Architectural Services for the fore mentioned School Building 13/06/2008 60 000
Ikamva Architects Arch SCMU5-08/09-0543 Architectural Services 08/12/2008 70 000
Ikamva Architects Arch SCMU5-08/09-0559
Architectural Engineering Services 08/12/2008 576 000
Ikamva Electrical EE 0505-08/09
Appoint Ikamva Electrical as Electrical / Mechanical Engineer on the Project 13/06/2008 300 000
Ikamva Electrical SCMU5-08/09-0516(EE)
Appointment of Electrical Engineer for the above services 02/06/2008 630 000
Ikamva Electrical EE SCMU5-08/09-0575
Electrical Engineering Services 09/12/2008 586 939
Ilangalethu Cons. CC T/A R&G Consultants
QS SCMU5-08/09-0623( c) Quantity Surveying Services 02/06/2009 17 500
Iliso Consulting (Pty)Ltd
CE/SE SCMU5-08/09-0608
Civil and Structural Engineering Services 12/03/2008 400 000
Iliso Consulting (Pty)Ltd
SE & CE SCMU5-08/09-0583
Structural and Civil Engineering Services 09/12/2008 100 000
Iliso Consulting Engineers
SE SCMU5-08/09-0518
Structural Engineering services 08/05/2008 100 000
Ilitha Quantity Surveyors cc
QS SCMU5-08/09-0644 Quantity Surveying Services 03/12/2009 380 000
Imbono FJA Architects Arch 0832(1)-07/08 Architectural School building 27/05/2008 80 000
Imbono FJA Architects Arch 0847(1)-07/08 Architect 26/05/2008 200 000
Imbono FJA Architects Arch 0847(1)-07/08 Architect 26/05/2008 200 000
Imbono FJA Architects Arch 0832(1)-07/08 Architectural Services 19/9/2008 80 000
Imbono FJA Architects Arch 0841(1)-07/08 Architectural Services 19/9/2008 40 000
Imbono FJA Architects
Arch SCMU5-08/09-0587 Architectural Services 09/12/2008 1 000 000

Department of Public Works – Vote 5 – Annual Report 2008/09
- 165 -
Consultant Ref No. Brief Description Date Appointment Amount – R
Imbono FJA Architects
Arch SCMU5-08/09-0587 Architectural Services 09/12/2008 1 000 000
Imbono FJA Architects
Arch SCMU5-08/09-0654 Architectural Services 03/12/2009 160 000
Impendulo Design Architects
Arch SCMU5-08/09-0558 Architectural Services 08/12/2008 900 000
Imvelo Quantity Surveyors
QS SCMU5-08/09-0618 ( c) Quantity Surveying Services 02/06/2008 21 000
Indwe QS QS SCMU5-08/09-0529 Quantity Surveying Services 08/05/2008 23 000
Indwe QS QS SCMU5-08/09-0619 Quantity Surveying Services 06/02/2009 23 500
Ingwe Pro Mas Construction
CE SCMU5-08/09-0560 Civil Engineering Services 08/12/2008 400 000
Ingwe Promas Consultant EE 0772(1)-07/08
Electrical Engineering Services 30/06/2008 100 000
Initio Bee Property Valuers & Constru
PV SCMU5-08/09-0545
Property Valuation services in Port Elizabeth 08/12/2008 3 500
Inyathi Quantity Surveying
QS SCMU5-08/09-0632(A) Quantity Surveying Services 02/11/2009 20 000
Inyathi Quantity Surveying QS 0795(1)-07/08
Quantity Surveyor Services for the fore mentioned School Building 13/06/2008 80 000
Inyathi Quantity Surveying QS 0796(1)-07/08 Quantity Surveying Services 29/05/2008 40 000
Inyathi Quantity Surveying
QS SCMU5-08/09-0525 Quantity Surveying Services 08/05/2008 23 000
Inyathi Quantity Surveying
QS SCMU5-08/09-0624 Quantity Surveying Services 02/06/2009 17 500
Inyathi Quantity Surveying
QS SCMU5-08/09-0622 Quantity Surveying Services 02/06/2009 21 000
Inyathi Quantity Surveying
QS SCMU5-08/09-0646 Quantity Surveying Services 03/12/2009 380 000
ISA & Partners SE/CE SCMU5-08/09-0644
Civil and Structural Engineering Services 03/12/2009 350 000
Isidingo Consulting QS SCMU5-08/09-0630 Quantity Surveying Services 02/11/2009 10 000
Isidingo Consulting QS SCMU5-08/09-0556 Quantity Surveying Services 08/12/2008 330 000
ITM Architects Arch 0501(1)-08/09 Architectural Service 16/04/2008 160 000
ITM Architects Arch 0501(1)-08/09 Architects Services 16/04/2008 160 000
ITM Architects Arch 0834(1)-07/08 Architectural School building 29/05/2008 60 000
ITM Architects Arch SCMU5-08/09-0555 Architectural Services 08/12/2008 137 500
Ivo Huisman Engineers
SE SCMU5-08/09-0518
Structural Engineering services 03/12/2009 200 000
Jefferson & Green (Pty) Ltd
SE SCMU5-08/09-0609
Structural Engineering services 12/03/2008 450 000
John Davies Consulting QS 0848(1)-07/08
Quantity Surveyors For Alterations, Restoration and Redecoration 06/03/2008 30 000
John Davies Consulting QS 0848(1)-07/08
Quantity Surveyors For Alterations, Restoration and Redecoration 16/04/2008 30 000
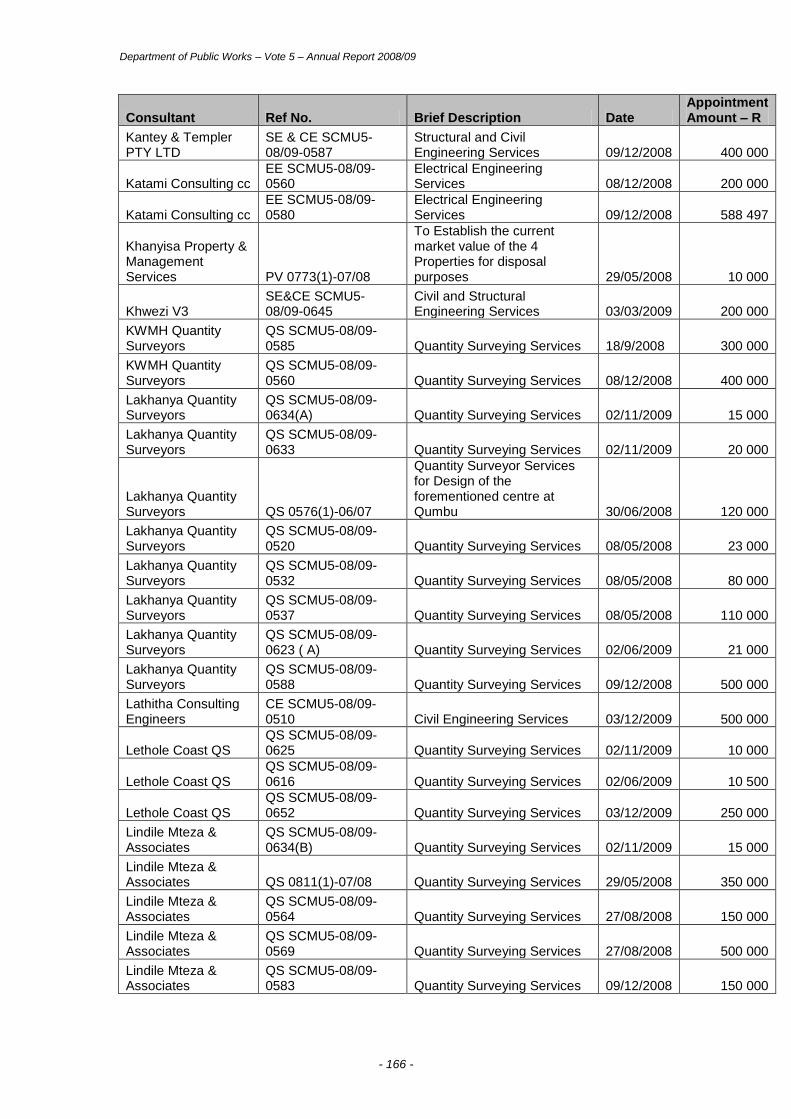
Department of Public Works – Vote 5 – Annual Report 2008/09
- 166 -
Consultant Ref No. Brief Description Date Appointment Amount – R
Kantey & Templer PTY LTD
SE & CE SCMU5-08/09-0587
Structural and Civil Engineering Services 09/12/2008 400 000
Katami Consulting cc EE SCMU5-08/09-0560
Electrical Engineering Services 08/12/2008 200 000
Katami Consulting cc EE SCMU5-08/09-0580
Electrical Engineering Services 09/12/2008 588 497
Khanyisa Property & Management Services PV 0773(1)-07/08
To Establish the current market value of the 4 Properties for disposal purposes 29/05/2008 10 000
Khwezi V3 SE&CE SCMU5-08/09-0645
Civil and Structural Engineering Services 03/03/2009 200 000
KWMH Quantity Surveyors
QS SCMU5-08/09-0585 Quantity Surveying Services 18/9/2008 300 000
KWMH Quantity Surveyors
QS SCMU5-08/09-0560 Quantity Surveying Services 08/12/2008 400 000
Lakhanya Quantity Surveyors
QS SCMU5-08/09-0634(A) Quantity Surveying Services 02/11/2009 15 000
Lakhanya Quantity Surveyors
QS SCMU5-08/09-0633 Quantity Surveying Services 02/11/2009 20 000
Lakhanya Quantity Surveyors QS 0576(1)-06/07
Quantity Surveyor Services for Design of the forementioned centre at Qumbu 30/06/2008 120 000
Lakhanya Quantity Surveyors
QS SCMU5-08/09-0520 Quantity Surveying Services 08/05/2008 23 000
Lakhanya Quantity Surveyors
QS SCMU5-08/09-0532 Quantity Surveying Services 08/05/2008 80 000
Lakhanya Quantity Surveyors
QS SCMU5-08/09-0537 Quantity Surveying Services 08/05/2008 110 000
Lakhanya Quantity Surveyors
QS SCMU5-08/09-0623 ( A) Quantity Surveying Services 02/06/2009 21 000
Lakhanya Quantity Surveyors
QS SCMU5-08/09-0588 Quantity Surveying Services 09/12/2008 500 000
Lathitha Consulting Engineers
CE SCMU5-08/09-0510 Civil Engineering Services 03/12/2009 500 000
Lethole Coast QS QS SCMU5-08/09-0625 Quantity Surveying Services 02/11/2009 10 000
Lethole Coast QS QS SCMU5-08/09-0616 Quantity Surveying Services 02/06/2009 10 500
Lethole Coast QS QS SCMU5-08/09-0652 Quantity Surveying Services 03/12/2009 250 000
Lindile Mteza & Associates
QS SCMU5-08/09-0634(B) Quantity Surveying Services 02/11/2009 15 000
Lindile Mteza & Associates QS 0811(1)-07/08 Quantity Surveying Services 29/05/2008 350 000
Lindile Mteza & Associates
QS SCMU5-08/09-0564 Quantity Surveying Services 27/08/2008 150 000
Lindile Mteza & Associates
QS SCMU5-08/09-0569 Quantity Surveying Services 27/08/2008 500 000
Lindile Mteza & Associates
QS SCMU5-08/09-0583 Quantity Surveying Services 09/12/2008 150 000

Department of Public Works – Vote 5 – Annual Report 2008/09
- 167 -
Consultant Ref No. Brief Description Date Appointment Amount – R
Lindile Mteza & Associates
QS SCMU5-08/09-0590
Quantity and Project Management Services 10/07/2008 400 000
Lindile Mteza & Associates
QS SCMU5-08/09-0623( b) Quantity Surveying Services 02/06/2009 17 500
Lukhozi Consulting Engineers
SE SCMU5-08/09-0567
Structural Engineering Services 27/08/2008 50 000
Lukhozi Consulting Engineers
SE&CE SCMU5-08/09-0582
Structural Engineering services 09/12/2008 500 000
Lukhozi Consulting Engineers
SE SCMU5-08/09-0614
Structural Engineering Services 26/01/2009 24 000
Lwandle Consultants QS 0799(1) -07/08 Quantity Surveying Services for the fore mentioned district 13/06/2008 60 000
Lwandle Consultants QS 0800(1)-07/08
Quantity Surveying Services for the fore mentioned District School 13/06/2008 40 000
Lwandle Consultants QS SCMU5-08/09-0527 Quantity Surveying Services 08/05/2008 23 000
Lwandle Consultants QS SCMU5-08/09-0617( A) Quantity Surveying Services 02/06/2009 21 000
Maneli Cotterell Davies
QS SCMU5-08/09-0620(b) Quantity Surveying Services 02/06/2009 17 500
Manong & Associates
CE SCMU5-08/09-0510
Civil Engineering services at Isilimela,Cazibe,Greenville 30/06/2008 100 000
Manong & Associates SE 0839(1)-07/08
Structural Engineering services 19/9/2008 15 000
Manzi Quantity Surveyors
QS SCMU5-08/09-0629(B) Quantity Surveying Services 02/11/2009 20 000
Manzi Quantity Surveyors
QS SCMU5-08/09-0621( c) Quantity Surveying Services 02/06/2009 17 500
Marcus Burri QS SCMU5-08/09-0636 Quantity Surveying Services 02/11/2009 5 000
Marcus Burri QS SCMU5-08/09-0637(A) Quantity Surveying Services 02/11/2009 10 000
Mazwana Maqethuka Peirson Associates
QS SCMU5-08/09-0642 Space Planning Services 27/02/2009 271 707
Mazwana Maqethuka Peirson Associates
QS SCMU5-08/09-0638© Quantity Surveying Services 02/11/2009 15 000
Mazwana Maqethuka Peirson Associates QS 0812(1)-07/08 Quantity Surveying Services 11/11/2008 350 000
Mazwana Maqethuka Peirson Associates
QS SCMU5-08/09-0538 Quantity Surveying Services 08/05/2008 70 000
Mazwana Maqethuka Peirson Associates
QS SCMU5-08/09-0632 (B) Quantity Surveying Services 02/11/2009 20 000
Mazwana Maqethuka Peirson Associates
QS SCMU5-08/09-0559 Quantity Surveying Services 08/12/2008 280 000
Mazwana Maqethuka Peirson Associates
QS SCMU5-08/09-0621 (A) Quantity Surveying Services 02/06/2009 21 000

Department of Public Works – Vote 5 – Annual Report 2008/09
- 168 -
Consultant Ref No. Brief Description Date Appointment Amount – R
Mazwana Maqethuka Peirson Associates
QS SCMU5-08/09-0618 ( b) Quantity Surveying Services 02/06/2009 17 500
Mazwana Maqethuka Peirson Associates
QS SCMU5-08/09-0648 Quantity Surveying Services 03/12/2009 300 000
Mazwana Maqethuka Peirson Associates
QS SCMU5-08/09-0612 Space Planning Services 12/09/2008 155 473
Mazwana Maqetuka Peirson & Associates QS 0815(1)-07/08
Quantity Surveying: Fencing to Schools 27/05/2008 60 000
Mazwana Maqetuka Peirson & Associates QS 0816(1)-07/08
Quantity Surveying Fencing: Fencing to Schools 27/05/2008 60 000
Mcoteli Mulders Architects Arch 0783-07/08 An Architectural Services 01/04/2008 600 000
MD Van Sulkwyk & Portgieter QS 0847(1)-07/08 Quantity Surveyors 30/06/2008 100 000
Mokate Monk & Du plessis
QS SCMU5-08/09-0635 Quantity Surveying Services 02/11/2009 10 000
Mokate Monk & Du plessis
QS SCMU5-08/09-0633 Quantity Surveying Services 02/11/2009 15 000
Mokate Monk & Du plessis
QS SCMU5-08/09-0541 Quantity Surveying Services 09/12/2008 25 000
Mokate Monk & Du plessis
QS SCMU5-08/09-0542 Quantity Surveying Services 08/12/2008 450 000
Mokate Monk & Du plessis
QS SCMU5-08/09-0553 Quantity Surveying Services 08/12/2008 600 000
Mokate Monk & Du Plessis
QS SCMU5-08/09-0591 Quantity Surveying Services 09/11/2008 100 000
Mokate Monk & Du Plessis
PM SCMU5-08/09-0655
Project Management and Space Planning Services 16/03/2009 75 000
Mokate Monk & Duplessis QS 0500(1)-08-09
Quantity Surveyors For Alterations, Restoration and Redecoration 06/03/2008 40 000
Mokate Monk & Duplessis QS 0500(1)-08-09
Quantity Surveyor for Alterations and Redecoration 16/04/2008 40 000
Mokate Monk & Duplessis QS 0762-07/08
Project Manager for phase 3 Raip Infrastructure Delivery 21/04/2008 300 000
Molemo Development Engineers
SE/CE SCMU5-08/09-0652
Civil and Structural Engineering Services 03/12/2009 200 000
Moors Milne & Kievet Arch. ECTS Inc
Arch SCMU5-08/09-0586 Architectural Services 18/9/2008 500 000
Mosi-oa-Tunya Engineers Group
EE SCMU5-08/09-0557
Mechanical and Electrical Engineering Services 08/12/2008 400 000
Mpande Architects Arch 0835(1)-07/08 Architectural School building 29/05/2008 60 000
Mpande Architects Arch & PA SCMU5-05/06-0103
Architectural and Principal Agent services 03/03/2009 300 000
Muhle Unlimited Design cc
QS SCMU5-08/09-0620( C) Quantity Surveying Services 02/06/2009 17 500

Department of Public Works – Vote 5 – Annual Report 2008/09
- 169 -
Consultant Ref No. Brief Description Date Appointment Amount – R
Naren Mistry Beveridge Architects
Arch SCMU5-08/09-0532 Architectural Services 08/05/2008 600 000
Nduluka Consulting Engineers EE 0504(1)-07/08 Electrical Engineering 13/06/2008 100 000
Nduluka Consulting Engineers EE 0504(1)-07/08 Electrical Engineering 30/06/2008 100 000
Nduluka Consulting Engineers EE 0504(1)-07/08 Electrical Engineering 30/06/2008 100 000
Nduluka Consulting Engineers EE 0504(1)-07/08 Electrical Engineering 08/04/2008 90 000
Nduluka Consulting Engineers EE 0780(1)-07/08
Electrical Engineering Services 13/06/2008 90 000
Ngonyama Okpanum & Associates Arch 0762(1)-07/08 Architectural Services 24/07/2008 200 000
Ningi Consulting Engineers
EE SCMU5-08/09-0506
Electrical Engineering Services 08/12/2008 200 000
Ningi Consulting Engineers
EE/ME SCMU5-08/09-0614
Electrical / Mechanical Engineering Services 26/01/2009 24 000
Ninham Shand (Pty) Ltd
GE SCMU5-08/09-0606
Geotechnical Engineering Services 12/03/2008 30 000
Ninham Shand Construction
SE SCMU5-08/09-0572
Structural Engineering services 08/08/2008 180 000
Njilo- Njilo Engineers (Mthatha Office)
ME SCMU5-08/09-0538
Mechanical Engineering Services 11/11/2008 60 000
Njilo-Njilo Consulting EE SCMU5-08/09-0570
Electrical Engineering Services 09/12/2008 1 000 000
Njilo-Njilo Consulting Services EE 0837(1)-07/08 Electrical School building 29/05/2008 30 000
NN Architects Arch SCMU5-08/09-0537 Architectural Services 08/05/2008 120 000
Nonty Dazana Quantity Surveyors
Quantity Surveyor Services for the fore mentioned School Building 30/06/2008 60 000
Nungu Trading 688 / Khula Valluation
PV SCMU5-08/09-0568 Property Valuation Services 27/08/2008 8 000
Nungu Trading 688 T/ A Kula Valuation Services PV 0845 (1)-07/08
Valuation of Crown Hotel to determine the Market Value + market rental for office accommodation 16/04/2008 10 000
Nungu Trading 688/ Khula Valuation
PV SCMU5-08/09-0610 Property Valuation Services 12/02/2008 10 000
Nzelenzele LS 0503(1)-08/09 Land Surveying Services 16/04/2008 65 000
Nzele-Nzele Preston & Medcalf (EL Office)
LS SCMU5-08/09-0570 Land Surveying Services 26/01/2009 224 435
Nzenzele Preston & Medcalf inc LS 0503(1)-08/09
There are 3 schools in Farm Mnyameni no 2362, Land Surveyor to Identify Portions of the three schools 05/05/2008 65 000
Omkhai Consulting Engineers
QS SCMU5-08/09-0637(B) Quantity Surveying Services 02/11/2009 15 000
Omkhai Consulting Engineers
QS SCMU5-08/09-0521 Quantity Surveying Services 24/08/2008 23 000

Department of Public Works – Vote 5 – Annual Report 2008/09
- 170 -
Consultant Ref No. Brief Description Date Appointment Amount – R
Osmond Lange Architects and Ikemeleng JV Architects
Arch SCMU5-07/08-0207
Architectural Engineering Services 18/8/2008 40 000 000
Palmer Flatela & Associates: It Rejected this Appointment QS SCMU5-08/09-0521 Quantity Surveying Services 08/05/2008 23 000
Pierre Webber QS QS SCMU5-08/09-0638(B) Quantity Surveying Services 02/11/2009 10 000
Pulana Baxter and Associates
QS SCMU5-08/09-0638(A) Quantity Surveying Services 02/11/2009 15 000
R&G Consulting QS 0801(1)-07/08 Quantity Surveying 29/05/2008 60 000
R&G Consulting QS 0801(1)-07/08 Quantity Surveying 29/05/2008 60 000
R&G Consulting QS SCMU5-08/09-0628 Quantity Surveying Services 03/12/2009 10 000
Raj Maharaj Arch 0810(1)-07/08 Architectural Services 27/05/2008 250 000
Raj Maharaj Architects
Arch SCMU5-08/09-0538 Architectural Services 08/05/2008 100 000
Raj Maharajah Architects
Arch SCMU5-08/09-0560 Architectural Services 18/9/2008 1 000 000
Rens & Leonard QS QS SCMU5-08/09-0653 Quantity Surveying Services 03/12/2009 500 000
RJ Waters & Associates EE 0771-07/08
To provide Electrical Engineering Devices 01/04/2008 150 000
Roeleveld Quantity Surveyor QS 0502(1)-08/09
Quantity Surveying services Project Management Services 16/04/2008 20 000
Roeleveld Quantity Surveyor QS 0728-07/08
Prepare Generic Tender documents for Rapid Delivery of Conventional Schools 21/04/2008 120 000
Roeleveld Quantity Surveyor QS 0850(1)-07/08
Quantity Surveying Services To Manage Mud Structure School Programme 16/04/2008 100 000
Roeleveld Quantity Surveyor QS 0850-07/08
Quantity Surveying services to Manage Mud Structure School Programs 29/05/2008 100 000
Roeleveld Quantity Surveyor
QS SCMU5-08/09-0535 Quantity Surveying Services 07/08/2008 150 000
Roeleveld Quantity Surveyor
QS SCMU5-08/09-0539 Quantity Surveying services 09/12/2008 500 0000
Roeleveld Quantity Surveyor
QS SCMU5-08/09-0551 Quantity Surveying Services 08/12/2008 1 080 000
Roeleveld Quantity Surveyors
QS SCMU5-08/09-0613 Quantity Surveying Services 26/01/2009 40 000
Roeleveld Quantity Surveyors
QS SCMU5-08/09-0509 Quantity Surveying Services 10/07/2008 500 000
Roeleveld Quantity Surveyors
QS SCMU5-08/09-0593 Quantity Surveying Services 29/10/2008 80 000
Ronald Hicks Arch SCMU5-08/09-0588
Architectural Services and Principal Agent services 09/12/2008 500 000
Rousseau Probert Elliot
QS SCMU5-08/09-0587 Quantity Surveying Services 09/12/2008 800 000
Rovert Consulting cc QS SCMU5-08/09- Quantity Surveying Services 02/06/2009 17 500

Department of Public Works – Vote 5 – Annual Report 2008/09
- 171 -
Consultant Ref No. Brief Description Date Appointment Amount – R
0620 (D)
s. Vena & Associates LS 0778-07/08
Consolidate even: 264, 265, 266, 267, 268, 269 Mt Frere Hospital 29/05/2008 3 000
s. Vena & Associates
LS SCMU5-08/09-0605 Land Surveying Services 12/03/2008 10 000
s. Vena & Associates
LS SCMU5-08/09-0657 Land Surveying Services 04/06/2009 30 000
Sebego Maloka & Viljoen Civil Engineers
SE SCMU5-08/09-0555
Structural Engineering services 08/12/2008 137 500
Sektor Consulting SE/CE SCMU5-08/09-0649 Civil and Structural Services 03/12/2009 200 000
Sektor Consulting SE SCMU5-08/09-0507
Structural Engineering services 08/05/2008 300 000
Selatile Moloi Consulting Engineers
SE/CE SCMU5-08/09-0639
Civil and Structural Engineering Services 03/12/2009 100 000
Selatile Moloi Consulting Engineers
SE SCMU5-08/09-0538
Structural Engineering Services 03/12/2009 400 000
Sheltamatiks Architects cc Arch 0576(1)-06/07
Architectural Services for Design of the forementioned centre at Qumbu 30/06/2008 144 000
Sheltamatiks Architects cc Arch 06/07-0575
Architectural Services for Design of abovementioned centre at Idutywa 30/06/2008 144 000
Sinakho Consulting Engineers
SE/CE SCMU5-08/09-0646 Civil and Structural Services 03/12/2009 200 000
Siseko Quantity Surveyors DW 3-03/04
Erection of Pre-Fabricated District Offices at Mount Frere 01/04/2008 194 000
Siseko Quantity Surveyors
QS SCMU5-08/09-0522 Quantity Surveying Services 08/05/2008 23 000
Siseko Quantity Surveyors
QS SCMU5-08/09-0586 Quantity Surveying Services 18/9/2008 300 000
Sivest SA(Pty)ltd CE SCMU5-08/09-0557 Civil Engineering Services 08/12/2008 600 000
Sivest SA(Pty)ltd SE SCMU5-08/09-0641
Structural Engineering Services 17/02/2009 15 000
Siyakhula Quantity Surveyors QS 0504-08/09
Appoint Siyakula Quantity Surveyors as QS on the Projects 13/06/2008 350 000
Siyakhula Quantity Surveyors QS 0504-08/09
Appoint Siyakula Quantity Surveyors as QS on the Projects 05/05/2008 350 000
Siyakhula Quantity Surveyors
QS SCMU5-08/09-0618 ( c) Quantity Surveying Services 02/06/2009 17 500
SKC SE/CE SCMU5-08/09-0650
Civil and Structural Engineering Services 09/12/2009 200 000
SKC Maleswai Engineers CE 0769(1)-07/08 Civil Engineer Services 29/05/2008 55 000
Smale & Partners Arch 0811-07/08 Architectural Engineering Services 27/08/2008 250 000
Soka & Associates Arch 0574(1)-06/07 Architectural Services for Design of the forementioned 30/06/2008 144 000

Department of Public Works – Vote 5 – Annual Report 2008/09
- 172 -
Consultant Ref No. Brief Description Date Appointment Amount – R
centre at Mount Frere
SSI Engineers EE SCMU5-08/09-0592
Electrical Engineering Services 10/07/2008 400 000
SSI A DHV Company ME 0849(1)-07/08
Designs HVAC Air Conditioning and Ventilation for the above Offices 16/04/2008 150 000
SSI A DHV Company SE 0505-08/09
Appoint SSI A DHV Company as Structural/ Civil Engineer on the Project 13/06/2008 300 000
SSI A DHV Company SE 0842(1)-07/08 Engineering Schools Building 29/05/2008 15 000
SSI Engineers SE/CE SCMU5-08/09-0651
Civil and Structural Engineering Services 03/12/2009 200 000
Stemele & Bosch EE SCMU5-08/09-0558
Electrical Engineering Services 08/12/2008 300 000
Stemele & Bosch ME SCMU5-08/09-0514 Mechanical Engineering 08/05/2008 150 000
SVP QS QS SCMU5-08/09-0530 Quantity Surveying Services 08/05/2008 23 000
Thabo Senyolo & Partners QS 0771-07/08
To Provide Quantity Surveying Services 01/04/2008 300 000
Thembeka Quantity Surveyors QS 0821(1)-07/08
Quantity Surveying Fencing: Fencing to Schools 27/05/2008 60 000
Thembela Architects Arch 0500(1)-08/09 Architects for Interior Design 06/03/2008 60 000
Thembela Architects Arch 0500(1)-08/09 Architects for Interior Design 16/04/2008 60 000
Thembela Architects Arch 0845(1)-07/08 Architects for Interior Design 16/04/2008 45 000
Thembela Architects Arch 0848-07/08 Architects for Interior Design 06/03/2008 45 000
Thembela Architects Arch SCMU5-08/09-0541 Architectural Services 09/12/2008 35 000
Thembela Architects Arch SCMU5-08/09-0542 Architectural Services 08/12/2008 500 000
Thembela Architects Arch SCMU5-08/09-0553 Architectural Services 16/01/2009 200 000
Thembela Architects Arch SCMU5-08/09-0614 Architectural Services 26/01/2009 24 000
Theunissen Jankowitz Arch 0504-08/09
Appoint Theunissen Jankwitz Architects as Architects and team Leaders on the Project 13/06/2008 400 000
Theunissen Jankowitz Arch 0504-08/09
Appoint Theunissen Jankwitz Architects as Architects and team Leaders on the Project 05/05/2008 400 000
THM Civil and Structural Engineers
SE SCMU5-05/06-0238
Basic Structural / Civil Engineering services 03/03/2009 300 000
THM Civil and Structural Engineers
CE & SE SCMU5-05/06-01
Civil and Structural Services to Monitor and Review the Drawings 03/03/2009 150 000
THM Civil and Structural Engineers SE/CE 0781(1)-07/08
Structural / Civil Engineering services required at Tower Hospital 05/05/2008 15 000
UWP Consulting Engineer SE 0755-07/08
Structural Engineer for assessment of existing office 15/04/2008 350 000
UWP Consulting Engineer SE 0703(1)-07/08
Design Water & Reticulation & Earthworks for Parking 16/04/2008 105 000

Department of Public Works – Vote 5 – Annual Report 2008/09
- 173 -
Consultant Ref No. Brief Description Date Appointment Amount – R
UWP Consulting Engineer
SE SCMU5-08/09-0559
Structural Engineering services 08/12/2008 150 000
UWP Consulting Engineers ( Mthatha Office)
CE SCMU5-08/09-0510 Civil Engineering Services 30/03/2009 500 000
UWP Consulting Engineers
SE SCMU5-08/09-0566
Structural Engineering Services 09/12/2008 40 000
Van Der Walt & Du Plessis
QS SCMU5-08/09-0650 Quantity Surveying Services 03/12/2009 350 000
Van Der Walt & Du Plessis
QS SCMU5-08/09-0631 Quantity Surveying Services 02/11/2009 25 000
Van Der Walt & Du Plessis QS 0806(1)-07/08 Quantity Surveying Services 29/05/2008 20 000
Vincent & Fensham QS SCMU5-08/09-0523 Quantity Surveying Services 08/05/2008 23 000
Vokon Africa Consulting EE 0835(1)-07/08
Electrical Engineering School Building 15/04/2008 30 000
Vokon Africa Consulting EE 0843(1)-07/08
Electrical Engineering Services for the fore mentioned School Building 13/06/2008 30 000
Vokon Africa Consulting (Mthatha Office)
EE SCMU5-08/09-0596
Electrical Engineering Services 11/11/2008 150 000
X3 Architects Arch SCMU5-08/09-0607 Architectural Services 23/3/2009 1 200 000