Demystifying Big Data | Population Reference Bureau
34
Demystifying Big Data for Demography and Global Health POPULATION BULLETIN • VOL. 76, NO. 1 • 2022
-
Upload
khangminh22 -
Category
Documents
-
view
1 -
download
0
Transcript of Demystifying Big Data | Population Reference Bureau

DemystifyingBig Datafor Demography and Global HealthPOPULATION BULLETIN • VOL. 76, NO. 1 • 2022
POPULATION BULLETIN VOL. 76, NO. 1 • 2022
This Population Bulletin was written by LORI S. ASHFORD, principal of Clarity Global Health LLC; TOSHIKO KANEDA, technical director of demographic research at PRB; and EMMANUEL LETOUZÉ, director and cofounder, Data-Pop Alliance, and Marie Curie Fellow, Universitat Pompeu Fabra.
ABOUT THE AUTHORS
Population Bulletins are published periodically by PRB for its members and subscribers and are available for purchase at PRB.org and Amazon.com.
For information about bulk pricing, email us at [email protected]. To become a PRB member or to support our work with a tax-deductible donation, please visit PRB.org.
ABOUT THIS PUBLICATION
The authors would like to thank several people who lent their expertise and provided useful advice and support for this Bulletin: Rachel Snow, Romesh Silva, and Tapiwa Jhamba of the Technical Division of the United Nations Population Fund (UNFPA); Alex de Sherbinin of the Center for International Earth Science Information Network (CIESIN), Columbia University; Emilio Zagheni and Joshua Wilde of the Max Planck Institute for Demographic Research; and Ingmar Weber of Qatar Computing Research Institute. Thanks also go to Sylvie Ashford for research and writing assistance.
We would like to acknowledge the following PRB staff who reviewed drafts of this report and provided valuable assistance, including BARBARA SELIGMAN, chief strategy and growth officer and senior vice president, International Programs; GAYE AGESA, senior regional communications manager; NANCY MATUSZAK, editorial director; RAQUEL WOJNAR, editor; JOHN HERNE, creative director; and ANNEKA VAN SCOYOC, senior graphic designer.
ACKNOWLEDGMENTS
SUGGESTED CITATIONLori S. Ashford, Toshiko Kaneda, and Emmanuel Letouzé, “Demystifying Big Data for Demography and Global Health,” Population Bulletin 76, no. 1 (2022).
PHOTO CREDITSCOVER, LEFT TO RIGHT: Uygar Ozel/Getty Images, anon-tae/Getty Images, SI Imaging Services/Imazins/Getty Images, zeljkosantrac/Getty Images, Westend61/Getty ImagesPAGE 2: robertharding/Alamy Stock PhotoPAGE 8: SI Imaging Services/Imazins/Getty Images PAGE 12: SK Hasan Ali/Alamy Stock PhotoPAGE 19: Amir Mukhtar/Getty ImagesPAGE 23: poco_bw/Getty Images
© 2022 Population Reference Bureau. All rights reserved.
Demystifying Big Datafor Demography and Global Health

Executive Summary 1
What Do We Mean by Big Data? 3
Big Data Sources and How They Can Inform Demography and Global Health 6Data Exhaust Offers Details of People’s Daily Lives and Movements 6Digital Content Provides Insights Into Beliefs and Behaviors 7Digital Sensing Provides Real-Time Information About People’s Locations and Surroundings 8
The Basics of Big Data Analytics 9
The Advantages of Using Big Data 11Fill Gaps in Population and Health Data 11Obtain Data at Relatively Low Cost 11Access Information in Almost Real Time 11Pinpoint Geographic Areas of Need With Granular Detail 12Enable Responses to Crises 12Improve Individual and Public Health 13Explore Rich Information Sources on Opinions and Behaviors 13Open New Research Opportunities 13
Innovative Uses of Big Data in Low- and Middle-Income Countries 14Afghanistan: Combining Data Sources to Produce New Population Estimates 14Malawi: Using Mobile Phone Data to Improve Availability of Health Services 15Sub-Saharan Africa: Conducting Geospatial Analysis to Close Gaps in Maternal Health Services 16North India: Exploring and Influencing Young People’s Attitudes About Family Planning on Digital Platforms 18Uganda: Gaining Insights on Public Opinion by Analyzing Talk Radio Shows 19
The Challenges and Risks of Using Big Data 21Legal and Ethical Concerns 21The Pitfalls of Computer Algorithms 21Data Limitations 22Difficulties Accessing Commercial Data 23Disadvantaged Populations Missing From the Data 23Limited Technical Capacity 23Resource Trade-Offs 23
Conclusions and Future Prospects 24Traditional Data Are Still Necessary 24Data Must Be Collected and Used Ethically 24Big Data Capacities and Communities Must Be Built 25
Appendix: International Projects Focused on Big Data for Public Good 26
References 27
Contents
Executive Summary
The explosion in use of mobile phones, computers, and other electronic devices around the world has created unimaginable volumes of data that offer new insights into human behavior and activities. Though previously concentrated in high-income countries, these digital data are accumulating rapidly in low- and middle-income countries.
Policymakers and development professionals who rely on demographic and health data are increasingly recognizing the advantages of using these data, called big data. A growing number of development projects in low- and middle-income countries are making innovative uses of data from sources such as satellite imagery, mobile phone calling records, internet searches, and social media posts. The data are filling information gaps in places where traditional data collection, such as censuses and household surveys, is too costly or logistically challenging. The new data and analytics associated with them can help identify populations who need services, track progress on health and development goals, and guide allocation of public resources. They can also be critical in tracking infectious diseases and responding to humanitarian crises.
Yet, the use of big data for decision-making also has drawbacks. One disadvantage is that data derived from mobile phones or online activity do not represent the whole population, only people who are digitally connected, and researchers have limited information about their characteristics. In addition, tapping into big data raises ethical and privacy
concerns related to using personal information. Because legal protections of personal data are not well developed in much of the world, researchers must proceed with caution and ensure that data culled from privately held records do not breach confidentiality standards or pose harm to individuals.
Big data use is at an early stage in the population and health fields in low- and middle-income countries for several reasons: resource constraints, limited awareness and technical capacity, and weak laws and regulations governing data access and use. More advanced computer programming and other analytical skills must be developed in host countries. New partnerships, research protocols, and regulatory frameworks are needed to access and share data in ways that protect individual privacy and promote participation by those collecting and using the data.
For all of its potential, big data cannot replace traditional data sources like censuses and surveys because they are essential to establish ground truth—what is known to be true on the ground—and verify research results. This report illustrates how combining new and old data sources can result in analyses that are richer in detail and more useful than any one source on its own. The goal is not just to have more data and bigger computers. Researchers must think about data differently and adopt new ways of analyzing and interpreting them so that the results are valid and useful for decisionmakers.
Professionals in demography and global health have varying degrees of understanding about big data and the advantages and risks of using it in their work. This Population Bulletin provides an accessible resource on this technical topic, examining innovative ways big data is being used and how we can start thinking differently about data.
1POPULATION BULLETIN • VOL. 76, NO. 1 • 2022
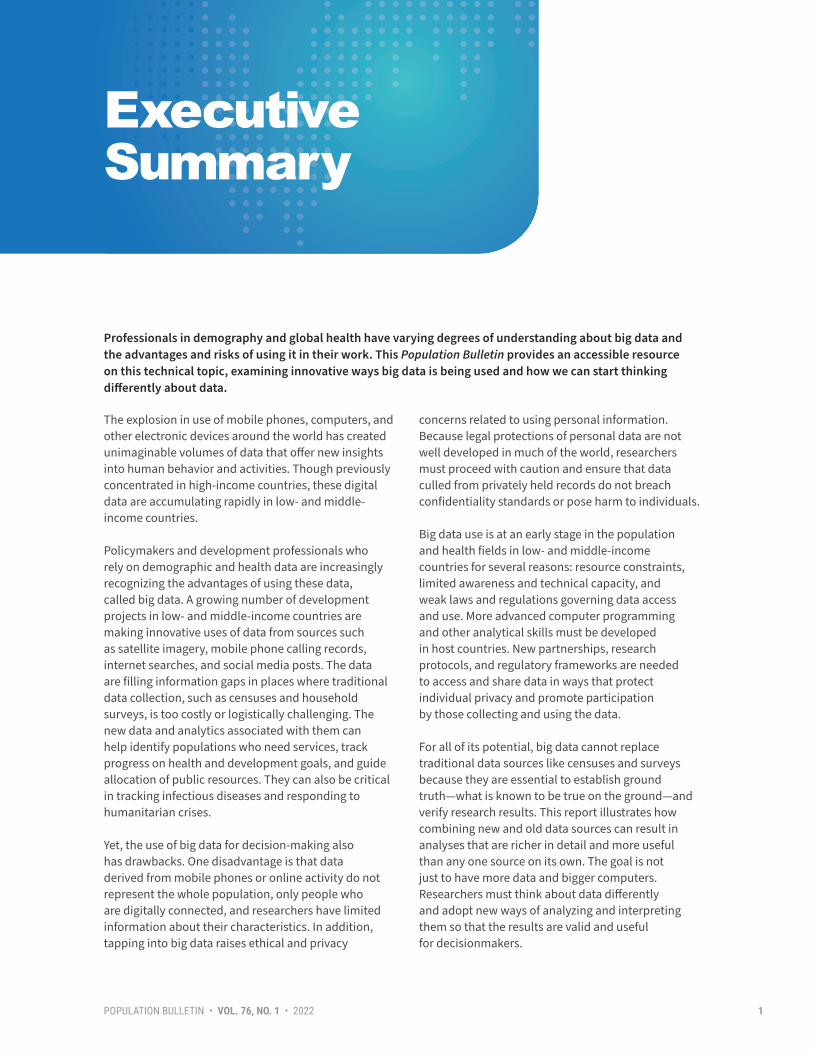
A Masai man talks on a mobile phone in Kenya. As more people use technological devices, the information they generate—collected as big data—can provide insights on population density, migration, and other issues.
Potential users of big data sources should be aware of the possibilities and challenges involved, keeping in mind three points. First, traditional censuses and surveys are not obsolete; the most promising innovations combine big and traditional data in such a way that the advantages of one data source overcome the limitations of another. Second, big
data must be collected and used ethically and responsibly, particularly regarding personal information. Third, new research capacities and communities must be built to turn masses of data into meaningful information that will help public and private agencies design better programs and services to improve lives.
Combining new and old data sources can result in analyses that are richer in detail and more useful than any one source on its own.
2POPULATION BULLETIN • VOL. 76, NO. 1 • 2022
What Do We Mean by Big Data?
The term big data refers to large amounts of information on interactions, transactions, and daily activities generated continuously from digital devices such as computers, cell phones, tablets, scanners, and smart devices. Bits of data are generated and collected every time an individual shops online, makes a cell phone call, sends a text message, uses a search engine, posts on social media, shares personal records online, jogs with a fitness tracker, or operates a smart speaker or thermostat in their home—for just a few examples. In addition, satellites, drones, and roving cameras capture images of cities, neighborhoods, and homes at regular intervals. Multiplying the digital activity of billions of individuals, along with businesses, industries, media, and governments, results in quantities of data that would have been unfathomable a few decades ago, and that are growing exponentially each year.
Big data is distinct from traditional forms of demographic and health data because it is generated as a byproduct of human activity. Traditional data refers to the censuses, surveys, civil registrations, and various kinds of health service and administrative records that have been collected for decades—and in some cases, centuries. To collect traditional data, researchers or administrators rely on a set of questions and use pretested instruments or forms; they identify the universe of people they wish to study and either collect data on everyone or a representative sample. Data collectors request information directly from respondents for explicit purposes, and people are usually aware of what is being recorded about them. In contrast, big data
accumulates automatically from people’s behavior, often without their awareness, or from remote cameras and digital sensors.
While national censuses and surveys contain a large amount and variety of data that require statistical software to analyze, “a lot of data” is not the same as big data. Similarly, the term big data does not refer to collecting or reporting traditional data using digital devices such as mobile phones or tablets, even though these devices enable researchers to reach more people faster. Collecting and reporting traditional data in digital formats are part of the digital revolution sweeping the world, but they do not fall under the big data umbrella.
Definitions of big data vary among scholars and organizations. Some define it in terms of its “Vs”—volume, velocity, and variety—referring to the unprecedented size and speed of data being generated and the wide range of sources it can come from.1 Value (another “v”) can be derived from finding hidden patterns that would otherwise go undetected in vast quantities of data. Creating this value, however, requires far greater storage capacity and computing power and more complex methods of analysis than the statistical methods typically used by demographers and social scientists. Other data and development organizations have characterized big data as a whole ecosystem encompassing sources, analytics, and users through the “Cs” of big data.2 These Cs refer to the digital crumbs—the data themselves; capacities—the tools, methods, software, and hardware used to give the crumbs meaning; and communities and culture—the
3POPULATION BULLETIN • VOL. 76, NO. 1 • 2022

teams of computer and social scientists that work with the datasets, and the end users of the data.
The growing use of digital devices worldwide is creating this huge variety and volume of crumbs for researchers to explore. Globally, there were 5.3 billion unique mobile phone users at the start of 2021, representing two-thirds of the world’s population, and 4.8 billion internet users (see Figure 1). How much data are digital users generating? A personal computer might contain 250 or 500 gigabytes of storage, but big data is measured in petabytes, equivalent to one million gigabytes. All of the data in the world are now reaching into the zettabytes, which are trillions of gigabytes.3 The lion’s share of big data is generated in high-income countries, but digital activity is growing everywhere (see Figures 2 and 3).
Regardless of how it is defined, big data requires advanced methods of analysis to extract value from large, unstructured datasets. Sources and methods go hand in hand—to turn big data into meaningful and actionable information, it must be
captured, stored, cleaned, queried, analyzed, and interpreted (see The Basics of Big Data Analytics, page 10). A whole field of data science has emerged and grown to analyze large datasets using machine learning, a type of artificial intelligence (AI), for an almost infinite array of purposes. Government officials and development professionals in low- and middle-income countries may have viewed big data analytics as a niche field five to 10 years ago, but the COVID-19 pandemic and related shutdowns have brought about new interest in using unconventional forms of data to answer pressing questions.
All big data share a key feature: The original data must be reorganized and queried to suit a purpose other than the data’s initial function. The data are not organized according to research objectives defined in advance; instead, they must be reorganized and interpreted after the fact.4 Researchers can repurpose the newer forms of unstructured data to complement traditional data sources, offering additional insights or filling gaps when the needed information is unavailable or out of date.
DIGITAL ACTIVITY WORLDWIDE LEAVES TRACES FOR RESEARCHERS TO FOLLOWWorld population: 7.8 billion
5.3 BILLION 67%UNIQUE MOBILE PHONE USERS
4.5 BILLION 57%ACTIVE SOCIAL MEDIA USERS
4.8 BILLION 61%INTERNET USERS
Note: Internet users does not include users of social media platforms—these values are reported separately. Social media users may not represent unique individuals because some people have multiple accounts, and some accounts may be fake. Source: Adapted from Simon Kemp, Digital 2021 July Global Statshot Report, July 21, 2021.
FIGURE 1
4POPULATION BULLETIN • VOL. 76, NO. 1 • 2022
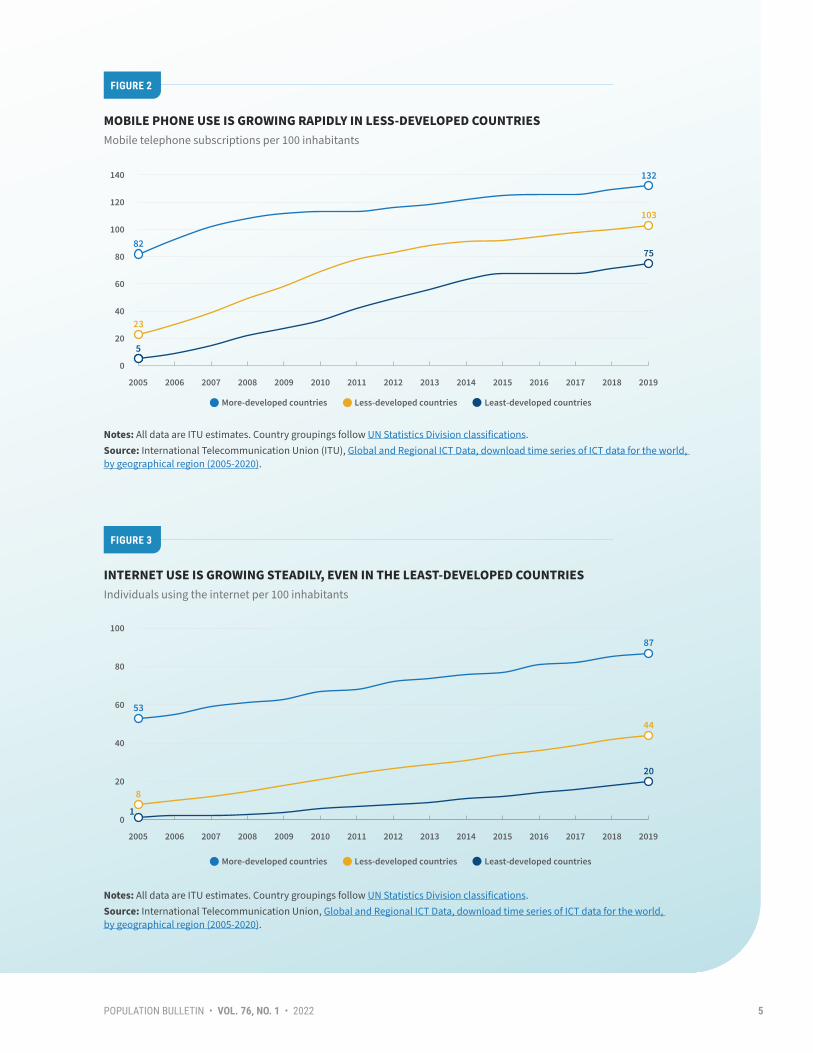
MOBILE PHONE USE IS GROWING RAPIDLY IN LESS-DEVELOPED COUNTRIESMobile telephone subscriptions per 100 inhabitants
INTERNET USE IS GROWING STEADILY, EVEN IN THE LEAST-DEVELOPED COUNTRIESIndividuals using the internet per 100 inhabitants
Notes: All data are ITU estimates. Country groupings follow UN Statistics Division classifications. Source: International Telecommunication Union (ITU), Global and Regional ICT Data, download time series of ICT data for the world, by geographical region (2005-2020).
Notes: All data are ITU estimates. Country groupings follow UN Statistics Division classifications. Source: International Telecommunication Union, Global and Regional ICT Data, download time series of ICT data for the world, by geographical region (2005-2020).
2005 2006 2007 2008 2009 2010 2011 2012 2013 2014 2015 2016 2017 2018 2019
0
20
40
60
80
100
120
140
82
132
23
103
5
75
More-developed countries Less-developed countries Least-developed countries
2005 2006 2007 2008 2009 2010 2011 2012 2013 2014 2015 2016 2017 2018 2019
0
20
40
60
80
100
53
87
8
44
1
20
More-developed countries Less-developed countries Least-developed countries
FIGURE 2
FIGURE 3
5POPULATION BULLETIN • VOL. 76, NO. 1 • 2022

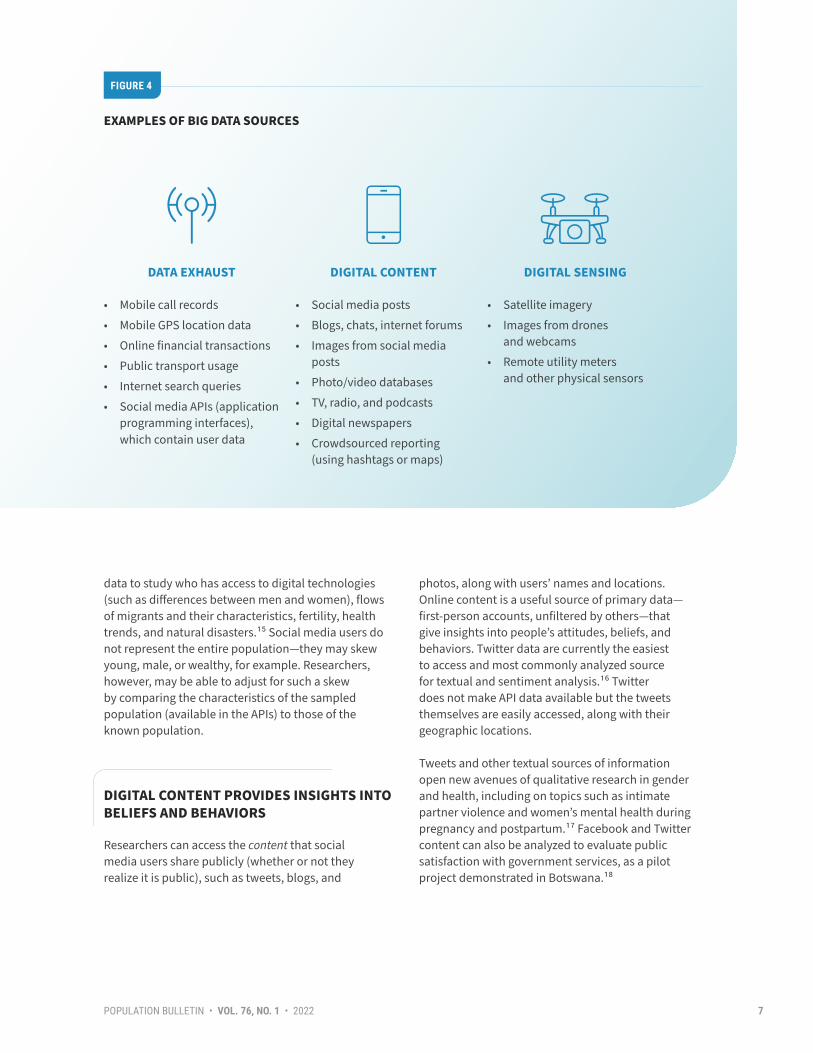
Big data can be generated by humans, machines, or both, and used for public or private purposes.5 In this section, we divide big data sources into three categories: data exhaust—passively collected records from everyday activity on digital devices; digital content—words and images posted online; and digital sensing—information gathered remotely, such as from satellites or physical sensors around us.6 The classifications and terms vary among organizations using big data, but the examples detailed here and in Figure 4 illustrate the range of potential sources.
DATA EXHAUST OFFERS DETAILS OF PEOPLE’S DAILY LIVES AND MOVEMENTS
Data exhaust, also called digital crumbs, breadcrumbs, footprints, or traces, refers to passively collected data that accumulate from private, everyday use of digital devices for mobile communications, money transactions, transportation, and activity on the internet.7 Most of these data belong to businesses who store and use them to improve their services and marketing. Mobile phone data are the most widely available type of exhaust because the majority of people in most countries now use mobile phones. Call records containing sender, receiver, time, and location provide a huge window into people’s lives and movements in almost every part of the globe. These and other exhaust data are anonymized (the users’ identities are removed) when the service providers or network operators who own the data share them for analysis.
In low- and middle-income countries, researchers have conducted studies using mobile phone records
to respond to disasters; measure poverty; plan urban development; monitor infectious diseases, education, and crime; and analyze social networks, gender equality, migration, and other demographic topics.8 Governments and aid organizations have used mobile phone data as an indirect way to measure income and food insecurity, and to target cash and other assistance to individuals and households who need it most.9
Internet activity also provides traces for researchers to follow; for example, migrant flows have been estimated by tracking the locations, inferred from internet protocol (IP) addresses, of users who repeatedly log into an email service such as Yahoo.10 More than a decade ago, a study of internet searches across 50 U.S. states and 37 countries showed that the volume of searches related to abortion was consistently higher in places where local abortion rates were low and laws and regulations related to abortion were restrictive.11 More recently, studies using Google Trends data have shown that the volume of internet searches with keywords related to pregnancy and childbirth can be used to predict birth rates several months ahead.12 A U.S. study in 2020 looked at search volumes by state to predict the effects of the COVID-19 pandemic on state-level births.13 The authors predicted U.S. fertility would drop overall, and birth data that became available later confirmed that it did.14
Social media provide increasing opportunities for research, as a growing share of the world’s population uses Facebook, Instagram, Twitter, and similar online platforms. Facebook and Google include users’ demographic information in their application programming interfaces (APIs), which are designed for advertisers to target their ads but can also be accessed and used for research. Social scientists have used API
Big Data Sources and How They Can Inform Demography and Global Health
6POPULATION BULLETIN • VOL. 76, NO. 1 • 2022
data to study who has access to digital technologies (such as differences between men and women), flows of migrants and their characteristics, fertility, health trends, and natural disasters.15 Social media users do not represent the entire population—they may skew young, male, or wealthy, for example. Researchers, however, may be able to adjust for such a skew by comparing the characteristics of the sampled population (available in the APIs) to those of the known population.
DIGITAL CONTENT PROVIDES INSIGHTS INTO BELIEFS AND BEHAVIORS
Researchers can access the content that social media users share publicly (whether or not they realize it is public), such as tweets, blogs, and
photos, along with users’ names and locations. Online content is a useful source of primary data—first-person accounts, unfiltered by others—that give insights into people’s attitudes, beliefs, and behaviors. Twitter data are currently the easiest to access and most commonly analyzed source for textual and sentiment analysis.16 Twitter does not make API data available but the tweets themselves are easily accessed, along with their geographic locations.
Tweets and other textual sources of information open new avenues of qualitative research in gender and health, including on topics such as intimate partner violence and women’s mental health during pregnancy and postpartum.17 Facebook and Twitter content can also be analyzed to evaluate public satisfaction with government services, as a pilot project demonstrated in Botswana.18
EXAMPLES OF BIG DATA SOURCES
DATA EXHAUST
• Mobile call records• Mobile GPS location data• Online financial transactions• Public transport usage• Internet search queries• Social media APIs (application
programming interfaces), which contain user data
DIGITAL CONTENT
• Social media posts• Blogs, chats, internet forums• Images from social media
posts • Photo/video databases• TV, radio, and podcasts• Digital newspapers• Crowdsourced reporting
(using hashtags or maps)
DIGITAL SENSING
• Satellite imagery• Images from drones
and webcams• Remote utility meters
and other physical sensors
FIGURE 4
7POPULATION BULLETIN • VOL. 76, NO. 1 • 2022
DIGITAL SENSING PROVIDES REAL-TIME INFORMATION ABOUT PEOPLE’S LOCATIONS AND SURROUNDINGS
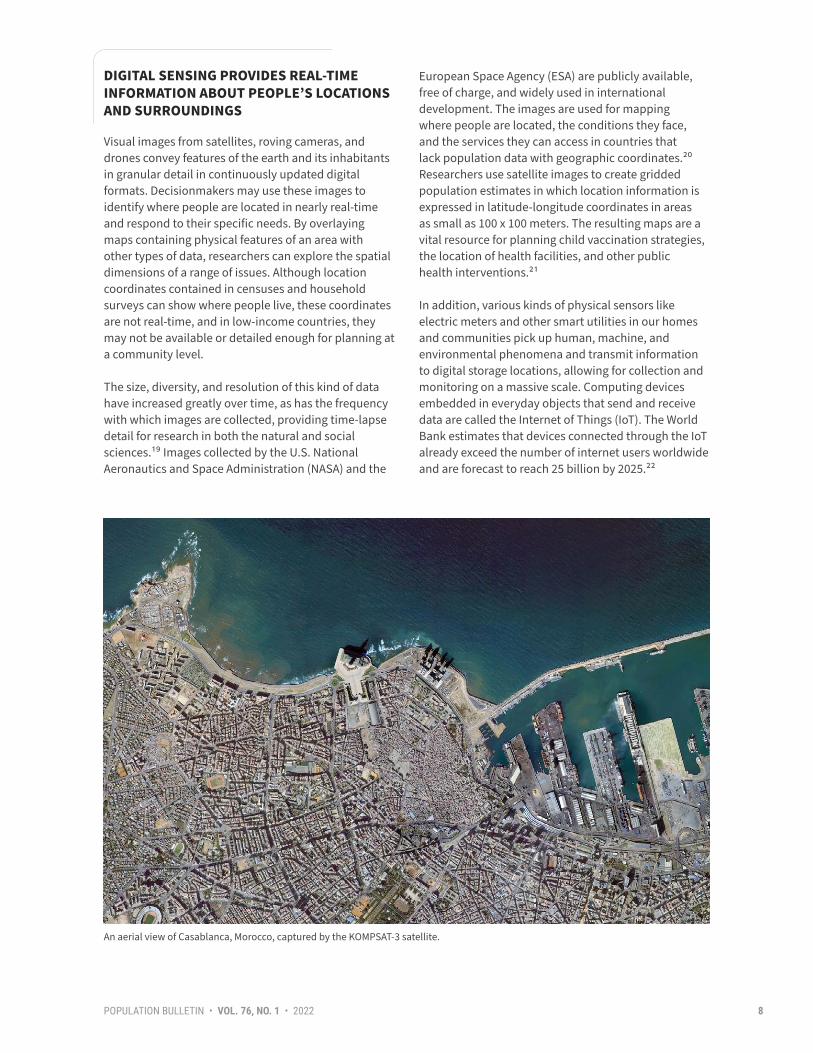
Visual images from satellites, roving cameras, and drones convey features of the earth and its inhabitants in granular detail in continuously updated digital formats. Decisionmakers may use these images to identify where people are located in nearly real-time and respond to their specific needs. By overlaying maps containing physical features of an area with other types of data, researchers can explore the spatial dimensions of a range of issues. Although location coordinates contained in censuses and household surveys can show where people live, these coordinates are not real-time, and in low-income countries, they may not be available or detailed enough for planning at a community level.
The size, diversity, and resolution of this kind of data have increased greatly over time, as has the frequency with which images are collected, providing time-lapse detail for research in both the natural and social sciences.19 Images collected by the U.S. National Aeronautics and Space Administration (NASA) and the
European Space Agency (ESA) are publicly available, free of charge, and widely used in international development. The images are used for mapping where people are located, the conditions they face, and the services they can access in countries that lack population data with geographic coordinates.20 Researchers use satellite images to create gridded population estimates in which location information is expressed in latitude-longitude coordinates in areas as small as 100 x 100 meters. The resulting maps are a vital resource for planning child vaccination strategies, the location of health facilities, and other public health interventions.21
In addition, various kinds of physical sensors like electric meters and other smart utilities in our homes and communities pick up human, machine, and environmental phenomena and transmit information to digital storage locations, allowing for collection and monitoring on a massive scale. Computing devices embedded in everyday objects that send and receive data are called the Internet of Things (IoT). The World Bank estimates that devices connected through the IoT already exceed the number of internet users worldwide and are forecast to reach 25 billion by 2025.22
An aerial view of Casablanca, Morocco, captured by the KOMPSAT-3 satellite.
8POPULATION BULLETIN • VOL. 76, NO. 1 • 2022
Big data comes in two forms: structured (such as records of phone calls or bank transactions) or unstructured (such as social media posts or radio transcripts). Either way, before meaning can be gleaned from big data, researchers must filter it using data analytics—tools and methods that convert massive amounts of raw data into “data about the data” that researchers can analyze for a specific purpose.23 Machine learning makes this possible. To develop a machine learning model, data scientists collect data on a specific problem and use the dataset to train a computer system to solve the problem using algorithms and mathematical equations. Examples in our daily lives include computer systems that can filter spam, suggest products to buy based on our past purchases, recognize faces or speech, and translate text into different languages.
Supervised learning is a form of machine learning in which researchers build a model linking inputs to known outputs, also called ground truth (knowledge about what is true in the real world), so that the machine will next apply the model to new inputs with unknown outputs.24 Once the computer system identifies features in the data that can accurately predict the outcomes of interest, it can use what it has learned to make predictions where the outcome is unknown. For example, it may estimate how many people live in an area based on certain types of dwellings, or how many will develop noncommunicable diseases such as diabetes and high blood pressure based on details about the population’s demographic characteristics, household income, and levels of education. Researchers often use machine learning to build models that predict an outcome involving multiple variables with complex relationships.25
Unsupervised learning, similar to data mining, is a process in which the machine uses input data to discover patterns and mathematical relationships unknown to the researchers to, for example, determine the typical progression of a disease.26 The ultimate goal is to identify hidden patterns and correlations that statistical software would not find.
Once computer models are trained on large amounts of data, they can make connections, predictions, infer-ences, or suggestions based on previous observations. The outputs of supervised and unsupervised machine learning can be:27
• Descriptive, capturing and classifying observations, reducing them to readable tables, graphics, or word clouds, such as a social media website listing trending topics.
• Predictive, forecasting what might happen based on thousands or millions of previous observations, or making an inference about one variable based on another variable, like estimating a population’s geographical distribution based on mobile phone activity.
• Prescriptive, trying to make recommendations based on causal relations, such as the possible effects on maternal mortality of adding childbirth facilities in a particular area.
Writing the computer code to perform these functions is complex and only one part of the process of turning crumbs of data into usable information for decision-making; the results must also be packaged and presented in ways that provide valuable insights. (See Box 1 for an example of transforming big data into usable information).
The Basics of Big Data Analytics
9POPULATION BULLETIN • VOL. 76, NO. 1 • 2022

BOX 1
Mobile phones are widely used in low- and middle-income countries and generate the most common form of data exhaust. To make call detail records useful, researchers must collect, clean, analyze, distill, and interpret the data (see figure). Anyone who wants to use this form of data exhaust must have an agreement with the mobile network operator (telecommunications company) to obtain records that contain the calling and receiving numbers, timestamps, and geographic locations of calls during a specified period. Some mobile phones are also smartphones, which provide even more detail for analysis because of their internet access logs and browsing history.
The network operator will typically anonymize the data, that is, remove personal identifying information to protect individual privacy. Anonymization often involves aggregating the call records, which reduces the size and utility of the data set and therefore the insights researchers can draw from it. Yet, this decrease in utility is considered a necessary trade-off for privacy.
Researchers must have the hardware, software, and data skills to store, process, and analyze the data, shown in the steps below. At each stage of the process, quality assurance is essential to identify potential errors and resolve them. Data analysts must also distill and transform the data into formats that end users like policymakers can understand.
Transforming Mobile Calling Data Into Useful Information for Decision-Making
Research team accesses the data gathered by MNO
Mobile network operator (MNO) collects call detail
records (CDRs)
Store data from MNO
Analyze indicators across time and space to identify
project characteristics
Clean and process data to build indicators, pair or combine
with other relevant data
AccessCollect Store
AnalyzeProcess CommunicateShare results in
easy-to-understand formats
THE PATH TO MAKING CALL DETAIL RECORDS USEFUL FOR DECISION-MAKING
Source: Adapted from Digital Impact Alliance and Data-Pop Alliance, Mobile Data for Development (MD4D) Handbook, 2021.
10POPULATION BULLETIN • VOL. 76, NO. 1 • 2022

The Advantages of Using Big Data
Many international organizations and initiatives around the world and national statistical offices consider big data a vital part of development progress. The World Bank’s World Development Report 2021 argues that because the possible uses of data are limitless, the reuse and repurposing of data are critical for improving lives.28
FILL GAPS IN POPULATION AND HEALTH DATA
The newer forms of data have great potential to fill gaps in countries where demographic and health data are scarce. Digital exhaust, online content, and satellite and other remote sensing data can offer alternative sources of information for estimating a population’s size, growth, and movements, as well as many indicators of their well-being. Though not examined in this report, electronic medical records are likely to increase in size and importance in low- and middle-income countries, creating an additional form of big data to be mined using machine learning tools.29
For United Nations (UN) agencies and countries monitoring progress toward the 2030 Sustainable Development Goals (SDGs), nontraditional sources of data could potentially fill gaps in measuring the 231 indicators used to monitor the 17 goals.30 Pilot projects have shown that big data sources such as satellite and remote sensing, social media, and mobile phone data could be particularly helpful in monitoring what the UN calls tier 3 indicators, for which standards and methods are not yet established.31
OBTAIN DATA AT RELATIVELY LOW COST
Researchers can obtain mobile phone call detail records from mobile network operators and use them at a small fraction of the cost of conducting household surveys.32 Although mobile phone datasets provide incomplete coverage of the population, they offer an inexpensive option for interim data analyses that can be compared with census and survey results once these become available. In addition, satellite imagery and associated software owned by NASA and the ESA are available free charge.
ACCESS INFORMATION IN ALMOST REAL TIME
With the right tools and resources, big data can be accessed and analyzed quickly enough to provide insights into nearly real-time situations. This timeliness means big data can help generate estimates between censuses and surveys that ordinarily take years to develop, conduct, and publish. It can also improve our understanding of human behavior and decision-making by offering early detection of unfolding crises or emergencies, details about where people are and what they are doing at a given moment, and relatively quick feedback on whether policies and programs are having the desired effects.33 Moreover, real-time data can help overcome the problem of recall bias—when survey participants fail to remember accurately events that happened in the past.
11POPULATION BULLETIN • VOL. 76, NO. 1 • 2022
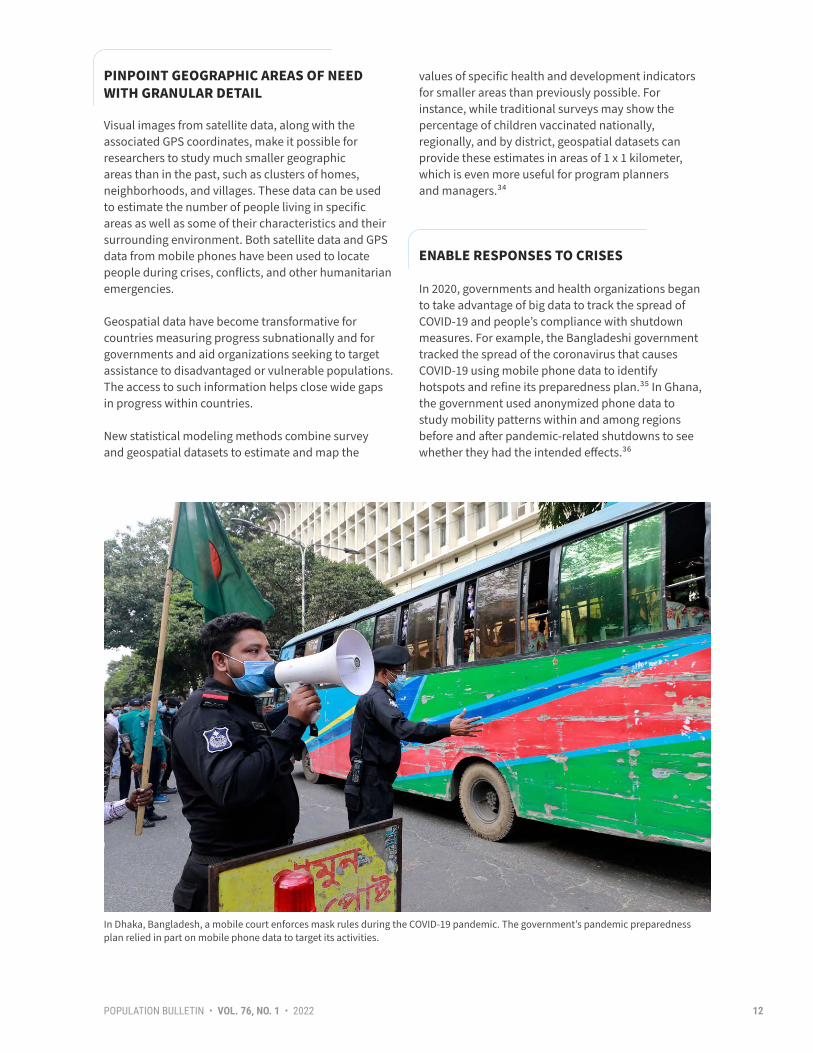
PINPOINT GEOGRAPHIC AREAS OF NEED WITH GRANULAR DETAIL
Visual images from satellite data, along with the associated GPS coordinates, make it possible for researchers to study much smaller geographic areas than in the past, such as clusters of homes, neighborhoods, and villages. These data can be used to estimate the number of people living in specific areas as well as some of their characteristics and their surrounding environment. Both satellite data and GPS data from mobile phones have been used to locate people during crises, conflicts, and other humanitarian emergencies.
Geospatial data have become transformative for countries measuring progress subnationally and for governments and aid organizations seeking to target assistance to disadvantaged or vulnerable populations. The access to such information helps close wide gaps in progress within countries.
New statistical modeling methods combine survey and geospatial datasets to estimate and map the
values of specific health and development indicators for smaller areas than previously possible. For instance, while traditional surveys may show the percentage of children vaccinated nationally, regionally, and by district, geospatial datasets can provide these estimates in areas of 1 x 1 kilometer, which is even more useful for program planners and managers.34
ENABLE RESPONSES TO CRISES
In 2020, governments and health organizations began to take advantage of big data to track the spread of COVID-19 and people’s compliance with shutdown measures. For example, the Bangladeshi government tracked the spread of the coronavirus that causes COVID-19 using mobile phone data to identify hotspots and refine its preparedness plan.35 In Ghana, the government used anonymized phone data to study mobility patterns within and among regions before and after pandemic-related shutdowns to see whether they had the intended effects.36
In Dhaka, Bangladesh, a mobile court enforces mask rules during the COVID-19 pandemic. The government’s pandemic preparedness plan relied in part on mobile phone data to target its activities.
12POPULATION BULLETIN • VOL. 76, NO. 1 • 2022

Humanitarian aid organizations need real-time data on displaced persons to plan for essential services, including public health and safety, yet it is challenging to collect during conflicts and natural disasters. The outpouring of refugees from Syria and Venezuela from 2015 to 2019, for example, prompted researchers and policymakers to seek nontraditional data sources to plan a humanitarian response.37 Mobile phone data have been valuable for tracking movements of people after natural disasters, such as the 2015 earthquake in Nepal.38 A newer tool, mobile location data, can detect all electronic devices that use Wi-Fi, GPS, or cell signals and track their locations and timestamps as long as the devices have location services enabled.39
IMPROVE INDIVIDUAL AND PUBLIC HEALTH
Various kinds of digital tracking devices can enable people to monitor their own health (for instance, monitoring exercise, sleep, blood pressure, heart rate, or menstrual cycle).40 By aggregating such data, researchers could engage in population-level tracking of selected health indicators, many of which would otherwise be hard to obtain from clinical records alone. This type of analysis—and its potential benefits—will not become widespread, however, until more people adopt and use digital tracking technologies in their daily lives.
EXPLORE RICH INFORMATION SOURCES ON OPINIONS AND BEHAVIORS
Digital content—for example from social media posts or readers’ comments on articles and websites—offers unique, unsolicited insights into how people interact and express themselves.41 Social scientists might examine this content to explore opinions and beliefs about sensitive issues such as gender identity, sexuality, or abortion. Digital content that users share regularly, like social media posts, can help capture rapidly changing beliefs, as opposed to one point in time from a traditional survey.42 Survey data on sensitive or socially taboo topics like premarital or extramarital sexual activity are hard to assess for
accuracy. The content of social media postings or records of use from dating apps for finding sexual partners could complement standard surveys to confirm or challenge their results.
OPEN NEW RESEARCH OPPORTUNITIES
When combined with traditional data sources, big data can offer additional dimensions and insights into people’s well-being, behaviors, and service needs. Many research projects today combine multiple types of data—satellite imagery, digital exhaust data, household survey, and census—creating new and innovative ways to answer demographic and health questions. For example, an AI company is testing a machine learning tool that combines data from health facilities and satellite imagery, along with population and geographic information, to forecast essential medicines in countries that have limited traditional data.43 The company is working with health ministries to predict use of contraceptives at health facilities in Côte d’Ivoire and vaccine utilization in Tanzania to project resource needs.44
The field of demography has a long history of creating scientifically sound estimates from imperfect data; using big data is a logical continuation of investigating, testing, validating, and improving our knowledge about populations.45
Beyond doing old things in new ways, big data can expand the scope of what researchers can investigate—answering questions that have not been asked before and opening new areas of inquiry. Social scientists can reach and study new populations, both foreseen and unforeseen; data scientists can test new models and algorithms to advance knowledge on nearly any research topic.46 These kinds of shifts entail a new way of thinking beyond established indicators, methodologies, and disciplines. Some of the field’s pioneers have framed big data primarily as a “mindset, of turning mess into meaning,” underlying its cultural significance.47 This mindset is starting to shape how demographers, social scientists, and public health specialists use big data for policymaking and program planning.
13POPULATION BULLETIN • VOL. 76, NO. 1 • 2022
Demographers, public health experts, and others are using big data as a resource to:
• Allocate resources and services more effectively where conflict has prevented a census count for decades.
• Identify where new health clinics can best serve a fast-growing population.
• Determine where increased services for maternal health would benefit the most people.
These are just some of the ways that big data, combined with existing household surveys, is being used to provide critical information for public-sector decision-making and resource allocation in places like Afghanistan, Malawi, and sub-Saharan Africa.
More explorative work, described in examples from India and Uganda, looks at what big data can tell us about people’s attitudes and behaviors on health-related topics. These examples include analyses of content from social media posts and talk-radio shows—in-depth descriptive information that would otherwise be costly to collect. The analyses could indicate ways to design programs to encourage people to adopt healthier behaviors.
AFGHANISTAN: COMBINING DATA SOURCES TO PRODUCE NEW POPULATION ESTIMATES
How can decisionmakers get the demographic information they need for development planning and resource allocation without a current, or even recent, census? Where instability, violence, or other hazards hinder traditional census-taking, machine learning models can generate population estimates to provide the necessary data. In Afghanistan, the last official
census was conducted in 1979, and ongoing insecurity makes it unlikely another one will be undertaken soon. Beginning in 2015, the UN Population Fund (UNFPA), WorldPop, Flowminder, and the National Statistics and Information Authority of Afghanistan formed a team to produce new population estimates in Afghanistan by combining big data with traditional survey data.48
Data scientists built an estimation model using recent data from rapid, small-scale surveys conducted in some Afghan provinces along with existing geospatial data, or demographic information organized by location and time. The team used AI to scan nationwide satellite imagery, identify residential compounds visually, and estimate household numbers and sizes from the buildings to form a new geospatial dataset.49 From these sources, the model generated population figures for 100 x 100-meter cells across Afghanistan’s 34 provinces (see Figure 5).50 The final population estimates, released in 2017, were broken down by age, sex, and geographic area, with corresponding certainty levels. Estimates were considered most statistically certain at the district and provincial levels, and least certain at the subdistrict level and in areas where traditional survey data were the least reliable.51
UN agencies operating in Afghanistan at the time adopted the 2017 estimates for funding and programming decisions.52 These modeled estimates are much more reliable than population projections based on the 1979 census because even a small change in the growth rate could produce a big difference in the final population estimate, especially in a country the size of Afghanistan.53 They are, however, still less accurate than recent national survey data would be and cannot provide the same level of detail on individuals, families, or households. In addition, machine learning estimates are only as accurate as the micro-data they are built around. Yet these
Innovative Uses of Big Data in Low- and Middle- Income Countries
14POPULATION BULLETIN • VOL. 76, NO. 1 • 2022

Source: WorldPop, “Mapping Afghanistan’s Population,” Feb. 24, 2019. Reproduced by permission.
new estimates fill an important information gap in environments where security or operational problems limit on-the-ground data collection.54
MALAWI: USING MOBILE PHONE DATA TO IMPROVE AVAILABILITY OF HEALTH SERVICES
Malawi’s fast-growing population is putting stress on its health infrastructure. How can the government best identify where the need for services is greatest? Decisionmakers engaged in this kind of development planning can use big data for detailed information about population density and seasonal migration patterns. In 2017, the Digital Impact Alliance (see appendix) partnered with Cooper/Smith and the government of Malawi to map demographic trends in Malawi using call detail records (CDRs) from mobile phones.55 The project team combined data from a mobile network operator and other data sources to strategically determine locations for new health clinics over the coming years.
The project was designed to address Malawi’s rising public health challenges due to its rapidly growing population, vulnerability to natural disasters, and basic health services already straining to meet needs. At the time the project began, 55% of Malawians lived within five kilometers of a health center.56 The Ministry of Health—aiming to raise that figure to 95% by 2023, in line with the SDGs—tasked the project team with determining the best locations for 900 new facilities.57
First, researchers compiled available census records, satellite imagery, existing health center locations, and monthly reports of disease burden by facility. Next, the partner mobile network operator provided 13 billion anonymized CDRs for calls and text messages between January 2016 and May 2018, from 23 million unique calling numbers (Malawi has a population of approximately 18 million people). The CDRs were tagged with the location of their nearest cell tower; altogether the towers spanned 95% of the country. From the geotagged records, researchers tracked population movements for weekday commutes, weekend travel, and migration during the rainy and dry seasons (see Figure 6).58
Enumeration area population count (unadjusted) Enumeration area population estimate (count)
FIGURE 5
A MACHINE LEARNING MODEL GENERATES POPULATION ESTIMATES IN AFGHANISTANThe map at left shows population estimates from recent, small-scale surveys, while the map at right shows complete national estimates produced with a machine learning model.
0–6270–620
628–840
621–932
841–1014
933–1210
1015–1174
1211–1484
1175–1340
1485–1809
1341–1531
1810–2337
1532–1796
2338–3667
1797–7796
3668–11006
15POPULATION BULLETIN • VOL. 76, NO. 1 • 2022

Combining these mobility trends and new population density maps with census and health center data, the project team visualized gaps in health clinic access with greater precision. They pinpointed locations where the proposed 900 new health centers would achieve the 95% access goal, accounting for the locations of commuters and seasonal migrants.59 The project also sought to enable the Ministry of Health to direct the course of analysis, consider future applications of mobile phone data for public health projects, and regularly track migration trends with call records. While the COVID-19 pandemic has slowed these next steps, the new methods offer Malawi’s government a path forward for its health care expansion over the coming years.
SUB-SAHARAN AFRICA: CONDUCTING GEOSPATIAL ANALYSIS TO CLOSE GAPS IN MATERNAL HEALTH SERVICES
Many women in sub-Saharan Africa face obstacles reaching health care services during and after pregnancy, putting their lives and the lives of their newborns at risk. How can officials monitor the availability and accessibility of essential services in a way that captures local variations? Geospatial models that combine data from satellite images and existing household surveys can provide up-to-date and fine-grained data that would otherwise be difficult to collect on the ground. Through a process of visualizing existing data by associated geographic locations, Southampton University’s WorldPop project has developed models to identify gaps in maternal health care at subnational levels in countries with large unmet needs for the service.
FIGURE 6
MOBILE CALLING RECORDS REVEAL MIGRATION PATTERNS IN MALAWIUnderstanding seasonal migration allows us to better estimate population density at a point in time
Note: Based on validated mobile network usage data 2016-2018.Source: Digital Impact Alliance (DIAL) and Data-Pop Alliance, MD4D Handbook, 2021. Reproduced by permission.
Rainy Season MigrationLots of migration from central to northern and southern regions
Percent change in population density
-0.26 -0.05
+0.05 +0.26Percent change in population density
Dry Season MigrationIn the dry season we expect people to travel back to their home regions
16POPULATION BULLETIN • VOL. 76, NO. 1 • 2022

Source: A. S. Wigley et al., “Measuring the Availability and Geographical Accessibility of Maternal Health Services Across Sub-Saharan Africa,” BMC Medicine 18, no. 1 (2020): 237. Reproduced by permission.
FIGURE 7
HIGH-RESOLUTION MAPS SHOW THE SPATIAL DISTRIBUTION OF HOSPITALS AND PREGNANCIES ACROSS SUB-SAHARAN AFRICAResearchers used small-scale geospatial datasets to estimate the average travel-time to the nearest hospital offering comprehensive emergency care in 48 countries (left) and the number of pregnancies per square kilometer (right).
In 2020, a WorldPop team developed models to examine the availability and geographic accessibility of maternal health care across sub-Saharan Africa. Availability was defined as having a minimum of one hospital per 500,000 population, while geographic accessibility was defined as having at least 80% of pregnancies within two hours of the nearest hospital, given the local topography and travel routes. The team estimated population and pregnancies per square kilometer, called small-area estimates, and used hospital location data for sub-Saharan Africa to estimate the associated travel times to reach the necessary
care (see Figure 7).60 Although most countries met the availability and accessibility targets when measured at the national level, researchers found substantial variations in meeting the targets at the subnational levels. More than half of all sub-Saharan countries had at least one province that did not meet one or both targets, while the large majority of the countries had at least one district that did not meet the targets. (Accessibility is shown in Figure 8).61 Governments seeking to achieve universal health coverage by 2030 and improve maternal health will find it vital to monitor these estimates at subnational levels.
Travel-time to the nearest hospital (mins)
No. of pregnancies per km2
Hospital location0–3030–6060–9090–120120–300300–450450–600600–720
> 5000Value
0
17POPULATION BULLETIN • VOL. 76, NO. 1 • 2022

NORTH INDIA: EXPLORING AND INFLUENCING YOUNG PEOPLE’S ATTITUDES ABOUT FAMILY PLANNING ON DIGITAL PLATFORMS
By 2030, India is expected to become the most populous country in the world. What do the country’s youth think about family planning—and how can their views be influenced? Researchers and program planners increasingly use data generated from online activity to identify trends in public opinion and design behavior-change interventions. Information from internet searches and postings on social media networks such as Facebook and Instagram can provide useful data on public attitudes that conventional surveys struggle to capture, particularly on sensitive topics.
In 2020, technology firm Quilt.AI analyzed more than five million internet searches, 20,000 data points from four social media platforms, and 1,200 news articles and blogs to characterize online youth discourse on family planning in the Indian states of Uttar Pradesh and Bihar.62
Using AI, Quilt.AI grouped internet users ages 16 to 24 into eight categories, such as conformists, spiritualists, skeptics, and activists, based on their digital behavior (searches, posts, comments, and blogs) related to family planning. The researchers then compared the presence of each category of users across different internet platforms.
The exercise suggested that certain platforms, such as TikTok and YouTube, offer more pro-family planning perspectives than others, such as Facebook and Twitter, for the target population. The study recommended that family planning supporters be given the necessary information and platforms to spread awareness, while non-supporters be educated with accurate information.63 Once audiences are categorized, organizations working in behavior change can tailor their messages to appeal to each distinct audience profile.
According to Quilt. AI, if done at a “disruptive scale”—strategically tailored messages delivered to each person in the target population every day—such interventions have the potential to change young
Source: Wigley et al., “Measuring the Availability and Geographical Accessibility of Maternal Health Services Across Sub-Saharan Africa.” Reproduced by permission.
FIGURE 8
GEOSPATIAL MODELING SHOWS WHERE GEOGRAPHIC ACCESSIBILITY TARGETS FOR MATERNAL HEALTH CARE ARE METGeospatial modeling of travel times to hospitals and pregnancies per square kilometer produced estimates showing where geographic accessibility targets for maternal health care were met nationally and at provincial and district levels (moving from left to right) across the subcontinent.
National Level Provincial Level District Level
MetNot Met
Accessibility
18POPULATION BULLETIN • VOL. 76, NO. 1 • 2022

people’s behaviors. Digital interventions could nudge their attitudes and behaviors in three ways:
• Redirect search engine traffic toward more reliable information on the topic.
• Place targeted advertisements on video platforms such as YouTube.
• Feature relevant content on user’s social media pages, such as dropping messages, videos, or memes into their timelines.64
The type and tone of the content for each audience profile would draw from the information extracted about them on various platforms. For example, skeptics could be shown examples of small, positive changes brought about by family planning using evidence produced by reputable institutions, while spiritualists could be shown positive religious voices talking about the importance of family planning. The type of content would vary by platform; for example, a humorous activity on TikTok, or a more detailed, informative video or article on Facebook.
As we discuss in the next section (The Challenges and Risks of Using Big Data, page 21), the same avenues for
reaching large audiences with beneficial information can also allow misinformation and harmful content to spread. Ethical principles and standards must guide the development of computer algorithms that determine what thousands (and potentially millions) of people, especially vulnerable young people, see when they log on to their devices. To the extent such standards are followed, the Quilt.AI study shows how data generated from social media platforms can help promote healthy behaviors using an individually targeted approach, which would not be possible without the use of AI.
UGANDA: GAINING INSIGHTS ON PUBLIC OPINION BY ANALYZING TALK RADIO SHOWS
Uganda’s policymakers want to gauge public opinion on several topics and combat misinformation but they have limited resources—and limited information sources. How can officials incorporate public opinion into their planning? In places where internet access and digital activity are low, analysts can cull big data from diverse media sources to understand public opinion and behavior. Only about a fourth of Uganda’s population is online,
Youth in Pakistan work together on their computers and smartphones. Information from social media posts can provide data on young people’s attitudes on sensitive topics.
19POPULATION BULLETIN • VOL. 76, NO. 1 • 2022

and more than 250 radio channels serve as forums for public debate, opinion sharing, and audience participation.65 The UN Pulse Lab in Kampala developed a machine learning approach to collect public opinion information from talk radio programs to support the government’s development planning. A speech-recognition tool automatically converts limitless hours of audio programming in English, Luganda, and Acholi to text, which allows for keyword searches, data visualizations, and other forms of content analysis.66
Early pilot projects evaluated public perceptions on a variety of topics, such as the influx of refugees from South Sudan into Uganda, the quality of public health service delivery, and malaria eradication.67 In 2019, the UN Pulse Lab explored discussions regarding sexual and gender-based violence across the country and created a dashboard showing real-time perceptions about violence against women and girls.68 During the COVID-19 pandemic, the UN and World Health Organization have used the Pulse Lab’s machine learning program to analyze public health conversations on talk radio, building a dashboard to monitor and quantify misinformation on more than 100 radio stations across Africa.69 Part of the initiative’s focus is to track public attitudes toward COVID-19 vaccines and share this data with fact-checking organizations and public health agencies to strategically counter prominent threads of misinformation.70
Analysis of radio content poses both opportunities and challenges. Radio shows air firsthand experiences and attitudes of people, especially in rural areas, who are absent from digital media. But keyword searches of audio transcripts often fail to turn up relevant information, and automated transcripts can be inaccurate, particularly when transcribing multiple languages and informal speech.71 Ensuring privacy is also a challenge because complicated algorithms must be written to remove personal identifying information from radio call-in shows before the transcripts are used for research. Despite these challenges, big data scraped from talk radio shows offers policymakers an affordable way to gather public opinions and incorporate them into development planning.
A radio tower in Botswana. Pulse Lab’s machine learning program analyzed public health conversations on talk radio across Africa to generate data on public attitudes regarding the COVID-19 pandemic.
Researchers and program planners increasingly use data generated from online activity to identify trends in public opinion and design behavior-change interventions.
20POPULATION BULLETIN • VOL. 76, NO. 1 • 2022

While the prospects of using big data have generated excitement in research communities, a great deal of literature has also accumulated on the challenges and risks of venturing into this data frontier, particularly in low- and middle-income countries. The less frequent—and mostly experimental—use of big data in these countries to date can be attributed to limited resources and technical expertise, weak or nonexistent laws and regulations governing data use, the lack of data literacy around big data, and low demand for data for public good.72
LEGAL AND ETHICAL CONCERNS
The same pathways that enable data to be used to improve lives can also create openings for inappropriate and harmful data use.73 Data not stored securely can be vulnerable to unauthorized users or hackers who leak private information to others. Governments can mine big data to monitor many details of people’s lives—either to create useful and inclusive public services or control the population in authoritarian ways (for instance, censorship and arrests). Even barring the most extreme and dystopian possibilities, the use of big data raises many practical, legal, and ethical issues (see Box 2).
New privacy laws and regulations, such as the General Data Protection Regulation in the European Union, give users of online services greater control over the data collected about them by requiring companies to ask for their consent. But data subjects do not have much leeway if they want to use digital services, nor
do they have meaningful ways to weigh in on the kinds of analyses performed with their data.74 In low-and middle-income countries, national statistical offices could benefit greatly from accessing private data for public use. However, they generally do not yet have the integrated systems and governance frameworks in place for sharing and managing these data. Most countries are not far along in developing and enforcing legislation on data privacy.75
THE PITFALLS OF COMPUTER ALGORITHMS
While shortcomings of traditional data collection have been well documented, the potential flaws in computer algorithms written for machine learning are less well known.76 One drawback to machine learning models is they may be based on patterns observed in one place in time that are not valid when applied elsewhere or at another point in time.77 Any new models need to be tested and validated before being widely deployed. In addition, the algorithms may have biases built in because they are filtered through a researcher’s or programmer’s lens. In the worst cases, the technical flaws can cause harm. For example, in the United States, face recognition algorithms were found to yield false positives (incorrect matches) at least 10 times more often than false negatives (an actual match that is missed), and the errors were greatest among subjects who were not white.78 These kinds of flaws not only jeopardize the validity of research results; they also have raised serious alarms in policing contexts.
The Challenges and Risks of Using Big Data
21POPULATION BULLETIN • VOL. 76, NO. 1 • 2022

While informed consent is typically required to conduct research on individuals, this principle does not apply to gathering social media data, mobile phone records, or other private digital content. Users of digital devices and services may be unaware of the data they are generating daily and may unknowingly consent to their data being collected and used (by allowing cookies or not reading the terms and conditions of use, if there are any). In addition, although data are supposed to be anonymized before they are shared, some analysts know how to identify users’ fingerprints.1
This situation raises ethical considerations: The potential benefits of using data for public good must be weighed against the risks of breaching privacy, either accidentally or intentionally.2
Consent agreements must be in place regarding the ethical and approved uses of people’s personal data, and data must be stored in ways that keep them secure from breaches. Even when people give consent, policymakers must consider whether the use of their data is appropriate or could cause unintended harm.3 Humanitarian crises provide clear examples of the need to put speed before privacy—to save people’s lives. Outside of these kinds
1 Nina Cesare et al., “Promises and Pitfalls of Using Digital Traces for Demographic Research,” Demography 55, no. 5 (2018): 1979-99. 2 World Bank, World Development Report 2021: Data for Better Lives (Washington, DC: World Bank, 2021); and UN High Commissioner for Human
Rights, The Right to Privacy in the Digital Age (Geneva: Human Rights Council, 2018).3 Access et al., Necessary & Proportionate: International Principles on the Application of Human Rights to Communication Surveillance (2014). 4 Digital Impact Alliance (DIAL), Mobile Data for Development (MD4D) Handbook (Washington, DC: DIAL, 2021). 5 World Bank, World Development Report 2021.6 Rosemary Wyber et al., “Big Data in Global Health: Improving Health in Low- and Middle-Income Countries,” Bulletin of the World Health Organization
93, no. 3 (2015): 203-8; and UNFPA, “Virtual Expert Group Meeting on Access Versus Privacy: The Special Case of Population Data,” Zoom webinar, Oct. 6-8, 2020.
of emergencies, however, weighing the need for speed versus individual privacy becomes murkier. In high-income countries, legal and regulatory frameworks have become essential for defining appropriate uses of data and building trust among individual users, technology companies, and governments.4
In low- and middle-income countries, laws protecting the privacy and security of information services may not exist or not be enforced.5 Social media platforms, mobile network operators, and internet service providers may operate outside the reach of regulators and in possibly unscrupulous ways. Privacy concerns are even greater if vulnerable populations and communities, such as youth and ethnic minorities, have their personal information exposed without access to legal redress. Data on sensitive topics such as fertility, use of reproductive health services, sexual orientation and gender identity, sexually transmitted infections (including HIV), gender-based violence, other personal health history, and even a person’s location at a given time can be misused and result in discrimination or threats to personal safety. The anonymization of population and health data must be robust, monitored, and enforced.6
BOX 2
Big Data’s Confidentiality and Privacy Concerns
References
DATA LIMITATIONS
Big numbers can give an illusion of statistical significance, accuracy, and comprehensiveness, but the results of big data analyses must always be considered and interpreted with caution. First, even millions of social media posts do not necessarily represent, statistically speaking, the population being studied.79 Second, without ground-truth data—that is, data checked for accuracy in the real world—it is more
difficult to find flaws and assess biases, correct them, and validate the results of big data analytics. Third, big data is often incomplete: It may lack variables of interest to demographers and social scientists, such as age, sex, and educational levels. Fourth, correlations found in the data cannot necessarily be used to infer cause and effect, which policymakers rely on to decide what to invest in. There are no randomized, controlled studies—the scientific gold standard for research—with big data because it is repurposed after the fact.
22POPULATION BULLETIN • VOL. 76, NO. 1 • 2022

DIFFICULTIES ACCESSING COMMERCIAL DATA
Of the many challenges that are magnified in low- and middle-income countries, the first relates to data access. The entities that collect big data control it, and in most cases can decide who can use it, for what purposes, and at what cost. Some companies with useful information may not want to share their data because of concerns about competitiveness or disclosing information about their customers; other companies are developing their own commercial offerings for data analytics.80 Thus, the digital divide between wealthier and poorer nations and organizations can also manifest itself in research using big data.81 International foundations, universities, the UN, and other organizations are developing use agreements with data owners to overcome these barriers.
DISADVANTAGED POPULATIONS MISSING FROM THE DATA
Although more than half of the world’s population is now using the internet, the proportion varies widely among countries. A key drawback of relying on big data sources is that the characteristics and behaviors of people who do not use digital devices are missing from the data. In the world’s least-developed countries, the International Telecommunication Union estimates that only 28% of men and 15% of women were using the internet as of the end of 2019.82 In addition, in eight out of 73 countries with data on phone ownership, less than half of the population owned a mobile phone—and many people use mobile phones that belong to others, which complicates analyses of call records. Health and development professionals may be most interested in knowing about and reaching the people who do not use mobile devices at all.
LIMITED TECHNICAL CAPACITY
Lower-income countries have fewer trained data scientists than high-income countries, and many organizations in low- and middle-income countries have limited resources to dedicate to the necessary hardware, software, and compatible information systems needed to generate insights from big data. Experts from the high-income countries are leading research on the low- and middle-income countries—and transfer of skills is essential to build the capacity of researchers to collect and analyze big data. Government officials and other leaders may not be familiar with big data and its possible uses; they may not seek out such evidence, and when presented with it, they may be unfamiliar with how to interpret it.83 Decisionmakers’ potential lack of familiarity with big data—its advantages and constraints—makes it all the more important for researchers to develop the skills and expertise to not only collect and analyze the data but also communicate their findings effectively.
RESOURCE TRADE-OFFS
Resource trade-offs must be considered, as funds and personnel devoted to analyzing big data could otherwise be used to support other conventional research. Although big data analysis is considered cost-effective relative to the long process of collecting data through traditional household surveys, start-up requires developing technical capacity, and the data may not meet all information needs. In the rush to find technological solutions to complex problems, researchers and others may also become distracted by the novelty of the technology and lose sight of its limitations.84
23POPULATION BULLETIN • VOL. 76, NO. 1 • 2022

Conclusions and Future Prospects
Big data has opened a new world of problem-solving capabilities for researchers and decisionmakers, and it continues to evolve rapidly. Potential users of big data sources should be aware of both the possibilities and challenges involved, keeping in mind three key points. First, traditional censuses and surveys are not obsolete; rather, they are essential to verify the results of big data analyses. Second, big data must be collected and used ethically and responsibly, particularly regarding personal information. Third, new research capacities and communities must be built to turn masses of data into meaningful information. If used ethically and effectively, big data can help governments set priorities for using limited public resources and help both public and private agencies design better programs and services to improve lives.
TRADITIONAL DATA ARE STILL NECESSARY
Big data cannot replace traditional demographic data but can complement and enhance it in many ways. The most promising innovations reviewed in this report combine big and traditional data sources in such a way that the comparative advantages of one data source overcome the limitations of another. These combined analyses were effective in generating new population estimates in Afghanistan, identifying the best placement of new health facilities in Malawi, and identifying gaps in maternal health services in sub-Saharan Africa.
Therefore, funders and technical agencies should continue to provide support for censuses, surveys,
and improvements in vital records in countries facing severe resource constraints, as these sources provide ground-truth data—the reference points for big data analyses. Demographers and social scientists can contribute to big data initiatives by drawing on well-developed statistical tools and techniques for assessing data quality, for example, by evaluating big data analyses using traditional data as a reference.
DATA MUST BE COLLECTED AND USED ETHICALLY
UN agencies and other international organizations have highlighted the need for data owners to have consent agreements in place regarding the ethical and approved uses of people’s personal data, and that data are stored in ways that keep them secure from breaches. Data analysts and end users must consider whether data collectors have taken these steps. Even when consent has been obtained, analysts and end users must consider whether the use of the data is appropriate or could cause unintended harm.85
Where national laws and regulations do not exist or are still evolving, data projects can self-regulate. As guidance, the UN System has published principles on personal data security and privacy.86 UN Global Pulse (see appendix) has developed a two-phase “Risk, Harms and Benefits Assessment Tool,” a data privacy and protection assessment to “help identify and minimize the risks of harms and maximize the positive impacts of data innovation projects.”87
24POPULATION BULLETIN • VOL. 76, NO. 1 • 2022
BIG DATA CAPACITIES AND COMMUNITIES MUST BE BUILT
For professionals working in low- and middle-income countries and in fields where big data use is still relatively new—such as demography and global health—grappling with the sheer volume and variety of data may seem daunting. Beyond this report’s brief introduction, several major alliances and networks of organizations (see appendix) have developed analytical tools and documented wide-ranging uses of big data in many development fields.
For big data use to expand, researchers must develop the technical knowledge and skills to assess the data landscape and identify the appropriate data sources and methods to apply, including machine learning tools. Funders and
technical agencies should support researchers and organizations in host countries to build this capacity. Communities of technical experts, data analysts, communicators, and policymakers should work collaboratively to solve problems in new and innovative ways—to identify the data needed, apply the appropriate tools, and ensure that the results are communicated clearly and used.
Demographers and public health researchers and professionals have always relied on multiple data sources to analyze and report on key phenomena in their fields. Big data offers an opportunity to deepen the understanding of core questions while opening avenues to address new questions. But making use of big data ethically and systematically requires building new capacities, partnerships, and mindsets.
25POPULATION BULLETIN • VOL. 76, NO. 1 • 2022
International Projects Focused on Big Data for Public Good
DATA-POP ALLIANCEData-Pop Alliance is a collaborative laboratory using data and artificial intelligence to study global problems and transform systems. Its members include the Harvard Humanitarian Initiative, MIT Connection Science, Overseas Development Institute, and the Flowminder Foundation.
DIGITAL IMPACT ALLIANCE (DIAL)A partnership among the U.S. Agency for International Development, the Bill & Melinda Gates Foundation, the Swedish government, and the UN Foundation, DIAL works toward a more inclusive digital society in emerging markets in which all women, men, and children benefit from life-enhancing, mobile-based digital services.
GRID3Geo-Referenced Infrastructure and Demographic Data for Development, or GRID3, works with countries to generate, assess, and use geospatial data on population, settlements, and infrastructure. The Center for International Earth Science Information Network (CIESIN) of Columbia University, the UN Population Fund (UNFPA), WorldPop Project, and Flowminder are partners.
FLOWMINDER FOUNDATION Flowminder, based in Stockholm, collects, aggregates, integrates, and analyzes anonymous mobile phone data, satellite imagery, and household survey data to provide insights and find solutions to development problems.
UN BIGDATAThe UN Committee of Experts on Big Data and Data Science for Official Statistics investigates the benefits and challenges of using big data in national statistical offices.
UN GLOBAL PULSEUN Global Pulse, an initiative of the UN secretary general, seeks to advance the discovery, growth, and responsible use of “big data and artificial intelligence for sustainable development, humanitarian action, and peace.”
WORLDPOP PROJECT The WorldPop project at the University of Southampton, UK, provides an open-access archive of spatial demographic datasets for Central and South America, Africa, and Asia to support development and health applications.
APPENDIX
26POPULATION BULLETIN • VOL. 76, NO. 1 • 2022

1 SAS, “Big Data: What It Is and Why It Matters,” Oct. 31, 2019; and Daniel Fuller, Richard Buote, and Kevin Stanley, “A Glossary for Big Data in Population and Public Health: Discussion and Commentary on Terminology and Research Methods,” Journal of Epidemiology and Community Health 71, no. 11 (2017): 1113-17.
2 Emmanuel Letouzé, “Big Data and Development: An Overview,” Data-Pop Alliance White Paper Series (New York: Data-Pop Alliance, 2015).
3 Indicative, “What Is a Zettabyte?” Feb. 23, 2020; Letouzé, “Big Data and Development.”
4 Claudia Abreu Lopes and Savita Bailur, Gender Equality and Big Data: Making Gender Data Visible (New York: UN Women, 2018).
5 World Bank, World Development Report 2021: Data for Better Lives (Washington, DC: World Bank, 2021).
6 Letouzé, “Big Data and Development.”
7 United Nations (UN) Global Pulse, Big Data for Development: A Primer (New York: UN, 2013); Letouzé, “Big Data and Development”; Francesco C. Billari and Emilio Zagheni, “Big Data and Population Processes: A Revolution?” presentation delivered at the annual conference of the Italian Statistical Society, Florence, June 28-30, 2017; World Bank, World Development Report 2021; and Nina Cesare et al., “Promises and Pitfalls of Using Digital Traces for Demographic Research,” Demography 55, no. 5 (2018): 1979-99.
8 Digital Impact Alliance (DIAL) and Data-Pop Alliance, Mobile Data for Development (MD4D) Handbook (Washington, DC: DIAL, 2021); and Data2X, The Landscape of Big Data and Gender: A Data2X Update (Washington, DC: Data2X, 2021).
9 Joshua Evan Blumenstock, Gabriel Cadamuro, and Robert On, “Predicting Poverty and Wealth From Mobile Phone Metadata,” Science 350 no. 6264 (2015): 1073-76; Lichen Liang et al., “Using Mobile Phone Data Helps Estimate Community-Level Food Insecurity: Findings From a Multi-Year Panel Study in Nepal,” PLOS ONE 15, no. 11 (2020): 1-16; and Joshua Blumenstock, “Using Mobile Phone and Satellite Data to Target Emergency Cash Transfers,” Medium, Jan. 11, 2021.
10 Billari and Zagheni, “Big Data and Population Processes.”
11 Ben Y. Reis and John S. Brownstein, “Measuring the Impact of Health Policies Using Internet Search Patterns: The Case of Abortion,” BMC Public Health 10 (2010): 514.
12 Billari and Zagheni, “Big Data and Population Processes”; and Joshua Wilde, Wei Chen, and Sophie Lohmann, “COVID-19 and the Future of US Fertility: What Can We Learn From Google?” working paper for the Max Planck Institute for Demographic Research, October 2020.
13 Wilde, Chen, and Lohmann, “COVID-19 and the Future of US Fertility.”
14 Joyce A. Martin, Brady E. Hamilton, and Michelle J.K. Osterman, “Births in the United States 2020,” NCHS Data Brief no. 418 (2021).
15 Ridhi Kashyap et al., “Monitoring Global Digital Gender Inequality Using the Online Populations of Facebook and Google,” Demographic Research 43 (2020): 779-816; Francesco Rampazzo et al., “Mater Certa Est, Pater Numquam: What Can Facebook Advertising Data Tell Us About Male Fertility Rates?” working paper delivered at the Twelfth International Association for the Advancement of Artificial Intelligence Conference on Web and Social Media, April 2018; Diego Alburez-Gutierrez et al., “Demography in the Digital Era: New Data Sources for Population Research,” preprint released on SocArXiv, May 8, 2019; Billari and Zagheni, “Big Data and Population Processes”; and Monica Alexander, Kivan Polimis, and Emilio Zagheni, “The Impact of Hurricane Maria on Out-Migration From Puerto Rico: Evidence From Facebook Data,” Population and Development Review 45, no. 3 (2019): 617-30.
16 Data2X, The Landscape of Big Data and Gender.
17 Data2X, The Landscape of Big Data and Gender.
18 Fabio Celli and Micol Stock, Measuring the Unmeasured - SDG Tier III Indicators: A Pilot for the Government of Botswana, Final Report (New York: Data-Pop Alliance and United Nations Development Programme [UNDP], 2019).
19 Bo Huang, Comprehensive Geographic Information Systems (Amsterdam: Elsevier, 2018).
20 Thematic Research Network on Data and Statistics, Leaving No One Off the Map: A Guide for Gridded Population Data for Sustainable Development (Palisades, NY: POPGRID Data Collaborative, 2020).
21 Geo-Referenced Infrastructure and Demographic Data for Development (GRID3).
22 World Bank, World Development Report 2021.
23 UN Global Pulse, Big Data for Development.
24 Fuller, Buote, and Stanley, “A Glossary for Big Data in Population and Public Health.”
25 Stephane Helleringer et al., “Improving Age Measurement in Low- and Middle-Income Countries Through Computer Vision: A Test in Senegal,” Demographic Research 40 (2019): 219-60.
26 Fuller, Buote, and Stanley, “A Glossary for Big Data in Population and Public Health.”
27 Letouzé, “Big Data and Development.”
28 World Bank, World Development Report 2021.
29 Stephen J. Mooney and Vikas Pejaver, “Big Data in Public Health: Terminology, Machine Learning, and Privacy,” Annual Review of Public Health 39 (2018): 95-112.
30 Our World in Data, “Measuring Progress Towards the Sustainable Development Goals,” June 28, 2018; Data-Pop Alliance, “Measuring the Unmeasured: Innovative Approaches to Measuring SDG Tier 3 Indicators,” July 29, 2019.
31 Data-Pop Alliance, “Measuring the Unmeasured”; Data-Pop Alliance and UNDP, Measuring the Unmeasured; and UN Statistics Division, Tier Classification of the 2030 SDG Indicators as of 29 March 2021.
32 Blumenstock, Cadamuro, and On, “Predicting Poverty and Wealth from Mobile Phone Metadata”; DIAL, MD4D Handbook.
33 UN Global Pulse, Big Data for Development.
REFERENCES
27POPULATION BULLETIN • VOL. 76, NO. 1 • 2022

34 C. Edson Utazi et al., “High Resolution Age-Structured Mapping of Childhood Vaccination Coverage in Low and Middle Income Countries,” Vaccine 36, no. 12 (2018): 1583-91.
35 Ramiz Uddin, “Achieving the SDGs in a Time of COVID-19: Bangladesh Perspective,” presentation delivered at the 6th International Conference on Big Data for Official Statistics, 2020.
36 Ghana Statistical Service, “Mobility Analysis to Support the Government of Ghana in Responding to the COVID-19 Outbreak,” April 3, 2020.
37 UN Economic and Social Commission for Western Asia (ESCWA), Big Data for Good: Can Big Data Illustrate the Challenges Facing Syrian Refugees in Lebanon? (Beirut: UN, 2020); and Joao Palotti et al., “Monitoring of the Venezuelan Exodus Through Facebook’s Advertising Platform,” PLOS ONE 15, no. 2 (2020).
38 Robin Wilson et al., “Rapid and Near Real-Time Assessments of Population Displacement Using Mobile Phone Data Following Disasters: The 2015 Nepal Earthquake,” PLoS Currents 8 (2016).
39 Alex de Sherbinin, “Mapping & Modeling Migration and Displacement With ‘Big’ Data,” presentation delivered to the Columbia Population Research Center and Data Science Institute, April 22, 2021.
40 Rosemary Wyber et al., “Big Data in Global Health: Improving Health in Low- and Middle-Income Countries,” Bulletin of the World Health Organization 93, no. 3 (2015): 203-8.
41 Cesare et al., “Promises and Pitfalls of Using Digital Traces for Demographic Research.”
42 Wyber et al., “Big Data in Global Health.”
43 Macro-Eyes, “Module One: Forecast.”
44 U.S. Agency for International Development, “USAID Announces Intelligent Forecasting Grant Winner,” July 22, 2021.
45 Billari and Zagheni, “Big Data and Population Processes”; Cesare et al., “Promises and Pitfalls of Using Digital Traces for Demographic Research.”
46 Alburez-Gutierrez et al., “Demography in the Digital Era.”
47 Alexander Görlach, “Technology, AI and Ethics,” Conditio Humana.
48 WorldPop, “Mapping Afghanistan’s Population,” Feb. 24, 2019.
49 United Nations Population Fund (UNFPA), New Methodology: A Hybrid Census to Generate Spatially Disaggregated Population Estimates (New York: UNFPA, 2017): 2.
50 UNFPA, New Methodology: 4.
51 UNFPA, New Methodology: 4.
52 WorldPop, “Mapping Afghanistan’s Population.”
53 Bahadur Hellali, “Hybrid Census to Generate Spatially-Disaggregated Population Estimates,” UNStats World Data Forum, Oct. 8, 2018.
54 UNFPA, New Methodology: 6.
55 DIAL and Data-Pop Alliance, MD4D Handbook: 36.
56 DIAL, Cooper/Smith, and Infosys, Using Mobile Phone Data to Make Policy Decisions (Washington, DC: DIAL, Cooper/Smith, and Infosys, 2019): 5.
57 DIAL, Cooper/Smith, and Infosys, Using Mobile Phone Data to Make Policy Decisions: 6.
58 DIAL, Cooper/Smith, and Infosys, Using Mobile Phone Data to Make Policy Decisions: 6.
59 DIAL, Cooper/Smith, and Infosys, Using Mobile Phone Data to Make Policy Decisions: 33.
60 A. S. Wigley et al., “Measuring the Availability and Geographical Accessibility of Maternal Health Services Across Sub-Saharan Africa,” BMC Medicine 18, no. 1 (2020): 237.
61 Wigley et al., “Measuring the Availability and Geographical Accessibility of Maternal Health Services Across Sub-Saharan Africa.”
62 Quilt.AI, “Young People’s Attitudes Towards Family Planning in North India,” Sept. 18, 2020.
63 Quilt.AI, “Young People’s Attitudes Towards Family Planning in North India.”
64 Quilt.AI, “Talking to Young Men About Sexual and Reproductive Health & Rights,” June 11, 2020.
65 Simon Kemp, “Digital 2021: Uganda,” DataReportal, Feb. 12, 2021; and Pulse Lab Kampala, “Making Ugandan Community Radio Machine-Readable Using Speech Recognition Technology,” UN Pulse Lab, 2016.
66 Pulse Lab Kampala, “Making Ugandan Community Radio Machine-Readable Using Speech Recognition Technology.”
67 Pulse Lab Kampala, “Using Machine Learning to Analyse Radio Content in Uganda,” Sept. 11, 2017.
68 Pulse Lab Kampala, “Ending Violence Against Women and Girls in Uganda,” UN Pulse Lab, 2019.
69 World Health Organization, “WHO and UN Global Pulse Are Building a Social Listening Radio Tool to Aid the COVID-19 Infodemic Response,” May 4, 2021.
70 World Health Organization, “WHO and UN Global Pulse Are Building a Social Listening Radio Tool to Aid the COVID-19 Infodemic Response.”
71 Pulse Lab Kampala, “Making Ugandan Community Radio Machine-Readable Using Speech Recognition Technology.”
72 World Bank, World Development Report 2021: 53; DIAL and Data-Pop Alliance, MD4D Handbook.
73 World Bank, World Development Report 2021.
74 Yvette Yanez and Emmanuel Letouzé, “The CODE for Building Participatory and Ethical Data Projects,” The Data Values Project, Aug. 3, 2021.
75 World Bank, World Development Report 2021.
76 Cesare et al., “Promises and Pitfalls of Using Digital Traces for Demographic Research.”
77 World Bank, World Development Report 2021; and UN High Commissioner for Human Rights, The Right to Privacy in the Digital Age (Geneva: Human Rights Council, 2018).
78 Access et al., Necessary & Proportionate: International Principles on the Application of Human Rights to Communication Surveillance (2014).
79 DIAL and Data-Pop Alliance, MD4D Handbook.
80 Emmanuel Letouzé and Nuria Oliver, Sharing Is Caring: Four Key Requirements for Sustainable Private Data Sharing and Use for Public Good (New York: Data-Pop Alliance, 2019).
81 UN Global Pulse, Big Data for Development; and DIAL and Data-Pop Alliance, MD4D Handbook.
28POPULATION BULLETIN • VOL. 76, NO. 1 • 2022
82 International Telecommunication Union (ITU), “Statistics,” Feb. 7, 2021; and ITU, “Measuring Digital Development: Facts and Figures 2020,” Nov. 30, 2020.
83 World Bank, World Development Report 2021.
84 Joshua Blumenstock, “Don’t Forget People in the Use of Big Data for Development,” Nature 561, no. 7722 (2018): 170-72.
85 Emmanuel Letouzé and Nuria Oliver, Sharing Is Caring; and UN High Commissioner for Human Rights, The Right to Privacy in the Digital Age.
86 UN System Chief Executives Board for Coordination, “Personal Data Protection and Privacy,” Feb. 11, 2019.
87 UN Global Pulse, “Risks, Harms and Benefits Assessment,” March 24, 2017.
29POPULATION BULLETIN • VOL. 76, NO. 1 • 2022

VISIT WWW.PRB.ORG TO FIND: FOCUS AREAS. Explore policy-relevant areas where PRB applies much of its data, research, analysis, and communications expertise.
RESOURCES. Access videos with leading experts, multimedia presentations to draw stakeholders into critical development conversations, analytical Population Bulletins, the Population Handbook on demography basics, policy training tools, and visual products like interactive infographics.
DATA. Delve into indicators for the United States and around the world, and view data in map, tabular, or trend graph formats.
WORK WITH PRB. Explore ways to partner with us, apply to one of our fellowships, and join our membership program. Donate to PRB, and learn about careers with us.
MONTHLY NEWSLETTER. Sign up to receive email announcements about new web content and PRB-sponsored seminars and briefings.
BECOME A PRB MEMBER
PRB’s work is made possible, in part, through the support of our members. As a PRB member, you’ll receive all of PRB’s signature publications, including the annual World Population Data Sheet, at no charge. You’ll also be helping us achieve our mission of promoting and supporting evidence-based policies, practices, and decision-making to improve the health and well-being of people throughout the world. To join, visit PRB.org.
INDIVIDUAL $65 LIBRARY $90 CORPORATION $350 LIFETIME MEMBERSHIP $6,000
GEOFFREY D. DABELKO, CHAIRProfessor and Associate Dean, George V. Voinovich School of Leadership and Public Affairs, Ohio University, Athens, Ohio; and Senior Advisor, Environmental Change and Security Program, Woodrow Wilson International Center for Scholars, Washington, D.C.
JENNIFER MADANS, VICE CHAIRFormer Associate Director, Centers for Disease Control and Prevention, National Center for Health Statistics
NIHAL W. GOONEWARDENE, SECRETARY AND TREASURERFormer President and Chief Executive Officer, International Science and Technology Institute, Inc.
JEFFREY JORDAN, PRESIDENT AND CHIEF EXECUTIVE OFFICERPresident and CEO, PRB, Washington, D.C.
ISABELLA ABODERINChair, Africa Research and Partnerships; and Director, Professor of Gerontology School for Policy Studies, University of Bristol Perivoli Africa Research Centre (United Kingdom)
ALAKA BASUProfessor, Department of Global Development, Cornell University, Ithaca, N.Y.; and Senior Fellow, Reproductive Health, United Nations Foundation
ROBERT CROSNOEAssociate Dean of Liberal Arts and Rapoport Centennial Professor of Sociology, College of Liberal Arts, Department of Sociology, University of Texas at Austin
EDWARD “SANDY” DAVIS Former Senior Advisor, Bipartisan Policy Center, Washington, D.C.
TOM DILLONVice President, Environment, The Pew Charitable Trusts, Washington, D.C.
DAVID FINNDirector, Corporate Development, Google Fiber, Seattle, Wash.
PATRICIA FOXENDeputy Director of Research, UnidosUS
AMANDA GLASSMANExecutive Vice President and Senior Fellow, Center for Global Development, Washington, D.C.; CEO of Center for Global Development Europe
JAMIE HERRING Founder and President, Habitat Seven, Ottawa, Ontario, Canada
THOMAS LEGRAND Former Professor, Départément of Démographie, Montréal, Québec, Canada; and President, International Union for the Scientific Study of Population
LISA PALMEREditorial Director and Project Lead, Planet Forward, The George Washington University, Washington, D.C.
JENNIFER DABBS SCUIBBAStanley J. Buckman Professor, Department of International Studies, Rhodes College
KYLER SHERMAN-WILKINSAssistant Professor of Sociology, Department of Sociology and Anthropology, Missouri State University
RICHARD WOODSFormer Senior Vice President, Corporate Affairs, Capital One, New York, N.Y.
PRB BOARD OF TRUSTEES
PRB MEMBERSHIP
PRB is 501 (c)(3) not-for-profit organization awarded four stars by Charity Navigator.
Informing a Smarter World
Demystifying Big Datafor Demography and Global Health
��������������������������������������������������������������������� �������������������������������������������������������������������������������������������������������������������������������������������������������������������������� ���������������������������� ������������������ ������������������������������������������������������������������������������������������������������������������������������������������������ ��������������������������������������� ��������������������������������������������
��������������������������������������������������������������������������������������������������� ��������������������������������������������� ����������������������������������������� ������������������������������������������������������������������������������������������������������������������������������� ����������������������������������������������������������������������������
1875 Connecticut Ave., NW, Suite 520 Washington, D.C. 20009 USA 800-877-9881 prb.org | @PRBdata