Debating the greening vs. browning of the North American boreal forest: differences between...
11
Debating the greening vs. browning of the North American boreal forest: differences between satellite datasets DOMINGO ALCARAZ-SEGURA *w z, EMILIO CHUVIECO§, HOWARD E. EPSTEIN *, ERIC S. KASISCHKE } andALEXANDERTRISHCHENKO k *Environmental Sciences Department, University of Virginia. 291 McCormick Road, Charlottesville, VA 22904, USA, wLaboratorio de Ana ´lisis Regional y Teledeteccio ´n – IFEVA, Universidad de Buenos Aires and CONICET. Av. San Martı ´n, 4453, Buenos Aires 1417, Argentina, zDepartamento de Biologı ´a Vegetal y Ecologı ´a, Universidad de Almerı ´a. Ctra. Sacramento s/n, La Can ˜ada de San Urbano, Almerı ´a 04120, Spain, §Departamento de Geografı ´a, Universidad de Alcala ´. Colegios 2, Alcala ´ de Henares, Madrid 28801, Spain, }Department of Geography, University of Maryland, College Park, MD 20742, USA, kCanada Centre for Remote Sensing, Natural Resources Canada. 588 Booth Str., Ottawa, ON, Canada K1A 0Y7 Abstract A number of remote sensing studies have evaluated the temporal trends of the normal- ized difference vegetation index (NDVI or vegetation greenness) in the North American boreal forest during the last two decades, often getting quite different results. To examine the effect that the use of different datasets might be having on the estimated trends, we compared the temporal trends of recently burned and unburned sites of boreal forest in central Canada calculated from two datasets: the Global Inventory, Monitoring, and Modeling Studies (GIMMS), which is the most commonly used 8 km dataset, and a new 1 km dataset developed by the Canadian Centre for Remote Sensing (CCRS). We compared the NDVI trends of both datasets along a fire severity gradient in order to evaluate the variance in regeneration rates. Temporal trends were calculated using the seasonal Mann–Kendall trend test, a rank-based, nonparametric test, which is robust against seasonality, nonnormality, heteroscedasticity, missing values, and serial depen- dence. The results showed contrasting NDVI trends between the CCRS and the GIMMS datasets. The CCRS dataset showed NDVI increases in all recently burned sites and in 50% of the unburned sites. Surprisingly, the GIMMS dataset did not capture the NDVI recovery in most burned sites and even showed NDVI declines in some burned sites one decade after fire. Between 50% and 75% of GIMMS pixels showed NDVI decreases in the unburned forest compared with o1% of CCRS pixels. Being the most broadly used dataset for monitoring ecosystem and carbon balance changes, the bias towards negative trends in the GIMMS dataset in the North American boreal forest has broad implications for the evaluation of vegetation and carbon dynamics in this region and globally. Keywords: AVHRR, boreal forest, burned areas, Canada, forest fires, GIMMS, NDVI trends, seasonal Mann-Kendall trend test Received 7 February 2009 and accepted 27 March 2009 Introduction The boreal forest of the northern hemisphere stores approximately 40% of the total carbon in terrestrial ecosystems, containing essentially as much carbon as the tropical rainforests (Gorham, 1991; Kasischke, 2000; Vasander & Kettunen, 2006). Being such a large reser- voir of terrestrial carbon, it is important to know if the boreal carbon balance is changing and, if so, in what ways. This is not only important as an input to the global carbon budget (Houghton, 2007), but also to provide individual countries with estimates of CO 2 uptake and emissions to assess their national budgets in meeting national and international targets (e.g. the Correspondence: Domingo Alcaraz-Segura, Environmental Sciences Department, University of Virginia. 291 McCormick Road, Charlottesville, VA 22904, USA, tel. 1 34 950 015 932, fax 1 34 950 015 069, e-mail: [email protected] Global Change Biology (2010) 16, 760–770, doi: 10.1111/j.1365-2486.2009.01956.x 760 r 2009 Crown in the right of Canada
Transcript of Debating the greening vs. browning of the North American boreal forest: differences between...

Debating the greening vs. browning of the NorthAmerican boreal forest: differences between satellitedatasets
D O M I N G O A L C A R A Z - S E G U R A *w z, E M I L I O C H U V I E C O § , H O WA R D E . E P S T E I N *,
E R I C S . K A S I S C H K E } and A L E X A N D E R T R I S H C H E N K O k*Environmental Sciences Department, University of Virginia. 291 McCormick Road, Charlottesville, VA 22904, USA, wLaboratorio
de Analisis Regional y Teledeteccion – IFEVA, Universidad de Buenos Aires and CONICET. Av. San Martın, 4453, Buenos Aires
1417, Argentina, zDepartamento de Biologıa Vegetal y Ecologıa, Universidad de Almerıa. Ctra. Sacramento s/n, La Canada de San
Urbano, Almerıa 04120, Spain, §Departamento de Geografıa, Universidad de Alcala. Colegios 2, Alcala de Henares, Madrid 28801,
Spain, }Department of Geography, University of Maryland, College Park, MD 20742, USA, kCanada Centre for Remote Sensing,
Natural Resources Canada. 588 Booth Str., Ottawa, ON, Canada K1A 0Y7
Abstract
A number of remote sensing studies have evaluated the temporal trends of the normal-
ized difference vegetation index (NDVI or vegetation greenness) in the North American
boreal forest during the last two decades, often getting quite different results. To examine
the effect that the use of different datasets might be having on the estimated trends, we
compared the temporal trends of recently burned and unburned sites of boreal forest in
central Canada calculated from two datasets: the Global Inventory, Monitoring, and
Modeling Studies (GIMMS), which is the most commonly used 8 km dataset, and a new
1 km dataset developed by the Canadian Centre for Remote Sensing (CCRS). We
compared the NDVI trends of both datasets along a fire severity gradient in order to
evaluate the variance in regeneration rates. Temporal trends were calculated using the
seasonal Mann–Kendall trend test, a rank-based, nonparametric test, which is robust
against seasonality, nonnormality, heteroscedasticity, missing values, and serial depen-
dence. The results showed contrasting NDVI trends between the CCRS and the GIMMS
datasets. The CCRS dataset showed NDVI increases in all recently burned sites and in
50% of the unburned sites. Surprisingly, the GIMMS dataset did not capture the NDVI
recovery in most burned sites and even showed NDVI declines in some burned sites one
decade after fire. Between 50% and 75% of GIMMS pixels showed NDVI decreases in the
unburned forest compared with o1% of CCRS pixels. Being the most broadly used
dataset for monitoring ecosystem and carbon balance changes, the bias towards negative
trends in the GIMMS dataset in the North American boreal forest has broad implications
for the evaluation of vegetation and carbon dynamics in this region and globally.
Keywords: AVHRR, boreal forest, burned areas, Canada, forest fires, GIMMS, NDVI trends, seasonal
Mann-Kendall trend test
Received 7 February 2009 and accepted 27 March 2009
Introduction
The boreal forest of the northern hemisphere stores
approximately 40% of the total carbon in terrestrial
ecosystems, containing essentially as much carbon as
the tropical rainforests (Gorham, 1991; Kasischke, 2000;
Vasander & Kettunen, 2006). Being such a large reser-
voir of terrestrial carbon, it is important to know if the
boreal carbon balance is changing and, if so, in what
ways. This is not only important as an input to the
global carbon budget (Houghton, 2007), but also to
provide individual countries with estimates of CO2
uptake and emissions to assess their national budgets
in meeting national and international targets (e.g. the
Correspondence: Domingo Alcaraz-Segura, Environmental
Sciences Department, University of Virginia. 291 McCormick
Road, Charlottesville, VA 22904, USA, tel. 1 34 950 015 932,
fax 1 34 950 015 069, e-mail: [email protected]
Global Change Biology (2010) 16, 760–770, doi: 10.1111/j.1365-2486.2009.01956.x
760 r 2009 Crown in the right of Canada

1997 United Nations Framework Convention on Cli-
mate Change).
One important component of the carbon budget is the
carbon sequestered in vegetation. Regional assessments
of this value using field data alone are difficult, but
significant improvements can be achieved through
combining inventory data with remotely sensed obser-
vations (Kurz & Apps, 2006). Among the different
spectral indices derived from satellite data, the normal-
ized difference vegetation index (NDVI) has been the
most widely used to assess spatial patterns and inter-
annual trends of variables related to the carbon storage
in aboveground vegetation, such as leaf area index,
biomass, and productivity (e.g. Tucker & Sellers, 1986;
Prince & Goward, 1996; Randerson et al., 1997; Goetz
et al., 2005). Satellite datasets derived from the global
area coverage (GAC) of the advanced very high resolu-
tion radiometer (AVHRR) began to be collected in the
1980s and have been widely used in global and regional
assessments of temporal trends of NDVI (or vegetation
greenness) and net primary production (e.g. Myneni
et al., 1997; Nemani et al., 2003).
Recent warming trends in many regions has led
to numerous assessments of the NDVI over time,
particularly in the High Northern Latitudes. In many
regions, consistent trends in the NDVI have been
reported regardless of the dataset being analyzed;
for example, NDVI increases (‘greening’) in the arctic
tundra (Myneni et al., 1997; Jia et al., 2003; Goetz et al.,
2005), or NDVI decreases (‘browning’) in the Chilean
semiarid zones (Baldi et al., 2008). However, in
other regions, the use of different datasets has led to
conflicting findings, potentially due to differences in the
processing and corrections applied to the satellite data
(e.g. McCloy et al., 2005; Hall et al., 2006; Baldi et al.,
2008).
One region where conflicting interannual trends in
vegetation greenness may have important implications
for assessments of the global carbon budget is the boreal
forest of central Canada (Fig. 1). Three main issues seem
to explain the observed trends derived from satellite
data: climate changes, vegetation recovery in recently
disturbed areas, and the use of different satellite data
sources to retrieve the trends. Climate warming has
been consistently associated with an increase in vegeta-
tion greenness (‘greening’) during the 1980s throughout
central Canada (Myneni et al., 1997; Tucker et al., 2001;
Slayback et al., 2003), despite the fact that forest extent
remained basically stable (Masek, 2001). When the data
record was extended to the 1990s and early 2000s, other
studies showed how the persistent warming might
have caused a negative trend in NDVI (‘browning’)
across this region (Myneni et al., 2001; Dong et al.,
2003), which may be caused by warmer but not wetter
climate, thus increasing drought stress associated with
greater evapotranspiration rates. This effect might have
Fig. 1 The solid line embraces our study area in central Canada. The dotted line is an approximate reproduction of the line in Fig. 4 of
the GIMMS user guide (Pinzon et al., 2007) that separates the boreal region (more affected by the satellite drift) from the northernmost
tundra region (less affected). The growing season mean NDVI of the 1984–2006 period of the GIMMS dataset is shown in gray scale.
GIMMS, Global Inventory, Monitoring, and Modeling Studies; NDVI, normalized difference vegetation index.
G R E E N I N G V S . B R O W N I N G O F T H E B O R E A L F O R E S T 761
r 2009 Crown in the right of Canada, Global Change Biology, 16, 760–770

become a major constraint for vegetation growth since
the early 1990s (Angert et al., 2005), which agreed with
model projections (Zhang et al., 2007). In contrast, other
remote sensing studies have shown a persistent green-
ing throughout the 1980s and 1990s in central Canada
(Zhou et al., 2001; Nemani et al., 2003; Reed, 2006;
Kimball et al., 2007). Nevertheless, none of these prior
studies accounted for a potentially significant source of
browning and greening in boreal forests, the biomass
reduction in areas disturbed by fire and its subsequent
regeneration (Hicke et al., 2003; Neigh et al., 2008). Even
if burned areas were excluded from the analysis, the
finding of declining NDVI in areas with dense tree
cover (Bunn et al., 2005; Bunn & Goetz, 2006) supported
the hypothesis that drought stress reduced the photo-
synthetic activity of the Canadian boreal forest during
the warmer 1990s (Goetz et al., 2005, 2007). In addition
to the effects of climate change and postfire regenera-
tion, a third issue may be involved in explaining the
trends of vegetation greenness found in different re-
mote sensing studies, i.e. the source and processing
streams of the different AVHRR datasets used (Zhou
et al., 2003; Simoniello et al., 2004; Stow et al., 2007). In
some cases, opposite trends can even be found; for
instance, a greening trend was observed in the boreal
forest of Alaska when using the Pathfinder AVHRR
Land (PAL) dataset (from 1982 to 2000) (Kimball et al.,
2007), while the Global Inventory, Monitoring, and
Modeling Studies (GIMMS) dataset showed a browning
trend (from 1982 to 2003) (Verbyla, 2008). Presently, only
the study by Olthof & Latifovic (2007) has evaluated the
NDVI trends in this region based on data not derived
from AVHRR-GAC data; these authors found that the
SPOT VEGETATION 1 km2 NDVI responded positively to
warming from 1998 to 2004 in both dry and humid
areas of Canada.
Despite the fact that many field observational studies
have independently evaluated the long-term response
of the boreal forest to warming without the use of
satellite data, it appears that no conclusive evidence
has been found (known as the ‘divergence problem’)
(D’Arrigo et al., 2008). Tree-ring widths and wood-
density records show both negative (Barber et al.,
2000) and positive relationships with temperature
(D’Arrigo et al., 2008). Ecosystem flux studies based
on eddy covariance methods also do not provide a
consistent answer. For instance, a 1995–2004 CO2 flux
record from a black spruce forest tower in Manitoba did
not show any clear correlation between warming and
either carbon uptake or release (Rocha et al., 2006; Dunn
et al., 2007). Bergeron et al. (2007), however, showed
that, across several sites in Canada, annual gross eco-
system production was positively related to mean an-
nual air temperatures and an earlier start of the growing
season (with greater dependence on spring rather than
summer temperatures).
Despite the important effects that climate may have
on temporal variability of the carbon balance in the
boreal forest that can be analyzed through variations in
satellite-observed NDVI, fire may be a more significant
driver of both carbon cycling (Kasischke et al., 1995;
Harden et al., 2000; Bond-Lamberty et al., 2007) and
trends in NDVI. In North America, recovery times to
preburn levels for NDVI have been estimated to be
around 6 (Goetz et al., 2007) to 9 (Hicke et al., 2003) years
depending on fire severity, though, in general, the high
NPP levels that occur in mature stands take much
longer to recover. A complicating factor in analyzing
postfire recovery using NDVI data is the fact that this
may vary as a function of variations in fire severity. For
example, in mature stands of black spruce boreal forest
of North America, research shows that the depth of
burning of the surface organic layer is a significant
cause of regeneration differences (Johnstone & Ka-
sischke, 2005; Johnstone & Chapin, 2006). In less severe
fires, where typically 10–20 cm of organic matter re-
mains unburned, postfire regrowth consists primarily
of shrubs that reproduce vegetatively and spruce seed-
lings. In severe fires, where 3–8 cm of organic matter
remains, there exists invasion of deciduous species,
primarily quaking aspen (Populus tremuloides Michx.).
In the severest fires, where o3 cm of organic matter
remains, regeneration typically consists of a significant
regrowth of quaking aspen. As a consequence of these
regeneration differences, rates of postfire NPP increase
from sites experiencing the least severe burns to sites
with the severest burns (Johnstone & Kasischke, 2005;
Johnstone & Chapin, 2006).
The goal of this study was to investigate whether
different satellite-based NDVI datasets produced
significant differences in observed trends in vegetation
greenness over the past two decades. For this,
we compared the temporal trends of burned and
unburned areas of boreal forest in central Canada
calculated from two datasets: the GIMMS dataset,
which is the most commonly used 8 km dataset, and a
new 1 km dataset developed by the Canadian Centre for
Remote Sensing (CCRS) (Latifovic et al., 2005). We
compared the NDVI trends between datasets along a
fire severity gradient in order to account for the var-
iance in regeneration rates.
Methods
Satellite datasets
To compare the NDVI trends of burned and unburned
sites of the North American boreal forest, we used two
762 D . A L C A R A Z - S E G U R A et al.
r 2009 Crown in the right of Canada, Global Change Biology, 16, 760–770

NDVI datasets derived from the AVHRR, on board the
satellite series of the National Oceanic and Atmospheric
Administration (NOAA), that are available for central
Canada over the growing season months (May–Septem-
ber) from 1984 to 2006.
The first dataset was obtained from the GIMMS team.
The GIMMS dataset is the most commonly used dataset
to model and evaluate vegetation patterns and trends
around the world. It has a spatial resolution of 64 km2,
and contains two composite images per month. It
has been corrected for sensor degradation, intersensor
differences, cloud cover, solar zenith angle, and viewing
angle effects due to satellite drift (using the empirical
mode decomposition function; (Pinzon et al., 2004),
volcanic aerosols, and other effects not related to
vegetation change (it is not corrected for water vapor,
ozone, and scattering due to tropospheric aerosols) (for
details see Tucker et al., 2005). GIMMS is currently
thought to be to be consistent with NDVI derived from
SPOT VEGETATION and Terra MODIS satellite data (Tucker
et al., 2005). Our second dataset was acquired from the
CCRS. The CCRS dataset has a spatial resolution of
1 km2 and contains one composite image based on a
minimum cloud index algorithm every 10 days (Khlo-
penkov & Trishchenko, 2007). It has been corrected for
sensor degradation using the NOAA-recommended
post launch calibration, cloud cover and shadow con-
tamination, as well as atmospheric corrections for water
vapor, ozone, and aerosols (using constant aerosol
optical depth) (for details see Latifovic et al., 2005). To
correct for intersensor differences in spectral response
function, we applied the absolute calibration coeffi-
cients at the top of the atmosphere available in Trish-
chenko et al. (2002) and Trishchenko (2009) to the raw
NDVI data. Then, using the quality flags, we first
discarded NDVI values with low quality (probability
of presence of clouds, water, snow, or ice 430%). We
finally discarded all pixels where 420% of dates
did not pass the former quality threshold (i.e. pixels
with 420% of dates with probability of low NDVI
quality 430%).
Sampling of burned and unburned sites
We identified burned pixels for every year of the 1984–
2006 period by applying the algorithm of Chuvieco et al.
(2008) on the CCRS dataset. The algorithm relies on
temporal comparisons of several spectral indices, as
well as near infrared reflectance. It emphasizes the
stability of the postfire signal to avoid false detections
associated with clouds, cloud shadows, missed data,
and radiometric calibration or geolocation errors be-
tween AVHRR sensors.
Most approaches that use satellite remote sensing
data to estimate burn severity rely on shortwave infra-
red (SWIR) bands that are not available with the
AVHRR sensor. Even with SWIR bands, there is no
consistent approach for satellite mapping of fire
severity in boreal forests (French et al., 2008). We used
a logic-based approach to divide AVHRR burned
pixels into three severity categories. Our approach
was predicated on observations that the dominant
forest cover in our study region was black spruce
forest. In this forest type, a key fire severity character-
istic is the depth of burning of the surface organic
layer (Kasischke et al., 2008). Two of the factors that
control depth of burning in black spruce forests include
seasonal and interannual variations in climate (Amiro
et al., 2001), and seasonal active layer thawing, where
deeper fires occur later in the growing season due to
greater thaw depths of soils (Kasischke & Johnstone,
2005).
Based on these factors, three categories of potential
severity were used for fires during the 1984–1995 period
depending on when the fire took place: low severity
(before July 21st in years of few, small fires), medium
severity (before July 21st in years of many, large fires),
and high severity (after July 21st any year). Unburned
pixels were selected within an area located from 10 to
30 km to the 1984–1995 burned pixels, as well as avoid-
ing any burned pixels in the 1996–2006 period, water
bodies, or nonforest land-covers (from Palko et al., 1995).
For each fire severity class we selected all GIMMS
64 km2 pixels that were dominated by CCRS 1 km2
burned pixels of that class (470% of that class and
o10% of any other single severity class or land-cover).
Surrounding these GIMMS burned pixels, we selected
the corresponding GIMMS unburned pixels (only those
with 100% of CCRS pixels of the same unburned class).
Finally, to allow a direct comparison of the trends in
the sampled pixels between the two datasets, we dis-
carded all CCRS pixels (both burned and unburned) not
contained within the GIMMS selected pixels. To reduce
the sample size of CCRS pixels, we selected 16 CCRS
random pixels completely included within each
GIMMS selected pixel. The number of pixels for each
class is summarized in Table 1.
Temporal trend analysis
Temporal NDVI trends in both datasets between 1996
and 2006 were calculated for sites burned between 1984
and 1995. In the unburned sites, trends were also
calculated for the 1996–2006 period to allow for direct
comparison with the burned sites and to avoid the
influence of possible pre-1984 fires [we assumed that
if any pixel was burned before 1984, a 12-year gap is
G R E E N I N G V S . B R O W N I N G O F T H E B O R E A L F O R E S T 763
r 2009 Crown in the right of Canada, Global Change Biology, 16, 760–770
long enough for the NDVI to recover, compared with
the 6-year NDVI recovery time observed by Goetz et al.
(2006) and the 9-year recovery time from Hicke et al.
(2003)].
NDVI time-series often do not meet parametric as-
sumptions such as normality and homoscedasticity. To
account for this, temporal trends were calculated as
suggested by de Beurs & Henebry (2005) using the
seasonal Mann–Kendall trend test, a rank-based non-
parametric test robust against seasonality, nonnormality,
heterocedasticity, missing values, and both intra- and
interannual autocorrelation (Hirsch et al., 1982; Hirsch
& Slack, 1984; Van Belle & Hughes, 1984). Checking for
trends using the full temporal resolution of the NDVI
seasonal dynamics, instead of using just the growing
season average or maximum, not only avoids the loss of
temporal information, but also makes more biological
sense, since the relationship between NDVI and tree
growth is more likely to be correlated at finer temporal
scales (e.g. monthly) (Kaufmann et al., 2004). The sea-
sonal Mann–Kendall test calculates the existence of a
monotonic trend within each intra-annual time-step (i.e.
composite period) based on Kendall’s tau statistic, by
summing the number of times a particular time-step
within a year has a higher or lower NDVI value than
any previous year. Then it performs a heterogeneity test
to see if this slope is consistent across all seasons
(composite images). The test was run using the envir-
onmental statistics module (Millard, 2001) in S-PLUS
(Insightful Corporation, 2007). For each pixel the result-
ing overall Sen’s slope (Hirsch et al., 1982) and P-value
were stored. Significant results were assumed for
P-values lower than 0.05.
Resampling and analysis of variance (ANOVA)
Due to the fact that the numbers of pixels identified
were very different across classes and datasets (Table 1),
before conducting any statistical comparisons, we
needed to find comparable sample sizes. We deter-
mined the minimum sample size necessary to capture
the variance in the data for each class and dataset. For
this, we calculated the increase in the cumulative var-
iance when a new random pixel was included in the
sample. We stopped when the increase in variance was
o5%. A bootstrap of 100 000 runs was necessary to get
normal distribution sample sizes. The final (or boot-
strapped) sample size of each class corresponded to the
Table 1 Sample sizes for burned and unburned pixels of
boreal forest across the fire severity gradient
GIMMS CCRS
GIMMS
bootstrap
CCRS
bootstrap
Low severity
Burned 28 448 21 23
Unburned 162 2592 19 19
Medium severity
Burned 137 2176 26 23
Unburned 550 9968 18 23
High severity
Burned 118 1856 27 24
Unburned 465 10 288 17 23
The ‘bootstrap’ columns show the samples (of comparable
sizes among classes and datasets) that were used to check for
significant differences in a bootstrapped ANOVA (see ‘Methods’
section for details).
GIMMS, Global Inventory, Monitoring, and Modeling Studies;
CCRS, Canadian Centre for Remote Sensing.
(a)
(b)
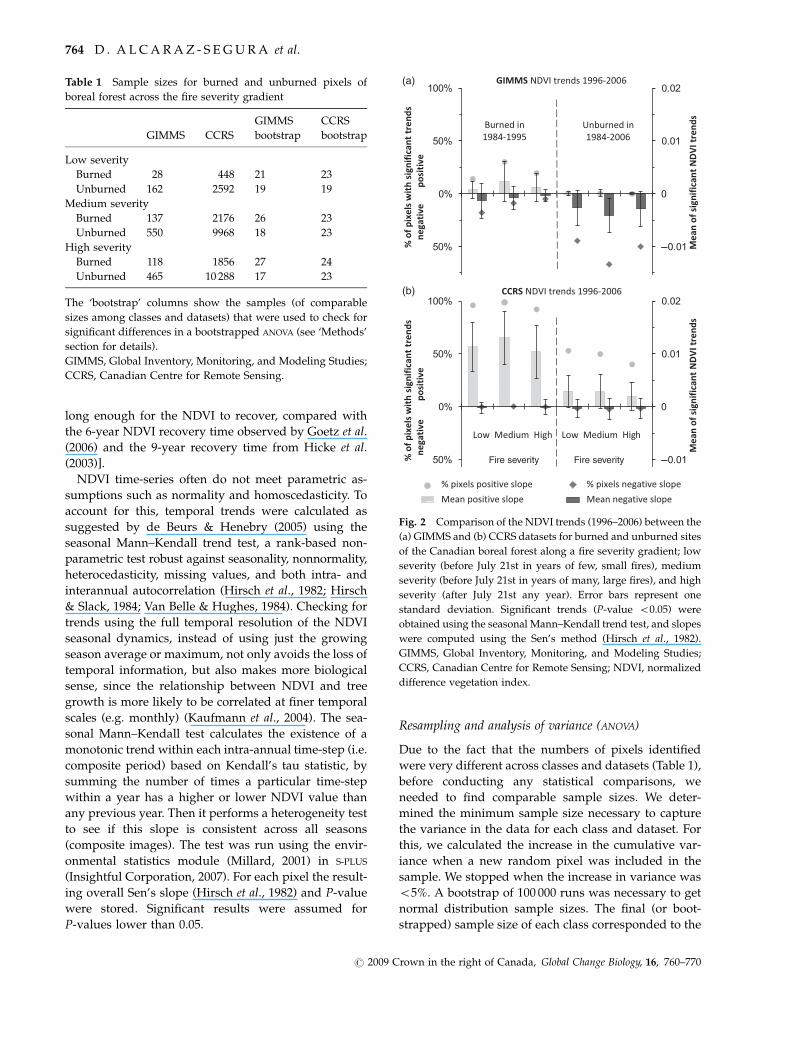
Fig. 2 Comparison of the NDVI trends (1996–2006) between the
(a) GIMMS and (b) CCRS datasets for burned and unburned sites
of the Canadian boreal forest along a fire severity gradient; low
severity (before July 21st in years of few, small fires), medium
severity (before July 21st in years of many, large fires), and high
severity (after July 21st any year). Error bars represent one
standard deviation. Significant trends (P-value o0.05) were
obtained using the seasonal Mann–Kendall trend test, and slopes
were computed using the Sen’s method (Hirsch et al., 1982).
GIMMS, Global Inventory, Monitoring, and Modeling Studies;
CCRS, Canadian Centre for Remote Sensing; NDVI, normalized
difference vegetation index.
764 D . A L C A R A Z - S E G U R A et al.
r 2009 Crown in the right of Canada, Global Change Biology, 16, 760–770

mean of these 100 000 runs (Table 1). Finally, to look for
significant differences in the NDVI trends among
burned and unburned classes, we also ran a boot-
strapped ANOVA. In each of the 100 000 repetitions, we
maintained for each class the sample sizes previously
calculated, but randomly changed the actual pixels
included for comparison. We recorded the number of
times that significant differences (P-valueo0.05) were
found between classes and how many times class
means were significantly different from zero. Compar-
isons between classes were based on the Sheffe’s S
procedure, which provides a confidence level for com-
parisons of means among all classes, and it is conserva-
tive for comparisons of simple differences of pairs.
Results
There were contrasting NDVI trends between the CCRS
and the GIMMS datasets, with the CCRS dataset show-
ing a general NDVI increase in both burned and un-
burned sites, while the GIMMS dataset exhibited a
decrease in the unburned forest and minor trends (both
positive and negative) in few burned sites (Fig. 2). In the
CCRS dataset, almost all burned sites showed strong
NDVI increases, always greater in percentage and mag-
nitude than the increases experienced by the unburned
forest sites (Fig. 2b). Contrary to this, in the GIMMS
dataset (Fig. 2a), only 22% of sites burned between 1984
and 1995 showed NDVI increases during the 1996–2006
period, while 11% showed NDVI decreases (weak
trends in both cases of absolute mean of Sen’s slopes
lower than 0.002). In the unburned forest, 54% of
GIMMS pixels showed NDVI negative trends (with
mean of Sen’s slopes lower than �0.003), and o1%
experienced slightly positive trends.
Fire severity had an effect on vegetation recovery as
observed by the NDVI trends. Burned sites with med-
ium fire severity (burned before July 21st in years of
many, large fires) experienced the greatest NDVI in-
creases in both datasets, though with much greater
magnitude in the CCRS data (Fig. 2). The unburned
forest surrounding sites of medium fire severity showed
positive NDVI trends that did not differ from the other
two severity classes in the CCRS dataset, but they
showed greater NDVI decreases than the low and high
severity classes in the GIMMS dataset.
The 100 000 bootstrapped ANOVAs (Table 2) showed
that, with the exception of the medium fire severity
class, the GIMMS NDVI trends did not significantly
differ between the burned and unburned classes. With-
in the burned severity classes, the GIMMS NDVI trends
did not differ and were not significantly different from
zero 20% to 62% of times. Unburned classes did not
differ significantly from each other, but their negative
NDVI trends were significantly different from zero. In
contrast, with the CCRS dataset (Table 2), the NDVI
trends did differ between the burned and unburned
classes, being positive and significantly different from
zero in all unburned and burned classes (though sig-
nificantly greater in the burned ones). Within the
burned classes, the CCRS NDVI trends did not signifi-
cantly differ among classes (only medium fire severity
was significantly different from the other two classes
15% of times). There were no significant differences
among the CCRS NDVI trends of the unburned classes.
We also ran 100 000 Kruskal–Wallis tests to compare the
same samples and the results were consistent with
those from the ANOVAs.
Discussion
Contrary to expectations, GIMMS-NDVI did not signif-
icantly increase from 1996 to 2006 in areas that had been
burned between 1984 and 1995. Despite the potential
presence of a maximum of 30% of nonburned forest
within the GIMMS sample for burned sites, a minimum
of 70% of burned area would likely have caused a
Table 2 Percentage of times that the NDVI trends (1996–
2006) significantly (P-value o0.05) differed between classes
in the 100 000 ANOVAs that compared burned and unburned
boreal forest sites along a fire severity gradient: low severity
(before July 21st in years of few, small fires), medium severity
(before July 21st in years of many, large fires), and high
severity (after July 21st any year). (a) The lower left side of
the matrix shows results for the GIMMS dataset and (b) the
upper right side for the CCRS dataset. Gray cells highlight
comparisons within the same dataset between burned and
unburned sites. Last row (GIMMS) and last column (CCRS)
show the percentage of times that the NDVI trends for each
fire severity class were significantly (P-value o0.05) different
from zero
% of 100 000
ANOVAs
Burned UnburnedCCRS
Low Med High Low Med High Zero
Burned
Low 5 1 100 100
Med 5 15 100 100
High 0 0 100 100
Unburned
Low 3 0 0 99
Med 97 2 0 98
High 58 0 1 91
GIMMS
Zero 38 80 69 100 100 100
GIMMS, Global Inventory, Monitoring, and Modeling Studies;
CCRS, Canadian Centre for Remote Sensing; NDVI, normal-
ized difference vegetation index.
G R E E N I N G V S . B R O W N I N G O F T H E B O R E A L F O R E S T 765
r 2009 Crown in the right of Canada, Global Change Biology, 16, 760–770

positive NDVI trend following burns. In fact, the CCRS
data, that also contained a maximum 30% of nonburned
forest, showed strong NDVI increases in all sampled
burned pixels. Previous work by Goetz et al. (2006) using
the GIMMS dataset detected NDVI increases after boreal
forest fires, but only by analyzing burn scars of three very
severe fire years. However, regardless of the severity of
the fire, given the steep rate of greening during postfire
regeneration in the boreal forest (Kasischke & French,
1997), the NDVI would be expected to capture these
changes. The presence of such positive responses in the
CCRS data but not in the GIMMS data may indicate that
the GIMMS data processing introduces a bias that tends
to underestimate positive NDVI trends in the boreal
forest of central Canada. A similar bias has been observed
in South America, where GIMMS was unable to detect
many known long-term ecosystem changes, while they
were evident using PAL and Fourier-Adjustment, Solar
zenith angle corrected, Interpolated Reconstructed (FAS-
IR) datasets (Baldi et al., 2008). De Beurs & Henebry
(2008) also showed how in some ecoregions of Northern
Eurasia the choice of the PAL or GIMMS datasets can
lead to different and even opposite effects of the northern
annular mode on the land surface phenologies.
Positive trends in vegetation greenness have been
observed in the Canadian boreal forest attributed to
warming through an increase in the number of growing
degree days and the growing season length (Nemani
et al., 2003; de Beurs & Henebry, 2005; Reed, 2006; Kimball
et al., 2007). However, recent studies using GIMMS
reported a negative NDVI trend in the North American
boreal forest suggestedly due to an increase in summer
drought stress (Goetz et al., 2005, 2007). From our com-
parison of postfire NDVI trends between the CCRS and
GIMMS datasets, the lack of postfire NDVI increases in
burned sites and the presence of GIMMS-NDVI decreases
in unburned areas may be due to processing algorithms
of this dataset, and not necessarily to an actual decline in
vegetation activity. Contrary to GIMMS, our CCRS results
support the occurrence of a slight increase in vegetation
greenness from 1996 to 2006 in the boreal forest of central
Canada. Work by Stow et al. (2007) in northern Alaska
also showed that GIMMS data did not capture the
majority of the areas of more rapidly increasing green-
ness, which were detected by a 1 km2 AVHRR dataset
from the United States Geological Survey.
Several reasons that will require further investigation
might be involved to explain different NDVI trends
between the GIMMS and CCRS datasets in central
Canada. The first hypothesis could be a possible
‘over-correction’ of the satellite drift contribution to
the NDVI signal that may have caused a bias in the
GIMMS dataset towards negative NDVI trends in the
boreal forest region of central Canada. This boreal
region is more affected by the satellite drift than the
northernmost tundra regions [notice the dotted line that
separates both regions in fig. 1, crossing from northern
Alaska to the southern coast of the Hudson Bay, that is
reproduced from fig. 4 of the GIMMS user guide
(Pinzon et al., 2007)]. A dissimilar satellite drift correc-
tion between the two regions may explain the negative
NDVI trends in the boreal region of central Canada, in
contrast to the positive NDVI trends in the tundra
region [notice that the same dotted line of Fig. 1
separates the negative NDVI trends of the boreal forest
from the positive NDVI trends of the tundra region in
fig. 4 of Goetz et al. (2005)]. A dissimilar satellite drift
correction may also explain why the GIMMS dataset
shows systematically lower mean NDVI values than the
FASIR dataset to the south of the dotted line of Fig. 1,
but systematically higher values to the north of it [see
fig. 2 of Hall et al. (2006)]. A second hypothesis could be
the larger pixel size and geolocation errors in the
GIMMS dataset compared with the CCRS dataset. The
lack of significant postfire increases in GIMMS-NDVI
might be explained by the maximum value compositing
of the GAC archive (several 1.1 km� 4 km GAC pixels
are taken to produce one 64 km2 GIMMS pixel). If this
technique produces a systematic bias towards high
NDVI values from nonburned GAC pixels surrounding
the GIMMS burned pixels, the postfire NDVI trends of
burned pixels would be contaminated by the signal of
nonburned surrounding areas. In contrast to GIMMS,
the better registration and full AVHRR 1 km2 spatial
resolution of the CCRS dataset minimizes the occur-
rence of mixed NDVI signals. For both datasets, we
tried to minimize this problem by avoiding a 10 km
buffer around water bodies, burned areas, and nonfor-
est land-covers. A third effect to consider is the different
temporal resolution of both datasets, which affects
their sensitivity to capture changes in land surface
phonologies. This was suggested by de Beurs & He-
nebry (2008) when comparing GIMMS and PAL data-
sets. The 10-day composites of CCRS (or PAL in their
study) have 50% higher temporal resolution than the
GIMMS 15-day composites. As a result, the 10-day
composite datasets can capture higher interannual
variability than GIMMS and can more accurately moni-
tor changes at the beginning and end of the growing
season, which can occur very rapidly in high latitudes.
Fire severity did not greatly determine the recovery
rates of NDVI during postfire regeneration. Recovery
rates of NDVI did not significantly differ between low
and high severity classes and were only slightly faster
in sites burned by medium severity. The lack of sig-
nificant differences in the recovery rates of NDVI in
burned pixels classified by the severity criteria may
be due to several factors. First, the method used for
766 D . A L C A R A Z - S E G U R A et al.
r 2009 Crown in the right of Canada, Global Change Biology, 16, 760–770

defining severity only applies to a portion of the vege-
tation types present in the study region (e.g. black
spruce forests, about 50% of the forest cover). Second,
during the first 10 years following a fire, factors other
than changes in the amount of green vegetation may
result in changes in NDVI. For example, fires create
large areas of charred organic material, as well as
exposed mineral soil in severe burns, that become
covered by regrowth of mosses (especially the very thin
fire moss, Ceratodon purpureus Hedw.) and new dead
plant litter. The progressive recovery of the postfire
ground layer changes dramatically the background
reflectance, which may result in NDVI changes not
related to the level of recovery of the aboveground
herbaceous and woody vegetation, particularly during
the first few years of low NDVI values.
Conclusions
In this study, we detected positive NDVI trends in the
Canadian boreal forest using the CCRS dataset that
contradict the decline of vegetation activity observed
in this and in previous studies based on the GIMMS
dataset. The GIMMS dataset largely missed the postfire
greening recovery, while the CCRS dataset, which has
improved corrections and a much higher spatial resolu-
tion than GIMMS, did capture it under all conditions of
fire severity. From these conflicting NDVI trends be-
tween the two datasets, regional trends derived from
current coarse resolution satellite datasets should be
taken with caution. The presence of a bias in satellite
datasets has broad implications for the evaluation of
global and national carbon budgets. Currently, the
GIMMS dataset is the most broadly used coarse-spatial
resolution dataset for monitoring ecosystem changes
(Pettorelli et al., 2005), detecting long-term trends in
vegetation growth and phenology (Kathuroju et al.,
2007), providing inputs for primary production models
(Cao et al., 2004), and acting as reference to model the
carbon balance worldwide (Potter et al., 2005; Luyssaert
et al., 2007). Hence, the presence of a long-term bias in
the GIMMS dataset may affect the aforementioned
studies. As the GIMMS user guide strongly encourages,
results should be validated with independent data. In
addition to the CCRS dataset, other remote sensing
datasets with higher spatial resolution than GIMMS
may help in this evaluation, such as the reprocessing
of the GAC archive under the Land Long Term Data
Record initiative, and the SPOT VEGETATION and Terra
MODIS collections. Our study also suggests the exis-
tence of slight differences associated with fire severity
that can be further investigated (e.g. by stratifying the
analysis across different ecoregions and land-covers)
using the CCRS dataset with its higher spatial resolution.
Finally, we think that the evaluation of satellite datasets
should not only be based on the physical and mathe-
matical principles of image processing (e.g. assessing
the effect of atmospheric corrections when comparing
with surface parameter values; McCloy et al., 2005;
Nagol et al., 2009), but also on comparisons with in-
dependent observations at the results stage (e.g. com-
paring satellite-detected trends of new datasets with
previously known independent observations of change,
like in this study and in Baldi et al., 2008).
Acknowledgements
Financial support for D. Alcaraz-Segura was provided by thepostdoctoral program of the Spanish Ministry of Education, theInter-American Institute for Global Change Research (IAI, CRNII 2031) under the US National Science Foundation (Grant GEO-0452325), the Spanish National Parks Agency (OrganismoAutonomo de Parques Nacionales, project 066/2007), the Anda-lusian Government (projects RNM1288 and RNM1280), and by aNational Science Foundation (Synthesis of Arctic SystemScience) award (ARC-0531180) to Howard Epstein. Universityof Virginia Research Computing Laboratory (K. Holcomb) andSiham Tabik (University of Malaga) helped to run the seasonalKendall trend test. The source for the GIMMS satellite data wasthe Global Land Cover Facility. The generation of the 1 km2 long-term AVHRR time series was conducted at the Canada Centrefor Remote Sensing (CCRS), Earth Sciences Sector of NaturalResources Canada as part of Project J35 of the program on‘Enhancing Resilience in a Changing Climate’ and the ‘ClimateChange and Ecosystem Impact’ project supported by the Cana-dian Space Agency through the Government Related InitiativesProgram (GRIP).
References
Amiro BD, Todd JB, Wotton BM et al. (2001) Direct carbon emi-
ssions from Canadian forest fires, 1959–1999. Canadian Journal
of Forest Research-Revue Canadienne de Recherche Forestiere, 31,
512–525.
Angert A, Biraud S, Bonfinls C et al. (2005) Drier summers cancel
out the CO2 uptake enhancement induced by warmer springs.
Proceedings of the National Academy of Sciences of the United
States of America, 102, 10823–10827.
Baldi G, Nosetto MD, Aragon MR, Aversa F, Paruelo JM, Jobbagy
EG (2008) Long-term satellite NDVI datasets: evaluating their
ability to detect ecosystem functional changes in South Amer-
ica. Sensors, 8, 5397–5425.
Barber VA, Juday GP, Finney BP (2000) Reduced growth of
Alaskan white spruce in the twentieth century from tempera-
ture-induced drought stress. Nature, 405, 668–673.
Bergeron O, Margolis HA, Black TA, Coursolle C, Dunn AL, Barr
AG, Wofsy SC (2007) Comparison of carbon dioxide fluxes
over three boreal black spruce forests in Canada. Global Change
Biology, 13, 89–107.
Bond-Lamberty B, Peckham SD, Ahl DE, Gower ST (2007) Fire as
the dominant driver of central Canadian boreal forest carbon
balance. Nature, 450, 89–92.
G R E E N I N G V S . B R O W N I N G O F T H E B O R E A L F O R E S T 767
r 2009 Crown in the right of Canada, Global Change Biology, 16, 760–770

Bunn AG, Goetz SJ (2006) Trends in satellite-observed circum-
polar photosynthetic activity from 1982 to 2003: the influence
of seasonality, cover type, and vegetation density. Earth Inter-
actions, 10, 1–19.
Bunn AG, Goetz SJ, Fiske GJ (2005) Observed and predicted
responses of plant growth to climate across Canada. Geophy-
sical Research Letters, 32, 1–4.
Cao M, Prince SD, Small J, Goetz SJ (2004) Remotely sensed
interannual variations and trends in terrestrial net primary
productivity 1981-2000. Ecosystems, 7, 233–242.
Chuvieco E, Englefield P, Trishchenko AP, Luo Y (2008) Genera-
tion of long time series of burn area maps of the boreal forest
from NOAA–AVHRR composite data. Remote Sensing of
Environment, 112, 2381–2396.
D’Arrigo R, Wilson R, Liepert B, Cherubini P (2008) On the
‘Divergence Problem’ in Northern Forests: a review of the tree-
ring evidence and possible causes. Global and Planetary Change,
60, 289–305.
de Beurs KM, Henebry GM (2005) Land surface phenology and
temperature variation in the International Geosphere-Bio-
sphere Program high-latitude transects. Global Change Biology,
11, 779–790.
de Beurs KM, Henebry GM (2008) Northern annular mode
effects on the land surface phenologies of Northern Eurasia.
Journal of Climate, 21, 4257–4279.
Dong JR, Kaufmann RK, Myneni RB et al. (2003) Remote sensing
estimates of boreal and temperate forest woody biomass:
carbon pools, sources, and sinks. Remote Sensing of Environ-
ment, 84, 393–410.
Dunn AL, Barford CC, Wofsy SC, Goulden ML, Daube BC (2007)
A long-term record of carbon exchange in a boreal black
spruce forest: means, responses to interannual variability,
and decadal trends. Global Change Biology, 13, 577–590.
French NHF, Kasischke ES, Hall RJ, Murphy KA, Verbyla DL,
Hoy EE, Allen JL (2008) Using Landsat data to assess fire and
burn severity in the North American boreal forest region: an
overview and summary of results. International Journal of
Wildland Fire, 17, 443–462.
Goetz SJ, Bunn AG, Fiske GJ, Houghton RA (2005) Satellite-
observed photosynthetic trends across boreal North America
associated with climate and fire disturbance. Proceedings of the
National Academy of Sciences of the United States of America, 102,
13521–13525.
Goetz SJ, Fiske GJ, Bunn AG (2006) Using satellite time-
series data sets to analyze fire disturbance and forest
recovery across Canada. Remote Sensing of Environment, 101,
352–365.
Goetz SJ, Mack MC, Gurney KR, Randerson JT, Houghton RA
(2007) Ecosystem responses to recent climate change and fire
disturbance at northern high latitudes: observations and
model results contrasting northern Eurasia and North Amer-
ica. Environmental Research Letters, 2, 045031, doi: 10.1088/
1748-9326/2/4/045031.
Gorham E (1991) Northern Peatlands – role in the carbon-cycle
and probable responses to climatic warming. Ecological Appli-
cations, 1, 182–195.
Hall F, Masek JG, Collatz GJ (2006) Evaluation of ISLSCP
Initiative IIFASIR and GIMMS NDVI products and implica-
tions for carbon cycle science. Journal of Geophysical Research-
Atmospheres, 111 D22S08, doi: 10.1029/2006JD007438.
Harden JW, Trumbore SE, Stocks BJ, Hirsch A, Gower ST, O’Neill
KP, Kasischke ES (2000) The role of fire in the boreal carbon
budget. Global Change Biology, 6, 174–184.
Hicke JA, Asner GP, Kasischke ES et al. (2003) Postfire response
of North American boreal forest net primary productivity
analyzed with satellite observations. Global Change Biology, 9,
1145–1157.
Hirsch RM, Slack J (1984) A nonparametric trend test for
seasonal data with serial dependence. Water Resources Research,
20, 727–732.
Hirsch RM, Slack JR, Smith RA (1982) Techniques of trend
analysis for monthly water quality data. Water Resources
Research, 18, 107–121.
Houghton RA (2007) Balancing the global carbon budget. Annual
Review of Earth and Planetary Sciences, 35, 313–347.
Insightful Corporation (2007) S-PLUS 8.0.4 for Windows Enter-
prise Developer.
Jia GJ, Epstein HE, Walker DA (2003) Greening of arctic Alaska,
1981–2001. Geophysical Research Letters, 30, 2067, doi: 10.1029/
2003GL018268.
Johnstone J, Chapin F (2006) Effects of soil burn severity on post-
fire tree recruitment in boreal forest. Ecosystems, 9, 14–31.
Johnstone JF, Kasischke ES (2005) Stand-level effects of soil burn
severity on postfire regeneration in a recently burned black
spruce forest. Canadian Journal of Forest Research-Revue Canadi-
enne de Recherche Forestiere, 35, 2151–2163.
Kasischke ES (2000) Boreal ecosystems in the carbon cycle. In:
Fire, Climate Change, and Carbon Cycling in the North American
Boreal Forest (eds Kasischke ES, Stocks BJ), pp. 19–30. Springer-
Verlag, New York.
Kasischke ES, Christensen NL, Stocks BJ (1995) Fire, global
warming, and the carbon balance of boreal forests. Ecological
Applications, 5, 437–451.
Kasischke ES, French NHF (1997) Constraints on using AVHRR
composite index imagery to study patterns of vegetation cover
in boreal forests. International Journal of Remote Sensing, 18,
2403–2426.
Kasischke ES, Johnstone JF (2005) Variation in postfire organic
layer thickness in a black spruce forest complex in interior
Alaska and its effects on soil temperature and moisture.
Canadian Journal of Forest Research-Revue Canadienne de
Recherche Forestiere, 35, 2164–2177.
Kasischke ES, Turetsky MR, Ottmar RD, French NHF, Hoy EE,
Kane ES (2008) Evaluation of the composite burn index for
assessing fire severity in Alaskan black spruce forests. Inter-
national Journal of Wildland Fire, 17, 515–526.
Kathuroju N, White MA, Symanzik J, Schwartz MD, Powell JA,
Nemani RR (2007) On the use of the advanced very
high resolution radiometer for development of prognostic land
surface phenology models. Ecological Modelling, 201, 144–156.
Kaufmann RK, D’Arrigo RD, Laskowski C, Myneni RB, Zhou L,
Davi NK (2004) The effect of growing season and summer
greenness on northern forests. Geophysical Research Letters, 31,
L09205, doi: 10.1029/2004GL019608.
Khlopenkov KV, Trishchenko AP (2007) SPARC: new cloud,
snow, and cloud shadow detection scheme for historical
768 D . A L C A R A Z - S E G U R A et al.
r 2009 Crown in the right of Canada, Global Change Biology, 16, 760–770

1-km AVHHR data over Canada. Journal of Atmospheric and
Oceanic Technology, 24, 322–343.
Kimball JS, Zhao M, McGuire AD et al. (2007) Recent climate-
driven increases in vegetation productivity for the western
Arctic: evidence of an acceleration of the northern terrestrial
carbon cycle. Earth Interactions, 11, 1–30.
Kurz W, Apps MJ (2006) Developing Canada’s national
forest carbon monitoring, accounting, and reporting
system to meet the reporting requirements of the Kyoto
Protocol. Mitigation and Adaptation Strategies for Global Change,
11, 33–43.
Latifovic R, Trishchenko AP, Chen J et al. (2005) Generating
historical AVHRR 1 km baseline satellite data records over
Canada suitable for climate change studies. Canadian Journal of
Remote Sensing, 31, 324–346.
Luyssaert S, Inglima I, Jung M et al. (2007) CO2 balance of boreal,
temperate, and tropical forests derived from a global database.
Global Change Biology, 13, 2509–2537.
Masek JG (2001) Stability of boreal forest stands during recent
climate change: evidence from Landsat satellite imagery. Jour-
nal of Biogeography, 28, 967–976.
McCloy KR, Los S, Lucht W, H S (2005) A comparative analysis
of three long-term NDVI datasets derived from AVHRR
satellite data. EARSeL eProceedings, 4, 52–69.
Millard SP (2001) Environmental Statistics for S-PLUS Version 2.0.
Probability, Statistics and Information. Seattle.
Myneni RB, Dong J, Tucker CJ et al. (2001) A large carbon sink in
the woody biomass of Northern forests. Proceedings of the
National Academy of Sciences of the United States of America, 98,
14784–14789.
Myneni RB, Keeling CD, Tucker CJ, Asrar G, Nemani RR (1997)
Increase plant growth in the northern high latitudes from
1981–1991. Nature, 386, 698–702.
Nagol JR, Vermote EF, Prince SD (2009) Effects of atmospheric
variation on AVHRR NDVI data. Remote Sensing of Environ-
ment, 113, 392–397.
Neigh CSR, Tucker CJ, Townshend JRG (2008) North American
vegetation dynamics observed with multi-resolution satellite
data. Remote Sensing of Environment, 112, 1749–1772.
Nemani RR, Keeling CD, Hashimoto H et al. (2003) Climate-
driven increases in global terrestrial net primary production
from 1982 to 1999. Science, 300, 1560–1563.
Olthof I, Latifovic R (2007) Short-term response of arctic vegeta-
tion NDVI to temperature anomalies. International Journal of
Remote Sensing, 28, 4823–4840.
Palko S, St-Laurent L, Huffman T, Unrau E (1995) The Canada
vegetation and land cover: a raster and vector data set for GIS
applications – uses in agriculture. In: GIS’95 Conference Pro-
ceedings 2, pp. 613–619. GIS World Inc., Fort Collins, CO, USA.
Pettorelli N, Vik JO, Mysterud A, Gaillard JM, Tucker CJ,
Stenseth NC (2005) Using the satellite-derived NDVI to assess
ecological responses to environmental change. Trends in Ecol-
ogy and Evolution, 20, 503–510.
Pinzon J, Brown ME, Tucker CJ (2004) Satellite time series
correction of orbital drift artifacts using empirical mode de-
composition. In: Hilbert-Huang Transform: Introduction and Ap-
plications (ed. Huang N), pp. 167–186. World Scientific
Publishers, Singapore.
Pinzon JE, Brown ME, Tucker CJ (2007) Global inventory model-
ing and mapping studies (GIMMS) satellite drift corrected and
NOAA-16 incorporated normalized difference vegetation in-
dex (NDVI), monthly 1981–2006. Product User Guide, 20 pp.
Global Land Cover Facility – University of Maryland, College
Park. Available at: http://www.landcover.org/data/guide/
technical/GIMMSdocumentation_NDVIg_GLCF.pdf
Potter C, Klooster S, Tan P, Steinbach M, Kumar V, Genovese V
(2005) Variability in terrestrial carbon sinks over two decades:
part 2 – Eurasia. Global and Planetary Change, 49, 177–186.
Prince SD, Goward SN (1996) Evaluation of the NOAA/NASA
Pathfinder AVHRR Land Data Set for global primary produc-
tion modelling. International Journal of Remote Sensing, 17,
217–221.
Randerson JT, Thompson MV, Conway TJ, Fung IY, Field CB
(1997) The contribution of terrestrial sources and sinks to
trends in the seasonal cycle of atmospheric carbon dioxide.
Global Biogeochemical Cycles, 11, 535–560.
Reed BC (2006) Trend analysis of time-series phenology of North
America derived from satellite data. Giscience and Remote
Sensing, 43, 24–38.
Rocha AV, Goulden ML, Dunn AL, Wofsy SC (2006) On linking
interannual tree ring variability with observations of whole-
forest CO2 flux. Global Change Biology, 12, 1378–1389.
Simoniello T, Cuomo V, Lanfredi M, Lasaponara R (2004) On the
relevance of accurate correction and validation procedures in
the analysis of AVHRR-NDVI time series for long-term mon-
itoring. Journal of Geophysical Research, 109, D20107, doi:
10.1029/2004JD004819.
Slayback DA, Pinzon JE, Los SO, Tucker CJ (2003) Northern
hemisphere photosynthetic trends 1982-99. Global Change
Biology, 9, 1–15.
Stow D, Petersen A, Hope A, Engstrom R, Coulter L (2007)
Greenness trends of Arctic tundra vegetation in the
1990s: comparison of two NDVI data sets from NOAA
AVHRR systems. International Journal of Remote Sensing, 28,
4807–4822.
Trishchenko AP (2009) Effects of spectral response function
on surface reflectance and NDVI measured with moderate
resolution satellite sensors: extension to AVHRR NOAA-17,
18 and METOP-A. Remote Sensing of Environment, 113,
335–341.
Trishchenko AP, Cihlar J, Li Z (2002) Effects of spectral response
function on surface reflectance and NDVI measured with
moderate resolution satellite sensors. Remote Sensing of Envir-
onment, 81, 1–18.
Tucker CJ, Pinzon JE, Brown ME et al. (2005) An extended
AVHRR 8-km NDVI dataset compatible with MODIS and
SPOT vegetation NDVI data. International Journal of Remote
Sensing, 26, 4485–4498.
Tucker CJ, Sellers PJ (1986) Satellite remote-sensing of pri-
mary production. International Journal of Remote Sensing, 7,
1395–1416.
Tucker CJ, Slayback DA, Pinzon JE, Los SO, Myneni RB,
Taylor MG (2001) Higher northern latitude normalized
difference vegetation index and growing season trends from
1982 to 1999. International Journal of Biometeorology, V45, 184–
190.
G R E E N I N G V S . B R O W N I N G O F T H E B O R E A L F O R E S T 769
r 2009 Crown in the right of Canada, Global Change Biology, 16, 760–770

Van Belle G, Hughes J (1984) Nonparametric tests for trend in
water quality. Water Resources Research, 20, 127–136.
Vasander H, Kettunen A (2006) Carbon in boreal peatlands.
In: Boreal Peatland Ecosystems (eds Wieder RK, Vitt DH),
pp. 165–194. Springer-Verlag, Heidelberg, Germany.
Verbyla D (2008) The greening and browning of Alaska based on
1982-2003 satellite data. Global Ecology and Biogeography, 17,
547–555.
Zhang K, Kimball JS, Zhao MS, Oechel WC, Cassano J, Running
SW (2007) Sensitivity of pan-Arctic terrestrial net primary pro-
ductivity simulations to daily surface meteorology from NCEP-
NCAR and ERA-40 reanalyses. Journal of Geophysical Research-
Biogeosciences, 112, G01011, doi: 10.1029/2006JG000249.
Zhou L, Kaufmann RK, Tian Y, Myneni RB, Tucker CJ (2003)
Relation between interannual variations in satellite measures
of northern forest greenness and climate between 1982 and
1999. Journal of Geophysical Research-Atmospheres, 108, D14004,
doi: 10.1029/2002JD002510.
Zhou LM, Tucker CJ, Kaufmann RK, Slayback D, Shabanov NV,
Myneni RB (2001) Variations in northern vegetation activity in-
ferred from satellite data of vegetation index during 1981 to 1999.
Journal of Geophysical Research-Atmospheres, 106, 20069–20083.
770 D . A L C A R A Z - S E G U R A et al.
r 2009 Crown in the right of Canada, Global Change Biology, 16, 760–770