Crystal Structures and Spectroscopic and Theoretical Properties of Pentacoordinate Nickel(II)...
11
FULL PAPER DOI:10.1002/ejic.201300339 Crystal Structures and Spectroscopic and Theoretical Properties of Pentacoordinate Nickel(II) Complexes Containing Tris(pyrazolyl)borate and Quinolinate Ligands Luisa López-Banet, [a] M. Dolores Santana,* [a] Gabriel García, [a] M. José Piernas, [a] Luis García, [b] José Pérez, [b] Ainhoa Calderón-Casado, [c] and Gotzone Barandika [d] Keywords: Nickel / Borates / N,O ligands / Optical properties / Structure elucidation A series of quinolinate nickel–tris(pyrazolyl)borate com- plexes [Ni(Tp*)(N,O-2,5,7-R 1 ,R 2 ,R 3 -8-hq)] {Tp* = hydrotris- (3,5-dimethylpyrazolyl)borate, 8-hq = 8-hydroxyquinoline} were synthesized and characterized by spectroscopic meth- ods. Single-crystal X-ray studies indicate that these com- plexes exhibit a pentacoordinate arrangement with chelating quinolinate and hydrotris(3,5-dimethylpyrazolyl)borate li- gands. The substituents on the quinolinate generate varia- tions in the absorption and emission wavelengths. Substitu- ents in the 5,7-positions and a 2-CN substituent in the quin- olinate induce a bathochromic shift with respect to the un- substituted derivative; however, 2-Me and 2-NH 2 substitu- ents cause a blueshift. The UV/Vis spectra were investigated by time-dependent (TD)-DFT on the basis of the optimized Introduction 8-Hydroxyquinoline (8-hq) is one of the most important chelators for metal ions, and it has significant applications in a variety of investigations that involve metal complexes. [1] The fluorescence of 8-hq can be modified by metal bind- ing, [2] which makes 8-hq even more attractive as a chelator. Therefore, 8-hq has been extensively used to construct very [a] Universidad de Murcia, Regional Campus of International Excellence “Campus Mare Nostrum” Dpto. Química Inorgánica, 30071 Murcia, Spain Fax: +34-868-887458 E-mail: [email protected] Homepage: http://www.um.es/ [b] Universidad Politécnica de Cartagena, Dpto. Ingeniería Minera, Geológica y Cartográfica (Área de Química Inorgánica), 30203 Cartagena (Murcia), Spain http://www.upct.es/ [c] Departamento de Mineralogía y Petrología, Facultad de Ciencia y Tecnología, Apdo. 644, 48080 Bilbao, Spain http://www.ehu.es/p200-home/es [d] Departamento de Química Inorgánica, Facultad de Farmacia, UPV/EHU, Paseo de la Universidad 7, 01006 Vitoria-Gasteiz, Spain http://www.ehu.es/p200-home/es Supporting information for this article is available on the WWW under http://dx.doi.org/10.1002/ejic.201300339. Eur. J. Inorg. Chem. 2013, 4280–4290 © 2013 Wiley-VCH Verlag GmbH & Co. KGaA, Weinheim 4280 geometries; further calculations were performed to identify the main contributions to the corresponding molecular orbit- als. These nickel(II) complexes show emissions between 458 and 561 nm in the solid state. The experimental results in combination with the theoretical approaches led us to pro- pose that the lowest-energy absorption can be assigned to both ligand-to-metal charge-transfer and intraligand charge- transfer (ILCT) transitions for the 2-Me- and 2-NH 2 -substi- tuted derivatives. Nevertheless, for the 5,7-substituted and 2-CN derivatives the transitions are mainly assigned to ILCT transitions with an admixture of metal orbitals. TD-DFT cal- culations indicate that the contribution of the metal to the transitions is one of the essential factors. sensitive fluorescent chemosensors with the aim of de- tecting metal ions of biological and/or environmental signi- ficance. [3–5] Currently, luminescent complexes containing d 8 transition metals are being investigated not only for their theoretical interest [6] but also for potential applications. [7] In this context, complexes of Pd II[4] and Pt II[5] occupy a notable position, although most of the palladium-contain- ing systems emit only at low temperatures. [8] The general strategy to enable emission of Pt II compounds has been to raise the energy of the d–d state by introducing strong-field cyclometalating ligands. [9] However, an alternative ap- proach involves the generation of an excited state of low- lying emission. For instance, an excited state that is local- ized in a ligand that would not be quenched by a d–d state. [10] Quinolinate (Q)-type ligands have been widely used to produce luminescent metal complexes that emit from a Q-based intraligand charge-transfer (ILCT) singlet or trip- let excited state. The state is formed if the highest occupied molecular orbital (HOMO) is localized on the phenolate ring and the lowest unoccupied molecular orbital (LUMO) is localized on the pyridyl ring of the Q ligand. [4,5] Com- pounds containing Ni II have been less addressed. [11,12] Nickel(II) Schiff base complexes [12b–12e] and 1D poly- mers [12f] are blue-light emitters both in solution and in the solid state. A Ni II octahedral complex containing 6-meth-
-
Upload
independent -
Category
Documents
-
view
2 -
download
0
Transcript of Crystal Structures and Spectroscopic and Theoretical Properties of Pentacoordinate Nickel(II)...

FULL PAPER
DOI:10.1002/ejic.201300339
Crystal Structures and Spectroscopic and TheoreticalProperties of Pentacoordinate Nickel(II) ComplexesContaining Tris(pyrazolyl)borate and Quinolinate Ligands
Luisa López-Banet,[a] M. Dolores Santana,*[a] Gabriel García,[a]
M. José Piernas,[a] Luis García,[b] José Pérez,[b]
Ainhoa Calderón-Casado,[c] and Gotzone Barandika[d]
Keywords: Nickel / Borates / N,O ligands / Optical properties / Structure elucidation
A series of quinolinate nickel–tris(pyrazolyl)borate com-plexes [Ni(Tp*)(N,O-2,5,7-R1,R2,R3-8-hq)] {Tp* = hydrotris-(3,5-dimethylpyrazolyl)borate, 8-hq = 8-hydroxyquinoline}were synthesized and characterized by spectroscopic meth-ods. Single-crystal X-ray studies indicate that these com-plexes exhibit a pentacoordinate arrangement with chelatingquinolinate and hydrotris(3,5-dimethylpyrazolyl)borate li-gands. The substituents on the quinolinate generate varia-tions in the absorption and emission wavelengths. Substitu-ents in the 5,7-positions and a 2-CN substituent in the quin-olinate induce a bathochromic shift with respect to the un-substituted derivative; however, 2-Me and 2-NH2 substitu-ents cause a blueshift. The UV/Vis spectra were investigatedby time-dependent (TD)-DFT on the basis of the optimized
Introduction
8-Hydroxyquinoline (8-hq) is one of the most importantchelators for metal ions, and it has significant applicationsin a variety of investigations that involve metal complexes.[1]
The fluorescence of 8-hq can be modified by metal bind-ing,[2] which makes 8-hq even more attractive as a chelator.Therefore, 8-hq has been extensively used to construct very
[a] Universidad de Murcia, Regional Campus of InternationalExcellence “Campus Mare Nostrum” Dpto. QuímicaInorgánica,30071 Murcia, SpainFax: +34-868-887458E-mail: [email protected]: http://www.um.es/
[b] Universidad Politécnica de Cartagena, Dpto. IngenieríaMinera, Geológica y Cartográfica (Área de QuímicaInorgánica),30203 Cartagena (Murcia), Spainhttp://www.upct.es/
[c] Departamento de Mineralogía y Petrología, Facultadde Ciencia y Tecnología,Apdo. 644, 48080 Bilbao, Spainhttp://www.ehu.es/p200-home/es
[d] Departamento de Química Inorgánica, Facultad de Farmacia,UPV/EHU,Paseo de la Universidad 7, 01006 Vitoria-Gasteiz, Spainhttp://www.ehu.es/p200-home/esSupporting information for this article is available on theWWW under http://dx.doi.org/10.1002/ejic.201300339.
Eur. J. Inorg. Chem. 2013, 4280–4290 © 2013 Wiley-VCH Verlag GmbH & Co. KGaA, Weinheim4280
geometries; further calculations were performed to identifythe main contributions to the corresponding molecular orbit-als. These nickel(II) complexes show emissions between 458and 561 nm in the solid state. The experimental results incombination with the theoretical approaches led us to pro-pose that the lowest-energy absorption can be assigned toboth ligand-to-metal charge-transfer and intraligand charge-transfer (ILCT) transitions for the 2-Me- and 2-NH2-substi-tuted derivatives. Nevertheless, for the 5,7-substituted and2-CN derivatives the transitions are mainly assigned to ILCTtransitions with an admixture of metal orbitals. TD-DFT cal-culations indicate that the contribution of the metal to thetransitions is one of the essential factors.
sensitive fluorescent chemosensors with the aim of de-tecting metal ions of biological and/or environmental signi-ficance.[3–5] Currently, luminescent complexes containing d8
transition metals are being investigated not only for theirtheoretical interest[6] but also for potential applications.[7]
In this context, complexes of PdII[4] and PtII[5] occupy anotable position, although most of the palladium-contain-ing systems emit only at low temperatures.[8] The generalstrategy to enable emission of PtII compounds has been toraise the energy of the d–d state by introducing strong-fieldcyclometalating ligands.[9] However, an alternative ap-proach involves the generation of an excited state of low-lying emission. For instance, an excited state that is local-ized in a ligand that would not be quenched by a d–dstate.[10] Quinolinate (Q)-type ligands have been widely usedto produce luminescent metal complexes that emit from aQ-based intraligand charge-transfer (ILCT) singlet or trip-let excited state. The state is formed if the highest occupiedmolecular orbital (HOMO) is localized on the phenolatering and the lowest unoccupied molecular orbital (LUMO)is localized on the pyridyl ring of the Q ligand.[4,5] Com-pounds containing NiII have been less addressed.[11,12]
Nickel(II) Schiff base complexes[12b–12e] and 1D poly-mers[12f] are blue-light emitters both in solution and in thesolid state. A NiII octahedral complex containing 6-meth-

www.eurjic.org FULL PAPER
ylpyridin-3-carboxylate ions[12g] shows emission maxima at424 and 461 nm, which are attributed to metal-perturbedligand-centered (LC) and ligand-to-metal charge-transfer(LMCT) transitions, respectively. Although different lumi-nescence properties have been observed for nickel(II) com-plexes, the reasons for these differences must be studied. Tomake an attempt to expand this area of chemistry, we haveselected hydrotris(3,5-dimethylpyrazolyl)borate (Tp*) as anancillary ligand for nickel(II), specifically to study the reac-tivity of the hydroxo [Ni(Tp*)(μ-OH)]2 complex towards 8-hydroxyquinoline ligands. The hydrotris(pyrazolyl)borate li-gand (TpR)[13] is widely used in the design of functionalmolecules, in asymmetric catalysis, in biomimetic chemistry,and in molecular “electronic devices”.[13,14] In this paper,we report mononuclear half-sandwich nickel(II) complexescontaining hydrotris(3,5-dimethylpyrazolyl)borate (Tp*)and 8-hydroxyquinolinate ligands. Moreover, structure de-termination of these species in the solid state and their spec-troscopic properties in solution are reported. Finally, we fo-cus on the effects of the quinolinate substituents on the elec-tronic absorption spectra in solution and on the emissionspectra in the solid state. To this purpose, time-dependentdensity functional theory (TD-DFT) calculations were per-formed.
Results and Discussion
Synthesis and Spectroscopic Characterization
Pentacoordinate nickel hydroxo complexes have beenused as versatile starting compounds to prepare a varietyof inorganic complexes,[15] as they are likely to lead to con-densation processes with protic organic ligands (Ni–OH +H–A�Ni–A + H2O). By way of this synthetic method, wereported the preparation of pentacoordinate nickel(II) com-plexes containing bridging phosphate ester ligands by usingthe hydroxo [Ni(Tp*)(μ-OH)]2 complex.[16] To explore thereactivity of this complex towards acid organic ligands withphotophysical properties, we treated [Ni(Tp*)(μ-OH)]2 withsubstituted-8-hydroxyquinolines to prepare mononuclear[Ni(Tp*)(N,O-2,5,7-R1,R2,R3-8-hq)] complexes through anacid–base reaction (Scheme 1).The new complexes werecharacterized by TOF mass spectrometry and IR, UV/Vis,and 1H NMR spectroscopy.
The IR spectra of complexes 1–9 show a band at 2528–2504 cm–1, which can be assigned to ν(B–H), and this isindicative of κ3 coordination of the Tp* ligand;[17] there isalso a ν(C=N) band for this ligand at approximately1545 cm–1. These spectra also show a band between 1590and 1560 cm–1, which can be assigned to ν(C=N) of thequinolinate ligands. The IR spectrum of 1 also exhibits aband due to ν(C�N) at 2230 cm–1. In the spectrum of 6,strong bands at 1511 and 1272 cm–1 are assigned to theasymmetric and symmetric stretching vibrations of the NO2
group. The stretching vibration of the NH2 group appearsas a weak band at 3395 cm–1 in the spectrum of 7.
All of the complexes exhibit relatively sharp hyperfine-shifted 1H NMR signals in CDCl3 solution spanning from
Eur. J. Inorg. Chem. 2013, 4280–4290 © 2013 Wiley-VCH Verlag GmbH & Co. KGaA, Weinheim4281
Scheme 1.
150 to –20 ppm. The 1H NMR spectra of complexes 1–9were assigned on the basis of our previous studies of para-magnetic nickel(II) complexes,[18] for which not only thechemical shifts but also the relative integrations and ob-served COSY cross-peaks were considered. The assignmentprocess of the resonances of [Ni(Tp*)(N,O-5,7-Me2-8-hq)](8) in CDCl3 is discussed as a representative example (Fig-ure 1).
In the spectrum of 8, the peak with the largest downfieldshift (δ = 151.3 ppm) has an integration corresponding toone proton, and it could be assigned to HB of the Tp*ligand. The next peak is also shifted downfield (δ =63.2 ppm) and integrates to three protons; thus, it was as-signed to the 4-H of the pyrazolyl rings of the Tp* ligand,which is in accordance with the observed properties of the4-H protons of the pyrazolyl ring in other Ni(TpR1,R2
) com-plexes.[19,20] In all cases, the Tp* arms are magneticallyequivalent in solution. In general, the protons nearest tothe nickel ion exhibit the largest chemical shift as well asthe greatest line broadening. Thus, the 4-H protons fromthe pyrazolyl rings experience the largest downfield shift,between 62 and 68 ppm. This tendency is general for com-plexes that contain hydrotris(3,5-dimethylpyrazolyl)borateligands.[20] The methyl protons that are close to the boronatom (5-Me) are observed between –3.2 and –5.0 ppm.

www.eurjic.org FULL PAPER
Figure 1. 1H NMR spectrum of 8 (in CDCl3 at r.t.).
However, signals of the 3-Me protons that are near thenickel ions are broadened and are shifted from the diamag-netic position to between –9.2 and –11.1 ppm. The assign-ment of the quinolinate signals comes from 2D NMR tech-niques (vide infra). A {1H–1H} COSY spectrum of 2 in themagnitude mode was recorded at 20 °C and shows cross-peaks between resonances at δ = 59.0, 25.0, and 14.2 ppm(Figure 2). These signals can be assigned to 3-H, 4-H, and5-H protons, respectively. The COSY spectrum of 2 alsoshows cross-peaks between resonances at δ = 64.3 and
Figure 2. Portion of the {1H–1H} COSY spectrum of complex 2 (inCDCl3 at 20 °C). Only the relevant region to assign the quinolinateresonances is shown in the top trace.
Eur. J. Inorg. Chem. 2013, 4280–4290 © 2013 Wiley-VCH Verlag GmbH & Co. KGaA, Weinheim4282
59.0 ppm, which can be assigned to the 2-H and 3-H pro-tons, respectively. Furthermore, cross-peaks between reso-nances at δ = –2.1 and –10.9 ppm are observed, which canbe assigned to the 6-H and 7-H protons, respectively. Allassignments are consistent with the {1H–1H} COSY spectraof complexes 5 and 8 (Figures S1 and S2, Supporting Infor-mation). Assignment of the resonances for the quinolinateprotons (5-H and 7-H) was performed (Figure 1) on thebasis of their absence in the spectrum of complex 8 in which5-H and 7-H are substituted by Me groups, as well as inthe spectra of complexes 3, 4 and 5 in which 5-H and 7-Hare substituted by chlorine, bromine, and iodine, respec-tively. In complex 6, 5-H is substituted by a NO2 group.Moreover, the spectrum of complex 7 (Figure 3) shows that2-H is substituted by a signal for the 2-NH2 group (δ =3.5 ppm). If the π contact shift is dominant, an alteration inthe direction of the shift of the phenyl protons is a commonfeature. Therefore, the unpaired electrons could polarize thenet spin density in the dπ orbitals.[21]
Description of the Crystal Structures
Suitable crystals for diffraction studies were obtained byslow diffusion of hexane into chloroform solutions of com-plexes at room temperature. Figures 4, 5, 6, and 7 give thethermal ellipsoids of the structures of 2, 3, 5, and 7. Se-lected bond lengths and angles are listed in Tables 1, 2, 3,and 4.
The nickel atoms in all of the complexes have distortedtrigonal bipyramidal geometry. The nitrogen atoms of theTp* ligands occupy two equatorial positions and one apicalposition. The nitrogen atom of 8-hq occupies the other ax-ial position, and the oxygen atom is in the remaining equa-torial position. The 8-hydroxyquinolinates are bonded inan η2-(N,O) fashion to the nickel centers. Thus, Addison’s
www.eurjic.org FULL PAPER
Figure 3. 1H NMR spectrum of 7 (in CDCl3 at room temperature).
Figure 4. ORTEP drawing of the cation of complex 2 (ellipsoids at50% probability level) with atom-labeling scheme.
Figure 5. ORTEP drawing of the cation of complex 3 (ellipsoids at50% probability level) with atom-labeling scheme.
parameter[22] τ shows values of 0.52 for complex 2 and 0.62for complexes 3, 5, and 7. The Ni–O bond lengths are be-tween 1.946 and 1.983 Å, which is similar to those observedin homoleptic[23] and mixed-ligand complexes.[11] However,the Ni–Nhq bond lengths are between 2.062 and 2.102 Å,
Eur. J. Inorg. Chem. 2013, 4280–4290 © 2013 Wiley-VCH Verlag GmbH & Co. KGaA, Weinheim4283
Figure 6. ORTEP drawing of the cation of complex 5 (ellipsoids at50% probability level) with atom-labeling scheme.
Figure 7. ORTEP drawing of the cation of complex 7 (ellipsoids at50% probability level) with atom-labeling scheme.
which is longer than those observed in homoleptic com-plexes.[23] The N–Ni–O “bite” angles [81.43(8)° for 2,80.17(10)° for 3, 80.2(2)° for 5, and 81.81° for 7] of thechelating 8-hydroxyquinolinates lie in a range that was pre-viously observed.[11] The highest angle of the trigonal bi-

www.eurjic.org FULL PAPER
Table 1. Selected bond lengths [Å] and angles [°] for the XRD andoptimized structures of complex 2.
XRD Optimized
Ni1–N1 2.023(2) 2.049Ni1–N3 2.092(2) 2.105Ni1–N5 2.018(2) 2.077Ni1–N7 2.062(2) 2.137Ni1–O1 1.9726(17) 1.994N1–Ni1–N3 87.37(8) 88.47N1–Ni1–N5 92.16(8) 92.36N1–Ni1–N7 93.13(8) 95.67N1–Ni1–O1 146.60(8) 122.08N3–Ni1–N5 88.49(8) 86.65N3–Ni1–N7 178.00(8) 175.59N3–Ni1–O1 97.10(8) 96.71N5–Ni1–N7 93.43(9) 94.69N5–Ni1–O1 120.94(8) 145.40N7–Ni1–O1 81.43(8) 79.80
Table 2. Selected bond lengths [Å] and angles [°] for the XRD andoptimized structures of complex 3.
XRD Optimized
Ni1–N1 2.004(3) 2.071Ni1–N3 2.083(3) 2.091Ni1–N5 2.026(3) 2.047Ni1–N7 2.090(3) 2.143Ni1–O1 1.983(2) 1.999N1–Ni1–N3 89.31(10) 87.27N1–Ni1–N5 91.14(11) 92.44N1–Ni1–N7 95.63(10) 95.09N1–Ni1–O1 137.15(10) 144.85N3–Ni1–N5 89.59(10) 88.70N3–Ni1–N7 174.42(10) 174.93N3–Ni1–O1 94.44(9) 96.17N5–Ni1–N7 92.90(10) 95.67N5–Ni1–O1 131.48(10) 122.54N7–Ni1–O1 80.17(10) 79.32
Table 3. Selected bond lengths [Å] and angles [°] for the XRD andoptimized structures of complex 5.
XRD Optimized
Ni1–N1 2.025(6) 2.047Ni1–N3 2.088(6) 2.091Ni1–N5 2.024(6) 2.071Ni1–N7 2.102(6) 2.135Ni1–O1 1.968(5) 2.011N1–Ni1–N3 88.9(3) 88.52N1–Ni1–N5 91.6(2) 92.64N1–Ni1–N7 97.3(3) 95.21N1–Ni1–O1 136.2(2) 122.47N3–Ni1–N5 89.3(2) 87.13N3–Ni1–N7 173.1(3) 175.82N3–Ni1–O1 93.3(2) 97.39N5–Ni1–N7 93.6(2) 94.58N5–Ni1–O1 132.2(2) 144.58N7–Ni1–O1 80.2(2) 79.02
pyramidal NTp*–Ni–Nhq is between 173.18 and 178.01° andits value in the complexes varies according to the order of2 � 7 � 3 � 5.
Eur. J. Inorg. Chem. 2013, 4280–4290 © 2013 Wiley-VCH Verlag GmbH & Co. KGaA, Weinheim4284
Table 4. Selected bond lengths [Å] and angles [°] for the XRD andoptimized structures of complex 7.
XRD Optimized
Ni1–N1 2.012(2) 2.078Ni1–N3 2.124(2) 2.134Ni1–N5 2.026(2) 2.064Ni1–N7 2.098(2) 2.167Ni1–O1 1.9460(19) 1.962N1–Ni1–N3 87.44(9) 86.80N1–Ni1–N5 92.11(9) 91.26N1–Ni1–N7 96.50(9) 95.75N1–Ni1–O1 129.10(9) 136.02N3–Ni1–N5 86.70(9) 87.38N3–Ni1–N7 175.95(8) 175.35N3–Ni1–O1 94.97(8) 95.60N5–Ni1–N7 94.09(9) 96.44N5–Ni1–O1 138.78(9) 132.69N7–Ni1–O1 81.81(8) 79.86
Absorption Spectra
The UV/Vis absorption spectra of all the complexes wererecorded in dilute solutions at room temperature, and theluminescence spectra were recorded in the solid state. Themaximum absorption and emission wavelengths are sum-marized in Table 5. The UV/Vis absorption spectra were re-corded in dilute solutions of 1,2-dichloroethane and toluene(ca. 10–4 m) and also in solutions of 10–5 m chloroform atroom temperature. The absorption bands for all studiedcomplexes are listed in Table 5.
The most intense absorption between 266 and 283 nm(DCE) that appears in all compounds arises from the typi-cal band of quinolinates.[24] Moreover, the UV/Vis spectrashow one absorption band between 320 and 355 nm (DCE)with extinction coefficients of 2000–3500 dm3 mol–1 cm–1 as-signed to the π–π* transition. Also, a longer-wavelength ab-sorption at 400–480 nm is attributed to an IL transitionthat is largely associated with a CT from the lone pair ofelectrons of the phenolate donor to the π* orbitals of thepyridine acceptor.[25a] The energy of this ILCT transition(according to Vogler notation)[25b,25c] is dependent on themetal, its oxidation state, additional ligands, or the solventpolarity. In these complexes, solvent effects are very small(the largest shift is 13 nm in 9) relative to the influence ofthe substituent in the quinolinate; in fact, the relative posi-tion of λmax of the lowest-energy absorption is identical inall solvents, and the observed sequence is: 7 � 9 � 2 � 4� 5 � 3 � 6 � 8 � 1. In the quinolinate rings, the presenceof electron-withdrawing groups in the 5,7- positions (i.e., 3,4, 5) or electron-donating groups (i.e., 8), and even a 2-CN (i.e., 1) substituent, induces a bathochromic shift in theabsorption relative to that of unsubstituted derivative 2.Further, 2-NH2 (i.e., 7) or 2-Me (i.e., 9) substituent in thequinolinate causes a blueshift in the absorption with respectto that observed for derivative 2. Moreover, in complex 6the band at 442 nm (DCE) show a large extinction coeffi-cient that is clearly associated with the electronic influenceof the nitro group.[25c]

www.eurjic.org FULL PAPER
Table 5. Electronic absorption data for complexes 1–9 in solutionsat room temperature and the emission data in the solid state atroom temperature.[a]
Complex λmax [nm] (ε, dm3 mol–1 cm–1)
1 DCE 282 (16057), 355 (2273), 482 (1400)CHCl3 258 (24230), 284 (24450), 357 (2360), 475 (2240)TOL 333 (2956 sh), 354 (2608), 479 (3159)emission 561 (375)[b]
2 DCE 266 (23042), 324 (1861), 417 (2440)CHCl3 267 (24720), 336 (2490), 423 (2510)TOL 325 (2060), 341 (1923 sh), 423 (3159)emission 483 (370)[b]
3 DCE 273 (30512), 349 (3308), 433 (3828)CHCl3 274 (37220), 351 (2860), 440 (3640)TOL 336 (2770 sh), 350 (3175), 434 (3784)emission 526 (385)[b]
4 DCE 275 (30607), 349 (3518), 428 (3949)CHCl3 243 (14570), 275 (27523), 350 (3288), 430 (4075)TOL 336 (2800 sh), 350 (3200), 433 (3800)emission 501 (371)[b]
5 DCE 282 (26691), 353 (3535), 431 (3980)CHCl3 241 (20280), 275 (27810), 354 (3110), 432 (3980)TOL 340 (3040 sh), 355 (3360), 436 (3920)emission 515 (370)[b]
6 DCE 267 (17280), 347 (5935), 442 (18482)CHCl3 266 (17750), 346 (6158), 447 (21583)TOL 330 (5973 sh), 341 (6644), 439 (17852)emission 496 (366)[b]
7 DCE 281 (29066), 319 (3269), 401 (2150)CHCl3 240 (22740), 281 (27090), 321 (3150), 410 (2050)TOL 323 (3174), 338 (2222 sh), 409 (2619)emission 458 (320)[b]
8 DCE 274 (20150), 342 (2134), 447 (2036)CHCl3 275 (26240), 348 (2150), 454 (2460)TOL 336 (2773 sh), 350 (2857), 451 (3277)emission 527 (380)[b]
9 DCE 268 (24836), 320 (2044), 406 (2567)CHCl3 240 (25740), 269 (22650), 333 (1690), 419 (2330)TOL 324 (1742), 341 (1666 sh), 413 (3257)emission 492 (364)[b]
[a] sh: shoulder. DCE = 1,2-dichloroethane. TOL = toluene.[b] Number in parentheses is λexc [nm].
Theoretical Approaches
To rationalize the observed influence of the substituentsin the quinolinate (identical in all solvents), we performedsome theoretical calculations. Recently, Ye and Neese[26]
studied the physical origin of the ZFSs (zero-field splittings)in a series of tetracoordinate NiTpX complexes by quantumchemical and ligand-field analysis.
First, structural optimization of the low-lying tripletstates was performed, and then, a frequency calculation wasperformed to check that the optimized structure was indeeda minimum (with no imaginary frequency). As observed inTables 1–4, the optimized distances and angles are in goodagreement with those obtained by XRD. The UV/Vis spec-tra were investigated by TD-DFT on the basis of the opti-mized geometries (Franck–Condon principle). In the Sup-porting Information, Table S1 shows the electronic transi-tion energies and the corresponding oscillator strengths (f),the main configurations, and the configuration interaction(CI) coefficients for complexes 1–9.
Eur. J. Inorg. Chem. 2013, 4280–4290 © 2013 Wiley-VCH Verlag GmbH & Co. KGaA, Weinheim4285
TD-DFT calculations indicate that the absorption exhib-iting the highest CI values correspond to HOMO–LUMOtransitions. Thus, further calculations were performed toidentify the main contributions to the corresponding molec-ular orbitals. Notably, the symmetry for the valence orbitalsis not known, because there was no restriction on the mo-lecular symmetry for the calculations. These restrictionscould lead us to a transition-state minimum and not to areal energy minimum. In a first qualitative analysis, theshape of the frontier orbitals is fairly different. In Figure 8,the most important occupied and empty orbitals for modelsystem 2 can be observed (see Figures S4–S11 in the Sup-porting Information for the most important occupied andempty orbitals for all complexes).
Figure 8. Most important occupied and empty orbitals for modelsystem 2.
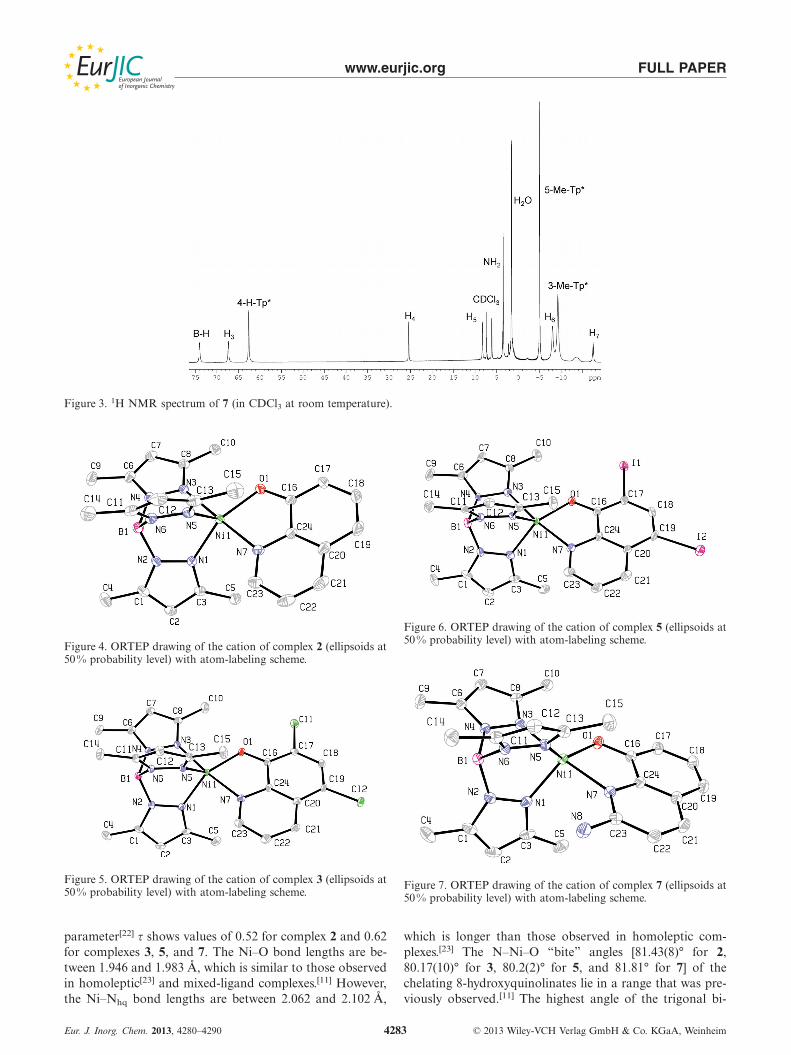
Whereas the HOMO and HOMO–8 are located on thequinolinate ligand (also see Table S2, Supporting Infor-mation), the virtual LUMO and LUMO+1 are located onthe quinolinate with a significant contribution from thenickel atom, and HOMO–9 is a mixed orbital. In Figure 9,the experimental and theoretical absorption spectra of com-plex 2 are shown for comparison, as an example. As ob-served, the TD-DFT prediction of the experimental absorp-tion spectrum matches very well, and from those theoreticalcalculations the assignment of the character of these transi-tions can be proposed. Further, data in Table S2 (Support-ing Information) also show that the main contribution tothe HOMOs can be attributed to the quinolinate ligand,and the values are higher than 34 % in all cases. Further-more, the LUMOs exhibit contributions from the quinolin-
www.eurjic.org FULL PAPER
Figure 9. Theoretical (top) and experimental (bottom) absorption spectra of complex 2 in chloroform.
ate ligand and the metal. This is an outstanding fact, be-cause it clearly indicates the occurrence of both ILCT andLMCT transitions. In fact, the change in the contributionof the metallic d orbitals is significant with values from 13to 50%.
Emission Spectra
The solid-state emission spectra of the complexes wererecorded by placing a uniform layer of powder between twoquartz plates. In the solid state, free rotation is restrictedand energy dissipation through nonradiative channels is re-duced, which causes an enhancement in the emission inten-sity. The complexes emit at room temperature in the 458–561 nm range in the solid state if they are excited at themaximum wavelength of their excitation spectra (Figure 10,Table 5; see also Figure S3, Supporting Information). Usu-ally, the luminescence of quinolinate complexes originatesfrom the quinolinate ILCT state.[27] In addition, modifica-tions to the quinolinate ligand result in changes in the emis-sion wavelengths of the corresponding complexes. As de-picted in Figure 10 and Table 5, the photophysical proper-ties of 1–9 are affected by electron-withdrawing and elec-tron-donating groups, which will be discussed below bymeans of distortion analysis of the coordination spheres.
Eur. J. Inorg. Chem. 2013, 4280–4290 © 2013 Wiley-VCH Verlag GmbH & Co. KGaA, Weinheim4286
Figure 10. Emission spectra of compounds 1, 2, 3, 7, and 9 in thesolid state at room temperature. The emission spectra of all com-plexes are given in Figure S13 in the Supporting Information.
Generally, the highest electron density of 8-hq is locatedon the phenoxide ring. Therefore, it is predicted that anelectron-withdrawing or an electron-donating group at theC-5, C-6, and C-7 positions will lead to a blueshift or aredshift in the absorption and fluorescence spectra. Somereports support this anticipation, for instance, attachmentof an acceptor group such as –CN or a donor group suchas –CH3 at the C-5 position causes a blueshift or a redshift,
www.eurjic.org FULL PAPER
respectively.[28] However, this prediction is not suitable inour cases, for which the emission of the [Ni(Tp*)(N,O-5,7-X2-8-hq)] {X = Cl (3), Br (4), I (5)} and [Ni(Tp*)(N,O-5-NO2-8-hq)] (6) complexes is redshifted with respect to theemission of unsubstituted derivative 2. Furthermore, the[Ni(Tp*)(N,O-5,7-Me2-8-hq)] (8) compound, which haselectron-donating groups, also exhibits emission that is red-shifted. The trend observed for the emission maxima wave-lengths is roughly the sequence that was observed in ab-sorption: 7 � 2 � 9 � 6 � 4 � 5 � 3 � 8 � 1.
Notably, the luminescence of transition-metal complexesis greatly affected by the accessibility of the metal-centeredexcited state through population of empty d orbitals, whichopens efficient channels for nonradiative decay. As we havementioned, the luminescence of quinolinate complexes orig-inates from the quinolinate ILCT state and its quantumyield would be affected by the presence of a d–d metal-centered excited state; however, this is not enough toquench the luminescence completely. This trend was alsoobserved for π–π* and ILCT transitions in nickel(II) com-plexes.[11,12]
As discussed above, TD-DFT calculations indicate thatthe occurrence of LMCT transitions should be consideredto explain the behavior of these compounds. In general, theemission energies are dependent on the substituents of thequinolinate ligand, although other effects can be consideredin relation to the emission in the solid state (see below).
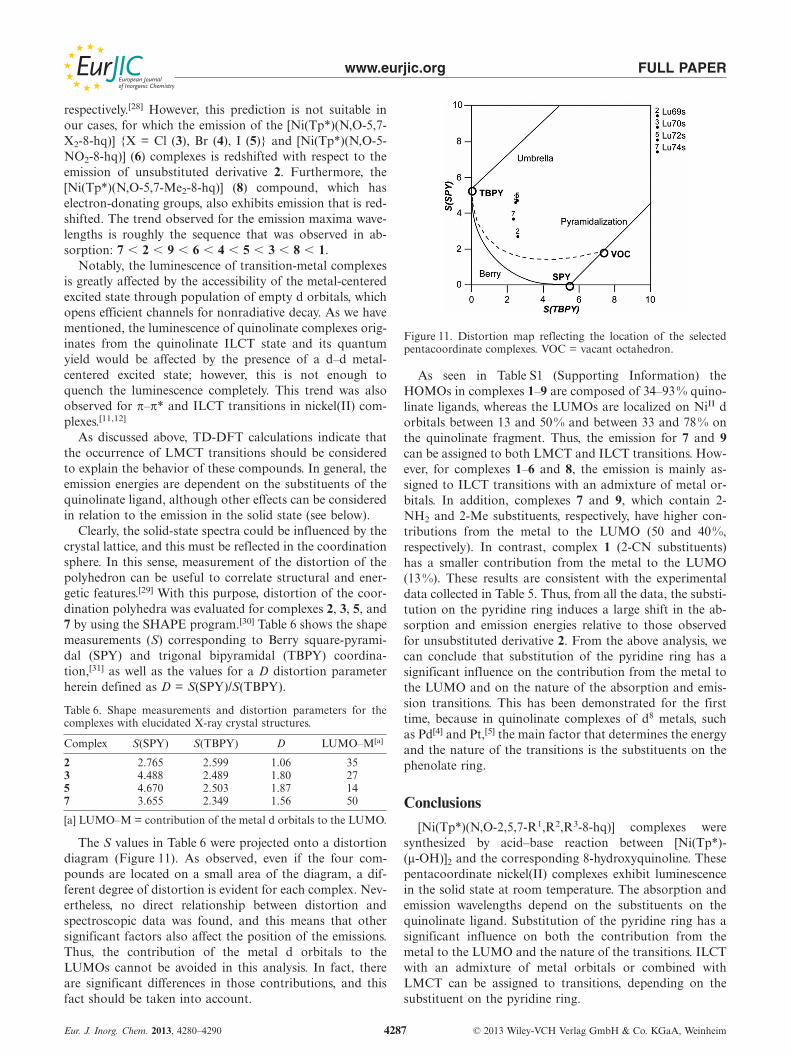
Clearly, the solid-state spectra could be influenced by thecrystal lattice, and this must be reflected in the coordinationsphere. In this sense, measurement of the distortion of thepolyhedron can be useful to correlate structural and ener-getic features.[29] With this purpose, distortion of the coor-dination polyhedra was evaluated for complexes 2, 3, 5, and7 by using the SHAPE program.[30] Table 6 shows the shapemeasurements (S) corresponding to Berry square-pyrami-dal (SPY) and trigonal bipyramidal (TBPY) coordina-tion,[31] as well as the values for a D distortion parameterherein defined as D = S(SPY)/S(TBPY).
Table 6. Shape measurements and distortion parameters for thecomplexes with elucidated X-ray crystal structures.
Complex S(SPY) S(TBPY) D LUMO–M[a]
2 2.765 2.599 1.06 353 4.488 2.489 1.80 275 4.670 2.503 1.87 147 3.655 2.349 1.56 50
[a] LUMO–M = contribution of the metal d orbitals to the LUMO.
The S values in Table 6 were projected onto a distortiondiagram (Figure 11). As observed, even if the four com-pounds are located on a small area of the diagram, a dif-ferent degree of distortion is evident for each complex. Nev-ertheless, no direct relationship between distortion andspectroscopic data was found, and this means that othersignificant factors also affect the position of the emissions.Thus, the contribution of the metal d orbitals to theLUMOs cannot be avoided in this analysis. In fact, thereare significant differences in those contributions, and thisfact should be taken into account.
Eur. J. Inorg. Chem. 2013, 4280–4290 © 2013 Wiley-VCH Verlag GmbH & Co. KGaA, Weinheim4287
Figure 11. Distortion map reflecting the location of the selectedpentacoordinate complexes. VOC = vacant octahedron.
As seen in Table S1 (Supporting Information) theHOMOs in complexes 1–9 are composed of 34–93% quino-linate ligands, whereas the LUMOs are localized on NiII dorbitals between 13 and 50 % and between 33 and 78% onthe quinolinate fragment. Thus, the emission for 7 and 9can be assigned to both LMCT and ILCT transitions. How-ever, for complexes 1–6 and 8, the emission is mainly as-signed to ILCT transitions with an admixture of metal or-bitals. In addition, complexes 7 and 9, which contain 2-NH2 and 2-Me substituents, respectively, have higher con-tributions from the metal to the LUMO (50 and 40%,respectively). In contrast, complex 1 (2-CN substituents)has a smaller contribution from the metal to the LUMO(13 %). These results are consistent with the experimentaldata collected in Table 5. Thus, from all the data, the substi-tution on the pyridine ring induces a large shift in the ab-sorption and emission energies relative to those observedfor unsubstituted derivative 2. From the above analysis, wecan conclude that substitution of the pyridine ring has asignificant influence on the contribution from the metal tothe LUMO and on the nature of the absorption and emis-sion transitions. This has been demonstrated for the firsttime, because in quinolinate complexes of d8 metals, suchas Pd[4] and Pt,[5] the main factor that determines the energyand the nature of the transitions is the substituents on thephenolate ring.
Conclusions
[Ni(Tp*)(N,O-2,5,7-R1,R2,R3-8-hq)] complexes weresynthesized by acid–base reaction between [Ni(Tp*)-(μ-OH)]2 and the corresponding 8-hydroxyquinoline. Thesepentacoordinate nickel(II) complexes exhibit luminescencein the solid state at room temperature. The absorption andemission wavelengths depend on the substituents on thequinolinate ligand. Substitution of the pyridine ring has asignificant influence on both the contribution from themetal to the LUMO and the nature of the transitions. ILCTwith an admixture of metal orbitals or combined withLMCT can be assigned to transitions, depending on thesubstituent on the pyridine ring.

www.eurjic.org FULL PAPER
Experimental SectionGeneral Methods: Infrared spectra were recorded with a Perkin–Elmer 16F PC FTIR spectrophotometer by using Nujol mulls be-tween polyethylene sheets. ESI-MS analyses were performed withan Agilent VL mass spectrometer. The ionization mechanism usedwas electrospray in the negative and positive ion full scan mode byusing methanol/ammonium acetate as the solvent and nitrogen gasfor desolvation. C, H, and N analyses were performed with a CarloErba model EA 1108 microanalyzer. 1H NMR spectra were re-corded with Bruker spectrometers (AC 200E or AC 300E) by usingSiMe4 as a standard. The {1H–1H} COSY spectrum was recordedwith a Bruker 200 MHz spectrometer at 20 °C in CDCl3 solutionwith 512 data points in the F1 dimension and 1024 data points inthe F2 dimension with a delay time of 500 ms for 2, 150 ms for 5,and 25 ms for 8. Experimental parameters were varied to obtainthe best resolution and signal-to-noise ratio. The UV/Vis spectrawere recorded with a UNICAM UV 500 spectrophotometer in the230–800 nm range. Excitation and emission spectra were recordedwith a Jobin Yvon Fluorolog 3-22 spectrofluorometer with a 450 Wxenon lamp, double-grating monochromators, and a TBX-04 pho-tomultiplier.
Materials: All chemicals were purchased from Aldrich and wereused without further purification. Solvents were dried and distilledby general methods before use. The [Ni(Tp*)(μ-OH)]2 complex wasprepared by previously described procedures.[18]
[Ni(Tp*)(N,O-2,5,7-R1,R2,R3–8-hq)]: Complexes 1–9 were preparedby reaction of [Ni(Tp*)(μ-OH)]2 (0.134 mmol) with the corre-sponding substituted 8-hydroxyquinolines [(N,O-2,5,7-R1,R2,R3-8-hq)] (0.268 mmol) in chloroform (30 mL). After stirring for 30 min,the solution was evaporated under reduced pressured, and n-hexanewas added to the solution. The resulting solids were collected byfiltration, washed with n-hexane, and air dried.
[Ni(Tp*)(N,O-2-CN-8-hq)] (1): Yield 84% (118.6 mg, orange).C25H27BN8NiO (525.04): calcd. C 57.19, H 5.18, N 21.34; found:C 56.60, H 4.96, N 20.99. TOF-MS (+): m/z = 525.1837 [M]+. IR(Nujol): ν̃ = 2510 (BH), 2230 (C�N), 1602 (C=C), 1590 (C=N),1545 (C=N), 1305, 1206, 1189, 1065, 1057, 1110, 838, 744, 750,547, 503, 296 (NiO), 270 (NiN) cm–1. 1H NMR (200 MHz, CDCl3):δ = 71.5 (HB-Tp*), 68.7 (3 H, 4-H-Tp*), 66.0 (1 H, 3-H), 24.0 (1H, 4-H), 8.0 (1 H, 4-H), –3.2 (9 H, 5-Me-Tp*), –8.1 (1 H, 4-H),–10.5 (9 H, 3-Me-Tp*), –17.2 (1 H, 7-H) ppm.
[Ni(Tp*)(N,O-8-hq)] (2): Yield 70% (93.9 mg, green-yellowish).C24H28BN7NiO (500.03): calcd. C 57.65, H 5.64, N 19.61; found C57.11, H 5.37, N 19.33. TOF-MS (+): m/z = 500.1885 [M]+. IR(Nujol): ν̃ = 2504 (BH), 1596 (C=N), 1574 (C=C), 1545 (C=N),1468, 1323, 1280, 1204, 1189, 1111, 1062, 1046, 819, 772, 513, 300(NiO), 270 (NiN) cm–1. 1H NMR (200 MHz, CDCl3): δ = 147.5(HB-Tp*), 64.4 (4 H, 2-H + 4-H-Tp*), 59.0 (1 H, 3-H), 25.1 (1 H,4-H), 14.2 (1 H, 5-H), –3.2 (9 H, 5-Me-Tp*), –2.1 (1 H, 6-H), –10.3(9 H, 3-Me-Tp*), –10.9 (1 H, 7-H) ppm.
[Ni(Tp*)(N,O-5,7-Cl2-8-hq)] (3): Yield 76% (115.8 mg, green-yel-lowish). C24H26BCl2N7NiO (568.92): calcd. C 50.67, H 4.61, N17.23; found C 50.72, H 4.42, N 17.17. TOF-MS (+): m/z =568.1105 [M]+. IR (Nujol): ν̃ = 2528 (BH), 1556 (C=N), 1544(C=N), 1488 (C=C), 1247, 1231, 1202, 1192, 1111, 1069, 1056, 889,805, 750, 671, 595, 289 (NiO), 274 (NiN) cm–1. 1H NMR(200 MHz, CDCl3): δ = 142.1 (HB-Tp*), 69.7 (1 H, 2-H), 65.4 (3H, 4-H-Tp*), 56.4 (1 H, 3-H), 24.2 (1 H, 4-H), –3.3 (9 H, 5-Me-Tp*), –9.2 (1 H, 6-H), –10.9 (9 H, 3-Me-Tp*) ppm.
[Ni(Tp*)(N,O-5,7-Br2-8-hq)] (4): Yield 83 % (146.7 mg, green).C24H26BBr2N7NiO (657.82): calcd. C 43.82, H 3.98, N 14.90%;
Eur. J. Inorg. Chem. 2013, 4280–4290 © 2013 Wiley-VCH Verlag GmbH & Co. KGaA, Weinheim4288
found C 43.90, H 3.54, N 14.73. TOF-MS (+): m/z = 657.0108[M]+. IR (Nujol): ν̃ = 2518 = (BH), 1585 (C=N), 1566 (C=C), 1547(C=N), 1254, 1201, 1178, 1108, 1068, 1057, 943, 866, 806, 774, 747,668, 577, 343 (NiO), 272 (NiN) cm–1. 1H NMR (200 MHz, CDCl3):δ = 141.4 (HB-Tp*), 69.7 (1 H, 2-H), 65.4 (3 H, 4-H-Tp*), 56.4 (1H, 3-H), 23.6 (1 H, 4-H), –3.3 (9 H, 5-Me-Tp*), –9.0 (1 H, 6-H),–11.0 (9 H, 3-Me-Tp*) ppm.
[Ni(Tp*)(N,O-5,7-I2-8-hq)] (5): Yield 82% (164.5 mg, dark-green).C24H26BI2N7NiO (751.82): calcd. C 38.34, H 3.49, N 13.04%;found C 38.31, H 2.88, N 12.89. TOF-MS (+): m/z = 751.9817[M]+. IR (Nujol): ν̃ = 2516 = (BH), 1558 (C=N), 1547 (C=N), 1253(C=C), 1200, 1178, 1113, 1066, 1057, 932, 881, 804, 792, 784, 744,666, 565, 328 (NiO), 273 (NiN) cm–1. 1H NMR (200 MHz, CDCl3):δ = 140.1 (HB-Tp*), 69.7 (1 H, 2-H), 65.4 (3 H, 4-H-Tp*), 56.5 (1H, 3-H), 23.6 (1 H, 4-H), –3.3 (9 H, 5-Me-Tp*), –8.8 (1 H, 6-H),–11.0 (9 H, 3-Me-Tp*) ppm.
[Ni(Tp*)(N,O-5-NO2-8-hq)] (6): Yield 87% (127.3 mg, dark-green).C24H27BN8NiO3 (545.03): calcd. C 52.89, H 4.99, N 20.56; foundC 51.91, H 5.18, N 19.85. TOF-MS (+): m/z = 545.1730 [M]+. IR(Nujol): ν̃ = 2511 (BH), 1600 (C=N), 1565 (C=C), 1543 (C=N),1511(NO2), 1414, 1272 (NO2), 1253, 1201, 1184, 1135, 1103, 1062,806, 791, 775, 578, 371 (NiO), 267 (NiN) cm–1. 1H NMR(200 MHz, CDCl3): δ = 142.3 (HB-Tp*), 67.6 (4 H, 2-H + 4-H-Tp*), 56.8 (1 H, 3-H), 18.2 (1 H, 4-H), –1.1 (9 H, 5-Me-Tp*), –2.1(1 H, 6-H), –10.8 (10 H, 7-H + 3-Me-Tp*) ppm.
[Ni(Tp*)(N,O-2-NH2-8-hq)] (7): Yield 84% (115.8 mg, brown).C24H29BN8NiO (515.04): calcd. C 55.97, H 5.68, N 21.28; found C55.73, H 5.68, N 21.76. TOF-MS (+): m/z = 515.1994 [M]+. IR(Nujol): ν̃ = 3395 (NH2), 2505 (BH), 1622 (C=N), 1571 (C=C),1545 (C=N), 1511, 1274, 1199, 1188, 1108, 1062, 1055, 817, 805,769, 609, 519, 296 (NiO), 270 (NiN) cm–1. 1H NMR (200 MHz,CDCl3): δ = 74.0 (HB-Tp*), 67.3 (1 H, 3-H), 62.6 (3 H, 4-H-Tp*),25.4 (1 H, 4-H), 8.3 (1 H, 5-H), –5.0 (9 H, 5-Me-Tp*), 3.5 (2 H, 2-NH), –8.0 (1 H, 6-H), –9.2 (9 H, 3-Me-Tp*), –17.5 (1 H, 7-H) ppm.
[Ni(Tp*)(N,O-5,7-Me2-8-hq)] (8): Yield 80% (113.7 mg, dark-green). C26H32BN7NiO (528.08): calcd. C 59.13, H 6.11, N 18.57;found C 58.86, H 6.29, N 18.48. TOF-MS (+): m/z = 528.2198[M]+. IR (Nujol): ν̃ = 2516 (BH), 1567 (C=N), 1546 (C=N), 1496(C=C), 1325, 1202, 1166, 1132, 1069, 1058, 891, 808, 773, 740, 670,611, 312 (NiO), 265 (NiN) cm–1. 1H NMR (200 MHz, CDCl3): δ= 151.4 (HB-Tp*), 67.4 (1 H, 2-H), 63.2 (3 H, 4-H-Tp*), 61.1 (1H, 3-H), 28.7 (1 H, 4-H), 24.3 (MeB), 4.3 (MeA), –3.9 (9 H, 5-Me-Tp*), –9.3 (1 H, 6-H), –10.6 (9 H, 3-Me-Tp*) ppm.
[Ni(Tp*)(N,O-2-Me-8-hq)] (9): Yield 83% (114 mg, brown).C25H30BN7NiO (514.06): calcd. C 58.41, H 5.88, N 19.07; found C57.64, H 5.96, N 18.84. TOF-MS (+): m/z = 556.1893 [M +HCOO]+. IR (Nujol): ν̃ = 2508 (BH), 1564 (C=N), 1545 (C=N),1506 (C=C), 1280, 1202, 1188, 1112, 1063, 1058, 824, 805, 792,767, 747, 610, 517, 509, 293 (NiO), 271 (NiN) cm–1. 1H NMR(200 MHz, CDCl3): δ = 69.5 (HB-Tp*), 64.2 (1 H, 3-H), 63.5 (3 H,4-H-Tp*), 24.1 (1 H, 4-H), 9.2 (1 H, 5-H), 4.2 (Me), –4.1 (9 H, 5-Me-Tp*), –7.4 (1 H, 6-H), –10.2 (9 H, 3-Me-Tp*), –19.1 (1 H, 7-H) ppm.
X-ray Data Collection and Structure Determination: Diffractiondata were collected with a Bruker Smart Apex diffractometer withgraphite-monochromated Mo-Kα radiation (λ = 0.71073 Å). Thediffraction frames were integrated by using the SAINT package[32]
and corrected for absorption with SADABS.[33] Crystallographicdata are shown in Table 7. The structures were solved by directmethods and refined anisotropically on F2.[34] Hydrogen atomswere introduced in calculated positions.

www.eurjic.org FULL PAPER
Table 7. Crystal data and summary of data collection and refinement for complexes 2, 3, 5, and 7.
Complex 2 3 5 7
Empirical formula C24H28BN7NiO C24H26BCl2N7NiO C24H26BI2N7NiO C24H29BN8NiOM 500.05 568.94 751.84 515.07T [K] 100(2) 100(2) 100(2) 100(2)λ [Å] 0.71073 0.71073 0.71073 0.71073Crystal system triclinic monoclinic monoclinic triclinicSpace group P1̄ P21/a P21/a P1̄a [Å] 7.6860(7) 7.8800(13) 7.9114(8) 7.7582(7)b [Å] 8.0185(7) 37.905(6) 38.784(4) 8.0018(7)c [Å] 22.0245(13) 8.9012(14) 9.1261(9) 21.2350(19)α [°] 79.6030(10) 90 90 90.344(2)β [°] 79.9930(10) 109.842(3) 109.214(2) 95.340(2)γ [°] 64.1470(10) 90 90 113.6820(10)V [Å3] 1194.52(17) 2500.9(7) 2644.2(5) 1200.65(19)Z 2 4 4 2Dcalcd. [g cm–3] 1.390 1.511 1.889 1.425μ [mm–1] 0.844 1.023 3.101 0.843F(000) 522 1176 1464 540θ range [°] 0.95 to 28.70 1.07 to 28.74 1.05 to 28.66 0.96 to 28.66Reflns collected 14756 30447 17495 14769Independent reflns, Rint 5632, 0.0247 6086, 0.0381 6235, 0.0379 5661, 0.0264Goodness-of-fit on F2 1.090 1.171 1.236 1.081R1
[a] [I�2σ(I)] 0.0473 0.0595 0.0665 0.0534wR2
[a] [I� 2σ(I)] 0.1226 0.1330 0.1564 0.1385R1
[a] (all data) 0.0516 0.0653 0.0776 0.0580wR2
[a] (all data) 0.1274 0.1389 0.1655 0.1440Max./min. Δρ [eÅ–3] 0.769/–0.638 0.852/–0.775 2.661/–1.692 0.722/–0.615
[a] R1 = Σ||Fo| – |Fc||/Σ| Fo| for reflections with I � 2σI. wR2 = {Σ[w(Fo2 – Fc
2)2]/Σ[w(Fo2)2]}1/2 for all reflections. w–1 = σ2(F2) + (aP)2 +
bP, in which P = (2Fc2 + Fo
2)/3 and a and b are constants set by the program.
CCDC-886085 (for 2), -886086 (for 3), -886087 (for 5), and -886088(for 7) contain the supplementary crystallographic data for this pa-per. These data can be obtained free of charge from The CambridgeCrystallographic Data Centre via www.ccdc.cam.ac.uk/data_request/cif.
Computational Details: DFT was used for quantum mechanical cal-culations on derivatives 1–9. All calculations were performed withthe unrestricted (U)B3LYP[35] functional and a generic basis setdef2-SVP[36] for all atoms by using the Gaussian 09W software.[37]
The B3LYP functional has been reported to be highly reliable forthese types of calculations.[11,38,39] The obtained energies are shownin the Supporting Information.
Supporting Information (see footnote on the first page of this arti-cle): {1H–1H} COSY spectrum of complex 5, excitation spectra for1–9 in the solid state, single-electron transitions according to TD-DFT calculations for 1–9, electronic transitions energies of 1–9 cal-culated by B3LYP/Def2-SVP, energies and percent compositions offrontier molecular orbitals.
Acknowledgments
This work was financially supported by the Fundación Séneca de laRegión de Murcia (project 08670/PI/08), Ministerio de Educación yCiencia (MEC) (project CTQ2008-02767/BQU), Ministerio de Ci-encia e Innovación (MICINN) (MAT2010-15375), andGobierno Vasco (Grupos Consolidados IT-177-07), which wegratefully acknowledge. UPV/EHU SGIker technical support(MEC, GV/EJ, European Social Fund) is gratefully acknowledged.A. C.-C. thanks the University of the Basque Country (UPV/EHU)for the contract corresponding to Contratación de Doctores Re-cientes. L. L.-B. thanks the Fundación Séneca de la Región deMurcia for an FPI grant.
Eur. J. Inorg. Chem. 2013, 4280–4290 © 2013 Wiley-VCH Verlag GmbH & Co. KGaA, Weinheim4289
[1] a) H. Zhang, L.-F. Han, K. A. Zachariasse, Y.-B. Jiang, Org.Lett. 2005, 7, 4217–4220; b) L. Zhang, E. Meggers, J. Am.Chem. Soc. 2005, 127, 74–75; c) P. Jiang, Z. Guo, Coord. Chem.Rev. 2004, 248, 205–229; d) F. Z. Zelder, J. Brunner, R. Krämer,Chem. Commun. 2004, 902–903; e) B. Valeur, I. Leray, Coord.Chem. Rev. 2000, 205, 3–40; f) K. Soroka, R. S. Vithanage,D. A. Phillips, B. Walker, P. K. Dagupta, Anal. Chem. 1987, 59,629–636.
[2] a) E. Bardez, I. Devol, B. Larrey, B. Valeur, J. Phys. Chem. B1997, 101, 7786–7793; b) C. W. Tang, S. A. Vanslyke, Appl.Phys. Lett. 1987, 51, 913–915.
[3] a) C. H. Chen, J. M. Shi, Coord. Chem. Rev. 1998, 171, 161–174; b) V. A. Montes, G. Li, R. Pohl, J. Shinar, P. Anzenbacher,Adv. Mater. 2004, 16, 2001–2003; c) S. Kappaun, S. Rente-nberger, A. Pogantsch, E. Zojer, K. Mereiter, G. Trimmel,Chem. Mater. 2006, 18, 3539–3547; d) M. D. Shults, B. Imperi-ali, J. Am. Chem. Soc. 2003, 125, 14248–14249; e) M. D. Shults,D. A. Pearce, B. Imperiali, J. Am. Chem. Soc. 2003, 125, 10591–10597; f) F. Launay, V. Alain, E. Destandau, N. Ramos, E.Bardez, P. Baret, J.-L. Pierre, New J. Chem. 2001, 25, 1269–1280; g) J. K. Winkler, C. M. Bowen, V. Michelet, J. Am. Chem.Soc. 1998, 120, 3237–3242; h) M. Hayashi, M. Ishii, K. Hirat-ani, K. Saigo, Tetrahedron Lett. 1998, 39, 6215–6218; i) P. Ba-ret, C. G. Béguin, H. Boukhalfa, C. Caris, J.-P. Laulhère, J.-L.Pierre, G. Serratrice, J. Am. Chem. Soc. 1995, 117, 9760–9761.
[4] M. Ghedini, I. Aiello, M. La Deda, A. Grisolia, Chem. Com-mun. 2003, 2198–2199.
[5] N. M. Shavaleev, H. Adams, J. Best, R. Edge, S. Navaratnam,J. A. Weinstein, Inorg. Chem. 2006, 45, 9410–9415.
[6] a) J. Sykora, J. Sima, in: Photochemistry of Coordination Com-pounds, Elsevier, Amsterdam, 1990; b) V. Balzani, F. Scandola,Supramolecular Photochemistry, Horwood, Chichester, 1991.
[7] P. de Silva, H. Q. N. Gunaratne, T. Gunnalaugsson, A. J. M.Huxley, C. P. McCoy, J. T. Rademacher, T. E. Rice, Chem. Rev.1997, 97, 1515–1566.

www.eurjic.org FULL PAPER
[8] a) K. A. Van Houten, D. C. Heath, C. A. Barringer, A. L.Rheingold, R. S. Pilato, Inorg. Chem. 1998, 37, 4647–4653; b)F. Barigelletti, D. Sandrini, M. Maestri, V. Balzani, A.von Zelewsky, L. Chassot, P. Jolliet, U. Maeder, Inorg. Chem.1988, 27, 3644–3647; c) Q. Wu, A. Hook, S. Wang, Angew.Chem. 2000, 112, 4094–4096; Angew. Chem. Int. Ed. 2000, 39,3933–3935; d) D. Song, Q. Wu, A. Hook, I. Kozin, S. Wang,Organometallics 2001, 20, 4683–4689.
[9] a) A. S. Ionkin, W. J. Marshall, Y. Wang, Organometallics 2005,24, 619–627; b) I. R. Laskar, S. F. Hsu, T. M. Chen, Polyhedron2005, 24, 881–888; c) S. W. Thomas III, S. Yagi, T. M. Swager,J. Mater. Chem. 2005, 15, 2829–2835; d) W.-Y. Wong, Z. He,S.-K. So, K.-L. Tong, Z. Lin, Organometallics 2005, 24, 4079–4082.
[10] a) S. J. Farley, D. L. Rochester, A. L. Thompson, J. A. K. How-ard, J. A. G. Williams, Inorg. Chem. 2005, 44, 9690–9703; b)J. F. Michalec, S. A. Bejune, D. G. Cuttell, G. C. Summerton,J. A. Gertenbach, J. S. Field, R. J. Haines, D. R. McMillin, In-org. Chem. 2001, 40, 2193–2200; c) J. F. Michalec, S. A. Bejune,D. R. McMillin, Inorg. Chem. 2000, 39, 2708–2709.
[11] M. D. Santana, R. García-Bueno, G. García, J. Pérez, L.García, M. Monge, A. Laguna, Dalton Trans. 2010, 39, 1797–1806.
[12] a) Z.-Q. Zhang, R.-D. Huang, L.-J. Dong, Y.-Q. Xu, L.-Q. Yu,Z.-W. Jiao, C.-W. Hu, Inorg. Chim. Acta 2009, 362, 3056–3064;b) S. Naskar, S. Naskar, R. J. Butcher, S. K. Chattopadhyay,Inorg. Chim. Acta 2010, 363, 3641–3646; c) M. Schnuriger, E.Tague, M. M. Richter, Inorg. Chim. Acta 2011, 379, 158–162;d) C. R. Bhattacharjee, G. Das, P. Mondal, Eur. J. Inorg. Chem.2011, 5390–5396; e) M. Barwiolek, E. Szlyk, T. M. Muzioł, T.Lis, Dalton Trans. 2011, 40, 11012–11022; f) J.-Y. Xu, C.-Z.Xie, F. Xue, L.-F. Hao, Z.-Y. Ma, D.-Z. Liao, S.-P. Yan, DaltonTrans. 2010, 39, 7159–7166; g) S. Dalai, A. Rana, M. Bera,D. S. Chowdhuri, E. Zangrando, Inorg. Chim. Acta 2010, 363,1843–1848.
[13] S. Trofimenko, Chem. Rev. 1993, 93, 943–980.[14] Y.-J. Sun, W.-Z. Shen, P. Cheng, S.-P. Yan, D.-Z. Liao, Z.-H.
Jiang, P.-W. Shen, Polyhedron 2004, 23, 211–218.[15] a) M. D. Santana, G. Garcia, J. Perez, E. Molins, G. Lopez,
Inorg. Chem. 2001, 40, 5701–5703; b) M. D. Santana, G.García, C. M. Navarro, A. A. Lozano, J. Pérez, L. García,Polyhedron 2002, 21, 1935–1942; c) M. D. Santana, G. García,A. A. Lozano, G. López, J. Tudela, J. Perez, Chem. Eur. J. 2004,10, 1738–1746; d) M. D. Santana, A. A. Lozano, G. García, G.López, J. Pérez, Dalton Trans. 2005, 104–109; e) J. Ruiz, M. D.Santana, A. Lozano, C. Vicente, G. García, G. López, Eur. J.Inorg. Chem. 2005, 3049.3056; f) A. A. Lozano, M. Sáez, J.Pérez, L. García, L. Lezama, T. Rojo, G. López, G. García,M. D. Santana, Dalton Trans. 2006, 3906–3911.
[16] a) L. López-Banet, M. D. Santana, G. García, L. García, J.Pérez, T. Rojo, L. Lezama, J.-P. Costes, Inorg. Chem. 2011, 50,437–443; b) J. Pérez, L. García, R. Carrascosa, E. Pérez, J. L.Serrano, G. Sánchez, G. García, M. D. Santana, L. López, J.García, Z. Anorg. Allg. Chem. 2007, 633, 1869–1874.
[17] M. Akita, K. Ohta, Y. Yakamashi, S. Hikichi, Y. Moro-oka,Organometallics 1997, 16, 4121–4128.
[18] M. D. Santana, L. López-Banet, G. García, L. García, J. Pérez,M. Liu, Eur. J. Inorg. Chem. 2008, 4012–4018.
[19] S. Hikichi, M. Yoshizawa, Y. Sasakura, H. Komatsuzaki, Y.Moro-oka, M. Akita, Chem. Eur. J. 2001, 7, 5011–5028.
[20] N. Kitajima, S. Hikichi, M. Tanaka, Y. Moro-oka, J. Am.Chem. Soc. 1993, 115, 5496–5508.
[21] I. Bertini, C. Luchinat, G. Parigi, in: Solution NMR of Para-magnetic Molecules – Applications to Metallobiomolecules andModels, Elsevier, Amsterdam, 2001, p. 29.
[22] A. W. Addison, T. N. Rao, J. Reedijk, J. V. Rijn, G. C. Ver-schoor, J. Chem. Soc., Dalton Trans. 1984, 1349–1356.
Eur. J. Inorg. Chem. 2013, 4280–4290 © 2013 Wiley-VCH Verlag GmbH & Co. KGaA, Weinheim4290
[23] H. Zhong, X.-R. Zeng, Y.-Q. Liu, Q.-Y. Luo, Acta Crystallogr.,Sect. E 2007, 63, M187–M189.
[24] W. E. Ohnesorge, L. B. Rogers, Spectrochim. Acta 1959, 14, 27.[25] a) H. Kunkely, A. Vogler, Chem. Phys. Lett. 2003, 376, 226 and
references cited therein; b) A. Vogler, H. Kunkely, Inorg. Chim.Acta 1981, 23, 4220; c) A. S. Kappaun, S. Sax, S. Eder, K. C.Möller, K. Waich, F. Niedermair, R. Saf, K. Mereiter, J. Jacob,K. Müllen, E. J. W. List, C. Slugovc, Chem. Mater. 2007, 19,1209–1221.
[26] S. Ye, F. Neese, J. Chem. Theory Comput. 2012, 8, 2344–2351.[27] a) A. Strasser, A. Vogler, Inorg. Chim. Acta 2004, 357, 2345–
2348; b) H. Kunkely, A. Vogler, Inorg. Chim. Acta 2009, 362,196–198; c) E. Bardez, I. Devol, B. Larrey, B. Valeur, J. Phys.Chem. B 1997, 101, 7786–7793.
[28] L. S. Sapochak, A. Padmaperuma, N. Washton, F. Endrino,G. T. Schmett, J. Marshall, D. Fogerty, P. E. Burrows, S. R.Forrest, J. Am. Chem. Soc. 2001, 123, 6300–6307.
[29] J. Pérez, R. Carrascosa, L. García, G. Barandika, A. Calderón-Casado, E. Pérez, J. L. Serrano, M. D. Santana, Dalton Trans.2011, 40, 9504–9511.
[30] M. Llunel, D. Casanova, J. Cirera, J. M. Bofill, P. Alemany, S.Álvarez, M. Pinsky, D. Yatunir, SHAPE, v. 1.1a, Program forContinuous Shape Measure Calculations of Polyhedral Xn andMLn Fragments, 2003.
[31] S. Álvarez, P. Alemany, D. Casanova, J. Cirera, M. Llunell, D.Avnir, Coord. Chem. Rev. 2005, 249, 1693–1708.
[32] SAINT, v. 6.22, Bruker AXS, Inc.[33] G. M. Sheldrick, SADABS, University of Göttingen, Germany,
1996.[34] G. M. Sheldrick, SHELX-97: Programs for Crystal Structure
Analysis (Release 97–2), University of Göttingen, Germany,1998.
[35] a) A. D. Becke, Phys. Rev. A 1988, 38, 3098–3100; b) A. D.Becke, J. Chem. Phys. 1993, 98, 5648–5652; c) C. Lee, W. Yang,R. G. Parr, Phys. Rev. B 1988, 37, 785–789.
[36] a) D. Feller, J. Comput. Chem. 1996, 17, 1571–1586; b) K. L.Schuchardt, B. T. Didier, T. Elsethagen, L. Sun, V. Gurumoor-thi, J. Chase, J. Li, T. L. Windus, J. Chem. Inf. Model. 2007,47, 1045–1052.
[37] M. J. Frisch, G. W. Trucks, H. B. Schlegel, G. E. Scuseria,M. A. Robb, J. R. Cheeseman, G. Scalmani, V. Barone, B.Mennucci, G. A. Petersson, H. Nakatsuji, M. Caricato, X. Li,H. P. Hratchian, A. F. Izmaylov, J. Bloino, G. Zheng, J. L. Son-nenberg, M. Hada, M. Ehara, K. Toyota, R. Fukuda, J. Hase-gawa, M. Ishida, T. Nakajima, Y. Honda, O. Kitao, H. Nakai,T. Vreven, J. A. Montgomery Jr., J. E. Peralta, F. Ogliaro, M.Bearpark, J. J. Heyd, E. Brothers, K. N. Kudin, V. N. Starov-erov, T. Keith, R. Kobayashi, J. Normand, K. Raghavachari,A. Rendell, J. C. Burant, S. S. Iyengar, J. Tomasi, M. Cossi, N.Rega, J. M. Millam, M. Klene, J. E. Knox, J. B. Cross, V.Bakken, C. Adamo, J. Jaramillo, R. Gomperts, R. E. Strat-mann, O. Yazyev, A. J. Austin, R. Cammi, C. Pomelli, J. W.Ochterski, R. L. Martin, K. Morokuma, V. G. Zakrzewski,G. A. Voth, P. Salvador, J. J. Dannenberg, S. Dapprich, A. D.Daniels, O. Farkas, J. B. Foresman, J. V. Ortiz, J. Cioslowski,D. J. Fox, Gaussian 09, revision B.01, Gaussian, Inc., Wall-ingford, CT, 2010.
[38] G.-C. Ou, Z.-Z. Wang, L.-Z. Yang, C.-Y. Zhao, T.-B. Lu, Dal-ton Trans. 2010, 39, 4274–4279.
[39] a) D. Jacquemin, V. Wathelet, E. A. Perpète, C. Adamo, J.Chem. Theory Comput. 2009, 5, 2420–2435; b) X. Zhou, Q.-J.Pan, B.-H. Xia, M.-X. Li, H.-X. Zhang, A.-C. Tung, J. Phys.Chem. A 2007, 111, 5465–5472.
Received: March 13, 2013Published Online: June 21, 2013

![Tris(acetonitrile-κ N ){2,6-bis[(diphenylphosphanyl)amino]-4-ethoxy-1,3,5-triazine-κ 3 P , N 1 , P ′}iron(II) bis(tetrafluoridoborate) acetonitrile disolvate](https://static.fdokumen.com/doc/165x107/6323aaae03238a9ff60a8974/trisacetonitrile-k-n-26-bisdiphenylphosphanylamino-4-ethoxy-135-triazine-k.jpg)