
Critical STEP Advances for Sustainable Iron Production - The ...
16
1 ELECTRONIC SUPPLEMENTARY INFORMATION FOR PUBLICATION Critical STEP Advances for Sustainable Iron Production Baochen Cui a and Stuart Licht, *a a Department of Chemistry, George Washington University, Washington, DC 20052, USA. CORRESPONDING AUTHOR EMAIL ADDRESS: [email protected] Expanded introduction, methodology details, and electrochemical parameter optimization Along with control of fire and the production of cement, the carbothermal reduction of iron is one of the founding technological pillars of civilization. Yet, it is also one of the major global sources of greenhouse gas release, and a CO 2 –free process to form this staple is needed. Hematite, Fe 2 O 3 , and magnetite, Fe 3 O 4 , are the principal ores currently used for the widespread carbothermal industrial production of iron. Introduced in 2010, STEP Iron produces iron without carbon dioxide emission through a new chemistry consisting of the electrochemical reduction of the unexpected, high solubility of Fe 2 O 3 and Fe 3 O 4 in molten lithiated carbonates. 1 This electronic supplementary information systematically characterizes the critical electrochemistry of STEP Iron, to provide high coulombic efficiency (approaching a 100% yield of the 3 e- reduction of Fe 2 O 3 ), low electrolysis potential and kinetically facile electron transfer to provide high rate. The electronic supplementary information provides a consistent analytical methodology to access iron purity, as well as specific, useful cathode, anode and electrolyte configurations to sustainably and effectively produce iron without greenhouse gas emissions. The electrolytic formation of energetic materials dates back to the first splitting of water to hydrogen and oxygen in 1801 and the discovery of the element potassium by Lavosier in 1807. By the 1900’s the decrease in standard electrochemical potential (unit activity) with increasing temperature of a variety of half reactions was well established, ESI-1 and by the 1980’s investigators such as Bockris ESI-2 suggested the use of thermal energy, including via nuclear or solar energy, to decrease the electrolysis potential required to drive water splitting. Solar splitting at elevated temperatures combines elements of solid state physics, insolation (solar radiation reaching a given area) and electrochemical theory, complicating any rigorous theoretical support of the process. In 2002, we derived the first rigorous theory that a solar photon contains sufficient thermal and electronic energy to efficiently split water by electrolysis. ESI-3 This led in 2003 to the first experimental demonstration that a single semiconductor with a bandgap of less than the electrochemical potential to split water (E° H2O (25°C) = 1.23V), such as silicon (E bandgap = 1.1 V), can directly drive solar water splitting (in molten hydroxide) by applying the excess solar thermal energy (not used by the silicon). ESI-4 The 2002 theory and experiment was generalized, from water splitting and hydrogen fuel formation, to all endothermic electrochemical processes in 2009 with the acronym STEP. 1 STEP and conventional iron chemistries. Commercial iron today continues to be produced by the millennia old carbothermal process. In the carbothermal process iron oxide is reduced by carbon. The carbothermal process releases the greenhouse gas, CO 2 , for example in the 3 electron reduction of Fe(III), accompanied by the 4 electron oxidation of carbon, as illustrated on the left side of Figure 1. 2Fe 2 O 3 + 3C 4Fe + 3CO 2 H 298 = 466.4 kJ/mol (1) This Fe 2 O 3 reduction reaction is endothermic. To sustain this reaction, heat, H, is provided by the burning of over one additional carbon, with concurrent release of further carbon dioxide: C + O 2 CO 2 H 298 = -393.5 kJ/mol (2) Alternatively, iron oxide can be electrolyzed, producing iron metal and evolving only oxygen, without carbon dioxide release. For example via: Fe 2 O 3 2Fe + 3/2O 2 ; E°(25°, 750°C or 1000°C) = 1.28 V, 0.96 V, or 0.85 V (3) Fe 3 O 4 3Fe + 2O 2 ; E°(25°, 750°C or 1000°C) = 1.32 V or 1.01V, 0.92 V (4) STEP and conventional carbon footprint. No CO 2 is released in this STEP process when the heat and electronic charge is generated by renewable energy (solar, wind, hydro, geothermal) or nuclear energy. Alternatively, we can calculate the CO 2 release when fossil fuels are used to form the electricity. As demonstrated in this study, iron may be formed at an electrolysis potential of as little as 0.9V in molten as Li 2 CO 3 . In Equation iii, the room temperature rest potential (calculated from the free energy of the reaction) is 1.28 V and the thermoneutral potential (calculated from the enthalpy of the reaction) is 1.43 V. The latter voltage is the energy required to prevent the system from cooling during electrolysis, and unlike the endothermic rest potential, is nearly constant with changing temperature, for example, E thermoneutral (1200°C) = 1.40 V, and from Equation iii requires 6 Faraday per mole of iron. This is equivalent to 0.225 kWh / mol Fe (from F = 96,485 A sec, and 1 kW=1000 VA), and will be less if an alternate heat source is used to maintain the system electrolysis temperature. Currently, fossil fuels release ~11 mol CO 2 / kWh; specifically the natural gas, oil, and coal generation of electricity have respective stack emissions of 7.5, 12 and 15 mol CO 2 / kWh. Hence, even if fossil fuel, rather than renewable energy, is used to generate the heat and electricity and heat for iron by electrolysis, it will only emit 0.225 x 11 = 2.5 CO 2 per Fe generated. This is less than the 7 CO 2 per Fe emitted by the existing iron smelting processes. In summary: Iron generation Process CO 2 emitted per Fe generated conventional smelting 7 new Li 2 CO 3 electrolysis powered by fossil fuel electricity 2.5 STEP Li 2 CO 3 (solar) electrolysis 0 Eqs. 2 and 3 endothermic, that is the energy (expressed here as the electrochemical potential) required to convert iron oxide to iron decreases with increasing temperature. The range of 500 to 950 °C provides an ideal range for the electrolysis to occur at low potential and without the materials constraints and instabilities imposed by higher temperature operating conditions. We had recently discovered that the lithiation of iron oxides facilitates their concentrated dissolution in molten carbonates. Electronic Supplementary Material (ESI) for Green Chemistry This journal is © The Royal Society of Chemistry 2013
-
Upload
khangminh22 -
Category
Documents
-
view
0 -
download
0
Transcript of Critical STEP Advances for Sustainable Iron Production - The ...
1
ELECTRONIC SUPPLEMENTARY INFORMATION FOR PUBLICATION
Critical STEP Advances for Sustainable Iron Production Baochen Cuia and Stuart Licht, *a
aDepartment of Chemistry, George Washington University, Washington, DC 20052, USA.
CORRESPONDING AUTHOR EMAIL ADDRESS: [email protected]
Expanded introduction, methodology details, and electrochemical parameter optimization
Along with control of fire and the production of cement, the carbothermal reduction of iron is one of the founding
technological pillars of civilization. Yet, it is also one of the major global sources of greenhouse gas release, and a CO2–free
process to form this staple is needed. Hematite, Fe2O3, and magnetite, Fe3O4, are the principal ores currently used for the
widespread carbothermal industrial production of iron. Introduced in 2010, STEP Iron produces iron without carbon dioxide
emission through a new chemistry consisting of the electrochemical reduction of the unexpected, high solubility of Fe2O3 and
Fe3O4 in molten lithiated carbonates.1 This electronic supplementary information systematically characterizes the critical
electrochemistry of STEP Iron, to provide high coulombic efficiency (approaching a 100% yield of the 3 e- reduction of
Fe2O3), low electrolysis potential and kinetically facile electron transfer to provide high rate. The electronic supplementary
information provides a consistent analytical methodology to access iron purity, as well as specific, useful cathode, anode and electrolyte configurations to sustainably and effectively produce iron without greenhouse gas emissions.
The electrolytic formation of energetic materials dates back to the first splitting of water to hydrogen and oxygen in
1801 and the discovery of the element potassium by Lavosier in 1807. By the 1900’s the decrease in standard electrochemical
potential (unit activity) with increasing temperature of a variety of half reactions was well established,ESI-1 and by the 1980’s
investigators such as BockrisESI-2 suggested the use of thermal energy, including via nuclear or solar energy, to decrease the
electrolysis potential required to drive water splitting. Solar splitting at elevated temperatures combines elements of solid
state physics, insolation (solar radiation reaching a given area) and electrochemical theory, complicating any rigorous
theoretical support of the process. In 2002, we derived the first rigorous theory that a solar photon contains sufficient thermal
and electronic energy to efficiently split water by electrolysis.ESI-3 This led in 2003 to the first experimental demonstration that a single semiconductor with a bandgap of less than the electrochemical potential to split water (E°H2O(25°C) = 1.23V),
such as silicon (Ebandgap = 1.1 V), can directly drive solar water splitting (in molten hydroxide) by applying the excess solar
thermal energy (not used by the silicon).ESI-4 The 2002 theory and experiment was generalized, from water splitting and hydrogen fuel formation, to all endothermic electrochemical processes in 2009 with the acronym STEP.1
STEP and conventional iron chemistries. Commercial iron today continues to be produced by the millennia old
carbothermal process. In the carbothermal process iron oxide is reduced by carbon. The carbothermal process releases the
greenhouse gas, CO2, for example in the 3 electron reduction of Fe(III), accompanied by the 4 electron oxidation of carbon,
as illustrated on the left side of Figure 1.
2Fe2O3 + 3C 4Fe + 3CO2 H298 = 466.4 kJ/mol (1)
This Fe2O3 reduction reaction is endothermic. To sustain this reaction, heat, H, is provided by the burning of over one
additional carbon, with concurrent release of further carbon dioxide:
C + O2 CO2 H298 = -393.5 kJ/mol (2)
Alternatively, iron oxide can be electrolyzed, producing iron metal and evolving only oxygen, without carbon dioxide
release. For example via:
Fe2O3 2Fe + 3/2O2; E°(25°, 750°C or 1000°C) = 1.28 V, 0.96 V, or 0.85 V (3)
Fe3O4 3Fe + 2O2; E°(25°, 750°C or 1000°C) = 1.32 V or 1.01V, 0.92 V (4)
STEP and conventional carbon footprint. No CO2 is released in this STEP process when the heat and electronic charge is
generated by renewable energy (solar, wind, hydro, geothermal) or nuclear energy. Alternatively, we can calculate the CO2
release when fossil fuels are used to form the electricity. As demonstrated in this study, iron may be formed at an electrolysis
potential of as little as 0.9V in molten as Li2CO3. In Equation iii, the room temperature rest potential (calculated from the free
energy of the reaction) is 1.28 V and the thermoneutral potential (calculated from the enthalpy of the reaction) is 1.43 V. The
latter voltage is the energy required to prevent the system from cooling during electrolysis, and unlike the endothermic rest
potential, is nearly constant with changing temperature, for example, Ethermoneutral(1200°C) = 1.40 V, and from Equation iii
requires 6 Faraday per mole of iron. This is equivalent to 0.225 kWh / mol Fe (from F = 96,485 A sec, and 1 kW=1000 VA),
and will be less if an alternate heat source is used to maintain the system electrolysis temperature. Currently, fossil fuels
release ~11 mol CO2 / kWh; specifically the natural gas, oil, and coal generation of electricity have respective stack
emissions of 7.5, 12 and 15 mol CO2 / kWh. Hence, even if fossil fuel, rather than renewable energy, is used to generate the
heat and electricity and heat for iron by electrolysis, it will only emit 0.225 x 11 = 2.5 CO2 per Fe generated. This is less than
the 7 CO2 per Fe emitted by the existing iron smelting processes. In summary:
Iron generation Process CO2 emitted per Fe generated
conventional smelting 7
new Li2CO3 electrolysis powered by fossil fuel electricity 2.5
STEP Li2CO3 (solar) electrolysis 0
Eqs. 2 and 3 endothermic, that is the energy (expressed here as the electrochemical potential) required to convert iron oxide
to iron decreases with increasing temperature. The range of 500 to 950 °C provides an ideal range for the electrolysis to occur
at low potential and without the materials constraints and instabilities imposed by higher temperature operating conditions.
We had recently discovered that the lithiation of iron oxides facilitates their concentrated dissolution in molten carbonates.
Electronic Supplementary Material (ESI) for Green ChemistryThis journal is © The Royal Society of Chemistry 2013
2
Both hematite, Fe2O3, and magnetite, Fe3O4, are highly soluble in molten lithiated carbonates.1,11 We have observed a high
solubility for both lower temperature eutectic carbonate melts (Li0.87Na0.63K0.50CO3), and for pure Li2CO3, (pure Li2CO3
melts at 723°C). In Li2CO3, ferric, [Fe(III)], solubility increases from 7 to 12 molal (molal = m moles per / kg Li2CO3) with
temperature increase from 750 to 900°C, while in the eutectic the solubility increases from 1 to 4 m Fe(III) as temperature increases from 550°C to 900°C.
Lithium oxide is not consumed in the iron making process. For Fe2O3 in molten carbonate, the STEP iron production
mechanism is given by:1
I dissolution in molten carbonate Fe2O3 + Li2O 2LiFeO2 (5)
II electrolysis, Li2O regeneration: 2LiFeO2 2Fe+ Li2O + 3/2O2 (6)
III net reaction, same as equation 3.
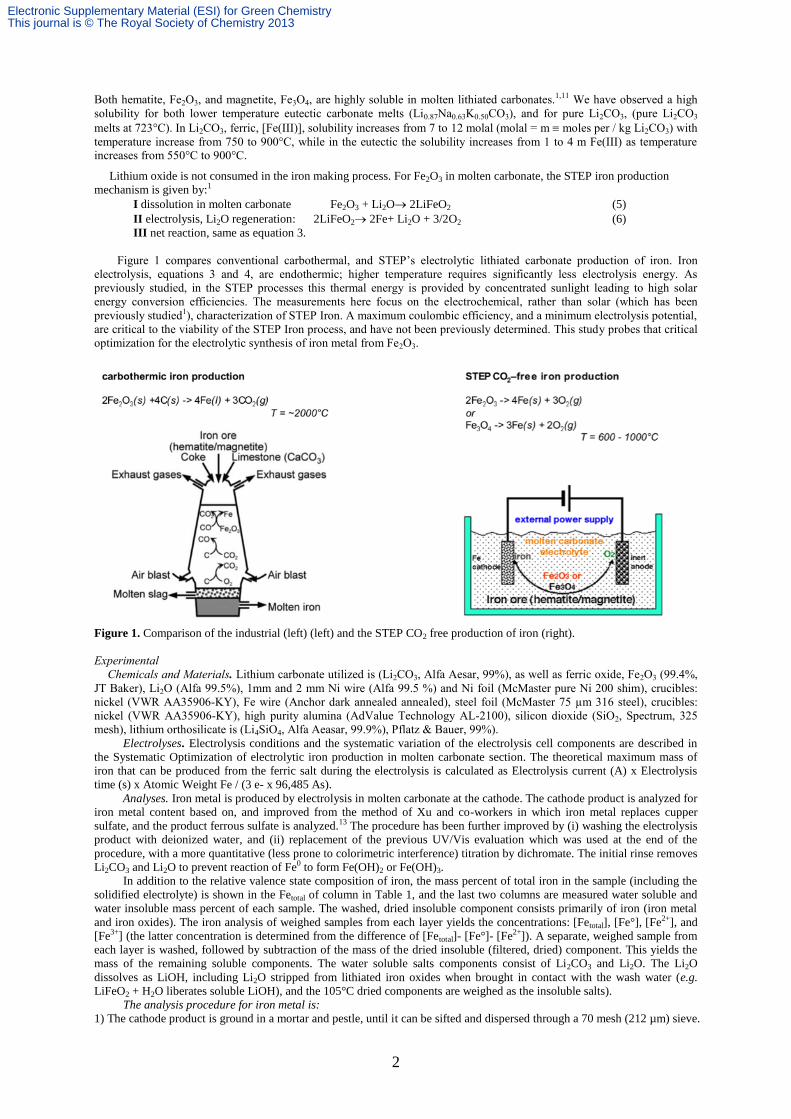
Figure 1 compares conventional carbothermal, and STEP’s electrolytic lithiated carbonate production of iron. Iron
electrolysis, equations 3 and 4, are endothermic; higher temperature requires significantly less electrolysis energy. As
previously studied, in the STEP processes this thermal energy is provided by concentrated sunlight leading to high solar
energy conversion efficiencies. The measurements here focus on the electrochemical, rather than solar (which has been
previously studied1), characterization of STEP Iron. A maximum coulombic efficiency, and a minimum electrolysis potential,
are critical to the viability of the STEP Iron process, and have not been previously determined. This study probes that critical
optimization for the electrolytic synthesis of iron metal from Fe2O3.
Figure 1. Comparison of the industrial (left) (left) and the STEP CO2 free production of iron (right).
Experimental
Chemicals and Materials. Lithium carbonate utilized is (Li2CO3, Alfa Aesar, 99%), as well as ferric oxide, Fe2O3 (99.4%,
JT Baker), Li2O (Alfa 99.5%), 1mm and 2 mm Ni wire (Alfa 99.5 %) and Ni foil (McMaster pure Ni 200 shim), crucibles:
nickel (VWR AA35906-KY), Fe wire (Anchor dark annealed annealed), steel foil (McMaster 75 µm 316 steel), crucibles:
nickel (VWR AA35906-KY), high purity alumina (AdValue Technology AL-2100), silicon dioxide (SiO2, Spectrum, 325
mesh), lithium orthosilicate is (Li4SiO4, Alfa Aeasar, 99.9%), Pflatz & Bauer, 99%).
Electrolyses. Electrolysis conditions and the systematic variation of the electrolysis cell components are described in
the Systematic Optimization of electrolytic iron production in molten carbonate section. The theoretical maximum mass of
iron that can be produced from the ferric salt during the electrolysis is calculated as Electrolysis current (A) x Electrolysis
time (s) x Atomic Weight Fe / (3 e- x 96,485 As).
Analyses. Iron metal is produced by electrolysis in molten carbonate at the cathode. The cathode product is analyzed for
iron metal content based on, and improved from the method of Xu and co-workers in which iron metal replaces cupper
sulfate, and the product ferrous sulfate is analyzed.13 The procedure has been further improved by (i) washing the electrolysis
product with deionized water, and (ii) replacement of the previous UV/Vis evaluation which was used at the end of the
procedure, with a more quantitative (less prone to colorimetric interference) titration by dichromate. The initial rinse removes
Li2CO3 and Li2O to prevent reaction of Fe0 to form Fe(OH)2 or Fe(OH)3.
In addition to the relative valence state composition of iron, the mass percent of total iron in the sample (including the
solidified electrolyte) is shown in the Fetotal of column in Table 1, and the last two columns are measured water soluble and
water insoluble mass percent of each sample. The washed, dried insoluble component consists primarily of iron (iron metal
and iron oxides). The iron analysis of weighed samples from each layer yields the concentrations: [Fetotal], [Fe°], [Fe2+], and
[Fe3+] (the latter concentration is determined from the difference of [Fetotal]- [Fe°]- [Fe2+]). A separate, weighed sample from
each layer is washed, followed by subtraction of the mass of the dried insoluble (filtered, dried) component. This yields the
mass of the remaining soluble components. The water soluble salts components consist of Li2CO3 and Li2O. The Li2O
dissolves as LiOH, including Li2O stripped from lithiated iron oxides when brought in contact with the wash water (e.g.
LiFeO2 + H2O liberates soluble LiOH), and the 105°C dried components are weighed as the insoluble salts).
The analysis procedure for iron metal is:
1) The cathode product is ground in a mortar and pestle, until it can be sifted and dispersed through a 70 mesh (212 µm) sieve.
Electronic Supplementary Material (ESI) for Green ChemistryThis journal is © The Royal Society of Chemistry 2013
3
2) The ground product is washed with deionized water, then extracted by suction filtration and rinsing the precipitate with
deionized water until pH is near 7. The precipitates, residue and filter paper are collected to react with CuSO4.
3) To 0.5 g of the ground product is added 50 ml of 0.5 M CuSO4, to form:
Fe + CuSO4 → FeSO4 + Cu (7)
4) After boiling this stirred solution for 1 hour, it is immediately filtered (to prevent the reaction of O2 with Fe2+) with a GF
/A (Whatman glass microfiber) filter paper into a 250 ml volumetric flask, and the filter paper is washed with double
deionized (18 MΩ) water also into the flask, and diluted to 250 ml.
5) 25 ml of the 250 ml filtrate is sampled by pipette into a 250 ml erlenmeyer flask,
and the following solutions are added to the flask: 20 ml of “A”, 20 ml of “B”, 50 ml of water, and 3 drops of indicator
solution “C”, where
A: is a mix of 50 ml of water with 10 ml concentrated H2SO4
B: 700 ml of water with 150 ml concentrated H2SO4, 150 ml H3PO4 (binds colored Fe3+, which is colored, as colorless
Fe(HPO4)2-, to improve clarity of the endpoint)
C: Is the indicator solution consisting of 0.2% aqueous Diphenlyamine 4-sulfonic acid sodium salt
D: Is the titrant consisting of 0.004167 M (6 x dilution of 0.025 M) K2Cr2O7
which tritrates as 1 equivalent K2Cr2O7 per FeSO4; each ml of solution D = 1.3962 mg of Fe° metal.
6FeSO4 + K2Cr2O7 + H2SO4 → 3Fe2(SO4)3+ K2SO4 + Cr2(SO4)3+ 7H2O (8)
The endpoint is observed as a color change from light blue (initial) to the endpoint’s purple.
This titration analysis is also confirmed by weighing the mass of magnetically removed the iron product that was washed &
dried to remove oxide. The reliability of the analysis during the titration is improved when solutions are stirred slowly in step
2, rather than rapidly, to prevent significant errors (underestimating the Fe° content of the product with increasing speed of
stirring) due to the introduction of oxygen, which can convert ferrous to ferric prior to the titration. The need to switch to a
lower stirring speed for the Fe° analysis was discovered and applied to the latter half of the experiments in this study. Under
this latter condition replicate analyses of Fe° metal mass from are reproducible to within a +2%.
The analysis procedure for total Fe is:
In accord with the method of Shi et al,14 a 0.1g sample was placed in a 250 ml flask with the addition of 20 ml of 1:1 diluted
HCl. The sample was placed on a mixer hot plate at about 90 oC (to prevent volatile loss of FeCl3 at higher temperature) until
completely dissolved. 20 ml water was added under N2 (99.999%). Al powder was added in three 0.1 g portions (in large
excess of the theoretical amount to reduce Fe3+ to Fe2+). With a minimum of stirring, the Al quickly reacts with Fe3+ and H+
to form Al3+, and Fe3+ was reduced to Fe2+. A color change from yellow to light yellow was observed until the solution was
transparent. The analysis occurs in accord with the following equations:
Al + Fe3+ Al3+ + Fe (9)
Fe + 2H+ Fe2++ H2 (10)
100 ml of H2O was added and the solution was cooled until room temperature. 20 ml sulfuric-phosphoric acid solution and 5
drops of the diphenylamine indicator where added after which the solution was titrated with the standard K2Cr2O7 solution
(0.0250 mol 1/6 K2Cr2O7/L).
Total Fe3+ (%) = V×N× FW Fe ÷1000/S
V-- standard K2Cr2O7 solution volume, ml.
N-- standard K2Cr2O7 solution concentration, mol/L.
FW Fe = 55.85 g/ mol.
S—specimen weight, g.
The analysis procedure for Fe2+ is based on the method of reference 14, as modified by references 13 and 15. In this analysis,
0.5 g of the sample to be analyzed was added to 250 ml flask and 20 ml of 1:1 diluted HCl was added. This solution was
mixed on a hot plate under 99.999% N2 at 90 oC until completely dissolved. 100 ml H2O was added and the solution allowed
to cool to room temperature. 20 ml sulfuric-phosphoric acid solution (prep: add 600 ml concentrated H2SO4 to 800 ml stirred
DI, then add 600 ml of 86% phosphoric acid) and 5 drops of the diphenylamine indicator were added and titrated with the
standard K2Cr2O7 solution (0.0250 mol 1/6 K2Cr2O7/L) to a sharp endpoint color change from green to purple.
In accord with the equation:
Fe2+ (%) = V×N×FW Fe÷1000/S.
V-- standard K2Cr2O7 solution volume, ml.
N-- standard K2Cr2O7 solution concentration, mol/L.
S—specimen weight, g.
The analysis procedure for Fe3+ is the straightforward difference from the known total iron, the sum of the iron metal and
ferrous species as: Fe3+(%)= Total Fe(%)-Fe0 (%)-Fe2+ (%)
The analysis procedure for the aqueous soluble components:
Filters were dried in an oven at 105 °C for 1 hour, and then cooled in a desiccator, and weighed. After weighing, samples
(~0.3g) to be analyzed were stirred one hour in 100 ml of DI (18 MΩ) in a 250 ml flask at room temperature, then filtered
using suction, and the filtrate washed on the filter with three 20 mL volumes of DI water. The filter is transferred onto a
glass weighing dish, and dried 105°C for a minimum of 1 hour until a minimum mass is measured (after cooling to room
temperature in the desiccator).
Equation: Water soluble substances (wt%) = (A-B)×100/A.
A—Specimen weight, g.
B-- Residue on the filter paper weight, g.
Electronic Supplementary Material (ESI) for Green ChemistryThis journal is © The Royal Society of Chemistry 2013
4
Systematic Optimization of electrolytic iron production in molten carbonate.
A systematic, variation of molten iron electrolysis can yield efficient iron production efficiency at low energy. General
conditions of the first series of electrolyses are summarized in Table 1. The cathode in this first series of experiments is a thin
planar 6.25 cm2 steel sheet. This cathode lies under the anode, and we observe that the iron product is deposited on top of the cathode. This cathode surface is the active area exposed to short ion diffusion path between the electrodes.
Table 2 summarizes the results of 1 hour electrolyses at 1 Amp in an 800°C molten lithium carbonate electrolyte containing
1.5 m Fe2O3 and 3 m Li2O (to generate 3 m LiFeO2 in solution). In this series of experiments the anode, a coiled pure nickel
(McMaster 200 Ni) wire is situated 3 mm below the surface of the electrolyte to facilitate oxygen evolution in an attempt to minimize oxygen interaction with the cathode product.
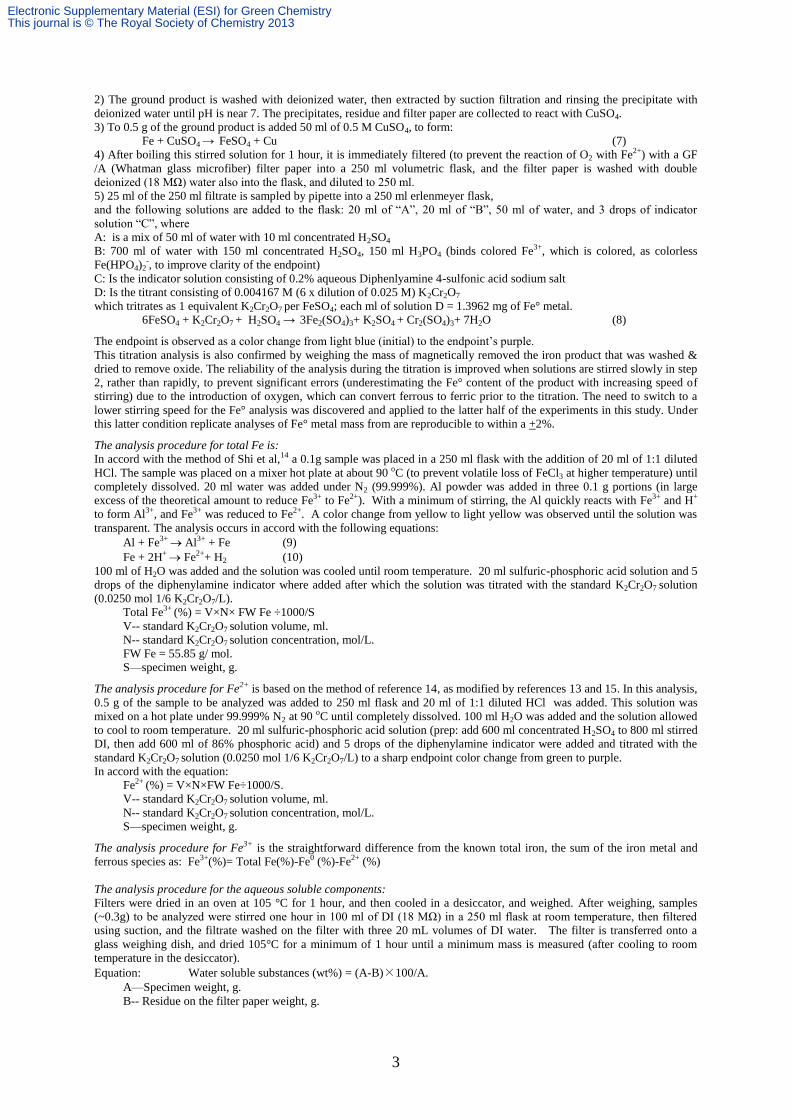
Table 1. Constant characteristics in the first series of STEP Iron parametric optimization studies.
Figure 2. Anode (upper electrode) and cathode (lower
electrode) prior to electrolysis (top) and following electrolysis
prior to removal of cathode product (bottom). Insulating
alumina ceramic tubes are reused and hence appear charred.
In the first series of experiments, summarized in Table 2,
the anode to interelectrode spacing is varied, and the mass of
electrolyte was changed to cover smaller or larger inter-
electrode separations. The electrodes before and after
electrolysis are photographed in Figure 2. The lithium based
electrolyte is highly conductive, and even at these relatively
high current densities, electrolytic resistance losses are not
significantly impacted by the variation of inter-electrode
spacing. The electrolysis potentials at 1 A constant current are
the same to within 0.1 V, independent of the 0.25 to 2.0 cm
electrode separation. Coulombic efficiency, particularly during
the 0.25 cm separation electrolysis may have been impacted by
shorting as the iron deposit growing from the cathode
approached the anode, and that a maximum of over 50%
coulombic efficiency is achieved for an intermediate spacing of 1.0 cm.
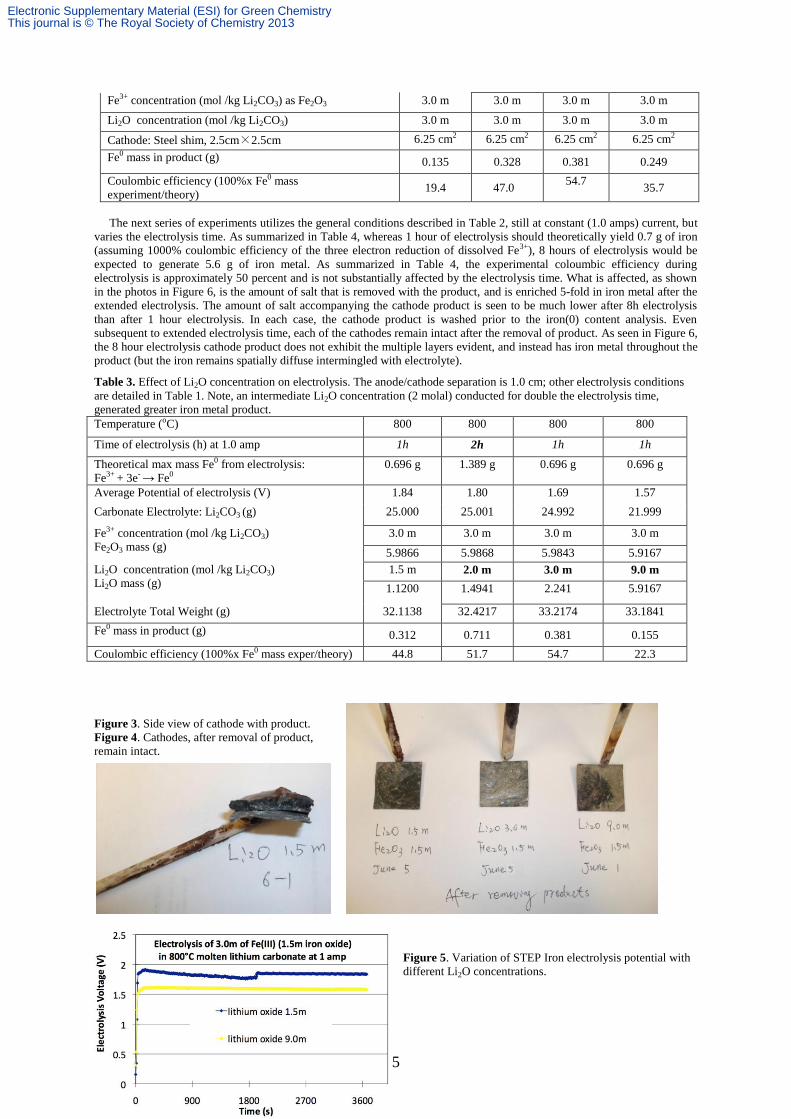
Table 3 summarizes STEP Iron electrolyses in which the
starting concentration of Li2O is varied. In each case, the
initial ferric concentration (as added Fe2O3) is kept constant at
3 molal Fe3+ in Li2CO3. As we have previously demonstrated, Fe2O3 is not soluble in carbonate unless Li2O is added, and
reacts to form LiFeO2 in the molten solution.1 The Li2O is not consumed in the electrolysis process. That is consistent with eq.
7, as LiFeO2 is reduced to form iron metal, Li2O is liberated to dissolve the next iteration of added iron ore (Fe2O3). As seen
in the photo in Figure 3, the iron is deposited directly on top of the cathode, followed by a black layer of partially reduced
iron (magnetite), followed by a layer of the electrolyte containing the excess (brown) Fe2O3 dissolved in the electrolyte. The
iron layer is easily separated from the cathode, Figure 4, and as seen in Figures 3 and 4 leaves behind a reusable cathode. As
seen in Table 3, a 1:1 ratio of Li2O to Fe2O3 supports the maximum coulombic efficiency, although it is interesting to note in
Figure 5, that higher concentrations of Li2O significantly decrease the required electrolysis potential (as seen comparing the
1.5 m and 9.0 m Li2O electrolysie). This decrease in potential with increasing oxide concentration may be due to the
formation of a peroxoide intermediate in the anodic evolution of oxygen as we have recently demonstrated.11 Also evident in
the figure, potential variations are occasionally observed during individual electrolyses, although average electrolysis
potential trends are highly consistent.
Table 2. Effect of electrode spacing and electrolyte mass on electrolysis. Electrodes are delineated in Table 1. The electrolyte
mass was changed as indicated below, to maintain electrolyte converage in experiments with smaller or larger inter-electrode
separations. Note, coulombic efficiency, particularly during the 0.25 separation electrolysis may have been impacted by
shorting as the iron deposit grew from the cathode towards the anode.
Temperature (oC) 800 800 800 800
Anode/Cathode separation (cm) 0.25 0.5 1.0 2.0
Electrolyte Total mass (g): Electrolyte weighed from a mix
of 200.0015g Li2CO3, 47.8888g Fe2O3 and 17.9286g Li2O,
8.3193 16.6128 33.2174 66.4510
Current of electrolysis 1.0 amp
Time of electrolysis (1h) 3600 s
Theoretical max mass Fe0 from electrolysis: Fe3++3e- Fe0 1A×3600÷96485÷3×55.85 = 0.696 g
Anode: Ni wire tightly coiled, l = 16 cm, d = 2.0 mm, area: 10 cm2
Cathode: Steel shim, 2.5cm×2.5cm, area 6.25 cm2
Electronic Supplementary Material (ESI) for Green ChemistryThis journal is © The Royal Society of Chemistry 2013
5
Fe3+ concentration (mol /kg Li2CO3) as Fe2O3 3.0 m 3.0 m 3.0 m 3.0 m
Li2O concentration (mol /kg Li2CO3) 3.0 m 3.0 m 3.0 m 3.0 m
Cathode: Steel shim, 2.5cm×2.5cm 6.25 cm2 6.25 cm2 6.25 cm2 6.25 cm2
Fe0 mass in product (g) 0.135 0.328 0.381 0.249
Coulombic efficiency (100%x Fe0 mass
experiment/theory) 19.4 47.0
54.7 35.7
The next series of experiments utilizes the general conditions described in Table 2, still at constant (1.0 amps) current, but
varies the electrolysis time. As summarized in Table 4, whereas 1 hour of electrolysis should theoretically yield 0.7 g of iron
(assuming 1000% coulombic efficiency of the three electron reduction of dissolved Fe3+), 8 hours of electrolysis would be
expected to generate 5.6 g of iron metal. As summarized in Table 4, the experimental coloumbic efficiency during
electrolysis is approximately 50 percent and is not substantially affected by the electrolysis time. What is affected, as shown
in the photos in Figure 6, is the amount of salt that is removed with the product, and is enriched 5-fold in iron metal after the
extended electrolysis. The amount of salt accompanying the cathode product is seen to be much lower after 8h electrolysis
than after 1 hour electrolysis. In each case, the cathode product is washed prior to the iron(0) content analysis. Even
subsequent to extended electrolysis time, each of the cathodes remain intact after the removal of product. As seen in Figure 6,
the 8 hour electrolysis cathode product does not exhibit the multiple layers evident, and instead has iron metal throughout the
product (but the iron remains spatially diffuse intermingled with electrolyte).
Table 3. Effect of Li2O concentration on electrolysis. The anode/cathode separation is 1.0 cm; other electrolysis conditions
are detailed in Table 1. Note, an intermediate Li2O concentration (2 molal) conducted for double the electrolysis time,
generated greater iron metal product.
Temperature (oC) 800 800 800 800
Time of electrolysis (h) at 1.0 amp 1h 2h 1h 1h
Theoretical max mass Fe0 from electrolysis:
Fe3+ + 3e- → Fe0
0.696 g 1.389 g 0.696 g 0.696 g
Average Potential of electrolysis (V) 1.84 1.80 1.69 1.57
Carbonate Electrolyte: Li2CO3 (g) 25.000 25.001 24.992 21.999
Fe3+ concentration (mol /kg Li2CO3)
Fe2O3 mass (g)
3.0 m 3.0 m 3.0 m 3.0 m
5.9866 5.9868 5.9843 5.9167
Li2O concentration (mol /kg Li2CO3)
Li2O mass (g)
1.5 m 2.0 m 3.0 m 9.0 m
1.1200 1.4941 2.241 5.9167
Electrolyte Total Weight (g) 32.1138 32.4217 33.2174 33.1841
Fe0 mass in product (g) 0.312 0.711 0.381 0.155
Coulombic efficiency (100%x Fe0 mass exper/theory) 44.8 51.7 54.7 22.3
Figure 3. Side view of cathode with product.
Figure 4. Cathodes, after removal of product,
remain intact.
Figure 5. Variation of STEP Iron electrolysis potential with
different Li2O concentrations.
Electronic Supplementary Material (ESI) for Green ChemistryThis journal is © The Royal Society of Chemistry 2013
6
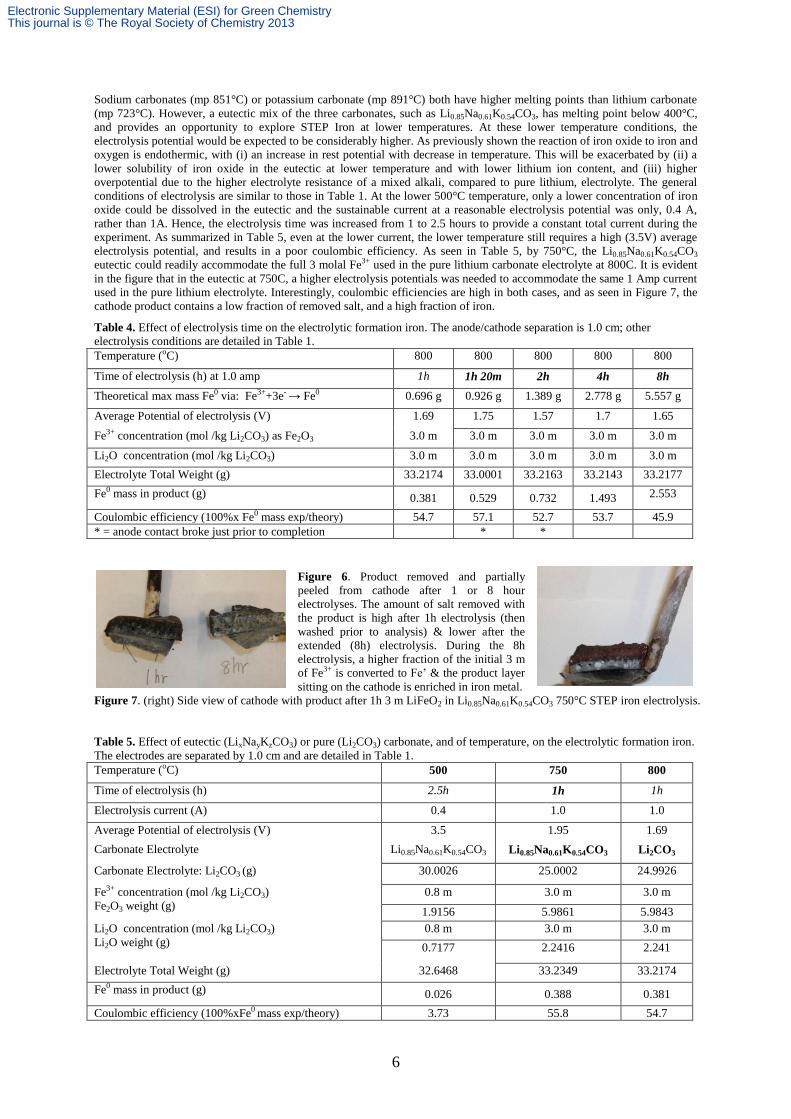
Sodium carbonates (mp 851°C) or potassium carbonate (mp 891°C) both have higher melting points than lithium carbonate
(mp 723°C). However, a eutectic mix of the three carbonates, such as Li0.85Na0.61K0.54CO3, has melting point below 400°C,
and provides an opportunity to explore STEP Iron at lower temperatures. At these lower temperature conditions, the
electrolysis potential would be expected to be considerably higher. As previously shown the reaction of iron oxide to iron and
oxygen is endothermic, with (i) an increase in rest potential with decrease in temperature. This will be exacerbated by (ii) a
lower solubility of iron oxide in the eutectic at lower temperature and with lower lithium ion content, and (iii) higher
overpotential due to the higher electrolyte resistance of a mixed alkali, compared to pure lithium, electrolyte. The general
conditions of electrolysis are similar to those in Table 1. At the lower 500°C temperature, only a lower concentration of iron
oxide could be dissolved in the eutectic and the sustainable current at a reasonable electrolysis potential was only, 0.4 A,
rather than 1A. Hence, the electrolysis time was increased from 1 to 2.5 hours to provide a constant total current during the
experiment. As summarized in Table 5, even at the lower current, the lower temperature still requires a high (3.5V) average
electrolysis potential, and results in a poor coulombic efficiency. As seen in Table 5, by 750°C, the Li0.85Na0.61K0.54CO3
eutectic could readily accommodate the full 3 molal Fe3+ used in the pure lithium carbonate electrolyte at 800C. It is evident
in the figure that in the eutectic at 750C, a higher electrolysis potentials was needed to accommodate the same 1 Amp current
used in the pure lithium electrolyte. Interestingly, coulombic efficiencies are high in both cases, and as seen in Figure 7, the
cathode product contains a low fraction of removed salt, and a high fraction of iron.
Table 4. Effect of electrolysis time on the electrolytic formation iron. The anode/cathode separation is 1.0 cm; other
electrolysis conditions are detailed in Table 1.
Temperature (oC) 800 800 800 800 800
Time of electrolysis (h) at 1.0 amp 1h 1h 20m 2h 4h 8h
Theoretical max mass Fe0 via: Fe3++3e- → Fe0 0.696 g 0.926 g 1.389 g 2.778 g 5.557 g
Average Potential of electrolysis (V) 1.69 1.75 1.57 1.7 1.65
Fe3+ concentration (mol /kg Li2CO3) as Fe2O3 3.0 m 3.0 m 3.0 m 3.0 m 3.0 m
Li2O concentration (mol /kg Li2CO3) 3.0 m 3.0 m 3.0 m 3.0 m 3.0 m
Electrolyte Total Weight (g) 33.2174 33.0001 33.2163 33.2143 33.2177
Fe0 mass in product (g) 0.381 0.529 0.732 1.493 2.553
Coulombic efficiency (100%x Fe0 mass exp/theory) 54.7 57.1 52.7 53.7 45.9
* = anode contact broke just prior to completion * *
Figure 6. Product removed and partially
peeled from cathode after 1 or 8 hour
electrolyses. The amount of salt removed with
the product is high after 1h electrolysis (then
washed prior to analysis) & lower after the
extended (8h) electrolysis. During the 8h
electrolysis, a higher fraction of the initial 3 m
of Fe3+ is converted to Fe’ & the product layer
sitting on the cathode is enriched in iron metal.
Figure 7. (right) Side view of cathode with product after 1h 3 m LiFeO2 in Li0.85Na0.61K0.54CO3 750°C STEP iron electrolysis.
Table 5. Effect of eutectic (LixNayKzCO3) or pure (Li2CO3) carbonate, and of temperature, on the electrolytic formation iron.
The electrodes are separated by 1.0 cm and are detailed in Table 1.
Temperature (oC) 500 750 800
Time of electrolysis (h) 2.5h 1h 1h
Electrolysis current (A) 0.4 1.0 1.0
Average Potential of electrolysis (V) 3.5 1.95 1.69
Carbonate Electrolyte Li0.85Na0.61K0.54CO3 Li0.85Na0.61K0.54CO3 Li2CO3
Carbonate Electrolyte: Li2CO3 (g) 30.0026 25.0002 24.9926
Fe3+ concentration (mol /kg Li2CO3)
Fe2O3 weight (g)
0.8 m 3.0 m 3.0 m
1.9156 5.9861 5.9843
Li2O concentration (mol /kg Li2CO3)
Li2O weight (g)
0.8 m 3.0 m 3.0 m
0.7177 2.2416 2.241
Electrolyte Total Weight (g) 32.6468 33.2349 33.2174
Fe0 mass in product (g) 0.026 0.388 0.381
Coulombic efficiency (100%xFe0 mass exp/theory) 3.73 55.8 54.7
Electronic Supplementary Material (ESI) for Green ChemistryThis journal is © The Royal Society of Chemistry 2013
7
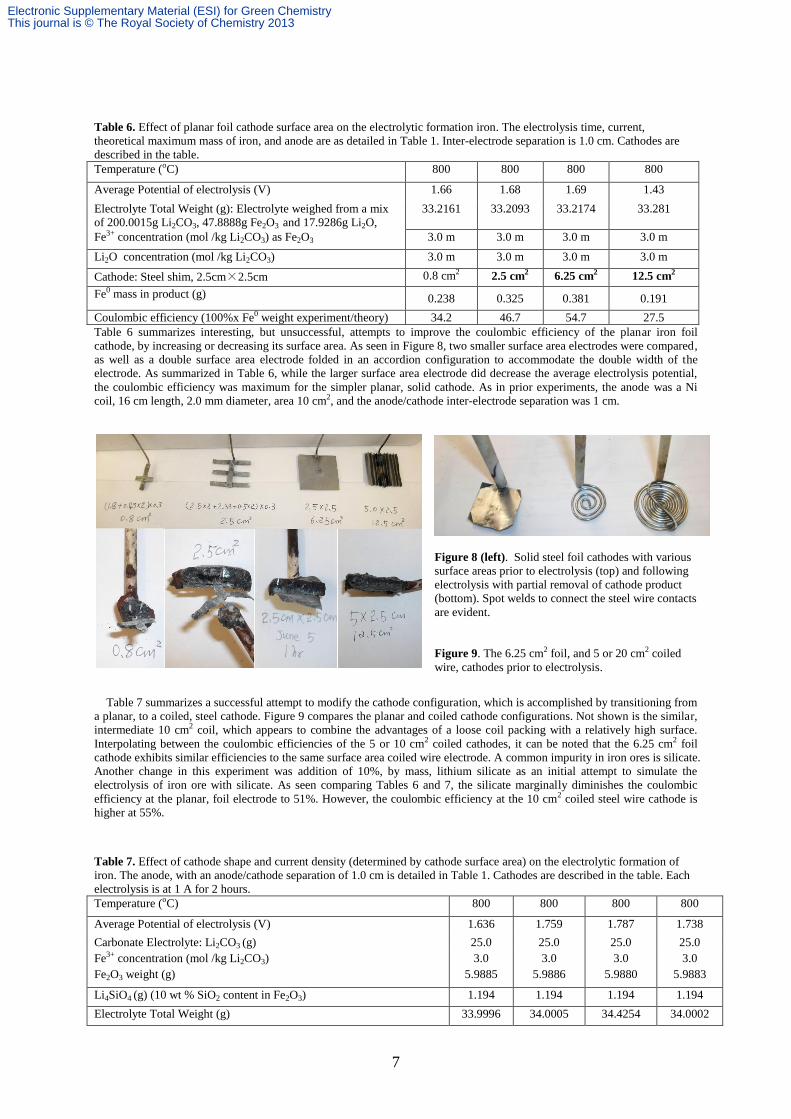
Table 6. Effect of planar foil cathode surface area on the electrolytic formation iron. The electrolysis time, current,
theoretical maximum mass of iron, and anode are as detailed in Table 1. Inter-electrode separation is 1.0 cm. Cathodes are
described in the table.
Temperature (oC) 800 800 800 800
Average Potential of electrolysis (V) 1.66 1.68 1.69 1.43
Electrolyte Total Weight (g): Electrolyte weighed from a mix
of 200.0015g Li2CO3, 47.8888g Fe2O3 and 17.9286g Li2O,
33.2161 33.2093 33.2174 33.281
Fe3+ concentration (mol /kg Li2CO3) as Fe2O3 3.0 m 3.0 m 3.0 m 3.0 m
Li2O concentration (mol /kg Li2CO3) 3.0 m 3.0 m 3.0 m 3.0 m
Cathode: Steel shim, 2.5cm×2.5cm 0.8 cm2 2.5 cm2 6.25 cm2 12.5 cm2
Fe0 mass in product (g) 0.238 0.325 0.381 0.191
Coulombic efficiency (100%x Fe0 weight experiment/theory) 34.2 46.7 54.7 27.5 Table 6 summarizes interesting, but unsuccessful, attempts to improve the coulombic efficiency of the planar iron foil
cathode, by increasing or decreasing its surface area. As seen in Figure 8, two smaller surface area electrodes were compared,
as well as a double surface area electrode folded in an accordion configuration to accommodate the double width of the
electrode. As summarized in Table 6, while the larger surface area electrode did decrease the average electrolysis potential,
the coulombic efficiency was maximum for the simpler planar, solid cathode. As in prior experiments, the anode was a Ni
coil, 16 cm length, 2.0 mm diameter, area 10 cm2, and the anode/cathode inter-electrode separation was 1 cm.
Figure 8 (left). Solid steel foil cathodes with various
surface areas prior to electrolysis (top) and following
electrolysis with partial removal of cathode product
(bottom). Spot welds to connect the steel wire contacts
are evident.
Figure 9. The 6.25 cm2 foil, and 5 or 20 cm2 coiled
wire, cathodes prior to electrolysis.
Table 7 summarizes a successful attempt to modify the cathode configuration, which is accomplished by transitioning from
a planar, to a coiled, steel cathode. Figure 9 compares the planar and coiled cathode configurations. Not shown is the similar,
intermediate 10 cm2 coil, which appears to combine the advantages of a loose coil packing with a relatively high surface.
Interpolating between the coulombic efficiencies of the 5 or 10 cm2 coiled cathodes, it can be noted that the 6.25 cm2 foil
cathode exhibits similar efficiencies to the same surface area coiled wire electrode. A common impurity in iron ores is silicate.
Another change in this experiment was addition of 10%, by mass, lithium silicate as an initial attempt to simulate the
electrolysis of iron ore with silicate. As seen comparing Tables 6 and 7, the silicate marginally diminishes the coulombic
efficiency at the planar, foil electrode to 51%. However, the coulombic efficiency at the 10 cm2 coiled steel wire cathode is
higher at 55%.
Table 7. Effect of cathode shape and current density (determined by cathode surface area) on the electrolytic formation of
iron. The anode, with an anode/cathode separation of 1.0 cm is detailed in Table 1. Cathodes are described in the table. Each
electrolysis is at 1 A for 2 hours.
Temperature (oC) 800 800 800 800
Average Potential of electrolysis (V) 1.636 1.759 1.787 1.738
Carbonate Electrolyte: Li2CO3 (g) 25.0 25.0 25.0 25.0
Fe3+ concentration (mol /kg Li2CO3) 3.0 3.0 3.0 3.0
Fe2O3 weight (g) 5.9885 5.9886 5.9880 5.9883
Li4SiO4 (g) (10 wt % SiO2 content in Fe2O3) 1.194 1.194 1.194 1.194
Electrolyte Total Weight (g) 33.9996 34.0005 34.4254 34.0002
Electronic Supplementary Material (ESI) for Green ChemistryThis journal is © The Royal Society of Chemistry 2013
8
Cathode: Area ( cm2)
Size: Length×width or diameter ( cm)
Shape: foil or coiled wire
6.25 5.0 10.0 20.0
2.5×2.5
Fe foil
13.3×0.12
Fe wire
26.5×0.12
Fe wire
53×0.12
Fe wire
Current density (mA/cm2) 160 200 100 50
Fe0 mass in product (g) 0.7049 0.2994 0.7693 0.6350
Coulombic efficiency (100%x Fe0 weight experiment/theory) 51% 22% 55% 46%
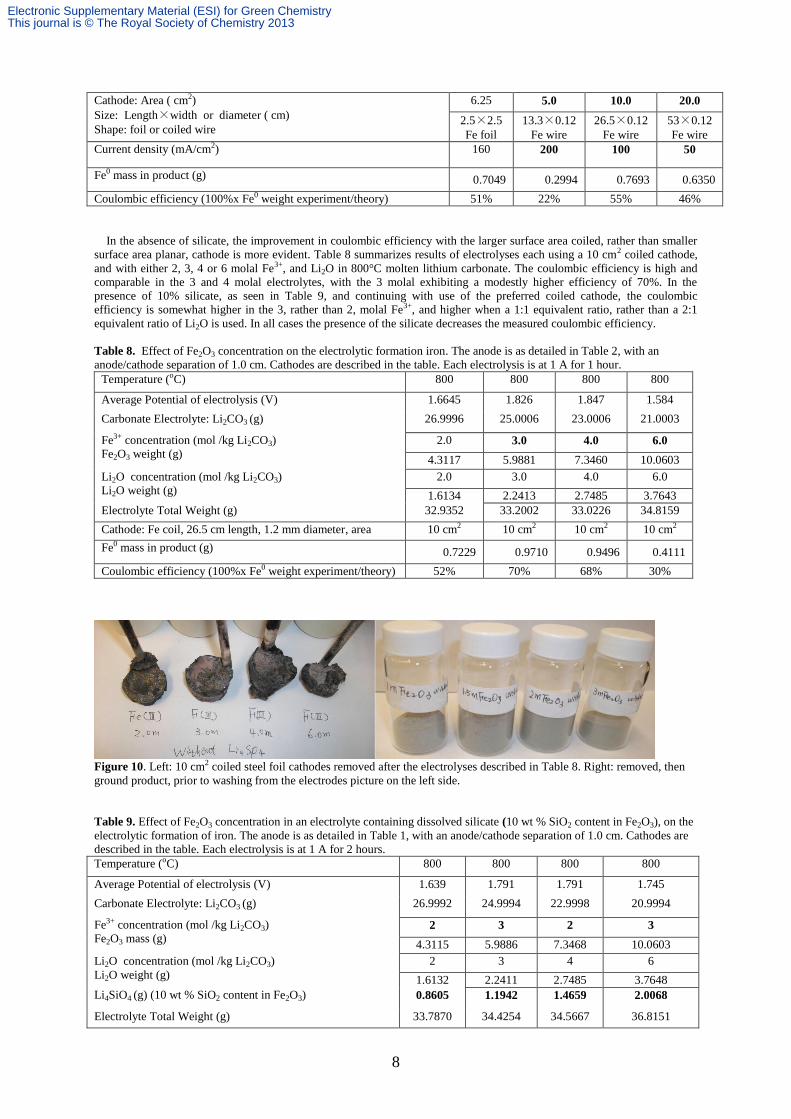
In the absence of silicate, the improvement in coulombic efficiency with the larger surface area coiled, rather than smaller
surface area planar, cathode is more evident. Table 8 summarizes results of electrolyses each using a 10 cm2 coiled cathode,
and with either 2, 3, 4 or 6 molal Fe3+, and Li2O in 800°C molten lithium carbonate. The coulombic efficiency is high and
comparable in the 3 and 4 molal electrolytes, with the 3 molal exhibiting a modestly higher efficiency of 70%. In the
presence of 10% silicate, as seen in Table 9, and continuing with use of the preferred coiled cathode, the coulombic
efficiency is somewhat higher in the 3, rather than 2, molal Fe3+, and higher when a 1:1 equivalent ratio, rather than a 2:1
equivalent ratio of Li2O is used. In all cases the presence of the silicate decreases the measured coulombic efficiency.
Table 8. Effect of Fe2O3 concentration on the electrolytic formation iron. The anode is as detailed in Table 2, with an
anode/cathode separation of 1.0 cm. Cathodes are described in the table. Each electrolysis is at 1 A for 1 hour.
Temperature (oC) 800 800 800 800
Average Potential of electrolysis (V) 1.6645 1.826 1.847 1.584
Carbonate Electrolyte: Li2CO3 (g) 26.9996 25.0006 23.0006 21.0003
Fe3+ concentration (mol /kg Li2CO3)
Fe2O3 weight (g)
2.0 3.0 4.0 6.0
4.3117 5.9881 7.3460 10.0603
Li2O concentration (mol /kg Li2CO3)
Li2O weight (g)
2.0 3.0 4.0 6.0
1.6134 2.2413 2.7485 3.7643
Electrolyte Total Weight (g) 32.9352 33.2002 33.0226 34.8159
Cathode: Fe coil, 26.5 cm length, 1.2 mm diameter, area 10 cm2 10 cm2 10 cm2 10 cm2
Fe0 mass in product (g) 0.7229 0.9710 0.9496 0.4111
Coulombic efficiency (100%x Fe0 weight experiment/theory) 52% 70% 68% 30%
Figure 10. Left: 10 cm2 coiled steel foil cathodes removed after the electrolyses described in Table 8. Right: removed, then
ground product, prior to washing from the electrodes picture on the left side.
Table 9. Effect of Fe2O3 concentration in an electrolyte containing dissolved silicate (10 wt % SiO2 content in Fe2O3), on the
electrolytic formation of iron. The anode is as detailed in Table 1, with an anode/cathode separation of 1.0 cm. Cathodes are
described in the table. Each electrolysis is at 1 A for 2 hours.
Temperature (oC) 800 800 800 800
Average Potential of electrolysis (V) 1.639 1.791 1.791 1.745
Carbonate Electrolyte: Li2CO3 (g) 26.9992 24.9994 22.9998 20.9994
Fe3+ concentration (mol /kg Li2CO3)
Fe2O3 mass (g) 2 3 2 3
4.3115 5.9886 7.3468 10.0603
Li2O concentration (mol /kg Li2CO3)
Li2O weight (g)
2 3 4 6
1.6132 2.2411 2.7485 3.7648
Li4SiO4 (g) (10 wt % SiO2 content in Fe2O3) 0.8605 1.1942 1.4659 2.0068
Electrolyte Total Weight (g) 33.7870 34.4254 34.5667 36.8151
Electronic Supplementary Material (ESI) for Green ChemistryThis journal is © The Royal Society of Chemistry 2013
9
Cathode: Fe coil, 26.5 cm length, 1.2 mm diameter, area 10 cm2 10 cm2 10 cm2 10 cm2
Fe0 mass in product (g) 0.6708 0.7693 0.4784 0.5899
Coulombic efficiency (100%x Fe0 weight experiment/theory) 48% 55% 34% 42%
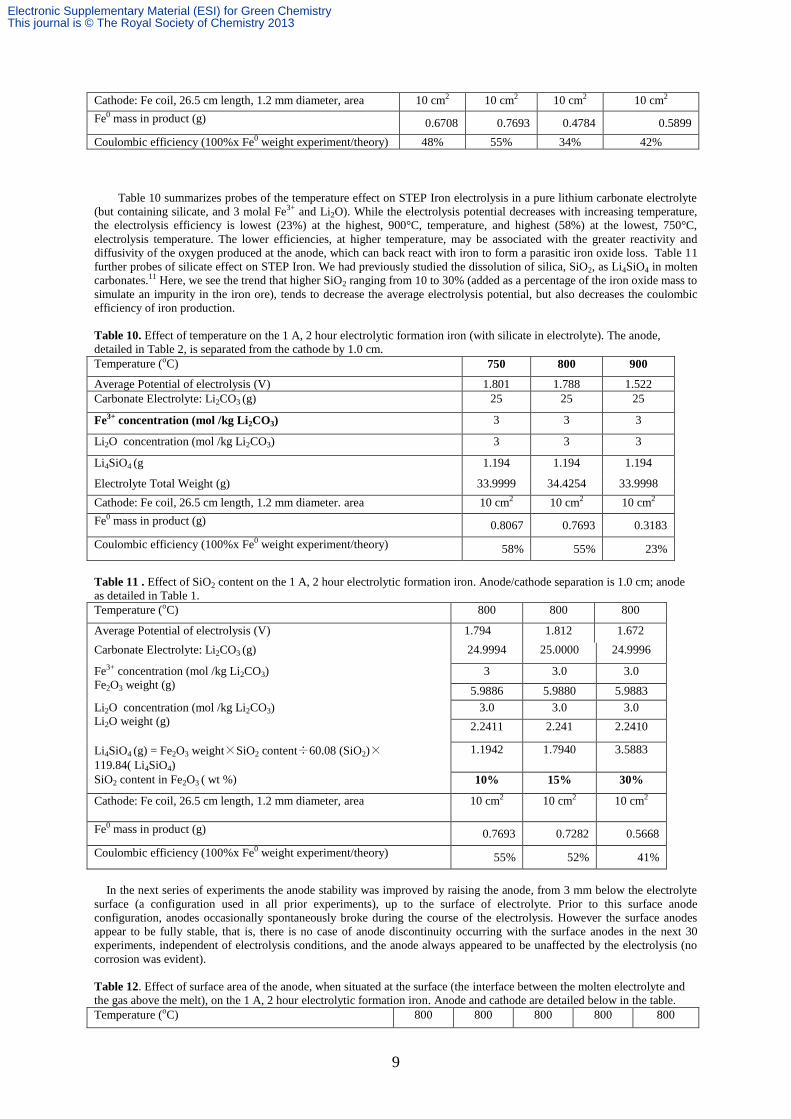
Table 10 summarizes probes of the temperature effect on STEP Iron electrolysis in a pure lithium carbonate electrolyte
(but containing silicate, and 3 molal Fe3+ and Li2O). While the electrolysis potential decreases with increasing temperature,
the electrolysis efficiency is lowest (23%) at the highest, 900°C, temperature, and highest (58%) at the lowest, 750°C,
electrolysis temperature. The lower efficiencies, at higher temperature, may be associated with the greater reactivity and
diffusivity of the oxygen produced at the anode, which can back react with iron to form a parasitic iron oxide loss. Table 11
further probes of silicate effect on STEP Iron. We had previously studied the dissolution of silica, SiO2, as Li4SiO4 in molten
carbonates.11 Here, we see the trend that higher SiO2 ranging from 10 to 30% (added as a percentage of the iron oxide mass to
simulate an impurity in the iron ore), tends to decrease the average electrolysis potential, but also decreases the coulombic
efficiency of iron production.
Table 10. Effect of temperature on the 1 A, 2 hour electrolytic formation iron (with silicate in electrolyte). The anode,
detailed in Table 2, is separated from the cathode by 1.0 cm.
Temperature (oC) 750 800 900
Average Potential of electrolysis (V) 1.801 1.788 1.522
Carbonate Electrolyte: Li2CO3 (g) 25 25 25
Fe3+ concentration (mol /kg Li2CO3) 3 3 3
Li2O concentration (mol /kg Li2CO3) 3 3 3
Li4SiO4 (g 1.194 1.194 1.194
Electrolyte Total Weight (g) 33.9999 34.4254 33.9998
Cathode: Fe coil, 26.5 cm length, 1.2 mm diameter. area 10 cm2 10 cm2 10 cm2
Fe0 mass in product (g) 0.8067 0.7693 0.3183
Coulombic efficiency (100%x Fe0 weight experiment/theory) 58% 55% 23%
Table 11 . Effect of SiO2 content on the 1 A, 2 hour electrolytic formation iron. Anode/cathode separation is 1.0 cm; anode
as detailed in Table 1.
Temperature (oC) 800 800 800
Average Potential of electrolysis (V) 1.794 1.812 1.672
Carbonate Electrolyte: Li2CO3 (g) 24.9994 25.0000 24.9996
Fe3+ concentration (mol /kg Li2CO3)
Fe2O3 weight (g)
3 3.0 3.0
5.9886 5.9880 5.9883
Li2O concentration (mol /kg Li2CO3)
Li2O weight (g)
3.0 3.0 3.0
2.2411 2.241 2.2410
Li4SiO4 (g) = Fe2O3 weight×SiO2 content÷60.08 (SiO2)×119.84( Li4SiO4)
1.1942 1.7940 3.5883
SiO2 content in Fe2O3 ( wt %) 10% 15% 30%
Cathode: Fe coil, 26.5 cm length, 1.2 mm diameter, area 10 cm2 10 cm2 10 cm2
Fe0 mass in product (g) 0.7693 0.7282 0.5668
Coulombic efficiency (100%x Fe0 weight experiment/theory) 55% 52% 41%
In the next series of experiments the anode stability was improved by raising the anode, from 3 mm below the electrolyte
surface (a configuration used in all prior experiments), up to the surface of electrolyte. Prior to this surface anode
configuration, anodes occasionally spontaneously broke during the course of the electrolysis. However the surface anodes
appear to be fully stable, that is, there is no case of anode discontinuity occurring with the surface anodes in the next 30
experiments, independent of electrolysis conditions, and the anode always appeared to be unaffected by the electrolysis (no
corrosion was evident).
Table 12. Effect of surface area of the anode, when situated at the surface (the interface between the molten electrolyte and
the gas above the melt), on the 1 A, 2 hour electrolytic formation iron. Anode and cathode are detailed below in the table.
Temperature (oC) 800 800 800 800 800
Electronic Supplementary Material (ESI) for Green ChemistryThis journal is © The Royal Society of Chemistry 2013
10
Anode: Ni wire, 2.0 mm diameter, length:
surface area:
coil configuration:
2 cm 8 cm 16 cm 16 cm 30 cm
1.3 cm2 5 cm2 10 cm2 10 cm2 18.8 cm2
tight tight tight loose tight
Cathode: Fe coil, l = 26.5 cm, d =1.2 mm, area: 10 cm2 10 cm2 10 cm2 10 cm2 10 cm2
Average Potential of electrolysis (V) 1.96 1.91 1.89 1.83 1.66
Fe3+ concentration (mol /kg Li2CO3) as Fe2O3 3.0 m 3.0 m 3.0 m 3.0 m 3.0 m
Li2O concentration (mol /kg Li2CO3) 3.0 m 3.0 m 3.0 m 3.0 m 3.0 m
Electrolyte total mass (g) 33.2176 33.2167 33.2172 33.2172 33.2161
Li4SiO4 (g) 0 0 0 0 0
Fe0 mass in product (g) 0.490 0.826 0.808 0.563 0.655
Coulombic efficiency (100%x Fe0 mass exp/theory) 35.2 59.3 58.0 40.4 47.0
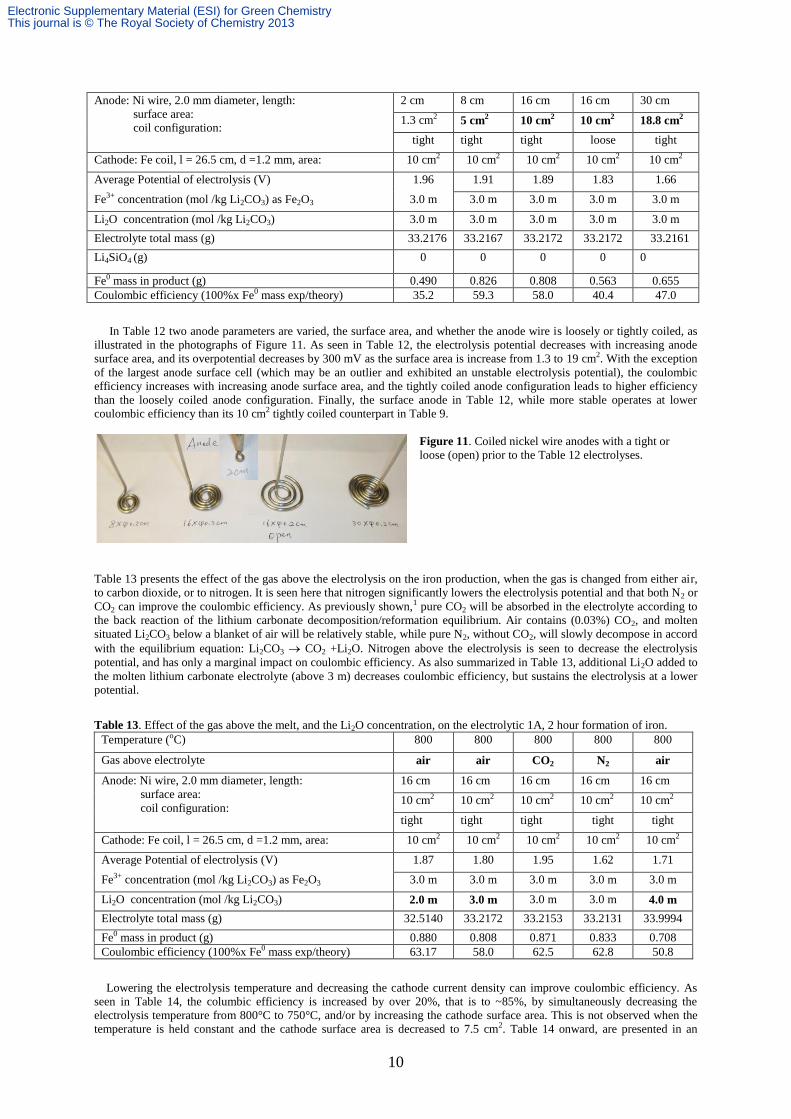
In Table 12 two anode parameters are varied, the surface area, and whether the anode wire is loosely or tightly coiled, as
illustrated in the photographs of Figure 11. As seen in Table 12, the electrolysis potential decreases with increasing anode
surface area, and its overpotential decreases by 300 mV as the surface area is increase from 1.3 to 19 cm2. With the exception
of the largest anode surface cell (which may be an outlier and exhibited an unstable electrolysis potential), the coulombic
efficiency increases with increasing anode surface area, and the tightly coiled anode configuration leads to higher efficiency
than the loosely coiled anode configuration. Finally, the surface anode in Table 12, while more stable operates at lower
coulombic efficiency than its 10 cm2 tightly coiled counterpart in Table 9.
Figure 11. Coiled nickel wire anodes with a tight or
loose (open) prior to the Table 12 electrolyses.
Table 13 presents the effect of the gas above the electrolysis on the iron production, when the gas is changed from either air,
to carbon dioxide, or to nitrogen. It is seen here that nitrogen significantly lowers the electrolysis potential and that both N2 or
CO2 can improve the coulombic efficiency. As previously shown,1 pure CO2 will be absorbed in the electrolyte according to
the back reaction of the lithium carbonate decomposition/reformation equilibrium. Air contains (0.03%) CO2, and molten
situated Li2CO3 below a blanket of air will be relatively stable, while pure N2, without CO2, will slowly decompose in accord
with the equilibrium equation: Li2CO3 CO2 +Li2O. Nitrogen above the electrolysis is seen to decrease the electrolysis
potential, and has only a marginal impact on coulombic efficiency. As also summarized in Table 13, additional Li2O added to
the molten lithium carbonate electrolyte (above 3 m) decreases coulombic efficiency, but sustains the electrolysis at a lower
potential.
Table 13. Effect of the gas above the melt, and the Li2O concentration, on the electrolytic 1A, 2 hour formation of iron.
Temperature (oC) 800 800 800 800 800
Gas above electrolyte air air CO2 N2 air
Anode: Ni wire, 2.0 mm diameter, length:
surface area:
coil configuration:
16 cm 16 cm 16 cm 16 cm 16 cm
10 cm2 10 cm2 10 cm2 10 cm2 10 cm2
tight tight tight tight tight
Cathode: Fe coil, l = 26.5 cm, d =1.2 mm, area: 10 cm2 10 cm2 10 cm2 10 cm2 10 cm2
Average Potential of electrolysis (V) 1.87 1.80 1.95 1.62 1.71
Fe3+ concentration (mol /kg Li2CO3) as Fe2O3 3.0 m 3.0 m 3.0 m 3.0 m 3.0 m
Li2O concentration (mol /kg Li2CO3) 2.0 m 3.0 m 3.0 m 3.0 m 4.0 m
Electrolyte total mass (g) 32.5140 33.2172 33.2153 33.2131 33.9994
Fe0 mass in product (g) 0.880 0.808 0.871 0.833 0.708
Coulombic efficiency (100%x Fe0 mass exp/theory) 63.17 58.0 62.5 62.8 50.8
Lowering the electrolysis temperature and decreasing the cathode current density can improve coulombic efficiency. As
seen in Table 14, the columbic efficiency is increased by over 20%, that is to ~85%, by simultaneously decreasing the
electrolysis temperature from 800°C to 750°C, and/or by increasing the cathode surface area. This is not observed when the
temperature is held constant and the cathode surface area is decreased to 7.5 cm2. Table 14 onward, are presented in an
Electronic Supplementary Material (ESI) for Green ChemistryThis journal is © The Royal Society of Chemistry 2013
11
abbreviated format, without the electrolyte concentration to save manuscript space. In each case the electrolyte total mass is ~
33 g. In each case the electrolyte is 3.0 m in Fe3+ and Li2O and without silicates. The coulombic efficiency also depends on
when the electrode is removed from the electrolysis chamber (electrolysis time, Table 15) and the electrolysis current (Table
16). As seen in Table 15, removing the electrode after, 1 hour negatively impacts the efficiency, although this effect
presumably may be mitigated if iron oxide is fed into the electrolysis chamber as iron is produced.
Table 14. Effect of the decrease in temperature and variation in cathode surface area on the 1A, 2 hour electrolytic formation
of iron with coiled iron cathodes. The electrolyte is 3.0 m in Fe3+ and Li2O.
Temperature (oC) 750 750 750 800
Gas above electrolyte N2 N2 N2 N2
Anode: Ni wire, d = 2.0 mm, l = 16 cm, coil, area: 10 cm2 10 cm2 10 cm2 10 cm2
Cathode: Fe coil, 1.2 mm diameter, length:
surface area:
20 cm 26.5 cm 33 cm 26.5 cm
7.5 cm2 10 cm2 12.5 cm2 10 cm2
Average Potential of electrolysis (V) 1.90 2.1 2.0 1.62
Coulombic efficiency (100%x Fe0 mass exp/theory) 75.4 86.7 84.7 62.8
Table 15. Effect of the electrolysis time in a lower temperature (750 °C) lithium carbonate electrolyte on the electrolytic
formation iron with coiled iron cathodes. The electrolyte is 3.0 m in Fe3+ and Li2O.
Temperature (oC) 750 750 750 750
Gas above electrolyte N2 N2 N2 N2
Anode: Ni wire, d = 2.0 mm, l = 16 cm, coil, area: 10 cm2 10 cm2 10 cm2 10 cm2
Cathode: Fe coil, l = 26.5 cm, d =1.2 mm, area: 10 cm2 10 cm2 10 cm2 10 cm2
Time of electrolysis (h) at 1.0 amp 1h 2h 3h 4h
Coulombic efficiency (100%x Fe0 mass exp/theory) 79.6 86.7 69.6 57.4
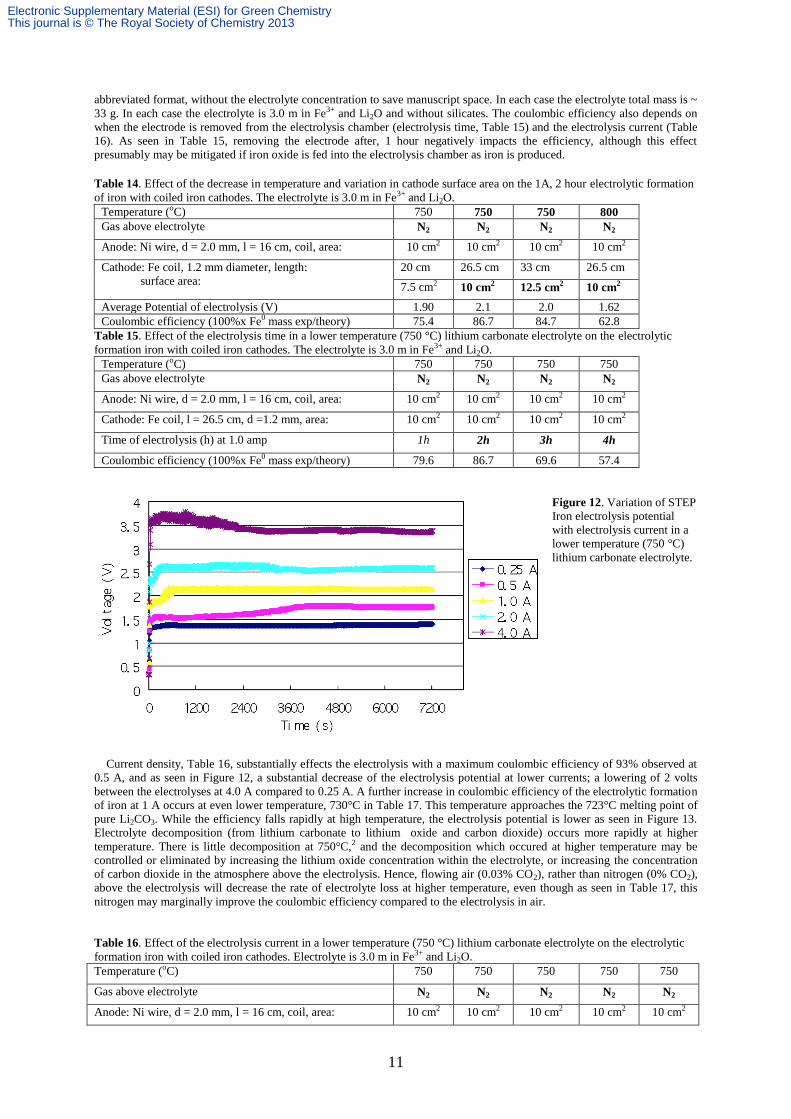
Figure 12. Variation of STEP
Iron electrolysis potential
with electrolysis current in a
lower temperature (750 °C)
lithium carbonate electrolyte.
Current density, Table 16, substantially effects the electrolysis with a maximum coulombic efficiency of 93% observed at
0.5 A, and as seen in Figure 12, a substantial decrease of the electrolysis potential at lower currents; a lowering of 2 volts
between the electrolyses at 4.0 A compared to 0.25 A. A further increase in coulombic efficiency of the electrolytic formation
of iron at 1 A occurs at even lower temperature, 730°C in Table 17. This temperature approaches the 723°C melting point of
pure Li2CO3. While the efficiency falls rapidly at high temperature, the electrolysis potential is lower as seen in Figure 13.
Electrolyte decomposition (from lithium carbonate to lithium oxide and carbon dioxide) occurs more rapidly at higher
temperature. There is little decomposition at 750°C,2 and the decomposition which occured at higher temperature may be
controlled or eliminated by increasing the lithium oxide concentration within the electrolyte, or increasing the concentration
of carbon dioxide in the atmosphere above the electrolysis. Hence, flowing air (0.03% CO2), rather than nitrogen (0% CO2),
above the electrolysis will decrease the rate of electrolyte loss at higher temperature, even though as seen in Table 17, this
nitrogen may marginally improve the coulombic efficiency compared to the electrolysis in air.
Table 16. Effect of the electrolysis current in a lower temperature (750 °C) lithium carbonate electrolyte on the electrolytic
formation iron with coiled iron cathodes. Electrolyte is 3.0 m in Fe3+ and Li2O.
Temperature (oC) 750 750 750 750 750
Gas above electrolyte N2 N2 N2 N2 N2
Anode: Ni wire, d = 2.0 mm, l = 16 cm, coil, area: 10 cm2 10 cm2 10 cm2 10 cm2 10 cm2
Electronic Supplementary Material (ESI) for Green ChemistryThis journal is © The Royal Society of Chemistry 2013
12
Cathode: Fe coil, l = 26.5 cm, d =1.2 mm, area: 10 cm2 10 cm2 10 cm2 10 cm2 10 cm2
Electrolysis current (A) during a 2 hour electrolysis 0.25 0.5 1.0 2.0 4.0
Coulombic efficiency (100%x Fe0 mass exp/theory) 53.7 93.1 86.7 50.3 25.6
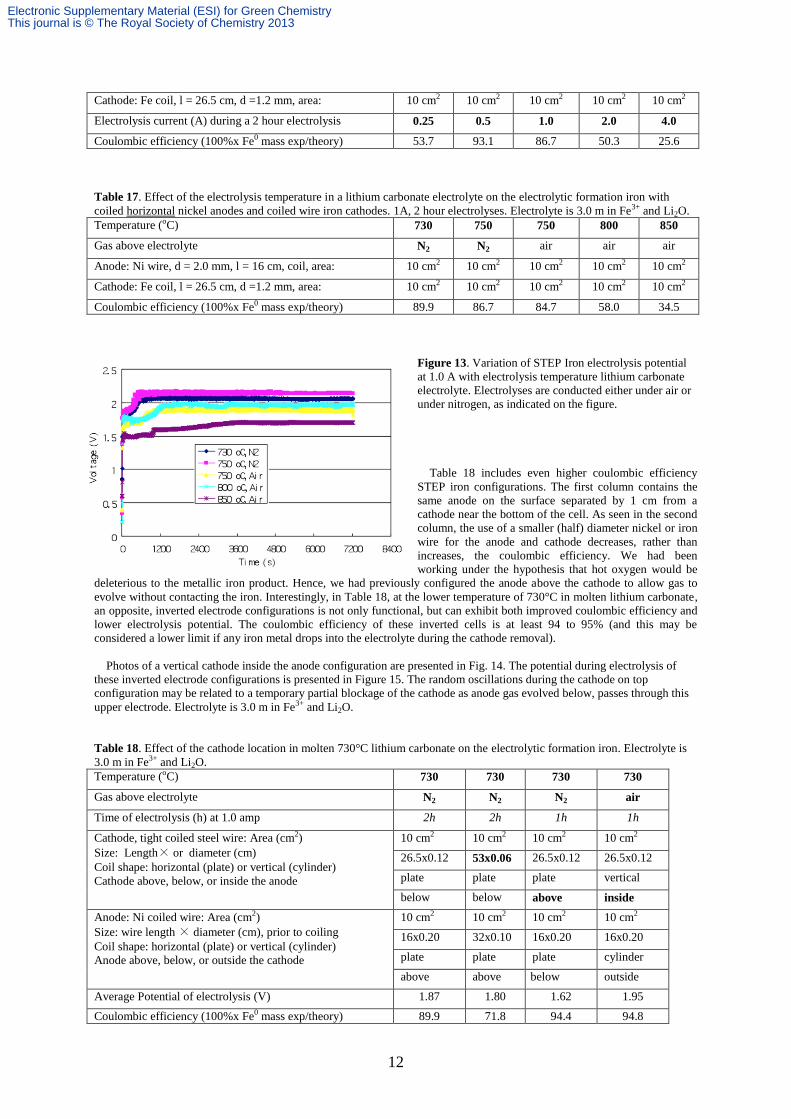
Table 17. Effect of the electrolysis temperature in a lithium carbonate electrolyte on the electrolytic formation iron with
coiled horizontal nickel anodes and coiled wire iron cathodes. 1A, 2 hour electrolyses. Electrolyte is 3.0 m in Fe3+ and Li2O.
Temperature (oC) 730 750 750 800 850
Gas above electrolyte N2 N2 air air air
Anode: Ni wire, d = 2.0 mm, l = 16 cm, coil, area: 10 cm2 10 cm2 10 cm2 10 cm2 10 cm2
Cathode: Fe coil, l = 26.5 cm, d =1.2 mm, area: 10 cm2 10 cm2 10 cm2 10 cm2 10 cm2
Coulombic efficiency (100%x Fe0 mass exp/theory) 89.9 86.7 84.7 58.0 34.5
Figure 13. Variation of STEP Iron electrolysis potential
at 1.0 A with electrolysis temperature lithium carbonate
electrolyte. Electrolyses are conducted either under air or
under nitrogen, as indicated on the figure.
Table 18 includes even higher coulombic efficiency
STEP iron configurations. The first column contains the
same anode on the surface separated by 1 cm from a
cathode near the bottom of the cell. As seen in the second
column, the use of a smaller (half) diameter nickel or iron
wire for the anode and cathode decreases, rather than
increases, the coulombic efficiency. We had been
working under the hypothesis that hot oxygen would be
deleterious to the metallic iron product. Hence, we had previously configured the anode above the cathode to allow gas to
evolve without contacting the iron. Interestingly, in Table 18, at the lower temperature of 730°C in molten lithium carbonate,
an opposite, inverted electrode configurations is not only functional, but can exhibit both improved coulombic efficiency and
lower electrolysis potential. The coulombic efficiency of these inverted cells is at least 94 to 95% (and this may be
considered a lower limit if any iron metal drops into the electrolyte during the cathode removal).
Photos of a vertical cathode inside the anode configuration are presented in Fig. 14. The potential during electrolysis of
these inverted electrode configurations is presented in Figure 15. The random oscillations during the cathode on top
configuration may be related to a temporary partial blockage of the cathode as anode gas evolved below, passes through this
upper electrode. Electrolyte is 3.0 m in Fe3+ and Li2O.
Table 18. Effect of the cathode location in molten 730°C lithium carbonate on the electrolytic formation iron. Electrolyte is
3.0 m in Fe3+ and Li2O.
Temperature (oC) 730 730 730 730
Gas above electrolyte N2 N2 N2 air
Time of electrolysis (h) at 1.0 amp 2h 2h 1h 1h
Cathode, tight coiled steel wire: Area (cm2)
Size: Length× or diameter (cm)
Coil shape: horizontal (plate) or vertical (cylinder)
Cathode above, below, or inside the anode
10 cm2 10 cm2 10 cm2 10 cm2
26.5x0.12 53x0.06 26.5x0.12 26.5x0.12
plate plate plate vertical
below below above inside
Anode: Ni coiled wire: Area (cm2)
Size: wire length × diameter (cm), prior to coiling
Coil shape: horizontal (plate) or vertical (cylinder)
Anode above, below, or outside the cathode
10 cm2 10 cm2 10 cm2 10 cm2
16x0.20 32x0.10 16x0.20 16x0.20
plate plate plate cylinder
above above below outside
Average Potential of electrolysis (V) 1.87 1.80 1.62 1.95
Coulombic efficiency (100%x Fe0 mass exp/theory) 89.9 71.8 94.4 94.8
Electronic Supplementary Material (ESI) for Green ChemistryThis journal is © The Royal Society of Chemistry 2013
13
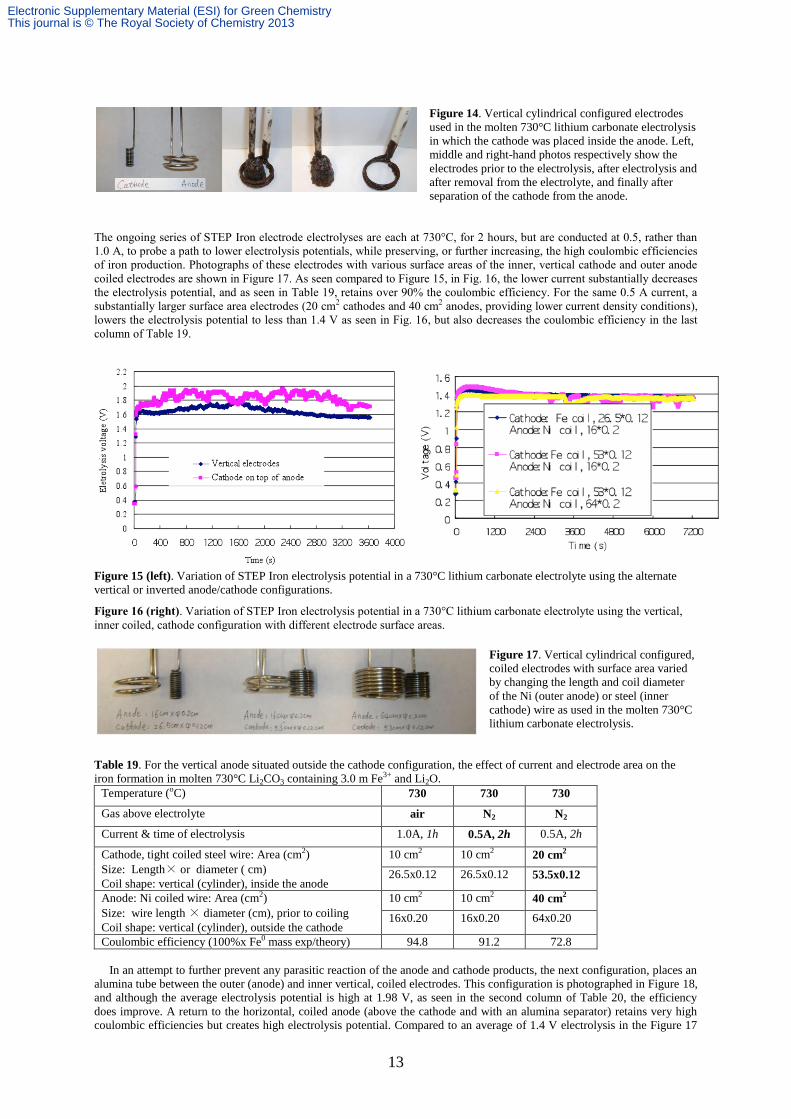
Figure 14. Vertical cylindrical configured electrodes
used in the molten 730°C lithium carbonate electrolysis
in which the cathode was placed inside the anode. Left,
middle and right-hand photos respectively show the
electrodes prior to the electrolysis, after electrolysis and
after removal from the electrolyte, and finally after
separation of the cathode from the anode.
The ongoing series of STEP Iron electrode electrolyses are each at 730°C, for 2 hours, but are conducted at 0.5, rather than
1.0 A, to probe a path to lower electrolysis potentials, while preserving, or further increasing, the high coulombic efficiencies
of iron production. Photographs of these electrodes with various surface areas of the inner, vertical cathode and outer anode
coiled electrodes are shown in Figure 17. As seen compared to Figure 15, in Fig. 16, the lower current substantially decreases
the electrolysis potential, and as seen in Table 19, retains over 90% the coulombic efficiency. For the same 0.5 A current, a
substantially larger surface area electrodes (20 cm2 cathodes and 40 cm2 anodes, providing lower current density conditions),
lowers the electrolysis potential to less than 1.4 V as seen in Fig. 16, but also decreases the coulombic efficiency in the last
column of Table 19.
Figure 15 (left). Variation of STEP Iron electrolysis potential in a 730°C lithium carbonate electrolyte using the alternate
vertical or inverted anode/cathode configurations.
Figure 16 (right). Variation of STEP Iron electrolysis potential in a 730°C lithium carbonate electrolyte using the vertical,
inner coiled, cathode configuration with different electrode surface areas.
Figure 17. Vertical cylindrical configured,
coiled electrodes with surface area varied
by changing the length and coil diameter
of the Ni (outer anode) or steel (inner
cathode) wire as used in the molten 730°C
lithium carbonate electrolysis.
Table 19. For the vertical anode situated outside the cathode configuration, the effect of current and electrode area on the
iron formation in molten 730°C Li2CO3 containing 3.0 m Fe3+ and Li2O.
Temperature (oC) 730 730 730
Gas above electrolyte air N2 N2
Current & time of electrolysis 1.0A, 1h 0.5A, 2h 0.5A, 2h
Cathode, tight coiled steel wire: Area (cm2)
Size: Length× or diameter ( cm)
Coil shape: vertical (cylinder), inside the anode
10 cm2 10 cm2 20 cm2
26.5x0.12 26.5x0.12 53.5x0.12
Anode: Ni coiled wire: Area (cm2)
Size: wire length × diameter (cm), prior to coiling
Coil shape: vertical (cylinder), outside the cathode
10 cm2 10 cm2 40 cm2
16x0.20 16x0.20 64x0.20
Coulombic efficiency (100%x Fe0 mass exp/theory) 94.8 91.2 72.8
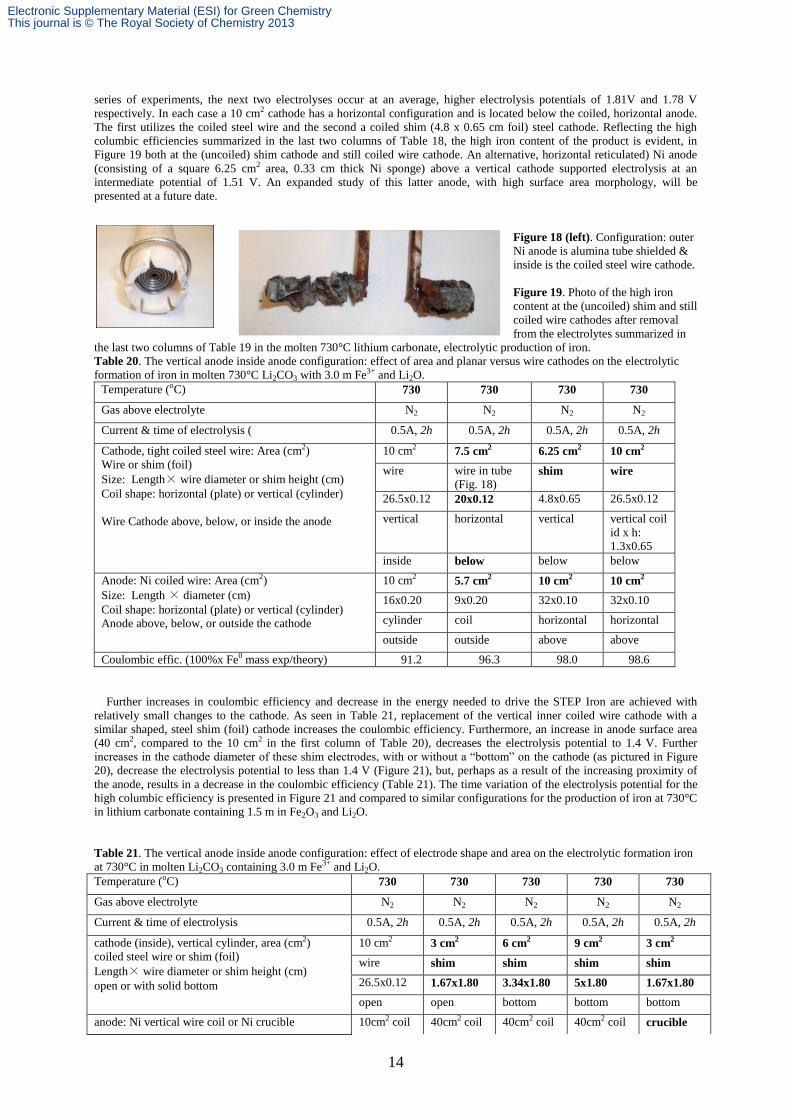
In an attempt to further prevent any parasitic reaction of the anode and cathode products, the next configuration, places an
alumina tube between the outer (anode) and inner vertical, coiled electrodes. This configuration is photographed in Figure 18,
and although the average electrolysis potential is high at 1.98 V, as seen in the second column of Table 20, the efficiency
does improve. A return to the horizontal, coiled anode (above the cathode and with an alumina separator) retains very high
coulombic efficiencies but creates high electrolysis potential. Compared to an average of 1.4 V electrolysis in the Figure 17
Electronic Supplementary Material (ESI) for Green ChemistryThis journal is © The Royal Society of Chemistry 2013
14
series of experiments, the next two electrolyses occur at an average, higher electrolysis potentials of 1.81V and 1.78 V
respectively. In each case a 10 cm2 cathode has a horizontal configuration and is located below the coiled, horizontal anode.
The first utilizes the coiled steel wire and the second a coiled shim (4.8 x 0.65 cm foil) steel cathode. Reflecting the high
columbic efficiencies summarized in the last two columns of Table 18, the high iron content of the product is evident, in
Figure 19 both at the (uncoiled) shim cathode and still coiled wire cathode. An alternative, horizontal reticulated) Ni anode
(consisting of a square 6.25 cm2 area, 0.33 cm thick Ni sponge) above a vertical cathode supported electrolysis at an
intermediate potential of 1.51 V. An expanded study of this latter anode, with high surface area morphology, will be
presented at a future date.
Figure 18 (left). Configuration: outer
Ni anode is alumina tube shielded &
inside is the coiled steel wire cathode.
Figure 19. Photo of the high iron
content at the (uncoiled) shim and still
coiled wire cathodes after removal
from the electrolytes summarized in
the last two columns of Table 19 in the molten 730°C lithium carbonate, electrolytic production of iron.
Table 20. The vertical anode inside anode configuration: effect of area and planar versus wire cathodes on the electrolytic
formation of iron in molten 730°C Li2CO3 with 3.0 m Fe3+ and Li2O.
Temperature (oC) 730 730 730 730
Gas above electrolyte N2 N2 N2 N2
Current & time of electrolysis ( 0.5A, 2h 0.5A, 2h 0.5A, 2h 0.5A, 2h
Cathode, tight coiled steel wire: Area (cm2)
Wire or shim (foil)
Size: Length× wire diameter or shim height (cm)
Coil shape: horizontal (plate) or vertical (cylinder)
Wire Cathode above, below, or inside the anode
10 cm2 7.5 cm2 6.25 cm2 10 cm2
wire wire in tube
(Fig. 18) shim wire
26.5x0.12 20x0.12 4.8x0.65 26.5x0.12
vertical horizontal vertical vertical coil
id x h:
1.3x0.65
inside below below below
Anode: Ni coiled wire: Area (cm2)
Size: Length × diameter (cm)
Coil shape: horizontal (plate) or vertical (cylinder)
Anode above, below, or outside the cathode
10 cm2 5.7 cm2 10 cm2 10 cm2
16x0.20 9x0.20 32x0.10 32x0.10
cylinder coil horizontal horizontal
outside outside above above
Coulombic effic. (100%x Fe0 mass exp/theory) 91.2 96.3 98.0 98.6
Further increases in coulombic efficiency and decrease in the energy needed to drive the STEP Iron are achieved with
relatively small changes to the cathode. As seen in Table 21, replacement of the vertical inner coiled wire cathode with a
similar shaped, steel shim (foil) cathode increases the coulombic efficiency. Furthermore, an increase in anode surface area
(40 cm2, compared to the 10 cm2 in the first column of Table 20), decreases the electrolysis potential to 1.4 V. Further
increases in the cathode diameter of these shim electrodes, with or without a “bottom” on the cathode (as pictured in Figure
20), decrease the electrolysis potential to less than 1.4 V (Figure 21), but, perhaps as a result of the increasing proximity of
the anode, results in a decrease in the coulombic efficiency (Table 21). The time variation of the electrolysis potential for the
high columbic efficiency is presented in Figure 21 and compared to similar configurations for the production of iron at 730°C
in lithium carbonate containing 1.5 m in Fe2O3 and Li2O.
Table 21. The vertical anode inside anode configuration: effect of electrode shape and area on the electrolytic formation iron
at 730°C in molten Li2CO3 containing 3.0 m Fe3+ and Li2O.
Temperature (oC) 730 730 730 730 730
Gas above electrolyte N2 N2 N2 N2 N2
Current & time of electrolysis 0.5A, 2h 0.5A, 2h 0.5A, 2h 0.5A, 2h 0.5A, 2h
cathode (inside), vertical cylinder, area (cm2)
coiled steel wire or shim (foil)
Length× wire diameter or shim height (cm)
open or with solid bottom
10 cm2 3 cm2 6 cm2 9 cm2 3 cm2
wire shim shim shim shim
26.5x0.12 1.67x1.80 3.34x1.80 5x1.80 1.67x1.80
open open bottom bottom bottom
anode: Ni vertical wire coil or Ni crucible 10cm2 coil 40cm2 coil 40cm2 coil 40cm2 coil crucible
Electronic Supplementary Material (ESI) for Green ChemistryThis journal is © The Royal Society of Chemistry 2013
15
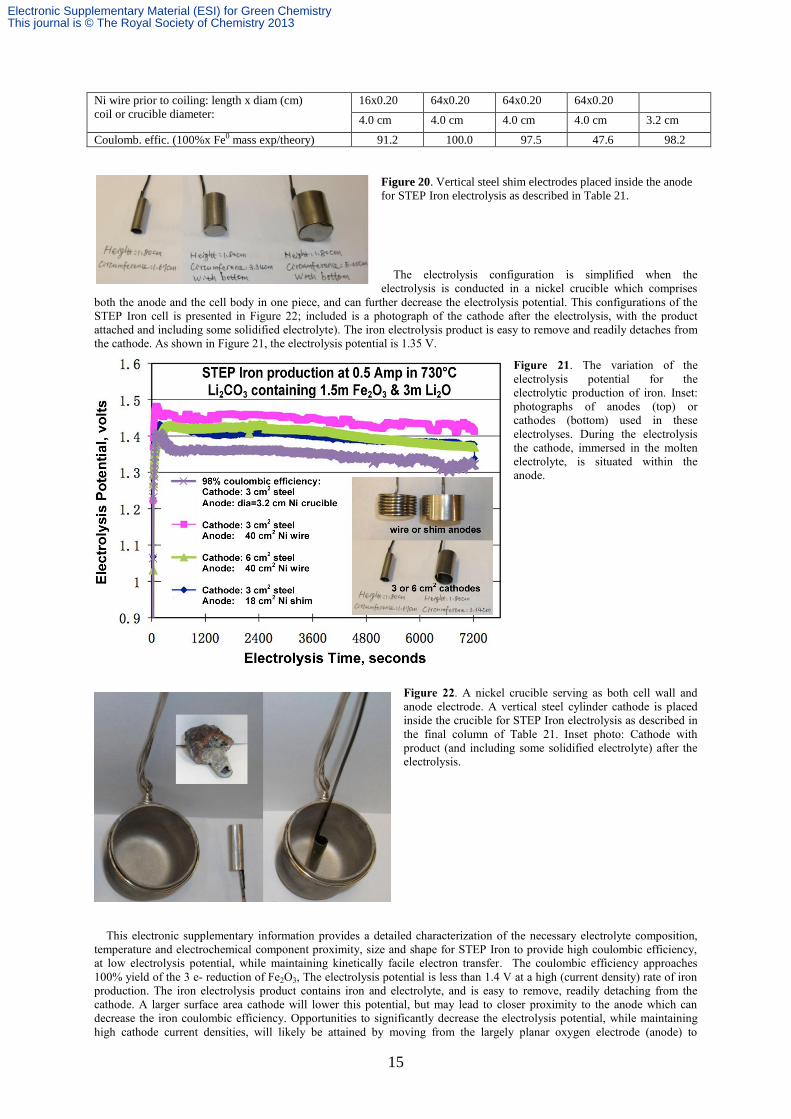
Ni wire prior to coiling: length x diam (cm)
coil or crucible diameter:
16x0.20 64x0.20 64x0.20 64x0.20
4.0 cm 4.0 cm 4.0 cm 4.0 cm 3.2 cm
Coulomb. effic. (100%x Fe0 mass exp/theory) 91.2 100.0 97.5 47.6 98.2
Figure 20. Vertical steel shim electrodes placed inside the anode
for STEP Iron electrolysis as described in Table 21.
The electrolysis configuration is simplified when the
electrolysis is conducted in a nickel crucible which comprises
both the anode and the cell body in one piece, and can further decrease the electrolysis potential. This configurations of the
STEP Iron cell is presented in Figure 22; included is a photograph of the cathode after the electrolysis, with the product
attached and including some solidified electrolyte). The iron electrolysis product is easy to remove and readily detaches from
the cathode. As shown in Figure 21, the electrolysis potential is 1.35 V.
Figure 21. The variation of the
electrolysis potential for the
electrolytic production of iron. Inset:
photographs of anodes (top) or
cathodes (bottom) used in these
electrolyses. During the electrolysis
the cathode, immersed in the molten
electrolyte, is situated within the
anode.
Figure 22. A nickel crucible serving as both cell wall and
anode electrode. A vertical steel cylinder cathode is placed
inside the crucible for STEP Iron electrolysis as described in
the final column of Table 21. Inset photo: Cathode with
product (and including some solidified electrolyte) after the
electrolysis.
This electronic supplementary information provides a detailed characterization of the necessary electrolyte composition,
temperature and electrochemical component proximity, size and shape for STEP Iron to provide high coulombic efficiency,
at low electrolysis potential, while maintaining kinetically facile electron transfer. The coulombic efficiency approaches
100% yield of the 3 e- reduction of Fe2O3, The electrolysis potential is less than 1.4 V at a high (current density) rate of iron
production. The iron electrolysis product contains iron and electrolyte, and is easy to remove, readily detaching from the
cathode. A larger surface area cathode will lower this potential, but may lead to closer proximity to the anode which can
decrease the iron coulombic efficiency. Opportunities to significantly decrease the electrolysis potential, while maintaining
high cathode current densities, will likely be attained by moving from the largely planar oxygen electrode (anode) to
Electronic Supplementary Material (ESI) for Green ChemistryThis journal is © The Royal Society of Chemistry 2013
16
chemically, or mechanically roughened, high microscopic surface area electrodes, and/or using geometric shapes which will
expose more of anode surface than the planar electrode.
Alternative carbonate electrolytes. A more cost effective solution to the corrosivity of the sodium-potassium STEP carbonate
melt (than the use of iridium which is stable as an air electrode during 5 hours of electrolysis in 750°C Na0.23K0.77CO3,
compared to nickel air electrodes which corrode) is found by the addition of calcium carbonate or barium salts to the sodium-
potassium, lithium-free, carbonate melt (the addition of calcium carbonate is shown here for the electrolytic formation of a
carbon product from carbon dioxide splitting, rather than an iron product from iron oxide splittng).12 The addition of calcium
carbonate can decrease the melting point of a carbonate mix. The sodium/lithium carbonate mix, Li1.07Na0.93CO3, has a
melting point of 499°C, but decreases to below 450°C if 2 to 10 mol% equimolar CaCO3 and BaCO3 is added.
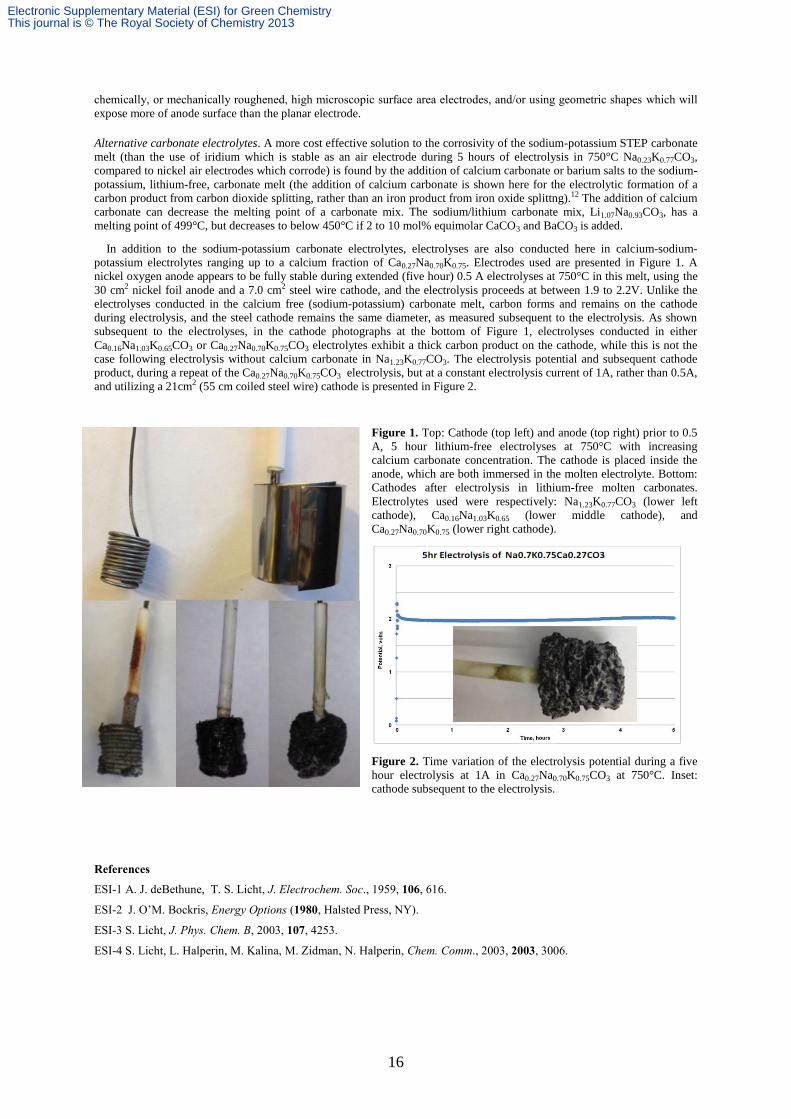
In addition to the sodium-potassium carbonate electrolytes, electrolyses are also conducted here in calcium-sodium-
potassium electrolytes ranging up to a calcium fraction of Ca0.27Na0.70K0.75. Electrodes used are presented in Figure 1. A
nickel oxygen anode appears to be fully stable during extended (five hour) 0.5 A electrolyses at 750°C in this melt, using the
30 cm2 nickel foil anode and a 7.0 cm2 steel wire cathode, and the electrolysis proceeds at between 1.9 to 2.2V. Unlike the
electrolyses conducted in the calcium free (sodium-potassium) carbonate melt, carbon forms and remains on the cathode
during electrolysis, and the steel cathode remains the same diameter, as measured subsequent to the electrolysis. As shown
subsequent to the electrolyses, in the cathode photographs at the bottom of Figure 1, electrolyses conducted in either
Ca0.16Na1.03K0.65CO3 or Ca0.27Na0.70K0.75CO3 electrolytes exhibit a thick carbon product on the cathode, while this is not the
case following electrolysis without calcium carbonate in Na1.23K0.77CO3. The electrolysis potential and subsequent cathode
product, during a repeat of the Ca0.27Na0.70K0.75CO3 electrolysis, but at a constant electrolysis current of 1A, rather than 0.5A,
and utilizing a 21cm2 (55 cm coiled steel wire) cathode is presented in Figure 2.
Figure 1. Top: Cathode (top left) and anode (top right) prior to 0.5
A, 5 hour lithium-free electrolyses at 750°C with increasing
calcium carbonate concentration. The cathode is placed inside the
anode, which are both immersed in the molten electrolyte. Bottom:
Cathodes after electrolysis in lithium-free molten carbonates.
Electrolytes used were respectively: Na1.23K0.77CO3 (lower left
cathode), Ca0.16Na1.03K0.65 (lower middle cathode), and
Ca0.27Na0.70K0.75 (lower right cathode).
Figure 2. Time variation of the electrolysis potential during a five
hour electrolysis at 1A in Ca0.27Na0.70K0.75CO3 at 750°C. Inset:
cathode subsequent to the electrolysis.
References
ESI-1 A. J. deBethune, T. S. Licht, J. Electrochem. Soc., 1959, 106, 616.
ESI-2 J. O’M. Bockris, Energy Options (1980, Halsted Press, NY).
ESI-3 S. Licht, J. Phys. Chem. B, 2003, 107, 4253.
ESI-4 S. Licht, L. Halperin, M. Kalina, M. Zidman, N. Halperin, Chem. Comm., 2003, 2003, 3006.
Electronic Supplementary Material (ESI) for Green ChemistryThis journal is © The Royal Society of Chemistry 2013