Cost Effective Solution for Energy Efficiency in Urban Water Supplies: Developing Countries
16
International Journal of Applied Engineering Research ISSN 0973-4562 Volume 9, Number 18 (2014) pp. 4667-4682 © Research India Publications http://www.ripublication.com Cost Effective Solution for Energy Efficiency in Urban Water Supplies: Developing Countries G Rudra Narsimha Rao 1 * , E Nand Gopal 2 , K V Sharma 3 1, 2 Industrial Energy Group, The Energy and Resources Institute (TERI), Bangalore 3 Department of Mechanical Engineering, Universiti Teknologi PETRONAS, Perak, Malaysia * Corresponding Author Tel: +91 80 25356590, Fax: +91 80 25356589 E-mail: [email protected] Abstract In several developing countries, the share of urban water utilities’ electrical energy consumption is over 5% of national electricity production. Energy cost is usually between 40 to 60% of the total operating cost of an urban water supply system. In urban water supply systems 90% of this electrical energy is consumed by pumps. The issues pertaining to developing countries are different than developed countries in this particular area. A huge sum of town council budget amount goes for paying electrical utility bills. The cost savings in water supply can lead to effective quality services (such as education, health, water and sanitation) to the local communities. One of the essential elements for optimizing energy cost of urban utilities is data monitoring and analysis. In the paper, case studies are presented to show-case importance of data analysis. Understanding of present tariffs and operational improvements itself results into a significant cost savings. A small improvement in pumping efficiency would yield significant reduction in energy consumption, which would in turn lead to reduction of carbon emissions to the atmosphere. Several energy efficiency studies show that there is a significant scope for energy costing savings in urban water pumping operations. However, a key barrier for carrying out energy efficiency improvement programme is the lack of knowledge and skill sets among the operational staff. To assist the water utility staff a web based interactive tool has been developed for identification of energy cost saving opportunities. The tool will contain the elements such as selection of appropriate measures, implementation and day-to-day management, and a monitoring system for the water works. The implications due to the use of such an online tool and its benefits are deliberated in the paper.
Transcript of Cost Effective Solution for Energy Efficiency in Urban Water Supplies: Developing Countries

International Journal of Applied Engineering Research ISSN 0973-4562 Volume 9, Number 18 (2014) pp. 4667-4682 © Research India Publications http://www.ripublication.com
Cost Effective Solution for Energy Efficiency in Urban Water Supplies: Developing Countries
G Rudra Narsimha Rao1 *, E Nand Gopal2, K V Sharma3
1, 2 Industrial Energy Group, The Energy and Resources Institute (TERI), Bangalore 3Department of Mechanical Engineering, Universiti Teknologi PETRONAS,
Perak, Malaysia * Corresponding Author Tel: +91 80 25356590, Fax: +91 80 25356589
E-mail: [email protected]
Abstract
In several developing countries, the share of urban water utilities’ electrical energy consumption is over 5% of national electricity production. Energy cost is usually between 40 to 60% of the total operating cost of an urban water supply system. In urban water supply systems 90% of this electrical energy is consumed by pumps. The issues pertaining to developing countries are different than developed countries in this particular area. A huge sum of town council budget amount goes for paying electrical utility bills. The cost savings in water supply can lead to effective quality services (such as education, health, water and sanitation) to the local communities. One of the essential elements for optimizing energy cost of urban utilities is data monitoring and analysis. In the paper, case studies are presented to show-case importance of data analysis. Understanding of present tariffs and operational improvements itself results into a significant cost savings. A small improvement in pumping efficiency would yield significant reduction in energy consumption, which would in turn lead to reduction of carbon emissions to the atmosphere.
Several energy efficiency studies show that there is a significant scope for energy costing savings in urban water pumping operations. However, a key barrier for carrying out energy efficiency improvement programme is the lack of knowledge and skill sets among the operational staff. To assist the water utility staff a web based interactive tool has been developed for identification of energy cost saving opportunities. The tool will contain the elements such as selection of appropriate measures, implementation and day-to-day management, and a monitoring system for the water works. The implications due to the use of such an online tool and its benefits are deliberated in the paper.

4668 G Rudra Narsimha Rao et al
I INTRODUCTION In India the share of the urban water utilities’ electrical energy consumption is over 5% of the national electricity production, similar to many other developing countries. Pumping energy cost forms an important part of the operational cost of water distribution systems worldwide. Upgrading motors and pumps with energy efficient ones and properly adjusting them for system requirement often allow significant energy savings [1]. Changing the pumping operational procedures is a very effective way for optimizing its energy consumption and it does not need any additional investment, the reduction in energy cost occurs immediately. Efforts to increase energy efficiency can reduce electrical consumption for pumping by as much as 5% – 25%, and sometimes even greater savings are realized [2]. The major component of the life cycle cost (LCC) of pumps is related to the energy spent in pumping, the remaining being related to the purchase and maintenance of the equipment. The issues pertaining to India is different than developed countries in this particular area. A huge sum of town municipality budget amount goes for paying electrical utility bills The cost savings in water supply can lead to effective quality services (such as education, health, water and sanitation) to the local communities. One of the essential elements for optimizing energy cost of urban utilities is data monitoring and analysis. Understanding of present tariffs and operational improvements itself results into a significant cost savings. A small improvement in pumping efficiency would yield significant reduction in energy consumption, which would in turn lead to reduction of carbon emissions to the atmosphere. In recent years, municipalities in global scenario are finding it challenging to supply potable quality piped drinking water due to a phenomenal growth in the urban population over past five decades. The issues affecting the water sector include disparity in water supply across regions, depletion of ground water and undercapitalized municipalities. The disruption in the monsoon rainfall pattern and rising energy tariffs has also created problems in meeting additional water requirement. Municipalities are spending large portions (40 - 60% of budget) of their revenues on purchasing energy for providing public services such as street lighting and water supply [3]. According to a recent Electric Power Survey, the Public Water Works in India consumes more than 12000 MUs and Public Lighting consumes 5000 MUs of electricity. Theoretical studies and practical implementation of optimal pump scheduling in various types of supply systems suggest that 10 % of the annual expenditure on energy and related costs may be saved if proper optimization methods are used [4]. The objectives is to analysis the water utility system, and simulate several scheduling scenarios with optimized pumps in order to minimize the expenditure related to energy consumption, based on the demand patterns and associated energy tariffs. At the same time, there is also a need for creation of awareness among the operating staff of water utilities on energy issues, steps for evaluation of their operating system from energy performance view point, identification of energy efficiency opportunities and induction of energy management approaches for integrating better standards and practices in everyday operation of water utilities.
Cost Effective Solution for Energy Efficiency in Urban Water Supplies: 4669
II MUNICIPAL WATER SUPPLY SYSTEMS The basic classification of water supply is based on type of source - ground water and surface water. Ground water sources (such as wells) indicate that the water is below ground level or the earth’s surface. Depending on the depth of the well, a pump may be able to transport the water directly to the water treatment facility; or else one or more pumps are needed in series to move water to the treatment location. The treated water can be pumped to water storage facilities or pumped directly into the distribution system. There are two basic types of water supply systems which are used to create water pressure within the distribution system are gravity feed system and pumping pressure system. Difference in elevation between the water treatment plant and the municipal area to be served, the water may flow by gravity through the distribution systems, or there may be the need for another pumping station. Sometimes a combination of gravity flow and one or more pumping stations could be suitable and economical to transport water from the source point to all the water demand points on the distribution system [5]. The fundamental correlation between water and energy is not widely understood or adequately exploited through coordinated holistic efficiency approaches. The water-energy relationship is based on the reality that treating water for human consumption and pumping treated water to the consumer is an extremely energy intensive process. Every single litre of water that passes through a system represents a substantial energy cost. A review of demand management techniques applicable for developing countries can be found in Vairavamoorthy & Mansoor [6]. One of the energy efficient methods to meet municipal water demand and flow control, particularly for systems where static head is a high proportion of the total head, is to install two or more pumps and operate them in parallel. A variation in flow rate is achieved by switching on and off additional pumps to meet the demand. The combined pump curve is obtained by adding the flow rates at a specific head. The system curve is usually not affected by the number of pumps that are running. It is also apparent that the flow rate with two pumps running is not double that of a single pump. If the system head was only static, then the flow rate would be proportional to the number of pumps operating. Care must be taken when running pumps in parallel to ensure that the operating point of the pump is controlled within the region deemed as acceptable by the manufacturer [7]. III METHODOLOGY The data gathered from municipal water pumping stations in various cities and towns, where energy conservation studies were conducted in India, have been used in the analysis [1]. The flow rate and quantity of water pumped, the number of pumps in use, the duration of operation, motor rewinding history was recorded for each station. The actual flow rate of water, inlet and outlet pressures at the pump, power consumed at each installation were measured using the following instruments: • Portable load manager to monitor and log the transformer parameters (Voltage,
current, power factor, kW, kVA, kVAr, Hz, kWh);

4670 G Rudra Narsimha Rao et al
• Clamp on electrical power analyzers to measure and log the individual motor parameters (Voltage, current, power factor, kW, kVA, kVAr, Hz, kWh);
• Ultrasonic water flow meter to measure the velocity and flow rate of water at the pump and in piping system;
• Digital pressure sensor to measure the delivery head of the pumps. Motor characteristics curves for various ratings collected from the manufacturers and used during the analysis. The above measurements and analysis carried out for over 433 pumps of different ratings (connected motor to pumps 11 kW to 2600 kW) installed across 98 pumping stations in five states in India are given in Table 1.
Table 1 Details of pumping stations used for analysis
City / State No. of pumping stations
No. of pumps (Operation)
Annual Energy Consumption, million kWh
Bangalore 9 67 179 Delhi 7 49 129 Pune 6 38 76.7 Vishakhapatnam 4 13 48.7 Andhra Pradesh (2 Municipalities)
5 16 3.5
Karnataka (11 Municipalities)
26 46 62.4
Tamil Nadu (25 Municipalities)
41 204 41.7
It was observed that water scarcity is significant in many locations and in some cases it is seasonal in nature. Most of the water pumping stations was not equipped with measuring devices to know the actual performance of the systems. Pump efficiency is linked to impeller design, and hence have a specific speed. Pumps that produce a ‘high head’ have ‘low specific speed’ and vice versa. This is an important selection criterion since for a given head and capacity, a pump with a lower specific speed will safely operate at a lower NPSH compared to that with a higher specific speed. Overall efficiency = Hydraulic efficiency x volumetric efficiency x mechanical efficiency (1) To achieve maximum overall efficiency it is clear that we should achieve maximum of hydraulic efficiency, volumetric efficiency, and mechanical efficiency. For increasing efficiency it is essential to reduce the respective losses. IV DATA ANALYSIS AND ENERGY SAVING POTENTIAL A selection 16 municipality, based on population coverage to suit Indian towns has

Cost Effective Solution for Energy Efficiency in Urban Water Supplies: 4671
been done via sampling. Analysis of these16 towns/cities is presented in this section. The collected data was analyzed based on the water availability at the source and the present installed capacity of the pumping stations. The comparison of the per capita figure against the all India norms of 135 LPCD (litres per person per day) water supplies reveals the deviation from this norm at these municipal towns.
Figure 1 Classification on the basis of per capita water supply
As seen from the above chart the difference in the amount of water received varies largely from town to town, and 75% of the towns receive less than the all India norms fixed by the government. A major reason for this is the non-availability of water at the source. It is also not unusual that the schemes with low installed capacity integrate bore-well water at numerous locations within the municipal vicinity area. In various cases these bore-wells are hand operated. The comprehensive detailed study revealed that significant potential exists in municipal water pumping installations in terms of improving the energy efficiency. The details of energy and cost savings identified, as a result of the energy audit is classified in terms of the percentage saving potential, are given in figure 2.
Figure 2 Percentage energy saving potential
The costs that can be saved by implementing energy saving measures can be utilized for the following initiatives:
4672 G Rudra Narsimha Rao et al
Improved water quality deliverables to the end users Better maintenance and house-keeping practices Advanced metering and monitoring facilities Creating awareness programmes on energy efficiency in other/neighboring
municipalities Some of the additional benefits could include Improved quality of water Better hygienic conditions Improved accounting of water Awareness among municipal staff on energy efficiency issues which leads to
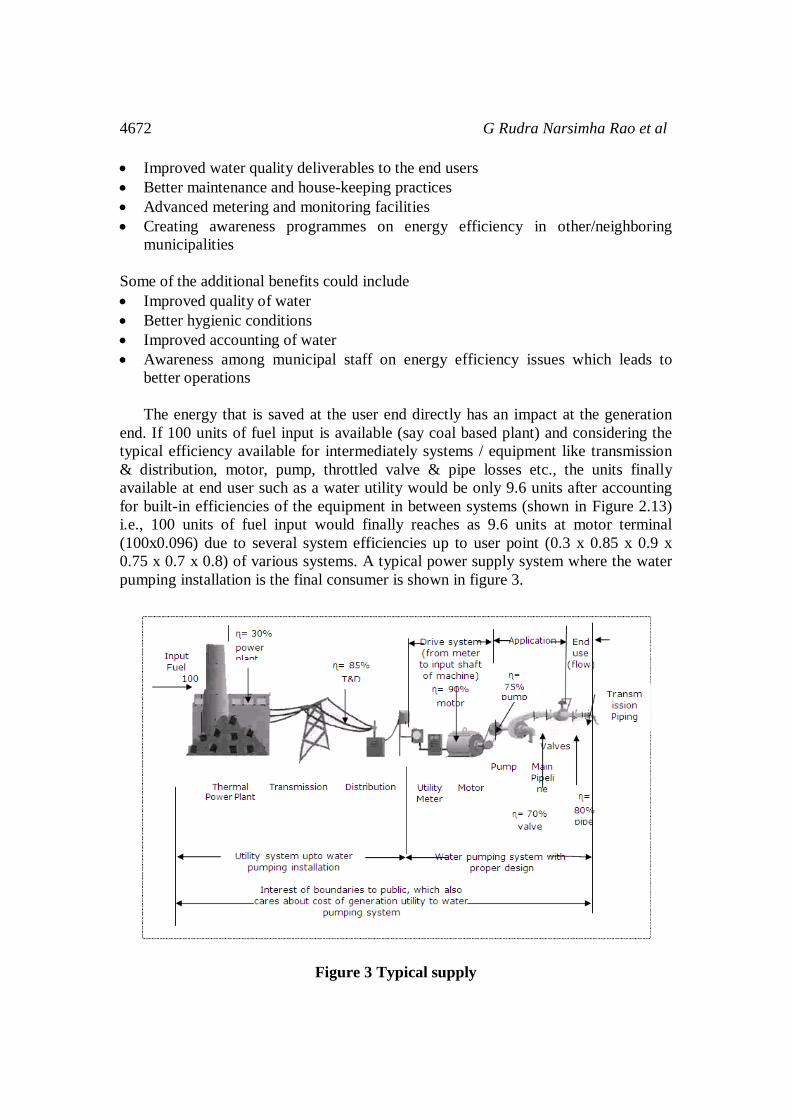
better operations The energy that is saved at the user end directly has an impact at the generation end. If 100 units of fuel input is available (say coal based plant) and considering the typical efficiency available for intermediately systems / equipment like transmission & distribution, motor, pump, throttled valve & pipe losses etc., the units finally available at end user such as a water utility would be only 9.6 units after accounting for built-in efficiencies of the equipment in between systems (shown in Figure 2.13) i.e., 100 units of fuel input would finally reaches as 9.6 units at motor terminal (100x0.096) due to several system efficiencies up to user point (0.3 x 0.85 x 0.9 x 0.75 x 0.7 x 0.8) of various systems. A typical power supply system where the water pumping installation is the final consumer is shown in figure 3.
Figure 3 Typical supply

Cost Effective Solution for Energy Efficiency in Urban Water Supplies: 4673
For every unit saved at the pumping station, generation can be reduced by almost 9.6 times since there are several intermediary players for the power to reach the end users. Generally for every unit produced in coal based power plants reduces the emission by almost 0.78 kilograms [8]. The figure depends on the efficiency of coal based power plants and the station heat rates. As per the Central Electricity Authority report on 17th Electric Power Survey, the annual energy consumption of water supply systems is 12, 000 million units. A 10% reduction in energy consumption by incorporating energy efficiency measures will amount to 1, 200 million units reduction in energy at the user end thereby yielding 11, 520 million units reduction potential at the generation end. The GHG emission reduction potential works out to 9.33 million MTCO2e annually. V CASE STUDIES The case studies presented below are from Municipalities of two states from southern India: Andhra Pradesh and Karnataka. The case studies are broadly divided into 3 categories: Electrical systems and drives Pumping system Operational and other aspects Electrical systems and drives Case Study 1: Fine tuning of the existing contract demand to meet the present loading conditions The installation had a contract demand of 1000 kVA. The minimum billing demand being 80% of the contract demand is 800 kVA. From the electricity bills it was observed that the installation is paying for the minimum billing demand even though the actual recorded demand is less than 800 kVA. The measured instantaneous contract demand is 172 kVA when one pump operates with the submersible pumps. The average maximum demand for the last six months is 223 kVA for the same combination of pumps. In this scenario, after taking into consideration the operation of various pumps at different seasons, potential exists to restructure the contract demand to reduce the fixed cost throughout the year. TERI recommended the reduction in the contract demand to 300 kVA from the existing level of 1000 kVA, thereby surrendering 700 kVA. This reduced the minimum billing demand to 250 kVA. From the previous month’s electricity bill, it was observed that the maximum load was 239 kVA at 0.94 pf. The reduced contract demand was able to cater to the above load. The proposal was successfully implemented which resulted in a demand saving to the tune of 650 kVA amounting to Rs. 15.21 lakhs annually. Case Study 2: Installation of capacitors to improve power factor (pf) and reduce kVA demand The present monthly average power factor is 0.83. The installation has paid a penalty of Rs 4.32 lakh annually for low average pf and excess kVA demand consumption.

4674 G Rudra Narsimha Rao et al
Presently, 110 kVAr capacitor banks are installed for the system, but only 70 kVAr is put in service. The 2 x 20 kVAr capacitors are old and one or two units are not functioning. Installation of additional 125 kVAr capacitors for the existing system was recommended. This measure was meant to improve the power factor to 0.95 and also bring down the recorded maximum demand by approximately 100 kVA. The recommendation was implemented, which resulted in savings of the penalty charges to the tune of Rs. 4.32 lakhs annually. Also it resulted in a demand reduction of 101 kVA amounting to Rs. 2.18 lakhs annually thereby totaling the savings to Rs. 6.5 lakhs annually. The cost of implementation required to necessitate this proposal was Rs. 1.20 lakhs which resulted in a simple payback period of 4 months. Case Study 3: Switching “OFF” one transformer of 750/1000 kVA rating when one pump is not in operation The pumping station operates 2 out of the three pumps at any given point of time. Two transformers of 750 kVA (in parallel) and one of 1000 kVA transformer supplies pump 1 and 2. The pump 3 is out of order and switching “off” one transformer can result in saving iron losses. When all the pumps are in working condition, the cyclic pattern of switching off transformers can be proposed, which can be done by changing the combination of the pumps. The above also reduces reactive power drawn from the grid.Switching “off” one transformer of 750/1000 kVA rating in cyclic rotation can result in energy savings. However care must be taken to energize the transformer at least once in two weeks (during long outage of pumps) and it is appropriate to avoid the exercise during monsoon months (energy savings considered for 8 months in a year and avoiding 4 monsoon months). The annual energy saving potential after implementing this measure worked out to 5, 760 kWh amounting to Rs. 0.21 lakhs with nil investment. Pumping system Case Study 4: Suitable sizing of booster pumps The water supply utility has been equipped with a booster pumping station which has 2 centrifugal pumps installed of which one operates to supply water to a reservoir which is located at a distance of 8 km from the pumping station. The rated parameters of the pumps are 660 lps @ 62 m head. The measured parameters are 670 lps @ 46 m head for pump 1 and 710 lps @ 46 m head for the second. The power drawn by the motor was 500 kW. The operating efficiency of the pumps is 61% and 64% respectively. The design figures indicate that the pumps should achieve efficiency figures of over 75% considering the sizing of these pumps. The reason for deviation in efficiency is the mismatch in heads, to the tune of 16 m from the rated and the actual. It was recommended that the pump be replaced with a suitably sized one having a specification of 710 lps @ 48 m. The overall efficiency from the manufacturer was learnt to be 80% for this size. After implementing this measure the reduction in power was found to be around 84 kW amounting to 7.3 lakh kWh of energy savings. The
Cost Effective Solution for Energy Efficiency in Urban Water Supplies: 4675
value of cost saving potential worked out to Rs. 25 lakhs with an investment of Rs. 10 lakhs for the pumps alone. The simple payback period worked out to be within 5 months from the date of installation. Case Study 5: Replace the present pump with high efficiency pump The pumping station has a single 610 HP pump installed to cater water to the booster pumping station which is situated at a distance of 15 km from the head works. The rated parameters of the pump are 237 lps @ 128 m head. The measured parameters are 188 lps @ 122 m head and the power drawn by the motor was 406 kW. The operating efficiency of the pump was estimated at 56%. It can be seen that there is no significant mismatch in heads from the rated and the actual requirement. The efficiency of the pumps has deteriorated due to the age, excess wear and tear and also due to increased clearances between casing and impeller. Energy conservation study recommended the replacement of the existing pump with a high efficiency pump having 250 lps @ 128 m head and an operating efficiency of 78%. The pump selected was of a higher capacity only with a view to reduce the number of pumping hours and also because the existing pipe had higher water carrying capacity. The implementation of this measure had several other benefits such as reduced specific energy consumption per ML of water pumped, increased output, decreased number of operating hours for the same water quantity or increased water availability. The implementation of the measure will result in an annual energy saving potential of 7.7 lakh kWh amounting to Rs. 30.7 lakhs with the cost of implementation being Rs. 24 lakhs. The simple payback period for this measure worked out to 9 months. Case Study 6: Replace the impellers of the present pump with new one The pumping station has two 600 HP centrifugal pumps of which one pump are operated to supply water to the water treatment complex. The rated parameters of the pumps are 357 lps @ 85 m head and pump efficiency of 84%. The measured parameters indicate a flow of 340 lps @ 74 m head from pump 2. The corresponding estimated overall efficiency is 59%. There seems to be wide difference between the rated and the actual efficiency figures. The reason for the deviation is the worn out impellers. Also the pumps have been designed for the ultimate stage and hence around ‘11m’ head difference exists from the rated and the actual one. It was suggested to replace the present impellers with a suitable sized one. Care has to be taken such that the head difference is not that high and also the water quantity should not differ. The implementation of this measure resulted in the following benefits such as reduction in power consumption and reduced specific energy per ML of water pumped. The implementation of this measure yielded a net annual energy saving of 7.74 lakh amounting to Rs. 29 lakh with an investment cost of Rs. 12 lakh. The simple payback period worked out to be within 5 months.
4676 G Rudra Narsimha Rao et al
Case Study 7: Modification in the existing piping network for enhanced water flow The pumping station has four centrifugal pumps of which two pumps are operated in parallel. The rated capacity of each pump is 15.86 MGD at 50 Hz, whereas the present drawing is only 14.23 MGD. So a 15% deficit exists from the rated capacity. The reason for the deficit is due to the existing piping network of the main header and the individual delivery pipes joining the header. The joining of the delivery pipes to the common header resulted in more resistance of flow for the parallel operation of pumps. The performance of the succeeding stations was also affected as the installations are designed similarly. The output of the pumps can be enhanced by modifying the existing header system. An additional new header connecting the alternate pumps has to be laid. This new header can be joined to the main header after a distance of 100 m or so. After modification in the existing network, an additional 1.4 MGD quantity of water can be drawn with negligible increment in power consumption, which results in reduction in specific energy consumption by 8.6%. The implementation of this measure resulted in an annual energy savings of 5.9 lakh kWh amounting to Rs. 20 lakh. The cost of implementation of the modification was Rs. 5.0 lakh, and the simple payback period worked out to be within 3 months. Operational and other aspects Case Study 8: Improving the main water flow distribution system A detailed flow pattern was carried out on the main transmission lines to assess water loss due to leakage andscope for improvements. The assessment indicated that the quantity of leakage accounted for 37% of the water that was being pumped from the head works. A majority of the leaks were quantity from the lead joints. Rectification of these joints will improve the main transmission system thereby reducing the leakage level to less than 10%. The proposal was implemented successfully which resulted in reducing the leakage quantity to less than 10% of the total water pumped. This resulted in saving of equivalent annual energy potential to 5.3 lakh kWh amounting to Rs. 21 lakh. The cost of implementation was Rs. 2.0 lakh only and the simple payback period worked out within a month. Case Study 9: Rescheduling of pump operation The pumping station has installed four centrifugal pumps. Normally two pumps are operated in parallel with delivery valves of both the pumps being throttled to match the inflow water quantity from the preceding station. The scheme description is as follows. Water is drawn from the treatment plant by gravity to the Ground Level Storage Reservoir (GLSR) of 4.0 ML capacity located at the pumping station. The present pumps under throttled condition are pumping 12.2 MGD of water. Due to this the efficiency of the pumps has fallen to 61%. Trials were carried out with the existing pumps like individual operation of pumps with full valve

Cost Effective Solution for Energy Efficiency in Urban Water Supplies: 4677
open and parallel operation with full valve open. The efficiency of the pumps when running independently is 73% and that under parallel operation is 65%. So there is an improvement in the operating efficiency of the pumps when throttling is avoided. Also the flow quantity has increased to 14.3 MGD from 12.2 MGD indicating an improvement of water pumping potential by 17%. It is also to be noted that when the pump is operated independently, the water quantity measured is 10 MGD. It can be seen that to pump an additional quantity of 2.2 MGD of water, a second pump is operated in parallel with the first. But as these pumps have the capacity to pump more water (14.3 MGD), the delivery valves of the pumps are throttled to match the inflow conditions from the water treatment plant. As the water receiving to the GLSR is constant from the water treatment plant, a scheme was devised with trials carried out with the available combination of pumps. Operation of one or two pumps or two pumps (with full valve opening) based on the water level in the tank will result in significant energy savings. Two pumps can be operated (with full valve open) when the water level is full in the GLSR. When the water level reaches 1/4th level of the tank one pump can be operated. To create this kind of an arrangement of operation of pumps, the following incorporations need to be done; Incorporation of motorized controls for the valves for automatic opening and
closing of valves before starting and stopping, Level controllers for GLSR tanks to be installed at 1/4th and at full tank level, Auto starting of pumps/stopping of one pump based on level controls (one pump
will be stopped when water level reaches 1/4th level of the tank and two pumps will be started when tank is filled)
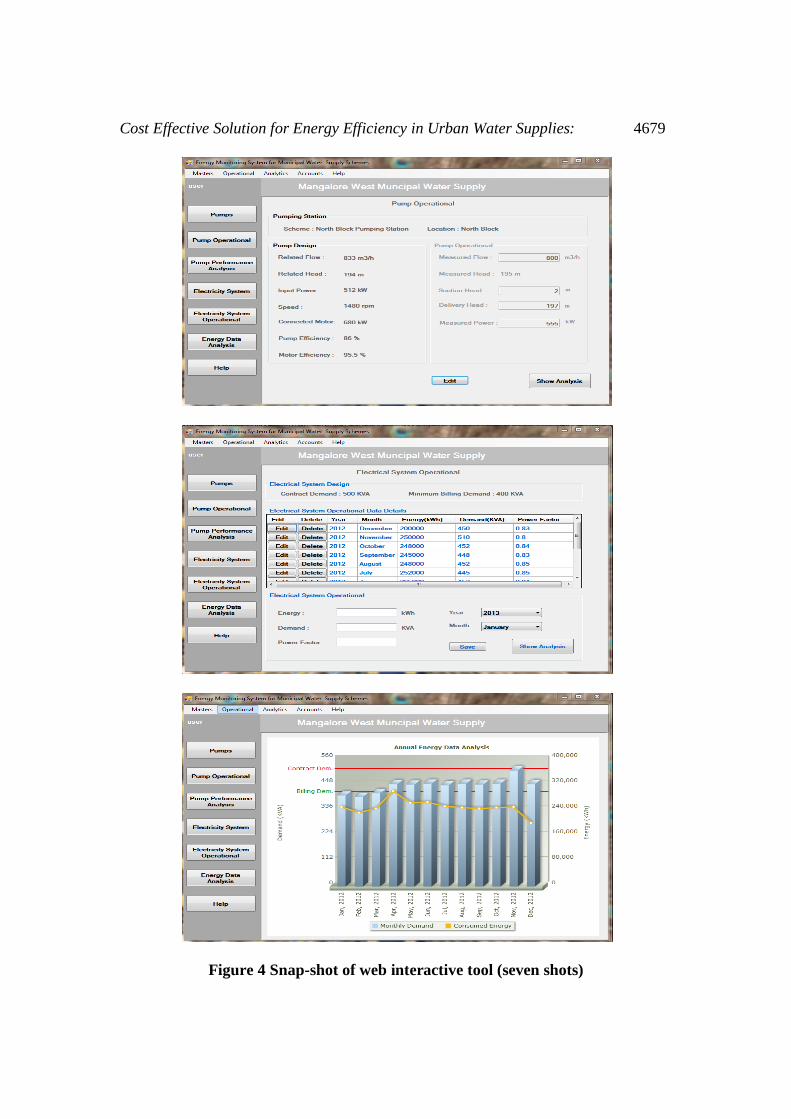
Dual ring mode sirens for level controllers Implementation of the measures resulted in operating of pumps at higher efficiency, reduced specific energy consumption per ML of water pumped, increased output from pumps, increased life of pump and motor and increased flexibility of pump operation. The implementation of this measure resulted in an annual energy saving potential of 19.5 lakh kWh amounting to Rs. 68 lakh. The cost of implementation for level controllers, motorized valves, and dual ring mode sirens was estimated to be Rs. 3.0 lakh. The simple payback period worked out to be within a month’s time. VI Web Interactive Monitoring Tool A monitoring tool has been developed to capture basic infrastructure details of municipal water pumping systems (such as electrical system and its prevailed tariff structure, pumps and its configuration, specifications etc.). These details can be entered along with registration. A back end data base storage has been created which captures all the entered monthly details (billing details, operating hours, number of pumps in use etc.). A comparative analysis is carried out based on operational data versus design (or) allocated data applicable to a particular pumping station. The results are displayed in terms of graphical representation which can be viewed and

4678 G Rudra Narsimha Rao et al
understood by the operating staff (skilled or unskilled). Depending upon the available instrumentation / information pumping station level data can be entered. It can be analyzed on a monthly and daily basis. The tool is a web interactive mode of operation with availability of expert services which is optional, where municipal utility staff can pose questions to the experts based on the data furnished. The technical expert team also can view the furnished data and provide free advisory services through mail (or phone). This will help the municipal staff to take necessary steps to enhance the pumping system operating efficiency. Some of the screen shots of online interactive tool are furnished in figure 4.
Cost Effective Solution for Energy Efficiency in Urban Water Supplies: 4679
Figure 4 Snap-shot of web interactive tool (seven shots)
4680 G Rudra Narsimha Rao et al
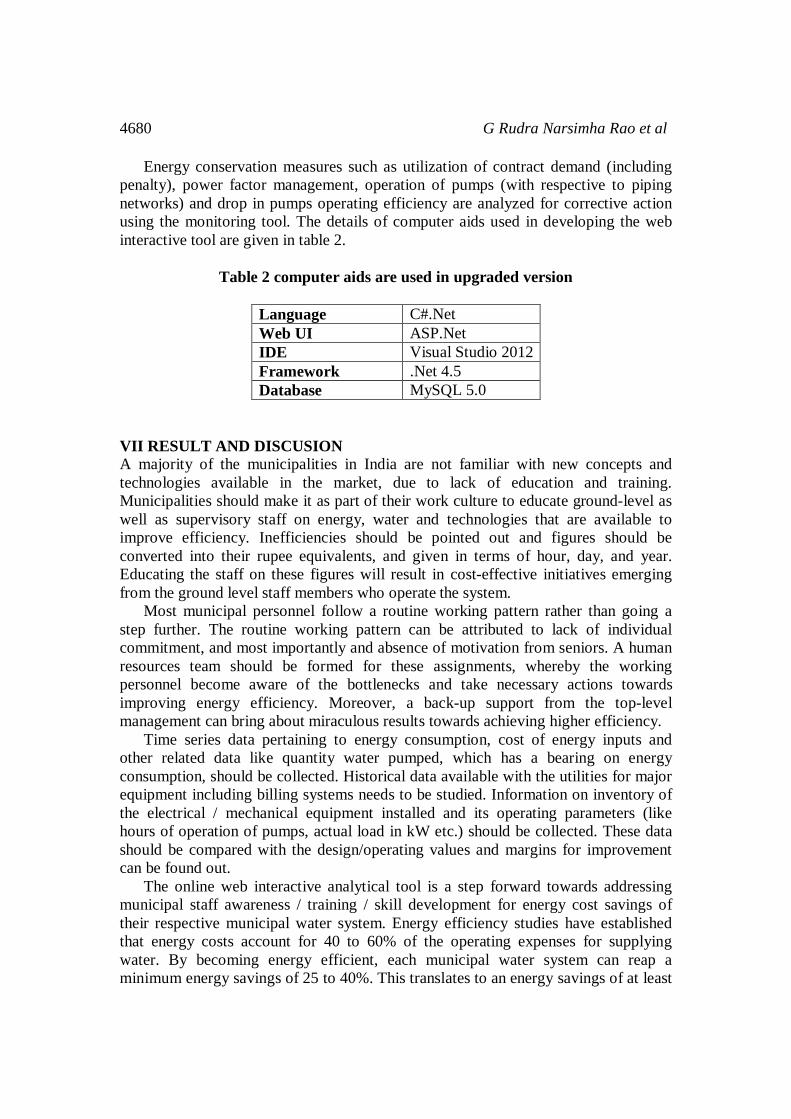
Energy conservation measures such as utilization of contract demand (including penalty), power factor management, operation of pumps (with respective to piping networks) and drop in pumps operating efficiency are analyzed for corrective action using the monitoring tool. The details of computer aids used in developing the web interactive tool are given in table 2.
Table 2 computer aids are used in upgraded version
Language C#.Net Web UI ASP.Net IDE Visual Studio 2012 Framework .Net 4.5 Database MySQL 5.0
VII RESULT AND DISCUSION A majority of the municipalities in India are not familiar with new concepts and technologies available in the market, due to lack of education and training. Municipalities should make it as part of their work culture to educate ground-level as well as supervisory staff on energy, water and technologies that are available to improve efficiency. Inefficiencies should be pointed out and figures should be converted into their rupee equivalents, and given in terms of hour, day, and year. Educating the staff on these figures will result in cost-effective initiatives emerging from the ground level staff members who operate the system. Most municipal personnel follow a routine working pattern rather than going a step further. The routine working pattern can be attributed to lack of individual commitment, and most importantly and absence of motivation from seniors. A human resources team should be formed for these assignments, whereby the working personnel become aware of the bottlenecks and take necessary actions towards improving energy efficiency. Moreover, a back-up support from the top-level management can bring about miraculous results towards achieving higher efficiency. Time series data pertaining to energy consumption, cost of energy inputs and other related data like quantity water pumped, which has a bearing on energy consumption, should be collected. Historical data available with the utilities for major equipment including billing systems needs to be studied. Information on inventory of the electrical / mechanical equipment installed and its operating parameters (like hours of operation of pumps, actual load in kW etc.) should be collected. These data should be compared with the design/operating values and margins for improvement can be found out. The online web interactive analytical tool is a step forward towards addressing municipal staff awareness / training / skill development for energy cost savings of their respective municipal water system. Energy efficiency studies have established that energy costs account for 40 to 60% of the operating expenses for supplying water. By becoming energy efficient, each municipal water system can reap a minimum energy savings of 25 to 40%. This translates to an energy savings of at least

Cost Effective Solution for Energy Efficiency in Urban Water Supplies: 4681
3000 MUs (based on the data that public water works in India consumes more than 12000 MUs), which means that one can avoid the need for an additional capacity of 500 MW for the Indian scenario. VIII CONCLUSION Energy costs are typically the highest or second highest governable costs for water utility operations. Using new developments in the area of pumps allows for initially selecting a pump to match the expected performance requirements and then maintain optimal performances through periodic refurbishment. These measures realize energy cost savings, it is not necessary that electrical system part designed to suit local conditions (tariff structures). From the study it is clear that a tremendous energy saving potential exists in these municipal water pumping installations. One of the interventions needed is to train and create awareness among the municipal utility staff about the benefits of energy efficiency improvement. In order to help and assist these staff with available resources/information an online web interactive monitoring tools has been developed. The tool will help in better understanding of their municipal water system and changes required for realizing energy cost saving opportunities time to time. Municipalities can utilize the energy cost savings accruable as a result of implementing energy efficiency measures for any other important services like health, education which are equally important in sustainable development. ACKNOWLEDGEMENTS The authors would like to acknowledge the support of all water utilities for sharing the data and allowing us to perform the study. Our sincere thanks to all who were directly or indirectly involved in the study and analysis. Finally we wish to acknowledge the support of all the TERI team members who were involved in the detailed study of all the water utilities in states of India and other developing countries. REFERENCES [1] TERI, “Best Practices Guide: Energy Efficiency in Municipal Water Pumping,
Bangalore”, India. 2009, pp. 59-71 [2] IFC. Manual for Development of Municipal Energy Efficiency Projects,
International Finance Corporation, 2007, pp. 03 [3] IFC, “Manual for Development of Municipal Energy Efficiency Projects”,
Washington D.C. 2007 [4] Rao, G.R.N, Sharma, K.V. Energy conservation opportunities in municipal
water supply systems: a case study, Resources, Energy and Development, 9(1), 2012, pp. 35-48
[5] Rao, G.R.N, Nand Gopal, E, Sharma, K.V. An Optimization Algorithm for

4682 G Rudra Narsimha Rao et al
Energy Efficiency inMunicipal Water Supply Utilities in Developing Countries, International Conference on Advances in Energy Research, IIT Bombay, Mumbai, 2013
[6] Vairavamoorthy, K., Mansoor, M.A.M, Demand management in developing countries. In: Butler, D., Memon. F (Ed.), Water Demand Management, IWA, ISBN:1843390787, 2005
[7] BEE, “Guidebook: Electrical Efficiency in Electrical Utilities”, Bureau of Energy Efficiency, India. 2010, pp.151-176
[8] CEA, “CO2 Baseline Database for the Indian Power Sector”, Central Electricity Authority, India. 2013, pp. 17