corporate social responsibility disclosure - Igbinedion ...
237
CORPORATE SOCIAL RESPONSIBILITY DISCLOSURE AND FINANCIAL PERFORMANCE OF SELECTED QUOTED FIRMS IN NIGERIA BY AGBO, Innocent Sunny PG/17/019890/BMS DEPARTMENT OF ACCOUNTING, SANUSI LAMIDO SANUSI COLLEGE OF BUSINESS AND MANAGEMENT STUDIES, IGBINEDION UNIVERSITY, OKADA, EDO STATE JULY, 2020
-
Upload
khangminh22 -
Category
Documents
-
view
1 -
download
0
Transcript of corporate social responsibility disclosure - Igbinedion ...
CORPORATE SOCIAL RESPONSIBILITY DISCLOSURE
AND FINANCIAL PERFORMANCE OF SELECTED
QUOTED FIRMS IN NIGERIA
BY
AGBO, Innocent Sunny
PG/17/019890/BMS
DEPARTMENT OF ACCOUNTING,
SANUSI LAMIDO SANUSI COLLEGE OF BUSINESS AND
MANAGEMENT STUDIES, IGBINEDION UNIVERSITY,
OKADA, EDO STATE
JULY, 2020

i
CORPORATE SOCIAL RESPONSIBILITY DISCLOSURE
AND FINANCIAL PERFORMANCE OF SELECTED
QUOTED FIRMS IN NIGERIA
BY
AGBO, Innocent Sunny
PG/17/019890/BMS
BEING A DOCTORAL THESIS PRESENTED TO THE
DEPARTMENT OF ACCOUNTING, SANUSI LAMIDO
SANUSI COLLEGE OF BUSINESS AND MANAGEMENT
STUDIES, IGBINEDION UNIVERSITY, OKADA, IN
PARTIAL FULFILMENT FOR THE AWARD OF DOCTOR
OF PHILOSOPHY (Ph.D.) DEGREE IN ACCOUNTING
SUPERVISORS: DR. O.O.K. ATU
PROF. A.E. OKOYE
ii
DECLARATION
I declare that:
1. This thesis is based on the study undertaken by me, AGBO, Innocent Sunny, in the
Department of Accounting, Igbinedion University, Okada, under the Supervision
of Dr. Atu, Omimi-Ejoor Osaretin Kingsley and Prof. A.E. Okoye.
2. This thesis has not been submitted elsewhere for the award of a degree or diploma.
3. The ideas and views of the research thesis are products of a research undertaken by
me. Where the ideas and views of other authors/researchers have been expressed,
they have been duly acknowledged.
Signature:_____________________________
Name: AGBO, Innocent Sunny
Matriculation Number: PG/17/019890/BMS
Date:________________________________
DEPARTMENT OF ACCOUNTING
IGBINEDION UNIVERSITY, OKADA

iii
DEDICATION
I dedicate this study to GOD ALMIGHTY, my spiritual fathers and mothers worldwide,
my amiable, loving caring, understanding and prayerful family, and all those who believe
that it is wrong to give up on the day when the night has not come.

iv
CERTIFICATION
We, the undersigned, certify that this research work was carried out by AGBO, Innocent
Sunny and is adequate in scope and quality. The necessary requirements in respect of the
Ph.D. (Accounting) degree have been strictly followed.
Dr. Atu, Omimi-Ejoor Osaretin Kingsley ____________________ ____________
Supervisor Sign Date
Prof. A.E. Okoye ____________________ ____________
Co-Supervisor Sign Date
Dr. (Mrs.) Mary Josiah ____________________ ____________
Head of Department Sign Date
Dr. (Mrs.) Mary Josiah ___________________ ____________
Internal Examiner Sign Date
Prof. ___________________ ____________
External Examiner Sign Date
Prof. (Mrs.) T.G. Okorie ___________________ ____________
Dean, School of Postgraduate Sign Date
Studies and Research

v
ACKNOWLEDGEMENTS
God’s time is the best! I first of all acknowledge my Creator, the unchangeable Changer,
with Whom there is no impossibility, my Lord and my God Who never allowed my
enemies to triumph over me. He made this whole exercise successful despite all odds.
With all the strength and breath in me, I thank and praise Him for all that He has done, all
that He is doing, and all that He will do – for His wisdom, protection, provision, care,
love, and all. May all praises be unto His Name forever and ever, amen. I also
acknowledge all my spiritual fathers and mothers worldwide. You have truly been
wonderful.
Many people played unquantifiable roles towards the success of this study. Chiefly among
them are my wonderful supervisors, Dr. Atu Omimi-Ejoor Osaretin Kingsley (FCA,
FCMA, FCTI) and Prof. A.E. Okoye (FCNA, FCTI), erudite scholars and unbeatable
professionals. They are award winning and selfless.
I sincerely acknowledge the immeasurable contributions of my colleagues and lecturers
who taught and or encouraged me in one way or the other during the course of my studies:
Dr. (Mrs.) M. Josiah, my amiable Head of Department, a true mother and lovely sister;
Prof. Raph I. Adeghe (Dean, CBMS); Dr. S.M. Aguwamba (HOD, Banking & Finance);
Dr. D.G.E. Mbaegbu; Prof. (Mrs.) T. Okorie (Dean, PGSR); Dr. S.E. Ughulu; Dr.
Imuetinyen John P. Ugiagbe; Dr. Ekienabor Ehis; Mr. Clement E. Ozele; Mrs. O.A.G.
Olufemi (Nee Atu); and Mr. Augustine Macaulay. You are all very distinguished and
wonderful scholars, and I am most privileged to have been associated with you. I remain
indebted to you all.
My profound gratitude goes to my loving parents, my amiable wife and understanding
children, my sisters, nephews and nieces. One love!

vi
Special regards to Mr. Oke Davidson of Futurelight Business Enterprises, College of
Pharmacy Annex, Igbinedion University, Okada, who typed, proof read, edited and helped
with the analysis in this study even under tight schedules, and also my beloved sister from
another mother, Edith Nnenna Okafor, College Officer, Basic Medical Sciences, Igbindion
University, Okada. Thanks for your advice, encouragement and motivation. You remain
blessed.
I also acknowledge the efforts and commitments of Mrs. Adeleke of University of Benin,
who painstakeningly proofread and corrected the grammatical errors in this study.
To God be all the glory.

vii
TABLE OF CONTENTS
Cover page
Title Page i
Declaration ii
Dedication iii
Certification iv
Acknowledgements v
Table of Contents vii
List of Tables xi
List of Figures xii
Abstract xiii
CHAPTER ONE: INTRODUCTION
1.1 Background to the Study 1
1.2 Statement of the Research Problem 6
1.3 Objectives of the study 7
1.4 Research Questions 8
1.5 Hypotheses of the study 8
1.6 Significance of the study 8
1.7 Scope of the Study 10
1.8 Limitations of the Study 11
1.9 Definition of Operational Terms 11
CHAPTER TWO: LITERATURE REVIEW
2.1 Introduction 13
2.2 Conceptual Framework 13
2.3 Dependent Variable 14
2.4 Corporate Financial Performance 14
2.5 Measurements of Corporate Financial Performance 15
2.5.1 Return on Assets (ROA) 17
2.5.2 Return on Equity (ROE) 19
2.5.3 Earnings per Share (EPS) 23
2.5.4 Share Price (SP) 26
2.6 Independent variable 29

viii
2.7 Corporate Social Responsibility (CSR) Disclosure 29
2.8 Measurements of Corporate Social Responsibility Disclosure 33
2.8.1 CSR Disclosure on Gifts and Donations (CSRDGD) 36
2.8.2 CSR Disclosure on Employment of Indigenous Staff (CSRDEIS) 38
2.8.3 CSR Disclosure on Environmental Activities (CSRDEA) 39
2.9 Determinants of Corporate Social Responsibility Disclosure 42
2.10 Role of CSR Disclosure in Community Development 46
2.11 Corporate Social Responsibility Disclosure and Corporate Financial
Performance 51
2.12 Review of Empirical Studies 60
2.13 Theoretical Framework 80
2.13.1 Shareholders Theory 81
2.13.2 Stewardship Theory 82
2.13.3 Stakeholder Theory 84
CHAPTER THREE: METHODOLOGY
3.1 Introduction 90
3.2 Research Design 90
3.3 Philosophical underpinning of the Study 91
3.4 Study Population 92
3.5 Sample and Sampling Technique 93
3.6 Sources of Data 95
3.7 Data Analysis Technique 95
3.8 Model Specification 96
3.9 Operationalization of Variables 98
CHAPTER FOUR: PRESENTATION AND ANALYSIS OF DATA
4.1 Introduction 100
4.2 Presentation and Analysis of Data 100
4.2.1 Preliminary Analysis 101
4.2.2 Test for Endogeneity in CSRD-FP Relationship 104
4.2.3 Regression Analysis 106
4.3 Test of Hypotheses 126
ix
CHAPTER FIVE: DISCUSSION OF FINDINGS
5.1 Introduction 130
5.2 Discussion of Findings 130
5.2.1 Gifts and Donations on Share Price 130
5.2.2 Employment of Indigenous Staff on Share Price 131
5.2.3 Environmental Activities on Share Price 131
5.2.4 Gifts and Donations on Return on Assets 131
5.2.5 Employment of Indigenous Staff on Return on Assets 132
5.2.6 Environmental Activities on Return on Assets 132
5.2.7 Gifts and Donations on Return on Equity 133
5.2.8 Employment of Indigenous Staff on Return on Equity 133
5.2.9 Environmental Activities on Return on Equity 134
5.2.10 Gifts and Donations on Earnings per Share 134
5.2.11 Employment of Indigenous Staff on Earnings per Share 134
5.2.12 Environmental Activities on Earnings per Share 135
CHAPTER SIX: SUMMARY OF FINDINGS, CONCLUSION AND
RECOMMENDATIONS
6.1 Introduction 136
6.2 Summary of Findings 136
6.3 Conclusion 137
6.4 Recommendations 138
6.5 Recommendations for Further Studies 139
6.6 Contributions to the Knowledge Gap 139
REFERENCES 141
APPENDICES 171

x
LIST OF TABLES
Table 3.1: Operationalization of Variables (financial performance measures)
Dependent Variable 98
Table 3.2: Operationalization of Variables (corporate social responsibility
measures) Independent Variable and Control variables 99
Table 4.1: Descriptive Statistics 101
Table 4.2: Variance Inflation Factor Test 102
Table 4.3: Pearson Correlation 103
Table 4.4: CSRD and Corporate Financial Performance Endogeneity
Test Results 105
Table 4.5: CSRD and Share Price Results 107
Table 4.6: Quantile process Estimates for CSRD and Share Price Regression 110
Table 4.7: CSRD and ROA Results 112
Table 4.8: Quantile process Estimates for CSRD and ROA Regression 115
Table 4.9: CSRD and ROE Results 117
Table 4.10: Quantile process Estimates for CSRD and ROE Regression 120
Table 4.11: CSRD and EPS Results 122
Table 4.12: Quantile process Estimates for CSRD and EPS Regression. 124

xi
LIST OF FIGURES
Fig 2.1: Stakeholder group 87
xii
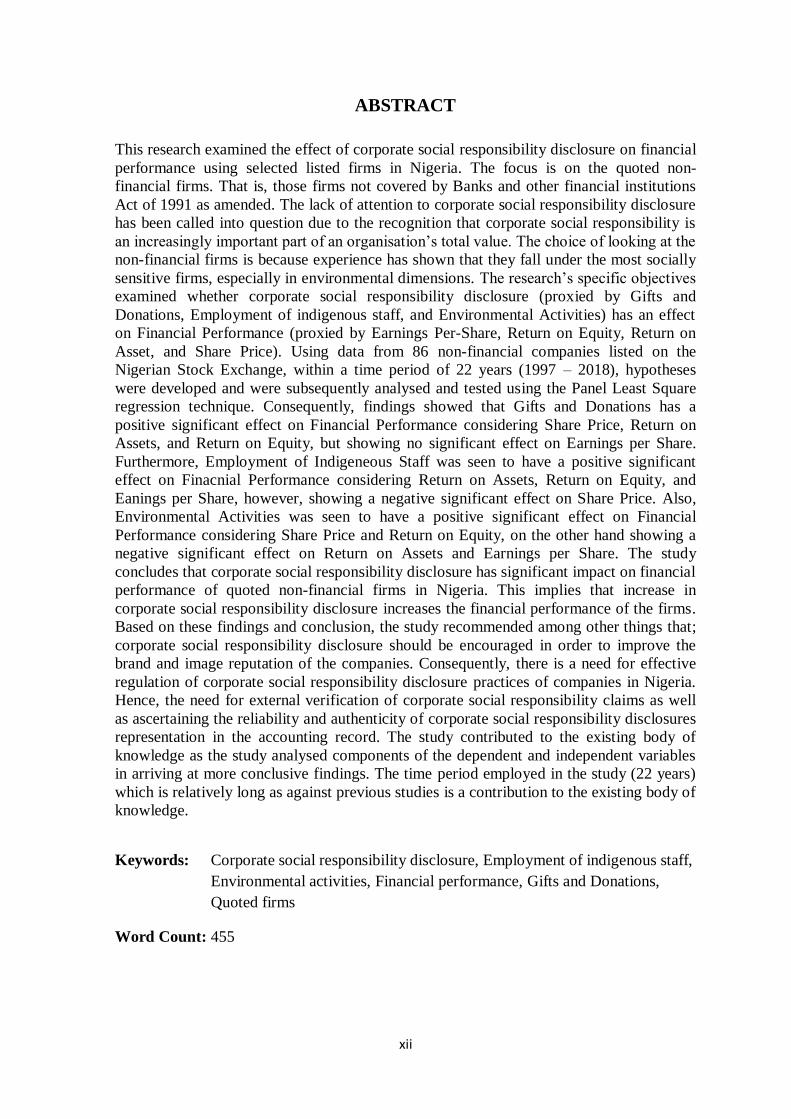
ABSTRACT
This research examined the effect of corporate social responsibility disclosure on financial
performance using selected listed firms in Nigeria. The focus is on the quoted non-
financial firms. That is, those firms not covered by Banks and other financial institutions
Act of 1991 as amended. The lack of attention to corporate social responsibility disclosure
has been called into question due to the recognition that corporate social responsibility is
an increasingly important part of an organisation’s total value. The choice of looking at the
non-financial firms is because experience has shown that they fall under the most socially
sensitive firms, especially in environmental dimensions. The research’s specific objectives
examined whether corporate social responsibility disclosure (proxied by Gifts and
Donations, Employment of indigenous staff, and Environmental Activities) has an effect
on Financial Performance (proxied by Earnings Per-Share, Return on Equity, Return on
Asset, and Share Price). Using data from 86 non-financial companies listed on the
Nigerian Stock Exchange, within a time period of 22 years (1997 – 2018), hypotheses
were developed and were subsequently analysed and tested using the Panel Least Square
regression technique. Consequently, findings showed that Gifts and Donations has a
positive significant effect on Financial Performance considering Share Price, Return on
Assets, and Return on Equity, but showing no significant effect on Earnings per Share.
Furthermore, Employment of Indigeneous Staff was seen to have a positive significant
effect on Finacnial Performance considering Return on Assets, Return on Equity, and
Eanings per Share, however, showing a negative significant effect on Share Price. Also,
Environmental Activities was seen to have a positive significant effect on Financial
Performance considering Share Price and Return on Equity, on the other hand showing a
negative significant effect on Return on Assets and Earnings per Share. The study
concludes that corporate social responsibility disclosure has significant impact on financial
performance of quoted non-financial firms in Nigeria. This implies that increase in
corporate social responsibility disclosure increases the financial performance of the firms.
Based on these findings and conclusion, the study recommended among other things that;
corporate social responsibility disclosure should be encouraged in order to improve the
brand and image reputation of the companies. Consequently, there is a need for effective
regulation of corporate social responsibility disclosure practices of companies in Nigeria.
Hence, the need for external verification of corporate social responsibility claims as well
as ascertaining the reliability and authenticity of corporate social responsibility disclosures
representation in the accounting record. The study contributed to the existing body of
knowledge as the study analysed components of the dependent and independent variables
in arriving at more conclusive findings. The time period employed in the study (22 years)
which is relatively long as against previous studies is a contribution to the existing body of
knowledge.
Keywords: Corporate social responsibility disclosure, Employment of indigenous staff,
Environmental activities, Financial performance, Gifts and Donations,
Quoted firms
Word Count: 455
1
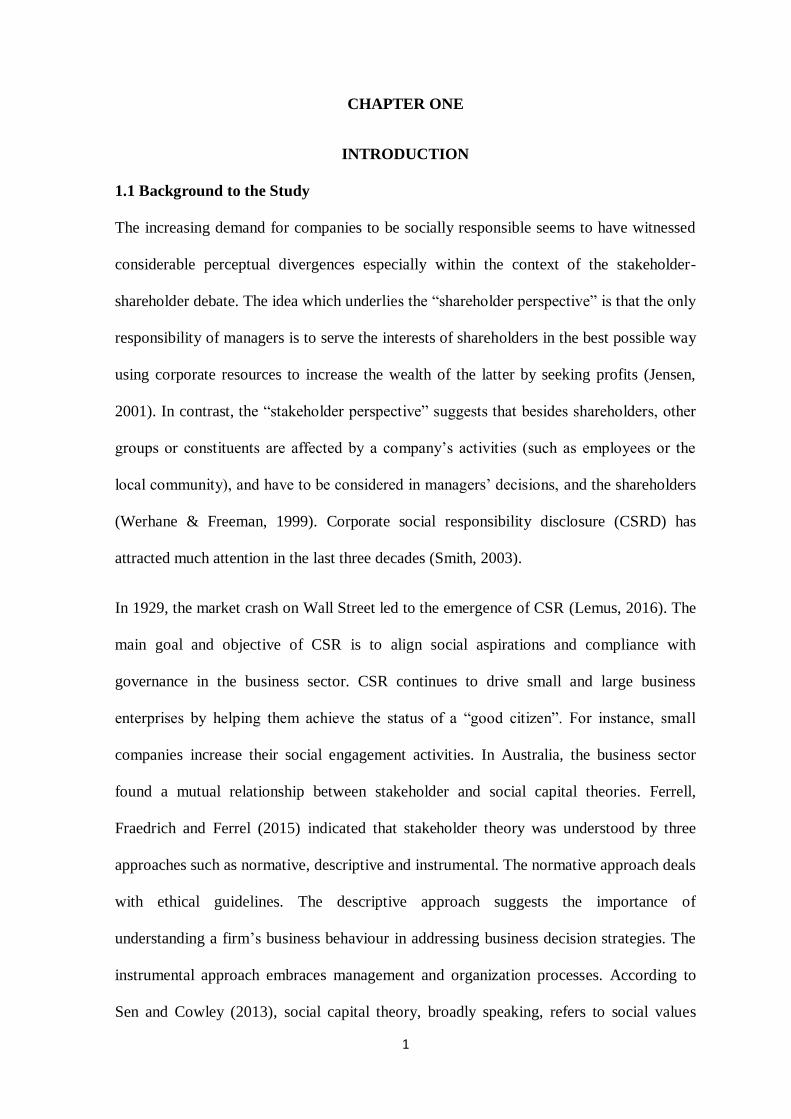
CHAPTER ONE
INTRODUCTION
1.1 Background to the Study
The increasing demand for companies to be socially responsible seems to have witnessed
considerable perceptual divergences especially within the context of the stakeholder-
shareholder debate. The idea which underlies the “shareholder perspective” is that the only
responsibility of managers is to serve the interests of shareholders in the best possible way
using corporate resources to increase the wealth of the latter by seeking profits (Jensen,
2001). In contrast, the “stakeholder perspective” suggests that besides shareholders, other
groups or constituents are affected by a company’s activities (such as employees or the
local community), and have to be considered in managers’ decisions, and the shareholders
(Werhane & Freeman, 1999). Corporate social responsibility disclosure (CSRD) has
attracted much attention in the last three decades (Smith, 2003).
In 1929, the market crash on Wall Street led to the emergence of CSR (Lemus, 2016). The
main goal and objective of CSR is to align social aspirations and compliance with
governance in the business sector. CSR continues to drive small and large business
enterprises by helping them achieve the status of a “good citizen”. For instance, small
companies increase their social engagement activities. In Australia, the business sector
found a mutual relationship between stakeholder and social capital theories. Ferrell,
Fraedrich and Ferrel (2015) indicated that stakeholder theory was understood by three
approaches such as normative, descriptive and instrumental. The normative approach deals
with ethical guidelines. The descriptive approach suggests the importance of
understanding a firm’s business behaviour in addressing business decision strategies. The
instrumental approach embraces management and organization processes. According to
Sen and Cowley (2013), social capital theory, broadly speaking, refers to social values
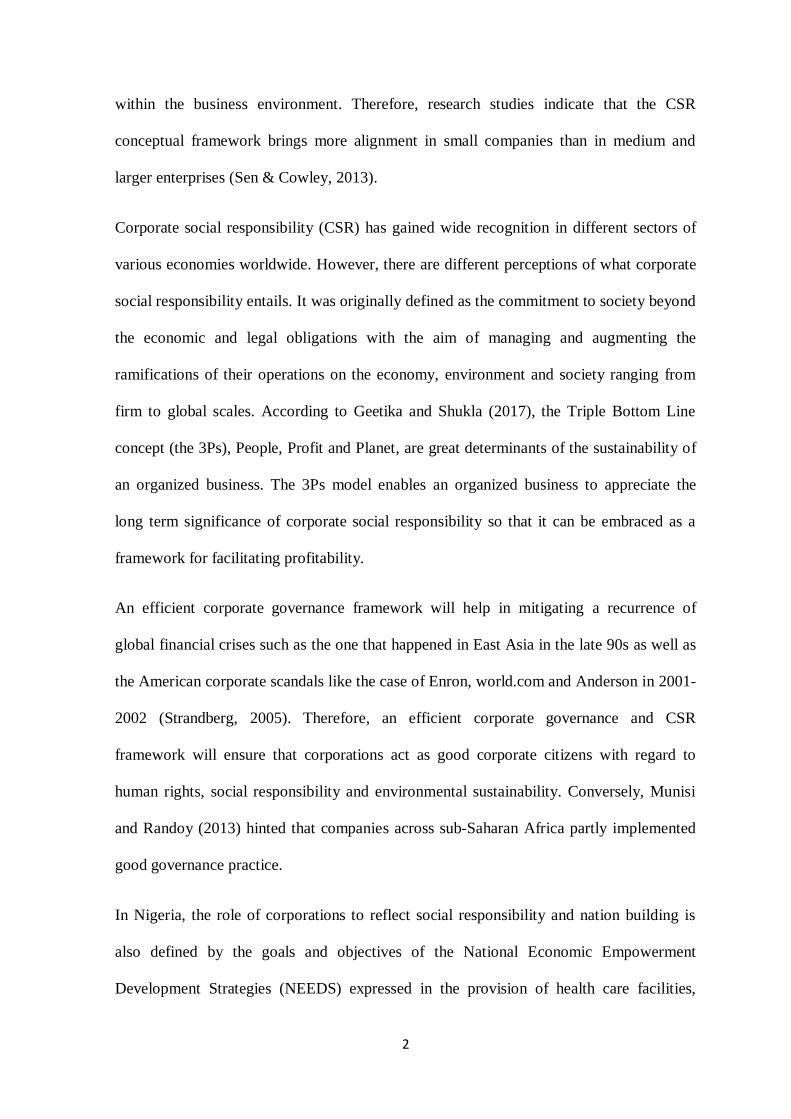
2
within the business environment. Therefore, research studies indicate that the CSR
conceptual framework brings more alignment in small companies than in medium and
larger enterprises (Sen & Cowley, 2013).
Corporate social responsibility (CSR) has gained wide recognition in different sectors of
various economies worldwide. However, there are different perceptions of what corporate
social responsibility entails. It was originally defined as the commitment to society beyond
the economic and legal obligations with the aim of managing and augmenting the
ramifications of their operations on the economy, environment and society ranging from
firm to global scales. According to Geetika and Shukla (2017), the Triple Bottom Line
concept (the 3Ps), People, Profit and Planet, are great determinants of the sustainability of
an organized business. The 3Ps model enables an organized business to appreciate the
long term significance of corporate social responsibility so that it can be embraced as a
framework for facilitating profitability.
An efficient corporate governance framework will help in mitigating a recurrence of
global financial crises such as the one that happened in East Asia in the late 90s as well as
the American corporate scandals like the case of Enron, world.com and Anderson in 2001-
2002 (Strandberg, 2005). Therefore, an efficient corporate governance and CSR
framework will ensure that corporations act as good corporate citizens with regard to
human rights, social responsibility and environmental sustainability. Conversely, Munisi
and Randoy (2013) hinted that companies across sub-Saharan Africa partly implemented
good governance practice.
In Nigeria, the role of corporations to reflect social responsibility and nation building is
also defined by the goals and objectives of the National Economic Empowerment
Development Strategies (NEEDS) expressed in the provision of health care facilities,
3
social welfare, employment, poverty reduction through skill acquisition and
entrepreneurship, etc.
Corporate Social Responsibility Disclosure (CSRD) refers to a company’s systematic
disclosure or exposure of information on its social performance. The term social
performance is understood in a broad sense and refers to social, environmental, and
governance issues that are typically not covered by financial performance metrics. In
contrast to Managerial Accounting, CSRDs primarily addres external stakeholders such as
customers, investors, and the public. In absene of formal mandatory rules, CSRDs
significantly vary in form (design, distribution, media, disclosing frequency, etc) and
content (scope quality, etc) (Encyclopedia of CSR, 2013). In other words, it is a voluntary
activity particularly in developing countries where at least there is no laws enforcing its
practice and as such it will be interesting to appreciate which ompanies disclose
information about social and encironemtnal activities and the extent of such disclosure
(Coffie, Aboagye-Otchere & Musa, 2018).
CSRD can be defined as the information that a company discloses about its environmental
impact and its relationship with its stakeholders by mans of relevant communication
channels (Campbell, 2004; Gray, Javad, Power & Sinclair, 2001). It discloses information
on what the firms have done for the sake of the community. It also shows the disclosure of
firms’ action on what they have been contributing to the welfare of society and what they
will do in the future for the welfare and interest of society. Usually the disclosure is
disclosed in a social responsibility report and published in company’s website or annual
report of public listed companies. CSRD is very important to company’s stakeholders. The
stakeholders of the company always take note of the disclosure because it shows what the
company plans to do, and have done for the welfare of society.
4
By the disclosure of CSR information, a firm addresses the information needs of
stakeholders and provides a basis for dialogue between the firm and its stakeholders. As a
critical avenue for stakeholder management, CSR disclosure shapes external perceptions
of the firm, helps relevant stakeholders assess whether the firm is a good corporate citizen,
and ultimately justifies the firm’s continued existence to its stakeholders. Geib and
Strawser (2001) argued that a greater level of reporting was itself a form of social
responsible behaviour. Branco and Rodrigues (2006) noted that Corporate Social
Responsibility was seen as a source of competitive advantage and not as an end in itself. In
effect, the concept of CSR has evolved from being regarded as detrimental to a company’s
profitability to being considered as somehow benefiting the company as a whole, at least
in the long run. Corporate social responsibility disclosure is basically divided into two: the
mandatory disclosure and the voluntary disclosure. The mandatory disclosure is backed by
law and practiced in the developed or western countries. Failure to disclose in these
countries attracts statutory sanctions.
The voluntary disclosure on the other hand, is not backed by law. This means that
companies that practice this type of disclosure are at liberty to disclose or not to disclose.
And failure to disclose attracts no statutory penalties or sanctions. Most of the African
nations practice the voluntary disclosure including Nigerian. This study therefore, is
devoted to the voluntary disclosure, being carried out in Nigeria. The disclosure measures
adopted in this study include: Gifts and donations (GD); Employment of indigenous staff
(EIS); and Environmental activities (EA).
Gifts and donations (GD) is the amount of gifts and donations by the firm expressed in
monetary terms. Employment of indigenous staff (EIS) is the ratio of number of
indigenous staff employed by the firm to the total number of staff in the firm. While,
5
Environmental activities (EA) is the total number of activities carried out by the firm to
nurture and protect the environment expressed in monetary terms.
Corporate performance refers to how well an organization achieves its market-oriented
and financial goals. Performance is the function of the ability of an organization to gain
and manage its resources in several different ways to develop a competitive advantage.
According to Benjalux (2006), performance measures are the lifeblood of economic units
since without them no decisions can be made. Financial performance measure is one of the
important performance measures for economic units. Financial performance measures are
used as indicators to evaluate the success of economic units in achieving stated strategies,
objectives and critical success factors.
Specifically, CSR may signal to the market that the firm is socially and environmentally
responsible, and may create goodwill for the firm thus leading to positive effects for firms’
financial performance. Bowen (2000), in this regard, explained that corporations engaged
and reported their CSR activities in order to increase their social visibility and improve
stakeholder relations as they create promotional opportunities for the firm. Furthermore,
many CSR activities are made on the basis of presenting corporations in a positive light
and providing reputation effects that improve how the organization is perceived. In
addition, Roberts and Dowling (2002) explained that corporate social responsibility
initiative could lead to a reputation advantage which could result to an improvement in
investment trust, new market opportunities, and positive reactions on the capital market
which could ultimately enhance organizations’ financial position.
The measures of financial performance used in this study are: Return on assets (ROA);
Return on equity (ROE); Earnings per share (EPS); and Share price (SP). This study
focuses on the quoted non-financial firms in Nigeria.

6
Return on assets (ROA) is equal to a fiscal year’s net income (after preferred stock
dividends but before common stock dividends) divided by total assets. Return on equity
(ROE) is equal to a fiscal year’s net income (after preferred stock dividends but before
common stock dividends) divided by total equity (excluding preferred shares), expressed
as a percentage. Earnings per share (EPS) is the earnings after interest and taxes divided
by total ordinary shares. Also known as price earnings ratio, it is measured by the stock
price. While Share price (SP) is measured by price earnings ratio.
1.2 Statement of the Research Problem
The choice of the study for quoted non-financial companies was informed by the gaps
created in previous studies in the area. This study was poised to fill those gaps. Firstly, so
much that has been written on this subject area concentrated on the financial sector such as
banks, insurance companies, other finance houses, etc Ehioghiren and Eneh (2019);
Oyewumi, Ogumeni and Oboh (2018); Wan and Muhammad (2016); Mahbuba and
Farzana (2013); El Mosaid and Boutti (2012); Amole, Adebiyi and Awolaja (2012);
Keffas and Olulu-Briggs (2011); Abbott and Monsen (1979); Alexander and Buchholz
(1978); Preston (1978); Vance (1975); Moskowitz (1972). But not much has been written
that emphasised the non-financial sector of the economy.
Secondly, most of the researches conducted in this area adopted Corporate Social
Responsibility Disclosure (CSRD) and Financial Performance (FP) as single variables
Wakesa (2017); Babalola (2012); Matthew, Rebecca and Greg (2007); McWilliams and
Siegel (2000).
Thirdly, most of the studies conducted in this area used small samples (from 1 – 10
samples); thus making the generalization of results to be unreliable and inconsistent,
Wekesa (2017); Seungwo, Junseok & Ahreum (2017); El Mosaid and Boutti (2012);
7
Anderson and Frankle (1980); Ingram (1978); Preston (1978); Spicer (1978); Sturdivant
amd Ginter (1977); Heinze (1976); Bowman and Haire (1975); Folger and Nutt (1975);
Bragdon and Marlin (1972); Moskowitz (1972).
Fourthly, most of the researches in this area concentrated on Asian and European countries
or developed nations such as Malaysia, China, India, Italy Bangledash, etc. Not much has
been done in African countries, especially Nigeria, Wan and Muhammad (2016);
Mahbuba and Farzana (2013); Iqbal (2012); El Mosaid and Boutti (2012); Keffas and
Olulu-Briggs (2011); Abbott and Monsen (1979); Alexander and Buchholz (1978);
Preston (1978); Vance (1975); Moskowitz (1972).
Finally, the time periods employed in the previous studies were too short (1 – 5 years),
Wekesa (2017); Seungwo Junseok and Ahreum (2017); Uweigbe and Egbide (2012); El
Mosaid and Boutti (2012). This makes it necessary for further studies in this study area.
Based on the above gaps in this area of studies in Nigeria, this study attempts to carry out
an investigation on corporate social responsibility disclosure (CSRD) and financial
performance in selected quoted firms along several dimensions. These include further
examination of CSRD using extended dimensions; large sample size, longer and more
recent period of study and a wider coverage of industries.
1.3 Objectives of the study
The broad objective of this study was to ascertain the impact of corporate social
responsibility disclosure (CSRD) on financial performance of selected quoted firms in
Nigeria. The specific objectives were to:
1. Examine whether gifts and donations (GD) has any significant impact on
financial performance (FP) of selected quoted firms in Nigeria;
8
2. Ascertain if employment of indigenous staff (EIS) has any significant effect on
financial performance (FP) of selected quoted firms in Nigeria;
3. Establish whether environmental activities (EA) have any significant impact on
financial performance (FP) of selected quoted firms in Nigeria.
1.4 Research Questions
The following research questions were posed for the study:
1. Does gifts and donations (GD) have any significant impact on financial
performance (FP) of selected quoted firms in Nigeria?
2. Does employment of indigenous staff (EIS) have any significant effect on financial
performance (FP) of selected quoted firms in Nigeria?
3. Do environmental activities (EA) have any significant impact on financial
performance (FP) of selected quoted firms in Nigeria?
1.5 Hypotheses of the study
The following null hypotheses were formulated for the study:
Ho1: Gifts and donations (GD) has no significant impact on financial performance (FP)
of selected quoted firms in Nigeria.
Ho2: Employment of indigenous staff (EIS) has no significant effect on financial
performance (FP) of selected quoted firms in Nigeria.
Ho3: Environmental activities (EA) have no significant impact on financial performance
(FP) of selected quoted firms in Nigeria.
1.6 Significance of the study
This study will be beneficial to all aspects of economic units, that is, public limited
companies, stakeholders, creditors, debtors, host communities, shareholders, investors,

9
managers, employees, etc, and also the international community in areas of
standardization of new improved formats for disclosure in companies using corporate
social responsibility.
The relationship between CSR disclosure and corporate financial performance is important
to both researchers and managers. A relationship between these variables could have a
significant impact on how managers approach CSR, and whether their firms are likely to
participate or not. A negative relationship might provide a warning to managers to think
carefully when deciding on whether to undertake CSR (Cochran, 1984). This research
adds to previous literatures by controlling variables that were pointed out in previous
research papers. CSR is a new trend and always changing so, this research provides
evidence of whether or not there is a relationship (positive or negative) between CSR
disclosure and corporate financial performance in quoted non-financial companies.
This study will also be useful to communities especially those in the oil producing areas of
Nigeria where a lot of social and environmental hazards have been unleashed on the
people by the activities of the corporations which operate there. The study will also be
useful to government and other regulatory agencies in the formulation of policies to foster
CSR activities in Nigeria as most companies are not committed to their CSR obligations.
The study will also be useful to other researchers who are interested in conducting further
researches in this area by providing a good background for them. For managers, the
empirical nature of this study will help them to examine how and in what proportion CSR
activities impact on their corporate performance and also which corporate performance
measure reacts more to CSR activity. These are very interesting issues for management.
10
1.7 Scope of the Study
This study examined the effect of corporate social responsibility disclosure on financial
performance of selected quoted non-financial companies in Nigeria. Corporate social
responsibility disclosure (CSRD) is proxied by gifts and donations (GD); employment of
indigenous staff (EIS); and environmental activities (EA). Additionally, financial
performance (FP) is proxied by Return on Equity (ROE); Return on Assets (ROA);
earnings per share (EPS); and share price (SP). This study was restricted to the secondary
data obtained from the published financial statements in the annual reports and accounts of
the sampled companies whose shares were publically traded on the floor of the Nigerian
Stock Exchange from 1997 to 2018 (22 years). The selected companies were: Afromedia,
Capital Hotel, Daar Communications, DN Tyre & Rubber, Ikeja Hotel, RT Briscoe,
Tantalizers, Tourist Company of Nigeria, Transcorp Hotels, University Press, Afrik
Pharmaceuticals, Ekocorp, Evans Medical, Fidson Healthcare, GlaxoSmithKline Nigeria,
Neimeth International Pharmaceuticals, Nigeria-German Chemicals, Pharma-Deko, Union
Diagnostic & Clinical Services, African Paints (Nigeria), Aluminum Extrusion Industries,
O.C. Gases Nigeria, Berger Paints, First Aluminum Nigeria, Meyer, Paints & Coatings
Manufactures, Port & Paints & Products Nigeria, Premier Paints, Thomas Wyatt Nigeria,
Cadbury Nigeria, Champion Breweries, Dangote Flour Mills, Dangote Sugar Refinery,
Flour Mills of Nigeria, FTN Cocoa Processor, Guinness Nigeria, Honeywell Flour Mill,
International Breweries, Livestock Feeds, McNichols, Morison Industries, Multi-Trex
Integrated Foods, Cascon Allied Industries, Nestle Nigeria, Nigerian Breweries, Nigerian
Enamelware, Northern Nigeria Flour Mills, Okomu Oil Palm, Presco, PZ Cussons Nigeria,
Nascon Allied Industries, Unilever Nigeria, Union Dicon Salt, Vitaform Nigeria, ABC
Transport, A.G. Leventis Nigeria, Academy Press, Beta Glass Co, Cement Company of
Northern Nigeria, Dangote Cement, Global Spectrum Energy Services, Interlinked
11
Technologies, John Holt, Julius Berger Nigeria, Studio Press (Nigeria), Red Star Express,
Lafarge Africa, SCOA Nigeria, Nigerian Aviation Handling Company, Trans-Nationwide
Express, Tripple Gee & Co., UAC of Nigeria, Capital Oil, Conoil, Forte Oil, MRS Oil
Nigeria, Japaul Oil & Maritime Services, Total Nigeria, Seplat Petroleum Development,
Eterna, Anino International, Caverton Offshore Support Group, Africa Prudential
Registrars, Computer Warehouse Group, Courteville Business Solutions, E-Tranzact
International and Omatek Ventures.
1.8 Limitations of the Study
A considerable amount of effort went into writing this empirical research. However, some
factors which were unavoidable contributed to limiting the study. Data were limited to
only the disclosed information on CSR variables found in the financial statements and
footnotes in the annual reports and accounts of the sampled companies. The data used
were self-reported by the companies involved. Lack of universal standards for CSR
disclosure may have limited the sample size of the companies involved. However, the
study accomplished its objectives.
1.9 Definition of Operational Terms
Corporate social responsibility: These are responsibilities of companies or firms to their
society or immediate environment.
Corporate social responsibility disclosure: This discloses information on what the firms
have done for the sake of the community. It also shows the disclosure of firm’s action on
what they have been contributing to the welfare of society and what they will do in the
future for the welfare and interest of society.
Financial performance: Overall performance of an organization in relation to
cash/money.

12
Earnings per share: This is the profit after preference share and taxation.
Employment of indigenous staff (EIS): Engagement of the indigenes of the host
community in the services of the companies at all levels.
Environmental activities (EA): All actions/activities taken/to be taken in other to
safeguard or protect the environment by the companies.
Gifts and Donations (GD): Quantifiable gifts and donations in monetary terms including
community development activities by the companies.
Non-financial companies: Means all quoted companies on the Nigerian Stock Exchange
excluding those that perform financial services such as banks, finance houses, insurance
companies, etc. That is those companies not covered by Banks and other financial
institutions Act (BOFIA) of 1991 as amended to date.
Return on assets: This is the profitability of a company in relation to its assets.
Return on equity: This is the profitability of a company based on the investment of the
shareholders.
13
CHAPTER TWO
LITERATURE REVIEW
2.1 Introduction
This chapter conducted a systematic review of related literatures from recent to most
recent which covered the variables in the study. It presents a review of the extent of
literatures on the study as well as dependent and indigenpent variables, relevant
conceptual and theoretical framework. Also presented are the major approaches by
previous researchers which include analysis and findings.
2.2 Conceptual Framework
A conceptual framework is a structure which the researcher believes can best explain the
natural progression of the phenomenon to be studied (Camp, 2001). It is linked with the
concepts, empirical research and important theories used in promoting and systemizing the
knowledge espoused by the researcher (Peshkin, 1993). It is the researcher’s explanation
of how the research problem would be explored. The conceptual framework presents an
integrated way of looking at a problem under study (Liehr & Smith, 1999). In a statistical
perspective, the conceptual framework describes the relationship between the main
concepts of a study. It is arranged in a logical structure to aid provide a picture or visual
display of how ideas in a study relate to one another (Grant & Osanloo, 2014). The
framework makes it easier for the researcher to easily specify and define the concepts
within the problem of the study (Luse, Menecke & Townsend, 2012). Miles and
Huberman (1994) opined that conceptual frameworks can be ‘graphical or in a narriative
form showing the key variables or constructs to be studied and the presumed relationships
between them.’

14
A conceptual framework is an analytical tool with several variations and contexts. It is
used to make conceptual distinctions and organize ideas. Strong conceptual frameworks
capture something real and do this in a way that is easy to remember and apply. The
dependent and independent variables were discussed under the conceptual framework.
2.3 Dependent Variable
Dependent variable is the variable that depends on other factors that are measured. These
variables are expected to change as a result of an experimental manipulation of the
independent variable or variables. It is the presumed effect. It is what you measure in the
experiment and what is affected during the experiment (Cramer & Howitt, 2004). It is the
variable that depends on other factors that are measured. These variables are expected to
change as a result of an experimental manipulation of the independent variable or
variables. It is the presumed effect. The dependent variable is the variable tested or
controlled in an experiment to test the effect of the independent variable (Baridam, 1999).
In this study, financial performance was the dependent variable.
2.4 Corporate Financial Performance
Corporate financial performance refers to the act of performing financial activities. In a
broader sense, corporate financial performance refers to the degree to which financial
objectives are being or have been accomplished. It is the process of measuring the results
of a firm’s policies and operations in monetary terms. According to Investopedia (2018),
corporate financial performance is a subjective measure of how well a firm uses assets
from its primary mode of business to generate revenues. The term is also used as a general
measure of a firm’s overall financial health.

15
According to Verma (2019) corporate financial performance, in a broader sense, refers to
the degree to which financial objectives are being or have been accomplished, and is an
important aspect of finance risk management. It is the process of measuring the results of a
firm’s policies and operations in monetary terms. It is used to measure a firm’s overall
financial health over a given period of time and also to compare similar firms across the
same industry or to compare industries or sectors in aggregation (Metcalf & Titard, 1976).
Verma (2019) also asserted that corporate financial performance analysis included the
analysis and interpretation of financial statements in such a way that it undertook full
diagnosis of the profitability and financial soundness of the business. The financial analyst
programme provides vital methodologies of a financial analysis. Areas of financial
performance analysis (firm’s production and productivity performance or total business
performance) are working capital analysis, financial structure analysis activity analysis,
and profitability analysis (Trivedi, 2010).
A corporate financial performance report is a summary of the financial performance of a
company that reports the financial health of a company which reports how investors and
stakeholders take their investment decisions (Verma, 2019).
2.5 Measurements of Corporate Financial Performance
Although one might have expected a certain diversity of measures of CSR, there is no real
consensus on the proper measure of financial performance either. In fact, there is a wide
range of such measures. However, most measures of financial performance fall into two
broad categories: investor returns and accounting returns. Both have enjoyed periods of
popularity, and both have evolved considerably in the past decades.
16
Investor Returns. The basic idea underlying investor returns is that returns should be
measured from the perspective of the shareholders. The first studies to employ investor
returns as a measure of financial performance were those by Moskowjtz (1972) and Vance
(1975). In both studies, changes in price per share were used as the investor returns index.
As most subsequent studies have noted, this measure is clearly flawed. The change in
price per share is only one element of investor returns. Dividend income is the other, and it
must be included in any measure of investor returns.
Abbott and Monsen (1979) used the change in share price plus dividends as their measure
of investor returns. However, it was insufficient. Simple returns (change in price per share
plus dividends) fail to capture another dimension of vital importance to investors -namely,
risk. In accepted finance theory, the risk of holding assets is measured by the covariance of
the expected return on the asset with that of the overall market. This measure, which is
commonly referred to as “beta,” is obtained for a stock by regressing its realized returns
on those of a broad based market index. The regression slope coefficient provides the beta
estimate. An average beta is 1. A stock with a beta above 1 is considered an aggressive
stock because it tends to move faster, either up or down, than the market.
Correspondingly, a stock with a beta below 1 is considered a defensive stock (Curley &
Bear, 1979). It was precisely this failure to adjust for risk that led to the (apparently)
contradictory results by Moskowitz (1972) and Vance (1975). Moskowitz’s study
indicated that firms with high CSR ratings outperformed the market.
Accounting Returns. Accounting returns are the other primary methods of measuring
financial performance. The basic idea behind using accounting returns as measures of
financial performance is to focus on how firm earnings respond to different managerial
policies. The most common measures of accounting returns used in studies of this nature
17
are simply earnings per share (EPS) or price/earnings (P/E) ratios. Bragdon and Marlin
(1972), Bowman and Haire (1975), Folger and Nutt (1975), Heinze (1976), Preston (1978)
and Spicer (1978) used EPS, P/F ratios, or some algebraic variation of them as, at least,
one of the measures of financial performance in their studies.
Several problems however, are associated with using EPS or P/F ratios as a measure
because both are strongly influenced by the rate of growth and accounting practices of
firms (Beaver & Morse, 1978). In addition, these financial performance measures cannot
be accurately compared across firms without considering financial leverage influences and
risk differences. This does not mean that one cannot use accounting returns, quite the
opposite. Accounting returns may be the best proxy for financial performance. However,
the particular measures used in previous studies have serious defects.
Profit maximization is the sole and primary function of any organized business
establishment. Therefore, when corporate social responsibility is adopted, it is believed to
increase the level or rate of profitability in the organization or business. The above
statement was supported by Friedman (1970) who stated that there was one, and only one,
social responsibility of business: to use its resources and engage in activities designed to
increase its profit as long as it stayed within the rules of the game. Thatmeans business
should engage in an open and free competition without deception or fraud. For the purpose
of this research, we considered Return on Equity (ROE), Return on Assets (ROA),
Earnings per share (EPS), and Share Price (SP) as measurements of financial performance.
2.5.1 Return on Assets (ROA)
ROA percentage shows how profitable a company’s assets are in generating revenue. It is
given by the ratio between net income and total assets. This ratio tells us what the
company can do with what it has got, that is, how much earnings it derives from each
18
monetary unit of assets it controls. It is a useful number for comparing competing
companies in the same industry. The number varies widely across different industries.
Return on assets gives an indication of the capital intensity of a company which depends
on the industrial sector. Companies that require large initial investments will generally
have lower returns on assets. This parameter is widely used in the literature (Aupperle,
Carroll and Hatfield (1985), Belkaoui and Karpiks (1989), Waddock and Graves (1997),
Preston and O’Bannon (1997), McWilliams and Siegel (2001) and Luce, Barber and
Hillman, 2001). Hongren, Harrison and Oliver (2009) said that ROA was used to measure
the profitability of a company using assets to earn income. Its formula is;
ROA= net income X 100
Total asset
Total asset= current asset+ non-current asset
Net income=total earnings
Return on assets (ROA) is one of profitability ratios. In the analysis of financial
statements, this ratio is most often highlighted, beause it is able to indicate company
success to create profits. ROA is able to measure the company ability to generate profits in
the past to then be projected in the future. Assets in question are overall company
properties, obtained from the capital itself or from foreign capital that has been coverted
into company assets used for corporate sustainability. Higher ROA value indicates better
company performance, because of highe return on investment rate. This value reflects the
company’s return on all assets (or funding) provided to the company (Wild,
Subramanyam, & Halsey, 2005). Any factors affecting on return on assets (ROA) are
Liquidity Ratio which is a ratio to measure a company’s ability to meet its short term
liabilities, calculated by comparing its current assets with current liabilities. Asset
19
Management Ratio is the asset management ratio; measures how effectively the company
manages its assets (Brigham and Houston, 2001). Debt Management Ratio is asset
management ratio to know the extent of company’s ability to meet its long-term
obligations (debt) used to finace all company activities.
According to Prastowo (2002), return on assets (ROA) is used to measure the
effectiveness of the company in generating profits by exploiting its assets. This ratio may
give an indication of good and bad neighbor measurement in implementing cost control or
management of his property. Return on assets (ROA) is often used as a tool to measure the
rate of return on total assets after interest expense and taxes (Brigham & Houston, 2001).
The high return on assets (ROA) will be good for the company. To value return on assets
(ROA) high would indicate that the company is able to generate profits relatively high
value assets. Investors would like the company to the value of return on assets (ROA) is
high, as companies with return on assets (ROA) which is capable of producing high levels
of corporate profits is greater than the return on assets (ROA) is low (Ang, 2001). Return
on assets (ROA) is a financial ratio used to measure the degree to which the assets have
been used to generate profits. The greater return on assets (ROA) the better the company’s
performance, because of the greater rate of return on investment (Riyanto, 2001).
2.5.2 Return on Equity (ROE)
This is used a great deal in economic literature (Bowman & Haire, 1975; Bregdon &
Marlin, 1972; Perket & Eilbirt, 1975; Spicer, 1978; Preston, 1978; Cowen, 1987;
Waddock & Graves 1997; Preston & O’Bannon, 1997). ROE is equal to a fiscal year’s net
income (after preferred stock dividends but before common stock dividends) divided by
total equity (excluding preferred shares) and expressed as a percentage. It measures the
rate of return on ownership interest (shareholders’ equity) of common stock owners. It
20
measures a firm’s efficiency in generating profits from every Dollar/Euro of net assets
(assets minus liabilities), and shows how well a company uses investment Dollars/Euros to
generate earnings growth. Reily and Brown (2012) explained the importance of ROE to
stockholders to indicate the returns after accounting for all other capital providers. ROA
can be analysed by its trend and its absolute number when compared with other companies
(Traub 2001).
Return on equity (ROE) or also often called Return On Common Equity, in Bahasa
Indonesia is often translated as Rentability of Own Share (Rentability of Own Capaital).
Investor to buy the share will be attracted to this profitability ratio, or part of total
profitability that can be allocated to shareholders. As known, shareholders has residual
claim on obtained profits. Profit obtained by the company firstly will be used to pay any
interest of debts, then preference share, and then (if any) will be given to common
shareholders. Return on equity (ROE) is the profitability ratio to measure the company’s
ability to generate profit based on eshare capital own by the copany. Return on equity can
be calculated as follow (Sartono, 2001):
Return on Equity (ROE) = Net Income After Tax
Total Equity
Return on equity (ROE) shows the extent to which companies manage their own capital
(net worth) effectively, measure the profitability of the investment that has been made
owners of their own capital or shareholders of the company. Ang (2001) states that the
higher the return on equity (ROE) will increase the profit growth. Return on equity (ROE)
indicates the profitability of own capital or often referred to as business profitability
(Sawir, 2005). The higher the value, the higher the ROE level of profit generated due to
additional working capital can be used to finance the company’s operations that could
ultimately result in profit (Suwarno, 2004). Irawan (2011) in his research found that return
21
on equity (ROE) affects profit growth. This is due to the nature and pattern of investments
made by the company which are very precise so that all assets can be used efficiently and
so that the profits can be maximized. In addition, the revenue generated by capital from
debt can be used to cover the cost of capital.
Return on equity (ROE) is a closely watched financial ratio among equity investors. It is a
strong measure of how well the management of a firm creates value for its shareholders.
Return on equity can be defined as the amount of net income returned as a percentage of
shareholders’ equity. It is one of the all time favourites and perhaps most widely used
overall measure of corporate financial performance (Rappaport, 1986) which was also
confirmed by Monteiro (2006). ROE is popular among investors because it links the
income statement (net profit/loss) to the balance sheet (shareholders’ equity). The fact that
ROE represents the end result of structured financial ratio analysis, called Du Pont
analysis, also contributes towards its popularity among analysts, financial managers, and
shareholders alike (Stowe, Robinson, Pinto & McLeavy, 2002).
However, for different reasons, ROE could be a misleading measure of corporate financial
performance (Web & Toit, 2007). First, earnings can be manipulated within the legal
framework via changes in accounting policy. Second, ROE increases with more financial
leverage, as long as the returns earned on the borrowed funds exceed the cost of the
borrowings. An increase in leverage beyond a certain level may translate into an increase
into the firm’s systematic risk or beta. Third, ROE is also susceptible to inflation; inflation
had a negative relationship with the profit margin which will, in turn, reduce ROE and
expected growth (Fuller & Perry, 1981). The DuPont model of financial analysis, which is
the extended version of ROE developed by F. Donaldson Brown in 1914, notably broaden
the understanding of ROE:
22
ROE = Net Profit x Sales x Assets
Sales Assets Equity
The three components or ratios, can be described (in sequence) as profitability, asset
turnover and financial leverage. The ROE can therefore be improved by improving
profitability, by using assets more efficiently and by increasing financial leverage. Over
time it has become clear that improving the ROE may not necessarily improve shareholder
value. Rappaport (1986) has pointed out that the second component of ROE, namely asset
turnover, is affected by inflation in such a way that it may increase even when assets are
not utilized better. He reasons that sales immediately reflect the impact of inflation,
whereas the book value of assets, which is a mixture of new and older assets, does not
adapt as quickly to the effects of inflation. Rappaport’s (1986) studies in the 1970’s
revealed that although the earnings of Standard & Poor’s 400 companies decreased
dramatically during the 1970s, their ROEs actually increase through increased levels of
asset turnover and gearing. The markets, however, were not misled by this apparent ‘better
performance’. Consequently the market returns during this period were generally very
poor, or ‘dismal’, accoding to Rappaport.
Around 1989 when Reimann (1989) published his work, ROE was used extensively for
measuring whether value was being created for shareholders. The reason behind the
adoption of ROE as a measure was that it gave more reliable results than earnings per
sharep (EPS) (Reimann, 1989). As it is important to consider how investors value the
shares of a company Reimann (1989) considered a number of strategy consulting firms
and found that they focus their measurements on the spread between ROE and the cost of
equity. If the spread is positive, it indicates that a company has advantageous growth
opportunities. Reimann (1989) also identified changes to accounting conventions
(policies) as being a problem when using ROE as a performance measure. It was also
23
recognized that financial measures such as ROE may be too short-term and that longer-
term measures, perhaps more qualitative, must be adopted as well. Reimann (1989) found
that ROE still left 66 percent of the variation in share prices unexplained, indicating a
large degree of unreliability.
Another problem with the use of ROE, as identified by Finegan (1991) is that it does not
consider the timing of cash flows. For that reason the free cash flow model is often cited
as a better means to determine whether shareholder value is being created. He also stated
that investors ‘go far beyond earnings in evaluating performance’. Therefore the managers
of a company cannot rely on earnings figures alone to measure performance, unless they
wan to wait for investors’ reactions to see how they are performing.
Copeland, Koller and Murrin (1996) argue that ROE is a short-term performance measure
and that too much focus on it can lead a company to overlook long-term growth
opportunities that might increase shareholder value. A company may also be able to
improve its ROE, while at the same time earning a return that is below its weighted
average cost of capital (WACC), and thereby destroy value. Traditionally, all business
measurements have been financial and this practice has been criticized by many
commentators (Kaplan & Norton, 1996). However, as Black, Wright, and Davies (2001)
recognize that there may still be a place for financial measures such as ROE and various
others in what they call a ‘metrics scorecard’. It involves the the use of variety of
performance measures (financial andnon-financial) to achieve certain goals.
2.5.3 Earnings per Share (EPS)
EPS indicates a company’s level of profitability. Tendelilin (2010) stated that earnings
per share showed the net profit of a company that was to be distributed to its shareholders
therefore, the higher the earnings per share, the higher the dividend to shareholders, and

24
vice versa. This is a portion of the company’s net earnings and preferred stock dividends
allocated to each share of the company. Its formula is:
EPS = net income-preferred dividend
Average outstanding shares
or
EPS = profit before tax
Number of ordinary shares
Earnings per share (EPS) is a management tool to measure the amount of profit that can be
shared to shareholders. Based on this conclusion, this ratio is a comparison of resulted
income (net profit) and the mount of circulated share. According to Arifin (2002), earnings
per share (EPS) is calculation result of net profit divided with the number of circulated
share. If there is an increase on a company EPS growth, then there will be also an increase
on investor interest at company shares. The profit used as the measure is the profit for the
owners earnings after tax (EAT).
According to the Interntional Accounting Standards (IAS) 33: Earnings per share, an
entity that trades equity instruments on public markets is required to disclose EPS as part
of its financial statements (BDO, 2014; IFRS, 2014). EPS is a calculation that allocates a
company’s profits to each of its ordinary shares (Vaidya, 2014). It serves as an indication
of profitability by measuring the entity’s performance in relation to share capital that is
employed to generate such returns (Koppeschaar, Sturdy, Du Toit, Deysel, Rossouw, Van
Wyk, Gaie-Booysen, Papageorgiou & Van der Merwe, 2013). For the purpose of
measuring EPS, provision has been made for three categories of EPS, namely basic EPS,
diluted EPS and headline EPS (BDO, 2014).

25
Basic EPS is the simplest form of EPS (Vaidya, 2014). For the purpose of calculating
basic EPS, profit or loss attributable to the holding entity must be adjusted for after-tax
amounts of preference dividends (IFRS, 2014). Basic EPS divides the actual earnings after
preference shares by the weighted average number of ordinary shares (Dunn, 2010).
Diluted EPS is more complex than basic EPS (Kennon, 2014). Diluted EPS expresses the
EPS that an entity would generate if all warrants, convertibles and options have been
exercised, causing the total orindary shares capacity to increase (Koppeschaar, et al.,
2013). In calculating diluted EPS, the total basic earnings are adjusted for any after-tax
savings that would arise when convertible instruments are exchanged for ordinary shares
before it is divided by the increased number of ordinary shares (BDO, 2014). Increases in
eh quantity of ordinary shares typically result in a lower and, thus, diluted EPS (Kennon,
2014). Furthermore, both basic and diluted EPS of an entity must be disclosed on the face
of the Statement of Profit or Loss and Other Comprehensive Income (BDO, 2014).
From the age old arguments of May (1968) and the more recent of Smart and Graham
(2012), it is evident that growth rates in historical earnings can be used to establish
possible future increases in growth potential. It is argued that EPS plays a significant role
in the investment decisions taken by investors, because EPS trends can be used to measure
risk and performance. In addition, it is important to study the relationship between EPS
and the share price of shares. Brigham and Ehrhardt (2007) posited that EPS signals
prospect to investors. EPS is therefore an indication of shareholder’s wealth and, should
EPS increase, increases in the value of the share will be expected (Mkhonza, 2007).
Balsam and Lipka (1998) contended that earnings explain share price behaviour, because
the relationship between accounting EPS and share prices have been extensively studied.
Chang, Su, Chen and Chang (2008) also concur by explaining that EPS influences share
prices in the long run.
26
2.5.4 Share Price (SP)
Share price is the price of a single share of a number of saleable stocks of a company,
derivative or other financial assets. In a layman's term, the stock price is the highest
amount someone is willing to pay for the stock or the lowest amount that it can be bought.
Share or stock performance is the measurement of a stock’s ability to increase or decrease
the wealth of its shareholders (Capozzi, 2010). Mauboussin (2012) noted a fascinating
relationship between executives and the share or stock prices of the companies they
managed, that is, the managers generally wanted their stock to rise so as to affirm the
perceived health of the company they ran and their remunerations. Gosh (2010) and
Mulford and Comiskey (2011) affirmed that a favourable effect on share prices was a
major motive for managers to involve themselves in financial manipulations.
Determining share prices is a complex and conflicting task. According to economic
theory, the price of any asset is usually determined by the market forces. However, a
number of empirical studies have been conducted on the determinants of stock prices.
Some of these studies looked at the relationships between stock prices and the factors that
could impact on it. The link between fundamental factors (e.g. firm earnings, dividends
and book-value per share) and stock price changes has always remained as the focus area
of interest for market analyst, fund mangers, and investors. According to Fama (1970), a
stock market is said to be efficient (pricing) if current securities’ prices reflect all available
information. In an efficient market, stock prices would be analysed by Technical Analysis
or Fundamental Analysis. Technical analysis evaluates the stock price movement and
predicts the future stock prices based on historical data of stock price. Fundamental
Analysis evaluates the intrinsic value of the company and compares it to the stock price.
27
According to Jones (2004), the comparison of these analyses will give insight to the
investor whther the stock price is undervalued or overvalued and it will assist the investor
in making the decision. Stock prices would be determined primarily by fundamental
factors. Various researchers have found important fundamentall factors that determine the
share prices for different markets, viz, dividend, retained earnings, size, earnings per
share, dividend yield, leverage, payout ratio, and book value per share. A stock price in an
efficient (price) market provides investors with a good measure of any firm’s performance
and its value. Srinivasan (2013) noticed that, understanding the impact of various
fundamental variables on stock prices is very much helpful to investors as it will help them
in taking profitable investment decisions. In general, Shiller (1981) found that stock prices
are not stable and fluctuate excessively in relation to the news about fundamentals (as
dividends) primarily due to market irrationality.
Stock price indices differ according to the number and characteristics of the stocks
included int eh index, a well the weights given to each stock. While a stock price index
measures the level of stock prices, its practical application is to compare values at different
points in time, that is, to mesure the rate of appreciation (excluding cash dividends) on
common stocks. First, any index is designed to tell investors in the same segment of the
market how well their stock portfolio should be performing. That is, an index isa
benchmark against which a “representative investor” can compare performance. If an
index is to enjoy widespread use, both the stocks selected and the weights employed
should be close to those of some signfiant portion of investors, and the rate of return
should correspond closely to the rate of return experienced by the representative investor.
Some indices are so representative that they have become the basis for “index funds”,
mutual funds that structure their portfolios to mimic the performance of a specific index
(Fortune, 1998).

28
Second, an index is intended to measure the price changes arising fromforces affecting
“the market”. However, stock prices are also affected by events unique to the firm, such as
supply disruptions, introduction of competitive products, or labour unrest. These events
give rise to firm-specific risks which ivnestors can avoid by proper diversification. A well-
diversified index will reflect less idiosyncratic risk than does an index with few firms.
Thus, other things equal, the larger the number of firms represented in the index, the better
the inedex will represent its segment of the market. Third, a stock price index should
normally be shielded from the effects of internal decisions that affect the firm’s share price
without altering investors’ risk and return. Stock splits is, other things equal, desirable. On
the other hand, a firm’s decision to merge or to acquire other firms will change the
character of the firm’s business and call for active intervention by the index manager to
determine if the firm should be dropped froman index and replaced by other firms
(Fortune, 1998).
Fourth, as stock prices change, each stock’s share of a representative investor’s portfolio
will chnge: The weights for stock with appreciation greater than average will fall. An
index that automatically corrects for the repercussions of price changes upon the weights
themselves, without requiring buying or selling of shares to restore weights, will, other
things equal, be more useful. For example, an equally weighted index, like the Dow Jones
Industrial Average, will beoem increasingly less useful as a benchmark, or increasingly
more expensive to mimic, because an investor must sell his best-performing stocks and
reinvest in the worst performers in order to maintain equal weights. A final consideration
is the trading frequency of stock included in an index. A stock index that includes too
many infrequently traded stocks will fail to accurately reflect the market, especially over
short intervals when prices are changing rapidly. Even indexes that included actively
traded stocks, such as Standard & Poor (S&P) 500, can reflect “stale” prics if markets are
29
closed by circuit breakers, if trading in individual stocks is halted, or if volume is so high
that quotes are delayed (Fortune, 1998).
2.6 Independent variable
The independent variable is a variable whose values are not dependent on other factors or
which variation does not depend on that of another. Independent variable is a variable
whose variation do not depend on another variable but the researchers experiment. That is,
it is a variable that stands alone and is not changed by the other variables. It is a variable
believed to affect the dependent variable (Cramer, Duncan, & Dennis, 2004). It is the
variable that is stable and unaffected by the other variables you are trying to measure. It
refers to the condition of an experiment tha tis systematically manipulated by the
investigator. It is the presumed cause. In this study, CSR disclosure represented the
independent variable.
2.7 Corporate Social Responsibility (CSR) Disclosure
MNCs report on their CSR efforts for various reasons. The possible explanations for CSR
include reputation management, brand protection, competitive pressure, meeting
community expectations, responding to media coverage of negative incidents, managing
stakeholder groups, attracting ethical investors or attempting to prevent potentially
onerous government regulations (Jones & Jonas, 2011; Nikolaevà & Bicho, 2011). There
has been a great deal of research on the link between CSR and the economic performance
of MNCs. Although there had been contradictory findings, the majority of studies found a
weak link between CSR and superior financial performance of firms (Samy, Odemilin &
Bampton. 2010).The level of CSR reporting by MNCs has steadily increased in the last
two decades from 12% in 1992, 24% in 1996 and to 28% in 1999 (Nikolaeva & Bicho,
2011). Fortanier and Kolk (2007) found that 161 out of 250 (64%) MNCs reported on their

30
CSR activities. By 2011, CSR reporting had increased to 80% of all MNCs (Jones &
Jonas, 2011).
Social responsibility disclosure refers to the disclosure of information about companies
interactions with society (Branco & Rodrigues, 2006). According to Hossain and Reaz
(2007), due to information asymmetry, disclosure of private information is imperative as it
brings general gains to economic efficiency. Joe and Kechi (2013) stated that corporate
social reporting represented a credible way of subtly pressuring firms to act in a socially
responsible manner. Also, Anwar (2005) opined that good CSR practices enabled
companies to attract better quality investors and meet challenges posted by competition.
A number of researchers, governments, international organizations and even community
of firms have addressed the issues of CSR since the 1950s. Despite numerous efforts to
bring about a clear and an unbiased definition of CSR, there is still some confusion as to
how CSR should be defined, and before then, there had been 37 definitions of CSR
(Dahlsrud, 2008).
According to Tran (2014), the term “CSR” first officially appeared in the book “Social
Responsibilities of the Businessmen” written by Bowen (1953). The concept, CSR, was
referred to as the obligations of businessmen to pursue those policies, to make those
policies or to follow those lines of actions that were desirable in terms of the objectives
and value of our society. By contrast, Friedman (1970), saw CSR as its nature of conflict.
The author added that engaging in CSR was a problem or conflict between the interests of
managers and shareholders. In other words, managers tried to use CSR as a tool to further
their own social, political or career agenda at the expense of shareholders.
Following the stakeholder theory, Hopkins (2003) stated that CSR was concerned with
treating the internal and external stakeholders of the firm in a socially responsible manner.
31
In other words, the wider aim of CSR was to create higher and higher standards of living
while preserving the profitability of the corporation for its stakeholders. By comparison,
Zu (2009) briefly defined CSR as the means companies integrated social and
environmental concerns in their business operations and their interaction with their
stakeholders on a voluntary basis. Makower (1994) stated that corporate responsibility was
the right thing to do and the key to companies’ competiveness and survival.
CSR is an obligation by a corporation to be liable for any actions that affect people,
communities and the environment. CSR is a concept that involves a shared responsibility
partnership between companies, governments, community resource agencies and local
communities (Rustiarini 2010). The partnership is a shared responsibility among
stakeholders and social enterprises. According to The World Business Council for
Sustainable Development (WBCSD), corporate social responsibility is the commitment of
a business to contribute to sustainable economic development through cooperation with
employees and their representatives, their families, local communities and the general
public to improve the quality of life by ways that benefit both themselves and for business
development. Information is a fundamental requirement in decision-making. Information
within the company can be financial or non-financial. One of the commonly requested
pieces of information disclosed today is the one about corporate social responsibility. With
this information, companies can disclose the activities of accountability to the
stakeholders. The investor or prospective investor also uses both financial and non
financial information for fundamental decision making. Companies are expected to
disclose their practice of CSR, especially when they have good performance in
environmental, social and economic activities (Abdur-Rouf, 2011).
CSR is concerned with treating the stakeholders of the firm ethically or in a responsible
manner. ‘Ethically responsible’ means treating stakeholders in a manner deemed

32
acceptable in civilized societies. Stakeholders exist both within and outside a firm. The
natural environment is a stakeholder. The wider aim of social responsibility is to create
higher and higher standards of living while preserving the profitability of the corporation
for people both within and outside the corporation. CSR can also be seen as the ethical
behaviour of business towards its constituencies or stakeholders (Coffie, Aboagye-
Otchere, & Musah, 2018).
CSR leads to a dialogue between a company and the environment in which it operates.
Common language discussion helps society to know whether its dialogue with companies
is heard and interpreted in a consistent way. To date, it is believed that dialogue has been
highly flawed as some companies use the terms “corporate citizenship”, “the ethical
corporation”, “good corporate governance” or “corporate responsibility”. The effect of the
flaw is that some companies now consider CSR as pure corporate philanthropy. Others
(such as Shell) see it as a new corporate strategic framework while others dismiss the
notion entirely (Saleh, Zulkifli, & Muhamad, 2010).
According to Gray, Owen and Adams (1996), CSR is the process of communicating the
social and environmental effects of an organization’s economic actions to particular
interest groups within the society and the public at large. Consequently, business
organizations use corporate social responsibility disclosure as a strategy to buy the minds
of the stakeholders in its environment of operation. Over the years, it has become
mandatory for corporate entities to disclose the corporate social responsibility they are
engaged in in their financial reports. It is referred to as social accounting and social audit.
The social responsibility reporting should desirably possess the following qualitative
characteristics (Ibrahim, 2003): the report should contain a statement of its objectives
which helps in assessing the basis of data collection and the reason for adopting that

33
particular form of presentation. The objective of such a report should be to discharge
accountability society. Information provided should be directly related to the user’s need,
not manipulated but be presented in a manner that is understandable to non-technical
people (Gray, Owen & Adams, 1996).
The concept of social accounting has become more important as a result of industrial
growth which has brought about prosperity as well as problems to society. For an
organization to function effectively, it needs to be accountable to the public at large.
Social accounting is the branch of accounting which measures, analyses and records
society and the enterprise itself both in quantitative and qualitative terms. Some
organizations also use photographs, charts and graphical presentations to illustrate the
social activities such as community projects that have been undertaken by the firm during
an accounting period (Bessong & Tapong, 2012).
2.8 Measurements of Corporate Social Responsibility Disclosure
Corporate social responsibility can be measured by using different variables. In this study,
the following measurements were used: gifts and donations (GD); employment of
indigenous staff (EIS), and environmental activities (EA). There are two generally
accepted methods of measuring CSR. The first one is the reputation index, where
knowledgeable observers rate firms on the basis of one or more dimensions of social
performance. This method has some advantages. First, it tends to be internally consistent
because one evaluator applies the same (albeit usually subjective) criteria to each firm.
Second, it makes no pretence of applying a rigorous objective measure to a dimension that
may be innately subjective. Third, it may summarize the perceptions of a key constituency
of various firms. This alone may be an important factor in determining the relationship
between CSR and financial performance (Abbot & Monsen, 1979).
34
There are, however, disadvantages as well. The most important (and most obvious) is that
such rankings are highly subjective and thus may vary significantly from one observer to
another. This raises the spectre of unreliability. A second problem is one of sample size.
Most reputation indices generated to date cover only a relatively small number of firms.
Thus, one must be cautious about generalizing from the results of these studies. The first
reputation index, a fairly narrow one, was generated by the Council of Economic Priorities
(CEP) in the late 1960s and early 1970s. In this study, the CEP ranked the pollution
control performance of 24 firms in the pulp and paper industry (Council of Economic
Priorities, 1971). This measure of CSR has been used by a number of studies, including
those by Bragdon and Marlin (1972), Folger and Nutt (1975) and Spicer (1978).
A second reputation index was generated by Milton Moskowitz who, over a period of
years, rated a number of firms as “outstanding,” “honorable mention,” or “worst”
(Moskowitz, 1972, 1975). The 1972 version of this index was used by Moskowitz and a
composite of his 1972-1975 indices was used by Sturdivant and Ginter (1977) in their
studies on the relationship between CSR and financial performance. Another popular
reputation index also can be traced back to Moskowitz. A survey was conducted by the
National Association of Concerned Business Students (“How business school students rate
corporations,” 1972) where 300 graduate students of business administration were
questioned about their views on the social responsibility of some of the Fortune 500 firms.
Indices generated from the study were used subsequently by Vance (1975), Heinze (1976)
and Alexander and Buchholz (1978).
The second method of measuring CSR is content analysis. Normally, in content analysis,
the extent of the reporting of CSR activities in various firms’ publications and especially
in the annual report is measured. This may consist of simply noting whether or not a

35
particular item (such as pollution control) is discussed either qualitatively or numerically,
or it can mean actually counting a number of items. A commonly used source for content
analysis is a series of studies conducted by Beresford (1973, 1975, 1976). Content analysis
has two significant advantages. First, once the particular variables have been chosen (a
subjective process), the procedure is reasonably objective. Therefore, the results are
independent of the particular research. Second, because this technique is more mechanical,
larger sample sizes are possible.
Content analysis is a research procedure meant for making replicable as well as valid
inferences from data to their context (Krippendorff, 1980). Utilizing the content analysis
procedure, the number of information disclosed can be calculated for each category or for
each company through counting the data items, to be precise, the amount of words, the
amount of sentences as well as the amount of pages (Hackston & Mime, 1996; Marston &
Shrives, 1991). Accounting researchers have utilized content analysis as a research
technique in various ways. The literature portrays two wide approaches to content
analysis: mechanistic and interpretative. Mechanistic approaches capture as well as portray
a surrogate assumed to express meaning and reporting intent (Campbell, 2000). In general,
these studies are form oriented, which implies that the focus is on volumetric or frequency
capture and semiotic assumptions which have a tendency to be applied. Smith and Taffler
(2000) distinguished this by means of meaning orientation suggesting that form orientated
content analysis entailed routine counting of words or concrete references at the same time
as meaning orientated analysis focuses on the fundamental themes in the texts under
examination. As regards this, meaning orientation has a greater interpretative element than
in the mechanistic postulation of form orientation. In general, content analysis may take
several forms, ranging from data capture by word counts (Campbell, 2003), sentence
counts (Patten & Crampton, 2004; Perrini, 2005), (summed) page proportions (Unerman,

36
2000), frequency of disclosure (Ness-India & Mirza, 1991), to high/low disclosure ratings
(Patten, 1991).
However, content analysis also has some drawbacks. The choice of variables to measure is
subjective. Furthermore, content analysis is only an indication of what firms say they do,
and this may be very different from what they actually do. At best, one certainly can
postulate that firms that are aware of these issues are those that will discuss as well as act
on them. On the other hand, one can imagine that firms which perform poorly on this front
will feel an extra incentive to make themselves look good by touting their achievements in
their annual reports (Allen, 2017).
In this study however, CSR report are the CSR items treated as disclosures which were
ascertained from the annual reports and accounts of the companies sampled in the study,
both in the financial statements and footnotes. They include:
2.8.1 CSR Disclosure on Gifts and Donations (CSRDGD)
Intra and inter community struggles over CSR benefits have hampered production
activities and hurt companies’ reputation (Idemudia, 2014). However, project decisions are
made and managed by the NGOs. The local communities are also expected to contribute
funds, human and natural resources or capital assets like land for the achievement of
development plans and objectives (Loza, 2004,). Potential benefits which businesses stand
to enjoy include increased access to critical resources and relevant local information,
enhanced reputation and organizational learning (Morris & Bartkus, 2015). Community
participation is central to this model, hence, there is the likelihood that it will reflect core
community needs, promote community empowerment and project sustainability and a
close cooperation between the communities and the company thereby reducing intra and
inter-community conflicts (Getz & Oetzel, 2010).

37
Gifts and donations in corporate social responsibility is linked with corporate
philanthropy. Meanwhile, in developing countries like Indonesia, CSR is most commonly
associated with philanthropy or charity, i.e. through corporate social investment in
eduation, health, sports development, the environment, and other community services
(Visser, 2008). Whether it is considered as CSR or not, charity, donation, compensation,
disaster relief is the most common popular especially for Indonesian companies. Despite
the fact that phyilanthropic action is very popular especially for Indonesian small and
medium enterprises, this approach believed as the obsolete one. This philanthropic action
known in another term as corporate social stewardship and had been used formally in
1950s-1960s (Lawrence & Webber, 2014). Genest (2005) noted, “Corporate philanthrophy
can be defined as a group of people authorized to act as an individual, especially in
business, who share a concern for the good furtune, happiness, health and prosperity of
mankind and demonstrate this concern through acts that are good, friendly, and helpful”.
Furthermore, Schnurbein, Seele, and Lock (2016) noted that corporate philanthropy
generally takes on three different forms: corporate giving, corporate volunteering and
corporate foundations. In addition, we use the framework of Anheler and Leat (2006) to
further differentiate corporate philanthropy in a charity/service, scientific philanthropy and
new scientific philanthropy approach. Corporate giving entails all kinds of contributions –
money and in kind – that are donated by the corporation. Noble, Cantrell, Kyriazis, and
Algie (2008) list four different motivational categories why enterprises give to charity:
strategic profit maximization, altruistic motivation, political motivation and managerial
utility motivation. In practice, decisions on giving are driven by a combination of the four
categories and were found to be triggered by specific community claims.

38
2.8.2 CSR Disclosure on Employment of Indigenous Staff (CSRDEIS)
Internal CSR practices refer to employee-oriented CSR activities which are directly related
to the physical and psychological working environment of employees, their health and
well-being, training and participation in the organization, equal opportunities and work-
life balance (Turker, 2009). Internal corporate social responsibility is mainly concerned
with the welfare of employees beyond the strategic and legal bounds of organizations. It
has its own importance. The internal operations of organizations to their employees are
associated with internal corporate social responsibility. The study of Turker (2009) saw
the internal corporate social responsibility as a psychological endowment for working
environments. Laurinavičius and Romeris (2013) claimed that corporate social
responsibility (CSR) was the commitment of an organization to meet the needs and
interests of their stakeholders, shareholders, suppliers, employees, customers, community
and others.
For instance, there has been a resurgence of interest in indigenous employment in the
Australian minerals industry, as indicated by the signing of the Memorandum of
Understanding (MOU) between the peak industry body, the Minerals Council of Australia
and the Australian Federal Government in June 2005. The MOU commits both parties to
deliver improved employment outcomes for indigenous communities in specific mining
regions over five years (Australian Government & MCA, 2006). Several mining
companies and government agencies have adopted indigenous employment policies and
programmes (Archer, 2005; DEWR, 2005a, DITR, 2005; Fowler, 2005; Hall & Driver,
2002; IMETF, 2003; Lenegan, 2005). Employment and training provisions have also
become a common feature of Indigenous Land Use Ageements (ILUAs) between
Tradition Owner groups, mining companies and State governments (O’Faircheallaigh,
2002; Quinn, 2005).
39
Underpinning these intiatives is the assumption that greater indigenous representation in
the mining workforce will promote a greater sharing of benefits between mining
companies and indigenous communinties (DEWR, 2005a; Render, 2005). With mineal and
engery exports set to rise by 26 per cent to $93.1 billion in 2005-06 (ABARE, 2006), there
are increased expectations and assurances that this will create more indigenous
employement opportunities. For example, recent proposals of several mine related projects
were accompanied by announcements that these developments will create better
employment prospects for Aboriginal people (ABC, 2006; Brechley, 2006; Office of
Territory Development, 2004; Tanami, 2005).
Furthermore, the treatment of employment conditions of Aboriginal workers within the
resource industries were often substandard to the point of being comparable to those
experienced by servants or indentured labourers (Elder, 2003; Kidd, 2003). According to
Broome (1982) as recently as 1969 Aboriginal workers at the Weipa mining operation
were not eligible for all the employment benefits provided to their non-aboriginal
counterparts, such as bonuses, holiday pay and lodgings. Gientzotis and Welch (1997)
further characterized the treatment of Aboriginal workers as a surplus and expensable
reserve labour force in the Australian mining industry. It has also been alleged that the
rapid expansion of large scale mining operations in the Pilbara region since the mining
boom in the 1960s, displaced or excluded Aboriginal workers who were previously
employed in smaller-scale mines (Holcombe, 2004; Rogers, 1973).
2.8.3 CSR Disclosure on Environmental Activities (CSRDEA)
Compliance with environmental policy in relation to the environment is also another
important dimension of CSR. CSR reporting evolved from information on the corporate
environmental and social policies included in annual reports to stand-alone combined
40
reports that include social, environmental and economic/financial (Buhr, 2002; Cho,
Michelon & Patten, 2012; Milne & Gray, 2007). Recent trends in environmental
disclosure and reporting practices suggest a largely increasing number of social,
environmental and economic/financial information stand-alone reports (Cho, 2011). The
issuance of such sustainability reports has now become almost a standard among the
world’s largest corporations. These are obviously deduced from the reputation index,
whch is the first of the two generally accepted methods of measuring CSR (Cochran &
Wood, 1984).
Environmental corporate social responsibility (ECSR) is a concept where companies
integrate environmental concerns in their business operations and the interaction with
stakeholders, without compromising economic performance. After witnessing an increase
in environmental catastrophes that was contributed by the unscrupulous business interest
and human careless attitude (Banyte, Brazioniene, & Gadeikiene, 2010), business
organizations is turning to CSR as its payback tool. Companies would actively seek to
integrate environmental consideration into their operation and activities. These includes
promoting the advantages of eco-friendly products (Jansson, 2010; Pickett-Baker, 2008;
Ramayah, Lee, & Mohamad, 2010), encouraging eco-tourism; (Chiutsi, Mukoroverwa,
Karigambe, & Mudzengi, 2011; Stronza & Gordillo, 2008; Weaver & Lawton, 2007),
developing environment friendly behaviour through workplace climate (Nik Ramli, 2007;
Nik Ramli & Naja, 2011) and many more.
An organization that truly embraced enviormental protection and sustainability has to have
a holistic and consistent strategic management approach (Velasquez-Manoff, 2009). Its
organizational members are expected to hold shared assumptions and beliefs about the
importance of balancing economic efficiency, social equity and environmental
41
accountability (Bertels, Papania & Papania, 2010). The motivation to be consistent when
implementing an environmental sustainable approach in every aspect of the CSR
initiatives is an outcome of the holistic organizational worldview.
Implementation of socially responsible activities results in reduction of negative impacts
on the environment rhough more efficient use of recourses, reduced water consumption,
lower waste disposal costs, savings from lower material and energy consumption of the
enterprises’ activities (Klimek, 2014). Generally it can be said that between the company
implementing socially responsible actions and the “the silent stakeholder” a kind of
feedback exists. The influence of the stakeholder changes the company, and the influence
of the company changes the stakeholder.
To obey CSR rules in case of environmental aspects corporations can measure their
environmental impact and implement the environmental management. Environmental
impacts can be measured in several ways through eniornmentally extended input-output
tables, material input per serve unit (MIPS) calculations, ecological footprint and life cycle
assessment, etc. To truly commit to its environmental responsibilities a company should
change its traiditional modes operation towards a more environmentally oriented one. The
environmentally more responsible perpective could include such issues as an emphasis on
increased resource productivity, cleaner production and active dialogue with the
company’s stakeholders (Uddin, Hassan & Tarique, 2008). In Poland enterprises choose
mostly the standard ISO 14001 defining the environmental management system to support
application of the principles of CSR. Its main objective is to improve the relationsip
between the business effects of human activities and the natural environment (Misztal &
Jasiulewicz-Kaczmarek, 2014).
42
2.9 Determinants of Corporate Social Responsibility Disclosure
According to Kamal and Yousef (2013), corporate social responsibility disclosure is
determined by different factors. These factors are:
Profitability
Profitability as defined by Pimentel and Patzek (2005) is the final measure of economic
success by a company in relation to the capital invested in it. Company’s profitability
gives an indication about the effectiveness of corporate management. Profitability is
defined based on net profit before tax. Profitability is achieved on management’s rate of
return, earnings margin, return on assets or return on capital. These rate/ratio set by
management tends to help in observing when the operations will be profitable enough to
accommodate the costs associated with CSR activities. Giner (1997) argued that managers
of profitable companies were more likely to provide more voluntary CSR disclosure in the
annual reports to support the continuation of their current positions and boost the levels of
current and future compensation.
It is very likely to see profitable companies providing detailed information of CSR in
order to attract users to their accounts and highlight management effectiveness. Profitable
companies have positive messages to signal to the users of the accounts. It is therefore,
understandable for profitable companies to disclose more information than non-profitable
companies. However, it is possible to see some companies sustaining losses and still
disclosing detailed information in order to explain what went wrong and how they intend
to correct it (Roberts, 1992).
Level of Leverage
It is expected that highly leveraged firms are more likely to voluntarily disclose more
information. Although Brammer and Pavelin (2008) and Purushothaman, Hancock,
43
Tower, and Taplin (2000) found a negative association between CSR disclosure and
gearing ratio, Purushothaman et al (2000) posited that highly leveraged companies could
have closer relations with their creditors and hence, disclose more CSR information in
their annual report narratives. A highly leveraged company will be asked by lenders to
disclose more detailed information than a company with a low leverage ratio. Lenders ask
for detailed information before granting loans. In addition, banks and other lending
organizations are more likely to lend to successful and reputable companies. Hence, highly
leveraged companies are likely to disclose more information than others in order to meet
the banks and other lending organizations’ expectations (Commors & Gao, 2009).
Industry Type
Companies operating in different industries embark on different activities. Hence,
manufacturing companies get involved in more activities than services companies. They
purchase various types of materials that need to be handled and stored before being used in
production. They also have work in progress and finished goods to handle and store before
being dispatched to the final users. Manufacturing companies are also capital intensive as
they require large capital investments that force them to look for external sources of
funding. Manufacturing companies are generally large in size, and they embark on various
operations. According to the legitimacy theory, manufacturing companies are expected to
disclose more social information concerning environmental health and safety issues than
companies that belong to other sectors in order to avoid public pressure and additional
regulations (Purushothaman, et al., 2000).
Status of the Audit Firm
The relationship between the extent of corporate reporting and the status of the audit firm
have been investigated in many studies, such s those by Signhvi and Desai (1971);
44
McNally McNally (1982); Malone, Gilbert, Tafarodi, and Malone (1993); Wallace (1994);
Raffournier (1995); Wallace and Naser (1995); Inchausti (1997); Owusu-Ansah (1998);
Naser, Jamal, and Naser (2002); Camfferman and Cooke (2002); Glaum and Street (2003);
Au (2004); Al-Shammari (2008); Barako (2007) and Aly (2010). Big international firms
possess intensive knowledge of the IFRSs and they audit large international companies.
They, therefore, charge higher audit fees than other firms. Hence, it is very likely for large
and profitable companies to hire big international audit firms since they can pay their fees.
Intensive knowledge of IFRSs and experience with multinational companies of the big
audit firms’ staff would have a positive effect on the extent of reporting by companies
audited by these firms.
Location of the Listed Company’s Head Office
Previous studies pointed to a possible association between accounting system development
and economic level development (Cooke & Wallace, 1990; Doupnik & Salter, 1995;
Salter, 1998; Williams, 1999). In other words, highly developed countries are more likely
to have a highly developed accounting system than the less developed countries.
Companies listed on the Abu Dhabi Securities Exchange are located in seven Emirates.
The level of economic development varies among the Emirates. It is argued that
companies located in urban areas would be usually more visible (Loughran & Schultz,
2005) than companies located in rural areas since these areas tend to have many
institutional investors, brokers, bankers, financial analysts, and lobby groups.
Ownership Structure
Government companies tend to disclose more CSR information than privately owned
companies although management of some privately owned companies may opt to disclose
social responsibility information in order to attract investments and signal that they
45
operate in line with society’s expectations. Government ownership can affect agency
conflict between agents (managers) and principals (shareholders). According to Eng and
Mak (2003), due to the conflict between corporate financial objectives and society’s
expectations, companies’ communication with shareholders becomes greater with
government ownership.
Corporate Size
According to Cormier and Gordon (2001), large companies are expected to have financial
and human resources to compile, analyse and disclose information more than small
companies. Since they have the resources, they are expected to hire big international audit
firms that are likely to force a better disclosure. Large companies are also subjected to the
scrutiny of the public. To assure the public, they tend to disclose more information than
small companies. Needless to say, large companies are more likely to be involved in
activities that require disclosure more than small companies. Furthermore, large
companies are closely monitored by the stock markets more than small companies
(Hazrati, Eskandari, Majlesi & Gholami, 2015).
Using total asset or total revenues to measure corporate size, prior research that examined
the association between the CSR disclosure and firm size found a significant positive
association (Adam, Anderson, Motto, Price, Johnson, & Welsh, 1998; Oeegan & Gordon,
1996, Gutherie & parker 1989; Hackson & Milns, 1996, 1998, Patten, 1992). This tells us
that large companies are more likely to disclose more CSR information than smaller ones
because large companies receive more attention from the public since they are more likely
to be diversified across geographical and product market and hence, might have larger and
more diverse stakeholder groups (Brammer & Pavelin, 2008). Large firms are more likely
to report CSR information in their annual reports because the firms are more likely to

46
cover the costs associated with reporting this information. Also, large companies tend to
disclose more voluntary information to reduce agency costs resulting from potential
conflicts between management and the stakeholders (Othman, Thani & Ghani, 2009) and
also political costs as they are usually more publicly visible than small companies (Archel,
2003; Cormier & Magnan, 2003).
Another determinant not mentioned above is liquidity. According to Shim and Siegel
(2000), liquidity is the company’s capacity to liquidate maturing short-term debt (within
one year) and also the availability of ready money or the ease with which an asset can be
converted to cash in order to meet the deposit withdrawal needs of the depositors on
demand (Rotimi, 2007). High liquid companies are more likely to report more voluntary
information to distinguish their companies from low liquid firms. On the other hand, one
might argue that corporate managers of companies with a low liquidity ratio may publish
more voluntary information in their annual reports to satisfy the information requirement
of stakeholders (Khaled, Mohammed & Marwa, 2011).
2.10 Role of CSR Disclosure in Community Development
Community is generally defined as a group of people who are interdependent on the
fulfilment of certain needs, live in close proximity and interact on a regular basis. There
are shared expectations for all members of the group and responsibility taken from those
expectations. The group is respectful and considerate of the individuality of other persons
in the community. In an environment, there is a sense of community which is defined as
the feelings of cooperation, commitment to the group welfare, willingness to communicate
openly, and responsibility to and for others as well as to one’s self. Most importantly,
there exists community leaders who are responsible for the success of any community
event, depending on the needs of the community and the individual’s own feelings. The

47
community leaders are individuals who strive to influence others to take responsibility for
their actions, achievements, and the community’s welfare (Bitchta, 2003).
According to Ismail (2009), community development (CD) refers to initiatives undertaken
by a community in partnership with external organizations or corporations to empower
individuals and groups of people by providing them with the skills they need to effect a
change in their own communities. These skills are often centred on making use of local
resources and building political power through the formation of large social groups
working for a common agenda. Community developers must understand how to both work
with individuals and affect communities’ positions within the context of larger social
institutions.
CD is the process of developing active and sustainable communities based on social
justice and mutual respect. It is about influencing power structures to remove the barriers
that prevent people from this process. They enable linkages to be made between
communities and the development of wider policies and programmes. CD expresses
values of fairness, equality, accountability, opportunity, choice, participation, mutuality,
reciprocity and continuous learning. Educating, enabling and empowering are at the core
of CD (Federation of Community Development Learning, FCDL, 2009).
CD is the combined processes, programmes, strategies and activities that make a
community sustainable as compared to economic development which is the marketing of
its potential for growth followed by local efforts to act on opportunities. The entire set of
approaches to community development practice may be considered a specialized form of
addressing, coordinating and building the social infrastructure in a location. CD may be
defined as a process of challenging the undesirable and unacceptable disparity of
conditions and infrastructure that negatively affects the quality of life in a place where

48
people live and work. It functions best as a process in locations where all strata of society
and citizenry are engaged with a sense of community solidarity (Community Glossary,
2009).
The widely used meaning of CD is the one given by the United Nations (United Nations,
1971). It defines CD as the organized effort of individuals in a community conducted in
such a way to help solve community problems with minimum help from external
organizations. External organizations include non-government organizations and
corporations of various types and sizes such as small and medium enterprises (SMEs) and
multinational corporations (MNCs). The implication of UN’s definition of CD is,
therefore, emphasizing creativity and self-reliance in the community for short and long
term goals, but not to defy the CSR roles of the various types of business firms. In relation
to the people, the definition of CD is essentially both an educational and organizational
process. Another term closely related to CD is community work which is about the active
involvement of people in the issues that affect their lives. It focuses on the relationship
among individuals, groups and the institutions which shape their everyday experience.
According to Federation of Community Development Learning (FCDL) (2009), it is a
developmental process that is both a collective and individual experience. It is based on a
commitment to equal partnership between all those involved to enable a sharing of skills,
awareness, knowledge and experience in order to bring about a change. It takes place in
both neighbourhoods and communities of interest whenever people come together to
identify what is relevant to them and act on issues of common concern. The key purpose is
to work with communities experiencing a disadvantage, enable them to collectively
identify needs and rights, clarify objectives and take action to meet these within a
democratic framework which respects the needs and rights of others. Community work
49
recognizes the need to celebrate diversity and appreciate differences among ethnic and
social groups in the community.
From the above meanings of CSR and CD, it is undeniable that CSR has implications on
community and CD in many ways. Based on Perrin’s (2009) report, CSR is the third most
important driver of employee engagement over all others.
The roles of CSR in CD are any direct and indirect benefits received by the community as
a result of the social commitment of corporations to the overall community and social
system. These common roles of CSR in CD are discussed as follow:
To share the negative consequences as a result of industrialization. This is related to
increasing conscience-focused market places necessitating more ethical business
processes, for instance, a higher UK road tax for higher emission vehicles thus reducing
the burden of small vehicle owners in a community. By doing so, small vehicle owners
share less tax burden hence, they can re-channel the money for more productive uses in
the community.
Closer ties between corporations and the community. Through CSR, the existence of
corporations in the social system is felt beyond the perception that a corporation is a place
to get employment, and produce goods and services. By doing so, corporations and
community would stay in peace and harmony. This becomes a social capital that is
essential in community development (Community Glossary, 2009).
Helping to get talents: Organizations with a reputation for CSR can take advantage of their
status and strengthen their appeal as an attractive employer by making their commitment a
part of their value proposition for potential candidates. It is also true that when employees
view their organizations’ commitment to socially responsible behaviour more favourably,

50
they also tend to have more positive attitudes in other areas that correlate with a better
performance. They believe their organizations recognize and reward great customer
service, act quickly to address and resolve customer concerns, and are led by people in
senior management who act in the best interest of customers (Federation of Community
Development Learning, FCDL, 2009).
Confidence in senior management is higher in other areas, too, when employees give their
company high marks for being socially responsible. For example, if a large number of
employees perceive that their organizations’ senior managements support new ideas and
new ways of doing things, this would result in a better perception of employees to the
organization, hence, their trust and loyalty to the organization. A company’s success in the
marketplace is often influenced by its capacity for innovation, and the perception of the
employees of the organization. It is also a factor in attracting and retaining talents. In
relation to CD, good employees’ perceptions of a corporation can lead to the community
treating the corporation as an important economic asset (Federation of Community
Development Learning, FCDL, 2009).
Role in transfer of technology (TOT): Closer ties help in TOT between Multi—National
Corporations (MNCs) that give concerns on CSR and communities in the host countries.
MNC is a corporation that has its facilities and other assets in at least one country other
than its home country. Such companies have offices and/or factories in different countries
and usually have a centralized head office where they coordinate global management.
Very large multinationals have budgets that exceed those of many small countries. Barton
(2007) focused on three mechanisms of international technology transfer: the flow of
human resources; the flow of public-sector technology support; and the flow of private
technology from MNCs to developing countries. He argued for greater mobility within and
the globalization of the world’s scientific enterprise, and reasserted an economic rationale
51
for investing in public sector research in developing countries. Through TOT coupled with
CSR processes, the targeted community would gain in the various aspects of product
development and marketing such as better price and quality as well as concern for
people’s wellbeing (CSR @Intel, 2009).
CSR helps to protect environment: Some of the world’s largest companies have made a
highly visible commitment to CSR, for example, with initiatives aimed at reducing their
environmental footprint. These companies take the view that financial and environmental
performance can work together to drive company growth and social reputation. This
attitude can only serve to enhance the employment value proposition such as an interest in
“going green” gains attraction (Towers, 2009). “We green the earth” slogan made by some
MNCs in Malaysia who owned large golf areas within the vicinity of residential areas was
another CSR initiative which seemed to protect the environment. Many non-profit
organizations have been involved in learning the advocacy of environmental protection of
CSR such as those reported by the United Nations. They are, for example, (1) “Friends of
the Earth” who highlight the environmental impact of some MNCs and campaign for
stronger laws on environmental responsibility; (2) “Green Peace mission” is another
example of CSR initiative that gives benefit to societies and communities in preserving the
latter’s rights to reaping a healthy environment.
2.11 Corporate social responsibility disclosure and corporate financial performance
Presently, CSR remains at a premature developmental stage. It seems inevitable that CSR
will be a part of financial reporting standards (Lemus, 2016). For example, in accounting,
the areas that are related to CSR are financial accounting, managerial accounting, and
income tax reporting. In the 21st century, CSR is an emerging field in the accounting and
finance industry. The three most important financial reporting standards under CSR are
52
Global Reporting Initiative (GRI) G3 standards, AA 1000 series, and the UN Global
Compacts Communication on Progress (COP, Tschopp & Huefner, 2015).
Empirical research on the link between CSR and financial performance has given a lot of
varied and heterogeneous results. In particular, there is a great variety in the sign of the
relation studied. The first study to find a negative relationship between CSR and financial
performance was Vance (1975). The study looked at share price and found that in building
a portfolio, an investor would be better off investing in companies which reported little or
no CSR. His concluding comment, was that companies had more reasons to be socially
responsible on the basis of how it affected the per share value of their common stock.
An opposing view to CSR influencing profitability is that it is a firm’s financial
performance that influences CSR and not the other way round. This is contrary to what the
majority of researchers think. The idea is that firms that have available ‘spare cash’ are
more likely to invest in society and the environment (McGuire, Sundgreen & Scheemweis,
1988). The explanation provided for the adverse relationship observed between CSR and
financial performance is that firms accept a responsibility to a range of different
stakeholders. Firms take on the extra costs to benefit society as a whole but at the expense
of their shareholders’ personal wealth (McGuirc et al. 1988).
Shane and Spicer (1983) also found a negative relationship between the level of social
disclosures and economic returns. This is a direct contrast to Spicer’s 1978 paper which
found a significant positive relationship. This highlights the inconsistency of the results
obtained by different studies. The explanation that Shane and Spicer (1983) provided for
the negative results was that investors were put off by CSR. This is consistent with the
research by Riahi-Belkaoui (2006) who found a negative relationship between external
perceptions of a company’s CSR activities and executive compensation schemes, thus
53
providing a new angle to the relationship. Riaha-Belkaoui’s findings suggested that top
management could be discouraged from undertaking CSR activities due to the fact that the
shareholders did not appreciate their profits being spent on activities they did not consider
beneficial to them.
Waddock and Graves (1997) assumed that companies with responsible behaviour could
have a competitive disadvantage since they had unnecessary costs which fell directly on
the bottom line and would necessarily reduce shareholders’ profits and wealth (Preston
and O’Bannon, 1997). Both short-term analyses which were based on measuring abnormal
returns (Wright & Ferris, 1997), market measures (Vance, 1975) and long-term studies
(Vance, 1975) had a negative relationship between performance and CSR. Ullman (1985)
explained that no clear tendency could be recorded among connections on social
information, social performance and economic results. The main reasons for this were the
theory’s inadequacy, inappropriate keyword definitions, and lack of empirical material.
The author observed that important aspects were not just social performance and economic
results but also “information” about social performance, and that only a few studies had
analysed the three-dimensional relations.
Other studies highlighted the impossibility of defining the sign of the existing relationship
between CSR and performance in the short term on the basis of abnormal return measure
(Welch & Wazzan 1999) and market actions in the long term (Aupperle, Carroll, &
Hatfield, 1985).
Waddock and Graves (1997), using the theory of scarce resources, identified the adoption
of responsible social behaviour as a consequence and not a cause of performance
improvement. The idea is that during a positive trend, there will probably be fewer limited
resources. Some of these resources could be liberated in a secondary activity such as CSR.
54
Preston and O’Bannon (1997) made use of a similar hypothesis called “available funds”,
because a firm’s behaviour depends on accessible resources. The authors presented an
alternative theory to “good management” called “the hypothesis of social impact”, that is,
a better financial performance follows a stronger company’s reputation. By considering
stakeholders’ implicit needs, a company increases its reputation and this improves its
financial performance.
Luce, Barber and Hiliman (2001) studied the relation between CSR enterprise’s appeal to
employees and a firm’s public profile. They claimed that a firm’s reputation had a positive
influence on the relationship between CSR and appeal. Short term studies based on
abnormal return measure (Posnikoff, 1997) and market actions (Moskowitz, 1972) showed
a positive relationship between performance and CSR. Markowitz (1972) noticed that the
average of common stock returns of 14 selected ethical enterprises for the first half of
1972 was 7.28%, an amount that was higher than the Dow Jones’s industrial index.
In the long run, Cochran and Wood (1984) showed a positive relationship between social
responsibility and financial-economic valuation (after controlling for the age of the
company). Spicer (1978) found a positive correlation between a firm’s economic
performance and its level of pollution control in the paper and pulp industry. The study
found that the higher the level of pollution control, the greater the profitability and size of
the firm, and the lower the systematic and total risks. Spicer also concluded that the
benefits seen were short lived.
Anderson and Frankle (1980) took a different approach by using a firm’s market value to
measure financial performance and its relationship with corporate social responsibility. A
positive relationship between market value and corporate social responsibility was found.
It meant that investors had invested more in firms which reported CSR than those which

55
did not. It provided some evidence of the existence of the ‘ethical investors.’ Griffin and
Mahon (1997) looked at the chemical industry and found that a high CSR was linked to a
high financial performance and that low amounts of CSR reporting were linked to a lower
financial performance for the firm. Griffin and Mahon’s empirical study was one of only a
handful of studies that was industry-specific. Industry is a moderating variable. However,
the internal validity of the empirical research was low as Griffin and Mahon only studied
six firms.
Joyner and Payne (2002) also found a positive correlation between reporting CSR with
performance and firm value. Joyner and Payne noted the difficulty of measuring the
benefits of CSR. There were also limitations as only a small sample of two firms was
studied in detail. So, their results could not be generalized adequately. The authors also
saw some indications of a time lag between when CSR was reported and the financial
benefits seen. The findings conflicted with the results by Spicer (1978) who found that the
financial benefits were short lived.
Parket and Eilbirt (2006) undertook some research that looked at a couple of directly
related issues. The first was that managers performed a cost-benefit analysis of reporting
CSR. The empirical research showed no evidence to suggest that managers performed a
cost- benefit analysis on corporate social responsibility. One company may be more
inclined to report CSR while another which has spare money to invest in CSR is more
likely to do so (Parket & Eilbirt 1975). This adds to the strength of the argument for
companies being motivated by increased financial performance when reporting corporate
social responsibility as the company could invest the excess money in other revenue
earning investments such as bonds, share portfolios or even leave it in the bank instead of
investing in CSR. Parket and Eilbirt were able to find a positive relationship between
56
profitability and corporate social responsibility thereby providing more evidence of the
relationship between the two variables.
According to Margolis and Walsh (2002), empirical studies of the relationship between
CSR and financial performance comprise essentially two types. The first uses the event
study methodology to assess the short-run financial impact (abnormal returns) when firms
engage in either socially responsible or irresponsible acts. The results of the studies were
mixed. Wright and Ferris (1997) discovered a negative relationship, Posnikoff (1997)
reported a positive relationship, while Welch and Wazzan (1999) found no relationship
between CSR and financial performance. Other studies discussed in McWilliams and
Siegel (1997) were similarly inconsistent on the relationship between CSR and short run
financial returns. Cochran and Wood (1984) located a positive correlation between social
responsibility and accounting performance after controlling for the age of assets.
Aupperle, Carroll and Hatfield (1985) detected no significant relationship between CSR
and a firm’s risk adjusted return on assets. In contrast, Waddock and Graves (1997) found
significant positive relationships between an index of CSR and performance measures
such as ROA in the following year. Studies using measures of return based on the stock
market also indicated diverse results. Vance (1975) rectified a previous research by
Moskowitz by extending the time period for analysis from 6 months to 3 years, thereby
producing results which contradicted Moskowitz and which indicated a negative
relationship between CSR and corporate performance. However, Alexander and Buchholz
(1978) improved on Vance’s analysis by evaluating the stock market performance of an
identical group of stocks on a risk adjusted basis. They got an inconclusive result.
Previous studies underlined the differential effects of CSR dimensions on firm
performance (e.g., Brammer & Pavelin, 2006). Therefore, it is likely that the impact of

57
corporate social responsibility on firm performance is contingent upon which dimension of
social responsiveness is taken into consideration. For instance, several studies found a
positive relationship between environmental practices or performance and financial
performance (e.g., Konar & Cohen, 2001; King & Lennox, 2001), but other results
appeared to be negative or non-significant (Barla, 2007; Filbeck and Gorman, 2004). The
same types of results may be found for social and business behaviours performance
measures. Applying social screens may appear to affect performance positively (Statman,
2006), negatively or insignificantly (Geczy, Stambaugh, & Levin 2005).
From the customers and suppliers’ dimension, many scholars noted their importance for
firms and an increasing number of recent studies examined whether investment in
customers and suppliers’ policies mades business sense. The results appeared mixed as
well (Zhu & Nakata, 2007; Hult, Griffith, Ketchen, & Chabowski, 2007; Reitzing &
Wagner, 2010). An investment in better relations with suppliers may improve a firm’s
knowledge about what can be transformed in improved performance outcomes (Hult,
Griffith, Ketchen, & Chabowski, 2007). On the other side, an investment in better
relations with suppliers may create for firms opportunity costs of not learning which could
be reflected in its performance (Reitzing & Wagner, 2010).
Concerning the impact of regulatory constraints on firm performance, the literature also
presented mitigating results. Theoretically, the threat of fines and other regulatory costs
may induce a higher corporate social responsibility, but corporate social responsibility
may also be a response to government (regulatory) failure. CSR and stricter regulations
may thus be complements or substitutes (Lyon & Maxwell, 2008; Maxwell & Decker,
2006). Empirically, many studies have tested the so-called “Porter hypothesis” whereby
stricter environmental constraints would contribute to make firms more profitable by
spurring innovation and competitiveness. However, when examining the relationship

58
between environmental regulation and firm performance, some studies suggested a
positive relationship, other studies implied a negative relationship while still others
showed no relationship at all (Sanchez, 1997).
Recent research has tended to provide more consistent results and show preliminary
evidence of a positive impact of corporate social responsibility on firm performance and
also a bi-directional causality, namely, from financial to social and environmental
performance (Scholtens, 2008; Margolis, Walsh, & Efenbien, 2007). These new results
seem to confirm the theory and estimations proposed by Surroca, Tribo and Waddock
(2010) which drew upon instrumental stakeholder theory and the resources-based view of
the firm to account for the recursive causal link between corporate social responsibility
(CSR) and firm performance via the mediating role of firms’ intangibles. The proposed
theoretical argument states that by developing close relationships with primary
stakeholders, a firm can develop certain intangible resources (technology, human
resources, reputation and culture) which enable the most efficient and competitive use of
the firm’s assets and help it to acquire a competitive advantage over its rivals.
Mackey, Mackey and Barney (2007) developed a theoretical model in which the supply of
and demand for socially responsible investment opportunities were analysed to determine
which activities would improve, reduce, or have no impact on a firm’s market value. The
model showed that firms might fund socially responsible activities that did not maximise
the present value of their firms’ future cash flows yet it could still maximise the market
value of the firm. A positive correlation between firm choices about investing in corporate
social responsibility activities and firm value was shown, suggesting that corporate social
responsibility could improve an organization’s performance. The proposition was
supported by Deckop, Merriman and Gupta (2006) whose empirical research also
indicated that CSR was positively related to corporate financial performance.
59
In their 1999 article, Harrison and Freeman (1977) examined the relationship between
stake- holder management and the perception that a firm was socially responsible, and the
performance implications of both stakeholder management and social responsibility. A
key factor in the review was the concept of a theoretical problem in determining whether a
corporate social responsibility (CSR) programme improved corporate performance
because ‘economic effects’ are also social, and ‘social effects’ were also economic. The
article made it clear that the true effect of CSR effects could not often be determined
because the benefits were long-term and subtle. A company that invests in a CSR initiative
today might not receive a benefit from the programme directly, but rather through more
subtle consumer loyalty derived from the idea that they are buying from a company that is
socially conscious.
A survey of Americans commissioned by the National Consumers League and Fleishman
Hillard International Communications, released on May 31, 2006, clearly showed that
two-third of Americans would patronize or buy the products of companies they adjudged
socially responsible, especially those that were seen to treat their employees very well. In
the survey, 76 per cent of American consumers agreed that to be socially responsible,
companies should place employees’ salary and wage increases above making charitable
donations. In the same vein, 76 percent of American consumers believed that a company’s
treatment of its employees played a big role in consumer purchasing decisions. A major
implication of the findings is that for CSR to enhance firm performance, its content should
not simply depict what the firms favour but what the consumers favour since it is their
purchasing decisions that make the difference in the patronage build up to enhance firm
financial performance. In a 2008 global study of consumer thinking by Good Purpose TM
titled “Putting More Meaning into Marketing”, it was shown that almost seven out of 10
60
(68%) consumers said that they would remain loyal to a brand during an economic
downturn if it supported a good cause (Margolis, Walsh, & Efenbein, 2007).
Laura and Sergio’s (2009) study titled “Does Corporate Social Responsibility Affect the
Performance of Firms?” also found that CSR firms were more virtuous, and had a better
long run performance. They added that although such firms could bear some initial costs
arising from their involvement in CSR, they nonetheless obtained higher sales and profits
due to the reputation effect of their corporate social responsibility involvements or
programmes, as well as a reduction of long run costs and increased socially responsible
demands. A study by Nicholas and O’Brien (2007) investigated whether social
responsibility practices of Global Australian firms enhanced economic performance of the
firms over a three year period. The study titled “investigating Social Responsibility
Practices of Global Australian Firms and how those Practices Enhance Economic Success”
found that CSR had a positive and strong effect on the firm in terms of community related
stakeholder concerns. The results of the study also suggested that it paid for firms to be
moderately socially responsible.
2.12 Review of Empirical Studies
Empirical studies revealed mixed results of the impact of corporate social responsibility
disclosure on financial performance of quoted firms.
According to Gallardo-Vizquez, Barroso-Mendez, Pajuelo-Moreno and Sanchez-Meca
(2019), there is currently a lack of consensus in the literature on the link between
performance and corporate social responsibility disclosure (CSRD). A meta-analysis was
carried out to shed light on this controversial topic, using the ABI/Inform Complete and
EconLit databases as search tools. To isolate articles with substantive, methodological
relevance, various filters were used. In addition to other criteria, all articles had to contain
61
certain keywords related to the study’s variables and at least one of the seven keywords
indicating empirical data analysis. As a result of the procedure, the meta-analysis included
only 95 articles. To process the sample, we employed the procedure developed by Hunter
and Schmidt. The results showed that the CSRD-performance relationship was not
significant enough for practical purposes. However, an analysis of moderating variables
revealed that the connection became of practical importance when moderated by three key
variables: region, type of disclosure and measures of organization size. This study’s
findings made a significant contribution by clarifying the links between CSRD and
performance, and identifying which variables could explain the diverse results of previous
research. Regarding limitations, the meta-analysis was subject to the availability of
published research and included only studies that reported Pearson correlation coefficients
and standardized beta coefficients.
Ehioghiren and Eneh (2019) examined corporate social responsibility accounting of bank
and insurance companies in Nigeria. The population of the study consisted of all the 16
banks and 40 companies quoted on the Nigerian Stock Exchange as at December, 2018.
The research design adopted for the study was the ex post facto research design. A sample
of 11 banks and insurances companies was selected based on their size from the
population of the bank and insurance companies. Data for the study were obtained from
annual reports for the period of ten (10) years, ranging from 2007 to 2016. Independent
sample test was used to compare the social responsibility expenditure of insurance
companies with those of banks. It was established that there existed a significant
difference in the social responsibility expenditure of banks and insurance companies in
Nigeria. The implication of the findings could be linked to lack of legal prescriptions and
ignorance of the benefits of social accounting and reporting.
62
Ibrahim and Hamid (2019) examined the impact of corporate social responsibility on
financial performance of listed non-financial services companies in Nigeria. The study
used ex-post factor research design and utilized secondary data collected from the annual
reports and accounts of twenty three (23) sampled listed non-financial services companies
in Nigeria for a period of 10 years (2008-2017). The sample of the study was arrived at by
using concensus sampling technique in which all the elements of the population were used
for the study. The data were analysed using descriptive statistics, correlation and
regression analysis (GLS Fixed Effect) with the aid of Stata Version 14.0. Robustness
tests, namely multicollinearity, heteroscedasticity, normality of residuals, Hausman
specification and F-Test were conducted to validate the results.
Gololo (2019) empirically examined the relationship between corporate social
responsibility disclosure and financial performance of quoted cement companies in
Nigeria. Secondary data were sourced from the quoted Nigerian cement companies’
annual reports. A sample of three [3] companies emerged from the population of five [5]
companies using purposive sampling technique method. The study utilized annual reports
of ten [10] years period covering [2008-2017] to obtain data for the study. Pooled OLS
and Random Effect [RE] Panel Estimation analysis methods were used to display and
discuss the results using STATA Version 12. The results revealed that corporate social
responsibility disclosure had a significant and positive impact on the employed return on
equity and return on capital employed. However, leverage and company size as control
variables had a positive significant effect on the financial performance of quoted cement
companies in Nigeria. Thus, CSRD was an important component to consider in
determining financial performance of companies.
63
Erhirhie and Ekwueme (2019) examined corporate social sustainability reporting and
financial performance of oil and gas industry in Nigeria. This study assessed the effect of
corporate social sustainability reporting on return on assets, return on equity, and return on
capital employed of oil and gas companies listed on the Nigerian Stock Exchange. Ten oil
and gas companies were sampled for the study. The study utilized secondary data
collected via financial ratios and accounts of the individual companies and content
analysis. The findings showed that social sustainability reporting exerted a negative effect
on all three performance proxies, howbeit, only its effect on return on equity was
statistically significant.
Oyewumi, Ogunmeru and Oboh (2018) used panel data set from banks in Nigeria, a
developing country to examine the effects of corporate social responsibility (CSR)
investment and disclosure on corporate financial performance. The results from the
Wallace and Hussain estimator of component variances (a two way random and fixed
effects panel) suggested that CSR investment without due disclosure would have little or
no contribution to corporate financial performance. This paper supported the argument
that firms could benefit both financially and non-financially from a strategic CSR agenda.
Oladipupo and Oladimeji (2018) investigated the association that subsisted between firm
social responsibility and stock price market. The data for the study were gathered from
secondary sources which were from the audited financial records as well as accounts of
the listed companies in Nigeria. The study was highly descriptive and empirical as it
embraced the use of panel regression technique as the tool of analysis. The findings of
regression analysis confirmed as a whole that firm social responsibility did not correlate
with stock price market. It also discovered that corporate social responsibility would not
be influenced by stock price market.
64
Seungwoo, Junseok and Ahreum’s (2017) research analysis of CSR on firm financial
performance in stakeholders perspective explored the R&D, technology commercialization
and CSR motivation as enhancement of corporate performance through CSR from the
stakeholders theory. It also investigated both traditional and strategic CSR relationships
with financial performance. It used questionnaire survey method and relied on primary
data. Questionnaires were only distributed to a specialized company. A research carried
out on Safaricom Ltd, a telecommunication company by Wekesa (2017) on corporate
social responsibility and financial performance showed an insignificant positive
relationship between CSR and financial performance and its indicators, revenue, net
income and earnings per share (EPS). The study used correlation research design and also
secondary data in collecting the annual financial reports from 2009 to 2017.
Adina and Dumitru (2017) investigated the differences in the market stock price (and other
market variables such as dividends and stock return) of companies that showed CSR
compared with those that did not. For this study, we used three statistical techniques:
discriminant analysis; probit analysis model; and logistic regression. There was no
significant difference in the prediction ability of the models in the context where probit
model and logistic regression had an average correct classification of 70.29%, while
discriminant analysis recorded 71.26%. Our analysis showed that stock return had a
significant impact on CSR activities of a company. Moreover, all discriminants had a
positive impact on CSR.
Isa and Madaki (2017) examined the impact of Corporate Social Responsibility Disclosure
(CSRD) on the financial performance of listed consumer goods companies in Nigeria. The
data were collected from the annual reports and accounts of the sampled companies for a
period of ten years, from 2005 to 2014. The data were analysed by means of descriptive

65
statistics to provide a summary of the variables. Ordinary Least Square (OLS) and
Generalized Least Square (GLS) regression were used to test the study’s hypotheses using
STATA software version 12.00.Thus, a panel data regression technique was employed.
The result showed a negative and significant relationship between CSRD and ROA; and a
negative but an insignificant relationship between CSRD and ROE; Leverage had a
positive but an insignificant relationship with CSR; Tobin’s Q had a positive and
statistically insignificant relationship with CSRD while EPS had a positive and significant
relationship with CSRD. It was found that the control variables (firm size and age) had a
positive and significant relationship with CSRD.
Iqbal (2017) sheds light on the impact of CSR on financial performance (FP) of banking
sector of Pakistan, using a sample of 30 commerical banks listed with Pakistan stock
exchange for the period of 10 years from 2006 to 2015, selected base upon market
capitalization. We applied pooled regression models to investigate the impact of CSR on
FP. Empirical findings signify the robustness of pooled model that documented a positive
and significant impact of CSR on return on assets, return on equity and earnings per share.
This premise holds that CSR has positive and significant impact on FP of selected
commercial banks of Pakistan. Based upon key findings, this study postulates CSR
phenomenon is consider as an essential growth element and FP-boosting tool by banking
industry of Pakistan.
Wan and Muhammad’s (2016) study on corporate social responsibility and financial
performance used Malaysia as a case study. The study investigated the relationship
between corporate social responsibility and firm performance in Malaysian public listed
companies. Independent variables like workplace, community, environment and market
place were used, accompanied by some dependent variables like earnings per share (EPS)
66
and return on equity (ROE). The study discovered a positive relationship between CSR
and financial performance.
Sampath (2015) examined the corporate social responsibility activities which were divided
into three categories, named: CSR activities to environment; CSR activities to employees;
and CSR activities to community. Each sample consisted of thirty listed companies that
disclosed their corporate social responsibilities activities from 2010 to 2014. Weighted
ranking method was used to measure the CSR activities while average share price was
used to determine the share price. Correlation was used to find out the association between
corporate social responsibility and share price. Regression was used to check the
relationship between corporate social responsibility and share price. The findings revealed
a positive relationship between share price and CSR activities for employees or
environment. R2 showed that CSR activities were not the crucial factor when making buy
or sell decisions of shares.
Fiori, Donato and Izzo (2015) investigated the impact of corporate social performance on
stock prices in Italian listed companies. The main stream of literature focused on the
relation between CSR and financial performance showing contradictory results that still
fed a debate which had not yet reached a unanimous and widely shared position.
Concerning the selection of the measure of performance, we chose stock prices as a proxy
for financial performance in order to measure the perception and reaction of financial
markets to the companies’ social responsible behaviours. Using different social
performance indicators concerning environment, community and employment activities,
we found evidence that a good social performance had a negative influence on stock prices
on the Italian Stock Exchange Market. The phenomenon was particularly evident when the
environmental strategies of the Italian listed companies were considered. This evidence is
67
consistent with the peculiarities of the Italian capitalism structure, which, because of its
backwardness in CSR topics and related issues, seems not mature enough to evaluate
appropriately the value of these policies.
Noor (2015), in his research on corporate social responsibility practice and corporate
financial performance: a case study of Nigerian listed companies, described the nature and
trend of the practice of CSR and also the relationship between CSR and corporate
financial performance among Nigerian listed companies; Content analysis was used to
extract data from annual reports of 68 companies listed on the floor of the Nigerian Stock
Exchange. And also, an hierarchical multiple regression analysis was used to examine the
relationship between CSR and CFP. The result of the study showed a negative relationship
between environmental disclosure and corporate financial performance.
Mahbuba and Farzana (2013) on Corporate Social Responsibility, based their research on
the relationship between corporate social responsibility expenditure and bank profitability,
and made Dutch Bangla Bank Ltd. (DBBL) in Bangladesh their case study. The
hypothesis formulated was tested and the result showed a significant relationship between
corporate social responsibility and profitability of DBBL. So, the CSR expenditure
provided good returns for the banks in the short run, and in the long run, it would surely
provide better returns. The study concluded that there was a significant relationship
between CSR and profitability, and the null hypothesis was rejected.
The authors however, pointed out the limitations of the study. First, the study was based
only on the net profit after tax of the bank which was one of the major indicators of the
bank’s financial performance but not the only one. Second, the study considered only one
bank in Bangladesh which did not reflect the overall banking sector of Bangladesh. In
Bangladesh, CSR initiatives by banks had risen significantly. So, Bangladesh Bank should
68
carefully monitor the activities of the banks whether they comply with the mandatory
involvement in the CSR activities from net profit which is 10% or more from its previous
year’s net profit. Above all, new laws regarding CSR legal restrictions to do CSR
activities for the betterment of the people, not for profit making or marketing strategies,
will surely bring more sustainable growth to the Bangladesh banking sectors (Mahbuba &
Farzana, 2013).
Uwuigbe and Egbide (2012) empirically investigated the relationship between firms’
corporate financial performance and the level of corporate social responsibility disclosures
among selected firms in Nigeria. It also looked at the relationship between firms’ financial
leverage and the level of corporate social responsibility disclosures among selected firms.
While the annual reports for the period 2008 were utilized as the main source of data
collection for the sampled 41 listed firms, the multiple regression analysis was employed
as a statistical technique for analysing the collected data. The paper revealed that firms’
corporate financial performance and the size of audit firm had a significant positive
relationship with the level of corporate social responsibility disclosures among selected
firms. Also, the paper, as part of its findings, observed that a significant negative
relationship existed between firms’ financial leverage and the level of corporate social
responsibility disclosures.
El Mosaid and Boutti (2012) evaluated the degree of CSR in Islamic banks using return on
asset (ROA) and return on equity (ROE). The sample size was got from 8 Islamic banks,
from 2009 to 2010. Simple regression model was used and the results showed no
significant relationship between CSR and firm performance.
The research of corporate social responsibility and its contributions to the development of
business in society with Nigeria as a case study by Uadiale and Fagbemi (2012) used a
69
sample size of 40 quoted companies and a measure for firm performance as return on asset
and return on equity. Findings gave corporate social responsibility a positive significant
relationship with firm performance.
Amole, Adebiyi and Awolaja (2012) investigated the relationship between CSR and
profitability of banks in Nigeria. First Bank Nigeria Plc was used as a case study.
Secondary data were obtained from audited annual reports of the bank. The outcome of the
regression analysis gave a positive significant relationship between CSR and profitability
in the stated case study.
Babalola (2012) conducted a study on corporate social responsibility and profit. Nigeria
was used as a case study, and listed firms on the Nigerian Stock Exchange were used to
gather secondary data. The findings of the study showed a negative relationship between
corporate social responsibility and profit.
Kakakhel, Ilyas, Iqbal, and Afeef (2012) investigated the impact of corporate social
responsibility on financial performance of cement sector listed firms on Karachi Stock
Exchange (Pakistan). Sample size of fifteen companies selected on the basis of availability
of data of companies. For data used annual reports during time period of 2008-2014. For
analysis purpose used fixed and random effect models and on the basis of Hausman test
fixed model is best for analysis. From the results it is concluded that there is positive and
significant relationship between corporate social responsibility and financial performance.
These results support the theoretical relationship between corporate social responsibility
and financial performance. The Hypotheses of positive and significant relationship of
corporate social responsibility and financial performance has been supported. This work
also supports the view of all those researchers whose empirical evidence found positive
70
and significant relationship between corporate social responsibility and financial
performance.
Iqbal (2012) analysed the positive impact of CSR on firm performance in his research on
the impact of CSR and firm performance in Pakistan. The secondary data used were got
from audited annual reports of 156 listed companies on the Karachi Stock Exchange by
using correlation and regression analyses. Return on asset and return on equity were used
to measure firm performance, while to measure corporate social responsibility, he used
social compliance, corporate governance, community investment, social report, product
integrity, corporate giving, environmental compliance, and business ethical principle. The
findings revealed a positive impact of CSR on firms’ financial performance.
Iqbal (2012) estimates the relationship of corporate social responsibility, financial
performance, market value of the share and financial leverage. In this particular study, 156
listed companies on Karachi Stock Exchange (KSE) from textile sector, chemical sector,
cement sector and the tobacco sector are taken. The observations are taken for the entire
period of 2010 and 2011 from the published resources of state bank of Pakistan. In
aggregate, the results of the study conclude that corporate social performance (CSR) has
no effect on financial performance (CFP). It is obvious from the results that CSR has
negative effect on the market value of the share but no relationship to D/Ea behaviour of
the firm, significantly. Moreover, the investors do not have the same level of information
as the information is captured by the management abou the company affairs. In addition,
the debt singling hypothesis indictes that the further incorporation of debt into capital
structure should include the behaviour of the investor, regarding to the investment in the
shares positively, but due to information asymmetry, it is negative.
71
Prior studies by Kamal (2012), Webb (2009), Cetin, Dammar and Husoy, (2007), Carroll,
(1999), Garry (1995), and Chrong (1993) reported that the introduction of CSR was
generated from economic, political, agency, stakeholder, legitimacy, and ethical theories.
Stakeholder theory, which was the main theory on which this research was based, posits
that an organization exists primary not only for itself and owners but also for the benefit of
society at large. Firms that engage in CSR do so as a way of giving back to society.
A research on the relationship of corporate social responsibility and firm performance of
banks in the US, UK and Japan by Keffas and Olulu-Briggs (2011) utilized 38 financial
and economic ratios that covered asset quality, capital, operations and liquidity. Data
Envelopment Analysis was used. The findings showed that banks which incorporated CSR
were more efficient in managing their asset portfolios. Therefore, its results were positive.
Corporate social responsibility in some firms do not prevent a drop in their market value.
CSR activities engender no improvement in some companies’ value performance, only
long-term growth in return on equity (Cho, Lee, & Park, 2012). Nelling and Webb (2004)
asserted that corporate social responsibility was driven more by unobservable firm
characteristics than by financial performance. They suggested that stock market
performance led to a greater firm investment in the aspect of corporate social
responsibility devoted to employee relations, but CSR activities did not affect financial
performance. The authors however, stated that the only aspect of corporate social
responsibility that was driven by stock market performance was employee relations. This
suggests that if corporate social responsibility activities provide benefits to the firm, such
benefits appear to manifest in unrelated dimensions to financial performance.
According to a popular opinion, seven out of ten consumers said that they would remain
loyal to a brand during an economic downturn if it supported a good cause. Poddi and

72
Vergalli (2009) also found that corporate social responsibility firms were more virtuous,
and had long run performance. They added that although such firms could bear some
initial costs arising from their involvement in corporate social responsibility, they,
nonetheless, obtained higher sales and profits due to the reputation effect of their corporate
social responsibility involvements or programmes, as well as a reduction of long run costs,
and increased socially responsible demands.
Heal (2009) asserted that poor shouldering of CSR cost organizations dearly through the
loss of reputation and goodwill. This means that organizations that properly integrate
corporate social responsibility into their business strategy develop good programmes to
implement this strategy, and also go ahead to implement the CSR strategy effectively to
enjoy a high reputation and accumulate high reputational assets. He also stated that
corporate social responsibility could reduce a firm’s cost of capital through the impact of
corporate social responsibility Investing (SRI).
Sweeney and Coughlan (2008), researched on reporting the corporate social responsibility
that corporate entities engaged in and if different industries reported corporate social
responsibility differently. The authors investigated how annual reports addressed the CSR
concerns of various groups of stakeholders to determine whether the group’s orientation
was stakeholder and industry specific. Based on stakeholder theory, significant emphasis
is given to stakeholder attributes and characteristics including power, legitimacy, and
agency, as well as to primary and secondary stakeholder categorization. A content analysis
approach was utilized to examine annual reports of 30 large public global companies, by
industry, for CSR messaging. The analysis identified strong similarities in the targeting of
CSR communications in the annual reports and intra-industries, and even though some
companies had separate CSR reports, the information was always summarized in the
73
annual reports. The research also pointed out a lack of clear focus on the benefits of CSR
for the shareholder as a specific stakeholder, as only one out of the seven industries in the
study put any focus on them.
Mackey, Mackey and Barney (2007) found that sometimes, when firms began socially
responsible activities, their market value would increase and sometimes, it would reduce
instead of increasing. They also found that sometimes, when firms ended socially
responsible activities, their market values would decrease while in some other firms, the
market value would increase. Also, continuing current socially responsible activities,
either by continuing to invest or not to in these activities increases a firm’s market value.
This is a classic example of mixed findings. The authors concluded by stating that only by
examining the supply of a demand for socially responsible investment opportunities at the
time those decisions were made could the relationship between a firm’s social
responsibility strategies and its market value be understood (Mackey, et al., 2007).
Matthew, Rebecca and Greg (2007) researched corporate social responsibility and firm
performance using Australia as a case study. Their research stated that corporate social
responsibility had endangered the interests of Australian economy in recent years. The
method used cut across 300 ASX listed companies for 2005 financial year. A sample of
277 companies was used after eliminating companies with missing data (McWilliams &
Siegel 2000). The result stated that there was no significant relationship between corporate
social responsibility and firm performance.
Colbert and Kurucz (2007) reported that 68 per cent of the 250 largest multinational
corporations had adopted CSR reporting by 2005. The most recent Klynveld Peat Marwick
Goerdeler (KPMG) Survey (2011) showed that 95 per cent of the Global Fortune 250
companies reported their CSR activities and that reporting, overall (in the 34 companies
74
surveyed), had increased by 11 percent in 2008 to 64 per cent. According to some authors,
what particularly makes these stand-alone reports remarkable is that they represent a clear
engagement of corporations with the increasingly critical issues of environmental and
social responsibility as well as business sustainability (Gray & Herremans, 2011).
According to Egwuonwu (2006), the three methods of evaluating corporate social
responsibility performance are the accounting or financial measures, market/stock market
value measures and the mixed measure which include the reputational assets accumulated
through engagement in corporate social responsibility programmes.
There is quite a large amount of literatures, empirical and otherwise that positively
associates corporate social responsibility with enhanced firm performance. The effort
appears so overwhelming that even firms with conservation spending increasingly indulge
in corporate social responsibility efforts. This is true even for Nigeria where a lot of firms
are into the practice of corporate social responsibility. A survey of Americans in 2006
clearly showed that two thirds of Americans would patronize or buy the products of
companies they adjudged socially responsible, especially those that were seen to treat their
employees very well. A major implication of the findings is that for corporate social
responsibility to enhanced a firm’s financial performance, its content should not simply
depict what the firm favours but also what the consumers favour since it is their
purchasing decisions that make the difference in the patronage build up to enhance firm
financial performance (Egwuonwu, 2006).
One major way the practice of corporate social responsibility has been found to enhance
firm value is through the reduction of conflict with stakeholders. Majority of literatures
underscore this reality, especially as it is noted that firms use corporate social
responsibility to reduce the risks in their environment. When firms are at peace with their
75
environments and host communities, wastage that arise from conflicts is eliminated and
the firm is placed in the right frame of mind to concentrate on the business of adding value
to its numerous stakeholders, especially the shareholders. That is why some researchers
assert that doing CSR is good business, that the avoidance or reduction of conflicts is
indeed a major contribution to effective firm corporate social responsibility programme
(Egwuonwu, 2006).
A few empirical literatures did also not find any positive relationship between corporate
social responsibility and firm performance. Becchetti and Ciciretti (2006) found that
individual social responsibilities firm stocks, on average, had significantly lower returns
and unconditional variance than control sample stock when controlling for industry
effects. Again, corporate social responsibility activities may affect the productive impacts
of efficiency, technical change and economies of scale as well as increase input costs
composition. Also, the exact impact of CSR on organizational value or performance is
dependent on firm characteristics such as the motivation for socially responsible actions,
tax laws, location, plant age and innovation activities.
Dentchev (2004) proved that the CSR strategy could harm the competitive advantage of
the firm if not carefully conducted. His result revealed positive but also negative
consequences of a corporate policy based on CSR. On the positive side, corporate social
responsibilities could lead to improved stakeholder relationship, enhance corporate
reputation and strengthen the business model of the firm. On the negative side, the freely
assumed corporate responsibilities could lead to reputation damage, misunderstanding and
wrong perceptions mainly based on a lack of knowledge, lack of credibility and lack of
information. The conclusion was that the theory on information asymmetry should also be
used in explaining the strategic importance of corporate social responsibility.
76
A study carried out by Mangos and O’Brien (2000) showed that corporate social
responsibility had a positive and strong effect on the firm in terms of community related
stakeholder concerns. The results of the study also suggested that it paid for firms to be
moderately socially responsible.
A corporation’s relationship with regulators can be of real significance in heavily-
regulated industries. A reputation for being green (supporting or promoting the protection
of the environment) can also be of use to an oil company in negotiations for access to
potential oil reserves in environmentally sensitive areas. Applications for exploration
permits in such areas are generally contested by environmental groups, and a reputation
for environmental sensitivity may be an asset in overcoming the reservations raised. In
general, a regulatory decision in favor of a company with a strong reputation for socially
responsible behaviour will be greeted more positively than one in favor of a company seen
as anti-social in its conduct. This must influence regulators in their decisions (Abbey,
2002).
Simpson and Kohers (2002) supported the hypothesis that the link between corporate
social responsibility and financial performance of the firm was quite positive. Preston and
O’Brien (2008) also saw no significant negative relationship between corporate social
responsibility and firm financial performance. Various studies on corporate social
responsibility observe that total sales per employee is significantly higher in firms that
carry out corporate social responsibility, notwithstanding the fact that smaller portions of
the financial benefits so derived go to shareholders, suggesting that returns on equity may
be lower in CSR firms. But this seeming penalty of relative lower return on equity is
compensated for by reduced conditional volatility on social responsibility. Negative
consequences are the portion of firms that abandon corporate social responsibility. Zsolnai
(2006) stated that caring organizations were rewarded for the higher costs of their socially
77
responsible behaviour by their ability to form commitments among owners, managers and
employees, and from established trust relationships with customers and sub-contractors.
He went ahead to state that people who were basically motivated to adhere to ethical
norms often prospered in competitive environments; and that socially responsible firms
could survive in competitive environments because social responsibility brought
substantial benefits to firms. According to Small and Zivin (2005), when a sizable fraction
of investors prefer corporate philanthropy to direct charitable giving (e.g., to avoid
taxation of corporate profits), firm valuations will be maximized by following social
policies that involve strictly positive levels of corporate philanthropy. Abbey (2002) also
asserted that a strong social and environmental performance led to a strong financial
performance.
McWilliams and Siegel’s (2000) research on corporate social responsibility and financial
performance estimated the effects of CSR by regressing firm performance on corporate
social performance. Two models were used: the specification model and the correlation
model. Results showed that R&D and corporate social performance were highly
correlated. Therefore, when R&D intensity was infused in corporate social performance,
there was a neutral effect on profitability.
Two studies that used risk adjusted measures of investor returns were by Anderson and
Frankle (1980) and Alexander and Buchholz (1978). However, there is a problem with the
use of even a “clean” measure of investor returns for this type of study. This problem is
summarized by one of the tenets of modern finance theory, the efficient markets
hypothesis. Simply stated, this tenet posits that as information that might affect future cash
flows of a firm becomes available, it immediately will be reflected in its current share
price. The implication of this is that even if CSR does lead to an improved financial
78
performance, as soon as the market becomes aware of any change in a firm’s CSR rating,
it will immediately alter price per share to reflect that information. As Alexander and
Buchholz (1978) noted, after such a reaction, only new information regarding a firm’s
social responsibility would have any affect on the firm’s financial performance. Thus, if
the perception of a firm’s social responsibility changed in 1975 and a naive researcher
examined only the period 1977-1979, then he or she probably would conclude that CSR
and financial performance were unrelated. In order to employ investor returns measures of
financial performance properly, the researcher must conduct an “event study.” Failure to
do so can lead the researcher, incorrectly, to the conclusion that there is no relationship
between CSR and financial performance, even if one actually exists.
As noted earlier, the previous empirical work in this area reached no real consensus on the
nature of the relationship between CSR and financial performance. Out of the 14 studies
examined, nine, Anderson and Frankle (1980), Ingram (1978), Preston (1978), Spicer
(1978), Sturdivant and Ginter (1977), Bowman and Haire (1975), Bragdon and Marlin
(1972), Heinze (1976), and Moskowitz (1972) found some positive relationship between
CSR and financial performance. However, as noted earlier, because of the incorrect
specification of the financial performance proxy, small sample size and questionable
methodology, the results must be viewed with suspicion.
Three studies by Abbott and Monsen (1979), Alexander and Buchholz (1978), and Folger
and Nutt (1975) found no real link between these variables. Alexander and Buchholz
(1978) as well as Abbott and Monsen used forms of investor returns as proxies for
financial performance. Abbott and Monsen, however, failed to account properly for risk.
Alexander and Buchholz did properly account for risk, but they did not employ an event
study and thus failed to discover a relationship even if one did exist. One study (Vance,

79
1975) found a negative relationship between the variables. However, as discussed earlier,
his proxy for investor returns (only change in share price) was clearly insufficient.
In order to overcome this problem, several researchers, Abbott and Monsen (1979),
Alexander and Buchholz (1978), Preston (1978), Vance (1975), and Moskowitz (1972)
compared their samples to broad market averages such as the Standard and Poors 500.
This step represents an improvement, but comparison to industry control groups is
superior. Accounting practices, operating leverage, and other variables that may influence
test results will be more homogeneous within industries. Sturdivant and Ginter (1977)
recognized this problem and grouped their sample into four somewhat homogeneous
subgroups. Unfortunately, by doing so, they reduced their overall sample size and did not,
necessarily, create subgroups with sufficient homogeneity. Finally, the time period(s)
employed in a number of the previous studies was too short. Seven of the studies
employed time periods equal to or less than two years. Only five of the studies used time
periods greater than or equal to five years.
One particularly innovative methodology that avoids many of the earlier problems with
investor returns was employed by Ingram (1978). He tested for a correlation between
social responsibility disclosures (used by others as a proxy for CSR) and financial
performance while controlling for both risk and industry effects. The procedure may be
viewed as a reverse cluster analysis where the sample is iteratively split into subgroups,
with the grouping criterion being maximization of the difference of a functional
relationship between each of the two subgroups at each iteration. The functional
relationship that Ingram used was excess market return for each firm as the dependent
variable. He used fiscal year, excess accounting earnings, and industry as explanatory
variables. Ingram’s procedure divided his sample of 116 firms into 10 subgroups wherein

80
each subgroup had two sets of firms—one having higher excess market returns than the
other. In seven of those subgroupings, firms in the higher excess market return category
had better CSR ratings than those in the lower excess market return category. The reverse
was true for the remaining three subgroups (Ingram, 1978).
Although the technique avoided many of the problems encountered by earlier studies, one
must be cautious in interpreting Ingram’s results as a support for a correlation between
CSR and financial performance. If, in fact, in Ingram’s null hypothesis there is no
relationship between social responsibility disclosures and financial performance, then 7 or
more of the 10 groups would have disclosure ratings in the higher financial performance
categories with a frequency of 11.32 percent. This clearly is not a strong rejection of the
null hypothesis (Ingram, 1978).
Most of the previous work in this area employed samples that were too small to result in
any safely generalizable results. The Folger and Nutt’s (1975) study, for example,
examined only nine firms. In fact, 6 out of the 14 studies examined here had samples of
less than 30 firms. Secondly, the control groups in a number of those studies were too
small. In several of the studies, the small sample of CSR firms was segmented and
subgroups were compared. In others, the sample was matched with an external control
group of a similar size. All but four of the studies employed control groups smaller than
100 firms.
2.13 Theoretical Framework
It is the “blueprint” or guide for a research (Grant & Osanloo, 2014). It is a framework
based on an existing thory in a field of inquiry that is related and/or reflects the hypothesis
of a study. It is a blueprint that is often ‘borrowed’ by the researcher to build his/her own
house or research inquiry. It serves as the foundation upon which a research is constructed.

81
Sinclair (2007) as well as Fulton and Krainovich-Miller (2010) compare the role of the
theoretical framework to that of a map or travel plan. Thus, when travelling to a particular
location, the map guides your path. Likewise, the theoretical framework guides researcher
so that he/she would not deviate from the confines of the accepted theories to make his/her
final contribution scholarly and academic. Thus, Brondizio, Leemans, and Solecki (2014)
concur that theoretical framework is the specific theory or theories about aspects of human
endeavour that can be useful to the study of events. Theoretical framework consists of
theoretical principles, constructs, concepts, and tenents of a theory (Grant & Osanloo,
2014). In this study, the theories applicable are: Shareholders theory; Stewardship theory;
and Stakeholder theory.
2.13.1 Shareholders Theory
This theory states that an organization’s commitment to operate in an economic and
environmentally sustainable manner while recognizing the interest of the stakeholders will
lead to a positive significant result in the financial performance (Freeman 1984, 1994).
This theory, proposed by Milton Friedman, stated that profit making is the primary
responsibility of any company, business or organization. In the theory, social
responsibility is to be ignored while recognition is based only on shareholders’ wealth.
Resources are not used effectively when companies engage in different CSR activities
(Henderson, 2001) so, managers are believed to work on behalf of shareholders to perform
important functions. This theory also points out that owners/entrepreneurs are special
stakeholders of the company therefore, their interest should be prioritized over other
stakeholders’ because they are the major providers of fund to the business. Therefore,
companies should incorporate the interest of shareholders that affects the company
positively or negatively.
82
Ancrum (2006) posited that the new framework for companies to embrace was derived
from the recognition that profit alone did not guarantee sustainable success but it needed
to be balanced with other factors: reputation; brand value; and retention of human capital.
This new framework is the value-creation business model which implies the combination
of personal principles, corporate ethics and commercial sustainability.
2.13.2 Stewardship Theory
Stewardship theory is a relatively new concept (Karns, 2011) and assumes that the
manager is a steward of the business with behaviours and objectives consistent with those
of the owners. The theory suggests that the firm’s purpose is to contribute to humanity by
“serving customers, employees and the community” (Karns, 2011). At the center of the
theory’s foundation is the concept that the business is here to serve rather than prouce a
profit. However, to be able to serve, the firm must be able to sustain itself economically
and this theory promotes efficient use of resources through working with stakeholders. It
views profits as necessary and an important funding mechanism to the primary objective
of meeting the service-oriented mission.
A stewardship focused firm aligns itself with the needs of society and through risk taking
and innovation, attempts to improve the life of others utilizing a business approach (Karns,
2011). The managers of such a firm are not motivated by personal needs and desires, but
rather see themselves as stewards with the same motives and objectives as the owners of
the firm (Davis, Schoorman, & Donaldson, 1997). Integrity, justice, and respect are the
core values of the firmand serve as the foundation for management’s actions on all
decisions. The pursuit of wealth building is secondary to serve for the common good from
sustainable business functions focused on the betterment of people and planet.
83
Underlying this philosophy of service is the perception that management is composed of
trustworthy individuals working together with all levels of employees and other
stakeholders (customers, suppliers, communities) who share the same philosophy (Davis,
Schoorman, & Donaldson, 1997). This behaviour is a collective effort and will result in
positive bneefits to the owners of the business through increased sales and profits.
Decisions are made by management based on the perception of what is best for the grup
rather than the individual. The more groups satisfied, the more profits will be created, and
the greater the financial rewards. Consequently, stewardship theorists build structures that
empower and facilitate management believing that it is not necessary to develop control or
monitoring mechanisms since management has the same intrinsic values as the owners
(Davis, Schoorman, & Donaldson, 1997).
Stewardship theory is much more of an altruistic approach to business than agency theory.
It promotes a broader focus and purpose than agency theory and assumes not only that
management’s incentives are not in conflict with those of the owners but also that the role
of business is to promote the health of our society. Given the history of business scandals
and failures, one could argue that maybe business is not capable of implementing such a
concept today or in the near future.
Stewardship theory is a framework which argues that people are intrinsically motivated to
work for others or for organisations to accomplish the tasks and responsibilities with
which they hae been entrusted. It argues that people are collective minded and pro-
organizational, rather than individualistic and therefore work towards the attainment of
organizational, group, or societal goals because doing so gives them a higher level of
satisfaction. Stewardship theory therefore provides one framework for characterizing the
motivations of managerial behaviour in various types of organisations (Caldwell, Hayes,
Karri, & Bernal, 2008).
84
The steward theory states that a steward protects and maximizes shareholders wealth
through firm performance. Stewards are company executives and managers working for
the shareholders, protects and make profits for the shareholders. The stewards are satisfied
and motivated when organizational success is attained. It stresses on the position of
employees or executives to act more autonomously so that the shareholders’ returns are
maximized. The employees take ownership of their jobs and work at them diligently.
The assumptions of stewardship theory are that long-term contractual relations are
developed based on trust, reputation, collective goals, and involvement whre alignment is
an outcome that results from relational reciprocity.
2.13.3 Stakeholder Theory
It is understood that the meaning of stakeholders is very broad indeed as it goes beyond
those who have purely formal or contractual ties to the organization. Other authors writing
on the subject have defined stakeholders similarly. Evan and Freeman (1988) clarified the
definition by stating that stakeholders were those groups of people who had a stake in or a
claim in the firm. They specifically outlined suppliers, customers, employees,
stockholders, the local community and management as the stakeholder groups in an
organization. Carroll (1993) defined a stakeholder as any individual or a group of people
who could affect or were affected by the actions, decisions, policies, practices, or goals of
the organization.
Stakeholders can be identified by the legitimacy of their claims which is substantiated by a
relationship of exchange between them and the organization. Hence, stakeholders include
stockholders, creditors, managers, employees, customers, suppliers, local communities and
the general public. Hill and Jones (1992) noted that the term, stakeholder, refered to
groups of constituents which had a legitimate claim on the firm. This legitimacy is
85
established through the existence of an exchange relationship, that is, an identifiable
contract that can be shown to exist between two parties. Each of these groups can be seen
as supplying the firm with critical resources (contributions), and in exchange, each expects
its interests to be satisfied (by inducements).
Some early studies by Clarkson (1995) and Freeman (1984) also found it useful to define
stakeholders as either primary or secondary. Clarkson (1995) argued that a primary
stakeholder was one without whose continuing participation the corporation could not
survive as a going concern; and secondary stakeholders as those who influenced or
affected, or were influenced or affected by the organisation, but were not engaged in
transactions with the organization and therefore, not essential to its survival. According to
Freeman (1984), primary stakeholders are those upon which the organization depends for
its survival (customers, shareholders, government and employees) and secondary
stakeholders are those who have an interest in the organization or the organization’s
activities, although the organization may not depend on these groups for its survival. The
stakeholder theory suggests that stakeholders have intrinsic value in and of themselves,
and the company therefore, has an obligation to uphold their rights and serve their interests
simply because they exist (Goodijk, 2003; Donaldson & Preston, 1995).
In 1984, Freeman introduced the stakeholder theory and mentioned that the core value of
the theory was social responsibility. In order for a company to reduce information
asymmetry, there needs to be equilibrium among stakeholders and CSR financial
reporting. Therefore, the stakeholder theory should be viable to companies and ease the
relationship among stakeholders (Bonson & Bednarova, 2015). Numerous theories have
been advanced why MNCs practise CSR but the most dominant paradigm is stakeholder
theory (Freundlieb & Teuteberg, 2013) which proposes that all organizations have various
86
groups of people or individuals that affect or are affected by the activities of the firm
(Sweeney & Coughlan, 2008). The primary reason for CSR/Sustainability reporting is to
provide stakeholders with the information they need to make decisions (Tschopp, 2011).
Nemetz (2013), in his environmental performance model, listed four main stakeholder
groups: the government; internal stakeholders; external stakeholders; and financial
stakeholders. Government policies, laws and regulations affect CSR/sustainability
reporting. Internal stakeholders include board members, executives, employees, and
various departments such as human resources, legal and accounting. External stakeholders
include unions, non-governmental organizations, professional organizations, customers,
and the general public. Financial stakeholders include banks, investors and insurers
(Nemetz, 2013). An MNC has both obligations and responsibilities towards the
stakeholders which it needs to discharge.
The theory simply states that the needs of the various stakeholders (suppliers, government,
creditors, employees, shareholders, etc) have to be satisfied by the managers. The
grouping of the stakeholders under six (6) main headings of shareholders, employees,
customers, government, community, environment, and other business agents include:
suppliers, trade unions, competitors and other business associates (Mullins 2002). The
theory was originally detailed by Freeman (1984). Other developments of the theory point
to Mitchell, Agle and Wood (1997), Phillips (2003) and Donaldson and Preston (1995).
The theory is divided into normative, instrumental and visually descriptive theories.
Normative perspective deals with the level of motivation of CSR in generating corporate
performance while the explanatory perspective deals with the emergence of CSR in
relation to corporate management. In other words, the infusion of stakeholders’ interest
into firm performance may be positively enhanced (Freeman 1984).
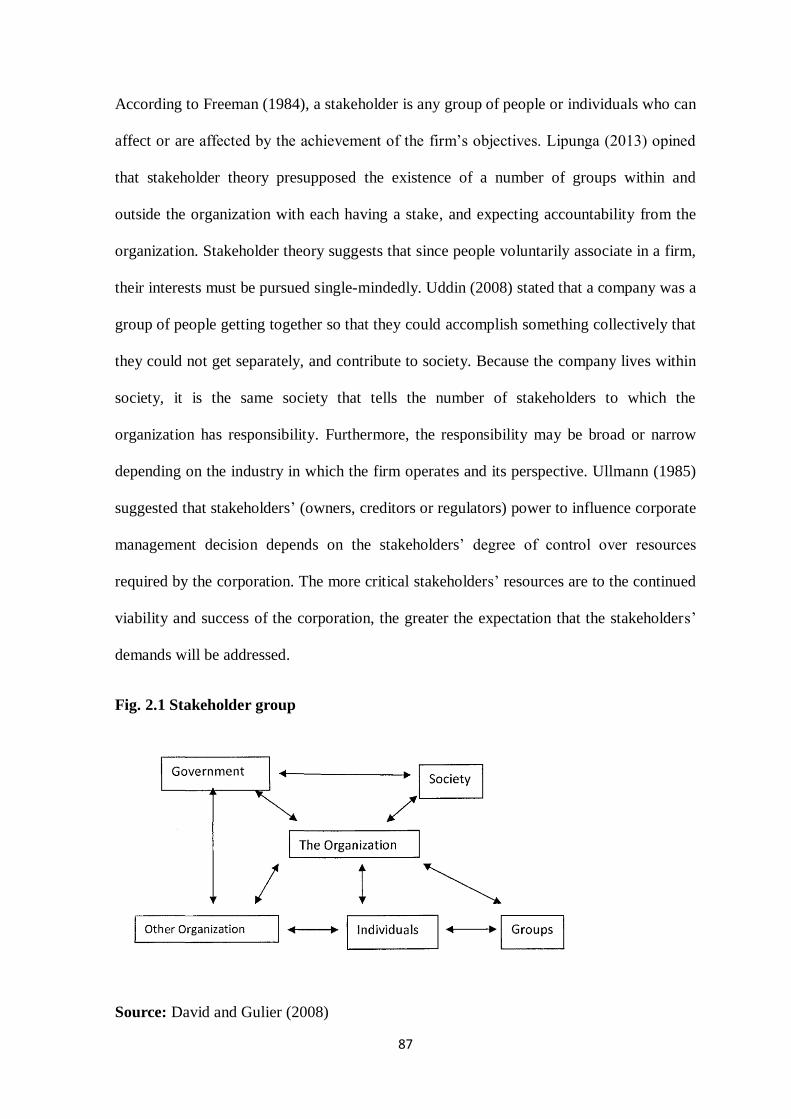
87
According to Freeman (1984), a stakeholder is any group of people or individuals who can
affect or are affected by the achievement of the firm’s objectives. Lipunga (2013) opined
that stakeholder theory presupposed the existence of a number of groups within and
outside the organization with each having a stake, and expecting accountability from the
organization. Stakeholder theory suggests that since people voluntarily associate in a firm,
their interests must be pursued single-mindedly. Uddin (2008) stated that a company was a
group of people getting together so that they could accomplish something collectively that
they could not get separately, and contribute to society. Because the company lives within
society, it is the same society that tells the number of stakeholders to which the
organization has responsibility. Furthermore, the responsibility may be broad or narrow
depending on the industry in which the firm operates and its perspective. Ullmann (1985)
suggested that stakeholders’ (owners, creditors or regulators) power to influence corporate
management decision depends on the stakeholders’ degree of control over resources
required by the corporation. The more critical stakeholders’ resources are to the continued
viability and success of the corporation, the greater the expectation that the stakeholders’
demands will be addressed.
Fig. 2.1 Stakeholder group
Source: David and Gulier (2008)

88
Clarkson (1995) divided stakeholder group into primary economic and secondary groups.
Primary stakeholder group are those people without whose continuous participation the
corporation cannot survive as a going concern. They include shareholders, employees,
creditors, customers, suppliers and the public (government and communities). The
secondary group, also known as the social group, include media, local and international
organization. Every stakeholder being important to an organization means that proper
understanding will naturally motivate any rational individual, group or organization to
intrinsically and willingly give to society. Management’s overall attainment of objectives
should no longer be viewed in terms of how much it has satisfied the need of the internal
members and perhaps the government; the local community must be taken into
consideration (Bessong & Tapong, 2012).
But Mele (2008) asserted that any attempt by the firm to bring fairness into stakeholder
representation would present some difficulty in corporate decision making apart from
portraying the firm as merely existing to service the interest of stakeholders.
The theories that are very important to this study were the shareholders theory and most
importantly, the stakeholder theory. According to Freeman (1984, 1994), shareholder
theory states that an organization’s commitment to operate in an economic and
environmentally sustainable manner while recognizing the interest of the stakeholders will
lead to a positive signifnicant result in its financial performance. On the other hand,
Carroll (1993) defined a stakeholder as any individual or a group of people who could
affect or was affected by the actions, decisions, policies, pratices, or goals of the
organization. Similarly, Freeman (1984) defined a stakeholder as any group of people or
individuals who could affect or were affected by the achievement of the firm’s objectives.
The stakeholder theory suggests that stakeholders have intrinsic value in themselves and in

89
the company; therefore, they have an obligation to uphold their rights and serve their
interests simply because they exist (Goodijk, 2003; Donaldson & Preston, 1995).
Stakeholder theory, which is the main theory on which this research was based, posits that
the organization exists primarily not only for itself and the owners but also for the benefit
of society at large. Firms that engage in CSR do so as a way of giving back to society.

90
CHAPTER THREE
METHODOLOGY
3.1 Introduction
Research methodology indicates the specification of the procedure employed by a
researcher in putting together the raw facts and data for processing and the estimation
techniques to be utilized. This chapter contains information on the population, sample and
sampling procedures, method of data collection, sources of data, research design, method
of data analysis, model specification, and operationalization of variables. In most cases,
the success of a research study, to a large extent, depends on the method applied in the
collection of research materials (Akindele, 1997).
3.2 Research Design
Nachmias and Nachmias (2009) posited that research design was the logical model of
proof that allowed the researcher to draw inferences concerning an investigation.
Designing a study helps the researcher to plan and implement it in a way that helps the
researcher obtain intended results, thus increasing the chances of obtaining information
that could be associated with the real situation (Burns & Grove, 2001). Research design
means the structuring of investigation aimed at identifying variables and their relationships
to other variables. It is used for the purpose of containing data to enable the researcher to
test hypotheses through the various stages of the research (Asika, 2008). It does not mean
the specified method for collecting data, but the more fundamental question of how the
study’s subjects will be brought into the scope of the research and how they will be
employed within the research setting to yield the required data (Abdellah & Levine, 1979).
91
It can therefore, be seen as a framework or plan that is used as a guide to collect and
analyse the data for a study (Baridam, 1999).
The ex-post facto research design was used in this research. Kerlinger (1970) noted that ex
post facto research was one in which the independent variable or variables had already
occurred and in which the researcher started with the observation of a dependent variable
or variables. Ex-post facto design is a quasi-experimental study which involves collecting
and analysing data from some variables which are already in place without manipulating
any of them in order to find out how some of them influence or are related to other
variables (Nwankwo, 2006; Simon & Goes, 2013). It is a method in which groups with
qualities that already exist are compared to some dependent variables (Cohen, Manion &
Morison, 2000).
Ex-post facto study or after-the-fact research is a category of research design in which the
investigation starts after the fact has occurred without interference from the researcher
(Salkind, 2010). The ex-post facto research design was chosen for the study because of its
special characteristics which are that the independent variable(s) is(are) not manipulated
and may have already occurred. Again, it is less costly and time-consuming to conduct.
3.3 Philosophical Underpinning of the Study
The justification for a research philosophy must be made by taking into consideration the
nature of the research questions and objectives. The choice of the particular research
philosophy and the approach or underpinning is crucial and can help the researcher to
clarify various research designs, recognize which design is suitable to the research, and
resrach designs that may be outside the researcher’s experience. Research philosophy
relates to the development of knowledge, and it is epistemological in nature. According to
92
Saunders, Lewis and Thornbill (2009), there are six philosophical perspectives which are
positivism, realism, pragmatism, interpretivism, objectivism and constructionism.
This research is premised on the positivist philosophy whih entails working with an
observable social reality in which the researcher is independent of and neither affects nor
is affected by the subject of the research. The study thus involved a structured
methodology employed to facilitate replication with emphasis on quantifiable observatiosn
that lend themselves to statistical analyses. Research approaches can also be deductive or
inductive (Baridam, 1999). Deductive owes more to positivism and inductive to
interpretivism. This study adopted a deductive strategy where existing theories provide the
basis of explanation which gives room for the prediction and control of social
phenomenon. The hypotheses formulated and tested assisted the researcher to make
meaningful deductions in this respect.
3.4 Study Population
A population is the aggregate of all cases that conform to the same designated set of
specifications (Nachmias & Nachmias, 2009). According to Adegbiji (2015), population
of study is the totality of people in a particular area. The population of a research has been
defined by Nwankwo (2006) as a universe of some group of people or objects who or
which an investigator is interested in. It is used to denote the total number of people in any
particular geographical area to whom the results of the study will be generalized.
The population of this study was made up of all the non-financial companies listed on the
Nigerian Stock Exchange in the period covered in the study, from 1997 to 2018. As at 21st
September, 2019 the number of listed non-financial companies on the Nigerian Stock
Exchange was 109, it was made up as follows:
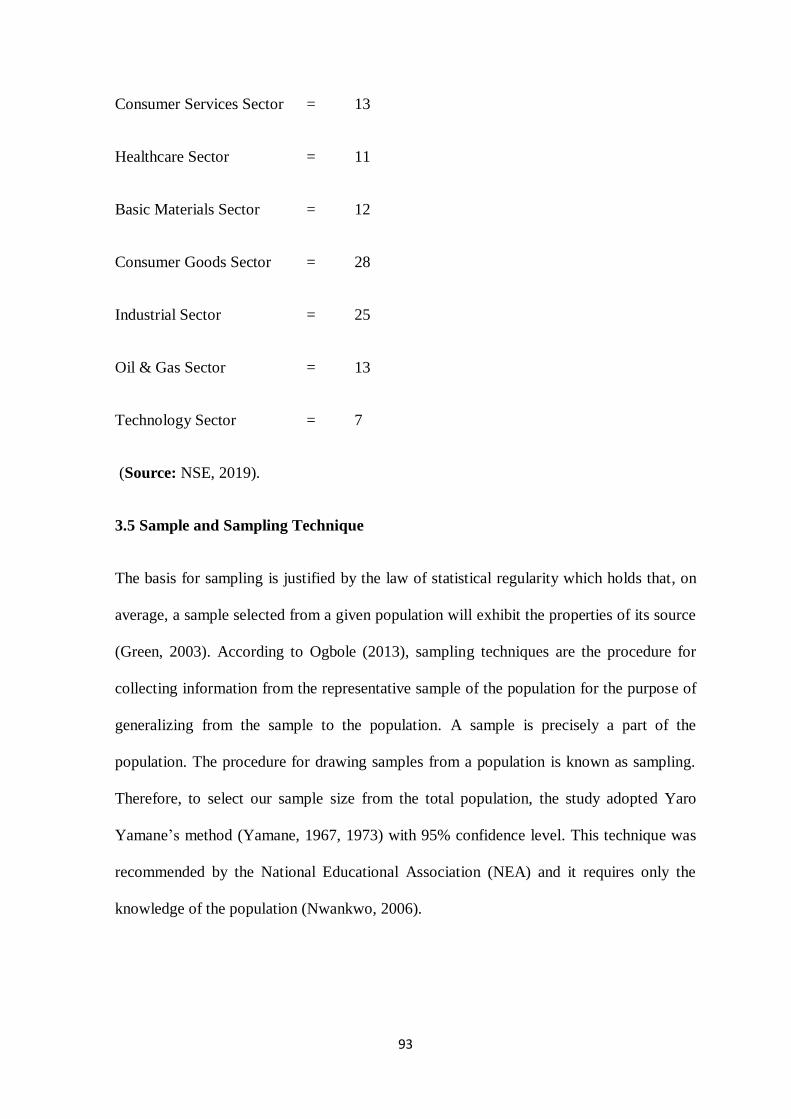
93
Consumer Services Sector = 13
Healthcare Sector = 11
Basic Materials Sector = 12
Consumer Goods Sector = 28
Industrial Sector = 25
Oil & Gas Sector = 13
Technology Sector = 7
(Source: NSE, 2019).
3.5 Sample and Sampling Technique
The basis for sampling is justified by the law of statistical regularity which holds that, on
average, a sample selected from a given population will exhibit the properties of its source
(Green, 2003). According to Ogbole (2013), sampling techniques are the procedure for
collecting information from the representative sample of the population for the purpose of
generalizing from the sample to the population. A sample is precisely a part of the
population. The procedure for drawing samples from a population is known as sampling.
Therefore, to select our sample size from the total population, the study adopted Yaro
Yamane’s method (Yamane, 1967, 1973) with 95% confidence level. This technique was
recommended by the National Educational Association (NEA) and it requires only the
knowledge of the population (Nwankwo, 2006).
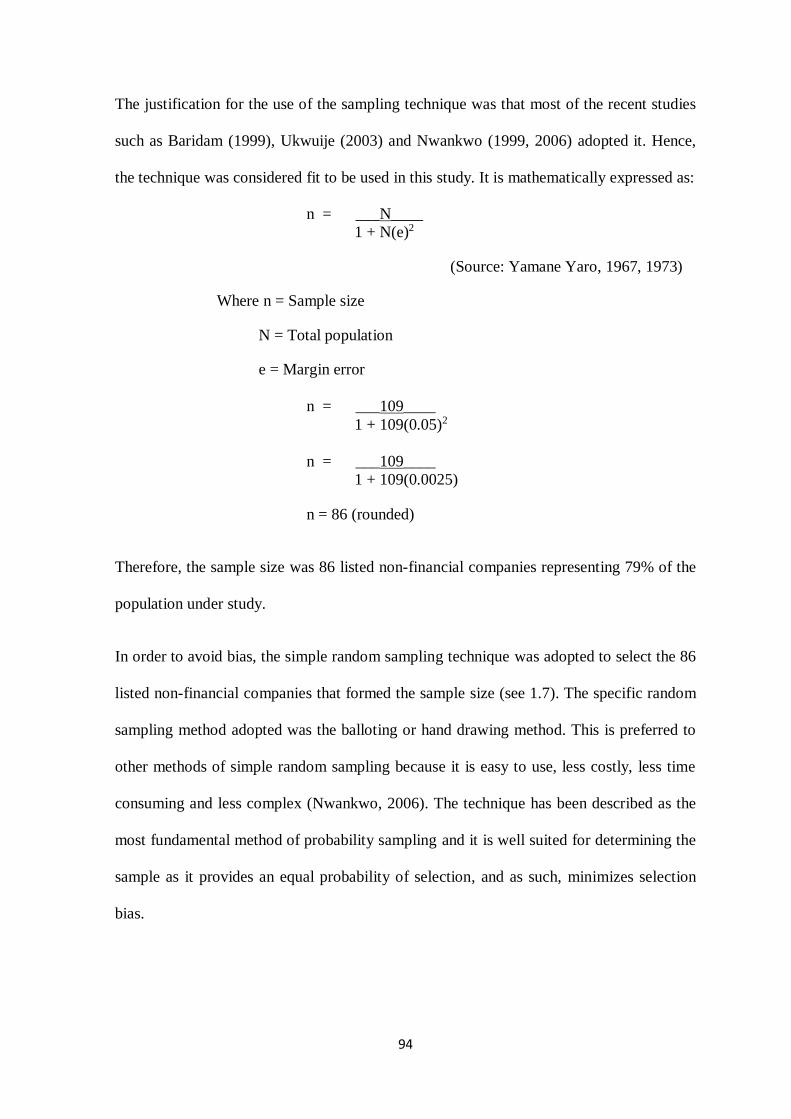
94
The justification for the use of the sampling technique was that most of the recent studies
such as Baridam (1999), Ukwuije (2003) and Nwankwo (1999, 2006) adopted it. Hence,
the technique was considered fit to be used in this study. It is mathematically expressed as:
n = ___N____
1 + N(e)2
(Source: Yamane Yaro, 1967, 1973)
Where n = Sample size
N = Total population
e = Margin error
n = ___109____
1 + 109(0.05)2
n = ___109____
1 + 109(0.0025)
n = 86 (rounded)
Therefore, the sample size was 86 listed non-financial companies representing 79% of the
population under study.
In order to avoid bias, the simple random sampling technique was adopted to select the 86
listed non-financial companies that formed the sample size (see 1.7). The specific random
sampling method adopted was the balloting or hand drawing method. This is preferred to
other methods of simple random sampling because it is easy to use, less costly, less time
consuming and less complex (Nwankwo, 2006). The technique has been described as the
most fundamental method of probability sampling and it is well suited for determining the
sample as it provides an equal probability of selection, and as such, minimizes selection
bias.

95
3.6 Sources of Data
There are basically two sources of data, primary and secondary sources. The primary
data sources include the questionnaires, personal interviews, etc, while the secondary
data are sourced from literatures, textbooks, journals, publications, etc (Baridam, 1999).
Secondary data were used for the study. The justification for the use of this method in this
study was supported by recent studies by Jayeola, Agbatogun and Akinrinlola (2017),
Ndubuisi and Ezechukwu (2017), Uwuigbe, Uwuigbe and Bernard (2015), Omokhudu and
Ibadin (2015) and Olugbenga and Atanda (2014). The data for the sampled listed
companies were sourced from the Nigerian Stock Exchange Fact Books and the
Companies’ Annual Financial Reports and Footnotes for the periods covered in the study.
The data were personally collected by the researcher and his assistants.
It should be noted that although there are a variety of media or documents for CSR
disclosure which include advertisements or articles published detailing a company’s
activities, booklets or leaflets and Websites, annual reports are broadly viewed as the main
official and legal documents which are produced on a regular basis and act as an important
piece for the presentation of a firm’s communication within political, social and economic
systems. They are the most publicized by companies. Therefore, this study was restricted
to CSR measurements in annual reports of the selected quoted companies.
3.7 Data Analysis technique
The study made use of Panel Least Square (PLS) regression analysis as the data analysis
method. Gujarati (2003) suggested four critical assumptions that must be met before
utilizing the regression analysis. Firstly was the assumption of normality which required
that samples be drawn from normally distributed populations and they be examined using
the Jacque-bera statistics. Second was the assumption of linearity of the model parameters.
96
A numerical test of linearity (White, 1980) should also be conducted. Thirdly was the
assumption of homoscedasticity which required the variance or standard deviation of the
dependent variables within the group to be equal, and fourthly was the assumption of
independence of error terms. Under this assumption, the error terms are independent from
one another and therefore, no serial correlation exists. To test the homoscedasticity
assumption, the auto regressive conditional heteroskedasticity (ARCH) test was utilized.
Finally, to test for multicollinearity, this study applied correlation coefficient and variance
inflation factors (VIF) tests. Given the above discussion, the various tests were conducted
to test the data against the regression assumptions. Thereafter, preliminary analysis was
conducted and then the regression estimates were computed. Indicators of the models
statistical fit such as the R2 were examined alongside the indicators of parameter
significance such as the t-test and the probability values (White, 1980).
3.8 Model Specification
In the definition of what constitutes corporate social responsibility disclosure, the study
built on the findings by Owolabi (2010). In a comprehensive analysis of corporate social
responsibility disclosure data for selected quoted companies in Nigeria sampled from 2006
to 2010, Owolabi (2010) identified the following CSR disclosures in financial statements
which were coded and defined below. However, the model was re-specified to examine
the effect of selected variants of CSR activities often reported in financial statements on
specific corporate performance indices.
Adopting Owolabi’s model, then;
FPit = f(CSRD) ---------------------------------------------- (1)
We decompose CSRD into core dimensions as specified in equation 2 below;
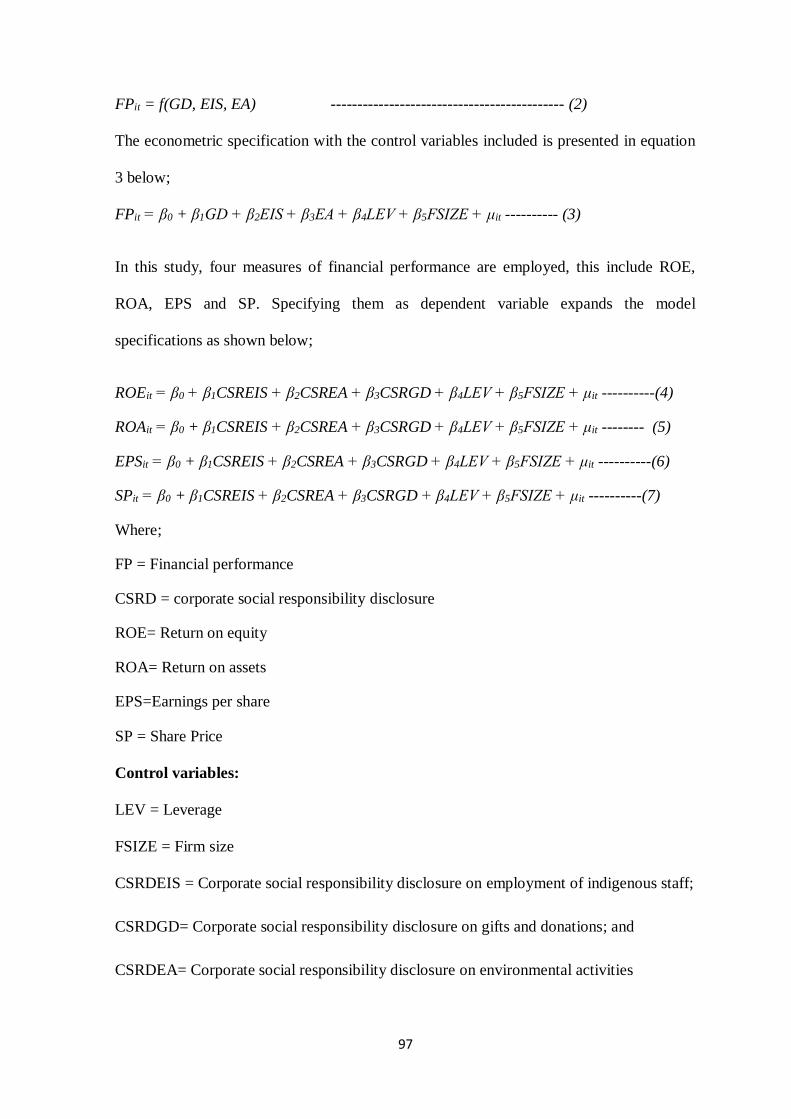
97
FPit = f(GD, EIS, EA) -------------------------------------------- (2)
The econometric specification with the control variables included is presented in equation
3 below;
FPit = β0 + β1GD + β2EIS + β3EA + β4LEV + β5FSIZE + μit ---------- (3)
In this study, four measures of financial performance are employed, this include ROE,
ROA, EPS and SP. Specifying them as dependent variable expands the model
specifications as shown below;
ROEit = β0 + β1CSREIS + β2CSREA + β3CSRGD + β4LEV + β5FSIZE + μit ----------(4)
ROAit = β0 + β1CSREIS + β2CSREA + β3CSRGD + β4LEV + β5FSIZE + μit -------- (5)
EPSit = β0 + β1CSREIS + β2CSREA + β3CSRGD + β4LEV + β5FSIZE + μit ----------(6)
SPit = β0 + β1CSREIS + β2CSREA + β3CSRGD + β4LEV + β5FSIZE + μit ----------(7)
Where;
FP = Financial performance
CSRD = corporate social responsibility disclosure
ROE= Return on equity
ROA= Return on assets
EPS=Earnings per share
SP = Share Price
Control variables:
LEV = Leverage
FSIZE = Firm size
CSRDEIS = Corporate social responsibility disclosure on employment of indigenous staff;
CSRDGD= Corporate social responsibility disclosure on gifts and donations; and
CSRDEA= Corporate social responsibility disclosure on environmental activities

98
3.9 Operationalization of Variables
These are the operational definitions (tabulated) of the variables used in the study, i.e. the
dependent and independent variables.
Table 3.1: Operationalization of Variables (financial performance measures)
Dependent variable
Variable Measurement Source
Return on Equity (ROE) ROE is equal to a fiscal year’s net
income (after preferred stock
dividends but before common stock dividends) divided by total equity
(excluding preferred shares),
expressed as a percentage.
Waddock and Grave (1997)
Preston and O’Bannon (1997);
Bowmwan and Haire (1975); Bregdon and Marlin (1972);
Perket and Eilbirt (1975); Spicer
(1978); Preston (1978); Cowen et
al. (1987); Reily and Brown (2012); Traub (2001); Chienjien
(2010); Uadiale (2010.
Return on Assets (ROA) ROA is equal to a fiscal year’s net
income (after preferred stock dividends but before common stock
dividends) divided by total assets
McWilliams and Siegel (2001)
Lucey, Barber and Hillman (2001); Aupperle, Carroll and
Hatfield (1985); Belkaoui and
Karpik (1989), Waddock and Grave (1997) Preston and
O’Bannon (1997); Hongren,
Harrison and Oliver (2009); Alexandri and Anjani (2014);
Kyereboah-Coleman (2007.
Earnings per Share (EPS) Earnings after interest and taxes
divided by total ordinary shares. Also known as price earnings ratio, it is
measured by the stock price.
Tendelilin (2010); Azhar, Osman
and Prinduri (2009); Chisholm (2009); Gottwald (2011)
Share Price (SP) Share price or stock price is measured
by price earnings ratio
Azhar, Osman And Parinduri
(2009); Chisholm (2009); Gottwald (2011); Capozzi (2010);
Mauboussin (2012); Gosh (2010);
Mulford & Comiskey (2011)
Source: Researcher’s compilation, 2019
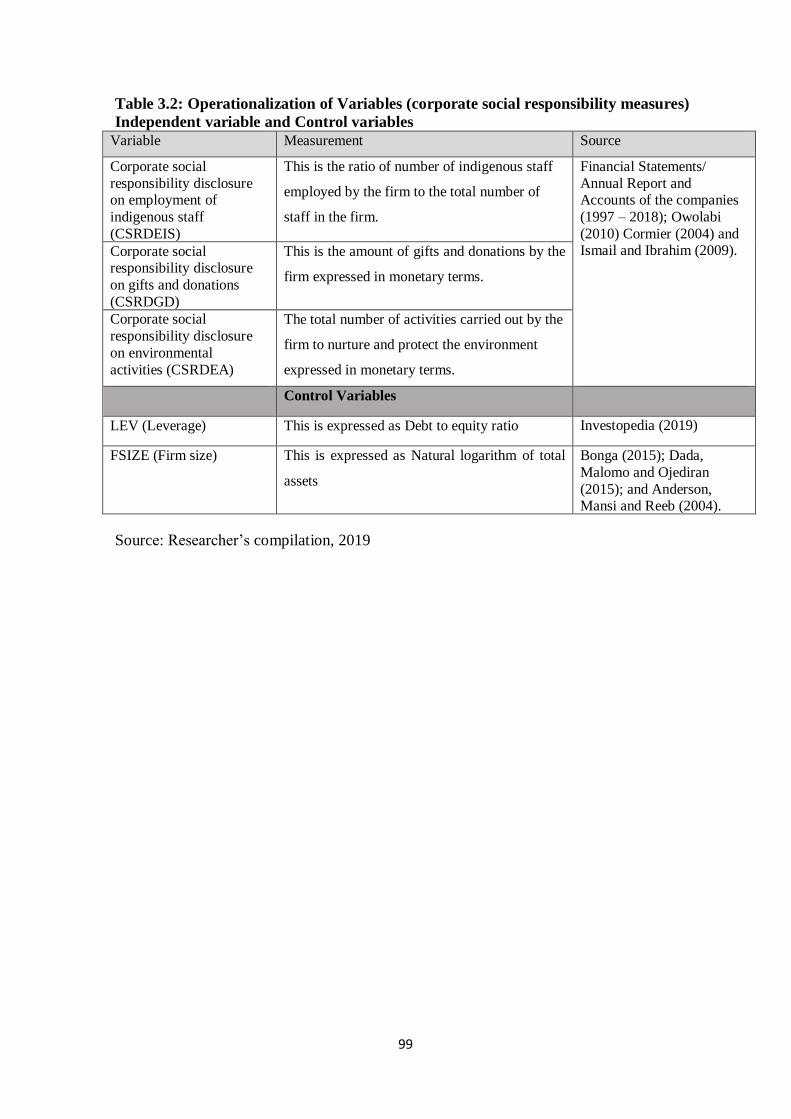
99
Table 3.2: Operationalization of Variables (corporate social responsibility measures)
Independent variable and Control variables
Variable Measurement Source
Corporate social
responsibility disclosure on employment of
indigenous staff
(CSRDEIS)
This is the ratio of number of indigenous staff
employed by the firm to the total number of
staff in the firm.
Financial Statements/
Annual Report and Accounts of the companies
(1997 – 2018); Owolabi
(2010) Cormier (2004) and Ismail and Ibrahim (2009). Corporate social
responsibility disclosure
on gifts and donations
(CSRDGD)
This is the amount of gifts and donations by the
firm expressed in monetary terms.
Corporate social
responsibility disclosure
on environmental
activities (CSRDEA)
The total number of activities carried out by the
firm to nurture and protect the environment
expressed in monetary terms.
Control Variables
LEV (Leverage) This is expressed as Debt to equity ratio Investopedia (2019)
FSIZE (Firm size) This is expressed as Natural logarithm of total
assets
Bonga (2015); Dada,
Malomo and Ojediran
(2015); and Anderson, Mansi and Reeb (2004).
Source: Researcher’s compilation, 2019

100
CHAPTER FOUR
PRESENTATION AND ANALYSIS OF DATA
4.1. Introduction
This chapter contains the presentation, analysis and interpretation of the data
collected for this research study. Consequently, it entails the application of both
mathematical and statistical techniques to provide the basis for the testing of the research
hypotheses. Hence, it is a vital part of any research study, since it forms the basis for
recommendation and conclusions at the end of the research. The models specified in the
previous chapter are examined empirically. The preliminary analysis of the data is first
conducted (descriptive and correlation analysis). Thereafter, the regression analysis is
conducted. The results are presented and interpreted below. The study data is on Appendix
I.
4.2 Presentation and Analysis of Data
This section examined the presentation and analysis of the estimations conducted
using the various statistical methods. The preliminary analysis was first examined and
then, we discussed the descriptive statistics results and the Pearson product moment
correlation results while the variance inflation factor test for multicollinearity was also
examined. After that, the test for endogeneity regression was conducted. The results were
presented and analysed below;

101
4.2.1. Preliminary Analysis
Table 4.1: Descriptive Statistics Mean Max Min Std. Dev. Jarque-Bera Prob
SP 34.48802 1555.99 0.5 115.0286 183895.3 0.000
CSRD-GD 0.911765 1 0 0.283869 1914.201 0.000
CSRD-EIS 0.985294 1 0 0.120471 107889 0.000
CSRD-EA 0.181373 1 0 0.385642 292.7556 0.000
LEV 0.586373 2.03 0 0.236074 492.81 0.000
FSIZE 7.059722 9.22 5.09 0.781306 7.541791 0.023
ROE 0.239651 2.5496 0.04 0.283278 2265.714 0.000
EPS 0.61732 2.01 0.03 0.226255 442.958 0.000
ROA 0.493801 2.966 0.006 0.302815 1856.99 0.000
Source: Researcher’s compilation (2019) using Eviews 10.0.
Table 4.1 showed the descriptive statistics for the variables and as observed, the mean for
the share price was 34.488, with a standard deviation of 115.02 which was high and
suggested the presence of volatility in the share price behaviour of the distribution of
companies. The price of the shares ranged from the minimum of 0.5 to a maximum of
1555.99. The maximum and minimum values stood at 2.549 and 0 respectively. The mean
for CSRD-GD, had a value of 0.911 which suggested that about 91% of the firms in the
distribution engaged in community development, gifts and donation activities with a
standard deviation of 0.2838. In terms of CSRD-EIS, the mean was 0.985 and it implied
that about 99% of the listed companies engaged in disclosures concerning activities related
to employment of indigenous staff. In relation to CSRD-EA, the mean for the distribution
was 0.1813 which implied that a very small number of firms, about 18.13% in the
distribution, disclosed on environmental activities. The mean for ROE was 0.2396 with a
standard deviation of 0.282. EPS had a mean value of 0.617 with a standard deviation of
0.226. The mean for firm size (FSIZE) as measured using the log of total assets was
7.057, with a standard deviation of 0.781. The average value for leverage (LEV) was
0.586, with a standard deviation of 0.236.
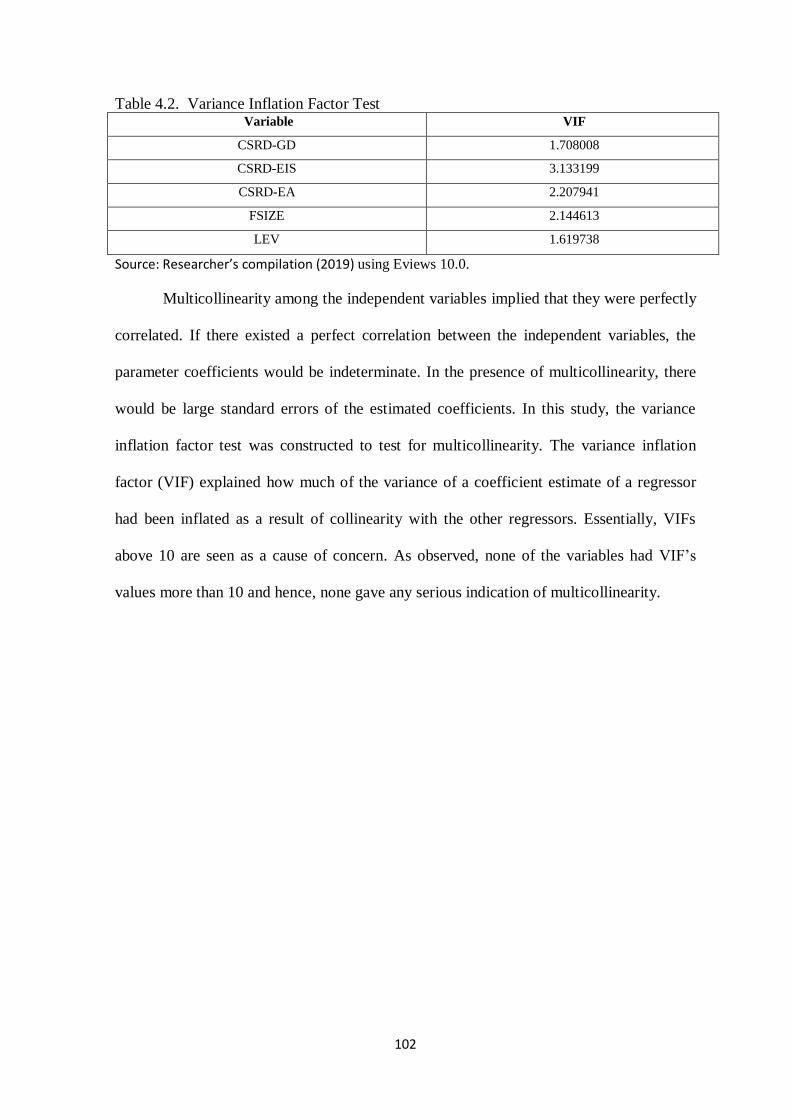
102
Table 4.2. Variance Inflation Factor Test Variable VIF
CSRD-GD 1.708008
CSRD-EIS 3.133199
CSRD-EA 2.207941
FSIZE 2.144613
LEV 1.619738
Source: Researcher’s compilation (2019) using Eviews 10.0.
Multicollinearity among the independent variables implied that they were perfectly
correlated. If there existed a perfect correlation between the independent variables, the
parameter coefficients would be indeterminate. In the presence of multicollinearity, there
would be large standard errors of the estimated coefficients. In this study, the variance
inflation factor test was constructed to test for multicollinearity. The variance inflation
factor (VIF) explained how much of the variance of a coefficient estimate of a regressor
had been inflated as a result of collinearity with the other regressors. Essentially, VIFs
above 10 are seen as a cause of concern. As observed, none of the variables had VIF’s
values more than 10 and hence, none gave any serious indication of multicollinearity.
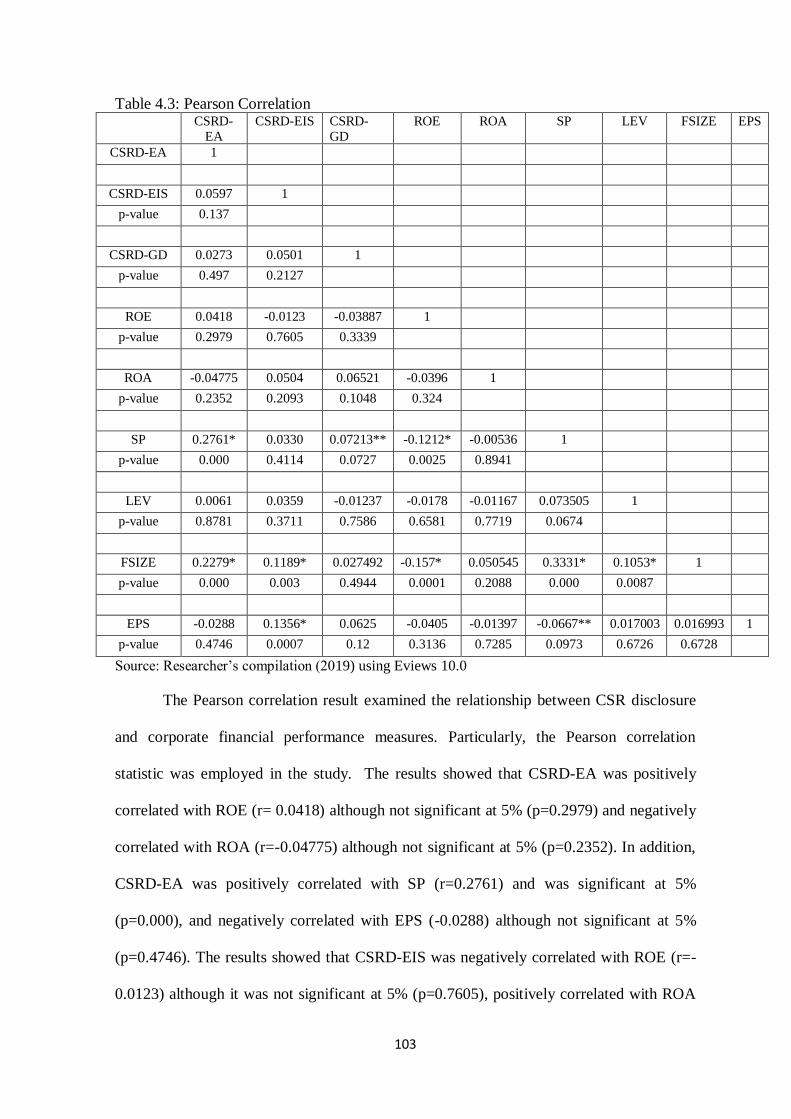
103
Table 4.3: Pearson Correlation CSRD-
EA
CSRD-EIS CSRD-
GD
ROE ROA SP LEV FSIZE EPS
CSRD-EA 1
CSRD-EIS 0.0597 1
p-value 0.137
CSRD-GD 0.0273 0.0501 1
p-value 0.497 0.2127
ROE 0.0418 -0.0123 -0.03887 1
p-value 0.2979 0.7605 0.3339
ROA -0.04775 0.0504 0.06521 -0.0396 1
p-value 0.2352 0.2093 0.1048 0.324
SP 0.2761* 0.0330 0.07213** -0.1212* -0.00536 1
p-value 0.000 0.4114 0.0727 0.0025 0.8941
LEV 0.0061 0.0359 -0.01237 -0.0178 -0.01167 0.073505 1
p-value 0.8781 0.3711 0.7586 0.6581 0.7719 0.0674
FSIZE 0.2279* 0.1189* 0.027492 -0.157* 0.050545 0.3331* 0.1053* 1
p-value 0.000 0.003 0.4944 0.0001 0.2088 0.000 0.0087
EPS -0.0288 0.1356* 0.0625 -0.0405 -0.01397 -0.0667** 0.017003 0.016993 1
p-value 0.4746 0.0007 0.12 0.3136 0.7285 0.0973 0.6726 0.6728
Source: Researcher’s compilation (2019) using Eviews 10.0
The Pearson correlation result examined the relationship between CSR disclosure
and corporate financial performance measures. Particularly, the Pearson correlation
statistic was employed in the study. The results showed that CSRD-EA was positively
correlated with ROE (r= 0.0418) although not significant at 5% (p=0.2979) and negatively
correlated with ROA (r=-0.04775) although not significant at 5% (p=0.2352). In addition,
CSRD-EA was positively correlated with SP (r=0.2761) and was significant at 5%
(p=0.000), and negatively correlated with EPS (-0.0288) although not significant at 5%
(p=0.4746). The results showed that CSRD-EIS was negatively correlated with ROE (r=-
0.0123) although it was not significant at 5% (p=0.7605), positively correlated with ROA
104
(r=0.0504) although was not significant at 5% (p=0.2093). Furthermore, CSRD-EIS
positively correlated with SP (r=0.0330) but was insignificant at 5% (p=0.4114), and
positively correlated with EPS (r=0.11356) and was significant at 5% (p=0.000). The
correlation results showed that CSRD-GD negatively correlated with ROE (r= -0.03887)
although was not significant at 5% (p=0.3339), and positively correlated with ROA (r=
0.0652) although was not significant at 5% (p=0.12). In addition, CSRD-GD positively
correlated with SP (r=0.07213) and was significant at 10% (p=0.0727), and positively
correlated with EPS (0.0625) and was not significant at 5% (p=0.4746). The correlation
analysis provided an insight into the direction and degree of the relationship between the
variables. However, it was limited in its inferential capacity as it did necessarily imply
functional dependence between the variables. Regression estimations were more suited for
this purpose.
4.2.2. Test for Endogeneity in CSRD-FP Relationship
The testing for endogeneity between CSRD and corporate financial performance
was premised on the findings from extant literatures which revealed two shades of opinion
on corporate social responsibility and financial performance studies. First is the impact of
corporate social responsibility on financial performance (Ismail & Adegbemi, 2013; Rapti
& Medda, 2012; Tilakasiri, 2012) and the impact of financial performance on corporate
social responsibility (Hirigoyen & Poulain-Rehm, 2015; Ilaboya & Omoye, 2013; Makni,
Francoeur & Bellavance, 2009). These two shades of studies have thrown up arguments in
recent times on the presence of endogeneity arising from potential reverse-causality
between CSRD and financial performance estimation. In the presence of endogeneity, the
parameter estimates tend to be biased due to the relationship in the residuals. Therefore,
aside depending on aprori facts on the issue, the study proceeded to test for the presence of
endogeneity.
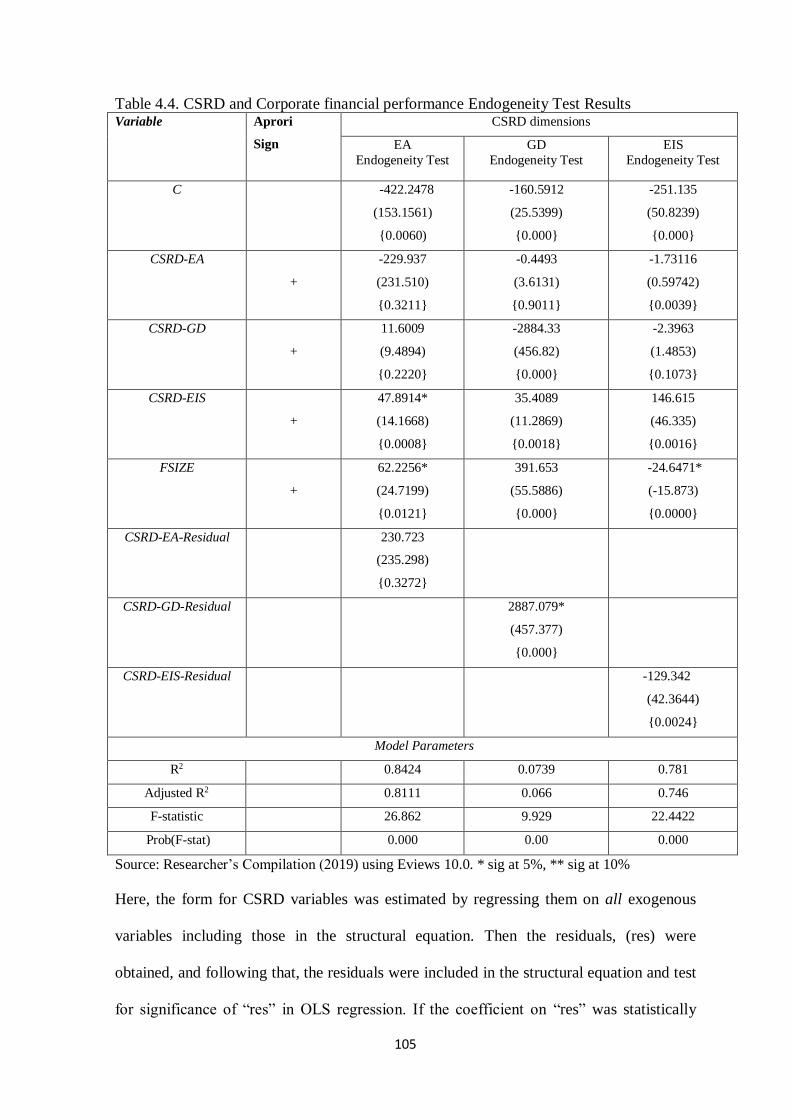
105
Table 4.4. CSRD and Corporate financial performance Endogeneity Test Results Variable Aprori
Sign
CSRD dimensions
EA
Endogeneity Test
GD
Endogeneity Test
EIS
Endogeneity Test
C
-422.2478
(153.1561)
{0.0060)
-160.5912
(25.5399)
{0.000}
-251.135
(50.8239)
{0.000}
CSRD-EA
+
-229.937
(231.510)
{0.3211}
-0.4493
(3.6131)
{0.9011}
-1.73116
(0.59742)
{0.0039}
CSRD-GD
+
11.6009
(9.4894)
{0.2220}
-2884.33
(456.82)
{0.000}
-2.3963
(1.4853)
{0.1073}
CSRD-EIS
+
47.8914*
(14.1668)
{0.0008}
35.4089
(11.2869)
{0.0018}
146.615
(46.335)
{0.0016}
FSIZE
+
62.2256*
(24.7199)
{0.0121}
391.653
(55.5886)
{0.000}
-24.6471*
(-15.873)
{0.0000}
CSRD-EA-Residual
230.723
(235.298)
{0.3272}
CSRD-GD-Residual
2887.079*
(457.377)
{0.000}
CSRD-EIS-Residual
-129.342
(42.3644)
{0.0024}
Model Parameters
R2 0.8424 0.0739 0.781
Adjusted R2 0.8111 0.066 0.746
F-statistic 26.862 9.929 22.4422
Prob(F-stat) 0.000 0.00 0.000
Source: Researcher’s Compilation (2019) using Eviews 10.0. * sig at 5%, ** sig at 10%
Here, the form for CSRD variables was estimated by regressing them on all exogenous
variables including those in the structural equation. Then the residuals, (res) were
obtained, and following that, the residuals were included in the structural equation and test
for significance of “res” in OLS regression. If the coefficient on “res” was statistically

106
different from zero, we concluded that CSRD was indeed endogenous. From the results in
table 4.4, CSRD-EA residual was not significant at 5% (p=0.3272), CSRD-GD-residual
was significant (p=0.000) and CSRD-EIS-residual was also significant at 5% (p=0.0024).
Hence, the study concluded that from the CSRD structure components, CSRD-GD and
CSRD-EIS were endogenous with financial performance. Consequently, the study, aside
from estimating the panel regression, also estimated the more robust Arrelano and Bond
GMM regression to address the presence of endogeneity. The results were presented
below;
4.2.3. Regression Analysis
The regression analysis was conducted to identify the relationship between the
dependent and independent variables, provide the relevant statistics for assessing the
performance of the specified model in the previous chapter, and test the hypotheses raised
in the study. The panel regression estimation was employed in this study and the fixed and
random effects estimates were presented and based on the hausman test, while the suitable
estimates were selected and utilized in the inferential analysis. Though panel effect models
mainly control for unobserved heterogeneity, they do not account for the endogeneity
problem (Cameron & Trivedi 2005). Therefore, in order to then address the endogeneity as
shown in table 4.4, the Arellano and Bond (1991) GMM estimator which controls for
potential endogeneity problem was also employed and thus provided a more robust
estimation parameter. The results and analysis were presented below:
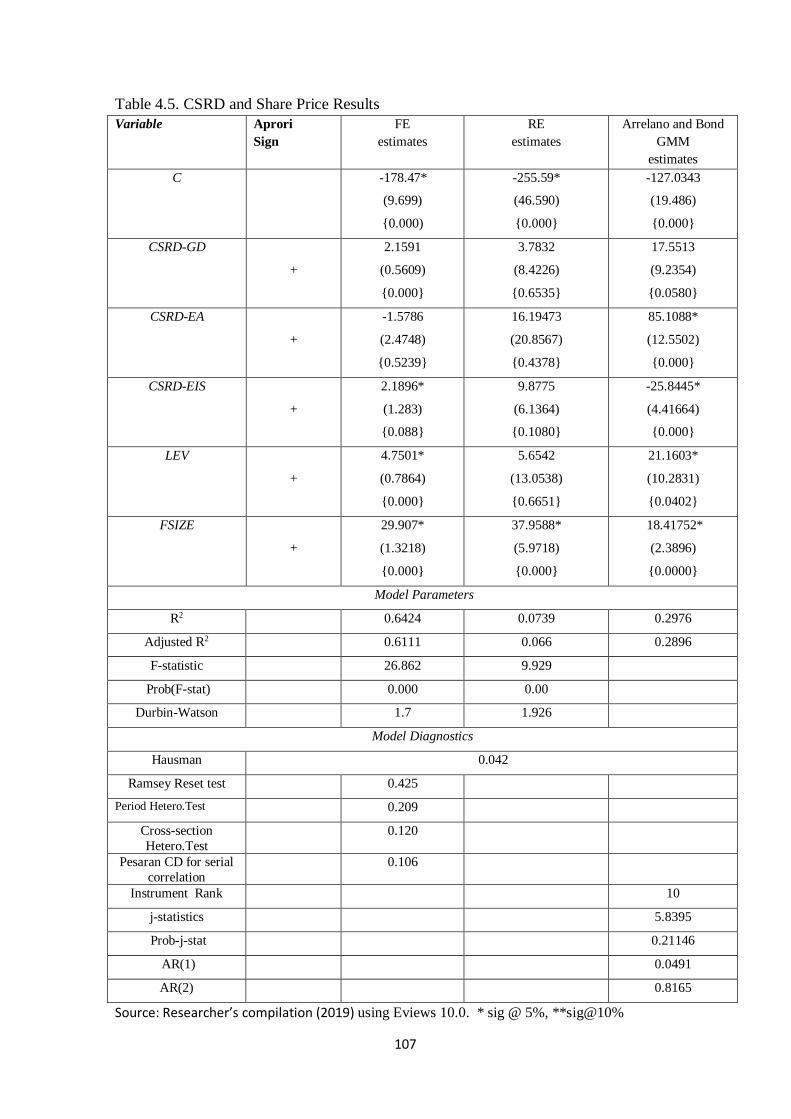
107
Table 4.5. CSRD and Share Price Results
Variable Aprori
Sign
FE
estimates
RE
estimates
Arrelano and Bond
GMM
estimates
C
-178.47*
(9.699)
{0.000)
-255.59*
(46.590)
{0.000}
-127.0343
(19.486)
{0.000}
CSRD-GD
+
2.1591
(0.5609)
{0.000}
3.7832
(8.4226)
{0.6535}
17.5513
(9.2354)
{0.0580}
CSRD-EA
+
-1.5786
(2.4748)
{0.5239}
16.19473
(20.8567)
{0.4378}
85.1088*
(12.5502)
{0.000}
CSRD-EIS
+
2.1896*
(1.283)
{0.088}
9.8775
(6.1364)
{0.1080}
-25.8445*
(4.41664)
{0.000}
LEV
+
4.7501*
(0.7864)
{0.000}
5.6542
(13.0538)
{0.6651}
21.1603*
(10.2831)
{0.0402}
FSIZE
+
29.907*
(1.3218)
{0.000}
37.9588*
(5.9718)
{0.000}
18.41752*
(2.3896)
{0.0000}
Model Parameters
R2 0.6424 0.0739 0.2976
Adjusted R2 0.6111 0.066 0.2896
F-statistic 26.862 9.929
Prob(F-stat) 0.000 0.00
Durbin-Watson 1.7 1.926
Model Diagnostics
Hausman 0.042
Ramsey Reset test 0.425
Period Hetero.Test 0.209
Cross-section
Hetero.Test
0.120
Pesaran CD for serial
correlation
0.106
Instrument Rank
10
j-statistics
5.8395
Prob-j-stat
0.21146
AR(1)
0.0491
AR(2)
0.8165
Source: Researcher’s compilation (2019) using Eviews 10.0. * sig @ 5%, **sig@10%
108
Table 4.5 showed the regression results which examined the impact of CSR
disclosures on SP. The Hausman test statistic p-value = 0.042 indicated that the FE was
the preferred model to the random effects and hence, the FE estimation results were
reported for the analysis in the study. Furthermore, the study attempted to model a
dynamic relationship between share price and CSR disclosures. The white adjusted
standard errors were employed to control for potential heteroskedasticity in the estimation
and hence, the estimation results were free from heteroskedasticity. Both panel period
heteroskedasticity [p=0.209] and cross-sectional heteroskedasticity [p=0.120] were
examined and the estimations were found to be free from such. The Peseran cross-
dependence test [p=0.106] was employed to confirm the threat of the serial correlation in
the errors and the statistic revealed the absence of cross-section dependence in the
residuals. The FE estimates showed that R2 was 0.6424 with a degree of freedom adjusted
the R2 of 61.1%. The F-stat was 26.862 (p-value = 0.00) significant at 5% and suggested
that the hypothesis of a significant linear relationship between the dependent and
independent variables could not be rejected. It was also indicative of the joint statistical
significance of the model.
The analysis of coefficients revealed CSRD-GD had a positive (2.1591) effect on
SP and was statistically significant at 5% (p=0.000). CSRD-EA impact on SP was not
significant at 5% although with a negative (-1.5786) coefficient. CSRD-EIS had a positive
(2.1896) impact on SP and was statistically significant (p=0.088) at 10%. Looking at the
control variables, FSIZE had a positive beta (29.907) and a statistically significant
(p=0.000). LEV also showed a positive coefficient (4.7501) and was significant at 5%. .
The Arrelano and Bond estimation results revealed that CSRD-GD had a positive
(17.5513) significant effect (p=0.058) on SP at 10%, CSRD-EIS had a negative impact (-
25.8445) on SP which was significant (p=0.000) at 5% and CSRD-EA had a positive beta
109
(85.1088) and significant (p=0.000) at 5%. One point to be emphasised for the GMM
estimation results was the J-stat test of over-identifying restrictions and the Arellano-Bond
test for autocorrelation error. The J-stat tests yielded all p-values above 0.10, which meant
that a null hypothesis could not be rejected. Hence, over identification restrictions were
valid. The AR(1) tests indicated that the residuals in first differences correlated as
expected, while the AR(2) tests gave p-values above 0.10, which meant that a null
hypothesis of no second-order serial correlation could not be rejected. Therefore, all
results of the GMM model were valid. The Ramsey Reset Test for model specification
confirmed the absence of misspecification errors [p=0.425].
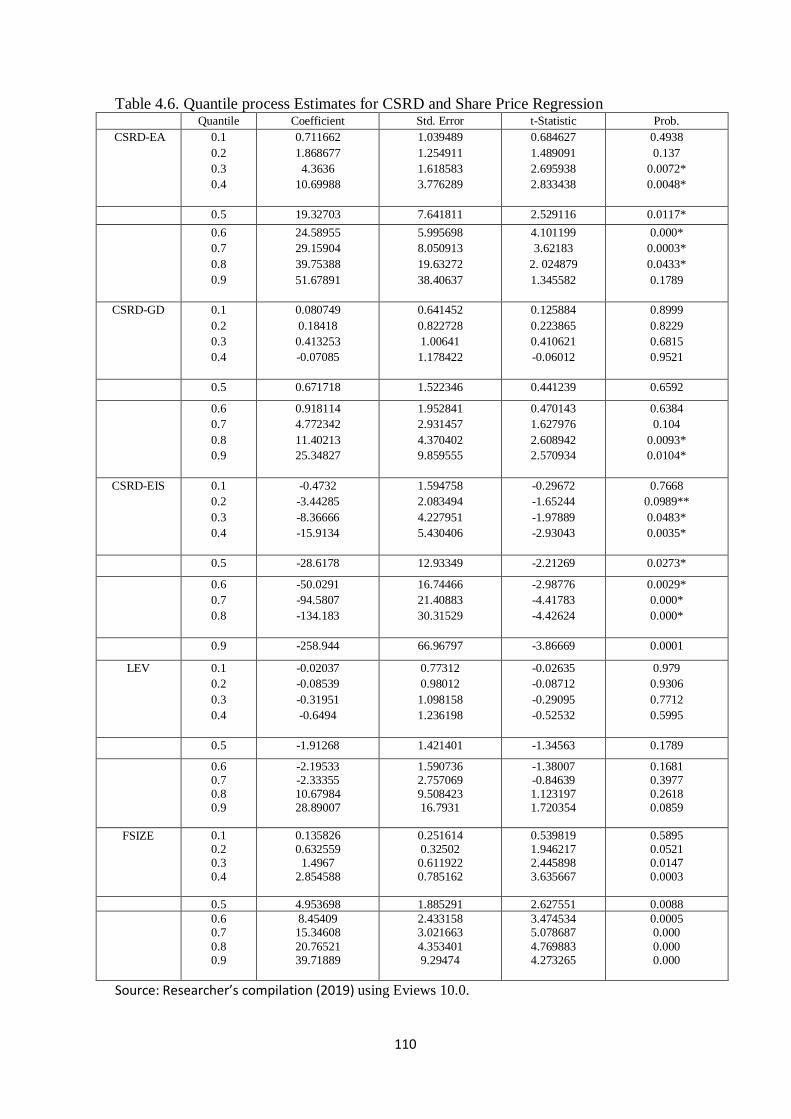
110
Table 4.6. Quantile process Estimates for CSRD and Share Price Regression Quantile Coefficient Std. Error t-Statistic Prob.
CSRD-EA 0.1
0.2
0.3
0.4
0.711662
1.868677
4.3636
10.69988
1.039489
1.254911
1.618583
3.776289
0.684627
1.489091
2.695938
2.833438
0.4938
0.137
0.0072*
0.0048*
0.5 19.32703 7.641811 2.529116 0.0117*
0.6
0.7
0.8
0.9
24.58955
29.15904
39.75388
51.67891
5.995698
8.050913
19.63272
38.40637
4.101199
3.62183
2. 024879
1.345582
0.000*
0.0003*
0.0433*
0.1789
CSRD-GD 0.1
0.2
0.3
0.4
0.080749
0.18418
0.413253
-0.07085
0.641452
0.822728
1.00641
1.178422
0.125884
0.223865
0.410621
-0.06012
0.8999
0.8229
0.6815
0.9521
0.5 0.671718 1.522346 0.441239 0.6592
0.6
0.7
0.8
0.9
0.918114
4.772342
11.40213
25.34827
1.952841
2.931457
4.370402
9.859555
0.470143
1.627976
2.608942
2.570934
0.6384
0.104
0.0093*
0.0104*
CSRD-EIS 0.1
0.2
0.3
0.4
-0.4732
-3.44285
-8.36666
-15.9134
1.594758
2.083494
4.227951
5.430406
-0.29672
-1.65244
-1.97889
-2.93043
0.7668
0.0989**
0.0483*
0.0035*
0.5 -28.6178 12.93349 -2.21269 0.0273*
0.6
0.7
0.8
-50.0291
-94.5807
-134.183
16.74466
21.40883
30.31529
-2.98776
-4.41783
-4.42624
0.0029*
0.000*
0.000*
0.9 -258.944 66.96797 -3.86669 0.0001
LEV 0.1
0.2
0.3
0.4
-0.02037
-0.08539
-0.31951
-0.6494
0.77312
0.98012
1.098158
1.236198
-0.02635
-0.08712
-0.29095
-0.52532
0.979
0.9306
0.7712
0.5995
0.5 -1.91268 1.421401 -1.34563 0.1789
0.6 0.7 0.8 0.9
-2.19533 -2.33355 10.67984 28.89007
1.590736 2.757069 9.508423 16.7931
-1.38007 -0.84639 1.123197 1.720354
0.1681 0.3977 0.2618 0.0859
FSIZE 0.1 0.2 0.3 0.4
0.135826 0.632559 1.4967
2.854588
0.251614 0.32502 0.611922 0.785162
0.539819 1.946217 2.445898 3.635667
0.5895 0.0521 0.0147 0.0003
0.5 4.953698 1.885291 2.627551 0.0088 0.6 0.7
0.8 0.9
8.45409 15.34608
20.76521 39.71889
2.433158 3.021663
4.353401 9.29474
3.474534 5.078687
4.769883 4.273265
0.0005 0.000
0.000 0.000
Source: Researcher’s compilation (2019) using Eviews 10.0.

111
Table 4.6 showed a significant positive relationship between CSRD-EA and SP; a
positive significant relationship between CSRD-GD and SP, and also a significant positive
relationship between CSRD-EIS and SP at 5%.
The usefulness of the quantile regression technique is unlike that of the panel
regression which does not show the effect of an independent variable on different levels of
the dependent but is regarded as a mean regression. The quantile regression parameter
estimates the change in a specified quantile of the response variable. The conditional
quantile regression traces the entire distribution of the independent variable, conditional
on a set of categories for the dependent variable. As observed, the distributional dynamics
for SP highlighted that the effect of CSRD-EA was significant at 5% for firms at high
levels above average financial performance at Q[0.3.] and Q[0.4]. The effect of CSRD-
EA was also significant at 5% for firms at average levels of financial performance Q[0.5]
and even below average levels Q[0.6], Q[0.7] and Q[0.8]. The findings thus highlighted
that the effect of environmental activities on share price could not necessarily be a
function of the share price levels.
Therefore, whether firms have relative high, average or low share prices, the effect
of CSRD-EA on SP is persistent. For CSRD-GD, the quantile estimates highlight that for
firms at below average share price level (Q[0.8.] and Q[0.9]) for the distribution, the
relationship with CSRD-GD is strongest. This may suggest that CSRD has stronger
positive effects on SP for firms in the below distribution average SP. For CSRD-EIS, the
outcome is similar to that of CSRD-EA. As observed, the distributional dynamics for SP
highlighted that the effect of CSRD-EIS was significant at 5% for firms at high levels
above average financial performance at Q[0.3.] and Q[0.4]. The effect of CSRD-EA was
also significant at 5% for firms at average levels of financial performance Q[0.5] and even
below average levels Q[0.6], Q[0.7] and Q[0.8]. The findings thus highlighted that the

112
effect of employment of indigenous staff on share price could not necessarily be a function
of the share price levels. Therefore, whether firms had relative high, average or low share
prices, the effect of CSRD-EIS on SP was persistent.
Table 4.7. CSRD and ROA Results
Variable Aprori
Sign
FE
estimates
RE
estimates
GMM
Estimates
C
0.41592*
(0.07241)
{0.000)
0.4566*
(0.4536)
{0.0023}
-0.80587*
(0.09233)
{0.000}
GD
+
-0.01892
(0.0152)
{0.2145}
0.04535
(0.03279)
{0.1672}
0.1463*
(0.0117)
{0.000}
EIS
+
-0.0776
(0.0525) {0.1399}
0.03199
(0.1004) {0.7501}
0.6625*
(0.0476) {0.000}
EA
+
0.02516*
(0.0112)
{0.0251}
0.0030
(0.0107)
{0.7772}
-0.2769*
(0.0416)
{0.000}
LEV
+
-0.0105
(0.0065)
{0.1063}
-0.01603
(0.0270)
{0.5540}
-0.0026
(0.0333)
{0.9378}
FSIZE
+
0.0075
(0.0071)
{0.2928}
-0.0039
(0.0177)
{0.8263}
0.0758*
(0.0187)
{0.0001}
Model Parameters
R2 0.6936 0.0734 0.358
Adjusted R2 0.6901 0.066 0.112
F-statistic 195.12 9.895
Prob(F-stat) 0.000 0.00 0.000
Durbin-Watson 2.1 1.97 2.071
Model Diagnostics
Hausman 0.006
Ramsey Reset test 0.410
Period Hetero.Test 0.81
Cross-section Hetero.Test
0.431
Pesaran CD for serial
correlation
0.571
Instrument Rank
8
j-statistics
3.0344
Prob-j-stat
0.2193
AR(1)
0.0023
AR(2)
0.274
Source: Researcher’s compilation (2019) using Eviews 10.0. * sig @ 5%, **sig@10%
Table 4.7 showed the regression results which examined the impact of CSRD on
Return on assets (ROA). From the Hausman test statistic p-value = 0.006, the FE was the
preferred model estimate between the fixed and random effect estimations. However, to
113
address the presence of potential endogeneity bias in GD and EIS dimensions of CSRD,
the generalized method of moments (GMM) estimator was also utilized. For statistical
precaution, the white adjusted standard errors were employed to control for potential
heteroskedasticity in the estimation and hence, the estimation results were free from
heteroskedasticity. Both panel period heteroskedasticity [p=0.81] and cross-sectional
heteroskedasticity [p=0.431] were examined and the estimations were found to be free
from such. The Peseran cross-dependence test [p=0.571] was employed to confirm the
threat of the serial correlation in the errors and the statistic revealed the absence of cross-
section dependence in the residuals. The FE estimates showed that R2 was 0.6936 with a
degree of freedom adjusted the R2 of 0.6901 which explained the extent to which the
explanatory variables were able to account for systematic variations in the dependent
variables. The F-stat was 195.12 (p-value = 0.00) significant at 5% and suggested that the
hypothesis of a significant linear relationship between the dependent and independent
variables could not be rejected. It was also indicative of the joint statistical significance of
the model.
The analysis of coefficients revealed that CSRD-GD dimension had a negative (-
0.01892) effect on ROA although it was not statistically significant at 5% (p=0.2145).
Employment of indigenous staff (CSRD-EIS) related disclosures had a negative (-0.0776)
impact on ROA although not also significant (p=0.1399) at 5%. Environmental activities
dimension (CSRD-EA) had a positive (0.0251) impact on ROA and was also significant
(p=0.0251) at 5%. Looking at the control variables, none of FSIZE and LEV showed any
statistical significance in their effects. Although the FE models mainly controlled for
unobserved heterogeneity, they did not account for the endogeneity problem (Cameron &
Trivedi 2005). To deal with the issue the Arellano and Bond (1991) GMM estimator
controlled for potential endogeneity problem. The Arrelano and Bond estimation results

114
showed a substantial difference from the FE estimations with stronger beta’s thus
confirming that the Arrelano and Bond estimations results, after correcting for
endogeneity, were more impressive. The analysis of the coefficients revealed that CSRD-
GD had a positive (0.1463) significant effect (p=0.000) on ROA, CSRD-EIS had a
positive impact (0.6625) on ROA which was significant (p=0.00) at 5% and CSRD-EA
had a negative beta (-0.2769) and was significant (p=0.000) at 5%. The J-stat test of over-
identifying restrictions and the Arellano-Bond test for autocorrelation error were
examined. The J-stat tests yielded all p-values above 0.10, which meant that a null
hypothesis could not be rejected. Hence, over identification restrictions were valid. The
AR(1) tests indicated that the residuals in first differences correlated as expected, while the
AR(2) tests gave p-values above 0.10, which meant that a null hypothesis of no second-
order serial correlation could not be rejected. Therefore, all results of the GMM model
were valid.
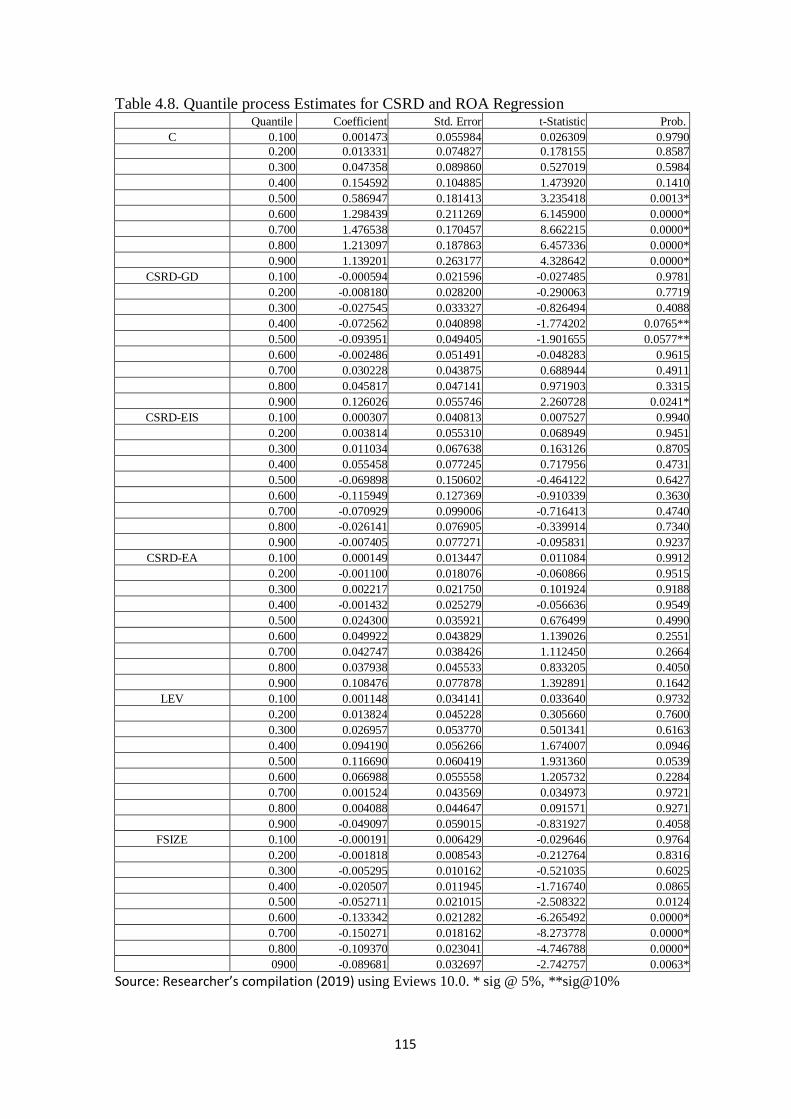
115
Table 4.8. Quantile process Estimates for CSRD and ROA Regression Quantile Coefficient Std. Error t-Statistic Prob.
C 0.100 0.001473 0.055984 0.026309 0.9790
0.200 0.013331 0.074827 0.178155 0.8587
0.300 0.047358 0.089860 0.527019 0.5984
0.400 0.154592 0.104885 1.473920 0.1410
0.500 0.586947 0.181413 3.235418 0.0013*
0.600 1.298439 0.211269 6.145900 0.0000*
0.700 1.476538 0.170457 8.662215 0.0000*
0.800 1.213097 0.187863 6.457336 0.0000*
0.900 1.139201 0.263177 4.328642 0.0000*
CSRD-GD 0.100 -0.000594 0.021596 -0.027485 0.9781
0.200 -0.008180 0.028200 -0.290063 0.7719
0.300 -0.027545 0.033327 -0.826494 0.4088
0.400 -0.072562 0.040898 -1.774202 0.0765**
0.500 -0.093951 0.049405 -1.901655 0.0577**
0.600 -0.002486 0.051491 -0.048283 0.9615
0.700 0.030228 0.043875 0.688944 0.4911
0.800 0.045817 0.047141 0.971903 0.3315
0.900 0.126026 0.055746 2.260728 0.0241*
CSRD-EIS 0.100 0.000307 0.040813 0.007527 0.9940
0.200 0.003814 0.055310 0.068949 0.9451
0.300 0.011034 0.067638 0.163126 0.8705
0.400 0.055458 0.077245 0.717956 0.4731
0.500 -0.069898 0.150602 -0.464122 0.6427
0.600 -0.115949 0.127369 -0.910339 0.3630
0.700 -0.070929 0.099006 -0.716413 0.4740
0.800 -0.026141 0.076905 -0.339914 0.7340
0.900 -0.007405 0.077271 -0.095831 0.9237
CSRD-EA 0.100 0.000149 0.013447 0.011084 0.9912
0.200 -0.001100 0.018076 -0.060866 0.9515
0.300 0.002217 0.021750 0.101924 0.9188
0.400 -0.001432 0.025279 -0.056636 0.9549
0.500 0.024300 0.035921 0.676499 0.4990
0.600 0.049922 0.043829 1.139026 0.2551
0.700 0.042747 0.038426 1.112450 0.2664
0.800 0.037938 0.045533 0.833205 0.4050
0.900 0.108476 0.077878 1.392891 0.1642
LEV 0.100 0.001148 0.034141 0.033640 0.9732
0.200 0.013824 0.045228 0.305660 0.7600
0.300 0.026957 0.053770 0.501341 0.6163
0.400 0.094190 0.056266 1.674007 0.0946
0.500 0.116690 0.060419 1.931360 0.0539
0.600 0.066988 0.055558 1.205732 0.2284
0.700 0.001524 0.043569 0.034973 0.9721
0.800 0.004088 0.044647 0.091571 0.9271
0.900 -0.049097 0.059015 -0.831927 0.4058
FSIZE 0.100 -0.000191 0.006429 -0.029646 0.9764
0.200 -0.001818 0.008543 -0.212764 0.8316
0.300 -0.005295 0.010162 -0.521035 0.6025
0.400 -0.020507 0.011945 -1.716740 0.0865
0.500 -0.052711 0.021015 -2.508322 0.0124
0.600 -0.133342 0.021282 -6.265492 0.0000*
0.700 -0.150271 0.018162 -8.273778 0.0000*
0.800 -0.109370 0.023041 -4.746788 0.0000*
0900 -0.089681 0.032697 -2.742757 0.0063*
Source: Researcher’s compilation (2019) using Eviews 10.0. * sig @ 5%, **sig@10%
116
Table 4.8 showed that CSRD-GD had a significant positive relationship with ROA
at 5%. However, for CSRD-EIS and CSR-EA, there was no significant performance
region which implied that either of them having an effect on performance, was indifferent
to performance levels.
Employing quantile estimation, the study probed further into examining
distributional dynamics in the behaviour of corporate social responsibility disclosure in
relation to corporate financial performance at different levels of financial performance.
The usefulness of the quantile regression technique is that the conditional quantile
regression traces the entire distribution of the independent variable, conditional on a set of
categories for the dependent variable.
The quantile estimates are relevant in providing an understanding and insight
particularly, regarding any financial performance thresholds that must be met before CSR
activities become significantly relevant. As observed, the distributional dynamics for ROA
highlighted that the effect of CSRD-GD was significant at 5% for firms at low levels of
financial performance at Q[0.9.] and significant at 5% for firms at above average levels of
financial performance Q[0.4], Q[0.5]. For CSRD-EIS and CSRD-EA, the quantile
estimates failed to highlight any significant financial performance region for which
CSRD-EIS and CSR-EA would be significant. It suggested that either CSRD-EIS or
CSRD-EA effects on financial performance was indifferent to the performance levels or
the effect was generally weak for all performance quantiles.
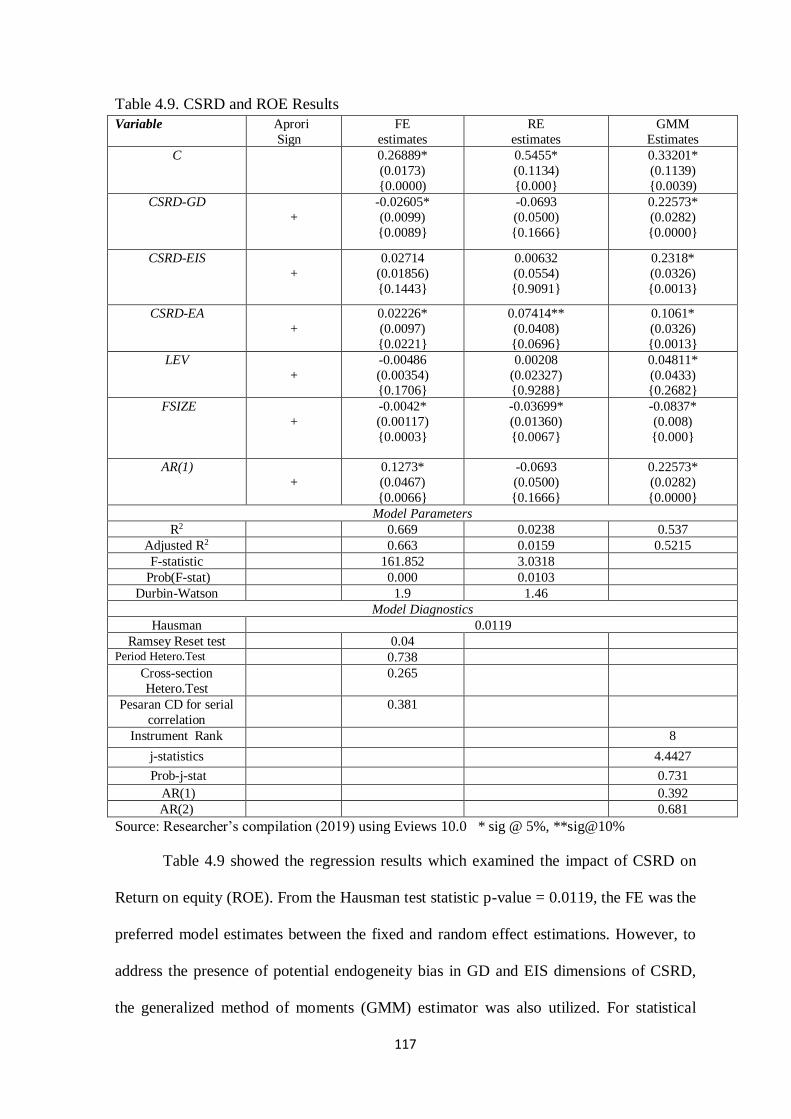
117
Table 4.9. CSRD and ROE Results
Variable Aprori
Sign
FE
estimates
RE
estimates
GMM
Estimates
C
0.26889*
(0.0173)
{0.0000)
0.5455*
(0.1134)
{0.000}
0.33201*
(0.1139)
{0.0039)
CSRD-GD
+
-0.02605*
(0.0099)
{0.0089}
-0.0693
(0.0500)
{0.1666}
0.22573*
(0.0282)
{0.0000}
CSRD-EIS
+
0.02714
(0.01856)
{0.1443}
0.00632
(0.0554)
{0.9091}
0.2318*
(0.0326)
{0.0013}
CSRD-EA
+
0.02226*
(0.0097)
{0.0221}
0.07414**
(0.0408)
{0.0696}
0.1061*
(0.0326)
{0.0013}
LEV
+
-0.00486
(0.00354) {0.1706}
0.00208
(0.02327) {0.9288}
0.04811*
(0.0433) {0.2682}
FSIZE
+
-0.0042*
(0.00117)
{0.0003}
-0.03699*
(0.01360)
{0.0067}
-0.0837*
(0.008)
{0.000}
AR(1)
+
0.1273*
(0.0467)
{0.0066}
-0.0693
(0.0500)
{0.1666}
0.22573*
(0.0282)
{0.0000}
Model Parameters
R2 0.669 0.0238 0.537
Adjusted R2 0.663 0.0159 0.5215
F-statistic 161.852 3.0318
Prob(F-stat) 0.000 0.0103
Durbin-Watson 1.9 1.46
Model Diagnostics
Hausman 0.0119
Ramsey Reset test 0.04
Period Hetero.Test 0.738
Cross-section
Hetero.Test
0.265
Pesaran CD for serial
correlation
0.381
Instrument Rank
8
j-statistics
4.4427
Prob-j-stat
0.731
AR(1)
0.392
AR(2)
0.681
Source: Researcher’s compilation (2019) using Eviews 10.0 * sig @ 5%, **sig@10%
Table 4.9 showed the regression results which examined the impact of CSRD on
Return on equity (ROE). From the Hausman test statistic p-value = 0.0119, the FE was the
preferred model estimates between the fixed and random effect estimations. However, to
address the presence of potential endogeneity bias in GD and EIS dimensions of CSRD,
the generalized method of moments (GMM) estimator was also utilized. For statistical
118
precaution, the white adjusted standard error was employed to control for potential
heteroskedasticity in the estimation and hence, the estimation results were free from
heteroskedasticity. Both panel period heteroskedasticity [p=0.738] and cross-sectional
heteroskedasticity [p=0.265] were examined and the estimations were found to be free
from such. The Peseran cross-dependence test [p=0.381] which was employed to confirm
the threat of the serial correlation in the errors and the statistic revealed the absence of
cross-section dependence in the residuals. The FE estimates showed that R2 was 0.669
with a degree of freedom adjusted the R2 of 0.663 which explained the extent to which the
explanatory variables were able to account for systematic variations in the dependent
variables. The F-stat was 161.852 (p-value = 0.00) significant at 5% and suggested that
the hypothesis of a significant linear relationship between the dependent and independent
variables could not be rejected. It was also indicative of the joint statistical significance of
the model.
The analysis of coefficients revealed that CSRD-GD dimension had a negative (-
0.02605) effect on ROE and statistically was significant at 5% (p=0.0089). Employment
of indigenous staff (CSRD-EIS) related disclosures had a positive (0.02714) impact on
ROE although not significant (p=0.1443) at 5%. Environmental activities dimension
(CSRD-EA) had a positive (0.0251) impact on ROE and was also significant (p=0.0221)
at 5%. Looking at the control variables, FSIZE showed a statistical significance. The
Arrelano and Bond estimation results showed substantial difference from the FE
estimations with stronger beta’s thus confirming that the Arrelano and Bond estimations
results, after correcting for endogeneity, were more impressive. The analysis of the
coefficients revealed that CSRD-GD had a positive (0.22573) significant effect (p=0.000)
on ROE, CSRD-EIS had a positive impact (0.2318) on ROE which was significant
(p=0.00) at 5% and CSRD-EA had a positive beta (0.1061) and was significant (p=0.000)
119
at 5%. The J-stat test for over-identifying restrictions and the Arellano-Bond test for
autocorrelation error were examined. The J-stat tests yielded all p-values above 0.10,
which meant that a null hypothesis could not be rejected. Hence, over identification
restrictions were valid. The AR(1) tests indicated that the residuals in first differences
correlated as expected, while the AR(2) tests gave p-values above 0.10, which meant that a
null hypothesis of no second-order serial correlation could not be rejected. Therefore, all
results of the GMM model were valid.
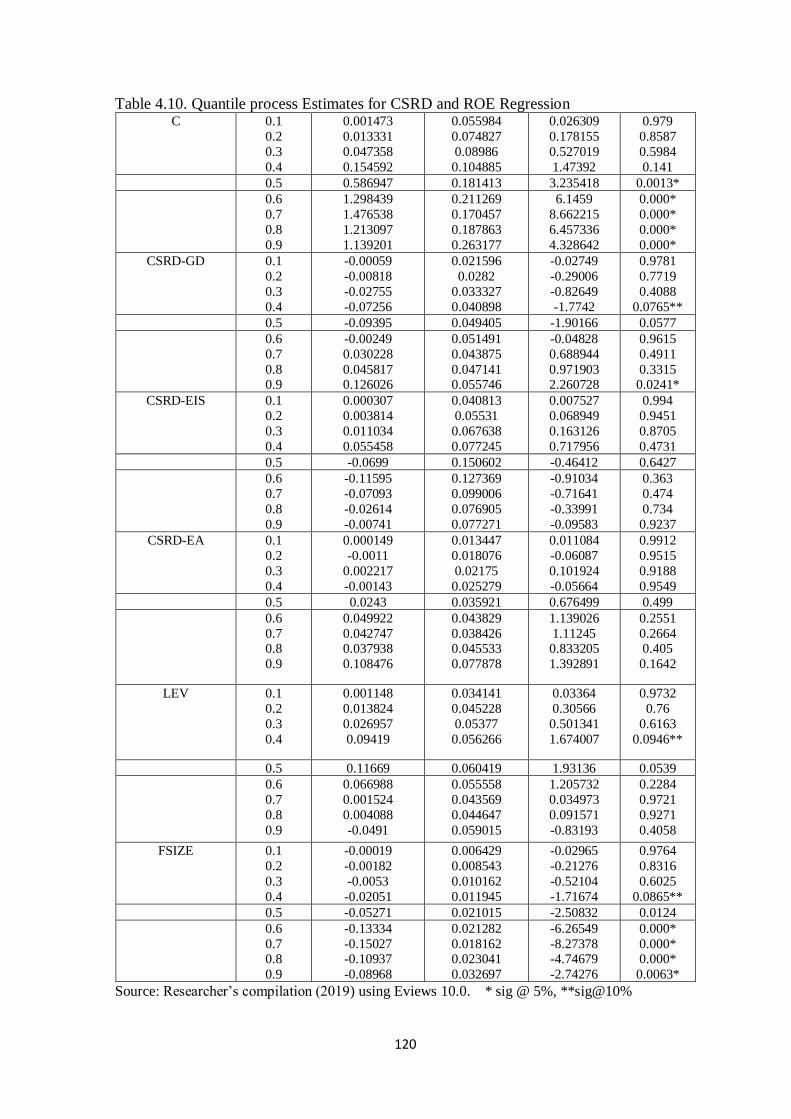
120
Table 4.10. Quantile process Estimates for CSRD and ROE Regression C 0.1
0.2
0.3
0.4
0.001473
0.013331
0.047358
0.154592
0.055984
0.074827
0.08986
0.104885
0.026309
0.178155
0.527019
1.47392
0.979
0.8587
0.5984
0.141 0.5 0.586947 0.181413 3.235418 0.0013* 0.6
0.7
0.8
0.9
1.298439
1.476538
1.213097
1.139201
0.211269
0.170457
0.187863
0.263177
6.1459
8.662215
6.457336
4.328642
0.000*
0.000*
0.000*
0.000*
CSRD-GD 0.1
0.2
0.3
0.4
-0.00059
-0.00818
-0.02755
-0.07256
0.021596
0.0282
0.033327
0.040898
-0.02749
-0.29006
-0.82649
-1.7742
0.9781
0.7719
0.4088
0.0765** 0.5 -0.09395 0.049405 -1.90166 0.0577 0.6
0.7
0.8 0.9
-0.00249
0.030228
0.045817 0.126026
0.051491
0.043875
0.047141 0.055746
-0.04828
0.688944
0.971903 2.260728
0.9615
0.4911
0.3315 0.0241*
CSRD-EIS 0.1
0.2
0.3
0.4
0.000307
0.003814
0.011034
0.055458
0.040813
0.05531
0.067638
0.077245
0.007527
0.068949
0.163126
0.717956
0.994
0.9451
0.8705
0.4731 0.5 -0.0699 0.150602 -0.46412 0.6427 0.6
0.7
0.8
0.9
-0.11595
-0.07093
-0.02614
-0.00741
0.127369
0.099006
0.076905
0.077271
-0.91034
-0.71641
-0.33991
-0.09583
0.363
0.474
0.734
0.9237
CSRD-EA 0.1
0.2
0.3
0.4
0.000149
-0.0011
0.002217
-0.00143
0.013447
0.018076
0.02175
0.025279
0.011084
-0.06087
0.101924
-0.05664
0.9912
0.9515
0.9188
0.9549 0.5 0.0243 0.035921 0.676499 0.499 0.6
0.7 0.8
0.9
0.049922
0.042747 0.037938
0.108476
0.043829
0.038426 0.045533
0.077878
1.139026
1.11245 0.833205
1.392891
0.2551
0.2664 0.405
0.1642
LEV 0.1
0.2
0.3
0.4
0.001148
0.013824
0.026957
0.09419
0.034141
0.045228
0.05377
0.056266
0.03364
0.30566
0.501341
1.674007
0.9732
0.76
0.6163
0.0946**
0.5 0.11669 0.060419 1.93136 0.0539 0.6
0.7
0.8
0.9
0.066988
0.001524
0.004088
-0.0491
0.055558
0.043569
0.044647
0.059015
1.205732
0.034973
0.091571
-0.83193
0.2284
0.9721
0.9271
0.4058
FSIZE 0.1
0.2
0.3
0.4
-0.00019
-0.00182
-0.0053
-0.02051
0.006429
0.008543
0.010162
0.011945
-0.02965
-0.21276
-0.52104
-1.71674
0.9764
0.8316
0.6025
0.0865** 0.5 -0.05271 0.021015 -2.50832 0.0124 0.6
0.7 0.8
0.9
-0.13334
-0.15027 -0.10937
-0.08968
0.021282
0.018162 0.023041
0.032697
-6.26549
-8.27378 -4.74679
-2.74276
0.000*
0.000* 0.000*
0.0063*
Source: Researcher’s compilation (2019) using Eviews 10.0. * sig @ 5%, **sig@10%
121
As observed, the distributional dynamics for ROE failed to strongly highlight any
significant financial performance region for which corporate social responsibility (CSRD-
GD, CSRD-EIS and CSRD-EA) would be significant and the effect appeared generally
weak for all performance quantiles. Although for firms at the lowest financial performance
region Q[0.9], their CSRD-GD activity tended to significantly affect ROE at 5%.
The analysis of coefficients revealed that CSRD-GD dimension had a negative (-
0.02605) effect on ROE and was statistically significant at 5% (p=0.0089). Employment
of indigenous staff (CSRD-EIS) related disclosures had a positive (0.02714) impact on
ROE although not significant (p=0.1443) at 5%. Environmental activities dimension
(CSRD-EA) had a positive (0.0251) impact on ROE and was also significant (p=0.0221)
at 5%. Looking at the control variables, FSIZE showed a statistical significance. The
Arrelano and Bond estimation results showed a substantial difference from the FE
estimations with stronger beta’s thus confirming that the Arrelano and Bond estimations
results, after correcting for endogeneity, were more impressive. The analysis of the
coefficients revealed that CSRD-GD had a positive (0.22573) significant effect (p=0.000)
on ROE, CSRD-EIS had a positive impact (0.2318) on ROE which was significant
(p=0.00) at 5% and CSRD-EA had a positive beta (0.1061) and was significant (p=0.000)
at 5%.
The J-stat test for over-identifying restrictions and the Arellano-Bond test for
autocorrelation error were examined. The J-stat tests yielded all p-values above 0.10,
which meant that a null hypothesis could not be rejected. Hence, over identification
restrictions were valid. The AR(1) tests indicated that the residuals in first differences
correlated as expected, while the AR(2) tests gave p-values above 0.10, which meant that a
null hypothesis of no second-order serial correlation could not be rejected. Therefore, all
results of the GMM model were valid.
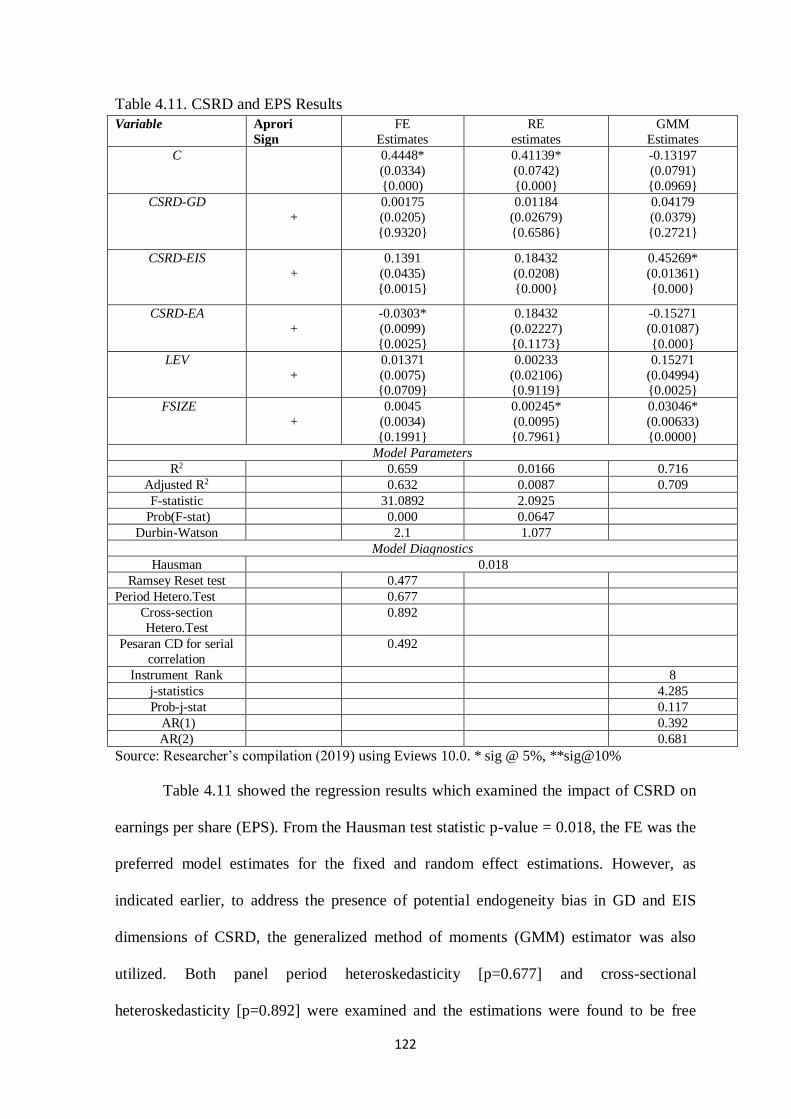
122
Table 4.11. CSRD and EPS Results
Variable Aprori
Sign
FE
Estimates
RE
estimates
GMM
Estimates
C
0.4448*
(0.0334)
{0.000)
0.41139*
(0.0742)
{0.000}
-0.13197
(0.0791)
{0.0969}
CSRD-GD
+
0.00175
(0.0205)
{0.9320}
0.01184
(0.02679)
{0.6586}
0.04179
(0.0379)
{0.2721}
CSRD-EIS
+
0.1391
(0.0435)
{0.0015}
0.18432
(0.0208)
{0.000}
0.45269*
(0.01361)
{0.000}
CSRD-EA
+
-0.0303*
(0.0099)
{0.0025}
0.18432
(0.02227)
{0.1173}
-0.15271
(0.01087)
{0.000}
LEV
+
0.01371
(0.0075) {0.0709}
0.00233
(0.02106) {0.9119}
0.15271
(0.04994) {0.0025}
FSIZE
+
0.0045
(0.0034)
{0.1991}
0.00245*
(0.0095)
{0.7961}
0.03046*
(0.00633)
{0.0000}
Model Parameters
R2 0.659 0.0166 0.716
Adjusted R2 0.632 0.0087 0.709
F-statistic 31.0892 2.0925
Prob(F-stat) 0.000 0.0647
Durbin-Watson 2.1 1.077
Model Diagnostics
Hausman 0.018
Ramsey Reset test 0.477
Period Hetero.Test 0.677
Cross-section
Hetero.Test
0.892
Pesaran CD for serial
correlation
0.492
Instrument Rank
8
j-statistics
4.285
Prob-j-stat
0.117
AR(1)
0.392
AR(2)
0.681
Source: Researcher’s compilation (2019) using Eviews 10.0. * sig @ 5%, **sig@10%
Table 4.11 showed the regression results which examined the impact of CSRD on
earnings per share (EPS). From the Hausman test statistic p-value = 0.018, the FE was the
preferred model estimates for the fixed and random effect estimations. However, as
indicated earlier, to address the presence of potential endogeneity bias in GD and EIS
dimensions of CSRD, the generalized method of moments (GMM) estimator was also
utilized. Both panel period heteroskedasticity [p=0.677] and cross-sectional
heteroskedasticity [p=0.892] were examined and the estimations were found to be free
123
from such. The Peseran cross-dependence test [p=0.492] was employed to confirm the
threat of the serial correlation in the errors and the statistic revealed the absence of a cross-
section dependence in the residuals.
The FE estimates showed that R2 was 0.659 with a degree of freedom adjusted the
R2 of 0.632 which explained the extent to which the explanatory variables were able to
account for systematic variations in the dependent variables. The F-stat was 31.0892 (p-
value = 0.00) significant at 5% and it suggested that the hypothesis of a significant linear
relationship between the dependent and independent variables could not be rejected. It was
also indicative of the joint statistical significance of the model. The analysis of
coefficients revealed that CSRD-GD dimension had a positive (0.00175) effect on EPS
although it was not statistically significant at 5% (p=0.9320). Employment of indigenous
staff (CSRD-EIS) related disclosures had a positive (0.1391) impact on EPS and was
significant (p=0.0015) at 5%. In the case of environmental activities dimension (CSRD-
EA), the effect on EPS was negative and also significant (p=0.0025) at 5%. Looking at the
control variables, none of FSIZE and LEV showed any statistical significance in their
effects.
The Arrelano and Bond estimation results showed a substantial difference from the
FE estimations with stronger beta’s thus confirming that the Arrelano and Bond
estimations results, after correcting for endogeneity, were more impressive with an
adjusted R2 of 70.9% The analysis of the coefficients revealed that CSRD-GD had a
positive (0.04179) although it was not significant (p=0.2721) on EPS, CSRD-EIS had a
positive impact (0.45269) on EPS which was significant (p=0.00) at 5% and CSRD-EA
had a negative beta (-0.15271) and significant (p=0.000) at 5%. The J-stat test of over-
identifying restrictions and the Arellano-Bond test for autocorrelation error were
examined. The J-stat tests yielded all p-values above 0.10, which meant that a null

124
hypothesis could not be rejected. Hence, over identification restrictions were valid. The
AR(1) tests indicated that the residuals in first differences correlated as expected, while the
AR(2) tests gave p-values above 0.10, which meant that a null hypothesis of no second-
order serial correlation could not be rejected. Therefore, all results of the GMM model
were valid.
Table 4.12. Quantile process Estimates for CSRD and EPS Regression. Quantile Coefficient Std. Error t-Statistic Prob.
C 0.100 0.200 0.300 0.400
-0.051178 0.135159 0.278781 0.289074
0.100352 0.113631 0.102786 0.090892
-0.509988 1.189456 2.712242 3.180404
0.6102 0.2347 0.0069 0.0015
0.500 0.322900 0.094659 3.411196 0.0007*
0.600 0.700 0.800 0.900
0.369534 0.354116 0.430114 0.605496
0.103747 0.116690 0.177472 0.171684
3.561857 3.034667 2.423560 3.526815
0.0004* 0.0025* 0.0157* 0.0005*
CSRD-GD 0.100 0.200 0.300 0.400
0.065051 0.055904 0.054228 0.046156
0.034208 0.034585 0.037132 0.044775
1.901641 1.616425 1.460410 1.030849
0.0577 0.1065 0.1447 0.3030
0.500 0.043709 0.047437 0.921406 0.3572
0.600 0.700
0.800 0.900
0.010578 0.027846
0.054903 0.029582
0.038823 0.036766
0.041295 0.064199
0.272473 0.757395
1.329523 0.460796
0.7853 0.4491
0.1842 0.6451
CSRD-EIS 0.100
0.200 0.300 0.400
0.145709
0.213599 0.271881 0.290221
0.048812
0.054567 0.057956 0.054485
2.985100
3.914465 4.691145 5.326669
0.0029
0.0001* 0.0000* 0.0000*
0.500 0.274024 0.067630 4.051825 0.0001*
0.600 0.700 0.800 0.900
0.299803 0.318182 0.259774 0.274702
0.068531 0.077098 0.112252 0.060203
4.374691 4.126977 2.314203 4.562898
0.0000* 0.0000* 0.0210* 0.0000*
CSRD-EA 0.100
0.200 0.300 0.400
-0.010249
-0.008197 0.013511 -0.005424
0.027767
0.027261 0.031842 0.031226
-0.369104
-0.300679 0.424308 -0.173690
0.7122
0.7638 0.6715 0.8622
0.500 -0.000450 0.030542 -0.014740 0.9882
0.600 0.700 0.800 0.900
-0.019097 -0.025003 -0.044029 -0.044233
0.028866 0.029254 0.029332 0.039791
-0.661566 -0.854686 -1.501049 -1.111635
0.5085 0.3931 0.1339 0.2667
LEV 0.100 0.200
0.300 0.400
0.055136 0.021773
0.036389 0.016591
0.047489 0.048493
0.033500 0.036997
1.161029 0.448979
1.086258 0.448440
0.2461 0.6536
0.2778 0.6540
0.500 0.047761 0.052405 0.911365 0.3625
0.600 0.700 0.800 0.900
0.063506 0.011096 -0.015504 0.061009
0.048064 0.044368 0.038839 0.101721
1.321275 0.250093 -0.399185 0.599762
0.1869 0.8026 0.6899 0.5489
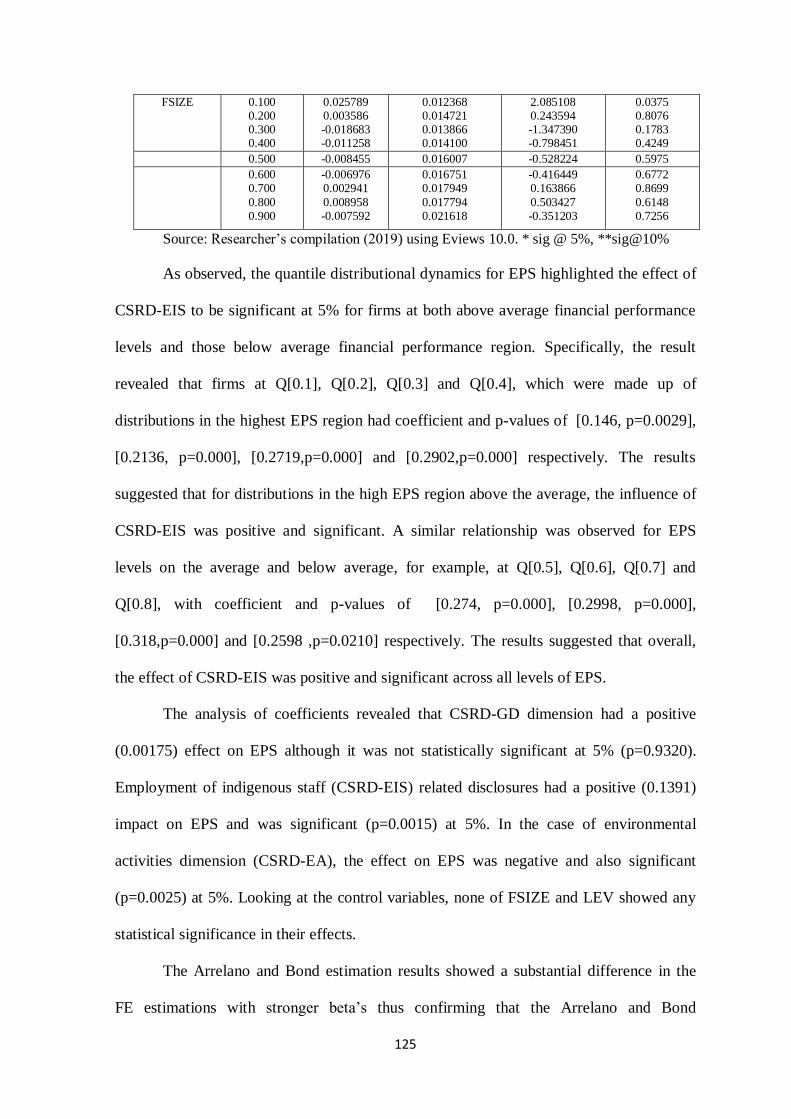
125
FSIZE 0.100 0.200 0.300 0.400
0.025789 0.003586 -0.018683 -0.011258
0.012368 0.014721 0.013866 0.014100
2.085108 0.243594 -1.347390 -0.798451
0.0375 0.8076 0.1783 0.4249
0.500 -0.008455 0.016007 -0.528224 0.5975
0.600 0.700
0.800 0.900
-0.006976 0.002941
0.008958 -0.007592
0.016751 0.017949
0.017794 0.021618
-0.416449 0.163866
0.503427 -0.351203
0.6772 0.8699
0.6148 0.7256
Source: Researcher’s compilation (2019) using Eviews 10.0. * sig @ 5%, **sig@10%
As observed, the quantile distributional dynamics for EPS highlighted the effect of
CSRD-EIS to be significant at 5% for firms at both above average financial performance
levels and those below average financial performance region. Specifically, the result
revealed that firms at Q[0.1], Q[0.2], Q[0.3] and Q[0.4], which were made up of
distributions in the highest EPS region had coefficient and p-values of [0.146, p=0.0029],
[0.2136, p=0.000], [0.2719,p=0.000] and [0.2902,p=0.000] respectively. The results
suggested that for distributions in the high EPS region above the average, the influence of
CSRD-EIS was positive and significant. A similar relationship was observed for EPS
levels on the average and below average, for example, at Q[0.5], Q[0.6], Q[0.7] and
Q[0.8], with coefficient and p-values of [0.274, p=0.000], [0.2998, p=0.000],
[0.318,p=0.000] and [0.2598 ,p=0.0210] respectively. The results suggested that overall,
the effect of CSRD-EIS was positive and significant across all levels of EPS.
The analysis of coefficients revealed that CSRD-GD dimension had a positive
(0.00175) effect on EPS although it was not statistically significant at 5% (p=0.9320).
Employment of indigenous staff (CSRD-EIS) related disclosures had a positive (0.1391)
impact on EPS and was significant (p=0.0015) at 5%. In the case of environmental
activities dimension (CSRD-EA), the effect on EPS was negative and also significant
(p=0.0025) at 5%. Looking at the control variables, none of FSIZE and LEV showed any
statistical significance in their effects.
The Arrelano and Bond estimation results showed a substantial difference in the
FE estimations with stronger beta’s thus confirming that the Arrelano and Bond
126
estimations results, after correcting for endogeneity, were more impressive with an
adjusted R2 of 70.9% The analysis of the coefficients revealed CSRD-GD had a positive
impact (0.04179) although it was not significant (p=0.2721) at 5%, CSRD-EIS had a
positive impact (0.45269) on EPS which was significant (p=0.00) at 5% and CSRD-EA
had a negative beta (-0.15271) and was significant (p=0.000) at 5%. The J-stat test of
over-identifying restrictions and the Arellano-Bond test for autocorrelation error were
examined. The J-stat tests yielded all p-values above 0.10, which meant that a null
hypothesis could not be rejected. Hence, over identification restrictions were valid. The
AR(1) tests indicated that the residuals in first differences correlated as expected, while the
AR(2) tests gave p-values above 0.10, which meant that a null hypothesis of no second-
order serial correlation could not be rejected. Therefore, all results of the GMM model
were valid.
4.3 Test of Hypotheses
Hypotheses formulated previously in chapter one were tested in this section. Our decision
rule is to accept hypothesis formulated if the calculated probability value is less than t-
critical value at 0.05 (5%) significant level. Otherwise we reject it.
4.3.1 Test of Hypothesis 1
Gifts and donations (GD) has no significant impact on corporate performance (FP) of
selected quoted firms in Nigeria.
Gifts and donations (GD) had a positive (2.1591) effect on SP and was statistically
significant at 5% (p=0.000). This was in agreement with the findings of Sampath (2015).
Also, the analysis of the coefficients revealed that GD had a positive (0.1463) significant
effect (p=0.000) on ROA. This was not in agreement with findings of Erhirhie and
Ekwueme (2019), Isa and Madaki (2017), El Mosaid and Boutti (2012), but in agreement
127
with the findings of Uadiale and Fagbemi (2012). More so, the analysis of the coefficients
revealed that GD had a positive (0.22573) significant effect (p=0.000) on ROE. This was
in agreement with the findings of Gololo (2019), Erhirhie and Ekwueme (2019), Uadiale
and Fagbemi (2012), but not in agreement with the findings of Isa and Madaki (2017), El
Mosaid and Boutti (2012). The analysis of fixed effects coefficients revealed that GD
dimension had a positive (0.00175) effect on EPS although it was not statistically
significant at 5% (p=0.9320). This was in agreement with the findings of Isa and Madaki
(2017). Following the decision rule, GD has a positive significant effect on CFP when
considering the individual proxies of SP, ROA, and ROE, but showing no significant effect
on EPS.
4.3.2 Test of Hypothesis Two
Employment of indigenous staff (EIS) has no significant effect on financial
performance (FP) of selected quoted firms in Nigeria.
From the results, the analysis of coefficients revealed that EIS had a positive (2.1896)
impact on SP and was not statistically significant (p=0.088) at 5%. This was in agreement
with the findings of Sampath (2019), but not in agreement with the findings of Fiori,
Donato and Izzo (2015). The analysis of coefficients revealed that Employment of
indigenous staff (EIS) related disclosures had a negative (-0.0776) impact on ROA
although it was not also significant (p=0.1399) at 5%. This was in agreement with the
findings of Erhirhie and Ekwueme (2019), Isa and Madaki (2017), El Mosaid and Boutti
(2012), but was not in agreement with the findings of Uadiale and Fagbemi (2012), Iqbal
(2012). The analysis of the coefficients revealed that EIS had a positive impact (0.2318)
on ROE which was significant (p=0.00) at 5%. This was in agreement with the findings of
Gololo (2019), Uadiale and Fagbemi (2012), Iqbal (2012), but not in agreement with the
128
findings of Erhirhie and Ekwueme (2019), Isa and Madaki (2017), El Mosaid and Boutti
(2012). Employment of indigenous staff (EIS) related disclosures had a positive (0.1391)
impact on EPS and it was significant (p=0.0015) at 5%. This was in agreement with the
findings of Isa and Madaki (2017). Following the decision rule, EIS was seen to have a
positive significant effect on CFP when considering the individual proxies of ROA, ROE,
and EPS, however showing a negative significant effect on SP.
4.3.3 Test of Hypothesis Three
Environmental activities (EA) has no significant impact on financial performance (FP)
of selected quoted firms in Nigeria.
The Arrelano and Bond estimation results revealed that EA had a positive beta (85.1088)
impact on SP and was significant (p=0.000) at 5%. This was in agreement with the
findings of Sampath (2015), Ibrahim adnn Hamid (2019) but not in agreement with the
findings of Fiori, Donato and Izzo (2015). The analysis of fixed effects coefficients
revealed that Environmental activities dimension (EA) had a positive (0.0251) impact on
ROA and was significant (p=0.0251) at 5%. This was not in agreement with the findings
of Erhirhie and Ekwueme (2019), Isa and Madaki (2017), Noor (2015), El Mosaid and
Boutti (2012), but in agreement with the findings of Ibrahim and Hamid (2019), Uadiale
and Fagbemi (2012), Iqbal (2012). The analysis of the coefficients revealed that EA had a
negative beta (-0.2769) and it was significant (p=0.000) at 5%. The analysis of the fixed
effects coefficients revealed that Environmental activities dimension (EA) had a positive
(0.0251) impact on ROE and was also significant (p=0.0221) at 5%. This was in
agreement with the findings of Gololo (2019), Ibrahim and Hamid (2019), Uadiale and
Fagbemi (2012), Iqbal (2012), but was not in agreement with the findings of Erhirhie and
Ekwueme (2019), Isa and Madaki (2017), Noor (2015), El Mosaid and Boutti (2012). The

129
analysis of the coefficients revealed that EA had a positive beta (0.1061) and significant
(p=0.000) at 5%. The analysis of fixed effects coefficients revealed that environmental
activities dimension (EA), the effect on EPS was negative and also significant (p=0.0025)
at 5%. This was in agreement with the findings of Isa and Madaki (2017), Noor (2015),
but in agreement with the findings of Ibrahim and Hamid (2019), Seungwoo, Junseok and
Ahreum (2017). Considering the decision rule, EA was seen to have a positive significant
effect on CFP when considering the individual proxies of SP and ROE, on the other hand
showing a negative significant effect on ROA and EPS.

130
CHAPTER FIVE
DISCUSSION OF FINDINGS
5.1 Introduction
This chapter examines the discussion of results and the test of hypotheses. The
findings of the study are discussed in the light of existing extant literature and this forms
the basis for the test of hypotheses.
5.2 Discussion of Findings
The findings of the study are hereby discussed.
5.2.1 Gifts and Donations on Share Price
The impact of corporate social responsibility disclosure as proxied by gifts and
donations (GD) on share price (SP) was significantly positive.
From the results in table 4.5, the analysis of coefficients revealed that GD had a positive
(2.1591) effect on SP and was statistically significant at 5% (p=0.000). However, the
Arrelano and Bond estimation results revealed that GD had a positive (17.5513)
significant effect (p=0.058) on SP at 10%. Consequently, on the basis of the Arrelano and
Bond GMM estimation, the null hypothesis that corporate social responsibility disclosure
on gifts and donations has no significant impact on share price was rejected. For GD, the
quantile estimates showed that for firms at below average share price level (Q[0.8.] and
Q[0.9]) for the distribution, the relationship with GD was strongest. That could suggest
that GD had stronger positive effects on SP for firms in the below distribution average.
That was in agreement with Sampath (2015) and Adina and Dumitru (2017) but in
disagreement with Vance (1975), Fiori, Donato and Izzo (2015) Oladipupo and Oladimeji
(2018).

131
5.2.2 Employment of indigenous staff on Share Price
The impact of corporate social responsibility disclosure as proxied by employment of
indigenous staff (EIS) on share price (SP) was significantly positive.
From the results in table 4.5, the analysis of coefficients revealed that EIS had a positive
(2.1896) impact on SP and was statistically significant (p=0.088) at 10%. EIS had a
negative impact (-25.8445) on SP which was significant (p=0.000) at 5%. As observed,
the distributional dynamics for SP highlighted that the effect of EIS was significant at 5%
for firms at high levels above average financial performance at Q[0.3.] and Q[0.4].
5.2.3 Environmental activities on Share Price
The impact of corporate social responsibility disclosure as proxied by environmental
activities (EA) on share price (SP) was significantly positive.
From the results in table 4.5, the analysis of coefficients revealed that EA’s impact on SP
was not significant at 5% although with a negative (-1.5786) coefficient. However, the
Arrelano and Bond estimation results revealed that EA had a positive beta (85.1088) and
was significant (p=0.000) at 5%. The results from quantile regression showed that the
effect of EA on share price could not necessarily be a function of the share price levels.
Therefore, whether firms had relative high, average or low share prices, the effect of EA
on SP was persistent.
5.2.4 Gifts and Donations (GD) on Return on Assets (ROA)
Table 4.9 showed the regression results which examined the impact of GD on Return on
Assets (ROA). The analysis of fixed effects coefficients revealed that GD dimension had a
negative (-0.01892) effect on ROA although it was not statistically significant at 5%
(p=0.2145). However, the Arrelano and Bond GMM estimation results showed a
132
substantial difference from the FE estimations with stronger beta’s thus, confirming that
the Arrelano and Bond estimations results, after correcting for endogeneity, were more
impressive. The analysis of the coefficients revealed that GD had a positive (0.1463)
significant effect (p=0.000) on ROA.
5.2.5 Employment of indigenous staff (EIS) on Return on Assets (ROA)
Table 4.9 showed the regression results which examined the impact of EIS on Return on
Assets (ROA). The analysis of fixed effects coefficients revealed that Employment of
indigenous staff (EIS) related disclosures had a negative (-0.0776) impact on ROA
although it was not also significant (p=0.1399) at 5%. However, the Arrelano and Bond
GMM estimation results showed a substantial difference from the FE estimations with
stronger beta’s thus, confirming that the Arrelano and Bond estimations results, after
correcting for endogeneity, were more impressive. The analysis of the coefficients
revealed that EIS had a positive impact (0.6625) on ROA which was significant (p=0.00)
at 5%.
5.2.6 Environmental activities (EA) on Return on Assets (ROA)
Table 4.9 showed the regression results which examined the impact of EA on Return on
Assets (ROA). The analysis of fixed effects coefficients revealed that Environmental
activities dimension (EA) had a positive (0.0251) impact on ROA and was significant
(p=0.0251) at 5%. However, the Arrelano and Bond GMM estimation results showed a
substantial difference from the FE estimations with stronger beta’s thus, confirming that
the Arrelano and Bond estimations results, after correcting for endogeneity, were more
impressive. The analysis of the coefficients revealed that EA had a negative beta (-0.2769)
and it was significant (p=0.000) at 5%.

133
5.2.7 Gifts and Donations (GD) on Return on Equity (ROE)
Table 4.8 showed the regression results which examined the impact of GD on Return on
Equity (ROE). The analysis of the fixed effects coefficients revealed that GD dimension
had a negative (-0.02605) effect on ROE and was statistically significant at 5%
(p=0.0089). The Arrelano and Bond GMM estimation results showed a substantial
difference from the FE estimations with stronger beta’s thus, confirming that the Arrelano
and Bond estimations results, after correcting for endogeneity, were more impressive. The
analysis of the coefficients revealed that GD had a positive (0.22573) significant effect
(p=0.000) on ROE. Although insights from the quantile regression for the distributional
dynamics for ROE failed to strongly highlight any significant financial performance
region for which corporate social responsibility [GD, EIS and EA] would be significant,
but for firms at the lowest financial performance region Q[0.9], their GD activity tended
to significantly affect ROE at 5%.
5.2.8 Employment of indigenous staff (EIS) on Return on Equity (ROE)
Table 4.8 showed the regression results which examined the impact of EIS on Return on
Equity (ROE). Employment of indigenous staff (EIS) related disclosures had a positive
(0.02714) impact on ROE although it was not significant (p=0.1443) at 5%. The Arrelano
and Bond GMM estimation results showed a substantial difference from the FE
estimations with stronger beta’s thus, confirming that the Arrelano and Bond estimations
results, after correcting for endogeneity, were more impressive. The analysis of the
coefficients revealed that EIS had a positive impact (0.2318) on ROE which was
significant (p=0.00) at 5%. Although insights from the quantile regression for the
distributional dynamics for ROE failed to strongly highlight any significant financial

134
performance region for which corporate social responsibility [GD, EIS and EA] would be
significant, but for firms at the lowest financial performance region Q[0.9].
5.2.9 Environmental activities (EA) on Return on Equity (ROE)
Table 4.8 showed the regression results which examined the impact of EA on Return on
Equity (ROE). The analysis of the fixed effects coefficients revealed that Environmental
activities dimension (EA) had a positive (0.0251) impact on ROE and was also significant
(p=0.0221) at 5%. The Arrelano and Bond GMM estimation results showed a substantial
difference from the FE estimations with stronger beta’s thus, confirming that the Arrelano
and Bond estimations results, after correcting for endogeneity, were more impressive. The
analysis of the coefficients revealed that EA had a positive beta (0.1061) and significant
(p=0.000) at 5%. Although insights from the quantile regression for the distributional
dynamics for ROE failed to strongly highlight any significant financial performance
region for which corporate social responsibility would be significant.
5.2.10 Gifts and Donations (GD) on Earnings per share (EPS)
Table 4.9 showed the regression results which examined the impact of GD on earnings per
share (EPS). The analysis of fixed effects coefficients revealed that GD dimension had a
positive (0.00175) effect on EPS although it was not statistically significant at 5%
(p=0.9320). The Arrelano and Bond estimation results revealed that GD had a positive
(0.04179) although no significant effect (p=0.2721) on EPS.
5.2.11 Employment of indigenous staff (EIS) on Earnings per share (EPS)
Table 4.9 showed the regression results which examined the impact of EIS on earnings per
share (EPS). Employment of indigenous staff (EIS) related disclosures had a positive
(0.1391) impact on EPS and it was significant (p=0.0015) at 5%. The Arrelano and Bond
135
estimation results revealed that EIS had a positive impact (0.45269) on EPS which was
significant (p=0.00) at 5%. Insights from the quantile distributional dynamics for EPS
tended to highlight that the effect of EIS was significant at 5% for firms at both above
average financial performance levels and those below average financial performance
region. Specifically, the result revealed that firms at Q[0.1], Q[0.2], Q[0.3] and Q[0.4]
which were made up of distributions in the highest EPS region had coefficient and p-
values of [0.146, p=0.0029], [0.2136, p=0.000], [0.2719,p=0.000] and [0.2902,p=0.000]
respectively. The results suggested that for distributions in the high EPS region above the
average, the influence of EIS was positive and significant. A similar relationship was
observed for EPS levels on average and below average, for example, at Q[0.5], Q[0.6],
Q[0.7] and Q[0.8], with coefficient and p-values of [0.274, p=0.000], [0.2998, p=0.000],
[0.318,p=0.000] and [0.2598, p=0.0210] respectively. The results suggested that overall,
the effect of EIS was positive and significant across all levels of EPS.
5.2.12 Environmental activities (EA) on Earnings per share (EPS)
Table 4.9 showed the regression results which examined the impact of EA on earnings per
share (EPS). The analysis of fixed effects coefficients revealed that environmental
activities dimension (EA), the effect on EPS was negative and also significant (p=0.0025)
at 5%. The Arrelano and Bond estimation results revealed that EA had a negative beta (-
0.15271) and it was significant (p=0.000) at 5%.
136
CHAPTER SIX
SUMMARY OF FINDINGS, CONCLUSION AND RECOMMENDATIONS
6.1. Introduction
This chapter summarizes the research work and provides conclusion and
recommendations in line with the topic of study. That is, it empirically investigates the
relationship between CSR disclosure and financial performance of listed non-financial
companies in Nigeria. Conceptual, theoretical and empirical literatures were used to
identify the research gaps in knowledge. The study presented and analysed data in chapter
four with specific attention given to the objectives and research questions of the study
which were used as units of analyses. The discussion of findings was related to the
concept and empirical studies reviewed in chapter two, followed by the test of hypotheses
formulated in chapter one which compared our results with other existing ones in both
developed and developing economies.
6.2 Summary of Findings
1. The results revealed a significant impact on corporate social responsibility
disclosure and corporate financial performance measures. Specifically, the parameter
estimates revealed that: CSRD-GD had a positive significant effect on SP at 10%, CSRD-
EIS had a negative impact on SP which was significant at 5% and CSRD-EA had a
positive impact and significant at 5%.
2. The results revealed a significant impact on corporate social responsibility
disclosure and ROA. Specifically, the parameter estimates revealed that: CSRD-GD had a
positive significant effect on ROA at 5%, CSRD-EIS had a positive impact on ROA which
was significant at 5% and CSRD-EA had a negative impact and significant at 5%.
3. The results revealed a significant impact on corporate social responsibility
disclosure and ROE. Specifically, the parameter estimates reveal that: CSRD-GD had a
137
positive significant effect on ROE at 5%, CSRD-EIS had a positive impact on ROE which
was significant at 5% and CSRD-EA had a positive beta and was significant at 5%.
4. The results revealed a significant effect on corporate social responsibility
disclosure and EPS. Specifically, the parameter estimates revealed that: CSRD-GD had a
positive though not significant effect on EPS, CSRD-EIS had a positive impact on EPS
which was significant at 5% and CSRD-EA had a negative effect on EPS and it was
significant at 5%.
6.3. Conclusion
In the past, corporate social responsibility disclosure used to get less attention from and
minimum revelevance in the objectives of business corporations. However, it has become
a crucial concern in recent times as a result of the global attention that the subject has
attracted. One approach in evaluating a company’s CSR behaviour is to examine if it
engages in CSR disclosure. It is believed that when a company engages in social
responsibility disclosure, it presents a balanced reportage of its activities and impacts and
provides a basis for stakeholders to evaluate its performance. It suffices to note that CSRD
is seen to have developed rather voluntarily in the recent past and this implies that
companies can choose what to disclose, and may even decide not to. Furthermore, the
nexus between CSRD and corporate financial performance is complex and leaves much to
be studied or researched. This is confirmed by the results-oriented empirical literatures in
the field. The study has tried to verify whether certain corporate financial performance
measures can be affected by a firm’s social responsible behaviour. The study analysed
some descriptive statistics and used cross section and panel data econometrical approaches
to verify whether CSR disclosure could affect corporate financial performance measures.
The study concludes that corporate social responsibility disclosure has a significant impact
on firm’s financial performance. This implies that the practice of effective corporate social
138
responsibility disclosure (CSRD) can enhance a more harmonious coexistence and smooth
operation of the companies in their host communities. This will equally promote the
companies’ reputation even as they strive to nurture and safeguard the environment in
which they operate, and hence, improve their financial performances.
6.4. Recommendations
Based on the findings of this study, the following recommendations were made:
1. Given that there is a significant impact on corporate social responsibility disclosure
and corporate financial performance measures, the study recommended among other
things that; corporate social responsibility disclosure should be encouraged in order to
improve the brand and image reputation of the companies.
2. The challenging situation of the weakness of state policy in the development of
effective and enforceable CSRD framework especially, in most developing countries,
lends credence to the view that contemporary CSR practices have drifted and evolved
within a system skewed towards the spirit of free-market individualism without an
effective state direction. Consequently, there is a need for effective regulation of CSRD
practices of companies in Nigeria.
3. There is the issue of credibility of CSR disclosures. One problem with CSR
disclosure is that the information reported tends to be selective and, as such, it is difficult
to determine whether such disclosures are anything more than corporate branding which is
motivated to enhance corporate image. Hence, there is the need for external verification of
CSR claims as well as ascertaining the reliability and authenticity of CSR disclosure
representations in the accounting record.
4. Finally, judging from the grave dangers posed by environmental degradation
globally and Nigeria in particular, it is recommended that stiff sanctions be imposed on
139
companies with poor or even without corporate environmental responsibility measures and
or policies.
6.5 Recommendations for Further Studies
1. We recommend further studies on Corporate Social Responsibility Disclosure
(CSRD) and Corporate Financial Performance (CFP) in the private sector of the economy.
2. We also recommend further studies on Corporate Social Responsibility and
Corporate Financial Performance in both financial and non-financial sectors of the
economy with larger samples.
6.6 Contributions to Knowledge
The study contributed to the existing body of knowledge as the study analysed
components of the dependent and independent variables in arriving at more conclusive
findings. The time period employed in the study (22 years) which is relatively long as
against previous studies is a contribution to the existing body of knowledge.
Some existing literatures dealt so much on the subject only in the financial sector making
it seem as if the non-financial sector does little or nothing in the area of corporate social
responsibility disclosure. This study, however, revealed that the non-financial sector is
also involved in corporate social responsibility activities and the disclosure, in no small
way.
Some of the existing studies in this area employed relatively small sample sizes, ranging
from 1 to 10 companies. This makes generalization of results unreliable and inconsistent.
In this study, however, a larger sample size (86 companies) representing 79% of the
population was used to make generalization of results more reliable, realistic, consistent
and acceptable.

140
Lastly, this study focused on the listed non-financial companies in Nigeria as against most
of the previous studies which focused on Asia and European countries such as Malaysia,
India, China, Italy, Bangladesh, to mention but a few.

141
REFERENCES
ABARE (Australian Bureau of Agricultural and Resource Economics) (2006). Australian
commodities. 06.1 March quarter, 13(1). Andrew Wright (ed). Canberra:
Commonwealth of Australia. Accessed 6 August 2020 from
http://www.abareconomics.com/australiancommodities/pdfs/AC_Marc06_BOOK.
ABC (Australian Boardcasting Corporation) (2006) Company pushes ahead with iron ore
mine plan. ABC News Online- Indigenous news. Accessed 6 August 2020 from
http://www.abc.net.au/message/news/stories/ms_news_1584051.htm
Abbey, D. (2002) Corporate Social Responsibility: Beyond Numbers (Electronic Version),
December, 2002.
Abbott, W.F., & Monsen, R.J. (1979) On the measurement of Corporate Social
Responsibility – Reported Disclosures as a method of measuring corporate social
involvement. The Academy of Management Journal, 22(3): 501 – 515.
Abbott, W.F., & Monsen, R.J. (1979). On the measurement of corporate social
responsibility: Self-report disclosure as a method of measuring social involvement.
Academy of Management Journal, 22, 501-515.
Abdur-Rouf, Md (2011) The Corporate Social Responsibility Disclosure: A Study of listed
companies in Bangladesh: Business and Economics Research Journal, 2(3): 19 –
32.
Accountingtools (2018) Profit Formula. Available at
https://www.accountingtools.com/articles/profitformula/htm accessed on 12
August 2019.
Ackerman, R.W. & Bauer, R.A. (1976) Corporate Social Responsiveness. Reston
Publishing, Reston – References – Scientific Research Publishing.
Adam, R. (1991) Performance indicators for sustainable development accounting &
business. A Journal of the Association of Chartered Accountants. 2(A): 14.
Adegbuji .V.F. (2015). Forensic Accountant: A Panacea for the Management of Fraud in
the Nigerian Banking Industry, A Case Study of some Selected Banks.
Unpublished Thesis in the Department of Accounting and Finance, Delta State
University, Abraka.
Adeyemi, T.O. (2016) Internal Financial Reporting Standards Adoption and Earnings
Management in Nigerian Non-Financial Quoted Companies. Retrieved on 28th
June, 2017 from http://www.kubanni.abu.edu.ng, jspui, bitstream.
142
Adina, D. & Dumitru, C.O. (2017) CSR and Company’s Stock Price: A Comparative
Evidence from Bucharest Stock Exchange. EuroEconomica, 36(1).
Aguilera R., Rupp D., & Williams C. (2005) Putting the back in Corporate Social
Responsibility: A multi-level Theory of Social Change in Organizations. An
Academy of Management Review, 16: 691-71.
Aguilera, R.V., Rupp, D.E., Williams, C.A., & Ganapathi, J. (2007). Putting the S back in
corporate social responsibility: A multilevel theory of social change in
organizations. Academy of Management Review, 32(3), 836-863.
Ahmed, K. & Henry, D. (2012) Accounting Conservatism and voluntary corporate
governance mechanisms by Australian firms. Accounting & amp; Finance, 52(3).
Akindele, R.I. & Nassan M.R. (1997) Research Methodology: An introduction Nigeria
Angelic Publisher Limited, Lagos.
Alchian, A.A. & Demsetz, H. (1972) Agency problems and the theory of the firm. EF
Fama Journal of Political economy. 1980 journals.uchicago.edu.
Alexandri, M.B. & Anjani, W.K. (2014) Income Smoothing: Impact Factors, Evidence in
Indonesia. International Journal of Small Business and Entrepreneurship
Research, 3(1): 21-27.
Allen, M. (2017) Content Analysis: Advantages and Disadvantages. The SAGE
Encyclopedia of Communication Research methods.
https://olx.doi.org/10.4135/978148331411.n90.
Al-Tuwaijri, S.A. Christensen, T.D. & Hughes, K. (2004). Environmental Disclosure,
Environmental Performance & Economic Performance: A Simultaneous Equation
Approach. Accounting Organization and Society, 29(5-6)447-471.
Amole, B.B., Adebiyi, S.O., & Awolaja, A.M., (2012), Corporate social responsibility and
profitability in Nigeria banks: A causal relationship. Research journal of finance
and accounting, 3(1), pp 6-17.
Ancrum, R., (2006). The principal’s principles. Financial Management: 57-58.
Anderson, J. C., & Frankle, A. W. (1980). Voluntary social reporting: An iso-beta
portfolio analysis. The Accounting Review, 55(3), 467-479.
Anderson, R.C., Mansi, S.A. & Reeb, D.M. (2004) Board Characteristics, Accounting
Report Integrity, and the Cost of Debt. Journal of Accounting and Economics,
37(2): 315 – 342.
Ang, R. (2001) Buku Pintar Pasar Modal Indonesia. Media Soft Indonesia.
Anheier, H.K. & Leat, D. (2006). Creative Philanthropy. London: Routledge.

143
Anwar S. (2005) Regional Economic Growth: An Evaluation of the Northern Territory.
Economic papers: A Journal of applied economics and policy, 24(3).
Archer, D. (2005) Indigenous employment and labour shortages in mining. Proceedings of
the Minerals Council of Australia sustainable development conference, Alice
Springs: 31 October – 4 November 2005. Accessed 6 August 2020 from
http://www.minerals.org.au/_data/assets/pdf_file/10937/Archer_Daniel_9B2.pdf
Archic, B.C. (1991) The pyramid of Corporate Social Responsibility: Towards the Moral
Management of Organizational Stakeholders. Business Horizons, August, 2009.
Arellano, M., & Bond, S. (1991) Some tests of specification for panel data: Monte Carlo
evidence and an application to employment equations. Review of Economic Studies
58: 277–297.
Ashari, N., Koh, H.C., Tan, S.L. & Wong, W.H. (1994) Factor affecting income
smoothing among listed companies in Singapore. Accounting and Business
Research, 24(96): 291-301. Retrieved on 28th June 2017 from
http://www.dx.doi.org/10.1080/00014788.1994/9729488.
Asika, A. (2004) Research Methodology & Design, Alfred Books Ltd, Nsukka.
Aupperle, K., Carrol, A., & Hatfield, J. (1985) An empirical examination of the
relationship between corporate social responsibility and profitability. Academy of
Management Journal, 28(2): 446 – 463.
Australian Government & MCA (Minerals Council of Australia) (2006) Regional
partnership newsletter. Issue 1. Accessed 6 August 2020 from
http://www.minerals.org.ua/_data/assets/pdf_file/11515/Regional_Partnrships_Mar
ch2006.pdf
Azhar, A.K.M., Osman, S.I.W., & Parinduri, R.A. (2009) On Capital Market Ratios and
Stock Valuation. A Geometric Approach online. Available on
http://papers.ssrn.com/sol3/papers.cfm?abstract_id=1460594. On 29 of July, 2017.
Babalola, Y.A., (2012), the impact of corporate social responsibility on firms’ profitability
in Nigeria. European Journal of Economics, Finance and administrative sciences,
45, 39-50.
Bacchetti, L. & Ciciretti, R. (2006) Corporate Social Responsibility and Stock Market
Performance. Centre for International Studies on Economic Growth: (CEIS) for
Vergata Research Papers, Working Paper No. 79.
Backman, .J. (1975). Corporate Social responsibility and accountability. NY University
Press, NY.
Baker, M. (2004). Corporate Social Responsibility — what does it mean? Retrieved, 12th
Oct.2015 from http://www.mallenbaker.net/csr/CSRfiles/definition.html.

144
Banyte, J., Brazioniene, L., & Gadeikiene, A. (2010) Expression of Green Marketing
Developing the Conception of Corporate Social Responsibility. Inzinerine
Ekonomika-Engineering Economics, 21(5), 550 – 560.
Baridam, D.M. (1999). Research Methods in Administrative Sciences. Sherbrook
Associates, Port Harcourt.
Barnett, M.L., (2007). Stakeholder influence capacity and the variability of financial
returns to corporate social responsibility. Academy of Management Review, 32(3),
794-816.
Barney, J.B. (1991) Firm Resources and Sustainable Competitive Advantage. Journal of
Management, 17: 99 – 120. References – Scientific Research Publishing.
Baron, D.P. (2001) Private Politics, Corporate Social Responsibility and integrated
strategy. Journal of Economics and Management Strategy, 10:7-45 – References –
Scientific Research Publications.
Barton, J.H. (2007) New trends in technology transfer: Implications for national and
international policy, Issue Paper No. 18. Geneva: International Centre for Trade
and Sustainable Development (ICTSD).
BDO (2014) IFRS at a glance: IAS33 – earnings per share. Retrieved from
https://bdointernational.com/services/Audit/IFRS/IFRS%20at%20Glance/Docume
nts/IAS%2033.pdf
Beaver, W., & Morse, D. (1978). What determines price-earnings ratios? Financial
Analysts Journal, 34(4), 65-86.
Benjalux, S. (2006) The empirical study into factors influencing the use of value-based
management tools, https://www.researchgate.net.
Beresford, D. R. (1975) Social responsibility disclosure in 1974 Fortune 500 annual
reports. Ernst and Ernst.
Bertels, S., Papania, L. & Papania, D. (2010) Embedding Sustainability in Organizational
Culture. Network for Business Sustainability. (www.nbs.net/knowledge/culture).
Bessong, K. & Tapang, A (2012), Social Responsibility Cost and Its Influence on the
Profitability of Nigerian Banks: International Journal Of Financial Research,
10(3), 33.
Bichta, C. (2003) CSR industry practices in the context of Greek. SR and Environmental
Management 10, 12 – 24.
Birley, S. & Westhead, P. (1990) Growth and Performance Contrast between type of
Small Firms. Strategic Management Journal 11: 535-557.
145
Black, A., Wright, P. & Davies, J. (2001) In search of shareholder value. 2nd Edition,
London: Pearson.
Bonga, K (2015). Determinants of dividend policy: Evidence from Polish Listed
Company. Procedia Economics and Finance, 23, 437 – 477.
Bonson, E., & Bednarova, M. (2015) CSR reporting practices of Eurozone companies.
Revista De Contabilidad – Spanish Accounting Review, 18(2), 182-193.
Bowen, H.R. (1953). Social Responsibilities of the Businessman. New York: Harper &
Row.
Bowen, W.F. (2000) On the measurement of corporate social responsibility: Self-reported
disclosures as a method of measuring corporate social involvement. Academy of
Management Journal, 22(3): 501-515.
Bowman, E.H., & Haire, M. (1975). A strategic posture toward corporate social
responsibility. California Management Review, 18(2), 49-58.
Bragdon, J. & Martin, J. (1972) Is Pollution Profitable? Risk Management, 19, 9 – 18 cited
by Curkovic, S. and Sroufe, R. (2016) A literature Review of Taxonomy of
Environmentally Responsible Manufacturing. American Journal of Industrial and
Business Management, 6(3).
Bragdon, J.H., & Marlin, J.A.T. (1972). Is pollution profitable? Risk Management, 19(4),
9-18.
Brammer, S. & Pavelin, S. (2006) Factors influencing the quality of corporate
environmental disclosure. Business strategy and the environment – Wiley Online
Library, 17(1): 16 – 29.
Brammer, S. & Pavelin,S. (2008) Factors influencing the quality of corporate
environmental disclosure. Business Strategy and the Environment, 17(2), 120-136.
Branco M.C. & Rodrigues L.L. (2006) Communication of Corporate Social Responsibility
by Portuguese Banks A Legitimacy Theory Perspective. Corporate
Communications: An International Journal, 11:232-248.
Branco, J., & Rodrigues F (2006) Influence of the economic and social systems on
corporate social ranking.” mimeo, University of Toulouse.
Breitbarth, T., Harris, P. & Insch, A. (2010) Pictures at an Exhibition Reflections on a
Typology of images used in the construction of corporate social responsibility and
sustainability in Non-Financial Corporate Reporting. Journal of Public Affairs, 10:
238 – 257.
Brenchley, F. (2006) Land council looks at nuclear waste deal. Australian financial
review, 10.

146
Brigham, E.F. & Ehrhardt, MC. (2007) Financial Management: Revised Custom Edition.
Belmont, CA: Cengage Learning.
Brigham, E.F. & Houston, J.F. (2005) Managemen Keuangan, Edisi Kesepululp, buku
Satu, (Terjemahan Ali Akbar Yulianto). Erlangga: Jakarta.
Brigham, E.F., & Houston, J.F. (2001) Financial Management, Translation by Erlangga
Publishing Team. Eight Edition, II Book. Erlangga Publishing, Jakarta.
Broome, R. (1982) Aboriginal Australians: A History Since 1788. George Allen & Unwin,
Sydney.
Buhr, N. (2002). A structuration view on the initiation of environmental reports. Critical
Perspectives on Accounting, 13, 17-38.
Bushman, R.M., Piotroski, J.B. & Smith, A.J. (2004) What Determines Corporate
Transparency? Journal of Accounting Research, 42(2).
Business for Social Responsibility, BSR (2004); www.bsr.org, (Accessed on Oct., 2015)
Caldwell, C., Hayes, L.A., Karri, R., & Bernal, P. (2008) Ethical stewardship implications
for leadership and trust. Journal of Business Ethics, 78, 153 – 164.
Campbell, D.J. (2007). Legitimacy theory or managerial reality construction. Corporate
social Disclosure in marks and spender Plc Reports (1990 — 1997). Accounting
Forum, 2: 79-103.
Campbell, D. (2004) A longitudinal and cross-sectional analysis of environmental
disclosure in UK companies – a research note. Br. Account Rev. 36: 107 – 117.
Campbell, J.Y. (2003) Equity volatility and Corporate Bond yields. The Journal of
Finance – Wiley Online Library.
Capozzi, C. (2010). What is Stock Performance? Retrieved on 20th June, 2017 from
https://www.sapling.com, stock performance.
Carrol, A.B. (2000) A commentary and an overview of Key Questions on corporate Social
performance measurement. SAGE Journals – Sage Publications.
Journals.sagepub.com Business Ethics Quarterly 10(1), 33- 42.
Carroll, .A. & Shabana, .K.M. (2010). The business case of corporate social responsibility:
A review of concepts, research and practice. International Journal of Management
Reviews. Blackwell Publishing Ltd and British Academy of Management, 85-105.
Carroll, .A.B., (1999). Corporate social responsibility: Evolution of definitional construct .
Business and Society, 38(3), 268-295.
Carroll, A.B (1991), “The Pyramid of Corporate Social Responsibility: Towards the Moral
Management of Organisational Stakeholders, Journal of Business Horizons, 34(4).

147
Carroll, A.B. (1991) The Pyramid of Corporate Social Responsibility: Toward the Moral
Management of Organizational Stakeholders. ResearchGate. Business Horizons,
34(4): 39 – 48. References – Scientific Publications. American Journal of
Industrial and Business Management, Vol 5, No. 8.
Cetin-Dammar, H. (2007) Special Issue: Business Ethics in a Global Economy. He UN
Global Compact. Business Ethics Quarterly 14: 755 – 774.
Chang, H., Su, C., Chen, Y. & Chang, Y. (2008) The relationship between stock price and
EPS: evidene based on Taiwan Panel Data. Economics Bulletin, 3(30), 1-12.
Chen, D. (2011) Knowledge evolution strategies and organizational performance: A
strategic fit analysis Electronic Commerce Research and Applications 10(1): 75-
84.
Chen, K., Babb, E.M. & Schrader, L.F. (1985) Growth of Large Cooperative and
Proprietary Firms in the US Food Sector. Agribusiness, 1:201.
Chisholm, A.M. (2009) An introduction to international capital markets. West Sussex:
John Wiley & Sons, 2:428.
Chiutsi, S., Mukoroverwa, M., Karigambe, P., & Mudzengi, B.K. (2011) The theory and
practice of ecotourism in Southern Africa. Journal of Hospitality Management and
Tourism, 2(2), 14 – 21.
Cho, C.H., Michelon, G., & Patten, D.M. (2012) Impression management in sustainability
reports: an empirical investigation of the use of graphs. Accounting and the Public
Interest, 12, 16-37.
Cho, C.H., Patten, D.M. & Roberts, R.W. (2011). Corporate Environmental Financial
Reporting and Financial Markets. In P. Bandal, & A.J. Hoffman (Eds), The Oxford
Handbook of Business and the Natural Environment (pp 519-536). Oxford: Oxford
University Press.
Cho, S., Lee, C. & Park, C.K., (2012). Measuring corporate social responsibility. CPA
Journal, 82(6), 54-60.
Clarkson, M.B.E. (1995) A Stakeholder Framework for Analyzing and Evaluating
Corporate Social Performance. Academy of Management Review, 20(1): 92 – 117.
Cochran, P.L. (1984) Corporate Social Responsibility and Financial Performance.
Academy of Management Journal, 27(1): 42 – 56.
Cochran, P.L., & Wood, R.A. (1984). Corporate social responsibility and financial
performance. Academy of Management Journal, 27(1), 42-56.
Coffie, W., Aboagye-Otchere, F. & Musah, A. (2018) Corporate Social Responsibility
disclosures (CSRD) Corporate Governance and the degree of multinational
activities. Journal of Accounting in Emerging Economies, 8(1), 106 – 123.

148
Cohen, L., Naion, L., & Morison, K. (2000) Research methods in Education, Routledge
Falmer: London.
Colbert, B.A. & Kurucz, E.C. (2007). Three Conceptions of Triple Bottom Line Business
Sustainability and the Role for HRM. Human Resource Planning, 30(1), 21-29.
Collguit J. (2001). The Dimensionality of Organizational Justice: A Construct Validation
of a Measure. Journal of Applied Psychology, 186:425-445.
Community Glossary (2009) Available at
http://www.findmehere.com/search/dictionary/c_index.htm#com. Accessed on 12
August 2019.
Copeland, T.E. Koller, T. & Murrin, J. (1996) Valuation: measuring and managing the
value of companies. 2nd Edition. New York: Wiley & Sons.
Cormier, D. & Magnan M. (2014) The impact of social responsibility disclosure and
governance on financial analysts’ information environment, Corporate
Governance, 14(4): 467 – 484.
Council of Economic Priorities (1971). Economic priorities report, 1(6), 13-23.
Cowen, S.S. (1987) The impact of Corporate Characteristics on social responsibility
disclosure: A typology and frequency-based analysis – ScienceDirect –
ScienceDirect.com. https://www.sciencedirect.com>pii.
Cramer, D. & Howitt, D.L. (2004) The SAGE Dictionary of Statistics. London: SAGE.
Crane, A. & Matten, D. (2004) Corporate Social Responsibility/SpringerLink, The Aspen
Institute and the World Resource Institute, Business Ethics, 54: 323,
https://doc.org/10.1007/S10551-004-1822-0.
CSR@Intel (2009). Does Technology have a role in Community Development? Available
at: http://blogs.intel.com/csr/2007/06, accessed on 12 August, 2019.
Curley, A.I., & Bear, R.M. (1979) Investment analysis and management. New York:
Harper.
Dabor, E.L. (2008). Business Accounting, Dan Diamond Publisher, Edo State, 672-673.
Dada, F.B., Malomo, E., & Ojediran, S. (2015). Critical evaluation of the determinants of
dividend policy of banking sector in Nigeria. International Journal of Economics
Commerce and Management, 3(2), 1-11.
Dahlsrud, A. (2008) How Corporate Social Responsibility is Defined: An Analysis of 37
Definitions. Corporate Social Responsibility and Environmental Management, 15:
1- 13.
149
Dammon, R. & Senbet, L. (1988) The Effect of Taxes and depreciation on Corporate
Investment and Financial Leverage. American Economic Review 85(3): 357-373.
David, C. & Guler, A. (2008). Corporate Social Responsibility. Retrieved from Diamond
Bank Plc CSR Framework Retrieved from:
http://diamondbank.com/index.php/component/ content/article/2-uncategorised/5
09-focus-. /areas on 4/7/2015.
Davis, J., Schoorman, F., & Donaldson, L. (1997). Toward a stewardship theory of
management. Academy of Management. The Academy of Management Review.
22(1), 20-47.
Decker, .O.S., (2004). Corporate social responsibility and structural change in financial
services. Managerial Auditing Journal, 19(6), 712-728.
Dentchev, N. (2004). “Corporate Social Performance as a Business Strategy: Journal of
Business Ethics, 55(4): 397-412. Retrieved, 16th Oct. 2015 from
ttp;//www.eurojournals.com/EJEFAS. html.
DEWR (Department of Employment and Workplace Relations (2005a) Corporate leaders
for Indigenous employment project: Guidebook to success. Accessed 6 August
2020 from http://www.workplace.gov.au/
DITR (Department of Industry, Tourism and Resources) (2005) Indigenous partnerships
program. Accessed 6 August 2020 from
www.industry.gov/au/indigenouspartnerships/
Donaldson, T., & Preston, L.E., (1995). The stakeholders theory of the corporation:
Concepts, evidence and implications. Academy of Management Review, 20(1), 65-
91.
Drumwright, M. (2002) Social Responsible Organizational Buying: Environmental
Concern as a Non-Economic Buying Criterion, Journal of Marketing 58:1-19.
Dubbink, W., Liedekerke, L.V., & Graafland, J.J. (2008) CSR, Transparency and the Role
of Intermediate Organizations. Journal of Business Ethics 82(2): 391 – 406.
Dunn, J. (2010) Financial reporting and analysis. West Sussex, England: Wiley.
Ehioghiren, E.E. & Eneh, O. (2019) Corporate Social Responsibility Accounting Of Banks
and Insurance Companies in Nigeria (2007-2016). International Journal of
Academic Management Science Research (IJAMSR), 3(6), 13-26.
Elder, B. (2003) Blood on the wattle: Massacres and maltreatment of Australian
Aborigines since 1788. Sydney: New Holland.
El Mosaid, F. & Boutti, R. (2012). Relationship between Corporate Social Responsibility
and Financial Performance in Islamic Banking Research, Journal of Finance and
Accounting. 3(10), 93-103.

150
Eng, L.L. & Mak, Y.T. (2003). Corporate Governance and Voluntary Disclosure. Journal
of Accounting and Public Policy, 22(4), 3 25-345.
Erhirhie, F.E. & Ekwueme, C.M. (2019) Corporate Social Sustainability Reporting and
Financial Performance of Oil and Gas Industry in Nigeria. International Journal of
Accounting, Finance and Risk Management, 4(2): 44-60.
EU Commission (2001) Green paper — promoting a European framework for corporate
social responsibility. Retrieved from http//.ssrn.com 2nd April 2014.
European Union (2002), http://europa.eu.int/comm/employmentsocial/socdial/csr2002,
(Accessed 15th Oct., 2015)
Evan, W.M. & Freeman, R.E. (1988) A Stakeholder Theory of the modern corporation:
Kantian Capitalism/Monash University – Reading Lists, 97 – 106.
http://images.lib.monash.edu.au/mgc 1020/014131.
Fama, F. (1970) Efficient Capital Markets: A Reviw of Theory and Empirical Work. The
Journal of Finance, 25(2). Papers and Proceedings of the Twenty-Eight Annual
Meeting of the American Finance Association, New York, N.Y., 383-417.
Federation of Community Development Learning (2009) Available at
http://www.fcdl.org.uk/about/defintion.htm accessed on 12 August, 2019.
Ferrel, O.C., & Maignan, I. (2004) Corporate Social Responsibility and Marketing: An
integrative framework. Journal of the Academy of Marketing Science, 32(1), 3 –
19.
Ferrell, O.C., Fraedrich, J., & Ferrel, L. (2015). Business ethics: ethical decision making &
cases (10th ed.). Cengage Learning.
Ferrero, J.M., Garcia-Sanchez, I.M., & Cuadrado-Ballesteros, B. (2013). Effect of
financial reporting quality on sustainability information disclosure. Corporate
Social Responsibility and Environmental Management, http://dx.doi.org/10.
1002/crs.1330.
Filbeck, G. & Gorman, R. (2004) The Relationship between the Environmental and
Financial performance of public utilities. SpringerLink – Econpapers,
Environmental & Resource Economics, 29: 137 – 157.
Finegan, P.T. (1991) Maximizing shareholder value at the private company. Journal of
Applied Corporate Finance, 4(1): 30-45.
Fiori, G., di Donato, F., & Izzo, M.F. (2015) Corporate social responsibility and stock
prices: A study on the Italian market. Corporate Ownership & Control, 12(2-6),
600-609. http://doi.org/10.22495/cocv12i2c6p3
151
Folger, H.R., & Nutt, F. (1975) A note on social responsibility and stock valuation.
Academy of Management Journal, 18, 155-159.
Fortune, P. (1998) A primer on U.S stock price indices. New England Economic Review.
Federal Reserve Bank of Boston, Issue Nov., 25-40.
Fowler, B. (2005) Employing local locals: The Tanami approach to increasing indigenous
employment. Proceedings of the Minerals Council of Australia sustainable
development conference, Alice Springs: 31 October – 4 November 2005. Accessed
6 August 2020 from
http://www.minerals.org.au/_data/asets/pdf_file/10215/Fowler_Brain10B1.pdf
Fortanier, F. & Kolk, A., (2007). On the economic dimensions of corporate social
responsibility: Exploring fortune global 250 reports. Business & Society, 46(4),
457-478.
Frazer, L & Lawley, M. (2000) questionnaire Design and Administration: A practical
guide. Chichester: United Kingdom.
Frederick, W.C. (1986) Conceptions of Corporate Social Responsibility the nature of
managerial capture. https://pdfs.semanticscholar.org
Freeman, .R.E (1984). Strategic Management – A stakeholder approach. Cambridge
Cambridge University Press.
Freeman, R.E. & Reed, D.L. (1983) Stockholders and Stakeholders: A new perspective on
Corporate Governance. SAGE Journals.
https://journals.sagepub.com/doi/10.2307/41165018.
Freeman, R.E., & Reed, D.L., (1994). Stockholders and stakeholders: A new perspective
on corporate governance. California Management Review, 25(3), 88-106.
Freundlieb, M. & Teuteberg, F., (2013). Corporate social responsibility reporting--A
transnational analysis of online corporate social responsibility reports by market-
listed companies: Contents and their evolution. International Journal of Innovation
and Sustainable Development, 7(1), 1-26.
Friedman, M., (1970). The social responsibility of business is to increase its profits The
New York Times Magazine, 173-178.
http://www.colorado.edu/studentgroups/libertarians/issues/friedman-soc-resp-
business.html
Galaskiewicz, J. (1991). Making corporate actors accountable: Institution-building In
Minneapolis-St. Paul. In W. W. Powell & P.J. DiMaggio (Eds). The new
institutionalism in organization analysis. Chicago: University of Chicago Press:
2.94-311.
Gallardo-Vázquez, D., Barroso-Méndez, M.J., Pajuelo-Moreno, M.L. & Sánchez-Meca, J.
(2019) Corporate Social Responsibility Disclosure and Performance: A Meta-
Analytic Approach. www.mdpi.com/journal/sustainability. Retrieved on 20
February 2019.

152
Gary, J., Inderjit S. & Dilip, R. (1995) Profitability and capital productivity in Chinese
industry (English), Research Paper Series (RPS), CH-PRS 34. China Series
Washington, D.C: The World Bank.
Geczy, C., Stambaugh, R.F., & Levin, D. (2005) Investing in Socially Responsible Mutual
Funds. SSRN Electronic Journal, 1 – 47 – References – Scientific Research
Publishing.
Geetika, A. & Shukla, V. (2017). The relationship between corporate social responsibility
and financial performance in Indian Banks. IUP Journal of Corporate
Governance, 16(2), 39-53.
Gelb, D.S. & Strawser, J.A. (2001) Corporate Social Responsibility Disclosures: An
Alternative Explanation for increased Disclosure/SpringerLink, Journal of
Business Ethics, 33; In http://doi.org/10.1023/A:101194212444.
Genest, C.M. (2005) Cultures, Organizations and Philanthropy. Corporate
Communication: An International Journal, 10(2), 315-327.
Gientzotis, J. and Welch A. (1997) Something to show for years of work? Employment,
education and training for Aboriginal people in Australia. The Journal of
Indigenous studies, 3(2), 1-26.
Gillham, B. (2000) Case Study Research Methods: Continuum, London – References-
Scientific Research publishing.
Gololo, I.A. (2019) Corporate Social Responsibility Disclosure and Financial Performance
of Quoted Nigerian Cement Companies. International Business and Accounting
Research Journal, 3(2), 89-106.
Goodijk, R. (2003) Corporate Governance and Stakeholder management: The ING-case.
Corporate ownership and control, 1(1): 149 – 155.
Gosh, S. (2010). Creative Accounting: A Fraudulent Practice Leading to Corporate
Collapse. Research and Practice in Social Sciences, 6(1): 1-15.
Gottwald, R. (2011) The Dependence between Stock Price and Intrinsic Value of a Stock.
Journal of
Goulboume, T. (2003) Corporate Social Responsibility: the business case risk analysis and
conflict impact assessment tools for multinational companies. Brisbane University
Press, Australia.
Gray, R., & Herremans, I.M. (2011). Sustainability and social responsibility reporting and
the emergence of the external social audits: the struggle for accountability? In P.
Banal, & Hoffman A.J. (Eds), The Oxford Handbook of Business and the Natural
Environment (pp 519-536). Oxford: Oxford University Press.
153
Gray, R., Javad, M., Power, D.M., & Sinclair, C.D. (2001) Socil and Environmental
Disclosure and Corporate Characteristics: A Research Note and Extension. Journal
of Business Finance & Accounting, 28(3 and 4): 327-356.
Gray, R., Owen, D. & Adams, T. (1996). Accounting and Accountability Changes and
Challenges in Corporate Social and Environmental Reporting Prentice Hall
Europe, Hemel Hempstead.
Griffin, J.J. & Mahon, J.F. (1997) The Corporate Social performance and Corporate
Finance performance Debate: Twenty-five years of incomparable Research
Business and Society 36(5): 5 – 31.
Gujarati, D.N. (2003) Basic Econometrics, 4th Edition, McGraw Hill, New York.
Habisch, A., & Janker, M. (2005) Corporate Social Responsibility Across Europe,
https://www.springer.com>book.
Hackston, D., & Mime, M. J. (1996) Some determinants of social and environmental
disclosures in New Zealand companies. Accounting, Auditing & Accountability
Journal, 9(1), 77-108.
Hall, J. & Driver, M. (2002) Queensland support for training and employment through the
Gulf Communities Agreement and Century mine. Queensland Department of
Employment and Training, Townsville.
Handerson, .D., (2001). Misguided virtue. False notions of corporate social responsibility:
London. The Institute of Economic Affairs Available online,
http://www.globalreporting.org.accessed.
Harward, B.B. & Upton, M. (1961) Introduction to Business Finance. New York:
McGrow Hill.
Hazrati, F.D., Eskandari, A., Majlesi, A., & Gholami, M. (2015) Investigation of Political
Costs’ Effects on Earning Management in Accepted firms in Tehran’s Stock
Exchange. Research Journal of Recent Sciences, 4(6): 1- 6.
Heal, G. (2009) Corporate Social Responsibility: An Economic and Financial Framework.
Columbia Business School; National Bureau of Economic Research (NBER).
Heinze, D.C. (1976) Financial correlates of a social involvement measure. Akron Business
and Economic Review, 7(1), 48-51.
Hill, C.W.L. & Jones, T.M. (1992) Stakeholder – Agency Theory. Journal of Management
Studies, 29, 131 – 154 – References-Scientific Research Publishing.
Ho, S.S., & Wong, K.S. (2001) A Study of the relationship between Corporate
Governance structure and the Extent of Voluntary Disclosure. Journal of
International Accounting, Auditing and Taxation, 10: 139 – 156.

154
Holcombe, S. (2004) Early indigenous engagement with mining in the Pilbara: Lessons
from a historical perspective. CAEPR working paper no.24. Canberra: Centre for
Aboriginal Economic Policy Research. Accessed 6 August 2020 from
http://www.anu.edu.au/caepr/Publications/WP/CAEPRWP24.pdf
Homgren, .C.T, Harrison, .W.T., & Oliver .M.S., (2009). Accounting Upper Saddle River,
NJ, Pearson.
Hope, O.K. (2003) Accounting Policy Disclosures and Analysts’ Forecasts. Contemporary
Accounting Research – Wiley Online Library.
Hopkins, M. (2003) The plenary Bargain: Corporate Social Responsibility Matters.
Business and Economics Earths can Amazon.com
Hult, T., Griffith, D.A., Ketchen, D.J., & Chabowski, B. (2007) An Assessment of the
Measurement of performance in International Business Research. Journal of
International Business Studies, 39(6): 1064 – 1080.
Ibrahim, B.W. (2003). An alternative approach to effective pollution control in Nigeria.
Ilorin: Rasjet Publishers.
Ibrahim, M. & Hamid, K.T. (2019) Corporate Social Responsibility and Financial
Performance of Listed Non-Financial Services Companies in Nigeria. American
Journal of Business and Society, 4(2), 56-71.
Idemudia, U. (2014). Corporate social responsibility and development in Africa: Issues
and Possibilities, Wiley Online Library, Geography Compass 8(7) 421-435,
https://doi.org/10.111/gec3.12143
IFRS (2014) A guide through IFRS: Part A2. United Kingdom: IFRS Foundation
Publications.
Ilaboya, O.J. & Christian, J. (2014). Corporate Governance and Audit Report Lag in
Nigeria. International Journal of Humanities and Social Science, 4(13): 172-180.
IMETF (Indigenous Mining and Enterprise Task Force) (2003) Indigenous Mining and
Enterprises Task Force 2002/03 Annual Report. Department of Business, Inustry
and Resource Development, Darwin.
Ingram, R.W. & Frazier, K.B. (2000) Environmental performance and corporate
disclosure. Journal of Accounting Research, 18(2): 614 – 622.
Ingram, R.W. (1978) An investigation of the information content of (certain) social
responsibility disclosures. Journal of Accounting Research, 16, 270-285.
Interdisciplinary Research, 1(1): 38-40.
Investopedia (2018) Philanthropy. Available at https://www.investopedia.com accessed on
12 August, 2019.
155
Investopedia (2019) Leverage. Available at https://www.investopedia.com accessed on 23
November, 2019.
Iqbal, N. (2017) The Corporate Social Responsibility and Firms’ Financial Performance:
Evidence from Financial Sector of Pakistan. International Journal of Economics
and Financial Issue, 7(2), 301-308.
Iqbal, N., Ahmad, N. Basheer, N., & Nadeem, M. (2012) Impact of Corporate Social
Responsibility on Financial Performance of Corporations: Evidence from Pakistan.
International Journal of Learning and Development, 2(6).
Iqbal, N., Ahmad, N., Basheer, N.A., & Nadeem, M., (2012), Impact of corporate social
responsibility on financial performance of corporations: Evidence from Pakistan.
International journal of learning and development, 2(6), 107-118 Margarita
(2004).
Irawan (2011), Pengaruh Rasio Keuangan Terhadap Pertumbuhan Laba Pada Perusahaan
Asuransi yang terdaftar di Bursa Efek Indonesia selama tahun 2007-2011.
Isa, M.A. & Madaki, J. (2017) Corporate Social Responsibility Disclosure and the
Financial Performance of Listed Consumer Goods Companies in Nigeria.
International Journal of Research in Management, Economics and Commerce,
ISSN2250-057X, Impact Factor: 6.384, 7(9), 90-99.
Ismail, A. & Ibrahim, H (2009) Social and Environmental Disclosure in the Annual
Reports of Jordanian Companies. ResearchGate, 2(2): 198 – 210.
Ismail, M. (2009) Corporate social responsibility and its role in community development:
An International Perspective. The Journal of International Social Research, 2:9.
Jackson, P. & Hawker, B. (2001) Defining Corporate Social Responsibility and
understanding its effects – UK Essays.
https://www.ukessays.com/essays/management.
Jacob, C.J. (2012). The impact of financial crisis on corporate social responsibility and its
implications for reputation risk management. Journal of Management and
Sustainability, 2(2), 259-275.
Jansson, J. (2010) Green consumer behaviour: deeterminants of curtailment and eco-
innovation adoption. Journal of Consumer Marketing, 27(4), 358 – 370.
Jayeola, O., Agbatogun, T.O. & Akinrinlola, T.O. (2017) Audit Quality and Earnings
Management among Nigerian Listed Deposit Money Banks. International Journal
of Accounting Research, 5(2): 159-164.
Jensen, M.C. (2001) Value maximization, stakeholder Theory, and the Corporate
Objective Function. Journal of Applied Corporate Finance – Wiley Online
Library, European Financial Management, 7(3), 297 – 317.
156
Joe, D. & Kechi, .K. (2013). Implications of Corporate Responsibility for the Performance
of Nigeria Firms. Journal of Advances in Management & Applied Economics, 3,
73-87.
Jones, P. & Comfort D. (2005) Corporate Social Responsibility: A Case Study of the UKs
leading food retailers. British Food Journal. 107(6): 423-435.
Jones, C. (2004) Investment analysis and management. John Willey and Sons. New York.
Joyner, B.E. & Payne, D. (2002) Evolution and Implementation: A study of values,
Business Ethics, and Corporate Social responsibility. Journal of Business Ethics
41(4): 297 – 311.
Kakakhel, S.J., Ilyas, M., Iqbal, J., & Afeef, M. (2012) Impact of Corporate Social
Responsibility on Financial Performance: Evidenec from Pakistan’s Cement
Industry. Abasyn Journal of Social Sciences, 8(2).
Kamal, N. & Yousef, H. (2013) Determinants of Corporate Social Responsibility
Reporting: Evidence from an Emerging Economy. Journal of Contemporary Issues
in Business Research, 2(3), 56-74.
Kaplan, R.S. & Norton, D.P. (1996) Translating strategy into action: the balanced
scorecard. Boston: Harvard Business School.
Karns, G. (2011) Stewardship: A new vision for the purpose of business. Corporate
Governance. 11(4), 337-347.
Keffas, G. & Olulu-Briggs, O.V. (2011) Corporate Social Responsibility: How does it
affect the Financial Performance of Banks? Empirical Evidence from US, UK and
Japan. Journal of Management and Corporate Governance, 3, 8-26.
Kennon, J. (2014) Basic vs diluted earnings per share: analyzing an income statement.
Retrived from
http://www.beginnersinvest.about.com/od/incomestatementanalysis/a/basic-eps-
dilutes-eps.html
Kerlinger, F.N. (1970). Foundation of Behavioral Research. New York: Holt, Rinehart
and Winston.
Khaled, H., Mohamed, B. & Marwa, A. R. (2011). Factors Affecting Corporate Social
Responsibility Disclosure in Egypt. School of Commerce and Law Publication, 1-
27.
Kidd, R. (2003) The biggest broker of them all: The State of Queensland and Aboriginal
labour. Paper presened at the National labour history conference. Brisbane.
Accessed 6 August 2020 from
http://www.linksdisk.com/roskidd/site/Speech25.htm

157
King, A.A. & Lenox, M.J. (2001) Lean and Green? An empirical examination of the
relationship between lean production and environmental performance. Journal of
Industrial Ecology, 22(6): 1413 – 1424.
Klimek, J. (2014). Etyka biznesu. Teoretyczne zalozenia, praktyka zastosowan, Difin, 282.
Klynveld Peat Marwick Goerdeler (KPMG) (2011). KPMG International Survey of
Corporate Responsibility Reporting. KPMG International Cooperative.
Konar, S. & Cohen, M.A. (2001) Does the market value Environmental performance.
Review of Economics and Statistics, 83(2): 281 – 289.
Koppeschaar, Z.R., Sturdy, J., Du Toit, E., Deysel, D.J., Rossouw, J., Van Wyk, H.A.,
Gaie-Booysen, F.F., Papageorgiou, K., Smith, C. & Van der Merwe, C.M. (2013)
Descriptive accounting: IFRS focus. (18th ed.). Van Schaik, Pretoria.
Krippendorff, K. (1980) Content Analysis: An Introduction to is methodology. London
Sage – References-Scientific Research publishing.
Kyereboah-Coleman, A. (2007) Corporate Governance and shareholder value
maximization: An African perspective. African Development Review – Wiley
Online Library.
Lantos, G. (2001) The Boundaries of Strategic Corporate Social Responsibility. Stonehill
College Publication, MA.
Laura, P. & Sergio, V. (2009) Does Corporate Social Responsibility affect the
performance of firms? FEEM Working Paper No. 52: 1- 47. SSRN:
https://ssrn.com/abstract=1444333 or http://dx.doi.org/10.2139/ssrn.1444333.
Laurinavicius, A. & Romeris, K.M. (2013). Industry, Science and Policy Makers for
Sustainable Future, 21(23) 57-69.
Lawrence, A.T., & Webber, J. (2014) Business and Society: Stakeholders, Ethics, Public
Policy (14 ed.). McGraw-Hill, New York.
Lemus, E. (2016). The Importance of CSR in Financial Reporting Standards. Global
Journal of Management and Business Research in Accounting and Auditing, Vol.
16 Issue 2, version 1.0, 25-32.
Lenegan, C. (2005) The minerals sector & indigenous relations. Address to Minerals
Week 2005: Resourcing an innovative industry. Canberra: 30 May – 3 June 2005.
Accessed 6 August 2020 from
http://www.minerals.org.au/_data/assets/pdf_fil/9062/LeneganCharlie.pdf
Leonard, D. & McAdam, R. (2003). Corporate Social Responsibility (Electronic version).
Quality Progress. Retrieved November 13, 2009 from www.asg.org.

158
Lipunga, A. M. (2013). Corporate Social Responsibility Reporting by Commercial Banks
in Annual Reports: Evidence from Malawi. University of Malawi publications, 88-
101.
Lord, H.G. (1973) Ex-post facto studies as a Research Method. Special Report #7320.
Loughran, T. & Schultz, P. (2005). Liquidity: Urban Versus Rural Firms. Journal of
Financial Economics, 78(2), 34 1-374.
Loza, J. (2004) Business-Community Partnerships: The case for community organization
capacity building. Journal of Business Ethics Vol. 53(3), 297 – 311.
Luce, R.A., Barber, A.E. & Hillman, A.J. (2001) Corporate Social Responsibility and
Marketing: An Integrative Framework/SpringerLink. Journal of Academy of
Marketing Science 32(1): 3- 19.
Lyon, T.P. & Maxwell, J.W. (2008) Corporate Social Responsibility and the Environment:
A Theoretical Perspective. Review of Environmental Economics and Policy.
Oxford Academic, 2(2): 240 – 260.
Mackey, A., Mackey T.B. & Barney, J.B. (2007) Corporate Social Responsibility and
Firm: Performance, Investor preferences and Corporate Strategies. Academic of
Management Review. 32(3): 87-835.
Mackey, A., Mackey, T.B. & Barney J.B. (2007) Corporate Social Responsibility and
Firm Performance Investor preferences and corporate strategies. Scientific
Research Publishing, Academy of Management Review, 32: 817 – 835.
Mahbuba, S., & Farzana, N. (2013) on Corporate Social Responsibility and Profitability:
A Case Study on Dutch Bangla Bank Ltd.: International Journal of Business and
Social Research (IJBSR), 3(4).
Mamewijk-Van, M. (2003) Concepts and definitions of CSR and Corporate Sustainability:
Between agency and Communion – Philpapers. Journal of Business Ethics 44(2-3):
95 – 105.
Margolis, J.D., & Walsh, J.P. (2001). People and Profit: The search for a link between a
company’s social and financial performance. Mahwah, N.J.: Lawrence Eribaum
Associates.
Margolis, J.D., Walsh, J.P. & Efenbein, H.A. (2007) Does it pay to be good? A meta-
analysis and redirection of research on the relationship between corporate social
and financial performance. SSRN https://ssrn.com/abstract=1866371 or
https://dx.doi/org/10.2139/ssm.1866371
Mashayekhi, B. (2005) Discreptionary Accruals Roles in Profit Smoothing of Tehran
Stock Exchange Listed Companies. Review of Accounting and Auditing, 12(42):74-
61.

159
Mastron, C.L., & Shrives, P.J. (1991) Disclosure Index Approach in Accounting Research:
A Review of Related issues. Monirul Hossain – Academia. Edu,
https://www.academia.edu
Masud M. & Hossain M.S. (2012) Corporate Social Responsibility Reporting Practices in
Bangladesh: A Study of Selected Private Commercial Banks, IOSR Journal of
Business and Management, 6:42-47.
Mattew, B., Reecca B., & Greg, H., (2007). Corporate social responsibility in the
Austrailian context.
Mauboussin, M.J. (2012). What Your Stock Price Really Means. Harvard Business
Review, Accounting and Finance. Retrieved on 29th June, 2017 from
https://www.hbr.org 2012/11/what-you-st
Maxwell, J.W. & Decker, C.S. (2006) Voluntary Environmental Investment and
Responsive Regulation. SpringerLink. Environ Resource Econ, 33(4): 425 – 439.
May, M.M. (1968) The earnigns per share trap. Financial Analysts Journal, 24(3), 113-
117.
McGuire, J.B., Sundgren, A. & Schneeweis, T. (1988) Corporate Social Responsibility
and firm financial performance. Jstor. The Academy of Management Journal,
31(4): 854 – 872.
McWilliams, A. & Siegel, D. (2001b) Creating and capturing value: Strategic corporate
social responsibility resource-based theory and sustainable competitive advantage.
Journal of Management. DOI: https://doc.org/10.1177/0149260631035696.
McWilliams, A., & Siegel, D., (2000). Corporate social responsibility and financial
performance: Correlation or misspecification? Strategic Management Journal,
21(5), 603.
Mele, D. (2008) Corporate Social Responsibility: Four Theory for a necessary practice.
Oxford University Press. Online document http://insight.lese.edu
Merriman, K. & Gupta, S. (2006) The Effects of CEO pay structure on corporate social
performance. Journal of Management, 32: 329 – 342.
Metalf, R.W. & Titard, P.L. (1976) Principles of Accounting. W.B. Saunders,
Philadelphia.
Milne, M., & Gray, R. (2007). Future prospects for sustainability reporting. In: J.
Unerman, J. Bebbington, & B. O’Dwyer (Eds.) Sustainability accounting and
accountability (pp. 184-207). London: Routledge.
Misztal, A. & Jasiulewicz-Kaczmarek, M. (2014) Environmental issue of corporate social
responsibility, Management, 18(1), 58-70.
160
Mitchell, R.K., Agle, B.R., & Wood, D.J. (1997). Towards a theory of stakeholder
identification and salience: Defining the principle of who and what really counts.
The Academy of Management Review, 22(4), 853-886.
Mkhonza, R.V. (2007) The influences of share buyback shcemes on earnings per share
and profitability of listed companies in South Africa. University of Johannesburg,
South Africa.
Mohammed, A.S. (2012). Corporate Social Responsibility Disclosure in Bangladesh.
Global Journal of Management and Business Research, 12:149 - 150.
Morris, S.A. & Bartkus, B.R. (2015). Look Who’s Talking. Corporate Philanthropy and
Firm Disclosure. International Journal of Business and Social Research 5(1), 1-4
Moskowitz, M. (1972). Choosing socially responsible stocks. Business and Society
Review, 1, 7 1-75.
Moutinho, L., & Southern, G. (2010). Strategic marketing management. Andover,
Hampshire: Cengage Learning.
Mulford, C.W., & Comiskey, E.M. (2011). The Financial Numbers Game: Detecting
Creative Accounting Practices. New York: John Wiley and Sons. Retrieved from
http://sites.google.com.site.mkjuy76. On 25th April, 2017.
Mullins, L. J. (2002). Management and Organisational Behaviour. 6th ed. London: Prentice
Hall.
Munisi, .G., & Randoy, .T., (2013). Corporate governance and company performance
across Sub- Saharan African countries. Journal of Economics and Business, 70,
92-110.
Nachmias, C.F & Nachmias, D. (2009). Research methods in the social sciences, London
Replica Press Ltd.
Ndubuisi, A.N. & Ezechukwu, B.O. (2017) Determinants of Audit Quality: Evidence from
Deposit Money Banks Listed on Nigeria Stock Exchange. International Journal of
Academic Research in Accounting, Finance and Management Sciences, 7(2): 117-
130.
Neilling E., & Webb, E. (2004) Corporate Social Responsibility and financial
performance. The virtuous circle revisited. Global Finance Online,
http://www.springerlink.com
Nemetz, P.N., (2013). Business and the sustainability challenge: An integrated
perspective. New York: Routledge.
Ness-India, & Mirza, H.S. (1991) Corporate Social and Environmental Disclosure: A
positive Accounting Theory view point. International Journal of Business and
Social Science, 3(9): 152 – 164.
161
Nibusinessinfo (2018) Business benefits of Corporate Social Responsibility. Available on
www.nibusinessinfo.co.uk accessed on 12 August 2019.
Nikolaeva, R. & Bicho, M., (2011). The role of institutional and reputational factors in the
voluntary adoption of corporate social responsibility reporting standards. Journal
of the Academy of Marketing Science, 39(1), 136-157.
NikRamli, N.A.R. & Naja, M. (2011) Spill over of Environmental Friendly Behaviour
Phenomenon: The Mediating Effect of Employee Organization Identification.
Malaysia.
NikRamli, N.A.R. (2007) Employee Involvement in EMS/ISO and its Spill Over Effect in
Consumer Environmentally Responsible Behaviour. Malaysia.
Noble, G., Cantrell, J., Kyriazis, E. & Algie, J. (2008) Motivations and forms of corporate
giving behaviour: Insights from Australia. International Journal of Nonprofit and
Voluntary Sector Marketing, 13(4), 315-325.
Noor, .A.A. (2015). Corporate social responsibility practice and corporate financial
performance: Evidence from Nigerian Companies. Social Responsibility Journal,
11(4), 749-763.
Nwankwo, J.J. (1983) Introduction to research operations in education and the social
science. Pakistan: Izharsons Press.
Nwankwo, O.C. (2006) A Practical Guide to Research Writing. Revised Edition, Pam
Unique Publishers, Portharcourt.
Oetzel, J. & Getz, K. (2012). Why and how might firms respond strategically to violent
conflict. Journal of International Business Studies, 43(2): 166 – 186.
O’Faircheallaigh, C. (2002) A new approach to policy evaluation: Mining and Indigenous
people, Aurlington: Ashgate.
Office of Territory Development (2004) Alcan Gove alumina refinery expansion. Fact
Sheet 4 – How has the Northern Territory government assisted with the refinery
expansion? Accessed 6 August 2020 from http://www.odt.nt.gov.au/dcm/otd/alcan/
Oladipupo, F.O. & Oladimeji, E.O. (2018) “Corporate Social Responsibility and Stock
Price Market of Selected Listed Companies in Nigeria”, International Journal of
Academic Research in Business and Social Sciences, Human Resource
Management Academic Research Society, International Journal of Academic
Research in Business and Social Sciences, 8(7), 872-886.
Olugbenga, A.A. & Atanda, O.A. (2014) The Relationship between Financial Accounting
Information and Market Values of Quoted Firms in Nigeria. Global Journal of
Contemporary Research in Accounting, Auditing and Business Ethics, 1(1):22-39.
Omokhudu, O.O. & Ibadin P.O. (2015) The Value Relevance of Accounting Information:
Evidence from Nigeria. Accounting and Finance Research, 4(3):20-30.
162
Omorokpe, R.O. (2003) Dictionary of Financial Accounting Terms. Mindex Publishing,
Benin City.
Ooserhout J. & Hengens P. (2006) Much Ado about Nothing: A conceptual critique of
corporate social responsibility. Erasmus Research Institute Publication, Erasmus
School of Economic, Netherland.
Orlitzky, M., Schmidt, F.L., & S.L Rynes (2003) Corporate Social and Financial
Performance: A Meta-Analysis. Organization Studies, 24(3):402-442. London:
SAGE Publication.
Othman, R., Thani, A.M. & Ghani E.K. (2009) Determinants of Islamic, Social Reporting
among Top Shari’a Approved Companies in Bursa, Malaysia. Research Journal of
International Studies, 12(10), 4-20.
Owolabi, A. (2010). Corporate Social Responsibility Disclosure on Nigerian Companies
from 2006-2010, Retrieved from http://www.utas.edu.au.20.10.2012
Oyewumi, R.O., Ogunmeru, O.A., and Oboh, C.S. (2018) Investment in corporate social
responsibility, disclosure practices, and financial performance of banks in Nigeria.
Future Business Journal 4: 195 – 205.
Pandey, I.M. (2011) Financial Management. Tenth Edition, Vikas Publishing House PVT,
Ltd, New Delhi.
Parket, I.R. & Eibirt, H. (1975) Social Responsibility: The underlying factors. Business
Horizons, 18(4): 5 – 10.
Patten, D.M. & Crampton, W. (2004) Social Responsiveness, profitability and
Catastrophic Events: Evidence on the orporate philanthropic Response.
SpringLink. The Corporate Givers’, Business Week (3732), 100 – 104 Google
Scholar.
Patten, D.M. (1991) Exposure, legitimacy and Social disclosure – Econpapers. Journal of
Accounting and Public Policy, 10(4), 297 – 308.
Patten, D.M. (1991) Exposure, Legitimacy, and Social disclosure. Econpapers. Journal of
Accounting and Public Policy 10(4): 297 – 308.
Pava, M.L. & Krausz, J. (1996) The association between corporate social responsibility
and financial performance: The paradox of social cost. Journal of Business Ethics,
15: 321 – 357.
Perrini, F. (2005) Building a European Portrait of Corporate Social Responsibility
Reporting. European Management Journal, 23: 611 – 527.
Phillips, .R. (2003). Stakeholders theory and organizational ethics. Beret-Koehler
Publishers.
163
Pickett-Baker, J. (2008) Pro-environmental products: marketing influence on consumer
purchase decision. Journal of Consumer Marketing, 25(5), 281 – 293.
Poddi, L. & Vergalli, S. (2009) Does Corporate Social Responsibility Affect Firms’
Performance? Discussion N.0809 from
http://econpapers.repect.org/paper/usbwpaper/0809/htm
Posnikoff, J.F. (1997) The Effect of Corporate Social Responsibility on the profitability of
the industrial companies on Jordan. ResearchGate.
https://www.researchgate.net/publication/260351437
Pour, B.S, Nazari, K., & Emami, M. (2014) Corporate Social Responsibility: A literature
review. African Journal of Business Management, 8(7): 228 – 234.
http://www.academyjournals.org/AJBM.
Prastowo, D. (2002) Analisis Laporan Keuangan: Konsep dan Aplikasi. YKPN:
Yogyakarta.
Pratima, B. (2002). “The Corporate Challenges of Sustainable Development.” Academy of
Management Executive 16(2): 120-133.
Preston, L. & O’Bannon, D. (1997). The corporate social-financial performance
relationship, Business and Society, 36(1): 5-31.
Preston, L.E. (1978). Analyzing corporate social performance: Methods and results.
Journal of Contemporary Business, 7(1), 135-149.
Purushorthaman, M., Hancock, P., Tower, G. & Taphlin, R.H. (2000) Determinants of
CSR practices of listed Singapore Companies. Pacific Accounting Review 12(2):
101-133.
Quinn, R. (2005) Mining ageements: Content ideas. National Native Title Tribunal.
Accessed 6 August 2020 from
http://www.nntt.gov.au/research/files/Mining_Ageements_Content_Ideas.pdf
Raman, A. (2001) A study of Corporate Social Disclosures in Bangladesh. Managerial
Auditing Journal, 16(5) – Emerald Insight.
Ramayah, T., Lee, J.W.C., & Mohamad, O. (2010) Green product purchase intention:
Some insights from a developing country. Journal of Resources, Conservation and
Recycling, 54, 1419 – 1427.
Ranganathan, J. & Ditz, D. (1996) Environmental Accounting: A tool for better
management, Management Accounting, 38 – 40, Google Scholar.
Reily, .F.K., & Brown .K.C., (2012). Analysis of investments and management of
portfolios, Canadian :south-western, cengage learning.

164
Reimann, B.C. (1989) Managing for value: a guide to value-based strategic management.
Oxford: Basil Blackwell.
Render, J. (2005) Mining and Indigenous peoples issues review. International Council on
Mining and Metals, London. Accessed 6 August 2020 from
http://www.icmm.com/publications/763IPReport.pdf
Riahi – Belkaoui, A. (2006) Executive Compensation organizational effectiveness, social
performance and firm performance: An empirical investigation Journal of Business
finance & Accounting 19(1): 25- 38.
Riyanto, B. (2001) Dasar-Dasar Pembelanjaan Perusahaan. Yogyakarta: BPFE.
Roberts, R.W. (1992) Determinants of CSRD: An application of stakeholder theory.
Accounting, organization and society, 17(6), 595 – 612.
Rogers, P. (1973) The industrialists and the Aborigines: A study of aboriginal employment
in the Australian mining industry. Sydney: Angus & Robertson.
Rotimi, A. (2007). Banking: Principles and Practice, AVL Publishing, Lagos.
Rouf, M.A. (2011). The Corporate Social Responsibility Disclosure: A Study of Listed
Companies in Bangladesh: Business and Economics Research Journal, 2:19-32.
Rustiarini, N.W. (2010) Effect of Corporate Social Responsibility Disclosure on Financial
performance with Audit Quality as a moderating variable.
DOI:10.21512/bbr.V712.1687.
Saleh, M., Zulkifli, N., & Muhamad, R. (2010) Corporate Social Responsibility disclosure
and its relation on institutional ownership. Managerial Auditing Journal, 25(6),
591 – 613.
Salkind, N.J. (2010) Ex-post facto study in Encyclopedia of Research Design
https://dx.doi.org/104135/9781412961288n145.
Sampath, H.R. (2015) Effect of Corporate Social Responsibility on share prices,
https://www.researchgate.net/publication/308691548_effect_of_corporate_social_r
esponsibility_on_share_prices, Retrieved on 15th December, 2019.
Samy, M., Odemilin, G., & Bampton, R., (2010). Corporate social responsibility: A
strategy for sustainable business success: An analysis of 20 selected British
companies. Corporate Governance, 10(2), 203-217.
Sartono, A. (2001) Financial Management (Theory and Application), Fourth Edition.
Yogyakarta: BPFE.
Savage, .A.A., (1994). Environmental reporting: Stakeholder’s perspective , Working
paper 94, University of Port Elizabeth.

165
Sawir, A. (2005) Analisis Kinerja Keuangan dan Perencanaan Keuangan Perusahaan.
Jakarta: Penerbit Gramedia Pustaka Utama.
Schnurbein, G.V., Seele, P., & Lock, L. (2016) Exclusive Corporate Philanthropy:
Rethinking The Nexus of CSR and Corportate Philanthropy. Social Responsibility
Journal, 12(2), 280-294.
Scholtens, B. (2008) Stakeholder relations and financial performance. Sustainable
Development and Socially Responsible Finance and Investing (Special Issue)
16(3): 213 – 232.
Sen, S., & Cowley, J. (2013). The relevance of stakeholder theory and social capital theory
in the context of CSR in SMEs: An Australian perspective. Journal of Business
Ethics, 118(2), 413-427.
Seungwoo, .O., Ahreum, .H. & Junseok, .H., (2017). An analysis of CSR on financial
performance in stakeholder perspective. Sustainability Journal, 9, 1023.
Shane, P.B. & Spicer, B.H. (1983) Marketing Response to Environmental information
produced outside the firm. The Accounting Review, 58: 521 – 537. Google Scholar,
151.
Shiller, R. (1981) Do stock prices move too much to be justified by subsequent changes in
dividends? America Economic Review, 71(3): 421-436.
Shim, J.K & Siegel, J.G. (2000). Financial Management, 2nd Edition, Barron’s.
Simon, M.K. & Goes, J. (2013). Ex-post facto Research, www.disertationreceipes.com
Simpson, W.G. & Kohers, T. (2002) The Link between corporate social and financial
performance: Evidence from the Banking Industry. Journal of Business Ethics, 35:
97 – 109, Journal of Financial Risk Management, 4(2) Scientific Research
Publishing.
Small, A.A. & Zivin, J.G. (2005) A Modigliani – Miller Theory of Altristic Corporate
Social Responsibility. Econpapers. The B.E. Journal of Economic Analysis &
Policy, 5(1): 1 – 21. ISSN (Online) 1935 – 1682.
Smart, S.B. & Graham, J.R. (2012) Introduction to financial management. (3rd ed.).
Belmont, CA: CEngage Learning.
Smith, C. (2002) Corporate Social Responsibility: Not whether but how? Centre of
Marketing Working paper, London Business School Publication, 3 -701.
Smith, M. & Taffer, R.J. (2000) The Chairman’s Statement – A content analysis of
discretionary narrative disclosures. Emerald Insight, https://www.emerald.com
Smith, N.C. (2003) Corporate Social Responsibility: Whether or How? California
Management Review 45(4), 52 – 76.
166
Smullen, J. & Hand, N. (2005) Oxford Dictionary of Accounting. Oxford University
Press, New York.
Social Responsibility Disclosure (2019), retrieved from
https://ukdiss.com/examples/social-responsibility-and-social-responsibility-
disclosure.php?Uref=1.
Solomon, R.C. (1994). The New World of Business: Ethics and Free Enterprise in the
Global Nineties. USA; Rowman & Littlefield Publishers Inc.
Spicer, B.H. (1978) Investors, corporate social performance and information disclosure:
An empirical study. The Accounting Review, 53(1), 94-111.
Srinivasan, P. (2012) Determinants of Equity Share Prices in India: A Panel Data
Approach. The Romanian Economic Journal, 46, 205-228.
Stanwick, P., & Stanwick, S. (2006) Corporate environmental disclosure: a longitudinal
study of Japanese firms. Journal of American Academy of Business, 9(1): 1-7.
Statman, M. (2006) Socially Responsible indexes. The Journal of Portfolio Management,
32(3), 100 – 109.
Strandberg, C. (2005). The convergence of corporate governance and corporate social
responsibility, Solution for a Sustainable World, available at
www.corostrandberg.com.pdf (assessed 14 April 2014).
Stronza,A., & Gordillo, J. (2008) Community Views of Ecotourism. Annals of Tourism
Research, 35(2), 448 – 468.
Sturdivant, F.D., & Ginter, J.L. (1977). Corporate social responsiveness: Management
attitudes and economic performance. California Management Review, 19(3), 30-
39.
Superti, C. (2005) Corporate Responsibility: Driven towards standardization (Electronic
version)? MSc Thesis, 2004/2005 academic year; Crandield University at Silsoe
Institute of Water and Environment. Retrieved July 6, 2009 from http://ex-
epsilon.sui.se/archive/00000793/01/Superti.pdf
Surroca, J., Tribo, J.A. & Waddock, S. (2010) Corporate responsibility and financial
performance: The role of intangible resources. Strategic Management, 31(5): 463 –
490.
Suwarno, A.E. (2004) Manfaat Informasi Rasio Keuangan Dalam Memprediksi Perubahan
Laba (Studi Empiris terhadap Perusahaan Manufaktur Go Publik di Bursa Efek
Jakarta). Jurnal Akuntasi dan Keuangan, 3(2).
Sweeney, L. & Coughlan D.J. (2013) Corporate Social Responsibility and firm
performance: A Stakeholder Approach. Academy of Management Proceedings –
AOM Journals.
167
Sweeney, L. & Coughlan, J., (2008). Do different industries report corporate social
responsibility differently? Ari investigation through the lens of stakeholder theory.
Journal of Marketing Communications, 14(2), 113-124.
Tanami, G. (2005) Coyote Gold project development. Accessed 6 August 2020 from
http://www.tanami.com.au/Operations/CoyoteGoldProject/Development.aspx
Tendelilin, (2010). Portfolio dan investasi- Teori dan Aplikasi. Yogyakarta: Kanisius.
Teoh, S.H., Welch, I. & Wazzan, C.P. (1999) The Effect of Socially Activist investment
policies on the financial markets. Evidence from the South African Boycott –
Econpapers. The Journal of Business, 72(1): 35 – 89.
Thebalance.com (2019) Profit, the catalyst for capitalism. Economic Theory. US
Economy. Available at https://www.thebalance.com/what-is-profit-and-how-does-
it-work-3305878, accessed on 12 August, 2019.
Tjia, O. & Setiawati, L. (2012). Effect of Corporate Social Responsibility Disclosure to
Value of the Firm, Study for Banking Industry in Indonesian: World Journal of
Social Science, 2: 169 - 179.
Towers, P. (2009) Corporate Social Responsibility: It’s no longer an option. Available at
http://www.towersperrin.com/tp/showdctmdoc.jsp, accessed on 23rd September,
2015.
Tran, Y.T.H. (2014). Corporate Social Responsibility in Banking Sector, International
Journal of Economics, Commerce and Management United Kingdom, 2, 2.
Traub, .E., (2001). Using ROE to analyse stocks: What you need to know about, American
Association of Individual Investor Journal, 4-7.
Trivedi, S.M. (2010) Financial performance. Areas of FPA significance of Financial
Performance-Shodhganga. Shodhganga.inflibnet.ac.in>bitstream.
Tschopp, D. & Huefner, R.J. (2015). Comparing the evolution of CSR reporting to that of
financial reporting. Journal of Business Ethics, 127(3), 565-577.
Tschopp, D., Barney, D., & Murphy, P., (2012). The institutional promotion of corporate
social responsibility reporting: Second tier institutions, Journal of Academic &
Business Ethics, 6, 1-17.
Tschopp, D., Wells, S., & Barney, D., (2011). The institutional promotion of corporate
social responsibility reporting. Journal of Academic & Business Ethics, 5, 1-18.
Turker, D. (2009). Measuring Corporate Social Responsibility: A Scale Development
Study, Journal of Business Ethics, 85(4), 411-427
Uadiale, M. (2010) The impact of Board structure on corporate financial performance in
Nigeria. International Journal of Business and Management, 5(10): 155.
168
Uadiale, O.M. & Fagbemi, T.O. (2012). Corporate Social Responsibility and Financial
Performance in Developing Economies: The Nigerian Experience. Journal of
Economics and Sustainable Development, 3(4), 44-55.
Uddin, M.B., Hassan M.R., & Tarique, K.M. (2008) Three dimensional aspects of
corporate social responsibility, Daffodil International University Journal of
Business and Economics, 3(1), 199-212.
Ukwuije, R.P.I. (2003) Peanut Educational Statistics. Celwil Nigeria Limited,
Portharcourt.
Unerman, J. (2000) Methodological issues – Reflections on quantification in corporate
social reporting content analysis. Accounting, Auditing & Accountability Journal,
13(5) – Emerald Insight.
Uwuigbe, U. & Egbide, B. (2012) Corporate Social Responsibility Disclosures in Nigeria:
A Study of Listed Financial and Non-Financial Firms. Journal of Management and
Sustainability, 2(1).
Uwuigbe, U., Ranti, U.O. & Bernard, O. (2015) Assessment of the Effects of Firm’s
Characteristics on Earnings Management of Listed Firms in Nigeria. Asian
Economic and Financial Review, 5(2):218-228.
Uwuigbe, U., Uwuigbe, O.R. & Bernard, O. (2015) Assessment of the Effects of Firms’
Characteristics on Earnings Management of Listed Firms in Nigeria. Asian
Economic and Financial Review, 5(2):218-228.
Vaidya, D. (2014). Dummies guide to earnigns per share. Retrieved from
http://www.wallstreetmojo.com.earnings-per-share-basic-eps-diluted-eps.html
Van Horne, J.C. & Wachowicz, J.M. (2010) Fundamentals of Financial Management.
Thirteenth Edition. PHI Learning Private Limited, New Delhi-110001.
Van Tonder, E., & Roberts-Lombard, M. (2013). A theoretical framework for managing
CSR plans and related initiatives in the modern business environment. Journal of
Business & Economics Research, 11(12), 503.
Vance, S. (1975). Are socially responsible corporations good investment risks?
Management Review, 64(8), 18-24.
Variyan, J. & Kraybill, D.S. (1994) Managerial Inputs and the Growth of Rural Small
Firms. American Journal of Agricultural Economics, 76:568-575.
Velasquez-Manoff, M. (2009) Environmental problems need a hoslitic approach. The
Christian Science Monitor. October 16.
(http://www.csmonitor.com/Environment/Bright-Green/2009/1016/environmental-
problems-need-a-holistic-approach)
169
Verma, E. (2019) Financial Performance – understanding its concepts and importance
2009 – 2019 Simplilearn Solutions.
https://www.simplilearn.com/finacialperformance-rar21-article.
Verschoor C.C. (1998) A study of the link between a corporation’s financial performance
and its commitment to Ethics. Journal of Business Ethics 17(3): 1509 – 1516.
Visser, W. (2008) Corporate Social Responsibility in Developing Countries. In The
Oxford Handbook of Corporate Social Responsibility. Oxford University Press,
Oxford.
Waddock, S.A. & Graves, S.A. (1997) The corporate social performance-financial
performance link. Strategic Management Journal, 18(4): 303-319.
Wan, .F.W.Y., & Muhammad, .S.A. (2016). The relationship between corporate social
responsibility and firm performance: Evidence from Malaysia. Medwell Journals,
10(4), 345-351.
Weaver, D.B., & Lawton, L.J. (2007) Twenty years on: The state of contemporary
ecotourism research. Tourism Management, 28, 1168 – 1179.
Wekesa, .R.N., (2017). Corporate social responsibility and financial performance: The
case study of Safaricom ltd. International Journal of Finance and Accounting,
6(6), 167-171.
Welford, R.J. (2004) Corporate Social Responsibility in Europe and Asia: Critical
Elements and Best Practice. Journal of Corporate Citizenship, 13:31-47.
Werhane, P.H. & Freeman, R.E. (1999) Business Ethics: The State of the Art.
International Journal of Management Reviews – Wiley Online Library.
White, H. (1980). A Heteroskedasticicty -Consistent Covariance Matrix Estimator and a
direct test for heteroskedasticity. The Econometric Society, 48(4) 817-838.
Wild, J.J., Subramanyam, K.R., & Halsey, R.F. (2005) Financial Report Analysis. Eight
Edition. Translated by: Yanivi S. Bachtiar and S. Nurwahyu Harahap. Salemba
Empat. Jakarta.
Wiyadi, R., Sasongko, N. & Fauzi, I. (2015) The Effect of Information Asymmetry, Firm
Size, Leverage, Profitability and Employee Stock Ownership on Earnings
Management with Accrual Model. International Journal of Business, Economics
and Law, 8(2): 21-30.
Wood, D.J. (1991) Corporate Social Performance Revisited. The Academy of
Management Review, 16 691 – 718 – References – Scientific Research Publishing.
Wood, F. & Sangster, A. (2002) Business Accounting. Prentice Hall, New York.
World Bank (2004) Social accountability: an introduction to the concept and emerging
practice (English). The World Bank – World Bank Documents & Reports – World
170
Bank Group. Social Development Papers, No. 76, Vol 1, World Bank:
Washington, DC.
Wright P, & Ferris, S.P (1997) Corporate Social Responsibility and Financial Performance
– Jstor – https://www.jstor.org>stable.
Yamane, Y. (1967) Statistics: An Introductory Analysis, 2nd Ed., Harper and Row, New
York.
Yamane, Y. (1973) Statistics: An Introductory Analysis, 3rd Ed., Harper and Row, New
York.
Zhou, H. & Wit, G. (2009) Determinants and Dimensions of Firm Growth. Retrieved on
20th November, 2017 from http://www.ordernemerschap.panteia.nl.pdf.
Zhu, Z. & Nakata, C. (2007) Reexamining the Link between Customer Orientation and
Business Performance: The Role of Information Systems. Journal of Marketing
Theory and Practice, 15(3): 187 – 203.
Zingales L. & Rajan R.G. (1998) Financial Dependence and Growth: The American
Economic Review, 88(3).
Zsolnai, L. (2006) Competitiveness and Corporate Social Responsibility. FEEM Working
Paper No. CSR 2.2006. Social Science Research Network (SSRN).
Zu (2009) The impact of Quality Management practices on performance: An empirical
study. Benchmarking: An International Journal, 24(2): 511 – 535.
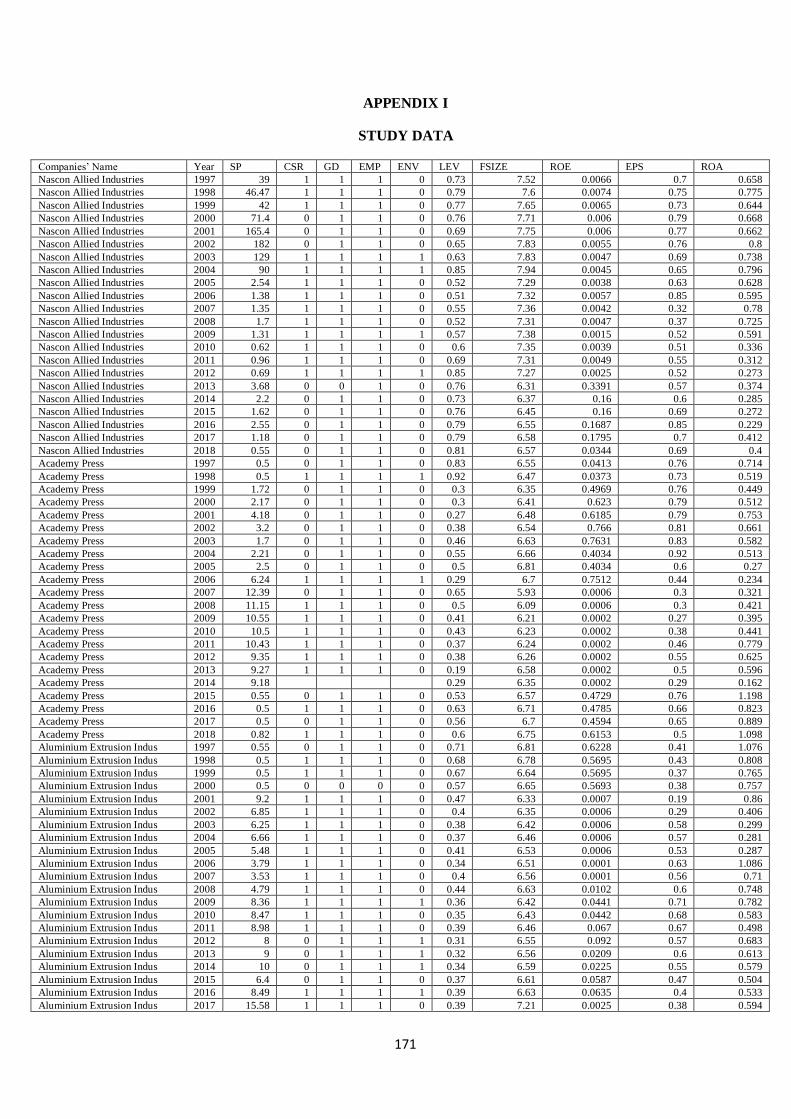
171
APPENDIX I
STUDY DATA
Companies’ Name Year SP CSR GD EMP ENV LEV FSIZE ROE EPS ROA
Nascon Allied Industries 1997 39 1 1 1 0 0.73 7.52 0.0066 0.7 0.658
Nascon Allied Industries 1998 46.47 1 1 1 0 0.79 7.6 0.0074 0.75 0.775
Nascon Allied Industries 1999 42 1 1 1 0 0.77 7.65 0.0065 0.73 0.644
Nascon Allied Industries 2000 71.4 0 1 1 0 0.76 7.71 0.006 0.79 0.668
Nascon Allied Industries 2001 165.4 0 1 1 0 0.69 7.75 0.006 0.77 0.662
Nascon Allied Industries 2002 182 0 1 1 0 0.65 7.83 0.0055 0.76 0.8
Nascon Allied Industries 2003 129 1 1 1 1 0.63 7.83 0.0047 0.69 0.738
Nascon Allied Industries 2004 90 1 1 1 1 0.85 7.94 0.0045 0.65 0.796
Nascon Allied Industries 2005 2.54 1 1 1 0 0.52 7.29 0.0038 0.63 0.628
Nascon Allied Industries 2006 1.38 1 1 1 0 0.51 7.32 0.0057 0.85 0.595
Nascon Allied Industries 2007 1.35 1 1 1 0 0.55 7.36 0.0042 0.32 0.78
Nascon Allied Industries 2008 1.7 1 1 1 0 0.52 7.31 0.0047 0.37 0.725
Nascon Allied Industries 2009 1.31 1 1 1 1 0.57 7.38 0.0015 0.52 0.591
Nascon Allied Industries 2010 0.62 1 1 1 0 0.6 7.35 0.0039 0.51 0.336
Nascon Allied Industries 2011 0.96 1 1 1 0 0.69 7.31 0.0049 0.55 0.312
Nascon Allied Industries 2012 0.69 1 1 1 1 0.85 7.27 0.0025 0.52 0.273
Nascon Allied Industries 2013 3.68 0 0 1 0 0.76 6.31 0.3391 0.57 0.374
Nascon Allied Industries 2014 2.2 0 1 1 0 0.73 6.37 0.16 0.6 0.285
Nascon Allied Industries 2015 1.62 0 1 1 0 0.76 6.45 0.16 0.69 0.272
Nascon Allied Industries 2016 2.55 0 1 1 0 0.79 6.55 0.1687 0.85 0.229
Nascon Allied Industries 2017 1.18 0 1 1 0 0.79 6.58 0.1795 0.7 0.412
Nascon Allied Industries 2018 0.55 0 1 1 0 0.81 6.57 0.0344 0.69 0.4
Academy Press 1997 0.5 0 1 1 0 0.83 6.55 0.0413 0.76 0.714
Academy Press 1998 0.5 1 1 1 1 0.92 6.47 0.0373 0.73 0.519
Academy Press 1999 1.72 0 1 1 0 0.3 6.35 0.4969 0.76 0.449
Academy Press 2000 2.17 0 1 1 0 0.3 6.41 0.623 0.79 0.512
Academy Press 2001 4.18 0 1 1 0 0.27 6.48 0.6185 0.79 0.753
Academy Press 2002 3.2 0 1 1 0 0.38 6.54 0.766 0.81 0.661
Academy Press 2003 1.7 0 1 1 0 0.46 6.63 0.7631 0.83 0.582
Academy Press 2004 2.21 0 1 1 0 0.55 6.66 0.4034 0.92 0.513
Academy Press 2005 2.5 0 1 1 0 0.5 6.81 0.4034 0.6 0.27
Academy Press 2006 6.24 1 1 1 1 0.29 6.7 0.7512 0.44 0.234
Academy Press 2007 12.39 0 1 1 0 0.65 5.93 0.0006 0.3 0.321
Academy Press 2008 11.15 1 1 1 0 0.5 6.09 0.0006 0.3 0.421
Academy Press 2009 10.55 1 1 1 0 0.41 6.21 0.0002 0.27 0.395
Academy Press 2010 10.5 1 1 1 0 0.43 6.23 0.0002 0.38 0.441
Academy Press 2011 10.43 1 1 1 0 0.37 6.24 0.0002 0.46 0.779
Academy Press 2012 9.35 1 1 1 0 0.38 6.26 0.0002 0.55 0.625
Academy Press 2013 9.27 1 1 1 0 0.19 6.58 0.0002 0.5 0.596
Academy Press 2014 9.18
0.29 6.35 0.0002 0.29 0.162
Academy Press 2015 0.55 0 1 1 0 0.53 6.57 0.4729 0.76 1.198
Academy Press 2016 0.5 1 1 1 0 0.63 6.71 0.4785 0.66 0.823
Academy Press 2017 0.5 0 1 1 0 0.56 6.7 0.4594 0.65 0.889
Academy Press 2018 0.82 1 1 1 0 0.6 6.75 0.6153 0.5 1.098
Aluminium Extrusion Indus 1997 0.55 0 1 1 0 0.71 6.81 0.6228 0.41 1.076
Aluminium Extrusion Indus 1998 0.5 1 1 1 0 0.68 6.78 0.5695 0.43 0.808
Aluminium Extrusion Indus 1999 0.5 1 1 1 0 0.67 6.64 0.5695 0.37 0.765
Aluminium Extrusion Indus 2000 0.5 0 0 0 0 0.57 6.65 0.5693 0.38 0.757
Aluminium Extrusion Indus 2001 9.2 1 1 1 0 0.47 6.33 0.0007 0.19 0.86
Aluminium Extrusion Indus 2002 6.85 1 1 1 0 0.4 6.35 0.0006 0.29 0.406
Aluminium Extrusion Indus 2003 6.25 1 1 1 0 0.38 6.42 0.0006 0.58 0.299
Aluminium Extrusion Indus 2004 6.66 1 1 1 0 0.37 6.46 0.0006 0.57 0.281
Aluminium Extrusion Indus 2005 5.48 1 1 1 0 0.41 6.53 0.0006 0.53 0.287
Aluminium Extrusion Indus 2006 3.79 1 1 1 0 0.34 6.51 0.0001 0.63 1.086
Aluminium Extrusion Indus 2007 3.53 1 1 1 0 0.4 6.56 0.0001 0.56 0.71
Aluminium Extrusion Indus 2008 4.79 1 1 1 0 0.44 6.63 0.0102 0.6 0.748
Aluminium Extrusion Indus 2009 8.36 1 1 1 1 0.36 6.42 0.0441 0.71 0.782
Aluminium Extrusion Indus 2010 8.47 1 1 1 0 0.35 6.43 0.0442 0.68 0.583
Aluminium Extrusion Indus 2011 8.98 1 1 1 0 0.39 6.46 0.067 0.67 0.498
Aluminium Extrusion Indus 2012 8 0 1 1 1 0.31 6.55 0.092 0.57 0.683
Aluminium Extrusion Indus 2013 9 0 1 1 1 0.32 6.56 0.0209 0.6 0.613
Aluminium Extrusion Indus 2014 10 0 1 1 1 0.34 6.59 0.0225 0.55 0.579
Aluminium Extrusion Indus 2015 6.4 0 1 1 0 0.37 6.61 0.0587 0.47 0.504
Aluminium Extrusion Indus 2016 8.49 1 1 1 1 0.39 6.63 0.0635 0.4 0.533
Aluminium Extrusion Indus 2017 15.58 1 1 1 0 0.39 7.21 0.0025 0.38 0.594
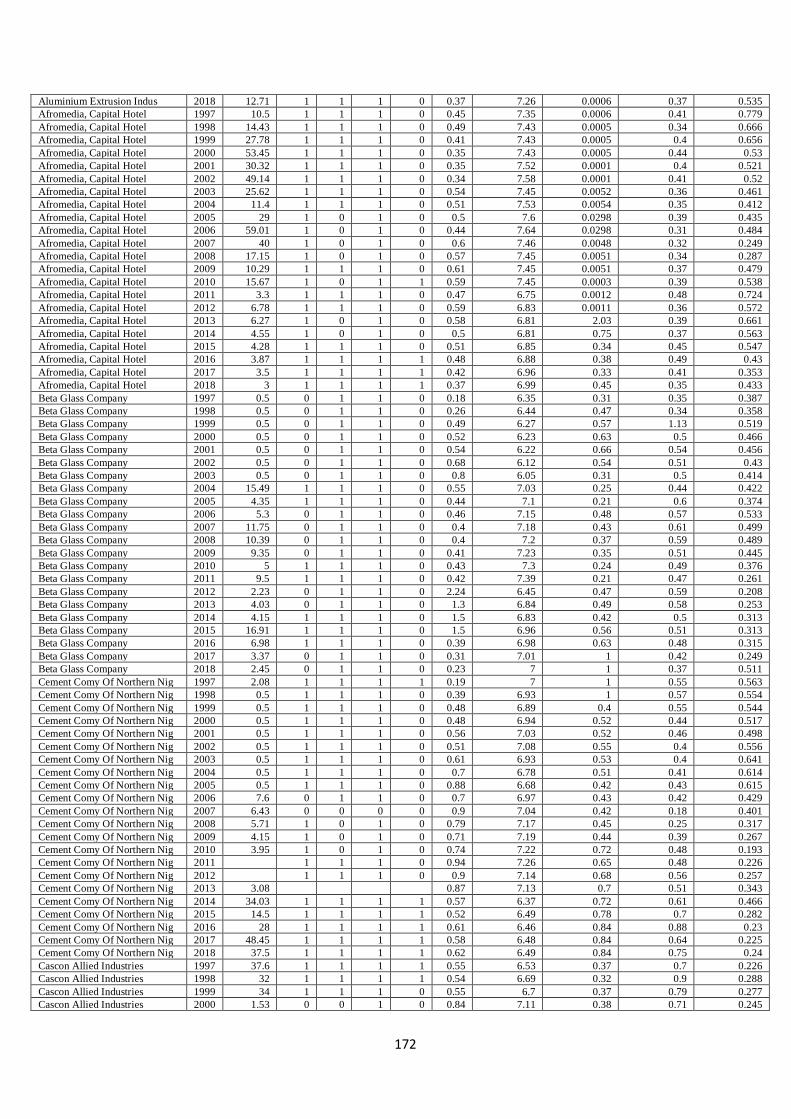
172
Aluminium Extrusion Indus 2018 12.71 1 1 1 0 0.37 7.26 0.0006 0.37 0.535
Afromedia, Capital Hotel 1997 10.5 1 1 1 0 0.45 7.35 0.0006 0.41 0.779
Afromedia, Capital Hotel 1998 14.43 1 1 1 0 0.49 7.43 0.0005 0.34 0.666
Afromedia, Capital Hotel 1999 27.78 1 1 1 0 0.41 7.43 0.0005 0.4 0.656
Afromedia, Capital Hotel 2000 53.45 1 1 1 0 0.35 7.43 0.0005 0.44 0.53
Afromedia, Capital Hotel 2001 30.32 1 1 1 0 0.35 7.52 0.0001 0.4 0.521
Afromedia, Capital Hotel 2002 49.14 1 1 1 0 0.34 7.58 0.0001 0.41 0.52
Afromedia, Capital Hotel 2003 25.62 1 1 1 0 0.54 7.45 0.0052 0.36 0.461
Afromedia, Capital Hotel 2004 11.4 1 1 1 0 0.51 7.53 0.0054 0.35 0.412
Afromedia, Capital Hotel 2005 29 1 0 1 0 0.5 7.6 0.0298 0.39 0.435
Afromedia, Capital Hotel 2006 59.01 1 0 1 0 0.44 7.64 0.0298 0.31 0.484
Afromedia, Capital Hotel 2007 40 1 0 1 0 0.6 7.46 0.0048 0.32 0.249
Afromedia, Capital Hotel 2008 17.15 1 0 1 0 0.57 7.45 0.0051 0.34 0.287
Afromedia, Capital Hotel 2009 10.29 1 1 1 0 0.61 7.45 0.0051 0.37 0.479
Afromedia, Capital Hotel 2010 15.67 1 0 1 1 0.59 7.45 0.0003 0.39 0.538
Afromedia, Capital Hotel 2011 3.3 1 1 1 0 0.47 6.75 0.0012 0.48 0.724
Afromedia, Capital Hotel 2012 6.78 1 1 1 0 0.59 6.83 0.0011 0.36 0.572
Afromedia, Capital Hotel 2013 6.27 1 0 1 0 0.58 6.81 2.03 0.39 0.661
Afromedia, Capital Hotel 2014 4.55 1 0 1 0 0.5 6.81 0.75 0.37 0.563
Afromedia, Capital Hotel 2015 4.28 1 1 1 0 0.51 6.85 0.34 0.45 0.547
Afromedia, Capital Hotel 2016 3.87 1 1 1 1 0.48 6.88 0.38 0.49 0.43
Afromedia, Capital Hotel 2017 3.5 1 1 1 1 0.42 6.96 0.33 0.41 0.353
Afromedia, Capital Hotel 2018 3 1 1 1 1 0.37 6.99 0.45 0.35 0.433
Beta Glass Company 1997 0.5 0 1 1 0 0.18 6.35 0.31 0.35 0.387
Beta Glass Company 1998 0.5 0 1 1 0 0.26 6.44 0.47 0.34 0.358
Beta Glass Company 1999 0.5 0 1 1 0 0.49 6.27 0.57 1.13 0.519
Beta Glass Company 2000 0.5 0 1 1 0 0.52 6.23 0.63 0.5 0.466
Beta Glass Company 2001 0.5 0 1 1 0 0.54 6.22 0.66 0.54 0.456
Beta Glass Company 2002 0.5 0 1 1 0 0.68 6.12 0.54 0.51 0.43
Beta Glass Company 2003 0.5 0 1 1 0 0.8 6.05 0.31 0.5 0.414
Beta Glass Company 2004 15.49 1 1 1 0 0.55 7.03 0.25 0.44 0.422
Beta Glass Company 2005 4.35 1 1 1 0 0.44 7.1 0.21 0.6 0.374
Beta Glass Company 2006 5.3 0 1 1 0 0.46 7.15 0.48 0.57 0.533
Beta Glass Company 2007 11.75 0 1 1 0 0.4 7.18 0.43 0.61 0.499
Beta Glass Company 2008 10.39 0 1 1 0 0.4 7.2 0.37 0.59 0.489
Beta Glass Company 2009 9.35 0 1 1 0 0.41 7.23 0.35 0.51 0.445
Beta Glass Company 2010 5 1 1 1 0 0.43 7.3 0.24 0.49 0.376
Beta Glass Company 2011 9.5 1 1 1 0 0.42 7.39 0.21 0.47 0.261
Beta Glass Company 2012 2.23 0 1 1 0 2.24 6.45 0.47 0.59 0.208
Beta Glass Company 2013 4.03 0 1 1 0 1.3 6.84 0.49 0.58 0.253
Beta Glass Company 2014 4.15 1 1 1 0 1.5 6.83 0.42 0.5 0.313
Beta Glass Company 2015 16.91 1 1 1 0 1.5 6.96 0.56 0.51 0.313
Beta Glass Company 2016 6.98 1 1 1 0 0.39 6.98 0.63 0.48 0.315
Beta Glass Company 2017 3.37 0 1 1 0 0.31 7.01 1 0.42 0.249
Beta Glass Company 2018 2.45 0 1 1 0 0.23 7 1 0.37 0.511
Cement Comy Of Northern Nig 1997 2.08 1 1 1 1 0.19 7 1 0.55 0.563
Cement Comy Of Northern Nig 1998 0.5 1 1 1 0 0.39 6.93 1 0.57 0.554
Cement Comy Of Northern Nig 1999 0.5 1 1 1 0 0.48 6.89 0.4 0.55 0.544
Cement Comy Of Northern Nig 2000 0.5 1 1 1 0 0.48 6.94 0.52 0.44 0.517
Cement Comy Of Northern Nig 2001 0.5 1 1 1 0 0.56 7.03 0.52 0.46 0.498
Cement Comy Of Northern Nig 2002 0.5 1 1 1 0 0.51 7.08 0.55 0.4 0.556
Cement Comy Of Northern Nig 2003 0.5 1 1 1 0 0.61 6.93 0.53 0.4 0.641
Cement Comy Of Northern Nig 2004 0.5 1 1 1 0 0.7 6.78 0.51 0.41 0.614
Cement Comy Of Northern Nig 2005 0.5 1 1 1 0 0.88 6.68 0.42 0.43 0.615
Cement Comy Of Northern Nig 2006 7.6 0 1 1 0 0.7 6.97 0.43 0.42 0.429
Cement Comy Of Northern Nig 2007 6.43 0 0 0 0 0.9 7.04 0.42 0.18 0.401
Cement Comy Of Northern Nig 2008 5.71 1 0 1 0 0.79 7.17 0.45 0.25 0.317
Cement Comy Of Northern Nig 2009 4.15 1 0 1 0 0.71 7.19 0.44 0.39 0.267
Cement Comy Of Northern Nig 2010 3.95 1 0 1 0 0.74 7.22 0.72 0.48 0.193
Cement Comy Of Northern Nig 2011
1 1 1 0 0.94 7.26 0.65 0.48 0.226
Cement Comy Of Northern Nig 2012
1 1 1 0 0.9 7.14 0.68 0.56 0.257
Cement Comy Of Northern Nig 2013 3.08
0.87 7.13 0.7 0.51 0.343
Cement Comy Of Northern Nig 2014 34.03 1 1 1 1 0.57 6.37 0.72 0.61 0.466
Cement Comy Of Northern Nig 2015 14.5 1 1 1 1 0.52 6.49 0.78 0.7 0.282
Cement Comy Of Northern Nig 2016 28 1 1 1 1 0.61 6.46 0.84 0.88 0.23
Cement Comy Of Northern Nig 2017 48.45 1 1 1 1 0.58 6.48 0.84 0.64 0.225
Cement Comy Of Northern Nig 2018 37.5 1 1 1 1 0.62 6.49 0.84 0.75 0.24
Cascon Allied Industries 1997 37.6 1 1 1 1 0.55 6.53 0.37 0.7 0.226
Cascon Allied Industries 1998 32 1 1 1 1 0.54 6.69 0.32 0.9 0.288
Cascon Allied Industries 1999 34 1 1 1 0 0.55 6.7 0.37 0.79 0.277
Cascon Allied Industries 2000 1.53 0 0 1 0 0.84 7.11 0.38 0.71 0.245

173
Cascon Allied Industries 2001 0.63 0 0 1 0 0.87 7.1 0.26 0.74 0.218
Cascon Allied Industries 2002 0.5 0 0 1 0 0.9 7.3 0.31 0.94 0.275
Cascon Allied Industries 2003 0.5 0 0 1 0 0.77 7.34 0.22 0.9 0.12
Cascon Allied Industries 2004 0.5 0 0 1 0 0.75 7.37 0.25 0.87 0.11
Cascon Allied Industries 2005 0.5 0 0 1 0 0.81 7.47 0.2 0.69 0.115
Cascon Allied Industries 2006 0.5 0 0 1 0 0.79 7.58 0.25 0.65 0.15
Cascon Allied Industries 2007 1.29 0 0 1 1 0.8 7.65 0.3 0.57 0.134
Cascon Allied Industries 2008 0.5 0 1 1 0 0.1 6.46 0.52 0.52 0.144
Cascon Allied Industries 2009 0.5 0 1 1 0 0.14 6.49 0.52 0.61 0.132
Cascon Allied Industries 2010 0.5 1 1 1 0 0.33 6.62 0.57 0.58 0.133
Cascon Allied Industries 2011 0.67 0 1 1 0 0.32 6.64 0.57 0.62 0.175
Cascon Allied Industries 2012 0.5 0 1 1 0 0.32 6.67 0.56 0.55 0.141
Cascon Allied Industries 2013 0.5 0 1 0 0 0.29 6.64 0.49 0.54 0.114
Cascon Allied Industries 2014 0.5 1 1 1 0 0.22 6.6 0.47 0.55 0.066
Cascon Allied Industries 2015 0.5 1 1 1 1 0.22 6.61 0.51 0.73 0.063
Cascon Allied Industries 2016 2.21 0 1 1 0 0.55 6.03 0.52 0.78 0.056
Cascon Allied Industries 2017 1.55 0 1 1 0 0.47 5.97 0.48 0.84 0.055
Cascon Allied Industries 2018 1.53 0 1 1 0 0.46 5.97 0.59 0.87 0.057
Courteville Business Solutions 1997 1.78 0 1 1 0 0.44 6.03 0.6 0.9 0.056
Courteville Business Solutions 1998 1.3 1 1 1 0 0.6 6.24 0.59 0.77 0.061
Courteville Business Solutions 1999 1.66 1 1 1 0 0.62 6.29 0.7 0.75 0.051
Courteville Business Solutions 2000 1.8 1 1 1 0 0.54 6.28 0.7 0.81 0.041
Courteville Business Solutions 2001 2.01 1 1 1 0 0.56 6.37 0.69 0.79 0.491
Courteville Business Solutions 2002 0.5 0 1 1 0 0.57 7.5 0.75 0.8 0.506
Courteville Business Solutions 2003 0.5 1 1 1 0 0.45 7.51 0.68 0.49 0.481
Courteville Business Solutions 2004 0.5 1 1 1 0 0.29 7.4 0.74 0.49 0.34
Courteville Business Solutions 2005 0.5 1 1 1 0 0.47 7.36 0.75 0.55 0.348
Courteville Business Solutions 2006 0.5 1 1 1 0 0.42 7.31 0 0.47 0.371
Courteville Business Solutions 2007 0.5 1 1 1 0 0.31 7.29 0 0.46 0.717
Courteville Business Solutions 2008 0.5 1 1 1 0 0.38 7.26 0.0019 0.44 0.512
Courteville Business Solutions 2009 0.5
0.48 7.31 0.0017 0.6 0.416
Courteville Business Solutions 2010 120 1 1 1 0 0.47 8.6 0.0017 0.62 0.407
Courteville Business Solutions 2011 110.77 0 1 1 0 0.45 8.72 0.0018 0.54 0.274
Courteville Business Solutions 2012 128.1 0 1 1 0 0.38 8.83 0.002 0.56 0.287
Courteville Business Solutions 2013 218.99 0 1 1 0 0.35 8.93 0.002 0.44 0.203
Courteville Business Solutions 2014 200 0 1 1 1 0.4 8.99 0.002 0.46 0.261
Courteville Business Solutions 2015 170 0 1 1 1 0.42 9.05 0.8526 0.34 0.246
Courteville Business Solutions 2016 173.99 1 1 1 1 0.48 9.18 0.038 0.46 0.504
Courteville Business Solutions 2017 230 1 1 1 0 0.53 9.22 0.0382 0.44 0.607
Courteville Business Solutions 2018 16 0 1 1 0 0.34 7.79 0.0554 0.44 0.591
Dangote Sugar 1997 4.7 0 1 1 0 0.46 7.86 0.0551 0.45 0.534
Dangote Sugar 1998 6 0 1 1 0 0.44 7.92 0.0553 0.43 0.333
Dangote Sugar 1999 11.7 0 1 1 0 0.44 7.92 0.0553 0.63 1.081
Dangote Sugar 2000 6.35 0 1 1 0 0.45 7.97 0.0555 0.52 0.622
Dangote Sugar 2001 6.11 0 1 1 0 0.43 8.01 0.0555 0.55 0.719
Dangote Sugar 2002 6.03 1 1 1 0 0.63 8.25 0.0842 0.69 0.683
Dangote Sugar 2003 20 1 1 1 1 0.52 8.29 0.0939 0.78 0.659
Dangote Sugar 2004 3.51 0 1 1 0 0.78 6.43 0.0933 0.75 0.675
Dangote Sugar 2005 1.07 1 1 1 0 0.75 6.44 0.0933 0.75 0.648
Dangote Sugar 2006 1.55 1 1 1 0 0.75 6.41 0.0933 0.74 0.671
Dangote Sugar 2007 1.41 1 1 1 0 0.74 6.42 0.0933 0.74 0.69
Dangote Sugar 2008 0.87 1 1 1 0 0.74 6.39 0.0933 0.71 0.726
Dangote Sugar 2009 0.67 1 1 1 0 0.71 6.37 0.1353 0.79 0.347
Dangote Sugar 2010 0.87 0 0 1 0 0.79 6.34 0.0197 0.82 0.123
Dangote Sugar 2011 0.73 1 1 1 0 0.82 6.28 0.0197 0.92 0.108
Dangote Sugar 2012 5.05 1 1 1 0 0.5 6.97 0.0204 0.62 0.136
Dangote Sugar 2013 2.96 1 1 1 0 0.6 7.17 0.0204 0.5 0.425
Dangote Sugar 2014 2.75 0 1 1 0 0.81 7.52 0.2373 0.6 0.186
Dangote Sugar 2015 2.75 0 1 1 0 0.61 7.26 0.2373 0.81 0.334
Dangote Sugar 2016 2.75 0 1 1 0 0.78 7.11 0.3656 0.61 0.45
Dangote Sugar 2017 2.05 0 1 1 0 0.66 7.46 0.3658 0.78 0.209
Dangote Sugar 2018 3.1 0 1 1 0 0.66 7.5 0.4348 0.66 0.229
Eternaoil 1997 4.06 1 1 1 1 0.74 7.68 0.9435 0.66 0.273
Eternaoil 1998 4.97 0 1 1 0 0.05 6.41 0.8435 0.74 0.299
Eternaoil 1999 4.94 0 1 1 0 0.06 6.43 0.7785 0.29 0.436
Eternaoil 2000 3.84 0 1 1 0 0.14 6.49 0.779 0.29 0.497
Eternaoil 2001 2.56 0 1 1 0 0.28 6.56 0.779 0.34 0.653
Eternaoil 2002 3.39 0 1 1 0 0.36 6.67 0.7812 0.45 0.881
Eternaoil 2003 3.04 0 1 1 0 0.4 6.77 0.4384 0.52 0.729
Eternaoil 2004 5 0 1 1 0 0.49 6.84 0.3906 0.57 0.732
Eternaoil 2005 5
0.47 6.8 0.3906 0.63 0.742

174
Eternaoil 2006 3.06 0 1 1 0 0.34 6.9 0.4505 0.62 0.29
Eternaoil 2007 0.79 0 1 1 0 0.45 6.97 0.4505 0.6 0.723
Eternaoil 2008 1.06 0 1 1 0 0.52 7.03 0.4505 0.56 0.586
Eternaoil 2009 2.79 0 1 1 0 0.57 7.09 0.4459 0.74 0.581
Eternaoil 2010 3.9 1 1 1 0 0.63 7.2 0.4499 0.38 0.559
Eternaoil 2011 2.5 1 1 1 0 0.62 7.22 0.0098 0.4 0.601
Eternaoil 2012 1.28 1 1 1 0 0.6 7.22 0.0098 0.4 0.64
Eternaoil 2013 3.7 1 1 1 0 0.56 7.24 0.0105 0.49 0.628
Eternaoil 2014 0.73 0 1 1 0 0.4 7.02 0.0105 0.46 0.698
Eternaoil 2015 0.5 1 1 1 1 0.4 7 0.0096 0.45 0.667
Eternaoil 2016 0.5 1 1 1 0 0.49 6.95 0.0096 0.42 0.507
Eternaoil 2017 0.5 1 1 1 0 0.46 6.93 0.0096 0.47 0.438
Eternaoil 2018 0.5 1 1 1 0 0.45 6.93 0 0.48 0.441
Flour Mills Of Nigeria 1997 0.5 1 1 1 0 0.42 6.92 0.0033 0.68 0.5
Flour Mills Of Nigeria 1998 0.5 1 1 1 0 0.47 6.97 0 0.73 0.635
Flour Mills Of Nigeria 1999 0.5 0 1 1 0 0.48 6.99 0.0093 0.63 0.62
Flour Mills Of Nigeria 2000 69 0 1 1 0 0.63 8.16 0.004 0.69 0.604
Flour Mills Of Nigeria 2001 65.45 0 1 1 0 0.69 8.21 0.0042 0.65 0.708
Flour Mills Of Nigeria 2002 65 1 1 1 1 0.65 8.37 0.0051 0.7 0.623
Flour Mills Of Nigeria 2003 87 1 1 1 1 0.7 8.45 0.0048 0.72 0.628
Flour Mills Of Nigeria 2004 39.2 1 1 1 1 0.72 8.47 0.0049 0.75 0.317
Flour Mills Of Nigeria 2005 20.8 1 1 1 1 0.75 8.54 0.3453 0.72 0.169
Flour Mills Of Nigeria 2006 18.49 1 1 1 0 0.72 8.54 0.4566 0.79 0.106
Flour Mills Of Nigeria 2007 29 1 1 1 1 0.79 8.68 0.4033 0.9 0.139
Flour Mills Of Nigeria 2008 21.9 1 1 0 0 0.63 7.84 0.5312 0.62 0.198
Flour Mills Of Nigeria 2009 11.6 0 1 0 0 0.87 7.66 0.4247 0.63 1.219
Flour Mills Of Nigeria 2010 7.73 0 1 1 0 0.82 7.63 0.4133 0.87 0.518
Flour Mills Of Nigeria 2011 108.3 0 1 1 0 0.6 8.02 0.4133 0.82 0.448
Flour Mills Of Nigeria 2012 227.9 0 1 1 0 0.68 8.14 0.1422 0.6 0.569
Flour Mills Of Nigeria 2013 330 1 1 1 0 0.89 8.09 0.4682 0.68 0.467
Flour Mills Of Nigeria 2014 84.43 1 1 1 0 0.69 8.15 0.4132 0.89 0.609
Flour Mills Of Nigeria 2015 43.48 1 1 1 0 0.62 8.17 0.3696 0.69 0.823
Flour Mills Of Nigeria 2016 0.61 0 1 1 0 0.48 6.64 0.3395 0.62 0.756
Flour Mills Of Nigeria 2017 0.5 0 1 1 0 0.48 6.66 0.3241 0.22 0.755
Flour Mills Of Nigeria 2018 0.5 0 1 1 0 0.55 6.64 0.342 0.31 0.75
Capital Oil 1997 0.5 0 1 1 0 0.63 6.66 0.342 0.48 0.699
Capital Oil 1998 0.5 0 1 1 0 0.73 6.65 0.0127 0.48 0.689
Capital Oil 1999 0.5 0 1 1 0 0.78 6.68 0.0127 0.55 0.819
Capital Oil 2000 0.5 0 1 1 0 0.77 6.72 0.0127 0.63 0.707
Capital Oil 2001 0.5 0 1 1 0 0.92 6.68 0.0107 0.73 0.454
Capital Oil 2002 26 1 1 1 1 0.47 7.17 0.0003 0.78 0.498
Capital Oil 2003 23 1 1 1 1 0.5 7.25 0.0004 0.77 0.57
Capital Oil 2004 45.1 1 1 1 0 0.51 7.34 0.0004 0.85 0.494
Capital Oil 2005 68 1 1 1 0 0.53 7.42 0.0003 0.43 0.492
Capital Oil 2006 50 1 1 1 0 0.54 7.45 0.0048 0.45 0.556
Capital Oil 2007 34.2 1 1 1 1 0.58 7.5 0.0049 0.47 0.512
Capital Oil 2008 15.75 1 1 1 1 0.4 7.45 0.0044 0.5 0.491
Capital Oil 2009 21.61
0.35 7.42 0.0044 0.51 0.067
Capital Oil 2010 15.03 0 1 1 0 0.49 5.83 0.0044 0.53 0.082
Capital Oil 2011 13.28 0 1 1 0 0.41 5.79 0.0044 0.54 0.344
Capital Oil 2012 12.98 0 1 1 0 0.45 5.85 0.0044 0.58 0.365
Capital Oil 2013 12.68 0 1 1 0 0.53 5.83 0.0044 0.4 0.377
Capital Oil 2014 12.08 0 1 1 0 0.49 5.82 0.0009 0.35 0.366
Capital Oil 2015 11.48 0 1 1 0 0.53 5.85 0.0008 0.55 0.381
Capital Oil 2016
0 1 1 0 0.53 5.86 0.0008 0.59 0.232
Capital Oil 2017 9.09 1 1 1 0 0.54 5.9 0.0007 0.49 0.238
Capital Oil 2018 190.56 1 1 1 0 0.56 7.89 0.0007 0.41 0.224
Global Spectrum Energy Serv. 1997 250 1 1 1 0 0.56 7.96 0.0007 0.45 0.218
Global Spectrum Energy Serv. 1998 275 1 1 1 1 0.64 8.03 0.0007 0.53 0.172
Global Spectrum Energy Serv. 1999 236 1 1 1 1 0.62 8.08 0.0009 0.49 0.512
Global Spectrum Energy Serv. 2000 168.15 1 1 1 1 0.66 8.12 0.0003 0.53 0.49
Global Spectrum Energy Serv. 2001 120.4 1 1 1 1 0.6 8.09 0.2291 0.53 0.518
Global Spectrum Energy Serv. 2002 83.05 1 1 1 1 0.7 8.14 0.2291 0.54 0.588
Global Spectrum Energy Serv. 2003 94 1 1 1 1 0.71 8.16 0.2293 0.5 0.827
Global Spectrum Energy Serv. 2004 5.1 0 1 1 0 0.55 7.48 0.2293 0.57 0.831
Global Spectrum Energy Serv. 2005 2.31 0 1 1 0 0.48 7.46 0.2296 0.56 0.749
Global Spectrum Energy Serv. 2006 2.09 0 1 1 0 0.63 7.65 0.2296 0.56 0.663
Global Spectrum Energy Serv. 2007 3.67 1 1 1 1 0.67 7.74 2.5496 0.64 0.714
Global Spectrum Energy Serv. 2008 3.46 1 1 1 0 0.68 7.81 0.1665 0.62 0.637
Global Spectrum Energy Serv. 2009 2.05 1 1 1 0 0.7 7.83 0.166 0.66 0.534
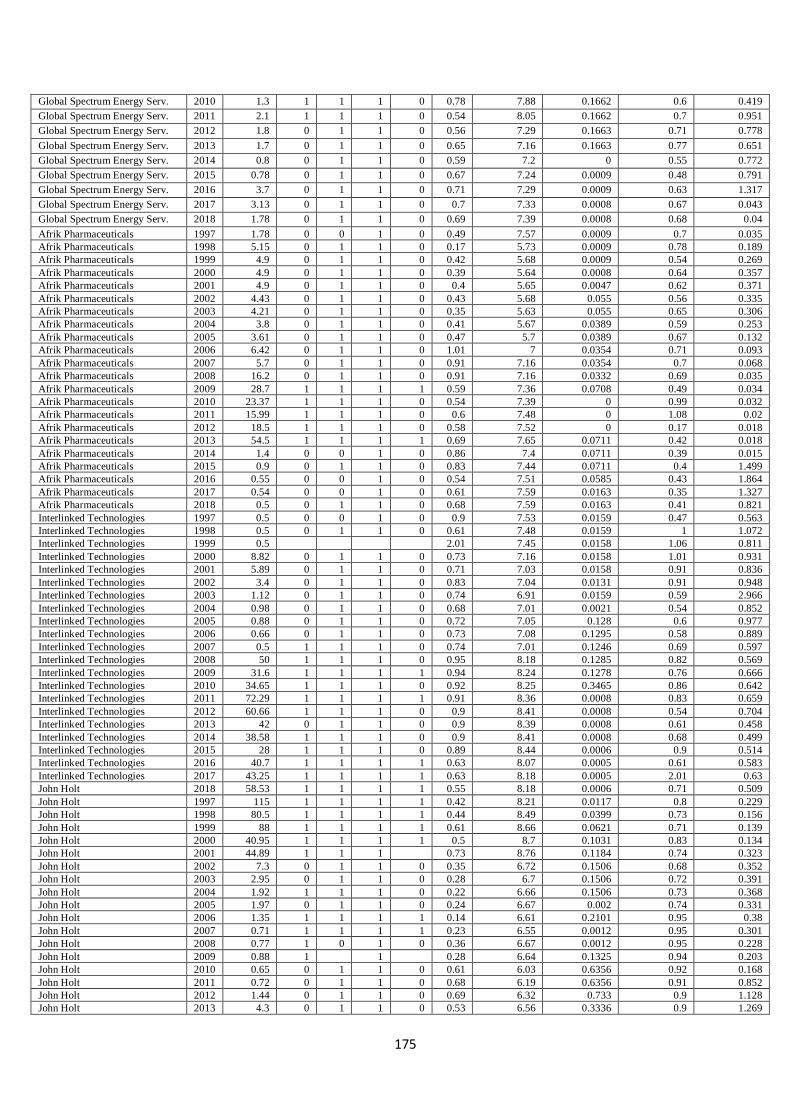
175
Global Spectrum Energy Serv. 2010 1.3 1 1 1 0 0.78 7.88 0.1662 0.6 0.419
Global Spectrum Energy Serv. 2011 2.1 1 1 1 0 0.54 8.05 0.1662 0.7 0.951
Global Spectrum Energy Serv. 2012 1.8 0 1 1 0 0.56 7.29 0.1663 0.71 0.778
Global Spectrum Energy Serv. 2013 1.7 0 1 1 0 0.65 7.16 0.1663 0.77 0.651
Global Spectrum Energy Serv. 2014 0.8 0 1 1 0 0.59 7.2 0 0.55 0.772
Global Spectrum Energy Serv. 2015 0.78 0 1 1 0 0.67 7.24 0.0009 0.48 0.791
Global Spectrum Energy Serv. 2016 3.7 0 1 1 0 0.71 7.29 0.0009 0.63 1.317
Global Spectrum Energy Serv. 2017 3.13 0 1 1 0 0.7 7.33 0.0008 0.67 0.043
Global Spectrum Energy Serv. 2018 1.78 0 1 1 0 0.69 7.39 0.0008 0.68 0.04
Afrik Pharmaceuticals 1997 1.78 0 0 1 0 0.49 7.57 0.0009 0.7 0.035
Afrik Pharmaceuticals 1998 5.15 0 1 1 0 0.17 5.73 0.0009 0.78 0.189
Afrik Pharmaceuticals 1999 4.9 0 1 1 0 0.42 5.68 0.0009 0.54 0.269
Afrik Pharmaceuticals 2000 4.9 0 1 1 0 0.39 5.64 0.0008 0.64 0.357
Afrik Pharmaceuticals 2001 4.9 0 1 1 0 0.4 5.65 0.0047 0.62 0.371
Afrik Pharmaceuticals 2002 4.43 0 1 1 0 0.43 5.68 0.055 0.56 0.335
Afrik Pharmaceuticals 2003 4.21 0 1 1 0 0.35 5.63 0.055 0.65 0.306
Afrik Pharmaceuticals 2004 3.8 0 1 1 0 0.41 5.67 0.0389 0.59 0.253
Afrik Pharmaceuticals 2005 3.61 0 1 1 0 0.47 5.7 0.0389 0.67 0.132
Afrik Pharmaceuticals 2006 6.42 0 1 1 0 1.01 7 0.0354 0.71 0.093
Afrik Pharmaceuticals 2007 5.7 0 1 1 0 0.91 7.16 0.0354 0.7 0.068
Afrik Pharmaceuticals 2008 16.2 0 1 1 0 0.91 7.16 0.0332 0.69 0.035
Afrik Pharmaceuticals 2009 28.7 1 1 1 1 0.59 7.36 0.0708 0.49 0.034
Afrik Pharmaceuticals 2010 23.37 1 1 1 0 0.54 7.39 0 0.99 0.032
Afrik Pharmaceuticals 2011 15.99 1 1 1 0 0.6 7.48 0 1.08 0.02
Afrik Pharmaceuticals 2012 18.5 1 1 1 0 0.58 7.52 0 0.17 0.018
Afrik Pharmaceuticals 2013 54.5 1 1 1 1 0.69 7.65 0.0711 0.42 0.018
Afrik Pharmaceuticals 2014 1.4 0 0 1 0 0.86 7.4 0.0711 0.39 0.015
Afrik Pharmaceuticals 2015 0.9 0 1 1 0 0.83 7.44 0.0711 0.4 1.499
Afrik Pharmaceuticals 2016 0.55 0 0 1 0 0.54 7.51 0.0585 0.43 1.864
Afrik Pharmaceuticals 2017 0.54 0 0 1 0 0.61 7.59 0.0163 0.35 1.327
Afrik Pharmaceuticals 2018 0.5 0 1 1 0 0.68 7.59 0.0163 0.41 0.821
Interlinked Technologies 1997 0.5 0 0 1 0 0.9 7.53 0.0159 0.47 0.563
Interlinked Technologies 1998 0.5 0 1 1 0 0.61 7.48 0.0159 1 1.072
Interlinked Technologies 1999 0.5
2.01 7.45 0.0158 1.06 0.811
Interlinked Technologies 2000 8.82 0 1 1 0 0.73 7.16 0.0158 1.01 0.931
Interlinked Technologies 2001 5.89 0 1 1 0 0.71 7.03 0.0158 0.91 0.836
Interlinked Technologies 2002 3.4 0 1 1 0 0.83 7.04 0.0131 0.91 0.948
Interlinked Technologies 2003 1.12 0 1 1 0 0.74 6.91 0.0159 0.59 2.966
Interlinked Technologies 2004 0.98 0 1 1 0 0.68 7.01 0.0021 0.54 0.852
Interlinked Technologies 2005 0.88 0 1 1 0 0.72 7.05 0.128 0.6 0.977
Interlinked Technologies 2006 0.66 0 1 1 0 0.73 7.08 0.1295 0.58 0.889
Interlinked Technologies 2007 0.5 1 1 1 0 0.74 7.01 0.1246 0.69 0.597
Interlinked Technologies 2008 50 1 1 1 0 0.95 8.18 0.1285 0.82 0.569
Interlinked Technologies 2009 31.6 1 1 1 1 0.94 8.24 0.1278 0.76 0.666
Interlinked Technologies 2010 34.65 1 1 1 0 0.92 8.25 0.3465 0.86 0.642
Interlinked Technologies 2011 72.29 1 1 1 1 0.91 8.36 0.0008 0.83 0.659
Interlinked Technologies 2012 60.66 1 1 1 0 0.9 8.41 0.0008 0.54 0.704
Interlinked Technologies 2013 42 0 1 1 0 0.9 8.39 0.0008 0.61 0.458
Interlinked Technologies 2014 38.58 1 1 1 0 0.9 8.41 0.0008 0.68 0.499
Interlinked Technologies 2015 28 1 1 1 0 0.89 8.44 0.0006 0.9 0.514
Interlinked Technologies 2016 40.7 1 1 1 1 0.63 8.07 0.0005 0.61 0.583
Interlinked Technologies 2017 43.25 1 1 1 1 0.63 8.18 0.0005 2.01 0.63
John Holt 2018 58.53 1 1 1 1 0.55 8.18 0.0006 0.71 0.509
John Holt 1997 115 1 1 1 1 0.42 8.21 0.0117 0.8 0.229
John Holt 1998 80.5 1 1 1 1 0.44 8.49 0.0399 0.73 0.156
John Holt 1999 88 1 1 1 1 0.61 8.66 0.0621 0.71 0.139
John Holt 2000 40.95 1 1 1 1 0.5 8.7 0.1031 0.83 0.134
John Holt 2001 44.89 1 1 1
0.73 8.76 0.1184 0.74 0.323
John Holt 2002 7.3 0 1 1 0 0.35 6.72 0.1506 0.68 0.352
John Holt 2003 2.95 0 1 1 0 0.28 6.7 0.1506 0.72 0.391
John Holt 2004 1.92 1 1 1 0 0.22 6.66 0.1506 0.73 0.368
John Holt 2005 1.97 0 1 1 0 0.24 6.67 0.002 0.74 0.331
John Holt 2006 1.35 1 1 1 1 0.14 6.61 0.2101 0.95 0.38
John Holt 2007 0.71 1 1 1 1 0.23 6.55 0.0012 0.95 0.301
John Holt 2008 0.77 1 0 1 0 0.36 6.67 0.0012 0.95 0.228
John Holt 2009 0.88 1
1
0.28 6.64 0.1325 0.94 0.203
John Holt 2010 0.65 0 1 1 0 0.61 6.03 0.6356 0.92 0.168
John Holt 2011 0.72 0 1 1 0 0.68 6.19 0.6356 0.91 0.852
John Holt 2012 1.44 0 1 1 0 0.69 6.32 0.733 0.9 1.128
John Holt 2013 4.3 0 1 1 0 0.53 6.56 0.3336 0.9 1.269
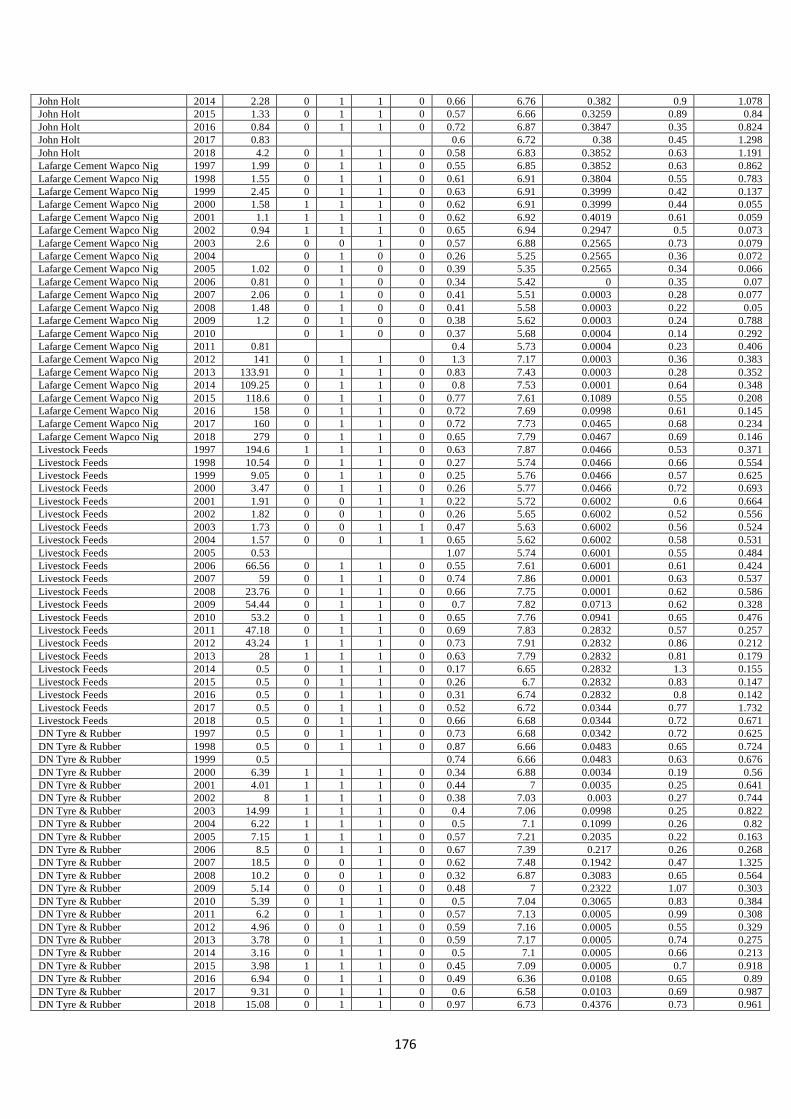
176
John Holt 2014 2.28 0 1 1 0 0.66 6.76 0.382 0.9 1.078
John Holt 2015 1.33 0 1 1 0 0.57 6.66 0.3259 0.89 0.84
John Holt 2016 0.84 0 1 1 0 0.72 6.87 0.3847 0.35 0.824
John Holt 2017 0.83
0.6 6.72 0.38 0.45 1.298
John Holt 2018 4.2 0 1 1 0 0.58 6.83 0.3852 0.63 1.191
Lafarge Cement Wapco Nig 1997 1.99 0 1 1 0 0.55 6.85 0.3852 0.63 0.862
Lafarge Cement Wapco Nig 1998 1.55 0 1 1 0 0.61 6.91 0.3804 0.55 0.783
Lafarge Cement Wapco Nig 1999 2.45 0 1 1 0 0.63 6.91 0.3999 0.42 0.137
Lafarge Cement Wapco Nig 2000 1.58 1 1 1 0 0.62 6.91 0.3999 0.44 0.055
Lafarge Cement Wapco Nig 2001 1.1 1 1 1 0 0.62 6.92 0.4019 0.61 0.059
Lafarge Cement Wapco Nig 2002 0.94 1 1 1 0 0.65 6.94 0.2947 0.5 0.073
Lafarge Cement Wapco Nig 2003 2.6 0 0 1 0 0.57 6.88 0.2565 0.73 0.079
Lafarge Cement Wapco Nig 2004
0 1 0 0 0.26 5.25 0.2565 0.36 0.072
Lafarge Cement Wapco Nig 2005 1.02 0 1 0 0 0.39 5.35 0.2565 0.34 0.066
Lafarge Cement Wapco Nig 2006 0.81 0 1 0 0 0.34 5.42 0 0.35 0.07
Lafarge Cement Wapco Nig 2007 2.06 0 1 0 0 0.41 5.51 0.0003 0.28 0.077
Lafarge Cement Wapco Nig 2008 1.48 0 1 0 0 0.41 5.58 0.0003 0.22 0.05
Lafarge Cement Wapco Nig 2009 1.2 0 1 0 0 0.38 5.62 0.0003 0.24 0.788
Lafarge Cement Wapco Nig 2010
0 1 0 0 0.37 5.68 0.0004 0.14 0.292
Lafarge Cement Wapco Nig 2011 0.81
0.4 5.73 0.0004 0.23 0.406
Lafarge Cement Wapco Nig 2012 141 0 1 1 0 1.3 7.17 0.0003 0.36 0.383
Lafarge Cement Wapco Nig 2013 133.91 0 1 1 0 0.83 7.43 0.0003 0.28 0.352
Lafarge Cement Wapco Nig 2014 109.25 0 1 1 0 0.8 7.53 0.0001 0.64 0.348
Lafarge Cement Wapco Nig 2015 118.6 0 1 1 0 0.77 7.61 0.1089 0.55 0.208
Lafarge Cement Wapco Nig 2016 158 0 1 1 0 0.72 7.69 0.0998 0.61 0.145
Lafarge Cement Wapco Nig 2017 160 0 1 1 0 0.72 7.73 0.0465 0.68 0.234
Lafarge Cement Wapco Nig 2018 279 0 1 1 0 0.65 7.79 0.0467 0.69 0.146
Livestock Feeds 1997 194.6 1 1 1 0 0.63 7.87 0.0466 0.53 0.371
Livestock Feeds 1998 10.54 0 1 1 0 0.27 5.74 0.0466 0.66 0.554
Livestock Feeds 1999 9.05 0 1 1 0 0.25 5.76 0.0466 0.57 0.625
Livestock Feeds 2000 3.47 0 1 1 0 0.26 5.77 0.0466 0.72 0.693
Livestock Feeds 2001 1.91 0 0 1 1 0.22 5.72 0.6002 0.6 0.664
Livestock Feeds 2002 1.82 0 0 1 0 0.26 5.65 0.6002 0.52 0.556
Livestock Feeds 2003 1.73 0 0 1 1 0.47 5.63 0.6002 0.56 0.524
Livestock Feeds 2004 1.57 0 0 1 1 0.65 5.62 0.6002 0.58 0.531
Livestock Feeds 2005 0.53
1.07 5.74 0.6001 0.55 0.484
Livestock Feeds 2006 66.56 0 1 1 0 0.55 7.61 0.6001 0.61 0.424
Livestock Feeds 2007 59 0 1 1 0 0.74 7.86 0.0001 0.63 0.537
Livestock Feeds 2008 23.76 0 1 1 0 0.66 7.75 0.0001 0.62 0.586
Livestock Feeds 2009 54.44 0 1 1 0 0.7 7.82 0.0713 0.62 0.328
Livestock Feeds 2010 53.2 0 1 1 0 0.65 7.76 0.0941 0.65 0.476
Livestock Feeds 2011 47.18 0 1 1 0 0.69 7.83 0.2832 0.57 0.257
Livestock Feeds 2012 43.24 1 1 1 0 0.73 7.91 0.2832 0.86 0.212
Livestock Feeds 2013 28 1 1 1 0 0.63 7.79 0.2832 0.81 0.179
Livestock Feeds 2014 0.5 0 1 1 0 0.17 6.65 0.2832 1.3 0.155
Livestock Feeds 2015 0.5 0 1 1 0 0.26 6.7 0.2832 0.83 0.147
Livestock Feeds 2016 0.5 0 1 1 0 0.31 6.74 0.2832 0.8 0.142
Livestock Feeds 2017 0.5 0 1 1 0 0.52 6.72 0.0344 0.77 1.732
Livestock Feeds 2018 0.5 0 1 1 0 0.66 6.68 0.0344 0.72 0.671
DN Tyre & Rubber 1997 0.5 0 1 1 0 0.73 6.68 0.0342 0.72 0.625
DN Tyre & Rubber 1998 0.5 0 1 1 0 0.87 6.66 0.0483 0.65 0.724
DN Tyre & Rubber 1999 0.5
0.74 6.66 0.0483 0.63 0.676
DN Tyre & Rubber 2000 6.39 1 1 1 0 0.34 6.88 0.0034 0.19 0.56
DN Tyre & Rubber 2001 4.01 1 1 1 0 0.44 7 0.0035 0.25 0.641
DN Tyre & Rubber 2002 8 1 1 1 0 0.38 7.03 0.003 0.27 0.744
DN Tyre & Rubber 2003 14.99 1 1 1 0 0.4 7.06 0.0998 0.25 0.822
DN Tyre & Rubber 2004 6.22 1 1 1 0 0.5 7.1 0.1099 0.26 0.82
DN Tyre & Rubber 2005 7.15 1 1 1 0 0.57 7.21 0.2035 0.22 0.163
DN Tyre & Rubber 2006 8.5 0 1 1 0 0.67 7.39 0.217 0.26 0.268
DN Tyre & Rubber 2007 18.5 0 0 1 0 0.62 7.48 0.1942 0.47 1.325
DN Tyre & Rubber 2008 10.2 0 0 1 0 0.32 6.87 0.3083 0.65 0.564
DN Tyre & Rubber 2009 5.14 0 0 1 0 0.48 7 0.2322 1.07 0.303
DN Tyre & Rubber 2010 5.39 0 1 1 0 0.5 7.04 0.3065 0.83 0.384
DN Tyre & Rubber 2011 6.2 0 1 1 0 0.57 7.13 0.0005 0.99 0.308
DN Tyre & Rubber 2012 4.96 0 0 1 0 0.59 7.16 0.0005 0.55 0.329
DN Tyre & Rubber 2013 3.78 0 1 1 0 0.59 7.17 0.0005 0.74 0.275
DN Tyre & Rubber 2014 3.16 0 1 1 0 0.5 7.1 0.0005 0.66 0.213
DN Tyre & Rubber 2015 3.98 1 1 1 0 0.45 7.09 0.0005 0.7 0.918
DN Tyre & Rubber 2016 6.94 0 1 1 0 0.49 6.36 0.0108 0.65 0.89
DN Tyre & Rubber 2017 9.31 0 1 1 0 0.6 6.58 0.0103 0.69 0.987
DN Tyre & Rubber 2018 15.08 0 1 1 0 0.97 6.73 0.4376 0.73 0.961
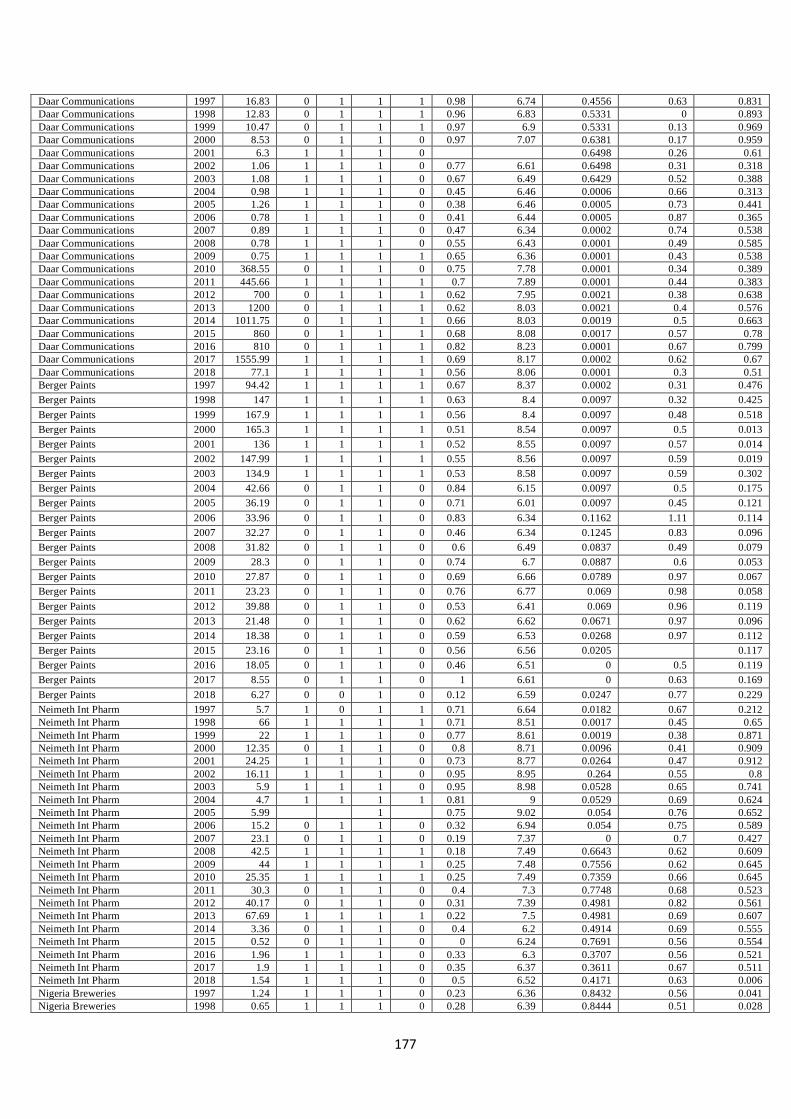
177
Daar Communications 1997 16.83 0 1 1 1 0.98 6.74 0.4556 0.63 0.831
Daar Communications 1998 12.83 0 1 1 1 0.96 6.83 0.5331 0 0.893
Daar Communications 1999 10.47 0 1 1 1 0.97 6.9 0.5331 0.13 0.969
Daar Communications 2000 8.53 0 1 1 0 0.97 7.07 0.6381 0.17 0.959
Daar Communications 2001 6.3 1 1 1 0
0.6498 0.26 0.61
Daar Communications 2002 1.06 1 1 1 0 0.77 6.61 0.6498 0.31 0.318
Daar Communications 2003 1.08 1 1 1 0 0.67 6.49 0.6429 0.52 0.388
Daar Communications 2004 0.98 1 1 1 0 0.45 6.46 0.0006 0.66 0.313
Daar Communications 2005 1.26 1 1 1 0 0.38 6.46 0.0005 0.73 0.441
Daar Communications 2006 0.78 1 1 1 0 0.41 6.44 0.0005 0.87 0.365
Daar Communications 2007 0.89 1 1 1 0 0.47 6.34 0.0002 0.74 0.538
Daar Communications 2008 0.78 1 1 1 0 0.55 6.43 0.0001 0.49 0.585
Daar Communications 2009 0.75 1 1 1 1 0.65 6.36 0.0001 0.43 0.538
Daar Communications 2010 368.55 0 1 1 0 0.75 7.78 0.0001 0.34 0.389
Daar Communications 2011 445.66 1 1 1 1 0.7 7.89 0.0001 0.44 0.383
Daar Communications 2012 700 0 1 1 1 0.62 7.95 0.0021 0.38 0.638
Daar Communications 2013 1200 0 1 1 1 0.62 8.03 0.0021 0.4 0.576
Daar Communications 2014 1011.75 0 1 1 1 0.66 8.03 0.0019 0.5 0.663
Daar Communications 2015 860 0 1 1 1 0.68 8.08 0.0017 0.57 0.78
Daar Communications 2016 810 0 1 1 1 0.82 8.23 0.0001 0.67 0.799
Daar Communications 2017 1555.99 1 1 1 1 0.69 8.17 0.0002 0.62 0.67
Daar Communications 2018 77.1 1 1 1 1 0.56 8.06 0.0001 0.3 0.51
Berger Paints 1997 94.42 1 1 1 1 0.67 8.37 0.0002 0.31 0.476
Berger Paints 1998 147 1 1 1 1 0.63 8.4 0.0097 0.32 0.425
Berger Paints 1999 167.9 1 1 1 1 0.56 8.4 0.0097 0.48 0.518
Berger Paints 2000 165.3 1 1 1 1 0.51 8.54 0.0097 0.5 0.013
Berger Paints 2001 136 1 1 1 1 0.52 8.55 0.0097 0.57 0.014
Berger Paints 2002 147.99 1 1 1 1 0.55 8.56 0.0097 0.59 0.019
Berger Paints 2003 134.9 1 1 1 1 0.53 8.58 0.0097 0.59 0.302
Berger Paints 2004 42.66 0 1 1 0 0.84 6.15 0.0097 0.5 0.175
Berger Paints 2005 36.19 0 1 1 0 0.71 6.01 0.0097 0.45 0.121
Berger Paints 2006 33.96 0 1 1 0 0.83 6.34 0.1162 1.11 0.114
Berger Paints 2007 32.27 0 1 1 0 0.46 6.34 0.1245 0.83 0.096
Berger Paints 2008 31.82 0 1 1 0 0.6 6.49 0.0837 0.49 0.079
Berger Paints 2009 28.3 0 1 1 0 0.74 6.7 0.0887 0.6 0.053
Berger Paints 2010 27.87 0 1 1 0 0.69 6.66 0.0789 0.97 0.067
Berger Paints 2011 23.23 0 1 1 0 0.76 6.77 0.069 0.98 0.058
Berger Paints 2012 39.88 0 1 1 0 0.53 6.41 0.069 0.96 0.119
Berger Paints 2013 21.48 0 1 1 0 0.62 6.62 0.0671 0.97 0.096
Berger Paints 2014 18.38 0 1 1 0 0.59 6.53 0.0268 0.97 0.112
Berger Paints 2015 23.16 0 1 1 0 0.56 6.56 0.0205
0.117
Berger Paints 2016 18.05 0 1 1 0 0.46 6.51 0 0.5 0.119
Berger Paints 2017 8.55 0 1 1 0 1 6.61 0 0.63 0.169
Berger Paints 2018 6.27 0 0 1 0 0.12 6.59 0.0247 0.77 0.229
Neimeth Int Pharm 1997 5.7 1 0 1 1 0.71 6.64 0.0182 0.67 0.212
Neimeth Int Pharm 1998 66 1 1 1 1 0.71 8.51 0.0017 0.45 0.65
Neimeth Int Pharm 1999 22 1 1 1 0 0.77 8.61 0.0019 0.38 0.871
Neimeth Int Pharm 2000 12.35 0 1 1 0 0.8 8.71 0.0096 0.41 0.909
Neimeth Int Pharm 2001 24.25 1 1 1 0 0.73 8.77 0.0264 0.47 0.912
Neimeth Int Pharm 2002 16.11 1 1 1 0 0.95 8.95 0.264 0.55 0.8
Neimeth Int Pharm 2003 5.9 1 1 1 0 0.95 8.98 0.0528 0.65 0.741
Neimeth Int Pharm 2004 4.7 1 1 1 1 0.81 9 0.0529 0.69 0.624
Neimeth Int Pharm 2005 5.99
1
0.75 9.02 0.054 0.76 0.652
Neimeth Int Pharm 2006 15.2 0 1 1 0 0.32 6.94 0.054 0.75 0.589
Neimeth Int Pharm 2007 23.1 0 1 1 0 0.19 7.37 0 0.7 0.427
Neimeth Int Pharm 2008 42.5 1 1 1 1 0.18 7.49 0.6643 0.62 0.609
Neimeth Int Pharm 2009 44 1 1 1 1 0.25 7.48 0.7556 0.62 0.645
Neimeth Int Pharm 2010 25.35 1 1 1 1 0.25 7.49 0.7359 0.66 0.645
Neimeth Int Pharm 2011 30.3 0 1 1 0 0.4 7.3 0.7748 0.68 0.523
Neimeth Int Pharm 2012 40.17 0 1 1 0 0.31 7.39 0.4981 0.82 0.561
Neimeth Int Pharm 2013 67.69 1 1 1 1 0.22 7.5 0.4981 0.69 0.607
Neimeth Int Pharm 2014 3.36 0 1 1 0 0.4 6.2 0.4914 0.69 0.555
Neimeth Int Pharm 2015 0.52 0 1 1 0 0 6.24 0.7691 0.56 0.554
Neimeth Int Pharm 2016 1.96 1 1 1 0 0.33 6.3 0.3707 0.56 0.521
Neimeth Int Pharm 2017 1.9 1 1 1 0 0.35 6.37 0.3611 0.67 0.511
Neimeth Int Pharm 2018 1.54 1 1 1 0 0.5 6.52 0.4171 0.63 0.006
Nigeria Breweries 1997 1.24 1 1 1 0 0.23 6.36 0.8432 0.56 0.041
Nigeria Breweries 1998 0.65 1 1 1 0 0.28 6.39 0.8444 0.51 0.028

178
Nigeria Breweries 1999 0.59 0 0 1 0 0.33 6.42 0.8444 0.52 0.092
Nigeria Breweries 2000 4.28 0 1 1 0 1.68 6.21 0.7184 0.55 0.04
Nigeria Breweries 2001 3.5 0 1 1 0 1.42 6.41 0.6377 0.53 0.521
Nigeria Breweries 2002 2.6 0 1 1 0 0.66 6.44 0.6127 0.9 0.357
Nigeria Breweries 2003 1.85 1 1 1 0 0.67 6.4 0.7484 1.09 0.21
Nigeria Breweries 2004 2.14 1 1 1 0 0.67 6.45 0.2375 0.84 0.222
Nigeria Breweries 2005 2.25 1 1 1 0 0.31 6.41 0.1333 0.71 0.171
Nigeria Breweries 2006 1.78 1 1 1 0 0.25 6.37 0.0006 0.83 0.134
Nigeria Breweries 2007 2.25 1 1 1 0 0.23 6.36 0.0006 0.46 0.11
Nigeria Breweries 2008 5.28 0 1 1 0 1 6.19 0.0006 0.6 0.168
Nigeria Breweries 2009 5.11 0 1 1 0 0.56 6.36 0.0011 0.74 0.307
Nigeria Breweries 2010 4.36 0 0 1 0 0.67 6.38 0.2406 0.69 0.167
Nigeria Breweries 2011 5.5 0 0 1 0 0.59 6.34 0.2415 0.76 0.249
Nigeria Breweries 2012 3.4 1 1 1 0 0.59 6.36 0.1324 0.72 0.187
Nigeria Breweries 2013 3.76 0 0 1 0 0.64 6.28 0.1288 0.72 0.223
Nigeria Breweries 2014 1.8 0 0 1 0 0.6 6.24 0.1386 0.53 0.431
Nigeria Breweries 2015 2.2 0 0 1 0 0.32 6.31 0.1386 0.62 0.511
Nigeria Breweries 2016 0.93 0 1 1 0 1.12 5.09 0.1386 0.59 0.553
Nigeria Breweries 2017 0.96 0 1 1 0 1 5.44 0.6508 0.56 0.458
Nigeria Breweries 2018 0.85 0 1 1 0 0.96 5.46 0.0195 0.46 0.483
Nigerian Northen Flour Mill 1997 0.77 0 1 1 0 1.04 5.4 0.0195 1 0.538
Nigerian Northen Flour Mill 1998 10.93 0 1 1 0 1 5.46 0.0264 0.12 0.321
Nigerian Northen Flour Mill 1999 10.93 0 1 1 0 0.92 5.53 0.0257 0.71 0.334
Nigerian Northen Flour Mill 2000 10.93 0 1 1 0 1.12 5.5 0.0258 0.84 0.531
Nigerian Northen Flour Mill 2001 9.88 0 0 1 0 0.78 5.45 0.0039 0.83 0.251
Nigerian Northen Flour Mill 2002 6.85 1 1 1 0 0.52 6.87 0.0039 0.71 0.31
Nigerian Northen Flour Mill 2003 8.67 1 1 1 1 0.81 7.4 0.0009 0.77 0.346
Nigerian Northen Flour Mill 2004 17 1 1 1 0 0.39 7.45 0.0016 0.8 0.835
Nigerian Northen Flour Mill 2005 38.5 0 1 1 0 0.47 7.51 0.0013 0.73 0.803
Nigerian Northen Flour Mill 2006 24.5 1 1 1 0 0.43 7.54 0.0017 0.95 0.804
Nigerian Northen Flour Mill 2007 33 1 1 1 0 0.45 7.74 0.0017 0.95 0.382
Nigerian Northen Flour Mill 2008 40.1 1 1 1 0 0.37 7.92 0.0017 0.81 0.185
Nigerian Northen Flour Mill 2009 68.5 1 1 1
0.92 7.99 0.0012 0.75 0.844
Nigerian Northen Flour Mill 2010 31.5 1 1 1 0 0.34 7.77 0.0012 0.45 1.011
Nigerian Northen Flour Mill 2011 28 1 1 1 0 0.4 7.84 0.0012 0.45 0.318
Nigerian Northen Flour Mill 2012 28 1 1 1 0 0.33 7.81 0.3628 0.32 0.46
Nigerian Northen Flour Mill 2013 37 1 1 1 0 0.36 7.86 0.3746 0.19 0.458
Nigerian Northen Flour Mill 2014 23.8 1 0 1 0 0.36 7.85 0.3694 0.18 0.416
Nigerian Northen Flour Mill 2015 25.7 1 0 1 1 0.39 7.83 0.3694 0.25 0.393
Nigerian Northen Flour Mill 2016 14.5 1 0 1 0 0.42 7.87 0.3786 0.25 0.459
Nigerian Northen Flour Mill 2017 20.6 1 0 1 0 0.5 7.95 0.0532 0.4 0.339
Nigerian Northen Flour Mill 2018 2.88 1 1 1 0 0.49 6.4 0.0403 0.31 0.083
Okomu Oil Palm 1997 2.39 1 1 1 0 0.44 6.44 0.3752 0.22 0.726
Okomu Oil Palm 1998 3 1 1 1 0 0.43 6.46 0.0003 1.12 0.801
Okomu Oil Palm 1999 4.42 1 1 1 0 0.43 6.48 0.0003 1.52 0.456
Okomu Oil Palm 2000 3.94 0 1 1 0 0.45 6.54 0.0002 1.68 0.675
Okomu Oil Palm 2001 4.25 0 1 1 0 0.46 6.58 0.0003 1.42 0.747
Okomu Oil Palm 2002 4.4 0 1 1 0 0.41 6.57 0.0002 0.66 0.952
Okomu Oil Palm 2003 5.12 1 1 1 0 0.45 6.65 0.0002 0.67 0.667
Okomu Oil Palm 2004 8.28 0 1 1 0 0.51 6.67 0.0002 0.67 0.76
Okomu Oil Palm 2005 5.52 0 1 1 0 0.57 6.78 0 0.31 1.876
Okomu Oil Palm 2006 5.42 0 1 1 0 0.54 6.85 0 0.25 0.814
Okomu Oil Palm 2007 5.32 0 1 1 0 0.63 6.91 0 0.23 0.734
Okomu Oil Palm 2008 4.67 0 0 1 0 0.69 6.99 0 0.46 0.81
Okomu Oil Palm 2009 4.16 0 0 1 0 0.82 7.02 0 0.61 0.933
Okomu Oil Palm 2010 3.77 0 0 1 0 0.68 7.15 0 1.12 0.746
Okomu Oil Palm 2011 3.09
0.79 7.11 0 1 0.769
Okomu Oil Palm 2012 2.92 0 1 1 0 0.75 6.9 0.5264 0.96 0.902
Okomu Oil Palm 2013 2.78 0 1 1 0 0.86 6.9 0 1.04 0.835
Okomu Oil Palm 2014 2.65 0 1 1 0 0.71 6.87 0.0006 1 0.78
Okomu Oil Palm 2015 2.52 0 1 1 0 0.77 6.97 0.0004 0.92 0.847
Okomu Oil Palm 2016 2.3 0 1 1 0 0.82 7.01 0.0004 1.12 0.342
Okomu Oil Palm 2017 2.3 0 1 1 0 0.84 7.03 0.0004 0.78 0.382
Okomu Oil Palm 2018 2.3 0 1 1 0 0.81 7.01 0.3788 0.55 0.333
Okomu Oil Palm 1997 1.99 1 1 1 0 0.76 6.98 0.3788 0.65 0.371
Presco 1998 0.52 1 1 1 0 0.33 6.77 0.3788 0.52 0.405
Presco 1999 0.5 1 1 1 0 0.43 6.82 0.4602 0.81 0.338
Presco 2000 0.5 1 1 1 0 0.44 6.78 0.0797 0.39 0.401
Presco 2001 0.5 1 1 1 0 0.53 6.76 0.0825 0.47 0.427
Presco 2002 0.5 1 1 1 0 0.64 6.7 0.0625 0.43 0.451
Presco 2003 0.5 1 1 1 0 0.66 6.71 0.0625 0.45 0.425
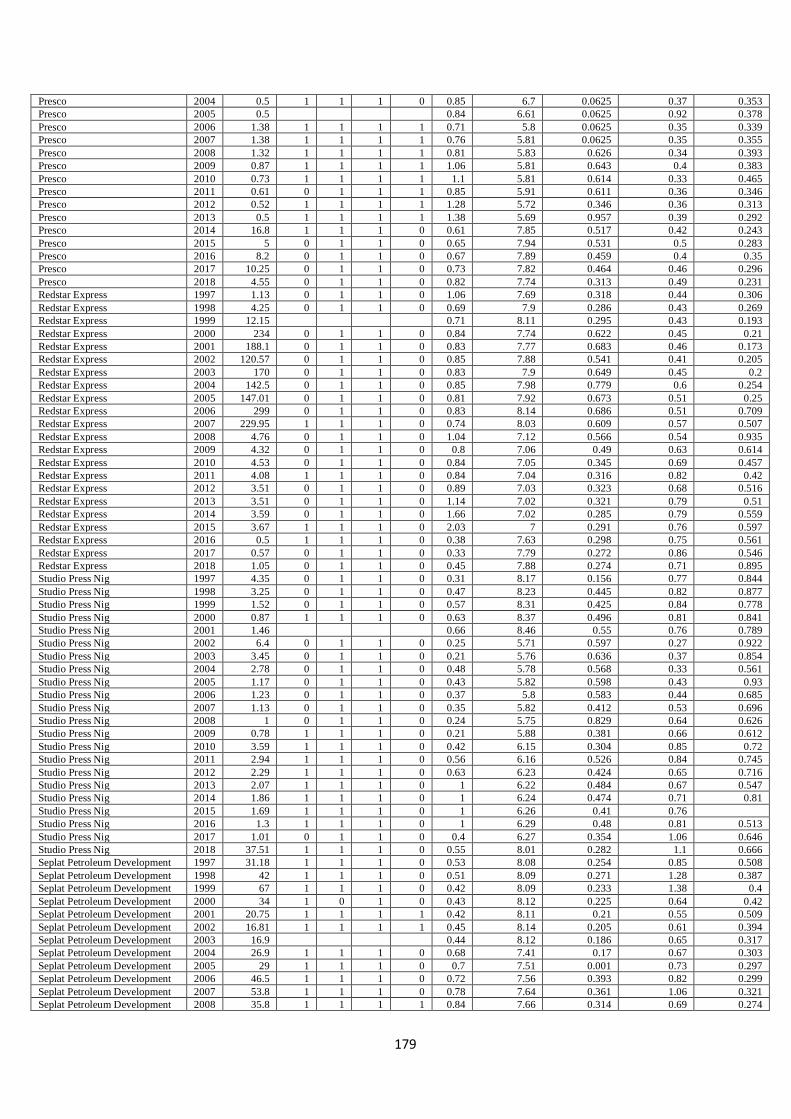
179
Presco 2004 0.5 1 1 1 0 0.85 6.7 0.0625 0.37 0.353
Presco 2005 0.5
0.84 6.61 0.0625 0.92 0.378
Presco 2006 1.38 1 1 1 1 0.71 5.8 0.0625 0.35 0.339
Presco 2007 1.38 1 1 1 1 0.76 5.81 0.0625 0.35 0.355
Presco 2008 1.32 1 1 1 1 0.81 5.83 0.626 0.34 0.393
Presco 2009 0.87 1 1 1 1 1.06 5.81 0.643 0.4 0.383
Presco 2010 0.73 1 1 1 1 1.1 5.81 0.614 0.33 0.465
Presco 2011 0.61 0 1 1 1 0.85 5.91 0.611 0.36 0.346
Presco 2012 0.52 1 1 1 1 1.28 5.72 0.346 0.36 0.313
Presco 2013 0.5 1 1 1 1 1.38 5.69 0.957 0.39 0.292
Presco 2014 16.8 1 1 1 0 0.61 7.85 0.517 0.42 0.243
Presco 2015 5 0 1 1 0 0.65 7.94 0.531 0.5 0.283
Presco 2016 8.2 0 1 1 0 0.67 7.89 0.459 0.4 0.35
Presco 2017 10.25 0 1 1 0 0.73 7.82 0.464 0.46 0.296
Presco 2018 4.55 0 1 1 0 0.82 7.74 0.313 0.49 0.231
Redstar Express 1997 1.13 0 1 1 0 1.06 7.69 0.318 0.44 0.306
Redstar Express 1998 4.25 0 1 1 0 0.69 7.9 0.286 0.43 0.269
Redstar Express 1999 12.15
0.71 8.11 0.295 0.43 0.193
Redstar Express 2000 234 0 1 1 0 0.84 7.74 0.622 0.45 0.21
Redstar Express 2001 188.1 0 1 1 0 0.83 7.77 0.683 0.46 0.173
Redstar Express 2002 120.57 0 1 1 0 0.85 7.88 0.541 0.41 0.205
Redstar Express 2003 170 0 1 1 0 0.83 7.9 0.649 0.45 0.2
Redstar Express 2004 142.5 0 1 1 0 0.85 7.98 0.779 0.6 0.254
Redstar Express 2005 147.01 0 1 1 0 0.81 7.92 0.673 0.51 0.25
Redstar Express 2006 299 0 1 1 0 0.83 8.14 0.686 0.51 0.709
Redstar Express 2007 229.95 1 1 1 0 0.74 8.03 0.609 0.57 0.507
Redstar Express 2008 4.76 0 1 1 0 1.04 7.12 0.566 0.54 0.935
Redstar Express 2009 4.32 0 1 1 0 0.8 7.06 0.49 0.63 0.614
Redstar Express 2010 4.53 0 1 1 0 0.84 7.05 0.345 0.69 0.457
Redstar Express 2011 4.08 1 1 1 0 0.84 7.04 0.316 0.82 0.42
Redstar Express 2012 3.51 0 1 1 0 0.89 7.03 0.323 0.68 0.516
Redstar Express 2013 3.51 0 1 1 0 1.14 7.02 0.321 0.79 0.51
Redstar Express 2014 3.59 0 1 1 0 1.66 7.02 0.285 0.79 0.559
Redstar Express 2015 3.67 1 1 1 0 2.03 7 0.291 0.76 0.597
Redstar Express 2016 0.5 1 1 1 0 0.38 7.63 0.298 0.75 0.561
Redstar Express 2017 0.57 0 1 1 0 0.33 7.79 0.272 0.86 0.546
Redstar Express 2018 1.05 0 1 1 0 0.45 7.88 0.274 0.71 0.895
Studio Press Nig 1997 4.35 0 1 1 0 0.31 8.17 0.156 0.77 0.844
Studio Press Nig 1998 3.25 0 1 1 0 0.47 8.23 0.445 0.82 0.877
Studio Press Nig 1999 1.52 0 1 1 0 0.57 8.31 0.425 0.84 0.778
Studio Press Nig 2000 0.87 1 1 1 0 0.63 8.37 0.496 0.81 0.841
Studio Press Nig 2001 1.46
0.66 8.46 0.55 0.76 0.789
Studio Press Nig 2002 6.4 0 1 1 0 0.25 5.71 0.597 0.27 0.922
Studio Press Nig 2003 3.45 0 1 1 0 0.21 5.76 0.636 0.37 0.854
Studio Press Nig 2004 2.78 0 1 1 0 0.48 5.78 0.568 0.33 0.561
Studio Press Nig 2005 1.17 0 1 1 0 0.43 5.82 0.598 0.43 0.93
Studio Press Nig 2006 1.23 0 1 1 0 0.37 5.8 0.583 0.44 0.685
Studio Press Nig 2007 1.13 0 1 1 0 0.35 5.82 0.412 0.53 0.696
Studio Press Nig 2008 1 0 1 1 0 0.24 5.75 0.829 0.64 0.626
Studio Press Nig 2009 0.78 1 1 1 0 0.21 5.88 0.381 0.66 0.612
Studio Press Nig 2010 3.59 1 1 1 0 0.42 6.15 0.304 0.85 0.72
Studio Press Nig 2011 2.94 1 1 1 0 0.56 6.16 0.526 0.84 0.745
Studio Press Nig 2012 2.29 1 1 1 0 0.63 6.23 0.424 0.65 0.716
Studio Press Nig 2013 2.07 1 1 1 0 1 6.22 0.484 0.67 0.547
Studio Press Nig 2014 1.86 1 1 1 0 1 6.24 0.474 0.71 0.81
Studio Press Nig 2015 1.69 1 1 1 0 1 6.26 0.41 0.76
Studio Press Nig 2016 1.3 1 1 1 0 1 6.29 0.48 0.81 0.513
Studio Press Nig 2017 1.01 0 1 1 0 0.4 6.27 0.354 1.06 0.646
Studio Press Nig 2018 37.51 1 1 1 0 0.55 8.01 0.282 1.1 0.666
Seplat Petroleum Development 1997 31.18 1 1 1 0 0.53 8.08 0.254 0.85 0.508
Seplat Petroleum Development 1998 42 1 1 1 0 0.51 8.09 0.271 1.28 0.387
Seplat Petroleum Development 1999 67 1 1 1 0 0.42 8.09 0.233 1.38 0.4
Seplat Petroleum Development 2000 34 1 0 1 0 0.43 8.12 0.225 0.64 0.42
Seplat Petroleum Development 2001 20.75 1 1 1 1 0.42 8.11 0.21 0.55 0.509
Seplat Petroleum Development 2002 16.81 1 1 1 1 0.45 8.14 0.205 0.61 0.394
Seplat Petroleum Development 2003 16.9
0.44 8.12 0.186 0.65 0.317
Seplat Petroleum Development 2004 26.9 1 1 1 0 0.68 7.41 0.17 0.67 0.303
Seplat Petroleum Development 2005 29 1 1 1 0 0.7 7.51 0.001 0.73 0.297
Seplat Petroleum Development 2006 46.5 1 1 1 0 0.72 7.56 0.393 0.82 0.299
Seplat Petroleum Development 2007 53.8 1 1 1 0 0.78 7.64 0.361 1.06 0.321
Seplat Petroleum Development 2008 35.8 1 1 1 1 0.84 7.66 0.314 0.69 0.274
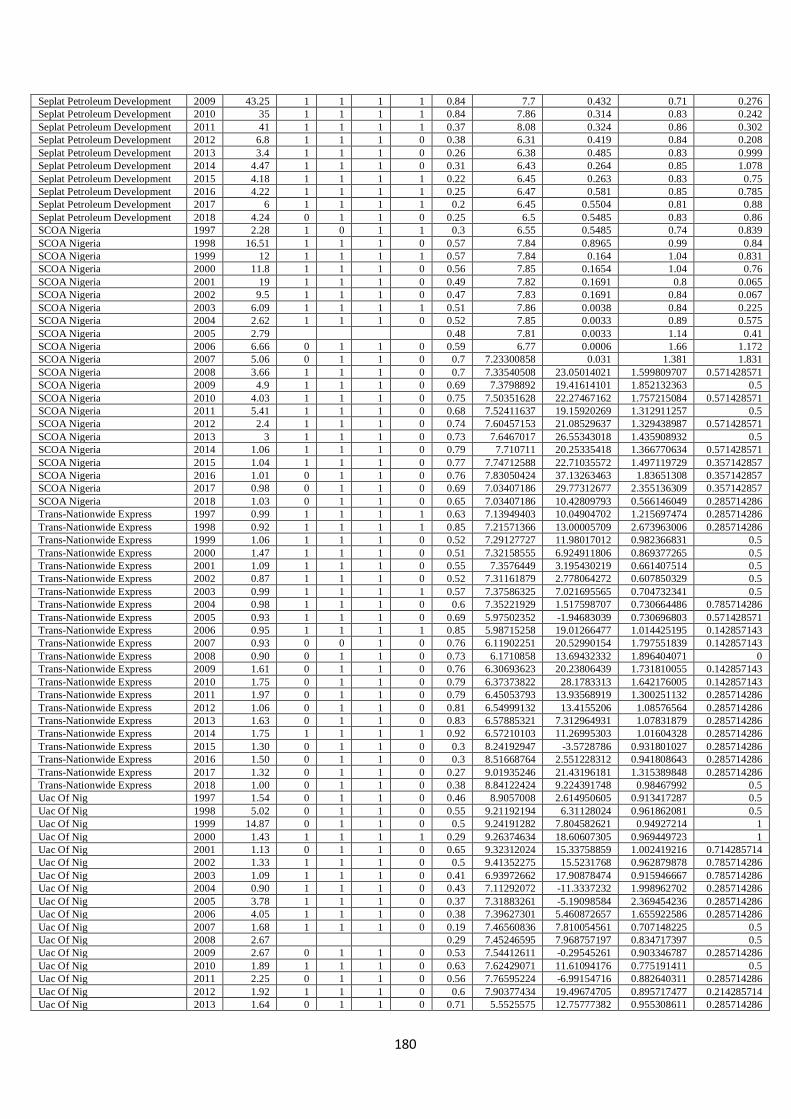
180
Seplat Petroleum Development 2009 43.25 1 1 1 1 0.84 7.7 0.432 0.71 0.276
Seplat Petroleum Development 2010 35 1 1 1 1 0.84 7.86 0.314 0.83 0.242
Seplat Petroleum Development 2011 41 1 1 1 1 0.37 8.08 0.324 0.86 0.302
Seplat Petroleum Development 2012 6.8 1 1 1 0 0.38 6.31 0.419 0.84 0.208
Seplat Petroleum Development 2013 3.4 1 1 1 0 0.26 6.38 0.485 0.83 0.999
Seplat Petroleum Development 2014 4.47 1 1 1 0 0.31 6.43 0.264 0.85 1.078
Seplat Petroleum Development 2015 4.18 1 1 1 1 0.22 6.45 0.263 0.83 0.75
Seplat Petroleum Development 2016 4.22 1 1 1 1 0.25 6.47 0.581 0.85 0.785
Seplat Petroleum Development 2017 6 1 1 1 1 0.2 6.45 0.5504 0.81 0.88
Seplat Petroleum Development 2018 4.24 0 1 1 0 0.25 6.5 0.5485 0.83 0.86
SCOA Nigeria 1997 2.28 1 0 1 1 0.3 6.55 0.5485 0.74 0.839
SCOA Nigeria 1998 16.51 1 1 1 0 0.57 7.84 0.8965 0.99 0.84
SCOA Nigeria 1999 12 1 1 1 1 0.57 7.84 0.164 1.04 0.831
SCOA Nigeria 2000 11.8 1 1 1 0 0.56 7.85 0.1654 1.04 0.76
SCOA Nigeria 2001 19 1 1 1 0 0.49 7.82 0.1691 0.8 0.065
SCOA Nigeria 2002 9.5 1 1 1 0 0.47 7.83 0.1691 0.84 0.067
SCOA Nigeria 2003 6.09 1 1 1 1 0.51 7.86 0.0038 0.84 0.225
SCOA Nigeria 2004 2.62 1 1 1 0 0.52 7.85 0.0033 0.89 0.575
SCOA Nigeria 2005 2.79
0.48 7.81 0.0033 1.14 0.41
SCOA Nigeria 2006 6.66 0 1 1 0 0.59 6.77 0.0006 1.66 1.172
SCOA Nigeria 2007 5.06 0 1 1 0 0.7 7.23300858 0.031 1.381 1.831
SCOA Nigeria 2008 3.66 1 1 1 0 0.7 7.33540508 23.05014021 1.599809707 0.571428571
SCOA Nigeria 2009 4.9 1 1 1 0 0.69 7.3798892 19.41614101 1.852132363 0.5
SCOA Nigeria 2010 4.03 1 1 1 0 0.75 7.50351628 22.27467162 1.757215084 0.571428571
SCOA Nigeria 2011 5.41 1 1 1 0 0.68 7.52411637 19.15920269 1.312911257 0.5
SCOA Nigeria 2012 2.4 1 1 1 0 0.74 7.60457153 21.08529637 1.329438987 0.571428571
SCOA Nigeria 2013 3 1 1 1 0 0.73 7.6467017 26.55343018 1.435908932 0.5
SCOA Nigeria 2014 1.06 1 1 1 0 0.79 7.710711 20.25335418 1.366770634 0.571428571
SCOA Nigeria 2015 1.04 1 1 1 0 0.77 7.74712588 22.71035572 1.497119729 0.357142857
SCOA Nigeria 2016 1.01 0 1 1 0 0.76 7.83050424 37.13263463 1.83651308 0.357142857
SCOA Nigeria 2017 0.98 0 1 1 0 0.69 7.03407186 29.77312677 2.355136309 0.357142857
SCOA Nigeria 2018 1.03 0 1 1 0 0.65 7.03407186 10.42809793 0.566146049 0.285714286
Trans-Nationwide Express 1997 0.99 1 1 1 1 0.63 7.13949403 10.04904702 1.215697474 0.285714286
Trans-Nationwide Express 1998 0.92 1 1 1 1 0.85 7.21571366 13.00005709 2.673963006 0.285714286
Trans-Nationwide Express 1999 1.06 1 1 1 0 0.52 7.29127727 11.98017012 0.982366831 0.5
Trans-Nationwide Express 2000 1.47 1 1 1 0 0.51 7.32158555 6.924911806 0.869377265 0.5
Trans-Nationwide Express 2001 1.09 1 1 1 0 0.55 7.3576449 3.195430219 0.661407514 0.5
Trans-Nationwide Express 2002 0.87 1 1 1 0 0.52 7.31161879 2.778064272 0.607850329 0.5
Trans-Nationwide Express 2003 0.99 1 1 1 1 0.57 7.37586325 7.021695565 0.704732341 0.5
Trans-Nationwide Express 2004 0.98 1 1 1 0 0.6 7.35221929 1.517598707 0.730664486 0.785714286
Trans-Nationwide Express 2005 0.93 1 1 1 0 0.69 5.97502352 -1.94683039 0.730696803 0.571428571
Trans-Nationwide Express 2006 0.95 1 1 1 1 0.85 5.98715258 19.01266477 1.014425195 0.142857143
Trans-Nationwide Express 2007 0.93 0 0 1 0 0.76 6.11902251 20.52990154 1.797551839 0.142857143
Trans-Nationwide Express 2008 0.90 0 1 1 0 0.73 6.1710858 13.69432332 1.896404071 0
Trans-Nationwide Express 2009 1.61 0 1 1 0 0.76 6.30693623 20.23806439 1.731810055 0.142857143
Trans-Nationwide Express 2010 1.75 0 1 1 0 0.79 6.37373822 28.1783313 1.642176005 0.142857143
Trans-Nationwide Express 2011 1.97 0 1 1 0 0.79 6.45053793 13.93568919 1.300251132 0.285714286
Trans-Nationwide Express 2012 1.06 0 1 1 0 0.81 6.54999132 13.4155206 1.08576564 0.285714286
Trans-Nationwide Express 2013 1.63 0 1 1 0 0.83 6.57885321 7.312964931 1.07831879 0.285714286
Trans-Nationwide Express 2014 1.75 1 1 1 1 0.92 6.57210103 11.26995303 1.01604328 0.285714286
Trans-Nationwide Express 2015 1.30 0 1 1 0 0.3 8.24192947 -3.5728786 0.931801027 0.285714286
Trans-Nationwide Express 2016 1.50 0 1 1 0 0.3 8.51668764 2.551228312 0.941808643 0.285714286
Trans-Nationwide Express 2017 1.32 0 1 1 0 0.27 9.01935246 21.43196181 1.315389848 0.285714286
Trans-Nationwide Express 2018 1.00 0 1 1 0 0.38 8.84122424 9.224391748 0.98467992 0.5
Uac Of Nig 1997 1.54 0 1 1 0 0.46 8.9057008 2.614950605 0.913417287 0.5
Uac Of Nig 1998 5.02 0 1 1 0 0.55 9.21192194 6.31128024 0.961862081 0.5
Uac Of Nig 1999 14.87 0 1 1 0 0.5 9.24191282 7.804582621 0.94927214 1
Uac Of Nig 2000 1.43 1 1 1 1 0.29 9.26374634 18.60607305 0.969449723 1
Uac Of Nig 2001 1.13 0 1 1 0 0.65 9.32312024 15.33758859 1.002419216 0.714285714
Uac Of Nig 2002 1.33 1 1 1 0 0.5 9.41352275 15.5231768 0.962879878 0.785714286
Uac Of Nig 2003 1.09 1 1 1 0 0.41 6.93972662 17.90878474 0.915946667 0.785714286
Uac Of Nig 2004 0.90 1 1 1 0 0.43 7.11292072 -11.3337232 1.998962702 0.285714286
Uac Of Nig 2005 3.78 1 1 1 0 0.37 7.31883261 -5.19098584 2.369454236 0.285714286
Uac Of Nig 2006 4.05 1 1 1 0 0.38 7.39627301 5.460872657 1.655922586 0.285714286
Uac Of Nig 2007 1.68 1 1 1 0 0.19 7.46560836 7.810054561 0.707148225 0.5
Uac Of Nig 2008 2.67
0.29 7.45246595 7.968757197 0.834717397 0.5
Uac Of Nig 2009 2.67 0 1 1 0 0.53 7.54412611 -0.29545261 0.903346787 0.285714286
Uac Of Nig 2010 1.89 1 1 1 0 0.63 7.62429071 11.61094176 0.775191411 0.5
Uac Of Nig 2011 2.25 0 1 1 0 0.56 7.76595224 -6.99154716 0.882640311 0.285714286
Uac Of Nig 2012 1.92 1 1 1 0 0.6 7.90377434 19.49674705 0.895717477 0.214285714
Uac Of Nig 2013 1.64 0 1 1 0 0.71 5.5525575 12.75777382 0.955308611 0.285714286
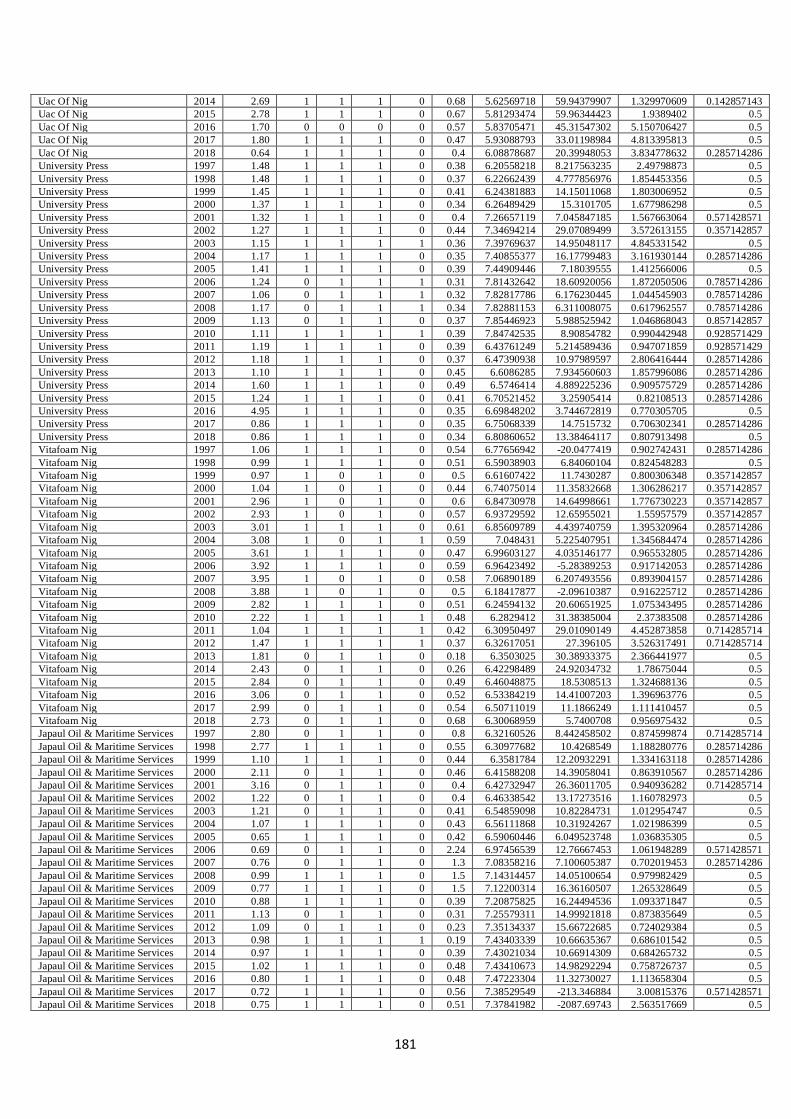
181
Uac Of Nig 2014 2.69 1 1 1 0 0.68 5.62569718 59.94379907 1.329970609 0.142857143
Uac Of Nig 2015 2.78 1 1 1 0 0.67 5.81293474 59.96344423 1.9389402 0.5
Uac Of Nig 2016 1.70 0 0 0 0 0.57 5.83705471 45.31547302 5.150706427 0.5
Uac Of Nig 2017 1.80 1 1 1 0 0.47 5.93088793 33.01198984 4.813395813 0.5
Uac Of Nig 2018 0.64 1 1 1 0 0.4 6.08878687 20.39948053 3.834778632 0.285714286
University Press 1997 1.48 1 1 1 0 0.38 6.20558218 8.217563235 2.49798873 0.5
University Press 1998 1.48 1 1 1 0 0.37 6.22662439 4.777856976 1.854453356 0.5
University Press 1999 1.45 1 1 1 0 0.41 6.24381883 14.15011068 1.803006952 0.5
University Press 2000 1.37 1 1 1 0 0.34 6.26489429 15.3101705 1.677986298 0.5
University Press 2001 1.32 1 1 1 0 0.4 7.26657119 7.045847185 1.567663064 0.571428571
University Press 2002 1.27 1 1 1 0 0.44 7.34694214 29.07089499 3.572613155 0.357142857
University Press 2003 1.15 1 1 1 1 0.36 7.39769637 14.95048117 4.845331542 0.5
University Press 2004 1.17 1 1 1 0 0.35 7.40855377 16.17799483 3.161930144 0.285714286
University Press 2005 1.41 1 1 1 0 0.39 7.44909446 7.18039555 1.412566006 0.5
University Press 2006 1.24 0 1 1 1 0.31 7.81432642 18.60920056 1.872050506 0.785714286
University Press 2007 1.06 0 1 1 1 0.32 7.82817786 6.176230445 1.044545903 0.785714286
University Press 2008 1.17 0 1 1 1 0.34 7.82881153 6.311008075 0.617962557 0.785714286
University Press 2009 1.13 0 1 1 0 0.37 7.85446923 5.988525942 1.046868043 0.857142857
University Press 2010 1.11 1 1 1 1 0.39 7.84742535 8.90854782 0.990442948 0.928571429
University Press 2011 1.19 1 1 1 0 0.39 6.43761249 5.214589436 0.947071859 0.928571429
University Press 2012 1.18 1 1 1 0 0.37 6.47390938 10.97989597 2.806416444 0.285714286
University Press 2013 1.10 1 1 1 0 0.45 6.6086285 7.934560603 1.857996086 0.285714286
University Press 2014 1.60 1 1 1 0 0.49 6.5746414 4.889225236 0.909575729 0.285714286
University Press 2015 1.24 1 1 1 0 0.41 6.70521452 3.25905414 0.82108513 0.285714286
University Press 2016 4.95 1 1 1 0 0.35 6.69848202 3.744672819 0.770305705 0.5
University Press 2017 0.86 1 1 1 0 0.35 6.75068339 14.7515732 0.706302341 0.285714286
University Press 2018 0.86 1 1 1 0 0.34 6.80860652 13.38464117 0.807913498 0.5
Vitafoam Nig 1997 1.06 1 1 1 0 0.54 6.77656942 -20.0477419 0.902742431 0.285714286
Vitafoam Nig 1998 0.99 1 1 1 0 0.51 6.59038903 6.84060104 0.824548283 0.5
Vitafoam Nig 1999 0.97 1 0 1 0 0.5 6.61607422 11.7430287 0.800306348 0.357142857
Vitafoam Nig 2000 1.04 1 0 1 0 0.44 6.74075014 11.35832668 1.306286217 0.357142857
Vitafoam Nig 2001 2.96 1 0 1 0 0.6 6.84730978 14.64998661 1.776730223 0.357142857
Vitafoam Nig 2002 2.93 1 0 1 0 0.57 6.93729592 12.65955021 1.55957579 0.357142857
Vitafoam Nig 2003 3.01 1 1 1 0 0.61 6.85609789 4.439740759 1.395320964 0.285714286
Vitafoam Nig 2004 3.08 1 0 1 1 0.59 7.048431 5.225407951 1.345684474 0.285714286
Vitafoam Nig 2005 3.61 1 1 1 0 0.47 6.99603127 4.035146177 0.965532805 0.285714286
Vitafoam Nig 2006 3.92 1 1 1 0 0.59 6.96423492 -5.28389253 0.917142053 0.285714286
Vitafoam Nig 2007 3.95 1 0 1 0 0.58 7.06890189 6.207493556 0.893904157 0.285714286
Vitafoam Nig 2008 3.88 1 0 1 0 0.5 6.18417877 -2.09610387 0.916225712 0.285714286
Vitafoam Nig 2009 2.82 1 1 1 0 0.51 6.24594132 20.60651925 1.075343495 0.285714286
Vitafoam Nig 2010 2.22 1 1 1 1 0.48 6.2829412 31.38385004 2.37383508 0.285714286
Vitafoam Nig 2011 1.04 1 1 1 1 0.42 6.30950497 29.01090149 4.452873858 0.714285714
Vitafoam Nig 2012 1.47 1 1 1 1 0.37 6.32617051 27.396105 3.526317491 0.714285714
Vitafoam Nig 2013 1.81 0 1 1 0 0.18 6.3503025 30.38933375 2.366441977 0.5
Vitafoam Nig 2014 2.43 0 1 1 0 0.26 6.42298489 24.92034732 1.78675044 0.5
Vitafoam Nig 2015 2.84 0 1 1 0 0.49 6.46048875 18.5308513 1.324688136 0.5
Vitafoam Nig 2016 3.06 0 1 1 0 0.52 6.53384219 14.41007203 1.396963776 0.5
Vitafoam Nig 2017 2.99 0 1 1 0 0.54 6.50711019 11.1866249 1.111410457 0.5
Vitafoam Nig 2018 2.73 0 1 1 0 0.68 6.30068959 5.7400708 0.956975432 0.5
Japaul Oil & Maritime Services 1997 2.80 0 1 1 0 0.8 6.32160526 8.442458502 0.874599874 0.714285714
Japaul Oil & Maritime Services 1998 2.77 1 1 1 0 0.55 6.30977682 10.4268549 1.188280776 0.285714286
Japaul Oil & Maritime Services 1999 1.10 1 1 1 0 0.44 6.3581784 12.20932291 1.334163118 0.285714286
Japaul Oil & Maritime Services 2000 2.11 0 1 1 0 0.46 6.41588208 14.39058041 0.863910567 0.285714286
Japaul Oil & Maritime Services 2001 3.16 0 1 1 0 0.4 6.42732947 26.36011705 0.940936282 0.714285714
Japaul Oil & Maritime Services 2002 1.22 0 1 1 0 0.4 6.46338542 13.17273516 1.160782973 0.5
Japaul Oil & Maritime Services 2003 1.21 0 1 1 0 0.41 6.54859098 10.82284731 1.012954747 0.5
Japaul Oil & Maritime Services 2004 1.07 1 1 1 0 0.43 6.56111868 10.31924267 1.021986399 0.5
Japaul Oil & Maritime Services 2005 0.65 1 1 1 0 0.42 6.59060446 6.049523748 1.036835305 0.5
Japaul Oil & Maritime Services 2006 0.69 0 1 1 0 2.24 6.97456539 12.76667453 1.061948289 0.571428571
Japaul Oil & Maritime Services 2007 0.76 0 1 1 0 1.3 7.08358216 7.100605387 0.702019453 0.285714286
Japaul Oil & Maritime Services 2008 0.99 1 1 1 0 1.5 7.14314457 14.05100654 0.979982429 0.5
Japaul Oil & Maritime Services 2009 0.77 1 1 1 0 1.5 7.12200314 16.36160507 1.265328649 0.5
Japaul Oil & Maritime Services 2010 0.88 1 1 1 0 0.39 7.20875825 16.24494536 1.093371847 0.5
Japaul Oil & Maritime Services 2011 1.13 0 1 1 0 0.31 7.25579311 14.99921818 0.873835649 0.5
Japaul Oil & Maritime Services 2012 1.09 0 1 1 0 0.23 7.35134337 15.66722685 0.724029384 0.5
Japaul Oil & Maritime Services 2013 0.98 1 1 1 1 0.19 7.43403339 10.66635367 0.686101542 0.5
Japaul Oil & Maritime Services 2014 0.97 1 1 1 0 0.39 7.43021034 10.66914309 0.684265732 0.5
Japaul Oil & Maritime Services 2015 1.02 1 1 1 0 0.48 7.43410673 14.98292294 0.758726737 0.5
Japaul Oil & Maritime Services 2016 0.80 1 1 1 0 0.48 7.47223304 11.32730027 1.113658304 0.5
Japaul Oil & Maritime Services 2017 0.72 1 1 1 0 0.56 7.38529549 -213.346884 3.00815376 0.571428571
Japaul Oil & Maritime Services 2018 0.75 1 1 1 0 0.51 7.37841982 -2087.69743 2.563517669 0.5
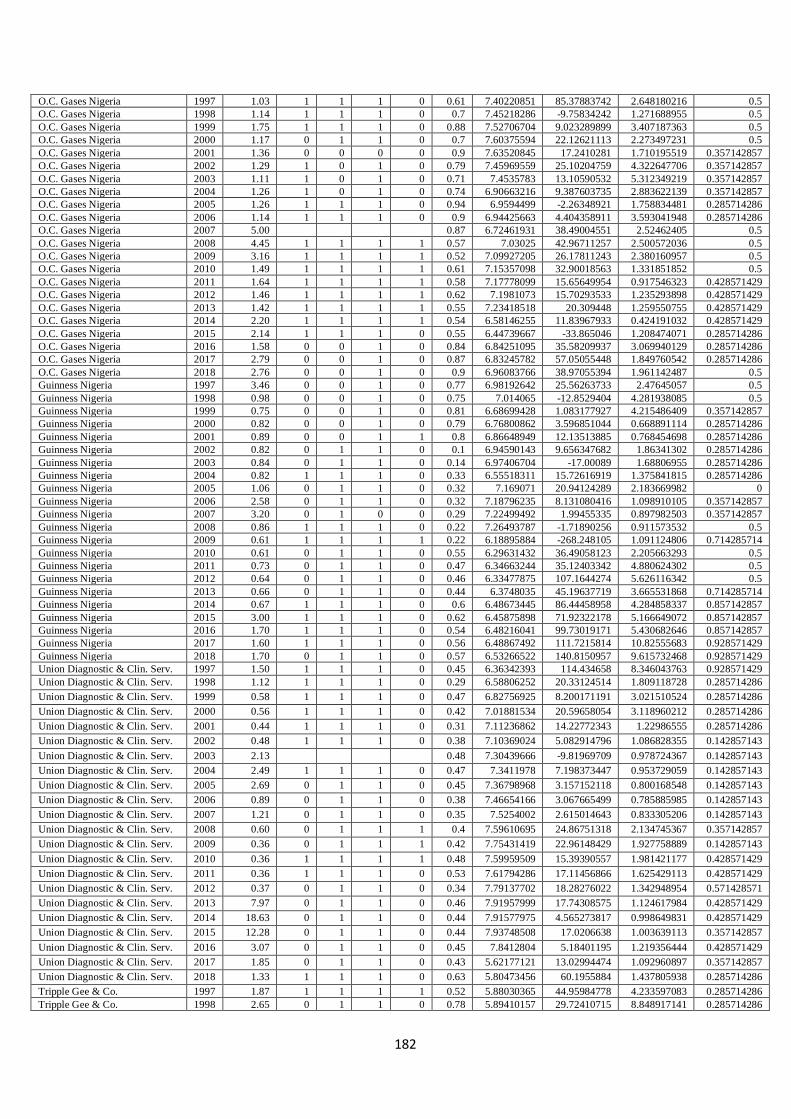
182
O.C. Gases Nigeria 1997 1.03 1 1 1 0 0.61 7.40220851 85.37883742 2.648180216 0.5
O.C. Gases Nigeria 1998 1.14 1 1 1 0 0.7 7.45218286 -9.75834242 1.271688955 0.5
O.C. Gases Nigeria 1999 1.75 1 1 1 0 0.88 7.52706704 9.023289899 3.407187363 0.5
O.C. Gases Nigeria 2000 1.17 0 1 1 0 0.7 7.60375594 22.12621113 2.273497231 0.5
O.C. Gases Nigeria 2001 1.36 0 0 0 0 0.9 7.63520845 17.2410281 1.710195519 0.357142857
O.C. Gases Nigeria 2002 1.29 1 0 1 0 0.79 7.45969559 25.10204759 4.322647706 0.357142857
O.C. Gases Nigeria 2003 1.11 1 0 1 0 0.71 7.4535783 13.10590532 5.312349219 0.357142857
O.C. Gases Nigeria 2004 1.26 1 0 1 0 0.74 6.90663216 9.387603735 2.883622139 0.357142857
O.C. Gases Nigeria 2005 1.26 1 1 1 0 0.94 6.9594499 -2.26348921 1.758834481 0.285714286
O.C. Gases Nigeria 2006 1.14 1 1 1 0 0.9 6.94425663 4.404358911 3.593041948 0.285714286
O.C. Gases Nigeria 2007 5.00
0.87 6.72461931 38.49004551 2.52462405 0.5
O.C. Gases Nigeria 2008 4.45 1 1 1 1 0.57 7.03025 42.96711257 2.500572036 0.5
O.C. Gases Nigeria 2009 3.16 1 1 1 1 0.52 7.09927205 26.17811243 2.380160957 0.5
O.C. Gases Nigeria 2010 1.49 1 1 1 1 0.61 7.15357098 32.90018563 1.331851852 0.5
O.C. Gases Nigeria 2011 1.64 1 1 1 1 0.58 7.17778099 15.65649954 0.917546323 0.428571429
O.C. Gases Nigeria 2012 1.46 1 1 1 1 0.62 7.1981073 15.70293533 1.235293898 0.428571429
O.C. Gases Nigeria 2013 1.42 1 1 1 1 0.55 7.23418518 20.309448 1.259550755 0.428571429
O.C. Gases Nigeria 2014 2.20 1 1 1 1 0.54 6.58146255 11.83967933 0.424191032 0.428571429
O.C. Gases Nigeria 2015 2.14 1 1 1 0 0.55 6.44739667 -33.865046 1.208474071 0.285714286
O.C. Gases Nigeria 2016 1.58 0 0 1 0 0.84 6.84251095 35.58209937 3.069940129 0.285714286
O.C. Gases Nigeria 2017 2.79 0 0 1 0 0.87 6.83245782 57.05055448 1.849760542 0.285714286
O.C. Gases Nigeria 2018 2.76 0 0 1 0 0.9 6.96083766 38.97055394 1.961142487 0.5
Guinness Nigeria 1997 3.46 0 0 1 0 0.77 6.98192642 25.56263733 2.47645057 0.5
Guinness Nigeria 1998 0.98 0 0 1 0 0.75 7.014065 -12.8529404 4.281938085 0.5
Guinness Nigeria 1999 0.75 0 0 1 0 0.81 6.68699428 1.083177927 4.215486409 0.357142857
Guinness Nigeria 2000 0.82 0 0 1 0 0.79 6.76800862 3.596851044 0.668891114 0.285714286
Guinness Nigeria 2001 0.89 0 0 1 1 0.8 6.86648949 12.13513885 0.768454698 0.285714286
Guinness Nigeria 2002 0.82 0 1 1 0 0.1 6.94590143 9.656347682 1.86341302 0.285714286
Guinness Nigeria 2003 0.84 0 1 1 0 0.14 6.97406704 -17.00089 1.68806955 0.285714286
Guinness Nigeria 2004 0.82 1 1 1 0 0.33 6.55518311 15.72616919 1.375841815 0.285714286
Guinness Nigeria 2005 1.06 0 1 1 0 0.32 7.169071 20.94124289 2.183669982 0
Guinness Nigeria 2006 2.58 0 1 1 0 0.32 7.18796235 8.131080416 1.098910105 0.357142857
Guinness Nigeria 2007 3.20 0 1 0 0 0.29 7.22499492 1.99455335 0.897982503 0.357142857
Guinness Nigeria 2008 0.86 1 1 1 0 0.22 7.26493787 -1.71890256 0.911573532 0.5
Guinness Nigeria 2009 0.61 1 1 1 1 0.22 6.18895884 -268.248105 1.091124806 0.714285714
Guinness Nigeria 2010 0.61 0 1 1 0 0.55 6.29631432 36.49058123 2.205663293 0.5
Guinness Nigeria 2011 0.73 0 1 1 0 0.47 6.34663244 35.12403342 4.880624302 0.5
Guinness Nigeria 2012 0.64 0 1 1 0 0.46 6.33477875 107.1644274 5.626116342 0.5
Guinness Nigeria 2013 0.66 0 1 1 0 0.44 6.3748035 45.19637719 3.665531868 0.714285714
Guinness Nigeria 2014 0.67 1 1 1 0 0.6 6.48673445 86.44458958 4.284858337 0.857142857
Guinness Nigeria 2015 3.00 1 1 1 0 0.62 6.45875898 71.92322178 5.166649072 0.857142857
Guinness Nigeria 2016 1.70 1 1 1 0 0.54 6.48216041 99.73019171 5.430682646 0.857142857
Guinness Nigeria 2017 1.60 1 1 1 0 0.56 6.48867492 111.7215814 10.82555683 0.928571429
Guinness Nigeria 2018 1.70 0 1 1 0 0.57 6.53266522 140.8150957 9.615732468 0.928571429
Union Diagnostic & Clin. Serv. 1997 1.50 1 1 1 0 0.45 6.36342393 114.434658 8.346043763 0.928571429
Union Diagnostic & Clin. Serv. 1998 1.12 1 1 1 0 0.29 6.58806252 20.33124514 1.809118728 0.285714286
Union Diagnostic & Clin. Serv. 1999 0.58 1 1 1 0 0.47 6.82756925 8.200171191 3.021510524 0.285714286
Union Diagnostic & Clin. Serv. 2000 0.56 1 1 1 0 0.42 7.01881534 20.59658054 3.118960212 0.285714286
Union Diagnostic & Clin. Serv. 2001 0.44 1 1 1 0 0.31 7.11236862 14.22772343 1.22986555 0.285714286
Union Diagnostic & Clin. Serv. 2002 0.48 1 1 1 0 0.38 7.10369024 5.082914796 1.086828355 0.142857143
Union Diagnostic & Clin. Serv. 2003 2.13
0.48 7.30439666 -9.81969709 0.978724367 0.142857143
Union Diagnostic & Clin. Serv. 2004 2.49 1 1 1 0 0.47 7.3411978 7.198373447 0.953729059 0.142857143
Union Diagnostic & Clin. Serv. 2005 2.69 0 1 1 0 0.45 7.36798968 3.157152118 0.800168548 0.142857143
Union Diagnostic & Clin. Serv. 2006 0.89 0 1 1 0 0.38 7.46654166 3.067665499 0.785885985 0.142857143
Union Diagnostic & Clin. Serv. 2007 1.21 0 1 1 0 0.35 7.5254002 2.615014643 0.833305206 0.142857143
Union Diagnostic & Clin. Serv. 2008 0.60 0 1 1 1 0.4 7.59610695 24.86751318 2.134745367 0.357142857
Union Diagnostic & Clin. Serv. 2009 0.36 0 1 1 1 0.42 7.75431419 22.96148429 1.927758889 0.142857143
Union Diagnostic & Clin. Serv. 2010 0.36 1 1 1 1 0.48 7.59959509 15.39390557 1.981421177 0.428571429
Union Diagnostic & Clin. Serv. 2011 0.36 1 1 1 0 0.53 7.61794286 17.11456866 1.625429113 0.428571429
Union Diagnostic & Clin. Serv. 2012 0.37 0 1 1 0 0.34 7.79137702 18.28276022 1.342948954 0.571428571
Union Diagnostic & Clin. Serv. 2013 7.97 0 1 1 0 0.46 7.91957999 17.74308575 1.124617984 0.428571429
Union Diagnostic & Clin. Serv. 2014 18.63 0 1 1 0 0.44 7.91577975 4.565273817 0.998649831 0.428571429
Union Diagnostic & Clin. Serv. 2015 12.28 0 1 1 0 0.44 7.93748508 17.0206638 1.003639113 0.357142857
Union Diagnostic & Clin. Serv. 2016 3.07 0 1 1 0 0.45 7.8412804 5.18401195 1.219356444 0.428571429
Union Diagnostic & Clin. Serv. 2017 1.85 0 1 1 0 0.43 5.62177121 13.02994474 1.092960897 0.357142857
Union Diagnostic & Clin. Serv. 2018 1.33 1 1 1 0 0.63 5.80473456 60.1955884 1.437805938 0.285714286
Tripple Gee & Co. 1997 1.87 1 1 1 1 0.52 5.88030365 44.95984778 4.233597083 0.285714286
Tripple Gee & Co. 1998 2.65 0 1 1 0 0.78 5.89410157 29.72410715 8.848917141 0.285714286

183
Tripple Gee & Co. 1999 1.76 1 1 1 0 0.75 6.02566135 19.57540194 2.80245368 0.285714286
Tripple Gee & Co. 2000 1.44 1 1 1 0 0.75 5.97101454 29.08359736 2.061614611 0.285714286
Tripple Gee & Co. 2001 1.66 1 1 1 0 0.74 5.9738706 17.0141418 1.645005985 0.285714286
Tripple Gee & Co. 2002 3.17 1 1 1 0 0.74 6.03094969 15.45569598 1.292799647 0.357142857
Tripple Gee & Co. 2003 2.33 1 1 1 0 0.71 6.24171329 25.34047132 1.911863565 0.285714286
Tripple Gee & Co. 2004 1.27 0 0 1 0 0.79 6.29420447 29.60055909 1.523924773 0.5
Tripple Gee & Co. 2005 1.32 1 1 1 0 0.82 6.04029451 20.06276632 1.328997706 0.571428571
Tripple Gee & Co. 2006 1.09 1 1 1 0 0.5 6.28344552 37.19032548 1.798198801 0.285714286
Tripple Gee & Co. 2007 0.81 1 1 1 0 0.6 6.50780893 10.56901812 1.749696137 0.285714286
Tripple Gee & Co. 2008 0.89 0 1 1 0 0.81 6.42386393 -20.6696038 1.596637894 0.285714286
Tripple Gee & Co. 2009 0.83 0 1 1 0 0.61 6.43392609 -76.1229633 1.575994124 0.285714286
Tripple Gee & Co. 2010 0.79 0 1 1 0 0.78 6.43595547 -40.241818 1.350929334 0.285714286
Tripple Gee & Co. 2011 3.18 0 1 1 0 0.66 6.41185833 -9.09364482 0.898544588 0.5
Tripple Gee & Co. 2012 3.18 0 1 1 0 0.66 6.41955231 -4.14315542 0.848543401 0.5
Tripple Gee & Co. 2013 4.39 1 1 1 1 0.74 6.39139 6.791830986 0.905429956 0.5
Tripple Gee & Co. 2014 2.23 0 1 1 0 0.05 6.36704509 -5.63746948 0.86497141 0.5
Tripple Gee & Co. 2015 4.27 0 1 1 0 0.06 5.97251294 7.713533998 0.798942121 0.5
Tripple Gee & Co. 2016 2.48 0 1 1 0 0.14 6.51555065 26.21111247 12.4705935 0.714285714
Tripple Gee & Co. 2017 1.96 0 1 1 0 0.28 6.98166325 -11.4337219 3.581179205 0.5
Tripple Gee & Co. 2018 1.63 0 1 1 0 0.36 7.01172274 -52.2492519 3.455756109 0.5
Pz Cussons 1997 1.63 0 1 1 0 0.4 6.96747777 -38.3157946 3.625495342 0.714285714
Pz Cussons 1998 1.72 0 1 1 0 0.49 7.1676662 15.6307339 1.411759703 0.5
Pz Cussons 1999 1.05
0.47 7.52130614 20.75681849 1.02577977 0.5
Pz Cussons 2000 1.34 0 1 1 0 0.34 7.26133768 14.79350425 0.915372845 0.357142857
Pz Cussons 2001 6.47 0 1 1 0 0.45 7.11492342 9.889252956 0.806920222 0.357142857
Pz Cussons 2002 3.67 0 1 1 0 0.52 7.45584045 11.57180637 1.054012512 0.285714286
Pz Cussons 2003 3.50 0 1 1 0 0.57 6.58199253 13.19736419 0.770320806 0.285714286
Pz Cussons 2004 3.00 1 1 1 0 0.63 6.63826506 8.056793189 0.942641515 0.285714286
Pz Cussons 2005 2.18 1 1 1 0 0.62 6.67183933 -23.9461674 1.485347891 0.285714286
Pz Cussons 2006 0.80 1 1 1 0 0.6 6.59847818 -61.9213289 1.464663575 0.285714286
Pz Cussons 2007 0.91 1 1 1 0 0.56 6.61206275 1351.818196 1.320699072 0.285714286
Pz Cussons 2008 1.13 0 1 1 0 0.4 6.84132768 -15.361826 1.175571101 0.285714286
Pz Cussons 2009 2.28 1 1 1 1 0.4 6.86359608 463.0887887 0.698285437 0.285714286
Pz Cussons 2010 2.75 1 1 1 0 0.49 6.85152765 10.05893854 0.664076362 0.285714286
Pz Cussons 2011 7.74 1 1 1 0 0.46 6.8228332 -49.6025789 0.984606545 0.285714286
Pz Cussons 2012 2.58 1 1 1 0 0.45 8.08310598 -81.0257726 0.985498087 0.285714286
Pz Cussons 2013 1.01 1 1 1 0 0.42 8.33911759 12.54101886 1.18496228 0.5
Pz Cussons 2014 0.97 1 1 1 0 0.47 8.72874288 15.66140013 1.673128944 0.285714286
Pz Cussons 2015 0.81 0 1 1 0 0.48 8.70438756 9.734265742 1.253462665 0.714285714
Pz Cussons 2016 0.82 0 1 1 0 0.63 8.6827 1.105525965 0.890760317 0.285714286
Pz Cussons 2017 0.89 0 1 1 0 0.69 8.86799398 4.485305997 0.874266493 0.5
Pz Cussons 2018 0.87 1 1 1 1 0.65 8.96111722 1.881201814 0.893867171 0.5
Morison Industries 1997 0.90 1 1 1 1 0.7 9.03391287 11.27249079 0.867813431 0.714285714
Morison Industries 1998 0.80 1 1 1 1 0.72 9.07445987 4.723624239 0.926713225 0.642857143
Morison Industries 1999 0.60 1 1 1 1 0.75 9.0905127 7.969453125 0.902841292 0.928571429
Morison Industries 2000 0.70 1 1 1 0 0.72 6.86350665 7.5764511 0.88627994 0.928571429
Morison Industries 2001 0.93 1 1 1 1 0.79 6.87641167 0.370772132 0.914888196 0.285714286
Morison Industries 2002 0.90 1 1 0 0 0.63 6.9384271 -50.0820125 1.250259255 0.285714286
Morison Industries 2003 1.08 0 1 0 0 0.87 7.01042993 -13.0456908 1.477888605 0.285714286
Morison Industries 2004 1.05 0 1 1 0 0.82 7.02186763 0.729082195 0.594082243 0.285714286
Morison Industries 2005 0.95 0 1 1 0 0.6 6.99791669 -5.3359807 0.50810335 0.285714286
Morison Industries 2006 0.92 0 1 1 0 0.68 6.94774081 -4.62910896 0.509559949 0.714285714
Morison Industries 2007 5.80 1 1 1 0 0.89 6.93302101 -22.2535782 0.60995755 0.5
Morison Industries 2008 6.74 1 1 1 0 0.69 6.92819387 2.106583956 0.585187683 0.5
Morison Industries 2009 4.95 1 1 1 0 0.62 6.91577371 0.642477397 0.577137636 0.5
Morison Industries 2010 1.76 0 1 1 0 0.48 7.88162362 2.329997686 0.551586252 0.5
Morison Industries 2011 2.77 0 1 1 0 0.48 8.03802512 22.18907933 1.74556293 0.285714286
Morison Industries 2012 1.80 0 1 1 0 0.55 8.13836718 11.1013412 1.972580229 0.285714286
Morison Industries 2013 1.54 0 1 1 0 0.63 8.1569131 11.56646618 1.06007759 0.571428571
Morison Industries 2014 3.03 0 1 1 0 0.73 8.21288475 7.306136717 1.634022448 0.357142857
Morison Industries 2015 2.78 0 1 1 0 0.78 8.36708999 18.90213414 1.748036391 0.357142857
Morison Industries 2016 1.72 0 1 1 0 0.77 8.4475413 10.17315205 1.299764265 0.857142857
Morison Industries 2017 4.00 0 1 1 0 0.92 8.47312105 9.210077157 1.496591698 0.857142857
Morison Industries 2018 4.88 1 1 1 1 0.47 8.53510339 6.42402045 1.32161136 0.928571429
Cadbury Nigeria 1997 10.85 1 1 1 1 0.5 7.4190784 10.03297117 0.995074791 0.857142857
Cadbury Nigeria 1998 3.37 1 1 1 0 0.51 7.05181188 29.33692945 1.536534578 0.285714286
Cadbury Nigeria 1999 6.02 1 1 1 0 0.53 7.29721646 77.73615154 5.019100867 0.5
Cadbury Nigeria 2000 1.30 1 1 1 0 0.54 7.94375215 73.29112619 14.86776484 0.5
Cadbury Nigeria 2001 1.30 1 1 1 1 0.58 7.83903475 -27.6848696 1.43131134 0.285714286
Cadbury Nigeria 2002 1.23 1 1 1 1 0.4 7.65538218 -10.8255992 1.129065209 0.357142857
Cadbury Nigeria 2003 1.10
0.35 7.62852112 -331.724125 1.33031245 0.142857143
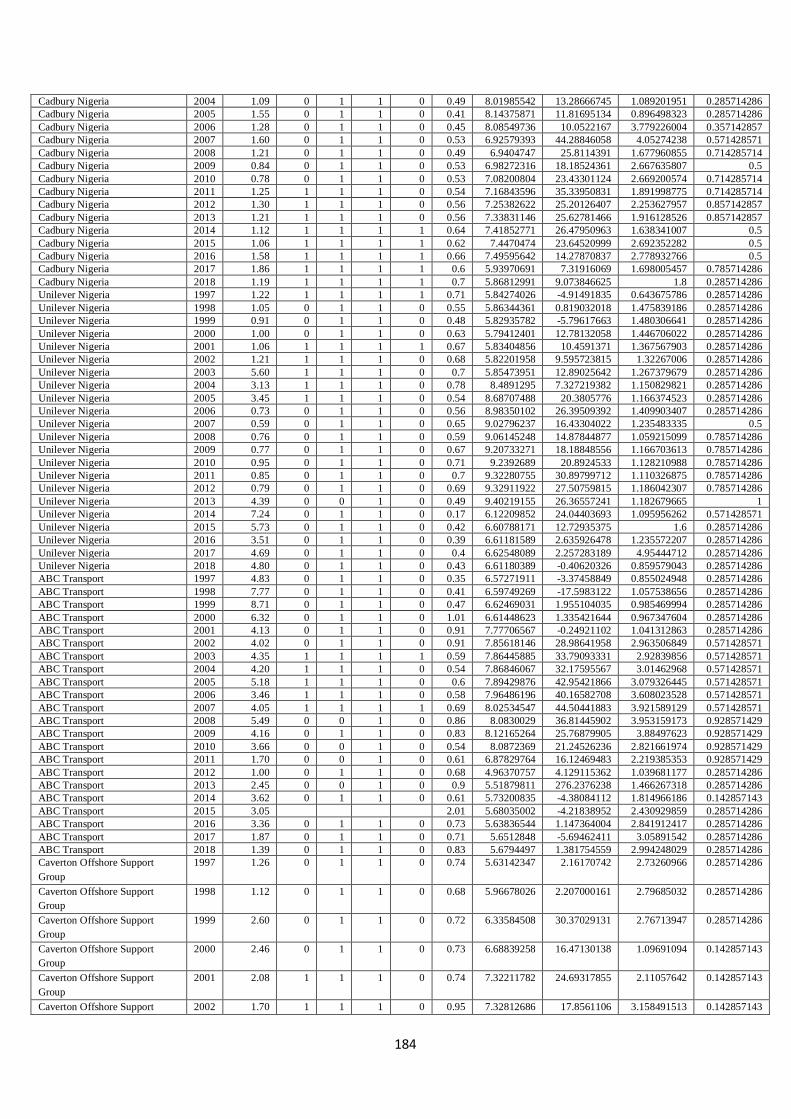
184
Cadbury Nigeria 2004 1.09 0 1 1 0 0.49 8.01985542 13.28666745 1.089201951 0.285714286
Cadbury Nigeria 2005 1.55 0 1 1 0 0.41 8.14375871 11.81695134 0.896498323 0.285714286
Cadbury Nigeria 2006 1.28 0 1 1 0 0.45 8.08549736 10.0522167 3.779226004 0.357142857
Cadbury Nigeria 2007 1.60 0 1 1 0 0.53 6.92579393 44.28846058 4.05274238 0.571428571
Cadbury Nigeria 2008 1.21 0 1 1 0 0.49 6.9404747 25.8114391 1.677960855 0.714285714
Cadbury Nigeria 2009 0.84 0 1 1 0 0.53 6.98272316 18.18524361 2.667635807 0.5
Cadbury Nigeria 2010 0.78 0 1 1 0 0.53 7.08200804 23.43301124 2.669200574 0.714285714
Cadbury Nigeria 2011 1.25 1 1 1 0 0.54 7.16843596 35.33950831 1.891998775 0.714285714
Cadbury Nigeria 2012 1.30 1 1 1 0 0.56 7.25382622 25.20126407 2.253627957 0.857142857
Cadbury Nigeria 2013 1.21 1 1 1 0 0.56 7.33831146 25.62781466 1.916128526 0.857142857
Cadbury Nigeria 2014 1.12 1 1 1 1 0.64 7.41852771 26.47950963 1.638341007 0.5
Cadbury Nigeria 2015 1.06 1 1 1 1 0.62 7.4470474 23.64520999 2.692352282 0.5
Cadbury Nigeria 2016 1.58 1 1 1 1 0.66 7.49595642 14.27870837 2.778932766 0.5
Cadbury Nigeria 2017 1.86 1 1 1 1 0.6 5.93970691 7.31916069 1.698005457 0.785714286
Cadbury Nigeria 2018 1.19 1 1 1 1 0.7 5.86812991 9.073846625 1.8 0.285714286
Unilever Nigeria 1997 1.22 1 1 1 1 0.71 5.84274026 -4.91491835 0.643675786 0.285714286
Unilever Nigeria 1998 1.05 0 1 1 0 0.55 5.86344361 0.819032018 1.475839186 0.285714286
Unilever Nigeria 1999 0.91 0 1 1 0 0.48 5.82935782 -5.79617663 1.480306641 0.285714286
Unilever Nigeria 2000 1.00 0 1 1 0 0.63 5.79412401 12.78132058 1.446706022 0.285714286
Unilever Nigeria 2001 1.06 1 1 1 1 0.67 5.83404856 10.4591371 1.367567903 0.285714286
Unilever Nigeria 2002 1.21 1 1 1 0 0.68 5.82201958 9.595723815 1.32267006 0.285714286
Unilever Nigeria 2003 5.60 1 1 1 0 0.7 5.85473951 12.89025642 1.267379679 0.285714286
Unilever Nigeria 2004 3.13 1 1 1 0 0.78 8.4891295 7.327219382 1.150829821 0.285714286
Unilever Nigeria 2005 3.45 1 1 1 0 0.54 8.68707488 20.3805776 1.166374523 0.285714286
Unilever Nigeria 2006 0.73 0 1 1 0 0.56 8.98350102 26.39509392 1.409903407 0.285714286
Unilever Nigeria 2007 0.59 0 1 1 0 0.65 9.02796237 16.43304022 1.235483335 0.5
Unilever Nigeria 2008 0.76 0 1 1 0 0.59 9.06145248 14.87844877 1.059215099 0.785714286
Unilever Nigeria 2009 0.77 0 1 1 0 0.67 9.20733271 18.18848556 1.166703613 0.785714286
Unilever Nigeria 2010 0.95 0 1 1 0 0.71 9.2392689 20.8924533 1.128210988 0.785714286
Unilever Nigeria 2011 0.85 0 1 1 0 0.7 9.32280755 30.89799712 1.110326875 0.785714286
Unilever Nigeria 2012 0.79 0 1 1 0 0.69 9.32911922 27.50759815 1.186042307 0.785714286
Unilever Nigeria 2013 4.39 0 0 1 0 0.49 9.40219155 26.36557241 1.182679665 1
Unilever Nigeria 2014 7.24 0 1 1 0 0.17 6.12209852 24.04403693 1.095956262 0.571428571
Unilever Nigeria 2015 5.73 0 1 1 0 0.42 6.60788171 12.72935375 1.6 0.285714286
Unilever Nigeria 2016 3.51 0 1 1 0 0.39 6.61181589 2.635926478 1.235572207 0.285714286
Unilever Nigeria 2017 4.69 0 1 1 0 0.4 6.62548089 2.257283189 4.95444712 0.285714286
Unilever Nigeria 2018 4.80 0 1 1 0 0.43 6.61180389 -0.40620326 0.859579043 0.285714286
ABC Transport 1997 4.83 0 1 1 0 0.35 6.57271911 -3.37458849 0.855024948 0.285714286
ABC Transport 1998 7.77 0 1 1 0 0.41 6.59749269 -17.5983122 1.057538656 0.285714286
ABC Transport 1999 8.71 0 1 1 0 0.47 6.62469031 1.955104035 0.985469994 0.285714286
ABC Transport 2000 6.32 0 1 1 0 1.01 6.61448623 1.335421644 0.967347604 0.285714286
ABC Transport 2001 4.13 0 1 1 0 0.91 7.77706567 -0.24921102 1.041312863 0.285714286
ABC Transport 2002 4.02 0 1 1 0 0.91 7.85618146 28.98641958 2.963506849 0.571428571
ABC Transport 2003 4.35 1 1 1 1 0.59 7.86445885 33.79093331 2.92839856 0.571428571
ABC Transport 2004 4.20 1 1 1 0 0.54 7.86846067 32.17595567 3.01462968 0.571428571
ABC Transport 2005 5.18 1 1 1 0 0.6 7.89429876 42.95421866 3.079326445 0.571428571
ABC Transport 2006 3.46 1 1 1 0 0.58 7.96486196 40.16582708 3.608023528 0.571428571
ABC Transport 2007 4.05 1 1 1 1 0.69 8.02534547 44.50441883 3.921589129 0.571428571
ABC Transport 2008 5.49 0 0 1 0 0.86 8.0830029 36.81445902 3.953159173 0.928571429
ABC Transport 2009 4.16 0 1 1 0 0.83 8.12165264 25.76879905 3.88497623 0.928571429
ABC Transport 2010 3.66 0 0 1 0 0.54 8.0872369 21.24526236 2.821661974 0.928571429
ABC Transport 2011 1.70 0 0 1 0 0.61 6.87829764 16.12469483 2.219385353 0.928571429
ABC Transport 2012 1.00 0 1 1 0 0.68 4.96370757 4.129115362 1.039681177 0.285714286
ABC Transport 2013 2.45 0 0 1 0 0.9 5.51879811 276.2376238 1.466267318 0.285714286
ABC Transport 2014 3.62 0 1 1 0 0.61 5.73200835 -4.38084112 1.814966186 0.142857143
ABC Transport 2015 3.05
2.01 5.68035002 -4.21838952 2.430929859 0.285714286
ABC Transport 2016 3.36 0 1 1 0 0.73 5.63836544 1.147364004 2.841912417 0.285714286
ABC Transport 2017 1.87 0 1 1 0 0.71 5.6512848 -5.69462411 3.05891542 0.285714286
ABC Transport 2018 1.39 0 1 1 0 0.83 5.6794497 1.381754559 2.994248029 0.285714286
Caverton Offshore Support
Group
1997 1.26 0 1 1 0 0.74 5.63142347 2.16170742 2.73260966 0.285714286
Caverton Offshore Support
Group
1998 1.12 0 1 1 0 0.68 5.96678026 2.207000161 2.79685032 0.285714286
Caverton Offshore Support
Group
1999 2.60 0 1 1 0 0.72 6.33584508 30.37029131 2.76713947 0.285714286
Caverton Offshore Support
Group
2000 2.46 0 1 1 0 0.73 6.68839258 16.47130138 1.09691094 0.142857143
Caverton Offshore Support
Group
2001 2.08 1 1 1 0 0.74 7.32211782 24.69317855 2.11057642 0.142857143
Caverton Offshore Support 2002 1.70 1 1 1 0 0.95 7.32812686 17.8561106 3.158491513 0.142857143
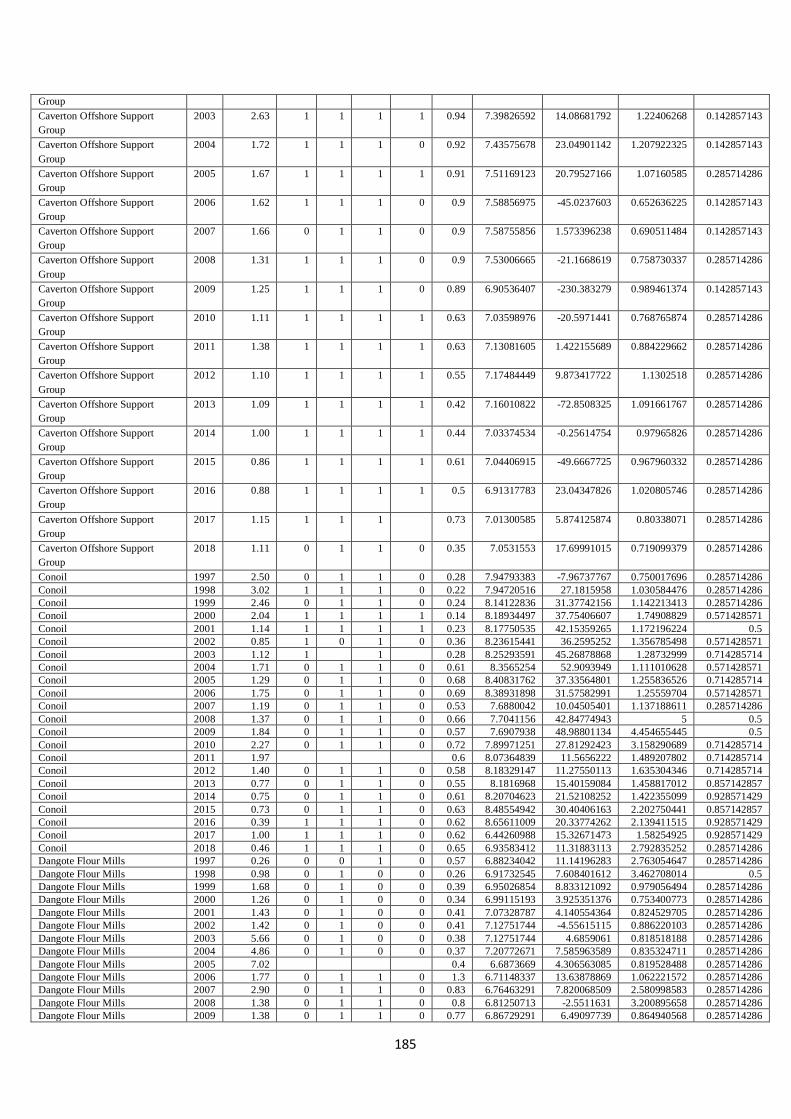
185
Group
Caverton Offshore Support
Group
2003 2.63 1 1 1 1 0.94 7.39826592 14.08681792 1.22406268 0.142857143
Caverton Offshore Support
Group
2004 1.72 1 1 1 0 0.92 7.43575678 23.04901142 1.207922325 0.142857143
Caverton Offshore Support
Group
2005 1.67 1 1 1 1 0.91 7.51169123 20.79527166 1.07160585 0.285714286
Caverton Offshore Support
Group
2006 1.62 1 1 1 0 0.9 7.58856975 -45.0237603 0.652636225 0.142857143
Caverton Offshore Support
Group
2007 1.66 0 1 1 0 0.9 7.58755856 1.573396238 0.690511484 0.142857143
Caverton Offshore Support
Group
2008 1.31 1 1 1 0 0.9 7.53006665 -21.1668619 0.758730337 0.285714286
Caverton Offshore Support
Group
2009 1.25 1 1 1 0 0.89 6.90536407 -230.383279 0.989461374 0.142857143
Caverton Offshore Support
Group
2010 1.11 1 1 1 1 0.63 7.03598976 -20.5971441 0.768765874 0.285714286
Caverton Offshore Support
Group
2011 1.38 1 1 1 1 0.63 7.13081605 1.422155689 0.884229662 0.285714286
Caverton Offshore Support
Group
2012 1.10 1 1 1 1 0.55 7.17484449 9.873417722 1.1302518 0.285714286
Caverton Offshore Support
Group
2013 1.09 1 1 1 1 0.42 7.16010822 -72.8508325 1.091661767 0.285714286
Caverton Offshore Support
Group
2014 1.00 1 1 1 1 0.44 7.03374534 -0.25614754 0.97965826 0.285714286
Caverton Offshore Support
Group
2015 0.86 1 1 1 1 0.61 7.04406915 -49.6667725 0.967960332 0.285714286
Caverton Offshore Support
Group
2016 0.88 1 1 1 1 0.5 6.91317783 23.04347826 1.020805746 0.285714286
Caverton Offshore Support
Group
2017 1.15 1 1 1
0.73 7.01300585 5.874125874 0.80338071 0.285714286
Caverton Offshore Support
Group
2018 1.11 0 1 1 0 0.35 7.0531553 17.69991015 0.719099379 0.285714286
Conoil 1997 2.50 0 1 1 0 0.28 7.94793383 -7.96737767 0.750017696 0.285714286
Conoil 1998 3.02 1 1 1 0 0.22 7.94720516 27.1815958 1.030584476 0.285714286
Conoil 1999 2.46 0 1 1 0 0.24 8.14122836 31.37742156 1.142213413 0.285714286
Conoil 2000 2.04 1 1 1 1 0.14 8.18934497 37.75406607 1.74908829 0.571428571
Conoil 2001 1.14 1 1 1 1 0.23 8.17750535 42.15359265 1.172196224 0.5
Conoil 2002 0.85 1 0 1 0 0.36 8.23615441 36.2595252 1.356785498 0.571428571
Conoil 2003 1.12 1
1
0.28 8.25293591 45.26878868 1.28732999 0.714285714
Conoil 2004 1.71 0 1 1 0 0.61 8.3565254 52.9093949 1.111010628 0.571428571
Conoil 2005 1.29 0 1 1 0 0.68 8.40831762 37.33564801 1.255836526 0.714285714
Conoil 2006 1.75 0 1 1 0 0.69 8.38931898 31.57582991 1.25559704 0.571428571
Conoil 2007 1.19 0 1 1 0 0.53 7.6880042 10.04505401 1.137188611 0.285714286
Conoil 2008 1.37 0 1 1 0 0.66 7.7041156 42.84774943 5 0.5
Conoil 2009 1.84 0 1 1 0 0.57 7.6907938 48.98801134 4.454655445 0.5
Conoil 2010 2.27 0 1 1 0 0.72 7.89971251 27.81292423 3.158290689 0.714285714
Conoil 2011 1.97
0.6 8.07364839 11.5656222 1.489207802 0.714285714
Conoil 2012 1.40 0 1 1 0 0.58 8.18329147 11.27550113 1.635304346 0.714285714
Conoil 2013 0.77 0 1 1 0 0.55 8.1816968 15.40159084 1.458817012 0.857142857
Conoil 2014 0.75 0 1 1 0 0.61 8.20704623 21.52108252 1.422355099 0.928571429
Conoil 2015 0.73 0 1 1 0 0.63 8.48554942 30.40406163 2.202750441 0.857142857
Conoil 2016 0.39 1 1 1 0 0.62 8.65611009 20.33774262 2.139411515 0.928571429
Conoil 2017 1.00 1 1 1 0 0.62 6.44260988 15.32671473 1.58254925 0.928571429
Conoil 2018 0.46 1 1 1 0 0.65 6.93583412 11.31883113 2.792835252 0.285714286
Dangote Flour Mills 1997 0.26 0 0 1 0 0.57 6.88234042 11.14196283 2.763054647 0.285714286
Dangote Flour Mills 1998 0.98 0 1 0 0 0.26 6.91732545 7.608401612 3.462708014 0.5
Dangote Flour Mills 1999 1.68 0 1 0 0 0.39 6.95026854 8.833121092 0.979056494 0.285714286
Dangote Flour Mills 2000 1.26 0 1 0 0 0.34 6.99115193 3.925351376 0.753400773 0.285714286
Dangote Flour Mills 2001 1.43 0 1 0 0 0.41 7.07328787 4.140554364 0.824529705 0.285714286
Dangote Flour Mills 2002 1.42 0 1 0 0 0.41 7.12751744 -4.55615115 0.886220103 0.285714286
Dangote Flour Mills 2003 5.66 0 1 0 0 0.38 7.12751744 4.6859061 0.818518188 0.285714286
Dangote Flour Mills 2004 4.86 0 1 0 0 0.37 7.20772671 7.585963589 0.835324711 0.285714286
Dangote Flour Mills 2005 7.02
0.4 6.6873669 4.306563085 0.819528488 0.285714286
Dangote Flour Mills 2006 1.77 0 1 1 0 1.3 6.71148337 13.63878869 1.062221572 0.285714286
Dangote Flour Mills 2007 2.90 0 1 1 0 0.83 6.76463291 7.820068509 2.580998583 0.285714286
Dangote Flour Mills 2008 1.38 0 1 1 0 0.8 6.81250713 -2.5511631 3.200895658 0.285714286
Dangote Flour Mills 2009 1.38 0 1 1 0 0.77 6.86729291 6.49097739 0.864940568 0.285714286
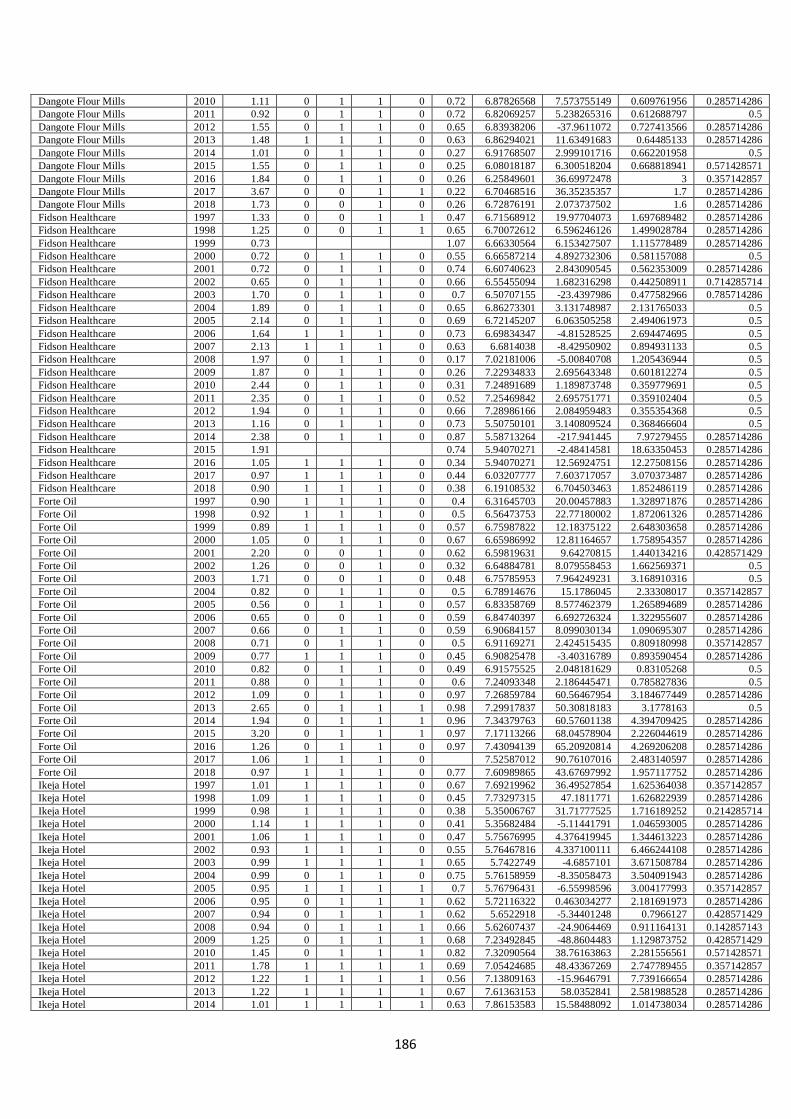
186
Dangote Flour Mills 2010 1.11 0 1 1 0 0.72 6.87826568 7.573755149 0.609761956 0.285714286
Dangote Flour Mills 2011 0.92 0 1 1 0 0.72 6.82069257 5.238265316 0.612688797 0.5
Dangote Flour Mills 2012 1.55 0 1 1 0 0.65 6.83938206 -37.9611072 0.727413566 0.285714286
Dangote Flour Mills 2013 1.48 1 1 1 0 0.63 6.86294021 11.63491683 0.64485133 0.285714286
Dangote Flour Mills 2014 1.01 0 1 1 0 0.27 6.91768507 2.999101716 0.662201958 0.5
Dangote Flour Mills 2015 1.55 0 1 1 0 0.25 6.08018187 6.300518204 0.668818941 0.571428571
Dangote Flour Mills 2016 1.84 0 1 1 0 0.26 6.25849601 36.69972478 3 0.357142857
Dangote Flour Mills 2017 3.67 0 0 1 1 0.22 6.70468516 36.35235357 1.7 0.285714286
Dangote Flour Mills 2018 1.73 0 0 1 0 0.26 6.72876191 2.073737502 1.6 0.285714286
Fidson Healthcare 1997 1.33 0 0 1 1 0.47 6.71568912 19.97704073 1.697689482 0.285714286
Fidson Healthcare 1998 1.25 0 0 1 1 0.65 6.70072612 6.596246126 1.499028784 0.285714286
Fidson Healthcare 1999 0.73
1.07 6.66330564 6.153427507 1.115778489 0.285714286
Fidson Healthcare 2000 0.72 0 1 1 0 0.55 6.66587214 4.892732306 0.581157088 0.5
Fidson Healthcare 2001 0.72 0 1 1 0 0.74 6.60740623 2.843090545 0.562353009 0.285714286
Fidson Healthcare 2002 0.65 0 1 1 0 0.66 6.55455094 1.682316298 0.442508911 0.714285714
Fidson Healthcare 2003 1.70 0 1 1 0 0.7 6.50707155 -23.4397986 0.477582966 0.785714286
Fidson Healthcare 2004 1.89 0 1 1 0 0.65 6.86273301 3.131748987 2.131765033 0.5
Fidson Healthcare 2005 2.14 0 1 1 0 0.69 6.72145207 6.063505258 2.494061973 0.5
Fidson Healthcare 2006 1.64 1 1 1 0 0.73 6.69834347 -4.81528525 2.694474695 0.5
Fidson Healthcare 2007 2.13 1 1 1 0 0.63 6.6814038 -8.42950902 0.894931133 0.5
Fidson Healthcare 2008 1.97 0 1 1 0 0.17 7.02181006 -5.00840708 1.205436944 0.5
Fidson Healthcare 2009 1.87 0 1 1 0 0.26 7.22934833 2.695643348 0.601812274 0.5
Fidson Healthcare 2010 2.44 0 1 1 0 0.31 7.24891689 1.189873748 0.359779691 0.5
Fidson Healthcare 2011 2.35 0 1 1 0 0.52 7.25469842 2.695751771 0.359102404 0.5
Fidson Healthcare 2012 1.94 0 1 1 0 0.66 7.28986166 2.084959483 0.355354368 0.5
Fidson Healthcare 2013 1.16 0 1 1 0 0.73 5.50750101 3.140809524 0.368466604 0.5
Fidson Healthcare 2014 2.38 0 1 1 0 0.87 5.58713264 -217.941445 7.97279455 0.285714286
Fidson Healthcare 2015 1.91
0.74 5.94070271 -2.48414581 18.63350453 0.285714286
Fidson Healthcare 2016 1.05 1 1 1 0 0.34 5.94070271 12.56924751 12.27508156 0.285714286
Fidson Healthcare 2017 0.97 1 1 1 0 0.44 6.03207777 7.603717057 3.070373487 0.285714286
Fidson Healthcare 2018 0.90 1 1 1 0 0.38 6.19108532 6.704503463 1.852486119 0.285714286
Forte Oil 1997 0.90 1 1 1 0 0.4 6.31645703 20.00457883 1.328971876 0.285714286
Forte Oil 1998 0.92 1 1 1 0 0.5 6.56473753 22.77180002 1.872061326 0.285714286
Forte Oil 1999 0.89 1 1 1 0 0.57 6.75987822 12.18375122 2.648303658 0.285714286
Forte Oil 2000 1.05 0 1 1 0 0.67 6.65986992 12.81164657 1.758954357 0.285714286
Forte Oil 2001 2.20 0 0 1 0 0.62 6.59819631 9.64270815 1.440134216 0.428571429
Forte Oil 2002 1.26 0 0 1 0 0.32 6.64884781 8.079558453 1.662569371 0.5
Forte Oil 2003 1.71 0 0 1 0 0.48 6.75785953 7.964249231 3.168910316 0.5
Forte Oil 2004 0.82 0 1 1 0 0.5 6.78914676 15.1786045 2.33308017 0.357142857
Forte Oil 2005 0.56 0 1 1 0 0.57 6.83358769 8.577462379 1.265894689 0.285714286
Forte Oil 2006 0.65 0 0 1 0 0.59 6.84740397 6.692726324 1.322955607 0.285714286
Forte Oil 2007 0.66 0 1 1 0 0.59 6.90684157 8.099030134 1.090695307 0.285714286
Forte Oil 2008 0.71 0 1 1 0 0.5 6.91169271 2.424515435 0.809180998 0.357142857
Forte Oil 2009 0.77 1 1 1 0 0.45 6.90825478 -3.40316789 0.893590454 0.285714286
Forte Oil 2010 0.82 0 1 1 0 0.49 6.91575525 2.048181629 0.83105268 0.5
Forte Oil 2011 0.88 0 1 1 0 0.6 7.24093348 2.186445471 0.785827836 0.5
Forte Oil 2012 1.09 0 1 1 0 0.97 7.26859784 60.56467954 3.184677449 0.285714286
Forte Oil 2013 2.65 0 1 1 1 0.98 7.29917837 50.30818183 3.1778163 0.5
Forte Oil 2014 1.94 0 1 1 1 0.96 7.34379763 60.57601138 4.394709425 0.285714286
Forte Oil 2015 3.20 0 1 1 1 0.97 7.17113266 68.04578904 2.226044619 0.285714286
Forte Oil 2016 1.26 0 1 1 0 0.97 7.43094139 65.20920814 4.269206208 0.285714286
Forte Oil 2017 1.06 1 1 1 0
7.52587012 90.76107016 2.483140597 0.285714286
Forte Oil 2018 0.97 1 1 1 0 0.77 7.60989865 43.67697992 1.957117752 0.285714286
Ikeja Hotel 1997 1.01 1 1 1 0 0.67 7.69219962 36.49527854 1.625364038 0.357142857
Ikeja Hotel 1998 1.09 1 1 1 0 0.45 7.73297315 47.1811771 1.626822939 0.285714286
Ikeja Hotel 1999 0.98 1 1 1 0 0.38 5.35006767 31.71777525 1.716189252 0.214285714
Ikeja Hotel 2000 1.14 1 1 1 0 0.41 5.35682484 -5.11441791 1.046593005 0.285714286
Ikeja Hotel 2001 1.06 1 1 1 0 0.47 5.75676995 4.376419945 1.344613223 0.285714286
Ikeja Hotel 2002 0.93 1 1 1 0 0.55 5.76467816 4.337100111 6.466244108 0.285714286
Ikeja Hotel 2003 0.99 1 1 1 1 0.65 5.7422749 -4.6857101 3.671508784 0.285714286
Ikeja Hotel 2004 0.99 0 1 1 0 0.75 5.76158959 -8.35058473 3.504091943 0.285714286
Ikeja Hotel 2005 0.95 1 1 1 1 0.7 5.76796431 -6.55998596 3.004177993 0.357142857
Ikeja Hotel 2006 0.95 0 1 1 1 0.62 5.72116322 0.463034277 2.181691973 0.285714286
Ikeja Hotel 2007 0.94 0 1 1 1 0.62 5.6522918 -5.34401248 0.7966127 0.428571429
Ikeja Hotel 2008 0.94 0 1 1 1 0.66 5.62607437 -24.9064469 0.911164131 0.142857143
Ikeja Hotel 2009 1.25 0 1 1 1 0.68 7.23492845 -48.8604483 1.129873752 0.428571429
Ikeja Hotel 2010 1.45 0 1 1 1 0.82 7.32090564 38.76163863 2.281556561 0.571428571
Ikeja Hotel 2011 1.78 1 1 1 1 0.69 7.05424685 48.43367269 2.747789455 0.357142857
Ikeja Hotel 2012 1.22 1 1 1 1 0.56 7.13809163 -15.9646791 7.739166654 0.285714286
Ikeja Hotel 2013 1.22 1 1 1 1 0.67 7.61363153 58.0352841 2.581988528 0.285714286
Ikeja Hotel 2014 1.01 1 1 1 1 0.63 7.86153583 15.58488092 1.014738034 0.285714286

187
Ikeja Hotel 2015 0.98 1 1 1 1 0.56 7.74504111 7.442548023 0.971344747 0.285714286
Ikeja Hotel 2016 1.34 1 1 1 1 0.51 7.81752984 1.987796794 0.808652109 0.285714286
Ikeja Hotel 2017 1.44 1 1 1 1 0.52 7.76227803 3.23202022 0.824325065 0.285714286
Ikeja Hotel 2018 1.11 1 1 1 1 0.55 7.82538548 3.691757508 0.892854885 0.285714286
MRS Oil Nigeria 1997 0.82 1 1 1 1 0.53 6.71306444 4.46017328 0.868734801 0.285714286
MRS Oil Nigeria 1998 4.68 0 1 1 0 0.84 7.03275169 17.40025061 0.9 0.5
MRS Oil Nigeria 1999 1.39 0 1 1 0 0.71 6.99686999 11.53240504 0.8 0.285714286
MRS Oil Nigeria 2000 0.56 0 1 1 0 0.83 7.07896426 -21.5525172 0.6 0.285714286
MRS Oil Nigeria 2001 0.68 0 1 1 0 0.46 7.22312262 6.140273493 0.7 0.285714286
MRS Oil Nigeria 2002 0.96 0 1 1 0 0.6 7.34773457 15.61976553 0.927573872 0.285714286
MRS Oil Nigeria 2003 1.13 0 1 1 0 0.74 7.4212336 12.32549784 0.903353845 0.285714286
MRS Oil Nigeria 2004 1.14 0 1 1 0 0.69 7.50847209 -157.995901 1.080530913 0.714285714
MRS Oil Nigeria 2005 1.33 0 1 1 0 0.76 7.62727063 25.94633155 1.050098306 0.714285714
MRS Oil Nigeria 2006 1.11 0 1 1 0 0.53 7.66365327 65.79210931 0.94738403 0.714285714
MRS Oil Nigeria 2007 1.14 0 1 1 0 0.62 5.39018238 11.86179971 0.920920391 0.285714286
MRS Oil Nigeria 2008 1.59 0 1 1 0 0.59 6.78449619 1730.011587 5.8 0.5
MRS Oil Nigeria 2009 1.24 0 1 1 0 0.56 6.87412461 36.28265192 6.737501107 0.5
MRS Oil Nigeria 2010 0.98 0 1 1 0 0.46 6.91131744 33.73099909 4.953443507 0.5
MRS Oil Nigeria 2011 0.99 0 1 1 0 1 6.87555319 39.77542647 1.756219778 0.5
MRS Oil Nigeria 2012 0.96 0 0 1 0 0.12 7.0020339 33.25933401 2.767747678 0.5
MRS Oil Nigeria 2013 0.94 1 0 1 1 0.71 7.0289591 38.9032256 1.800869125 0.5
MRS Oil Nigeria 2014 0.99 1 1 1 1 0.71 7.05809057 42.05661625 1.540906923 0.5
MRS Oil Nigeria 2015 0.96 1 1 1 0 0.77 7.09884733 39.16565326 3.03113443 0.5
MRS Oil Nigeria 2016 0.96 0 1 1 0 0.8 7.21204973 29.60119582 2.781862477 0.5
MRS Oil Nigeria 2017 0.73 1 1 1 0 0.73 6.5955607 29.70621874 1.715352275 0.571428571
MRS Oil Nigeria 2018 0.82 1 1 1 0 0.95 6.69278111 36.18588531 4 0.285714286
International Breweries 1997 1.05 1 1 1 0 0.95 6.21106044 34.71037328 4.877436196 0.142857143
International Breweries 1998 0.97 1 1 1 1 0.81 6.2929453 19.03991099 10.85211801 0.142857143
International Breweries 1999 0.97
1
0.75 6.15040672 26.67056961 3.367317824 0.142857143
International Breweries 2000 0.99 0 1 1 0 0.32 6.99501112 23.58312467 6.018046682 0.142857143
International Breweries 2001 0.93 0 1 1 0 0.19 7.03955224 14.69547786 1.29562535 0.142857143
International Breweries 2002 0.93 1 1 1 1 0.18 7.13351285 10.90155692 1.295113296 0.285714286
International Breweries 2003 0.96 1 1 1 1 0.25 7.15624586 13.02431265 1.226454659 0.357142857
International Breweries 2004 0.97 1 1 1 1 0.25 7.1740359 9.712255348 1.099642567 0.142857143
International Breweries 2005 1.22 0 1 1 0 0.4 6.18838422 8.821448647 1.088289936 0.214285714
International Breweries 2006 1.69 0 1 1 0 0.31 6.55715927 112.4858958 1.546694873 0.5
International Breweries 2007 2.46 1 1 1 1 0.22 6.41693609 5.432509352 1.280408121 0.5
International Breweries 2008 1.44 0 1 1 0 0.4 6.42060802 -15.8726956 1.604955491 0.5
International Breweries 2009 1.19 0 1 1 0 0 6.3562156 215.0514605 1.211913575 0.285714286
International Breweries 2010 1.23 1 1 1 0 0.33 6.58046023 62.15467995 0.837356808 0.285714286
International Breweries 2011 1.26 1 1 1 0 0.35 6.72902897 14.95572729 0.775206191 0.285714286
International Breweries 2012 1.52 1 1 1 0 0.5 6.74377316 -751.818182 1.250371605 0.285714286
International Breweries 2013 3.96 1 1 1 0 0.23 6.82604498 -14.0082576 1.303466951 0.571428571
International Breweries 2014 1.26 1 1 1 0 0.28 6.89866903 60.54735287 1.206231771 0.571428571
International Breweries 2015 2.41 0 0 1 0 0.33 6.65052287 7.059216241 1.117001617 0.571428571
International Breweries 2016 1.60 0 1 1 0 1.68 6.43623502 5.21751269 1.058111867 0.714285714
International Breweries 2017 1.00 0 1 1 0 1.42 6.51593104 7.169660723 1.58018279 0.714285714
International Breweries 2018 1.43 0 1 1 0 0.66 6.4607068 6.013616266 1.858856425 0.5
Nestle Nigeria 1997 1.53 1 1 1 0 0.67 6.6137131 -42.4632463 1.186162823 0.5
Nestle Nigeria 1998 1.38 1 1 1 0 0.67 6.48588816 -13.2668237 1.215781068 0.5
Nestle Nigeria 1999 3.23 1 1 1 0 0.31 6.46109977 11.19588668 1.048691189 0.5
Nestle Nigeria 2000 2.43 1 1 1 0 0.25 6.46105996 -4.39723593 0.910888984 0.5
Nestle Nigeria 2001 2.69 1 1 1 0 0.23 6.4444333 7.334981454 1.000429459 0.5
Nestle Nigeria 2002 1.89 0 1 1 0 1 6.34247006 14.01686305 1.05709207 0.357142857
Nestle Nigeria 2003 2.27 0 1 1 0 0.56 6.00979666 -29.0046918 1.205195342 0.428571429
Nestle Nigeria 2004 1.99 0 0 1 0 0.67 6.71254861 2.374121748 5.60398821 0.285714286
Nestle Nigeria 2005 1.44 0 0 1 0 0.59 6.69879113 10.11718287 3.129374501 0.285714286
Nestle Nigeria 2006 1.51 1 1 1 0 0.59 6.74526659 11.43414462 3.44571888 0.285714286
Nestle Nigeria 2007 1.47 0 0 1 0 0.64 6.84705669 18.02648227 0.725002991 0.142857143
Nestle Nigeria 2008 1.42 0 0 1 0 0.6 6.80012158 14.7543571 0.592786565 0.285714286
Nestle Nigeria 2009 1.45 0 0 1 0 0.32 6.8926021 6.105957873 0.764119506 0.285714286
Nestle Nigeria 2010 1.41 0 1 1 0 1.12 7.00198786 10.5870631 0.773196738 0.428571429
Nestle Nigeria 2011 1.67 0 1 1 0 1 7.04918382 8.413241666 0.95392067 0.285714286
Nestle Nigeria 2012 1.50 0 1 1 0 0.96 7.09636454 26.00373318 0.848722048 0.285714286
Nestle Nigeria 2013 1.60 0 1 1 0 1.04 7.41903384 11.51250725 0.793162983 0.285714286
Nestle Nigeria 2014 1.77 0 1 1 0 1 7.32740635 88.99199936 4.394440969 0.5
Nestle Nigeria 2015 1.60 0 1 1 0 0.92 7.46478085 87.25856932 7.244027417 0.5
Nestle Nigeria 2016 1.70 0 1 1 0 1.12 7.64591693 92.25310146 5.73181292 0.5
Nestle Nigeria 2017 1.90 0 0 1 0 0.78 7.78065613 92.78867899 3.510715455 0.714285714
Nestle Nigeria 2018 1.08 1 1 1 0 0.52 7.89057913 84.77504032 4.688879982 0.285714286
Nigeria-German Chemicals 1997 1.58 1 1 1 1 0.81 7.94921048 71.07481418 4.796122571 0.857142857

188
Nigeria-German Chemicals 1998 1.30 1 1 1 0 0.39 8.03425728 61.83100047 4.830673734 0.642857143
Nigeria-German Chemicals 1999 0.69 0 1 1 0 0.47 8.02556009 54.83036855 7.766187629 0.642857143
Nigeria-German Chemicals 2000 0.90 1 1 1 0 0.43 8.0763311 61.86939586 8.706342153 0.642857143
Nigeria-German Chemicals 2001 1.08 1 1 1 0 0.45 7.87884947 62.45357641 6.316181724 0.714285714
Nigeria-German Chemicals 2002 1.18 1 1 1 0 0.37 7.95688021 30.07091457 4.134326109 0.785714286
Nigeria-German Chemicals 2003 0.87 1 1 1
0.92 8.01875308 43.86642331 4.018854425 0.785714286
Nigeria-German Chemicals 2004 1.37 1 1 1 0 0.34 8.02933459 79.74323952 4.347297942 0.714285714
Nigeria-German Chemicals 2005 1.05 1 1 1 0 0.4 8.0583859 59.93136067 4.198536187 0.714285714
Nigeria-German Chemicals 2006 1.08 1 1 1 0 0.33 8.37236179 60.45607124 5.181617465 0.785714286
Nigeria-German Chemicals 2007 0.82 1 1 1 0 0.36 8.40420684 48.92168904 3.461929772 0.714285714
Nigeria-German Chemicals 2008 4.36 1 0 1 0 0.36 8.40270772 40.71008258 4.048998275 0.714285714
Nigeria-German Chemicals 2009 2.09 1 0 1 1 0.39 8.5431105 38.34163535 5.489259364 0.928571429
Nigeria-German Chemicals 2010 1.84 1 0 1 0 0.42 8.55171669 24.72621477 4.161201608 0.928571429
Nigeria-German Chemicals 2011 1.89 1 0 1 0 0.5 5.92366308 22.08437272 3.655000851 0.857142857
Nigeria-German Chemicals 2012 1.57 1 1 1 0 0.49 6.07813116 17.56571371 1.7 0.142857143
Nigeria-German Chemicals 2013 1.01 1 1 1 0 0.44 6.16466032 17.20501728 1.003969041 0.142857143
Nigeria-German Chemicals 2014 1.00 1 1 1 0 0.43 6.11055066 13.63122718 2.450945115 0.285714286
Nigeria-German Chemicals 2015 0.69 1 1 1 0 0.43 6.08682449 36.47264308 3.622553214 0.142857143
Nigeria-German Chemicals 2016 0.66 0 1 1 0 0.45 6.00831395 31.94256692 3.046087313 0.285714286
Nigeria-German Chemicals 2017 1.67 0 1 1 0 0.46 6.33588957 29.64448018 3.361774013 0.285714286
Nigeria-German Chemicals 2018 2.34 0 1 1 0 0.41 6.34309098 17.83008424 1.866280046 0.285714286
Total Nigeria 1997 2.44 1 1 1 0 0.45 6.48911733 6.247793381 1.390620808 0.285714286
Total Nigeria 1998 1.87 0 1 1 0 0.51 6.7009234 6.939136472 1.260389342 0.285714286
Total Nigeria 1999 1.68 0 1 1 0 0.57 6.21282499 5.695465686 1.121407256 0.285714286
Total Nigeria 2000 1.34 0 1 1 0 0.54 6.28641335 6.938271045 2.60425118 0.285714286
Total Nigeria 2001 1.68 0 1 1 0 0.63 6.37260771 -17.1599316 2.457396531 0.285714286
Total Nigeria 2002 1.53 0 0 1 0 0.69 6.44085479 8.646351809 2.082493265 0.285714286
Total Nigeria 2003 1.46 0 0 1 0 0.82 6.40946715 27.31015559 1.703152521 0.285714286
Total Nigeria 2004 1.42 0 0 1 0 0.68 6.61637804 12.27271307 2.631023907 0.285714286
Total Nigeria 2005 0.92
0.79 6.52608431 29.34094638 1.723439321 0.285714286
Total Nigeria 2006 1.55 0 1 1 0 0.75 6.55911832 0.37039975 1.66982348 0.285714286
Total Nigeria 2007 1.29 0 1 1 0 0.86 6.51409795 14.02146206 1.62322806 0.285714286
Total Nigeria 2008 1.67 0 1 1 0 0.71 6.69326656 13.16553471 1.657082327 0.285714286
Total Nigeria 2009 3.34 0 1 1 0 0.77 7.85826414 -13.4830747 1.305925257 0.285714286
Total Nigeria 2010 1.26 0 1 1 0 0.82 7.94817924 12.61862994 1.251262196 0.5
Total Nigeria 2011 1.98 0 1 1 0 0.84 8.45905714 11.55808795 1.105770705 0.785714286
Total Nigeria 2012 1.29 0 1 1 0 0.81 8.49934068 18.59082118 1.378615083 0.5
Total Nigeria 2013 0.96 1 1 1 0 0.76 8.51319909 18.93688088 1.095610228 0.5
Total Nigeria 2014 1.45 1 1 1 0 0.33 8.60814555 15.100981 1.093664882 0.785714286
Total Nigeria 2015 2.19 1 1 1 0 0.43 8.71186102 0.373678707 1.004226605 0.571428571
Total Nigeria 2016 1.31 1 1 1 0 0.44 8.77224609 10.2381143 0.857266463 0.285714286
Total Nigeria 2017 0.75 1 1 1 0 0.53 8.94908372 -2.88003965 0.881286262 0.714285714
Total Nigeria 2018 0.80 1 1 1 0 0.64 8.97603862 -393.968796 1.148918489 0.5
Thomas Wyatt Nigeria 1997 0.72 1 1 1 0 0.66 6.80461989 -61.2994623 1.114659353 0.5
Thomas Wyatt Nigeria 1998 0.75 1 1 1 0 0.85 6.84770447 11.84742833 2.502781339 0.285714286
Thomas Wyatt Nigeria 1999 0.94
0.84 6.89160357 4.384765579 3.016677118 0.285714286
Thomas Wyatt Nigeria 2000 1.08 1 1 1 1 0.71 6.90202118 28.19200054 2.458862143 0.285714286
Thomas Wyatt Nigeria 2001 4.00 1 1 1 1 0.76 6.93792522 12.62259693 2.041839444 0.285714286
Thomas Wyatt Nigeria 2002 4.09 1 1 1 1 0.81 7.36857627 27.77605232 1.136162825 0.285714286
Thomas Wyatt Nigeria 2003 4.38 1 1 1 1 1.06 7.49212696 20.64028242 0.851006969 0.285714286
Thomas Wyatt Nigeria 2004 2.82 1 1 1 1 1.1 7.47785383 14.06446289 1.1238353 0.714285714
Thomas Wyatt Nigeria 2005 4.37 0 1 1 1 0.85 7.49129977 9.250384155 1.709736776 0.714285714
Thomas Wyatt Nigeria 2006 3.89 1 1 1 1 1.28 7.30218338 6.686305073 1.286623411 0.714285714
Thomas Wyatt Nigeria 2007 4.09 1 1 1 1 1.38 6.1576571 21.80989073 1.747196616 0.357142857
Thomas Wyatt Nigeria 2008 5.78 1 1 1 0 0.61 6.17539583 -392.435841 1.18736301 0.285714286
Thomas Wyatt Nigeria 2009 4.73 0 1 1 0 0.65 6.17247332 364.6823306 1.372366408 0.285714286
Thomas Wyatt Nigeria 2010 3.93 0 1 1 0 0.67 6.0953106 107.0639771 1.838998808 0.285714286
Thomas Wyatt Nigeria 2011 1.08 0 1 1 0 0.73 6.21154715 71.39418354 2.266142774 0.285714286
Thomas Wyatt Nigeria 2012 1.38 0 1 1 0 0.82 6.4098378 41.81027027 1.971410243 0.285714286
Thomas Wyatt Nigeria 2013 1.15 0 1 1 0 1.06 6.44448371 -2.47478222 1.403413481 0.285714286
Thomas Wyatt Nigeria 2014 1.06 0 1 1 0 0.69 6.39761608 78.53719187 0.774426445 0.285714286
Thomas Wyatt Nigeria 2015 1.02
0.71 6.45320042 -14.5967764 0.750659834 0.5
Thomas Wyatt Nigeria 2016 1.01 0 1 1 0 0.84 6.40994698 10.84692506 0.731901788 0.5
Thomas Wyatt Nigeria 2017 0.97 0 1 1 0 0.83 5.20086144 36.92948173 0.389831935 0.5
Thomas Wyatt Nigeria 2018 1.00 0 1 1 0 0.85 5.00046072 8 1.00381727 0.142857143
Tantalizers 1997 0.99 0 1 1 0 0.83 4.93765466 7.172226943 0.463944403 0.142857143
Tantalizers 1998 0.93 0 1 1 0 0.85 5.06914248 1.984700862 0.256442541 0.142857143
Tantalizers 1999 1.04 0 1 1 0 0.81 5.09269609 -24.8244887 0.97651866 0.285714286
Tantalizers 2000 1.28 0 1 1 0 0.83 5.43892347 591.5093058 1.682895975 0.285714286
Tantalizers 2001 1.19 1 1 1 0 0.74 5.34452588 -76 1.257286508 0.285714286
Tantalizers 2002 1.05 0 1 1 0 1.04 5.40109367 -254.07314 1.432877305 0.285714286
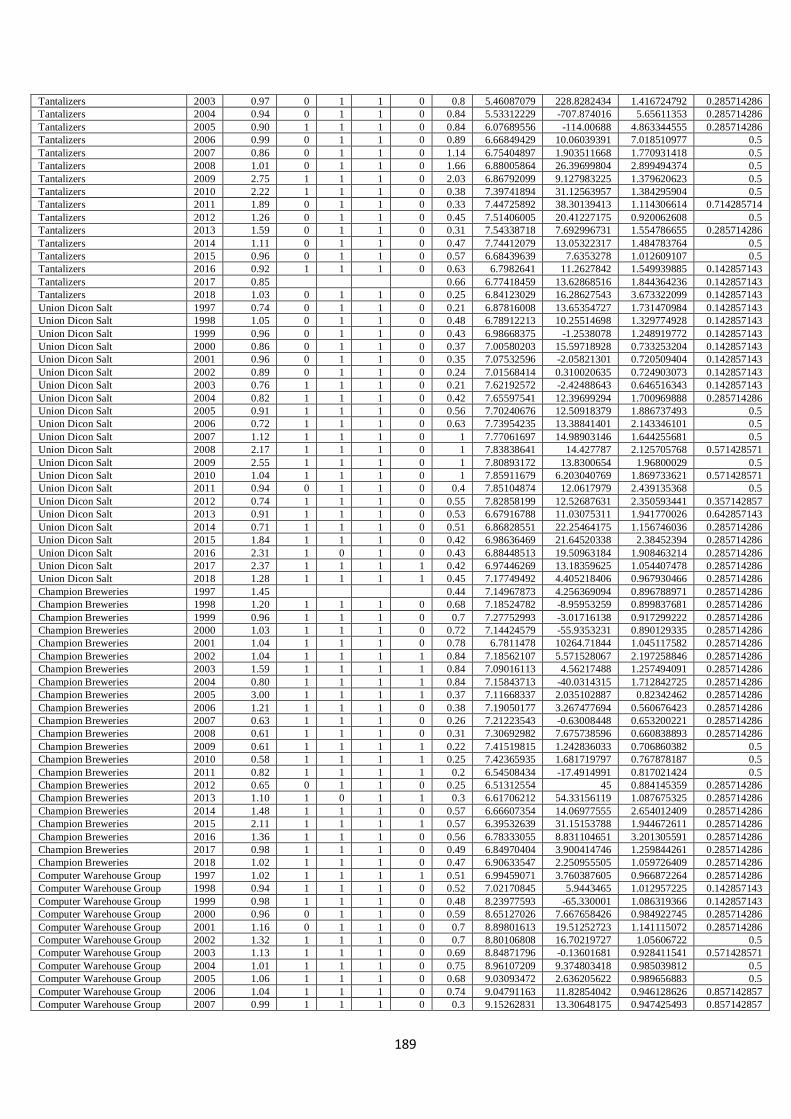
189
Tantalizers 2003 0.97 0 1 1 0 0.8 5.46087079 228.8282434 1.416724792 0.285714286
Tantalizers 2004 0.94 0 1 1 0 0.84 5.53312229 -707.874016 5.65611353 0.285714286
Tantalizers 2005 0.90 1 1 1 0 0.84 6.07689556 -114.00688 4.863344555 0.285714286
Tantalizers 2006 0.99 0 1 1 0 0.89 6.66849429 10.06039391 7.018510977 0.5
Tantalizers 2007 0.86 0 1 1 0 1.14 6.75404897 1.903511668 1.770931418 0.5
Tantalizers 2008 1.01 0 1 1 0 1.66 6.88005864 26.39699804 2.899494374 0.5
Tantalizers 2009 2.75 1 1 1 0 2.03 6.86792099 9.127983225 1.379620623 0.5
Tantalizers 2010 2.22 1 1 1 0 0.38 7.39741894 31.12563957 1.384295904 0.5
Tantalizers 2011 1.89 0 1 1 0 0.33 7.44725892 38.30139413 1.114306614 0.714285714
Tantalizers 2012 1.26 0 1 1 0 0.45 7.51406005 20.41227175 0.920062608 0.5
Tantalizers 2013 1.59 0 1 1 0 0.31 7.54338718 7.692996731 1.554786655 0.285714286
Tantalizers 2014 1.11 0 1 1 0 0.47 7.74412079 13.05322317 1.484783764 0.5
Tantalizers 2015 0.96 0 1 1 0 0.57 6.68439639 7.6353278 1.012609107 0.5
Tantalizers 2016 0.92 1 1 1 0 0.63 6.7982641 11.2627842 1.549939885 0.142857143
Tantalizers 2017 0.85
0.66 6.77418459 13.62868516 1.844364236 0.142857143
Tantalizers 2018 1.03 0 1 1 0 0.25 6.84123029 16.28627543 3.673322099 0.142857143
Union Dicon Salt 1997 0.74 0 1 1 0 0.21 6.87816008 13.65354727 1.731470984 0.142857143
Union Dicon Salt 1998 1.05 0 1 1 0 0.48 6.78912213 10.25514698 1.329774928 0.142857143
Union Dicon Salt 1999 0.96 0 1 1 0 0.43 6.98668375 -1.2538078 1.248919772 0.142857143
Union Dicon Salt 2000 0.86 0 1 1 0 0.37 7.00580203 15.59718928 0.733253204 0.142857143
Union Dicon Salt 2001 0.96 0 1 1 0 0.35 7.07532596 -2.05821301 0.720509404 0.142857143
Union Dicon Salt 2002 0.89 0 1 1 0 0.24 7.01568414 0.310020635 0.724903073 0.142857143
Union Dicon Salt 2003 0.76 1 1 1 0 0.21 7.62192572 -2.42488643 0.646516343 0.142857143
Union Dicon Salt 2004 0.82 1 1 1 0 0.42 7.65597541 12.39699294 1.700969888 0.285714286
Union Dicon Salt 2005 0.91 1 1 1 0 0.56 7.70240676 12.50918379 1.886737493 0.5
Union Dicon Salt 2006 0.72 1 1 1 0 0.63 7.73954235 13.38841401 2.143346101 0.5
Union Dicon Salt 2007 1.12 1 1 1 0 1 7.77061697 14.98903146 1.644255681 0.5
Union Dicon Salt 2008 2.17 1 1 1 0 1 7.83838641 14.427787 2.125705768 0.571428571
Union Dicon Salt 2009 2.55 1 1 1 0 1 7.80893172 13.8300654 1.96800029 0.5
Union Dicon Salt 2010 1.04 1 1 1 0 1 7.85911679 6.203040769 1.869733621 0.571428571
Union Dicon Salt 2011 0.94 0 1 1 0 0.4 7.85104874 12.0617979 2.439135368 0.5
Union Dicon Salt 2012 0.74 1 1 1 0 0.55 7.82858199 12.52687631 2.350593441 0.357142857
Union Dicon Salt 2013 0.91 1 1 1 0 0.53 6.67916788 11.03075311 1.941770026 0.642857143
Union Dicon Salt 2014 0.71 1 1 1 0 0.51 6.86828551 22.25464175 1.156746036 0.285714286
Union Dicon Salt 2015 1.84 1 1 1 0 0.42 6.98636469 21.64520338 2.38452394 0.285714286
Union Dicon Salt 2016 2.31 1 0 1 0 0.43 6.88448513 19.50963184 1.908463214 0.285714286
Union Dicon Salt 2017 2.37 1 1 1 1 0.42 6.97446269 13.18359625 1.054407478 0.285714286
Union Dicon Salt 2018 1.28 1 1 1 1 0.45 7.17749492 4.405218406 0.967930466 0.285714286
Champion Breweries 1997 1.45
0.44 7.14967873 4.256369094 0.896788971 0.285714286
Champion Breweries 1998 1.20 1 1 1 0 0.68 7.18524782 -8.95953259 0.899837681 0.285714286
Champion Breweries 1999 0.96 1 1 1 0 0.7 7.27752993 -3.01716138 0.917299222 0.285714286
Champion Breweries 2000 1.03 1 1 1 0 0.72 7.14424579 -55.9353231 0.890129335 0.285714286
Champion Breweries 2001 1.04 1 1 1 0 0.78 6.7811478 10264.71844 1.045117582 0.285714286
Champion Breweries 2002 1.04 1 1 1 1 0.84 7.18562107 5.571528067 2.197258846 0.285714286
Champion Breweries 2003 1.59 1 1 1 1 0.84 7.09016113 4.56217488 1.257494091 0.285714286
Champion Breweries 2004 0.80 1 1 1 1 0.84 7.15843713 -40.0314315 1.712842725 0.285714286
Champion Breweries 2005 3.00 1 1 1 1 0.37 7.11668337 2.035102887 0.82342462 0.285714286
Champion Breweries 2006 1.21 1 1 1 0 0.38 7.19050177 3.267477694 0.560676423 0.285714286
Champion Breweries 2007 0.63 1 1 1 0 0.26 7.21223543 -0.63008448 0.653200221 0.285714286
Champion Breweries 2008 0.61 1 1 1 0 0.31 7.30692982 7.675738596 0.660838893 0.285714286
Champion Breweries 2009 0.61 1 1 1 1 0.22 7.41519815 1.242836033 0.706860382 0.5
Champion Breweries 2010 0.58 1 1 1 1 0.25 7.42365935 1.681719797 0.767878187 0.5
Champion Breweries 2011 0.82 1 1 1 1 0.2 6.54508434 -17.4914991 0.817021424 0.5
Champion Breweries 2012 0.65 0 1 1 0 0.25 6.51312554 45 0.884145359 0.285714286
Champion Breweries 2013 1.10 1 0 1 1 0.3 6.61706212 54.33156119 1.087675325 0.285714286
Champion Breweries 2014 1.48 1 1 1 0 0.57 6.66607354 14.06977555 2.654012409 0.285714286
Champion Breweries 2015 2.11 1 1 1 1 0.57 6.39532639 31.15153788 1.944672611 0.285714286
Champion Breweries 2016 1.36 1 1 1 0 0.56 6.78333055 8.831104651 3.201305591 0.285714286
Champion Breweries 2017 0.98 1 1 1 0 0.49 6.84970404 3.900414746 1.259844261 0.285714286
Champion Breweries 2018 1.02 1 1 1 0 0.47 6.90633547 2.250955505 1.059726409 0.285714286
Computer Warehouse Group 1997 1.02 1 1 1 1 0.51 6.99459071 3.760387605 0.966872264 0.285714286
Computer Warehouse Group 1998 0.94 1 1 1 0 0.52 7.02170845 5.9443465 1.012957225 0.142857143
Computer Warehouse Group 1999 0.98 1 1 1 0 0.48 8.23977593 -65.330001 1.086319366 0.142857143
Computer Warehouse Group 2000 0.96 0 1 1 0 0.59 8.65127026 7.667658426 0.984922745 0.285714286
Computer Warehouse Group 2001 1.16 0 1 1 0 0.7 8.89801613 19.51252723 1.141115072 0.285714286
Computer Warehouse Group 2002 1.32 1 1 1 0 0.7 8.80106808 16.70219727 1.05606722 0.5
Computer Warehouse Group 2003 1.13 1 1 1 0 0.69 8.84871796 -0.13601681 0.928411541 0.571428571
Computer Warehouse Group 2004 1.01 1 1 1 0 0.75 8.96107209 9.374803418 0.985039812 0.5
Computer Warehouse Group 2005 1.06 1 1 1 0 0.68 9.03093472 2.636205622 0.989656883 0.5
Computer Warehouse Group 2006 1.04 1 1 1 0 0.74 9.04791163 11.82854042 0.946128626 0.857142857
Computer Warehouse Group 2007 0.99 1 1 1 0 0.3 9.15262831 13.30648175 0.947425493 0.857142857
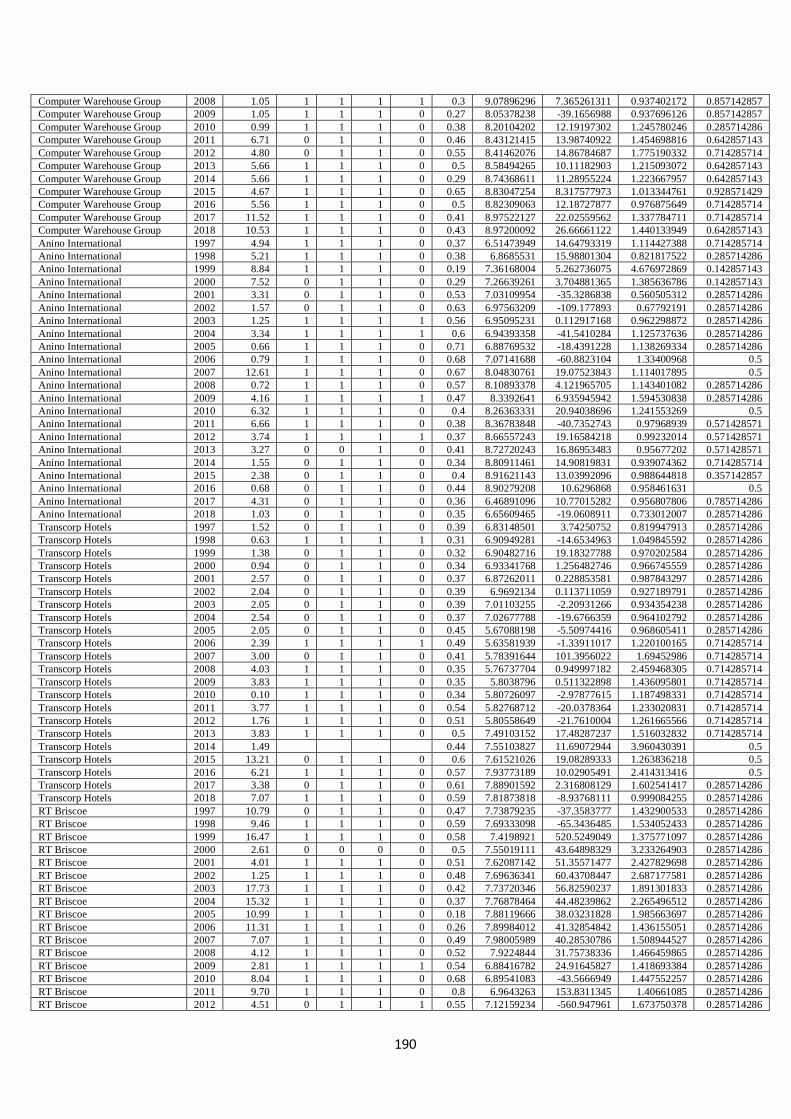
190
Computer Warehouse Group 2008 1.05 1 1 1 1 0.3 9.07896296 7.365261311 0.937402172 0.857142857
Computer Warehouse Group 2009 1.05 1 1 1 0 0.27 8.05378238 -39.1656988 0.937696126 0.857142857
Computer Warehouse Group 2010 0.99 1 1 1 0 0.38 8.20104202 12.19197302 1.245780246 0.285714286
Computer Warehouse Group 2011 6.71 0 1 1 0 0.46 8.43121415 13.98740922 1.454698816 0.642857143
Computer Warehouse Group 2012 4.80 0 1 1 0 0.55 8.41462076 14.86784687 1.775190332 0.714285714
Computer Warehouse Group 2013 5.66 1 1 1 0 0.5 8.58494265 10.11182903 1.215093072 0.642857143
Computer Warehouse Group 2014 5.66 1 1 1 0 0.29 8.74368611 11.28955224 1.223667957 0.642857143
Computer Warehouse Group 2015 4.67 1 1 1 0 0.65 8.83047254 8.317577973 1.013344761 0.928571429
Computer Warehouse Group 2016 5.56 1 1 1 0 0.5 8.82309063 12.18727877 0.976875649 0.714285714
Computer Warehouse Group 2017 11.52 1 1 1 0 0.41 8.97522127 22.02559562 1.337784711 0.714285714
Computer Warehouse Group 2018 10.53 1 1 1 0 0.43 8.97200092 26.66661122 1.440133949 0.642857143
Anino International 1997 4.94 1 1 1 0 0.37 6.51473949 14.64793319 1.114427388 0.714285714
Anino International 1998 5.21 1 1 1 0 0.38 6.8685531 15.98801304 0.821817522 0.285714286
Anino International 1999 8.84 1 1 1 0 0.19 7.36168004 5.262736075 4.676972869 0.142857143
Anino International 2000 7.52 0 1 1 0 0.29 7.26639261 3.704881365 1.385636786 0.142857143
Anino International 2001 3.31 0 1 1 0 0.53 7.03109954 -35.3286838 0.560505312 0.285714286
Anino International 2002 1.57 0 1 1 0 0.63 6.97563209 -109.177893 0.67792191 0.285714286
Anino International 2003 1.25 1 1 1 1 0.56 6.95095231 0.112917168 0.962298872 0.285714286
Anino International 2004 3.34 1 1 1 1 0.6 6.94393358 -41.5410284 1.125737636 0.285714286
Anino International 2005 0.66 1 1 1 0 0.71 6.88769532 -18.4391228 1.138269334 0.285714286
Anino International 2006 0.79 1 1 1 0 0.68 7.07141688 -60.8823104 1.33400968 0.5
Anino International 2007 12.61 1 1 1 0 0.67 8.04830761 19.07523843 1.114017895 0.5
Anino International 2008 0.72 1 1 1 0 0.57 8.10893378 4.121965705 1.143401082 0.285714286
Anino International 2009 4.16 1 1 1 1 0.47 8.3392641 6.935945942 1.594530838 0.285714286
Anino International 2010 6.32 1 1 1 0 0.4 8.26363331 20.94038696 1.241553269 0.5
Anino International 2011 6.66 1 1 1 0 0.38 8.36783848 -40.7352743 0.97968939 0.571428571
Anino International 2012 3.74 1 1 1 1 0.37 8.66557243 19.16584218 0.99232014 0.571428571
Anino International 2013 3.27 0 0 1 0 0.41 8.72720243 16.86953483 0.95677202 0.571428571
Anino International 2014 1.55 0 1 1 0 0.34 8.80911461 14.90819831 0.939074362 0.714285714
Anino International 2015 2.38 0 1 1 0 0.4 8.91621143 13.03992096 0.988644818 0.357142857
Anino International 2016 0.68 0 1 1 0 0.44 8.90279208 10.6296868 0.958461631 0.5
Anino International 2017 4.31 0 1 1 0 0.36 6.46891096 10.77015282 0.956807806 0.785714286
Anino International 2018 1.03 0 1 1 0 0.35 6.65609465 -19.0608911 0.733012007 0.285714286
Transcorp Hotels 1997 1.52 0 1 1 0 0.39 6.83148501 3.74250752 0.819947913 0.285714286
Transcorp Hotels 1998 0.63 1 1 1 1 0.31 6.90949281 -14.6534963 1.049845592 0.285714286
Transcorp Hotels 1999 1.38 0 1 1 0 0.32 6.90482716 19.18327788 0.970202584 0.285714286
Transcorp Hotels 2000 0.94 0 1 1 0 0.34 6.93341768 1.256482746 0.966745559 0.285714286
Transcorp Hotels 2001 2.57 0 1 1 0 0.37 6.87262011 0.228853581 0.987843297 0.285714286
Transcorp Hotels 2002 2.04 0 1 1 0 0.39 6.9692134 0.113711059 0.927189791 0.285714286
Transcorp Hotels 2003 2.05 0 1 1 0 0.39 7.01103255 -2.20931266 0.934354238 0.285714286
Transcorp Hotels 2004 2.54 0 1 1 0 0.37 7.02677788 -19.6766359 0.964102792 0.285714286
Transcorp Hotels 2005 2.05 0 1 1 0 0.45 5.67088198 -5.50974416 0.968605411 0.285714286
Transcorp Hotels 2006 2.39 1 1 1 1 0.49 5.63581939 -1.33911017 1.220100165 0.714285714
Transcorp Hotels 2007 3.00 0 1 1 0 0.41 5.78391644 101.3956022 1.69452986 0.714285714
Transcorp Hotels 2008 4.03 1 1 1 0 0.35 5.76737704 0.949997182 2.459468305 0.714285714
Transcorp Hotels 2009 3.83 1 1 1 0 0.35 5.8038796 0.511322898 1.436095801 0.714285714
Transcorp Hotels 2010 0.10 1 1 1 0 0.34 5.80726097 -2.97877615 1.187498331 0.714285714
Transcorp Hotels 2011 3.77 1 1 1 0 0.54 5.82768712 -20.0378364 1.233020831 0.714285714
Transcorp Hotels 2012 1.76 1 1 1 0 0.51 5.80558649 -21.7610004 1.261665566 0.714285714
Transcorp Hotels 2013 3.83 1 1 1 0 0.5 7.49103152 17.48287237 1.516032832 0.714285714
Transcorp Hotels 2014 1.49
0.44 7.55103827 11.69072944 3.960430391 0.5
Transcorp Hotels 2015 13.21 0 1 1 0 0.6 7.61521026 19.08289333 1.263836218 0.5
Transcorp Hotels 2016 6.21 1 1 1 0 0.57 7.93773189 10.02905491 2.414313416 0.5
Transcorp Hotels 2017 3.38 0 1 1 0 0.61 7.88901592 2.316808129 1.602541417 0.285714286
Transcorp Hotels 2018 7.07 1 1 1 0 0.59 7.81873818 -8.93768111 0.999084255 0.285714286
RT Briscoe 1997 10.79 0 1 1 0 0.47 7.73879235 -37.3583777 1.432900533 0.285714286
RT Briscoe 1998 9.46 1 1 1 0 0.59 7.69333098 -65.3436485 1.534052433 0.285714286
RT Briscoe 1999 16.47 1 1 1 0 0.58 7.4198921 520.5249049 1.375771097 0.285714286
RT Briscoe 2000 2.61 0 0 0 0 0.5 7.55019111 43.64898329 3.233264903 0.285714286
RT Briscoe 2001 4.01 1 1 1 0 0.51 7.62087142 51.35571477 2.427829698 0.285714286
RT Briscoe 2002 1.25 1 1 1 0 0.48 7.69636341 60.43708447 2.687177581 0.285714286
RT Briscoe 2003 17.73 1 1 1 0 0.42 7.73720346 56.82590237 1.891301833 0.285714286
RT Briscoe 2004 15.32 1 1 1 0 0.37 7.76878464 44.48239862 2.265496512 0.285714286
RT Briscoe 2005 10.99 1 1 1 0 0.18 7.88119666 38.03231828 1.985663697 0.285714286
RT Briscoe 2006 11.31 1 1 1 0 0.26 7.89984012 41.32854842 1.436155051 0.285714286
RT Briscoe 2007 7.07 1 1 1 0 0.49 7.98005989 40.28530786 1.508944527 0.285714286
RT Briscoe 2008 4.12 1 1 1 0 0.52 7.9224844 31.75738336 1.466459865 0.285714286
RT Briscoe 2009 2.81 1 1 1 1 0.54 6.88416782 24.91645827 1.418693384 0.285714286
RT Briscoe 2010 8.04 1 1 1 0 0.68 6.89541083 -43.5666949 1.447552257 0.285714286
RT Briscoe 2011 9.70 1 1 1 0 0.8 6.9643263 153.8311345 1.40661085 0.285714286
RT Briscoe 2012 4.51 0 1 1 1 0.55 7.12159234 -560.947961 1.673750378 0.285714286

191
RT Briscoe 2013 2.30 0 1 1 1 0.44 7.05665719 121.7601918 1.49540141 0.285714286
RT Briscoe 2014 3.41 0 1 1 1 0.46 7.04773906 -61.2250379 1.597830073 0.285714286
RT Briscoe 2015 4.56 0 1 1 0 0.4 7.04485948 -30.0578826 1.765869159 0.285714286
RT Briscoe 2016 3.36 1 1 1 1 0.4 7.02521933 6.922608503 1.603977576 0.5
RT Briscoe 2017 0.96 1 1 1 0 0.41 7.01645773 -50.0515428 1.703439266 0.285714286
RT Briscoe 2018 1.46 1 1 1 0 0.43 7.9606659 183.6896487 1.897676188 0.285714286
Port & Paints & Products Nig. 1997 0.76 1 1 1 0 0.42 7.9986287 6.706934394 1.083139172 0.285714286
Port & Paints & Products Nig. 1998 1.06 1 1 1 0 2.24 8.00492247 -25.1912866 1.576714885 0.5
Port & Paints & Products Nig. 1999 1.41 1 1 1 0 1.3 7.54098836 -20.2128038 1.30025776 0.5
Port & Paints & Products Nig. 2000 0.36 1 1 1 0 1.5 7.63312188 5.345230071 0.692646424 0.5
Port & Paints & Products Nig. 2001 1.36 1 1 1 0 1.5 7.78867794 20.23274968 0.902678685 0.5
Port & Paints & Products Nig. 2002 0.01 1 1 1 0 0.39 7.87854593 14.3110443 1.077747705 0.285714286
Port & Paints & Products Nig. 2003 11.54 1 1 1 0 0.31 8.1745378 6.100521861 1.177909715 0.285714286
Port & Paints & Products Nig. 2004 12.23 1 1 1 0 0.23 8.23237435 8.027437008 0.867532182 0.285714286
Port & Paints & Products Nig. 2005 16.36 1 0 1 0 0.19 8.30724769 3.681427759 1.372347295 0.285714286
Port & Paints & Products Nig. 2006 14.85 1 0 1 0 0.39 5.27275568 2.321640634 1.045825515 0.357142857
Port & Paints & Products Nig. 2007 11.50 1 0 1 0 0.48 5.3605153 27.68440936 1.078609454 0.285714286
Port & Paints & Products Nig. 2008 9.10 1 0 1 0 0.48 5.43142146 35.27169468 0.818908019 0.285714286
Port & Paints & Products Nig. 2009 6.60 1 1 1 0 0.56 5.70840681 30.79688676 4.357037798 0.285714286
Port & Paints & Products Nig. 2010 3.77 1 0 1 1 0.51 5.70980732 14.59817941 2.086476727 0.285714286
Port & Paints & Products Nig. 2011 2.10 1 1 1 0 0.61 5.76307817 12.04400393 1.840211564 0.285714286
Port & Paints & Products Nig. 2012 4.91 1 1 1 0 0.7 5.78180347 10.64288699 1.890232308 0.285714286
Port & Paints & Products Nig. 2013 7.27 1 0 1 0 0.88 5.82277723 -10.9345441 1.568481672 0.285714286
Port & Paints & Products Nig. 2014 8.47 1 0 1 0 0.7 5.79758674 20.29619145 1.007004148 0.285714286
Port & Paints & Products Nig. 2015 16.98 1 1 1 0 0.9 5.81708057 16.79777811 0.997158975 0.285714286
Port & Paints & Products Nig. 2016 8.52 1 1 1 1 0.79 6.17145614 11.90698109 0.691550185 0.357142857
Port & Paints & Products Nig. 2017 6.61 1 1 1 1 0.71 6.18621475 2.867428228 0.662710542 0.285714286
Port & Paints & Products Nig. 2018 7.11 1 1 1 1 0.74 6.17029487 7.128544015 1.666296345 0.285714286
E-Tranzact International 1997 4.09 0 1 1 0 0.94 6.22947578 13.00059363 2.34233052 0.5
E-Tranzact International 1998 8.48 0 1 1 0 0.9 6.15459559 16.60593248 2.441026865 0.5
E-Tranzact International 1999 5.46 0 1 1 0 0.87 6.15953561 -7.42067106 1.866343991 0.5
E-Tranzact International 2000 7.21 0 1 1 0 0.57 6.23380883 -7.7389918 1.67861426 0.5
E-Tranzact International 2001 8.58 0 1 1 0 0.52 6.22254324 -0.97063495 1.338431525 0.5
E-Tranzact International 2002 10.46 0 1 1 0 0.61 6.24316956 1.74253171 1.679801362 0.5
E-Tranzact International 2003 9.11 0 1 1 0 0.58 6.25651233 1.412563642 1.533769379 0.5
E-Tranzact International 2004 9.85 1 1 1 0 0.62 7.44222566 3.616515709 1.463658319 0.571428571
E-Tranzact International 2005 5.92 1 1 1 0 0.55 7.89828722 16.20044607 1.418237839 0.285714286
E-Tranzact International 2006 5.40 0 1 1 0 0.54 7.9786667 13.18336498 0.918054571 0.5
E-Tranzact International 2007 8.88 0 1 1 0 0.55 7.97354918 14.21546627 1.546779571 0.5
E-Tranzact International 2008 7.33 0 1 1 0 0.84 8.01018304 13.73797764 1.285361986 0.5
E-Tranzact International 2009 11.45 0 1 1 0 0.87 8.08490857 11.9567462 1.671491466 0.5
E-Tranzact International 2010 8.22 1 1 1 0 0.9 8.08981893 5.971575303 3.341932121 0.5
E-Tranzact International 2011 10.76 1 1 1 0 0.77 8.08997034 11.72079775 1.257964074 0.5
E-Tranzact International 2012 4.90 0 1 1 0 0.75 8.11514655 13.8851418 1.98399763 0.5
E-Tranzact International 2013 4.12 0 1 1 0 0.81 8.10942778 14.40774363 1.289036746 0.428571429
E-Tranzact International 2014 10.91 1 1 1 0 0.79 6.86835373 6.942018563 0.963222647 0.785714286
E-Tranzact International 2015 8.60 1 1 1 0 0.8 6.88732445 5.729685909 1.452608012 0.5
E-Tranzact International 2016 13.95 1 1 1 0 0.1 6.91143195 8.91792767 2.191473036 0.5
E-Tranzact International 2017 5.25 0 1 1 0 0.14 6.8841495 5.13888941 1.313602889 0.285714286
E-Tranzact International 2018 4.06 0 1 1 0 0.33 6.83855676 -5.23681305 0.750889653 0.285714286
Paints & Coatings Manufactures 1997 1.04 1 1 1 1 0.32 6.78311692 -36.5464178 0.795785207 0.285714286
Paints & Coatings Manufactures 1998 2.13 1 1 1 0 0.32 6.77989217 -4.91658672 0.716847446 0.285714286
Paints & Coatings Manufactures 1999 17.40 1 1 1 0 0.29 6.70963624 -12.9645246 0.752119321 0.285714286
Paints & Coatings Manufactures 2000 34.17 1 1 1 0 0.22 6.64679853 -73.5825223 0.9374276 0.285714286
Paints & Coatings Manufactures 2001 11.84 1 1 1 0 0.22 7.2700374 -73.160658 1.080963386 0.285714286
Paints & Coatings Manufactures 2002 18.33 1 1 1 0 0.55 7.30862698 -34.7645338 3.997333995 0.5
Paints & Coatings Manufactures 2003 8.40 1 1 1 0 0.47 7.37093212 25.77167966 4.091042092 0.5
Paints & Coatings Manufactures 2004 9.45 1 1 1 0 0.46 7.37436336 38.86121984 4.37573935 0.5
Paints & Coatings Manufactures 2005 12.16 1 1 1 0 0.44 7.41383601 49.90246281 2.823889898 0.5
Paints & Coatings Manufactures 2006 7.00 0 1 1 0 0.6 7.50852873 50.14860423 4.367084045 0.5
Paints & Coatings Manufactures 2007 6.26 0 0 0 0 0.62 7.56226459 41.28848397 3.893135144 0.5
Paints & Coatings Manufactures 2008 7.12 1 0 1 0 0.54 7.64101889 39.51707831 4.093241099 0.5
Paints & Coatings Manufactures 2009 3.49 1 0 1 0 0.56 7.6602606 49.8657582 5.784020911 0.642857143
Paints & Coatings Manufactures 2010 4.27 1 0 1 0 0.57 7.7004656 32.25571508 4.732578994 0.857142857
Paints & Coatings Manufactures 2011 4.74 1 1 1 0 0.45 8.94651957 14.89851689 3.928186674 0.857142857
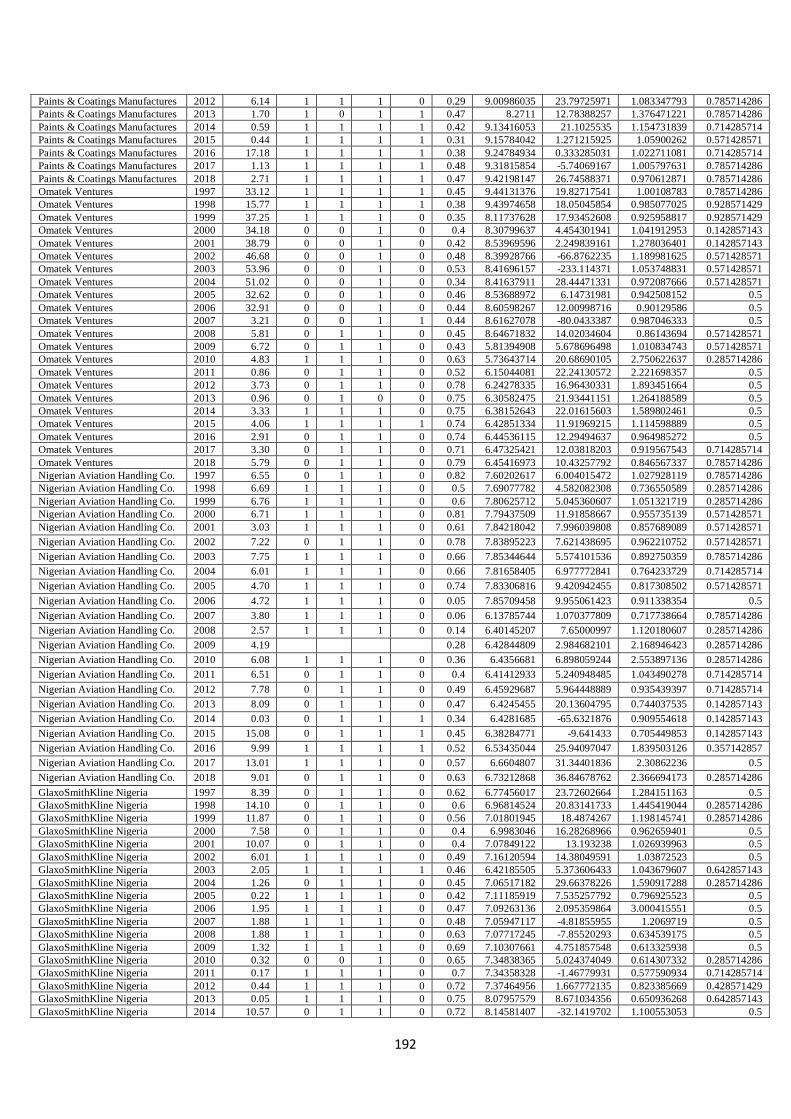
192
Paints & Coatings Manufactures 2012 6.14 1 1 1 0 0.29 9.00986035 23.79725971 1.083347793 0.785714286
Paints & Coatings Manufactures 2013 1.70 1 0 1 1 0.47 8.2711 12.78388257 1.376471221 0.785714286
Paints & Coatings Manufactures 2014 0.59 1 1 1 1 0.42 9.13416053 21.1025535 1.154731839 0.714285714
Paints & Coatings Manufactures 2015 0.44 1 1 1 1 0.31 9.15784042 1.271215925 1.05900262 0.571428571
Paints & Coatings Manufactures 2016 17.18 1 1 1 1 0.38 9.24784934 0.333285031 1.022711081 0.714285714
Paints & Coatings Manufactures 2017 1.13 1 1 1 1 0.48 9.31815854 -5.74069167 1.005797631 0.785714286
Paints & Coatings Manufactures 2018 2.71 1 1 1 1 0.47 9.42198147 26.74588371 0.970612871 0.785714286
Omatek Ventures 1997 33.12 1 1 1 1 0.45 9.44131376 19.82717541 1.00108783 0.785714286
Omatek Ventures 1998 15.77 1 1 1 1 0.38 9.43974658 18.05045854 0.985077025 0.928571429
Omatek Ventures 1999 37.25 1 1 1 0 0.35 8.11737628 17.93452608 0.925958817 0.928571429
Omatek Ventures 2000 34.18 0 0 1 0 0.4 8.30799637 4.454301941 1.041912953 0.142857143
Omatek Ventures 2001 38.79 0 0 1 0 0.42 8.53969596 2.249839161 1.278036401 0.142857143
Omatek Ventures 2002 46.68 0 0 1 0 0.48 8.39928766 -66.8762235 1.189981625 0.571428571
Omatek Ventures 2003 53.96 0 0 1 0 0.53 8.41696157 -233.114371 1.053748831 0.571428571
Omatek Ventures 2004 51.02 0 0 1 0 0.34 8.41637911 28.44471331 0.972087666 0.571428571
Omatek Ventures 2005 32.62 0 0 1 0 0.46 8.53688972 6.14731981 0.942508152 0.5
Omatek Ventures 2006 32.91 0 0 1 0 0.44 8.60598267 12.00998716 0.90129586 0.5
Omatek Ventures 2007 3.21 0 0 1 1 0.44 8.61627078 -80.0433387 0.987046333 0.5
Omatek Ventures 2008 5.81 0 1 1 0 0.45 8.64671832 14.02034604 0.86143694 0.571428571
Omatek Ventures 2009 6.72 0 1 1 0 0.43 5.81394908 5.678696498 1.010834743 0.571428571
Omatek Ventures 2010 4.83 1 1 1 0 0.63 5.73643714 20.68690105 2.750622637 0.285714286
Omatek Ventures 2011 0.86 0 1 1 0 0.52 6.15044081 22.24130572 2.221698357 0.5
Omatek Ventures 2012 3.73 0 1 1 0 0.78 6.24278335 16.96430331 1.893451664 0.5
Omatek Ventures 2013 0.96 0 1 0 0 0.75 6.30582475 21.93441151 1.264188589 0.5
Omatek Ventures 2014 3.33 1 1 1 0 0.75 6.38152643 22.01615603 1.589802461 0.5
Omatek Ventures 2015 4.06 1 1 1 1 0.74 6.42851334 11.91969215 1.114598889 0.5
Omatek Ventures 2016 2.91 0 1 1 0 0.74 6.44536115 12.29494637 0.964985272 0.5
Omatek Ventures 2017 3.30 0 1 1 0 0.71 6.47325421 12.03818203 0.919567543 0.714285714
Omatek Ventures 2018 5.79 0 1 1 0 0.79 6.45416973 10.43257792 0.846567337 0.785714286
Nigerian Aviation Handling Co. 1997 6.55 0 1 1 0 0.82 7.60202617 6.004015472 1.027928119 0.785714286
Nigerian Aviation Handling Co. 1998 6.69 1 1 1 0 0.5 7.69077782 4.582082308 0.736550589 0.285714286
Nigerian Aviation Handling Co. 1999 6.76 1 1 1 0 0.6 7.80625712 5.045360607 1.051321719 0.285714286
Nigerian Aviation Handling Co. 2000 6.71 1 1 1 0 0.81 7.79437509 11.91858667 0.955735139 0.571428571
Nigerian Aviation Handling Co. 2001 3.03 1 1 1 0 0.61 7.84218042 7.996039808 0.857689089 0.571428571
Nigerian Aviation Handling Co. 2002 7.22 0 1 1 0 0.78 7.83895223 7.621438695 0.962210752 0.571428571
Nigerian Aviation Handling Co. 2003 7.75 1 1 1 0 0.66 7.85344644 5.574101536 0.892750359 0.785714286
Nigerian Aviation Handling Co. 2004 6.01 1 1 1 0 0.66 7.81658405 6.977772841 0.764233729 0.714285714
Nigerian Aviation Handling Co. 2005 4.70 1 1 1 0 0.74 7.83306816 9.420942455 0.817308502 0.571428571
Nigerian Aviation Handling Co. 2006 4.72 1 1 1 0 0.05 7.85709458 9.955061423 0.911338354 0.5
Nigerian Aviation Handling Co. 2007 3.80 1 1 1 0 0.06 6.13785744 1.070377809 0.717738664 0.785714286
Nigerian Aviation Handling Co. 2008 2.57 1 1 1 0 0.14 6.40145207 7.65000997 1.120180607 0.285714286
Nigerian Aviation Handling Co. 2009 4.19
0.28 6.42844809 2.984682101 2.168946423 0.285714286
Nigerian Aviation Handling Co. 2010 6.08 1 1 1 0 0.36 6.4356681 6.898059244 2.553897136 0.285714286
Nigerian Aviation Handling Co. 2011 6.51 0 1 1 0 0.4 6.41412933 5.240948485 1.043490278 0.714285714
Nigerian Aviation Handling Co. 2012 7.78 0 1 1 0 0.49 6.45929687 5.964448889 0.935439397 0.714285714
Nigerian Aviation Handling Co. 2013 8.09 0 1 1 0 0.47 6.4245455 20.13604795 0.744037535 0.142857143
Nigerian Aviation Handling Co. 2014 0.03 0 1 1 1 0.34 6.4281685 -65.6321876 0.909554618 0.142857143
Nigerian Aviation Handling Co. 2015 15.08 0 1 1 1 0.45 6.38284771 -9.641433 0.705449853 0.142857143
Nigerian Aviation Handling Co. 2016 9.99 1 1 1 1 0.52 6.53435044 25.94097047 1.839503126 0.357142857
Nigerian Aviation Handling Co. 2017 13.01 1 1 1 0 0.57 6.6604807 31.34401836 2.30862236 0.5
Nigerian Aviation Handling Co. 2018 9.01 0 1 1 0 0.63 6.73212868 36.84678762 2.366694173 0.285714286
GlaxoSmithKline Nigeria 1997 8.39 0 1 1 0 0.62 6.77456017 23.72602664 1.284151163 0.5
GlaxoSmithKline Nigeria 1998 14.10 0 1 1 0 0.6 6.96814524 20.83141733 1.445419044 0.285714286
GlaxoSmithKline Nigeria 1999 11.87 0 1 1 0 0.56 7.01801945 18.4874267 1.198145741 0.285714286
GlaxoSmithKline Nigeria 2000 7.58 0 1 1 0 0.4 6.9983046 16.28268966 0.962659401 0.5
GlaxoSmithKline Nigeria 2001 10.07 0 1 1 0 0.4 7.07849122 13.193238 1.026939963 0.5
GlaxoSmithKline Nigeria 2002 6.01 1 1 1 0 0.49 7.16120594 14.38049591 1.03872523 0.5
GlaxoSmithKline Nigeria 2003 2.05 1 1 1 1 0.46 6.42185505 5.373606433 1.043679607 0.642857143
GlaxoSmithKline Nigeria 2004 1.26 0 1 1 0 0.45 7.06517182 29.66378226 1.590917288 0.285714286
GlaxoSmithKline Nigeria 2005 0.22 1 1 1 0 0.42 7.11185919 7.535257792 0.796925523 0.5
GlaxoSmithKline Nigeria 2006 1.95 1 1 1 0 0.47 7.09263136 2.095359864 3.000415551 0.5
GlaxoSmithKline Nigeria 2007 1.88 1 1 1 0 0.48 7.05947117 -4.81855955 1.2069719 0.5
GlaxoSmithKline Nigeria 2008 1.88 1 1 1 0 0.63 7.07717245 -7.85520293 0.634539175 0.5
GlaxoSmithKline Nigeria 2009 1.32 1 1 1 0 0.69 7.10307661 4.751857548 0.613325938 0.5
GlaxoSmithKline Nigeria 2010 0.32 0 0 1 0 0.65 7.34838365 5.024374049 0.614307332 0.285714286
GlaxoSmithKline Nigeria 2011 0.17 1 1 1 0 0.7 7.34358328 -1.46779931 0.577590934 0.714285714
GlaxoSmithKline Nigeria 2012 0.44 1 1 1 0 0.72 7.37464956 1.667772135 0.823385669 0.428571429
GlaxoSmithKline Nigeria 2013 0.05 1 1 1 0 0.75 8.07957579 8.671034356 0.650936268 0.642857143
GlaxoSmithKline Nigeria 2014 10.57 0 1 1 0 0.72 8.14581407 -32.1419702 1.100553053 0.5
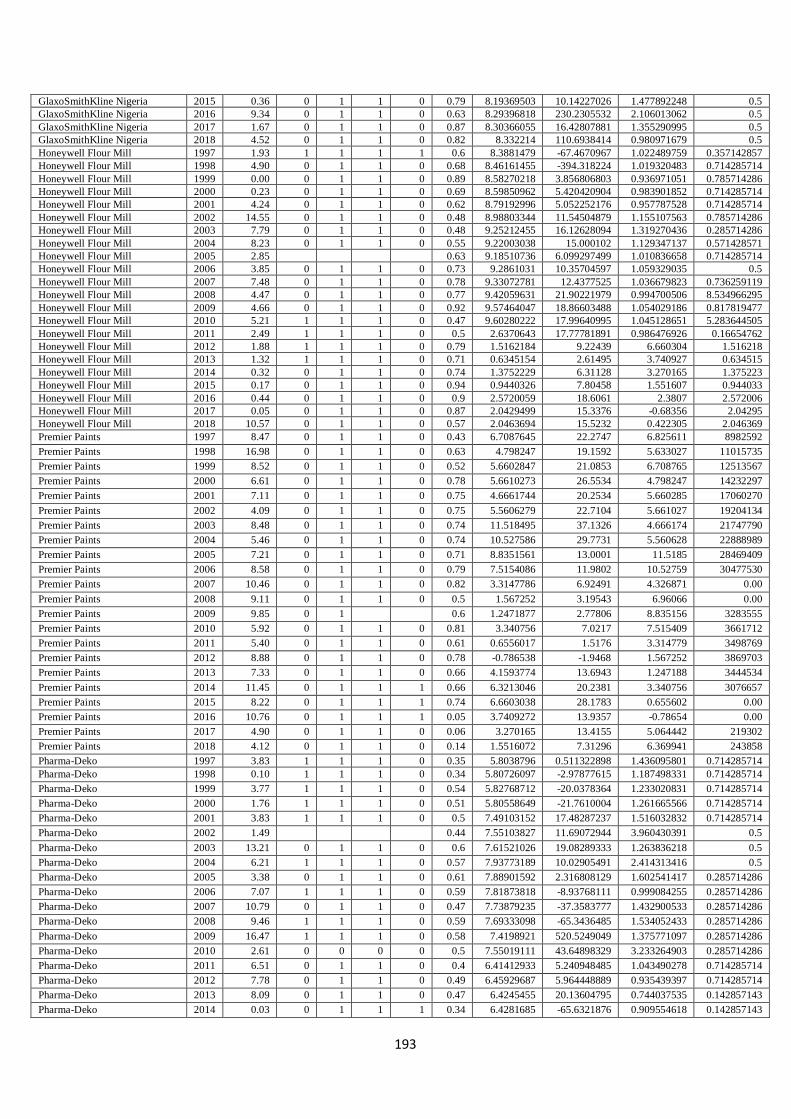
193
GlaxoSmithKline Nigeria 2015 0.36 0 1 1 0 0.79 8.19369503 10.14227026 1.477892248 0.5
GlaxoSmithKline Nigeria 2016 9.34 0 1 1 0 0.63 8.29396818 230.2305532 2.106013062 0.5
GlaxoSmithKline Nigeria 2017 1.67 0 1 1 0 0.87 8.30366055 16.42807881 1.355290995 0.5
GlaxoSmithKline Nigeria 2018 4.52 0 1 1 0 0.82 8.332214 110.6938414 0.980971679 0.5
Honeywell Flour Mill 1997 1.93 1 1 1 1 0.6 8.3881479 -67.4670967 1.022489759 0.357142857
Honeywell Flour Mill 1998 4.90 0 1 1 0 0.68 8.46161455 -394.318224 1.019320483 0.714285714
Honeywell Flour Mill 1999 0.00 0 1 1 0 0.89 8.58270218 3.856806803 0.936971051 0.785714286
Honeywell Flour Mill 2000 0.23 0 1 1 0 0.69 8.59850962 5.420420904 0.983901852 0.714285714
Honeywell Flour Mill 2001 4.24 0 1 1 0 0.62 8.79192996 5.052252176 0.957787528 0.714285714
Honeywell Flour Mill 2002 14.55 0 1 1 0 0.48 8.98803344 11.54504879 1.155107563 0.785714286
Honeywell Flour Mill 2003 7.79 0 1 1 0 0.48 9.25212455 16.12628094 1.319270436 0.285714286
Honeywell Flour Mill 2004 8.23 0 1 1 0 0.55 9.22003038 15.000102 1.129347137 0.571428571
Honeywell Flour Mill 2005 2.85
0.63 9.18510736 6.099297499 1.010836658 0.714285714
Honeywell Flour Mill 2006 3.85 0 1 1 0 0.73 9.2861031 10.35704597 1.059329035 0.5
Honeywell Flour Mill 2007 7.48 0 1 1 0 0.78 9.33072781 12.4377525 1.036679823 0.736259119
Honeywell Flour Mill 2008 4.47 0 1 1 0 0.77 9.42059631 21.90221979 0.994700506 8.534966295
Honeywell Flour Mill 2009 4.66 0 1 1 0 0.92 9.57464047 18.86603488 1.054029186 0.817819477
Honeywell Flour Mill 2010 5.21 1 1 1 0 0.47 9.60280222 17.99640995 1.045128651 5.283644505
Honeywell Flour Mill 2011 2.49 1 1 1 0 0.5 2.6370643 17.77781891 0.986476926 0.16654762
Honeywell Flour Mill 2012 1.88 1 1 1 0 0.79 1.5162184 9.22439 6.660304 1.516218
Honeywell Flour Mill 2013 1.32 1 1 1 0 0.71 0.6345154 2.61495 3.740927 0.634515
Honeywell Flour Mill 2014 0.32 0 1 1 0 0.74 1.3752229 6.31128 3.270165 1.375223
Honeywell Flour Mill 2015 0.17 0 1 1 0 0.94 0.9440326 7.80458 1.551607 0.944033
Honeywell Flour Mill 2016 0.44 0 1 1 0 0.9 2.5720059 18.6061 2.3807 2.572006
Honeywell Flour Mill 2017 0.05 0 1 1 0 0.87 2.0429499 15.3376 -0.68356 2.04295
Honeywell Flour Mill 2018 10.57 0 1 1 0 0.57 2.0463694 15.5232 0.422305 2.046369
Premier Paints 1997 8.47 0 1 1 0 0.43 6.7087645 22.2747 6.825611 8982592
Premier Paints 1998 16.98 0 1 1 0 0.63 4.798247 19.1592 5.633027 11015735
Premier Paints 1999 8.52 0 1 1 0 0.52 5.6602847 21.0853 6.708765 12513567
Premier Paints 2000 6.61 0 1 1 0 0.78 5.6610273 26.5534 4.798247 14232297
Premier Paints 2001 7.11 0 1 1 0 0.75 4.6661744 20.2534 5.660285 17060270
Premier Paints 2002 4.09 0 1 1 0 0.75 5.5606279 22.7104 5.661027 19204134
Premier Paints 2003 8.48 0 1 1 0 0.74 11.518495 37.1326 4.666174 21747790
Premier Paints 2004 5.46 0 1 1 0 0.74 10.527586 29.7731 5.560628 22888989
Premier Paints 2005 7.21 0 1 1 0 0.71 8.8351561 13.0001 11.5185 28469409
Premier Paints 2006 8.58 0 1 1 0 0.79 7.5154086 11.9802 10.52759 30477530
Premier Paints 2007 10.46 0 1 1 0 0.82 3.3147786 6.92491 4.326871 0.00
Premier Paints 2008 9.11 0 1 1 0 0.5 1.567252 3.19543 6.96066 0.00
Premier Paints 2009 9.85 0 1 0.6 1.2471877 2.77806 8.835156 3283555
Premier Paints 2010 5.92 0 1 1 0 0.81 3.340756 7.0217 7.515409 3661712
Premier Paints 2011 5.40 0 1 1 0 0.61 0.6556017 1.5176 3.314779 3498769
Premier Paints 2012 8.88 0 1 1 0 0.78 -0.786538 -1.9468 1.567252 3869703
Premier Paints 2013 7.33 0 1 1 0 0.66 4.1593774 13.6943 1.247188 3444534
Premier Paints 2014 11.45 0 1 1 1 0.66 6.3213046 20.2381 3.340756 3076657
Premier Paints 2015 8.22 0 1 1 1 0.74 6.6603038 28.1783 0.655602 0.00
Premier Paints 2016 10.76 0 1 1 1 0.05 3.7409272 13.9357 -0.78654 0.00
Premier Paints 2017 4.90 0 1 1 0 0.06 3.270165 13.4155 5.064442 219302
Premier Paints 2018 4.12 0 1 1 0 0.14 1.5516072 7.31296 6.369941 243858
Pharma-Deko 1997 3.83 1 1 1 0 0.35 5.8038796 0.511322898 1.436095801 0.714285714
Pharma-Deko 1998 0.10 1 1 1 0 0.34 5.80726097 -2.97877615 1.187498331 0.714285714
Pharma-Deko 1999 3.77 1 1 1 0 0.54 5.82768712 -20.0378364 1.233020831 0.714285714
Pharma-Deko 2000 1.76 1 1 1 0 0.51 5.80558649 -21.7610004 1.261665566 0.714285714
Pharma-Deko 2001 3.83 1 1 1 0 0.5 7.49103152 17.48287237 1.516032832 0.714285714
Pharma-Deko 2002 1.49 0.44 7.55103827 11.69072944 3.960430391 0.5
Pharma-Deko 2003 13.21 0 1 1 0 0.6 7.61521026 19.08289333 1.263836218 0.5
Pharma-Deko 2004 6.21 1 1 1 0 0.57 7.93773189 10.02905491 2.414313416 0.5
Pharma-Deko 2005 3.38 0 1 1 0 0.61 7.88901592 2.316808129 1.602541417 0.285714286
Pharma-Deko 2006 7.07 1 1 1 0 0.59 7.81873818 -8.93768111 0.999084255 0.285714286
Pharma-Deko 2007 10.79 0 1 1 0 0.47 7.73879235 -37.3583777 1.432900533 0.285714286
Pharma-Deko 2008 9.46 1 1 1 0 0.59 7.69333098 -65.3436485 1.534052433 0.285714286
Pharma-Deko 2009 16.47 1 1 1 0 0.58 7.4198921 520.5249049 1.375771097 0.285714286
Pharma-Deko 2010 2.61 0 0 0 0 0.5 7.55019111 43.64898329 3.233264903 0.285714286
Pharma-Deko 2011 6.51 0 1 1 0 0.4 6.41412933 5.240948485 1.043490278 0.714285714
Pharma-Deko 2012 7.78 0 1 1 0 0.49 6.45929687 5.964448889 0.935439397 0.714285714
Pharma-Deko 2013 8.09 0 1 1 0 0.47 6.4245455 20.13604795 0.744037535 0.142857143
Pharma-Deko 2014 0.03 0 1 1 1 0.34 6.4281685 -65.6321876 0.909554618 0.142857143

194
Pharma-Deko 2015 15.08 0 1 1 1 0.45 6.38284771 -9.641433 0.705449853 0.142857143
Pharma-Deko 2016 9.99 1 1 1 1 0.52 6.53435044 25.94097047 1.839503126 0.357142857
Pharma-Deko 2017 13.01 1 1 1 0 0.57 6.6604807 31.34401836 2.30862236 0.5
Pharma-Deko 2018 9.01 0 1 1 0 0.63 6.73212868 36.84678762 2.366694173 0.285714286
Nigerian Enamelware 1997 1.02 1 1 1 0 0.47 6.90633547 2.250955505 1.059726409 0.285714286
Nigerian Enamelware 1998 1.02 1 1 1 1 0.51 6.99459071 3.760387605 0.966872264 0.285714286
Nigerian Enamelware 1999 0.94 1 1 1 0 0.52 7.02170845 5.9443465 1.012957225 0.142857143
Nigerian Enamelware 2000 0.98 1 1 1 0 0.48 8.23977593 -65.330001 1.086319366 0.142857143
Nigerian Enamelware 2001 0.96 0 1 1 0 0.59 8.65127026 7.667658426 0.984922745 0.285714286
Nigerian Enamelware 2002 1.16 0 1 1 0 0.7 8.89801613 19.51252723 1.141115072 0.285714286
Nigerian Enamelware 2003 1.32 1 1 1 0 0.7 8.80106808 16.70219727 1.05606722 0.5
Nigerian Enamelware 2004 1.13 1 1 1 0 0.69 8.84871796 -0.13601681 0.928411541 0.571428571
Nigerian Enamelware 2005 1.01 1 1 1 0 0.75 8.96107209 9.374803418 0.985039812 0.5
Nigerian Enamelware 2006 1.06 1 1 1 0 0.68 9.03093472 2.636205622 0.989656883 0.5
Nigerian Enamelware 2007 1.04 1 1 1 0 0.74 9.04791163 11.82854042 0.946128626 0.857142857
Nigerian Enamelware 2008 0.99 1 1 1 0 0.3 9.15262831 13.30648175 0.947425493 0.857142857
Nigerian Enamelware 2009 1.05 1 1 1 1 0.3 9.07896296 7.365261311 0.937402172 0.857142857
Nigerian Enamelware 2010 1.05 1 1 1 0 0.27 8.05378238 -39.1656988 0.937696126 0.857142857
Nigerian Enamelware 2011 0.99 1 1 1 0 0.38 8.20104202 12.19197302 1.245780246 0.285714286
Nigerian Enamelware 2012 6.71 0 1 1 0 0.46 8.43121415 13.98740922 1.454698816 0.642857143
Nigerian Enamelware 2013 4.80 0 1 1 0 0.55 8.41462076 14.86784687 1.775190332 0.714285714
Nigerian Enamelware 2014 5.66 1 1 1 0 0.5 8.58494265 10.11182903 1.215093072 0.642857143
Nigerian Enamelware 2015 5.66 1 1 1 0 0.29 8.74368611 11.28955224 1.223667957 0.642857143
Nigerian Enamelware 2016 4.67 1 1 1 0 0.65 8.83047254 8.317577973 1.013344761 0.928571429
Nigerian Enamelware 2017 5.56 1 1 1 0 0.5 8.82309063 12.18727877 0.976875649 0.714285714
Nigerian Enamelware 2018 11.52 1 1 1 0 0.41 8.97522127 22.02559562 1.337784711 0.714285714
Meyer 1997 2.35 0 1 1 0 0.52 7.25469842 2.695751771 0.359102404 0.5
Meyer 1998 1.94 0 1 1 0 0.66 7.28986166 2.084959483 0.355354368 0.5
Meyer 1999 1.16 0 1 1 0 0.73 5.50750101 3.140809524 0.368466604 0.5
Meyer 2000 2.38 0 1 1 0 0.87 5.58713264 -217.941445 7.97279455 0.285714286
Meyer 2001 1.91 0.74 5.94070271 -2.48414581 18.63350453 0.285714286
Meyer 2002 1.05 1 1 1 0 0.34 5.94070271 12.56924751 12.27508156 0.285714286
Meyer 2003 0.97 1 1 1 0 0.44 6.03207777 7.603717057 3.070373487 0.285714286
Meyer 2004 0.90 1 1 1 0 0.38 6.19108532 6.704503463 1.852486119 0.285714286
Meyer 2005 0.90 1 1 1 0 0.4 6.31645703 20.00457883 1.328971876 0.285714286
Meyer 2006 0.92 1 1 1 0 0.5 6.56473753 22.77180002 1.872061326 0.285714286
Meyer 2007 0.89 1 1 1 0 0.57 6.75987822 12.18375122 2.648303658 0.285714286
Meyer 2008 1.05 0 1 1 0 0.67 6.65986992 12.81164657 1.758954357 0.285714286
Meyer 2009 2.20 0 0 1 0 0.62 6.59819631 9.64270815 1.440134216 0.428571429
Meyer 2010 1.26 0 0 1 0 0.32 6.64884781 8.079558453 1.662569371 0.5
Meyer 2011 1.71 0 0 1 0 0.48 6.75785953 7.964249231 3.168910316 0.5
Meyer 2012 0.82 0 1 1 0 0.5 6.78914676 15.1786045 2.33308017 0.357142857
Meyer 2013 0.56 0 1 1 0 0.57 6.83358769 8.577462379 1.265894689 0.285714286
Meyer 2014 0.65 0 0 1 0 0.59 6.84740397 6.692726324 1.322955607 0.285714286
Meyer 2015 0.66 0 1 1 0 0.59 6.90684157 8.099030134 1.090695307 0.285714286
Meyer 2016 0.71 0 1 1 0 0.5 6.91169271 2.424515435 0.809180998 0.357142857
Meyer 2017 0.77 1 1 1 0 0.45 6.90825478 -3.40316789 0.893590454 0.285714286
Meyer 2018 0.82 0 1 1 0 0.49 6.91575525 2.048181629 0.83105268 0.5
McNichols 1997 0.74 1 1 1 0 0.55 7.82858199 12.52687631 2.350593441 0.357142857
McNichols 1998 0.91 1 1 1 0 0.53 6.67916788 11.03075311 1.941770026 0.642857143
McNichols 1999 0.71 1 1 1 0 0.51 6.86828551 22.25464175 1.156746036 0.285714286
McNichols 2000 1.84 1 1 1 0 0.42 6.98636469 21.64520338 2.38452394 0.285714286
McNichols 2001 2.31 1 0 1 0 0.43 6.88448513 19.50963184 1.908463214 0.285714286
McNichols 2002 2.37 1 1 1 1 0.42 6.97446269 13.18359625 1.054407478 0.285714286
McNichols 2003 1.28 1 1 1 1 0.45 7.17749492 4.405218406 0.967930466 0.285714286
McNichols 2004 1.45 0.44 7.14967873 4.256369094 0.896788971 0.285714286
McNichols 2005 1.20 1 1 1 0 0.68 7.18524782 -8.95953259 0.899837681 0.285714286
McNichols 2006 0.96 1 1 1 0 0.7 7.27752993 -3.01716138 0.917299222 0.285714286
McNichols 2007 1.03 1 1 1 0 0.72 7.14424579 -55.9353231 0.890129335 0.285714286
McNichols 2008 1.04 1 1 1 0 0.78 6.7811478 10264.71844 1.045117582 0.285714286
McNichols 2009 1.04 1 1 1 1 0.84 7.18562107 5.571528067 2.197258846 0.285714286
McNichols 2010 1.59 1 1 1 1 0.84 7.09016113 4.56217488 1.257494091 0.285714286

195
McNichols 2011 0.80 1 1 1 1 0.84 7.15843713 -40.0314315 1.712842725 0.285714286
McNichols 2012 3.00 1 1 1 1 0.37 7.11668337 2.035102887 0.82342462 0.285714286
McNichols 2013 1.21 1 1 1 0 0.38 7.19050177 3.267477694 0.560676423 0.285714286
McNichols 2014 0.63 1 1 1 0 0.26 7.21223543 -0.63008448 0.653200221 0.285714286
McNichols 2015 0.61 1 1 1 0 0.31 7.30692982 7.675738596 0.660838893 0.285714286
McNichols 2016 0.61 1 1 1 1 0.22 7.41519815 1.242836033 0.706860382 0.5
McNichols 2017 0.58 1 1 1 1 0.25 7.42365935 1.681719797 0.767878187 0.5
McNichols 2018 0.82 1 1 1 1 0.2 6.54508434 -17.4914991 0.817021424 0.5
FTN Cocoa Processor 1997 3.79 1 1 1 0 0.34 6.51 0.0001 0.63 1.086
FTN Cocoa Processor 1998 3.53 1 1 1 0 0.4 6.56 0.0001 0.56 0.71
FTN Cocoa Processor 1999 4.79 1 1 1 0 0.44 6.63 0.0102 0.6 0.748
FTN Cocoa Processor 2000 8.36 1 1 1 1 0.36 6.42 0.0441 0.71 0.782
FTN Cocoa Processor 2001 8.47 1 1 1 0 0.35 6.43 0.0442 0.68 0.583
FTN Cocoa Processor 2002 8.98 1 1 1 0 0.39 6.46 0.067 0.67 0.498
FTN Cocoa Processor 2003 8 0 1 1 1 0.31 6.55 0.092 0.57 0.683
FTN Cocoa Processor 2004 9 0 1 1 1 0.32 6.56 0.0209 0.6 0.613
FTN Cocoa Processor 2005 10 0 1 1 1 0.34 6.59 0.0225 0.55 0.579
FTN Cocoa Processor 2006 6.4 0 1 1 0 0.37 6.61 0.0587 0.47 0.504
FTN Cocoa Processor 2007 8.49 1 1 1 1 0.39 6.63 0.0635 0.4 0.533
FTN Cocoa Processor 2008 15.58 1 1 1 0 0.39 7.21 0.0025 0.38 0.594
FTN Cocoa Processor 2009 12.71 1 1 1 0 0.37 7.26 0.0006 0.37 0.535
FTN Cocoa Processor 2010 10.5 1 1 1 0 0.45 7.35 0.0006 0.41 0.779
FTN Cocoa Processor 2011 14.43 1 1 1 0 0.49 7.43 0.0005 0.34 0.666
FTN Cocoa Processor 2012 10.57 0 1 1 0 0.57 2.0463694 15.5232 0.422305 2.046369
FTN Cocoa Processor 2013 8.47 0 1 1 0 0.43 6.7087645 22.2747 6.825611 8982592
FTN Cocoa Processor 2014 16.98 0 1 1 0 0.63 4.798247 19.1592 5.633027 11015735
FTN Cocoa Processor 2015 8.52 0 1 1 0 0.52 5.6602847 21.0853 6.708765 12513567
FTN Cocoa Processor 2016 6.61 0 1 1 0 0.78 5.6610273 26.5534 4.798247 14232297
FTN Cocoa Processor 2017 7.11 0 1 1 0 0.75 4.6661744 20.2534 5.660285 17060270
FTN Cocoa Processor 2018 4.09 0 1 1 0 0.75 5.5606279 22.7104 5.661027 19204134
First Aluminum Nigeria 1997 1.7 0 1 1 0 0.46 6.63 0.7631 0.83 0.582
First Aluminum Nigeria 1998 2.21 0 1 1 0 0.55 6.66 0.4034 0.92 0.513
First Aluminum Nigeria 1999 2.5 0 1 1 0 0.5 6.81 0.4034 0.6 0.27
First Aluminum Nigeria 2000 6.24 1 1 1 1 0.29 6.7 0.7512 0.44 0.234
First Aluminum Nigeria 2001 12.39 0 1 1 0 0.65 5.93 0.0006 0.3 0.321
First Aluminum Nigeria 2002 11.15 1 1 1 0 0.5 6.09 0.0006 0.3 0.421
First Aluminum Nigeria 2003 10.55 1 1 1 0 0.41 6.21 0.0002 0.27 0.395
First Aluminum Nigeria 2004 10.5 1 1 1 0 0.43 6.23 0.0002 0.38 0.441
First Aluminum Nigeria 2005 10.43 1 1 1 0 0.37 6.24 0.0002 0.46 0.779
First Aluminum Nigeria 2006 9.35 1 1 1 0 0.38 6.26 0.0002 0.55 0.625
First Aluminum Nigeria 2007 9.27 1 1 1 0 0.19 6.58 0.0002 0.5 0.596
First Aluminum Nigeria 2008 9.18 0.29 6.35 0.0002 0.29 0.162
First Aluminum Nigeria 2009 0.55 0 1 1 0 0.53 6.57 0.4729 0.76 1.198
First Aluminum Nigeria 2010 0.5 1 1 1 0 0.63 6.71 0.4785 0.66 0.823
First Aluminum Nigeria 2011 0.5 0 1 1 0 0.56 6.7 0.4594 0.65 0.889
First Aluminum Nigeria 2012 0.82 1 1 1 0 0.6 6.75 0.6153 0.5 1.098
First Aluminum Nigeria 2013 0.55 0 1 1 0 0.71 6.81 0.6228 0.41 1.076
First Aluminum Nigeria 2014 0.5 1 1 1 0 0.68 6.78 0.5695 0.43 0.808
First Aluminum Nigeria 2015 0.5 1 1 1 0 0.67 6.64 0.5695 0.37 0.765
First Aluminum Nigeria 2016 0.5 0 0 0 0 0.57 6.65 0.5693 0.38 0.757
First Aluminum Nigeria 2017 9.2 1 1 1 0 0.47 6.33 0.0007 0.19 0.86
First Aluminum Nigeria 2018 6.85 1 1 1 0 0.4 6.35 0.0006 0.29 0.406
Evans Medical 1997 11.54 1 1 1 0 0.31 8.1745378 6.100521861 1.177909715 0.285714286
Evans Medical 1998 12.23 1 1 1 0 0.23 8.23237435 8.027437008 0.867532182 0.285714286
Evans Medical 1999 16.36 1 0 1 0 0.19 8.30724769 3.681427759 1.372347295 0.285714286
Evans Medical 2000 14.85 1 0 1 0 0.39 5.27275568 2.321640634 1.045825515 0.357142857
Evans Medical 2001 11.50 1 0 1 0 0.48 5.3605153 27.68440936 1.078609454 0.285714286
Evans Medical 2002 9.10 1 0 1 0 0.48 5.43142146 35.27169468 0.818908019 0.285714286
Evans Medical 2003 6.60 1 1 1 0 0.56 5.70840681 30.79688676 4.357037798 0.285714286
Evans Medical 2004 3.77 1 0 1 1 0.51 5.70980732 14.59817941 2.086476727 0.285714286
Evans Medical 2005 2.10 1 1 1 0 0.61 5.76307817 12.04400393 1.840211564 0.285714286
Evans Medical 2006 4.91 1 1 1 0 0.7 5.78180347 10.64288699 1.890232308 0.285714286
Evans Medical 2007 7.27 1 0 1 0 0.88 5.82277723 -10.9345441 1.568481672 0.285714286
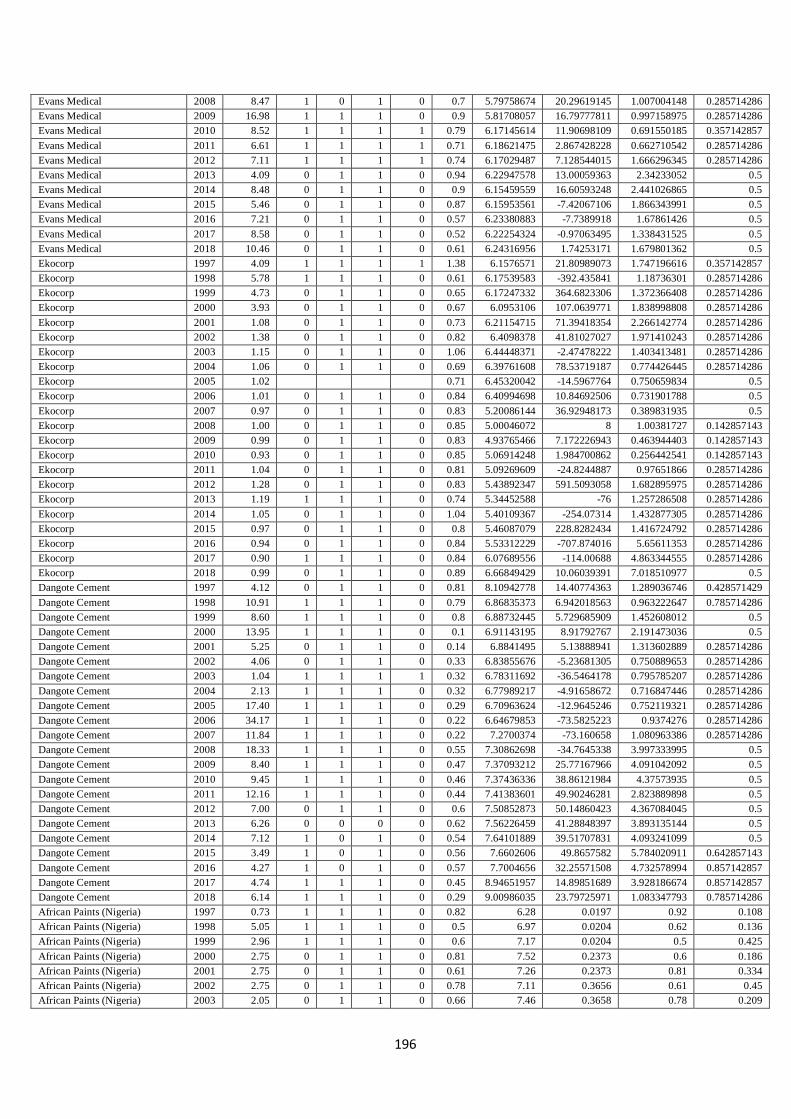
196
Evans Medical 2008 8.47 1 0 1 0 0.7 5.79758674 20.29619145 1.007004148 0.285714286
Evans Medical 2009 16.98 1 1 1 0 0.9 5.81708057 16.79777811 0.997158975 0.285714286
Evans Medical 2010 8.52 1 1 1 1 0.79 6.17145614 11.90698109 0.691550185 0.357142857
Evans Medical 2011 6.61 1 1 1 1 0.71 6.18621475 2.867428228 0.662710542 0.285714286
Evans Medical 2012 7.11 1 1 1 1 0.74 6.17029487 7.128544015 1.666296345 0.285714286
Evans Medical 2013 4.09 0 1 1 0 0.94 6.22947578 13.00059363 2.34233052 0.5
Evans Medical 2014 8.48 0 1 1 0 0.9 6.15459559 16.60593248 2.441026865 0.5
Evans Medical 2015 5.46 0 1 1 0 0.87 6.15953561 -7.42067106 1.866343991 0.5
Evans Medical 2016 7.21 0 1 1 0 0.57 6.23380883 -7.7389918 1.67861426 0.5
Evans Medical 2017 8.58 0 1 1 0 0.52 6.22254324 -0.97063495 1.338431525 0.5
Evans Medical 2018 10.46 0 1 1 0 0.61 6.24316956 1.74253171 1.679801362 0.5
Ekocorp 1997 4.09 1 1 1 1 1.38 6.1576571 21.80989073 1.747196616 0.357142857
Ekocorp 1998 5.78 1 1 1 0 0.61 6.17539583 -392.435841 1.18736301 0.285714286
Ekocorp 1999 4.73 0 1 1 0 0.65 6.17247332 364.6823306 1.372366408 0.285714286
Ekocorp 2000 3.93 0 1 1 0 0.67 6.0953106 107.0639771 1.838998808 0.285714286
Ekocorp 2001 1.08 0 1 1 0 0.73 6.21154715 71.39418354 2.266142774 0.285714286
Ekocorp 2002 1.38 0 1 1 0 0.82 6.4098378 41.81027027 1.971410243 0.285714286
Ekocorp 2003 1.15 0 1 1 0 1.06 6.44448371 -2.47478222 1.403413481 0.285714286
Ekocorp 2004 1.06 0 1 1 0 0.69 6.39761608 78.53719187 0.774426445 0.285714286
Ekocorp 2005 1.02 0.71 6.45320042 -14.5967764 0.750659834 0.5
Ekocorp 2006 1.01 0 1 1 0 0.84 6.40994698 10.84692506 0.731901788 0.5
Ekocorp 2007 0.97 0 1 1 0 0.83 5.20086144 36.92948173 0.389831935 0.5
Ekocorp 2008 1.00 0 1 1 0 0.85 5.00046072 8 1.00381727 0.142857143
Ekocorp 2009 0.99 0 1 1 0 0.83 4.93765466 7.172226943 0.463944403 0.142857143
Ekocorp 2010 0.93 0 1 1 0 0.85 5.06914248 1.984700862 0.256442541 0.142857143
Ekocorp 2011 1.04 0 1 1 0 0.81 5.09269609 -24.8244887 0.97651866 0.285714286
Ekocorp 2012 1.28 0 1 1 0 0.83 5.43892347 591.5093058 1.682895975 0.285714286
Ekocorp 2013 1.19 1 1 1 0 0.74 5.34452588 -76 1.257286508 0.285714286
Ekocorp 2014 1.05 0 1 1 0 1.04 5.40109367 -254.07314 1.432877305 0.285714286
Ekocorp 2015 0.97 0 1 1 0 0.8 5.46087079 228.8282434 1.416724792 0.285714286
Ekocorp 2016 0.94 0 1 1 0 0.84 5.53312229 -707.874016 5.65611353 0.285714286
Ekocorp 2017 0.90 1 1 1 0 0.84 6.07689556 -114.00688 4.863344555 0.285714286
Ekocorp 2018 0.99 0 1 1 0 0.89 6.66849429 10.06039391 7.018510977 0.5
Dangote Cement 1997 4.12 0 1 1 0 0.81 8.10942778 14.40774363 1.289036746 0.428571429
Dangote Cement 1998 10.91 1 1 1 0 0.79 6.86835373 6.942018563 0.963222647 0.785714286
Dangote Cement 1999 8.60 1 1 1 0 0.8 6.88732445 5.729685909 1.452608012 0.5
Dangote Cement 2000 13.95 1 1 1 0 0.1 6.91143195 8.91792767 2.191473036 0.5
Dangote Cement 2001 5.25 0 1 1 0 0.14 6.8841495 5.13888941 1.313602889 0.285714286
Dangote Cement 2002 4.06 0 1 1 0 0.33 6.83855676 -5.23681305 0.750889653 0.285714286
Dangote Cement 2003 1.04 1 1 1 1 0.32 6.78311692 -36.5464178 0.795785207 0.285714286
Dangote Cement 2004 2.13 1 1 1 0 0.32 6.77989217 -4.91658672 0.716847446 0.285714286
Dangote Cement 2005 17.40 1 1 1 0 0.29 6.70963624 -12.9645246 0.752119321 0.285714286
Dangote Cement 2006 34.17 1 1 1 0 0.22 6.64679853 -73.5825223 0.9374276 0.285714286
Dangote Cement 2007 11.84 1 1 1 0 0.22 7.2700374 -73.160658 1.080963386 0.285714286
Dangote Cement 2008 18.33 1 1 1 0 0.55 7.30862698 -34.7645338 3.997333995 0.5
Dangote Cement 2009 8.40 1 1 1 0 0.47 7.37093212 25.77167966 4.091042092 0.5
Dangote Cement 2010 9.45 1 1 1 0 0.46 7.37436336 38.86121984 4.37573935 0.5
Dangote Cement 2011 12.16 1 1 1 0 0.44 7.41383601 49.90246281 2.823889898 0.5
Dangote Cement 2012 7.00 0 1 1 0 0.6 7.50852873 50.14860423 4.367084045 0.5
Dangote Cement 2013 6.26 0 0 0 0 0.62 7.56226459 41.28848397 3.893135144 0.5
Dangote Cement 2014 7.12 1 0 1 0 0.54 7.64101889 39.51707831 4.093241099 0.5
Dangote Cement 2015 3.49 1 0 1 0 0.56 7.6602606 49.8657582 5.784020911 0.642857143
Dangote Cement 2016 4.27 1 0 1 0 0.57 7.7004656 32.25571508 4.732578994 0.857142857
Dangote Cement 2017 4.74 1 1 1 0 0.45 8.94651957 14.89851689 3.928186674 0.857142857
Dangote Cement 2018 6.14 1 1 1 0 0.29 9.00986035 23.79725971 1.083347793 0.785714286
African Paints (Nigeria) 1997 0.73 1 1 1 0 0.82 6.28 0.0197 0.92 0.108
African Paints (Nigeria) 1998 5.05 1 1 1 0 0.5 6.97 0.0204 0.62 0.136
African Paints (Nigeria) 1999 2.96 1 1 1 0 0.6 7.17 0.0204 0.5 0.425
African Paints (Nigeria) 2000 2.75 0 1 1 0 0.81 7.52 0.2373 0.6 0.186
African Paints (Nigeria) 2001 2.75 0 1 1 0 0.61 7.26 0.2373 0.81 0.334
African Paints (Nigeria) 2002 2.75 0 1 1 0 0.78 7.11 0.3656 0.61 0.45
African Paints (Nigeria) 2003 2.05 0 1 1 0 0.66 7.46 0.3658 0.78 0.209
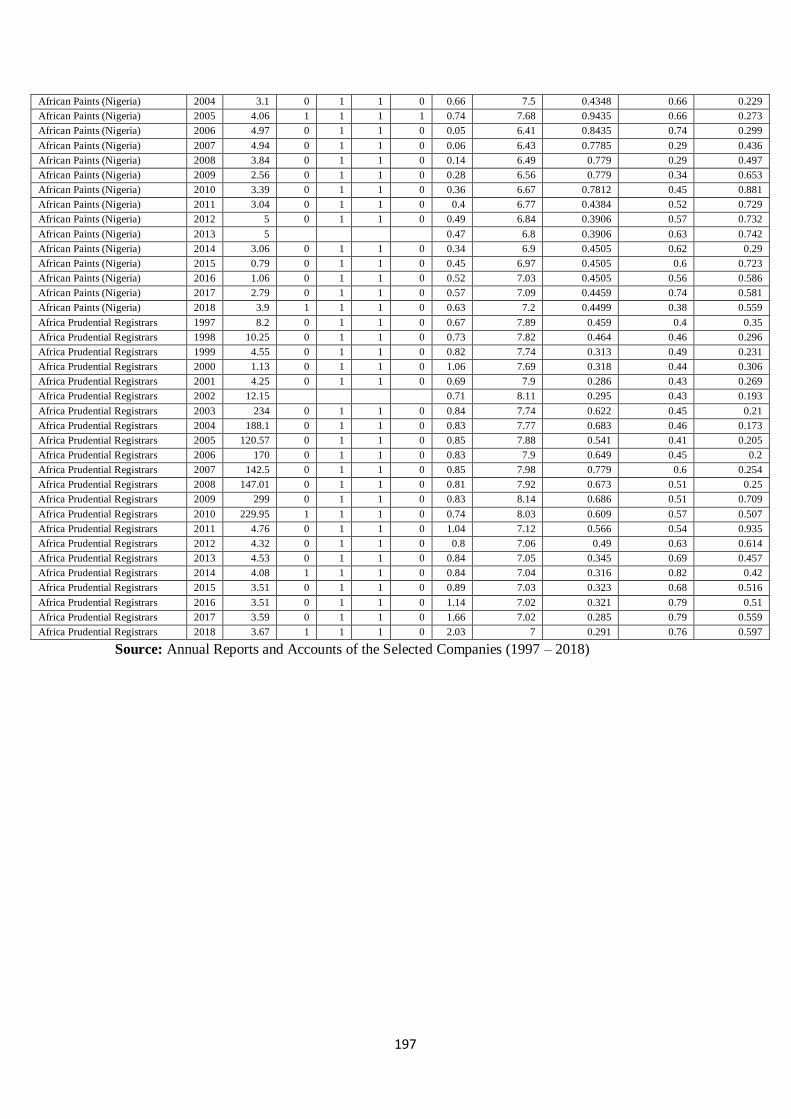
197
African Paints (Nigeria) 2004 3.1 0 1 1 0 0.66 7.5 0.4348 0.66 0.229
African Paints (Nigeria) 2005 4.06 1 1 1 1 0.74 7.68 0.9435 0.66 0.273
African Paints (Nigeria) 2006 4.97 0 1 1 0 0.05 6.41 0.8435 0.74 0.299
African Paints (Nigeria) 2007 4.94 0 1 1 0 0.06 6.43 0.7785 0.29 0.436
African Paints (Nigeria) 2008 3.84 0 1 1 0 0.14 6.49 0.779 0.29 0.497
African Paints (Nigeria) 2009 2.56 0 1 1 0 0.28 6.56 0.779 0.34 0.653
African Paints (Nigeria) 2010 3.39 0 1 1 0 0.36 6.67 0.7812 0.45 0.881
African Paints (Nigeria) 2011 3.04 0 1 1 0 0.4 6.77 0.4384 0.52 0.729
African Paints (Nigeria) 2012 5 0 1 1 0 0.49 6.84 0.3906 0.57 0.732
African Paints (Nigeria) 2013 5 0.47 6.8 0.3906 0.63 0.742
African Paints (Nigeria) 2014 3.06 0 1 1 0 0.34 6.9 0.4505 0.62 0.29
African Paints (Nigeria) 2015 0.79 0 1 1 0 0.45 6.97 0.4505 0.6 0.723
African Paints (Nigeria) 2016 1.06 0 1 1 0 0.52 7.03 0.4505 0.56 0.586
African Paints (Nigeria) 2017 2.79 0 1 1 0 0.57 7.09 0.4459 0.74 0.581
African Paints (Nigeria) 2018 3.9 1 1 1 0 0.63 7.2 0.4499 0.38 0.559
Africa Prudential Registrars 1997 8.2 0 1 1 0 0.67 7.89 0.459 0.4 0.35
Africa Prudential Registrars 1998 10.25 0 1 1 0 0.73 7.82 0.464 0.46 0.296
Africa Prudential Registrars 1999 4.55 0 1 1 0 0.82 7.74 0.313 0.49 0.231
Africa Prudential Registrars 2000 1.13 0 1 1 0 1.06 7.69 0.318 0.44 0.306
Africa Prudential Registrars 2001 4.25 0 1 1 0 0.69 7.9 0.286 0.43 0.269
Africa Prudential Registrars 2002 12.15 0.71 8.11 0.295 0.43 0.193
Africa Prudential Registrars 2003 234 0 1 1 0 0.84 7.74 0.622 0.45 0.21
Africa Prudential Registrars 2004 188.1 0 1 1 0 0.83 7.77 0.683 0.46 0.173
Africa Prudential Registrars 2005 120.57 0 1 1 0 0.85 7.88 0.541 0.41 0.205
Africa Prudential Registrars 2006 170 0 1 1 0 0.83 7.9 0.649 0.45 0.2
Africa Prudential Registrars 2007 142.5 0 1 1 0 0.85 7.98 0.779 0.6 0.254
Africa Prudential Registrars 2008 147.01 0 1 1 0 0.81 7.92 0.673 0.51 0.25
Africa Prudential Registrars 2009 299 0 1 1 0 0.83 8.14 0.686 0.51 0.709
Africa Prudential Registrars 2010 229.95 1 1 1 0 0.74 8.03 0.609 0.57 0.507
Africa Prudential Registrars 2011 4.76 0 1 1 0 1.04 7.12 0.566 0.54 0.935
Africa Prudential Registrars 2012 4.32 0 1 1 0 0.8 7.06 0.49 0.63 0.614
Africa Prudential Registrars 2013 4.53 0 1 1 0 0.84 7.05 0.345 0.69 0.457
Africa Prudential Registrars 2014 4.08 1 1 1 0 0.84 7.04 0.316 0.82 0.42
Africa Prudential Registrars 2015 3.51 0 1 1 0 0.89 7.03 0.323 0.68 0.516
Africa Prudential Registrars 2016 3.51 0 1 1 0 1.14 7.02 0.321 0.79 0.51
Africa Prudential Registrars 2017 3.59 0 1 1 0 1.66 7.02 0.285 0.79 0.559
Africa Prudential Registrars 2018 3.67 1 1 1 0 2.03 7 0.291 0.76 0.597
Source: Annual Reports and Accounts of the Selected Companies (1997 – 2018)
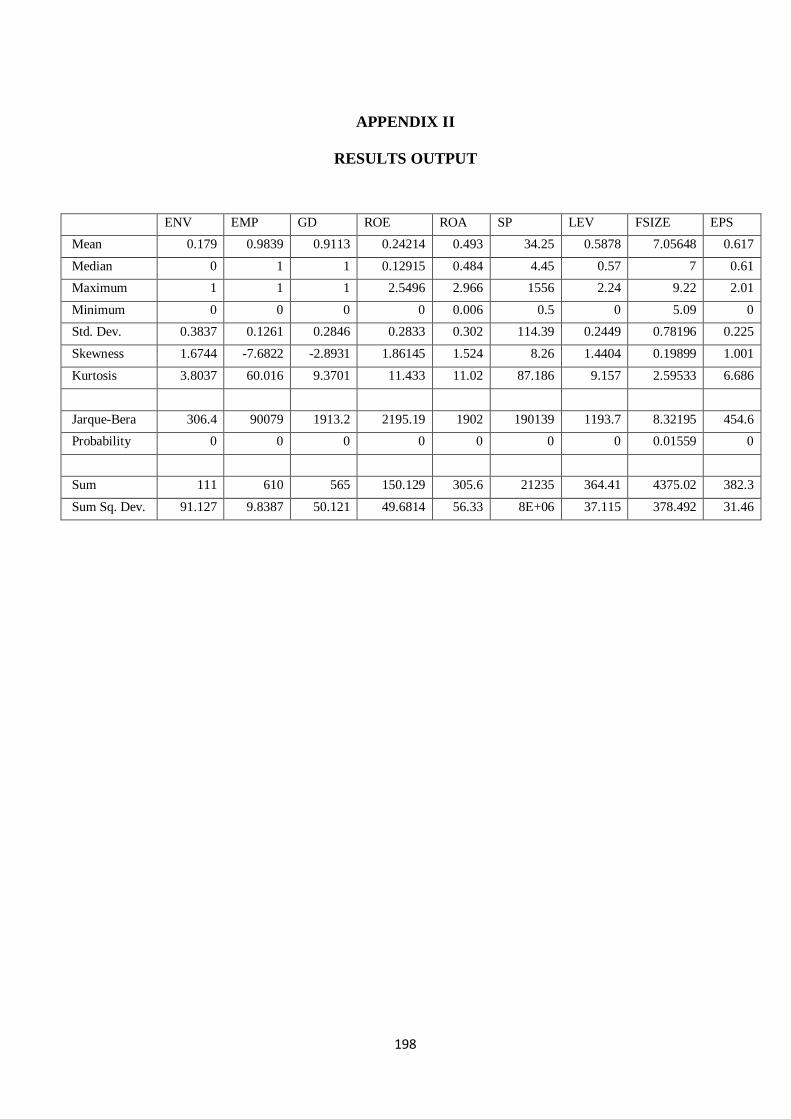
198
APPENDIX II
RESULTS OUTPUT
ENV EMP GD ROE ROA SP LEV FSIZE EPS
Mean 0.179 0.9839 0.9113 0.24214 0.493 34.25 0.5878 7.05648 0.617
Median 0 1 1 0.12915 0.484 4.45 0.57 7 0.61
Maximum 1 1 1 2.5496 2.966 1556 2.24 9.22 2.01
Minimum 0 0 0 0 0.006 0.5 0 5.09 0
Std. Dev. 0.3837 0.1261 0.2846 0.2833 0.302 114.39 0.2449 0.78196 0.225
Skewness 1.6744 -7.6822 -2.8931 1.86145 1.524 8.26 1.4404 0.19899 1.001
Kurtosis 3.8037 60.016 9.3701 11.433 11.02 87.186 9.157 2.59533 6.686
Jarque-Bera 306.4 90079 1913.2 2195.19 1902 190139 1193.7 8.32195 454.6
Probability 0 0 0 0 0 0 0 0.01559 0
Sum 111 610 565 150.129 305.6 21235 364.41 4375.02 382.3
Sum Sq. Dev. 91.127 9.8387 50.121 49.6814 56.33 8E+06 37.115 378.492 31.46
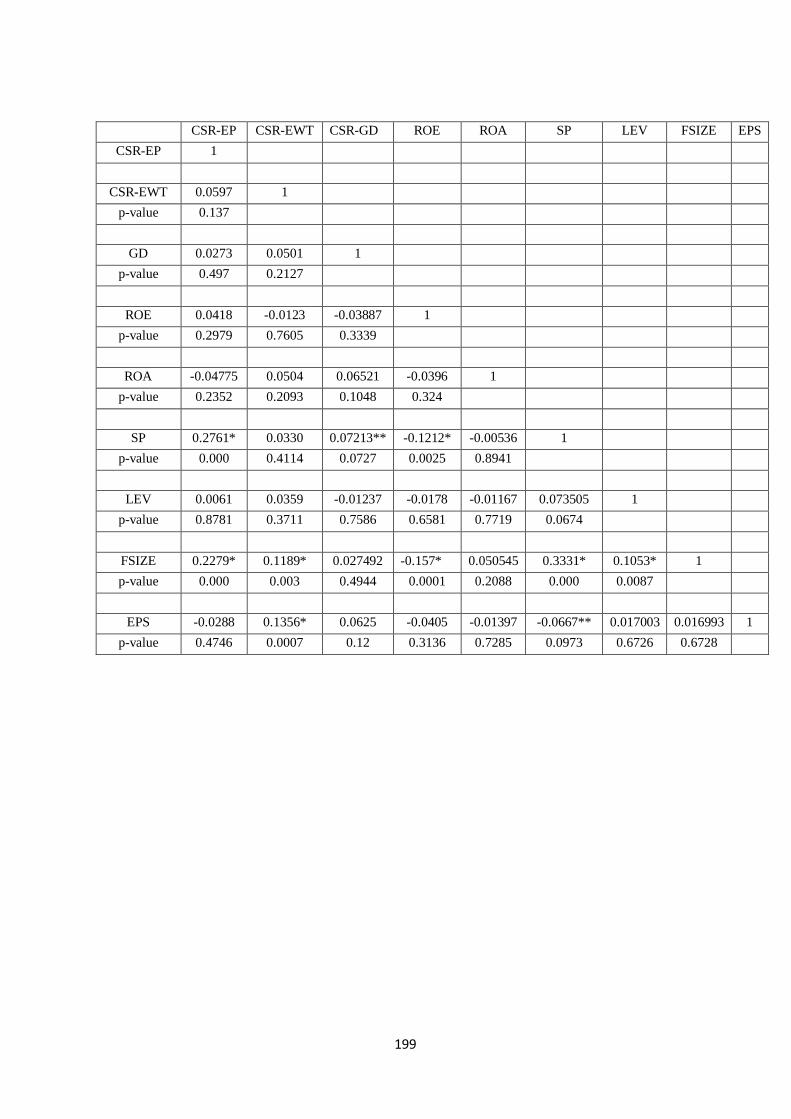
199
CSR-EP CSR-EWT CSR-GD ROE ROA SP LEV FSIZE EPS
CSR-EP 1
CSR-EWT 0.0597 1
p-value 0.137
GD 0.0273 0.0501 1
p-value 0.497 0.2127
ROE 0.0418 -0.0123 -0.03887 1
p-value 0.2979 0.7605 0.3339
ROA -0.04775 0.0504 0.06521 -0.0396 1
p-value 0.2352 0.2093 0.1048 0.324
SP 0.2761* 0.0330 0.07213** -0.1212* -0.00536 1
p-value 0.000 0.4114 0.0727 0.0025 0.8941
LEV 0.0061 0.0359 -0.01237 -0.0178 -0.01167 0.073505 1
p-value 0.8781 0.3711 0.7586 0.6581 0.7719 0.0674
FSIZE 0.2279* 0.1189* 0.027492 -0.157* 0.050545 0.3331* 0.1053* 1
p-value 0.000 0.003 0.4944 0.0001 0.2088 0.000 0.0087
EPS -0.0288 0.1356* 0.0625 -0.0405 -0.01397 -0.0667** 0.017003 0.016993 1
p-value 0.4746 0.0007 0.12 0.3136 0.7285 0.0973 0.6726 0.6728

200
Dependent Variable: PINDEX
Method: Panel Least Squares
Date: 01/15/20 Time: 13:18
Sample: 1997 2018
Periods included: 22
Cross-sections included: 70
Total panel (unbalanced) observations: 1540
White cross-section standard errors & covariance (d.f. corrected)
Variable Coefficient Std. Error t-Statistic Prob.
C -160.5912 25.53992 -6.287850 0.0000
GD -2884.330 456.8192 -6.313943 0.0000
ENV -0.449295 3.613082 -0.124352 0.9011
EMP 35.40896 11.28692 3.137168 0.0018
FSIZE 391.6528 55.58857 7.045563 0.0000
GDRESID01 2887.079 457.3767 6.312258 0.0000
Effects Specification
Cross-section fixed (dummy variables)
R-squared 0.822929 Mean dependent var 33.89342
Adjusted R-squared 0.794781 S.D. dependent var 113.7028
S.E. of regression 51.50861 Akaike info criterion 10.84932
Sum squared resid 1435347. Schwarz criterion 11.46477
Log likelihood -3319.688 Hannan-Quinn criter. 11.08841
F-statistic 29.23577 Durbin-Watson stat 1.999318
Prob(F-statistic) 0.000000
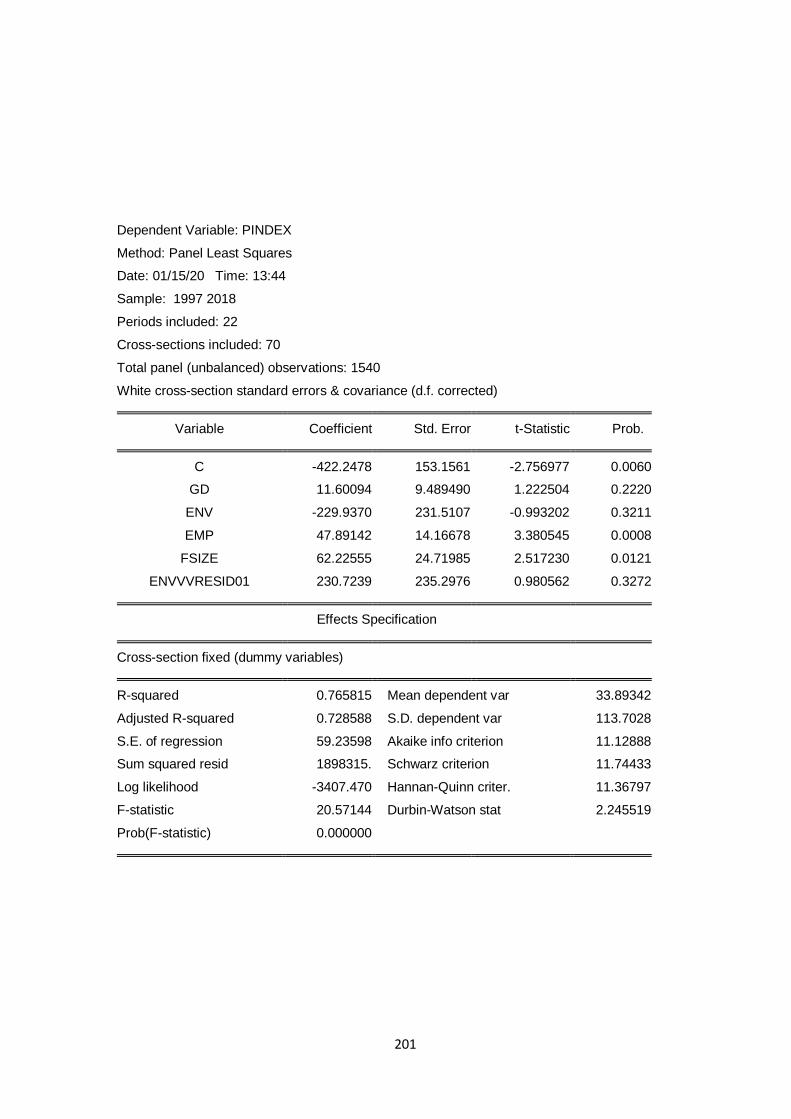
201
Dependent Variable: PINDEX
Method: Panel Least Squares
Date: 01/15/20 Time: 13:44
Sample: 1997 2018
Periods included: 22
Cross-sections included: 70
Total panel (unbalanced) observations: 1540
White cross-section standard errors & covariance (d.f. corrected)
Variable Coefficient Std. Error t-Statistic Prob.
C -422.2478 153.1561 -2.756977 0.0060
GD 11.60094 9.489490 1.222504 0.2220
ENV -229.9370 231.5107 -0.993202 0.3211
EMP 47.89142 14.16678 3.380545 0.0008
FSIZE 62.22555 24.71985 2.517230 0.0121
ENVVVRESID01 230.7239 235.2976 0.980562 0.3272
Effects Specification
Cross-section fixed (dummy variables)
R-squared 0.765815 Mean dependent var 33.89342
Adjusted R-squared 0.728588 S.D. dependent var 113.7028
S.E. of regression 59.23598 Akaike info criterion 11.12888
Sum squared resid 1898315. Schwarz criterion 11.74433
Log likelihood -3407.470 Hannan-Quinn criter. 11.36797
F-statistic 20.57144 Durbin-Watson stat 2.245519
Prob(F-statistic) 0.000000
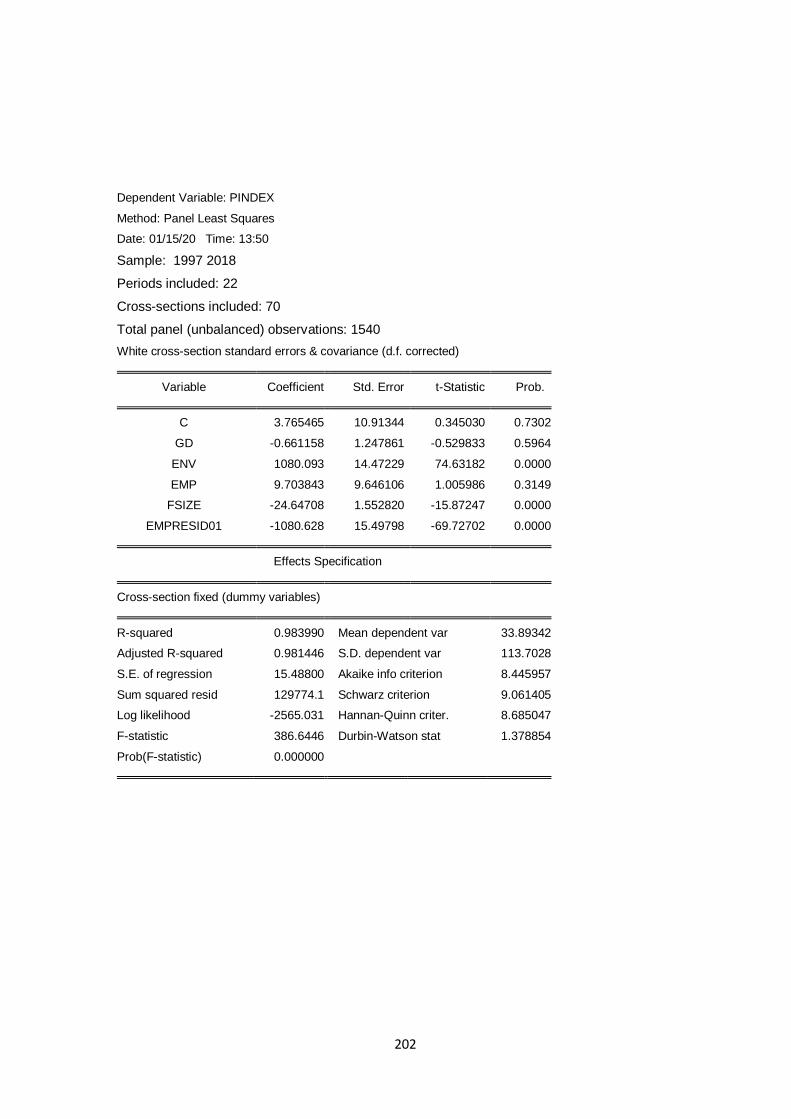
202
Dependent Variable: PINDEX
Method: Panel Least Squares
Date: 01/15/20 Time: 13:50
Sample: 1997 2018
Periods included: 22
Cross-sections included: 70
Total panel (unbalanced) observations: 1540
White cross-section standard errors & covariance (d.f. corrected)
Variable Coefficient Std. Error t-Statistic Prob.
C 3.765465 10.91344 0.345030 0.7302
GD -0.661158 1.247861 -0.529833 0.5964
ENV 1080.093 14.47229 74.63182 0.0000
EMP 9.703843 9.646106 1.005986 0.3149
FSIZE -24.64708 1.552820 -15.87247 0.0000
EMPRESID01 -1080.628 15.49798 -69.72702 0.0000
Effects Specification
Cross-section fixed (dummy variables)
R-squared 0.983990 Mean dependent var 33.89342
Adjusted R-squared 0.981446 S.D. dependent var 113.7028
S.E. of regression 15.48800 Akaike info criterion 8.445957
Sum squared resid 129774.1 Schwarz criterion 9.061405
Log likelihood -2565.031 Hannan-Quinn criter. 8.685047
F-statistic 386.6446 Durbin-Watson stat 1.378854
Prob(F-statistic) 0.000000
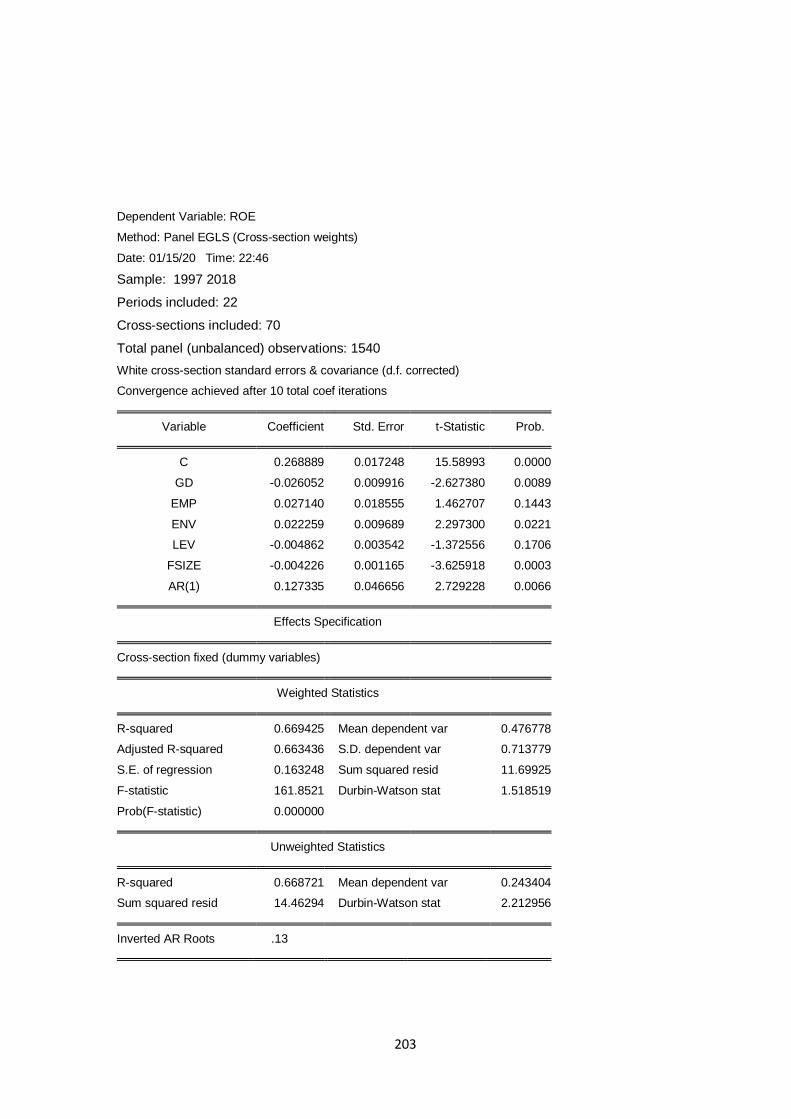
203
Dependent Variable: ROE
Method: Panel EGLS (Cross-section weights)
Date: 01/15/20 Time: 22:46
Sample: 1997 2018
Periods included: 22
Cross-sections included: 70
Total panel (unbalanced) observations: 1540
White cross-section standard errors & covariance (d.f. corrected)
Convergence achieved after 10 total coef iterations
Variable Coefficient Std. Error t-Statistic Prob.
C 0.268889 0.017248 15.58993 0.0000
GD -0.026052 0.009916 -2.627380 0.0089
EMP 0.027140 0.018555 1.462707 0.1443
ENV 0.022259 0.009689 2.297300 0.0221
LEV -0.004862 0.003542 -1.372556 0.1706
FSIZE -0.004226 0.001165 -3.625918 0.0003
AR(1) 0.127335 0.046656 2.729228 0.0066
Effects Specification
Cross-section fixed (dummy variables)
Weighted Statistics
R-squared 0.669425 Mean dependent var 0.476778
Adjusted R-squared 0.663436 S.D. dependent var 0.713779
S.E. of regression 0.163248 Sum squared resid 11.69925
F-statistic 161.8521 Durbin-Watson stat 1.518519
Prob(F-statistic) 0.000000
Unweighted Statistics
R-squared 0.668721 Mean dependent var 0.243404
Sum squared resid 14.46294 Durbin-Watson stat 2.212956
Inverted AR Roots .13

204
Dependent Variable: ROE
Method: Panel EGLS (Cross-section random effects)
Date: 01/15/20 Time: 22:47
Sample: 1997 2018
Periods included: 22
Cross-sections included: 70
Total panel (unbalanced) observations: 1540
Swamy and Arora estimator of component variances
White cross-section standard errors & covariance (d.f. corrected)
Variable Coefficient Std. Error t-Statistic Prob.
C 0.545487 0.113193 4.819089 0.0000
GD -0.069266 0.050019 -1.384798 0.1666
EMP 0.006324 0.055373 0.114217 0.9091
ENV 0.074143 0.040787 1.817833 0.0696
LEV 0.002081 0.023270 0.089448 0.9288
FSIZE -0.036993 0.013604 -2.719308 0.0067
Effects Specification
S.D. Rho
Cross-section random 0.212984 0.5593
Idiosyncratic random 0.189067 0.4407
Weighted Statistics
R-squared 0.023829 Mean dependent var 0.073636
Adjusted R-squared 0.015969 S.D. dependent var 0.190073
S.E. of regression 0.188575 Sum squared resid 22.08313
F-statistic 3.031829 Durbin-Watson stat 1.456343
Prob(F-statistic) 0.010306
Unweighted Statistics
R-squared 0.023564 Mean dependent var 0.242659
Sum squared resid 49.04980 Durbin-Watson stat 0.655673

205
Dependent Variable: SP
Method: Panel GMM EGLS (Cross-section weights)
Date: 01/16/20 Time: 09:51
Sample: 1997 2018
Periods included: 22
Cross-sections included: 70
Total panel (unbalanced) observations: 1540
2SLS instrument weighting matrix
Linear estimation after one-step weighting matrix
Instrument specification: C GD(-1) EMP(-1) ENV(-1) ENV(-2) EMP(-2) FSIZE(
-1) LEV(-2) GD(-2) ROA
Constant added to instrument list
Variable Coefficient Std. Error t-Statistic Prob.
C -127.0343 19.48605 -6.519243 0.0000
GD 17.55134 9.235400 1.900442 0.0580
EMP -25.84445 4.416639 -5.851611 0.0000
ENV 85.10883 12.55023 6.781455 0.0000
LEV 21.16025 10.28310 2.057770 0.0402
FSIZE 18.41752 2.389635 7.707253 0.0000
Weighted Statistics
R-squared 0.297668 Mean dependent var 50.76321
Adjusted R-squared 0.289558 S.D. dependent var 94.55234
S.E. of regression 86.74879 Sum squared resid 3258478.
Durbin-Watson stat 0.903334 J-statistic 5.839485
Instrument rank 10 Prob(J-statistic) 0.211461
Unweighted Statistics
R-squared 0.110803 Mean dependent var 37.14376
Sum squared resid 6325222. Durbin-Watson stat 0.722407

206
Dependent Variable: ROE
Method: Panel GMM EGLS (Cross-section weights)
Date: 01/16/20 Time: 10:35
Sample: 1997 2018
Periods included: 22
Cross-sections included: 70
Total panel (unbalanced) observations: 1540
2SLS instrument weighting matrix
Linear estimation after one-step weighting matrix
White cross-section standard errors & covariance (d.f. corrected)
WARNING: estimated coefficient covariance matrix is of reduced rank
Instrument specification: C ENV(-1) FSIZE(-1) GD(-1) SP(-1) LEV(-3) EMP(
-3) ROE(-4)
Constant added to instrument list
Variable Coefficient Std. Error t-Statistic Prob.
C 0.332001 0.113910 2.914590 0.0039
GD 0.225725 0.028214 8.000411 0.0000
EMP 0.231787 0.118974 1.948216 0.0524
ENV 0.106112 0.032639 3.251077 0.0013
LEV 0.048109 0.043359 1.109549 0.2682
FSIZE -0.083714 0.008412 -9.951330 0.0000
Weighted Statistics
R-squared 0.137189 Mean dependent var 0.332648
Adjusted R-squared 0.121502 S.D. dependent var 0.402325
S.E. of regression 0.271289 Sum squared resid 20.23937
Durbin-Watson stat 0.521193 J-statistic 14.44275
Instrument rank 8 Prob(J-statistic) 0.000731
Unweighted Statistics
R-squared -0.077986 Mean dependent var 0.234252
Sum squared resid 20.82271 Durbin-Watson stat 0.338015
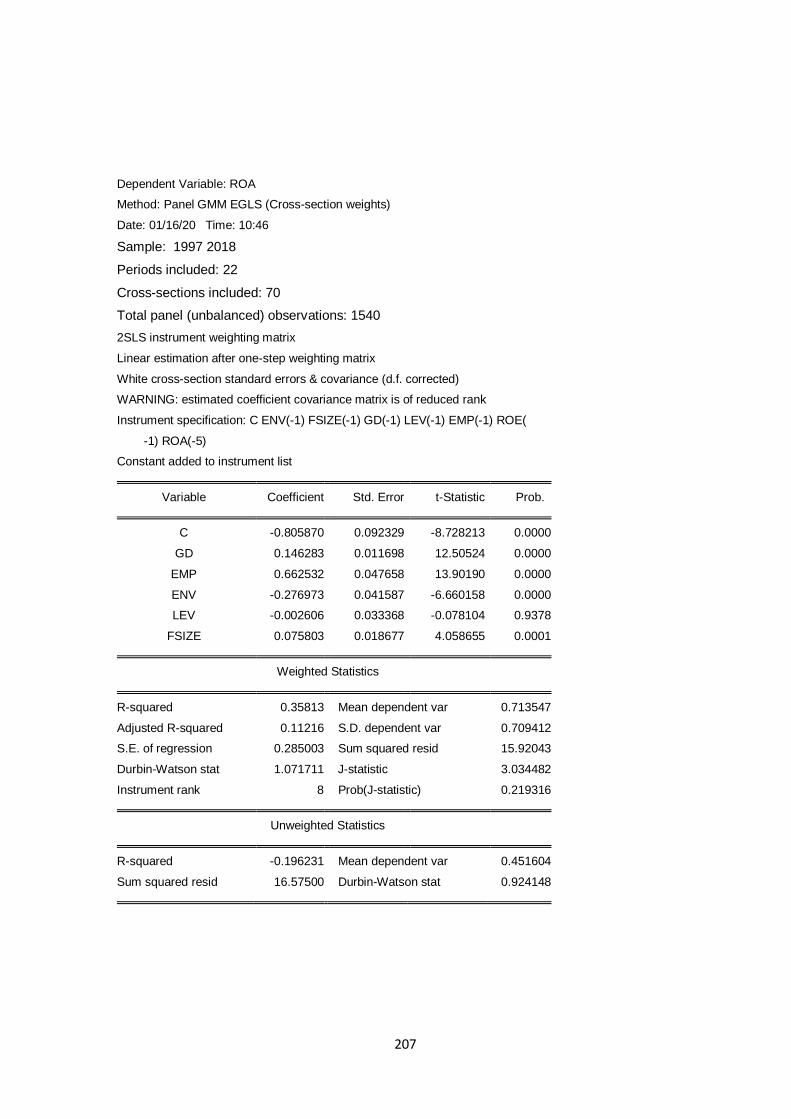
207
Dependent Variable: ROA
Method: Panel GMM EGLS (Cross-section weights)
Date: 01/16/20 Time: 10:46
Sample: 1997 2018
Periods included: 22
Cross-sections included: 70
Total panel (unbalanced) observations: 1540
2SLS instrument weighting matrix
Linear estimation after one-step weighting matrix
White cross-section standard errors & covariance (d.f. corrected)
WARNING: estimated coefficient covariance matrix is of reduced rank
Instrument specification: C ENV(-1) FSIZE(-1) GD(-1) LEV(-1) EMP(-1) ROE(
-1) ROA(-5)
Constant added to instrument list
Variable Coefficient Std. Error t-Statistic Prob.
C -0.805870 0.092329 -8.728213 0.0000
GD 0.146283 0.011698 12.50524 0.0000
EMP 0.662532 0.047658 13.90190 0.0000
ENV -0.276973 0.041587 -6.660158 0.0000
LEV -0.002606 0.033368 -0.078104 0.9378
FSIZE 0.075803 0.018677 4.058655 0.0001
Weighted Statistics
R-squared 0.35813 Mean dependent var 0.713547
Adjusted R-squared 0.11216 S.D. dependent var 0.709412
S.E. of regression 0.285003 Sum squared resid 15.92043
Durbin-Watson stat 1.071711 J-statistic 3.034482
Instrument rank 8 Prob(J-statistic) 0.219316
Unweighted Statistics
R-squared -0.196231 Mean dependent var 0.451604
Sum squared resid 16.57500 Durbin-Watson stat 0.924148
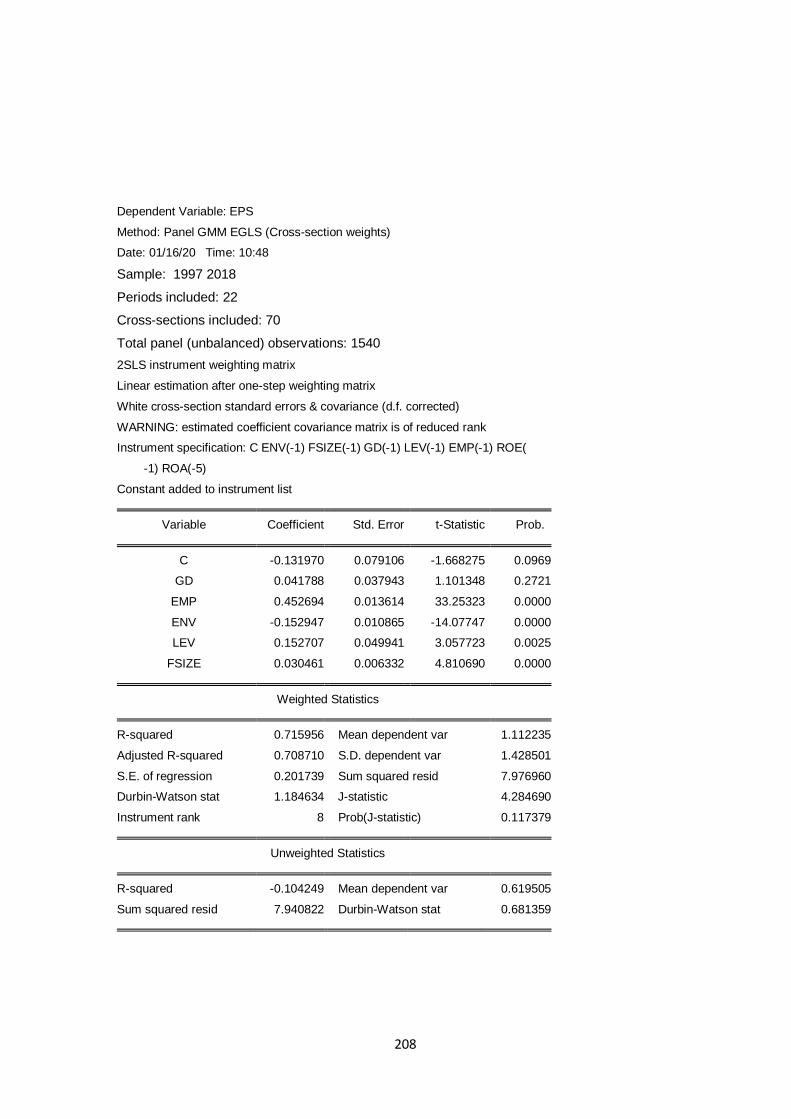
208
Dependent Variable: EPS
Method: Panel GMM EGLS (Cross-section weights)
Date: 01/16/20 Time: 10:48
Sample: 1997 2018
Periods included: 22
Cross-sections included: 70
Total panel (unbalanced) observations: 1540
2SLS instrument weighting matrix
Linear estimation after one-step weighting matrix
White cross-section standard errors & covariance (d.f. corrected)
WARNING: estimated coefficient covariance matrix is of reduced rank
Instrument specification: C ENV(-1) FSIZE(-1) GD(-1) LEV(-1) EMP(-1) ROE(
-1) ROA(-5)
Constant added to instrument list
Variable Coefficient Std. Error t-Statistic Prob.
C -0.131970 0.079106 -1.668275 0.0969
GD 0.041788 0.037943 1.101348 0.2721
EMP 0.452694 0.013614 33.25323 0.0000
ENV -0.152947 0.010865 -14.07747 0.0000
LEV 0.152707 0.049941 3.057723 0.0025
FSIZE 0.030461 0.006332 4.810690 0.0000
Weighted Statistics
R-squared 0.715956 Mean dependent var 1.112235
Adjusted R-squared 0.708710 S.D. dependent var 1.428501
S.E. of regression 0.201739 Sum squared resid 7.976960
Durbin-Watson stat 1.184634 J-statistic 4.284690
Instrument rank 8 Prob(J-statistic) 0.117379
Unweighted Statistics
R-squared -0.104249 Mean dependent var 0.619505
Sum squared resid 7.940822 Durbin-Watson stat 0.681359
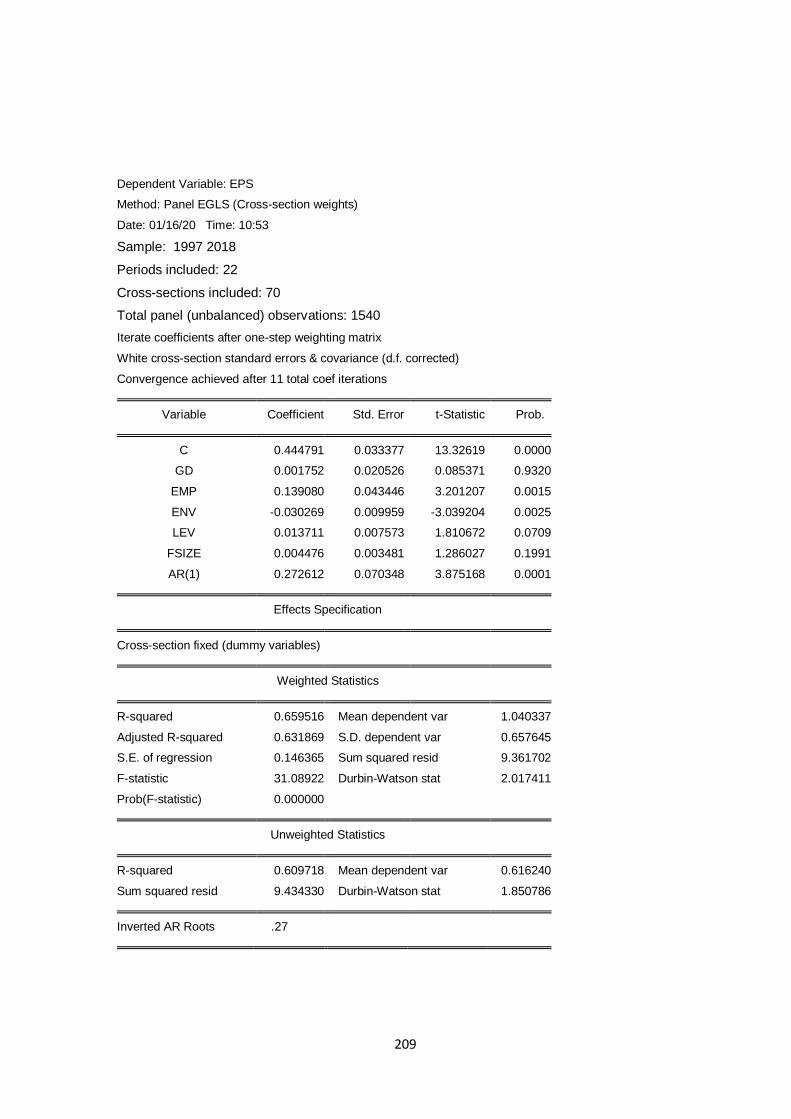
209
Dependent Variable: EPS
Method: Panel EGLS (Cross-section weights)
Date: 01/16/20 Time: 10:53
Sample: 1997 2018
Periods included: 22
Cross-sections included: 70
Total panel (unbalanced) observations: 1540
Iterate coefficients after one-step weighting matrix
White cross-section standard errors & covariance (d.f. corrected)
Convergence achieved after 11 total coef iterations
Variable Coefficient Std. Error t-Statistic Prob.
C 0.444791 0.033377 13.32619 0.0000
GD 0.001752 0.020526 0.085371 0.9320
EMP 0.139080 0.043446 3.201207 0.0015
ENV -0.030269 0.009959 -3.039204 0.0025
LEV 0.013711 0.007573 1.810672 0.0709
FSIZE 0.004476 0.003481 1.286027 0.1991
AR(1) 0.272612 0.070348 3.875168 0.0001
Effects Specification
Cross-section fixed (dummy variables)
Weighted Statistics
R-squared 0.659516 Mean dependent var 1.040337
Adjusted R-squared 0.631869 S.D. dependent var 0.657645
S.E. of regression 0.146365 Sum squared resid 9.361702
F-statistic 31.08922 Durbin-Watson stat 2.017411
Prob(F-statistic) 0.000000
Unweighted Statistics
R-squared 0.609718 Mean dependent var 0.616240
Sum squared resid 9.434330 Durbin-Watson stat 1.850786
Inverted AR Roots .27

210
Dependent Variable: EPS
Method: Panel EGLS (Cross-section random effects)
Date: 01/16/20 Time: 10:54
Sample: 1997 2018
Periods included: 22
Cross-sections included: 70
Total panel (unbalanced) observations: 1540
Swamy and Arora estimator of component variances
White cross-section standard errors & covariance (d.f. corrected)
Variable Coefficient Std. Error t-Statistic Prob.
C 0.411392 0.074206 5.543912 0.0000
GD 0.011844 0.026796 0.441996 0.6586
EMP 0.184320 0.020841 8.844004 0.0000
ENV -0.034933 0.022274 -1.568319 0.1173
LEV 0.002331 0.021060 0.110666 0.9119
FSIZE 0.002446 0.009463 0.258482 0.7961
Effects Specification
S.D. Rho
Cross-section random 0.146092 0.4204
Idiosyncratic random 0.171541 0.5796
Weighted Statistics
R-squared 0.016595 Mean dependent var 0.239270
Adjusted R-squared 0.008665 S.D. dependent var 0.172210
S.E. of regression 0.171370 Sum squared resid 18.20790
F-statistic 2.092529 Durbin-Watson stat 1.077324
Prob(F-statistic) 0.064653
Unweighted Statistics
R-squared 0.025689 Mean dependent var 0.615288
Sum squared resid 30.98115 Durbin-Watson stat 0.633153

211
Dependent Variable: ROA
Method: Panel EGLS (Cross-section weights)
Date: 01/16/20 Time: 10:58
Sample: 1997 2018
Periods included: 22
Cross-sections included: 70
Total panel (unbalanced) observations: 1540
Iterate coefficients after one-step weighting matrix
White cross-section standard errors & covariance (d.f. corrected)
Convergence achieved after 11 total coef iterations
WARNING: estimated coefficient covariance matrix is of reduced rank
Variable Coefficient Std. Error t-Statistic Prob.
C 0.415924 0.072410 5.744013 0.0000
GD 0.018920 0.015223 1.242885 0.2145
EMP -0.077564 0.052467 -1.478333 0.1399
ENV 0.025159 0.011196 2.247102 0.0251
LEV -0.010484 0.006481 -1.617736 0.1063
FSIZE 0.007475 0.007098 1.053152 0.2928
AR(1) 0.818398 0.022068 37.08579 0.0000
Weighted Statistics
R-squared 0.693671 Mean dependent var 0.809289
Adjusted R-squared 0.690116 S.D. dependent var 0.556274
S.E. of regression 0.210066 Sum squared resid 22.81404
F-statistic 195.1214 Durbin-Watson stat 2.111625
Prob(F-statistic) 0.000000
Unweighted Statistics
R-squared 0.423584 Mean dependent var 0.479332
Sum squared resid 26.68396 Durbin-Watson stat 2.774504
Inverted AR Roots .82
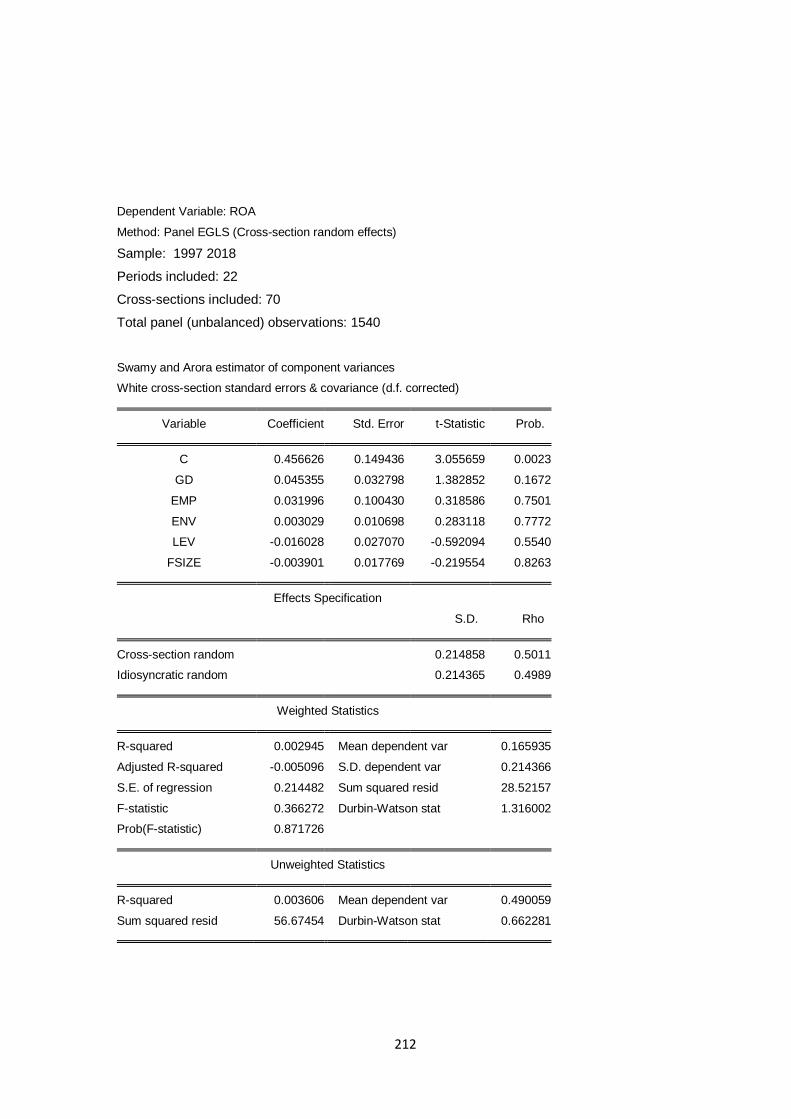
212
Dependent Variable: ROA
Method: Panel EGLS (Cross-section random effects)
Sample: 1997 2018
Periods included: 22
Cross-sections included: 70
Total panel (unbalanced) observations: 1540
Swamy and Arora estimator of component variances
White cross-section standard errors & covariance (d.f. corrected)
Variable Coefficient Std. Error t-Statistic Prob.
C 0.456626 0.149436 3.055659 0.0023
GD 0.045355 0.032798 1.382852 0.1672
EMP 0.031996 0.100430 0.318586 0.7501
ENV 0.003029 0.010698 0.283118 0.7772
LEV -0.016028 0.027070 -0.592094 0.5540
FSIZE -0.003901 0.017769 -0.219554 0.8263
Effects Specification
S.D. Rho
Cross-section random 0.214858 0.5011
Idiosyncratic random 0.214365 0.4989
Weighted Statistics
R-squared 0.002945 Mean dependent var 0.165935
Adjusted R-squared -0.005096 S.D. dependent var 0.214366
S.E. of regression 0.214482 Sum squared resid 28.52157
F-statistic 0.366272 Durbin-Watson stat 1.316002
Prob(F-statistic) 0.871726
Unweighted Statistics
R-squared 0.003606 Mean dependent var 0.490059
Sum squared resid 56.67454 Durbin-Watson stat 0.662281
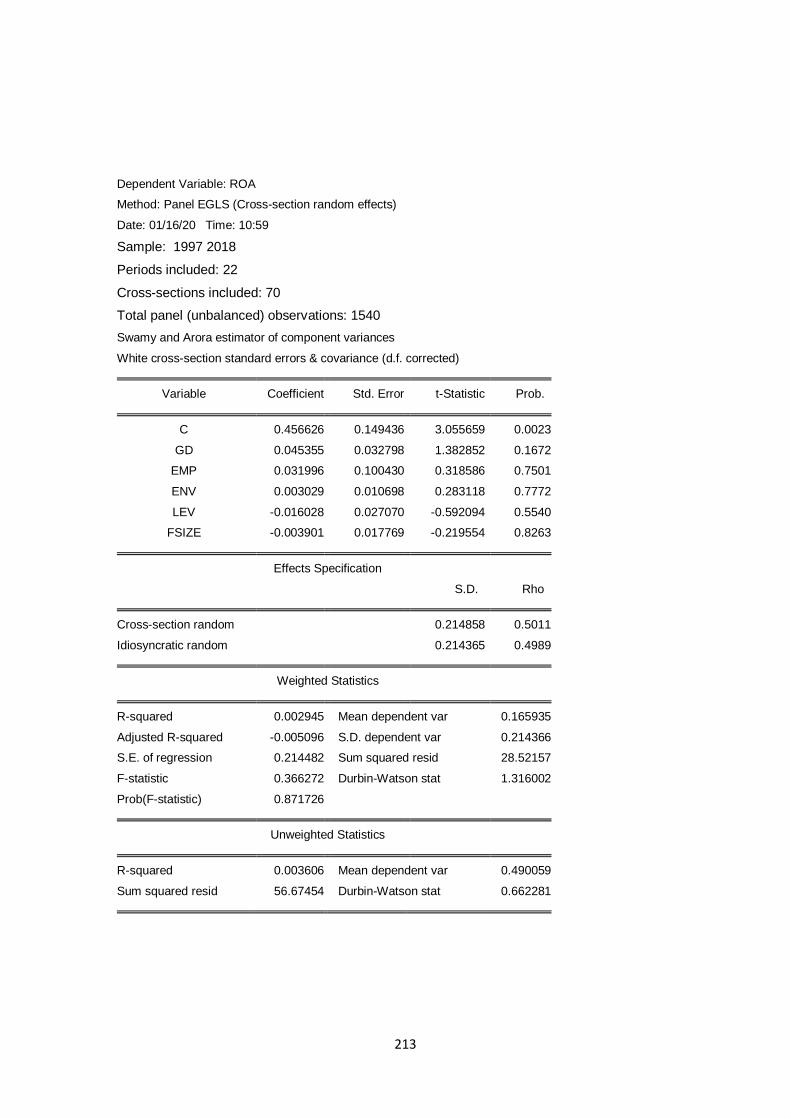
213
Dependent Variable: ROA
Method: Panel EGLS (Cross-section random effects)
Date: 01/16/20 Time: 10:59
Sample: 1997 2018
Periods included: 22
Cross-sections included: 70
Total panel (unbalanced) observations: 1540
Swamy and Arora estimator of component variances
White cross-section standard errors & covariance (d.f. corrected)
Variable Coefficient Std. Error t-Statistic Prob.
C 0.456626 0.149436 3.055659 0.0023
GD 0.045355 0.032798 1.382852 0.1672
EMP 0.031996 0.100430 0.318586 0.7501
ENV 0.003029 0.010698 0.283118 0.7772
LEV -0.016028 0.027070 -0.592094 0.5540
FSIZE -0.003901 0.017769 -0.219554 0.8263
Effects Specification
S.D. Rho
Cross-section random 0.214858 0.5011
Idiosyncratic random 0.214365 0.4989
Weighted Statistics
R-squared 0.002945 Mean dependent var 0.165935
Adjusted R-squared -0.005096 S.D. dependent var 0.214366
S.E. of regression 0.214482 Sum squared resid 28.52157
F-statistic 0.366272 Durbin-Watson stat 1.316002
Prob(F-statistic) 0.871726
Unweighted Statistics
R-squared 0.003606 Mean dependent var 0.490059
Sum squared resid 56.67454 Durbin-Watson stat 0.662281

214
Dependent Variable: ROE
Method: Panel EGLS (Cross-section weights)
Date: 01/16/20 Time: 11:07
Sample: 1997 2018
Periods included: 22
Cross-sections included: 70
Total panel (unbalanced) observations: 1540
Iterate coefficients after one-step weighting matrix
White cross-section standard errors & covariance (d.f. corrected)
Convergence achieved after 10 total coef iterations
Variable Coefficient Std. Error t-Statistic Prob.
C 0.268889 0.017248 15.58993 0.0000
GD -0.026052 0.009916 -2.627380 0.0089
EMP 0.027140 0.018555 1.462707 0.1443
ENV 0.022259 0.009689 2.297300 0.0221
LEV -0.004862 0.003542 -1.372556 0.1706
FSIZE -0.004226 0.001165 -3.625918 0.0003
AR(1) 0.127335 0.046656 2.729228 0.0066
Effects Specification
Cross-section fixed (dummy variables)
Weighted Statistics
R-squared 0.969425 Mean dependent var 0.476778
Adjusted R-squared 0.963436 S.D. dependent var 0.713779
S.E. of regression 0.163248 Sum squared resid 11.69925
F-statistic 161.8521 Durbin-Watson stat 1.518519
Prob(F-statistic) 0.000000
Unweighted Statistics
R-squared 0.668721 Mean dependent var 0.243404
Sum squared resid 14.46294 Durbin-Watson stat 2.212956
Inverted AR Roots .13
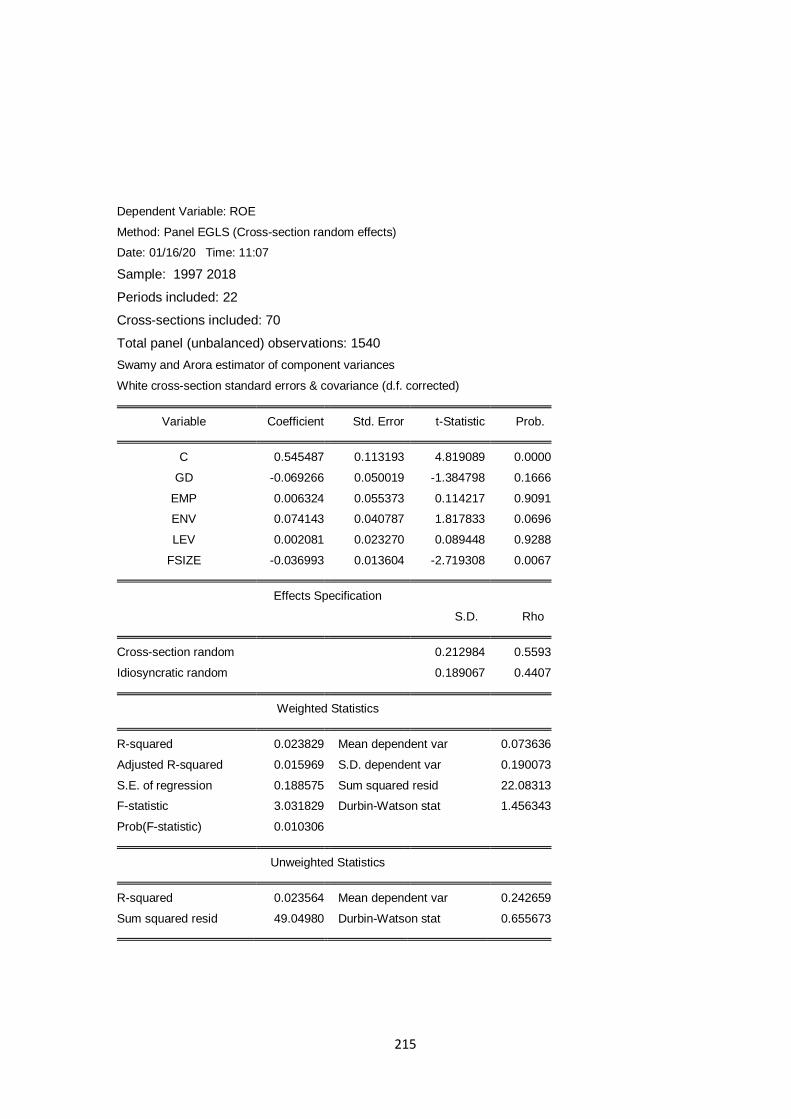
215
Dependent Variable: ROE
Method: Panel EGLS (Cross-section random effects)
Date: 01/16/20 Time: 11:07
Sample: 1997 2018
Periods included: 22
Cross-sections included: 70
Total panel (unbalanced) observations: 1540
Swamy and Arora estimator of component variances
White cross-section standard errors & covariance (d.f. corrected)
Variable Coefficient Std. Error t-Statistic Prob.
C 0.545487 0.113193 4.819089 0.0000
GD -0.069266 0.050019 -1.384798 0.1666
EMP 0.006324 0.055373 0.114217 0.9091
ENV 0.074143 0.040787 1.817833 0.0696
LEV 0.002081 0.023270 0.089448 0.9288
FSIZE -0.036993 0.013604 -2.719308 0.0067
Effects Specification
S.D. Rho
Cross-section random 0.212984 0.5593
Idiosyncratic random 0.189067 0.4407
Weighted Statistics
R-squared 0.023829 Mean dependent var 0.073636
Adjusted R-squared 0.015969 S.D. dependent var 0.190073
S.E. of regression 0.188575 Sum squared resid 22.08313
F-statistic 3.031829 Durbin-Watson stat 1.456343
Prob(F-statistic) 0.010306
Unweighted Statistics
R-squared 0.023564 Mean dependent var 0.242659
Sum squared resid 49.04980 Durbin-Watson stat 0.655673
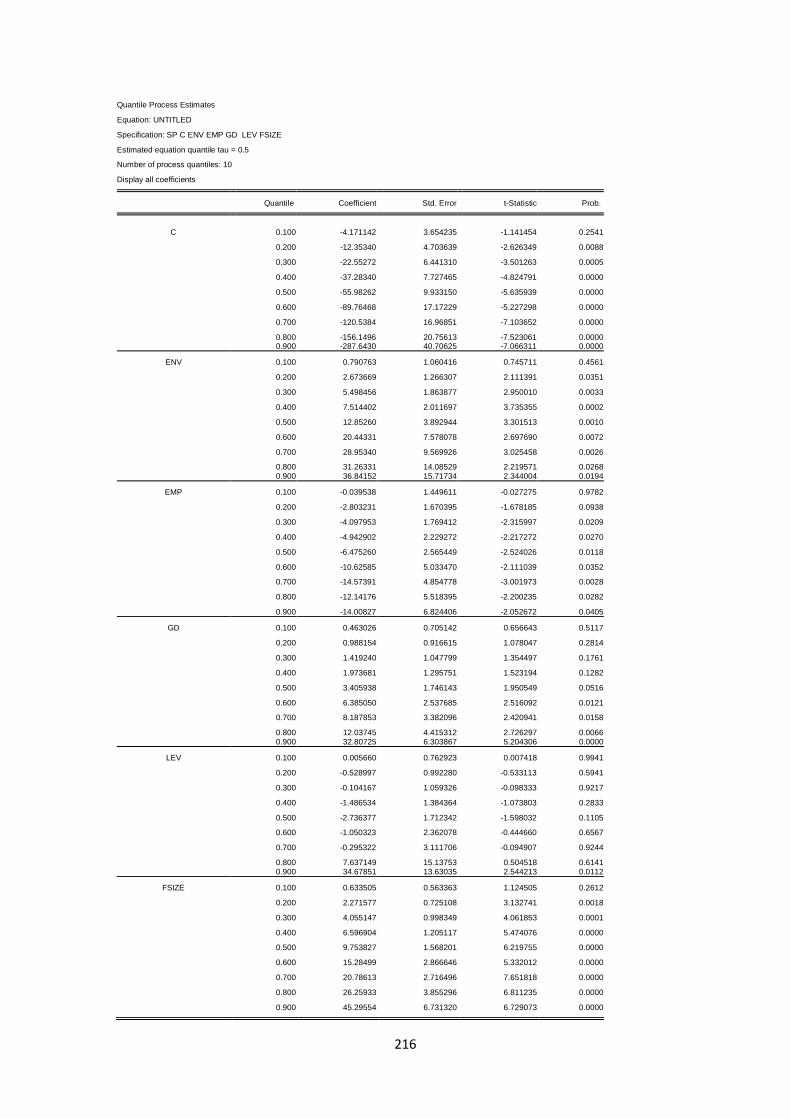
216
Quantile Process Estimates
Equation: UNTITLED
Specification: SP C ENV EMP GD LEV FSIZE
Estimated equation quantile tau = 0.5
Number of process quantiles: 10
Display all coefficients
Quantile Coefficient Std. Error t-Statistic Prob.
C 0.100 -4.171142 3.654235 -1.141454 0.2541
0.200 -12.35340 4.703639 -2.626349 0.0088
0.300 -22.55272 6.441310 -3.501263 0.0005
0.400 -37.28340 7.727465 -4.824791 0.0000
0.500 -55.98262 9.933150 -5.635939 0.0000
0.600 -89.76468 17.17229 -5.227298 0.0000
0.700 -120.5384 16.96851 -7.103652 0.0000
0.800 -156.1496 20.75613 -7.523061 0.0000 0.900 -287.6430 40.70625 -7.066311 0.0000
ENV 0.100 0.790763 1.060416 0.745711 0.4561
0.200 2.673669 1.266307 2.111391 0.0351
0.300 5.498456 1.863877 2.950010 0.0033
0.400 7.514402 2.011697 3.735355 0.0002
0.500 12.85260 3.892944 3.301513 0.0010
0.600 20.44331 7.578078 2.697690 0.0072
0.700 28.95340 9.569926 3.025458 0.0026
0.800 31.26331 14.08529 2.219571 0.0268 0.900 36.84152 15.71734 2.344004 0.0194
EMP 0.100 -0.039538 1.449611 -0.027275 0.9782
0.200 -2.803231 1.670395 -1.678185 0.0938
0.300 -4.097953 1.769412 -2.315997 0.0209
0.400 -4.942902 2.229272 -2.217272 0.0270
0.500 -6.475260 2.565449 -2.524026 0.0118
0.600 -10.62585 5.033470 -2.111039 0.0352
0.700 -14.57391 4.854778 -3.001973 0.0028
0.800 -12.14176 5.518395 -2.200235 0.0282
0.900 -14.00827 6.824406 -2.052672 0.0405
GD 0.100 0.463026 0.705142 0.656643 0.5117
0.200 0.988154 0.916615 1.078047 0.2814
0.300 1.419240 1.047799 1.354497 0.1761
0.400 1.973681 1.295751 1.523194 0.1282
0.500 3.405938 1.746143 1.950549 0.0516
0.600 6.385050 2.537685 2.516092 0.0121
0.700 8.187853 3.382096 2.420941 0.0158
0.800 12.03745 4.415312 2.726297 0.0066 0.900 32.80725 6.303867 5.204306 0.0000
LEV 0.100 0.005660 0.762923 0.007418 0.9941
0.200 -0.528997 0.992280 -0.533113 0.5941
0.300 -0.104167 1.059326 -0.098333 0.9217
0.400 -1.486534 1.384364 -1.073803 0.2833
0.500 -2.736377 1.712342 -1.598032 0.1105
0.600 -1.050323 2.362078 -0.444660 0.6567
0.700 -0.295322 3.111706 -0.094907 0.9244
0.800 7.637149 15.13753 0.504518 0.6141 0.900 34.67851 13.63035 2.544213 0.0112
FSIZE 0.100 0.633505 0.563363 1.124505 0.2612
0.200 2.271577 0.725108 3.132741 0.0018
0.300 4.055147 0.998349 4.061853 0.0001
0.400 6.596904 1.205117 5.474076 0.0000
0.500 9.753827 1.568201 6.219755 0.0000
0.600 15.28499 2.866646 5.332012 0.0000
0.700 20.78613 2.716496 7.651818 0.0000
0.800 26.25933 3.855296 6.811235 0.0000
0.900 45.29554 6.731320 6.729073 0.0000

217
Quantile Process Estimates
Equation: UNTITLED
Specification: ROE C ENV EMP GD LEV FSIZE
Estimated equation quantile tau = 0.5
Number of process quantiles: 10 Display all coefficients
Quantile Coefficient Std. Error t-Statistic Prob.
C 0.100 0.001473 0.055984 0.026309 0.9790
0.200 0.013331 0.074827 0.178155 0.8587
0.300 0.047358 0.089860 0.527019 0.5984
0.400 0.154592 0.104885 1.473920 0.1410
0.500 0.586947 0.181413 3.235418 0.0013
0.600 1.298439 0.211269 6.145900 0.0000
0.700 1.476538 0.170457 8.662215 0.0000
0.800 1.243216 0.187354 6.635660 0.0000 0.900 1.139201 0.263177 4.328642 0.0000
ENV 0.100 0.000149 0.013447 0.011084 0.9912
0.200 -0.001100 0.018076 -0.060866 0.9515
0.300 0.002217 0.021750 0.101924 0.9188
0.400 -0.001432 0.025279 -0.056636 0.9549
0.500 0.024300 0.035921 0.676499 0.4990
0.600 0.049922 0.043829 1.139026 0.2551
0.700 0.042747 0.038426 1.112450 0.2664
0.800 0.037938 0.046364 0.818283 0.4135
0.900 0.108476 0.077878 1.392891 0.1642
EMP 0.100 0.000307 0.040813 0.007527 0.9940
0.200 0.003814 0.055310 0.068949 0.9451
0.300 0.011034 0.067638 0.163126 0.8705
0.400 0.055458 0.077245 0.717956 0.4731
0.500 -0.069898 0.150602 -0.464122 0.6427
0.600 -0.115949 0.127369 -0.910339 0.3630
0.700 -0.070929 0.099006 -0.716413 0.4740
0.800 -0.026141 0.076827 -0.340258 0.7338
0.900 -0.007405 0.077271 -0.095831 0.9237
GD 0.100 -0.000594 0.021596 -0.027485 0.9781
0.200 -0.008180 0.028200 -0.290063 0.7719
0.300 -0.027545 0.033327 -0.826494 0.4088
0.400 -0.072562 0.040898 -1.774202 0.0765
0.500 -0.093951 0.049405 -1.901655 0.0577
0.600 -0.002486 0.051491 -0.048283 0.9615
0.700 0.030228 0.043875 0.688944 0.4911
0.800 0.015698 0.051618 0.304114 0.7611 0.900 0.126026 0.055746 2.260728 0.0241
LEV 0.100 0.001148 0.034141 0.033640 0.9732
0.200 0.013824 0.045228 0.305660 0.7600
0.300 0.026957 0.053770 0.501341 0.6163
0.400 0.094190 0.056266 1.674007 0.0946
0.500 0.116690 0.060419 1.931360 0.0539
0.600 0.066988 0.055558 1.205732 0.2284
0.700 0.001524 0.043569 0.034973 0.9721
0.800 0.004088 0.045164 0.090524 0.9279
0.900 -0.049097 0.059015 -0.831927 0.4058
FSIZE 0.100 -0.000191 0.006429 -0.029646 0.9764
0.200 -0.001818 0.008543 -0.212764 0.8316
0.300 -0.005295 0.010162 -0.521035 0.6025
0.400 -0.020507 0.011945 -1.716740 0.0865
0.500 -0.052711 0.021015 -2.508322 0.0124
0.600 -0.133342 0.021282 -6.265492 0.0000
0.700 -0.150271 0.018162 -8.273778 0.0000
0.800 -0.109370 0.023322 -4.689628 0.0000
0.900 -0.089681 0.032697 -2.742757 0.0063

218
Quantile Process Estimates
Equation: UNTITLED
Specification: ROA C ENV EMP GD LEV FSIZE
Estimated equation quantile tau = 0.5
Number of process quantiles: 10
Display all coefficients Quantile Coefficient Std. Error t-Statistic Prob.
C 0.100 -0.125199 0.120916 -1.035421 0.3009
0.200 -0.022421 0.107056 -0.209434 0.8342
0.300 -0.036622 0.123677 -0.296108 0.7672
0.400 -0.215480 0.134011 -1.607926 0.1084
0.500 -0.258518 0.135627 -1.906095 0.0571
0.600 0.005108 0.341146 0.014972 0.9881
0.700 0.201521 0.382547 0.526787 0.5985
0.800 0.559000 0.182197 3.068103 0.0022 0.900 0.688269 0.190686 3.609428 0.0003
ENV 0.100 0.002317 0.049555 0.046748 0.9627
0.200 -0.001482 0.034154 -0.043382 0.9654
0.300 -0.018311 0.036660 -0.499467 0.6176
0.400 0.003780 0.037620 0.100488 0.9200
0.500 -0.010307 0.034151 -0.301809 0.7629
0.600 -0.004668 0.035928 -0.129921 0.8967
0.700 -0.058940 0.035805 -1.646136 0.1002
0.800 -0.104780 0.038081 -2.751530 0.0061 0.900 -0.076448 0.045216 -1.690738 0.0914
EMP 0.100 0.026075 0.038978 0.668963 0.5038
0.200 0.167927 0.054853 3.061374 0.0023
0.300 0.270914 0.062593 4.328193 0.0000
0.400 0.300994 0.062217 4.837834 0.0000
0.500 0.355459 0.063859 5.566350 0.0000
0.600 0.231001 0.311080 0.742578 0.4580
0.700 0.145380 0.358316 0.405732 0.6851
0.800 -0.084980 0.143125 -0.593749 0.5529
0.900 0.043951 0.121723 0.361072 0.7182
GD 0.100 0.034156 0.040903 0.835041 0.4040
0.200 0.052360 0.035339 1.481618 0.1390
0.300 0.092351 0.038802 2.380067 0.0176
0.400 0.118761 0.041556 2.857862 0.0044
0.500 0.138936 0.045385 3.061264 0.0023
0.600 0.138099 0.062145 2.222223 0.0266
0.700 0.082367 0.085284 0.965805 0.3345
0.800 0.072832 0.085589 0.850953 0.3951 0.900 0.047842 0.116796 0.409623 0.6822
LEV 0.100 -0.019398 0.058169 -0.333482 0.7389
0.200 -0.020454 0.045996 -0.444679 0.6567
0.300 -0.074034 0.046428 -1.594594 0.1113
0.400 -0.088464 0.048468 -1.825206 0.0685
0.500 -0.107841 0.051076 -2.111373 0.0351
0.600 -0.040173 0.058206 -0.690190 0.4903 0.700 -0.043670 0.056177 -0.777363 0.4372
0.800 -0.018870 0.110715 -0.170438 0.8647 0.900 0.060922 0.132256 0.460636 0.6452
FSIZE 0.100 0.030768 0.018935 1.624904 0.1047
0.200 0.008674 0.017051 0.508737 0.6111 0.300 0.007317 0.018610 0.393145 0.6943
0.400 0.036864 0.018410 2.002347 0.0457 0.500 0.043702 0.017822 2.452104 0.0145
0.600 0.028813 0.020148 1.430084 0.1532 0.700 0.033918 0.020850 1.626722 0.1043
0.800 0.029064 0.026601 1.092587 0.2750
0.900 0.005114 0.031908 0.160261 0.8727
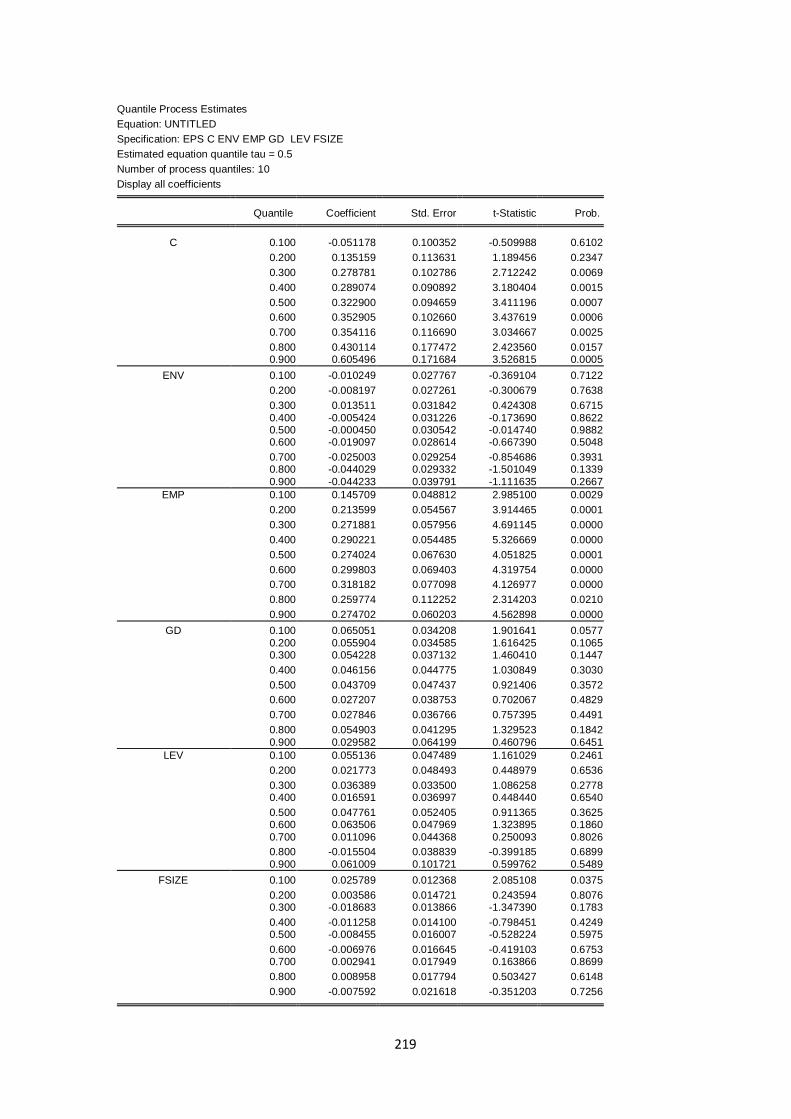
219
Quantile Process Estimates
Equation: UNTITLED
Specification: EPS C ENV EMP GD LEV FSIZE
Estimated equation quantile tau = 0.5
Number of process quantiles: 10
Display all coefficients Quantile Coefficient Std. Error t-Statistic Prob.
C 0.100 -0.051178 0.100352 -0.509988 0.6102
0.200 0.135159 0.113631 1.189456 0.2347
0.300 0.278781 0.102786 2.712242 0.0069
0.400 0.289074 0.090892 3.180404 0.0015
0.500 0.322900 0.094659 3.411196 0.0007
0.600 0.352905 0.102660 3.437619 0.0006
0.700 0.354116 0.116690 3.034667 0.0025
0.800 0.430114 0.177472 2.423560 0.0157 0.900 0.605496 0.171684 3.526815 0.0005
ENV 0.100 -0.010249 0.027767 -0.369104 0.7122
0.200 -0.008197 0.027261 -0.300679 0.7638
0.300 0.013511 0.031842 0.424308 0.6715
0.400 -0.005424 0.031226 -0.173690 0.8622 0.500 -0.000450 0.030542 -0.014740 0.9882 0.600 -0.019097 0.028614 -0.667390 0.5048
0.700 -0.025003 0.029254 -0.854686 0.3931 0.800 -0.044029 0.029332 -1.501049 0.1339
0.900 -0.044233 0.039791 -1.111635 0.2667
EMP 0.100 0.145709 0.048812 2.985100 0.0029
0.200 0.213599 0.054567 3.914465 0.0001
0.300 0.271881 0.057956 4.691145 0.0000
0.400 0.290221 0.054485 5.326669 0.0000
0.500 0.274024 0.067630 4.051825 0.0001
0.600 0.299803 0.069403 4.319754 0.0000
0.700 0.318182 0.077098 4.126977 0.0000
0.800 0.259774 0.112252 2.314203 0.0210
0.900 0.274702 0.060203 4.562898 0.0000
GD 0.100 0.065051 0.034208 1.901641 0.0577
0.200 0.055904 0.034585 1.616425 0.1065 0.300 0.054228 0.037132 1.460410 0.1447
0.400 0.046156 0.044775 1.030849 0.3030
0.500 0.043709 0.047437 0.921406 0.3572
0.600 0.027207 0.038753 0.702067 0.4829
0.700 0.027846 0.036766 0.757395 0.4491
0.800 0.054903 0.041295 1.329523 0.1842
0.900 0.029582 0.064199 0.460796 0.6451
LEV 0.100 0.055136 0.047489 1.161029 0.2461
0.200 0.021773 0.048493 0.448979 0.6536
0.300 0.036389 0.033500 1.086258 0.2778 0.400 0.016591 0.036997 0.448440 0.6540
0.500 0.047761 0.052405 0.911365 0.3625 0.600 0.063506 0.047969 1.323895 0.1860
0.700 0.011096 0.044368 0.250093 0.8026
0.800 -0.015504 0.038839 -0.399185 0.6899
0.900 0.061009 0.101721 0.599762 0.5489
FSIZE 0.100 0.025789 0.012368 2.085108 0.0375
0.200 0.003586 0.014721 0.243594 0.8076 0.300 -0.018683 0.013866 -1.347390 0.1783
0.400 -0.011258 0.014100 -0.798451 0.4249 0.500 -0.008455 0.016007 -0.528224 0.5975
0.600 -0.006976 0.016645 -0.419103 0.6753 0.700 0.002941 0.017949 0.163866 0.8699
0.800 0.008958 0.017794 0.503427 0.6148
0.900 -0.007592 0.021618 -0.351203 0.7256

220
APPENDIX III
STUDY SAMPLE
1. A.G. Leventis Nigeria,
2. ABC Transport,
3. Academy Press,
4. Africa Prudential Registrars,
5. African Paints (Nigeria),
6. Afrik Pharmaceuticals,
7. Afromedia, Capital Hotel,
8. Aluminum Extrusion Industries,
9. Anino International,
10. Berger Paints,
11. Beta Glass Co,
12. Cadbury Nigeria,
13. Capital Oil,
14. Cascon Allied Industries,
15. Caverton Offshore Support Group,
16. Cement Company of Northern Nigeria,
17. Champion Breweries,
18. Computer Warehouse Group,
19. Conoil,
20. Courteville Business Solutions,
21. Daar Communications,
22. Dangote Cement,
23. Dangote Flour Mills,
24. Dangote Sugar Refinery,
25. DN Tyre & Rubber,
26. Ekocorp,
27. Eterna,
28. E-Tranzact International,
29. Evans Medical,
30. Fidson Healthcare,

221
31. First Aluminum Nigeria,
32. Flour Mills of Nigeria,
33. Forte Oil,
34. FTN Cocoa Processor,
35. GlaxoSmithKline Nigeria,
36. Global Spectrum Energy Services,
37. Guinness Nigeria,
38. Honeywell Flour Mill,
39. Ikeja Hotel,
40. Interlinked Technologies,
41. International Breweries,
42. Japaul Oil & Maritime Services,
43. John Holt,
44. Julius Berger Nigeria,
45. Lafarge Africa,
46. Livestock Feeds,
47. McNichols,
48. Meyer,
49. Morison Industries,
50. MRS Oil Nigeria,
51. Multi-Trex Integrated Foods,
52. Nascon Allied Industries
53. Neimeth International Pharmaceuticals,
54. Nestle Nigeria,
55. Nigeria-German Chemicals,
56. Nigerian Aviation Handling Company,
57. Nigerian Breweries,
58. Nigerian Enamelware,
59. Northern Nigeria Flour Mills,
60. O.C. Gases Nigeria,
61. Okomu Oil Palm,
62. Omatek Ventures.
63. Paints & Coatings Manufactures,
64. Pharma-Deko,
222
65. Port & Paints & Products Nigeria,
66. Premier Paints,
67. Presco,
68. PZ Cussons Nigeria,
69. Red Star Express,
70. RT Briscoe,
71. SCOA Nigeria,
72. Seplat Petroleum Development,
73. Studio Press (Nigeria),
74. Tantalizers,
75. Thomas Wyatt Nigeria,
76. Total Nigeria,
77. Tourist Company of Nigeria,
78. Transcorp Hotels,
79. Trans-Nationwide Express,
80. Tripple Gee & Co.,
81. UAC of Nigeria,
82. Unilever Nigeria,
83. Union Diagnostic & Clinical Services,
84. Union Dicon Salt,
85. University Press,
86. Vitaform Nigeria
Source: Researcher’s Compilation, 2019
223
APPENDIX IV
CORPORATE SOCIAL RESPONSIBILITY DISCLOSURE
AND FINANCIAL PERFORMANCE OF SELECTED
QUOTED FIRMS IN NIGERIA
224