Tax evasion by domestic and foreign-owned Portuguese firms: a ...
Upload
independentCategory
view
2download
0
Núcleo de Investigação em Microeconomia Aplicada Universidade do Minho
Corporate performance: does ownership matter?
A comparison of foreign - and domestic - owned firms in
Greece and Portugal
Natália Barbosa Helen Louri
October 2003
Working Paper Series No. 26
1
CORPORATE PERFORMANCE: DOES OWNERSHIP MATTER? A COMPARISON OF FOREIGN- AND DOMESTIC-OWNED FIRMS IN
GREECE AND PORTUGAL
Natália Barbosa* Helen Louri**
ABSTRACT
The paper investigates whether multinational corporations (MNCs) operating in Portugal and Greece perform differently than domestic firms using two samples. The first contains 2651 and the second 523 firms operating in Greece in 1997 and Portugal in 1992 respectively. Departures from normality of firms' profitability motivated the adoption of the robust technique of quantile regression. The estimation results suggest that ownership ties do not make a significant difference with respect to performance of firms operating in Portugal. Results were similar for firms operating in Greece and only when firms in the upper quantiles of gross profits were compared, MNCs were found to significantly perform better than domestic firms. It is probably because MNCs have to compensate for their liability of foreigness that in spite of their technological advantages they cannot persistently outperform their domestic rivals.
JEL: F23, L10, L60, C21 Key words: Multinational Corporations, Profitability, Manufacturing Industry
Quantile Regression
* Universidade do Minho and NIMA.
Email: [email protected]
** Athens University of Economics and Business. Email: [email protected]
Correspondence Address: Athens University of Economics and Business, 76 Patission Street, 10434 Athens, Greece Tel.: 00 30 1 8203122 Fax: 00 30 1 8203301
Financial support from a TMR grant on Foreign Direct Investment and the Multinational Corporation (FMRX-CT-98-0215) is acknowledged. We are grateful to DETEFP, Ministry of Labour and Solidarity, Portugal, and to Bank of Portugal for having provided access to the data used in this study.

2
1 INTRODUCTION The evidence on firms’ performance gathered over the past years appears to challenge the
conventional homogeneity wisdom that considers the heterogeneity of firms to be a
temporary phenomenon, which will ultimately be followed by convergence of firms in
conduct and performance as a result of competition in the same industry. In a study of
firms in the US, Mueller (1986) reported long-lived differences in profitability within
industries, while studies of firms in the UK (Cubbin and Geroski, 1987) and in several
other countries (Mueller, 1990) corroborate the earlier findings. The common observation
of firms’ persistent heterogeneity within an industry has stimulated several studies
seeking to identify and describe what factors block the convergence of firms’ conduct and
performance over time. After the seminal paper by Demsetz (1973) who pointed out that
a superior competitive performance might be specific to the firm that has developed a
differential advantage in producing and marketing its products, further studies identify
technological, industry-based, historical and organizational considerations as the leading
factors in firm performance (Röller and Sinclair-Desgagné, 1996). Firms are
heterogeneous in terms of efficiency and competitive capabilities, which would reflect on
their competitive performance.
The emphasis on firm-specific assets as the main source of firms’ heterogeneity
with respect to conduct and performance has stimulated many studies that seek to
investigate whether multinational firms (MNCs), or their subsidiaries, perform better than
domestically controlled firms. The international business literature has well established
that a reason why firms invest abroad is that they possess firm-specific advantages, not
available to domestic firms in the host country. Such advantages may compensate for the
costs of doing business abroad relative to domestically-owned firms and, hence, assist
MNCs to display superior performance (cf., among others, Dunning (1993), Markusen
(1995), Caves (1996)). MNCs' advantages may comprise financial advantages, product
differentiation and marketing advantages, advantages arising from superior governance
or from the ability to exploit economies of scale (Dunning, 1993, p. 162-163). The
Industrial Organization (IO) paradigm applied to MNCs also emphasises the possession of
"nontangible productive assets, such as technological know-how, marketing and
managing skills, export contacts, coordinated relationships with suppliers and
customers, and reputation" (Aitken and Harrison, 1999, p. 606-607) as competitive
advantages that can be transferred across space and enable MNCs to successfully
compete with firms that know the modus operandi of local markets. Empirical results
have largely been interpreted in the light of the firm-specific advantages argument.
Nonetheless, previous empirical evidence on MNCs performance compared with
domestically owned firms is somewhat ambiguous, though it tends to suggest on balance
that foreign ownership impacts positively on firms’ performance.
Studies of firms operating in developing countries, Lecraw (1984), Willmore
(1986), and Majumdar (1997) conclude that ownership ties do make a difference with
3
respect to firms’ performance. Firms with foreign ownership out-perform domestically
owned firms with similar characteristics. Chhibber and Majumdar (1999) extend the
study of Indian industry by including foreign control considerations and reinforce the
previous finding; MNCs display relatively superior performance. This conclusion of MNCs
superior performance is generally achieved for developed countries (cf. Caves, 1996;
Boardman et al., 1997). On the other hand, Globerman et al. (1994) report that once the
effects of capital intensity and size are controlled for, MNCs operating in the Canadian
market are not significantly more productive than Canadian-owned firms, emphasising
that the superior performance of MNCs is primarily due to the high capital intensity and
large size that generally characterise them. Kim and Lyn (1990), in turn, found that
MNCs operating in the U.S. market are less profitable than randomly selected
domestically owned firms.
Portugal and Greece present particularly interesting cases for building upon
earlier empirical evidence on the relative superior performance of MNCs and testing the
relationship between ownership and the reported performance. They are both developed
countries but, in the context of the European Union (EU), they are small, peripheral
economies attracting MNCs that may have reasons for investing in these countries
distinct from those investing in other European countries. Moreover, EU membership
and the creation of the Single Market triggered a wave of FDI in Europe, with Portugal
and Greece being important receptors of FDI. The topic under scrutiny is, therefore, to
investigate whether MNCs operating in Portugal and Greece perform differently than
domestically owned firms. In particular, we seek to identify the relevant factors that may
explain the performance implications of foreign ownership for a large cross section of
firms in Portuguese and Greek industries, controlling for a number of factors affecting
firms’ performance. A closely related topic is to examine whether MNCs perform well per
se, or their relative superior performance is a consequence of the detrimental effect they
may exercise on domestic profitability.
The paper is organised as follows. In the next section the literature on firms’
performance is briefly reviewed in order to establish the model of performance that forms
the basis of the empirical application. A discussion of the data and variables used in the
study is made in Section 3. The next section presents the appropriate econometric
methodology, while Section 5 reports and discusses estimation results that intend to
provide answers for the research questions stated earlier. The paper ends by reviewing
the main conclusions and evaluating policy implications towards FDI.
2 A MODEL OF PERFORMANCE Before discussing the main determinants of corporate performance, we should briefly
address the question of how we can measure performance. Broadly, one can measure
corporate performance by variables relating to productivity, profitability, growth or, even,
customers’ satisfaction. These measures tend to be related, as firms with greater
productivity are more likely to have greater profitability and to experience large rates of
4
growth. Nonetheless, they are far from being perfectly correlated (Thomsen and
Pedersen, 2000) and one has to choose the most appropriate measure to accomplish the
research objectives. On the other hand, the choice of the performance measure to be
used merely depends on whether it is asserted that firms pursue maximum profits,
productivity levels or customer’s satisfaction. In line with the standard wisdom in IO, we
assume profit-maximising firms and, accordingly, we measure their performance by
variables relating to profitability.
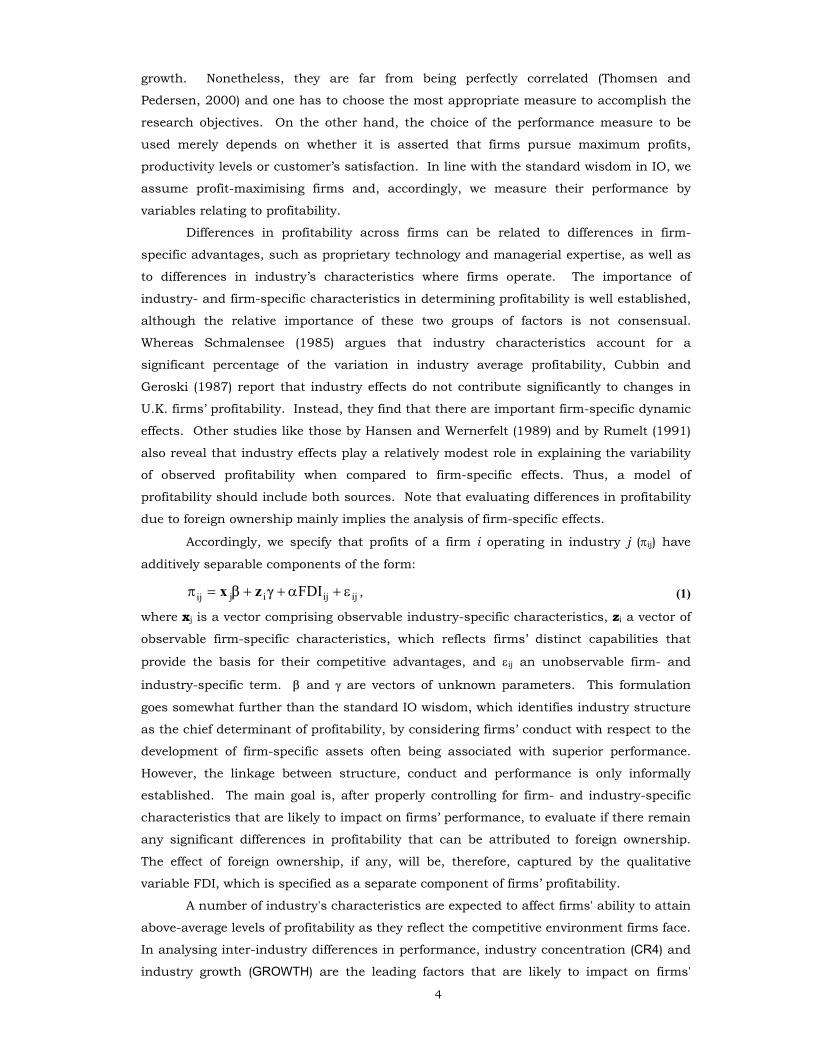
Differences in profitability across firms can be related to differences in firm-
specific advantages, such as proprietary technology and managerial expertise, as well as
to differences in industry’s characteristics where firms operate. The importance of
industry- and firm-specific characteristics in determining profitability is well established,
although the relative importance of these two groups of factors is not consensual.
Whereas Schmalensee (1985) argues that industry characteristics account for a
significant percentage of the variation in industry average profitability, Cubbin and
Geroski (1987) report that industry effects do not contribute significantly to changes in
U.K. firms’ profitability. Instead, they find that there are important firm-specific dynamic
effects. Other studies like those by Hansen and Wernerfelt (1989) and by Rumelt (1991)
also reveal that industry effects play a relatively modest role in explaining the variability
of observed profitability when compared to firm-specific effects. Thus, a model of
profitability should include both sources. Note that evaluating differences in profitability
due to foreign ownership mainly implies the analysis of firm-specific effects.
Accordingly, we specify that profits of a firm i operating in industry j (πij) have
additively separable components of the form:
ijijijij FDI ε+α++=π γβ zx , (1)
where xj is a vector comprising observable industry-specific characteristics, zi a vector of
observable firm-specific characteristics, which reflects firms’ distinct capabilities that
provide the basis for their competitive advantages, and εij an unobservable firm- and
industry-specific term. β and γ are vectors of unknown parameters. This formulation
goes somewhat further than the standard IO wisdom, which identifies industry structure
as the chief determinant of profitability, by considering firms’ conduct with respect to the
development of firm-specific assets often being associated with superior performance.
However, the linkage between structure, conduct and performance is only informally
established. The main goal is, after properly controlling for firm- and industry-specific
characteristics that are likely to impact on firms’ performance, to evaluate if there remain
any significant differences in profitability that can be attributed to foreign ownership.
The effect of foreign ownership, if any, will be, therefore, captured by the qualitative
variable FDI, which is specified as a separate component of firms’ profitability.
A number of industry's characteristics are expected to affect firms' ability to attain
above-average levels of profitability as they reflect the competitive environment firms face.
In analysing inter-industry differences in performance, industry concentration (CR4) and
industry growth (GROWTH) are the leading factors that are likely to impact on firms'

5
profitability. Two types of arguments can be made about the effect of the degree of
competition on profitability. Following the standard IO wisdom, industry concentration
facilitates collusion and, in highly concentrated industries, firms can exercise monopoly
power leading to large profits. Further, in these industries incumbents are more likely to
retaliate against entrants (Bunch and Smiley, 1992), preventing outside competition from
exerting a disciplinary effect in driving profits to their normal level and agency problems
may be less severe (Nickel et al., 1997). The available evidence relating firms'
performance to industry concentration suggests mainly a positive relationship between
concentration and profitability (Hay and Morris, 1991), even though Schmalensee (1989)
argues that “a researcher cannot expect a strong, positive concentration-profitability
relation to leap out from cross-section data” (p. 976).
Another element of competitive environment that may impact on profitability is
industry growth. One of the stylised facts established by Schmalensee (1989, p. 972) is
that profits are in general larger in growing than otherwise identical industries. This is
consistent with the view that profit-maximising firms may take any increase in demand
as profit opportunities in the form of larger profits instead of, for instance, faster growth.
In a period of demand growth firms may experience difficulties to immediately respond by
increasing their output and, therefore, an excess demand is likely to arise, leading to
increases in prices and profits. For instance, Bradburd and Caves (1982) find empirical
support for the hypothesis of a positive relationship between growth and profitability, but
less so in concentrated industries.
Inter-industry differentials in firms’ performance may also be explained by
differentials on R&D expenditures (R&D). Grabowki and Mueller (1978) and Kim and Lyn
(1990) provide evidence that firms operating in research-intensive industries tend to
obtain above-average profits, suggesting the formation of rent-yielding assets. More
recently Hanel and St-Pierre (2002) do not reject the hypothesis that R&D impacts
positively on profitability, even though the contribution to profits depends on firms’
capability to appropriate the results of R&D activities. This is crucial in the case of
MNCs as they commonly establish their affiliates in research-intensive industries to
exploit their own proprietary knowledge (Cleeve, 1997). Therefore, a significant and
positive relationship between research intensity at industry level and firms’ performance
would be expected.
The degree of foreign presence (FSHARE) in an industry may impact on firms’
performance, preventing its convergence in the long run. The effects on firms’
performance attributed to MNCs may however operate in divergent directions.
Notwithstanding the direct effect of MNCs transference of assets on efficiency and
performance of their affiliates, positive MNC-related spillovers in an industry are expected
to increase the average performance of firms. Blomström and Kokko (1998) establish
theoretically the linkage between technology spillovers, technical efficiency of domestic
firms and their effect on firms’ performance, while Barrel and Pain (1993), Blomström
and Sjöholm (1998), and Dimelis and Louri (2002) find evidence that suggests a positive

6
effect of the degree of foreign penetration in an industry on productive efficiency, which
should render performance higher. The foreign presence in an industry, on the other
hand, is likely to affect competitive conditions. Overall, economic theory posits that
foreign presence tends to be neutral or to enhance the intensity of competition, leading to
a decrease in profit margins. Therefore, the effect of the degree of foreign presence on
firms’ performance depends on the relative weight of these two opposite forces at work.
Within an industry, firms’ strategic choices, which delineate firm-specific
characteristics, are likely to affect performance. The literature on entry has emphasised
firm size as a strategic choice that is mainly driven by potential incumbents’ aggressive
behaviour towards newcomers (Gelman and Salop, 1983; Scherer and Ross, 1990),
uncertainty about their own efficiency (Jovanovic, 1982) and survival (Cabral, 1995), and
financial constraints (Evans and Jovanovic, 1989). These different explanations usually
support small entry sizes, though small size does not imply superior performance. The
theory is ambiguous on the precise relationship between size and performance, but there
is consensus that firm size (SIZE) impacts on firm-level performance. Large firms may
generate superior performance as they are more prone to exploit economies of scale and
scope and they may organize their activities more efficiently (Majumdar, 1997). On the
other hand, monitoring costs, increased bureaucratisation and extensive hierarchies may
prevent large firms from achieving higher performance. Small firms may be able to
compensate their cost differentials by adopting more flexible managerial organizations
and methods of production (Audretsch and Yamawaki, 1992), responding more rapidly to
changes on competitive environment and obtaining larger than average profits. These
arguments may be less appealing in the case of MNCs than in the case of domestically
owned firms as MNCs are normally large firms, but are critical when comparing domestic
and foreign firms. Finally, the correlation between firm size and market power, reported
elsewhere, reinforces the specification of SIZE as an explanatory variable of firms’
performance.
The impact of firm’s age (AGE) on performance is expected to be significant,
though the direction of the effect has not yet been unequivocally established in
performance literature. During their early infancy, firms go through a learning process
about their abilities to operate in the industry (Jovanovic, 1982) or through a developing
process of new organizational capabilities (Nelson and Winter, 1982). Comparatively,
older firms enjoy the benefits of their previous learning process and can, therefore, obtain
superior performance. However, they “are prone to inertia, and the bureaucratic
ossification that goes along with age” (Majumdar, 1997, p. 233), that may make firms ill
suited to cope with changes in their competitive environment, leading to negative
performance. Although the learning process is not industry-specific and MNCs could
benefit from past experience of their parent company, they are also subject to some sort
of learning process to the extent that they are operating in an unfamiliar environment
and they are locally competing with more informed domestic firms. All of these
7
arguments make age relevant in explaining differentials in firms’ performance, regardless
of their (domestic or foreign) origin.
Finally, firm-specific choices related to financial risk and efficiency in asset
management may lead to the creation of heterogeneity within industry and may help to
explain firm performance. To control for financial risk that can be associated with firm
dependency and bargaining power in the capital market and may impact on firm
performance, a measure of debt ratio (DEBT) is added to the set of covariates. The
relative ability of firms to convert assets into cash (LIQUIDITY) may also impact on
performance as resources can quickly be used to respond to profit opportunities. The
variables INVENTORY, which is measured as a ratio between inventory value and total
assets, and TURNOVER, which is measured as a ratio between sales and total assets,
may capture aspects of firm-level competencies to efficiently manage assets in order to
maximize their rent-yielding power.
3 DATA SET, DEFINITION OF VARIABLES AND DESCRIPTIVE STATISTICS
3.1 The Data
The data sets used in this paper were drawn from several sources. In the Portuguese
case, most of individual firm information was collected by the Bank of Portugal that
studies a random sample of firms on an annual basis. This data source provides mostly
financial data based on the accounts of firms but lacks information on firms’ ownership
structure. To include such information on our data set, we had to combine the Bank of
Portugal data with other sources. In particular, data on foreign ownership has been
derived from Quadros de Pessoal, a data set produced by the Portuguese Ministry of
Labour and based on a standardized questionnaire that all firms with wage earners must
answer every year. The final sample includes 523 manufacturing firms operating in
Portugal in 1992.1
In the Greek case, individual firm information has been derived from the ICAP
directory, which provides financial data based on the published accounts of all Plc. and
Ltd. firms in Greece combined with relevant information from other sources. The data
refer to 1997 but only firms alive in 1992 as well are included so that we can have growth
measures. Thus, 2651 firms are used, most of them large-sized, producing more than
three quarters of manufacturing sales in 1997.2
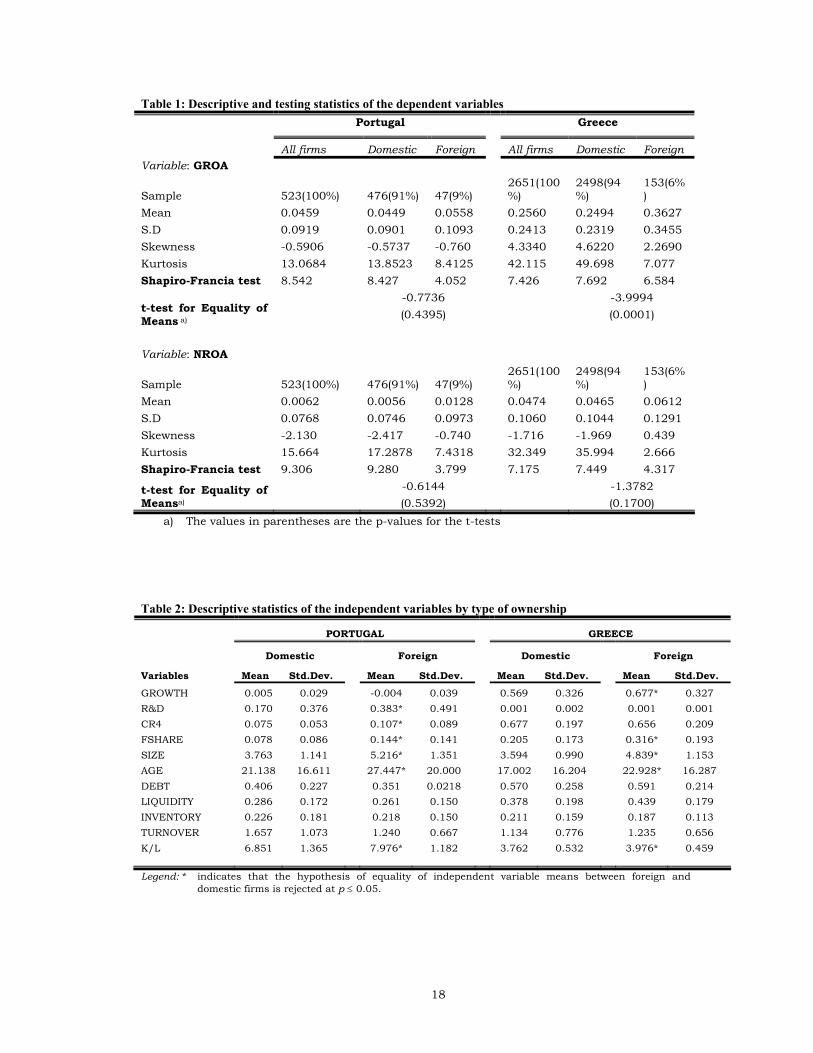
3.2 The dependent variables Table 1 presents a summary of the descriptive and testing statistics of two alternative
dependent variables. For each sample, we use a net and gross measure of return on
1 As both sources do not reveal the real identification of firms, the matching of these two data sources requires the definition of some identification criteria. We use information on main economic activity performed, number of employees, and location as the matching variables. 2 All Plc. and Ltd. firms in Greece have to publish annual accounts in the press. ICAP collects the financial data
reported there and combines it with information derived from additional searches on foreign ownership, location, age and employment. Hence our sample includes the population of all manufacturing firms in this category.
8
assets (NROA and GROA, respectively) as a proxy of firms' profitability. The main
difference is that taxes and financial costs and revenue are not included in gross
measures. The descriptive statistics show that average profitability for firms in our
sample operating in Portugal is significantly lower than for firms operating in Greece,
although the relatively high standard deviation implies that there is a larger spread of
profitability around the mean in Portugal. The difference in the period of analysis may
partially explain such difference as the observed years may imply differences over the
economic cycle.
Most interestingly, the coefficient for skewness indicates that the distribution of
firms’ gross profitability (GROA) is slightly skewed to the right in the Greek case, as
compared to the normal distribution, while in the Portuguese case the skewness is
negligible. Conversely, in both cases the distribution of firms’ net profitability (NROA) is
slightly skewed to the left. For all cases the coefficient for kurtosis provides evidence that
the distribution of firms’ profitability departs from normality. This finding is further
corroborated by the Shapiro-Francia test for the normality assumption of the marginal
distribution of firms’ profitability which is rejected at p=0.00, suggesting caution in
choosing the appropriate econometric treatment to deal with such distribution features.
In particular, the OLS methodology would not be appropriate for our purposes as the
non-normality of the dependent variable causes the OLS residuals to be non-Gaussian,
leading to inefficient or asymptotically inefficient estimators. On the contrary, quantile
regression models seem quite appropriate to the analysis of firms’ profitability as they
provide a robust characterization of the firms’ profitability distribution that does not rest
on strong distributional assumptions.3 On the other hand, the t-tests for equality of means show that in Portugal there
are no considerable differences between domestic- and foreign-owned firms with regard to
profitability, while in Greece, the average gross profitability of domestic firms is
significantly lower than the average gross profitability of foreign firms. This result
suggests that after controlling for firm- and industry-specific characteristics that are
likely to impact on firms’ performance, one would not expect any significant difference in
profitability that can be attributed to foreignness at least in the Portuguese case.
Moreover, it provides us with preliminary evidence that the similarity in terms of
performance between foreign- and domestic-firms appears to be country-specific.
3.3 The explanatory variables The choice of explanatory variables or covariates is theoretically driven and aims to proxy
firm- and industry-specific characteristics that are likely to determine firms’ performance
regardless of ownership structure.
In order to proxy industry growth we define the covariate GROWTH as the average
of annual rate of growth of output in the relevant (3-digit) industry over the past 3 years
in the Portuguese case and over the past 5 years in the Greek case. Industry
3 See Section 4 for a discussion of the estimation of quantile regression models.

9
concentration is another industry-specific characteristic that is measured by the share of
employees contained in the industry’s four largest firms (CR4). The intensity of foreign
firms in the industry (FSHARE) in the Portuguese sample is measured as the ratio of
employment accounted for foreign firms (regardless of their participation rates) to the
total number of employees in the relevant industry. In the Greek sample it is measured
as the share of an industry’s fixed assets accounted for by foreign firms.4 In turn, the
R&D Intensity (R&D) is measured as the ratio of R&D expenditures to sales at industry
level for the Greek sample, but similar data are not available for Portugal. Instead, we
use information on the number of innovating firms per industry to construct a dummy
variable that aims to proxy R&D intensity. In particular, we define an industry as R&D
intensive if the ratio of innovating firms to the total number of firms in an industry is
greater than the average ratio for the manufacturing industry.
With reference to firm-specific characteristics (all lagged by one year), we measure
firm size (SIZE) by the logarithm of the number of employees and firm age (AGE) by the
number of years a firm is operating in an industry. In order to proxy financial risk we
define the covariate DEBT as the ratio of short and long term debt to total assets and the
covariate LIQUIDITY as the ratio of working capital to total assets. On the other hand,
firm-level operational competencies are proxied by the covariates INVENTORY and
TURNOVER, which are measured as the ratio between inventory value to total assets and
sales to total assets, respectively. Additionally, we use physical capital as reported by the
firm (capital stock) and compute the logarithm of the ratio of capital to number of
employees in order to obtain the average of capital per employee, which is a proxy to
physical capital intensity (K/L). In order to answer our main research question, we define
the covariate foreign ownership (FDI) that takes the value 1 if the firm has a foreign
participation greater than 10%5, which allows us to evaluate if there are any significant
differences in profitability due exclusively to foreigness.
Aside differences on performance, the descriptive statistics of the independent
variables reported in Table 2 show that foreign firms operate in industries with a higher
degree of foreign presence, suggesting that they seek to take advantage of some sort of
externalities due to the presence of MNCs. In the Greek sample, we find also that the
difference in the means of industry growth is significant, as indicated by the t-statistic
that leads us to reject the hypothesis of equality of means between foreign and domestic
firms at p-value of 0.05. The average growth of industries where domestic firms operate
is smaller than the average growth of industries where foreign firms operate. This
suggests that comparatively, foreign firms tend to choose industries with high rate of
growth as a device to explore profit opportunities. No similar evidence is found in the
Portuguese sample. Nonetheless, in the Portuguese sample we found that foreign firms
operate in relatively more concentrated and R&D-intensive industries. This appears to
4 Use of employment data as in the Portuguese case provided similar results. 5 Following the usual threshold used by national statistical agencies to determine whether a firm is foreign or domestic
based on the effective exercise of corporate control, we consider as foreign firms all firms that have at least 10% of foreign participation.
10
indicate that foreign firms expect to obtain large profits by exercising monopoly power
that is considerably easier in concentrated industries.
When analysing firm-specific characteristics in both samples, it becomes
noticeable that foreign and domestic firms have similar preferences with respect to
financial risk and efficiency in asset management. Based on the t-tests performed to
assess the hypothesis of equality of means between foreign and domestic firms, we found
that there are no significant differences in the means of the covariates DEBT, LIQUIDITY,
INVENTORY, and TURNOVER. Conversely, the statistics reported in Table 2 show that,
on average, capital-intensity and size of foreign firms significantly exceed the respective
means of domestic firms. Moreover, we find a preference of foreign firms for larger size
and more capital per employee, which may contribute to a positive differential in
performance. It is also worth noting that foreign firms in our samples are, on average,
older than domestic firms, suggesting that previous learning process about their abilities
to operate in the industry may lead to superior performance.
4 ESTIMATION PROCEDURES Let Qq(π|c) for q ∈ (0,1) denote the qth quantile of the conditional distribution of firms’
profitability (π), given the known vector, c=(x, z, FDI), of covariates discussed above. The
conditional quantile distribution provides a full characterization of the conditional firms’
profitability. As q is increased from 0 to 1, the entire distribution of π is traced,
conditional on c. By modelling the conditional quantiles with the identity link function,
i.e. ( ) ( ) ( ) ( )FDIQ qqiqjijijq α+′+′=π γzβxc ,
the parameters of (1) can be estimated at various quantiles of the conditional distribution
of π, allowing the effects of the covariates to differ at different points of the distribution
and, thus, it may show whether a covariate exerts a significant influence on one tail of
the distribution but not on the other.
The quantile regression (QR) coefficients, β(q), γ(q) and α(q), for given q ∈ (0,1) can be
estimated by the methods introduced by Koenker and Basset (1978). They define the qth
regression quantile as the solution to the problem
iji
iijiji
ij FDI hhmin,,
∑ α−′−′−π=∑ εα
γzβx jγβ (2)
with,
( )
<ε−>ε
=0if120if2
ij
ijij q
qh .
Note that quantiles other than the median are estimated by weighting the residuals. The
positive or negative nature of the residuals determines their appropriate weights.
Estimation was performed using the SQREG procedure in STATA and 1000 replications
were performed to estimate the entire variance-covariance matrix of the estimators by
bootstrap resampling. The practical advantage of this procedure is that one can perform
11
hypothesis tests concerning coefficients within and across quantiles. The relevance of
the bootstrapping procedure hinges on its robustness property; in particular when the
errors from the QR equation are not homogeneously distributed. The Pseudo R2 for each
quantile is calculated as q
qW
W1 ~ˆ
− where qW is the sum of weighted deviations about
estimated quantiles and qW~ the sum of weighted deviations about raw quantiles, i.e.
quantile regression on a constant only.
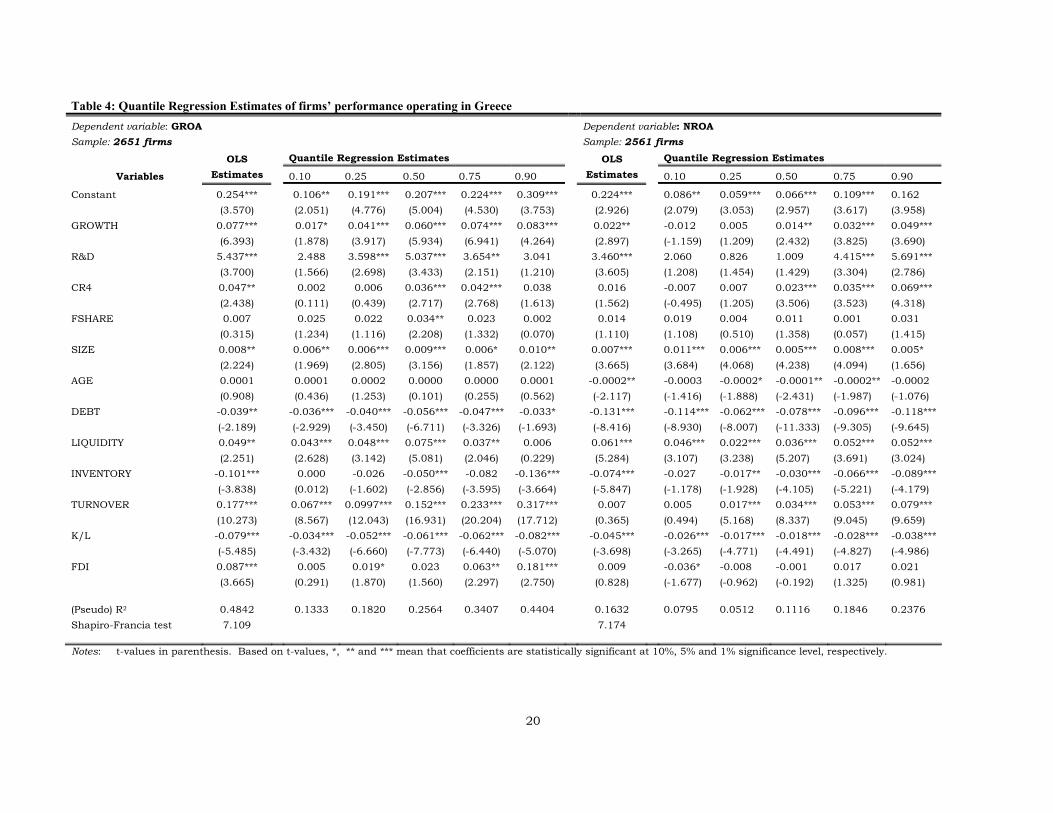
5 RESULTS Empirical results for selected quantiles from estimating the QR model are given in Tables
3 and 4. For comparison purposes, we also provide the estimates obtained from the OLS
model. The OLS results show that our empirical model of profitability explains more
than 25 % of the observed profit variability for firms operating in Portugal and the model
goodness-of-fit for firms operating in Greece is between 16% and 48%. Interestingly the
model offers a better fit for the net measure of profitability in the Portuguese case, while
in the Greek case, the goodness-of-fit substantially increases when we use the gross
measure of profits. Nonetheless, in both samples industry characteristics account for a
small percentage of the variation in firms' profitability. When we regress profitability on
firm-specific covariates only, the R2 is very close to the overall R2, indicating that firm-
specific characteristics play a chief role in explaining the variability of observed
profitability.
The Shapiro-Francia test applied to the OLS residuals, however, confirms the
inadequacy of the OLS methodology to analyse the conditional distribution of corporate
profitability. The hypothesis of normality of the residuals is rejected at p=0.00, rendering
OLS estimators inefficient. This result is not surprising as we have already found
evidence that the marginal distribution (see Section 3.2) departs from normality. It
should be noted, nonetheless, that overall, the covariates that are statistically significant
in explaining profitability remain mostly unchanged, indicating that the significance of
the covariates on the conditional mean of the dependent variable is similar to that at the
selected quantiles of the conditional distribution, though their effects are considerably
different. The discussion of the estimated results is therefore focused on quantile
regression results.
Overall the results reported in Tables 3 and 4 indicate that the effects of most of
the significant covariates differ among the selected quantiles, reinforcing the adoption of
the quantile regression methodology. In particular, the coefficient of our main covariate
(FDI) varies considerably, either in terms of size and significance, as we move from OLS to
quantile regression and among the selected quantiles of the profitability conditional
distribution. In the Portuguese case we find evidence that does not support our a priori
expectation with respect to the relationship between foreign ownership and profitability,
casting doubts on the hypothesis that MNCs perform better than domestic firms. If there
12
is any difference, it appears to favour Portuguese domestic firms that seem to perform
better than MNCs operating in Portugal. This relative superior performance is
particularly evident when we concentrate our attention on the gross measure of
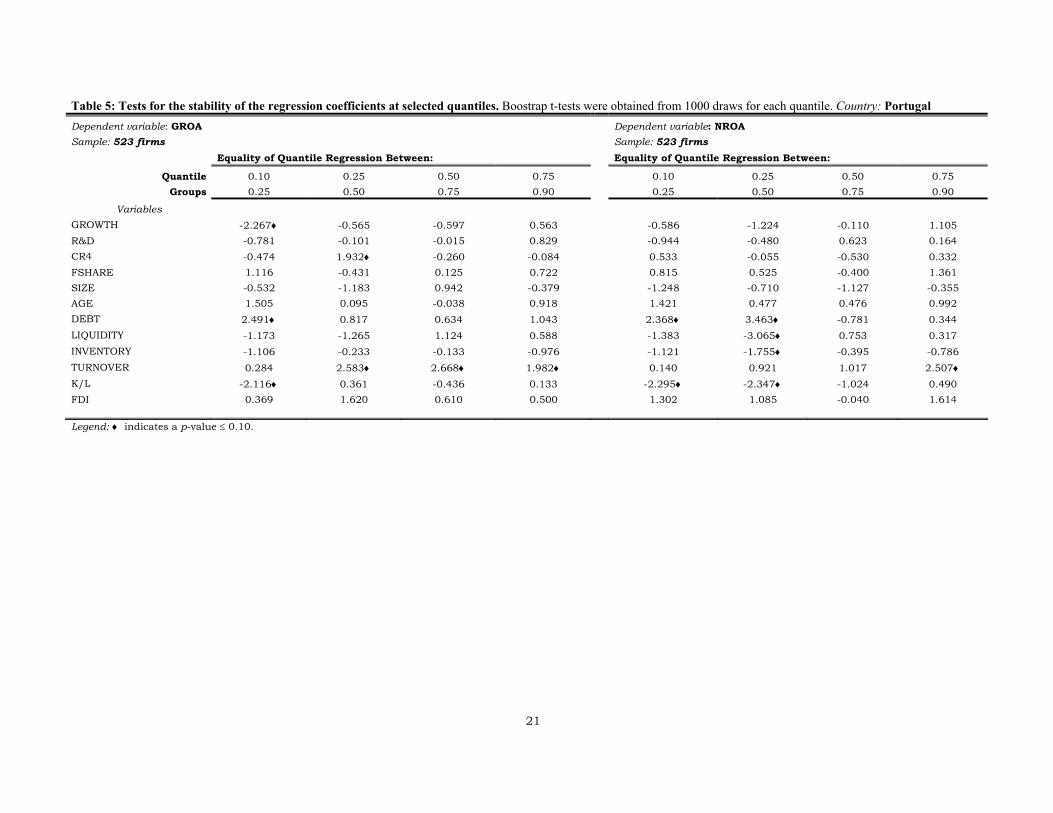
profitability and on firms are at the lower quantiles (0.10 and 0.25). Note, however, that
significant differences among the regression coefficients are only reported for those
quantiles (see Table 5). When we consider the net measure of profitability there is also
no support for the hypothesis that after controlling for firm- and industry-specific
characteristics that are likely to determine firms’ performance, there remains a
differential in profitability that can only be associated to foreign ownership. Yet, the
effect of FDI on firms belonging to the lower quantiles appears to differ. As we move from
the lower quantile to the upper quantile, the estimated effect of foreign ownership on
profitability increases, suggesting that ownership matters as firms attain high profits
levels but not significantly.
Conversely, the Greek sample offers evidence that there may be profitability
differentials that could be attributed to foreignness. In particular, we find that the
coefficient of FDI varies significantly from 0.005 to 0.181 as we move from the lower
quantile (0.10) to the upper quantile (0.90) of the gross profitability conditional
distribution. More interestingly, the most profitable foreign firms, i.e. firms at the upper
quantiles (0.75 and 0.90), report positive differentials on profitability that are statistically
significant and can only be associated to foreignness, confirming our a priori
expectations. This suggests that the effect of foreignness on profitability is strengthened
towards the right tails of the distribution, as is confirmed by the tests performed for the
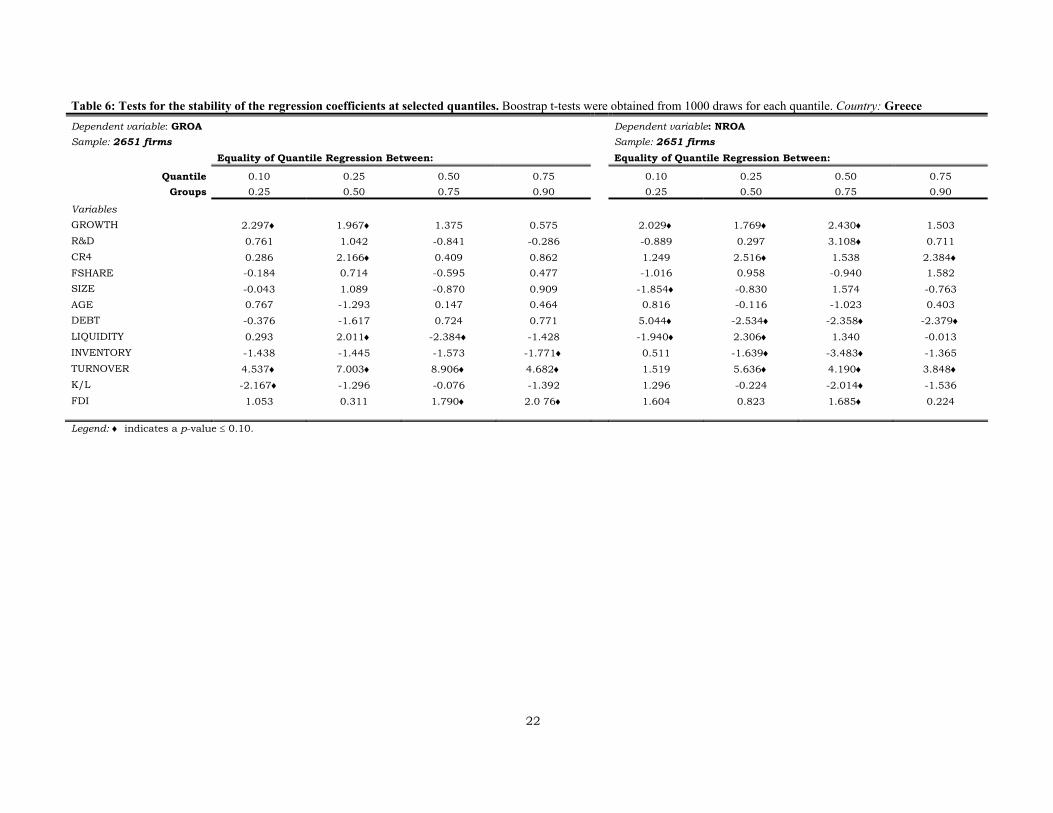
stability of the regression coefficients at selected quantiles (see Table 6). The effect of
foreign ownership across the net profitability conditional distribution is similar to that
found in the Portuguese sample; that is, an increasing effect of foreign ownership on
firms' profitability, despite its statistical insignificance. Overall, the hypothesis of relative
superior performance of MNCs is only partially supported by our descriptive evidence,
suggesting that country-specific factors may also be at work preventing us to find
regularities across the observed economies.
The effect of the degree of foreign presence (FSHARE) on corporate profitability, on
the other hand, provides similar evidence across the observed manufacturing industries.
The covariate is statistically insignificant in explaining profitability, irrespective of the
empirical measure, the sample and, the econometric methodology applied. This result
appears to indicate that the intensity of foreign presence in an industry is neutral to
competition with no impact on margins. An alternative interpretation is that the pro-
competitive effect may be entirely compensated by positive MNC-related spillovers,
rendering the overall effect on firms' profitability insignificant. In order to investigate
whether this effect differs by type of ownership we re-estimate the model for both samples
adding interaction covariates such as FDI*FSHARE to the set of covariates.6 Neither
6 The estimation results of the models of performance with interaction covariates are available from the authors upon
request.
13
FSHARE nor FDI*FSHARE is ever statistically significant, indicating that if MNCs reveal
relative superior performance, it cannot be explained as a consequence of a damaging
effect on domestic profitability. MNCs may perform well due to their own specific
characteristics and capabilities to compete in an industry. Moreover, the statistically
insignificant effect of FSHARE on domestic and foreign firms’ performance suggests that,
if anything, the FDI enhancing efficiency effect is spread out to all firms operating in an
industry. Consequently, this effect would hardly explain differentials in performance.
Industry-specific characteristics (GROWTH, R&D and, CR4) offer us evidence of
different effects among the observed firms. Firms operating in Greece are sensitive to
industry growth, R&D intensity and degree of concentration, while firms operating in
Portugal appear to reveal that industry characteristics do not matter for profitability.
Moreover, the positive and significant effect of the degree of concentration found in the
Greek sample peaks towards the median slightly increasing its size but maintaining its
significance level. We interpret this result as evidence that firms are more likely to
protect their market positions against rivals' competition if their profitability is median or
higher. A different picture is offered by the industry growth and R&D intensity
coefficients, indicating that they are important enhancing profitability factors but for all
firms, regardless of their profits level and ownership structure.
In terms of firm-specific attributes, we find evidence that large firms operating in
Greece perform better than small firms, regardless of their profitability level and
performance measure. Moreover, the magnitude of SIZE effect on firms' profitability is
identical across firms. This suggests that monitoring costs and potential increased
bureaucratisation may well be compensated for by the advantages of exploiting
economies of scale and scope that are available to large firms. The effect of SIZE can also
be interpreted as indicating firms’ market power and its positive impact on performance.
This positive relationship may explain MNCs superior performance, as they are larger
than domestic firms (cf. Table 2). Conversely, firm size appears to not significantly
impact on performance of firms operating in Portugal. Alternatively, we can interpret this
result as indicating that the advantages of being large are entirely compensated for by the
disadvantages, resulting in a neutral effect on performance. However, we should note
that when the NROA measure is used large size appears to result in low performance,
particularly for firms at the upper quantiles of the profitability distribution.
On the other hand, firms' age does not impact significantly on profitability.
Nevertheless, when a net measure of profitability is used, firms operating in Greece and
with a profit level around the median of the profitability conditional distribution do not
appear to benefit from age. Old firms seem to perform worse than young ones,
suggesting that the benefits of a previous learning process may not compensate for the
organizational stumbling blocks that may come along with age.
In agreement with our a priori expectations, the results show that the ability of
firms to convert assets into cash is an important enhancing profitability factor. Both
samples provide evidence that the covariate LIQUIDITY is strongly significant in

14
explaining differentials in profitability. There are, nonetheless, no significant differences
across the selected quantiles of the profitability distribution for firms operating in
Portugal (see Table 5). That is, the ability to quickly convert assets into cash in response
to profit opportunities seems to be equally spread out to all firms. Conversely, firms
operating in Greece seem to be dissimilar in terms of such ability. Firms with a median
level of profits appear to have a higher capacity to respond to profit opportunities by
converting assets into cash. They appear, on the other hand, to be more susceptible to
financial risk, which impacts negatively on profitability. The negative effect of DEBT
increases towards the median of the conditional profitability distribution, decreasing
afterwards. However, when we use a net measure of profits, the concave configuration of
the DEBT effect is not confirmed. On the contrary, we find evidence of a negative and
increasing effect as we move from the lower to the upper quantile, suggesting that firms'
dependency on the capital market may increase with their profit levels as in order to
respond to profit opportunities external funds may be required. It should be noted,
however, that a similar effect can not be found in the Portuguese sample. The DEBT
effect decreases as firms’ profitability increases, suggesting that firms operating in
Portugal may respond to profit opportunities using their own surplus of funds, which is
more likely to be available in firms with high levels of profits.
With respect to firm-level competencies in assets management, we find strong
evidence of a positive and increasing impact on firms’ profitability as the effect of the
covariate TURNOVER increases as we move towards the right tail of the profitability
conditional distribution. This result suggests that high profit levels may be partially
explained by the ability of firms to take full advantage of their assets rent-yielding power,
the finding being not county-specific. Conversely, the way firms manage their inventories
and its impact on profitability is a contrasting finding between the two samples. Whereas
firms operating in Portugal appear to choose high levels of inventories as a way to
increase profits, for firms operating in Greece high level of inventories impact negatively
on profitability. Nonetheless, in both cases the INVENTORY effect decreases as firms
attain high profits, indicating that the relative relevance of inventory decisions falls as
firms increase their performance.
Another contrasting finding is related to the effect of physical capital intensity
(K/L) on firms’ profitability. Whereas firms operating in Portugal appear to improve their
performance if they choose a capital-intensive technology, firms operating in Greece are
more prone to choose a labour intensive technology as a way to improve performance.
This suggests that capital costs in Greece may be a relevant constraint that prevents
firms from increasing profitability, irrespective of whether we use a gross or net measure
of profitability. Moreover, this effect appears not to be mitigated as firms move across the
probability distribution, as there are no significant differences among firms at different
quantiles of the conditional distribution.
15
6 CONCLUSIONS AND IMPLICATIONS The aim of our study was to identify performance variables and most importantly, to
examine specifically the role of FDI both as a shift variable and as an industry variable
measuring technology spillovers using two separate, country-specific samples of
manufacturing firms. For this purpose, a sample of 2651 Greek firms in 1997 and a
sample of 523 Portuguese firms in 1992 were constructed. Departures from normality of
firms' profitability motivated the adoption of the robust technique of quantile regression,
which to our knowledge had not been used previously in relevant studies. It should also
be stressed that to date, there were no published performance studies for either country.
The estimation results suggest that, after controlling for firm-and industry-
specific characteristics that are likely to impact on performance, ownership ties do not
make a significant difference for firms in Portugal, subsequently casting doubts on the
hypothesis that MNCs perform better than domestic firms, probably because they have to
compensate for their liability of foreigness. Conversely, MNCs operating in Greece are
significantly more profitable than Greek-owned firms, if a specific measure of profitability
(gross return on assets) is taken into account and in particular when firms in the upper
quantiles are compared. In both countries the intensity of foreign presence in an industry
appears to be neutral to competition with no impact on margins. Hence, if MNCs reveal a
superior relative performance, it cannot be attributed to a damaging effect on domestic
profitability possibly imposed by tough competition.
Firms operating in Greece are found to be sensitive to industry characteristics,
such as concentration, R&D intensity and growth, which is not true for Portuguese firms.
Another difference between firms in the two countries is the effect of size being positively
significant in Greece and non-significant in Portugal, while capital intensity appears to
worsen and improve performance respectively. Still, a notable similarity is the effect of
liquidity or the ability to convert assets into cash to explore profitable opportunities,
while the effect of debt is found to play a negative role. Most of these effects vary by
quantile.
One interesting extension of our research would be to examine the impact on
performance according to the extent of foreign ownership, and specifically whether
differences are observed between majority- and minority-held foreign firms and whether
such considerations affect the nature of spillovers. Another potentially fruitful extension
would be to include more countries in the analysis, allowing the recognition of country-
specific effects and thereby contributing to a better understanding of the conditions
under which foreign ownership may affect performance.
16
7 REFERENCES Aitken, Brian J. and Harrison, Ann E. (1999) “Do Domestic Firms Benefit from Direct Foreign
Investment? Evidence from Venezuela”, American Economic Review, 89 (3), pp. 605-618. Audretsch, David B.; Yamawaki, Hideki (1992) "Sub-optimal Scale Plants and Compensating Factor
Differentials in U.S. and japanese Manufacturing", Audretsch, David B.; Siegfried, John J. (eds.), Empirical Studies in Industrial Organization: Essays in Honor of Leonard W. Weiss, Dordrecht: Kluwer Academic Publishers, pp. 161-185.
Blomström, M. and Kokko, A. (1998) “Multinational Corporations and Spillovers”, Journal of Economic Surveys, 12, pp. 247-277.
Blomström, M. and Sjöholm, F. (1999) “Technology Transfer and Spillovers: Does Local Participation with Multinationals Matter?”, European Economic Review, 42(4-6), pp.915-923.
Boardman, Anthony E. and Vining, Aidan R. (1989) Ownership and Performance in Competitive Environments: A Comparison of the Performance of Private, Mixed and State-Owned Enterprises”, Journal of Law and Economics, 32 (1), p. 1-33.
Boardman, A. E., Shapiro, D. M. and Vining, A. R. (1997) “The Role of Agency Costs in Explaining the Superior Performance of Foreign MNE Subsidiaries”, International Business Review, 6, pp. 295-317.
Bradburd, R. M. And Caves, R.E. (1982) “A closer look at the effect of market growth on industries’ profits”, Review of Economics and Statistics, Vol. 64, pp.635-645.
Bunch, David S.; Smiley, Robert (1992) "Who Deters Entry? Evidence of the Use of Strategic Entry Deterrence", Review of Economics and Statistics, Vol. 74, No. 3 (August), pp. 509-521.
Cabral, Luís (1995) "Sunk Costs, Firm Size and Firm Growth", Journal of Industrial Economics, Vol. 43, No. 2 (June), pp. 161-172.
Caves, Richard E. (1996) Multinational Enterprise and Economic Analysis, 2nd edition, Cambridge University Press.
Chhibber, Pradeep K. and Majumdar, Sunit K. (1998) “Does It Pay to Venture Abroad? Exporting Behavior and the Performance of Firms in Indian Industry”, Managerial and Decision Economics, 19 (2), pp. 121-126.
Chhibber, Pradeep K. and Majumdar, Sunit K. (1999) “Foreign Ownership and Profitability: Property Rights, Control, and the Performance of Firms in Indian Industry”, Journal of Law and Economics, 42, pp. 209-238.
Cleeve, Emmanuel (1997) “The Motives for Joint Ventures: A Transaction Costs Analysis of Japanese MNE’s in the UK”, Scottish Journal of Political Economy, Vol. 44, No. 1 (February), pp. 31-43.
Co, Catherine Y. (2001) “Trade, foreign direct investment and industry performance”, International Journal of Industrial Organization, 19 (1-2), pp.163-183.
Cubbin, J.; Geroski, P. A. (1987) "The Convergence of Profits in the Long Run: Inter-firm and Inter-industry Comparisons", Journal of Industrial Economics, Vol. 35, pp. 427-442.
Davies, S. and Lyons B. (1991) Characterizing Relative Performance: The Productivity Advantage of foreign owned firms in the UK, Oxford Economic Papers, 43(4), pp. 584-595.
Demsetz, Harold (1973) "Industrial structure, Market Rivalry, and Public Policy", Journal of Law and Economics, Vol. 16, pp. 1-3.
Dimelis, S. and Louri, H. (2002) “Foreign ownership and production efficiency: A quantile regression analysis”, Oxford Economic Papers, 54, pp. 449-469.
Driffield, Nigel and Munday, Max (1998) “The Impact of Foreign Direct Investment on UK Manufacturing: Is there a Profit Squeeze in Domestic Firms?”, Applied Economics, 30, pp. 705-709.
Dunning, John H. (1993) Multinational Enterprises and the Global Economy, Harlow: Addison-Wesley.
Evans, D.; Jovanovic, B. (1989) "An Estimated Model of Entrepreneurial Choice under Liquity Constraints", Journal of Political Economy, Vol. 97, pp. 808-827.
Gelman, J. R.; Salop, S. C. (1983) "Judo Economics: Capacity Limitation and Coupon Competition", Bell Journal of Economics, Vol. 14, pp. 315-325.
Globerman, Steven, Ries, Jonh C. and Vertinsky, Ilan (1994) “The Economic Performance of Foreign Affiliates in Canada”, Canadian Journal of Economics, 27 (1), pp. 143-156.
Grabowski, H. G. and Mueller, D. C. (1978) “Industrial research and development, intangible capital stocks, and firm profits rates”, Bell Journal of Economics, Vol. 9, pp. 328-343.
17
Hanel, P. and St-Pierre, A. (2002) “Effects of R&D Spillovers on the Profitability of Firms”, Review of Industrial Organization, 20 (4), pp. 305-322.
Hansen, Gary S. and Wernerfelt, Birger (1989) “Determinants of Firm Performance: The Relative Importance of Economic and Organizational Factors”, Strategic Management Journal, 10, pp. 399-411.
Hay, D. A. and Morris, D. J. (1991) Industrial Economics and Organization: Theory and Evidence, 2nd ed., Oxford: Oxford University Press.
Jacobson, Louis S. (1987) “The Validity of ROI as a Measure of Business Performance”, American Economic Review, 77 (3), pp. 470-478.
Jenkins, Rhys (1990) “Comparing Foreign Subsidiaries and Local Firms in LDCs. Theoretical Issues and Empirical Evidence”, Journal of Development Studies, 26, pp. 205-228.
Jovanovic, Boyan (1982) "Selection and the Evolution of Industry", Econometrica, Vol. 50, No. 3 (May), pp. 649-670.
Kim, Wi S. and Lyn, Esmeralda O. (1990) “FDI Theories and The Performance of Foreign Multinationals Operating in the U.S.”, Journal of International Business Studies, 21 (1), pp. 41-54.
Koenker, R. and Basset, G. S. (1978) “Regression Quantiles”, Econometrica, 46 (), pp. 33-50. Lecraw, D. J. (1984) “Bargaining power, ownership, and profitability of transnational corporations
in developing countries”, Journal of International Business Studies, Vol. 15, pp. 27-43. Majundar, Sumit K. (1997) “The Impact of Size and Age on Firm-Level Performance: Some Evidence
from Indian Industry”, Review of Industrial Organization, 12, pp. 231-241. Markusen, J. (1995), “The Boundaries of Multinational Enterprises and the Theory of International
Trade”, Journal of Economic Perspectives, Vol. 9 (2), pp. 169-189. Mueller, D. (1986) Profits in the long run, Cambridge: Cambridge University Press. Nelson, R. and Winter, S. (1982) An Evolutionary Theory of Economic Change, Cambridge, Mass.,
Harvard University Press. Nickell, S.; Nicolitsas, D.; Dryden, Neil (1997) “What makes firms perform well?, European Economic
Review, Vol. 41, pp. 783-796. Ravenscraft, David J. (1983) “Structure-profit Relationships at the Line of Business and Industry
Level”, Review of Economics and Statistics, 65, pp. 22-31. Röller, Lars-Hendrik; Sinclair-Desgagné, Bernard (1996) "On the Heterogeneity of Firms", European
Economic Review, Vol. 40, pp. 531-539. Rumelt, R. P. (1982) “Diversification strategy and profitability”, Strategic Management Journal, Vol.
3, No. 4, pp. 359-369. Rumelt, Richard P. (1991) "How Much Does Industry Matter?", Strategic Management Journal, Vol.
12, No. 3 (March), pp. 167-185. Scherer, F.; Ross, D. (1990), Industrial Market Structure and Economic Performance, 3rd. ed.,
Boston: Houghton Mifflin. Schmalensee, Richard (1985) "Do Markets Differ Much?, American Economic Review, Vol. 75, No. 3
(June), pp. 341-351. Schmalensee, Richard (1989) "Inter-Industry Studies of Structure and Performance", Schmalensee,
Richard; Willig, Robert D. (eds.), Handbook of Industrial Organization - Volume II, Amsterdam: North-Holland, pp. 951-1009.
Siripaisalpipat, Pimonwan and Hoshino, Yasuo (2000) “Firm-Specific Advantages, Entry Modes, and Performance of Japanese FDI in Thailand”, Japan and the World Economy, 12 (1), pp. 33-48.
Wernerfelt, B. and Montgomery, C. A. (1988) “Tobin’s q and the Importance of Focus in Firm Performance”, American Economic Review, Vol. 78, No.1, pp.246-250.
Willmore, Larry (1986), “The Comparative Performance of Foreign and Domestic Firms in Brazil”, World Development, 14 (4), pp. 489-502.
18
Table 1: Descriptive and testing statistics of the dependent variables Portugal Greece
All firms Domestic Foreign All firms Domestic Foreign Variable: GROA
Sample 523(100%) 476(91%) 47(9%) 2651(100%)
2498(94%)
153(6%)
Mean 0.0459 0.0449 0.0558 0.2560 0.2494 0.3627 S.D 0.0919 0.0901 0.1093 0.2413 0.2319 0.3455 Skewness -0.5906 -0.5737 -0.760 4.3340 4.6220 2.2690 Kurtosis 13.0684 13.8523 8.4125 42.115 49.698 7.077 Shapiro-Francia test 8.542 8.427 4.052 7.426 7.692 6.584
t-test for Equality of Means a)
-0.7736 (0.4395)
-3.9994 (0.0001)
Variable: NROA
Sample 523(100%) 476(91%) 47(9%) 2651(100%)
2498(94%)
153(6%)
Mean 0.0062 0.0056 0.0128 0.0474 0.0465 0.0612 S.D 0.0768 0.0746 0.0973 0.1060 0.1044 0.1291 Skewness -2.130 -2.417 -0.740 -1.716 -1.969 0.439 Kurtosis 15.664 17.2878 7.4318 32.349 35.994 2.666 Shapiro-Francia test 9.306 9.280 3.799 7.175 7.449 4.317
t-test for Equality of Meansa)
-0.6144 (0.5392)
-1.3782 (0.1700)
a) The values in parentheses are the p-values for the t-tests
Table 2: Descriptive statistics of the independent variables by type of ownership
PORTUGAL GREECE
Domestic Foreign Domestic Foreign
Variables Mean Std.Dev. Mean Std.Dev. Mean Std.Dev. Mean Std.Dev. GROWTH 0.005 0.029 -0.004 0.039 0.569 0.326 0.677* 0.327 R&D 0.170 0.376 0.383* 0.491 0.001 0.002 0.001 0.001 CR4 0.075 0.053 0.107* 0.089 0.677 0.197 0.656 0.209 FSHARE 0.078 0.086 0.144* 0.141 0.205 0.173 0.316* 0.193 SIZE 3.763 1.141 5.216* 1.351 3.594 0.990 4.839* 1.153 AGE 21.138 16.611 27.447* 20.000 17.002 16.204 22.928* 16.287 DEBT 0.406 0.227 0.351 0.0218 0.570 0.258 0.591 0.214 LIQUIDITY 0.286 0.172 0.261 0.150 0.378 0.198 0.439 0.179 INVENTORY 0.226 0.181 0.218 0.150 0.211 0.159 0.187 0.113 TURNOVER 1.657 1.073 1.240 0.667 1.134 0.776 1.235 0.656 K/L 6.851 1.365 7.976* 1.182 3.762 0.532 3.976* 0.459
Legend: * indicates that the hypothesis of equality of independent variable means between foreign and domestic firms is rejected at p ≤ 0.05.

19
Table 3: Quantile Regression Estimates of firms’ performance operating in Portugal Dependent variable: GROA Sample: 523 firms
Dependent variable: NROA Sample: 523 firms
Quantile Regression Estimates Quantile Regression Estimates
Variables OLS
Estimates 0.10 0.25 0.50 0.75 0.90
OLS Estimates 0.10 0.25 0.50 0.75 0.90
Constant -0.230*** (-4.500)
-0.306*** (-4.205)
-0.183*** (-3.348)
-0.175*** (-4.262)
-0.184*** (-3.427)
-0.199*** (-3.105)
-0.093** (-2.110)
-0.247*** (-3.943)
-0.119** (-2.463)
-0.030 (-1.290)
0.011 (0.377)
-0.009 (-0.217)
GROWTH 0.077 (0.583)
0.547** (2.501)
0.125 (0.851)
0.053 (0.493)
-0.026 (-0.167)
0.061 (0.331)
-0.009 (-0.082)
0.216 (1.009)
0.115 (1.219)
0.005 (0.068)
-0.003 (-0.038)
0.108 (0.971)
R&D 0.007 (0.841)
0.019 (1.350)
0.009 (1.041)
0.008 (1.173)
0.008 (0.812)
0.021 (1.207)
0.005 (0.691)
0.016 (1.549)
0.006 (1.222)
0.004 (1.024)
0.008 (1.132)
0.010 (0.915)
CR4 -0.130* (-1.845)
-0.106 (-0.850)
-0.163* (-1.738)
-0.017 (-0.242)
-0.037 (-0.406)
-0.046 (-0.384)
-0.132** (-2.398)
-0.101 (-0.878)
-0.045 (-0.567)
-0.049 (-1.405)
-0.066* (-1.746)
-0.046 (-0.659)
FSHARE 0.026 (0.499)
-0.057 (-0.682)
0.025 (0.405)
0.004 (0.080)
0.012 (0.159)
0.072 (0.753)
0.058 (1.270)
-0.048 (-0.576)
0.012 (0.217)
0.040* (1.755)
0.023 (0.495)
0.101 (1.580)
SIZE 0.005 (1.384)
0.009 (1.452)
0.006 (1.533)
0.002 (0.642)
0.005 (1.215)
0.003 (0.868)
-0.002 (-0.660)
0.006 (1.089)
0.0002 (0.075)
-0.002 (-0.913)
-0.004** (-1.843)
-0.005 (-1.544)
AGE -0.0003 (-1.156)
-0.001 (-1.372)
-0.000 (-0.108)
-0.000 (-0.065)
-0.000 (-0.070)
0.000 (0.843)
-0.0002 (-0.994)
-0.0005 (-1.489)
-0.0001 (-0.378)
0.000 (0.085)
0.000 (0.486)
0.000 (1.167)
DEBT -0.111*** (-2.973)
-0.163*** (-3.438)
-0.072*** (-2.762)
-0.056*** (-2.966)
0.040 (1.285)
-0.004 (-0.111)
-0.179*** (-6.880)
-0.224*** (-5.923)
-0.142*** (-4.793)
-0.070*** (-3.953)
-0.082*** (-5.094)
-0.075*** (-3.366)
LIQUIDITY 0.295*** (7.758)
0.280*** (4.344)
0.225*** (4.895)
0.181*** (7.100)
0.225*** (4.597)
0.252*** (6.049)
0.222*** (7.540)
0.247*** (4.405)
0.179*** (4.469)
0.093*** (4.427)
0.109*** (4.636)
0.119*** (3.174)
INVENTORY 0.140*** (3.549)
0.173*** (2.715)
0.119*** (2.958)
0.112*** (4.726)
0.109*** (3.230)
0.074** (2.224)
0.095*** (3.120)
0.133** (2.449)
0.081*** (3.066)
0.044 (3.383)
0.038** (2.394)
0.021 (0.816)
TURNOVER 0.012 (1.478)
-0.002 (-0.239)
-0.000 (-0.021)
0.014** (2.404)
0.036*** (3.543)
0.056*** (5.229)
0.002 (0.400)
0.001 (0.081)
0.002 (0.349)
0.006 (1.624)
0.010** (1.938)
0.027*** (3.424)
K/L 0.026*** (5.229)
0.031*** (4.384)
0.018*** (2.782)
0.019*** (4.760)
0.017*** (3.214)
0.018*** (3.218)
0.014*** (3.159)
0.026*** (4.291)
0.013*** (2.604)
0.004 (1.604)
0.002 (0.596)
0.003 (0.934)
FDI -0.016 (-1.082)
-0.033 (-1.364)
-0.026* (-1.677)
-0.004 (-0.416)
0.004 (0.245)
0.014 (0.622)
-0.009 (-0.675)
-0.041* (-1.671)
-0.014 (-0.953)
-0.000 (-0.012)
0.000 (0.028)
0.036 (1.288)
(Pseudo) R2 0.2432 0.2127 0.0980 0.1051 0.1373 0.2442 0.3450 0.3152 0.1261 0.0871 0.1627 0.2523 Shapiro-Francia test 7.916 7.908 Notes: t-values in parenthesis. Based on t-values, *, ** and *** mean that coefficients are statistically significant at 10%, 5% and 1% significance level, respectively.
20
Table 4: Quantile Regression Estimates of firms’ performance operating in Greece Dependent variable: GROA Sample: 2651 firms
Dependent variable: NROA Sample: 2561 firms
Quantile Regression Estimates Quantile Regression Estimates
Variables OLS
Estimates 0.10 0.25 0.50 0.75 0.90
OLS Estimates 0.10 0.25 0.50 0.75 0.90
Constant 0.254*** (3.570)
0.106** (2.051)
0.191*** (4.776)
0.207*** (5.004)
0.224*** (4.530)
0.309*** (3.753)
0.224*** (2.926)
0.086** (2.079)
0.059*** (3.053)
0.066*** (2.957)
0.109*** (3.617)
0.162 (3.958)
GROWTH 0.077*** (6.393)
0.017* (1.878)
0.041*** (3.917)
0.060*** (5.934)
0.074*** (6.941)
0.083*** (4.264)
0.022** (2.897)
-0.012 (-1.159)
0.005 (1.209)
0.014** (2.432)
0.032*** (3.825)
0.049*** (3.690)
R&D 5.437*** (3.700)
2.488 (1.566)
3.598*** (2.698)
5.037*** (3.433)
3.654** (2.151)
3.041 (1.210)
3.460*** (3.605)
2.060 (1.208)
0.826 (1.454)
1.009 (1.429)
4.415*** (3.304)
5.691*** (2.786)
CR4 0.047** (2.438)
0.002 (0.111)
0.006 (0.439)
0.036*** (2.717)
0.042*** (2.768)
0.038 (1.613)
0.016 (1.562)
-0.007 (-0.495)
0.007 (1.205)
0.023*** (3.506)
0.035*** (3.523)
0.069*** (4.318)
FSHARE 0.007 (0.315)
0.025 (1.234)
0.022 (1.116)
0.034** (2.208)
0.023 (1.332)
0.002 (0.070)
0.014 (1.110)
0.019 (1.108)
0.004 (0.510)
0.011 (1.358)
0.001 (0.057)
0.031 (1.415)
SIZE 0.008** (2.224)
0.006** (1.969)
0.006*** (2.805)
0.009*** (3.156)
0.006* (1.857)
0.010** (2.122)
0.007*** (3.665)
0.011*** (3.684)
0.006*** (4.068)
0.005*** (4.238)
0.008*** (4.094)
0.005* (1.656)
AGE 0.0001 (0.908)
0.0001 (0.436)
0.0002 (1.253)
0.0000 (0.101)
0.0000 (0.255)
0.0001 (0.562)
-0.0002** (-2.117)
-0.0003 (-1.416)
-0.0002* (-1.888)
-0.0001** (-2.431)
-0.0002** (-1.987)
-0.0002 (-1.076)
DEBT -0.039** (-2.189)
-0.036*** (-2.929)
-0.040*** (-3.450)
-0.056*** (-6.711)
-0.047*** (-3.326)
-0.033* (-1.693)
-0.131*** (-8.416)
-0.114*** (-8.930)
-0.062*** (-8.007)
-0.078*** (-11.333)
-0.096*** (-9.305)
-0.118*** (-9.645)
LIQUIDITY 0.049** (2.251)
0.043*** (2.628)
0.048*** (3.142)
0.075*** (5.081)
0.037** (2.046)
0.006 (0.229)
0.061*** (5.284)
0.046*** (3.107)
0.022*** (3.238)
0.036*** (5.207)
0.052*** (3.691)
0.052*** (3.024)
INVENTORY -0.101*** (-3.838)
0.000 (0.012)
-0.026 (-1.602)
-0.050*** (-2.856)
-0.082 (-3.595)
-0.136*** (-3.664)
-0.074*** (-5.847)
-0.027 (-1.178)
-0.017** (-1.928)
-0.030*** (-4.105)
-0.066*** (-5.221)
-0.089*** (-4.179)
TURNOVER 0.177*** (10.273)
0.067*** (8.567)
0.0997*** (12.043)
0.152*** (16.931)
0.233*** (20.204)
0.317*** (17.712)
0.007 (0.365)
0.005 (0.494)
0.017*** (5.168)
0.034*** (8.337)
0.053*** (9.045)
0.079*** (9.659)
K/L -0.079*** (-5.485)
-0.034*** (-3.432)
-0.052*** (-6.660)
-0.061*** (-7.773)
-0.062*** (-6.440)
-0.082*** (-5.070)
-0.045*** (-3.698)
-0.026*** (-3.265)
-0.017*** (-4.771)
-0.018*** (-4.491)
-0.028*** (-4.827)
-0.038*** (-4.986)
FDI 0.087*** (3.665)
0.005 (0.291)
0.019* (1.870)
0.023 (1.560)
0.063** (2.297)
0.181*** (2.750)
0.009 (0.828)
-0.036* (-1.677)
-0.008 (-0.962)
-0.001 (-0.192)
0.017 (1.325)
0.021 (0.981)
(Pseudo) R2 0.4842 0.1333 0.1820 0.2564 0.3407 0.4404 0.1632 0.0795 0.0512 0.1116 0.1846 0.2376 Shapiro-Francia test 7.109 7.174 Notes: t-values in parenthesis. Based on t-values, *, ** and *** mean that coefficients are statistically significant at 10%, 5% and 1% significance level, respectively.
21
Table 5: Tests for the stability of the regression coefficients at selected quantiles. Boostrap t-tests were obtained from 1000 draws for each quantile. Country: Portugal Dependent variable: GROA Sample: 523 firms
Dependent variable: NROA Sample: 523 firms
Equality of Quantile Regression Between: Equality of Quantile Regression Between:
Quantile Groups
0.10 0.25
0.25 0.50
0.50 0.75
0.75 0.90
0.10 0.25
0.25 0.50
0.50 0.75
0.75 0.90
Variables GROWTH -2.267♦ -0.565 -0.597 0.563 -0.586 -1.224 -0.110 1.105 R&D -0.781 -0.101 -0.015 0.829 -0.944 -0.480 0.623 0.164 CR4 -0.474 1.932♦ -0.260 -0.084 0.533 -0.055 -0.530 0.332 FSHARE 1.116 -0.431 0.125 0.722 0.815 0.525 -0.400 1.361 SIZE -0.532 -1.183 0.942 -0.379 -1.248 -0.710 -1.127 -0.355 AGE 1.505 0.095 -0.038 0.918 1.421 0.477 0.476 0.992 DEBT 2.491♦ 0.817 0.634 1.043 2.368♦ 3.463♦ -0.781 0.344 LIQUIDITY -1.173 -1.265 1.124 0.588 -1.383 -3.065♦ 0.753 0.317 INVENTORY -1.106 -0.233 -0.133 -0.976 -1.121 -1.755♦ -0.395 -0.786 TURNOVER 0.284 2.583♦ 2.668♦ 1.982♦ 0.140 0.921 1.017 2.507♦ K/L -2.116♦ 0.361 -0.436 0.133 -2.295♦ -2.347♦ -1.024 0.490 FDI 0.369 1.620 0.610 0.500 1.302 1.085 -0.040 1.614 Legend: ♦ indicates a p-value ≤ 0.10.
22
Table 6: Tests for the stability of the regression coefficients at selected quantiles. Boostrap t-tests were obtained from 1000 draws for each quantile. Country: Greece Dependent variable: GROA Sample: 2651 firms
Dependent variable: NROA Sample: 2651 firms
Equality of Quantile Regression Between: Equality of Quantile Regression Between:
Quantile Groups
0.10 0.25
0.25 0.50
0.50 0.75
0.75 0.90
0.10 0.25
0.25 0.50
0.50 0.75
0.75 0.90
Variables GROWTH 2.297♦ 1.967♦ 1.375 0.575 2.029♦ 1.769♦ 2.430♦ 1.503 R&D 0.761 1.042 -0.841 -0.286 -0.889 0.297 3.108♦ 0.711 CR4 0.286 2.166♦ 0.409 0.862 1.249 2.516♦ 1.538 2.384♦ FSHARE -0.184 0.714 -0.595 0.477 -1.016 0.958 -0.940 1.582 SIZE -0.043 1.089 -0.870 0.909 -1.854♦ -0.830 1.574 -0.763 AGE 0.767 -1.293 0.147 0.464 0.816 -0.116 -1.023 0.403 DEBT -0.376 -1.617 0.724 0.771 5.044♦ -2.534♦ -2.358♦ -2.379♦ LIQUIDITY 0.293 2.011♦ -2.384♦ -1.428 -1.940♦ 2.306♦ 1.340 -0.013 INVENTORY -1.438 -1.445 -1.573 -1.771♦ 0.511 -1.639♦ -3.483♦ -1.365 TURNOVER 4.537♦ 7.003♦ 8.906♦ 4.682♦ 1.519 5.636♦ 4.190♦ 3.848♦ K/L -2.167♦ -1.296 -0.076 -1.392 1.296 -0.224 -2.014♦ -1.536 FDI 1.053 0.311 1.790♦ 2.0 76♦ 1.604 0.823 1.685♦ 0.224 Legend: ♦ indicates a p-value ≤ 0.10.

Working Papers - NIMA series
No.
1. Lıgia Pinto , Glenn Harrison, Multilateral negotiations over climatechange policy, May 2000
2. Paulo Guimaraes, Douglas Woodward, Octavio Figueiredo, A tractableapproach to the firm location decision problem, May 2000
3. Miguel Portela , Measuring skill: a multi-dimensional index, September2000
4. Rosa Branca Esteves , Paulo Guimaraes, Price discrimination and tar-geted advertising: a welfare analysis, November 2000
5. Anabela Botelho , Lıgia Pinto , Has Portugal gone wireless? Lookingback, looking ahead, December 2000
6. Pedro Barros, Clara Dismuke , Hospital production in a national healthservice: the physician’s dilemma, December 2000
7. Anabela Botelho , Mark A. Hirsch, Elisabet E. Rutstrom, Culture,nationality and demographics in ultimatum games, December 2000
8. Miguel Portela , The impact of segregation on wage inequality: a lookat recruitment and pay policies at the firm level, January 2001
9. Pedro Portugal, Ana Rute Cardoso, Disentangling the minimum wagepuzzle: an analysis of job accessions and separations from a longitudinalmatched employer-employee data set, April 2001
10. Ana Rute Cardoso, Priscila Ferreira , The dynamics of job creation anddestruction for University graduates: why a rising unemployment ratecan be misleading, May 2001
11. Octavio Figueiredo, Paulo Guimaraes, Douglas Woodward, Asymmet-ric information and location, July 2001
12. Anabela Botelho , Lıgia Pinto , Hypothetical, real, and predicted realwillingness to pay in open-ended surveys: experimental results, Septem-ber 2001
13. Anabela Botelho , Lıgia Pinto , Miguel Portela , Antonio Silva, Thedeterminants of success in university entrance, September 2001

14. Anabela Botelho , Strategic behavior at trial. The production, report-ing, and evaluation of complex evidence, September 2001
15. Paulo Guimaraes, The state of Portuguese research in economics: ananalysis based on publications in international journals, September 2001
16. Anabela Botelho , Glenn Harrison, Marc Hirsch, Elisabet E. Rutstrom,Bargaining behavior, demographics and nationality: a reconsiderationof the experimental evidence, December 2001
17. Joao Cerejeira da Silva , Identification of the Portuguese industrialdistricts, February 2002
18. Octavio Figueiredo, Paulo Guimaraes, Douglas Woodward, Modelingindustrial location decisions in U.S. Counties, April 2002
19. Aslan Zorlu , Joop Hartog, The effect of immigration on wages in threeEuropean countries, October 2002
20. Elvira Lima , David K. Whynes, Finance and performance of Por-tuguese hospitals, February 2003
21. Aslan Zorlu , Do ethnicity and sex matter in pay? Analyses of 8 ethnicgroups in the Dutch labour market, June 2003
22. Cecile Wetzels , Aslan Zorlu , Wage effects of motherhood: a doubleselection approach, June 2003
23. Natalia Barbosa , What drives new firms into an industry? An inte-grative model of entry, October 2003
24. Elvira Lima , Teresa Josefina Lopes Esquerdo , The economic costs ofalcohol misuse in Portugal, October 2003
25. Anabela Botelho , Lıgia Pinto , Isabel Rodrigues , How to comply withenvironmental regulations?The role of information, October 2003
26. Natalia Barbosa , Helen Louri, Corporate performance: does ownershipmatter? A comparison of foreign - and domestic - owned firms inGreece and Portugal, October 2003
27. Anabela Botelho , Lıgia Pinto , Students’ expectations of the economicreturns to college education. Results of controlled experiment, Decem-ber 2003

28. Paula Veiga , Income-related health inequality in Portugal, July 2005
29. Anabela Botelho , Glenn Harrison, Lıgia Pinto , Elisabet E. Rutstrom,Testing static game theory with dynamic experiments: a case study ofpublic goods, November 2005
30. Anabela Botelho , Glenn Harrison, Lıgia Pinto , Elisabet E. Rutstrom,Social norms and social choice, November 2005
31. Anabela Botelho , Glenn Harrison, Lıgia Pinto , Elisabet E. Rutstrom,Paula Veiga , Discounting in developing countries: a pilot experimentin Timor-Leste, November 2005
32. Paula Veiga , Ronald P. Wilder , Maternal smoking during pregnancyand birthweight - A propensity score matching approach, January 2006
The Working Papers of the Applied Microeconomics Research Unit (NIMA)can be downloaded in PDF format from http://nima.eeg.uminho.pt
Copyright © 2022 FDOKUMEN