Corporate Governance, Takeovers, and Top-Management Compensation: Theory and Evidence
17
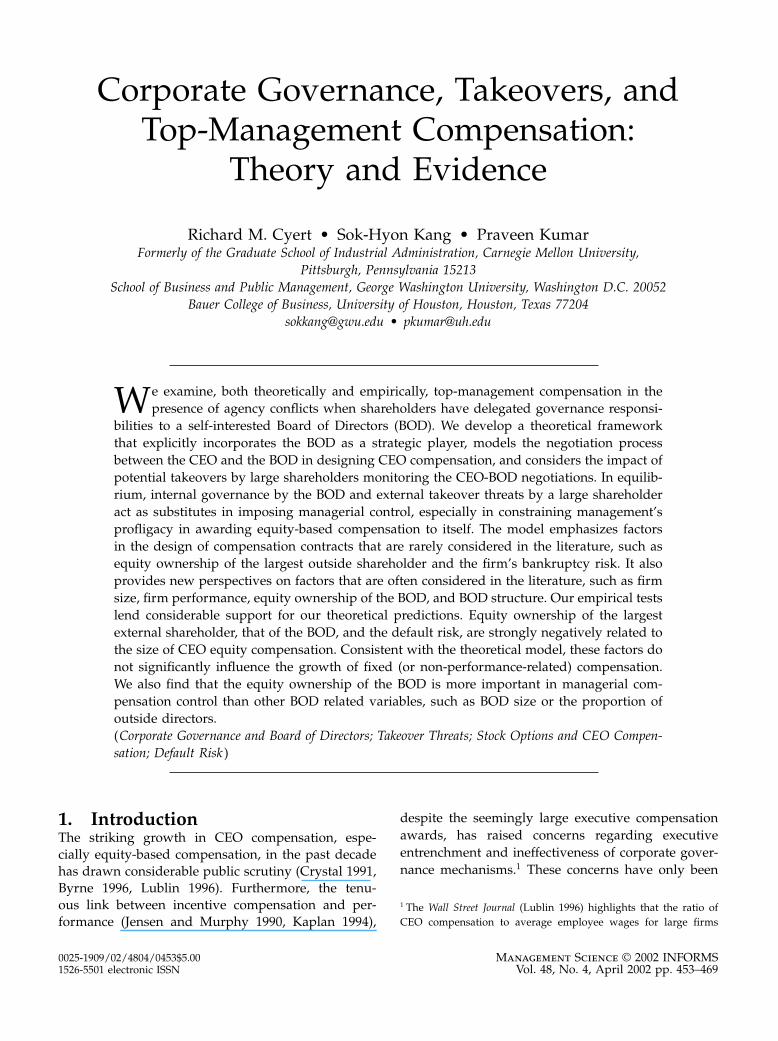
Corporate Governance, Takeovers, and Top-Management Compensation: Theory and Evidence Richard M. Cyert • Sok-Hyon Kang • Praveen Kumar Formerly of the Graduate School of Industrial Administration, Carnegie Mellon University, Pittsburgh, Pennsylvania 15213 School of Business and Public Management, George Washington University, Washington D.C. 20052 Bauer College of Business, University of Houston, Houston, Texas 77204 [email protected] • [email protected] W e examine, both theoretically and empirically, top-management compensation in the presence of agency conflicts when shareholders have delegated governance responsi- bilities to a self-interested Board of Directors (BOD). We develop a theoretical framework that explicitly incorporates the BOD as a strategic player, models the negotiation process between the CEO and the BOD in designing CEO compensation, and considers the impact of potential takeovers by large shareholders monitoring the CEO-BOD negotiations. In equilib- rium, internal governance by the BOD and external takeover threats by a large shareholder act as substitutes in imposing managerial control, especially in constraining management’s profligacy in awarding equity-based compensation to itself. The model emphasizes factors in the design of compensation contracts that are rarely considered in the literature, such as equity ownership of the largest outside shareholder and the firm’s bankruptcy risk. It also provides new perspectives on factors that are often considered in the literature, such as firm size, firm performance, equity ownership of the BOD, and BOD structure. Our empirical tests lend considerable support for our theoretical predictions. Equity ownership of the largest external shareholder, that of the BOD, and the default risk, are strongly negatively related to the size of CEO equity compensation. Consistent with the theoretical model, these factors do not significantly influence the growth of fixed (or non-performance-related) compensation. We also find that the equity ownership of the BOD is more important in managerial com- pensation control than other BOD related variables, such as BOD size or the proportion of outside directors. ( Corporate Governance and Board of Directors; Takeover Threats; Stock Options and CEO Compen- sation; Default Risk ) 1. Introduction The striking growth in CEO compensation, espe- cially equity-based compensation, in the past decade has drawn considerable public scrutiny (Crystal 1991, Byrne 1996, Lublin 1996). Furthermore, the tenu- ous link between incentive compensation and per- formance (Jensen and Murphy 1990, Kaplan 1994), despite the seemingly large executive compensation awards, has raised concerns regarding executive entrenchment and ineffectiveness of corporate gover- nance mechanisms. 1 These concerns have only been 1 The Wall Street Journal (Lublin 1996) highlights that the ratio of CEO compensation to average employee wages for large firms 0025-1909/02/4804/0453$5.00 1526-5501 electronic ISSN Management Science © 2002 INFORMS Vol. 48, No. 4, April 2002 pp. 453–469
-
Upload
independent -
Category
Documents
-
view
3 -
download
0
Transcript of Corporate Governance, Takeovers, and Top-Management Compensation: Theory and Evidence
Corporate Governance, Takeovers, andTop-Management Compensation:
Theory and Evidence
Richard M. Cyert • Sok-Hyon Kang • Praveen KumarFormerly of the Graduate School of Industrial Administration, Carnegie Mellon University,
Pittsburgh, Pennsylvania 15213School of Business and Public Management, George Washington University, Washington D.C. 20052
Bauer College of Business, University of Houston, Houston, Texas [email protected] • [email protected]
We examine, both theoretically and empirically, top-management compensation in thepresence of agency conflicts when shareholders have delegated governance responsi-
bilities to a self-interested Board of Directors (BOD). We develop a theoretical frameworkthat explicitly incorporates the BOD as a strategic player, models the negotiation processbetween the CEO and the BOD in designing CEO compensation, and considers the impact ofpotential takeovers by large shareholders monitoring the CEO-BOD negotiations. In equilib-rium, internal governance by the BOD and external takeover threats by a large shareholderact as substitutes in imposing managerial control, especially in constraining management’sprofligacy in awarding equity-based compensation to itself. The model emphasizes factorsin the design of compensation contracts that are rarely considered in the literature, such asequity ownership of the largest outside shareholder and the firm’s bankruptcy risk. It alsoprovides new perspectives on factors that are often considered in the literature, such as firmsize, firm performance, equity ownership of the BOD, and BOD structure. Our empirical testslend considerable support for our theoretical predictions. Equity ownership of the largestexternal shareholder, that of the BOD, and the default risk, are strongly negatively related tothe size of CEO equity compensation. Consistent with the theoretical model, these factors donot significantly influence the growth of fixed (or non-performance-related) compensation.We also find that the equity ownership of the BOD is more important in managerial com-pensation control than other BOD related variables, such as BOD size or the proportion ofoutside directors.(Corporate Governance and Board of Directors; Takeover Threats; Stock Options and CEO Compen-sation; Default Risk )
1. IntroductionThe striking growth in CEO compensation, espe-cially equity-based compensation, in the past decadehas drawn considerable public scrutiny (Crystal 1991,Byrne 1996, Lublin 1996). Furthermore, the tenu-ous link between incentive compensation and per-formance (Jensen and Murphy 1990, Kaplan 1994),
despite the seemingly large executive compensationawards, has raised concerns regarding executiveentrenchment and ineffectiveness of corporate gover-nance mechanisms.1 These concerns have only been
1 The Wall Street Journal (Lublin 1996) highlights that the ratio ofCEO compensation to average employee wages for large firms
0025-1909/02/4804/0453$5.001526-5501 electronic ISSN
Management Science © 2002 INFORMSVol. 48, No. 4, April 2002 pp. 453–469
CYERT, KANG, AND KUMARCorporate Governance and Top-Management Compensation
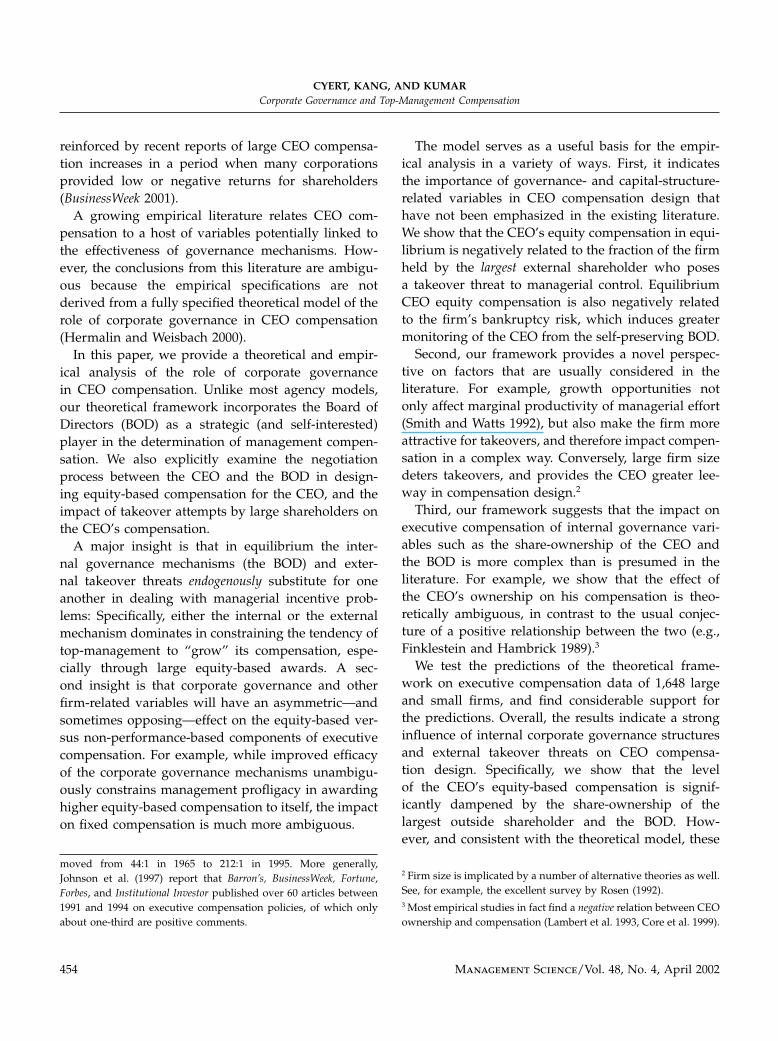
reinforced by recent reports of large CEO compensa-tion increases in a period when many corporationsprovided low or negative returns for shareholders(BusinessWeek 2001).A growing empirical literature relates CEO com-
pensation to a host of variables potentially linked tothe effectiveness of governance mechanisms. How-ever, the conclusions from this literature are ambigu-ous because the empirical specifications are notderived from a fully specified theoretical model of therole of corporate governance in CEO compensation(Hermalin and Weisbach 2000).In this paper, we provide a theoretical and empir-
ical analysis of the role of corporate governancein CEO compensation. Unlike most agency models,our theoretical framework incorporates the Board ofDirectors (BOD) as a strategic (and self-interested)player in the determination of management compen-sation. We also explicitly examine the negotiationprocess between the CEO and the BOD in design-ing equity-based compensation for the CEO, and theimpact of takeover attempts by large shareholders onthe CEO’s compensation.A major insight is that in equilibrium the inter-
nal governance mechanisms (the BOD) and exter-nal takeover threats endogenously substitute for oneanother in dealing with managerial incentive prob-lems: Specifically, either the internal or the externalmechanism dominates in constraining the tendency oftop-management to “grow” its compensation, espe-cially through large equity-based awards. A sec-ond insight is that corporate governance and otherfirm-related variables will have an asymmetric—andsometimes opposing—effect on the equity-based ver-sus non-performance-based components of executivecompensation. For example, while improved efficacyof the corporate governance mechanisms unambigu-ously constrains management profligacy in awardinghigher equity-based compensation to itself, the impacton fixed compensation is much more ambiguous.
moved from 44:1 in 1965 to 212:1 in 1995. More generally,Johnson et al. (1997) report that Barron’s, BusinessWeek, Fortune,Forbes, and Institutional Investor published over 60 articles between1991 and 1994 on executive compensation policies, of which onlyabout one-third are positive comments.
The model serves as a useful basis for the empir-ical analysis in a variety of ways. First, it indicatesthe importance of governance- and capital-structure-related variables in CEO compensation design thathave not been emphasized in the existing literature.We show that the CEO’s equity compensation in equi-librium is negatively related to the fraction of the firmheld by the largest external shareholder who posesa takeover threat to managerial control. EquilibriumCEO equity compensation is also negatively relatedto the firm’s bankruptcy risk, which induces greatermonitoring of the CEO from the self-preserving BOD.Second, our framework provides a novel perspec-
tive on factors that are usually considered in theliterature. For example, growth opportunities notonly affect marginal productivity of managerial effort(Smith and Watts 1992), but also make the firm moreattractive for takeovers, and therefore impact compen-sation in a complex way. Conversely, large firm sizedeters takeovers, and provides the CEO greater lee-way in compensation design.2
Third, our framework suggests that the impact onexecutive compensation of internal governance vari-ables such as the share-ownership of the CEO andthe BOD is more complex than is presumed in theliterature. For example, we show that the effect ofthe CEO’s ownership on his compensation is theo-retically ambiguous, in contrast to the usual conjec-ture of a positive relationship between the two (e.g.,Finklestein and Hambrick 1989).3
We test the predictions of the theoretical frame-work on executive compensation data of 1,648 largeand small firms, and find considerable support forthe predictions. Overall, the results indicate a stronginfluence of internal corporate governance structuresand external takeover threats on CEO compensa-tion design. Specifically, we show that the levelof the CEO’s equity-based compensation is signif-icantly dampened by the share-ownership of thelargest outside shareholder and the BOD. How-ever, and consistent with the theoretical model, these
2 Firm size is implicated by a number of alternative theories as well.See, for example, the excellent survey by Rosen (1992).3 Most empirical studies in fact find a negative relation between CEOownership and compensation (Lambert et al. 1993, Core et al. 1999).
454 Management Science/Vol. 48, No. 4, April 2002
CYERT, KANG, AND KUMARCorporate Governance and Top-Management Compensation
internal governance-related and external takeover-related variables do not significantly influence theCEO’s fixed salary. Furthermore, we find a strongnegative association between default risk and CEOcompensation—a result that has not been docu-mented before—but that is predicted by the theoreti-cal framework.The prominent role of the largest shareholder’s
ownership in CEO compensation contract designobtains, even after controlling for size, other indica-tors of CEO power (such as the CEO’s share owner-ship, BOD structure, and CEO tenure) and industryeffects. We also note that while the empirical literatureincludes (equity) blockholders as part of a long list ofvariables that potentially impact CEO compensation,our theoretical and empirical analysis confirms thatthe largest shareholder plays the pivotal role. Thus,there is compelling evidence that external takeoverthreats play a major role in executive compensationdesign, and this may help explain recent empiricalfindings by Bertrand and Mullainathan (1999), thatcompensation levels increase following the passage ofantitakeover legislation.The strong negative relation of BOD ownership
to CEO equity-based compensation is also appeal-ing, since the BOD is given the primary discretion ofsetting top-management compensation. Prior studiespredict a similar relationship, but find no such asso-ciation between board ownership and CEO pay (e.g.,Lambert et al. 1993, Core et al. 1999). Furthermore, byexamining BOD-related variables in conjunction withownership- and takeover-related variables, our anal-ysis sheds new light on the role of board structure onCEO compensation. For example, the significance ofboard size reported in the literature appears to be anindirect manifestation of the strong relation betweencompensation and firm size, and is in any case dom-inated by the role of director ownership.The structure of the paper is as follows. Section 2
describes the model, characterizes equilibrium com-pensation, and performs comparative statics analy-sis to derive refutable predictions for the empiricaltests. Section 3 sets out the empirical test design anddescribes the data. Section 4 performs the empiricalanalysis, and §5 concludes.
2. The Basic Model2.1. Timing ConventionsThere are two time periods in the model. In thebeginning of Period 1, the firm has profits (its onlyassets) of �, and outstanding senior debt of D thatbecomes due in Period 2. The firm is widely held,with N shares initially outstanding. It is controlledby a risk-averse CEO, M, who holds a fraction �M
of the firm’s shares. There is risk-neutral representa-tive director, J, who may also own a fraction �J ofthe firm’s shares. The largest outside shareholder is arisk-neutral investor L, who holds a fraction �L < 05of the firm’s shares. The remaining fraction 1− �L+�J +�M� of the firm is held by atomistic risk-neutralshareholders. The variables � ≡ � D N �M �J �L�
are publicly observable.Under M’s management, an investment in Period 1
of I1 yields (dollar) profits X2I1� in Period 2, where,X2I1� = ZI1+ �2 if I1 ≤�I , and is equal to Z�I +Y I1−�I�+ �2, else. Here, Z > 1, Y < 1, and �I is a given posi-tive constant. �2 is a profit shock that is realized afterinvestment is made, such that E�2�= 0. It is assumedthat the firm (initially) cannot exploit this invest-ment opportunity without M. Following the realiza-tion of X2, the firm is liquidated, with the sharehold-ers receiving the residual profits after the payment ofD and any (junior) debt B1 issued to a risk-neutralbond market in Period 1. For simplicity, the interestrate is normalized to be zero. It will be assumed thatZ > �1+ D−��/�I�, so that the first-best investmentis �I .M’s objectives are different from maximizing V1,
however. Apart from being risk averse, M alsoenjoys private benefits from the firm’s investments:In Period 1, M maximizes a utility function UM =E�uwM
2 ��+�I1, where wM2 is M’s (possibly risky) mon-
etary wealth in Period 2, and �> 0 is a given constant.It is convenient to normalize u0�= 0, and assume thatM’s reservation utility in Period 1 is ��I . Ex-ante share-holder value is then maximized by investing I∗1 =�Ifinanced through a borrowing of B∗
1 =max�0 �I −��,and paying zero salary to M.We will assume that the investment level chosen by
M is nonverifiable. Also, M’s borrowings in Period 1(through the issue of junior debt) cannot be ex-ante
Management Science/Vol. 48, No. 4, April 2002 455
CYERT, KANG, AND KUMARCorporate Governance and Top-Management Compensation
restricted by the outside shareholders either directlyor indirectly by tying M’s compensation to the newborrowing.4 Under these assumptions, the first-bestarrangement is not self-enforceable. In case of a zerosalary, with a risk-neutral bond market and zerointerest rate, the manager will issue junior debt ofthe amount Bmax1 = �Z−Y ��I +Y�−D�/1−Y � (sinceany further junior debt is nonrepayable in expecta-tion), and his optimal investment will be equal toImax1 = Bmax1 for the manager.However, we allow incentive provision through the
award of equity-based compensation to the CEO.5 Atypical compensation for M will be represented bythe pair C1 ≡ A1 n1�, where A1 is a fixed cash com-pensation paid to the manager in Period 1, and n1 isthe number of newly issued shares provided to him.We explicitly model the corporate governance pro-cess that results in the determination of C1. Consistentwith practice, the BOD proposes top-managementcompensation for shareholder approval, after consul-tations with the CEO.The corporate governance literature strongly sug-
gests in fact that the CEO is very influential withthe BOD in setting top-management compensationlevels (Mace 1986, Patton and Baker 1987, Crystal1991). Therefore, M initially suggests a compensationC1 to J. If J accepts, then C1 is made public knowl-edge. Individual shareholders can either (implicitly)accept C1 or disapprove by taking control of the firmand renegotiating with M (see below). As pointed outby Black (1998), there is little evidence that CEO com-pensation arrangements can be overturned by share-holders through alternative means, such as proxyvotes. Meanwhile, if J rejects M’s proposed C1, then
4 We do not generally observe shareholder contracts with man-agers that restrict borrowing directly or indirectly. There are atleast two reasons for this. First, if all contingencies can not beex-ante spelled out (which is the plausible assumption), then suchrestrictions can inappropriately take away managerial discretion.Second, such restrictions introduce another moral hazard problemsince management can attempt to evade financial leverage limits byincreasing the firm’s operational leverage (for example, by aggres-sively courting credit from suppliers).5 Note that nonlinear contracting will not eliminate the agencyproblem: M’s optimal investment always exceeds the efficientinvestment level �I with any sharing rule (for M).
either the impasse is resolved through a change ofownership by a takeover, or the firm is liquidatedwith the shareholders receiving S1 ≡max�0 � −D�6J receives a personal benefit of K+ in Period 2 ifthe firm does not default, but suffers a loss of K−
if the firm defaults.7 Finally, J’s opportunity costsof performing his corporate governance function areassumed to be zero.Formally, let OJ
1 ∈ �CJ1 � denote the outcome in
the negotiation game between J and M, where CJ1 =
AJ1 n
J1� is the mutually agreed upon compensation,
and represents the alternative event. When OJ1
becomes known, L can either (implicitly) accept thecompensation arrangement or attempt to overturn itby gaining control of the firm by making a cash ten-der offer for a proportion �LT −�L of the firm’s shares(where �LT ≥ 05). In the event of a successful tenderoffer, L displaces J. There are fixed costs of ' of mak-ing the offer (Shleifer and Vishny 1986).Majority ownership allows L to change the sta-
tus quo compensation policy, if CJ1 provides exces-
sively large rents to M, for example. But, follow-ing the takeover, L can even attempt to replace therent-seeking M by an equivalently skilled manage-ment that imposes lower agency costs on the firm. Weassume that with probability 0< ( < 1, L can success-fully replace M and implement the first-best arrange-ment. With the probability 1−(�, M continues man-aging the firm, and his compensation is determined
6 Here, M receives zero compensation in liquidation, since this isM’s compensation in the absence of quasi monopoly rents fromoperating the firm. Also, liquidation is a threat-point in the nego-tiation game that is triggered when there is an impasse betweenM and J, and no shareholder is willing to takeover the control ofthe firm. Thus, liquidation serves as a useful “off-equilibrium-path”threat to restrict the equilibrium behavior of M, J, and L. From anempirical standpoint, corporate governance and survival outcomesare extremely uncertain in such situations. However, there is evi-dence that such situations often end in liquidations or bust-ups,especially following takeovers by large shareholders (Berger andOfek 1996).7 This formulation parsimoniously captures two realistic featuresof serving on the BOD: (1) a major benefit of directorships of sol-vent firms is the “prestige” or “self-esteem” derived from service,and the increased likelihood of service on other boards (Aghionand Bolton 1992, Shivdasani and Yermack 1998), and (2) there isa nontrivial threat of personal liability lawsuits being brought byshareholders in the event of a default.
456 Management Science/Vol. 48, No. 4, April 2002
CYERT, KANG, AND KUMARCorporate Governance and Top-Management Compensation
as an outcome of a negotiation game with L. Thisgame is assumed to be set up similar to that betweenJ and M.The post-takeover game set-up follows a large liter-
ature that emphasizes, both theoretically and empir-ically, the management disciplining role of takeovers(e.g., Long and Walkling 1984, Jensen and Ruback1983, Jensen 1986, 1993). Large shareholders have thegreatest incentive to reduce managerial agency coststhrough changes in incentive compensation arrange-ments, and even outright replacement of rent-seekingmanagers, since they gain the most from such valueimprovements.Following the outcome of the takeover game, if
the firm is still operational, �2 is realized. This deter-mines X2, and the liquidating cash assets of the firmare X2+�+B1− I1−A1�. The firm is then liquidatedaccording to the terms specified above.
2.2. Equilibrium Compensation andComparative Statics
We denote M’s optimal investment for a givenC1 �� by I1C1 ��. Consider the compensation nego-tiations between L and M, conditional on L gain-ing control, with some ownership fraction, �TL ≥05. If M is not replaced, then M suggests someC1 to L, whose expected payoffs as a functionof C1 are, ULC1 �
LT �� = �LTN/N + n1��V1C1 ��
(where V1C1 �� is the expected shareholder liquida-tion value for a given C1 ��). Let UMC1 �� denoteM’s expected utility. Any equilibrium compensationCL1 = AL
1 nL1� then maximizes UMC1 �� subject to
the constraints that (i) ULC1 �LT �� ≥ �LTS1 and (ii)
UMCL1 ��≥ u�MS1�.
It is straightforwardly shown that any CL1 will
generically have equity-based compensation; i.e., nL1 >0, as long as the exogenous parameters S1 and E��2 ��2 ≥ 0� ≡ E+��2� are such that S1 �= E+��2�. The rea-son is that if nL1 = 0, then M chooses the maximumfeasible investment by utilizing the firm’s borrow-ing capacity completely. In this situation, V1 = E+��2�,which cannot generically be an equilibrium: It willeither be in L’s best interest to reject M’s proposal (ifS1 > E+��2�) or be in M’s own best interest to sug-gest a compensation with a positive equity award.Finally, AL
1 > 0 if M values some minimal certain
wealth sufficiently highly at the margin, i.e., if theInada condition, limw→0 u
′w�=�, is satisfied. In thiscase, an all-equity compensation package will be pro-hibitively expensive in terms of meeting M’s reserva-tion utility for continued employment with the firm.It also turns out that M’s optimal offer does not
depend on the fraction of the firm held by L (aslong as �LT ≥ 05). Thus L’s expected payoffs inthe post-takeover (subgame) equilibrium are linearin �LT ) UL
L �LT �� = �LTV
L1 , with VL
1 ≡ (V ∗1 + 1 −
(�max�N/N +nL1��V1CL1 �� S1�, the shareholder
value of the firm following a takeover by L. Here, V ∗1
is the expected liquidating value of the firm under thefirst-best investment and borrowing levels �I B∗
1�.Meanwhile, L’s expected payoffs given some out-
come OJ1 of the negotiation game between J and M
are ULJ O
J1 ��, where UL
J = �LN/N + nJ1��V1CJ1 ��
if OJ1 = CJ
1 , and ULJ = �LS1, if O
J1 = . If UL
L exceedsULJ by a sufficient amount, then L will have incen-
tive to take control if he can purchase �LT −�L frac-tion of N from the small shareholders (where 05 ≤�LT ≤ 1−�J +�M�� at a price P for the firm such that,ULL �
LT ��−UL
J OJ1 ��− �LT −�L�P−' > 0. But, view-
ing the success of the takeover attempt as indepen-dent of his own decision, a rational small shareholderwill tender if and only if P ≥ VL
1 (Grossman and Hart1980). In equilibrium, therefore, P = VL
1 . Substitutingthis above, and using the definitions of UL
L and ULJ ,
we conclude that L will not make a bid for controlonly if �LV L
1 −ULJ −' ≤ 0.
We now analyze the negotiation game between Jand M, taking as given some 05≤�LT ≤ 1−�J+�M��.For any given C1, J’s expected payoffs are
UJ C1 �� =(�JN
N +n1
)V1C1 ��
+ 1−QC1 ���K+−QC1 ���K
−
Here, QC1 �� is the probability of default. M’s opti-mal strategy can then be derived in the followingmanner. Let, UM� and UJ � respectively denoteM and J’s expected utility (in the continuation game)if they are unable to agree on a compensation.8
8 UM� = (u�MV ∗1 �+ 1− (�max�UMCL
1 �� u�MS1��, if �LV L
1 −S1� > ', and u�MS1� else. UJ � is calculated analogously.
Management Science/Vol. 48, No. 4, April 2002 457
CYERT, KANG, AND KUMARCorporate Governance and Top-Management Compensation
Next, let, CJ1 = AJ
1 nJ1� be a solution, if it exists,
to the following optimization problem: MaximizeUMC1 ��, subject to
UJ C1 ��≥ UJ � (1)
�L[VL1 −
(N
N+n1
)V1C1 ��
]−' ≤ 0 (2)
If a solution to this constrained maximization prob-lem exists, and if UM
J ≥ UM�, then CJ1 is the
equilibrium compensation contract when the firm isoperational and there is no takeover. Analysis ofthis problem shows that the equilibrium will typ-ically involve positive equity compensation for theCEO: Under the most plausible parameterizations,either L or J will not accept the managerial invest-ment behavior that is implied by giving zero equity-based compensation to M. Moreover, the equilibriumequity-compensation will typically exceed the levelthat maximizes shareholder value. Since the J’s objec-tives deviate from those of the shareholders, andtakeovers involve deadweight costs on L, the CEO isemboldened to ask for large equity-based awards. Infact, the size of the equity-based compensation awarddepends on factors that determine J’s incentive align-ment with the shareholders, and L’s takeover incen-tives. This point is now made precise through com-parative statics.To aid readability, we report the comparative statics
separately for salary and equity compensation.9
Proposition 1. The equilibrium equity-based compen-sation nJ1 is (i) decreasing in �L, (ii) decreasing in �J ifthe default probability is not too large, (iii) increasing in', (iv) increasing in N , and (v) decreasing in the defaultprobability Q. But the relation of nJ1 to Z (the “magnitude”of the growth-opportunity), �, D, and �M is ambiguous.
Proposition 2. The relation of the equilibrium fixedsalary AJ
1 to the variables specified in Proposition 1 is gen-erally ambiguous. However, the relation of AJ
1 to these vari-ables is opposite in sign to that of nJ1 if M borrows up tothe debt capacity of the firm.
9 Proofs of these comparative statics are available from the authors.
2.3. DiscussionAn important result is that CEO equity compensa-tion will be inversely related to L’s (initial) share-holding, �L. Increasing nJ1 has two effects: There isa dilution cost on the existing shareholders, and thiscost is increasing in the (initial) stake of the share-holder, at the margin. But there may also be an off-setting incentive effect on the investment behavior ofM.10 In equilibrium, however, the former effect dom-inates at the margin, and there is an unambiguousnegative effect on nJ1 if �
L increases exogenously.The argument in the previous paragraph (also (1))
explains the positive relation of nJ1 to firm size(which is proportional to N ): A higher N reducesthe marginal dilution costs equity awards to M, and(2) applies (with the opposite sign) for the transac-tions costs in the takeover market '. By the sametoken, however, the relation of the equilibrium fixedsalary to �L is ambiguous: There is a direct neg-ative effect (on AJ
1) of increasing �L, but there isan opposing and indirect “‘wealth” effect because alower equity award increases the outside sharehold-ers’ value ceteris paribus.The relation of nJ1 to J’s initial holdings is also nega-
tive as long as the firm is not almost sure to default.11
Meanwhile, a higher default probability unambigu-ously tightens the internal governance constraint (1)and has a negative impact on nJ1The relation of equilibrium managerial compensa-
tion to (1) growth opportunities Z, (2) the (initial)profits �, and (3) debt D, is also of interest. Take the
10 M’s optimal investment I1 on the interior of �0 Imax1 � is an increas-ing function of the cash salary A1: A higher salary reduces themarginal expected utility of wealth (because of the strict concav-ity of u), and thereby reduces the expected utility cost of ineffi-cient investment for M. The relation of I1 with respect to n1 isambiguous: A higher equity award induces an incentive effect thatargues for more efficient (lower) investment, but there is also anopposing wealth effect, similar to the one that comes into playwith a higher salary. However, I1 is decreasing in n1 wheneverM’s constant relative risk aversion coefficient is less than one, i.e.,�−u′′w�w/u′w�� < 111 If the firm will almost surely default, then J’s individual rational-ity constraint (1) can be binding only if V1 (i.e., the equity valueunder the existing management) exceeds J’s reservation utility (forexample, if ' is large and S1 is low). In this case, a higher �J actuallymakes J more anxious to accept M’s proposal.
458 Management Science/Vol. 48, No. 4, April 2002
CYERT, KANG, AND KUMARCorporate Governance and Top-Management Compensation
case of a ceteris paribus increase in Z. It is easy toshow that in this case M prefers to increase his invest-ment because of an unambiguous “wealth” effect.This fact may suggest higher equity awards for incen-tive purposes. But a higher Z also makes the firmmore valuable (other things being fixed), and there-fore tightens the corporate governance constraints—arguing for lower equity awards. The net effect isambiguous, and the reasoning with respect to (initial)profits and debt is analogous. Finally, an increase in�M has conflicting effects on M’s optimal investmentsince there is an incentive effect which argues formore efficient (lower) investment and an opposingwealth effect that motivates larger (and less efficient)investment.
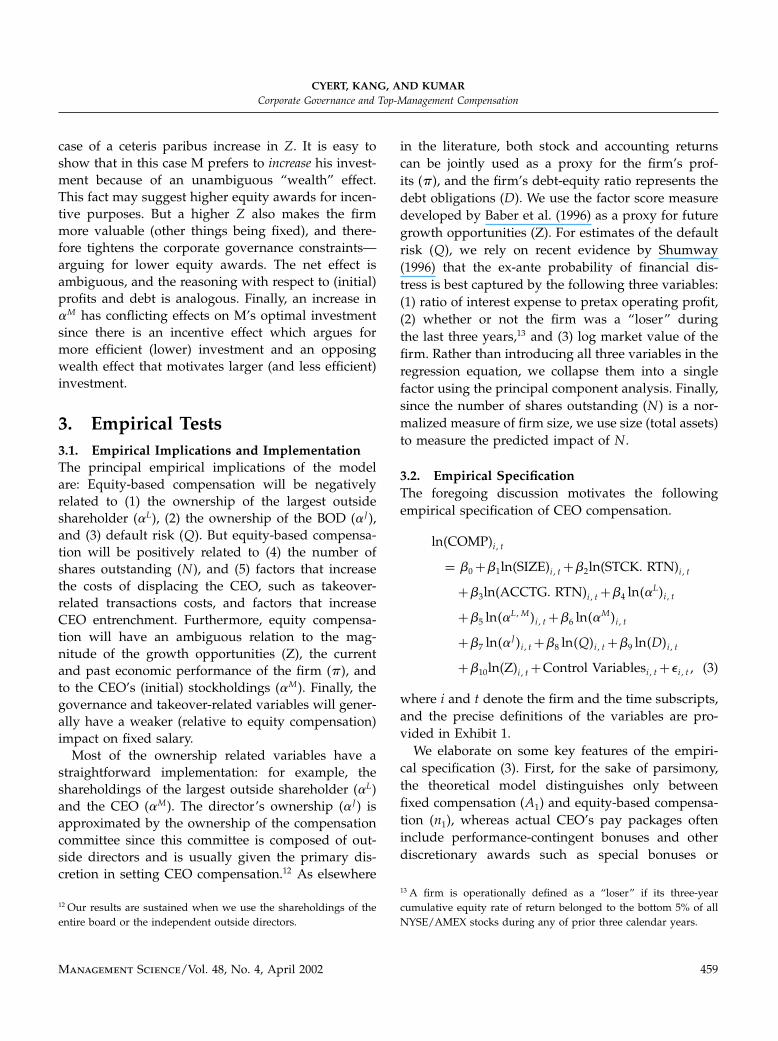
3. Empirical Tests3.1. Empirical Implications and ImplementationThe principal empirical implications of the modelare: Equity-based compensation will be negativelyrelated to (1) the ownership of the largest outsideshareholder (�L), (2) the ownership of the BOD (�J ),and (3) default risk (Q). But equity-based compensa-tion will be positively related to (4) the number ofshares outstanding (N ), and (5) factors that increasethe costs of displacing the CEO, such as takeover-related transactions costs, and factors that increaseCEO entrenchment. Furthermore, equity compensa-tion will have an ambiguous relation to the mag-nitude of the growth opportunities (Z), the currentand past economic performance of the firm (�), andto the CEO’s (initial) stockholdings (�M ). Finally, thegovernance and takeover-related variables will gener-ally have a weaker (relative to equity compensation)impact on fixed salary.Most of the ownership related variables have a
straightforward implementation: for example, theshareholdings of the largest outside shareholder (�L)and the CEO (�M ). The director’s ownership (�J ) isapproximated by the ownership of the compensationcommittee since this committee is composed of out-side directors and is usually given the primary dis-cretion in setting CEO compensation.12 As elsewhere
12 Our results are sustained when we use the shareholdings of theentire board or the independent outside directors.
in the literature, both stock and accounting returnscan be jointly used as a proxy for the firm’s prof-its (�), and the firm’s debt-equity ratio represents thedebt obligations (D). We use the factor score measuredeveloped by Baber et al. (1996) as a proxy for futuregrowth opportunities (Z). For estimates of the defaultrisk (Q), we rely on recent evidence by Shumway(1996) that the ex-ante probability of financial dis-tress is best captured by the following three variables:(1) ratio of interest expense to pretax operating profit,(2) whether or not the firm was a “loser” duringthe last three years,13 and (3) log market value of thefirm. Rather than introducing all three variables in theregression equation, we collapse them into a singlefactor using the principal component analysis. Finally,since the number of shares outstanding (N ) is a nor-malized measure of firm size, we use size (total assets)to measure the predicted impact of N .
3.2. Empirical SpecificationThe foregoing discussion motivates the followingempirical specification of CEO compensation.
ln(COMP)i t
= 10+11ln(SIZE)i t+12ln(STCK. RTN)i t+13ln(ACCTG. RTN)i t+14 ln�L�i t+15 ln�L M�i t+16 ln�M�i t+17 ln�J �i t+18 lnQ�i t+19 lnD�i t+110ln(Z)i t+Control Variablesi t+ �i t (3)
where i and t denote the firm and the time subscripts,and the precise definitions of the variables are pro-vided in Exhibit 1.We elaborate on some key features of the empiri-
cal specification (3). First, for the sake of parsimony,the theoretical model distinguishes only betweenfixed compensation (A1) and equity-based compensa-tion (n1), whereas actual CEO’s pay packages ofteninclude performance-contingent bonuses and otherdiscretionary awards such as special bonuses or
13 A firm is operationally defined as a “loser” if its three-yearcumulative equity rate of return belonged to the bottom 5% of allNYSE/AMEX stocks during any of prior three calendar years.
Management Science/Vol. 48, No. 4, April 2002 459
CYERT, KANG, AND KUMARCorporate Governance and Top-Management Compensation
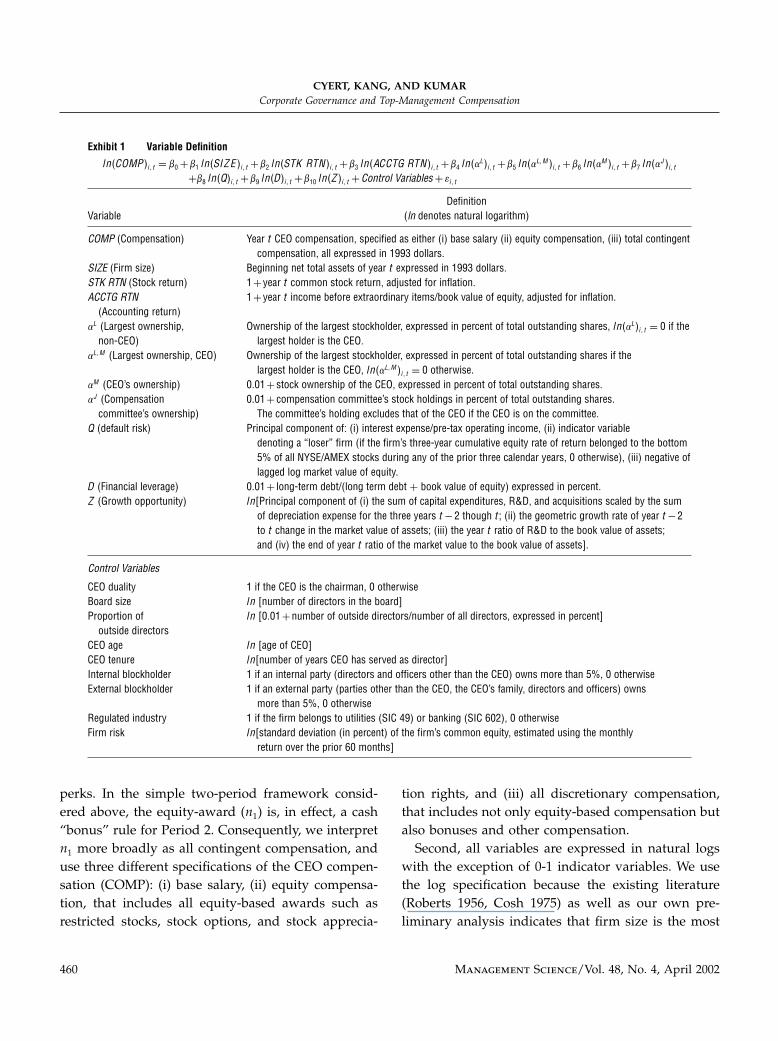
Exhibit 1 Variable Definition
ln�COMP�i t = �0+�1 ln�SIZE�i t +�2 ln�STK RTN�i t +�3 ln�ACCTG RTN�i t +�4 ln��L�i t +�5 ln��
LM�i t +�6 ln��M�i t +�7 ln��
J �i t+�8 ln�Q�i t +�9 ln�D�i t +�10 ln�Z�i t +Control Variables + �i t
DefinitionVariable (ln denotes natural logarithm)
COMP (Compensation) Year t CEO compensation, specified as either (i) base salary (ii) equity compensation, (iii) total contingentcompensation, all expressed in 1993 dollars.
SIZE (Firm size) Beginning net total assets of year t expressed in 1993 dollars.STK RTN (Stock return) 1+ year t common stock return, adjusted for inflation.ACCTG RTN 1+ year t income before extraordinary items/book value of equity, adjusted for inflation.
(Accounting return)�L (Largest ownership, Ownership of the largest stockholder, expressed in percent of total outstanding shares, ln��L�i t = 0 if thenon-CEO) largest holder is the CEO.
�LM (Largest ownership, CEO) Ownership of the largest stockholder, expressed in percent of total outstanding shares if thelargest holder is the CEO, ln��LM�i t = 0 otherwise.
�M (CEO’s ownership) 0�01+ stock ownership of the CEO, expressed in percent of total outstanding shares.�J (Compensation 0�01+ compensation committee’s stock holdings in percent of total outstanding shares.committee’s ownership) The committee’s holding excludes that of the CEO if the CEO is on the committee.
Q (default risk) Principal component of: (i) interest expense/pre-tax operating income, (ii) indicator variabledenoting a “loser” firm (if the firm’s three-year cumulative equity rate of return belonged to the bottom5% of all NYSE/AMEX stocks during any of the prior three calendar years, 0 otherwise), (iii) negative oflagged log market value of equity.
D (Financial leverage) 0�01+ long-term debt/(long term debt + book value of equity) expressed in percent.Z (Growth opportunity) ln[Principal component of (i) the sum of capital expenditures, R&D, and acquisitions scaled by the sum
of depreciation expense for the three years t−2 though t; (ii) the geometric growth rate of year t−2to t change in the market value of assets; (iii) the year t ratio of R&D to the book value of assets;and (iv) the end of year t ratio of the market value to the book value of assets].
Control Variables
CEO duality 1 if the CEO is the chairman, 0 otherwiseBoard size ln [number of directors in the board]Proportion of ln [0�01+number of outside directors/number of all directors, expressed in percent]
outside directorsCEO age ln [age of CEO]CEO tenure ln[number of years CEO has served as director]Internal blockholder 1 if an internal party (directors and officers other than the CEO) owns more than 5%, 0 otherwiseExternal blockholder 1 if an external party (parties other than the CEO, the CEO’s family, directors and officers) owns
more than 5%, 0 otherwiseRegulated industry 1 if the firm belongs to utilities (SIC 49) or banking (SIC 602), 0 otherwiseFirm risk ln[standard deviation (in percent) of the firm’s common equity, estimated using the monthly
return over the prior 60 months]
perks. In the simple two-period framework consid-ered above, the equity-award (n1) is, in effect, a cash“bonus” rule for Period 2. Consequently, we interpretn1 more broadly as all contingent compensation, anduse three different specifications of the CEO compen-sation (COMP): (i) base salary, (ii) equity compensa-tion, that includes all equity-based awards such asrestricted stocks, stock options, and stock apprecia-
tion rights, and (iii) all discretionary compensation,that includes not only equity-based compensation butalso bonuses and other compensation.Second, all variables are expressed in natural logs
with the exception of 0-1 indicator variables. We usethe log specification because the existing literature(Roberts 1956, Cosh 1975) as well as our own pre-liminary analysis indicates that firm size is the most
460 Management Science/Vol. 48, No. 4, April 2002
CYERT, KANG, AND KUMARCorporate Governance and Top-Management Compensation
influential determinant of the level of CEO compen-sation, and that this relation is best described as log-linear. As a result, the regression coefficients in (3)have an elasticity interpretation.Finally, we use Heckman’s (1979) two-step proce-
dure to estimate equations for equity compensationand all discretionary compensation. The Heckmanestimation is necessary because equity compensationis not awarded for 49.4% of the sample firm-years,and thus, direct applications of ordinary least squarescan yield biased estimates.The control variables account for the influence of
variables that are not explicitly considered in our the-oretical framework, but are often considered in theliterature. These include variables that may impactthe effectiveness of corporate governance mecha-nisms and industry- or firm-specific variables. Thegovernance-related variables are: (1) CEO Duality (i.e.,the CEO also serves as the chairperson of the BOD):Jensen (1993) and organizational theorists suggest that“CEO duality” diminishes the extent of board control(Finkelstein and Hambrick 1989). In our framework,duality also serves as proxy for high costs of displac-ing the CEO. (2) Board Size: Lipton and Lorsch (1992)and Jensen (1993) argue that an “overcrowded” boardis less likely to function effectively and is easier forthe CEO to control.14 (3) Inside Versus Outside Direc-tors: A high proportion of outside directors is oftenconsidered to enhance the quality of corporate gov-ernance (Fama and Jensen 1983).15 As in the existingliterature, we define outside directors as those that areneither a direct family member nor a relative of theCEO, and are not a current or former employee ofthe firm. (4) Age and Tenure of the CEO: Organizationalbehavior theorists suggest that the CEO-BOD nexus
14 Recently Yermack (1996) finds related evidence that firm valueis higher if the board size is smaller, and more directly Core et al.(1999) report that CEO compensation is increasing in board size.15 The role of outside directors in firm performance has beenactively investigated, although the results appear mixed. For exam-ple, while Rosenstein and Wyatt (1990) and Brickley et al. (1994)find that firm value is related to board composition or appoint-ments of outsider directors, Hermalin and Weisbach (1991) andYermack (1996) find little evidence that firm performance is relatedto board composition.
becomes stronger with longer CEO tenure,16 result-ing in a compensation package that is more prefer-able to the CEO—relatively larger cash compensa-tion and smaller equity-based compensation. (5) OtherBlockholders: For reasons of simplicity, our theoreti-cal model assumes only one blockholder. To controlfor the effects of other blockholders, we incorporateseparate indicator variables for internal blockholders(stock holders who are current or former executiveofficers owning more than 5% of the firm) and forexternal blockholders.The industry- and firms-specific control variables
are: (1) An indicator variable for regulated industries:Kostiuk (1989) and Smith and Watts (1992) argue thatexecutives of regulated industries (such as utilitiesand banks) command lower wages because regulationrestricts the managers’ discretion, and thus reducesthe marginal product of the managerial decisionmaker. (2) Firm Risk: The standard option-theoreticargument is that that firms with greater financial riskwill tend to award more equity-based compensationsince the value of stock options is increasing in risk.More recently, Aggarwal and Samwick (1999) moti-vate the role of financial risk in executive compensa-tion from an agency-theoretic perspective.
3.3. DataExecutive compensation and ownership data are com-piled from proxy statements, obtained through a mailrequest to all U.S. public firms traded on the NYSE,AMEX, or NASDAQ National Market System, andlisted in the DISCLOSURE database and in 1993COMPUSTAT primary, secondary, tertiary, and full-coverage files (4,865 firms). Out of a total of 4,193responses to our request for proxy statements for 1992and 1993, we compile the data for 2,006 firms thatprovide proxy statements for both years. We remove358 firms for various reasons of data availability, leav-ing the final sample size at 1,648 firms.17 For ease ofexposition, we designate these firms as the “sample”
16 This is measured as the number of years he or she has served asdirector because this information is available more often than theyears served as CEO.17 The primary reason for a deletion from the sample is that theCEO did not serve the full fiscal year because of exits and entries in
Management Science/Vol. 48, No. 4, April 2002 461
CYERT, KANG, AND KUMARCorporate Governance and Top-Management Compensation
Table 1 Firm Size Distribution
Size Classified by Total Assets
Classification Based on theExistence of 5% Holder
Number ofSize Total Assets firms (percent Without 5% With 5%Divisionsa Range ($mil) of sample) Blockholders Blockholders
1 0.1 ∼18�6 95 (5.8%) 4 912 ∼33�9 132 (8.0%) 2 1303 ∼55�8 146 (8.8%) 3 1434 ∼88�9 155 (9.4%) 6 1495 ∼150�0 183 (11.1%) 9 1746 ∼268�8 168 (10.4%) 7 1617 ∼464�8 172 (10.7%) 10 1628 ∼965�7 177 (10.8%) 18 1599 ∼3013�0 214 (12.9%) 35 179
10 ∼251506�0 206 (12.5%) 52 154
Total 1,648 (100%) 146 1502
aThe size divisions are based on the 1993 distribution of 4,865 U.S. firmslisted on NYSE, ASE, and NASDAQ National Market System complied by Dis-closure Inc.
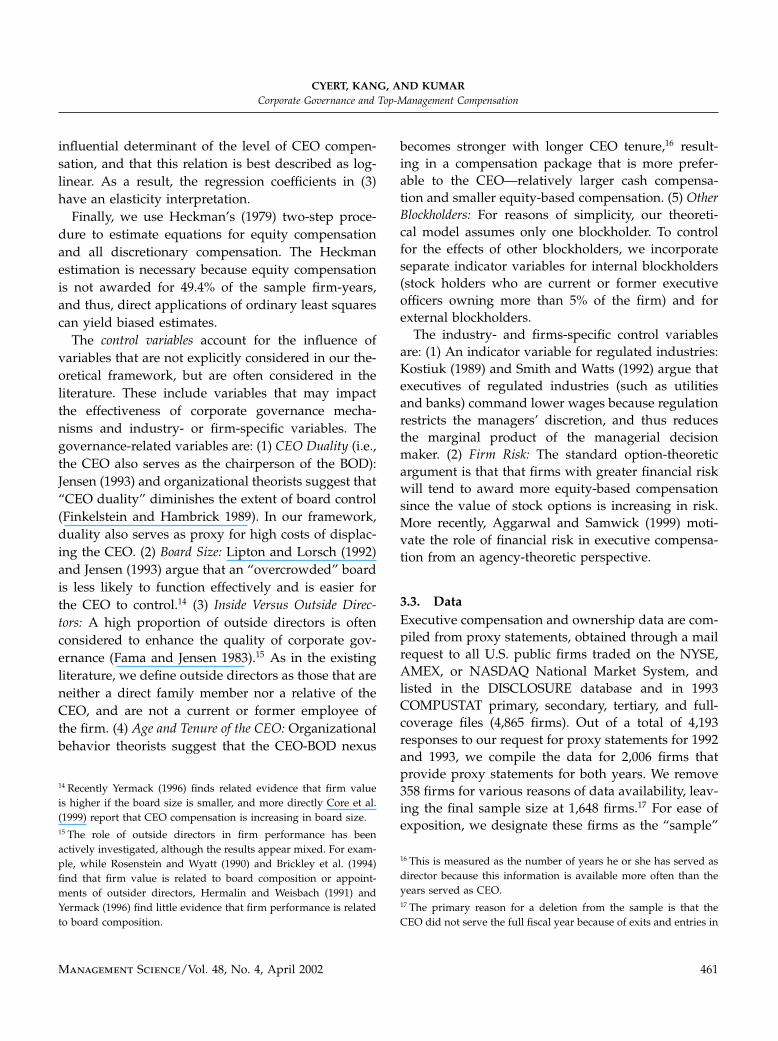
and refer to the original 4,865 firms as the “popu-lation.” The financial and stock price data are fromCOMPUSTAT primary, secondary, tertiary, and full-coverage files and the CRSP (Center for Research inSecurity Prices) files.Table 1 displays the sample profile in terms of
firm size deciles based on the book value of totalassets. Since the deciles are delineated by the distri-bution of the population, the expected distributionfor a random sample is 10% in each decile. We seethat the sample is somewhat skewed towards largefirms, but is still composed of a significant numberof small firms. The firm size ranges from $4.2 mil-lion to $184 billion in total assets, and 302 industriesare represented (based on the two-digit SIC codes).18
The last two columns classify the sample into two cat-egories based on the existence of a 5% blockholderbecause the largest shareholder cannot be identified
the middle of the fiscal year; the second reason is missing financialinformation such as total assets, stock price, etc.18 The sample distributions in terms of exchange listings and indus-try membership are also similar to the population distributions.
unless some party holds more than 5% of the firm.19
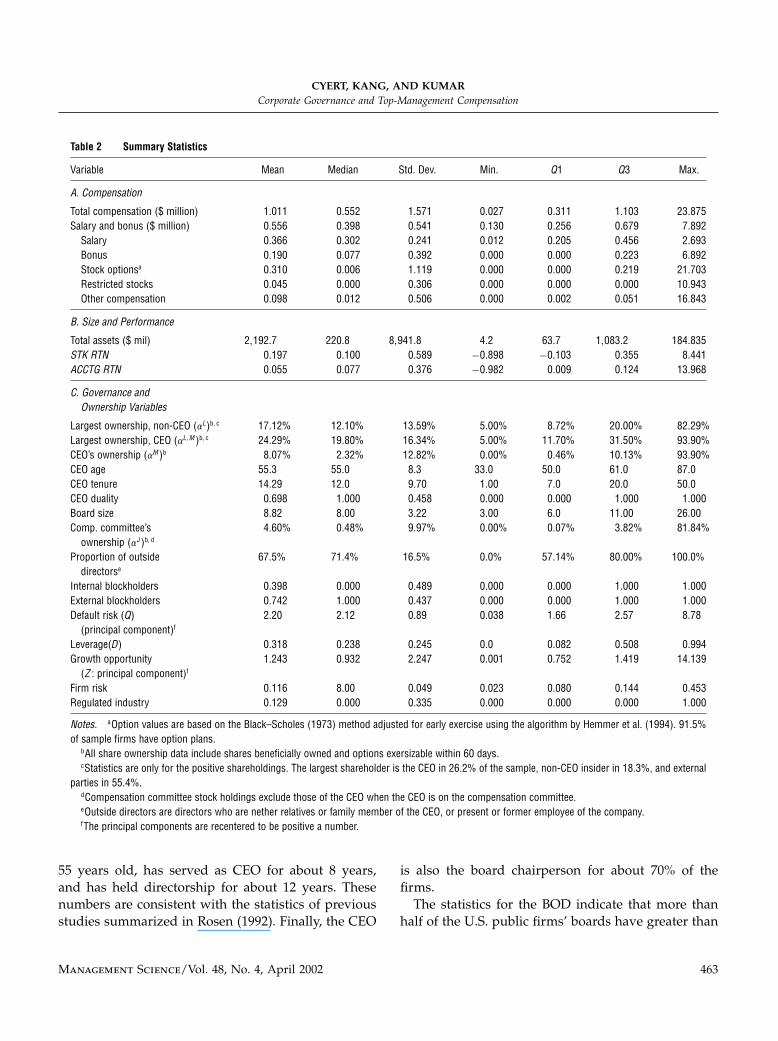
For about 8.8% of the sample (146 firms) no singleparty holds more than 5% of the firm, and not sur-prisingly, these firms tend to be large.Table 2 displays summary statistics. The first
panel gives the fiscal 1992–1993 distributions forcompensation components. Since fiscal year 1992,proxy statements contain information that permits thedecomposition of executive compensation into fivedistinctive components: salary, cash bonus, long-termincentive payout (LTIP), the value of stock optionsand restricted stock granted during the year, and“other compensation” (e.g., automobile costs).Mean base salary is $366,000, almost 36% of
mean total compensation of $1,011,000. Cash bonuses($190,000), on average, add about 52% to the basesalary. Cash bonuses are awarded by 69% of the firmsin 1992–1993, and when they are awarded, they addabout 75% to the base salary. Option values are com-puted as in Jensen and Murphy (1990)—using theBlack and Scholes (1973) approach—except that weadjust for early exercise using the algorithm recom-mended in Hemmer et al. (1994).20 The data indi-cate that the mean value of options granted ($310,000)is larger than cash bonuses, and is about 30% ofmean total compensation. And although almost allfirms (91.5%) have stock option plans, only about one-half (50.6%) granted stock options during 1992–1993.When options are granted, however, they constituteabout one-half of the total compensation.The remainder of the table shows statistics for the
governance and stock ownership data.21 As shownin Panel B, mean ownership of the largest non-CEOequity holder is about 17.2%, whereas the ownershipwhen the CEO is the largest shareholder (26.2% of thecase) is 24.3%. On average, a typical CEO beneficiallyholds about 8% of the firm’s equity, while the medianstock ownership is about 2.3%. The average CEO is
19 U.S. firms are required to report large-shareholdings only if theyexceed 5% of common shares.20 Details are available on request.21 All share ownership numbers include “beneficially” ownedshares (e.g., shares owned by kin and relatives) and options thatcan be exercised within 60 days, consistent with the treatment inmost empirical studies.
462 Management Science/Vol. 48, No. 4, April 2002
CYERT, KANG, AND KUMARCorporate Governance and Top-Management Compensation
Table 2 Summary Statistics
Variable Mean Median Std. Dev. Min. Q1 Q3 Max.
A. Compensation
Total compensation ($ million) 1�011 0�552 1�571 0�027 0�311 1�103 23�875Salary and bonus ($ million) 0�556 0�398 0�541 0�130 0�256 0�679 7�892Salary 0�366 0�302 0�241 0�012 0�205 0�456 2�693Bonus 0�190 0�077 0�392 0�000 0�000 0�223 6�892Stock optionsa 0�310 0�006 1�119 0�000 0�000 0�219 21�703Restricted stocks 0�045 0�000 0�306 0�000 0�000 0�000 10�943Other compensation 0�098 0�012 0�506 0�000 0�002 0�051 16�843
B. Size and Performance
Total assets ($ mil) 2192�7 220�8 8941�8 4�2 63�7 1083�2 184�835STK RTN 0�197 0�100 0�589 −0�898 −0�103 0�355 8�441ACCTG RTN 0�055 0�077 0�376 −0�982 0�009 0�124 13�968
C. Governance andOwnership Variables
Largest ownership, non-CEO (�L�b c 17�12% 12�10% 13�59% 5�00% 8�72% 20�00% 82�29%Largest ownership, CEO (�LM�b c 24�29% 19�80% 16�34% 5�00% 11�70% 31�50% 93�90%CEO’s ownership (�M�b 8�07% 2�32% 12�82% 0�00% 0�46% 10�13% 93�90%CEO age 55�3 55�0 8�3 33�0 50�0 61�0 87�0CEO tenure 14�29 12�0 9�70 1�00 7�0 20�0 50�0CEO duality 0�698 1�000 0�458 0�000 0�000 1�000 1�000Board size 8�82 8�00 3�22 3�00 6�0 11�00 26�00Comp. committee’s 4�60% 0�48% 9�97% 0�00% 0�07% 3�82% 81�84%ownership ��J �bd
Proportion of outside 67�5% 71�4% 16�5% 0�0% 57�14% 80�00% 100�0%directorse
Internal blockholders 0�398 0�000 0�489 0�000 0�000 1�000 1�000External blockholders 0�742 1�000 0�437 0�000 0�000 1�000 1�000Default risk (Q) 2�20 2�12 0�89 0�038 1�66 2�57 8�78(principal component)f
Leverage(D) 0�318 0�238 0�245 0�0 0�082 0�508 0�994Growth opportunity 1�243 0�932 2�247 0�001 0�752 1�419 14�139(Z : principal component)f
Firm risk 0�116 8�00 0�049 0�023 0�080 0�144 0�453Regulated industry 0�129 0�000 0�335 0�000 0�000 0�000 1�000
Notes. aOption values are based on the Black–Scholes (1973) method adjusted for early exercise using the algorithm by Hemmer et al. (1994). 91.5%of sample firms have option plans.
bAll share ownership data include shares beneficially owned and options exersizable within 60 days.cStatistics are only for the positive shareholdings. The largest shareholder is the CEO in 26.2% of the sample, non-CEO insider in 18.3%, and external
parties in 55.4%.dCompensation committee stock holdings exclude those of the CEO when the CEO is on the compensation committee.eOutside directors are directors who are nether relatives or family member of the CEO, or present or former employee of the company.fThe principal components are recentered to be positive a number.
55 years old, has served as CEO for about 8 years,and has held directorship for about 12 years. Thesenumbers are consistent with the statistics of previousstudies summarized in Rosen (1992). Finally, the CEO
is also the board chairperson for about 70% of thefirms.The statistics for the BOD indicate that more than
half of the U.S. public firms’ boards have greater than
Management Science/Vol. 48, No. 4, April 2002 463
CYERT, KANG, AND KUMARCorporate Governance and Top-Management Compensation
eight members, the upper bound recommended byLipton and Lorsch (1992) and Jensen (1993). Com-pensation committees, typically consisting of threeto four directors, have mean (median) share owner-ship of about 4.6% (0.48%).22 The middle half of thecompensation committees hold somewhere between0.07% to 3.80% of the firm. On average, about 67%of the BOD is occupied by outside directors whosemean and median shareholdings are 5.11% and 1.17%,respectively.
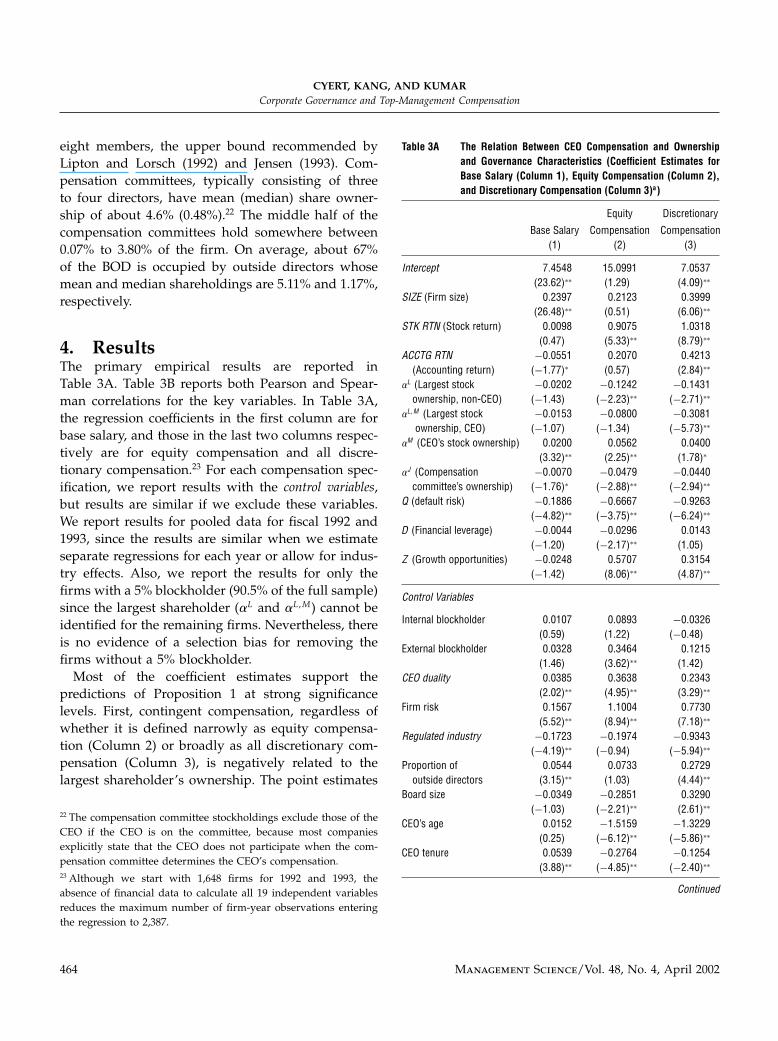
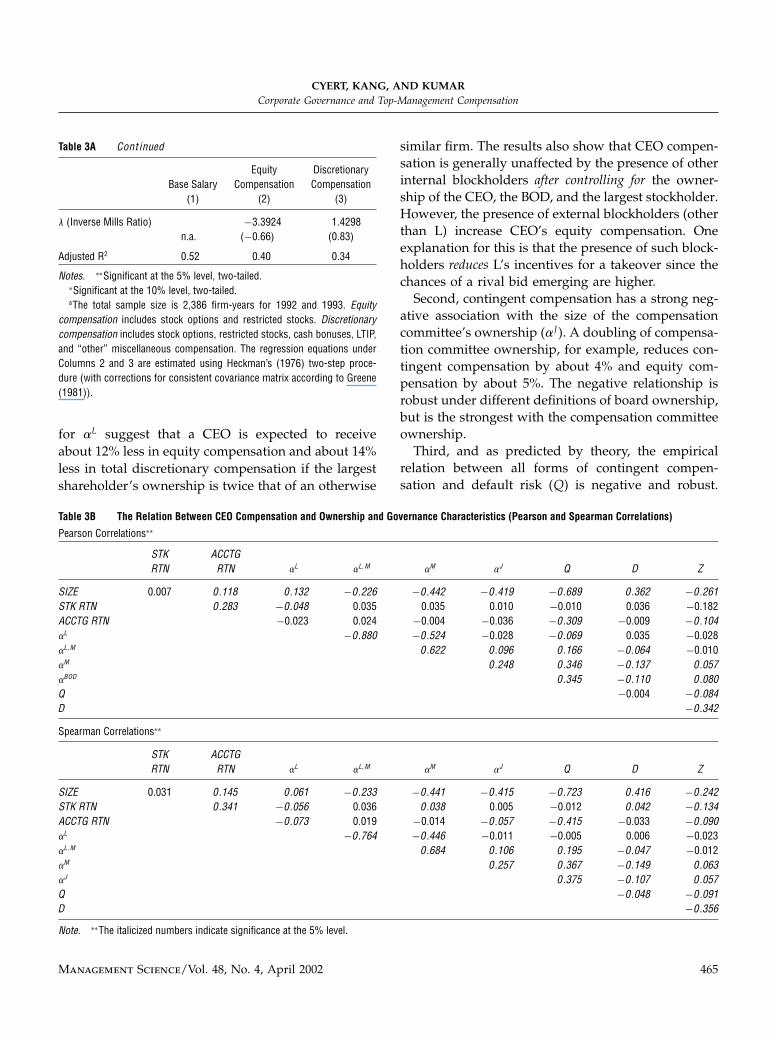
4. ResultsThe primary empirical results are reported inTable 3A. Table 3B reports both Pearson and Spear-man correlations for the key variables. In Table 3A,the regression coefficients in the first column are forbase salary, and those in the last two columns respec-tively are for equity compensation and all discre-tionary compensation.23 For each compensation spec-ification, we report results with the control variables,but results are similar if we exclude these variables.We report results for pooled data for fiscal 1992 and1993, since the results are similar when we estimateseparate regressions for each year or allow for indus-try effects. Also, we report the results for only thefirms with a 5% blockholder (90.5% of the full sample)since the largest shareholder (�L and �L M ) cannot beidentified for the remaining firms. Nevertheless, thereis no evidence of a selection bias for removing thefirms without a 5% blockholder.Most of the coefficient estimates support the
predictions of Proposition 1 at strong significancelevels. First, contingent compensation, regardless ofwhether it is defined narrowly as equity compensa-tion (Column 2) or broadly as all discretionary com-pensation (Column 3), is negatively related to thelargest shareholder’s ownership. The point estimates
22 The compensation committee stockholdings exclude those of theCEO if the CEO is on the committee, because most companiesexplicitly state that the CEO does not participate when the com-pensation committee determines the CEO’s compensation.23 Although we start with 1,648 firms for 1992 and 1993, theabsence of financial data to calculate all 19 independent variablesreduces the maximum number of firm-year observations enteringthe regression to 2,387.
Table 3A The Relation Between CEO Compensation and Ownershipand Governance Characteristics (Coefficient Estimates forBase Salary (Column 1), Equity Compensation (Column 2),and Discretionary Compensation (Column 3)a)
Equity Discretionary
Base Salary Compensation Compensation(1) (2) (3)
Intercept 7�4548 15�0991 7�0537�23�62�∗∗ �1�29� �4�09�∗∗
SIZE (Firm size) 0�2397 0�2123 0�3999�26�48�∗∗ �0�51� �6�06�∗∗
STK RTN (Stock return) 0�0098 0�9075 1�0318�0�47� �5�33�∗∗ �8�79�∗∗
ACCTG RTN −0�0551 0�2070 0�4213(Accounting return) �−1�77�∗ �0�57� �2�84�∗∗
�L (Largest stock −0�0202 −0�1242 −0�1431ownership, non-CEO) �−1�43� �−2�23�∗∗ �−2�71�∗∗
�LM (Largest stock −0�0153 −0�0800 −0�3081ownership, CEO) �−1�07� �−1�34� �−5�73�∗∗
�M (CEO’s stock ownership) 0�0200 0�0562 0�0400�3�32�∗∗ �2�25�∗∗ �1�78�∗
�J (Compensation −0�0070 −0�0479 −0�0440committee’s ownership) �−1�76�∗ �−2�88�∗∗ �−2�94�∗∗
Q (default risk) −0�1886 −0�6667 −0�9263�−4�82�∗∗ �−3�75�∗∗ �−6�24�∗∗
D (Financial leverage) −0�0044 −0�0296 0�0143�−1�20� �−2�17�∗∗ �1�05�
Z (Growth opportunities) −0�0248 0�5707 0�3154�−1�42� �8�06�∗∗ �4�87�∗∗
Control Variables
Internal blockholder 0�0107 0�0893 −0�0326�0�59� �1�22� �−0�48�
External blockholder 0�0328 0�3464 0�1215�1�46� �3�62�∗∗ �1�42�
CEO duality 0�0385 0�3638 0�2343�2�02�∗∗ �4�95�∗∗ �3�29�∗∗
Firm risk 0�1567 1�1004 0�7730�5�52�∗∗ �8�94�∗∗ �7�18�∗∗
Regulated industry −0�1723 −0�1974 −0�9343�−4�19�∗∗ �−0�94� �−5�94�∗∗
Proportion of 0�0544 0�0733 0�2729outside directors �3�15�∗∗ �1�03� �4�44�∗∗
Board size −0�0349 −0�2851 0�3290�−1�03� �−2�21�∗∗ �2�61�∗∗
CEO’s age 0�0152 −1�5159 −1�3229�0�25� �−6�12�∗∗ �−5�86�∗∗
CEO tenure 0�0539 −0�2764 −0�1254�3�88�∗∗ �−4�85�∗∗ �−2�40�∗∗
Continued
464 Management Science/Vol. 48, No. 4, April 2002
CYERT, KANG, AND KUMARCorporate Governance and Top-Management Compensation
Table 3A Continued
Equity DiscretionaryBase Salary Compensation Compensation
(1) (2) (3)
" (Inverse Mills Ratio) −3�3924 1�4298n�a� �−0�66� �0�83�
Adjusted R2 0�52 0�40 0�34
Notes. ∗∗Significant at the 5% level, two-tailed.∗Significant at the 10% level, two-tailed.aThe total sample size is 2,386 firm-years for 1992 and 1993. Equity
compensation includes stock options and restricted stocks. Discretionarycompensation includes stock options, restricted stocks, cash bonuses, LTIP,and “other” miscellaneous compensation. The regression equations underColumns 2 and 3 are estimated using Heckman’s (1976) two-step proce-dure (with corrections for consistent covariance matrix according to Greene(1981)).
for �L suggest that a CEO is expected to receiveabout 12% less in equity compensation and about 14%less in total discretionary compensation if the largestshareholder’s ownership is twice that of an otherwise
Table 3B The Relation Between CEO Compensation and Ownership and Governance Characteristics (Pearson and Spearman Correlations)
Pearson Correlations∗∗
STK ACCTGRTN RTN �L �LM �M �J Q D Z
SIZE 0�007 0 �118 0 �132 −0 �226 −0 �442 −0 �419 −0 �689 0 �362 −0 �261STK RTN 0 �283 −0 �048 0�035 0�035 0�010 −0�010 0�036 −0�182ACCTG RTN −0�023 0�024 −0�004 −0�036 −0 �309 −0�009 −0 �104�L −0 �880 −0 �524 −0�028 −0 �069 0�035 −0�028�LM 0 �622 0 �096 0 �166 −0 �064 −0�010�M 0 �248 0 �346 −0 �137 0 �057�BOD 0 �345 −0 �110 0 �080Q −0�004 −0 �084D −0 �342
Spearman Correlations∗∗
STK ACCTGRTN RTN �L �LM �M �J Q D Z
SIZE 0�031 0 �145 0 �061 −0 �233 −0 �441 −0 �415 −0 �723 0 �416 −0 �242STK RTN 0 �341 −0 �056 0�036 0 �038 0�005 −0�012 0 �042 −0 �134ACCTG RTN −0 �073 0�019 −0�014 −0 �057 −0 �415 −0�033 −0 �090�L −0 �764 −0 �446 −0�011 −0�005 0�006 −0�023�LM 0 �684 0 �106 0 �195 −0 �047 −0�012�M 0 �257 0 �367 −0 �149 0 �063�J 0 �375 −0 �107 0 �057Q −0 �048 −0 �091D −0 �356
Note. ∗∗The italicized numbers indicate significance at the 5% level.
similar firm. The results also show that CEO compen-sation is generally unaffected by the presence of otherinternal blockholders after controlling for the owner-ship of the CEO, the BOD, and the largest stockholder.However, the presence of external blockholders (otherthan L) increase CEO’s equity compensation. Oneexplanation for this is that the presence of such block-holders reduces L’s incentives for a takeover since thechances of a rival bid emerging are higher.Second, contingent compensation has a strong neg-
ative association with the size of the compensationcommittee’s ownership (�J ). A doubling of compensa-tion committee ownership, for example, reduces con-tingent compensation by about 4% and equity com-pensation by about 5%. The negative relationship isrobust under different definitions of board ownership,but is the strongest with the compensation committeeownership.Third, and as predicted by theory, the empirical
relation between all forms of contingent compen-sation and default risk (Q) is negative and robust.
Management Science/Vol. 48, No. 4, April 2002 465
CYERT, KANG, AND KUMARCorporate Governance and Top-Management Compensation
Interestingly, however, leverage has a negative rela-tion with equity compensation, but not with otherforms of contingent compensation.Fourth, consistent with existing studies, and as also
predicted by the theoretical model, contingent com-pensation is strongly positively related to firm size.We also find that CEO duality, which is also a proxyfor the costs of CEO displacement ('), is positivelyrelated with CEO-contingent compensation: a CEOchairman receives about 36% greater equity compen-sation than a nonchairman CEO.Fifth, the relation of equity and total contingent
compensation to the magnitude of the firm’s growthopportunities (Z) is strongly positive, and similarresults obtain for recent economic performance. Basedon the discussion in §2.3, these results suggest thatthe incentive motive for equity awards overrides theopposing tendency due to tighter external governanceconstraints.A basic empirical prediction of the model is that
the corporate-governance-related variables will havean asymmetric and sometimes opposing impact onequity versus fixed compensation. This predictionis supported in Table 3A and B. We find that thelargest shareholder’s ownership has no significantinfluence of base salary (independent of whether thelargest shareholder is the CEO or not). Similarly, thecompensation committee’s ownership has a relativelyinsignificant impact on the base salary. The posi-tive coefficient on CEO’s ownership suggests that theCEO’s fixed remuneration is increasing in his or herownership, controlling for the case when the CEO isthe largest shareholder.Finally, the pay-performance link between share-
holder return and discretionary compensation is size-able and significant: An increase in the firm’s equityvalue by one percent leads to a roughly equal percent-age increase in the CEO’s contingent compensation.However, it is striking that the pay-performance linkbetween shareholder return and fixed salary is notsignificantly different from zero. While the strongerpay-performance sensitivity for incentive compensa-tion is also reported in Cyert et al. (1995) and Hall andLiebman (1998), our analysis shows that this result isrobust even when controlling for internal governance-related and external takeover-related variables.
4.1. The Role of Other Governance-Related andControl Variables
The role of some of the other control variables is note-worthy. First, firm risk is strongly positively relatedto both the incentive and nonincentive compensa-tion components. The literature has been unable todocument such a robust positive relation betweenfirm risk and CEO compensation. The finding thatCEOs in regulated industries receive lower compen-sation is also consistent with the literature (Smith andWatts 1992). Furthermore, unlike the existing liter-ature, our empirical specification allows the role ofother internal governance related variables to beexamined in conjunction with the ownership- andtakeover-related variables.The positive coefficient on the proportion of out-
side directors for base salary (Column 1) and dis-cretionary compensation equation (Column 3), indi-cates that CEO cash compensation (in terms of salaryand discretionary bonuses) is higher if the board isrepresented by a greater portion of outside directors.The results also indicate prima facie that board sizeis a significant force in the determination of equityand discretionary compensation (although the direc-tion of this effect is ambiguous). The significance ofthis variable vanishes, however, when log total assets,log market value, or all three variables—log totalassets, log market value, and log revenues—are usedas regressors. This suggests that the significance of theboard size is an indirect manifestation of the strongrelation between compensation and firm size, andwhat matters in CEO compensation is directors’ stockownership rather than the mere number of directors.Finally, the coefficients on CEO tenure and age are
generally positive for base salary, but are significantlynegative for the nonsalary components. The positivecoefficient for tenure for base salary appears tobe consistent with the managerial power theorythat argues for a positive relation of CEO powerto her tenure. But the negative relation betweentenure and contingent compensation is inconsis-tent with Gibbons and Murphy’s (1992) argumentthat, as the CEO nears his retirement, the pro-portion of his performance-contingent pay needsto increase because of diminishing incentives fromcareer concerns.
466 Management Science/Vol. 48, No. 4, April 2002
CYERT, KANG, AND KUMARCorporate Governance and Top-Management Compensation
Table 4 Coefficient Estimates for Large Versus Small Firms (Asymptotic t-statistics in Parentheses)a
Base Salary Discretionary Compensation
Small Large Small LargeFirmsb Firmsb Firmsb Firmsb
Exp. Sign (1) (2) (3) (4)
Intercept 7�4832 7�8139 3�4286 9�0654�15�28�∗∗ �15�76�∗∗ �0�55� �4�12�∗∗
SIZE (Firm size) �+� 0�2541 0�2015 0�5978 0�2770�14�05�∗∗ �13�95�∗∗ �1�90�∗ �3�81�∗∗
STK RTN (Stock return) �+� 0�0257 −0�0185 1�1600 0�8898�0�99� �−0�51� �4�13�∗∗ �4�94�∗∗
ACCTG RTN (Accounting return) �+� −0�0744 −0�0248 0�3568 0�4285�−1�90�∗ �−0�47� �1�39� �1�45�
�L (Largest ownership, non-CEO) �−� 0�0274 −0�0560 −0�0898 −0�1765�1�38� �−2�74�∗∗ �−1�13� �−2�49�∗∗
�LM (Largest stock ownership, CEO) �−� 0�0261 −0�0455 −0�2094 −0�3731�1�29� �−2�19�∗∗ �−2�53�∗∗ �−5�18�∗∗
�M (CEO’s stock ownership) �?� 0�0332 0�0093 0�0215 0�0513�3�89�∗∗ �1�04� �0�62� �1�67�∗
�J (Comp. committee’s ownership) �−� −0�0069 −0�0061 −0�0525 −0�0398�−1�27� �−1�03� �−2�33�∗∗ �−1�97�
Q (default risk) �−� −0�0926 −0�2461 −0�7076 −1�1148�−1�55� �−4�42�∗∗ �−3�16�∗∗ �−5�75�∗∗
D (Financial leverage) �?� −0�0084 −0�0007 0�0038 0�0309�−1�93�∗ �−0�11� �0�22� �1�32�
Z (Growth opportunities) �?� −0�0092 −0�0550 0�4005 0�2135�−0�42� �−1�81�∗ �4�78�∗∗ �2�03�∗∗
Control Variables Included Included Included Included
Adjusted R2 0�22 0�32 0�18 0�33Sample Size 1148 1238 1148 1238
Notes. All equations include control variables indicated in Table 3, but coefficients are not reported.∗Significant at the 5% level, two-tailed,∗∗Significant at the 10% level, two-tailed.aLarge firms are those that belong to size decile 6–10 in Table 1.bSmall firms are those that belong to size decile 1–5 in Table 1.
4.2. Alternative Estimations andRobustness Checks
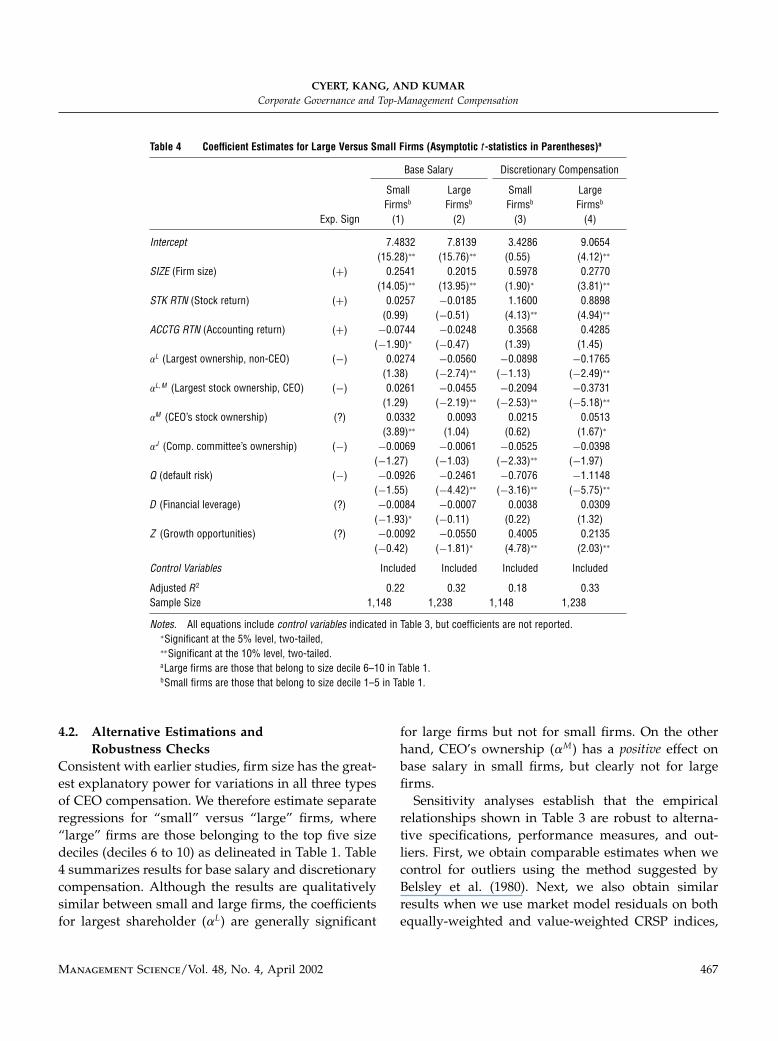
Consistent with earlier studies, firm size has the great-est explanatory power for variations in all three typesof CEO compensation. We therefore estimate separateregressions for “small” versus “large” firms, where“large” firms are those belonging to the top five sizedeciles (deciles 6 to 10) as delineated in Table 1. Table4 summarizes results for base salary and discretionarycompensation. Although the results are qualitativelysimilar between small and large firms, the coefficientsfor largest shareholder (�L) are generally significant
for large firms but not for small firms. On the otherhand, CEO’s ownership (�M ) has a positive effect onbase salary in small firms, but clearly not for largefirms.Sensitivity analyses establish that the empirical
relationships shown in Table 3 are robust to alterna-tive specifications, performance measures, and out-liers. First, we obtain comparable estimates when wecontrol for outliers using the method suggested byBelsley et al. (1980). Next, we also obtain similarresults when we use market model residuals on bothequally-weighted and value-weighted CRSP indices,
Management Science/Vol. 48, No. 4, April 2002 467
CYERT, KANG, AND KUMARCorporate Governance and Top-Management Compensation
instead of raw stock returns; and when we use returnon assets (ROA), instead of return on equity (ROE),as the accounting performance measure.
5. ConclusionsFrom the viewpoint of agency theory, various litera-tures emphasize the role of incentive contracting (e.g.,Holmstrom 1979), the implicit discipline imposed onmanagers by large shareholders and the market forcorporate control (Jensen and Ruback 1983, Shleiferand Vishny 1986), and the monitoring role of the BOD(Crystal 1991, Byrne 1996, Hermalin and Weisbach1998). The model developed in this paper provides anintegrated framework for considering the interplay ofthese forces in the equilibrium determination of man-agement compensation.Our empirical analysis contributes to the growing
empirical literature on CEO compensation in at leastfour ways: (1) by demonstrating the importance offactors suggested by the theoretical model, but notverified in the existing literature (e.g., default riskand ownership of the largest shareholder), (2) by doc-umenting the existence of a significant relationshipbetween factors that have been considered by theexisting literature without finding a clear relationship(e.g., BOD ownership and the strength of executivepay-performance relationship), (3) by reexamining therole of factors found significant in the literature (e.g.,board size) using a more comprehensive empiricalspecification that takes into account the role of own-ership and takeover threats, and (4) by reportingthat the efficacy of corporate governance has greaterimpact on equity-based compensation relative to fixedcompensation.
AcknowledgmentsThe authors are grateful to two anonymous referees and BalaBalachandran (the editor) for helpful comments. They also thankRick Antle, Bill Baber, Morton Kamien, Shyam Sunder, and seminarparticipants at Carnegie-Mellon University, Humboldt University,University of Maryland, New York University, and Yale Universityfor useful comments.
ReferencesAggarwal, R., A. Samwick. 1999. The other side of the tradeoff: The
impact of risk on executive compensation. J. Political Econom.107 65–105.
Aghion, P., P. Bolton. 1992. An incomplete contracts approach tofinancial contracting. Rev. Econom. Stud. 59 473–494.
Baber, W., S. Janakiraman, S. Kang. 1996. Investment opportunitiesand the structure of performance-based executive compensa-tion. J. Accounting Econom. 21 297–318.
Belsley, D., E. Kuh, R. Welsch. 1980. Regression Diagnostics: Identify-ing Influential Data and Sources of Collinearity. Wiley, New York.
Berger, P., E. Ofek. 1996. Bustup takeovers of value-destroyingfirms. J. Finance 51 1175–1200.
Bertrand, M., S. Mullainathan. 1999. Is there discretion in wagesetting? A test using takeover legislation. Rand J. Econom. 30535–554.
Black, B. 1998. Shareholder activism and corporate governancein the United States. New Palgrave Dictionary Econom. Law 3459–465.
Black, F., M. Scholes. 1973. The pricing of options and corporateliabilities. J. Political Econom. 81 637–654.
Brickley, J., J. Coles, R. Terry. 1994. The board of directors and theenactment of poison pills. J. Financial Econom. 35 371–390.
Byrne, J. 1996. The best and worst boards. BusinessWeek (Novem-ber 25).
Core, J., R. Holthausen, D. Larcker. 1999. Corporate governance,chief executive officer compensation, and firm performance.J. Financial Econom. 51 371–406.
Cosh, A. 1975. The remuneration of chief executives in the UnitedKingdom. Econom. J. 85 75–94.
Crystal, G. 1991. In Search of Excess: The Overcompensation of Ameri-can Executives. W.W. Norton, New York.
Cyert, R., S. Kang, J. Kim, P. Kumar. 1995. Compensation and per-formance: Theory and evidence. Working paper, Carnegie Mel-lon University, Pittsburgh, PA.
Fama, E., M. Jensen. 1983. Separation of ownership and control.J. Law Econom. 26 301–305.
Finkelstein, S., D. Hambrick. 1989. Chief executive compensation:A study of the intersection of markets and political processes.Strategic Management J. 10 121–134.
Gibbons, R., K. Murphy. 1992. Optimal incentive contracts in thepresence of career concerns: Theory and evidence. J. PoliticalEconom. 100 468–505.
Gilson, R., K. John, L. Lang. 1990. Troubled debt restructurings: Anempirical study of private reorganizations of firms in default.J. Financial Econom. 27 315–354.
Greene, W. 1981. Sample selection bias as a specification error:Comment. Econometrica 49 795–798.
Grossman, S., O. Hart. 1980. Takeover bids, the free-rider problem,and the theory of the corporation. Bell J. Econom. 11 42–64.
Hall, B., J. Liebman. 1998. Are CEOs really paid like bureaucrats?Quart. J. Econom. 113 658–691.
Hart, O. 1995. Firm, Contracts and Financial Structure. Oxford Uni-versity Press, London, U.K.
Heckman, J. 1979. Sample selection bias as a specification error.Econometrica 47 153–161.
468 Management Science/Vol. 48, No. 4, April 2002
CYERT, KANG, AND KUMARCorporate Governance and Top-Management Compensation
Hemmer, T., S. Matsunaga, T. Shevlin. 1994. Estimating the “fairvalue” of employee stock options with expected early exercise.Accounting Horizons 8 23–42.
Hermalin, B., M. Weisbach. 1991. The effects of board compositionand direct incentives on firm performance. Financial Manage-ment 20 101–112., . 1998. Endogenously chosen boards of directors andtheir monitoring of the CEO. Amer. Econom. Rev. 88 96–118., . 2000. Boards of directors as an endogenously deter-mined institution: A survey of the economic literature. Work-ing paper, University of Illinois, Urbana-Champaign, IL.
Holmstrom, B. 1979. Moral hazard and observabilit. Bell J. Econom.10 74–91.
Jensen, M. 1986. Agency cost of free cash flow, corporate financeand takeovers. Amer. Econom. Rev. 76 323–329.. 1993. The modern industrial revolution, exit, and failure ofinternal control systems. J. Finance 48 35–44., K. Murphy. 1990. Performance pay and top-managementincentives. J. Political Econom. 98 225–264., R. Ruback. 1983. The market for corporate control: The scien-tific evidence. J. Financial Econom. 11 5–50.
Johnson, M., S. Porter, M. Shackell. 1997. Stakeholder pressure andthe structure of executive compensation. Working paper, Uni-versity of Michigan, Ann Arbor, MI.
Kaplan, S. 1994. Top executive rewards and firm performance: Acomparison of Japan and the United States. J. Political Econom.102 510–546.
Kostiuk, P. 1989. Firm size and executive compensation. J. HumanResources 25 90–105.
Lambert, R., D. Larcker, K. Wigelt. 1993. The structure of organiza-tional incentives. Admin. Sci. Quart. 38 438–461.
Lavalle, L. 2001. Executive pay: Why is it still soaring? BusinessWeek(April 16).
Lipton, M., J. Lorsch. 1992. A modest proposal for improved cor-porate governance. Business Lawyer 48 59–77.
Long, M., R. Walkling. 1984. Agency theory, managerial welfare,and takeover bid resistance. Rand J. Econom. 5 54–68.
Lublin, J. S. 1996. Executive pay: The great divide. The Wall StreetJournal (April 11).
Mace, M. 1986. Directors: Myth and Reality. Harvard Business SchoolPress, Cambridge, MA.
Patton, A., J. Baker. 1987. Why do not directors rock the boat? Har-vard Bus. Rev. 65 10–12.
Roberts, D. 1956. A general theory of executive compensationbased on statistically tested propositions. Quart. J. Econom. 74270–294.
Rosen, S. 1992. Contracts and the market for executives. L. Wernin,H. Wijkander, eds. Contract Economics. Basil Blackwell, Oxford,U.K., 181–211.
Rosenstein, S., J. Wyatt. 1990. Outside directors, board inde-pendence, and shareholder wealth. J. Financial Econom. 26175–191.
Shivdasani, A., D. Yermack. 1998. CEO involvement in the selectionof new board members: An empirical analysis. Working paper,New York University, New York.
Shleifer, A., R. Vishny. 1986. Large shareholders and corporate con-trol. J. Political Econom. 94 461–488.
Shumway, T. 1996. Size, overreaction, and book-to-market effects asdefault premia. Working paper, University of Michigan, AnnArbor, MI.
Smith, C., R. Watts. 1992. The investment opportunity set andcorporate financing, dividend, and compensation policies.J. Financial Econom. 32 263–292.
Yermack, D. 1996. Higher market valuation for firms with smallboard of directors. J. Financial Econom. 40 185–211.
Accepted by Bala Balachandran; received November 1994. This paper was with the authors 15 months for 6 revisions.
Management Science/Vol. 48, No. 4, April 2002 469