Controversial behavior of aminoguanidine in the presence of either reducing sugars or soluble...
9
Controversial behavior of aminoguanidine in the presence of either reducing sugars or soluble glycated bovine serum albumin Andreea Iren Serban a,⇑ , Marieta Costache b , Anca Dinischiotu b a University of Agricultural Science and Veterinary Medicine, Faculty of Veterinary Medicine, 105 Splaiul Independentei 050097, Bucharest 5, Romania b University of Bucharest, Faculty of Biology, Molecular Biology Center, 91-95 Splaiul Independentei 050089, Bucharest 5, Romania article info Article history: Received 29 April 2011 Received in revised form 10 August 2011 Accepted 11 October 2011 Available online 17 October 2011 Keywords: Advanced glycation end products (AGEs) Glucose Ribose Aminoguanidine Collagen Fluorescence abstract The elucidation of the controversial inhibitory effect of aminoguanidine (AG) on the cross-linking and fluorescent advanced glycation end products (AGEs) formation during long-term in vitro glycation of type I collagen with 250 mM reducing sugars or 0.5 mg/ml soluble glycated bovine serum albumin (AGE-BSA) was researched. Chromatographic and SDS–PAGE analyses revealed the formation of aggregates during collagen glyca- tion. AG at all concentrations (5–80 mM) prevented the cross-linking of collagen peptides with monosac- charides but an increase in fluorescence with a maximum value at 10 mM AG was noticed. In the presence of AGE-BSA, AG prevented the cross-linking process and decreased the fluorescence levels in a concentration-dependent manner. Our results suggest that AG is an efficient inhibitor of collagen cross-linking and the highest increase in fluorescence due to reducing sugars and AG can be explained by the competition between guanidine group of AG and arginine residues of some protein-bound dideoxyosones, which could form fluorescent compounds. Ó 2011 Elsevier Ltd. All rights reserved. 1. Introduction In diabetes, the major extracellular matrix protein, collagen, undergoes extensive chemical modifications that result in de- creased solubility and susceptibility to enzymes, increased stabil- ity, cross-linking, fluorescence, and browning. 1,2 These alterations of collagen are involved in the pathogenesis of diabetic complica- tions and are the results of glycation reactions. 3,4 These reactions occur through a cascade of events between reducing sugars and amino groups on the protein. The first step of this cascade begins with the reversible formation of a Schiff base aldimine adduct that undergoes rearrangement to a relatively irreversible ketoamine Amadori product. This compound is slowly degraded in complex reaction pathways via unbound dicarbonyl intermediates, such as glyoxal, methylglyoxal, and 3-deoxyglucosone (3-DG) or protein- bound dideoxyosones to a plethora of compounds collectively called AGEs. The generation of these novel dideoxyosones requires carbonyl shifts along the entire carbohydrate backbone and opens up new possibilities for considering Amadori compounds degrada- tion and AGEs cross-link formation pathways. 5,6 This Amadori pathway or Hodge pathway is considered as the primary route of in vivo AGEs formation. Glucosepane is the major Maillard cross- linking product derived from glucose 7,8 whereas pentosidine formation is due to arabinose, an intermediate in the autoxidation of glucose. 9 Autoxidation of the reducing sugar or Schiff’s base ad- duct, the Wolff and Namiki pathways, respectively, can signifi- cantly complicate the glycation reaction especially in in vitro experiments designed to study AGEs formation and inhibition. 10,11 For this reason Booth et al., have developed an interrupted glyca- tion method that allowed for the isolation of Amadori rich proteins. 12 In the fight against AGEs formation and diabetic complications, Brownlee et al. introduced aminoguanidine (AG), a dicarbonyl trap, as a promising pharmacological tool for the inhibition of Maillard reaction, by showing that AG can prevent protein cross-linking in the arterial wall. 13 Since then, many studies have investigated the effects of AG 14–16 or AG-derivates treatment 17 and all new dis- covered AGEs inhibitors were compared with AG inhibitory poten- tial. 18–20 These studies confirmed that AG treatment inhibits or retards the development of nephropathy, 21–23 retinopathy 24,25 , and neuropathy. 26,27 In spite of these results, a clinical trial to pre- vent diabetic nephropathy by AG was terminated early due to lack of efficiency and safety concerns. 14 However, in alloxan-diabetic rats, AG can inhibit the development of retinopathy without mod- ifying AGE-hemoglobin levels or tail collagen pentosidine level, fluorescence intensity, and thermal breaking time. 28 In a 5-year study in diabetic dogs 29 and in skin collagen of STZ-diabetic rats, 30 AG was shown to have no influence on pentosidine levels in tail and aorta collagen. 0008-6215/$ - see front matter Ó 2011 Elsevier Ltd. All rights reserved. doi:10.1016/j.carres.2011.10.017 ⇑ Corresponding author. Tel.: +40 72 428 40 18; fax: +40 21 318 15 75. E-mail address: [email protected] (A.I. Serban). Carbohydrate Research 346 (2011) 2872–2880 Contents lists available at SciVerse ScienceDirect Carbohydrate Research journal homepage: www.elsevier.com/locate/carres
Transcript of Controversial behavior of aminoguanidine in the presence of either reducing sugars or soluble...
Carbohydrate Research 346 (2011) 2872–2880
Contents lists available at SciVerse ScienceDirect
Carbohydrate Research
journal homepage: www.elsevier .com/locate /carres
Controversial behavior of aminoguanidine in the presence of eitherreducing sugars or soluble glycated bovine serum albumin
Andreea Iren Serban a,⇑, Marieta Costache b, Anca Dinischiotu b
a University of Agricultural Science and Veterinary Medicine, Faculty of Veterinary Medicine, 105 Splaiul Independentei 050097, Bucharest 5, Romaniab University of Bucharest, Faculty of Biology, Molecular Biology Center, 91-95 Splaiul Independentei 050089, Bucharest 5, Romania
a r t i c l e i n f o a b s t r a c t
Article history:Received 29 April 2011Received in revised form 10 August 2011Accepted 11 October 2011Available online 17 October 2011
Keywords:Advanced glycation end products (AGEs)GlucoseRiboseAminoguanidineCollagenFluorescence
0008-6215/$ - see front matter � 2011 Elsevier Ltd. Adoi:10.1016/j.carres.2011.10.017
⇑ Corresponding author. Tel.: +40 72 428 40 18; faxE-mail address: [email protected] (A.I. Serban).
The elucidation of the controversial inhibitory effect of aminoguanidine (AG) on the cross-linking andfluorescent advanced glycation end products (AGEs) formation during long-term in vitro glycation of typeI collagen with 250 mM reducing sugars or 0.5 mg/ml soluble glycated bovine serum albumin (AGE-BSA)was researched.
Chromatographic and SDS–PAGE analyses revealed the formation of aggregates during collagen glyca-tion. AG at all concentrations (5–80 mM) prevented the cross-linking of collagen peptides with monosac-charides but an increase in fluorescence with a maximum value at 10 mM AG was noticed. In thepresence of AGE-BSA, AG prevented the cross-linking process and decreased the fluorescence levels ina concentration-dependent manner.
Our results suggest that AG is an efficient inhibitor of collagen cross-linking and the highest increase influorescence due to reducing sugars and AG can be explained by the competition between guanidinegroup of AG and arginine residues of some protein-bound dideoxyosones, which could form fluorescentcompounds.
� 2011 Elsevier Ltd. All rights reserved.
1. Introduction
In diabetes, the major extracellular matrix protein, collagen,undergoes extensive chemical modifications that result in de-creased solubility and susceptibility to enzymes, increased stabil-ity, cross-linking, fluorescence, and browning.1,2 These alterationsof collagen are involved in the pathogenesis of diabetic complica-tions and are the results of glycation reactions.3,4 These reactionsoccur through a cascade of events between reducing sugars andamino groups on the protein. The first step of this cascade beginswith the reversible formation of a Schiff base aldimine adduct thatundergoes rearrangement to a relatively irreversible ketoamineAmadori product. This compound is slowly degraded in complexreaction pathways via unbound dicarbonyl intermediates, such asglyoxal, methylglyoxal, and 3-deoxyglucosone (3-DG) or protein-bound dideoxyosones to a plethora of compounds collectivelycalled AGEs. The generation of these novel dideoxyosones requirescarbonyl shifts along the entire carbohydrate backbone and opensup new possibilities for considering Amadori compounds degrada-tion and AGEs cross-link formation pathways.5,6 This Amadoripathway or Hodge pathway is considered as the primary route ofin vivo AGEs formation. Glucosepane is the major Maillard cross-linking product derived from glucose7,8 whereas pentosidine
ll rights reserved.
: +40 21 318 15 75.
formation is due to arabinose, an intermediate in the autoxidationof glucose.9 Autoxidation of the reducing sugar or Schiff’s base ad-duct, the Wolff and Namiki pathways, respectively, can signifi-cantly complicate the glycation reaction especially in in vitroexperiments designed to study AGEs formation and inhibition.10,11
For this reason Booth et al., have developed an interrupted glyca-tion method that allowed for the isolation of Amadori richproteins.12
In the fight against AGEs formation and diabetic complications,Brownlee et al. introduced aminoguanidine (AG), a dicarbonyl trap,as a promising pharmacological tool for the inhibition of Maillardreaction, by showing that AG can prevent protein cross-linking inthe arterial wall.13 Since then, many studies have investigatedthe effects of AG14–16 or AG-derivates treatment17 and all new dis-covered AGEs inhibitors were compared with AG inhibitory poten-tial.18–20 These studies confirmed that AG treatment inhibits orretards the development of nephropathy,21–23 retinopathy24,25,and neuropathy.26,27 In spite of these results, a clinical trial to pre-vent diabetic nephropathy by AG was terminated early due to lackof efficiency and safety concerns.14 However, in alloxan-diabeticrats, AG can inhibit the development of retinopathy without mod-ifying AGE-hemoglobin levels or tail collagen pentosidine level,fluorescence intensity, and thermal breaking time.28 In a 5-yearstudy in diabetic dogs29 and in skin collagen of STZ-diabetic rats,30
AG was shown to have no influence on pentosidine levels in tailand aorta collagen.

A. I. Serban et al. / Carbohydrate Research 346 (2011) 2872–2880 2873
Taking into account that glycated collagen products are excel-lent markers of diabetic complications4 and the controversial roleof AG in in vivo studies, our work has been aimed at studyingthe in vitro effects of different AG concentrations on collagen gly-cation with glucose, ribose, or soluble AGE-BSA.
2. Materials and methods
2.1. Materials
MiliQ water and all buffers used for incubation were passedthrough a Chelex-100 resin column (Bio-Rad) to remove any tracemetal ions and to reduce at maximum their undesirable influencein the glycation process. BSA (fraction V, RIA grade), D-glucose, D-ri-bose, aminoguanidine hydrochloride, type I collagen from bovineAchilles tendon, pepsin (1:2500, from porcine stomach), gel filtra-tion molecular markers, acetic acid, acrylamide/bis-acrylamide30%, TEMED, ammonium persulfate, Tris base, glycine, SDS, sodiumthiosulfate, formaldehyde, silver nitrate were purchased from Sig-ma–Aldrich company, acetonitrile and NaN3 were purchased fromMerck and PBS from Gibco.
2.2. Methods
2.2.1. Digestion of type I collagenCollagen from bovine Achilles tendon was subjected to a limited
pepsin digestion as previously described.31 Briefly, 100 mg colla-gen was incubated for 20 h with 1 mg/mL pepsin in 0.5 mol/L ace-tic acid at 37 �C in a shaking incubator, and then was centrifuged at12,000g for 30 min at 20 �C. The supernatant contained the pepsin-soluble collagen (PSC), which was successively dialyzed against0.01 M acetic acid, MilliQ water and 10 mM PBS pH 7.4 for 72 h.The PSC concentration was estimated by measuring the concentra-tion of hydroxyproline, which represents up to 14% of the collagenby weight.32
2.2.2. Preparation of AGE-BSA and evaluation of glycationprocess
According to the methods previously described,31,33 solubleAGE-BSA was synthesized in vitro by co-incubation of 1.6 M D-glu-cose and 100 mg/mL BSA in sterile 10 mM PBS, pH 7.4, for 6 weeksunder aerobic conditions at 37 �C, in the presence of 3 mM NaN3 toprevent bacterial growth. The unbound sugar was removed by dial-ysis against 10 mM PBS, pH 7.4 for 48 h. The glycation process ofBSA was analyzed by gel filtration using a Fast Protein Liquid Chro-matography (FPLC) system, SDS–PAGE, and fluorescencespectroscopy.
2.2.3. In vitro glycation of pepsin-soluble collagenAliquots of PSC (24 mg/ml) were incubated with glucose and ri-
bose at 250 mM concentration, or 0.5 mg/ml AGE-BSA in the ab-sence or presence of 5, 10, 20, 40, and 80 mM AG in 10 mM PBS,pH 7.4 for 6 weeks under aerobic conditions at 37 �C. The sampleswere kept in the dark, in conical flasks, in a shaker incubator Cer-tomat BS-T Beckman Coulter at 50 rpm. Individual samples wereremoved at desired times and frozen at �20 �C. Controls (PCSsincubated for 6 weeks at 37 �C in 10 mM PBS, pH 7.4 with5–80 mM AG) have not shown any change compared to PCS
Table 1The relation between the retention volume and the molecular weight
Ret. vol. (ml) 7.51 7.63 9.32 10.81 11.70MW (kDa) 427 405.50 252 161.50 123Ret. vol. (ml) 13.14 13.51 13.82 14.02 14.18MW (kDa) 70.70 61.01 55.18 50.17 48.32
incubated for 6 weeks in 10 mM PBS, pH 7.4, at 37 �C. The cross-linking of collagen and development of fluorescent related prod-ucts were assessed via FPLC and fluorescence spectroscopy of gelfiltration collected fractions.
2.2.4. Fast protein liquid chromatographyA FPLC automated system (ÄKTA FPLC-Amersham Pharmacia
Biotech) with a size exclusion column (Superdex 200 HR 10/30)was used for the separation of glycated and unglycated proteins.Samples of 100 lL in 10 mM PBS pH 7.4, with a concentration of:150 lg collagen, 150 lg collagen glycated in the presence of glu-cose or ribose and various concentrations of AG and mixtures of150 lg collagen + 2.5 lg AGE-BSA and 5–80 mM AG, were loadedon the column and eluted with 5% acetonitrile in 10 mM PBS pH7.4 mixture, at a constant flow rate of 0.8 mL/min. The proteinabsorption was automatically recorded at 280 nm and fractionsof 1 mL were collected. To determine the molecular weight ofeluted protein fractions we used the Unicorn 4.00 software andthe following molecular markers: urease, Jack Bean, 545 kDa; apo-ferritin, horse spleen, 443 kDa; b-amylase, sweet potato, 200 kDa;alcohol dehydrogenase, yeast, 150 kDa; albumin, bovine serum,66 kDa; albumin, chicken egg white, 44.29 kDa; carbonic anhy-drase, bovine erythrocytes, 29 kDa, and lysozyme, chicken eggwhite, 14.3 kDa. The correspondence between the retention vol-ume and the molecular weight of separated protein fractions bygel filtration is shown in Table 1.
2.2.5. Fluorescence assaysThe fluorescence of Maillard compounds and pentosidine-like
products was spectrofluorometrically recorded at kex 370 nm/kem
440 nm and at kex 335 nm/kem 385 nm, respectively, against10 mM PBS, pH 7.4, as blank, for every protein collected fractionusing a JASCO FP 750 spectrofluorometer.
2.2.6. Gel electrophoresisPSC cross-linking and aggregation were investigated by SDS–
PAGE (4% PAA stacking gel and 7.5% PAA resolving gel)34 and pro-tein bands were silver stained.35 Because collagen peptides canbecome soluble in acetic acid, the fixation of gels was made with15% formaldehyde and 25% ethanol for 1 h. The gels were sensi-tized by soaking for 1 min in 0.02% sodium thiosulfate pentahy-drate salt and stained with 6 mM silver nitrate for 30 min. Afterthat, the gels were developed for 5 min in a solution which con-tained 3% sodium carbonate, 150 ll formaldehyde (37%), and20 ll of 1% sodium thiosulfate pentahydrate salt (0.0002%). Thereaction was stopped with a solution of 4% (w/v) Tris base and2% (v/v) acetic acid.
All our experiments were done in triplicates. The samples wererun in triplicate each time and the results are expressed asmean ± SD.
3. Results
3.1. The effect of AG on collagen glycation with glucose
PSC incubated for 6 weeks in 10 mM PBS was separated by gelfiltration and the elution pattern revealed four peaks with
11.94 12.01 12.53 12.76 12.85 13.02114.38 111.71 95.30 83.29 80.80 74.39
14.65 15.03 15.21 15.50 15.60 15.7045.59 39.80 38.45 37.50 35.44 34.67

Figure 1. FPLC elution patterns of collagen peptides glycated with 250 mM glucose in the absence or presence of AG, detected by UV absorbance at 280 nm.
Figure 2. Relative fluorescence recorded at (a) kex 335 nm/kex 385 nm and (b) kex
370 nm/kex 440 nm of collagen peptides glycated with 250 mM glucose in theabsence or presence of AG fractions separated by gel filtration.
2874 A. I. Serban et al. / Carbohydrate Research 346 (2011) 2872–2880
molecular weights of: 34.67, 48.32, 70, and 111.71 kDa (Fig. 1 andTable 1).
After 6 weeks, the gel filtration pattern of PSC glycated with250 mM glucose showed the formation of a 405.5 kDa aggregateand a 5-fold increase of UV absorbance of collagen peptides, whichhave undergone a slight increase in the molecular weight to 35.44,55.18, 80.80, and 114.38 kDa, respectively (Fig. 1 and Table 1). Inthe presence of 5 mM AG and 250 mM glucose, the chromato-graphic pattern revealed the disappearance of the 405.5 kDamolecular aggregate and a higher increase of UV absorbance ofthe four collagen peaks with retention volumes of 39.80, 54.06,78.44, and 100.61 kDa, respectively. At 10 mM AG, the inhibitionof cross-linking of collagen is higher compared to the elution pat-tern obtained at 5 mM AG. The concentration of 10 mM AG wasassociated with the highest increase of UV absorbance of collagenpeptides separated in three peaks of 39.80, 51.81, and 74.39 kDa,respectively. With the increase of AG concentration, the peaks sep-arated by gel filtration began to converge to one peak with the de-crease of UV absorbance and corresponding molecular weight,suggesting the inhibition of cross-linking of PCS peptides. Thechromatographic pattern of PSC glycated in the presence of80 mM AG revealed one peak with a molecular weightof 38.45 kDa, which has a UV absorbance lower than absorbanceof PSC peak glycated with glucose (Fig. 1 and Table 1).
The pattern of the relative fluorescence of PSC peptides’ frac-tions collected by gel filtration glycated in the presence of glucoseand AG with concentrations between 5 and 80 mM recorded at kex
335 nm/kem 385 nm corresponded to a pentosidine-like compoundand at kex 370 nm/kem 440 nm corresponded to a Maillard likecompound crossline, followed the chromatographic pattern re-corded at 280 nm (Figs. 1 and 2). Due to the glucose-induced gly-cation of PSC peptides, the fluorescence levels increased to about8- to 11-fold, at kex 335 nm/kem 385 nm and to 10- to 16-fold, atkex 370 nm/kem 440 nm when compared to unglycated PSC pep-tides levels. With the inhibition of cross-linking, due to theincrease of AG concentration, the fluorescence level recorded atboth excitation wavelengths decreased at fractions 2 and 3, corre-sponding to molecular aggregates, and increased at fractions 7–10.The maximum fluorescence level was recorded when the samplewas glycated in the presence of 10 mM AG at fraction 8, which
showed an 8-fold increase compared to the value correspondingto PSC peptides glycated in absence of AG, at kex 335 nm/kem
385 nm and a 2.2-fold increase at kex 370 nm/kem 440 nm, respec-tively (Fig. 2). Even in the presence of 80 mM AG, the fluorescencelevel at both excitation wavelengths for fractions 9–10 remainedhigher than that recorded in its absence. The total relative fluores-cence level (obtained by adding up the level of fluorescencerecorded from each fraction separated by FPLC) recorded in thecase of glycated PCS peptides overtook the value obtained in thepresence of 80 mM AG at kex 335 nm/kem 385 nm and kex
370 nm/kem 440 nm by 1.13-fold and 2-fold, respectively. At40 mM AG, the total fluorescence level decreased only at kex
370 nm/kem 440 nm, by 1.5-fold, when compared to the value re-corded for glycated PSC peptides in its absence; at the same time,
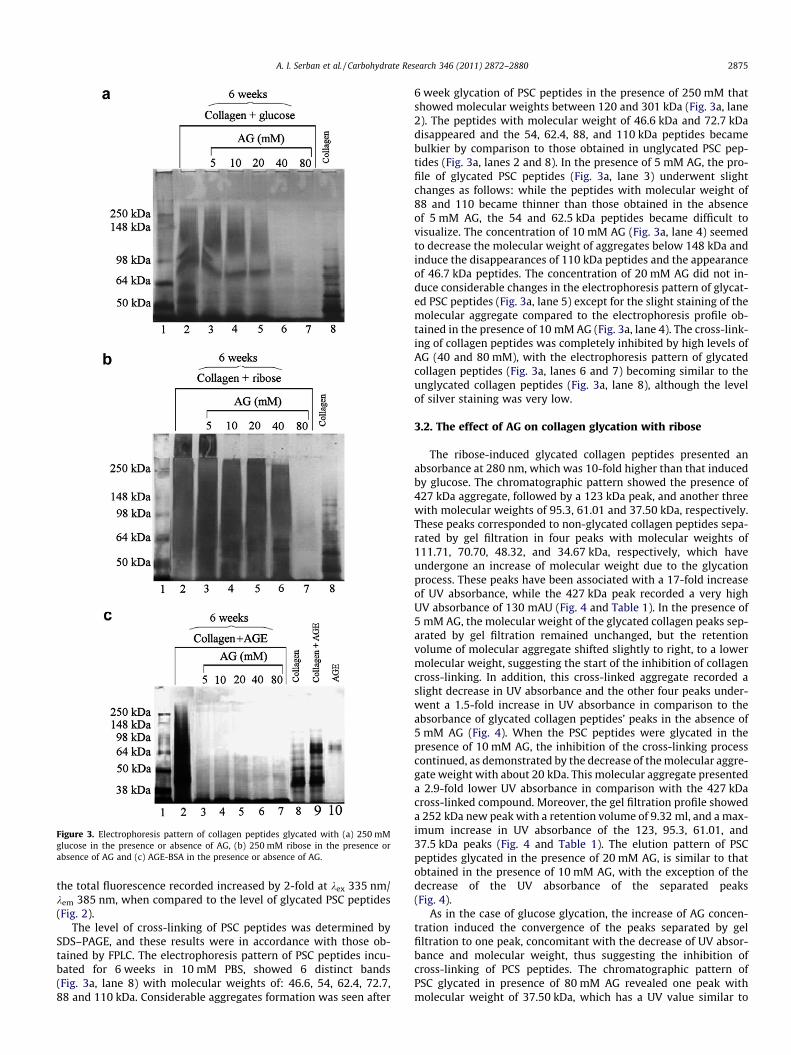
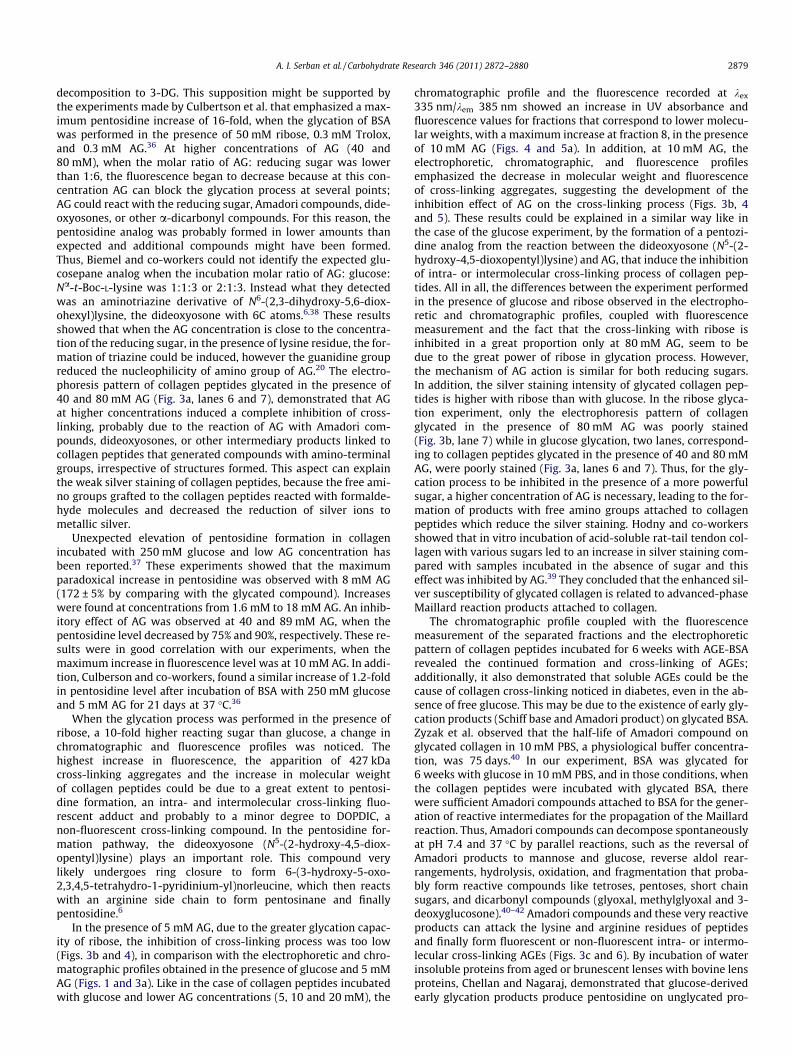
Figure 3. Electrophoresis pattern of collagen peptides glycated with (a) 250 mMglucose in the presence or absence of AG, (b) 250 mM ribose in the presence orabsence of AG and (c) AGE-BSA in the presence or absence of AG.
A. I. Serban et al. / Carbohydrate Research 346 (2011) 2872–2880 2875
the total fluorescence recorded increased by 2-fold at kex 335 nm/kem 385 nm, when compared to the level of glycated PSC peptides(Fig. 2).
The level of cross-linking of PSC peptides was determined bySDS–PAGE, and these results were in accordance with those ob-tained by FPLC. The electrophoresis pattern of PSC peptides incu-bated for 6 weeks in 10 mM PBS, showed 6 distinct bands(Fig. 3a, lane 8) with molecular weights of: 46.6, 54, 62.4, 72.7,88 and 110 kDa. Considerable aggregates formation was seen after
6 week glycation of PSC peptides in the presence of 250 mM thatshowed molecular weights between 120 and 301 kDa (Fig. 3a, lane2). The peptides with molecular weight of 46.6 kDa and 72.7 kDadisappeared and the 54, 62.4, 88, and 110 kDa peptides becamebulkier by comparison to those obtained in unglycated PSC pep-tides (Fig. 3a, lanes 2 and 8). In the presence of 5 mM AG, the pro-file of glycated PSC peptides (Fig. 3a, lane 3) underwent slightchanges as follows: while the peptides with molecular weight of88 and 110 became thinner than those obtained in the absenceof 5 mM AG, the 54 and 62.5 kDa peptides became difficult tovisualize. The concentration of 10 mM AG (Fig. 3a, lane 4) seemedto decrease the molecular weight of aggregates below 148 kDa andinduce the disappearances of 110 kDa peptides and the appearanceof 46.7 kDa peptides. The concentration of 20 mM AG did not in-duce considerable changes in the electrophoresis pattern of glycat-ed PSC peptides (Fig. 3a, lane 5) except for the slight staining of themolecular aggregate compared to the electrophoresis profile ob-tained in the presence of 10 mM AG (Fig. 3a, lane 4). The cross-link-ing of collagen peptides was completely inhibited by high levels ofAG (40 and 80 mM), with the electrophoresis pattern of glycatedcollagen peptides (Fig. 3a, lanes 6 and 7) becoming similar to theunglycated collagen peptides (Fig. 3a, lane 8), although the levelof silver staining was very low.
3.2. The effect of AG on collagen glycation with ribose
The ribose-induced glycated collagen peptides presented anabsorbance at 280 nm, which was 10-fold higher than that inducedby glucose. The chromatographic pattern showed the presence of427 kDa aggregate, followed by a 123 kDa peak, and another threewith molecular weights of 95.3, 61.01 and 37.50 kDa, respectively.These peaks corresponded to non-glycated collagen peptides sepa-rated by gel filtration in four peaks with molecular weights of111.71, 70.70, 48.32, and 34.67 kDa, respectively, which haveundergone an increase of molecular weight due to the glycationprocess. These peaks have been associated with a 17-fold increaseof UV absorbance, while the 427 kDa peak recorded a very highUV absorbance of 130 mAU (Fig. 4 and Table 1). In the presence of5 mM AG, the molecular weight of the glycated collagen peaks sep-arated by gel filtration remained unchanged, but the retentionvolume of molecular aggregate shifted slightly to right, to a lowermolecular weight, suggesting the start of the inhibition of collagencross-linking. In addition, this cross-linked aggregate recorded aslight decrease in UV absorbance and the other four peaks under-went a 1.5-fold increase in UV absorbance in comparison to theabsorbance of glycated collagen peptides’ peaks in the absence of5 mM AG (Fig. 4). When the PSC peptides were glycated in thepresence of 10 mM AG, the inhibition of the cross-linking processcontinued, as demonstrated by the decrease of the molecular aggre-gate weight with about 20 kDa. This molecular aggregate presenteda 2.9-fold lower UV absorbance in comparison with the 427 kDacross-linked compound. Moreover, the gel filtration profile showeda 252 kDa new peak with a retention volume of 9.32 ml, and a max-imum increase in UV absorbance of the 123, 95.3, 61.01, and37.5 kDa peaks (Fig. 4 and Table 1). The elution pattern of PSCpeptides glycated in the presence of 20 mM AG, is similar to thatobtained in the presence of 10 mM AG, with the exception of thedecrease of the UV absorbance of the separated peaks(Fig. 4).
As in the case of glucose glycation, the increase of AG concen-tration induced the convergence of the peaks separated by gelfiltration to one peak, concomitant with the decrease of UV absor-bance and molecular weight, thus suggesting the inhibition ofcross-linking of PCS peptides. The chromatographic pattern ofPSC glycated in presence of 80 mM AG revealed one peak withmolecular weight of 37.50 kDa, which has a UV value similar to

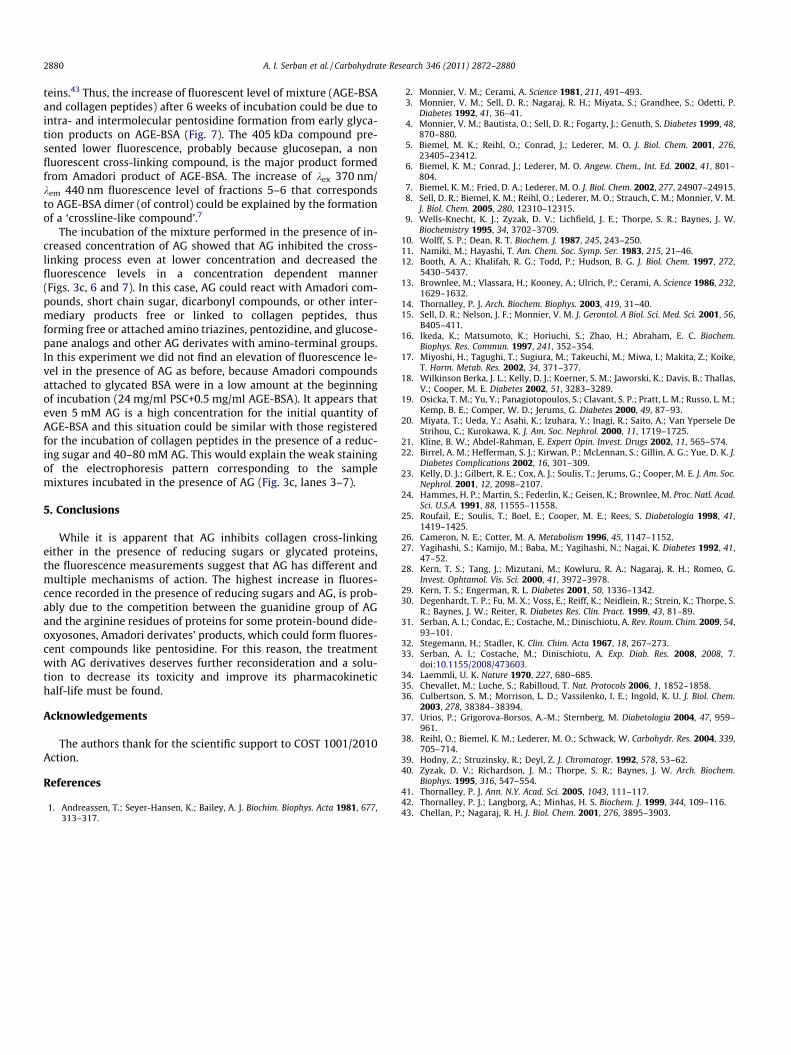
Figure 5. Relative fluorescence recorded at (a) kex 335 nm/kex 385 nm and (b) kex
370 nm/kex440 nm of collagen peptides glycated with 250 mM ribose in theabsence or presence of AG fractions separated by gel filtration.
Figure 4. FPLC elution patterns of collagen peptides glycated with 250 mM ribose in the absence or presence of AG, detected by UV absorbance at 280 nm.
2876 A. I. Serban et al. / Carbohydrate Research 346 (2011) 2872–2880
the peak of the collagen peptides glycated in the absence of AGwith the same retention volume (Fig. 4).
Due to the greater glycation capacity of ribose, the fluorescenceof glycated collagen peptides fractions collected by gel filtrationshowed a higher increase by comparison to the un-glycated colla-gen peptide fractions, with a maximum of 272 and 130-fold forfraction 2, corresponding to the 427 kDa molecular aggregate, asrecorded at kex 335 nm/kem 385 nm and kex 370 nm/kem 440 nm,respectively (Fig. 5). From fractions 3 to 10 fluorescence values re-mained high, with an average of 90 mAU at kex 335 nm/kem 385and 37 mAU at kex 370 nm/kem 440 nm (Fig. 5). When the glycationprocess occurred in the presence of AG, even at a concentration of5 mM, the intensity of fluorescence recorded at kex 335 nm/kem 385decreased slowly for fraction 2, but increased between 1.4–1.7-foldfor fractions from 3 and 10. In exchange, the level of fluorescencemeasured at kex 370 nm/kem 440 nm decreased 2-fold for fraction2 and slowly for the other fractions. With the increase of AG con-centration to 10 mM, while the fluorescence intensity at kex
335 nm/kem 385 associated with fraction 2, which corresponds tothe 427 kDa aggregate, decreased 4-fold, thus demonstrating theinhibition of cross-linking, fraction 8 had a maximum value of263 RFU, a value comparable with that recorded for fraction 2 inthe presence of ribose only. An increase of fluorescence measuredat kex 370 nm/kem 440 nm was recorded in the case of fractions 6–11 as well. The fluorescence patterns obtained at 20 mM AG,measured at both excitation wavelengths, resemble those recordedat 10 mM AG, but the fluorescence values are lower. At 40 mM AG,the fluorescence levels decrease before fraction 6, but remain highfor fractions higher than 6, when compared to the level recorded inthe presence of ribose only, at both excitation wavelengths. At thehighest concentration of AG, 80 mM, the maximum level of fluores-cence is reached at fractions 9–10 and has comparable values withthose recorded for the same fractions in the absence of AG.However, the total relative fluorescence recorded at kex 335 nm/kem 385 nm, decreased by 0.8 and 0.27-fold only in the presenceof 40 and 80 mM AG, respectively. At kex 370 nm/kem 440 nm, the
decrease of the total relative fluorescence ranged from 0.73-foldfor 5 mM AG up to 0.25-fold for 80 mM AG.
The inhibition of cross-linking of PSC peptides glycated with ri-bose induced by different concentrations of AG was also analyzedby SDS–PAGE. In the absence of AG, the peptides with a highmolecular weight (up to 406 kDa) showed aggregation and re-mained contained in the stacking gel, while collagen peptides withlower molecular weight (under 50 kDa) disappeared from the gel(Fig. 3b, lane 2). In the presence of 5 mM AG, the electrophoresis
A. I. Serban et al. / Carbohydrate Research 346 (2011) 2872–2880 2877
pattern was similar to the profile obtained in its absence (Fig. 3b,lane 3). The concentration of 10 mM AG induced a decrease inthe molecular weight of the aggregate up to 301 kDa, in the sameway as the 20 mM one (Fig. 3b, lanes 4 and 5). When the glycationprocess occurred in the presence of 40 mM AG, the molecularweight of the aggregate decreased to 277 kDa, and the electropho-resis profile revealed two distinct bands, with a molecular weightof 62 kDa and 54.3 kDa, corresponding to unglycated collagen pep-tides (Fig. 3b, lanes 6 and 8). In the presence of the highest concen-tration of AG, the cross-linking of collagen peptides wascompletely inhibited, with the disappearance of the molecularaggregate; however, the collagen peptides were very weakly silverstained, similar with the profile obtained in the presence of glucoseat 80 mM AG (Fig. 3b, lane 7 and Fig. 3a, lane 7).
3.3. The effect of AG on collagen glycation with AGE-BSA
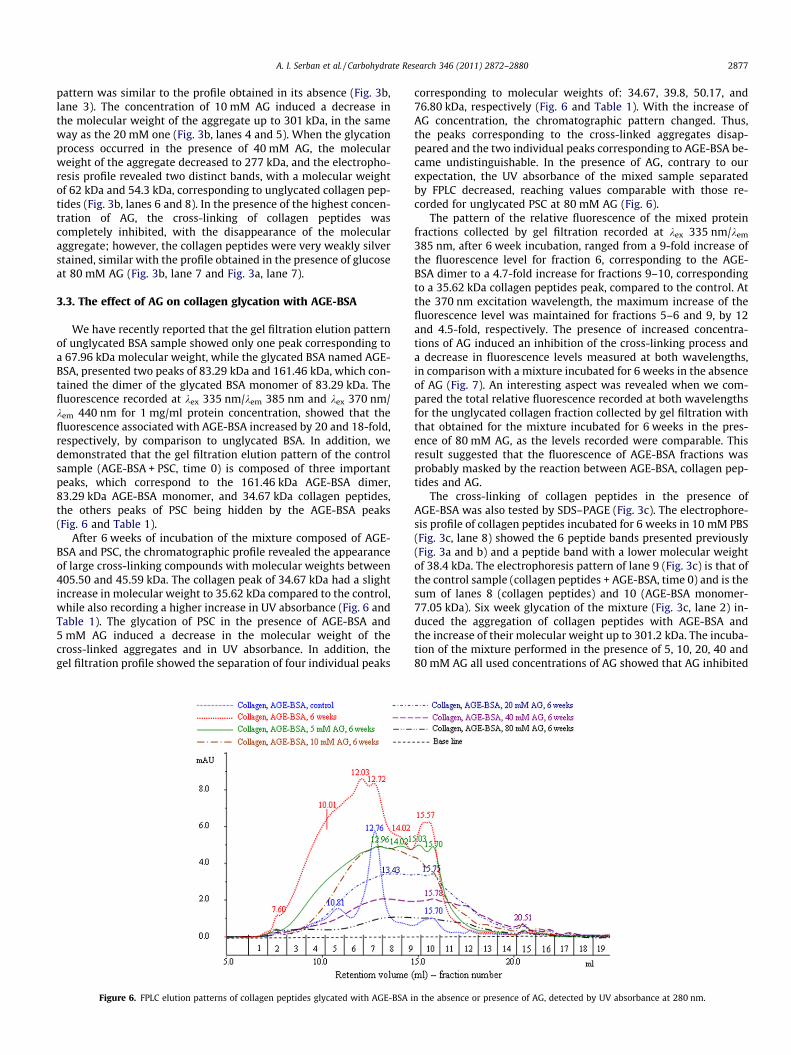
We have recently reported that the gel filtration elution patternof unglycated BSA sample showed only one peak corresponding toa 67.96 kDa molecular weight, while the glycated BSA named AGE-BSA, presented two peaks of 83.29 kDa and 161.46 kDa, which con-tained the dimer of the glycated BSA monomer of 83.29 kDa. Thefluorescence recorded at kex 335 nm/kem 385 nm and kex 370 nm/kem 440 nm for 1 mg/ml protein concentration, showed that thefluorescence associated with AGE-BSA increased by 20 and 18-fold,respectively, by comparison to unglycated BSA. In addition, wedemonstrated that the gel filtration elution pattern of the controlsample (AGE-BSA + PSC, time 0) is composed of three importantpeaks, which correspond to the 161.46 kDa AGE-BSA dimer,83.29 kDa AGE-BSA monomer, and 34.67 kDa collagen peptides,the others peaks of PSC being hidden by the AGE-BSA peaks(Fig. 6 and Table 1).
After 6 weeks of incubation of the mixture composed of AGE-BSA and PSC, the chromatographic profile revealed the appearanceof large cross-linking compounds with molecular weights between405.50 and 45.59 kDa. The collagen peak of 34.67 kDa had a slightincrease in molecular weight to 35.62 kDa compared to the control,while also recording a higher increase in UV absorbance (Fig. 6 andTable 1). The glycation of PSC in the presence of AGE-BSA and5 mM AG induced a decrease in the molecular weight of thecross-linked aggregates and in UV absorbance. In addition, thegel filtration profile showed the separation of four individual peaks
Figure 6. FPLC elution patterns of collagen peptides glycated with AGE-BSA i
corresponding to molecular weights of: 34.67, 39.8, 50.17, and76.80 kDa, respectively (Fig. 6 and Table 1). With the increase ofAG concentration, the chromatographic pattern changed. Thus,the peaks corresponding to the cross-linked aggregates disap-peared and the two individual peaks corresponding to AGE-BSA be-came undistinguishable. In the presence of AG, contrary to ourexpectation, the UV absorbance of the mixed sample separatedby FPLC decreased, reaching values comparable with those re-corded for unglycated PSC at 80 mM AG (Fig. 6).
The pattern of the relative fluorescence of the mixed proteinfractions collected by gel filtration recorded at kex 335 nm/kem
385 nm, after 6 week incubation, ranged from a 9-fold increase ofthe fluorescence level for fraction 6, corresponding to the AGE-BSA dimer to a 4.7-fold increase for fractions 9–10, correspondingto a 35.62 kDa collagen peptides peak, compared to the control. Atthe 370 nm excitation wavelength, the maximum increase of thefluorescence level was maintained for fractions 5–6 and 9, by 12and 4.5-fold, respectively. The presence of increased concentra-tions of AG induced an inhibition of the cross-linking process anda decrease in fluorescence levels measured at both wavelengths,in comparison with a mixture incubated for 6 weeks in the absenceof AG (Fig. 7). An interesting aspect was revealed when we com-pared the total relative fluorescence recorded at both wavelengthsfor the unglycated collagen fraction collected by gel filtration withthat obtained for the mixture incubated for 6 weeks in the pres-ence of 80 mM AG, as the levels recorded were comparable. Thisresult suggested that the fluorescence of AGE-BSA fractions wasprobably masked by the reaction between AGE-BSA, collagen pep-tides and AG.
The cross-linking of collagen peptides in the presence ofAGE-BSA was also tested by SDS–PAGE (Fig. 3c). The electrophore-sis profile of collagen peptides incubated for 6 weeks in 10 mM PBS(Fig. 3c, lane 8) showed the 6 peptide bands presented previously(Fig. 3a and b) and a peptide band with a lower molecular weightof 38.4 kDa. The electrophoresis pattern of lane 9 (Fig. 3c) is that ofthe control sample (collagen peptides + AGE-BSA, time 0) and is thesum of lanes 8 (collagen peptides) and 10 (AGE-BSA monomer-77.05 kDa). Six week glycation of the mixture (Fig. 3c, lane 2) in-duced the aggregation of collagen peptides with AGE-BSA andthe increase of their molecular weight up to 301.2 kDa. The incuba-tion of the mixture performed in the presence of 5, 10, 20, 40 and80 mM AG all used concentrations of AG showed that AG inhibited
n the absence or presence of AG, detected by UV absorbance at 280 nm.
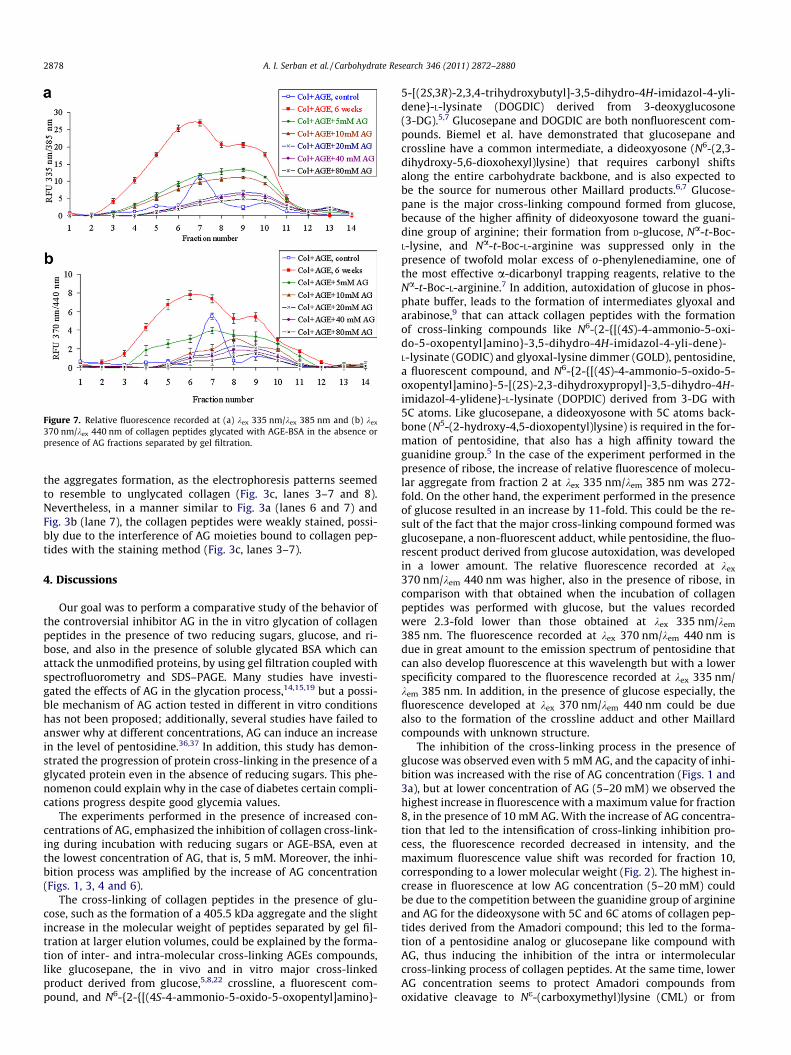
Figure 7. Relative fluorescence recorded at (a) kex 335 nm/kex 385 nm and (b) kex
370 nm/kex 440 nm of collagen peptides glycated with AGE-BSA in the absence orpresence of AG fractions separated by gel filtration.
2878 A. I. Serban et al. / Carbohydrate Research 346 (2011) 2872–2880
the aggregates formation, as the electrophoresis patterns seemedto resemble to unglycated collagen (Fig. 3c, lanes 3–7 and 8).Nevertheless, in a manner similar to Fig. 3a (lanes 6 and 7) andFig. 3b (lane 7), the collagen peptides were weakly stained, possi-bly due to the interference of AG moieties bound to collagen pep-tides with the staining method (Fig. 3c, lanes 3–7).
4. Discussions
Our goal was to perform a comparative study of the behavior ofthe controversial inhibitor AG in the in vitro glycation of collagenpeptides in the presence of two reducing sugars, glucose, and ri-bose, and also in the presence of soluble glycated BSA which canattack the unmodified proteins, by using gel filtration coupled withspectrofluorometry and SDS–PAGE. Many studies have investi-gated the effects of AG in the glycation process,14,15,19 but a possi-ble mechanism of AG action tested in different in vitro conditionshas not been proposed; additionally, several studies have failed toanswer why at different concentrations, AG can induce an increasein the level of pentosidine.36,37 In addition, this study has demon-strated the progression of protein cross-linking in the presence of aglycated protein even in the absence of reducing sugars. This phe-nomenon could explain why in the case of diabetes certain compli-cations progress despite good glycemia values.
The experiments performed in the presence of increased con-centrations of AG, emphasized the inhibition of collagen cross-link-ing during incubation with reducing sugars or AGE-BSA, even atthe lowest concentration of AG, that is, 5 mM. Moreover, the inhi-bition process was amplified by the increase of AG concentration(Figs. 1, 3, 4 and 6).
The cross-linking of collagen peptides in the presence of glu-cose, such as the formation of a 405.5 kDa aggregate and the slightincrease in the molecular weight of peptides separated by gel fil-tration at larger elution volumes, could be explained by the forma-tion of inter- and intra-molecular cross-linking AGEs compounds,like glucosepane, the in vivo and in vitro major cross-linkedproduct derived from glucose,5,8,22 crossline, a fluorescent com-pound, and N6-{2-{[(4S-4-ammonio-5-oxido-5-oxopentyl]amino}-
5-[(2S,3R)-2,3,4-trihydroxybutyl]-3,5-dihydro-4H-imidazol-4-yli-dene}-L-lysinate (DOGDIC) derived from 3-deoxyglucosone(3-DG).5,7 Glucosepane and DOGDIC are both nonfluorescent com-pounds. Biemel et al. have demonstrated that glucosepane andcrossline have a common intermediate, a dideoxyosone (N6-(2,3-dihydroxy-5,6-dioxohexyl)lysine) that requires carbonyl shiftsalong the entire carbohydrate backbone, and is also expected tobe the source for numerous other Maillard products.6,7 Glucose-pane is the major cross-linking compound formed from glucose,because of the higher affinity of dideoxyosone toward the guani-dine group of arginine; their formation from D-glucose, Na-t-Boc-L-lysine, and Na-t-Boc-L-arginine was suppressed only in thepresence of twofold molar excess of o-phenylenediamine, one ofthe most effective a-dicarbonyl trapping reagents, relative to theNa-t-Boc-L-arginine.7 In addition, autoxidation of glucose in phos-phate buffer, leads to the formation of intermediates glyoxal andarabinose,9 that can attack collagen peptides with the formationof cross-linking compounds like N6-(2-{[(4S)-4-ammonio-5-oxi-do-5-oxopentyl]amino}-3,5-dihydro-4H-imidazol-4-yli-dene)-L-lysinate (GODIC) and glyoxal-lysine dimmer (GOLD), pentosidine,a fluorescent compound, and N6-{2-{[(4S)-4-ammonio-5-oxido-5-oxopentyl]amino}-5-[(2S)-2,3-dihydroxypropyl]-3,5-dihydro-4H-imidazol-4-ylidene}-L-lysinate (DOPDIC) derived from 3-DG with5C atoms. Like glucosepane, a dideoxyosone with 5C atoms back-bone (N5-(2-hydroxy-4,5-dioxopentyl)lysine) is required in the for-mation of pentosidine, that also has a high affinity toward theguanidine group.5 In the case of the experiment performed in thepresence of ribose, the increase of relative fluorescence of molecu-lar aggregate from fraction 2 at kex 335 nm/kem 385 nm was 272-fold. On the other hand, the experiment performed in the presenceof glucose resulted in an increase by 11-fold. This could be the re-sult of the fact that the major cross-linking compound formed wasglucosepane, a non-fluorescent adduct, while pentosidine, the fluo-rescent product derived from glucose autoxidation, was developedin a lower amount. The relative fluorescence recorded at kex
370 nm/kem 440 nm was higher, also in the presence of ribose, incomparison with that obtained when the incubation of collagenpeptides was performed with glucose, but the values recordedwere 2.3-fold lower than those obtained at kex 335 nm/kem
385 nm. The fluorescence recorded at kex 370 nm/kem 440 nm isdue in great amount to the emission spectrum of pentosidine thatcan also develop fluorescence at this wavelength but with a lowerspecificity compared to the fluorescence recorded at kex 335 nm/kem 385 nm. In addition, in the presence of glucose especially, thefluorescence developed at kex 370 nm/kem 440 nm could be duealso to the formation of the crossline adduct and other Maillardcompounds with unknown structure.
The inhibition of the cross-linking process in the presence ofglucose was observed even with 5 mM AG, and the capacity of inhi-bition was increased with the rise of AG concentration (Figs. 1 and3a), but at lower concentration of AG (5–20 mM) we observed thehighest increase in fluorescence with a maximum value for fraction8, in the presence of 10 mM AG. With the increase of AG concentra-tion that led to the intensification of cross-linking inhibition pro-cess, the fluorescence recorded decreased in intensity, and themaximum fluorescence value shift was recorded for fraction 10,corresponding to a lower molecular weight (Fig. 2). The highest in-crease in fluorescence at low AG concentration (5–20 mM) couldbe due to the competition between the guanidine group of arginineand AG for the dideoxysone with 5C and 6C atoms of collagen pep-tides derived from the Amadori compound; this led to the forma-tion of a pentosidine analog or glucosepane like compound withAG, thus inducing the inhibition of the intra or intermolecularcross-linking process of collagen peptides. At the same time, lowerAG concentration seems to protect Amadori compounds fromoxidative cleavage to Ne-(carboxymethyl)lysine (CML) or from
A. I. Serban et al. / Carbohydrate Research 346 (2011) 2872–2880 2879
decomposition to 3-DG. This supposition might be supported bythe experiments made by Culbertson et al. that emphasized a max-imum pentosidine increase of 16-fold, when the glycation of BSAwas performed in the presence of 50 mM ribose, 0.3 mM Trolox,and 0.3 mM AG.36 At higher concentrations of AG (40 and80 mM), when the molar ratio of AG: reducing sugar was lowerthan 1:6, the fluorescence began to decrease because at this con-centration AG can block the glycation process at several points;AG could react with the reducing sugar, Amadori compounds, dide-oxyosones, or other a-dicarbonyl compounds. For this reason, thepentosidine analog was probably formed in lower amounts thanexpected and additional compounds might have been formed.Thus, Biemel and co-workers could not identify the expected glu-cosepane analog when the incubation molar ratio of AG: glucose:Na-t-Boc-L-lysine was 1:1:3 or 2:1:3. Instead what they detectedwas an aminotriazine derivative of N6-(2,3-dihydroxy-5,6-diox-ohexyl)lysine, the dideoxyosone with 6C atoms.6,38 These resultsshowed that when the AG concentration is close to the concentra-tion of the reducing sugar, in the presence of lysine residue, the for-mation of triazine could be induced, however the guanidine groupreduced the nucleophilicity of amino group of AG.20 The electro-phoresis pattern of collagen peptides glycated in the presence of40 and 80 mM AG (Fig. 3a, lanes 6 and 7), demonstrated that AGat higher concentrations induced a complete inhibition of cross-linking, probably due to the reaction of AG with Amadori com-pounds, dideoxyosones, or other intermediary products linked tocollagen peptides that generated compounds with amino-terminalgroups, irrespective of structures formed. This aspect can explainthe weak silver staining of collagen peptides, because the free ami-no groups grafted to the collagen peptides reacted with formalde-hyde molecules and decreased the reduction of silver ions tometallic silver.
Unexpected elevation of pentosidine formation in collagenincubated with 250 mM glucose and low AG concentration hasbeen reported.37 These experiments showed that the maximumparadoxical increase in pentosidine was observed with 8 mM AG(172 ± 5% by comparing with the glycated compound). Increaseswere found at concentrations from 1.6 mM to 18 mM AG. An inhib-itory effect of AG was observed at 40 and 89 mM AG, when thepentosidine level decreased by 75% and 90%, respectively. These re-sults were in good correlation with our experiments, when themaximum increase in fluorescence level was at 10 mM AG. In addi-tion, Culberson and co-workers, found a similar increase of 1.2-foldin pentosidine level after incubation of BSA with 250 mM glucoseand 5 mM AG for 21 days at 37 �C.36
When the glycation process was performed in the presence ofribose, a 10-fold higher reacting sugar than glucose, a change inchromatographic and fluorescence profiles was noticed. Thehighest increase in fluorescence, the apparition of 427 kDacross-linking aggregates and the increase in molecular weightof collagen peptides could be due to a great extent to pentosi-dine formation, an intra- and intermolecular cross-linking fluo-rescent adduct and probably to a minor degree to DOPDIC, anon-fluorescent cross-linking compound. In the pentosidine for-mation pathway, the dideoxyosone (N5-(2-hydroxy-4,5-diox-opentyl)lysine) plays an important role. This compound verylikely undergoes ring closure to form 6-(3-hydroxy-5-oxo-2,3,4,5-tetrahydro-1-pyridinium-yl)norleucine, which then reactswith an arginine side chain to form pentosinane and finallypentosidine.6
In the presence of 5 mM AG, due to the greater glycation capac-ity of ribose, the inhibition of cross-linking process was too low(Figs. 3b and 4), in comparison with the electrophoretic and chro-matographic profiles obtained in the presence of glucose and 5 mMAG (Figs. 1 and 3a). Like in the case of collagen peptides incubatedwith glucose and lower AG concentrations (5, 10 and 20 mM), the
chromatographic profile and the fluorescence recorded at kex
335 nm/kem 385 nm showed an increase in UV absorbance andfluorescence values for fractions that correspond to lower molecu-lar weights, with a maximum increase at fraction 8, in the presenceof 10 mM AG (Figs. 4 and 5a). In addition, at 10 mM AG, theelectrophoretic, chromatographic, and fluorescence profilesemphasized the decrease in molecular weight and fluorescenceof cross-linking aggregates, suggesting the development of theinhibition effect of AG on the cross-linking process (Figs. 3b, 4and 5). These results could be explained in a similar way like inthe case of the glucose experiment, by the formation of a pentozi-dine analog from the reaction between the dideoxyosone (N5-(2-hydroxy-4,5-dioxopentyl)lysine) and AG, that induce the inhibitionof intra- or intermolecular cross-linking process of collagen pep-tides. All in all, the differences between the experiment performedin the presence of glucose and ribose observed in the electropho-retic and chromatographic profiles, coupled with fluorescencemeasurement and the fact that the cross-linking with ribose isinhibited in a great proportion only at 80 mM AG, seem to bedue to the great power of ribose in glycation process. However,the mechanism of AG action is similar for both reducing sugars.In addition, the silver staining intensity of glycated collagen pep-tides is higher with ribose than with glucose. In the ribose glyca-tion experiment, only the electrophoresis pattern of collagenglycated in the presence of 80 mM AG was poorly stained(Fig. 3b, lane 7) while in glucose glycation, two lanes, correspond-ing to collagen peptides glycated in the presence of 40 and 80 mMAG, were poorly stained (Fig. 3a, lanes 6 and 7). Thus, for the gly-cation process to be inhibited in the presence of a more powerfulsugar, a higher concentration of AG is necessary, leading to the for-mation of products with free amino groups attached to collagenpeptides which reduce the silver staining. Hodny and co-workersshowed that in vitro incubation of acid-soluble rat-tail tendon col-lagen with various sugars led to an increase in silver staining com-pared with samples incubated in the absence of sugar and thiseffect was inhibited by AG.39 They concluded that the enhanced sil-ver susceptibility of glycated collagen is related to advanced-phaseMaillard reaction products attached to collagen.
The chromatographic profile coupled with the fluorescencemeasurement of the separated fractions and the electrophoreticpattern of collagen peptides incubated for 6 weeks with AGE-BSArevealed the continued formation and cross-linking of AGEs;additionally, it also demonstrated that soluble AGEs could be thecause of collagen cross-linking noticed in diabetes, even in the ab-sence of free glucose. This may be due to the existence of early gly-cation products (Schiff base and Amadori product) on glycated BSA.Zyzak et al. observed that the half-life of Amadori compound onglycated collagen in 10 mM PBS, a physiological buffer concentra-tion, was 75 days.40 In our experiment, BSA was glycated for6 weeks with glucose in 10 mM PBS, and in those conditions, whenthe collagen peptides were incubated with glycated BSA, therewere sufficient Amadori compounds attached to BSA for the gener-ation of reactive intermediates for the propagation of the Maillardreaction. Thus, Amadori compounds can decompose spontaneouslyat pH 7.4 and 37 �C by parallel reactions, such as the reversal ofAmadori products to mannose and glucose, reverse aldol rear-rangements, hydrolysis, oxidation, and fragmentation that proba-bly form reactive compounds like tetroses, pentoses, short chainsugars, and dicarbonyl compounds (glyoxal, methylglyoxal and 3-deoxyglucosone).40–42 Amadori compounds and these very reactiveproducts can attack the lysine and arginine residues of peptidesand finally form fluorescent or non-fluorescent intra- or intermo-lecular cross-linking AGEs (Figs. 3c and 6). By incubation of waterinsoluble proteins from aged or brunescent lenses with bovine lensproteins, Chellan and Nagaraj, demonstrated that glucose-derivedearly glycation products produce pentosidine on unglycated pro-
2880 A. I. Serban et al. / Carbohydrate Research 346 (2011) 2872–2880
teins.43 Thus, the increase of fluorescent level of mixture (AGE-BSAand collagen peptides) after 6 weeks of incubation could be due tointra- and intermolecular pentosidine formation from early glyca-tion products on AGE-BSA (Fig. 7). The 405 kDa compound pre-sented lower fluorescence, probably because glucosepan, a nonfluorescent cross-linking compound, is the major product formedfrom Amadori product of AGE-BSA. The increase of kex 370 nm/kem 440 nm fluorescence level of fractions 5–6 that correspondsto AGE-BSA dimer (of control) could be explained by the formationof a ‘crossline-like compound’.7
The incubation of the mixture performed in the presence of in-creased concentration of AG showed that AG inhibited the cross-linking process even at lower concentration and decreased thefluorescence levels in a concentration dependent manner(Figs. 3c, 6 and 7). In this case, AG could react with Amadori com-pounds, short chain sugar, dicarbonyl compounds, or other inter-mediary products free or linked to collagen peptides, thusforming free or attached amino triazines, pentozidine, and glucose-pane analogs and other AG derivates with amino-terminal groups.In this experiment we did not find an elevation of fluorescence le-vel in the presence of AG as before, because Amadori compoundsattached to glycated BSA were in a low amount at the beginningof incubation (24 mg/ml PSC+0.5 mg/ml AGE-BSA). It appears thateven 5 mM AG is a high concentration for the initial quantity ofAGE-BSA and this situation could be similar with those registeredfor the incubation of collagen peptides in the presence of a reduc-ing sugar and 40–80 mM AG. This would explain the weak stainingof the electrophoresis pattern corresponding to the samplemixtures incubated in the presence of AG (Fig. 3c, lanes 3–7).
5. Conclusions
While it is apparent that AG inhibits collagen cross-linkingeither in the presence of reducing sugars or glycated proteins,the fluorescence measurements suggest that AG has different andmultiple mechanisms of action. The highest increase in fluores-cence recorded in the presence of reducing sugars and AG, is prob-ably due to the competition between the guanidine group of AGand the arginine residues of proteins for some protein-bound dide-oxyosones, Amadori derivates’ products, which could form fluores-cent compounds like pentosidine. For this reason, the treatmentwith AG derivatives deserves further reconsideration and a solu-tion to decrease its toxicity and improve its pharmacokinetichalf-life must be found.
Acknowledgements
The authors thank for the scientific support to COST 1001/2010Action.
References
1. Andreassen, T.; Seyer-Hansen, K.; Bailey, A. J. Biochim. Biophys. Acta 1981, 677,313–317.
2. Monnier, V. M.; Cerami, A. Science 1981, 211, 491–493.3. Monnier, V. M.; Sell, D. R.; Nagaraj, R. H.; Miyata, S.; Grandhee, S.; Odetti, P.
Diabetes 1992, 41, 36–41.4. Monnier, V. M.; Bautista, O.; Sell, D. R.; Fogarty, J.; Genuth, S. Diabetes 1999, 48,
870–880.5. Biemel, M. K.; Reihl, O.; Conrad, J.; Lederer, M. O. J. Biol. Chem. 2001, 276,
23405–23412.6. Biemel, K. M.; Conrad, J.; Lederer, M. O. Angew. Chem., Int. Ed. 2002, 41, 801–
804.7. Biemel, K. M.; Fried, D. A.; Lederer, M. O. J. Biol. Chem. 2002, 277, 24907–24915.8. Sell, D. R.; Biemel, K. M.; Reihl, O.; Lederer, M. O.; Strauch, C. M.; Monnier, V. M.
J. Biol. Chem. 2005, 280, 12310–12315.9. Wells-Knecht, K. J.; Zyzak, D. V.; Lichfield, J. E.; Thorpe, S. R.; Baynes, J. W.
Biochemistry 1995, 34, 3702–3709.10. Wolff, S. P.; Dean, R. T. Biochem. J. 1987, 245, 243–250.11. Namiki, M.; Hayashi, T. Am. Chem. Soc. Symp. Ser. 1983, 215, 21–46.12. Booth, A. A.; Khalifah, R. G.; Todd, P.; Hudson, B. G. J. Biol. Chem. 1997, 272,
5430–5437.13. Brownlee, M.; Vlassara, H.; Kooney, A.; Ulrich, P.; Cerami, A. Science 1986, 232,
1629–1632.14. Thornalley, P. J. Arch. Biochem. Biophys. 2003, 419, 31–40.15. Sell, D. R.; Nelson, J. F.; Monnier, V. M. J. Gerontol. A Biol. Sci. Med. Sci. 2001, 56,
B405–411.16. Ikeda, K.; Matsumoto, K.; Horiuchi, S.; Zhao, H.; Abraham, E. C. Biochem.
Biophys. Res. Commun. 1997, 241, 352–354.17. Miyoshi, H.; Tagughi, T.; Sugiura, M.; Takeuchi, M.; Miwa, I.; Makita, Z.; Koike,
T. Horm. Metab. Res. 2002, 34, 371–377.18. Wilkinson Berka, J. L.; Kelly, D. J.; Koerner, S. M.; Jaworski, K.; Davis, B.; Thallas,
V.; Cooper, M. E. Diabetes 2002, 51, 3283–3289.19. Osicka, T. M.; Yu, Y.; Panagiotopoulos, S.; Clavant, S. P.; Pratt, L. M.; Russo, L. M.;
Kemp, B. E.; Comper, W. D.; Jerums, G. Diabetes 2000, 49, 87–93.20. Miyata, T.; Ueda, Y.; Asahi, K.; Izuhara, Y.; Inagi, R.; Saito, A.; Van Ypersele De
Strihou, C.; Kurokawa, K. J. Am. Soc. Nephrol. 2000, 11, 1719–1725.21. Kline, B. W.; Abdel-Rahman, E. Expert Opin. Invest. Drugs 2002, 11, 565–574.22. Birrel, A. M.; Hefferman, S. J.; Kirwan, P.; McLennan, S.; Gillin, A. G.; Yue, D. K. J.
Diabetes Complications 2002, 16, 301–309.23. Kelly, D. J.; Gilbert, R. E.; Cox, A. J.; Soulis, T.; Jerums, G.; Cooper, M. E. J. Am. Soc.
Nephrol. 2001, 12, 2098–2107.24. Hammes, H. P.; Martin, S.; Federlin, K.; Geisen, K.; Brownlee, M. Proc. Natl. Acad.
Sci. U.S.A. 1991, 88, 11555–11558.25. Roufail, E.; Soulis, T.; Boel, E.; Cooper, M. E.; Rees, S. Diabetologia 1998, 41,
1419–1425.26. Cameron, N. E.; Cotter, M. A. Metabolism 1996, 45, 1147–1152.27. Yagihashi, S.; Kamijo, M.; Baba, M.; Yagihashi, N.; Nagai, K. Diabetes 1992, 41,
47–52.28. Kern, T. S.; Tang, J.; Mizutani, M.; Kowluru, R. A.; Nagaraj, R. H.; Romeo, G.
Invest. Ophtamol. Vis. Sci. 2000, 41, 3972–3978.29. Kern, T. S.; Engerman, R. L. Diabetes 2001, 50, 1336–1342.30. Degenhardt, T. P.; Fu, M. X.; Voss, E.; Reiff, K.; Neidlein, R.; Strein, K.; Thorpe, S.
R.; Baynes, J. W.; Reiter, R. Diabetes Res. Clin. Pract. 1999, 43, 81–89.31. Serban, A. I.; Condac, E.; Costache, M.; Dinischiotu, A. Rev. Roum. Chim. 2009, 54,
93–101.32. Stegemann, H.; Stadler, K. Clin. Chim. Acta 1967, 18, 267–273.33. Serban, A. I.; Costache, M.; Dinischiotu, A. Exp. Diab. Res. 2008, 2008, 7.
doi:10.1155/2008/473603.34. Laemmli, U. K. Nature 1970, 227, 680–685.35. Chevallet, M.; Luche, S.; Rabilloud, T. Nat. Protocols 2006, 1, 1852–1858.36. Culbertson, S. M.; Morrison, L. D.; Vassilenko, I. E.; Ingold, K. U. J. Biol. Chem.
2003, 278, 38384–38394.37. Urios, P.; Grigorova-Borsos, A.-M.; Sternberg, M. Diabetologia 2004, 47, 959–
961.38. Reihl, O.; Biemel, K. M.; Lederer, M. O.; Schwack, W. Carbohydr. Res. 2004, 339,
705–714.39. Hodny, Z.; Struzinsky, R.; Deyl, Z. J. Chromatogr. 1992, 578, 53–62.40. Zyzak, D. V.; Richardson, J. M.; Thorpe, S. R.; Baynes, J. W. Arch. Biochem.
Biophys. 1995, 316, 547–554.41. Thornalley, P. J. Ann. N.Y. Acad. Sci. 2005, 1043, 111–117.42. Thornalley, P. J.; Langborg, A.; Minhas, H. S. Biochem. J. 1999, 344, 109–116.43. Chellan, P.; Nagaraj, R. H. J. Biol. Chem. 2001, 276, 3895–3903.