Small-scale guild proportions and niche complementarity in a Caucasian subalpine hay meadow
Vol 21, No. 2;Feb 2014
COMPARISON OF BODY PROPORTIONS OF
SPORTMEN FROM DIFFERENT BRANCHES
Elvin Onarıcı Güngör1, Can Cemal Cingi PhD2, Nuray Bayar Muluk MD3, Barıs Gurol4, Cemal Cingi
MD5, Özge Bolluk6
1Research Assistant, School of Physical Education and Sports, Anadolu University, Eskisehir, Turkey
2Instractor, Communication Design and Management, Faculty of Communication Sciences, Anadolu University,
Eskisehir, Turkey
3Professor in Kırıkkale University, Faculty of Medicine, ENT Department, Kırıkkale, Turkey
4Research Assistant, School of Physical Education and Sports, Anadolu University, Eskisehir, Turkey 5Professor
in Eskisehir Osmangazi University, Faculty of Medicine, ENT Department, Eskisehir, Turkey
6Research Assistant, Eskisehir Osmangazi University, Biostatistics and Medical Informatics Department,
Eskişehir, Turkey
Elvin Onarici Gungor (Corresponding author)
Faculty of Sport Science, Anadolu University,
Iki Eylul Campus, Eskisehir, Turkey
Tel: +90 222 3350580-6718, +90 533 4694805 E-mail: [email protected]
Conflict of interest: The authors declare that there is no conflict of interest
Acknowledgement:
"With exception of data collection, preparation of this paper including design and planning was
supported by Continuous Education and Scientific Research Association."
Abstract
Purpose: Body proportions of humans may be different between various sportive branches. We investigated the
body proportions of volleyball and basketball players and track and field athletes.
Method: The study was conducted with 88 male students of School of Physical Education and Sports: Group1:
Basketball players (n=37), Group 2: Volleyball players (n=23), and Group 3: Track and field athletes (n=28).
Height, chest circumference, difference of inspiration and expiration chest circumference, waist circumference,
hip circumference, waist/hip circumferences, length from crista to below the foot, length from the root of the
penis and below the foot, length from head to chin, length from chin to chest, length from chest to abdomen,
length from abdomen to root of the penis were measured.
New Results: In basketball players, “Height”; and “Difference of inspiration and expiration chest
circumference” values were higher than volleyball players and track and field athletes. In volleyball players,
“Waist circumference”, “Hip circumference” and “Waist/hip circumference” values were higher than basketball
players and track and field athletes.
Conclusion: Chest circumference and respiratory capacities of the sportmen were improved in basketball
players. In volleyball players, the body circumference was wider; whereas in basketball players, the reaching the
ball movement might have caused elongation of the body and the arms.
Key words: Volleyball players, Basketball players, Track and field athletes, body proportions.
Vol 21, No. 2;Feb 2014
1.Introduction The drawing of the Vitruvian Man by the famed renaissance artist Leonardo da Vinci in the late fifteenth century
(circa 1487) is representation of ideal human proportions (male) described by the ancient Roman architect
Vitruvius. Leonardo created this work based on the writings of Marcus Vitruvius Pollio, a master architect in the
Roman Empire. It is generally considered to be a supreme example of the synergy between art and science
(Ashrafian, 2011; Maloney et al, 2011; Pollio, 2006). There are some researches about the growth of body limbs.
Ontogenetic research and migrant studies have demonstrated that body proportions are largely genetically
controlled (Hooliday, 1997).
According to other researches ethnicity, genetic and hormonal are very important factors of body composition
and growth process (Wagner et al, 2000). Additionally nutrition, are important factor for the bone mass
development of preadolescent (Rogol et al, 2000; Ilich et al, 1998). Based on the previous researches it can be
said that genetic, ethnicity, nutrition are the important factors for the anthropometric growth. Ethnicity is said as
a single word. But so many different ethnic groups are living in Anatolia, which is the cradle of civilization for
centuries.
Anthropometric data, body composition, bone density, muscle mass between different sport branches were
researched in previous literature (Andreoli et al, 2001; Damsgaard et al, 2001). It’s known that moderate activity
is associated with cardiovascular benefits and favorable changes in body composition (Rogol,et al, 2000). Two
studies were done in Turkey about Vitruvius square. One of them was about the evaluation of Turkish males
with respect to Leonardo’s circle and upper extremity ratios (Yilmaz et al, 2005). Other one was about Vitruvius
Square and related equations in Turkish men in terms of artistic anatomy (Cikmaz et al., 2007). Both of these
studies were applied to regular population. But there is not any study comparing the differences of body
proportions among different sport branches.
Body proportions of athletes from different branches were investigated in this study among basketball, volleyball
and track and field athletes of Physical Education and Sports Department compared with the Leonardo’s perfect
anatomical representation. So research group that included in this study consisted of people who have sportsman
since childhood. We predict that lengths of extremity and body proportions of the subjects can be different from
average values because of they started sport pre-adolescent. The aim of the present study was compare the body
proportions of basketball, volleyball and track and field athletes.
2.Materials and Method
This prospective study was conducted in students of “School of Physical Education and Sports” (SPESp) in
Anadolu University between January to June 2012.
2.1.Participants
The study group was consisted of 88 male students of School of Physical Education and Sports. Their ages were
between 18 and 25. This study was conducted by three sport groups:
Group1: Basketball players (n=37)
Group 2: Volleyball players (n=23)
Group 3: Track and field athletes (n=28)
2.2.Instruments and Procedure
All measurements were performed by the same investigator using the same measuring devices for all and
repeated for reliability. Height, chest circumference, difference of inspiration and expiration chest
circumference, waist circumference, hip circumference, waist/hip circumferences, length from crista to ground,
length from the inner side of the leg and ground, length from head to chin, length from chin to chest, length from
chest to abdomen, length from abdomen to root of the penis were measured.
Height was measured to the nearest 0.1 cm using a stadiometer (Holtain Ltd) with the subject wearing sports
clothing and no shoes. Measure the circumference of the chest at maximum inspiration and expiration procedure:
The patient is standing with arms hanging relaxed. The circumference was measured immediately bellowed the
nipples in men while maximum inspiration and expiration (Backup, 2008). Waist–hip ratio (i.e. the waist
circumference divided by the hip circumference) was suggested as an additional measure of body fat
distribution. The ratio can be measured more precisely than skin folds, and it provides an index of both
subcutaneous and intra‐ abdominal adipose tissue (Bjorntorp, 1987). Waist circumference is measured at the
narrowest portion of the torso, while hip circumference is measured at the level of greater trochanters as
Hoffman (Hoffman, 2006) did.
All the steps of the study were planned and carried out according to the principles outlined in the Declaration of
Helsinki (2004). Local Ethics Committee Approval of Eskişehir Osmangazi University was also present for this
study.
2.3.Statistical Analysis
Vol 21, No. 2;Feb 2014
SPSS 16.0 was used for statistical analysis. Kruskal Wallis Variance Analysis and Mann Whitney U test with
Bonferroni correction were used.
The level of significance was set at p<0.05.
3.Results
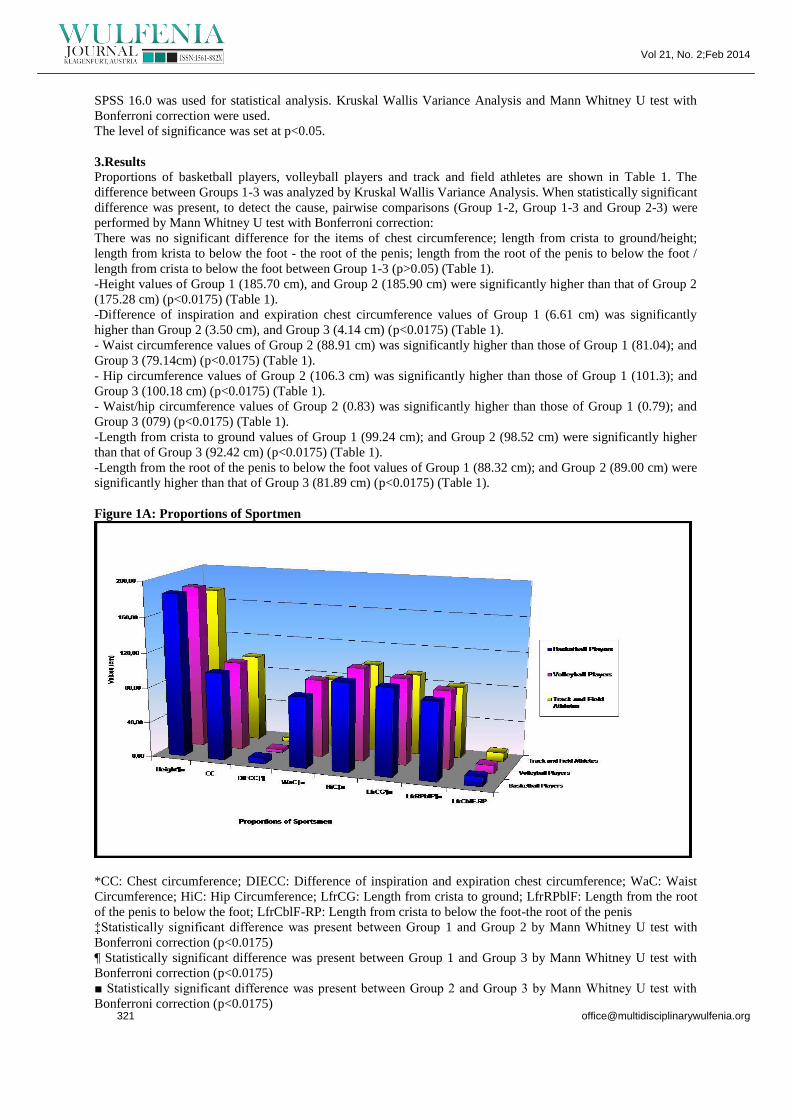
Proportions of basketball players, volleyball players and track and field athletes are shown in Table 1. The
difference between Groups 1-3 was analyzed by Kruskal Wallis Variance Analysis. When statistically significant
difference was present, to detect the cause, pairwise comparisons (Group 1-2, Group 1-3 and Group 2-3) were
performed by Mann Whitney U test with Bonferroni correction:
There was no significant difference for the items of chest circumference; length from crista to ground/height;
length from krista to below the foot - the root of the penis; length from the root of the penis to below the foot /
length from crista to below the foot between Group 1-3 (p>0.05) (Table 1).
-Height values of Group 1 (185.70 cm), and Group 2 (185.90 cm) were significantly higher than that of Group 2
(175.28 cm) (p<0.0175) (Table 1).
-Difference of inspiration and expiration chest circumference values of Group 1 (6.61 cm) was significantly
higher than Group 2 (3.50 cm), and Group 3 (4.14 cm) (p<0.0175) (Table 1).
- Waist circumference values of Group 2 (88.91 cm) was significantly higher than those of Group 1 (81.04); and
Group 3 (79.14cm) (p<0.0175) (Table 1).
- Hip circumference values of Group 2 (106.3 cm) was significantly higher than those of Group 1 (101.3); and
Group 3 (100.18 cm) (p<0.0175) (Table 1).
- Waist/hip circumference values of Group 2 (0.83) was significantly higher than those of Group 1 (0.79); and
Group 3 (079) (p<0.0175) (Table 1).
-Length from crista to ground values of Group 1 (99.24 cm); and Group 2 (98.52 cm) were significantly higher
than that of Group 3 (92.42 cm) (p<0.0175) (Table 1).
-Length from the root of the penis to below the foot values of Group 1 (88.32 cm); and Group 2 (89.00 cm) were
significantly higher than that of Group 3 (81.89 cm) (p<0.0175) (Table 1).
Figure 1A: Proportions of Sportmen
*CC: Chest circumference; DIECC: Difference of inspiration and expiration chest circumference; WaC: Waist
Circumference; HiC: Hip Circumference; LfrCG: Length from crista to ground; LfrRPblF: Length from the root
of the penis to below the foot; LfrCblF-RP: Length from crista to below the foot-the root of the penis
‡Statistically significant difference was present between Group 1 and Group 2 by Mann Whitney U test with
Bonferroni correction (p<0.0175)
¶ Statistically significant difference was present between Group 1 and Group 3 by Mann Whitney U test with
Bonferroni correction (p<0.0175)
■ Statistically significant difference was present between Group 2 and Group 3 by Mann Whitney U test with
Bonferroni correction (p<0.0175)

Vol 21, No. 2;Feb 2014
Table 1: Proportions of Sportmen*
Parameters of Human
Proportions
Measurements of
Basketball Players
(Group 1)
Measurements of
Volleyball Players
(Group 2)
Measurements of
Track and Field
Athletes
(Group 3)
P** Mean Standard
Deviation
Mean Standard
Deviation
Mean Standard
Deviation
Height (cm) ¶■ 185.70 8,98 185,90 2,60 175,28
10,32
0.000
Chest circumference (CC)
(cm) 99,67 7,03 101,83 4,38 98,89 7,26
0.017
Difference of inspiration and
expiration chest
circumference (DIECC) (cm)
‡¶
6,61
1,75
3,50
2,05
4,14
2,17
0.000
Waist Circumference (WaC)
(cm) ‡■ 81,04 7,51 88,91 5,64 79,14 7,96
0.000
Hip Circumference (cm)
(HiC) ‡■
101.3 5,08 106.3 5,37 100,18 6,89
0.001
Waist/hip circumferences
(Wa/HiC)(cm) ‡■
0.79 0,05 0,83
0,03
0,79
0,06
0.003
Length from crista to ground
(LfrCG) (cm) ¶■ 99,24 7,22 98,52 1,95 92,42 6,92
0.000
Length from crista to
ground/height
(LfrCG/He)(cm)
0,53 0,02 0,52 0,01 0,52 0,025
0.259
Length from the root of the
penis to below the foot
(LfrRPblF) (cm) ¶■
88,32 5,80 89,00 1,23 81,89 4,19
0.000
Length from crista to below
the foot - the root of the penis
(LfrCblF-RP)(cm)
10,91 3,75 9,52 2,47 10,53 5,35
0.291
Length from the root of the
penis to below the foot /
Length from crista to below
the foot
(LfrRPblF/LfrCblF)(cm)
0,89 0,03 0,90 0,02 0,88 0,04
0.530
*Values were given as mean±standard deviation
**p value shows the results of Kruskal Wallis Variance Analysis
‡Statistically significant difference was present between Group 1 and Group 2 by Mann Whitney U test with
Bonferroni correction (p<0.0175)
¶ Statistically significant difference was present between Group 1 and Group 3 by Mann Whitney U test with
Bonferroni correction (p<0.0175)
■ Statistically significant difference was present between Group 2 and Group 3 by Mann Whitney U test with
Bonferroni correction (p<0.0175)

Vol 21, No. 2;Feb 2014
Figure 1B: Proportions of Sportmen*
*Wa/HiC: Waist/hip circumferences; LfrCG/He: Length from crista to ground/height; LfrRPblF/LfrCblF:
Length from the root of the penis to below the foot / Length from crista to below the foot
‡Statistically significant difference was present between Group 1 and Group 2 by Mann Whitney U test with
Bonferroni correction (p<0.0175)
¶ Statistically significant difference was present between Group 1 and Group 3 by Mann Whitney U test with
Bonferroni correction (p<0.0175)
■ Statistically significant difference was present between Group 2 and Group 3 by Mann Whitney U test with
Bonferroni correction (p<0.0175)
Proportions of sportmen according to the ideal ratio were shown in Table 2. The difference between Groups 1-3
was analyzed by Kruskal Wallis Variance Analysis. When statistically significant difference was present, to
detect the cause, pairwise comparisons (Group 1-2, Group 1-3 and Group 2-3) were performed by Mann
Whitney U test with Bonferroni correction:
-Length from the top of head to the bottom of the chin values of Group 2 (23.25 cm) was significantly higher
than those of Group 1 (22.48 cm); and Group 3 (21.38 cm); and values of Group 1 (22.48) was significantly
higher than Group 3 (21.38) (p<0.0175) (Table 2).
-Length from chin to breast values of Group 1 (25.55 cm) was significantly higher than those of Group 2 (24.10
cm); and Group 3 (24.15 cm) (p<0.0175) (Table 2).
-Length from breast to abdomen values of Group 2 (25.79 cm) was significantly higher than those of Group 1
(24.03 cm); and Group 3 (22.36 cm) (p<0.0175) (Table 2).
-“Length from abdomen to the root of the penis” values of Group 2 (29.20 cm) was significantly higher than
those of Group 1 (27.29 cm); and Group 3 (25.19 cm) (p<0.0175) (Table 2).
Proportions of Basketball and Volleyball players and Track and Field Athletes and Leonardo da Vinci
Anatomical Proportions were shown on Table 3. The difference between Groups 1-3 was analyzed by Kruskal
Wallis Variance Analysis. When statistically significant difference was present, to detect the value caused
difference, pairwise comparisons (Group 1-2, Group 1-3 and Group 2-3) were performed by Mann Whitney U
test with Bonferroni correction:

Vol 21, No. 2;Feb 2014
- There was no significant difference for the ratios of “Height/Length from above the chest to the top of the
head” and “Height/ Length from the root of the penis to below the foot” between Group 1-3 (p>0.05) (Table 3).
-Height /length from the top of head to the bottom of the chin values of Group 1 (8.29 cm) was significantly
higher than that of Group 2 (8.01 cm) (p<0.0175) (Table 3).
Table 2. Proportions of Sportmen According to the Ideal Ratio
Parameters of
Human
Proportions
Measurements
of Basketball
Players
Measurements
of Volleyball
Players
Measurements of Track and
Field Athletes
P** Mean Standard
Deviation
Mean
Standard
Deviation
Mean Standard
Deviation
Ideal Ratio 24.8 25.6 22.9
Length from the
top of head to the
bottom of the chin
(LfrTHtoBCn)(cm)
‡¶■
22,48 1,77 23,25 1,17 21,38 1,61
0.000
Length from chin
to breast
(LfrCntoBr) (cm)
‡¶
25,55 1,72 24,10 2,26 24,15 1,70
0.000
Length from breast
to abdomen
(LfrBrtoAb) (cm)
‡■
24,03 3,48 25,79 1,41 22,36 1,96
0.000
Length from
abdomen to the
root of the penis
(LfrAbtoRPen)
(cm) ‡■
27,29 4,45 29,20 1,50 25,19 4,25
0.000
*Values were given as mean±standard deviation
**p value shows the results of Kruskal Wallis Variance Analysis
‡Statistically significant difference was present between Group 1 and Group 2 by Mann Whitney U test with
Bonferroni correction (p<0.0175)
¶ Statistically significant difference was present between Group 1 and Group 3 by Mann Whitney U test with
Bonferroni correction (p<0.0175)
■ Statistically significant difference was present between Group 2 and Group 3 by Mann Whitney U test with
Bonferroni correction (p<0.0175)

Vol 21, No. 2;Feb 2014
Table 3. Proportions of Basketball and Volleyball players and Track and Field Athletes and Leonardo da
Vinci Anatomical Proportions*
Parameters
of Human
Proportions
Measurements of
Basketball
Players*
Measurements of
Volleyball Players*
Measurements of
Track and Field
Athletes*
P**
Leonardo da
Vinci’s
Anatomical
Proportions
(Maloney and
Fried, 2011
(2); Pollio,
2006 (3)
Mean Std.Dev. Mean Std.Dev. Mean Std.Dev.
Height /length
from the top
of head to the
bottom of the
chin (cm) ‡
8,29 0,53 8,01 0,42 8,21 0,34
0.010
8.0
Height/Length
from above
the chest to
the top of the
head
3,87 0,17 3,93 0,19 3,85 0,14
0.298
4.0
Height/
Length from
the root of the
penis to below
the foot
2,10 0,07 2,08 0,03 2,14 0,10
0.126
2.0
*Values were given as mean±standard deviation
**p value shows the results of Kruskal Wallis Variance Analysis
‡Statistically significant difference was present between Group 1 and Group 2 by Mann Whitney U test with
Bonferroni correction (p<0.0175)

Vol 21, No. 2;Feb 2014
Figure 2: Proportions of Sportmen According to the Ideal Ratio*
*LfrTHtoBCn: Length from the top of head to the bottom of the chin (cm); LfrCntoBr: Length from chin to
breast; LfrBrtoAb: Length from breast to abdomen; LfrAbtoRPen: Length from abdomen to the root of the penis
‡Statistically significant difference was present between Group 1 and Group 2 by Mann Whitney U test with
Bonferroni correction (p<0.0175)
¶ Statistically significant difference was present between Group 1 and Group 3 by Mann Whitney U test with
Bonferroni correction (p<0.0175)
■ Statistically significant difference was present between Group 2 and Group 3 by Mann Whitney U test with
Bonferroni correction (p<0.0175) 4.Discussion
Musaiger et al. (1994), found that basketball players and volleyball players were the tallest athletes among
different sport branches at Bahrain. As a result of this study volleyball and basketball players were taller than
track and field athletes. Difference between inspiration and expiration chest circumference of basketball players
is more than volleyball players (p<0.05). This result was also supported with the literature from different
countries.
The reason of this difference may not only be the nature of the basketball sport. Basketball is very popular sport
in Turkey at schools. So basketball players start play basketball at early ages. There are so many basketball
schools in big cities like Istanbul, Ankara. On the contrary volleyball schools are not so many. Also Turkey was
the second at FIBA world championship of basketball in 2010.
Our results showed that, in basketball players, “Height”; and “Difference of inspiration and expiration chest
circumference” values were higher than volleyball players and track and field athletes. In volleyball players,
“Waist circumference”, “Hip circumference” and “Waist/hip circumference” values were higher than basketball
players and track and field athletes. In both basketball and volleyball players, “Length from crista to ground” and
“Length from the root of the penis to below the foot” values were significantly higher than track and field
athletes.
Our results also showed that, in basketball players, “Length from chin to breast values” values were higher than
volleyball players and track and field athletes. In volleyball players, “Length from the top of head to the bottom
of the chin” andn“Length from breast to abdomen” values were higher than basketball players and track and field
athletes.
In volleyball player group, “Height /length from the top of head to the bottom of the chin” ratio was lower than
Basketball players. As shown in Table 1, height of the volleyball players was not lower than the other groups.

Vol 21, No. 2;Feb 2014
Therefore, the lower ration of “Height /length from the top of head to the bottom of the chin” may be related to
higher “length from the top of head to the bottom of the chin” values.
In the present study, length from the top of the forehead to the bottom of the chin, length from chin to chest
upper, length from chest to abdomen and length from abdomen to the inner side of the leg body ratios were
evaluated as upper body measurements. According to the proportions of da Vinci it is concluded that these four
lengths are equal according to literature (Ashrafian, 2011; Maloney, et al., 2011). As it will be seen in Table 2
proportions of basketball players, volleyball players and track and field athletes are not similar with literature.
According to da Vinci, the ratio of the height to length from the top of head to the bottom of the chin is eight;
height to length from above the chest to the top of the head is four; and height to length from the root of the
penis to below the foot is two. Because of basketball players are tall the ratio of the height to length from the top
of head to the bottom of the chin is very high when compare with the da Vinci’s ratio as shown in the Table 3.
This ratio of volleyball players is lower. This result shows that basketball players are taller and height is not
reflecting the length from the top of head to the bottom of the chin. Length from the root of the penis to below
the foot of track and field athletes is more than volleyball and basketball players and results are close to da
Vinci’s ratios (Ashrafian, 2011; Maloney, et al., 2011).
In our study, length from the top of head to the bottom of the chin is the parameter shows differences among
three groups. Length from chin to breast of basketball players is significantly longer than other groups. Also
length from breast to abdomen of basketball players is significantly longer than other groups (Table 2). Heights
of basketball players are more than other groups. This can be the reason of longer upper body lengths. So it can
be said that people have a long height also have the longer upper body lengths. Length from breast to abdomen
and length from abdomen to the inner side of the leg of volleyball players are more than other groups. Volleyball
players started sport life early. This situation can effect these measurements.
Waist circumference of volleyball players (88.91 cm) is more than basketball players (81.04 cm) and track and
field athletes (79.14 cm) (p<0.0175). Waist circumferences of athletes are expected to be low. But they are
thicker because of the exercise effect the entire body. According to Nande et al. (2009) mean waist
circumferences of different sport disciplines including male athletics, badminton, cricket, judo, volleyball
players, gymnastics, weight lifting noticed less differences and found to be in range of 76.5 to 81.5. Waist
circumferences of athletes who are participated in our study are in range of 82.5 to 95.4. Differences can be
related with different sport disciplines.
Hip circumferences of volleyball players (106.3 cm) are more than basketball players (101.3 cm) and track and
field athletes (100.18 cm) (p<0.0175). According to Nande, et al. (2009) mean hip circumferences of male
athletes found between 88.7 and 93.3. Range of hip circumferences of our athletes was between 100.18 cm and
106.3 cm. Differences also can be related with different sport disciplines.
Waist to hip ratio volleyball players (0.83) is more than basketball players (0.79) and track and field athletes
(0.79) (p<0.0175). There is a geographic variation of waist to hip ratio among different populations like Hadzas,
Americans, Polands and Scottishes (Marlove et al, 2005). So the results of this study reflect the Anatolian
population. Waist to hip ratio of Anatolian population was found 0.9 and 0.8 in previous research (Arslantas et
al, 2008). Results supported each other.
According to anatomical drawings of Leonardo; length from below the foot to below the knee is a quarter of the
height of a man and length from below the knee to the root of the penis is a quarter of the height of a man
(Pollio, 2006). So length from the root of the penis to below the foot is half of a man. Research results are
parallel with the literature (Height/ Length from the root of the penis to below the foot of basketball
players=2.10; volleyball players=2.08; track and field athletes=2.14).
According to anatomical drawings of Leonardo; length from the top of the forehead to the bottom of the chin is
one-eight of the height of a man (Pollio, 2006). When compare this literature with this study all of the groups are
close to literature value (ratio of basketball players=8.29, volleyball players=8.01 and track and field
athletes=8.21). But most close value is belonging to volleyball players.
According to anatomical drawings of Leonardo; length from above the chest to the top of the head is quarter of
the height of a man (Pollio, 2006). All of the groups are very close to literature value (ratio of basketball
players=3.87, volleyball players=3.93, and track and field athletes=3.85). But most close value is belonging to
volleyball players.
Singal et al. (2006), investigated the anthropometric profile of male athletes who actively participated track and
field. They found a regular increase in all anthropometric measurements between the ages of 10 and 18 in both
athlete and control boys. The adolescent spurt has occurred earlier in athlete boys in most of the anthropometric
measurements. Musaiger et al. (1994), compared the body composition between athletes (football, handball,
volleyball and basketball) and non-athlete adults. They found differences in body composition among basketball,
volleyball and handball players. Rahmawati et al. (Rahmawati et al, 2007), determined the specific
morphological characteristics of young male athletes (badminton, soccer and volleyball players) compared with
non-athlete students in Indonesia. They also found differences among different sport branches. Pollock et al.
(1997), determined the aerobic power and body composition of older track athletes after a 20-yr follow-up.

Vol 21, No. 2;Feb 2014
In the present study, in basketball players, “Height”; and “Difference of inspiration and expiration chest
circumference” and “Length from chin to breast values” were higher than volleyball players and track and field
athletes. These results suggest that chest circumference and respiratory capacities of the sportmen were improved
in basketball players.
In volleyball players, “Length from the top of head to the bottom of the chin” and“Length from breast to
abdomen” values were higher; and “Height /length from the top of head to the bottom of the chin” ratio was
lower showing higher “length from the top of head to the bottom of the chin” values. As a result, in volleyball
players, upper part of the body growth more than the lower part of the body and leg-length. In volleyball players,
“Waist circumference”, “Hip circumference” and “Waist/hip circumference” values were also higher than
basketball players and track and field athletes. In volleyball players, the body circumference was wider; whereas
in basketball players, the body and the arms might have been elongated by the reaching the ball movement.
What extent Turkish men fit the Vitruvius square and its equations were investigated in Turkey. As a conclusion
it was observed that a great majority of Turkish men do not fit ‘‘Vitruvius square’’ and its equations (Cikmaz et
al., 2007). This data may be explained as the interaction of various civilizations through out the history of
Anatolia. Turkish population is not only continuation of a population but a combination of many different
populations. So it is impossible to speak about unique genetic structure of Turkish men. As Turkish population
have so many civilizations, male athletes from specific sport disciplines were included into this study.
5.References
1- Ashrafian, H. (2011). Leonardo da Vinci’s Vitruvian Man: a renaissance for inguinal hernias. Hernia,
15 (5), 593-594.
2- Maloney, W.J., Fried, J. (2011). Vitruvian Man - Leonardo da Vinci's Interpretation of the Golden
Proportion and its Application in Modern Dentistry. WebmedCentral Dentistry, 2(4), WMC001879.
3- Pollio, V. (2006) Vitruvius, the Ten Books on Architecture, Book III, Chapter I, ‘On Symmetry: In
Temples and in the Human Body’.,Gutenberg.org., pp. 12-31.
4- Hooliday, T.W. (1997) Body proportions in Late Pleistocene Europe and modern human origins,
Journal of Human Evolution, 32, 423–447.
5- Wagner, D.R., Heyward, V.H. (2000) Measures of body composition in blacks and whites: a
comparative review, The American Journal of Clinical Nutrition, 71, 1392-402.
6- Ilich, J.Z., Skugor, M., Hangartner, T., Baoshe, A., Matkovic, V. (1998) Relation of Nutrition, Body
Composition and Physical Activity to Skeletal Development: A Cross-Sectional Study in Preadolescent
Females, Journal of American College of Nutrition, 17 (2), 136-147.
7- Rogol, A.D., Clark, P.A., Roemmich, J.N. (2000) Growth and pubertal development in children and
adolescents: effects of diet and physical activity, Am J Clin Nutr, 72(suppl), 521S–8S.
8- Andreoli, A., Monteleone, M., Loan, M.V., Promenzio, L., Tarantino, U., Lorenzo, A.D. (2001) Effects
of different sports on bone density and muscle mass in highly trained athletes. Med. Sci. Sports Exerc.,
33 (4), 507–511.
9- Damsgaard, R., Bencke, J., Matthisen, G., Petersen, J.H., Müller, J. (2001) Body proportions, body
composition and pubertal development of children in competitive sports. Scand J Med Sci Sports, 11,
54–60.
10- Yilmaz, A., Cikmaz, S., Mesut, R. (2005) Evaluation of Turkish Males with respect to Leonardo’s
circle and Upper Extremity Ratios. Medical Journal of Trakya University, 22 (3), 137-141.
11- Cikmaz, S., Yilmaz, A., Mesut, R. (2007) “Vitruvius Square” and Related Equations in Turkish Men in
Terms of Artistic Anatomy. Medical Journal of Trakya University, 24(1), 23-27.
12- Backup, K. (2008) Clinical Tests for the Muskoskeletal System Examinations-Signs-Phenomena, 2nd
Edition: Thieme, p. 10.
13- Bjorntorp, P. (1987) Fat cell distribution and metabolism. Annals of the New York Academy of Sciences,
499, 66-72.
14- Hoffman, J. (2006) Norms for Fitness, Performance and Health. Human Kinetics, p. 87.
15- World Medical Association General Assembly (2004). World Medical Association Declaration of
Helsinki: ethical principles for medical research involving human subjects. J Int Bioethique, 15(1), 124-
9.
16- Musaiger, A.O., Ragheb, M.A., Al-Marzooq, G. (1994) Body composition of athletes in Bahrain.
British Journal of Sports Medicine, 28(3), 157-9.
17- Nande, P.J., Mudafale, V., Vali, S.A. (2009) Anthropometric Profile of Female and Male Players
Engaged in Different Sports Disciplines. The Internet Journal of Nutrition and Wellness, Volume 8
Number 1. DOI: 10.5580/2704.
18- Marlove, F., Apicella, C., Reed, D. (2005) Men’s preferences for women’s profile waist-to-hip ratio in
two societies. Evolution and Human Behavior, 26, 458 – 468.

Vol 21, No. 2;Feb 2014
19- Arslantas, D., Metintas, S., Unsal, A., Isikli, B., Kalyoncu, C., Arslantas, A. (2008) Prevalence of
osteoporosis in middle Anatolian population using calcaneal ultrasonography method. Maturitas, 59,
234–241.
20- Singal, P., Bhatnagar, D.P., Kaur, S. (2006) Anthropometric Profile and Development of Facial Hair in
Male Athletes. Journal of Exercise Science and Physiotherapy, 2, 52-58.
21- Rahmawati, N.T., Budiharjo, S., Ashizawa, K. (2007) Somatotypes of young male athletes and non-
athlete students in Yogyakarta, Indonesia. Anthropological Science, 115, 1–7.
22- Pollock, M.L., Mengelkoch, L.J., Graves, J.E., Lowenthal, D.T., Limacher, M.C., Foster, C., et al.
(1997) Twenty-year follow-up of aerobic power and body composition of older track athletes. Journal
of Applied Physiology, 82(5), 1508–1516.
Copyright © 2022 FDOKUMEN