citizen's charter - Directorate of Health Services, Govt. of Goa
Upload
khangminh22Category
view
0download
0
COMMUNITY SERVICES DIRECTORATEANNUAL REPORT 2012–2013
02VOLUME


02VOLUME
COMMUNITY SERVICES DIRECTORATEANNUAL REPORT 2012–2013

ISBN 978-0-642-6060-8-2
© Australian Capital Territory, Canberra 2013
This work is copyright. Apart from any use permitted under the Copyright Act 1968, no part may be reproduced by any process without written permission from Territory Records Office, Shared Services, Chief Minister and Treasury Directorate, ACT Government, GPO Box 158, Canberra ACT 2601.
Enquiries about this publication should be directed to:
Senior ManagerOrganisational GovernanceCommunity Services DirectorateGPO Box 158Canberra City, ACT 2601Phone (02) 6205 0469Website: www.communityservices.act.gov.au
Phone: Canberra Connect 132281
Accessibility Statement
The ACT Government is committed to making its information, services, events and venues, accessible to as many people as possible. If you have difficulty reading a standard printed document and would like to receive this publication in an alternative format, such as large print or audio, please telephone (02) 6205 0619.
If English is not your first language and you require a translating and interpreting service, please telephone Canberra Connect on 13 22 81.
If you are deaf or hearing impaired and require the TTY typewriter service, please telephone (02) 6205 0888.
Text printed on Fuji Xerox Digital Coated Range60% recycled, FSC Recycled CertifiedISO 14001 environmental Certification Certified Carbon Neutral

iii
Contents
A. Analysis Of Financial Performance—Community Services Directorate 1
A.1 Management Discussion and Analysis 3
A.2 Audited Financial Report 14
A.3 Territorial Financial Statements 106
A.4 Statement of Performance 129
B. Analysis of Financial Performance—Housing ACT 153
B.1 Management Discussion and Analysis 155
B.2 Audited Financial Report 167
B.3 Statement of Performance 249
C. Triple Bottom Line Reporting 257
D. Strategic Asset Management 261
D.1 Assets Managed 263
D.2 Assets Maintenance and Upgrade 268
D.3 Office Accommodation 270
E. Capital Works 273
E.1 Community Services Directorate 275
E.2 Housing ACT 283
F. Community Grants—Partnerships—Assistance—Sponsorships 287
F.1 Government Contracting 289
F.2 Service Funding Agreements, Community Grants and Sponsorship 302
F.2.1 Service Funding Agreements 303
F.2.2 Community Grants and Sponsorship 323
G. Strategic Objectives and Indicators 357
G.1 Community Services Directorate 359
Strategic Objective 1—Provide Services to Strengthen the Capacity of People with Disabilities, their Families and Carers to Maximise Control over their lives 359
Strategic Objective 2—Provide Services to Improve Developmental Outcomes for Children, Young People and Adults with Physical, Intellectual, Communication and other Functional Difficulties 359
Strategic Objective 3—Improve Outcomes for Children and Families through the Provision of Coordinated Locally Based Services 360
Strategic Objective 4—Provision of Services and Interventions that Reduce the Risk of Re-Substantiated Reports of Abuse 360

COMMUNITY SERVICES DIRECTORATE ANNUAL REPORT 2012–13iv
Strategic Objective 5—Improve the Outcomes for People in the Community by Providing a Range of Support and Services 361
Strategic Objective 6—Promote and Increase Participation in Community Life by Canberrans, including those from Culturally and Linguistically Diverse Backgrounds 361
Strategic Objective 7—Provision of Services that Improve Outcomes for Young People Involved with the Justice System 361
Strategic Objective 8—Improve Stability of Children in Care through Case Management and Appropriate Services and Programs 362
G.2 Housing ACT 362
Strategic Objective 1—Appropriately Housing People Most in Need 362
Strategic Objective 2—Access to Safe, Affordable and Sustainable Housing that Contributes to Social and Economic Participation 363
Index 364

v
List of Charts, Tables and Graphs
A. Analysis Of Financial Performance—Community Services Directorate 3
A.1 Management Discussion and Analysis for the Community Services Directorate for the Financial Year Ended 30 June 2013 3Graph 1 Net Cost of Services 6Graph 2 Components of Expenditure 6Graph 3 Components of Own Source Revenue 8Graph 4 Total Assets as at 30 June 2013 9Graph 5 Total Liabilities as at 30 June 2013 10Graph 6 Territorial Income and Expenses 11Table 1 Net Cost of Services 5Table 2 Reconciliation of Directorate Original to Revised Budget for 2012–13 12Table 3 Reconciliation of Territorial Original to Revised Budget for 2012–13 12Table 4 Comparison of Net Cost of Services to Revised Budget 2012–13 13
B. Analysis of Financial Performance—Housing ACT 155
Figure 1 Net Cost of Services 157Figure 2 Expenditure ($’000) 158Figure 3 Supplies and Services Expenditure ($’000) 158Figure 4 Own Source Revenue ($’000) 160Figure 5 Total Assets ($’000) 161Figure 6 Cash inflows ($’000) 163Figure 7 Cash outflows ($’000) 164Figure 8 Net cash flows from operations 164Figure 9 Total Liabilities ($’000) 165Table 1 Net Cost of Services 156Table 2 Total Expenditure 159Table 3 Current Ratio 162Table 4 Housing ACT’s Cash Needs as 30 June 2013 162Table 5 Comparison of Net Cost of Services to Budget 166
C. Triple Bottom Line Reporting 259
Table 1 Community Services Directorate’s Performance 259
D. Strategic Asset Management 263
Table 1 Community Facilities 263Table 2 Childcare Centres transferred to Education and Training Directorate 265Table 3 Value of Assets Managed by the Community Services Directorate 266Table 4 2012–13 Expenditure—CSD Facilities 268Table 5 2012–13 Repairs and Maintenance Program—CSD Facilities 269Table 6 Office Accommodation 270Table 7 Non-Office Accommodation 271

COMMUNITY SERVICES DIRECTORATE ANNUAL REPORT 2012–13vi
E. Capital Works 275
Table 1 Statement of Capital Works Income and Expenditure 2012–13 277Table 2 Statement of Capital Works Income and Expenditure 2012–13 285
F. Community Grants—Partnerships—Assistance—Sponsorships 289
F.1 Government Contracting 289
Table 1 Summary of Government Contracting 289Table 2 Output 1.1—Disability Services and Policy 290Table 3 Output 3.1—Community Services 292Table 4 Output 3.2—Community Affairs 292Table 5 Output 3.3—Arts Policy, Advice and Programs 293Table 6 Output 4.1—Youth Services 295Table 7 Output 4.2—Care and Protection Services 295Table 8 Contracts Distributed as overheads 296Table 9 Output 1.1—Social Housing Services 296
F.2 Service Funding Agreements, Community Grants and Sponsorship 302
Table 10 Summary of Service Funding Agreements, Community Grants and Sponsorship 302Table 11 Output 1.1—Disability Services and Policy 303Table 12 Output 2.2—Children’s Services 309Table 13 Output 3.1—Community Services 310Table 14 Output 3.2—Community Affairs 314Table 15 Output 4.2—Care and Protection Services 315Table 16 Housing ACT Output 1.1—Social Housing Services 319Table 17 International Day of People with Disability 323Table 18 Quality of Life Grant 324Table 19 Good Life Planning Grant 324Table 20 Innovation Grant 324Table 21 Other Grants 325Table 22 Sponsorships 325Table 23 Sponsorships 325Table 24 Community Support and Infrastructure Grants 326Table 25 Community Services Program Grants 328Table 26 ACT Women’s Grants 328Table 27 Audrey Fagan Community Grants, Audrey Fagan Young Women’s
Enrichment Grants Program, Return to Work Community Grants and ACT Office for Women Sponsorships 330
Table 28 ACT Seniors Grants and Sponsorship Program 331Table 29 Community Languages Grants 332Table 30 ACT Multicultural Radio Grants Program 334Table 31 ACT Multicultural Grants Program 336Table 32 Aboriginal and Torres Strait Islander Cultural Grants 344Table 33 Aboriginal and Torres Strait Islander Leadership Grants Program 345Table 34 ACT Arts Fund—Key Arts Organisation Funding 346Table 35 ACT Arts Fund—Project Funding 347
vii
Table 36 ACT Arts Fund—Out Of Round Funding 349Table 37 ACT Creative Arts Fellowship 350Table 38 Start-Up Funding 350Table 39 Australian National University—Community Outreach Program 350Table 40 Visual Arts and Crafts Strategy Funding 351Table 41 Communities Working with Arts 351Table 42 ACT Arts Organisation Funding 351Table 43 ACT Arts Fund—Program Funding 352Table 44 ACT Book of the Year 352Table 45 ACT Poetry Prize 352Table 46 Special Initiative Funding 353Table 47 Regional Arts Fund 353Table 48 Artists in Schools Program 353Table 49 Youth InterACT Grants 354Table 50 Care and Protection Services Sponsorships 355Table 51 Social Housing and Homelessness Services Grants 355
Index 364

COMMUNITY SERVICES DIRECTORATE ANNUAL REPORT 2012–13viii
ASECTION
ANALYSIS OF FINANCIAL PERFORMANCE—COMMUNITY SERVICES DIRECTORATE

SECTION A ANALYSIS OF FINANCIAL PERFORMANCE — COMMUNITY SERVICES DIRECTORATE 3
A. Analysis Of Financial Performance—Community Services Directorate
A.1 Management Discussion and Analysis for the Community Services Directorate for the Financial Year Ended 30 June 2013
General Overview
Objectives
The work of the Community Services Directorate (the Directorate) is shaped by whole of government priorities that promote the participation and wellbeing of the Canberra community. The focus and responsibility of the Directorate is broad and includes a range of policy and programs that deliver essential services to individuals, their families and the ACT community more broadly.
Services are targeted to people with a disability, children and young people, families, carers, women, Aboriginal and Torres Strait Islander peoples, and people who are ageing. Programs relate to multicultural affairs, volunteering, community services and facilities, concessions, social housing, therapy services, and arts and culture.
The Directorate is committed to recognising the stage of life and circumstances of its clients and to facilitating an outcome that is focused on their individual needs. This is reflected in the Directorate’s Strategic Plan which articulates participation as the central driver of its work, and is supported by five goals:
> a positive start—individuals and families receive services and support when they are needed
> support to grow and develop—individuals and families have the skills, support and information to join in
> a productive life—people of Canberra are valued contributors to our community
> a connected community—people of Canberra come together to build a vibrant, resilient and connected community
> a leading organisation—leading in the way we work for the people of Canberra
Participation, and its elements of engaging, learning, working and having a voice, is about ways to achieve better outcomes for everyone in the ACT. Central to this approach is a commitment to value and to build the cultural and social capital in the ACT, and to support and engage people who are the most marginalised and vulnerable in our community.
COMMUNITY SERVICES DIRECTORATE ANNUAL REPORT 2012–134
Risk Management
Business units are responsible for identifying and managing all strategic and operational risks. The Internal Audit Review and Insurance Unit works with business units and the executive management to report and monitor the risk plans that have been developed.
The Directorate’s Risk Management Framework - strategic risk revision was performed in 2011–12. It included a revised Strategic Risk Profile that aligned with the business plans developed and the new standard AS/NZS ISO 31000:2009, Risk Management – Principles and Guidelines.
The following themes were identified:
> Safety
> Personnel
> Procurement
> Governance
> Business Continuity
> Information Management
Within these strategic risk groups, the significant and broad risks to all business units are:
> Workforce capacity and capability
> Workplace safety and culture
> DisabilityCare
> Medium and large scale procurement
> Governance – ensuring legislative and regulatory compliance and better practice
> Finance/Resources/Achievement of Objectives – appropriately managing resources and efficiently and effectively achieving objectives and outcomes
> Service Delivery/Partnerships – ensuring quality service delivery and obtaining value for money partnerships
Further revision and update of the Strategic Risk Profile and the Risk Management Framework in 2013 demonstrates the importance the Directorate places on risk management and forms the basis for the practical application of risk treatment strategies.
Consistent with best practice, the Risk Management Framework is being reviewed to be efficient in accommodating emerging risks. In addition, business units are expected to present their risk registers and risk reduction strategies at regular intervals to the CSD Audit and Review Committee meetings.
Directorate Financial Performance
The following financial information is based on audited Financial Statements for 2012–13, the 2012–13 Budget amended through notifiable instruments and the budget process (see Table 2), and the budget and forward estimates contained in the 2013–14 Budget Papers.

SECTION A ANALYSIS OF FINANCIAL PERFORMANCE — COMMUNITY SERVICES DIRECTORATE 5
Table 1—Net Cost of Services(1)
Actual 2011–12
$m
Revised Budget(2) 2012–13
$m
Actual 2012–13
$m
Budget 2013–14
$m
Forward Estimate 2014–15
$m
Forward Estimate 2015–16
$m
Expenditure(1) 236.1 240.5 246.3 253.4 247.6 236.9
Own Source Revenue(1) 13.6 5.7 10.0 6.1 5.7 6.2
Net Cost of Services 222.5 234.8 236.3 247.3 241.9 230.7
1 Details of Expenditure and Own Source Revenue are contained in Table 4.2 For the purposes of the Management Discussion and Analysis, the Revised Budget means the Original Budget
as published in the Budget Papers, amended through notifiable instruments and/or the budget process.
Comparison to Revised Budget
The Directorate’s net cost of services for 2012–13 was $1.5 million or less than 1 per cent higher than the revised 2012–13 Budget. This reflects a combination of factors including:
> increased costs associated with the delivery of human services to the ACT community;
> partially offset by lower expenses relating to depreciation and amortisation and higher own source revenues including the return of prior year expenditure claims, the recovery of unspent grant and resources received free of charge.
Future Trends
Graph 1 below indicates that in 2013–14 the Directorate is anticipating an increase in expenditure and relatively consistent own source revenues, which results in an overall increase in the net cost of services.
This increase in budgeted expenditure relates to a range of initiatives funded through the 2013–14 budget process; as well as two year Commonwealth and ACT Government funding for service enhancements as part of a National Partnership to prepare the ACT for the launch of the National Disability Insurance Scheme (DisabilityCare).
In the forward estimates the budgeted expenditure and net cost of services are anticipated to return to 2012–13 levels, noting that the impact of the implementation of DisabilityCare from July 2015 is yet to be reflected in the outyears.

COMMUNITY SERVICES DIRECTORATE ANNUAL REPORT 2012–136
Graph 1—Net Cost of Services
0 20 40 60 80
100 120 140 160 180 200 220 240 260
Actual2012–13
Budget2013–14
Forward Estimate2014–15
Forward Estimate2015–16
$m
Own Source Revenue Expenditure Net Cost of Services
Expenditure
1. Components of Expenditure
In 2012–13 90 per cent of total expenditure or approximately $200 million was expended on service delivery to the ACT community, either through grants or services purchased from non- government and external providers ($91 million), or through Directorate services ($109 million).
Graph 2 below indicates that the largest components of expenditure in 2012–13 relate to grants and purchased services (41 per cent) and employee expenses (40 per cent). This is reflective of the nature of the Directorate’s business as a service delivery agency, where services are delivered through as combination of purchasing arrangements from the non-government sector, and those provided directly to the community through Directorate staffing and programs.
Graph 2—Components of Expenditure
Supplies and Services
Depreciation & Amortisation
Grants and Purchased Services
Other Expenses
Employee Expenses
16%
3%
41%
<1%
40%
SECTION A ANALYSIS OF FINANCIAL PERFORMANCE — COMMUNITY SERVICES DIRECTORATE 7
2. Comparison to Revised Budget
Total expenditure of $246.3 million was $5.8 million or 2 per cent higher than the revised 2012–13 Budget of $240.5 million.
The higher expenditure predominantly relates to
> increased costs associated with the use of agency support staff and overtime relating to the care of high and complex needs clients. These both arise from the ongoing pressures associated with the provision of disability services and youth justice
> a significant increase in the workers’ compensation insurance premium in 2012–13
> additional staff in relation to the DisabilityCare taskforce and staff engaged for strategic projects
These issues place significant pressures on the ongoing provision of the delivery of human services to the ACT community and have led to a net overspend across the categories of Employee Expenses, Supplies and Services and Grants and Purchased Services ($7.4 million).
This was partially offset by lower than anticipated depreciation expense in 2012–13 ($1.6 million). This was mainly due to later than expected completion of capital works, as well as some assets that became fully depreciated during the year.
3. Future Trends
The Directorate’s expenditure is budgeted to increase in 2013–14 by $12.9 million when compared to the 2012–13 amended budget. This is mainly due to additional funding for initiatives from the 2013–14 budget process, increases in funding associated with National Partnerships with the Commonwealth, as well as wage and other cost increases.
In the forward estimates 2014–15 and 2015–16 financial years, budgeted expenditure is forecasted to gradually return to approximately 2012–13 levels. This movement reflects the cessation of non ongoing funding provided by the ACT and Commonwealth Governments under a National Partnership agreement for DisabilityCare.
Total Own Source Revenue
1. Components of Own Source Revenue
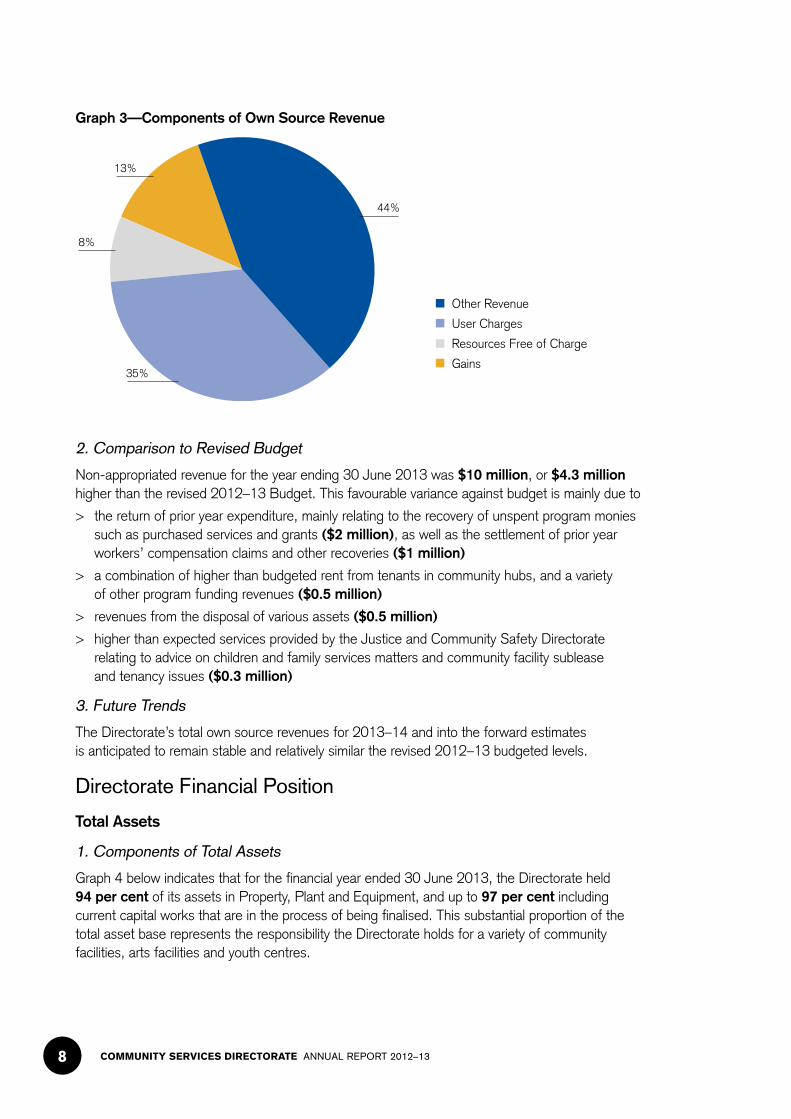
Graph 3 below indicates that for the financial year ended 30 June 2013, the Directorate received the majority of own source revenue from other revenue (44 per cent) and user charges (35 per cent). Other Revenue in 2012–13 mainly related to recovery of unspent program monies, recoveries of prior years workers’ compensation claims and grants from the Commonwealth for specific programs.
COMMUNITY SERVICES DIRECTORATE ANNUAL REPORT 2012–138
Graph 3—Components of Own Source Revenue
Other Revenue
User Charges
Resources Free of Charge
Gains
13%
8%
44%
35%
2. Comparison to Revised Budget
Non-appropriated revenue for the year ending 30 June 2013 was $10 million, or $4.3 million higher than the revised 2012–13 Budget. This favourable variance against budget is mainly due to
> the return of prior year expenditure, mainly relating to the recovery of unspent program monies such as purchased services and grants ($2 million), as well as the settlement of prior year workers’ compensation claims and other recoveries ($1 million)
> a combination of higher than budgeted rent from tenants in community hubs, and a variety of other program funding revenues ($0.5 million)
> revenues from the disposal of various assets ($0.5 million)
> higher than expected services provided by the Justice and Community Safety Directorate relating to advice on children and family services matters and community facility sublease and tenancy issues ($0.3 million)
3. Future Trends
The Directorate’s total own source revenues for 2013–14 and into the forward estimates is anticipated to remain stable and relatively similar the revised 2012–13 budgeted levels.
Directorate Financial Position
Total Assets
1. Components of Total Assets
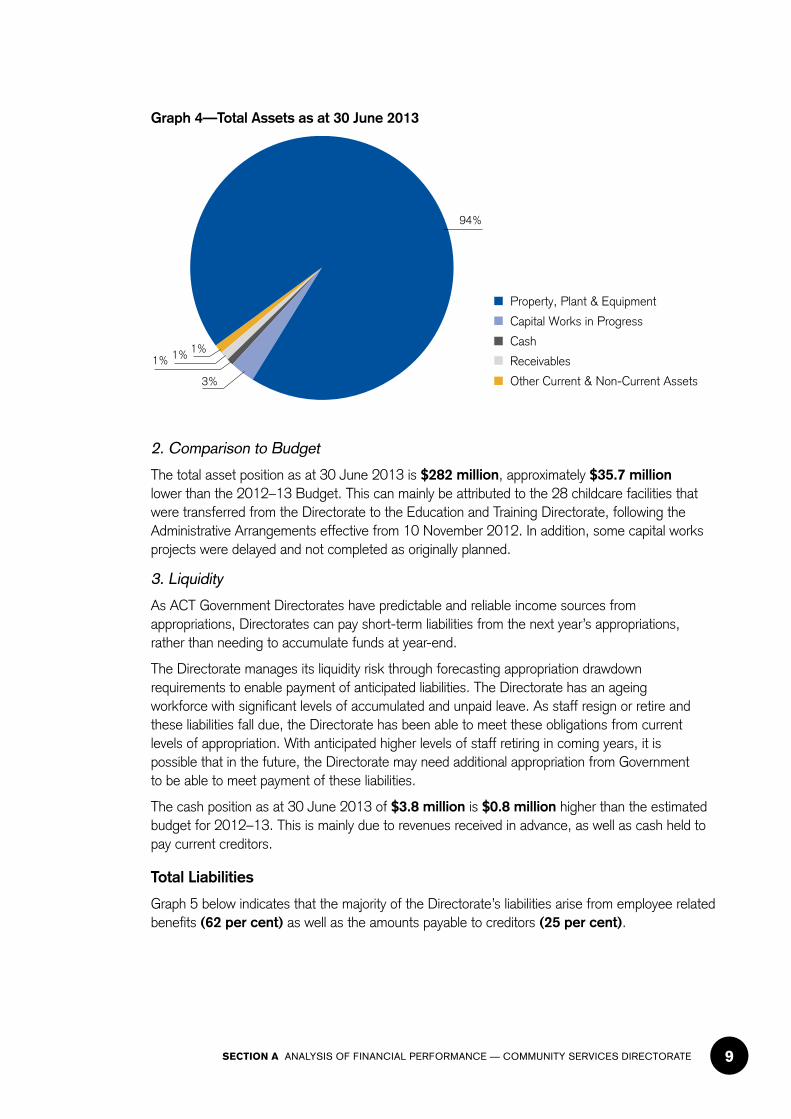
Graph 4 below indicates that for the financial year ended 30 June 2013, the Directorate held 94 per cent of its assets in Property, Plant and Equipment, and up to 97 per cent including current capital works that are in the process of being finalised. This substantial proportion of the total asset base represents the responsibility the Directorate holds for a variety of community facilities, arts facilities and youth centres.
SECTION A ANALYSIS OF FINANCIAL PERFORMANCE — COMMUNITY SERVICES DIRECTORATE 9
Graph 4—Total Assets as at 30 June 2013
Property, Plant & Equipment
Capital Works in Progress
Cash
Receivables
Other Current & Non-Current Assets
94%
1%1%1%
3%
2. Comparison to Budget
The total asset position as at 30 June 2013 is $282 million, approximately $35.7 million lower than the 2012–13 Budget. This can mainly be attributed to the 28 childcare facilities that were transferred from the Directorate to the Education and Training Directorate, following the Administrative Arrangements effective from 10 November 2012. In addition, some capital works projects were delayed and not completed as originally planned.
3. Liquidity
As ACT Government Directorates have predictable and reliable income sources from appropriations, Directorates can pay short-term liabilities from the next year’s appropriations, rather than needing to accumulate funds at year-end.
The Directorate manages its liquidity risk through forecasting appropriation drawdown requirements to enable payment of anticipated liabilities. The Directorate has an ageing workforce with significant levels of accumulated and unpaid leave. As staff resign or retire and these liabilities fall due, the Directorate has been able to meet these obligations from current levels of appropriation. With anticipated higher levels of staff retiring in coming years, it is possible that in the future, the Directorate may need additional appropriation from Government to be able to meet payment of these liabilities.
The cash position as at 30 June 2013 of $3.8 million is $0.8 million higher than the estimated budget for 2012–13. This is mainly due to revenues received in advance, as well as cash held to pay current creditors.
Total Liabilities
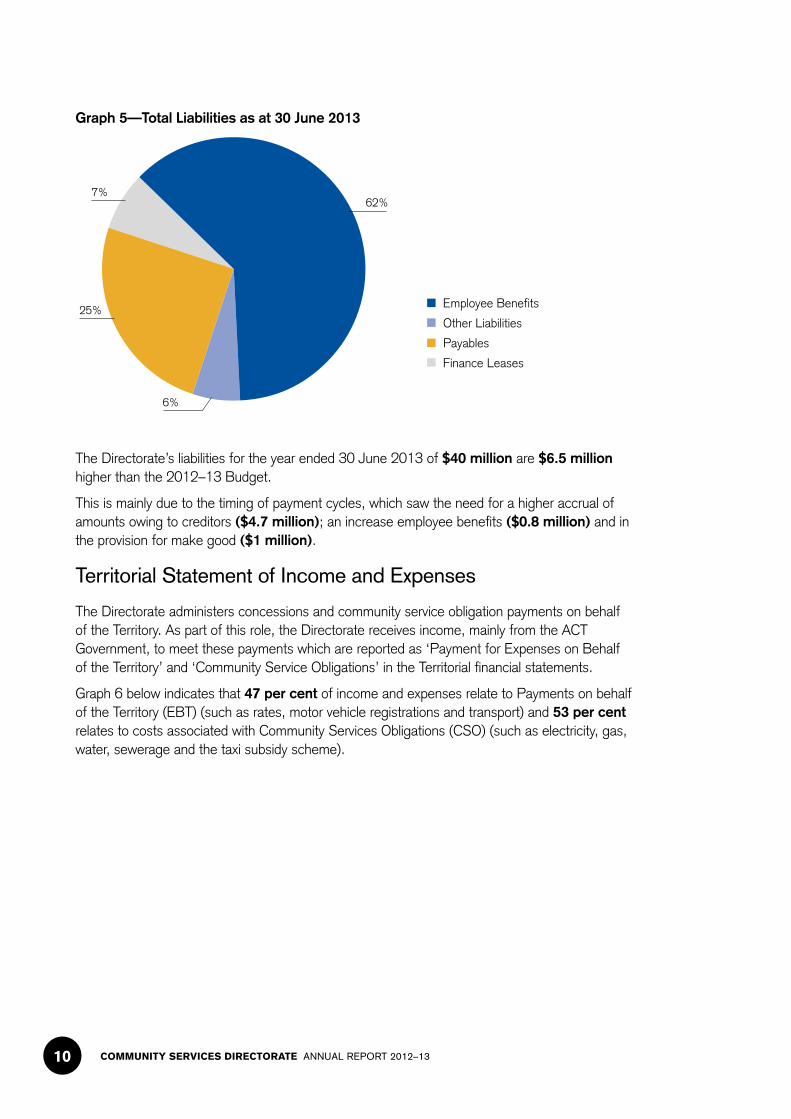
Graph 5 below indicates that the majority of the Directorate’s liabilities arise from employee related benefits (62 per cent) as well as the amounts payable to creditors (25 per cent).
COMMUNITY SERVICES DIRECTORATE ANNUAL REPORT 2012–1310
Graph 5—Total Liabilities as at 30 June 2013
Employee Benefits
Other Liabilities
Payables
Finance Leases
7%62%
25%
6%
The Directorate’s liabilities for the year ended 30 June 2013 of $40 million are $6.5 million higher than the 2012–13 Budget.
This is mainly due to the timing of payment cycles, which saw the need for a higher accrual of amounts owing to creditors ($4.7 million); an increase employee benefits ($0.8 million) and in the provision for make good ($1 million).
Territorial Statement of Income and Expenses
The Directorate administers concessions and community service obligation payments on behalf of the Territory. As part of this role, the Directorate receives income, mainly from the ACT Government, to meet these payments which are reported as ‘Payment for Expenses on Behalf of the Territory’ and ‘Community Service Obligations’ in the Territorial financial statements.
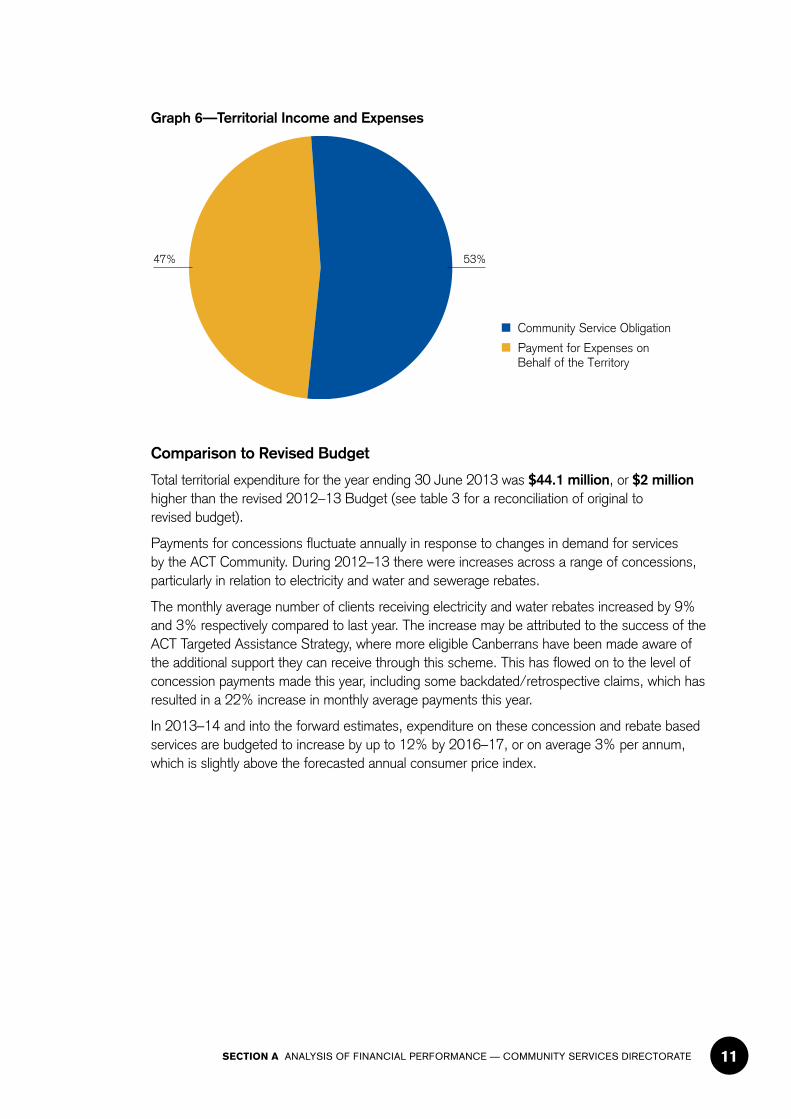
Graph 6 below indicates that 47 per cent of income and expenses relate to Payments on behalf of the Territory (EBT) (such as rates, motor vehicle registrations and transport) and 53 per cent relates to costs associated with Community Services Obligations (CSO) (such as electricity, gas, water, sewerage and the taxi subsidy scheme).
SECTION A ANALYSIS OF FINANCIAL PERFORMANCE — COMMUNITY SERVICES DIRECTORATE 11
Graph 6—Territorial Income and Expenses
Community Service Obligation
Payment for Expenses onBehalf of the Territory
53%47%
Comparison to Revised Budget
Total territorial expenditure for the year ending 30 June 2013 was $44.1 million, or $2 million higher than the revised 2012–13 Budget (see table 3 for a reconciliation of original to revised budget).
Payments for concessions fluctuate annually in response to changes in demand for services by the ACT Community. During 2012–13 there were increases across a range of concessions, particularly in relation to electricity and water and sewerage rebates.
The monthly average number of clients receiving electricity and water rebates increased by 9% and 3% respectively compared to last year. The increase may be attributed to the success of the ACT Targeted Assistance Strategy, where more eligible Canberrans have been made aware of the additional support they can receive through this scheme. This has flowed on to the level of concession payments made this year, including some backdated/retrospective claims, which has resulted in a 22% increase in monthly average payments this year.
In 2013–14 and into the forward estimates, expenditure on these concession and rebate based services are budgeted to increase by up to 12% by 2016–17, or on average 3% per annum, which is slightly above the forecasted annual consumer price index.
COMMUNITY SERVICES DIRECTORATE ANNUAL REPORT 2012–1312
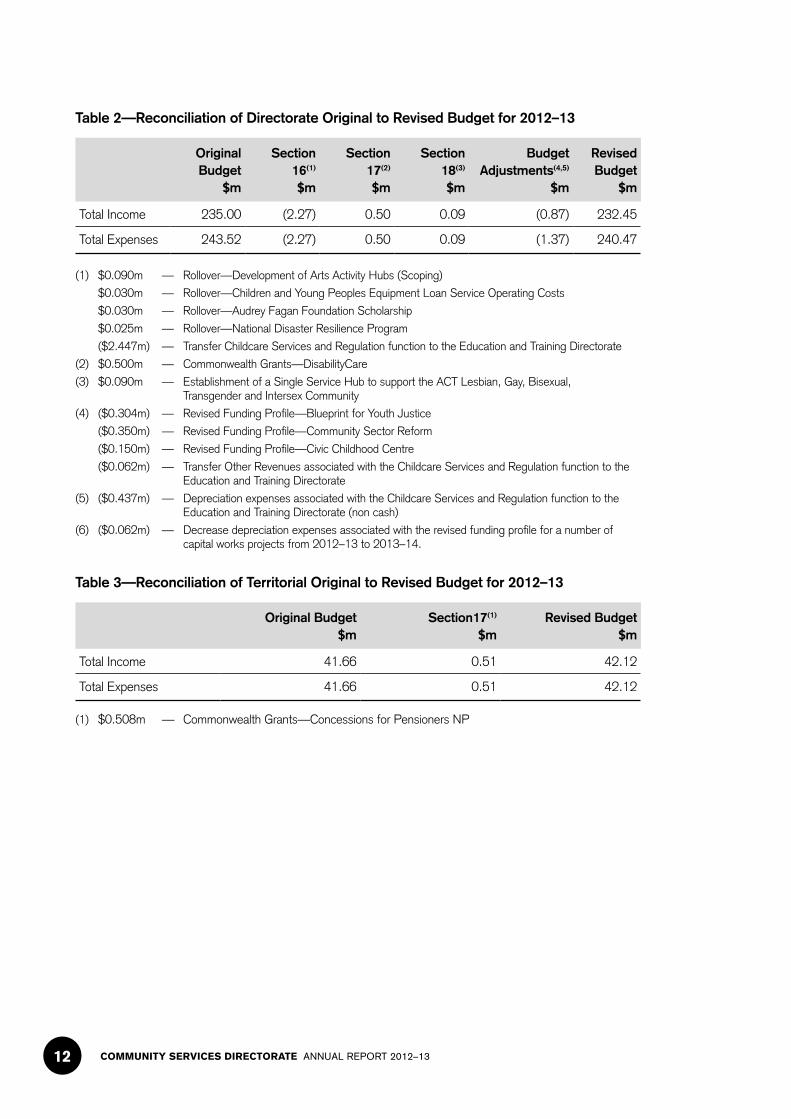
Table 2—Reconciliation of Directorate Original to Revised Budget for 2012–13
Original Budget
$m
Section16(1)
$m
Section17(2)
$m
Section18(3)
$m
Budget Adjustments(4,5)
$m
Revised Budget
$m
Total Income 235.00 (2.27) 0.50 0.09 (0.87) 232.45
Total Expenses 243.52 (2.27) 0.50 0.09 (1.37) 240.47
(1) $0.090m — Rollover—Development of Arts Activity Hubs (Scoping)
$0.030m — Rollover—Children and Young Peoples Equipment Loan Service Operating Costs
$0.030m — Rollover—Audrey Fagan Foundation Scholarship
$0.025m — Rollover—National Disaster Resilience Program
($2.447m) — Transfer Childcare Services and Regulation function to the Education and Training Directorate
(2) $0.500m — Commonwealth Grants—DisabilityCare
(3) $0.090m — Establishment of a Single Service Hub to support the ACT Lesbian, Gay, Bisexual, Transgender and Intersex Community
(4) ($0.304m) — Revised Funding Profile—Blueprint for Youth Justice
($0.350m) — Revised Funding Profile—Community Sector Reform
($0.150m) — Revised Funding Profile—Civic Childhood Centre
($0.062m) — Transfer Other Revenues associated with the Childcare Services and Regulation function to the Education and Training Directorate
(5) ($0.437m) — Depreciation expenses associated with the Childcare Services and Regulation function to the Education and Training Directorate (non cash)
(6) ($0.062m) — Decrease depreciation expenses associated with the revised funding profile for a number of capital works projects from 2012–13 to 2013–14.
Table 3—Reconciliation of Territorial Original to Revised Budget for 2012–13
Original Budget$m
Section17(1)
$m Revised Budget
$m
Total Income 41.66 0.51 42.12
Total Expenses 41.66 0.51 42.12
(1) $0.508m — Commonwealth Grants—Concessions for Pensioners NP

SECTION A ANALYSIS OF FINANCIAL PERFORMANCE — COMMUNITY SERVICES DIRECTORATE 13
Table 4—Comparison of Net Cost of Services to Revised Budget 2012–13
Description
Original Budget
$’000Adjustments
$’000
Revised Budget(1)
$’000
Less Actual$’000
Variance
$’000 %
Expenditure
Employee and Superannuation 91,831 (1,003) 90,828 99,168 (8,340) (9)
Supplies and Services 38,931 (1,391) 37,540 40,016 (2,476) (7)
Depreciation and Amortisation 9,491 (499) 8,992 7,403 1,589 18
Grants and Purchased Services 103,196 (153) 103,043 99,676 3,367 3
Other Expenses 72 - 72 25 47 65
Total Expenditure 243,521 (3,046) 240,475 246,288 (5,814) (2)
Own Source Revenue
User Charges 2,902 - 2,902 3,457 555 19
Resources Free of Charge 460 - 460 803 343 75
Gains 1,212 - 1,212 1,308 95 8
Other Revenue 1,226 (62) 1,164 4,393 3,229 277
Total Own Source Revenue 5,800 (62) 5,738 9,961 4,222 74
Total Net Cost of Services 237,721 (2,984) 234,737 236,327 (1,590) (1)
(1) See Table 2 for a reconciliation of the Original 2012–13 Budget to the Revised Budget.
COMMUNITY SERVICES DIRECTORATE ANNUAL REPORT 2012–1314
A.2 Audited Financial Report
INDEPENDENT AUDIT REPORT
COMMUNITY SERVICES DIRECTORATE
To the Members of the ACT Legislative Assembly
Report on the financial statements
The financial statements of the Community Services Directorate (the Directorate) for the year ended 30 June 2013 have been audited. These comprise the following financial statements and accompanying notes:
• Controlled financial statements – operating statement, balance sheet, statement of changes in equity, cash flow statement and statement of appropriation.
• Territorial financial statements – statement of income and expenses on behalf of the Territory, statement of assets and liabilities on behalf of the Territory, statement of recognised income and expenses on behalf of the Territory, cash flow statement on behalf of the Territory and territorial statement of appropriation.
Responsibility for the financial statements
The Director-General of the Directorate is responsible for the preparation and fair presentation of the financial statements in accordance with the Financial Management Act 1996. This includes responsibility for maintaining adequate accounting records and internal controls that are designed to prevent and detect fraud and error, and the accounting policies and estimates used in the preparation of the financial statements.
The auditor’s responsibility
Under the Financial Management Act 1996, I am responsible for expressing an independent audit opinion on the financial statements of the Directorate.
The audit was conducted in accordance with Australian Auditing Standards to obtain reasonable assurance that the financial statements are free of material misstatement.
I formed the audit opinion following the use of audit procedures to obtain evidence about the amounts and disclosures in the financial statements. As these procedures are influenced by the use of professional judgement, selective testing of evidence supporting the amounts and other disclosures in the financial statements, inherent limitations of internal control and the availability of persuasive rather than conclusive evidence, an audit cannot guarantee that all material misstatements have been detected.
Level 4, 11 Moore Street, Canberra City, ACT 2601 | PO Box 275, Civic Square, ACT 2608 Telephone: 02 6207 0833 | Facsimile: 02 6207 0826 | Email: [email protected]
Although the effectiveness of internal controls is considered when determining the nature and extent of audit procedures, the audit was not designed to provide assurance on internal controls.
The audit is not designed to provide assurance on the appropriateness of budget information included in the financial statements or to evaluate the prudence of decisions made by the Directorate.
Electronic presentation of the audited financial statements
Those viewing an electronic presentation of these financial statements should note that the audit does not provide assurance on the integrity of information presented electronically and does not provide an opinion on any other information which may have been hyperlinked to or from these financial statements. If users of these statements are concerned with the inherent risks arising from the electronic presentation of information, they are advised to refer to the printed copy of the audited financial statements to confirm the accuracy of this electronically presented information.
Independence
Applicable independence requirements of Australian professional ethical pronouncements were followed in conducting the audit.
Audit opinion
In my opinion, the financial statements of the Directorate for the year ended 30 June 2013:
(i) are presented in accordance with the Financial Management Act 1996, Australian Accounting Standards and other mandatory financial reporting requirements in Australia; and
(ii) present fairly the financial position of the Directorate as at 30 June 2013 and the results of its operations and cash flows for the year then ended.
The audit opinion should be read in conjunction with other information disclosed in this report.
Community Services Directorate Financial Statements
For the Year Ended 30 June 2013
Statement of Responsibility
In my opinion, the financial statements are in agreement with the Community Services Directorate’s accounts and records and fairly reflect the financial operations of the Directorate for the year ended 30 June 2013 and the financial position of the Directorate on that date.
Community Services Directorate Financial Statements
For the Year Ended 30 June 2013
Statement by the Chief Finance Officer
In my opinion, the financial statements have been prepared in accordance with generally accepted accounting principles, and are in agreement with the Community Services Directorate’s accounts and records and fairly reflect the financial operations of the Directorate for the year ended 30 June 2013 and the financial position of the Directorate on that date.

Community Services Directorate Operating Statement
For the Year Ended 30 June 2013
Note Actual
No. 2013
$'000
Income
Revenue
Government Payment for Outputs 4 226,713
User Charges - ACT Government 5 360
User Charges - Non-ACT Government 5 3,096
Interest 6 1
Resources Received Free of Charge 7 803
Other Revenue 8 4,393
Total Revenue 235,366
Gains
Other Gains 9 1,308
Total Gains 1,308
Total Income 236,674
Expenses
Employee Expenses 10 87,491
Superannuation Expenses 11 11,677
Supplies and Services 12 39,136
Depreciation and Amortisation 13 7,403
Grants and Purchased Services 14 99,676
Borrowing Costs 15 422
Other Expenses 16 254
Asset Transfers 17 229
Total Expenses 246,288
Operating (Deficit) (9,614)
Other Comprehensive Income
Items that will not be reclassified subsequently
to profit or loss
Net Effect of a Correction of an Error -
Increase in the Asset Revaluation Surplus 33 4,184
Total Other Comprehensive Income 4,184
Total Comprehensive (Deficit)/Income (5,430)
Original
Budget
2013
$'000
Actual
2012
$'000
229,199
-
2,902
-
460
1,226
233,787
216,676
41
2,643
1
778
2,714
222,853
1,212
1,212
234,999
7,378
7,378
230,231
79,717
12,114
38,840
9,491
103,196
87
76
-
243,521
(8,522)
82,194
10,674
38,705
7,605
96,479
290
118
-
236,065
(5,834)
(1,271)
41
(1,230)
-
15,319
15,319
(9,752) 9,485
The above Operating Statement should be read in conjunction with the accompanying notes.

Community Services Directorate
Balance Sheet
As at 30 June 2013
Note Actual
No. 2013
$'000
Current Assets
Cash and Cash Equivalents 21 3,825
Receivables 22 2,750
Assets Held For Sale 23 120
Other Assets 27 92
Total Current Assets 6,787
Non-Current Assets
Receivables 22 864
Property, Plant and Equipment 24 264,560
Intangible Assets 25 417
Capital Works in Progress 26 9,437
Total Non-Current Assets 275,278
Total Assets 282,065
Current Liabilities
Payables 28 9,781
Finance Leases 29 1,225
Employee Benefits 30 22,401
Other Provisions 31 36
Other Liabilities 32 1,181
Total Current Liabilities 34,624
Non-Current Liabilities
Finance Leases 29 1,557
Employee Benefits 30 1,997
Other Provisions 31 1,403
Other Liabilities 32 407
Total Non-Current Liabilities 5,364
Total Liabilities 39,988
Net Assets 242,077
Equity
Accumulated Funds 185,239
Asset Revaluation Surplus 33 56,838
Total Equity 242,077
Original
Budget
2013
$'000
2,773
2,724
72
182
5,751
-
286,091
321
25,569
311,981 301,635
317,732 306,754
5,006 6,857
1,353 1,060
21,552 21,688
294 308
713 779
28,918
1,501
2,005
-
1,037
4,543
33,461
284,271
236,393
47,878
284,271
Actual
2012
$'000
2,635
2,151
199
134
5,119
-
288,654
106
12,875
30,692
1,395
1,956
1,082
671
5,104
35,796
270,958
207,802
63,156
270,958
The above Balance Sheet should be read in conjunction with the accompanying notes.
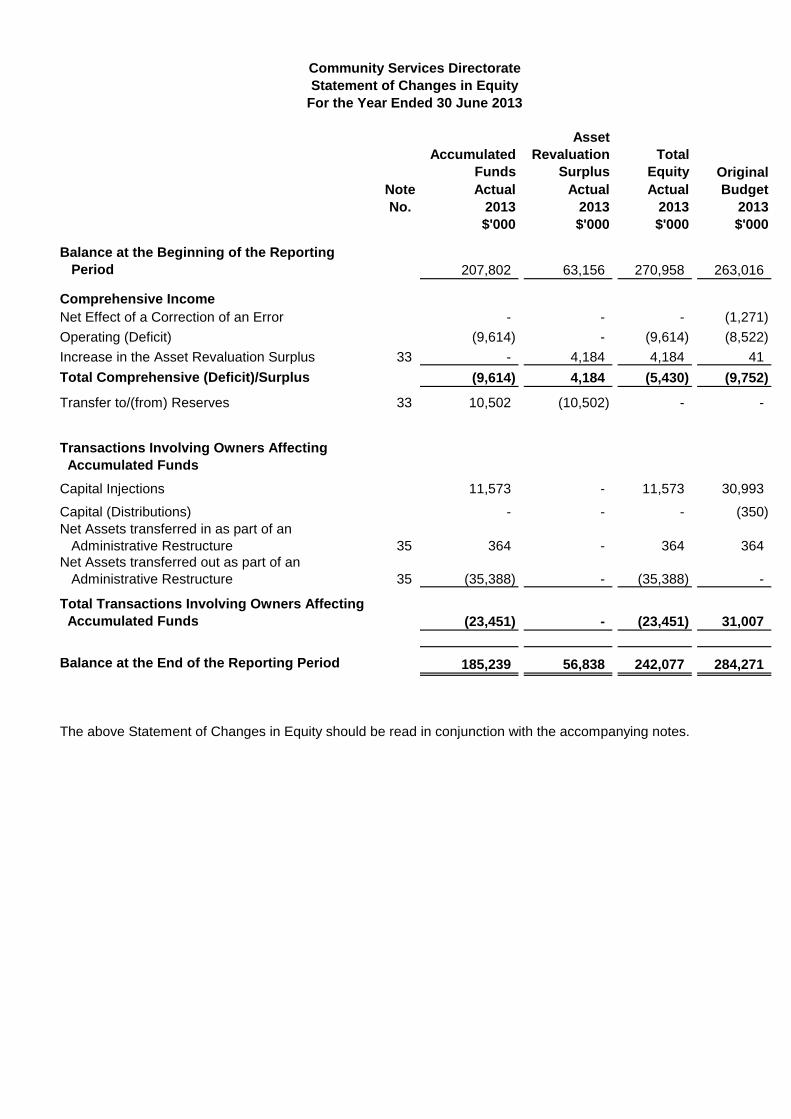
Community Services Directorate Statement of Changes in Equity
For the Year Ended 30 June 2013
Asset
Accumulated Revaluation Total
Funds Surplus Equity Original
Note Actual Actual Actual Budget
No. 2013 2013 2013 2013
$'000 $'000 $'000 $'000
Balance at the Beginning of the Reporting
Period 207,802 63,156 270,958 263,016
Comprehensive Income
Net Effect of a Correction of an Error - - - (1,271)
Operating (Deficit) (9,614) - (9,614) (8,522)
Increase in the Asset Revaluation Surplus 33 - 4,184 4,184 41
Total Comprehensive (Deficit)/Surplus (9,614) 4,184 (5,430) (9,752)
Transfer to/(from) Reserves 33 10,502 (10,502) - -
Transactions Involving Owners Affecting
Accumulated Funds
Capital Injections 11,573 - 11,573 30,993
Capital (Distributions) - - - (350)
Net Assets transferred in as part of an
Administrative Restructure 35 364 - 364 364
Net Assets transferred out as part of an
Administrative Restructure 35 (35,388) - (35,388) -
Total Transactions Involving Owners Affecting
Accumulated Funds (23,451) - (23,451) 31,007
Balance at the End of the Reporting Period 185,239 56,838 242,077 284,271
The above Statement of Changes in Equity should be read in conjunction with the accompanying notes.
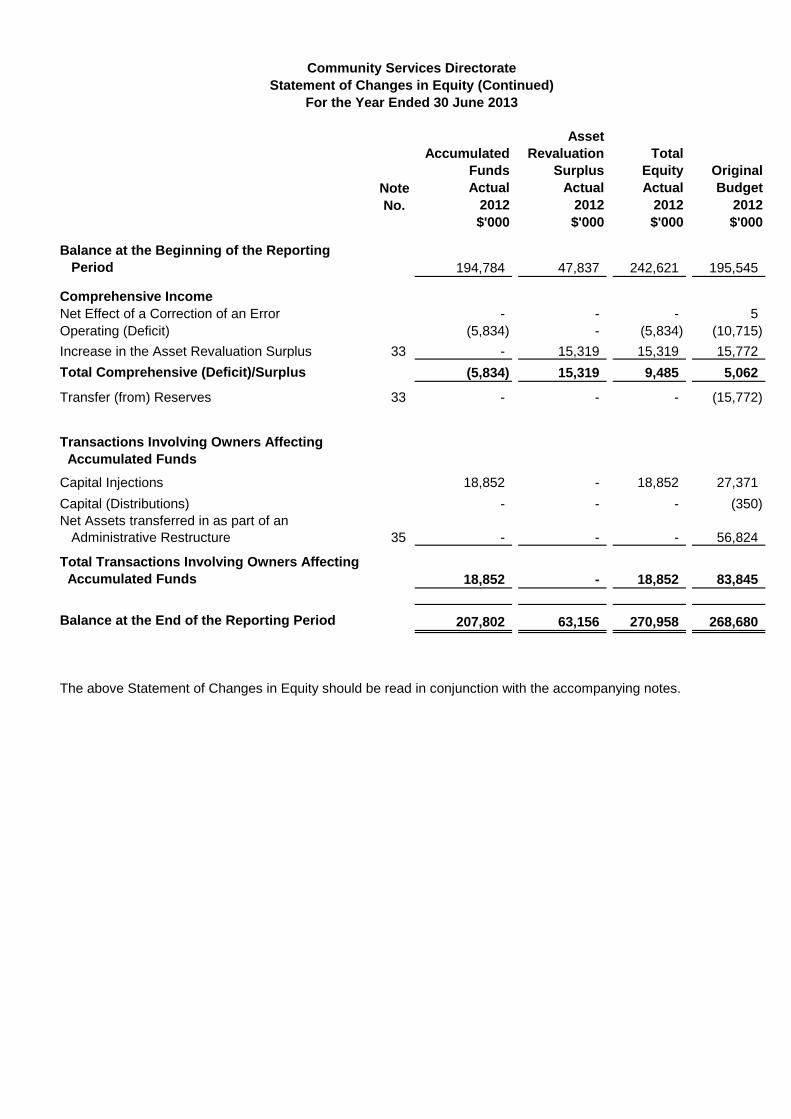
Community Services Directorate Statement of Changes in Equity (Continued)
For the Year Ended 30 June 2013
Asset
Accumulated Revaluation Total
Funds Surplus Equity Original
Note Actual Actual Actual Budget
No. 2012 2012 2012 2012
$'000 $'000 $'000 $'000
Balance at the Beginning of the Reporting
Period 194,784 47,837 242,621 195,545
Comprehensive Income
Net Effect of a Correction of an Error - - - 5
Operating (Deficit) (5,834) - (5,834) (10,715)
Increase in the Asset Revaluation Surplus 33 - 15,319 15,319 15,772
Total Comprehensive (Deficit)/Surplus (5,834) 15,319 9,485 5,062
Transfer (from) Reserves 33 - - - (15,772)
Transactions Involving Owners Affecting
Accumulated Funds
Capital Injections 18,852 - 18,852 27,371
Capital (Distributions) - - - (350)
Net Assets transferred in as part of an
Administrative Restructure 35 - - - 56,824
Total Transactions Involving Owners Affecting
Accumulated Funds 18,852 - 18,852 83,845
Balance at the End of the Reporting Period 207,802 63,156 270,958 268,680
The above Statement of Changes in Equity should be read in conjunction with the accompanying notes.

Community Services Directorate Cash Flow Statement
For the Year Ended 30 June 2013
Note
No.
Actual
2013
$'000
Cash Flows from Operating Activities
Receipts
Government Payment for Outputs
User Charges - ACT Government
User Charges - Non-ACT Government
Interest Received
Goods and Services Tax Input Tax Credits
from the Australian Taxation Office
Goods and Services Tax Collected from
Customers
Other Total Receipts from Operating Activities
226,713
708
2,807
1
14,547
572
3,655
249,003
Payments
Employee
Superannuation
Supplies and Services
Grants and Purchased Services
Borrowing Costs
Goods and Services Tax Paid to Suppliers
Total Payments from Operating Activities
86,705
11,605
38,459
96,399
213
14,559
247,940
Net Cash Inflows from Operating Activities 39 1,063
Cash Flows from Investing Activities
Receipts
Proceeds from the Sale of Property, Plant
and Equipment
Total Receipts from Investing Activities
97
97
Payments
Purchase of Property, Plant and Equipment
Purchase of Intangibles
Loans Provided (Loans Receivable)
Total Payments from Investing Activities
10,013
-
1,000
11,014
Net Cash (Outflows) from Investing Activities (10,917)
Original
Budget Actual
2013 2012
$'000 $'000
229,199 216,676
- 178
2,902 2,419
- 1
15,102 14,081
681 429
1,226 2,861
249,110 236,645
78,796 78,670
12,112 10,621
37,598 35,983
103,625 94,767
86 236
16,237 15,088
248,454 235,365
656 1,280
- 128 - 128
30,877
100
-
19,504
224
-
30,977 19,728
(30,977) (19,600)
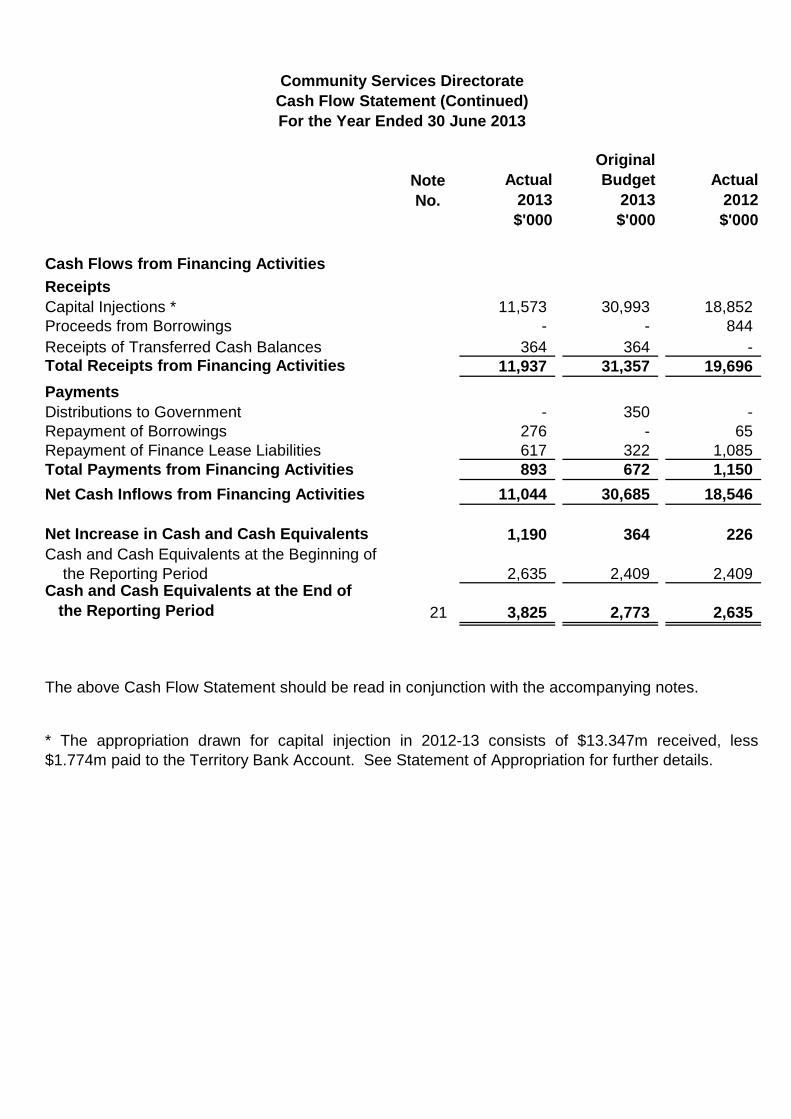
Community Services Directorate
Cash Flow Statement (Continued)
For the Year Ended 30 June 2013
Cash Flows from Financing Activities
Receipts
Capital Injections *
Proceeds from Borrowings
Receipts of Transferred Cash Balances Total Receipts from Financing Activities
Payments
Distributions to Government
Repayment of Borrowings
Repayment of Finance Lease Liabilities
Total Payments from Financing Activities
Net Cash Inflows from Financing Activities
Net Increase in Cash and Cash Equivalents
Cash and Cash Equivalents at the Beginning of
the Reporting Period Cash and Cash Equivalents at the End of
the Reporting Period
Note No.
21
Actual
2013
$'000
11,573
-
364
11,937
-
276
617
893
11,044
1,190
2,635
3,825
Original
Budget
2013
$'000
30,993
-
364
31,357
350
-
322
672
30,685
364
2,409
2,773
Actual
2012
$'000
18,852
844
-
19,696
-
1,085
1,150
18,546
2,409
2,635
The above Cash Flow Statement should be read in conjunction with the accompanying notes.
* The appropriation drawn for capital injection in 2012-13 consists of $13.347m received, less
$1.774m paid to the Territory Bank Account. See Statement of Appropriation for further details.
65
226
2013
Total Income
Total Expenses
Operating (Deficit)/Surplus
2012
Total Income
Total Expenses
Operating (Deficit)/Surplus
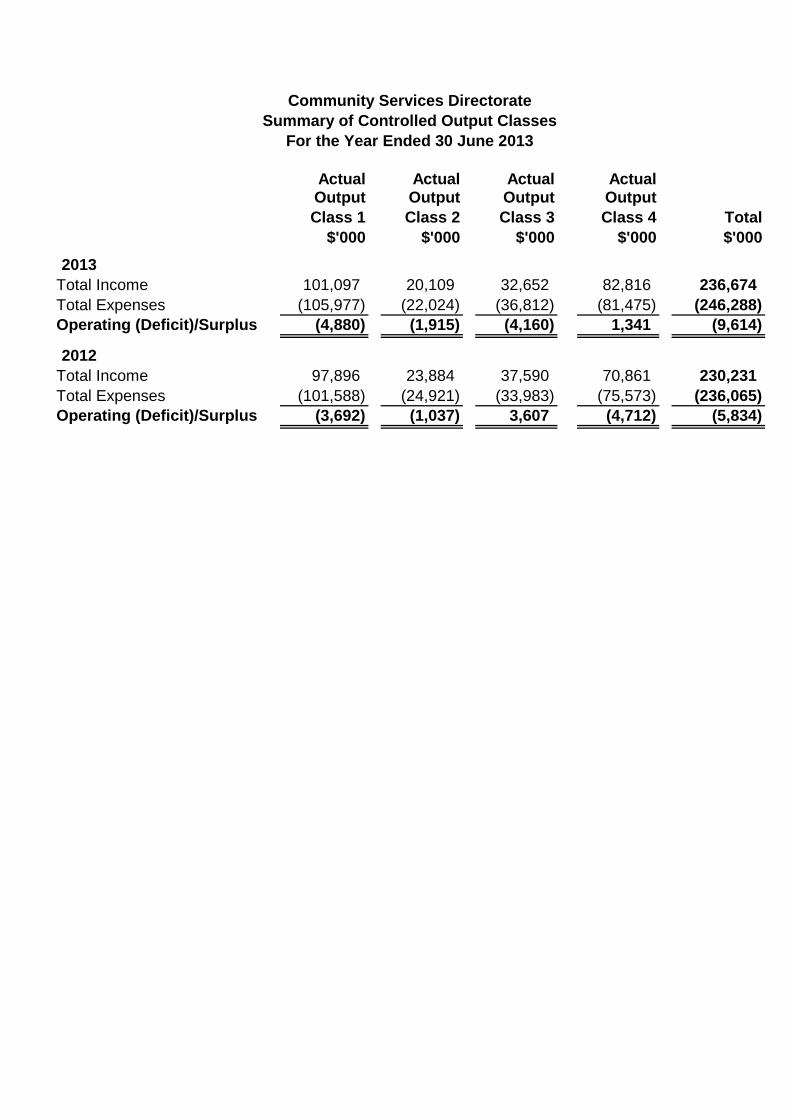
Community Services Directorate Summary of Controlled Output Classes
For the Year Ended 30 June 2013
Actual Output
Class 1
$'000
Actual Output
Class 2
$'000
Actual Output
Class 3
$'000
101,097
(105,977)
(4,880)
20,109
(22,024)
(1,915)
32,652
(36,812)
(4,160)
97,896
(101,588)
(3,692)
23,884
(24,921)
(1,037)
37,590
(33,983)
3,607
Actual Output
Class 4
$'000
Total
$'000
82,816
(81,475)
1,341
236,674
(246,288)
(9,614)
70,861
(75,573)
(4,712)
230,231
(236,065)
(5,834)
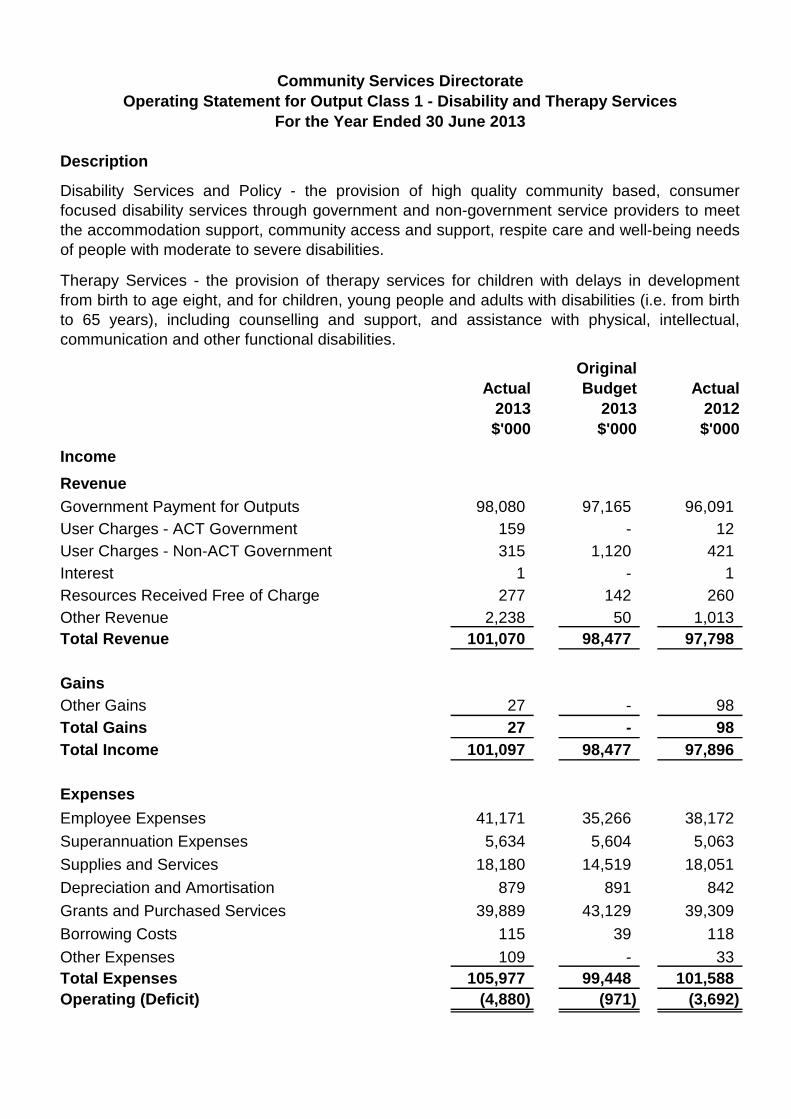
Community Services Directorate Operating Statement for Output Class 1 - Disability and Therapy Services
For the Year Ended 30 June 2013
Description
Disability Services and Policy - the provision of high quality community based, consumer
focused disability services through government and non-government service providers to meet
the accommodation support, community access and support, respite care and well-being needs
of people with moderate to severe disabilities.
Therapy Services - the provision of therapy services for children with delays in development
from birth to age eight, and for children, young people and adults with disabilities (i.e. from birth
to 65 years), including counselling and support,
communication and other functional disabilities.
and assistance with physical, intellectual,
Actual
2013
$'000
Original
Budget
2013
$'000
Actual
2012
$'000
Income
Revenue
Government Payment for Outputs
User Charges - ACT Government
User Charges - Non-ACT Government
Interest
98,080
159
315
1
97,165
-
1,120
-
96,091
12
421
1
Resources Received Free of Charge
Other Revenue
Total Revenue
277
2,238
101,070
142
50
98,477
260
1,013
97,798
Gains
Other Gains 27 - 98
Total Gains 27 - 98
Total Income 101,097 98,477 97,896
Expenses
Employee Expenses
Superannuation Expenses
Supplies and Services
Depreciation and Amortisation
Grants and Purchased Services
Borrowing Costs
Other Expenses
Total Expenses
Operating (Deficit)
41,171
5,634
18,180
879
39,889
115
109
105,977
(4,880)
35,266
5,604
14,519
891
43,129
39
-
99,448
(971)
38,172
5,063
18,051
842
39,309
118
33
101,588
(3,692)

Community Services Directorate Operating Statement for Output Class 2 - Early Intervention
For the Year Ended 30 June 2013
Description
Child and Family Centre Program - the provision of an early intervention and prevention
program for children from birth to age five and their families. The program provides a range of
universal and targeted parenting information and support services, specialist clinical services,
community development and community education programs, including the Parents as
Teachers and Schools as Communities programs. Services are delivered in partnerships with
other agencies, local community organisations and service providers.
Children Services - the provision of services to assist children, young people and families to
participate in a range of community activities and prevention/intervention services. The output
includes licensing and monitoring the operation of child care services. A component of this
function was transferred to the Education and Training Directorate (ETD) as part of the
Administrative Arrangements effective from 10 November 2012.
Original
Actual Budget Actual
2013 2013 2012
$'000 $'000 $'000
Income
Revenue
Government Payment for Outputs 19,646 24,545 22,910
User Charges - ACT Government 35 - -
User Charges - Non-ACT Government 23 - 69
Resources Received Free of Charge 8 55 9
Other Revenue
Total Revenue
Gains
Other Gains
Total Gains
Total Income
381
20,093
16
16
20,109
424
25,024
-
-
25,024
866
23,854
30
30
23,884
Expenses
Employee Expenses 6,129 8,937 7,989
Superannuation Expenses 882 1,133 1,083
Supplies and Services 2,527 4,994 2,442
Depreciation and Amortisation 972 919 1,571
Grants and Purchased Services 11,456 10,559 11,725
Borrowing Costs 57 15 109
Other Expenses 1 27 2
Total Expenses
Operating (Deficit)
22,024
(1,915)
26,584
(1,560)
24,921
(1,037)

Community Services Directorate Operating Statement for Output Class 3 - Community Development and Policy
For the Year Ended 30 June 2013
Description
Community Services - the provision of a variety of community support development activities,
including administration of a range of concessions and benefits to low income earners, and
management of community facilities.
Community Affairs - the provision of support and policy development activities, including
multicultural affairs, ageing, the status of women and Aboriginal and Torres Strait Islander
Affairs.
Arts Policy, Advice and Programs - implementation of Government policies and priorities and
facilitation and development of, and community participation in, the arts.
Original
Actual Budget Actual
2013 2013 2012
$'000 $'000 $'000
Income
Revenue
Government Payment for Outputs 28,347 29,184 27,939
User Charges - ACT Government 43 - 29
User Charges - Non-ACT Government 2,297 978 1,683
Resources Received Free of Charge 33 12 29
Other Revenue 722 443 660
Total Revenue 31,442 30,617 30,340
Gains
Other Gains 1,210 1,212 7,250
Total Gains 1,210 1,212 7,250
Total Income 32,652 31,829 37,590
Expenses
Employee Expenses 6,386 5,300 5,584
Superannuation Expenses 841 489 790
Supplies and Services 7,473 8,754 6,684
Depreciation and Amortisation 4,336 5,393 4,145
Grants and Purchased Services 17,412 16,158 16,713
Borrowing Costs 32 1 10
Other Expenses 103 - 57
Asset Transfers 229 - -
Total Expenses 36,812 36,095 33,983
Operating (Deficit)/Surplus (4,160) (4,266) 3,607
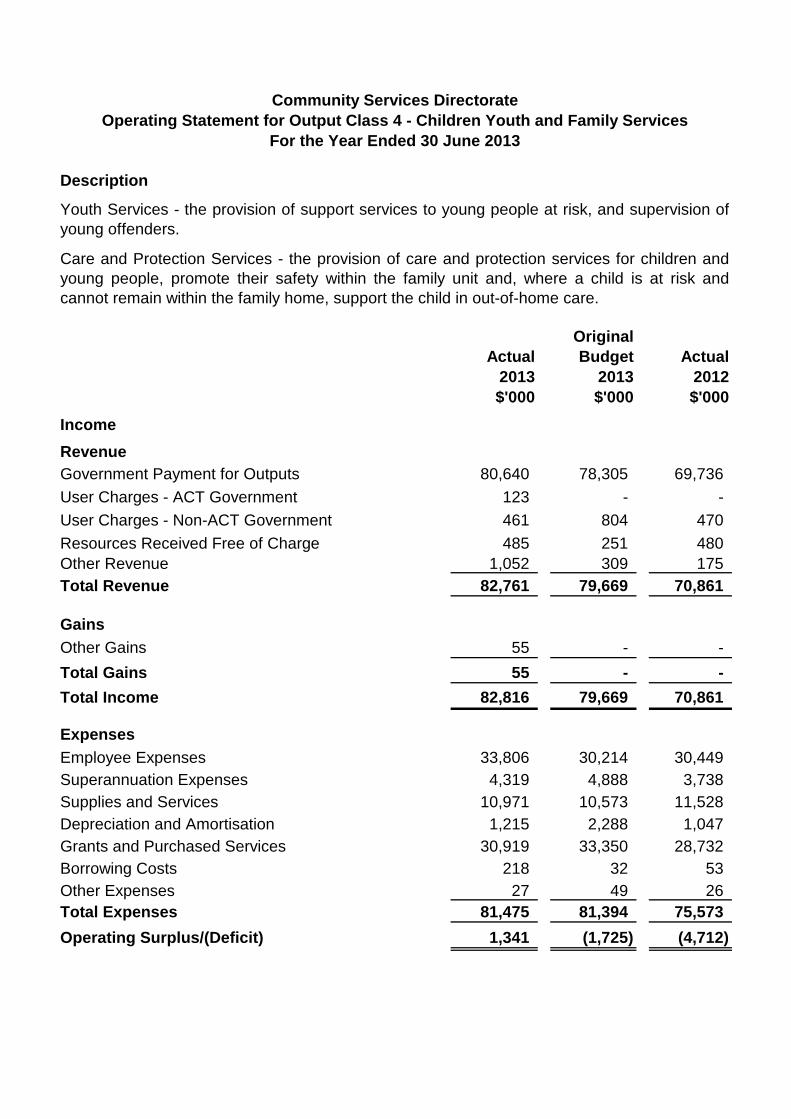
Community Services Directorate Operating Statement for Output Class 4 - Children Youth and Family Services
For the Year Ended 30 June 2013
Description
Youth Services - the provision of support services to young people at risk, and supervision of
young offenders.
Care and Protection Services - the provision of care and protection services for children and
young people, promote their safety within the family unit and, where a child is at risk and
cannot remain within the family home, support the child in out-of-home care.
Original
Actual Budget Actual
2013 2013 2012
$'000 $'000 $'000
Income
Revenue
Government Payment for Outputs 80,640 78,305 69,736
User Charges - ACT Government 123 - -
User Charges - Non-ACT Government 461 804 470
Resources Received Free of Charge 485 251 480
Other Revenue 1,052 309 175
Total Revenue 82,761 79,669 70,861
Gains
Other Gains 55 - -
Total Gains 55 - -
Total Income 82,816 79,669 70,861
Expenses
Employee Expenses 33,806 30,214 30,449
Superannuation Expenses 4,319 4,888 3,738
Supplies and Services 10,971 10,573 11,528
Depreciation and Amortisation 1,215 2,288 1,047
Grants and Purchased Services 30,919 33,350 28,732
Borrowing Costs 218 32 53
Other Expenses 27 49 26
Total Expenses 81,475 81,394 75,573
Operating Surplus/(Deficit) 1,341 (1,725) (4,712)
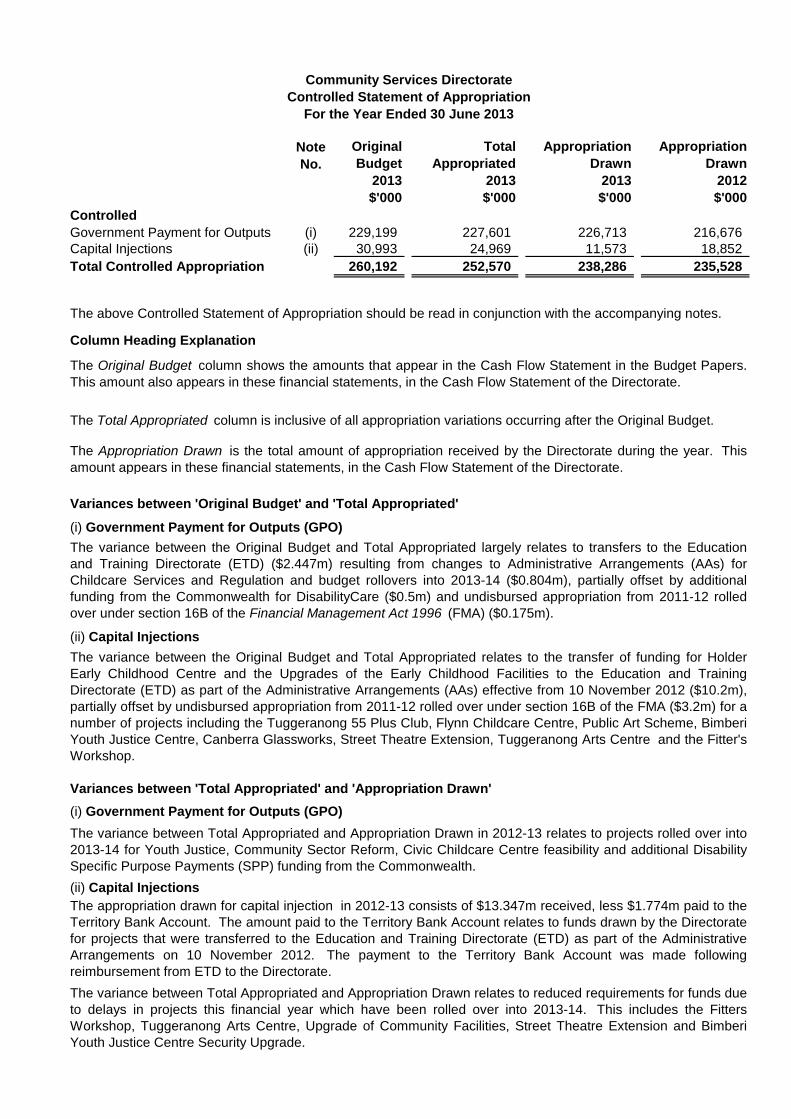
Community Services Directorate Controlled Statement of Appropriation
For the Year Ended 30 June 2013
Note Original Total Appropriation Appropriation
No. Budget Appropriated Drawn Drawn
2013 2013 2013 2012
$'000 $'000 $'000 $'000
Controlled
Government Payment for Outputs (i) 229,199 227,601 226,713 216,676
Capital Injections (ii) 30,993 24,969 11,573 18,852
Total Controlled Appropriation 260,192 252,570 238,286 235,528
The above Controlled Statement of Appropriation should be read in conjunction with the accompanying notes.
Column Heading Explanation
The Original Budget column shows the amounts that appear in the Cash Flow Statement in the Budget Papers.
This amount also appears in these financial statements, in the Cash Flow Statement of the Directorate.
The Total Appropriated column is inclusive of all appropriation variations occurring after the Original Budget.
The Appropriation Drawn is the total amount of appropriation received by the Directorate during the year. This
amount appears in these financial statements, in the Cash Flow Statement of the Directorate.
Variances between 'Original Budget' and 'Total Appropriated'
(i) Government Payment for Outputs (GPO)
The variance between the Original Budget and Total Appropriated largely relates to transfers to the Education
and Training Directorate (ETD) ($2.447m) resulting from changes to Administrative Arrangements (AAs) for
Childcare Services and Regulation and budget rollovers into 2013-14 ($0.804m), partially offset by additional
funding from the Commonwealth for DisabilityCare ($0.5m) and undisbursed appropriation from 2011-12 rolled
over under section 16B of the Financial Management Act 1996 (FMA) ($0.175m).
(ii) Capital Injections
The variance between the Original Budget and Total Appropriated relates to the transfer of funding for Holder
Early Childhood Centre and the Upgrades of the Early Childhood Facilities to the Education and Training
Directorate (ETD) as part of the Administrative Arrangements (AAs) effective from 10 November 2012 ($10.2m),
partially offset by undisbursed appropriation from 2011-12 rolled over under section 16B of the FMA ($3.2m) for a
number of projects including the Tuggeranong 55 Plus Club, Flynn Childcare Centre, Public Art Scheme, Bimberi
Youth Justice Centre, Canberra Glassworks, Street Theatre Extension, Tuggeranong Arts Centre and the Fitter's
Workshop.
Variances between 'Total Appropriated' and 'Appropriation Drawn'
(i) Government Payment for Outputs (GPO)
The variance between Total Appropriated and Appropriation Drawn in 2012-13 relates to projects rolled over into
2013-14 for Youth Justice, Community Sector Reform, Civic Childcare Centre feasibility and additional Disability
Specific Purpose Payments (SPP) funding from the Commonwealth.
(ii) Capital Injections
The appropriation drawn for capital injection in 2012-13 consists of $13.347m received, less $1.774m paid to the
Territory Bank Account. The amount paid to the Territory Bank Account relates to funds drawn by the Directorate
for projects that were transferred to the Education and Training Directorate (ETD) as part of the Administrative
Arrangements on 10 November 2012. The payment to the Territory Bank Account was made following
reimbursement from ETD to the Directorate.
The variance between Total Appropriated and Appropriation Drawn relates to reduced requirements for funds due
to delays in projects this financial year which have been rolled over into 2013-14. This includes the Fitters
Workshop, Tuggeranong Arts Centre, Upgrade of Community Facilities, Street Theatre Extension and Bimberi
Youth Justice Centre Security Upgrade.
Community Services Directorate Controlled Financial Statements Note Index
For the Year Ended 30 June 2013
Note 1 Objectives of the Community Services Directorate
Note 2 Summary of Significant Accounting Policies
Note 3 Change in Accounting Estimates, Accounting Policy and Correction of a Prior Period Error
Income Note 4 Government Payment for Outputs Note 5 User Charges Note 6 Interest Note 7 Resources Received Free of Charge Note 8 Other Revenue Note 9 Other Gains
Expenses Note 10 Employee Expenses Note 11 Superannuation Expenses Note 12 Supplies and Services Note 13 Depreciation and Amortisation Note 14 Grants and Purchased Services Note 15 Borrowing Costs Note 16 Other Expenses Note 17 Asset Transfers Note 18 Waivers, Impairment Losses and Write-Offs Note 19 Act of Grace Payments Note 20 Auditor’s Remuneration
Assets Note 21 Cash and Cash Equivalents Note 22 Receivables Note 23 Assets Held for Sale Note 24 Property, Plant and Equipment Note 25 Intangible Assets Note 26 Capital Works in Progress Note 27 Other Assets
Liabilities Note 28 Payables Note 29 Finance Leases Note 30 Employee Benefits Note 31 Other Provisions Note 32 Other Liabilities

Community Services Directorate Controlled Financial Statements Note Index (Continued)
For the Year Ended 30 June 2013
Equity Note 33 Equity
Other Note 34 Disaggregated Disclosure of Assets and Liabilities Note 35 Restructure of Administrative Arrangements Note 36 Financial Instruments Note 37 Commitments Note 38 Contingent Liabilities and Contingent Assets Note 39 Cash Flow Reconciliation Note 40 Events Occurring After Balance Date

Community Services Directorate Notes to and Forming Part of the Financial Statements
For the Year Ended 30 June 2013
NOTE 1. OBJECTIVES OF THE COMMUNITY SERVICES DIRECTORATE
Operations and Principal Activities
The work of the Community Services Directorate (the Directorate) is shaped by whole
of government priorities which promote the participation and wellbeing of the
Canberra community. The focus and responsibility of the Directorate is broad and
includes a range of policy and programs which deliver essential services to
individuals, their families and the ACT community more broadly.
Services are targeted to people with a disability, children and young people, families,
carers, women, Aboriginal and Torres Strait Islander peoples, and people who are
ageing. Programs include multicultural affairs, volunteering, community services and
facilities, concessions, social housing, therapy services, and arts and cultural
programs.
The Directorate is committed to recognising the stage of life and circumstances of its
clients and to facilitating an outcome that is focused on their individual needs. This is
reflected in the Directorate’s Strategic Plan which articulates participation as the
central driver of its work, and is supported by five goals:
a positive start - individuals and families receive services and support when they are needed;
support to grow and develop - individuals and families have the skills, support and information to join in;
a productive life - people of Canberra are valued contributors to our community;
a connected community - people of Canberra come together to build a vibrant, resilient and connected community; and
a leading organisation - leading in the way we work for the people of Canberra.
Participation, and its elements of engaging, learning, working and having a voice, is
about ways to achieve better outcomes for everyone in the ACT. Central to this
approach is a commitment to value and to build the cultural and social capital in the
ACT, and to support and engage people who are the most marginalised and
vulnerable in our community.
Community Services Directorate Notes to and Forming Part of the Financial Statements
For the Year Ended 30 June 2013
NOTE 2. SUMMARY OF SIGNIFICANT ACCOUNTING POLICIES
(a) Basis of Accounting
The Financial Management Act 1996 (FMA) requires the preparation of annual financial statements for ACT Government Directorates.
The FMA and the Financial Management Guidelines issued under the Act, requires a Directorate’s financial statements to include:
(i) an Operating Statement for the year; (ii) a Balance Sheet at the end of the year; (iii) a Statement of Changes in Equity for the year; (iv) a Cash Flow Statement for the year; (v) an Operating Statement for each class of output for the year; (vi) a Statement of Appropriation for the year; (vii) a summary of the significant accounting policies adopted for the year; and (viii) such other statements as are necessary to fairly reflect the financial
operations of the Directorate during the year and its financial position at the end of the year.
These general-purpose financial statements have been prepared to comply with ‘Generally Accepted Accounting Principles’ as required by the FMA. The financial statements have been prepared in accordance with:
(i) Australian Accounting Standards; and (ii) ACT Accounting and Disclosure Policies.
The financial statements have been prepared using the accrual basis of accounting, which recognises the effects of transactions and events when they occur. Except for land, buildings, correctional facility, land improvements, works of art and community and heritage assets, which are measured at fair value, these financial statements have also been prepared according to the historical cost convention.
As at 30 June 2013, the Directorate’s current assets are insufficient to meet its current liabilities. However, this is not considered a liquidity risk as its cash requirements are funded through appropriation from the ACT Government on a cash–needs basis. This is consistent with the whole–of–government cash management regime which requires excess cash balances to be held centrally rather than within individual agency bank accounts.
These financial statements are presented in Australian dollars, which is the Directorate’s functional currency.
The Directorate is an individual reporting entity.

Community Services Directorate Notes to and Forming Part of the Financial Statements
For the Year Ended 30 June 2013
NOTE 2. SUMMARY OF SIGNIFICANT ACCOUNTING POLICIES (Continued)
(b) Controlled and Territorial Items
The Directorate produces Controlled and Territorial financial statements. The Controlled financial statements include income, expenses, assets and liabilities over which the Directorate has control. The Territorial financial statements include income, expenses, assets and liabilities that the Directorate administers on behalf of the ACT Government, but does not control.
The purpose of the distinction between Controlled and Territorial is to enable an assessment of the Directorate’s performance against the decisions it has made in relation to the resources it controls, while maintaining accountability for all resources under its responsibility.
The basis of accounting described in paragraph (a) above applies to both Controlled and Territorial financial statements except where specified otherwise.
(c) The Reporting Period
These financial statements state the financial performance, changes in equity and cash flows of the Directorate for the year ended 30 June 2013 together with the financial position of the Directorate as at 30 June 2013.
(d) Comparative Figures
Budget Figures To facilitate a comparison with the Budget Papers, as required by the Financial Management Act 1996, budget information for 2012-13 has been presented in the financial statements. Budget figures in the financial statements are the original budget figures that appear in the Budget Papers, which aligns to information included in the Appropriation Act 2012-2013.
Prior Year Comparatives Comparative information has been disclosed in respect of the previous period for amounts reported in the financial statements, except where an Australian Accounting Standard does not require comparative information to be disclosed.
Where the presentation or classification of items in the financial statements is amended, the comparative amounts have been reclassified where practical. Where a reclassification has occurred, the nature, amount and reason for the reclassification is provided.

Community Services Directorate Notes to and Forming Part of the Financial Statements
For the Year Ended 30 June 2013
NOTE 2. SUMMARY OF SIGNIFICANT ACCOUNTING POLICIES (Continued)
(e) Rounding
All amounts in the financial statements have been rounded to the nearest thousand dollars ($’000). Use of “-“ represents zero amounts or amounts rounded down to zero.
(f) Revenue Recognition
Revenue is recognised at the fair value of the consideration received or receivable in the Operating Statement. All revenue is recognised to the extent that it is probable that the economic benefits will flow to the Directorate and the revenue can be reliably measured. In addition the following specific recognition criteria must also be met before revenue is recognised:
Rendering of Services Revenue from the rendering of services is recognised when the stage of completion of the transaction at the reporting date can be measured reliably and the costs of rendering the service can be measured reliably.
Interest Interest revenue is recognised using the effective interest method.
(g) Resources Received and Provided Free of Charge
Resources received free of charge are recorded as revenue in the Operating Statement at fair value. The revenue is separately disclosed under resources received free of charge. Goods and services received free of charge from ACT Government agencies are recorded as resources received free of charge, whereas goods and services received free of charge from entities external to the ACT Government are recorded as donations. Services that are received free of charge are only recorded in the Operating Statement if they can be reliably measured and would have been purchased if not provided to the Directorate free of charge.
(h) Repairs and Maintenance
The Directorate undertakes repairs and maintenance on property, plant and equipment assets. Where the maintenance leads to an upgrade of the asset and increases the service potential of the existing asset, the cost is capitalised. Maintenance expenses which do not increase the service potential of the asset are expensed.

Community Services Directorate Notes to and Forming Part of the Financial Statements
For the Year Ended 30 June 2013
NOTE 2. SUMMARY OF SIGNIFICANT ACCOUNTING POLICIES (Continued)
(i) Borrowing Costs
Borrowing costs are expensed in the period in which they are incurred.
(j) Waivers of Debt
Debts that are waived under section 131 of the Financial Management Act 1996 are expensed during the year in which the right to payment was waived. Further details of waivers are disclosed at Note 18 Waivers, Impairment Losses and Write-offs and Note 46 Waivers, Impairment Losses and Write-offs – Territorial.
(k) Current and Non-Current Items
Assets and liabilities are classified as current or non-current in the Balance Sheet and in the relevant notes. Assets are classified as current where they are expected to be realised within 12 months after the reporting date. Liabilities are classified as current when they are due to be settled within 12 months after the reporting date or the Directorate does not have an unconditional right to defer settlement of the liability for at least 12 months after the reporting date.
Assets or liabilities which do not fall within the current classification are classified as non-current.
(l) Impairment of Assets
The Directorate assesses at each reporting date whether there is any indication that an asset may be impaired. Assets are also reviewed for impairment whenever events or changes in circumstances indicate that the carrying amount may not be recoverable.
An impairment loss is recognised for the amount by which an asset’s carrying amount exceeds its recoverable amount. The recoverable amount is the higher of the asset’s ‘fair value less cost to sell’ and its ‘value in use’. An asset’s ‘value in use’ is its depreciated replacement cost, where the asset would be replaced if the Directorate were deprived of it. Non-financial assets that have previously been impaired are reviewed for possible reversal of impairment at each reporting date.
Any resulting impairment losses, for land, buildings, correctional facility, land improvements, works of art and community and heritage assets, are recognised as a decrease in the Asset Revaluation Surplus relating to these classes of assets. Where the impairment loss is greater than the available balance in the Asset Revaluation Surplus for the relevant class of asset, the difference is expensed in the Operating Statement. Impairment losses for plant and equipment, leasehold improvements and intangible assets are also recognised in the Operating Statement as these asset classes are carried at cost, and do not have an Asset Revaluation Surplus attached to them. The carrying amount of the asset is also reduced to its recoverable amount.
Community Services Directorate Notes to and Forming Part of the Financial Statements
For the Year Ended 30 June 2013
NOTE 2. SUMMARY OF SIGNIFICANT ACCOUNTING POLICIES (Continued)
(m) Cash and Cash Equivalents
For the purposes of the Cash Flow Statement and the Balance Sheet, cash includes cash at bank and cash on hand.
(n) Receivables
Accounts receivable (including trade receivables and other trade receivables) are initially recognised at fair value and are subsequently measured at amortised cost, with any adjustments to the carrying amount being recorded through the Operating Statement.
Trade receivables arise in the normal course of selling goods/services to other agencies and to the public. Trade receivables are payable within 28 days after the issue of an invoice or the goods/services have been provided under a contractual arrangement.
Other trade receivables arise outside the normal course of selling goods and services to other agencies and to the public. Other trade receivables are payable within 28 days after the issue of an invoice or the goods/services have been provided under a contractual arrangement.
The allowance for impairment losses represents the amount of trade receivables and other trade receivables the Directorate estimates will not be repaid. The allowance for impairment losses is based on objective evidence and a review of overdue balances. The Directorate considers the following is objective evidence of impairment:
(a) becoming aware of financial difficulties of debtors; (b) default payments; or (c) debts more than 90 days overdue.
The amount of the allowance is the difference between the asset’s carrying amount and the present value of the estimated future cash flows, discounted at the original effective interest rate. Cash flows relating to short-term receivables are not discounted if the effect of discounting is immaterial. The amount of the allowance is recognised in the Operating Statement. The allowance for impairment losses are written back against the receivables account when the Directorate ceases action to collect the debt as it considers that it will cost more to recover the debt than the debt is worth.
Receivables that have been renegotiated because they are past due or impaired are accounted for based on the renegotiated terms.
Community Services Directorate Notes to and Forming Part of the Financial Statements
For the Year Ended 30 June 2013
NOTE 2. SUMMARY OF SIGNIFICANT ACCOUNTING POLICIES (Continued)
(o) Assets Held for Sale
Assets held for sale are assets that are available for immediate sale in their present condition, and their sale is highly probable.
Assets held for sale are measured at the lower of the carrying amount and fair value less costs to sell. An impairment loss is recognised for any initial or subsequent write down of the asset to fair value less cost to sell. Assets held for sale are not depreciated.
(p) Acquisition and Recognition of Property, Plant and Equipment
Property, plant and equipment are initially recorded at cost. Cost includes the purchase price, directly attributable costs and the estimated cost of dismantling and removing the item (where, upon acquisition there is a present obligation to remove the item).
Where property, plant and equipment are acquired at no cost, or minimal cost, cost is its fair value as at the date of acquisition. However, property, plant and equipment acquired at no or minimal cost as part of a Restructuring of Administrative Arrangements is measured at the transferor’s book value.
Property, plant and equipment with a minimum value of $5,000 are capitalised.
(q) Measurement of Property, Plant and Equipment after Initial Recognition
Property, plant and equipment are valued using the cost or revaluation model of valuation. Land, buildings, correctional facility, land improvements, works of art and community and heritage assets are measured at fair value. Leasehold improvements and plant and equipment are measured at cost.
Fair value is the amount for which an asset could be exchanged between knowledgeable willing parties in an arm’s length transaction. Fair value is measured using market based evidence available for that asset (or a similar asset), as this is the best evidence of an asset’s fair value. Where the market price for an asset cannot be obtained because the asset is specialised and is rarely sold, depreciated replacement cost is used as fair value.
Fair value for land, buildings, correctional facility and land improvements are measured using current prices in a market for similar properties in a similar location and condition.
Fair value for some community and heritage assets are measured using depreciated replacement cost. For other community and heritage assets, fair value is determined using a market price where there is a market for the same or similar property.

Community Services Directorate Notes to and Forming Part of the Financial Statements
For the Year Ended 30 June 2013
NOTE 2. SUMMARY OF SIGNIFICANT ACCOUNTING POLICIES (Continued)
(q) Measurement of Property, Plant and Equipment after Initial Recognition (continued)
Fair values for some works of art are measured using depreciated replacement cost. For other works of art, fair value is determined using assessment of value in the art market by an accredited art valuer.
Land, buildings, correctional facility, land improvements, works of art and community and heritage assets are revalued every 3 years. However, if at any time management considers that the carrying amount of an asset materially differs from its fair value then the asset will be revalued regardless of when the last valuation took place. Any accumulated depreciation relating to buildings, correctional facility, land improvements, works of art and community and heritage assets at the date of revaluation is written back against the gross carrying amount of the asset and the net amount is restated to the revalued amount of the asset.
The cost of plant and equipment comprises the purchase price, any directly attributable costs, and the initial estimate of the costs of dismantling and removing plant and equipment and restoring the site on which it is located.
(r) Intangible Assets
The Directorate’s intangible assets are comprised of externally acquired software for internal use.
Externally acquired software is recognised and capitalised when:
(a) it is probable that the expected future economic benefits that are attributable to the software will flow to the Directorate;
(b) the cost of the software can be measured reliably; and (c) the acquisition cost is equal to or exceeds $50,000.
Capitalised software has a finite useful life. Software is amortised on a straight-line basis over its useful life, over a period not exceeding 5 years.
Intangible Assets are measured at cost.
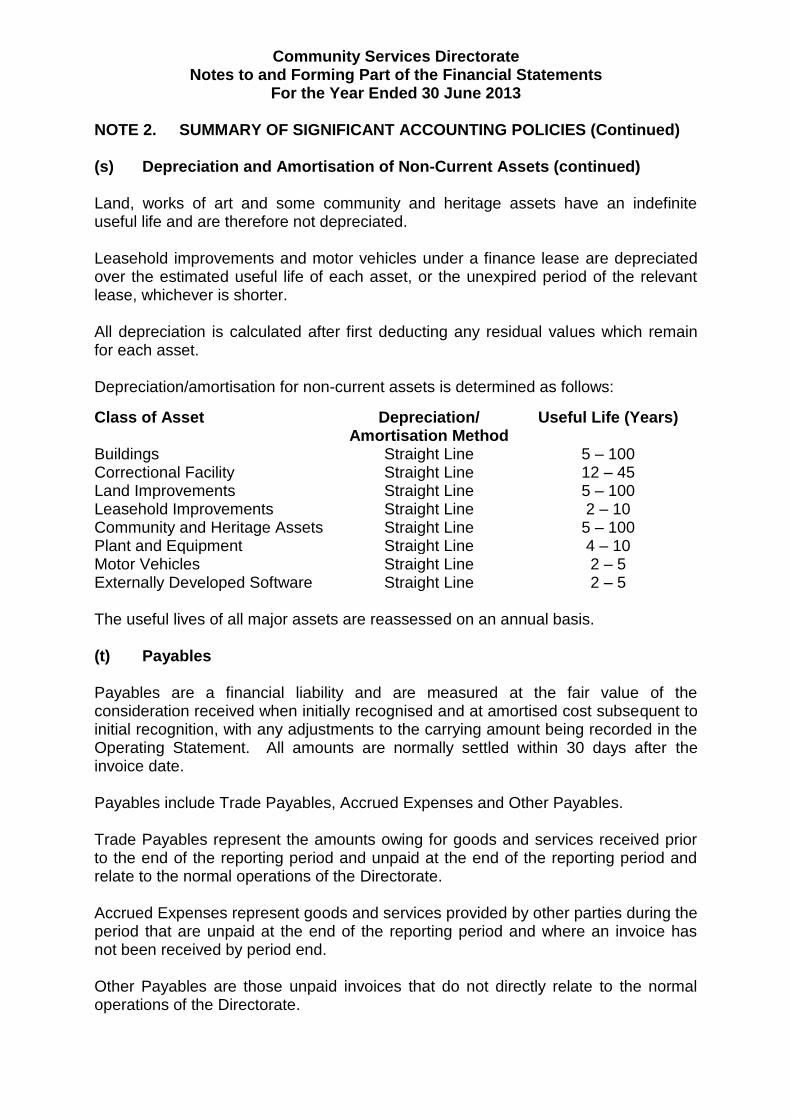
(s) Depreciation and Amortisation of Non-Current Assets
Non-current assets with a limited useful life are systematically depreciated/amortised over their useful lives in a manner that reflects the consumption of their service potential. The useful life commences when an asset is ready for use. When an asset is revalued it is depreciated/amortised over its newly assessed remaining useful life. Amortisation is used in relation to intangible assets and depreciation is applied to physical assets such as buildings, land improvements and plant and equipment.
Community Services Directorate Notes to and Forming Part of the Financial Statements
For the Year Ended 30 June 2013
NOTE 2. SUMMARY OF SIGNIFICANT ACCOUNTING POLICIES (Continued)
(s) Depreciation and Amortisation of Non-Current Assets (continued)
Land, works of art and some community and heritage assets have an indefinite useful life and are therefore not depreciated.
Leasehold improvements and motor vehicles under a finance lease are depreciated over the estimated useful life of each asset, or the unexpired period of the relevant lease, whichever is shorter.
All depreciation is calculated after first deducting any residual values which remain for each asset.
Depreciation/amortisation for non-current assets is determined as follows:
Class of Asset Depreciation/ Useful Life (Years) Amortisation Method
Buildings Straight Line 5 – 100 Correctional Facility Straight Line 12 – 45 Land Improvements Straight Line 5 – 100 Leasehold Improvements Straight Line 2 – 10 Community and Heritage Assets Straight Line 5 – 100 Plant and Equipment Straight Line 4 – 10 Motor Vehicles Straight Line 2 – 5 Externally Developed Software Straight Line 2 – 5
The useful lives of all major assets are reassessed on an annual basis.
(t) Payables
Payables are a financial liability and are measured at the fair value of the consideration received when initially recognised and at amortised cost subsequent to initial recognition, with any adjustments to the carrying amount being recorded in the Operating Statement. All amounts are normally settled within 30 days after the invoice date.
Payables include Trade Payables, Accrued Expenses and Other Payables.
Trade Payables represent the amounts owing for goods and services received prior to the end of the reporting period and unpaid at the end of the reporting period and relate to the normal operations of the Directorate.
Accrued Expenses represent goods and services provided by other parties during the period that are unpaid at the end of the reporting period and where an invoice has not been received by period end.
Other Payables are those unpaid invoices that do not directly relate to the normal operations of the Directorate.
Community Services Directorate Notes to and Forming Part of the Financial Statements
For the Year Ended 30 June 2013
NOTE 2. SUMMARY OF SIGNIFICANT ACCOUNTING POLICIES (Continued)
(u) Borrowings
Borrowings are a financial liability and are measured at the fair value of the consideration received when initially recognised and at amortised cost subsequent to initial recognition, with any adjustments to the carrying amount being recorded in the Operating Statement. The loans are interest free loans with repayments to be made over the next 4 years.
(v) Leases
The Directorate has entered into finance leases and operating leases.
Finance Leases Finance leases effectively transfer to the Directorate substantially all the risks and rewards incidental to ownership of the assets under a finance lease. The title may or may not eventually be transferred. Finance leases are initially recognised as an asset and a liability at the lower of the fair value of the asset and the present value of the minimum lease payments each being determined at the inception of the lease.
The discount rate used to calculate the present value of the minimum lease payments is the interest rate implicit in the lease. Assets under a finance lease are depreciated on a straight-line basis over the shorter of the asset’s useful life and lease term. The depreciation is calculated after first deducting any residual values which remain for each leased asset. Each lease payment is allocated between interest expense and reduction of the lease liability. Lease liabilities are classified as current and non-current.
Operating Leases Operating leases do not effectively transfer to the Directorate substantially all the risks and rewards incidental to ownership of the asset under an operating lease. Operating lease payments are recorded as an expense in the Operating Statement on a straight line basis over the term of the lease.
(w) Employee Benefits
Employee benefits include wages and salaries, annual leave, annual leave loading, long service leave and applicable on-costs. On-costs include annual leave, long service leave, superannuation and other costs that are incurred when employees take annual and long service leave. These benefits accrue as a result of services provided by employees up to the reporting date that remain unpaid. They are recorded as a liability and as an expense.
Wages and Salaries Accrued wages are salaries that are measured as the amount that remains unpaid to employees at the end of the reporting period.

Community Services Directorate Notes to and Forming Part of the Financial Statements
For the Year Ended 30 June 2013
NOTE 2. SUMMARY OF SIGNIFICANT ACCOUNTING POLICIES (Continued)
(w) Employee Benefits (continued)
Annual and Long Service Leave Annual and long service leave that fall due wholly within the next 12 months is measured based on the estimated amount of remuneration payable when the leave is taken.
Annual and long service leave, including applicable on-costs, that do not fall due within the next 12 months are measured at the present value of estimated future payments to be made in respect of services provided by employees up to the end of the reporting period. Consideration is given to the future wage and salary levels, experience of employee departures and periods of service. At each reporting period end, the present value of future payments is calculated using market yields on Commonwealth Government bonds with terms to maturity that match, as closely as possible, the estimated future cash flows. In 2012-13, the rate used to estimate the present value of these future payments is 101.3% (106.6% in 2011-12).
The long service leave liability is estimated with reference to the minimum period of qualifying service. For employees with less than the required minimum period of 7 years qualifying service, the probability that employees will reach the required minimum period has been taken into account in estimating the provision for long service leave and the applicable on-costs.
The provision for annual and long service leave includes estimated on-costs. As these on-costs only become payable if the employee takes annual and long service leave while in service, the probability that employees will take annual and long service leave while in service has been taken into account in estimating the liability for on-costs.
Annual and long service leave liabilities are classified as current liabilities in the Balance Sheet where there are no unconditional rights to defer the settlement of the liability for at least 12 months. However, where there is an unconditional right to defer settlement of the liability for at least 12 months, annual leave and long service leave have been classified as a non-current liability in the Balance Sheet.
(x) Superannuation
The Directorate receives funding for superannuation payments as part of the Government Payment for Outputs. The Directorate then makes payments on a fortnightly basis to the Territory Banking Account to cover its superannuation liability for the Commonwealth Superannuation Scheme (CSS) and the Public Sector Superannuation Scheme (PSS). This payment covers the CSS/PSS employer contribution (but does not include the productivity component). The Directorate pays the productivity component directly to Comsuper. The CSS and PSS are defined benefit superannuation plans meaning that the defined benefits received by employees are based on the employee’s years of service and average final salary.

Community Services Directorate Notes to and Forming Part of the Financial Statements
For the Year Ended 30 June 2013
NOTE 2. SUMMARY OF SIGNIFICANT ACCOUNTING POLICIES (Continued)
(x) Superannuation (continued)
Superannuation payments have also been made directly to superannuation funds for those members of the Public Sector who are part of superannuation accumulation schemes. This includes the Public Sector Superannuation Scheme Accumulation Plan (PSSAP) and schemes of employee choice.
Superannuation employer contribution payments for the CSS and PSS are calculated by taking the salary level at an employee’s anniversary date and multiplying by the actuarially assessed nominal CSS or PSS employer contribution rate for each employee. The productivity component payments are calculated by taking the salary level, at an employee’s anniversary date, and multiplying it by the employer contribution rate (approximately 3%) for each employee.
Superannuation payments for the PSSAP are calculated by taking the salary level, at an employee’s anniversary date, and multiplying it by the appropriate employer contribution rate.
Superannuation payments for fund of choice arrangements are calculated by taking an employee’s salary each pay and multiplying it by the appropriate employer contribution rate.
A superannuation liability is not recognised in the Balance Sheet as the Superannuation Provision Account recognises the total Territory superannuation liability for the CSS and PSS, and Comsuper and the external schemes recognises the superannuation liability for the PSSAP and other schemes respectively.
The ACT Government is liable for the reimbursement of the emerging costs of benefits paid each year to members of the CSS and PSS in respect of the ACT Government service provided after 1 July 1989. These reimbursement payments are made from the Superannuation Provision Account.
(y) Equity Contributed by the ACT Government
Contributions made by the ACT Government, through its role as owner of the Directorate, are treated as contributions of equity.
Increases or decreases in net assets as a result of Administrative Restructures are also recognised in equity.
(z) Insurance
Major risks are insured through the ACT Insurance Authority. The excess payable, under this arrangement, varies depending on each class of insurance held.
Community Services Directorate Notes to and Forming Part of the Financial Statements
For the Year Ended 30 June 2013
NOTE 2. SUMMARY OF SIGNIFICANT ACCOUNTING POLICIES (Continued)
(aa) Significant Accounting Judgements and Estimates
In the process of applying the accounting policies listed in this note, the Directorate has made the following judgements and estimates that have the most significant impact on the amounts recorded in the financial statements:
(a) Fair Value of Assets: The Directorate has made a significant judgement regarding the fair value of its assets. Land and buildings, including the correctional facility, land improvements, community and heritage assets and works of art have been recorded at the market value of similar properties or assets as determined by an independent valuer. The valuer discounts the land value to reflect its use for community purposes. In some circumstances, buildings that are purpose built may in fact realise more or less in the market. Works of art are valued independently by an accredited art valuer.
(b) Employee Benefits: Significant judgements have been applied in estimating the liability for employee benefits. The estimated liability for employee benefits requires a consideration of the future wage and salary levels, experience of employee departures and periods of service. The estimate also includes an assessment of the probability that employees will meet the minimum service period required to qualify for long service leave and that on-costs will become payable. Further information on this estimate is outlined in Note 2(w) Employee Benefits and Note 3(a) Change in Accounting Estimate.
(c) Impairment Losses: Debts are written off as impaired when so identified. The write-off is to expense or, to the extent an allowance for impairment already existed, as a reversal of the allowance. An allowance is raised for any impairment based on a review of all outstanding accounts at year end.
(d) Estimate of Useful Life of Property, Plant and Equipment: The Directorate has made a significant estimate in determining the useful lives of its property, plant and equipment. The estimation of property, plant and equipment has been based on the historical experience of similar assets. For assets valued by an external valuer, the Directorate applies the estimated remaining useful life of assets as assessed in the valuation reports. Leasehold Improvements and Motor Vehicles under a finance lease have a useful life equal to the estimated useful life assessed by the Directorate at the time of acquisition or the unexpired period of the lease. For all other plant and equipment, an assessment of the useful life of the asset is done at the time of acquisition. The useful lives are assessed on an annual basis and any adjustments made when considered necessary. Further disclosure concerning an asset’s useful life can be found at Note 2(s) Depreciation and Amortisation of Non-Current Assets.
No other accounting assumptions or estimates have been identified that have a significant risk of causing a material adjustment to carrying amounts of assets and liabilities within the next accounting period.
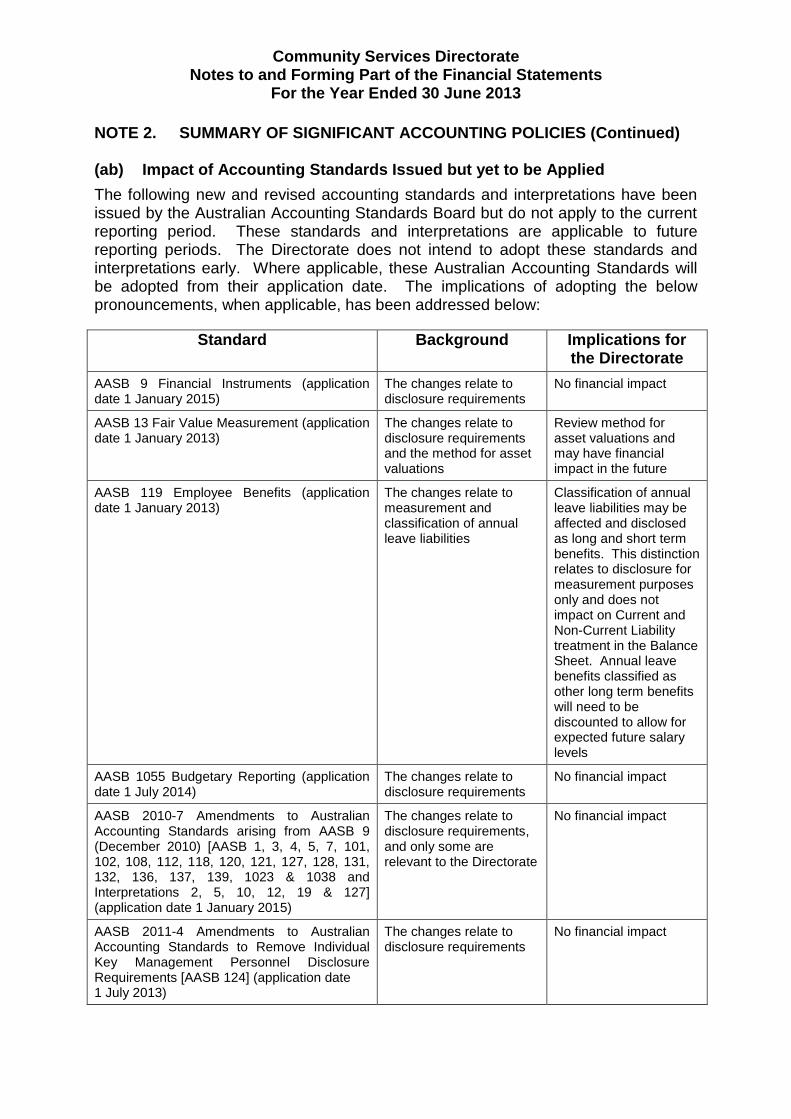
Community Services Directorate Notes to and Forming Part of the Financial Statements
For the Year Ended 30 June 2013
NOTE 2. SUMMARY OF SIGNIFICANT ACCOUNTING POLICIES (Continued)
(ab) Impact of Accounting Standards Issued but yet to be Applied
The following new and revised accounting standards and interpretations have been issued by the Australian Accounting Standards Board but do not apply to the current reporting period. These standards and interpretations are applicable to future reporting periods. The Directorate does not intend to adopt these standards and interpretations early. Where applicable, these Australian Accounting Standards will be adopted from their application date. The implications of adopting the below pronouncements, when applicable, has been addressed below:
Standard Background Implications for the Directorate
AASB 9 Financial Instruments (application date 1 January 2015)
The changes relate to disclosure requirements
No financial impact
AASB 13 Fair Value Measurement (application The changes relate to Review method for date 1 January 2013) disclosure requirements
and the method for asset valuations
asset valuations and may have financial impact in the future
AASB 119 Employee Benefits (application date 1 January 2013)
The changes relate to measurement and classification of annual leave liabilities
Classification of annual leave liabilities may be affected and disclosed as long and short term benefits. This distinction relates to disclosure for measurement purposes only and does not impact on Current and Non-Current Liability treatment in the Balance Sheet. Annual leave benefits classified as other long term benefits will need to be discounted to allow for expected future salary levels
AASB 1055 Budgetary Reporting (application date 1 July 2014)
The changes relate to disclosure requirements
No financial impact
AASB 2010-7 Amendments to Australian Accounting Standards arising from AASB 9 (December 2010) [AASB 1, 3, 4, 5, 7, 101, 102, 108, 112, 118, 120, 121, 127, 128, 131, 132, 136, 137, 139, 1023 & 1038 and Interpretations 2, 5, 10, 12, 19 & 127] (application date 1 January 2015)
The changes relate to disclosure requirements, and only some are relevant to the Directorate
No financial impact
AASB 2011-4 Amendments to Australian Accounting Standards to Remove Individual Key Management Personnel Disclosure Requirements [AASB 124] (application date 1 July 2013)
The changes relate to disclosure requirements
No financial impact

Community Services Directorate Notes to and Forming Part of the Financial Statements
For the Year Ended 30 June 2013
NOTE 2. SUMMARY OF SIGNIFICANT ACCOUNTING POLICIES (Continued)
(ab) Impact of Accounting Standards Issued but yet to be Applied (Continued)
Standard Background Implications for the Directorate
AASB 2011-8 Amendments to Australian Accounting Standards arising from AASB 13 [AASB 1, 2, 3, 4, 5, 7, 9, 2009-11, 101, 107, 112, 118, 119, 120, 121, 128, 131, 132, 133, 134, 136, 138, 139, 140, 141, 1004, 1023 & 1038 and Interpretations 2, 4, 12, 13, 14, 17, 19, 131 & 132] (application date 1 January 2013)
The changes relate to disclosure requirements and method for asset valuations
Review method for asset valuations to ensure compliance with AASB 13
AASB 2012-5 Amendments to Australian Accounting Standards arising from Annual Improvements 2009-2011 Cycle [AASB 1, 101, 116, 132, 134 and Interpretation 2] (application date 1 January 2013)
The changes relate to disclosure requirements
No financial impact
AASB 2012-6 Amendments to Australian Accounting Standards – Mandatory Effective Date AASB 9 and Transition Disclosures [AASB 9, AASB 2009-11, AASB 2010-7 & AASB 2011-8] (application date 1 January 2013)
The changes relate to disclosure requirements
No financial impact

Community Services Directorate Notes to and Forming Part of the Financial Statements
For the Year Ended 30 June 2013
NOTE 3. CHANGE IN ACCOUNTING ESTIMATES, ACCOUNTING POLICY AND CORRECTION OF A PRIOR PERIOD ERROR
(a) Change in Accounting Estimate
Revision of Estimation of the Employee Benefit Liability
As disclosed in Note 2(w) Employee Benefits, annual and long service leave liabilities, including applicable on-costs, which do not fall due within the next 12 months, are measured at the present value of estimated future payments to be made in respect of services provided by employees up to the end of the reporting period. The present value of future payments is estimated using the Commonwealth Government bond rate.
Last financial year the present value rate was 106.6%, however, due to a change in the Commonwealth Government bond rate, the rate used is 101.3% in 2012-13.
This change has resulted in a decrease to the estimate of the long service leave liability and expense in the current reporting period of approximately $512k. There is no change in the estimate of annual leave liability and expense as it is assumed that they will fall within the next 12 months.
Revision of Useful Lives and Residual Values
The Directorate reviews the useful lives and residual values of its non-current assets as part of its revaluation process. This review resulted in the adjustment to the useful lives of some buildings, land improvements and community and heritage assets this financial year and the increase in residual value of some properties. Assets held at cost are assessed through an annual stock take process. Useful lives and residual values for those assets are revised when identified and considered material. The revision of useful lives and residual values will result in a decrease in depreciation expenses in the next reporting period of approximately $57k. For further details see Note 2(s) Depreciation and Amortisation of Non-Current Assets and Note 13 Depreciation and Amortisation.
All other accounting policies used in the preparation of these financial statements are consistent with those used in 2011-12.
(b) Change in Accounting Policy
The Directorate had no changes in Accounting Policy during the reporting period.
(c) Correction of Prior Period Errors
The Directorate had no correction of prior period errors during the reporting period.

Community Services Directorate Notes to and Forming Part of the Financial Statements
For the Year Ended 30 June 2013
NOTE 4. GOVERNMENT PAYMENT FOR OUTPUTS
Government Payment for Outputs (GPO) is revenue received from the ACT Government to fund
the costs of delivering outputs. The ACT Government pays GPO appropriation on a fortnightly
basis.
2013 2012
$'000 $'000
Revenue from the ACT Government
Government Payment for Outputs a
226,713 216,676
Government Payment for Outputs 226,713 216,676
a) GPO funding for 2012-13 was greater than in 2011-12 mainly due to funding for projects rolled
over from 2011-12, funding for new initiatives, such as Additional Positions for Care and
Protection Services, Out of Home Care Costs, Therapy Assistants Program, Blueprint for Youth
Justice and additional funding from the Commonwealth for DisabilityCare. This was partially
offset by funding for projects rolled over into 2013-14 and the transfer of funding for the Childcare
Services and Regulation function to the Education and Training Directorate (ETD) as part of the
Administrative Arrangements effective from 10 November 2012.

Community Services Directorate Notes to and Forming Part of the Financial Statements
For the Year Ended 30 June 2013
NOTE 5. USER CHARGES
User charge revenue is derived by providing services to other ACT Government agencies and to
the public. User-charge revenue is not part of ACT Government appropriation and is paid by the
user of the services. This revenue is driven by consumer demand and is commercial in nature.
2013 2012
$'000 $'000
User Charges - ACT Government
User Charges - ACT Government a
360 41
Total User Charges - ACT Government 360 41
User Charges - Non-ACT Government
Respite Care for Disability Clients 97 96
Individual Support Accommodation for Disability Clients b
188 184
Tenant Rental Income c
1,810 1,387 d
Facilities Hire 493 289
Other e
508 687
Total User Charges - Non-ACT Government 3,096 2,643
Total User Charges for Goods and Services 3,456 2,684
a) The increase in User Charges - ACT Government relates to monies received from Housing
ACT for their contribution to the Project Management Office, responsible for promoting and
implementing organisational strategy and change across the Directorate.
b) Revenue for Individual Support Accommodation for disability clients relates to funding received
from the NSW Department of Ageing, Disability, Housing and Community Services for one NSW
client accessing Disability ACT services.
c) The increase in Tenant Rental Income relates to rent received from external tenancies at the
Community Hubs and from tenants under the Affordable Rental Office. There was an increase in
the number of properties held under this scheme, 27 properties in 2012-13 compared to 22 in
2011-12.
d) The increase in Facilities Hire relates to additional revenue received for the hire of facilities for
the National Multicultural Festival and facility hire for rooms rented by external parties through the
Office for Multicultural and Aboriginal and Torres Strait Islander Affairs.
e) Other User Charges - Non-ACT Government largely relates to funding received from the
Commonwealth for welfare services provided to the Jervis Bay region and overseas adoption
fees. The decrease from 2011-12 relates to one-off recoveries of salary costs for one staff on
secondment to the Australian Children's Education and Care Quality Authority.
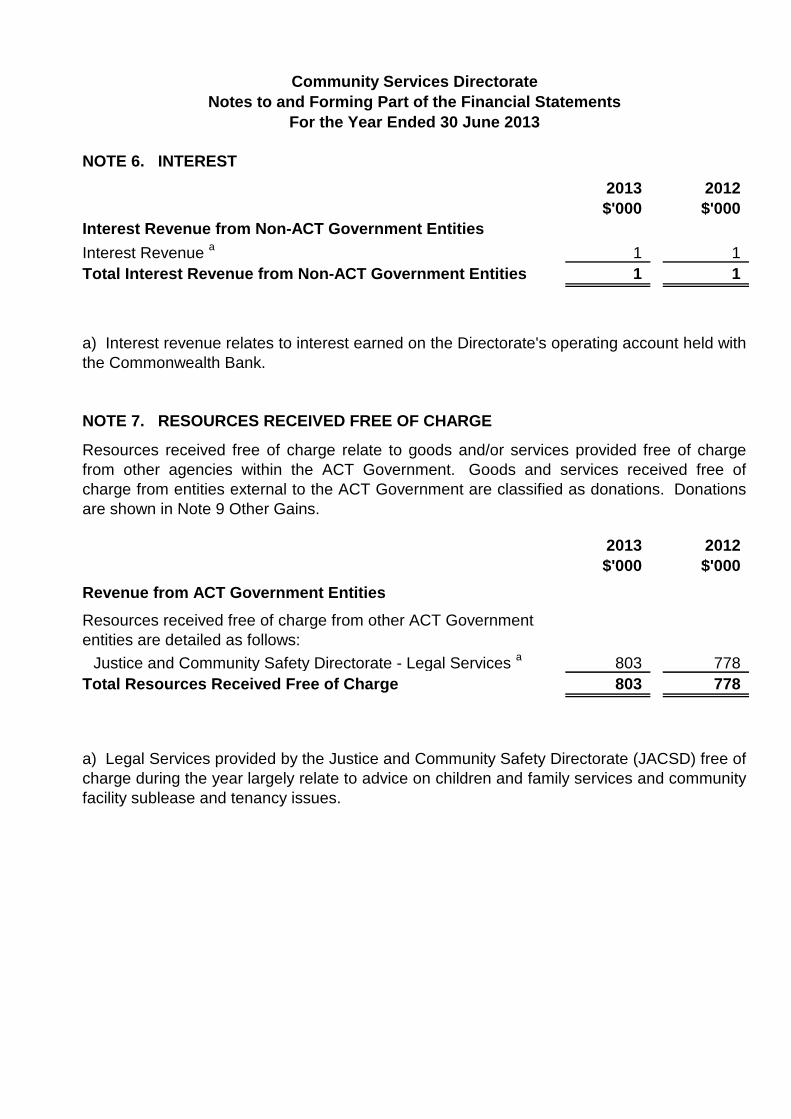
Community Services Directorate Notes to and Forming Part of the Financial Statements
For the Year Ended 30 June 2013
NOTE 6. INTEREST
2013 2012
$'000 $'000
Interest Revenue from Non-ACT Government Entities
Interest Revenue a
1 1
Total Interest Revenue from Non-ACT Government Entities 1 1
a) Interest revenue relates to interest earned on the Directorate's operating account held with
the Commonwealth Bank.
NOTE 7. RESOURCES RECEIVED FREE OF CHARGE
Resources received free of charge relate to goods and/or services provided free of charge
from other agencies within the ACT Government. Goods and services received free of
charge from entities external to the ACT Government are classified as donations. Donations
are shown in Note 9 Other Gains.
2013 2012
$'000 $'000
Revenue from ACT Government Entities
Resources received free of charge from other ACT Government
entities are detailed as follows:
Justice and Community Safety Directorate - Legal Services a
803 778
Total Resources Received Free of Charge 803 778
a) Legal Services provided by the Justice and Community Safety Directorate (JACSD) free of
charge during the year largely relate to advice on children and family services and community
facility sublease and tenancy issues.
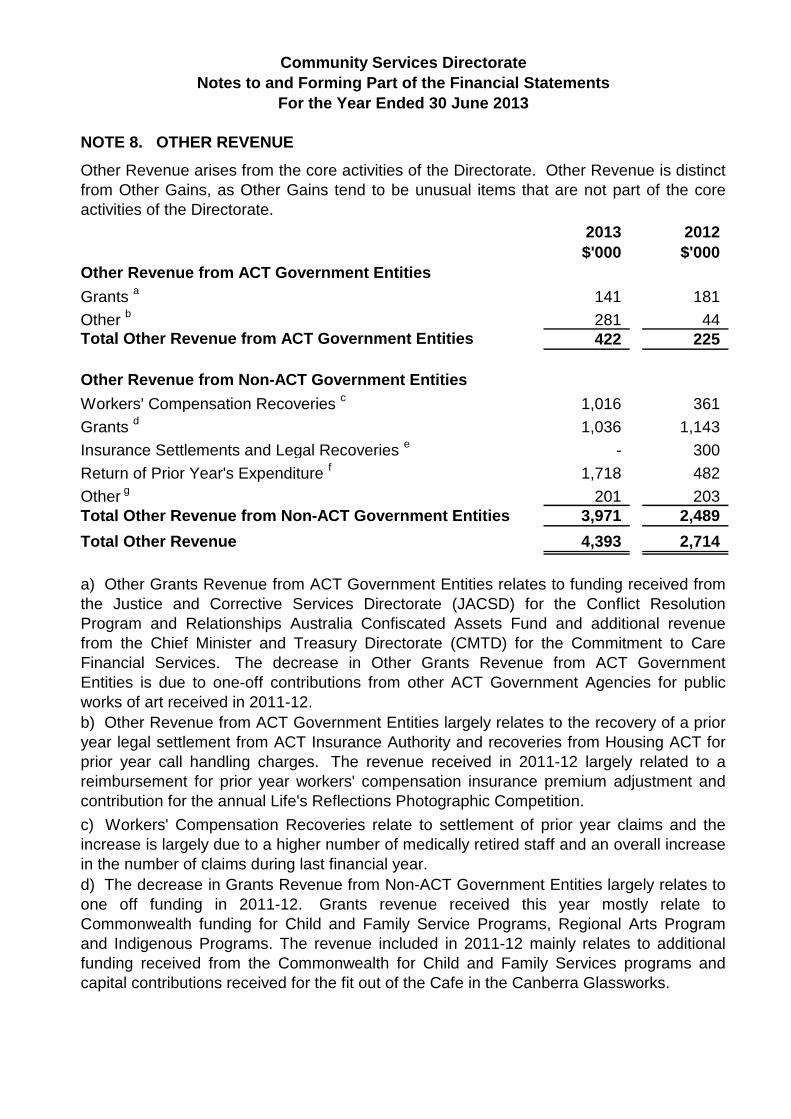
Community Services Directorate Notes to and Forming Part of the Financial Statements
For the Year Ended 30 June 2013
NOTE 8. OTHER REVENUE
Other Revenue arises from the core activities of the Directorate. Other Revenue is distinct
from Other Gains, as Other Gains tend to be unusual items that are not part of the core
activities of the Directorate.
2013 2012
$'000 $'000
Other Revenue from ACT Government Entities
Grants a
141 181 b
Other 281 44 Total Other Revenue from ACT Government Entities 422 225
Other Revenue from Non-ACT Government Entities
Workers' Compensation Recoveries c
1,016 361
Grants d
1,036 1,143
Insurance Settlements and Legal Recoveries e
- 300
Return of Prior Year's Expenditure f
1,718 482 g
Other 201 203
Total Other Revenue from Non-ACT Government Entities 3,971 2,489
Total Other Revenue 4,393 2,714
a) Other Grants Revenue from ACT Government Entities relates to funding received from
the Justice and Corrective Services Directorate (JACSD) for the Conflict Resolution
Program and Relationships Australia Confiscated Assets Fund and additional revenue
from the Chief Minister and Treasury Directorate (CMTD) for the Commitment to Care
Financial Services. The decrease in Other Grants Revenue from ACT Government
Entities is due to one-off contributions from other ACT Government Agencies for public
works of art received in 2011-12.
b) Other Revenue from ACT Government Entities largely relates to the recovery of a prior
year legal settlement from ACT Insurance Authority and recoveries from Housing ACT for
prior year call handling charges. The revenue received in 2011-12 largely related to a
reimbursement for prior year workers' compensation insurance premium adjustment and
contribution for the annual Life's Reflections Photographic Competition.
c) Workers' Compensation Recoveries relate to settlement of prior year claims and the
increase is largely due to a higher number of medically retired staff and an overall increase
in the number of claims during last financial year.
d) The decrease in Grants Revenue from Non-ACT Government Entities largely relates to
one off funding in 2011-12. Grants revenue received this year mostly relate to
Commonwealth funding for Child and Family Service Programs, Regional Arts Program
and Indigenous Programs. The revenue included in 2011-12 mainly relates to additional
funding received from the Commonwealth for Child and Family Services programs and
capital contributions received for the fit out of the Cafe in the Canberra Glassworks.
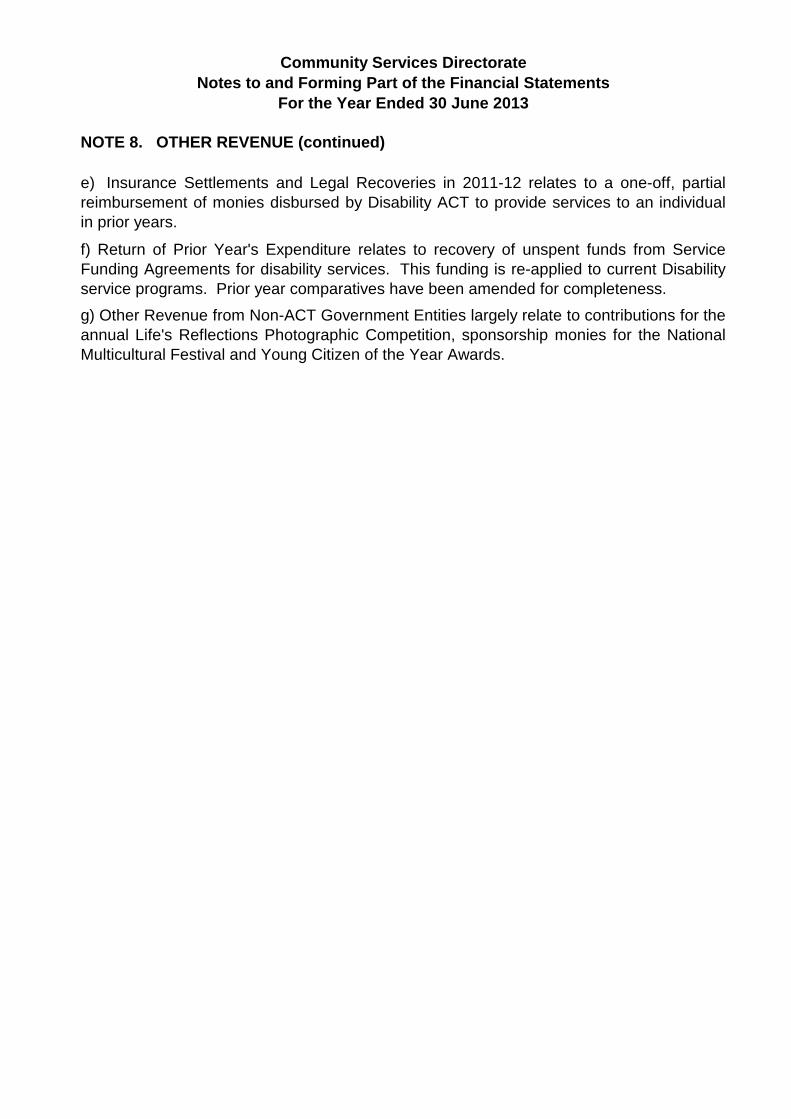
Community Services Directorate
Notes to and Forming Part of the Financial Statements
For the Year Ended 30 June 2013
NOTE 8. OTHER REVENUE (continued)
e) Insurance Settlements and Legal Recoveries in 2011-12 relates to a one-off, partial
reimbursement of monies disbursed by Disability ACT to provide services to an individual
in prior years.
f) Return of Prior Year's Expenditure relates to recovery of unspent funds from Service
Funding Agreements for disability services. This funding is re-applied to current Disability
service programs. Prior year comparatives have been amended for completeness.
g) Other Revenue from Non-ACT Government Entities largely relate to contributions for the
annual Life's Reflections Photographic Competition, sponsorship monies for the National
Multicultural Festival and Young Citizen of the Year Awards.

Community Services Directorate Notes to and Forming Part of the Financial Statements
For the Year Ended 30 June 2013
NOTE 9. OTHER GAINS
Other Gains tend to be one-off, unusual transactions that are not part of the Directorate's
core activities. Other Gains are distinct from other revenue, as other revenue arises from
the core activities of the Directorate.
2013 2012
$'000 $'000
Gains from the Sale of Assets a
97 128
Gains from the Contribution of Assets b
1,185 7,203
Donations c
26 -
Other Gains d
- 47
Total Other Gains 1,308 7,378
a) Gains from the Sale of Assets relate to motor vehicles, where the finance lease has
expired and the vehicle has been sold at a value higher than the residual value. The
decrease from 2011-12 relates to fewer vehicles disposed during the year (42 in 2012-13
compared to 46 in 2011-12) and more vehicles sold at a loss compared to last financial
year.
b) Gains from the Contribution of Assets for 2012-13 relate to the transfer of 4 Affordable
Rental Office properties from Housing ACT. Gains from the Contribution of Assets for
2011-12 relate to the transfer of 23 Affordable Rental Office properties from Housing ACT
and additional land at Gungahlin, Chisholm and Condor transferred from the Environment
and Sustainable Development Directorate (ESDD) for the expansion of existing childcare
centres. The gains also included transfers of land associated with the development of the
Bonython Community Hub from Housing ACT.
c) Donations in 2012-13 relate to the recognition of the 'Moai Statue' public works of art
statue donated to the people and the City of Canberra from the Ambassador of Chile in
1998. The asset was not previously recognised by any ACT Government agency.
d) Other Gains in 2011-12 related to the recognition of an interest-free loan from the
Environment and Sustainable Development Directorate (ESDD) from the Resource
Management Fund for the purpose of energy efficient lighting, controls and mechanical
upgrades in a variety of community facilities.

Community Services Directorate Notes to and Forming Part of the Financial Statements
For the Year Ended 30 June 2013
NOTE 10. EMPLOYEE EXPENSES
2013 2012
$'000 $'000
Salaries and Wages a
75,810 71,299
Annual Leave b
4,191 4,352
Long Service Leave c
1,527 2,851
Workers' Compensation Insurance Premium d
5,674 3,339
Other Employee Benefits and On-Costs e
289 353
Total Employee Expenses 87,491 82,194
a) The increase in Salaries and Wages can be attributed to an increase in average base
salaries compared to last financial year and an increase in full-time equivalent staff (FTEs)
(see Note 30 Employee Benefits).
b) The decrease in Annual Leave expense largely relates to a reduction in annual leave
provision due to fewer entitlement hours, lower Enterprise Bargaining Agreement (EBA) % rate
applied and lower number of employees with leave entitlements. The decrease also reflects
the transfer of 17 full time equivalent (FTE) staff to the Education and Training Directorate as
part of the Childcare Services and Regulation function under the Administrative Arrangements
(AAs) effective from 10 November 2012.
c) The reduction in Long Service Leave expense is mainly due to the impact of a lower
government bond rate used to estimate the present value of long service leave entitlements
(101.3% in 2012-13 compared to 106.6% in 2011-12) and a reduced anticipated EBA % used
to estimate salary increases relevant to employee entitlements.
d) The increase in Workers' Compensation Insurance Premium reflects the impact of an
adjustment to the ACT's risk margin by Comcare and an increase in the number of higher cost
claims.
e) Other Employee Benefits and On-Costs largely relates to employee fringe benefits. The
prior year also includes one voluntary redundancy paid out during 2011-12.
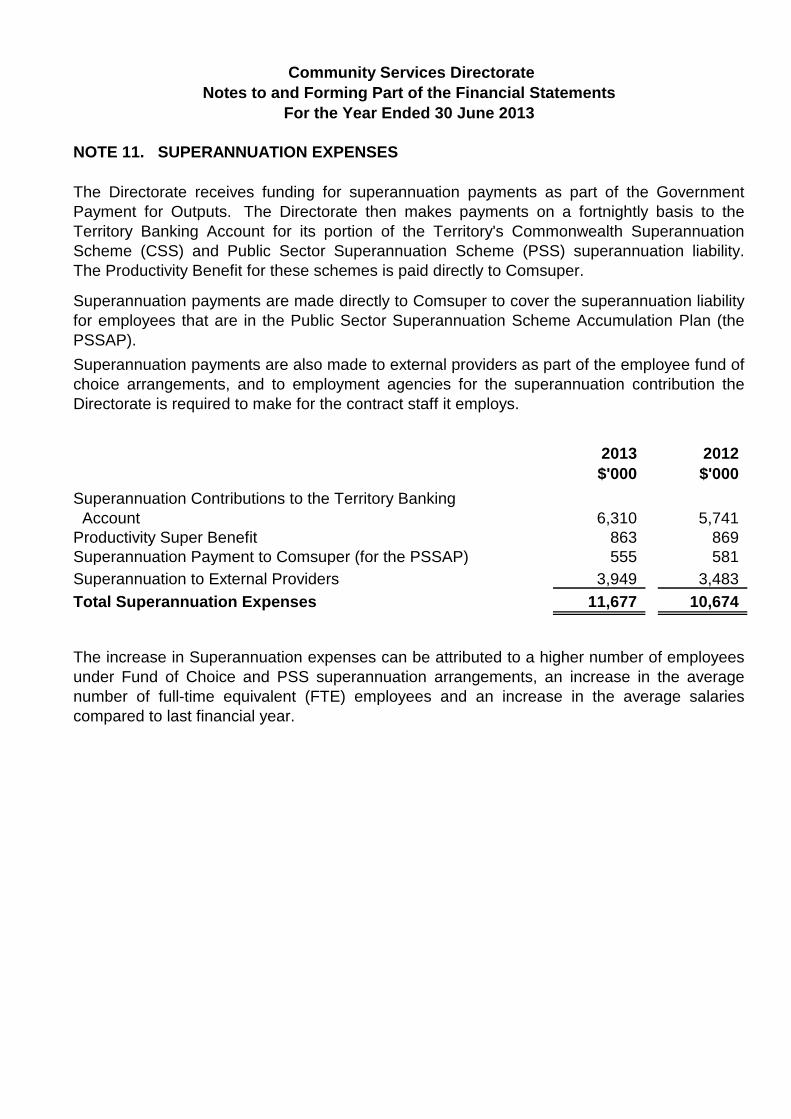
Community Services Directorate Notes to and Forming Part of the Financial Statements
For the Year Ended 30 June 2013
NOTE 11. SUPERANNUATION EXPENSES
The Directorate receives funding for superannuation payments as part of the Government
Payment for Outputs. The Directorate then makes payments on a fortnightly basis to the
Territory Banking Account for its portion of the Territory's Commonwealth Superannuation
Scheme (CSS) and Public Sector Superannuation Scheme (PSS) superannuation liability.
The Productivity Benefit for these schemes is paid directly to Comsuper.
Superannuation payments are made directly to Comsuper to cover the superannuation liability
for employees that are in the Public Sector Superannuation Scheme Accumulation Plan (the
PSSAP).
Superannuation payments are also made to external providers as part of the employee fund of
choice arrangements, and to employment agencies for the superannuation contribution the
Directorate is required to make for the contract staff it employs.
2013 2012
$'000 $'000
Superannuation Contributions to the Territory Banking
Account 6,310 5,741
Productivity Super Benefit 863 869
Superannuation Payment to Comsuper (for the PSSAP) 555 581
Superannuation to External Providers 3,949 3,483
Total Superannuation Expenses 11,677 10,674
The increase in Superannuation expenses can be attributed to a higher number of employees
under Fund of Choice and PSS superannuation arrangements, an increase in the average
number of full-time equivalent (FTE) employees and an increase in the average salaries
compared to last financial year.
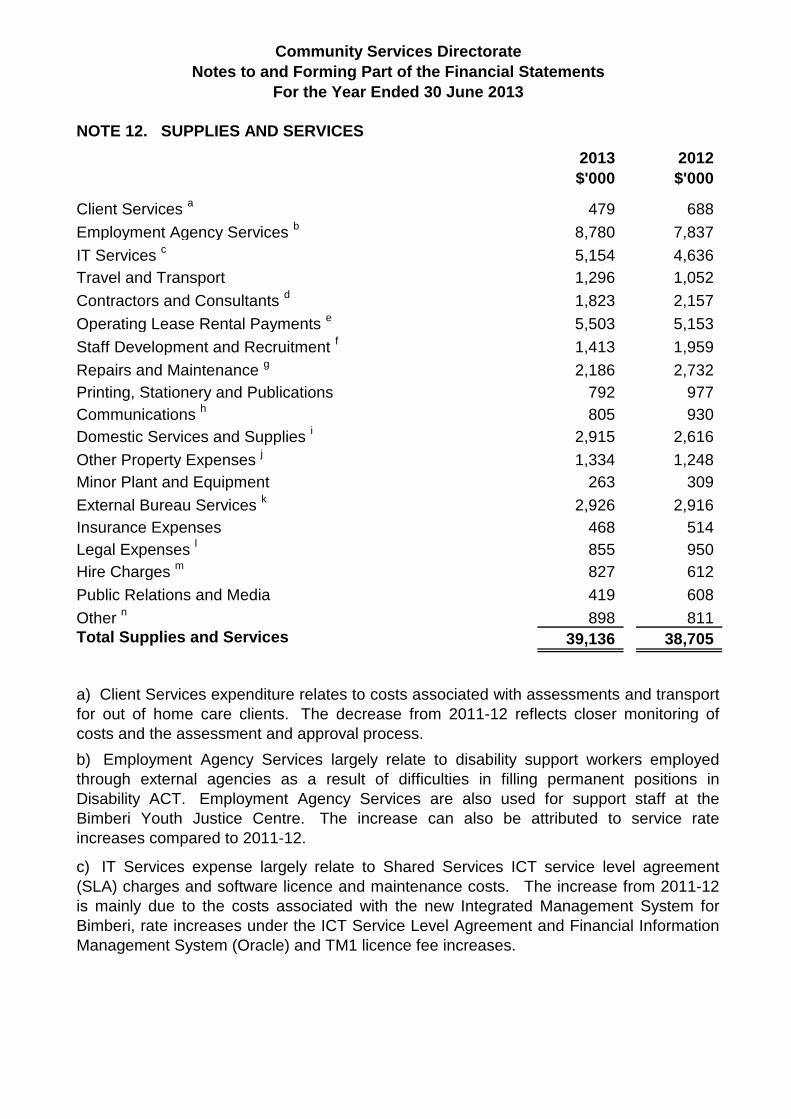
Community Services Directorate Notes to and Forming Part of the Financial Statements
For the Year Ended 30 June 2013
NOTE 12. SUPPLIES AND SERVICES
2013 2012
$'000 $'000
Client Services a
479 688
Employment Agency Services b
8,780 7,837
IT Services c
5,154 4,636
Travel and Transport 1,296 1,052
Contractors and Consultants d
1,823 2,157
Operating Lease Rental Payments e
5,503 5,153
Staff Development and Recruitment f
1,413 1,959
Repairs and Maintenance g
2,186 2,732
Printing, Stationery and Publications 792 977 h
Communications 805 930
Domestic Services and Supplies i
2,915 2,616 j
Other Property Expenses 1,334 1,248
Minor Plant and Equipment 263 309
External Bureau Services k
2,926 2,916
Insurance Expenses 468 514
Legal Expenses l
855 950
Hire Charges m
827 612
Public Relations and Media 419 608
Other n
898 811
Total Supplies and Services 39,136 38,705
a) Client Services expenditure relates to costs associated with assessments and transport
for out of home care clients. The decrease from 2011-12 reflects closer monitoring of
costs and the assessment and approval process.
b) Employment Agency Services largely relate to disability support workers employed
through external agencies as a result of difficulties in filling permanent positions in
Disability ACT. Employment Agency Services are also used for support staff at the
Bimberi Youth Justice Centre. The increase can also be attributed to service rate
increases compared to 2011-12.
c) IT Services expense largely relate to Shared Services ICT service level agreement
(SLA) charges and software licence and maintenance costs. The increase from 2011-12
is mainly due to the costs associated with the new Integrated Management System for
Bimberi, rate increases under the ICT Service Level Agreement and Financial Information
Management System (Oracle) and TM1 licence fee increases.

Community Services Directorate Notes to and Forming Part of the Financial Statements
For the Year Ended 30 June 2013
NOTE 12. SUPPLIES AND SERVICES (continued)
d) The decrease in Contractors and Consultants largely relate to one off payments in
2011-12 for costs associated with the Bimberi Youth Justice Centre reviews, Office for
Children, Youth and Family Support organisation structure review, development of the
National Quality Framework and the development of a disability awareness program for
schools (Everyday EveryOne). One-off expenses for 2012-13 include costs associated
with consultation and development for the Fitters Workshop, the Arts Activity Hubs,
Strategic Asset Management Plan for Community and Youth Facilities, Triple Bottom Line
reporting requirements, Hands Across Canberra and Improving Services for Families.
e) The increase in Operating Lease Rental Payments can be largely attributed to the
renewal of lease contract for Swanson Plaza and a general increase in rental costs this
year associated with 11 Moore St, Canberra City and Nature Conservation House in
Belconnen for the area occupied by Disability ACT staff.
f) The decrease in Staff Development and Recruitment largely relate to one-off costs in
2011-12 for relocation expenses for the overseas recruitment of Care and Protection staff.
g) The decrease in Repairs and Maintenance largely relates to the transfer of 28
Childcare Centres to the Education and Training Directorate (ETD) as part of the
Administrative Arrangements effective from 10 November 2012. All repairs and
maintenance costs associated with these properties after the transfer date are included in
ETD's expenditure for the year. There was also a reduction in unforseen repairs and
maintenance associated with Community Facilities.
h) Communications expenses relates to telephones, faxes, mobile phones and desktop
line usage. The overall decrease in costs is due to savings achieved by a reduction in
usage across the Directorate.
i) The increase in costs associated with Domestic Services and Supplies largely relates to
an increase in rates for utilities and domestic services for the Bimberi Youth Justice
Centre, Disability ACT group homes and the tenanted Community Hubs.
j) The increase in Other Property Expenses mostly relates to management costs
associated with the Affordable Rental Office for properties tenanted for the full year,
property management fees for the Griffin Centre and additional valuation and survey
services during the year.
k) External Bureau Services expenditure relates to the Shared Services Centre services
provided for Human Resources, Finance, Records Management and Procurement.
l) The decrease in Legal Expenses largely relates to resources received free of charge
from the Justice and Community Safety Directorate (JACSD) for various legal services
provided, including advice on children and family services and tenanted community hubs
sublease reviews. The services provided in 2011-12 included work performed on the
Working with Vulnerable People Bill 2011 and Young People Amendment Bill 2011 .

Community Services Directorate
Notes to and Forming Part of the Financial Statements
For the Year Ended 30 June 2013
NOTE 12. SUPPLIES AND SERVICES (continued)
m) The increase in Hire Charges largely relates to higher costs for infrastructure, lighting,
generators and other services for the National Multicultural Festival. The increase is also
due to general rate increases for office hire charges.
n) The increase in Other Supplies and Services largely relates to an increase in external
audit services for an independent quality assurance audit of community providers of
disability services and an increase in entertainment and hospitality costs associated with
the Young Canberra Citizen Awards and other official events.

Community Services Directorate Notes to and Forming Part of the Financial Statements
For the Year Ended 30 June 2013
NOTE 13. DEPRECIATION AND AMORTISATION 2013 2012 $'000 $'000
Depreciation
Correctional Facility 787 773
Buildings *a
4,571 4,745
Land Improvements *a
285 385
Leasehold Improvements b
394 532
Heritage and Community Assets *c
488 463
Plant and Equipment 69 69 d
Motor Vehicles 672 586
Total Depreciation 7,266 7,553
Amortisation
Externally Developed Software e
137 52
Total Amortisation 137 52
Total Depreciation and Amortisation 7,403 7,605
* Overall Depreciation Expenses for Buildings, Land Improvements and Heritage and
Community Assets have decreased due to the transfer of 28 Childcare facilities to the
Education and Training Directorate (ETD) as part of the Administrative Arrangements
(AAs) effective from 10 November 2012.
a) The decrease in depreciation for Buildings and Land Improvements is mainly due to the
AA transfer of Childcare properties to ETD, partially offset by the impact of the transfer to
the Directorate of an additional 4 Affordable Rental Office Properties from Housing ACT.
b) The decrease in depreciation for Leasehold Improvements can be attributed to a major
fit out of Swanson Plaza, which reached the end of its estimated useful life in December
2012.
c) The increase in depreciation for Heritage and Community Assets can be attributed to
the reclassification of Strathnairn Homestead as a Heritage Asset during the financial year,
partially offset by the transfer of one Heritage listed Childcare Centre to ETD as part of the
AAs.
d) The increase in depreciation for Motor Vehicles can be attributed to more vehicles taken
up on finance leases during the year and the disposal of some vehicles during the year.
The Directorate has 149 vehicles under a finance lease as at 30 June 2013, compared to
138 in 2011-12.
e) The increase in depreciation for Externally Developed Software relates to the addition of
the Disability Client Information System in September 2012.
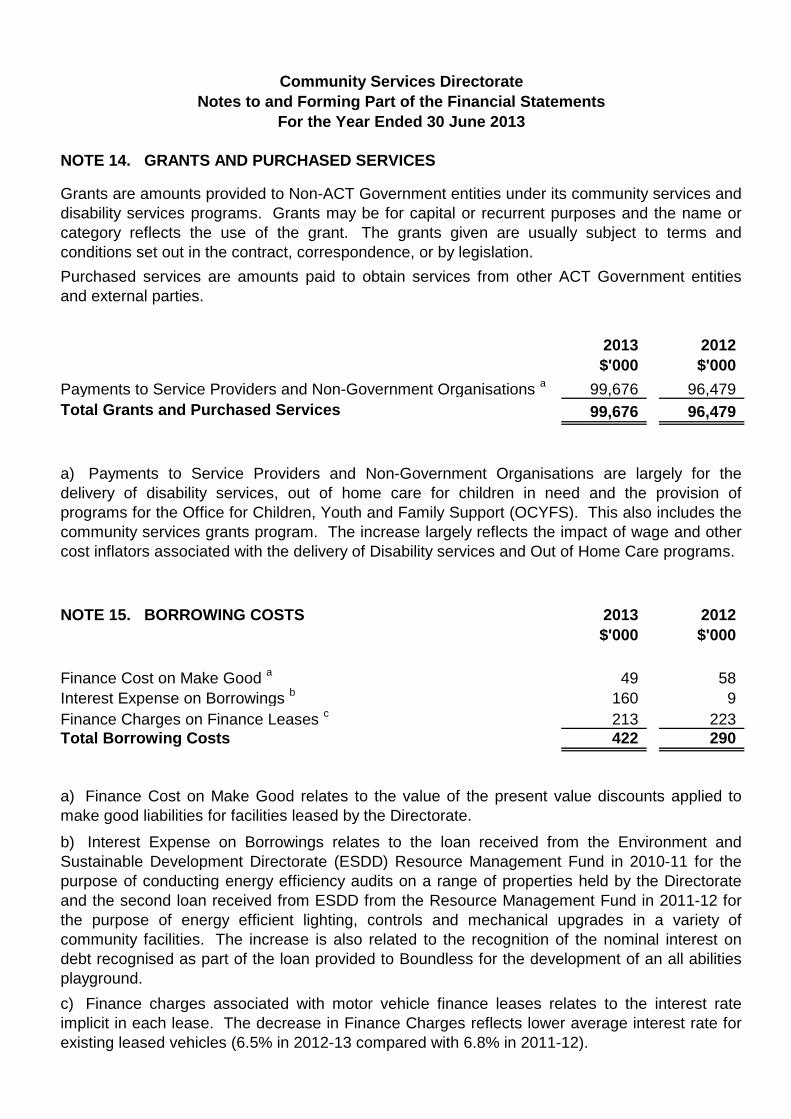
Community Services Directorate Notes to and Forming Part of the Financial Statements
For the Year Ended 30 June 2013
NOTE 14. GRANTS AND PURCHASED SERVICES
Grants are amounts provided to Non-ACT Government entities under its community services and
disability services programs. Grants may be for capital or recurrent purposes and the name or
category reflects the use of the grant. The grants given are usually subject to terms and
conditions set out in the contract, correspondence, or by legislation.
Purchased services are amounts paid to obtain services from other ACT Government entities
and external parties.
2013 2012
$'000 $'000
Payments to Service Providers and Non-Government Organisations a
99,676 96,479
Total Grants and Purchased Services 99,676 96,479
a) Payments to Service Providers and Non-Government Organisations are largely for the
delivery of disability services, out of home care for children in need and the provision of
programs for the Office for Children, Youth and Family Support (OCYFS). This also includes the
community services grants program. The increase largely reflects the impact of wage and other
cost inflators associated with the delivery of Disability services and Out of Home Care programs.
NOTE 15. BORROWING COSTS 2013 2012
$'000 $'000
Finance Cost on Make Good a
49 58 b
Interest Expense on Borrowings 160 9
Finance Charges on Finance Leases c
213 223
Total Borrowing Costs 422 290
a) Finance Cost on Make Good relates to the value of the present value discounts applied to
make good liabilities for facilities leased by the Directorate.
b) Interest Expense on Borrowings relates to the loan received from the Environment and
Sustainable Development Directorate (ESDD) Resource Management Fund in 2010-11 for the
purpose of conducting energy efficiency audits on a range of properties held by the Directorate
and the second loan received from ESDD from the Resource Management Fund in 2011-12 for
the purpose of energy efficient lighting, controls and mechanical upgrades in a variety of
community facilities. The increase is also related to the recognition of the nominal interest on
debt recognised as part of the loan provided to Boundless for the development of an all abilities
playground.
c) Finance charges associated with motor vehicle finance leases relates to the interest rate
implicit in each lease. The decrease in Finance Charges reflects lower average interest rate for
existing leased vehicles (6.5% in 2012-13 compared with 6.8% in 2011-12).

Community Services Directorate Notes to and Forming Part of the Financial Statements
For the Year Ended 30 June 2013
NOTE 16. OTHER EXPENSES 2013 2012
$'000 $'000
Act of Grace Payments (see Note 19) - 10
Impairment Losses and Write-offs (see Note 18) 141 83
Loss on Disposal of Assets a
113 25
Total Other Expenses 254 118
a) Loss on Disposal of Assets relates to the retirement of 13 vehicles disposed of at less than
the residual value and the decommissioning of 3 public works of art. The Loss on Disposal of
Assets from 2011-12 relates to the decommissioning of a public work of art.
NOTE 17. ASSET TRANSFERS
2013 2012
$'000 $'000
Asset Transfers a
229 -
Total Asset Transfers 229 -
a) Asset Transfers relates to one Affordable Rental Office property transferred to Housing ACT
during the year as it was no longer available for use as part of the scheme.
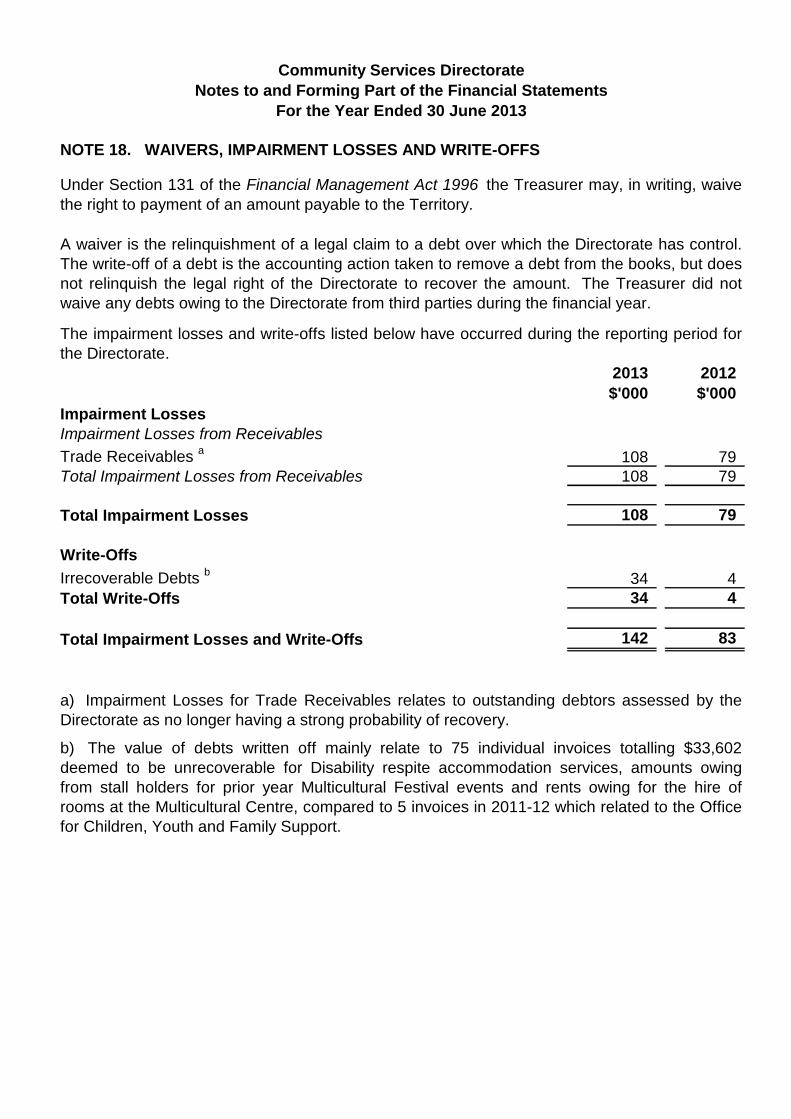
Community Services Directorate Notes to and Forming Part of the Financial Statements
For the Year Ended 30 June 2013
NOTE 18. WAIVERS, IMPAIRMENT LOSSES AND WRITE-OFFS
Under Section 131 of the Financial Management Act 1996 the Treasurer may, in writing, waive
the right to payment of an amount payable to the Territory.
A waiver is the relinquishment of a legal claim to a debt over which the Directorate has control.
The write-off of a debt is the accounting action taken to remove a debt from the books, but does
not relinquish the legal right of the Directorate to recover the amount. The Treasurer did not
waive any debts owing to the Directorate from third parties during the financial year.
The impairment losses and write-offs listed below have occurred during the reporting period for
the Directorate.
2013 2012
$'000 $'000
Impairment Losses
Impairment Losses from Receivables
Trade Receivables a
108 79
Total Impairment Losses from Receivables 108 79
Total Impairment Losses 108 79
Write-Offs b
Irrecoverable Debts 34 4
Total Write-Offs 34 4
Total Impairment Losses and Write-Offs 142 83
a) Impairment Losses for Trade Receivables relates to outstanding debtors assessed by the
Directorate as no longer having a strong probability of recovery.
b) The value of debts written off mainly relate to 75 individual invoices totalling $33,602
deemed to be unrecoverable for Disability respite accommodation services, amounts owing
from stall holders for prior year Multicultural Festival events and rents owing for the hire of
rooms at the Multicultural Centre, compared to 5 invoices in 2011-12 which related to the Office
for Children, Youth and Family Support.

Community Services Directorate Notes to and Forming Part of the Financial Statements
For the Year Ended 30 June 2013
NOTE 19. ACT OF GRACE PAYMENTS
Under Section 130 of the Financial Management Act 1996 the Treasurer may, in writing,
authorise Act of Grace Payments to be made by the Directorate. Act of Grace payments are a
method of providing equitable remedies to entities or individuals that may have been unfairly
disadvantaged by the Government but have no legal claim to the payment.
There were no Act of Grace payments made during the financial year.
In 2011-12 the Treasurer authorised one Act of Grace Payment. This payment related to fees
incurred for legal representation in an appeal against disciplinary action initiated by the
Directorate. The appeal against disciplinary action did not legally entitle the recipient to
compensation, however as they were unfairly disadvantaged, the Treasurer approved the Act of
Grace Payment.
2013 2012
$'000 $'000
Legal Fees - 10 Total Act of Grace Payments - 10
NOTE 20. AUDITOR'S REMUNERATION
Auditor's remuneration consists of financial audit services provided to the Directorate by the
ACT Auditor-General's Office.
No other services were provided by the ACT Auditor-General's Office.
2013 2012
$'000 $'000
Audit Services
Audit Fees Paid to the ACT Auditor-General's Office 105 101
Total Audit Services 105 101

Community Services Directorate Notes to and Forming Part of the Financial Statements
For the Year Ended 30 June 2013
NOTE 21. CASH AND CASH EQUIVALENTS
The Directorate holds a number of bank accounts with the Commonwealth Bank and
Westpac Banking Corporation as part of the whole-of-government banking
arrangements.
2013 2012
$'000 $'000
Cash at Bank a
3,813 2,610
Cash on Hand 12 25
Total Cash and Cash Equivalents 3,825 2,635
a) Cash at Bank mainly relates to revenue received in advance from the
Commonwealth for Early Intervention and Prevention Services and Youth Services,
the Directorate's cash buffer and cash held for energy efficiency projects to be
undertaken in 2013-14, the external management of the Smartcard for the Taxi
Subsidy Scheme and funding associated with the Public Arts Repairs and
Maintenance Sinking Fund.
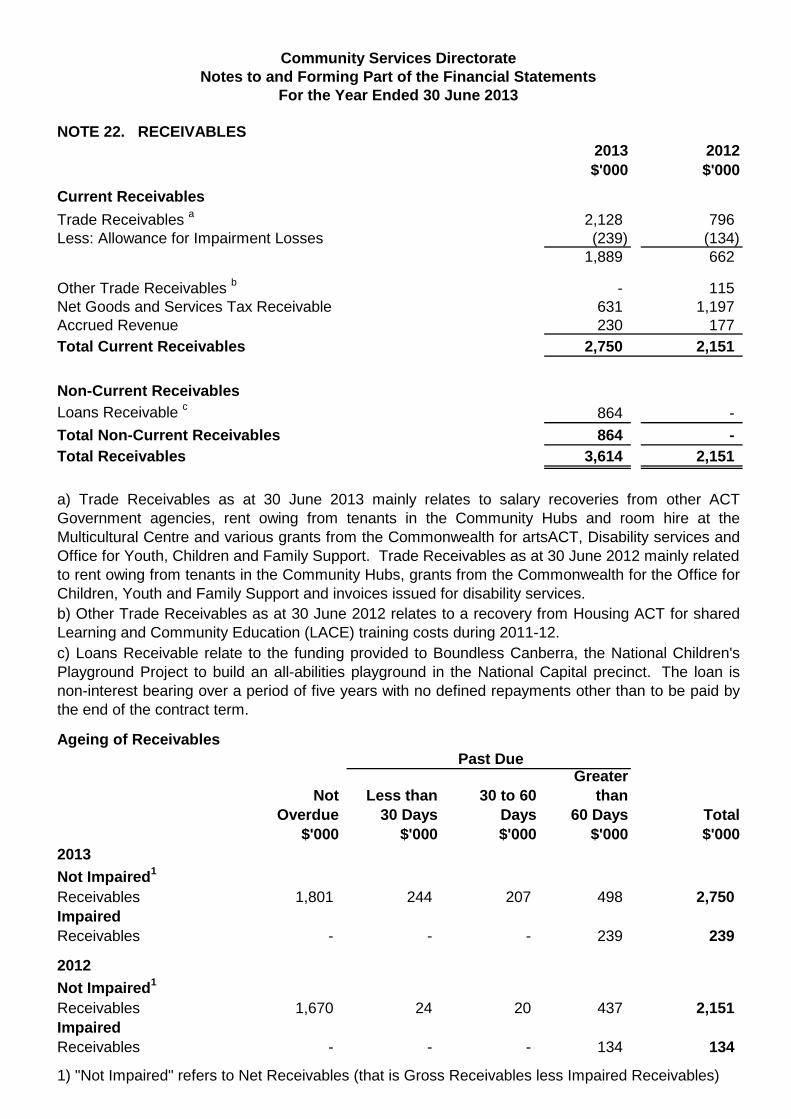
Community Services Directorate Notes to and Forming Part of the Financial Statements
For the Year Ended 30 June 2013
NOTE 22. RECEIVABLES 2013 2012
$'000 $'000
Current Receivables
Trade Receivables a
2,128 796
Less: Allowance for Impairment Losses (239) (134)
1,889 662
bOther Trade Receivables - 115
Net Goods and Services Tax Receivable 631 1,197
Accrued Revenue 230 177
Total Current Receivables 2,750 2,151
Non-Current Receivables
Loans Receivable c
864 -
Total Non-Current Receivables 864 -
Total Receivables 3,614 2,151
a) Trade Receivables as at 30 June 2013 mainly relates to salary recoveries from other ACT
Government agencies, rent owing from tenants in the Community Hubs and room hire at the
Multicultural Centre and various grants from the Commonwealth for artsACT, Disability services and
Office for Youth, Children and Family Support. Trade Receivables as at 30 June 2012 mainly related
to rent owing from tenants in the Community Hubs, grants from the Commonwealth for the Office for
Children, Youth and Family Support and invoices issued for disability services.
b) Other Trade Receivables as at 30 June 2012 relates to a recovery from Housing ACT for shared
Learning and Community Education (LACE) training costs during 2011-12.
c) Loans Receivable relate to the funding provided to Boundless Canberra, the National Children's
Playground Project to build an all-abilities playground in the National Capital precinct. The loan is
non-interest bearing over a period of five years with no defined repayments other than to be paid by
the end of the contract term.
Ageing of Receivables
Past Due Greater
Not Less than 30 to 60 than
Overdue 30 Days Days 60 Days Total
$'000 $'000 $'000 $'000 $'000
2013
Not Impaired1
Receivables 1,801 244 207 498 2,750
Impaired
Receivables - - - 239 239
2012
Not Impaired1
Receivables 1,670 24 20 437 2,151
Impaired
Receivables - - - 134 134
1) "Not Impaired" refers to Net Receivables (that is Gross Receivables less Impaired Receivables)
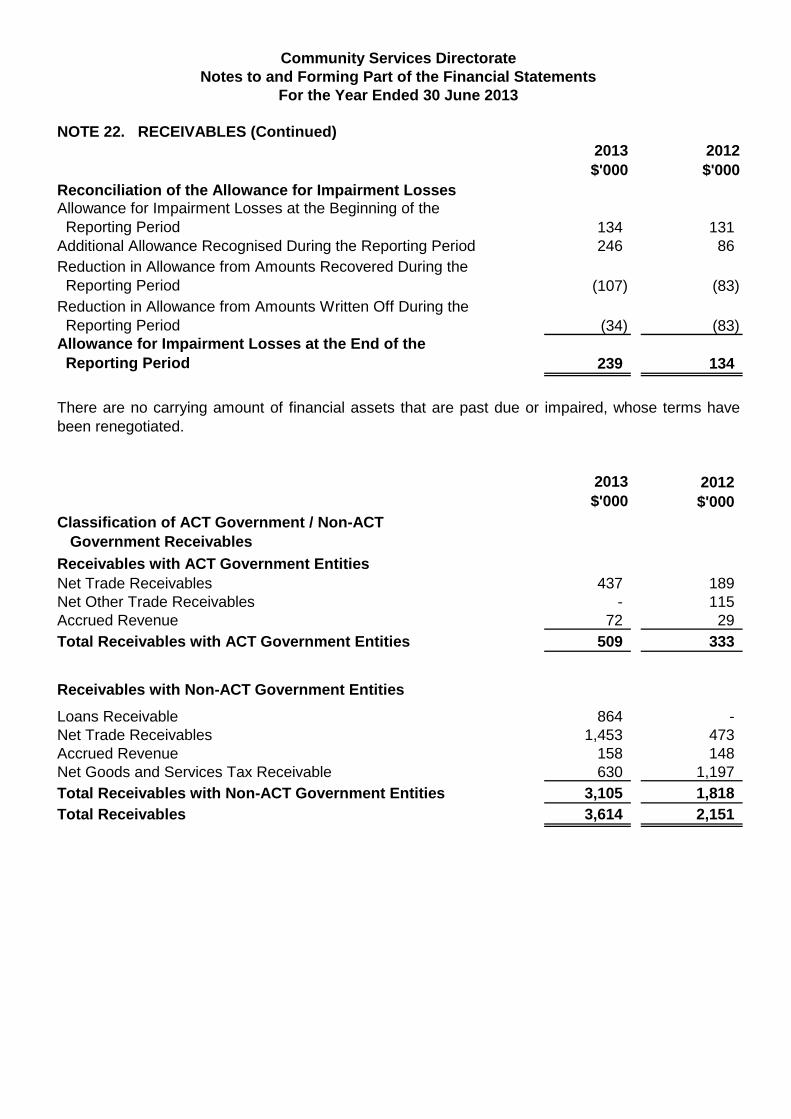
Community Services Directorate Notes to and Forming Part of the Financial Statements
For the Year Ended 30 June 2013
NOTE 22. RECEIVABLES (Continued)
Reconciliation of the Allowance for Impairment Losses
Allowance for Impairment Losses at the Beginning of the
Reporting Period
Additional Allowance Recognised During the Reporting Period
Reduction in Allowance from Amounts Recovered During the
Reporting Period
Reduction in Allowance from Amounts Written Off During the
Reporting Period
Allowance for Impairment Losses at the End of the
Reporting Period
2013 2012
$'000 $'000
134 131
246 86
(107) (83)
(34) (83)
239 134
There are no carrying amount of financial assets that are past due or impaired, whose terms have
been renegotiated.
Classification of ACT Government / Non-ACT
Government Receivables
Receivables with ACT Government Entities
Net Trade Receivables
Net Other Trade Receivables
Accrued Revenue
Total Receivables with ACT Government Entities
Receivables with Non-ACT Government Entities
Loans Receivable
Net Trade Receivables
Accrued Revenue
Net Goods and Services Tax Receivable
Total Receivables with Non-ACT Government Entities
Total Receivables
2013 2012
$'000 $'000
437 189
- 115
72 29
509 333
864 -
1,453 473
158 148
630 1,197
3,105 1,818 3,614 2,151

Community Services Directorate
Notes to and Forming Part of the Financial Statements
For the Year Ended 30 June 2013
NOTE 23. ASSETS HELD FOR SALE
The Directorate has classified some plant and equipment as 'assets held for sale'. As at
30 June 2013, the Directorate had 6 motor vehicles which had been returned to the fleet
provider (SG Fleet) and are expected to be sold in July 2013. The residual and all lease
payments have been paid. As such these vehicles have been classified as plant and
equipment held for sale.
2013 2012
$'000 $'000
Plant and Equipment Held for Sale a
120 199
Total Assets Held for Sale 120 199
a) With the majority of motor vehicle leases being 24 to 36 months, the decrease in plant
and equipment held for sale can be attributed to a fewer number of motor vehicle finance
lease contracts coming to an end during the 2013 financial year.
Community Services Directorate Notes to and Forming Part of the Financial Statements
For the Year Ended 30 June 2013
NOTE 24. PROPERTY, PLANT AND EQUIPMENT
Property, plant and equipment include the following classes of assets - Land, Correctional
Facility, Buildings, Land Improvements, Leasehold Improvements, Community and Heritage
Assets, Works of Art and Plant and Equipment.
Land includes all land held by the Directorate relating to Community, Youth and artsACT
facilities.
The Correctional Facility held by the Directorate relates to the buildings used at the Bimberi Youth Justice Centre.
Buildings and Land Improvements held by the Directorate include Community, Youth and
artsACT facilities acquired for the delivery of outputs and includes the written down value of land
improvements made in relation to those facilities.
Leasehold Improvements represent capital expenditure incurred in relation to leased assets and
any make good requirements relating to the leased premises. This includes fit-out of leased
buildings undertaken by the Directorate mainly in relation to its occupancy of Level 2 at Nature
Conservation House Belconnen, Swanson Plaza Belconnen, Women's Information Referral
Centre Canberra and the Ground Floor and Levels 4,5,6,7 and 8 of 11 Moore Street Canberra.
Community and Heritage Assets are non-current assets that the ACT Government intends to
preserve indefinitely because of their unique, cultural or environmental attributes. A common
feature of heritage assets is that they cannot be replaced and they are not usually available for
sale or for redeployment. Heritage and Community assets held by the Directorate include:
Oaks Estate Community Hall
The Causeway Hall
The Hall Museum
Hall Neighbourhood Hall and Precinct
Tharwa Primary and Pre-school
Corroboree Park Community Hall
Downer Community Hall
Gorman House
Ainslie Arts Centre
The Canberra Glassworks
The Chapel (Canberra Glassworks guest accommodation)
Strathnairn Homestead
Ethos (Public Work of Art)
Works of Art held by the Directorate include various public artworks around Canberra developed
and maintained by artsACT.
Plant and Equipment includes motor vehicles, communications equipment, furniture and fittings,
medical equipment and office equipment.

Community Services Directorate Notes to and Forming Part of the Financial Statements
For the Year Ended 30 June 2013
NOTE 24. PROPERTY, PLANT AND EQUIPMENT (Continued)
Land and Buildings
Land at Fair Value *a
Total Land Assets
Correctional Facility at Fair Value
Less: Accumulated Depreciation
Buildings at Fair Value *b
Less: Accumulated Depreciation
Less: Accumulated Impairment Losses
Land Improvements at Fair Value *c
Less: Accumulated Depreciation
Less: Accumulated Impairment Losses
Total Written Down Value of Buildings and Land
Improvements
Total Land and Written Down Value of Buildings
and Land Improvements
Leasehold Improvements
Leasehold Improvements at Cost d
Less: Accumulated Depreciation
Total Written Down Value of Leasehold Improvements
Community and Heritage Assets
Community and Heritage Assets at Fair Value *e
Less: Accumulated Depreciation
Total Written Down Value of Community and Heritage Assets
Works of Art f
Works of Art at Fair Value
Total Written Down Value of Works of Art
Plant and Equipment
Plant and Equipment at Cost g
Less: Accumulated Depreciation
Total Written Down Value of Plant and Equipment
Total Written Down Value of Property, Plant and Equipment
2013 2012
$'000 $'000
52,152 59,136
52,152 59,136
42,115 37,320
(76) (2,383)
113,810 145,675
(343) (7,767)
(367) (367)
9,242 11,652
(22) (843)
(42) (42)
164,317 183,245
216,469 242,381
13,487 13,851
(10,972) (11,043)
2,515 2,808
29,715 30,491
(56) (359)
29,659 30,132
12,510 10,170
12,510 10,170
4,990 4,627
(1,583) (1,464)
3,407 3,163
264,560 288,654
Community Services Directorate Notes to and Forming Part of the Financial Statements
For the Year Ended 30 June 2013
NOTE 24. PROPERTY, PLANT AND EQUIPMENT (Continued)
* On 10 November 2012, a restructuring of Administrative Arrangements (AAs) occurred
involving the transfer of Childcare Services and Regulation from the Directorate to the
Education and Training Directorate (ETD). 28 Childcare Facilities were transferred as part of
these arrangements affecting Land, Buildings, Land Improvements and Heritage and
Community Assets. The overall decrease to Property, Plant and Equipment from the transfers
to ETD was $33.259m (see Note 35 Restructures of Administrative Arrangements).
a) The decrease in Land at Fair Value can be attributed to the transfer of land for 27 Childcare
Facilities to the Education and Training Directorate (ETD) as part of the AAs ($15.432m). The
effect of this transfer was partially offset by the 4 additional Affordable Rental Office properties
transferred from Housing ACT to the Directorate. Valuations were also undertaken on all of the
Directorate's facilities, resulting in an increase in land values of $8.607m.
b) The decrease in Buildings mainly relates to the transfer of 27 Childcare Facilities to the
Education and Training Directorate (ETD) as part of the AAs ($14.460m). The effect of this
transfer was partially offset by the 4 additional Affordable Rental Office properties transferred
from Housing ACT to the Directorate ($0.870m) and the completion of various capital projects
during the year including the Flynn Community Hub, Bimberi Youth Justice Centre, Gungahlin
Library, Community and Youth Centre and Forde Community Centre. Valuations were also
undertaken on all the Directorate's facilities, resulting in an overall decrease in building values of
$3.966m.
c) The decrease in Land Improvements can be attributed to the transfer of land for 27 Childcare
Facilities to the Education and Training Directorate (ETD) as part of the AAs ($2.097m). The
effect of this transfer was partially offset by valuations undertaken on all the Directorate's
facilities, resulting in an increase in land improvement values of $0.994m. There were also
minor increases in Land Improvements relating to the completion of various minor capital
upgrades projects.
d) The decrease in Leasehold Improvements is due to the transfer of 3 Childcare Leasehold
Improvement Facilities to the Education and Training Directorate (ETD) as part of the AAs
($0.465m). These improvements had already reached the end of their useful lives and had
been fully depreciated. This was partially offset by the addition of leasehold improvement fitout
at 11 Moore St, Canberra City ($0.102m). e) The decrease in Community and Heritage assets at Fair Value is largely due to the transfer of
1 Childcare Facility to the Education and Training Directorate (ETD) as part of the AAs
($1.394m) and valuations undertaken on Heritage assets during the year also resulted in a
decrease to asset values of $3.116m. This decrease was partially offset by the reclassification
of the Strathnairn Homestead to Heritage Assets during the year from Land and Buildings
($2.649m) and the completion of capital works at Strathnairn Homestead, increasing Heritage
assets by $1.067m.
f) The increase in Works of Art assets at Fair Value is due to the completion of various public art
works including Touching Lightly, Prime Minister John Curtin and Treasurer Ben Chifley, Poets
Corner Busts, Oushi Zokei - Dream Lens for the Future, Droplet, Lady With Flowers, Bush Pack,
Blue Sky and Magenta Fold, Moth Ascending the Capital and Menzies Commission.
g) The increase in Plant and Equipment is largely due to more motor vehicles under a finance
lease held as at 30 June 2013 (149 compared to 138 as at 30 June 2012).
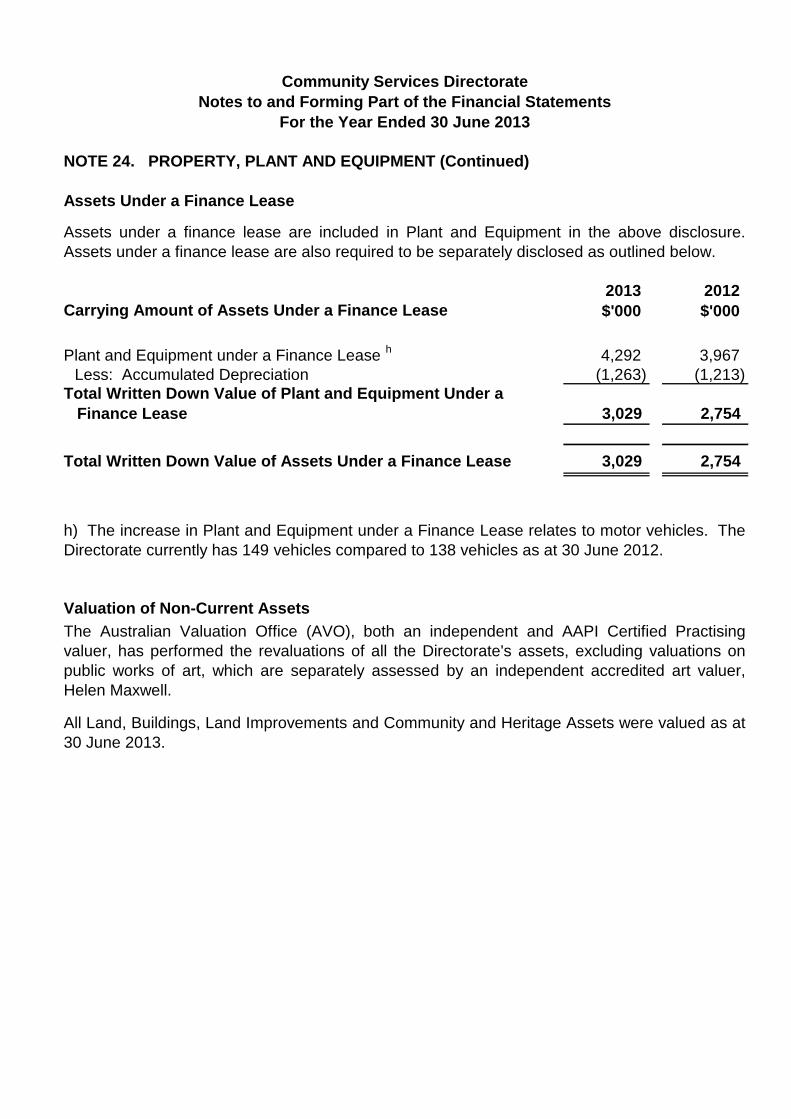
Community Services Directorate Notes to and Forming Part of the Financial Statements
For the Year Ended 30 June 2013
NOTE 24. PROPERTY, PLANT AND EQUIPMENT (Continued)
Assets Under a Finance Lease
Assets under a finance lease are included in Plant and Equipment in the above disclosure.
Assets under a finance lease are also required to be separately disclosed as outlined below.
2013 2012
Carrying Amount of Assets Under a Finance Lease $'000 $'000
Plant and Equipment under a Finance Lease h
4,292 3,967
Less: Accumulated Depreciation (1,263) (1,213)
Total Written Down Value of Plant and Equipment Under a
Finance Lease 3,029 2,754
Total Written Down Value of Assets Under a Finance Lease 3,029 2,754
h) The increase in Plant and Equipment under a Finance Lease relates to motor vehicles. The
Directorate currently has 149 vehicles compared to 138 vehicles as at 30 June 2012.
Valuation of Non-Current Assets
The Australian Valuation Office (AVO), both an independent and AAPI Certified Practising
valuer, has performed the revaluations of all the Directorate's assets, excluding valuations on
public works of art, which are separately assessed by an independent accredited art valuer,
Helen Maxwell.
All Land, Buildings, Land Improvements and Community and Heritage Assets were valued as at
30 June 2013.
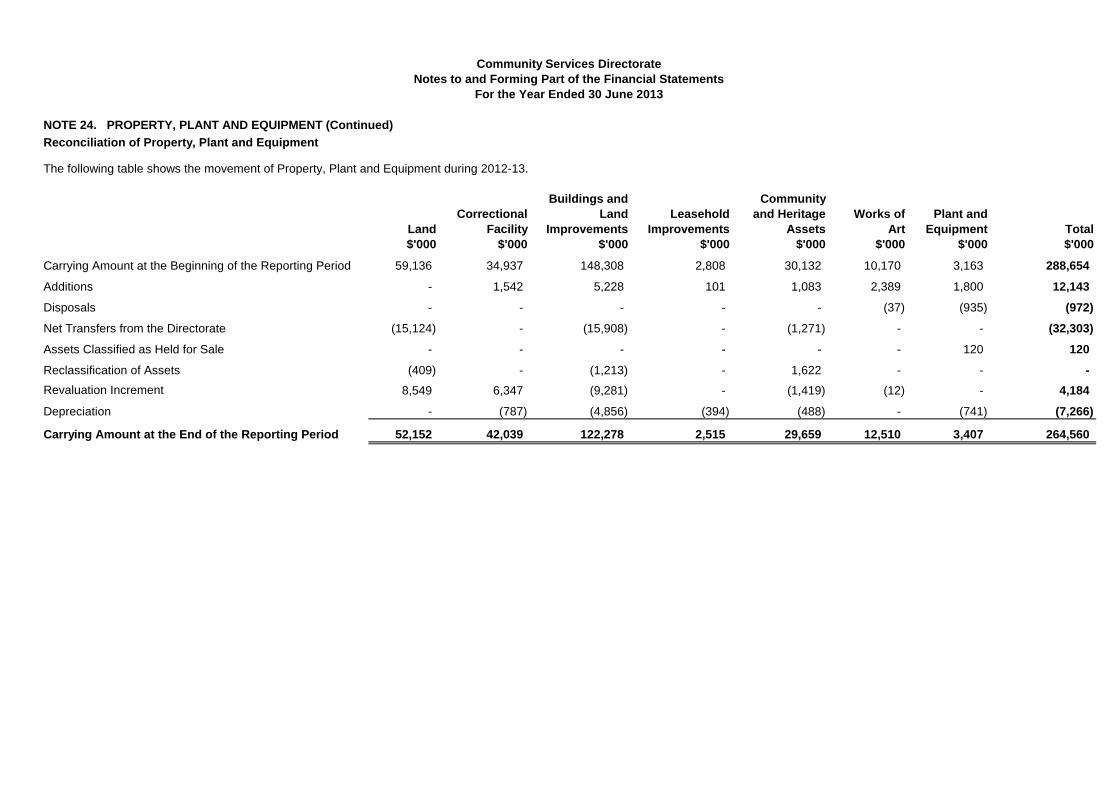
Community Services Directorate Notes to and Forming Part of the Financial Statements
For the Year Ended 30 June 2013
NOTE 24. PROPERTY, PLANT AND EQUIPMENT (Continued)
Reconciliation of Property, Plant and Equipment
The following table shows the movement of Property, Plant and Equipment during 2012-13.
Buildings and Community
Correctional Land Leasehold and Heritage Works of Plant and
Land Facility Improvements Improvements Assets Art Equipment Total
$'000 $'000 $'000 $'000 $'000 $'000 $'000 $'000
Carrying Amount at the Beginning of the Reporting Period 59,136 34,937 148,308 2,808 30,132 10,170 3,163 288,654
Additions - 1,542 5,228 101 1,083 2,389 1,800 12,143
Disposals - - - - - (37) (935) (972)
Net Transfers from the Directorate (15,124) - (15,908) - (1,271) - - (32,303)
Assets Classified as Held for Sale - - - - - - 120 120
Reclassification of Assets (409) - (1,213) - 1,622 - - -
Revaluation Increment 8,549 6,347 (9,281) - (1,419) (12) - 4,184
Depreciation - (787) (4,856) (394) (488) - (741) (7,266)
Carrying Amount at the End of the Reporting Period 52,152 42,039 122,278 2,515 29,659 12,510 3,407 264,560
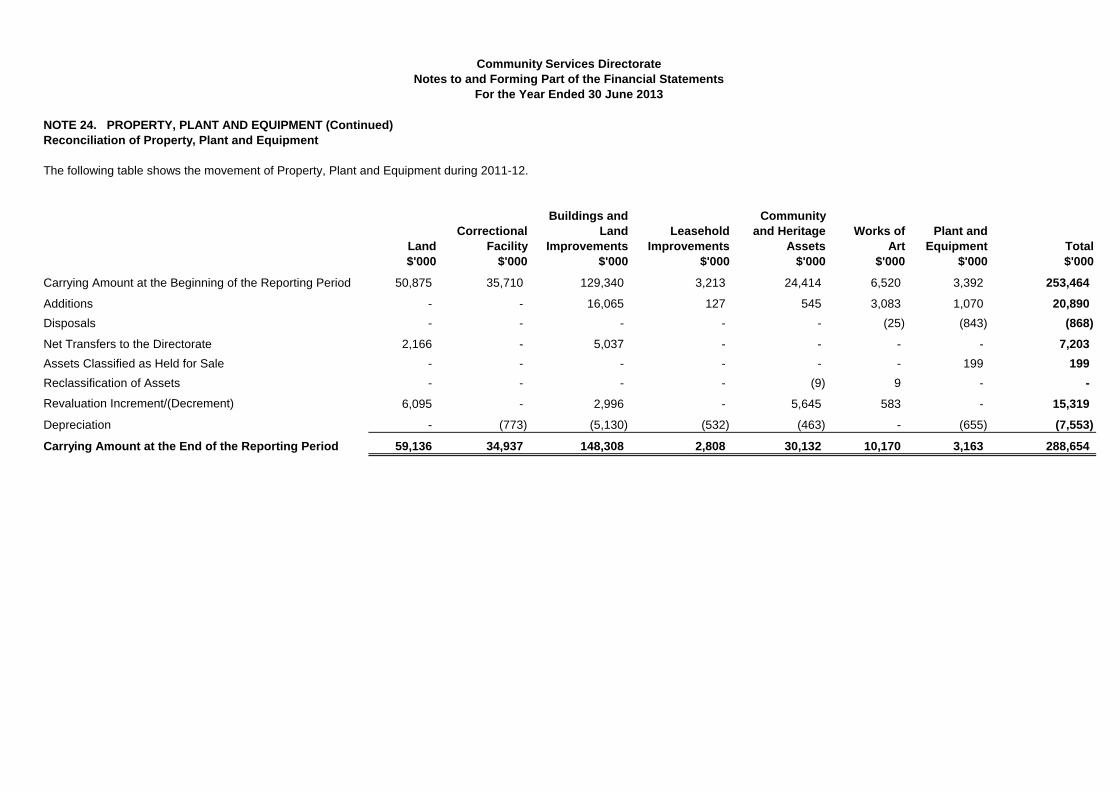
Community Services Directorate Notes to and Forming Part of the Financial Statements
For the Year Ended 30 June 2013
NOTE 24. PROPERTY, PLANT AND EQUIPMENT (Continued)
Reconciliation of Property, Plant and Equipment
The following table shows the movement of Property, Plant and Equipment during 2011-12.
Buildings and Community
Correctional Land Leasehold and Heritage Works of Plant and
Land Facility Improvements Improvements Assets Art Equipment Total
$'000 $'000 $'000 $'000 $'000 $'000 $'000 $'000
Carrying Amount at the Beginning of the Reporting Period 50,875 35,710 129,340 3,213 24,414 6,520 3,392 253,464
Additions - - 16,065 127 545 3,083 1,070 20,890
Disposals - - - - - (25) (843) (868)
Net Transfers to the Directorate 2,166 - 5,037 - - - - 7,203
Assets Classified as Held for Sale - - - - - - 199 199
Reclassification of Assets - - - - (9) 9 - -
Revaluation Increment/(Decrement) 6,095 - 2,996 - 5,645 583 - 15,319
Depreciation - (773) (5,130) (532) (463) - (655) (7,553)
Carrying Amount at the End of the Reporting Period 59,136 34,937 148,308 2,808 30,132 10,170 3,163 288,654

Community Services Directorate Notes to and Forming Part of the Financial Statements
For the Year Ended 30 June 2013
NOTE 25. INTANGIBLE ASSETS
The Directorate has externally purchased IBM Cognos TM1 software consisting of 20
licences and TRIM Context Software consisting of 80 licences.
Externally Purchased Software
Computer Software at Cost a
Less: Accumulated Amortisation
Total Externally Purchased Software
Total Intangible Assets
2013 2012
$'000 $'000
1,000 557
(583) (451)
417 106
417 106
a) The increase in Computer Software at Cost relates to a Disability client information
system implemented during the year.
Reconciliation of Intangible Assets
The following table shows the movement of Intangible Assets from the beginning to the
end of 2012-13.
Carrying Amount at the Beginning of the Reporting
Period
Additions Amortisation Expense
Externally
Purchased
Software Total
$'000 $'000
106 106
448 448
(137) (137)
Carrying Amount at the End of the Reporting Period 417
Reconciliation of Intangible Assets
The following table shows the movement of Intangible Assets from the beginning to the
end of 2011-12.
Carrying Amount at the Beginning of the Reporting
Period
Additions Amortisation Expense
Carrying Amount at the End of the Reporting Period
Externally
Purchased
Software Total
$'000 $'000
102 102
56 56
(52) (52)
106 106
417
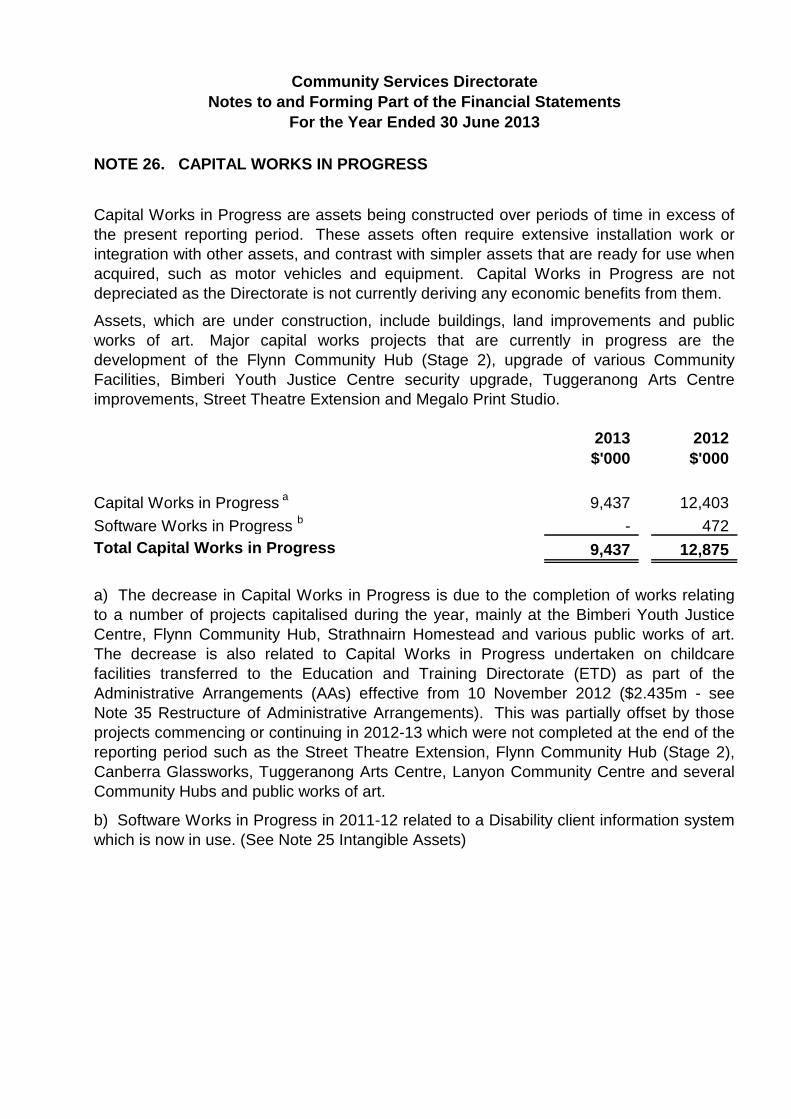
Community Services Directorate Notes to and Forming Part of the Financial Statements
For the Year Ended 30 June 2013
NOTE 26. CAPITAL WORKS IN PROGRESS
Capital Works in Progress are assets being constructed over periods of time in excess of
the present reporting period. These assets often require extensive installation work or
integration with other assets, and contrast with simpler assets that are ready for use when
acquired, such as motor vehicles and equipment. Capital Works in Progress are not
depreciated as the Directorate is not currently deriving any economic benefits from them.
Assets, which are under construction, include buildings, land improvements and public
works of art. Major capital works projects that are currently in progress are the
development of the Flynn Community Hub (Stage 2), upgrade of various Community
Facilities, Bimberi Youth Justice Centre security upgrade, Tuggeranong Arts Centre
improvements, Street Theatre Extension and Megalo Print Studio.
2013 2012
$'000 $'000
Capital Works in Progress a
9,437 12,403
Software Works in Progress b
- 472
Total Capital Works in Progress 9,437 12,875
a) The decrease in Capital Works in Progress is due to the completion of works relating
to a number of projects capitalised during the year, mainly at the Bimberi Youth Justice
Centre, Flynn Community Hub, Strathnairn Homestead and various public works of art.
The decrease is also related to Capital Works in Progress undertaken on childcare
facilities transferred to the Education and Training Directorate (ETD) as part of the
Administrative Arrangements (AAs) effective from 10 November 2012 ($2.435m - see
Note 35 Restructure of Administrative Arrangements). This was partially offset by those
projects commencing or continuing in 2012-13 which were not completed at the end of the
reporting period such as the Street Theatre Extension, Flynn Community Hub (Stage 2),
Canberra Glassworks, Tuggeranong Arts Centre, Lanyon Community Centre and several
Community Hubs and public works of art.
b) Software Works in Progress in 2011-12 related to a Disability client information system
which is now in use. (See Note 25 Intangible Assets)

Community Services Directorate Notes to and Forming Part of the Financial Statements
For the Year Ended 30 June 2013
NOTE 26. CAPITAL WORKS IN PROGRESS (Continued)
Reconciliation of Capital Works in Progress
The following shows the movement of Capital Works in Progress from the beginning to
end of 2012-13.
2013 2012
$'000 $'000
Carrying Amount at the Beginning of the Reporting
Period 12,875 13,904
Additions 11,431 18,847
Transfer out of Capital Works in Progress from Administrative
Arrangements (AAs) a
(4,180) -
Capital Works in Progress Completed and Expensed (17) -
Capital Works in Progress Completed and Transferred out
to Property, Plant and Equipment b
(10,217) (19,876)
Capital Works in Progress Completed and Transferred out
to Intangibles c
(455) -
Carrying Amount at the End of the Reporting Period 9,437 12,875
a) The Transfer of Capital Works in Progress from the Administrative Arrangements
(AAs) in 2013 relates to projects transferred to the Education and Training Directorate
(ETD) for childcare facility upgrades.
b) The balance transferred out of Capital Works in Progress in 2013 mainly relates to
works finalised at the Flynn Community Hub, Bimberi Youth Justice Centre, Strathnairn
Homestead and various public works of art. The balance transferred out of Capital Works
in Progress in 2012 relates to completed stages at the Flynn Childcare Centre, West
Belconnen Child and Family Centre, Tuggeranong 55 Plus Club, Watson Arts Centre and
various public works of art.
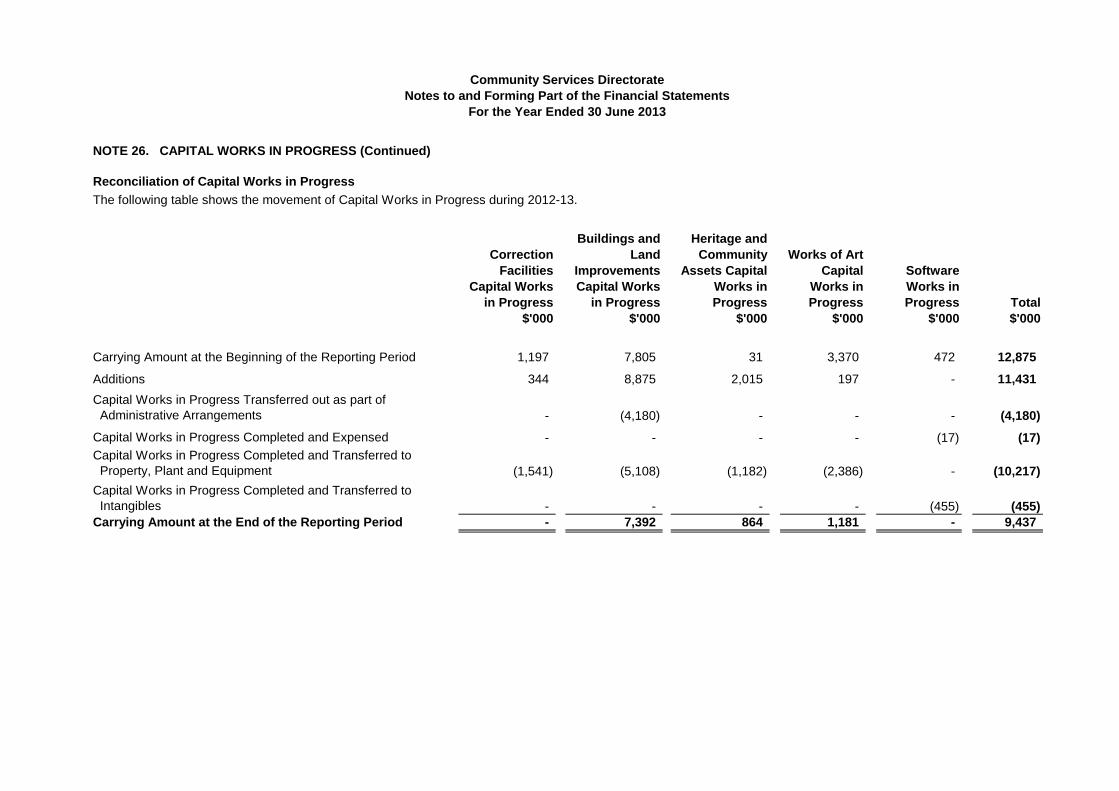
Community Services Directorate Notes to and Forming Part of the Financial Statements
For the Year Ended 30 June 2013
NOTE 26. CAPITAL WORKS IN PROGRESS (Continued)
Reconciliation of Capital Works in Progress
The following table shows the movement of Capital Works in Progress during 2012-13.
Buildings and Heritage and
Correction Land Community Works of Art
Facilities Improvements Assets Capital Capital Software
Capital Works Capital Works Works in Works in Works in
in Progress in Progress Progress Progress Progress Total
$'000 $'000 $'000 $'000 $'000 $'000
Carrying Amount at the Beginning of the Reporting Period 1,197 7,805 31 3,370 472 12,875
Additions 344 8,875 2,015 197 - 11,431
Capital Works in Progress Transferred out as part of
Administrative Arrangements - (4,180) - - - (4,180)
Capital Works in Progress Completed and Expensed - - - - (17) (17)
Capital Works in Progress Completed and Transferred to
Property, Plant and Equipment (1,541) (5,108) (1,182) (2,386) - (10,217)
Capital Works in Progress Completed and Transferred to
Intangibles - - - - (455) (455)
Carrying Amount at the End of the Reporting Period - 7,392 864 1,181 - 9,437
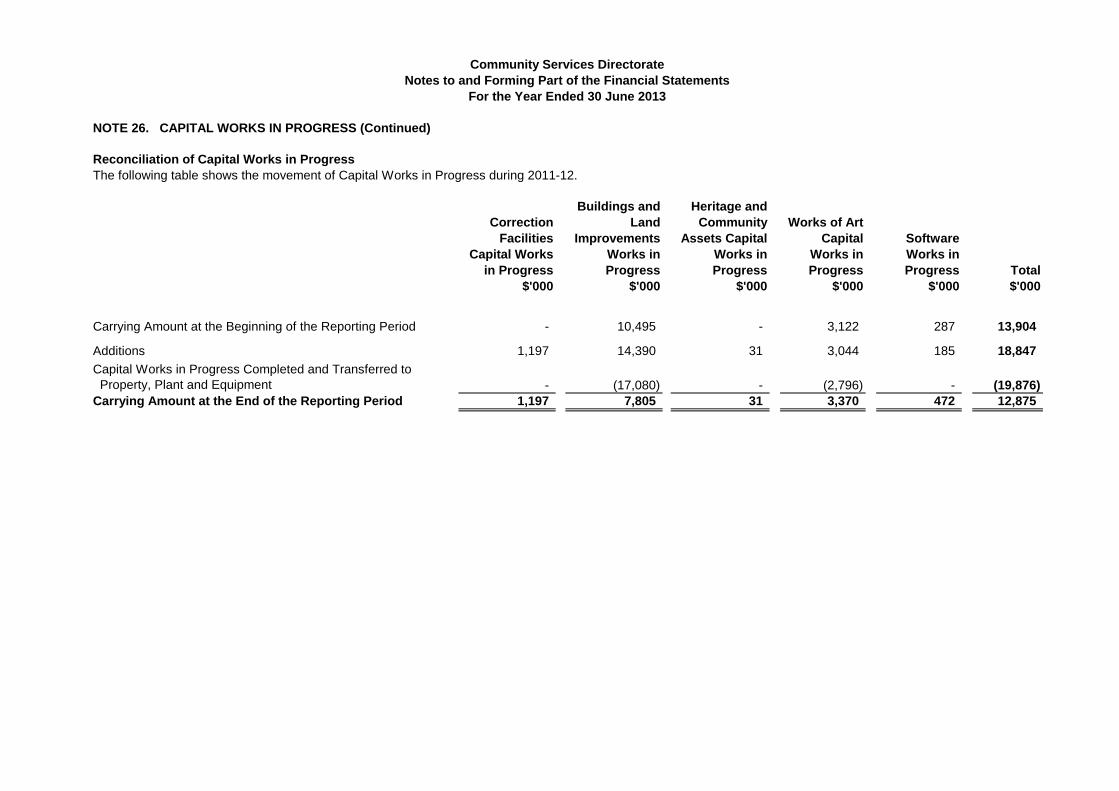
Community Services Directorate Notes to and Forming Part of the Financial Statements
For the Year Ended 30 June 2013
NOTE 26. CAPITAL WORKS IN PROGRESS (Continued)
Reconciliation of Capital Works in Progress
The following table shows the movement of Capital Works in Progress during 2011-12.
Correction
Facilities
Capital Works
in Progress
$'000
Buildings and
Land
Improvements
Works in
Progress
$'000
Heritage and
Community
Assets Capital
Works in
Progress
$'000
Works of Art
Capital
Works in
Progress
$'000
Software
Works in
Progress
$'000
Total
$'000
Carrying Amount at the Beginning of the Reporting Period - 10,495 - 3,122 287 13,904
Additions
Capital Works in Progress Completed and Transferred to
Property, Plant and Equipment
Carrying Amount at the End of the Reporting Period
1,197
-
1,197
14,390
(17,080)
7,805
31
-
31
3,044
(2,796)
3,370
185
-
472
18,847
(19,876)
12,875
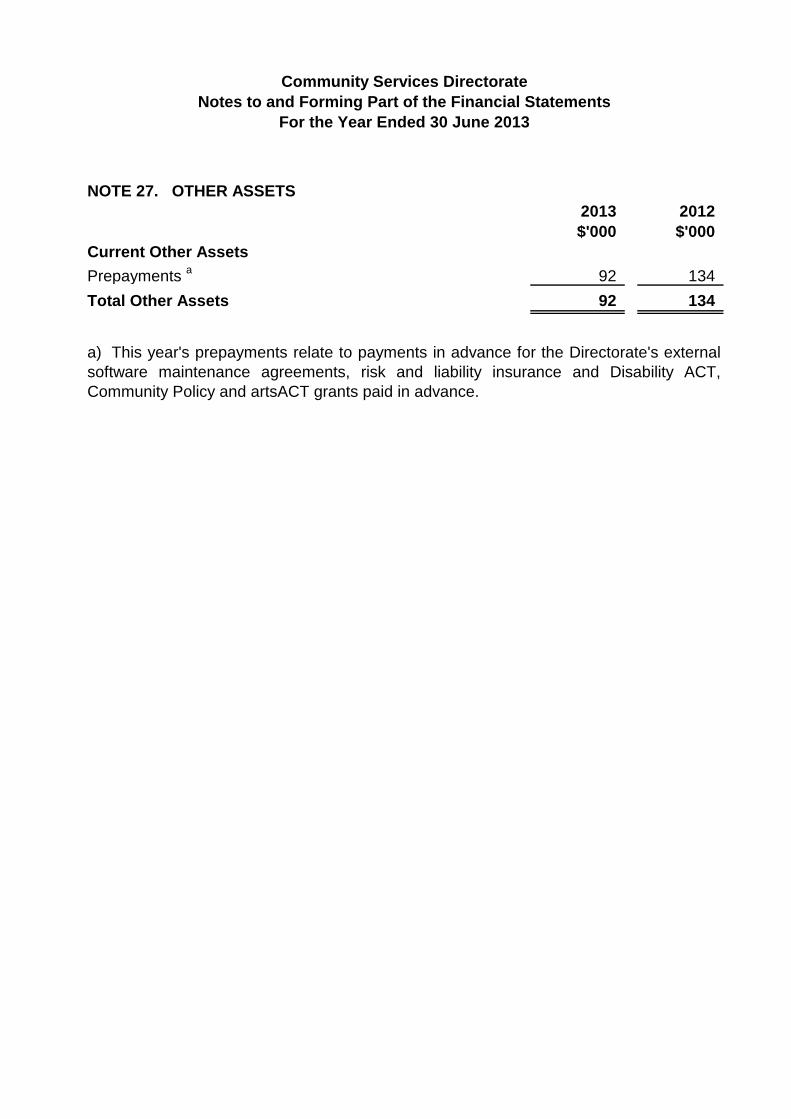
Community Services Directorate Notes to and Forming Part of the Financial Statements
For the Year Ended 30 June 2013
NOTE 27. OTHER ASSETS
2013 2012
$'000 $'000
Current Other Assets
Prepayments a
92 134
Total Other Assets 92 134
a) This year's prepayments relate to payments in advance for the Directorate's external
software maintenance agreements, risk and liability insurance and Disability ACT,
Community Policy and artsACT grants paid in advance.
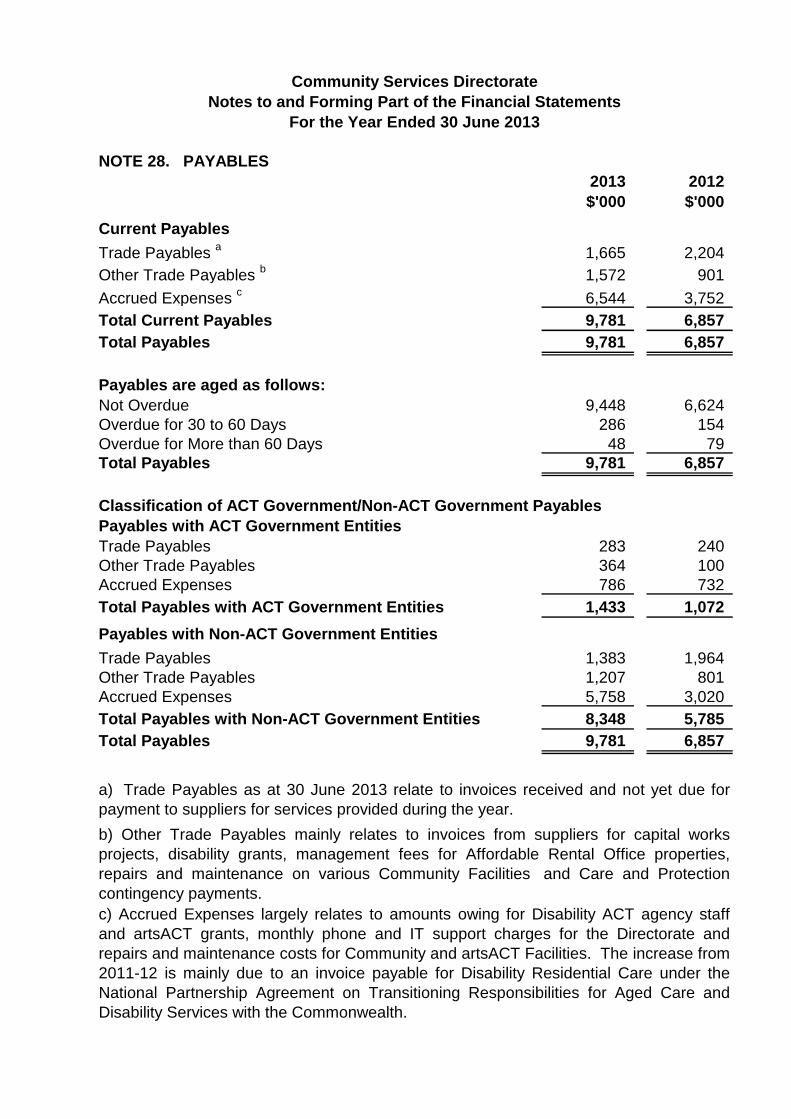
Community Services Directorate Notes to and Forming Part of the Financial Statements
For the Year Ended 30 June 2013
NOTE 28. PAYABLES 2013 2012
$'000 $'000
Current Payables
Trade Payables a
1,665 2,204
Other Trade Payables b
1,572 901
Accrued Expenses c
6,544 3,752
Total Current Payables 9,781 6,857
Total Payables 9,781 6,857
Payables are aged as follows:
Not Overdue 9,448 6,624
Overdue for 30 to 60 Days 286 154
Overdue for More than 60 Days 48 79
Total Payables 9,781 6,857
Classification of ACT Government/Non-ACT Government Payables
Payables with ACT Government Entities
Trade Payables 283 240
Other Trade Payables 364 100
Accrued Expenses 786 732
Total Payables with ACT Government Entities 1,433 1,072
Payables with Non-ACT Government Entities
Trade Payables 1,383 1,964
Other Trade Payables 1,207 801
Accrued Expenses 5,758 3,020
Total Payables with Non-ACT Government Entities 8,348 5,785
Total Payables 9,781 6,857
a) Trade Payables as at 30 June 2013 relate to invoices received and not yet due for
payment to suppliers for services provided during the year.
b) Other Trade Payables mainly relates to invoices from suppliers for capital works
projects, disability grants, management fees for Affordable Rental Office properties,
repairs and maintenance on various Community Facilities and Care and Protection
contingency payments.
c) Accrued Expenses largely relates to amounts owing for Disability ACT agency staff
and artsACT grants, monthly phone and IT support charges for the Directorate and
repairs and maintenance costs for Community and artsACT Facilities. The increase from
2011-12 is mainly due to an invoice payable for Disability Residential Care under the
National Partnership Agreement on Transitioning Responsibilities for Aged Care and
Disability Services with the Commonwealth.

Community Services Directorate Notes to and Forming Part of the Financial Statements
For the Year Ended 30 June 2013
NOTE 29. FINANCE LEASES
The Directorate currently holds 149 motor vehicle finance leases, all of which have been taken
up as a finance lease liability and an asset under a finance lease. The interest rates implicit in
these leases vary from 3.13% to 8.86% and the terms vary from 2 to 5 years. These leases
allow for extensions, but have no terms of renewal or purchase options, nor escalation
clauses.
2013 2012
$'000 $'000
Current Finance Lease Liabilities Secured
Finance Leases a
1,225 1,060
Total Current Secured Finance Lease Liabilities 1,225 1,060
Non-Current Finance Lease Liabilities Secured
Finance Leases a
1,557 1,395
Total Non-Current Secured Finance Lease Liabilities 1,557 1,395
Total Finance Lease Liabilities 2,782 2,455
a) The increase in Finance Leases can be attributed to a higher number of motor vehicle
finance leases renewed during the 2013 financial year. The Directorate held 149 vehicles as
at 30 June 2013 compared to 138 as at 30 June 2012.
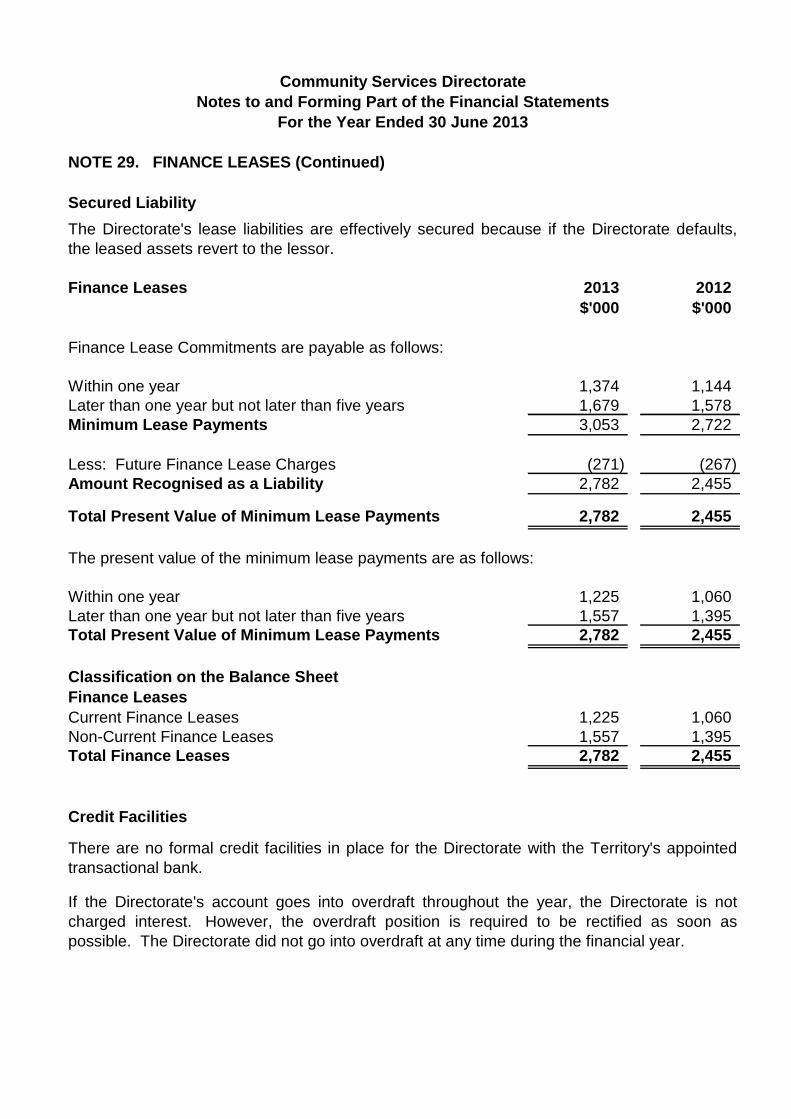
Community Services Directorate Notes to and Forming Part of the Financial Statements
For the Year Ended 30 June 2013
NOTE 29. FINANCE LEASES (Continued)
Secured Liability
The Directorate's lease liabilities are effectively secured because if the Directorate defaults,
the leased assets revert to the lessor.
Finance Leases
Finance Lease Commitments are payable as follows:
Within one year
Later than one year but not later than five years
2013 2012
$'000 $'000
1,374 1,144
1,679 1,578
Minimum Lease Payments 3,053 2,722
Less: Future Finance Lease Charges (271) (267)
Amount Recognised as a Liability 2,782 2,455
Total Present Value of Minimum Lease Payments 2,782 2,455
The present value of the minimum lease payments are as follows:
Within one year 1,225 1,060
Later than one year but not later than five years 1,557 1,395
Total Present Value of Minimum Lease Payments 2,782 2,455
Classification on the Balance Sheet
Finance Leases
Current Finance Leases 1,225 1,060
Non-Current Finance Leases 1,557 1,395
Total Finance Leases 2,782 2,455
Credit Facilities
There are no formal credit facilities in place for the Directorate with the Territory's appointed
transactional bank.
If the Directorate's account goes into overdraft throughout the year, the Directorate is not
charged interest. However, the overdraft position is required to be rectified as soon as
possible. The Directorate did not go into overdraft at any time during the financial year.

Community Services Directorate Notes to and Forming Part of the Financial Statements
For the Year Ended 30 June 2013
NOTE 30. EMPLOYEE BENEFITS 2013 2012
$'000 $'000
Current
Annual Leave a
8,292 8,650
Long Service Leave b
11,282 10,614
Accrued Salaries c
2,449 2,114
Other Benefits c
378 310
Total Current Employee Benefits 22,401 21,688
Non-Current
Long Service Leave b
1,997 1,956
Total Non-Current Employee Benefits 1,997 1,956
Total Employee Benefits 24,398 23,644
During the 2013 reporting period, the Directorate employed an average of 978 full-time
equivalent (FTE) staff (957 FTEs in 2012).
For Disclosure Purposes Only
Estimate of when Leave is Payable
Estimated Amount Payable within 12 months
Annual Leave
Long Service Leave
Accrued Salaries
Other Benefits
2013 2012
$'000 $'000
8,292 8,650
1,018 1,081
2,449 2,114
378 310
Total Employee Benefits Payable within 12 Months 12,137 12,155
Estimated Amount Payable after 12 Months
Long Service Leave 12,261 11,489
Total Employee Benefits Payable after 12 Months 12,261 11,489
Total Employee Benefits 24,398 23,644
a) The decrease in Annual Leave liability is due to fewer entitlement hours, a lower
Enterprise Bargaining Agreement (EBA) rate used to estimate future salary increases and
fewer number of employees with annual leave entitlements compared to 2011-12, largely
due to the transfer of 17 full time equivalent (FTE) staff to the Education and Training
Directorate (ETD) as part of the Administrative Arrangements (AAs).

Community Services Directorate
Notes to and Forming Part of the Financial Statements
For the Year Ended 30 June 2013
NOTE 30. EMPLOYEE BENEFITS (continued)
b) The increase in Long Service Leave liability is mainly due to higher average salary and
years of service and a higher average on-cost rate. The increase was partially offset by
the impact of a lower government bond rate used to estimate the present value of long
service leave entitlements (101.3% compared to 106.6% in 2011-12), lower anticipated
EBA rate used to estimate future salary increases (2.0% in 2012-13 compared to 3.5% in
2011-12) and the transfer of 17 full time equivalent (FTE) staff to the Education and
Training Directorate (ETD) as part of the Administrative Arrangements (AAs).
c) The increase in Accrued Salaries and Other Benefits largely relates to an increase in
the number of FTE staff and an increase in base salaries compared to 2011-12.

Community Services Directorate Notes to and Forming Part of the Financial Statements
For the Year Ended 30 June 2013
NOTE 31. OTHER PROVISIONS
Current Other Provisions
Provision for Make Good
Total Current Other Provisions
Non-Current Other Provisions
Provision for Make Good
Total Non-Current Other Provisions
Total Other Provisions
2013
$'000
36
36
1,403
1,403
1,439
2012
$'000
308
308
1,082
1,082
1,390
Provision for Make Good
The Directorate currently has 4 property leases for 11 Moore St and 13 London Circuit,
Canberra City, Swanson Plaza and Nature Conservation House, Belconnen. There are clauses
within the lease agreements which require the Directorate, upon cessation of the tenancy, to
return the office space to the condition it was in before it was leased (this is referred to as 'make
good'). The current tenancy agreement for 11 Moore St was signed in 2010 and runs for 5
years. The current London Circuit agreement was for 3 years and expires in 2014.
The current lease agreement for Swanson Plaza, Belconnen was for 10 years, but was
renegotiated in 2012-13 and now expires in 2015. The current tenancy agreement for Nature
Conservation House, Belconnen, is for a 5 year period and expires in 2015. The Directorate
currently occupies 20% of this property.
The make good provision is based on an agreed rate per square metre of occupancy, being
$180 per sqm for Swanson Plaza and 13 London Circuit, $170 per sqm for 11 Moore St and $40
per sqm for Nature Conservation House.
As at 31 October 2015, the approximate cost for 11 Moore St would be $1,035,416 to meet the
make good obligation. The present value of $1,035,416, using the 2 year Government bond
rate as at 30 June 2013 (2.58%), is approximately $984,035.
2013 2012
$'000 $'000
Reconciliation of the Provision for Make Good
Provision for Make Good at the Beginning of the
Reporting Period 1,390 1,205
Increase in Provision due to initial recognition of liability - 127
Increase in Provision due to unwinding of discount 49 58
Provision for Make Good at the End of the Reporting Period 1,439 1,390
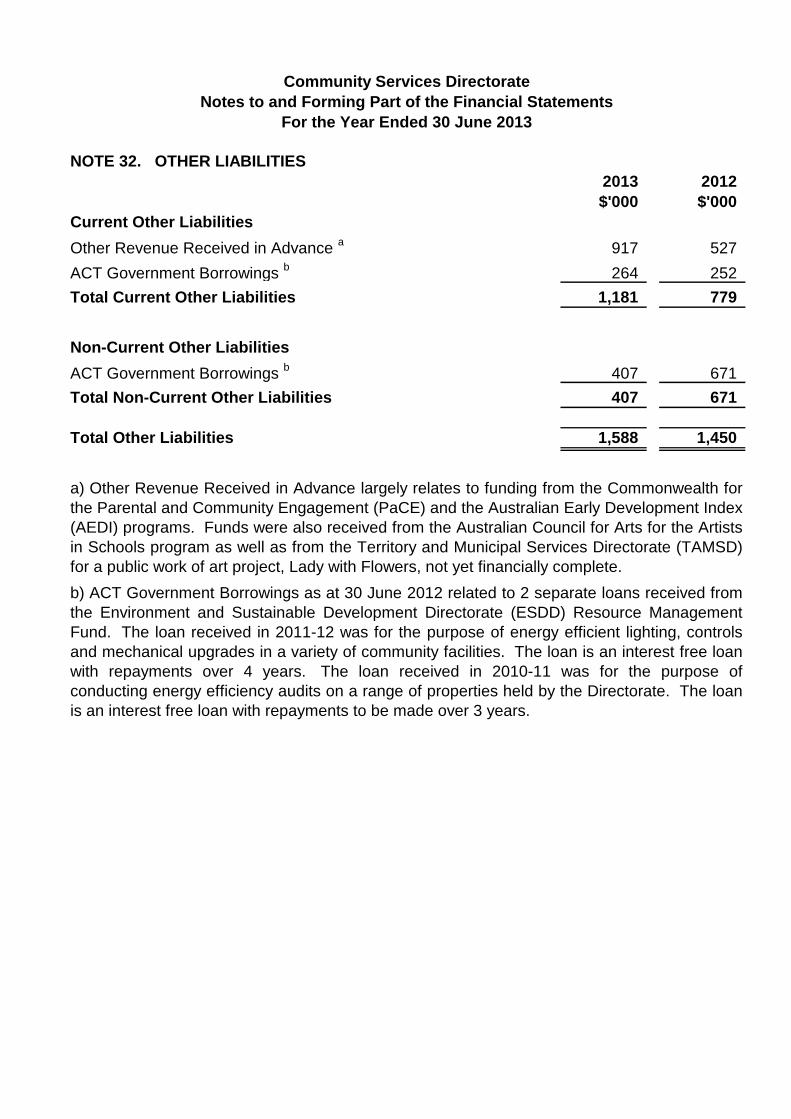
Community Services Directorate Notes to and Forming Part of the Financial Statements
For the Year Ended 30 June 2013
NOTE 32. OTHER LIABILITIES 2013 2012
$'000 $'000
Current Other Liabilities
Other Revenue Received in Advance a
917 527
ACT Government Borrowings b
264 252
Total Current Other Liabilities 1,181 779
Non-Current Other Liabilities
ACT Government Borrowings b
407 671
Total Non-Current Other Liabilities 407
Total Other Liabilities 1,588 1,450
a) Other Revenue Received in Advance largely relates to funding from the Commonwealth for
the Parental and Community Engagement (PaCE) and the Australian Early Development Index
(AEDI) programs. Funds were also received from the Australian Council for Arts for the Artists
in Schools program as well as from the Territory and Municipal Services Directorate (TAMSD)
for a public work of art project, Lady with Flowers, not yet financially complete.
b) ACT Government Borrowings as at 30 June 2012 related to 2 separate loans received from
the Environment and Sustainable Development Directorate (ESDD) Resource Management
Fund. The loan received in 2011-12 was for the purpose of energy efficient lighting, controls
and mechanical upgrades in a variety of community facilities. The loan is an interest free loan
with repayments over 4 years. The loan received in 2010-11 was for the purpose of
conducting energy efficiency audits on a range of properties held by the Directorate. The loan
is an interest free loan with repayments to be made over 3 years.
671

Community Services Directorate Notes to and Forming Part of the Financial Statements
For the Year Ended 30 June 2013
NOTE 33. EQUITY
Asset Revaluation Surplus
The Asset Revaluation Surplus is used to record the increments and decrements in the value
of each class of property, plant and equipment.
2013 2012
$'000 $'000
Balance at the Beginning of the Reporting Period 63,156 47,837
Increment in Land due to Revaluation a
8,606 6,095
(Decrement)/Increment in Buildings and Land Improvements
due to Revaluation b
(2,972) 2,996
(Decrement)/Increment in Community and Heritage Assets
due to Revaluation c
(1,438) 5,645
(Decrement)/Increment in Works of Art Assets due to
Revaluation d
(12) 583
Total Increase in the Asset Revaluation Surplus 4,184 15,319
Transfer (from) Asset Revaluation Surplus e
(10,502) -
Balance at the End of the Reporting Period 56,838 63,156
a) The increment in Land due to Revaluation relates to the valuation of the Directorate's
assets by an independent valuer during the year. The effect of the valuations was to increase
Land assets by $8.606m.
b) The decrement in Buildings and Land Improvements due to Revaluation relates to the
valuation of the Directorate's assets by an independent valuer during the year. Community
and artsACT facilities were valued at $2.972m less than their previous fair value amounts.
c) The decrement in Community and Heritage Assets due to Revaluation relates to the
valuation of the Directorate's assets by an independent valuer during the year. The artsACT
Heritage listed facilities were valued at $1.438m less than their previous fair value amounts.
d) The decrement in Works of Art due to Revaluation relates to the decommissioning of one
public art work during the year.
e) The Transfer of Reserves largely relates to 28 childcare facilities transferred to the
Education and Training Directorate (ETD) as part of the Administrative Arrangements (AAs)
effective from 10 November 2012.
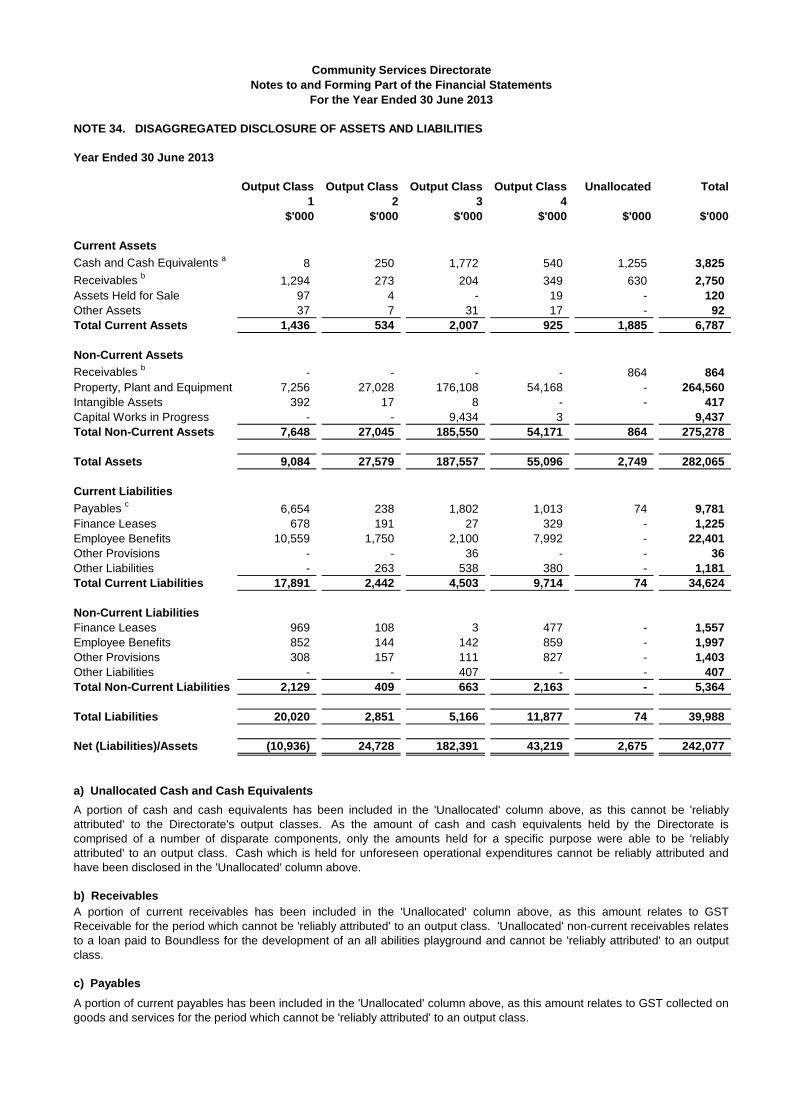
Community Services Directorate Notes to and Forming Part of the Financial Statements
For the Year Ended 30 June 2013
NOTE 34. DISAGGREGATED DISCLOSURE OF ASSETS AND LIABILITIES
Year Ended 30 June 2013
Output Class Output Class Output Class Output Class Unallocated Total
1 2 3 4
$'000 $'000 $'000 $'000 $'000 $'000
Current Assets
Cash and Cash Equivalents a
8 250 1,772 540 1,255 3,825
Receivables b
1,294 273 204 349 630 2,750
Assets Held for Sale 97 4 - 19 - 120
Other Assets 37 7 31 17 - 92
Total Current Assets 1,436 534 2,007 925 1,885 6,787
Non-Current Assets
Receivables b
- - - - 864 864
Property, Plant and Equipment 7,256 27,028 176,108 54,168 - 264,560
Intangible Assets 392 17 8 - - 417
Capital Works in Progress - - 9,434 3 9,437
Total Non-Current Assets 7,648 27,045 185,550 54,171 864 275,278
Total Assets 9,084 27,579 187,557 55,096 2,749 282,065
Current Liabilities
Payables c
6,654 238 1,802 1,013 74 9,781
Finance Leases 678 191 27 329 - 1,225
Employee Benefits 10,559 1,750 2,100 7,992 - 22,401
Other Provisions - - 36 - - 36
Other Liabilities - 263 538 380 - 1,181
Total Current Liabilities 17,891 2,442 4,503 9,714 74 34,624
Non-Current Liabilities
Finance Leases 969 108 3 477 - 1,557
Employee Benefits 852 144 142 859 - 1,997
Other Provisions 308 157 111 827 - 1,403
Other Liabilities - - 407 - - 407
Total Non-Current Liabilities 2,129 409 663 2,163 - 5,364
Total Liabilities 20,020 2,851 5,166 11,877 74 39,988
Net (Liabilities)/Assets (10,936) 24,728 182,391 43,219 2,675 242,077
a) Unallocated Cash and Cash Equivalents
A portion of cash and cash equivalents has been included in the 'Unallocated' column above, as this cannot be 'reliably
attributed' to the Directorate's output classes. As the amount of cash and cash equivalents held by the Directorate is
comprised of a number of disparate components, only the amounts held for a specific purpose were able to be 'reliably
attributed' to an output class. Cash which is held for unforeseen operational expenditures cannot be reliably attributed and
have been disclosed in the 'Unallocated' column above.
b) Receivables
A portion of current receivables has been included in the 'Unallocated' column above, as this amount relates to GST
Receivable for the period which cannot be 'reliably attributed' to an output class. 'Unallocated' non-current receivables relates
to a loan paid to Boundless for the development of an all abilities playground and cannot be 'reliably attributed' to an output
class.
c) Payables
A portion of current payables has been included in the 'Unallocated' column above, as this amount relates to GST collected on
goods and services for the period which cannot be 'reliably attributed' to an output class.

Community Services Directorate Notes to and Forming Part of the Financial Statements
For the Year Ended 30 June 2013
NOTE 34. DISAGGREGATED DISCLOSURE OF ASSETS AND LIABILITIES (Continued)
Year Ended 30 June 2012
Output Class Output Class Output Class Output Class Unallocated Total
1 2 3 4
$'000 $'000 $'000 $'000 $'000 $'000
Current Assets a
Cash and Cash Equivalents 15 395 997 29 1,199 2,635 b
Receivables 227 134 507 86 1,197 2,151
Assets Held for Sale 148 21 - 30 - 199
Other Assets 67 9 36 22 - 134
Total Current Assets 457 559 1,540 167 2,396 5,119
Non-Current Assets
Property, Plant and Equipment 6,021 56,692 181,194 44,747 - 288,654
Intangible Assets 55 34 17 - - 106
Capital Works in Progress 24 145 11,873 833 - 12,875
Total Non-Current Assets 6,100 56,871 193,084 45,580 - 301,635
Total Assets 6,557 57,430 194,624 45,747 2,396 306,754
Current Liabilities c
Payables 4,560 142 1,158 939 58 6,857
Finance Leases 520 434 13 93 - 1,060
Employee Benefits 10,121 2,356 1,832 7,379 - 21,688
Other Provisions 308 - - - - 308
Other Liabilities - 398 324 57 - 779
Total Current Liabilities 15,509 3,330 3,327 8,468 58 30,692
Non-Current Liabilities
Finance Leases 631 688 25 51 - 1,395
Employee Benefits 883 226 160 687 - 1,956
Other Provisions - 140 136 806 - 1,082
Other Liabilities - 10 604 57 - 671
Total Non-Current Liabilities 1,514 1,064 925 1,601 - 5,104
Total Liabilities 17,023 4,394 4,252 10,069 58 35,796
Net (Liabilities)/Assets (10,466) 53,036 190,372 35,678 2,338 270,958
a) Unallocated Cash and Cash Equivalents A portion of cash and cash equivalents has been included in the 'Unallocated' column above, as this cannot be 'reliably
attributed' to the Directorate's output classes. As the amount of cash and cash equivalents held by the Directorate is
comprised of a number of disparate components, only the amounts held for a specific purpose were able to be 'reliably
attributed' to an output class. Cash which is held for unforeseen operational expenditures cannot be reliably attributed and
have been disclosed in the 'Unallocated' column above.
b) Receivables
A portion of current receivables has been included in the 'Unallocated' column above, as this amount relates to GST
Receivable for the period which cannot be 'reliably attributed' to an output class.
c) Payables
A portion of current payables has been included in the 'Unallocated' column above, as this amount relates to GST collected on
goods and services for the period which cannot be 'reliably attributed' to an output class.
Community Services Directorate Notes to and Forming Part of the Financial Statements
For the Year Ended 30 June 2013
NOTE 35. RESTRUCTURE OF ADMINISTRATIVE ARRANGEMENTS
Restructures of Administrative Arrangements 2012-13
On 10 November 2012, a restructuring of administrative arrangements occurred involving the
transfer of Childcare Services and Regulation from the Directorate to the Education and Training
Directorate (ETD). The Childcare Services and Regulation function is responsible for
administering ACT Government legislation in relation to the licensing of children's services in the
ACT including centre based children's services, school age care, family day care, independent
preschools and playschools, and managing government owned childcare centres. The transfer of
this function involved the transfer of 17 full time equivalent (FTE) staff from the Directorate.
The land and buildings for 28 Childcare facilities were also transferred to the ETD.
Restructures of Administrative Arrangements 2011-12
The Directorate did not have any restructuring requirements under the Administrative
Arrangements Order (AAO) during the 2011-12 financial year.
Amendment to Administrative Arrangements 2010-11
A maintenance fund was established in the Chief Minister and Treasury Directorate (CMTD) to
provide ongoing maintenance of art works created under the Government’s Percent-for-Art
Scheme. The fund was not transferred at the time artsACT was transferred to CSD under the
Administrative Arrangements of 17 May 2011, pending a reconciliation by CMTD. A reconciliation
of the fund was undertaken and the balance of the fund ($364,070) was transferred from CMTD
during 2012-13.
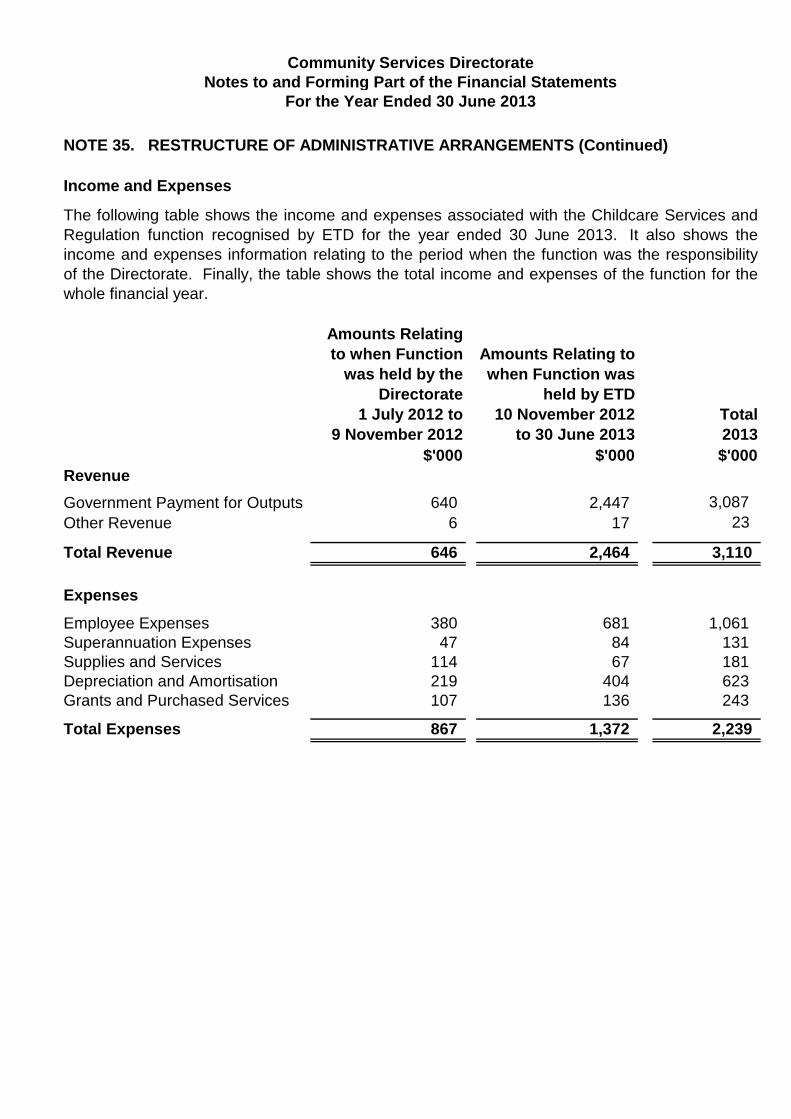
Community Services Directorate Notes to and Forming Part of the Financial Statements
For the Year Ended 30 June 2013
NOTE 35. RESTRUCTURE OF ADMINISTRATIVE ARRANGEMENTS (Continued)
Income and Expenses
The following table shows the income and expenses associated with the Childcare Services and
Regulation function recognised by ETD for the year ended 30 June 2013. It also shows the
income and expenses information relating to the period when the function was the responsibility
of the Directorate. Finally, the table shows the total income and expenses of the function for the
whole financial year.
Revenue
Government Payment for Outputs
Other Revenue
Total Revenue
Expenses
Employee Expenses
Superannuation Expenses
Supplies and Services
Depreciation and Amortisation
Grants and Purchased Services
Total Expenses
Amounts Relating
to when Function
was held by the
Directorate
1 July 2012 to
9 November 2012
$'000
640
6
646
380
47
114
219
107
867
Amounts Relating to
when Function was
held by ETD
10 November 2012
to 30 June 2013
$'000
Total
2013
$'000
2,447
17
3,087
23
2,464 3,110
681
84
67
404
136
1,061
131
181
623
243
1,372 2,239
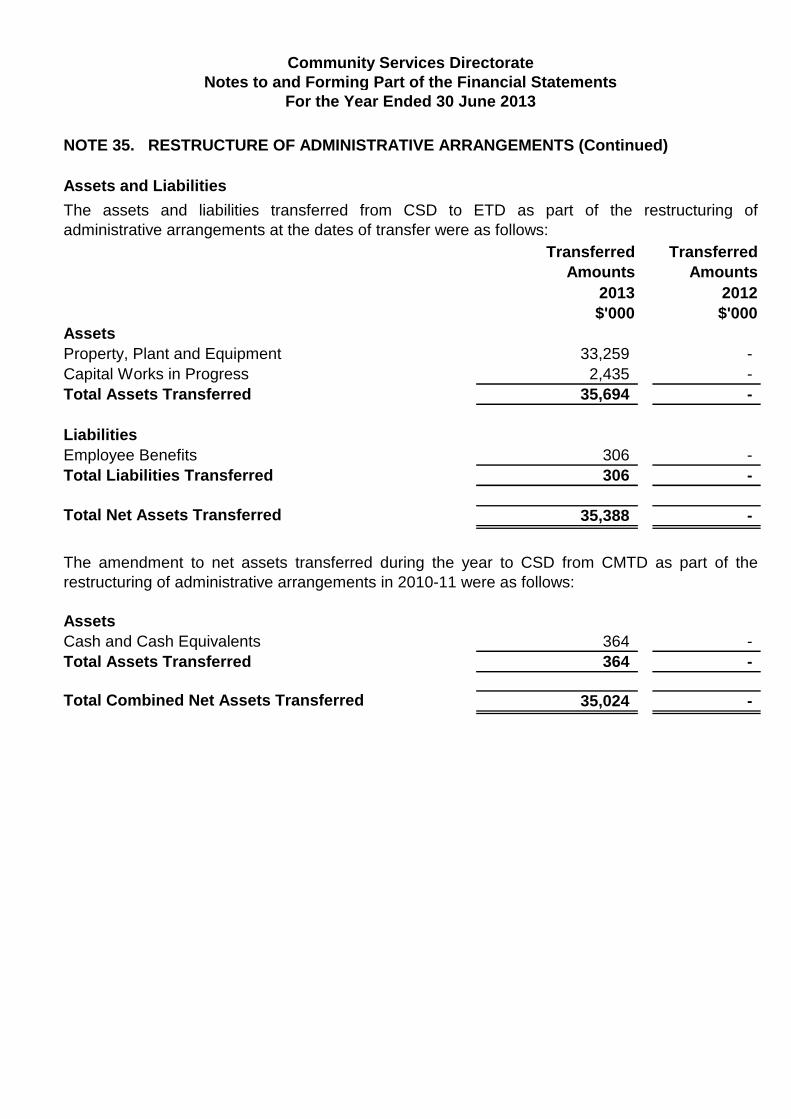
Community Services Directorate Notes to and Forming Part of the Financial Statements
For the Year Ended 30 June 2013
NOTE 35. RESTRUCTURE OF ADMINISTRATIVE ARRANGEMENTS (Continued)
Assets and Liabilities
The assets and liabilities transferred from CSD to ETD as part of the restructuring of
administrative arrangements at the dates of transfer were as follows:
Transferred Transferred
Amounts Amounts
2013 2012
$'000 $'000
Assets
Property, Plant and Equipment 33,259 -
Capital Works in Progress 2,435 -
Total Assets Transferred 35,694 -
Liabilities
Employee Benefits 306 -
Total Liabilities Transferred 306 -
Total Net Assets Transferred 35,388 -
The amendment to net assets transferred during the year to CSD from CMTD as part of the
restructuring of administrative arrangements in 2010-11 were as follows:
Assets
Cash and Cash Equivalents 364 -
Total Assets Transferred 364 -
Total Combined Net Assets Transferred 35,024 -
Community Services Directorate Notes to and Forming Part of the Financial Statements
For the Year Ended 30 June 2013
NOTE 36. FINANCIAL INSTRUMENTS
Details of the significant policies and methods adopted, including the criteria for recognition, the
basis of measurement, and the basis on which income and expenses are recognised, with
respect to each class of financial asset and financial liability are disclosed in Note 2 Summary of
Significant Accounting Policies, to the financial statements.
Interest Rate Risk
Interest rate risk is the risk that the fair value or future cash flows of a financial instrument will
fluctuate because of changes in market interest rates.
The Directorate is considered to have insignificant exposure to interest rate risk, as it holds only
cash and cash equivalents with the Commonwealth Bank that generates minimal interest, and
receivables are non-interest bearing. Interest on liabilities in relation to finance lease
commitments for motor vehicles are at fixed interest rates. All ACT Government borrowings
held by the Directorate are interest free loans.
There have been no changes in risk exposure or processes for managing risk since the last
financial reporting period.
Sensitivity Analysis
A sensitivity analysis has not been undertaken as the Directorate has insignificant exposure to
interest rate risk.
Credit Risk
Credit risk is the risk that one party to a financial instrument will fail to discharge an obligation
and cause the other party to incur a financial loss.
Financial assets consist of cash and cash equivalents and receivables. The Directorate's credit
risk is limited to the carrying amount of the financial assets it holds net of any allowance made
for impairment.
Cash and cash equivalents are held with the Commonwealth Bank and Westpace Banking
Corporation, both high credit, quality financial institutions, in accordance with whole of ACT
Government banking arrangements and the Directorate holds no investments.
A significant proportion of the Directorate's receivables are from ACT Government and
Commonwealth Government agencies. The Directorate reviews outstanding debtors on a
monthly basis and those unresolved are referred to the ACT Government Solicitor's Office for
legal action.
Credit risk for the Directorate is therefore considered to be low with no significant concentration
of credit risk.
There have been no changes in credit risk exposure since the last reporting period.

Community Services Directorate Notes to and Forming Part of the Financial Statements
For the Year Ended 30 June 2013
NOTE 36. FINANCIAL INSTRUMENTS (Continued)
Liquidity Risk
Liquidity risk is the risk that the Directorate will be unable to meet its financial obligations
associated with financial liabilities that are settled by delivering cash or another financial asset.
The Directorate's main financial obligations relate to the payment of employee benefits,
payment of grants and the purchase of supplies and services. Grants are mainly paid on a
quarterly basis and purchases of supplies and services are paid within 28 days of receiving the
goods or services.
The main source of cash to pay these obligations is appropriation from Government which is
paid on a fortnightly basis during the year. The Directorate manages its liquidity risk through
forecasting appropriation drawdown requirements to enable payment of anticipated obligations.
The Directorate's exposure to liquidity risk has not changed since the previous reporting period.
Price Risk
Price risk is the risk that the fair value or future cash flows of a financial instrument will fluctuate
because of changes in market prices (other than those arising from interest rate risk or currency
risk), whether these changes are caused by factors specific to the individual financial instrument
or its issuer, or factors affecting all similar financial instruments traded in the market.
The Directorate does not have any financial instruments that are subject to price risk.
Accordingly a sensitivity analysis has not been undertaken.
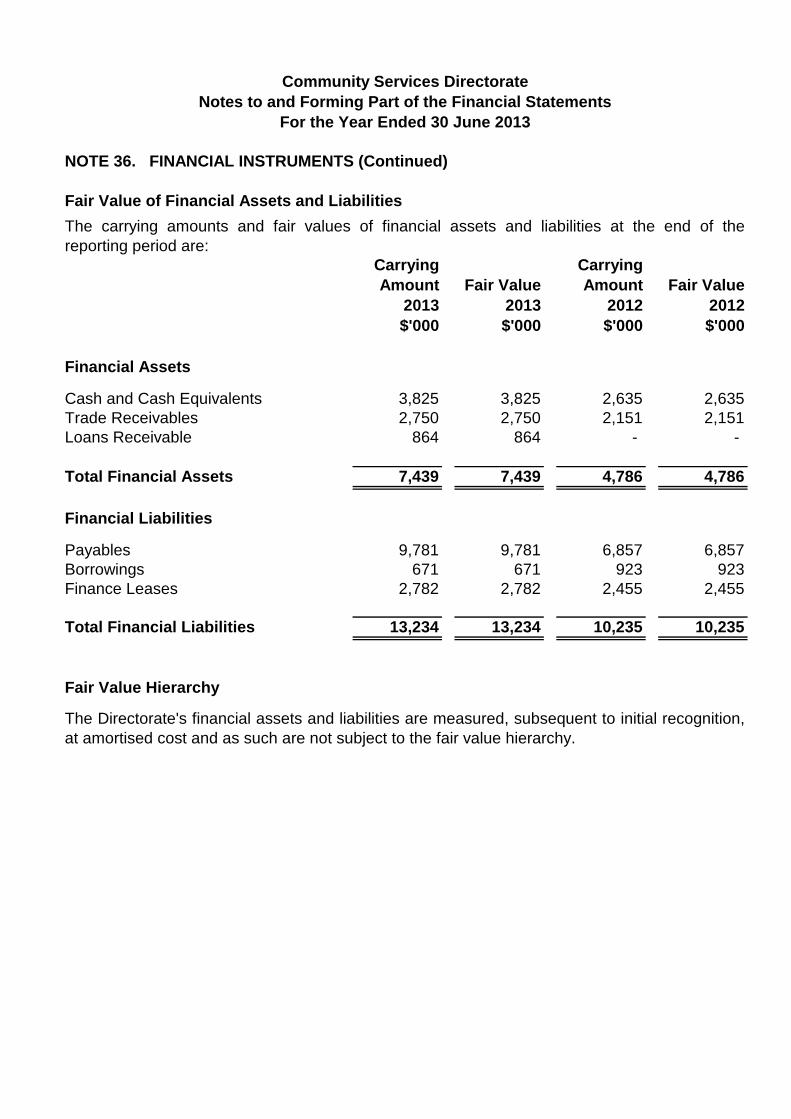
Community Services Directorate Notes to and Forming Part of the Financial Statements
For the Year Ended 30 June 2013
NOTE 36. FINANCIAL INSTRUMENTS (Continued)
Fair Value of Financial Assets and Liabilities
Carrying
Amount
2013
$'000
The carrying amounts and fair values of financial
reporting period are:
Fair Value
2013
$'000
assets and lia
Carrying
Amount
2012
$'000
at the bilities
Fair Value
end
2012
$'000
of the
Financial Assets
Cash and Cash Equivalents
Trade Receivables
Loans Receivable
3,825
2,750
864
3,825
2,750
864
2,635
2,151
-
2,635
2,151
-
Total Financial Assets 7,439 7,439 4,786 4,786
Financial Liabilities
Payables
Borrowings
Finance Leases
9,781
671
2,782
9,781
671
2,782
6,857
923
2,455
6,857
923
2,455
Total Financial Liabilities 13,234 13,234 10,235 10,235
Fair Value Hierarchy
The Directorate's financial assets and liabilities are measured, subsequent to initial recognition,
at amortised cost and as such are not subject to the fair value hierarchy.
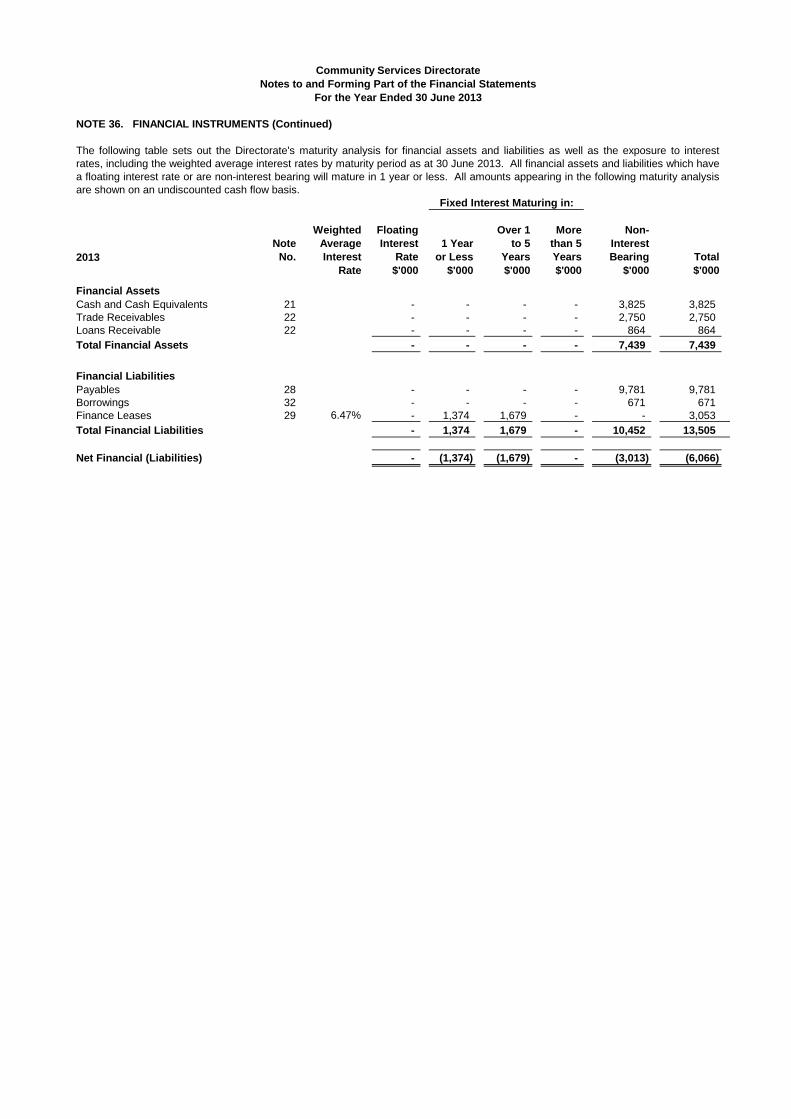
Community Services Directorate Notes to and Forming Part of the Financial Statements
For the Year Ended 30 June 2013
NOTE 36. FINANCIAL INSTRUMENTS (Continued)
The following table sets out the Directorate's maturity analysis for financial assets and liabilities as well as the exposure to interest
rates, including the weighted average interest rates by maturity period as at 30 June 2013. All financial assets and liabilities which have
a floating interest rate or are non-interest bearing will mature in 1 year or less. All amounts appearing in the following maturity analysis
are shown on an undiscounted cash flow basis.
Fixed Interest Maturing in:
2013
Note
No.
Weighted
Average
Interest
Rate
Floating
Interest
Rate
$'000
1 Year
or Less
$'000
Over 1
to 5
Years
$'000
More
than 5
Years
$'000
Non-
Interest
Bearing
$'000
Total
$'000
Financial Assets
Cash and Cash Equivalents
Trade Receivables
Loans Receivable
21
22
22
-
-
-
-
-
-
-
-
-
-
-
-
3,825
2,750
864
3,825
2,750
864
Total Financial Assets - - - - 7,439 7,439
Financial Liabilities
Payables
Borrowings
Finance Leases
Total Financial Liabilities
28
32
29 6.47%
-
-
-
-
-
-
1,374
1,374
-
-
1,679
1,679
-
-
-
-
9,781
671
-
10,452
9,781
671
3,053
13,505
Net Financial (Liabilities) - (1,374) (1,679) - (3,013) (6,066)
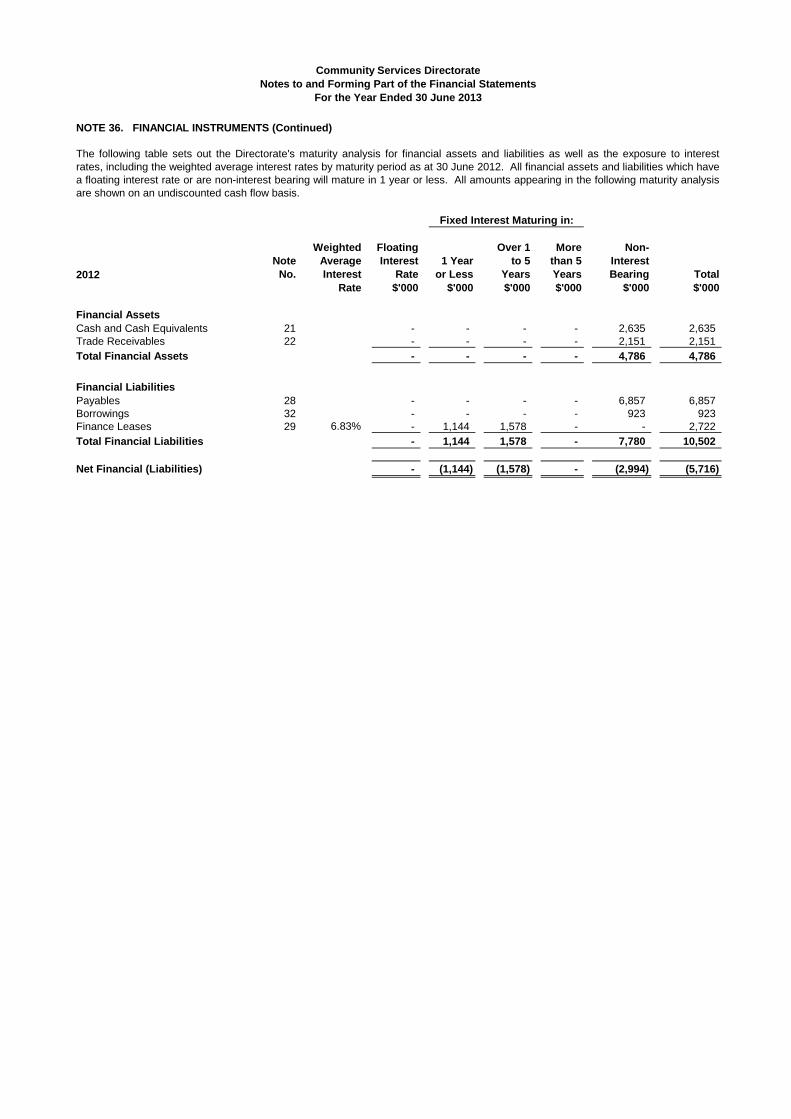
Community Services Directorate Notes to and Forming Part of the Financial Statements
For the Year Ended 30 June 2013
NOTE 36. FINANCIAL INSTRUMENTS (Continued)
The following table sets out the Directorate's maturity analysis for financial assets and liabilities as well as the exposure to interest
rates, including the weighted average interest rates by maturity period as at 30 June 2012. All financial assets and liabilities which have
a floating interest rate or are non-interest bearing will mature in 1 year or less. All amounts appearing in the following maturity analysis
are shown on an undiscounted cash flow basis.
Fixed Interest Maturing in:
2012
Note
No.
Weighted
Average
Interest
Rate
Floating
Interest
Rate
$'000
1 Year
or Less
$'000
Over 1
to 5
Years
$'000
More
than 5
Years
$'000
Non-
Interest
Bearing
$'000
Total
$'000
Financial Assets
Cash and Cash Equivalents
Trade Receivables
Total Financial Assets
21
22
-
-
-
-
-
-
-
-
-
-
-
-
2,635
2,151
4,786
2,635
2,151
4,786
Financial Liabilities
Payables
Borrowings
Finance Leases
Total Financial Liabilities
28
32
29 6.83%
-
-
-
-
-
-
1,144
1,144
-
-
1,578
1,578
-
-
-
-
6,857
923
-
7,780
6,857
923
2,722
10,502
Net Financial (Liabilities) - (1,144) (1,578) - (2,994) (5,716)
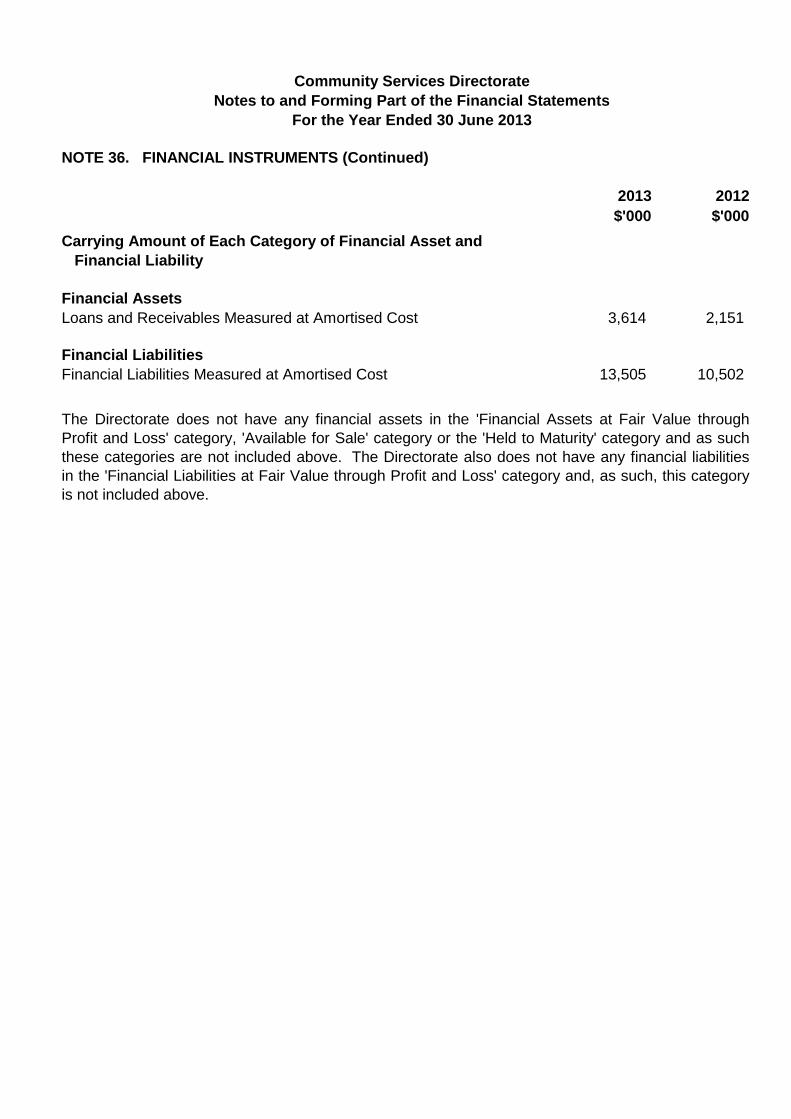
Community Services Directorate Notes to and Forming Part of the Financial Statements
For the Year Ended 30 June 2013
NOTE 36. FINANCIAL INSTRUMENTS (Continued)
2013 2012
$'000 $'000
Carrying Amount of Each Category of Financial Asset and
Financial Liability
Financial Assets
Loans and Receivables Measured at Amortised Cost 3,614 2,151
Financial Liabilities
Financial Liabilities Measured at Amortised Cost 13,505 10,502
The Directorate does not have any financial assets in the 'Financial Assets at Fair Value through
Profit and Loss' category, 'Available for Sale' category or the 'Held to Maturity' category and as such
these categories are not included above. The Directorate also does not have any financial liabilities
in the 'Financial Liabilities at Fair Value through Profit and Loss' category and, as such, this category
is not included above.

Community Services Directorate Notes to and Forming Part of the Financial Statements
For the Year Ended 30 June 2013
NOTE 37. COMMITMENTS 2013 2012
$'000 $'000
Capital Commitments
Capital commitments contracted at reporting date mainly relate to the upgrade of various
community facilities, Holt Preschool refurbishment, Ainslie Music Hub, Tuggeranong Arts
Centre improvements, Street Theatre Extension, Megalo Print Studio, various public
works of art and other minor upgrade projects that have not been recognised as liabilities,
payable:
Within One Year 13,626 33,919
Later than One Year but not later than Five Years 600 3,992
Total Capital Commitments 14,226 37,911
Other Commitments
Other commitments contracted at reporting date that mainly relate to grants to Non-
Government Organisations that have not been recognised as liabilities, payable:
Within One Year 95,253 80,749
Later than One Year but not later than Five Years 150,726 88,270
Total Other Commitments a
245,979 169,019
a) The increase in Other Commitments largely relates to renewal of various contracts for
a further 3 year period, contract price increases and new contracts entered into in
2012-13.
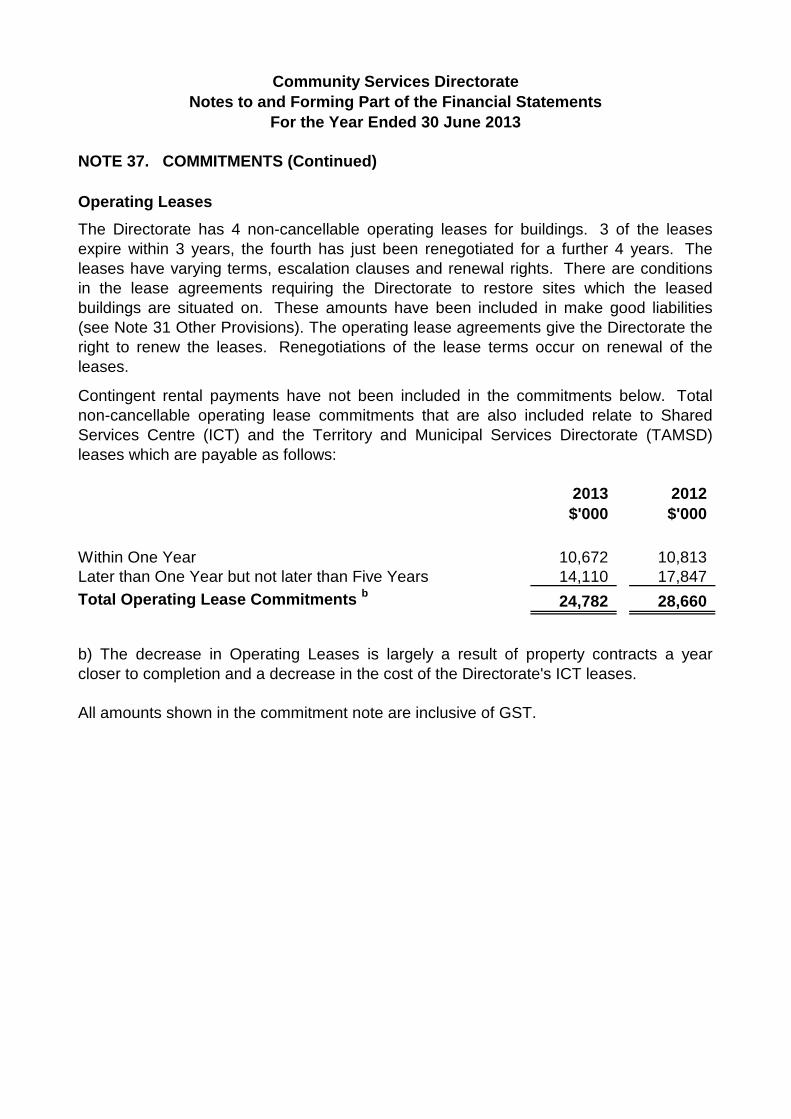
Community Services Directorate Notes to and Forming Part of the Financial Statements
For the Year Ended 30 June 2013
NOTE 37. COMMITMENTS (Continued)
Operating Leases
The Directorate has 4 non-cancellable operating leases for buildings. 3 of the leases
expire within 3 years, the fourth has just been renegotiated for a further 4 years. The
leases have varying terms, escalation clauses and renewal rights. There are conditions
in the lease agreements requiring the Directorate to restore sites which the leased
buildings are situated on. These amounts have been included in make good liabilities
(see Note 31 Other Provisions). The operating lease agreements give the Directorate the
right to renew the leases. Renegotiations of the lease terms occur on renewal of the
leases.
Contingent rental payments have not been included in the commitments below. Total
non-cancellable operating lease commitments that are also included relate to Shared
Services Centre (ICT) and the Territory and Municipal Services Directorate (TAMSD)
leases which are payable as follows:
2013 2012
$'000 $'000
Within One Year 10,672 10,813
Later than One Year but not later than Five Years 14,110 17,847
Total Operating Lease Commitments b
24,782 28,660
b) The decrease in Operating Leases is largely a result of property contracts a year
closer to completion and a decrease in the cost of the Directorate's ICT leases.
All amounts shown in the commitment note are inclusive of GST.

Community Services Directorate
Notes to and Forming Part of the Financial Statements
For the Year Ended 30 June 2013
NOTE 38. CONTINGENT LIABILITIES AND CONTINGENT ASSETS
The contingent liabilities reflect several individual contingent claims against the
Directorate where the final financial ramifications are unclear pending legal settlement.
The ACT Government Solicitor's Office has estimated the 24 contingent claims for 2013
at $952,000 (23 claims in 2012 estimated at $1,015,000).
The Directorate's contingent liabilities largely relate to personal injury claims.
The Directorate had no contingent assets as at 30 June 2013.

Community Services Directorate Notes to and Forming Part of the Financial Statements
For the Year Ended 30 June 2013
NOTE 39. CASH FLOW RECONCILIATION
a) Reconciliation of the Cash and Cash Equivalents at the end of the Reporting
Period in the Cash Flow Statement to the equivalent items in the Balance Sheet.
2013
$'000
2012
$'000
Total Cash and Cash Equivalents Recorded in the Balance
Sheet
Cash and Cash Equivalents at the End of the Reporting
Period as Recorded in the Cash Flow Statement
3,825
3,825
2,635
2,635
b) Reconciliation of Net Cash Inflows from Operating Activities to the
Operating (Deficit)
Operating (Deficit)
Add/(Less) Non-Cash Items
Depreciation and Amortisation
Net Assets Transferred
Forgiveness of Liabilities
Net Increase in Assets due to Administrative Restructure
Nominal Interest on Borrowings
Donated Assets
Add Items Classified as Investing or Financing
Net Loss/(Gain) on Disposal of Non-Current Assets
Unrealised (Gain) on Borrowings
Finance Lease Borrowing Costs
(9,614) (5,834)
7,403 7,604
(956) (7,203)
141 83
306 -
209 66
(26) -
16 (103)
- (47)
213 223
Cash Before Changes in Operating Assets and Liabilities (2,308) (5,211)
Changes in Operating Assets and Liabilities
(Increase)/Decrease in Receivables
Decrease in Other Assets
Increase in Payables
Increase in Employee Benefits
Increase/(Decrease) in Other Liabilities
(740) 429
42 48
2,925 2,551
754 3,594
390 (131)
Net Changes in Operating Assets and Liabilities 3,371 6,491
Net Cash Inflows from Operating Activities 1,063 1,280
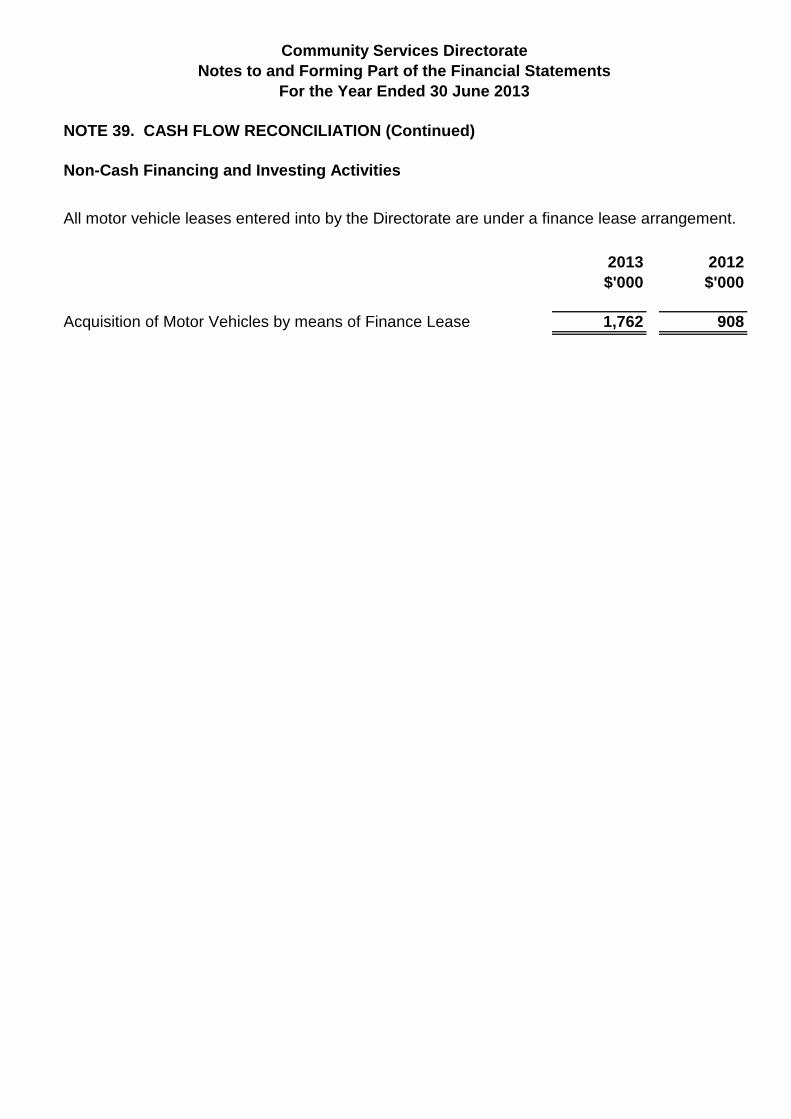
Community Services Directorate Notes to and Forming Part of the Financial Statements
For the Year Ended 30 June 2013
NOTE 39. CASH FLOW RECONCILIATION (Continued)
Non-Cash Financing and Investing Activities
All motor vehicle leases entered into by the Directorate are under a finance lease arrangement.
2013 2012
$'000 $'000
Acquisition of Motor Vehicles by means of Finance Lease 1,762 908

Community Services Directorate
Notes to and Forming Part of the Financial Statements
For the Year Ended 30 June 2013
NOTE 40. EVENTS OCCURRING AFTER BALANCE DATE
a) The responsibility and funding associated with the management of an electronic card
system for the Taxi Subsidy Scheme will be transferred to Territorial appropriations in
2013-14. The budget allocation to be transferred is $214,000.
b) The ACT Government will change its banking arrangements from the
Commonwealth Bank to the Westpac Banking Corporation in accordance with the
Whole of Government Banking Arrangements. All bank accounts and services with
Commonwealth Bank will be closed as at 30 September 2013.
There were no other events that occurred after balance date that would affect the
Financial Statements in the current or future reporting periods.
COMMUNITY SERVICES DIRECTORATE ANNUAL REPORT 2012–13106
A.3 Territorial Financial Statements
Community Services Directorate
TERRITORIAL FINANCIAL STATEMENTS
FOR THE YEAR ENDED 30 JUNE 2013

Community Services Directorate Statement of Income and Expenses on Behalf of the Territory
For the Year Ended 30 June 2013
Note
No.
Actual
2013
$'000
Original
Budget
2013
$'000
Actual
2012
$'000
Income
Payment for Expenses on Behalf of the Territory
Community Service Obligations
42
42
20,670
23,458
19,121
22,537
19,028
20,077
Total Income 44,128 41,658 39,105
Expenses
Grants and Purchased Services
Other Expenses
43
44
23,458
20,670
22,537
19,121
20,077
19,028
Total Expenses 44,128 41,658 39,105
Operating Surplus/(Deficit) - - -
The above Statement of Income and Expenses on Behalf of the Territory should be read in
conjunction with the accompanying notes.
Community Services Directorate has 4 Output Classes in the Controlled Financial Statements,
however the Territorial program is only attributable to Output Class 3 - Community Development
and Policy. Therefore, a separate Disaggregated Income and Expense note has not been
included in these financial statements.
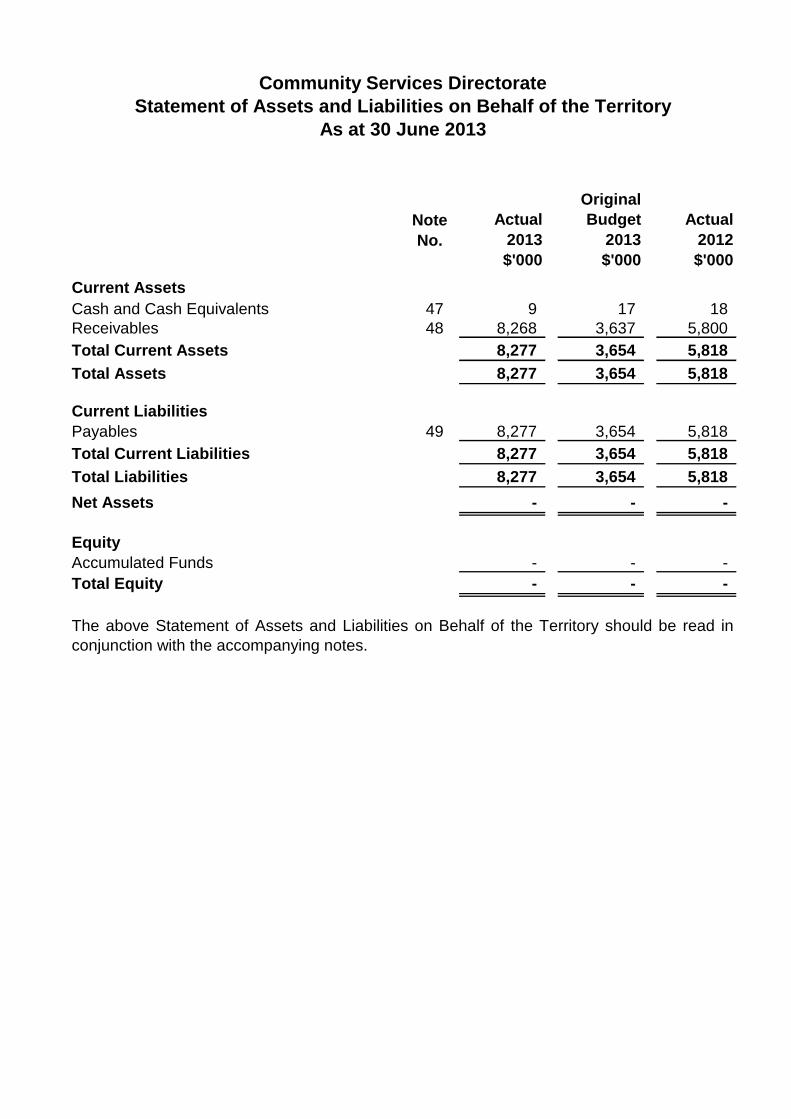
Community Services Directorate Statement of Assets and Liabilities on Behalf of the Territory
As at 30 June 2013
Current Assets
Cash and Cash Equivalents
Receivables
Total Current Assets
Total Assets
Current Liabilities
Payables
Total Current Liabilities
Total Liabilities
Net Assets
Equity
Accumulated Funds
Total Equity
Note
No.
Actual
2013
$'000
Original
Budget
2013
$'000
Actual
2012
$'000
47
48
9
8,268
8,277
8,277
17
3,637
3,654
3,654
18
5,800
5,818
5,818
49 8,277
8,277
8,277
-
3,654
3,654
3,654
-
5,818
5,818
5,818
-
-
-
-
-
-
-
The above Statement of Assets and Liabilities on Behalf of the Territory should be read in
conjunction with the accompanying notes.

Community Services Directorate Statement of Recognised Income and Expenses on Behalf of the Territory
For the Year Ended 30 June 2013
Accumulated Total
Funds Equity Original
Actual Actual Budget
2013 2013 2013
$'000 $'000 $'000
Balance at the Beginning of the Reporting
Period - - -
Comprehensive Income
Operating Surplus/(Deficit) - - -
Total Comprehensive Income - - -
Balance at the End of the Reporting Period - - -
Accumulated Total
Funds Equity Original
Actual Actual Budget
2012 2012 2012
$'000 $'000 $'000
Balance at the Beginning of the Reporting
Period - - -
Comprehensive Income
Operating Surplus/(Deficit) - - -
Total Comprehensive Income - - -
Transactions Involving Owners Affecting
Accumulated Funds
Capital Injections - - 300
Total Transactions Involving Owners Affecting
Accumulated Funds - - 300
Balance at the End of the Reporting Period - - 300
The above Statement of Recognised Income and Expense on Behalf of the Territory should be read in
conjunction with the accompanying notes.
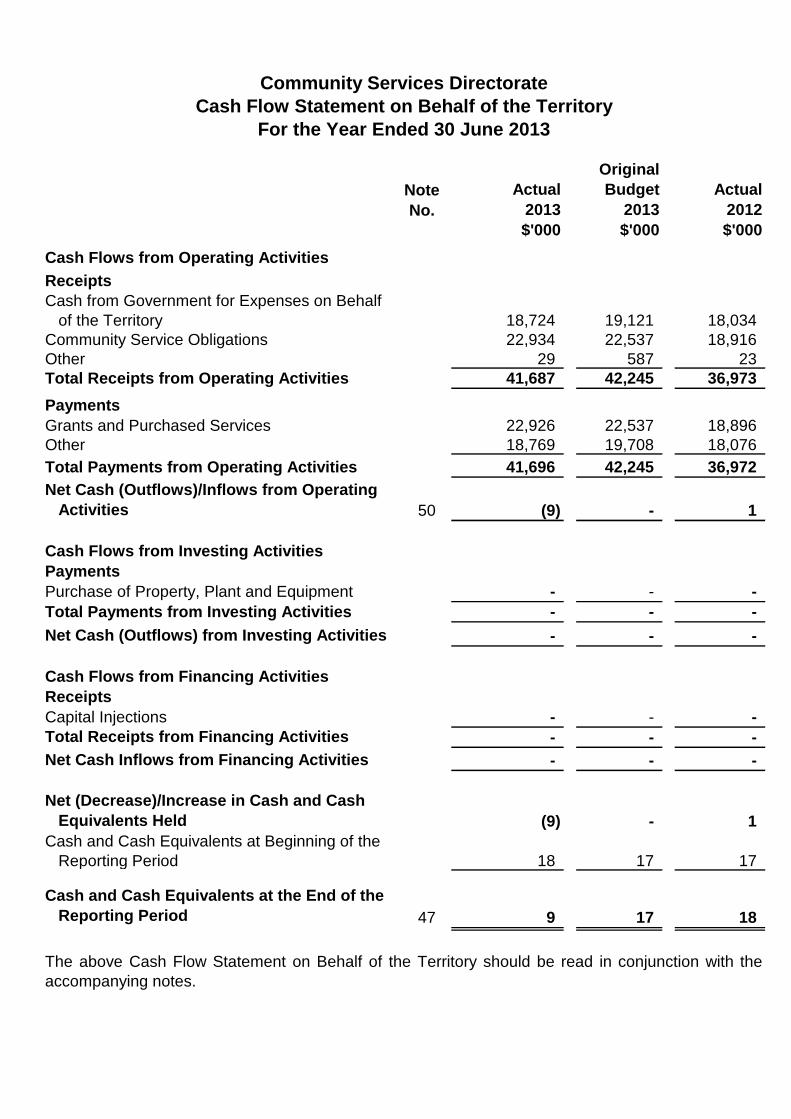
- -
- -
- -
- -
- -
- -
Community Services Directorate Cash Flow Statement on Behalf of the Territory
For the Year Ended 30 June 2013
Note Actual
No. 2013
$'000
Cash Flows from Operating Activities
Receipts
Cash from Government for Expenses on Behalf
of the Territory 18,724
Community Service Obligations 22,934
Other 29
Total Receipts from Operating Activities 41,687
Payments
Grants and Purchased Services 22,926
Other 18,769
Total Payments from Operating Activities 41,696
Net Cash (Outflows)/Inflows from Operating
Activities 50 (9)
Cash Flows from Investing Activities
Payments
Purchase of Property, Plant and Equipment -
Total Payments from Investing Activities -
Net Cash (Outflows) from Investing Activities -
Cash Flows from Financing Activities
Receipts
Capital Injections -
Total Receipts from Financing Activities -
Net Cash Inflows from Financing Activities -
Net (Decrease)/Increase in Cash and Cash
Equivalents Held (9)
Cash and Cash Equivalents at Beginning of the
Reporting Period 18
Cash and Cash Equivalents at the End of the
Reporting Period 47 9
Original
Budget
2013
$'000
Actual
2012
$'000
19,121
22,537
587
42,245
18,034
18,916
23
36,973
22,537
19,708
42,245
18,896
18,076
36,972
- 1
- 1
17 17
17 18
The above Cash Flow Statement on Behalf of the Territory should be read in conjunction with the
accompanying notes.

Community Services Directorate Territorial Statement of Appropriation
For the Year Ended 30 June 2013
Original Total Appropriation Appropriation
Budget Appropriated Drawn Drawn
2013 2013 2013 2012
Territorial $'000 $'000 $'000 $'000
Expenses on behalf of the
Territory/Community Service
Obligations 41,658 42,166 41,658 36,950
Total Territorial Appropriation 41,658 42,166 41,658 36,950
The above Territorial Statement of Appropriation should be read in conjunction with the accompanying
notes.
Column Heading Explanations
The Original Budget column shows the amounts that appear in the Cash Flow Statement on Behalf of the Territory in the Budget Papers. The Total Appropriated column is inclusive of all appropriation variations occurring after the Original Budget. The Appropriation Drawn is the total amount, which was received by the Directorate during the year in Appropriation.
These amounts appear in the Cash Flow Statement on Behalf of the Territory.
For Disclosure Purposes Only Original Total Appropriation Appropriation
Budget Appropriated Drawn Drawn
2013 2013 2013 2012
$'000 $'000 $'000 $'000
Territorial
Expenses on Behalf of the
Territory (i) 19,121 19,629 18,724 18,034
Community Service
Obligations (ii) 22,537 22,537 22,934 18,916
Total Territorial Appropriation 41,658 42,166 41,658 36,950

Community Services Directorate Territorial Statement of Appropriation (Continued)
For the Year Ended 30 June 2013
Variances between 'Original Budget' and 'Total Appropriated'
(i) Expenses on Behalf of the Territory
The variance between Original Budget and Total Appropriated relates to additional funding from the
Commonwealth under the National Partnerships for certain concessions for Pensioner and Senior
Card Holders and National Reciprocal Transport Concessions.
(ii) Community Service Obligations
There is no variance between Original Budget and Total Appropriated for Community Service
Obligations.
Variances between 'Total Appropriated' and 'Appropriation Drawn'
(i) Expenses on Behalf of the Territory
Funds required to meet payments for concessions were less than anticipated. As a result, the
appropriation was not fully drawn down. Additional funding from the Commonwealth for transport and
general concessions was not received in time to draw down for payment of invoices in this financial
year. The additional $508k has been rolled over through a s16B instrument into 2013-14.
(ii) Community Service Obligations
Funds required to meet payments for community service obligations were greater than anticipated. As
a result, additional funds from the 'underspend' in concessions were drawn down. Total Territorial
appropriation was not exceeded.

Community Services Directorate Territorial Financial Statements Note Index
For the Year Ended 30 June 2013
Note 41 Summary of Significant Accounting Policies
Income
Note 42 Payment for Expenses on Behalf of the Territory
Expenses
Note 43 Grants and Purchased Services
Note 44 Other Expenses
Note 45 Act of Grace Payments
Note 46 Waivers, Impairment Losses and Write-Offs
Assets
Note 47 Cash and Cash Equivalents
Note 48 Receivables
Liabilities
Note 49 Payables
Other
Note 50 Cash Flow Reconciliation
Note 51 Financial Instruments
Note 52 Commitments
Note 53 Contingent Liabilities and Contingent Assets
Note 54 Events Occurring After Balance Date

Community Services Directorate
Notes to and Forming Part of the Financial Statements
For the Year Ended 30 June 2013
NOTE 41. SUMMARY OF SIGNIFICANT ACCOUNTING POLICIES
The Community Services Directorate accounting policies are contained in Note 2 Summary
of Significant Accounting Policies. The policies outlined in Note 2 apply to both the
Controlled and Territorial financial statements.
(a) Payments for Expenses on Behalf of the Territory
The Statement of Assets and Liabilities on Behalf of the Territory includes receivables from,
the Territory Banking Account.

Community Services Directorate Notes to and Forming Part of the Financial Statements
For the Year Ended 30 June 2013
NOTE 42. PAYMENT FOR EXPENSES ON BEHALF OF THE TERRITORY
Under the Financial Management Act 1996 , funds can be appropriated for expenses
incurred on behalf of the Territory. The Community Services Directorate receives this
appropriation to fund expenses incurred on behalf of the Territory, being the payment of
concessions.
2013 2012
$'000 $'000
Payment for Expenses on Behalf of the Territory 20,670 19,028
Community Service Obligations (CSO) 23,458 20,077
Total Payment for Expenses on Behalf of the Territory 44,128 39,105
Payment of Expenses on Behalf of the Territory
Concession Payments:
- General Rates a
7,813 6,758
- Motor Vehicle Registrations and Licences b
3,761 3,520
- Pensioner Transport c
7,188 7,123
- Spectacle / Senior Spectacle Scheme d
1,684 1,490
- Government Assisted Transport Scheme e
224 137
20,670 19,028
Community Service Obligations
- Electricity and Gas f
10,717 9,330
- Water and Sewerage g
11,450 9,677
- Taxi Subsidy Scheme h
1,182 1,070
- Funeral Assistance Program i
109 -
23,458 20,077
Total Payment for Expenses on Behalf of the Territory 44,128 39,105
a) The increase in concession payments for General Rates reflects an increase in rates
charged in 2012-13 and a 17% increase in the maximum concession per property from $481
in 2011-12 to $565 in 2012-13.
b) The increase in Motor Vehicle Registrations and Licences is due to a higher number of
eligible concession holders accessing this concession and an increase in registration and
licence fees from 1 July 2012.
c) Pensioner Transport concessions relate to rebates offered for eligible pensioners for
transport using ACTION and Deane's Buslines.
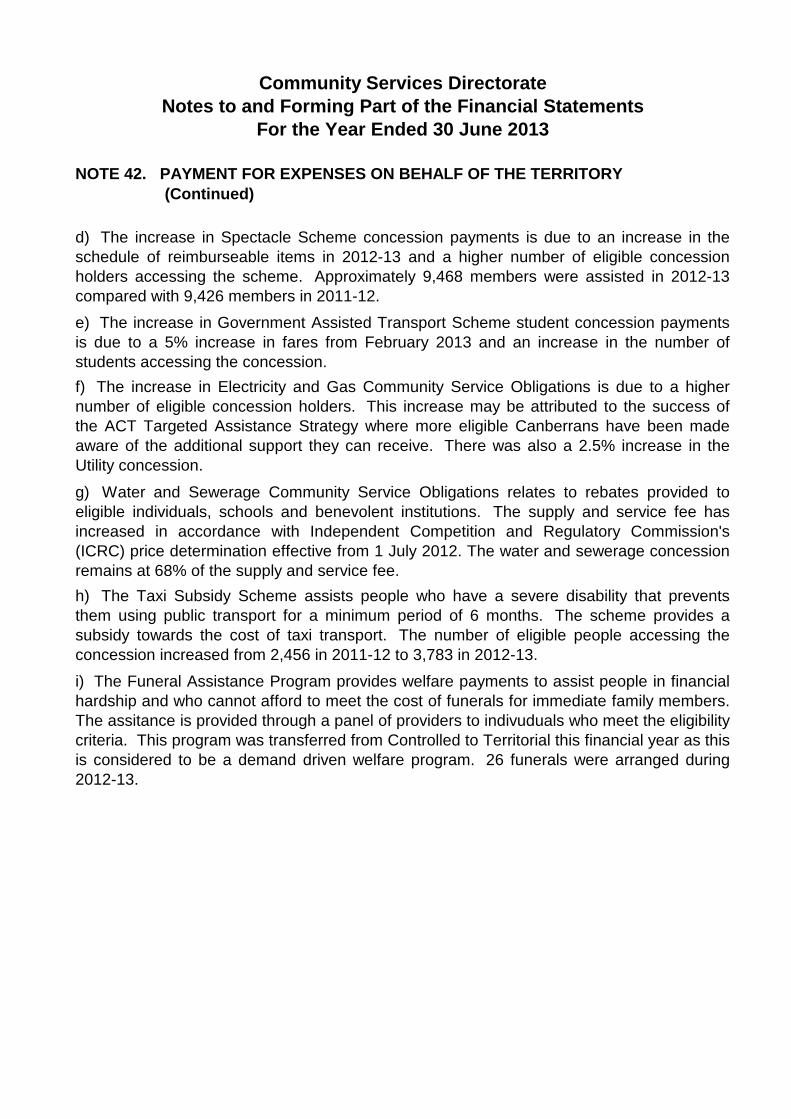
Community Services Directorate Notes to and Forming Part of the Financial Statements
For the Year Ended 30 June 2013
NOTE 42. PAYMENT FOR EXPENSES ON BEHALF OF THE TERRITORY (Continued)
d) The increase in Spectacle Scheme concession payments is due to an increase in the
schedule of reimburseable items in 2012-13 and a higher number of eligible concession
holders accessing the scheme. Approximately 9,468 members were assisted in 2012-13
compared with 9,426 members in 2011-12.
e) The increase in Government Assisted Transport Scheme student concession payments
is due to a 5% increase in fares from February 2013 and an increase in the number of
students accessing the concession.
f) The increase in Electricity and Gas Community Service Obligations is due to a higher
number of eligible concession holders. This increase may be attributed to the success of
the ACT Targeted Assistance Strategy where more eligible Canberrans have been made
aware of the additional support they can receive. There was also a 2.5% increase in the
Utility concession.
g) Water and Sewerage Community Service Obligations relates to rebates provided to
eligible individuals, schools and benevolent institutions. The supply and service fee has
increased in accordance with Independent Competition and Regulatory Commission's
(ICRC) price determination effective from 1 July 2012. The water and sewerage concession
remains at 68% of the supply and service fee.
h) The Taxi Subsidy Scheme assists people who have a severe disability that prevents
them using public transport for a minimum period of 6 months. The scheme provides a
subsidy towards the cost of taxi transport. The number of eligible people accessing the
concession increased from 2,456 in 2011-12 to 3,783 in 2012-13.
i) The Funeral Assistance Program provides welfare payments to assist people in financial
hardship and who cannot afford to meet the cost of funerals for immediate family members.
The assitance is provided through a panel of providers to indivuduals who meet the eligibility
criteria. This program was transferred from Controlled to Territorial this financial year as this
is considered to be a demand driven welfare program. 26 funerals were arranged during
2012-13.

Community Services Directorate Notes to and Forming Part of the Financial Statements
For the Year Ended 30 June 2013
NOTE 43. GRANTS AND PURCHASED SERVICES
Grants are amounts provided by the Directorate to ACT Government and Non-ACT
Government entities for general assistance or for a particular purpose. Grants may be
for capital or recurrent purposes and the name or category reflects the use of the grant.
The grants given are usually subject to terms and conditions set out in the contract,
correspondence, or by legislation.
2013 2012
$'000 $'000
Community Service Obligations 23,458 20,077
Total Grants and Purchased Services 23,458 20,077
Community Service Obligations
- Electricity and Gas a
10,717 9,330
- Water and Sewerage b
11,450 9,677
- Taxi Subsidy Scheme c
1,182 1,070
- Funeral Assistance Program d
109 -
23,458 20,077
a) The increase in Electricity and Gas Community Service Obligations is due to a higher
number of eligible concession holders. This increase may be attributed to the success of
the ACT Targeted Assistance Strategy where more eligible Canberrans have been made
aware of the additional support they can receive. There was also a 2.5% increase in the
Utility concession.
b) Water and Sewerage Community Service Obligations relates to rebates provided to
eligible individuals, schools and benevolent institutions. The supply and service fee has
increased in accordance with Independent Competition and Regulatory Commission's
(ICRC) price determination effective from 1 July 2012. The water and sewerage
concession remains at 68% of the supply and service fee.
c) The Taxi Subsidy Scheme assists people who have a severe disability that prevents
them using public transport for a minimum period of 6 months. The scheme provides a
subsidy towards the cost of taxi transport. The number of eligible people accessing the
concession increased from 2,456 in 2011-12 to 3,783 in 2012-13.
d) The Funeral Assistance Program provides welfare payments to assist people in
financial hardship and who cannot afford to meet the cost of funerals for immediate
family members. The assitance is provided through a panel of providers to indivuduals
who meet the eligibility criteria. This program was transferred from Controlled to
Territorial this financial year as this is considered to be a demand driven welfare
program. 26 funerals were arranged during 2012-13.
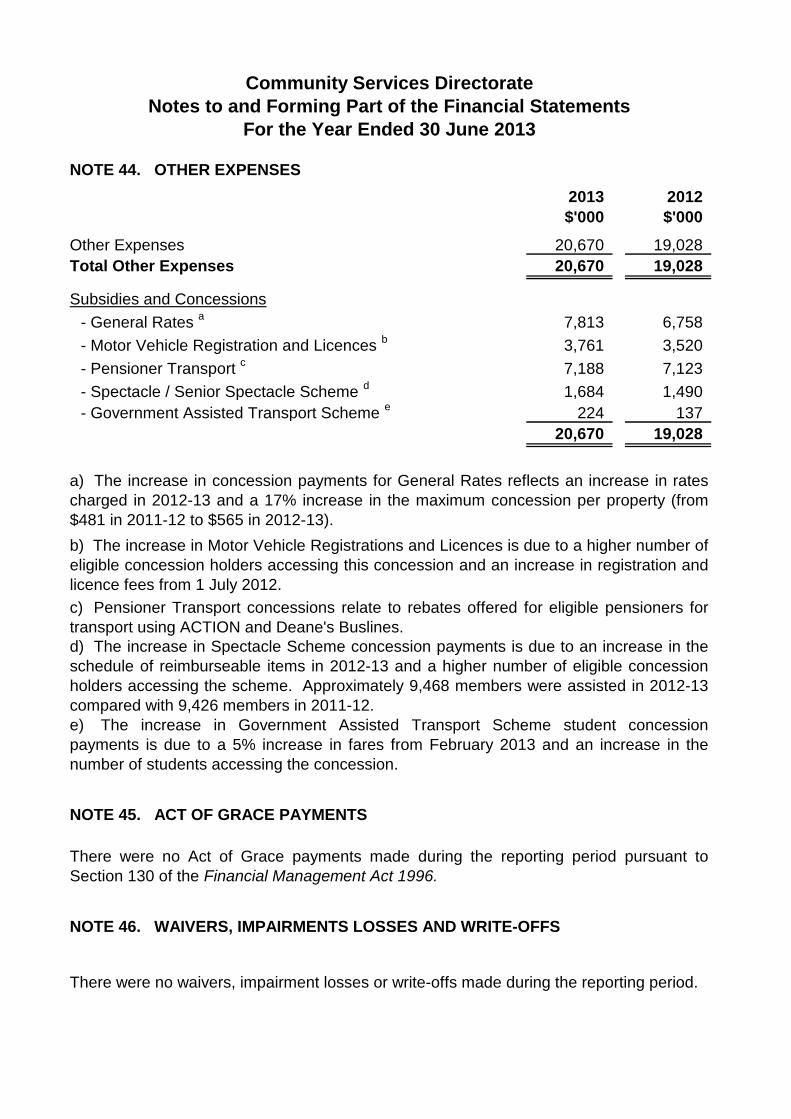
Community Services Directorate Notes to and Forming Part of the Financial Statements
For the Year Ended 30 June 2013
NOTE 44. OTHER EXPENSES
2013
$'000
2012
$'000
Other Expenses
Total Other Expenses
20,670
20,670
19,028
19,028
Subsidies and Concessions
- General Rates a
7,813 6,758
- Motor Vehicle Registration and Licences b
3,761 3,520
- Pensioner Transport c
7,188 7,123
- Spectacle / Senior Spectacle Scheme d
1,684 1,490
- Government Assisted Transport Scheme e
224 137
20,670 19,028
a) The increase in concession payments for General Rates reflects an increase in rates
charged in 2012-13 and a 17% increase in the maximum concession per property (from
$481 in 2011-12 to $565 in 2012-13).
b) The increase in Motor Vehicle Registrations and Licences is due to a higher number of
eligible concession holders accessing this concession and an increase in registration and
licence fees from 1 July 2012.
c) Pensioner Transport concessions relate to rebates offered for eligible pensioners for
transport using ACTION and Deane's Buslines.
d) The increase in Spectacle Scheme concession payments is due to an increase in the
schedule of reimburseable items in 2012-13 and a higher number of eligible concession
holders accessing the scheme. Approximately 9,468 members were assisted in 2012-13
compared with 9,426 members in 2011-12.
e) The increase in Government Assisted Transport Scheme student concession
payments is due to a 5% increase in fares from February 2013 and an increase in the
number of students accessing the concession.
NOTE 45. ACT OF GRACE PAYMENTS
There were no Act of Grace payments made during the reporting period pursuant to
Section 130 of the Financial Management Act 1996.
NOTE 46. WAIVERS, IMPAIRMENTS LOSSES AND WRITE-OFFS
There were no waivers, impairment losses or write-offs made during the reporting period.
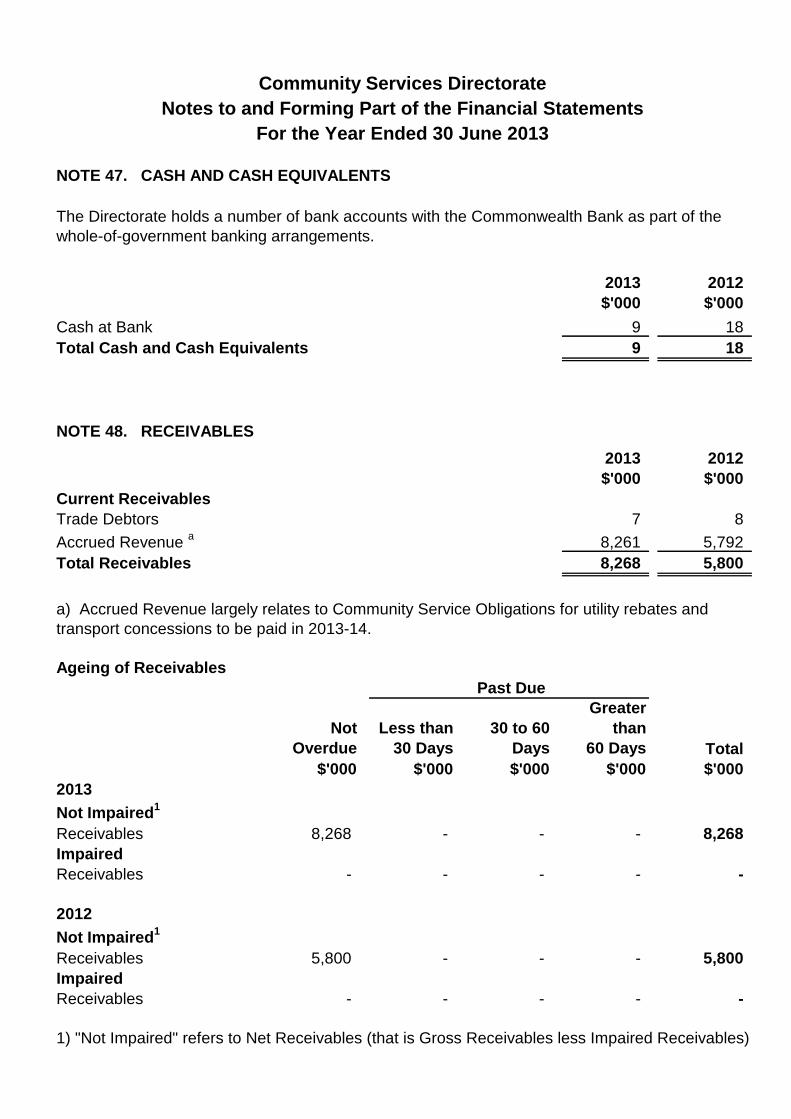
Community Services Directorate Notes to and Forming Part of the Financial Statements
For the Year Ended 30 June 2013
NOTE 47. CASH AND CASH EQUIVALENTS
The Directorate holds a number of bank accounts with the Commonwealth Bank as part of the
whole-of-government banking arrangements.
2013 2012
$'000 $'000
Cash at Bank 9 18
Total Cash and Cash Equivalents 9 18
NOTE 48. RECEIVABLES
2013 2012
$'000 $'000
Current Receivables
Trade Debtors 7 8
Accrued Revenue a
8,261 5,792
Total Receivables 8,268 5,800
a) Accrued Revenue largely relates to Community Service Obligations for utility rebates and
transport concessions to be paid in 2013-14.
Ageing of Receivables
Past Due
Greater
Not Less than 30 to 60 than
Overdue 30 Days Days 60 Days Total
$'000 $'000 $'000 $'000 $'000
2013
Not Impaired1
Receivables 8,268 - - - 8,268
Impaired
Receivables - - - - -
2012
Not Impaired1
Receivables 5,800 - - - 5,800
Impaired
Receivables - - - - -
1) "Not Impaired" refers to Net Receivables (that is Gross Receivables less Impaired Receivables)

Community Services Directorate
Notes to and Forming Part of the Financial Statements
For the Year Ended 30 June 2013
NOTE 48. RECEIVABLES (Continued)
Classification of ACT Government/Non-ACT Government
Receivables
2013
$'000
2012
$'000
Receivables with ACT Government Entities
Accrued Revenue (Territory Banking Account)
Total Receivables with ACT Government Entities
8,261
8,261
5,792
5,792
Receivables with Non-ACT Government Entities
Receivables (Interstate Taxi Subsidy Scheme Concessions)
Total Receivables with Non-ACT Government Entities
Total Receivables
7
7
8,268
8
8
5,800
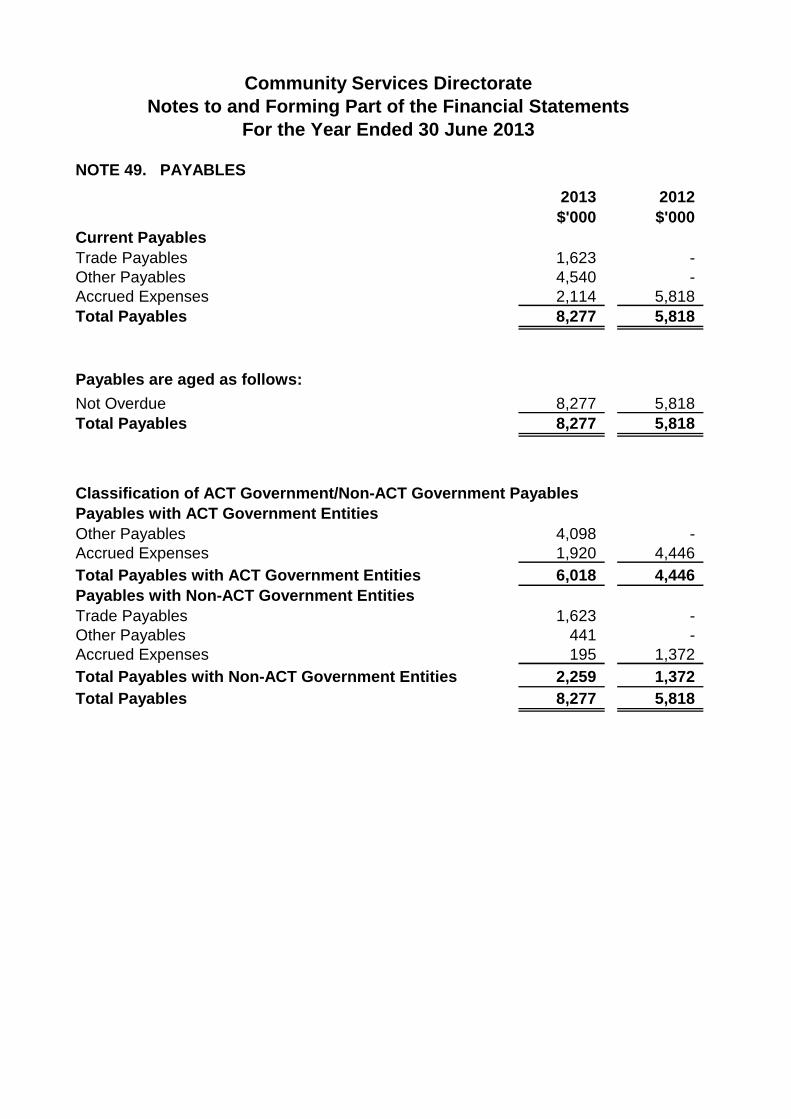
Community Services Directorate Notes to and Forming Part of the Financial Statements
For the Year Ended 30 June 2013
NOTE 49. PAYABLES
2013 2012
$'000 $'000
Current Payables
Trade Payables 1,623 -
Other Payables 4,540 -
Accrued Expenses 2,114 5,818
Total Payables 8,277 5,818
Payables are aged as follows:
Not Overdue 8,277 5,818
Total Payables 8,277 5,818
Classification of ACT Government/Non-ACT Government Payables
Payables with ACT Government Entities
Other Payables 4,098 -
Accrued Expenses 1,920 4,446
Total Payables with ACT Government Entities 6,018 4,446
Payables with Non-ACT Government Entities
Trade Payables 1,623 -
Other Payables 441 -
Accrued Expenses 195 1,372
Total Payables with Non-ACT Government Entities 2,259 1,372
Total Payables 8,277 5,818
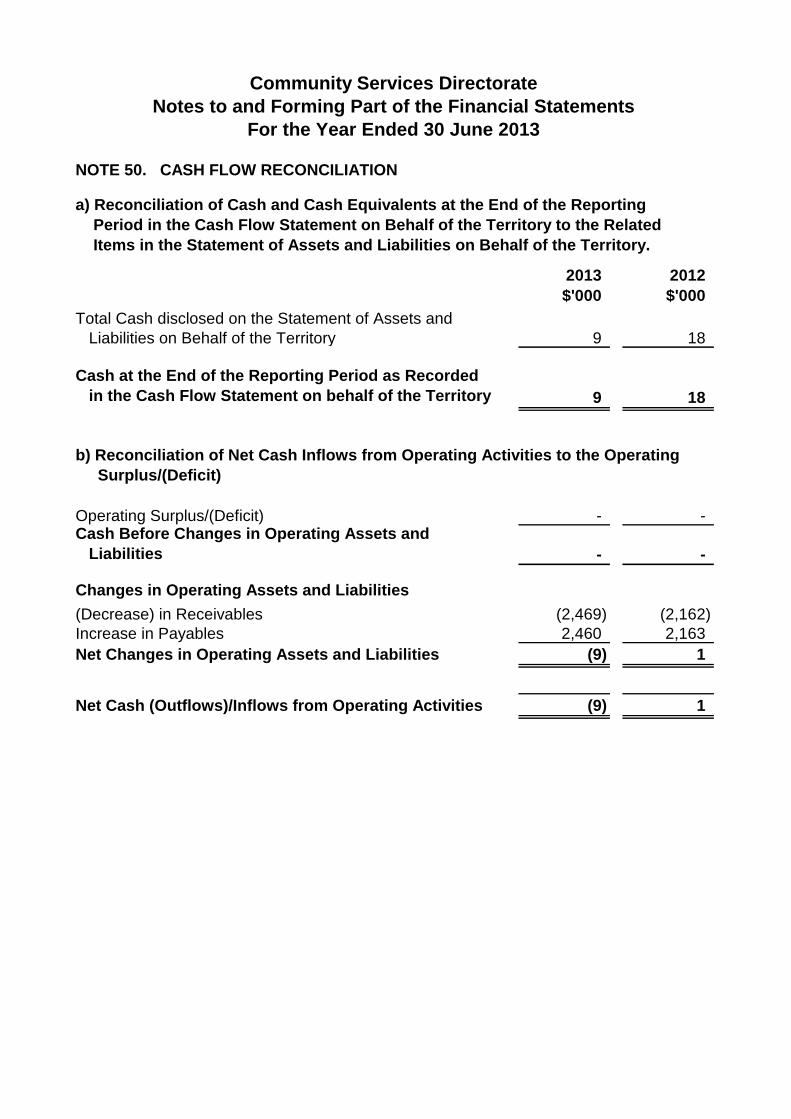
Community Services Directorate Notes to and Forming Part of the Financial Statements
For the Year Ended 30 June 2013
NOTE 50. CASH FLOW RECONCILIATION
a) Reconciliation of Cash and Cash Equivalents at the End of the Reporting
Period in the Cash Flow Statement on Behalf of the Territory to the Related
Items in the Statement of Assets and Liabilities on Behalf of the Territory.
2013 2012
$'000 $'000
Total Cash disclosed on the Statement of Assets and
Liabilities on Behalf of the Territory 9 18
Cash at the End of the Reporting Period as Recorded
in the Cash Flow Statement on behalf of the Territory 9 18
b) Reconciliation of Net Cash Inflows from Operating Activities to the Operating
Surplus/(Deficit)
Operating Surplus/(Deficit) - -Cash Before Changes in Operating Assets and
Liabilities - -
Changes in Operating Assets and Liabilities
(Decrease) in Receivables (2,469) (2,162)
Increase in Payables 2,460 2,163
Net Changes in Operating Assets and Liabilities (9) 1
Net Cash (Outflows)/Inflows from Operating Activities (9) 1

Community Services Directorate Notes to and Forming Part of the Financial Statements
For the Year Ended 30 June 2013
NOTE 51. FINANCIAL INSTRUMENTS
Details of the significant accounting policies and methods adopted, including the criteria
for recognition, the basis of measurement, and the basis on which income and expenses
are recognised, with respect to each class of financial asset and financial liability are
disclosed in Note 41 Summary of Significant Accounting Policies.
Interest Rate Risk
Interest rate risk is the risk that the fair value or future cash flows of a financial instrument
will fluctuate because of changes in market interest rates.
The Directorate is considered to have insignificant exposure to interest rate risk, as it holds
only cash and cash equivalents with the Commonwealth Bank and Westpac Banking
Corporation, both generate minimal or no interest, and receivables are non-interest
bearing.
There have been no changes in risk exposure or processes for managing risk since the
last financial reporting period.
Sensitivity Analysis
A sensitivity analysis has not been undertaken as the Directorate is not exposed to interest
rate risk.
Credit Risk
Credit risk is the risk that one party to a financial instrument will fail to discharge an
obligation and cause the other party to incur a financial loss.
Financial assets consist of cash and cash equivalents and receivables. The Directorate's
credit risk is limited to the carrying amount of the financial assets it holds net of any
allowance made for impairment.
Cash and cash equivalents are held with the Commonwealth Bank, a high credit, quality
financial institution, in accordance with whole of ACT Government banking arrangements
and the Directorate holds no investments.
A significant proportion of the Directorate's Territorial receivables are from the ACT
Government which means that the credit risk for these receivables is low. The Directorate
reviews outstanding debtors on a monthly basis and if any are unresolved they are
referred to the ACT Government Solicitor's Office for legal action. There is no significant
concentration of credit risk that has been identified by the Directorate for Territorial
financial assets.
There have been no changes in credit risk exposure since the last reporting period.

Community Services Directorate Notes to and Forming Part of the Financial Statements
For the Year Ended 30 June 2013
NOTE 51. FINANCIAL INSTRUMENTS (Continued)
Liquidity Risk
Liquidity risk is the risk that the Directorate will encounter difficulties in meeting obligations
associated with financial liabilities that are settled by delivering cash or another financial
asset. To limit its exposure to liquidity risk, the Directorate ensures that at any particular
point in time it has a sufficient amount of current financial assets to meet its current
financial liabilities. Also, where necessary, the Directorate can request additional
appropriation in order to meet its Territorial payables. This ensures the Directorate has
enough liquidity to meet its emerging finanical liabilities.
The Directorate's exposure to liquidity risk and the management of this risk has not
changed since the previous reporting period.
Price Risk
Price risk is the risk that the fair value or future cash flows of a financial instrument will
fluctuate because of changes in market prices, whether these changes are caused by
factors specific to the individual financial instrument or its issuer, or factors affecting all
similar financial instruments traded in the market.
The Directorate does not have Territorial financial assets that are subject to price risk.
Accordingly, a sensitivity analysis has not been undertaken.
Fair Value of Financial Assets and Liabilities
The carrying amounts and fair values of financial assets and liabilities at balance date are:
Carrying Fair Carrying Fair
Amount Value Amount Value
2013 2013 2012 2012
$'000 $'000 $'000 $'000
Financial Assets
Cash and Cash Equivalents 9 9 18 18
Receivables 8,268 8,268 5,800 5,800
Total Financial Assets 8,277 8,277 5,818 5,818
Financial Liabilities
Payables 8,277 8,277 5,818 5,818
Total Financial Liabilities 8,277 8,277 5,818 5,818
Fair Value Hierarchy
The Directorate's financial assets and liabilities are measured, subsequent to initial
recognition, at amortised cost and as such are not subject to the fair value hierarchy.
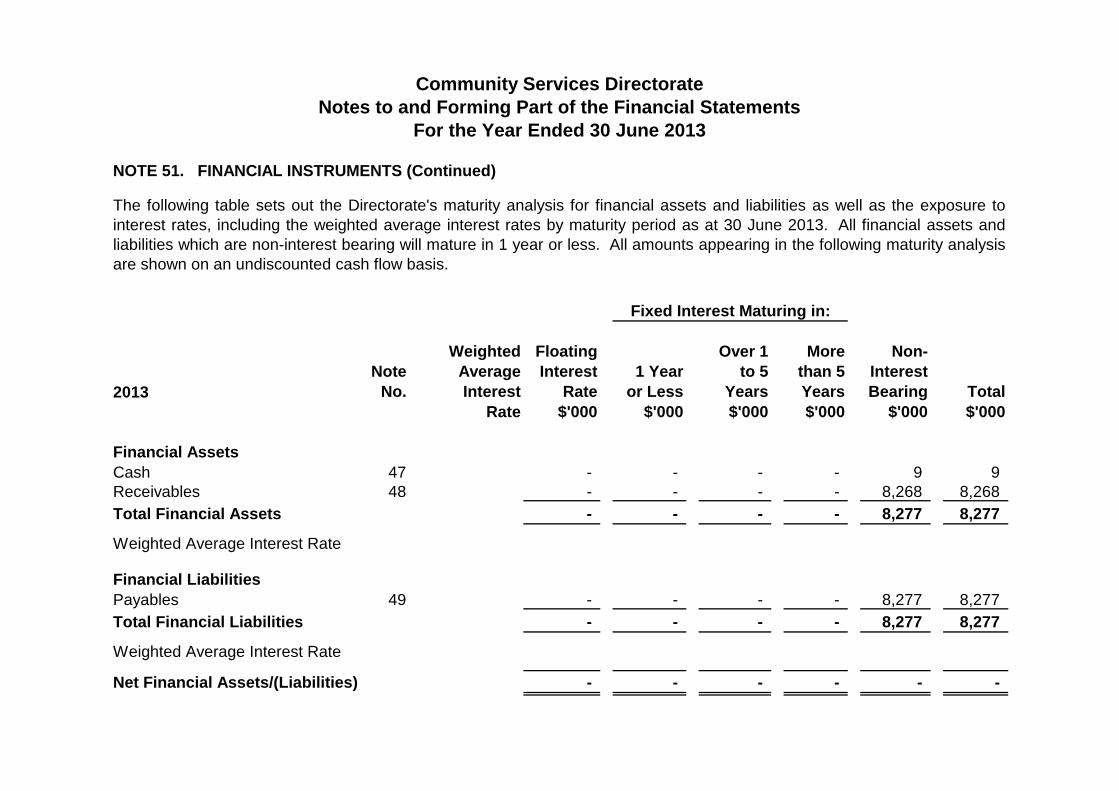
Community Services Directorate Notes to and Forming Part of the Financial Statements
For the Year Ended 30 June 2013
NOTE 51. FINANCIAL INSTRUMENTS (Continued)
The following table sets out the Directorate's maturity analysis for financial assets and liabilities as well as the exposure to
interest rates, including the weighted average interest rates by maturity period as at 30 June 2013. All financial assets and
liabilities which are non-interest bearing will mature in 1 year or less. All amounts appearing in the following maturity analysis
are shown on an undiscounted cash flow basis.
Fixed Interest Maturing in:
2013
Note
No.
Weighted
Average
Interest
Rate
Floating
Interest
Rate
$'000
1 Year
or Less
$'000
Over 1
to 5
Years
$'000
More
than 5
Years
$'000
Non-
Interest
Bearing
$'000
Total
$'000
Financial Assets
Cash
Receivables
Total Financial Assets
47
48
-
-
-
-
-
-
-
-
-
-
-
-
9
8,268
8,277
9
8,268
8,277
Weighted Average Interest Rate
Financial Liabilities
Payables
Total Financial Liabilities
49 -
-
-
-
-
-
-
-
8,277
8,277
8,277
8,277
Weighted Average Interest Rate
Net Financial Assets/(Liabilities) - - - - - -
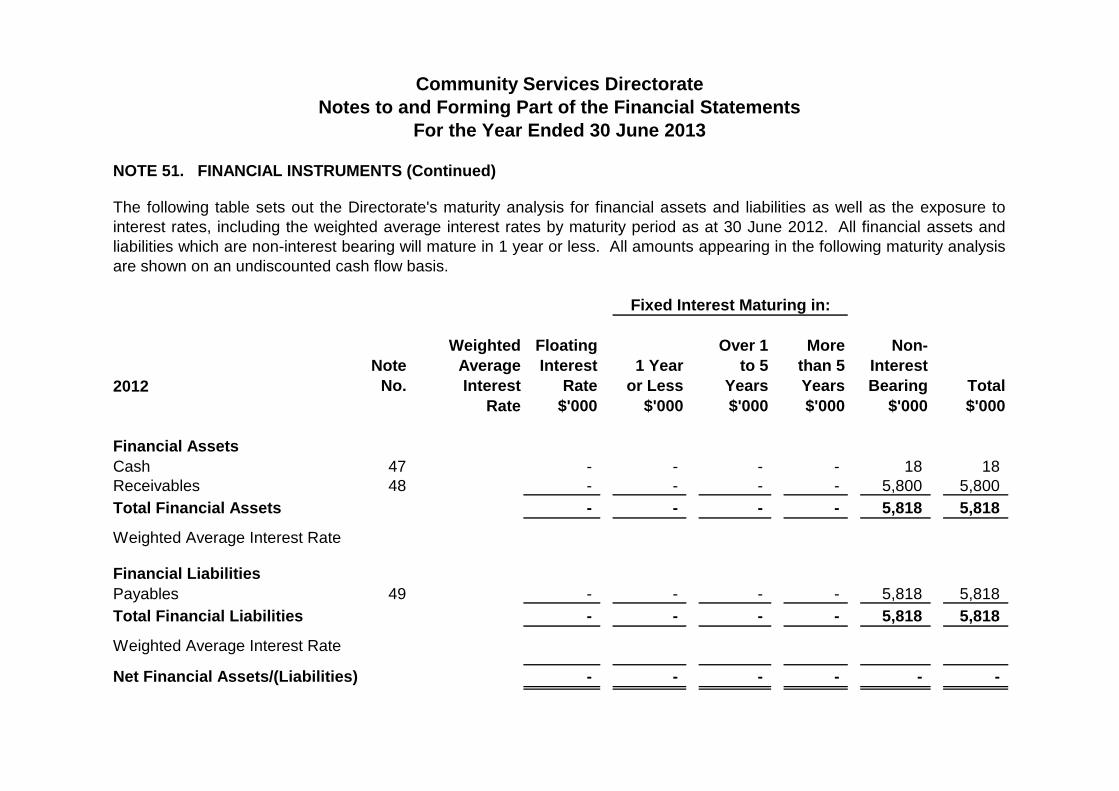
Community Services Directorate Notes to and Forming Part of the Financial Statements
For the Year Ended 30 June 2013
NOTE 51. FINANCIAL INSTRUMENTS (Continued)
The following table sets out the Directorate's maturity analysis for financial assets and liabilities as well as the exposure to
interest rates, including the weighted average interest rates by maturity period as at 30 June 2012. All financial assets and
liabilities which are non-interest bearing will mature in 1 year or less. All amounts appearing in the following maturity analysis
are shown on an undiscounted cash flow basis.
Fixed Interest Maturing in:
2012
Note
No.
Weighted
Average
Interest
Rate
Floating
Interest
Rate
$'000
1 Year
or Less
$'000
Over 1
to 5
Years
$'000
More
than 5
Years
$'000
Non-
Interest
Bearing
$'000
Total
$'000
Financial Assets
Cash
Receivables
Total Financial Assets
47
48
-
-
-
-
-
-
-
-
-
-
-
-
18
5,800
5,818
18
5,800
5,818
Weighted Average Interest Rate
Financial Liabilities
Payables
Total Financial Liabilities
49 -
-
-
-
-
-
-
-
5,818
5,818
5,818
5,818
Weighted Average Interest Rate
Net Financial Assets/(Liabilities) - - - - - -

Community Services Directorate Notes to and Forming Part of the Financial Statements
For the Year Ended 30 June 2013
NOTE 51. FINANCIAL INSTRUMENTS (Continued)
2013 2012
$'000 $'000
Carrying Amount of Each Class of Financial Asset and
Financial Liability
Financial Assets
Loans and Receivables 8,268 5,800
Financial Liabilities
Financial Liabilities Measured at Amortised Cost 8,277 5,818
The Directorate does not have any Territorial financial assets in the 'Financial Assets at
Fair Value through Profit and Loss' category, 'Available for Sale' category or the 'Held to
Maturity' category and as such these categories are not included above. The
Directorate also does not have any Territorial financial liabilities in the 'Financial
Liabilities at Fair Value through Profit and Loss' category and, as such, this category is
not included above.

Community Services Directorate
Notes to and Forming Part of the Financial Statements
For the Year Ended 30 June 2013
NOTE 52. COMMITMENTS
2013 2012
$'000 $'000
Other Commitments
Within One Year - Community Service Obligations 23,307 22,968
Within One Year - Other Concessions 23,827 22,801
Total Other Commitments a
47,134 45,769
All amounts shown in the commitment note are inclusive of GST.
There were no contingent liabilities or contingent assets as at 30 June 2013.
There were no indemnities as at 30 June 2013.
NOTE 54. EVENTS OCCURRING AFTER BALANCE DATE
NOTE 53. CONTINGENT LIABILITIES AND CONTINGENT ASSETS
a) The increase in Territorial Commitments is mainly due to an increase in CPI and an
increase in funding for the Taxi Subsidy Scheme, energy and utility concessions, and
the Funeral Assistance Program.
Other commitments contracted at reporting date mainly relate to community service
obligations that have not been recognised as liabilities payable for general rates,
electricity, water and sewerage, bus transport, spectacle scheme, taxi subsidy scheme
and motor vehicle and licences rebates:
There were no other events that occurred after balance date that would affect the
Financial Statements in the current or future reporting periods.
a) The responsibility and funding associated with the management of an electronic card
system for the Taxi Subsidy Scheme will be transferred from Controlled appropriations
in 2013-14. The budget allocation to be transferred is $214,000.
b) The ACT Government will change its banking arrangements from the
Commonwealth Bank to the Westpac Banking Corporation in accordance with the
Whole of Government Banking Arrangements. All bank accounts and services with
Commonwealth Bank will be closed as at 30 September 2013.
SECTION A ANALYSIS OF FINANCIAL PERFORMANCE — COMMUNITY SERVICES DIRECTORATE 129
A.4 Statement of Performance
REPORT OF FACTUAL FINDINGS
COMMUNITY SERVICES DIRECTORATE
To the Members of the ACT Legislative Assembly
Report on the statement of performance
The statement of performance of the Community Services Directorate (the Directorate) for the year ended 30 June 2013 has been reviewed.
Responsibility for the statement of performance
The Director-General of the Directorate is responsible for the preparation and fair presentation of the statement of performance of the Directorate in accordance with the Financial Management Act 1996. This includes responsibility for maintaining adequate records and internal controls that are designed to prevent and detect fraud and error, and the systems and procedures to measure the results of the accountability indicators reported in the statement of performance.
The auditor’s responsibility
Under the Financial Management Act 1996 and Financial Management (Statement of Performance Scrutiny) Guidelines 2011, I am responsible for providing a report of factual findings on the statement of performance.
The review was conducted in accordance with Australian Auditing Standards applicable to review engagements, to provide assurance that the results of the accountability indicators reported in statement of performance have been fairly presented in accordance with the Financial Management Act 1996.
A review is primarily limited to making inquiries with representatives of the Directorate, performing analytical and other review procedures and examining other available evidence. These review procedures do not provide all of the evidence that would be required in an audit, therefore, the level of assurance provided is less than that given in an audit. An audit has not been performed and no audit opinion is being expressed on the statement of performance.
The review did not include an assessment of the relevance or appropriateness of the accountability indicators reported in the statement of performance or the related performance targets.
Level 4, 11 Moore Street, Canberra City, ACT 2601 | PO Box 275, Civic Square, ACT 2608 Telephone: 02 6207 0833 | Facsimile: 02 6207 0826 | Email: [email protected]
No opinion is expressed on the accuracy of explanations provided for variations between actual and targeted performance due to the often subjective nature of such explanations.
Electronic presentation of the statement of performance
Those viewing an electronic presentation of this statement of performance should note that the review does not provide assurance on the integrity of information presented electronically, and does not provide an opinion on any other information which may have been hyperlinked to or from this statement of performance. If users of this statement of performance are concerned with the inherent risks arising from the electronic presentation of information, they are advised to refer to the printed copy of the reviewed statement of performance to confirm the accuracy of this electronically presented information.
Independence
Applicable independence requirements of Australian professional ethical pronouncements were followed in conducting the review.
Review opinion
Based on the review procedures, no matters have come to my attention which indicate that the results of the accountability indicators, reported in the statement of performance of the Directorate for the year ended 30 June 2013, are not fairly presented in accordance with the Financial Management Act 1996.
This review opinion should be read in conjunction with the other information disclosed in this report.
Community Services Directorate Statement of Performance
For the Year Ended 30 June 2013
Statement of Responsibility
In my opinion, the Statement of Performance is in agreement with the Directorate’s records and fairly reflects the service performance of the Directorate for the year ended 30 June 2013 and also fairly reflects the judgements exercised in preparing it.

Community Services Directorate Statement of Performance
For the Year Ended 30 June 2013
Output Class 1 – Disability and Therapy Services
Output 1.1 – Disability Services and Policy
Description
Provision of high quality community based, consumer focused disability services through government and non government service providers to meet the accommodation support, community access and support, respite care and wellbeing needs of people with moderate to severe disabilities.
Accountability Indicators 1 Original Target
2012–13
Actual Result
2012–13 Variance
% Notes
Total Cost ($’000) 86,026 92,648 8 1
Government Payment for Outputs ($’000) 84,243 85,092 1
a. Accommodation support (number of places). 500 506 1
Services that provide accommodation to people with a disability and services that provide support needed to enable a person with a disability to remain in their existing accommodation or to move to more suitable or appropriate accommodation.
b. Community support (number of people accessing service).
1,000 1,145 15 2
Services that provide the support needed for a person with a disability to live in a non-institutional setting. These include: behaviour/specialist intervention, counselling, case management, local coordination and development.
c. Community access (hours of service). 245,000 247,015 1
Services designed to provide opportunities for people with a disability to gain and use their abilities to enjoy their full potential for social independence. This includes hours of service purchased from the non–government sector.
d. Respite – centre based (number of bed nights). 8,100 7,519 (7) 3
Respite care provided in community setting similar to a ‘group home’ structure and respite care provided in other centre-based settings.
e. Respite – in own home (number of hours). 50,000 46,285 (7) 4
Respite care provided in the individual’s own home. This includes hours purchased from the non–government sector.
f. Client satisfaction as measured by annual survey. 75% 80% 7 5
The satisfaction of clients and funded organisations with the relationship with the Directorate and service delivery and contract management by the Directorate.
g. Cost per head of population. $234.44 $252.49 8 6
The above Statement of Performance should be read in conjunction with the accompanying notes.
1 Under the Financial Management (Statement of Performance Scrutiny) Guidelines 2011, the accountability
indicators are reviewed by the ACT Auditor–General’s Office.
Community Services Directorate Statement of Performance
For the Year Ended 30 June 2013
Explanation of Material Variances
1. The variance from target is mainly due to additional costs related to the DisabilityCare Taskforce, and higher costs associated with the delivery of disability services to the community.
2. The actual result above target relates primarily to an increase in the number of grant applications assessed.
3. The actual result below target is mainly attributable to decreased demand and the closure of government respite houses for maintenance and over the Christmas period.
4. A preference for flexible community access services has resulted in fewer hours for in–home respite services.
5. Client satisfaction exceeded target for 2012-13 reflecting higher levels of satisfaction particularly for Accommodation Support Services in group homes and case management and Community Support.
6. The higher cost per head of population is due to the higher overall cost for the output (see note 1)

Community Services Directorate Statement of Performance
For the Year Ended 30 June 2013
Output Class 1 – Disability and Therapy Services
Output 1.2 – Therapy Services
Description
Provision of therapy services for children with delays in development from birth to age eight, and for children, young people and adults with disabilities (i.e. from birth to 65 years), including counselling and support, and assistance with physical, intellectual, communication and other functional disabilities.
Accountability Indicators 1 Original Target
2012–13
Actual Result
2012–13 Variance
% Notes
Total Cost ($’000) 13,422 13,329 (<1)
Government Payment for Outputs ($’000) 12,922 13,120 1
a. Hours of therapy services provided. 66,500 75,697 14 1
Hours of therapy services to an individual, group or the community. Hours of service to an individual may include assessments, intervention, consultations with families or other providers of service to the client.
b. Average cost per hour of therapy services to an individual or group.
$201.83 $176.08 (13) 2
c. Client satisfaction with therapy service as measured by annual survey.
85% 94% 11 3
d. New referrals actioned within five working days. 95% 99% 4
New referrals are taken by intake and through the Drop In Clinics. The team leaders will accept these referrals within the five working days of being formally documented as a referral.
The above Statement of Performance should be read in conjunction with the accompanying notes.
1 Under the Financial Management (Statement of Performance Scrutiny) Guidelines 2011, the accountability
indicators are reviewed by the ACT Auditor–General’s Office.

Community Services Directorate Statement of Performance
For the Year Ended 30 June 2013
Explanation of Material Variances
1. The result above target is mainly due to a higher number of parent workshops, group sessions, therapy assistant hours and increased school aged service delivery strategies.
2. The lower average cost per hour against the target is due to the higher number of hours of Therapy Services provided (see note 1).
3. Improvement in processes based on previous client feedback, such as more active management of clients on the waiting list, have led to higher satisfaction levels.
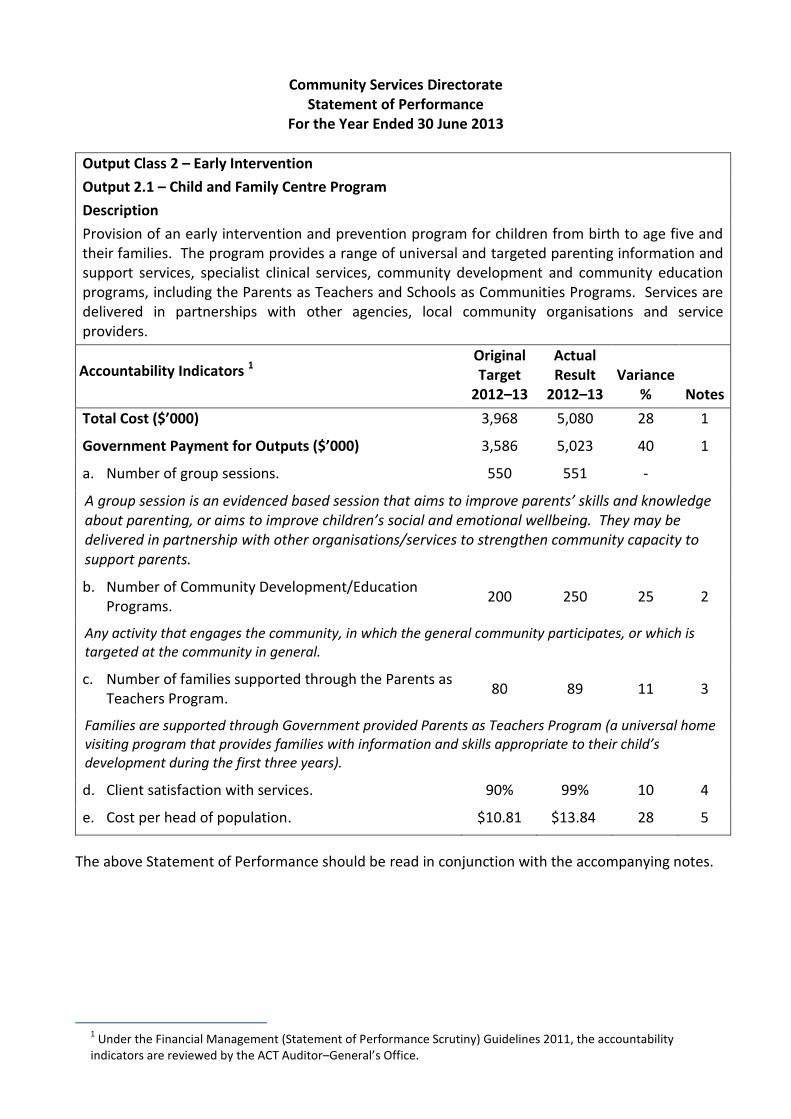
Community Services Directorate Statement of Performance
For the Year Ended 30 June 2013
Output Class 2 – Early Intervention
Output 2.1 – Child and Family Centre Program
Description
Provision of an early intervention and prevention program for children from birth to age five and their families. The program provides a range of universal and targeted parenting information and support services, specialist clinical services, community development and community education programs, including the Parents as Teachers and Schools as Communities Programs. Services are delivered in partnerships with other agencies, local community organisations and service providers.
Accountability Indicators 1 Original Target
2012–13
Actual Result
2012–13 Variance
% Notes
Total Cost ($’000) 3,968 5,080 28 1
Government Payment for Outputs ($’000) 3,586 5,023 40 1
a. Number of group sessions. 550 551 -
! group session is an evidenced based session that aims to improve parents’ skills and knowledge about parenting, or aims to improve children’s social and emotional wellbeing. They may be delivered in partnership with other organisations/services to strengthen community capacity to support parents.
b. Number of Community Development/Education Programs.
200 250 25 2
Any activity that engages the community, in which the general community participates, or which is targeted at the community in general.
c. Number of families supported through the Parents as Teachers Program.
80 89 11 3
Families are supported through Government provided Parents as Teachers Program (a universal home visiting program that provides families with information and skills appropriate to their child’s development during the first three years).
d. Client satisfaction with services. 90% 99% 10 4
e. Cost per head of population. $10.81 $13.84 28 5
The above Statement of Performance should be read in conjunction with the accompanying notes.
1 Under the Financial Management (Statement of Performance Scrutiny) Guidelines 2011, the accountability
indicators are reviewed by the ACT Auditor–General’s Office.

Community Services Directorate Statement of Performance
For the Year Ended 30 June 2013
Explanation of Material Variances
1. The variance from target is mainly due to some Early Intervention programs that were previously reported in Output 2.2 now incorporated into the Child and Family Centre programs and included in this output.
2. The Child and Family Centres delivered additional programs targeted at Aboriginal and Torres Strait Islander families through the Indigenous Parenting Support Service program.
3. Demand for this program remains strong across the centres.
4. The Child and Family Centres have a strong focus on customer service which continues to be reflected in the survey results. The majority of families are satisfied with the service and assistance they have received through the Centres.
5. The higher cost per head of population is due to the higher overall cost for the output (see note 1)
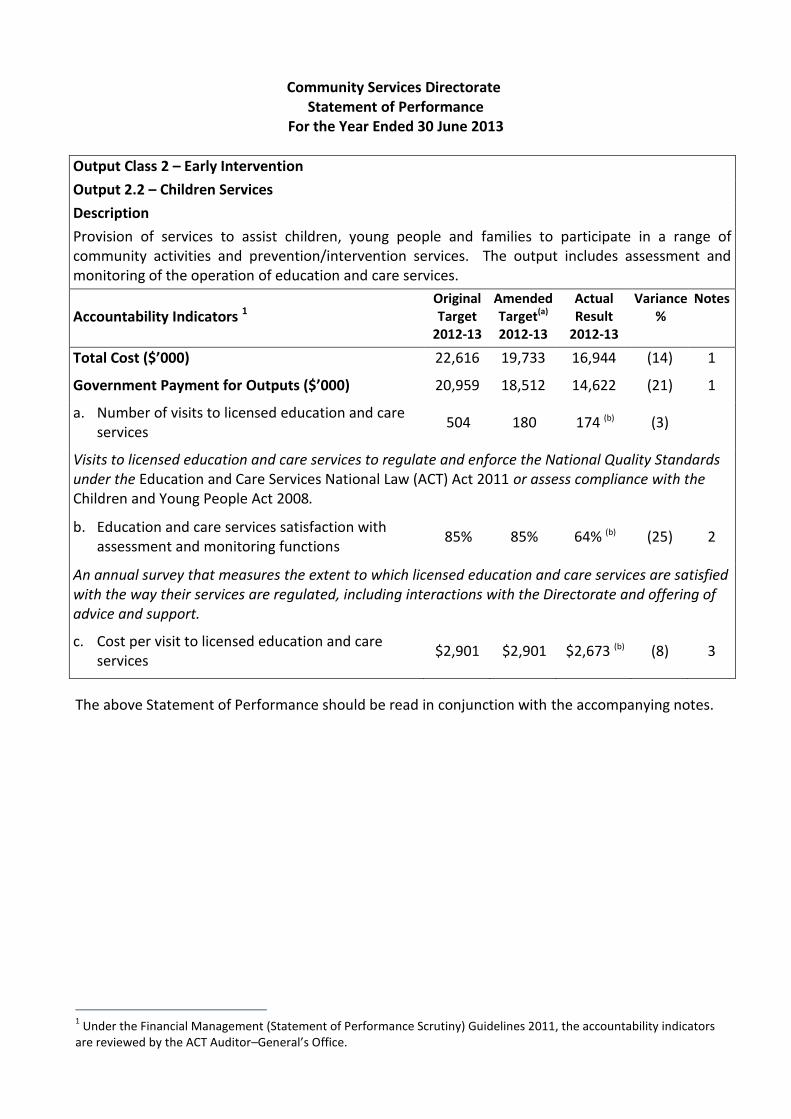
Community Services Directorate Statement of Performance
For the Year Ended 30 June 2013
Output Class 2 – Early Intervention
Output 2.2 – Children Services
Description
Provision of services to assist children, young people and families to participate in a range of community activities and prevention/intervention services. The output includes assessment and monitoring of the operation of education and care services.
Accountability Indicators 1 Original Target
2012-13
Amended Target(a)
2012-13
Actual Result
2012-13
Variance %
Notes
Total Cost ($’000) 22,616 19,733 16,944 (14) 1
Government Payment for Outputs ($’000) 20,959 18,512 14,622 (21) 1
a. Number of visits to licensed education and care services
504 180 174 (b) (3)
Visits to licensed education and care services to regulate and enforce the National Quality Standards under the Education and Care Services National Law (ACT) Act 2011 or assess compliance with the Children and Young People Act 2008.
b. Education and care services satisfaction with assessment and monitoring functions
85% 85% 64% (b) (25) 2
An annual survey that measures the extent to which licensed education and care services are satisfied with the way their services are regulated, including interactions with the Directorate and offering of advice and support.
c. Cost per visit to licensed education and care services
$2,901 $2,901 $2,673 (b) (8) 3
The above Statement of Performance should be read in conjunction with the accompanying notes.
1 Under the Financial Management (Statement of Performance Scrutiny) Guidelines 2011, the accountability indicators
are reviewed by the ACT Auditor–General’s Office.
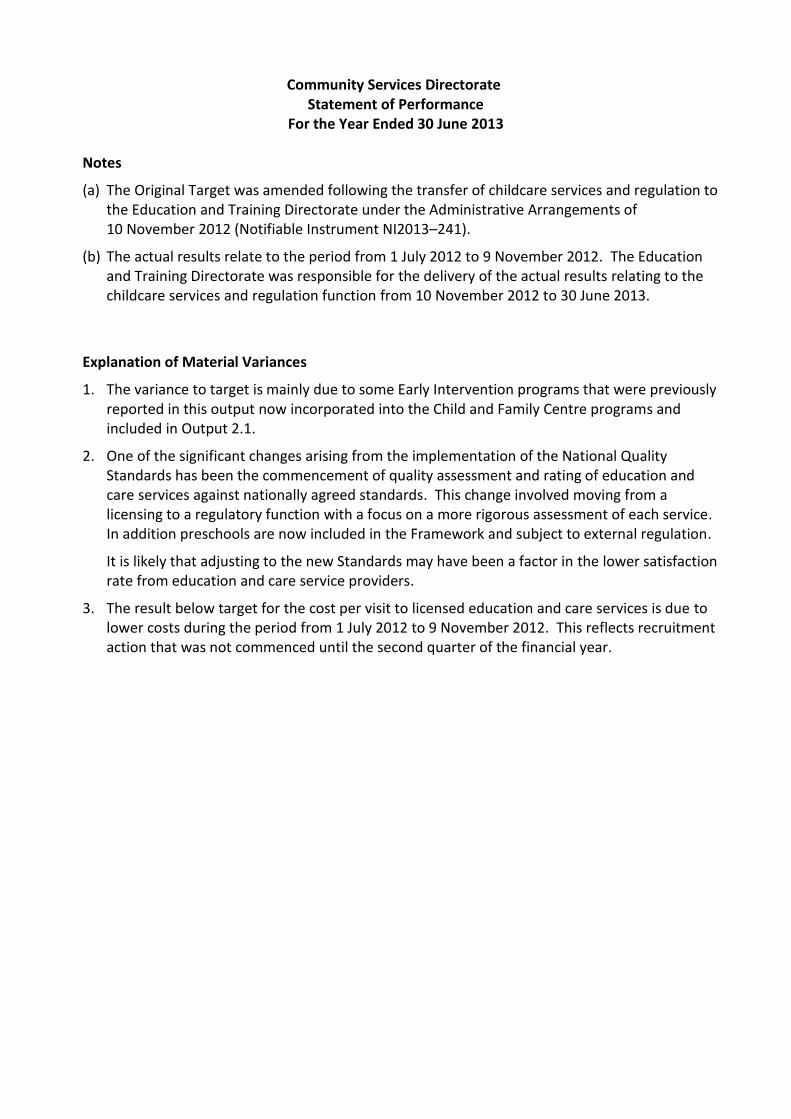
Community Services Directorate Statement of Performance
For the Year Ended 30 June 2013
Notes
(a) The Original Target was amended following the transfer of childcare services and regulation to the Education and Training Directorate under the Administrative Arrangements of 10 November 2012 (Notifiable Instrument NI2013–241).
(b) The actual results relate to the period from 1 July 2012 to 9 November 2012. The Education and Training Directorate was responsible for the delivery of the actual results relating to the childcare services and regulation function from 10 November 2012 to 30 June 2013.
Explanation of Material Variances
1. The variance to target is mainly due to some Early Intervention programs that were previously reported in this output now incorporated into the Child and Family Centre programs and included in Output 2.1.
2. One of the significant changes arising from the implementation of the National Quality Standards has been the commencement of quality assessment and rating of education and care services against nationally agreed standards. This change involved moving from a licensing to a regulatory function with a focus on a more rigorous assessment of each service. In addition preschools are now included in the Framework and subject to external regulation.
It is likely that adjusting to the new Standards may have been a factor in the lower satisfaction rate from education and care service providers.
3. The result below target for the cost per visit to licensed education and care services is due to lower costs during the period from 1 July 2012 to 9 November 2012. This reflects recruitment action that was not commenced until the second quarter of the financial year.

Community Services Directorate Statement of Performance
For the Year Ended 30 June 2013
Output Class 3 – Community Development and Policy
Output 3.1 – Community Services
Description
Provision of a variety of community support and development activities, including administration of a range of concessions and benefits to low income earners and management of community facilities.
Accountability Indicators 1 Original Target
2012–13
Actual Result
2012–13 Variance
% Notes
Total Cost ($’000) 16,927 16,125 (5) 1
Government Payment for Outputs ($’000) 11,848 10,909 (8) 2
a. Number of partnership forums with the community. 16 17 6 3
The Joint Community Government Reference Group, the Community Recovery Sub-Committee, Community Services Program Forums and the Regional Community Services Forums are held to foster strategic partnerships to improve sector viability in the ACT.
b. Number of Community Capacity Building projects supported.
15 23 53 4
Number of grants allocated to assist community organisations to strengthen capacity, sustainability and address disadvantage in the community.
c. Number of visits to community service organisations. 26 28 8 5
The number of funded service organisations visited during the financial year.
d. Tenant satisfaction with management of community facilities as measured by annual survey.
80% 69% (14) 6
The annual survey measures the standard of service and assistance Community Facility Managers receive from the Directorate.
e. Funded organisations’ satisfaction with government contract administration (as measured by annual survey).
85% 95% 12 7
Measures the extent to which non-government entities that administer and provide services contracted by the government are satisfied with the way their contracts are administered, including management of contract compliance through monitoring contractual requirements and service delivery quality, disbursement of contract payments and offering advice and support to service providers.
f. Cost per head of population. $46.13 $43.94 (5) 8
The above Statement of Performance should be read in conjunction with the accompanying notes.
1 Under the Financial Management (Statement of Performance Scrutiny) Guidelines 2011, the accountability
indicators are reviewed by the ACT Auditor–General’s Office.

Community Services Directorate Statement of Performance
For the Year Ended 30 June 2013
Explanation of Material Variances
1. The variance from target is mainly due to depreciation expense being lower than budgeted as a result of revaluation and the useful life of facilities.
2. The variance below target is mainly due to a number of programs not commencing as expected. Funding for these programs has been rollover over from 2012-13 into 2013-14.
3. An additional meeting for the Joint Community Government Reference Group was held in the second quarter of 2012-13.
4. The number of grants is variable depending on funding requested by applicants. In 2012–13, more grants of a lower dollar value were provided to community organisations.
5. Additional service visits to community service organisations were conducted in the first and fourth quarters to consult on sector reforms.
6. There were significant changes to reporting and billing processes during the year that impacted tenants in the community facilities that may have contributed to the results of the survey. The Directorate has supported tenants through these changes which are now operating smoothly.
7. Comments received indicated that the majority of non–government organisations were ‘very satisfied’ or ‘satisfied’ with the service and assistance provided by the Directorate.
8. The lower cost per head of population is due to lower overall cost for the output (see note 1).
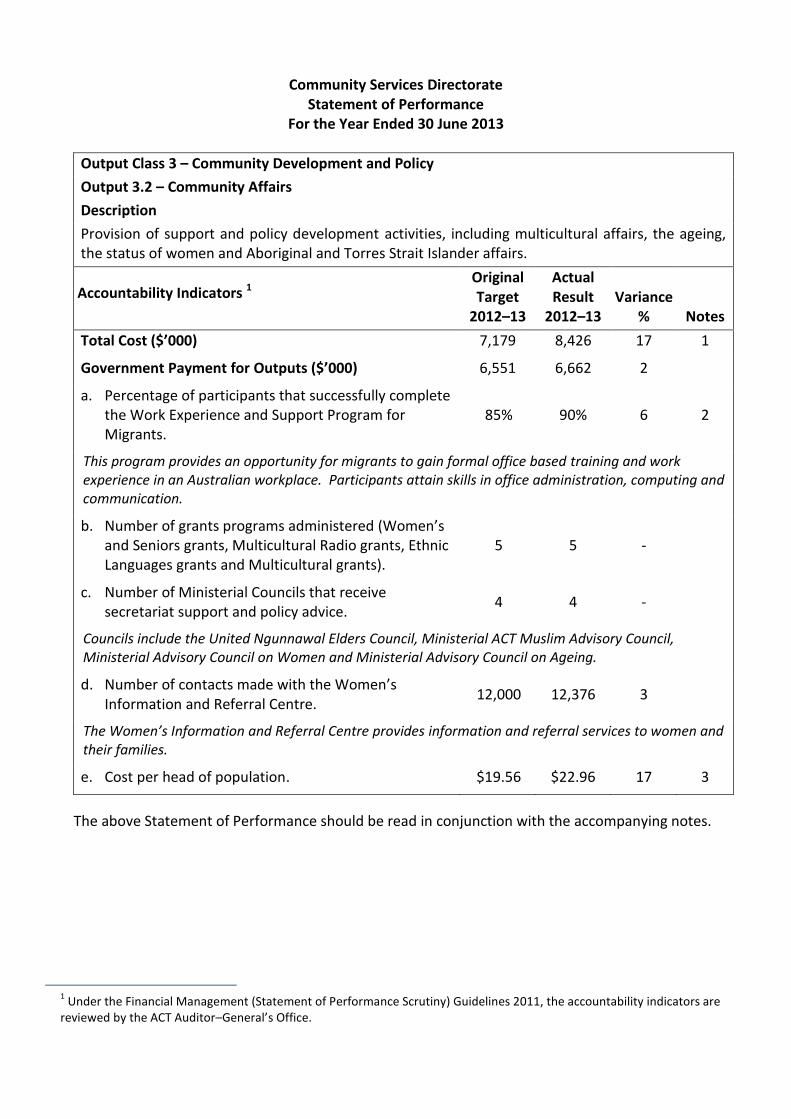
Community Services Directorate Statement of Performance
For the Year Ended 30 June 2013
Output Class 3 – Community Development and Policy
Output 3.2 – Community Affairs
Description
Provision of support and policy development activities, including multicultural affairs, the ageing, the status of women and Aboriginal and Torres Strait Islander affairs.
Accountability Indicators 1 Original Target
2012–13
Actual Result
2012–13 Variance
% Notes
Total Cost ($’000) 7,179 8,426 17 1
Government Payment for Outputs ($’000) 6,551 6,662 2
a. Percentage of participants that successfully complete the Work Experience and Support Program for Migrants.
85% 90% 6 2
This program provides an opportunity for migrants to gain formal office based training and work experience in an Australian workplace. Participants attain skills in office administration, computing and communication.
b. Number of grants programs administered (Women’s and Seniors grants, Multicultural Radio grants, Ethnic Languages grants and Multicultural grants).
5 5 -
c. Number of Ministerial Councils that receive secretariat support and policy advice.
4 4 -
Councils include the United Ngunnawal Elders Council, Ministerial ACT Muslim Advisory Council, Ministerial Advisory Council on Women and Ministerial Advisory Council on Ageing.
d. Number of contacts made with the Women’s Information and Referral Centre.
12,000 12,376 3
The Women’s Information and Referral Centre provides information and referral services to women and their families.
e. Cost per head of population. $19.56 $22.96 17 3
The above Statement of Performance should be read in conjunction with the accompanying notes.
1 Under the Financial Management (Statement of Performance Scrutiny) Guidelines 2011, the accountability indicators are
reviewed by the ACT Auditor–General’s Office.
Community Services Directorate Statement of Performance
For the Year Ended 30 June 2013
Explanation of Material Variances
1. The variance from target is mainly due to additional revenues from sponsorships of the National Multicultural Festival which resulted in an expanded budget and associated costs.
2. The actual result above target reflects the high level of engagement of participants and supervisors through the training and work placement components of the Program. The Program continues to evolve to meet the needs of each individual cohort and promotes excellence.
3. The higher cost per head of population is due to the higher overall cost for the output (see note 1)
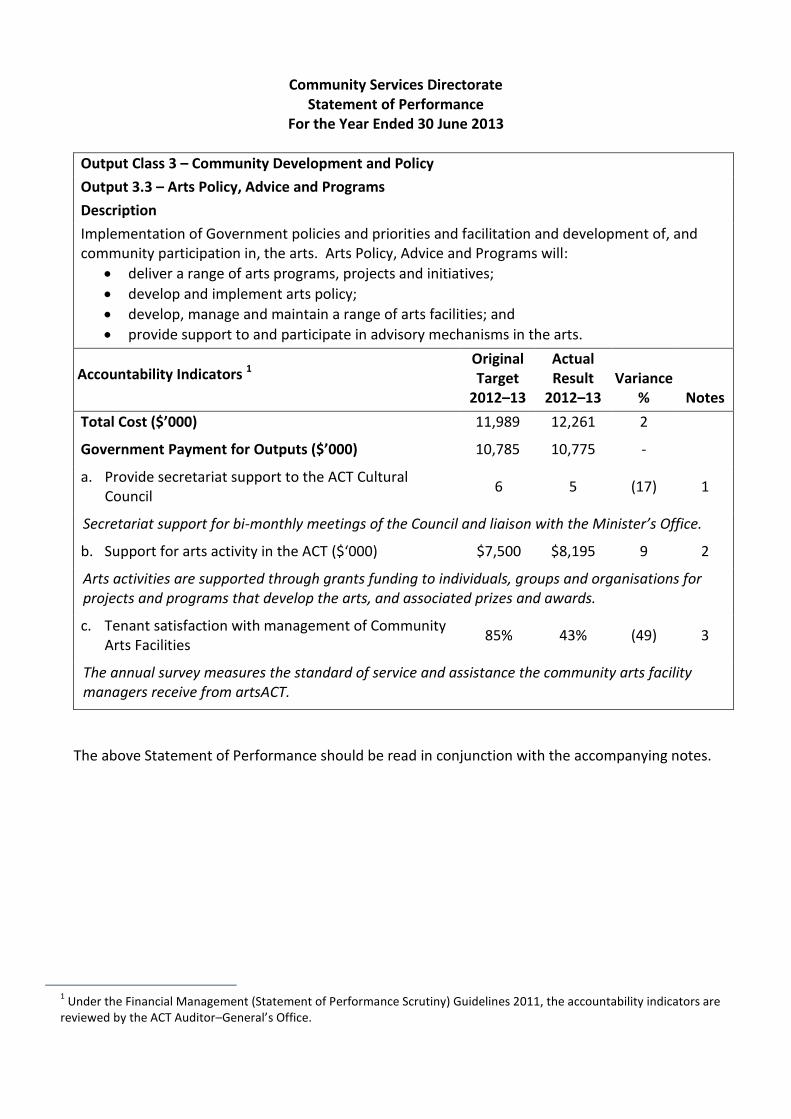
Community Services Directorate Statement of Performance
For the Year Ended 30 June 2013
Output Class 3 – Community Development and Policy
Output 3.3 – Arts Policy, Advice and Programs
Description
Implementation of Government policies and priorities and facilitation and development of, and community participation in, the arts. Arts Policy, Advice and Programs will:
deliver a range of arts programs, projects and initiatives;
develop and implement arts policy;
develop, manage and maintain a range of arts facilities; and
provide support to and participate in advisory mechanisms in the arts.
Accountability Indicators 1 Original Target
2012–13
Actual Result
2012–13 Variance
% Notes
Total Cost ($’000) 11,989 12,261 2
Government Payment for Outputs ($’000) 10,785 10,775 -
a. Provide secretariat support to the ACT Cultural Council
6 5 (17) 1
Secretariat support for bi-monthly meetings of the Council and liaison with the Minister’s Office.
b. Support for arts activity in the ACT ($‘000) $7,500 $8,195 9 2
Arts activities are supported through grants funding to individuals, groups and organisations for projects and programs that develop the arts, and associated prizes and awards.
c. Tenant satisfaction with management of Community Arts Facilities
85% 43% (49) 3
The annual survey measures the standard of service and assistance the community arts facility managers receive from artsACT.
The above Statement of Performance should be read in conjunction with the accompanying notes.
1 Under the Financial Management (Statement of Performance Scrutiny) Guidelines 2011, the accountability indicators are
reviewed by the ACT Auditor–General’s Office.
Community Services Directorate Statement of Performance
For the Year Ended 30 June 2013
Explanation of Material Variances
1. The year to date result is less than the target due to the ACT Cultural Council being wound up in March 2013. The Cultural Council will be replaced by a new ministerial advisory mechanism through the establishment of issue specific expert groups as required.
2. The variance above target due to funding to an organisation now being included in the actual result.
3. Tenant satisfaction for the arts facilities was conducted for the first time in 2012-13. Tenants were satisfied with the service and assistance provided by the Directorate, in particular the responsiveness to queries that were dealt with in a timely manner. A large proportion of the tenants surveyed indicated that they were neither satisfied nor dissatisfied with the level of service provided.

Community Services Directorate Statement of Performance
For the Year Ended 30 June 2013
Output Class 4 – Children, Youth and Family Services
Output 4.1 – Youth Services
Description
Provision of support services to young people at risk and support and supervision of young offenders.
Accountability Indicators 1 Original Target
2012–13
Actual Result
2012–13 Variance
% Notes
Total Cost ($’000) 25,792 25,638 -
Government Payment for Outputs ($’000) 24,075 24,169 -
a. Number of custody days used annually. 8,000 6,525 (18) 1
The number of days served in custody by a young person.
b. Number of Community Youth Justice clients. 315 233 (26) 2
Includes clients supervised on a community based justice order, clients for whom a court ordered report is requested and clients supported on a voluntary basis.
c. Number of individual clients supported by the Turnaround Program.
38 28 (26) 3
Turnaround is a program providing integrated support to young people aged between 12 to18 years requiring intensive support.
d. Number of children or young people receiving targeted intervention services through the Adolescent Day Unit and Youth Connection Service.
116 92 (21) 4
The Adolescent Day Unit supports young people aged 12–15 years to work towards returning to school or vocational education programs. Youth Connections works with young people who are at risk of leaving school early.
e. Average cost per Youth Services client. $21,835 $26,630 22 5
The above Statement of Performance should be read in conjunction with the accompanying notes.
1 Under the Financial Management (Statement of Performance Scrutiny) Guidelines 2011, the accountability indicators are
reviewed by the ACT Auditor–General’s Office.
Community Services Directorate Statement of Performance
For the Year Ended 30 June 2013
Explanation of Material Variances
1. The lower number of custody days may be attributed to a greater emphasis in the ACT on diverting young people from the youth justice system including the introduction of the After Hours Bail Support Service which diverts young people from custody.
2. The lower number of clients being referred to and supported may be attributed to a greater emphasis in the ACT on diverting young people from the youth justice system and in turn the lower number of young people being referred to Youth Justice Case Management.
3. The number of individual clients supported by the Turnaround Program and length of time spent in the program is demand driven. These factors impact on the overall number of young people accessing the program.
4. The lower number of clients is due to the Adolescent Day Unit no longer being operational. Service delivery options are currently being remodelled.
5. The higher average cost per client is mainly due to a lower number of clients requiring Youth Services throughout the year.
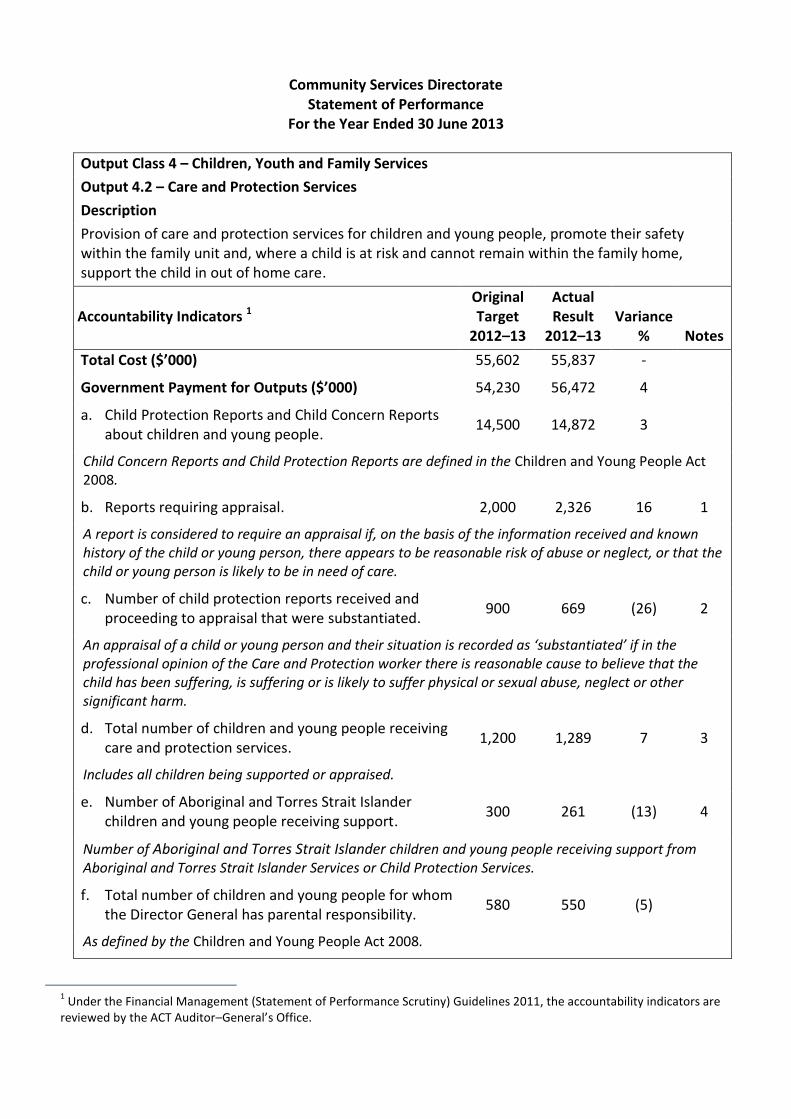
Community Services Directorate Statement of Performance
For the Year Ended 30 June 2013
Output Class 4 – Children, Youth and Family Services
Output 4.2 – Care and Protection Services
Description
Provision of care and protection services for children and young people, promote their safety within the family unit and, where a child is at risk and cannot remain within the family home, support the child in out of home care.
Accountability Indicators 1 Original Target
2012–13
Actual Result
2012–13 Variance
% Notes
Total Cost ($’000) 55,602 55,837 -
Government Payment for Outputs ($’000) 54,230 56,472 4
a. Child Protection Reports and Child Concern Reports about children and young people.
14,500 14,872 3
Child Concern Reports and Child Protection Reports are defined in the Children and Young People Act 2008.
b. Reports requiring appraisal. 2,000 2,326 16 1
A report is considered to require an appraisal if, on the basis of the information received and known history of the child or young person, there appears to be reasonable risk of abuse or neglect, or that the child or young person is likely to be in need of care.
c. Number of child protection reports received and proceeding to appraisal that were substantiated.
900 669 (26) 2
!n appraisal of a child or young person and their situation is recorded as ‘substantiated’ if in the professional opinion of the Care and Protection worker there is reasonable cause to believe that the child has been suffering, is suffering or is likely to suffer physical or sexual abuse, neglect or other significant harm.
d. Total number of children and young people receiving care and protection services.
1,200 1,289 7 3
Includes all children being supported or appraised.
e. Number of Aboriginal and Torres Strait Islander children and young people receiving support.
300 261 (13) 4
Number of Aboriginal and Torres Strait Islander children and young people receiving support from Aboriginal and Torres Strait Islander Services or Child Protection Services.
f. Total number of children and young people for whom the Director General has parental responsibility.
580 550 (5)
As defined by the Children and Young People Act 2008.
1 Under the Financial Management (Statement of Performance Scrutiny) Guidelines 2011, the accountability indicators are
reviewed by the ACT Auditor–General’s Office.
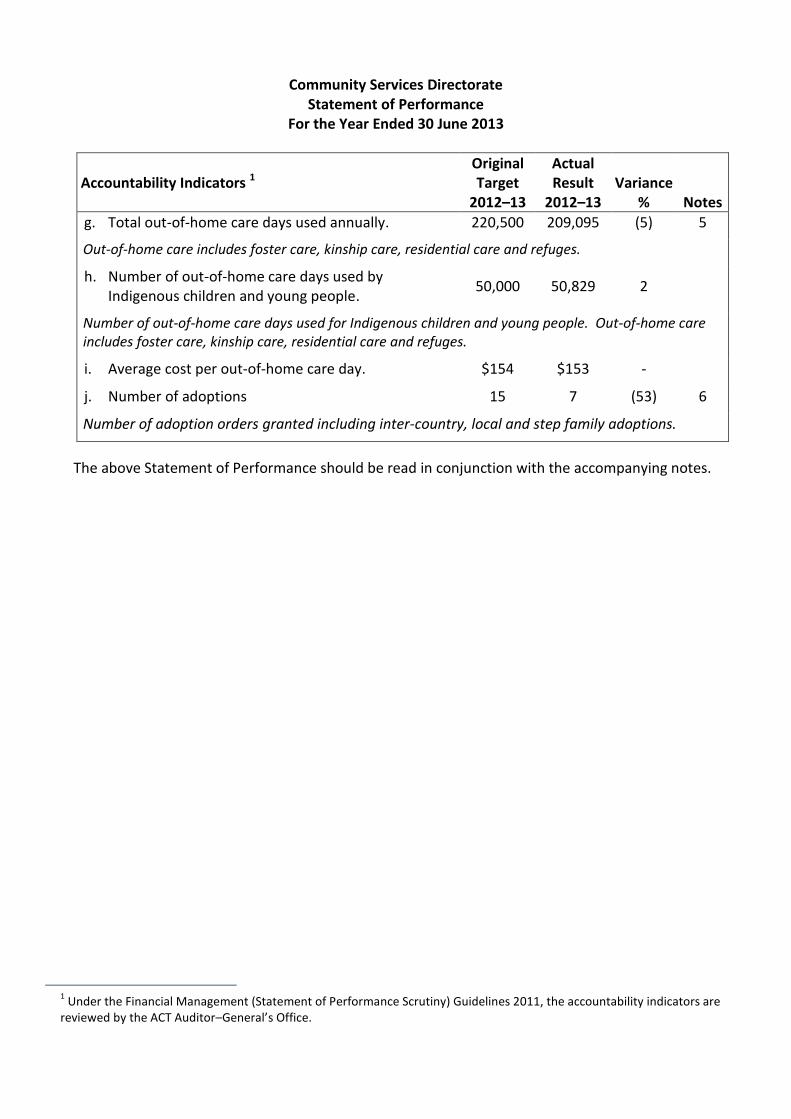
Community Services Directorate Statement of Performance
For the Year Ended 30 June 2013
Accountability Indicators 1 Original Target
2012–13
Actual Result
2012–13 Variance
% Notes
g. Total out-of-home care days used annually. 220,500 209,095 (5) 5
Out-of-home care includes foster care, kinship care, residential care and refuges.
h. Number of out-of-home care days used by Indigenous children and young people.
50,000 50,829 2
Number of out-of-home care days used for Indigenous children and young people. Out-of-home care includes foster care, kinship care, residential care and refuges.
i. Average cost per out-of-home care day. $154 $153 -
j. Number of adoptions 15 7 (53) 6
Number of adoption orders granted including inter-country, local and step family adoptions.
The above Statement of Performance should be read in conjunction with the accompanying notes.
1 Under the Financial Management (Statement of Performance Scrutiny) Guidelines 2011, the accountability indicators are
reviewed by the ACT Auditor–General’s Office.

Community Services Directorate Statement of Performance
For the Year Ended 30 June 2013
Explanation of Material Variances
1. The number of Reports proceeding to appraisal can fluctuate depending on the number of reports received and the individual issues identified for a particular child, young person or family. In 2012-13, more reports were assessed as Child Protection Reports requiring appraisal than predicted based on prior year’s trends.
2. The number of Reports substantiated can fluctuate depending on the result of the appraisal for each child or young person. The number of substantiations is currently under target, but this is expected to change over time with the completion of appraisals currently in progress.
3. The number of individual children and young people receiving appraisal, support or ongoing casework from Care and Protection Services can fluctuate daily depending on the changing needs of children, young people and families. The actual result was slightly above target indicating an increase in current community demand.
4. The number of Aboriginal and Torres Strait Islander children and young people receiving appraisal, support or ongoing casework from Care and Protection Services and/or Aboriginal and Torres Strait Islander Services can fluctuate on a daily basis. The result below target reflects the active focus on early intervention services.
5. The number of care days used is based on placement of children in overnight care where the Office for Children, Youth and Family Support make a payment. The impact of programs such as Child Protection Case Conferencing may have contributed to the variance from target.
6. The timing of placement of children from overseas has been increasingly delayed due to much longer timeframes being experienced in the matching of children with Australian families. The 2010 Amendments to the ACT Adoption Act 1993 has also decreased the number of step parent adoption applications as approval of the Family Court is required prior to a step parent adoption matter being finalised. These two significant factors have resulted in fewer orders being granted.

BSECTION
ANALYSIS OF FINANCIAL PERFORMANCE—HOUSING ACT


SECTION B ANALYSIS OF FINANCIAL PERFORMANCE — HOUSING ACT 155
B. Analysis of Financial Performance—Housing ACT
B.1 Management Discussion and Analysis
General Overview
Objectives
Housing ACT’s principal objective is to provide safe, affordable and appropriate housing and the support and assistance to alleviate and address homelessness and housing for some of the most disadvantaged in the community.
Housing assistance primarily occurs through the provision of housing for rent and a rental subsidy to eligible public housing tenants. Housing ACT also funds homelessness services to provide support and assistance to homeless families or those at risk of becoming homeless, to address the individual needs and circumstances of homeless people and provide them with the capability to secure and sustain long term housing.
Risk Management
Operational risk – Housing ACT faces those risks typically experienced by a human services agency. Most significant are the risks associated with:
> Providing services to disadvantaged clients with high and complex needs;
> Building and maintaining skills and workforce capacity, particularly in areas where staff turnover has traditionally been high. This includes having measures in place to recruit and retain staff, and provide appropriate training;
> Managing properties for the delivery of services to high and complex need clients and in particular, addressing the larger multi-unit complexes to reduce the effects of concentrating disadvantage in these areas; and
> Managing the business management information system (Homenet).
Financial risk – Costs continue to increase faster than revenues: Managing costs to maintain positive cash flows from operations has become more challenging, as general rates, utilities and other property costs as well as employee costs increase substantially more than the Consumer Price Index (CPI), and therefore the growth in rental revenues.
Rental receipts are the major source of growing revenues but rental receipts are capped, being dependent upon the indexing of pensions and other benefits based upon increases in the CPI. Therefore, increases in market rent do not substantially increase rental revenues: Increases in market rent simply result in higher rental rebates, as current policy requires tenants pay no more than 25% of assessable household income as rent, and over 92% of tenants are in receipt of a rental rebate.
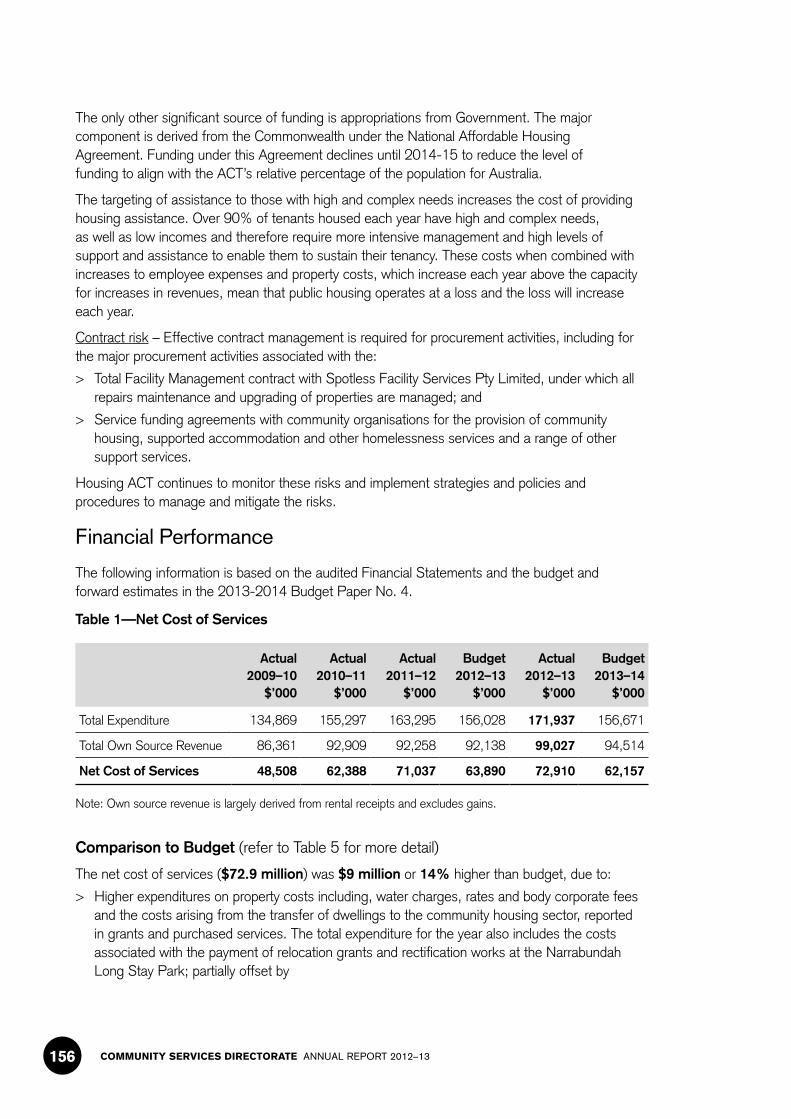
COMMUNITY SERVICES DIRECTORATE ANNUAL REPORT 2012–13156
The only other significant source of funding is appropriations from Government. The major component is derived from the Commonwealth under the National Affordable Housing Agreement. Funding under this Agreement declines until 2014-15 to reduce the level of funding to align with the ACT’s relative percentage of the population for Australia.
The targeting of assistance to those with high and complex needs increases the cost of providing housing assistance. Over 90% of tenants housed each year have high and complex needs, as well as low incomes and therefore require more intensive management and high levels of support and assistance to enable them to sustain their tenancy. These costs when combined with increases to employee expenses and property costs, which increase each year above the capacity for increases in revenues, mean that public housing operates at a loss and the loss will increase each year.
Contract risk – Effective contract management is required for procurement activities, including for the major procurement activities associated with the:
> Total Facility Management contract with Spotless Facility Services Pty Limited, under which all repairs maintenance and upgrading of properties are managed; and
> Service funding agreements with community organisations for the provision of community housing, supported accommodation and other homelessness services and a range of other support services.
Housing ACT continues to monitor these risks and implement strategies and policies and procedures to manage and mitigate the risks.
Financial Performance
The following information is based on the audited Financial Statements and the budget and forward estimates in the 2013-2014 Budget Paper No. 4.
Table 1—Net Cost of Services
Actual 2009–10
$’000
Actual 2010–11
$’000
Actual 2011–12
$’000
Budget 2012–13
$’000
Actual 2012–13
$’000
Budget 2013–14
$’000
Total Expenditure 134,869 155,297 163,295 156,028 171,937 156,671
Total Own Source Revenue 86,361 92,909 92,258 92,138 99,027 94,514
Net Cost of Services 48,508 62,388 71,037 63,890 72,910 62,157
Note: Own source revenue is largely derived from rental receipts and excludes gains.
Comparison to Budget (refer to Table 5 for more detail)
The net cost of services ($72.9 million) was $9 million or 14% higher than budget, due to:
> Higher expenditures on property costs including, water charges, rates and body corporate fees and the costs arising from the transfer of dwellings to the community housing sector, reported in grants and purchased services. The total expenditure for the year also includes the costs associated with the payment of relocation grants and rectification works at the Narrabundah Long Stay Park; partially offset by
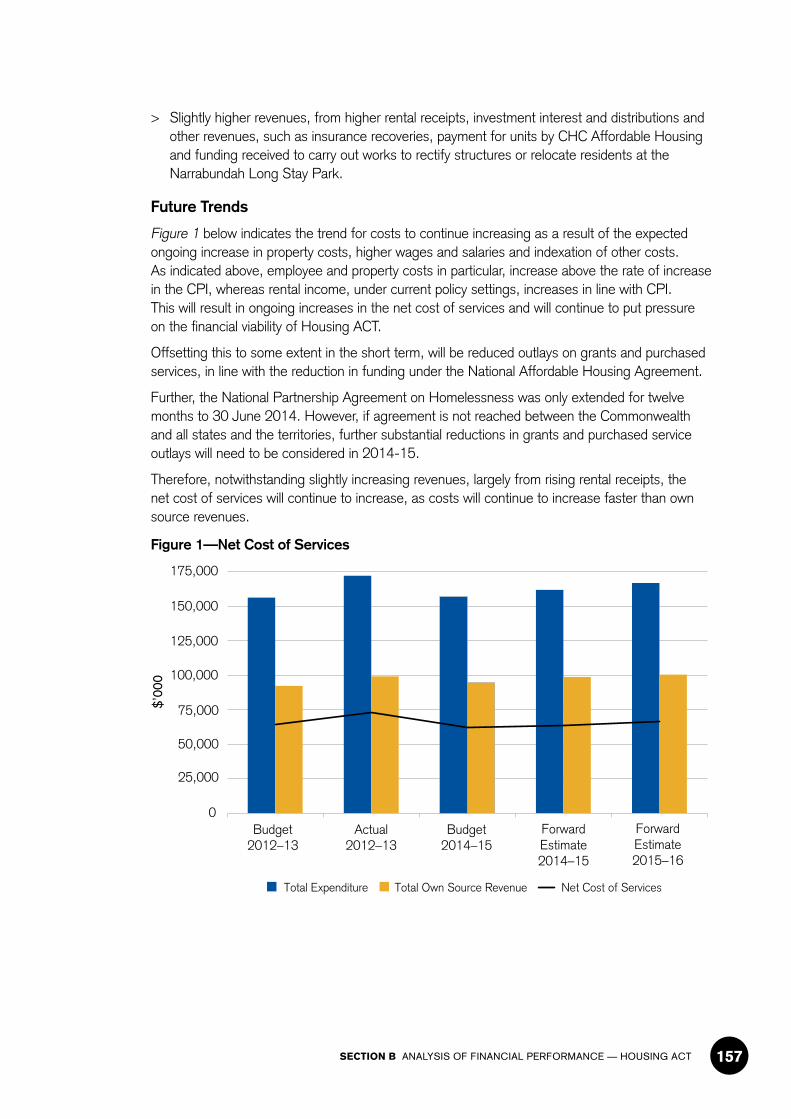
SECTION B ANALYSIS OF FINANCIAL PERFORMANCE — HOUSING ACT 157
> Slightly higher revenues, from higher rental receipts, investment interest and distributions and other revenues, such as insurance recoveries, payment for units by CHC Affordable Housing and funding received to carry out works to rectify structures or relocate residents at the Narrabundah Long Stay Park.
Future Trends
Figure 1 below indicates the trend for costs to continue increasing as a result of the expected ongoing increase in property costs, higher wages and salaries and indexation of other costs. As indicated above, employee and property costs in particular, increase above the rate of increase in the CPI, whereas rental income, under current policy settings, increases in line with CPI. This will result in ongoing increases in the net cost of services and will continue to put pressure on the financial viability of Housing ACT.
Offsetting this to some extent in the short term, will be reduced outlays on grants and purchased services, in line with the reduction in funding under the National Affordable Housing Agreement.
Further, the National Partnership Agreement on Homelessness was only extended for twelve months to 30 June 2014. However, if agreement is not reached between the Commonwealth and all states and the territories, further substantial reductions in grants and purchased service outlays will need to be considered in 2014-15.
Therefore, notwithstanding slightly increasing revenues, largely from rising rental receipts, the net cost of services will continue to increase, as costs will continue to increase faster than own source revenues.
Figure 1—Net Cost of Services
$’00
0
Budget2012–13
Actual2012–13
Budget2014–15
ForwardEstimate2015–16
ForwardEstimate2014–15
Total Expenditure Total Own Source Revenue Net Cost of Services
0
25,000
50,000
75,000
100,000
125,000
150,000
175,000
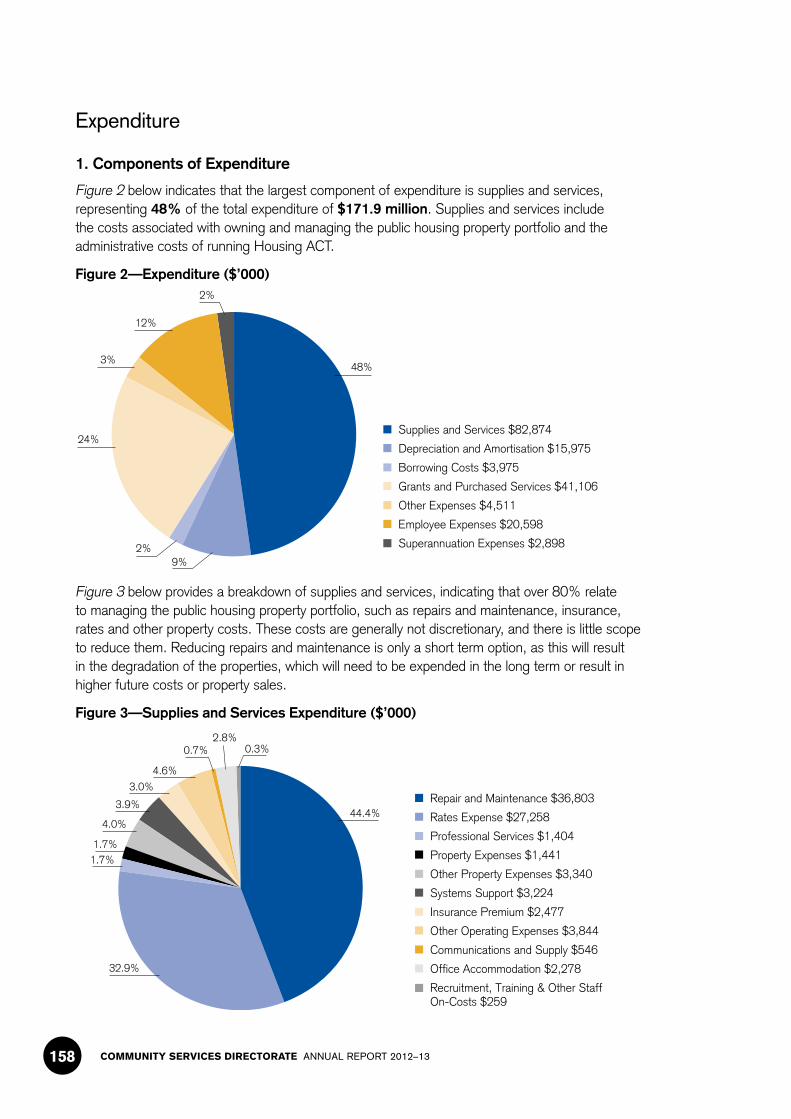
COMMUNITY SERVICES DIRECTORATE ANNUAL REPORT 2012–13158
Expenditure
1. Components of Expenditure
Figure 2 below indicates that the largest component of expenditure is supplies and services, representing 48% of the total expenditure of $171.9 million. Supplies and services include the costs associated with owning and managing the public housing property portfolio and the administrative costs of running Housing ACT.
Figure 2—Expenditure ($’000)
Supplies and Services $82,874
Depreciation and Amortisation $15,975
Borrowing Costs $3,975
Grants and Purchased Services $41,106
Other Expenses $4,511
Employee Expenses $20,598
Superannuation Expenses $2,898
48%
9%2%
12%
2%
3%
24%
Figure 3 below provides a breakdown of supplies and services, indicating that over 80% relate to managing the public housing property portfolio, such as repairs and maintenance, insurance, rates and other property costs. These costs are generally not discretionary, and there is little scope to reduce them. Reducing repairs and maintenance is only a short term option, as this will result in the degradation of the properties, which will need to be expended in the long term or result in higher future costs or property sales.
Figure 3—Supplies and Services Expenditure ($’000)
Repair and Maintenance $36,803
Rates Expense $27,258
Professional Services $1,404
Property Expenses $1,441
Other Property Expenses $3,340
Systems Support $3,224
Insurance Premium $2,477
Other Operating Expenses $3,844
Communications and Supply $546
Office Accommodation $2,278
Recruitment, Training & Other StaffOn-Costs $259
44.4%
32.9%
4.6%
3.0%
3.9%
4.0%
1.7%1.7%
0.7% 0.3%2.8%

SECTION B ANALYSIS OF FINANCIAL PERFORMANCE — HOUSING ACT 159
2. Comparison to Budget
The total expenditure of $171.9 million is $15.9 million (10%) above the budget of $156 million.
Table 2—Total Expenditure1
$m
Budget1 156.0
Less: Actual Expenditure 171.9
Variance to be Explained1 15.9
The $15.9 million above budget expenditure predominantly relates to higher:
> Grants and purchased services ($15.3 million) - due to the transfer of dwellings to community housing, as agreed during the negotiations with the Commonwealth under the Nation Building and Jobs Plan Economic Stimulus Initiative;
> Supplies and services ($1.8 million) - due largely to higher property costs, including, general rates, water rates and charges and body corporate costs; and
> Other expenses ($0.7 million) - due largely to the demolition and write-off of properties for redevelopment and claims for compensation for loss or damage, including personal injury claims; partially offset by.
> Lower depreciation and amortisation costs ($1.7 million) - due to the lower than expected increase in the property values from the 2012 valuation and the delay in the upgrade of Homenet to version 6.
3. Future Trends
Expenditures are expected to continue to trend higher at a faster rate than CPI: Wage outcomes agreed under the Enterprise Agreement are generally higher than CPI, and the increase in general rates, sewerage and water costs are also expected to continue to increase significantly above the increase in the CPI. In particular, with the changes to the general rates under the taxation reforms announced in the 2012-13 Budget: A fairer, simpler and more efficient taxation system, the general rates are expected to increase significantly each year to meet the loss of stamp duty revenues to the ACT Budget. Other property related costs are also expected to increase above the rate of normal indexation, such as insurance premiums, body corporate fees and utility costs.
Other costs are generally indexed in line with movements in the CPI.
Expenditure on service purchasing and grants will decline in the short term due to the reduction in funding under the National Affordable Housing Agreement flowing through to lower funding to the homelessness sector. Outlays will need to be reviewed once the continuation of the funding under the National Partnership Agreement on Homelessness is known. However, there will continue to be some level of cross subsidisation from public housing operations for homelessness services, at least in the short term.
Borrowing costs however, will continue to decline in line with the repayment of the Commonwealth loans.
1 Refer to Table 5

COMMUNITY SERVICES DIRECTORATE ANNUAL REPORT 2012–13160
Own Source Revenue
1. Components of Own Source Revenue
Figure 4 below shows that 90% of own source revenue, excluding profit on the sale of dwellings and other gains, was derived from rental receipts from tenants.
Figure 4—Own Source Revenue ($’000)
Rent $88,477
Interest and Distribution $2,260
Other Revenue $8,036
Resources Received Free of Charge $254
90%
0%
2%
8%
2. Comparison to Budget
Revenue
Excluding gains, total own source revenue was $99 million. This is $6.9 million higher than the budget of $92.1 million. The higher revenues are due to higher other revenues of $4.2 million as a result of the receipt of funding to carry out works at the Narrabundah Long Stay Park, the receipt of monies from the sale of units to Community Housing Canberra Limited and higher recoveries as a result of reimbursements for losses from insurable incidents during the year; higher rental receipts ($1.9 million); and interest receivable on the investment in the Lyons Estate Redevelopment Joint Venture and distributions on investments held with the Territory Banking Account ($0.5 million). In addition, revenues received free of charge of almost $0.3 million were received during the year, for legal work and advice provided by the Government Solicitor’s Office.
Gains
During the year Housing ACT derived gains on the sale of properties of $1.8 million. This was $0.7 million more than the budgeted amount of $1.1 million, due to the number of high value sales during the year.
Other gains of $0.4 million, arising from the increase in the value of investments held in the Territory Banking Account and the return of a property from the Affordable Rental Office to be used for public housing, were recognised during the year.
A loss ($0.1 million) occurred on the equity in investment properties sold under the Shared Equity Scheme, as a result of the slight decline in the underlying property values as assessed by the independent valuer as at 30 June 2013. This loss is reported in other expenses in the Operating Statement.
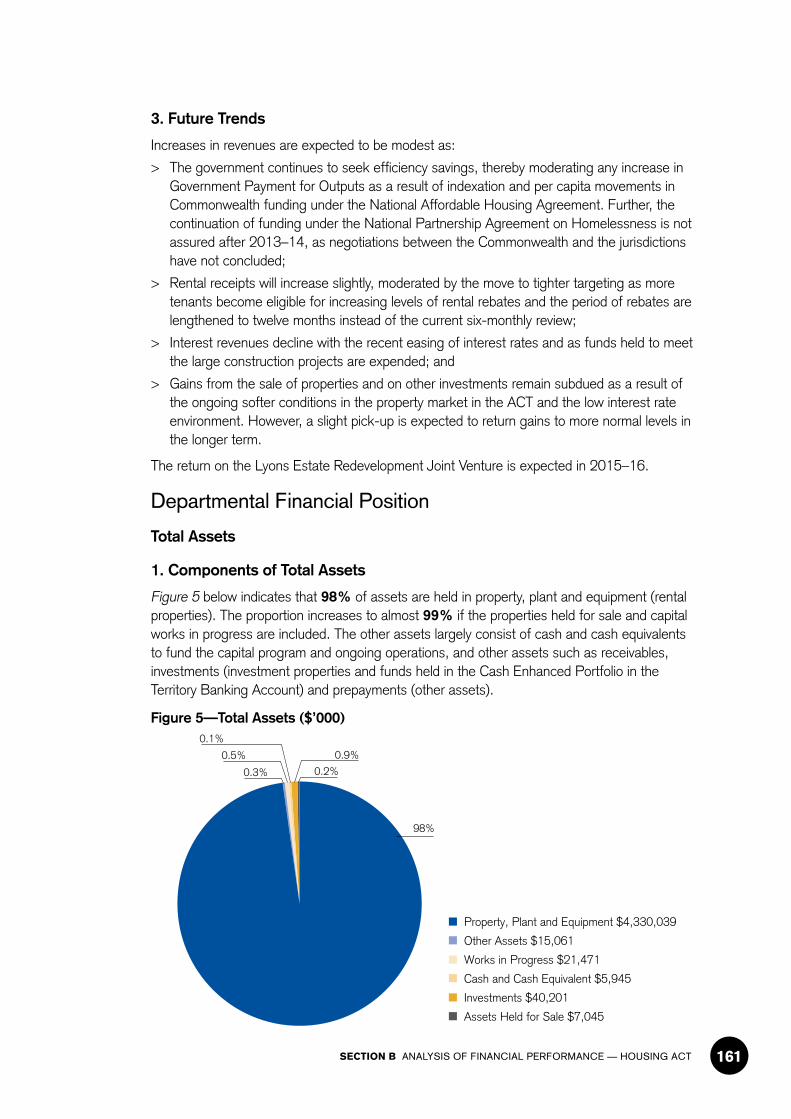
SECTION B ANALYSIS OF FINANCIAL PERFORMANCE — HOUSING ACT 161
3. Future Trends
Increases in revenues are expected to be modest as:
> The government continues to seek efficiency savings, thereby moderating any increase in Government Payment for Outputs as a result of indexation and per capita movements in Commonwealth funding under the National Affordable Housing Agreement. Further, the continuation of funding under the National Partnership Agreement on Homelessness is not assured after 2013–14, as negotiations between the Commonwealth and the jurisdictions have not concluded;
> Rental receipts will increase slightly, moderated by the move to tighter targeting as more tenants become eligible for increasing levels of rental rebates and the period of rebates are lengthened to twelve months instead of the current six-monthly review;
> Interest revenues decline with the recent easing of interest rates and as funds held to meet the large construction projects are expended; and
> Gains from the sale of properties and on other investments remain subdued as a result of the ongoing softer conditions in the property market in the ACT and the low interest rate environment. However, a slight pick-up is expected to return gains to more normal levels in the longer term.
The return on the Lyons Estate Redevelopment Joint Venture is expected in 2015–16.
Departmental Financial Position
Total Assets
1. Components of Total Assets
Figure 5 below indicates that 98% of assets are held in property, plant and equipment (rental properties). The proportion increases to almost 99% if the properties held for sale and capital works in progress are included. The other assets largely consist of cash and cash equivalents to fund the capital program and ongoing operations, and other assets such as receivables, investments (investment properties and funds held in the Cash Enhanced Portfolio in the Territory Banking Account) and prepayments (other assets).
Figure 5—Total Assets ($’000)
Property, Plant and Equipment $4,330,039
Other Assets $15,061
Works in Progress $21,471
Cash and Cash Equivalent $5,945
Investments $40,201
Assets Held for Sale $7,045
98%
0.3% 0.2%
0.5%
0.1%
0.9%
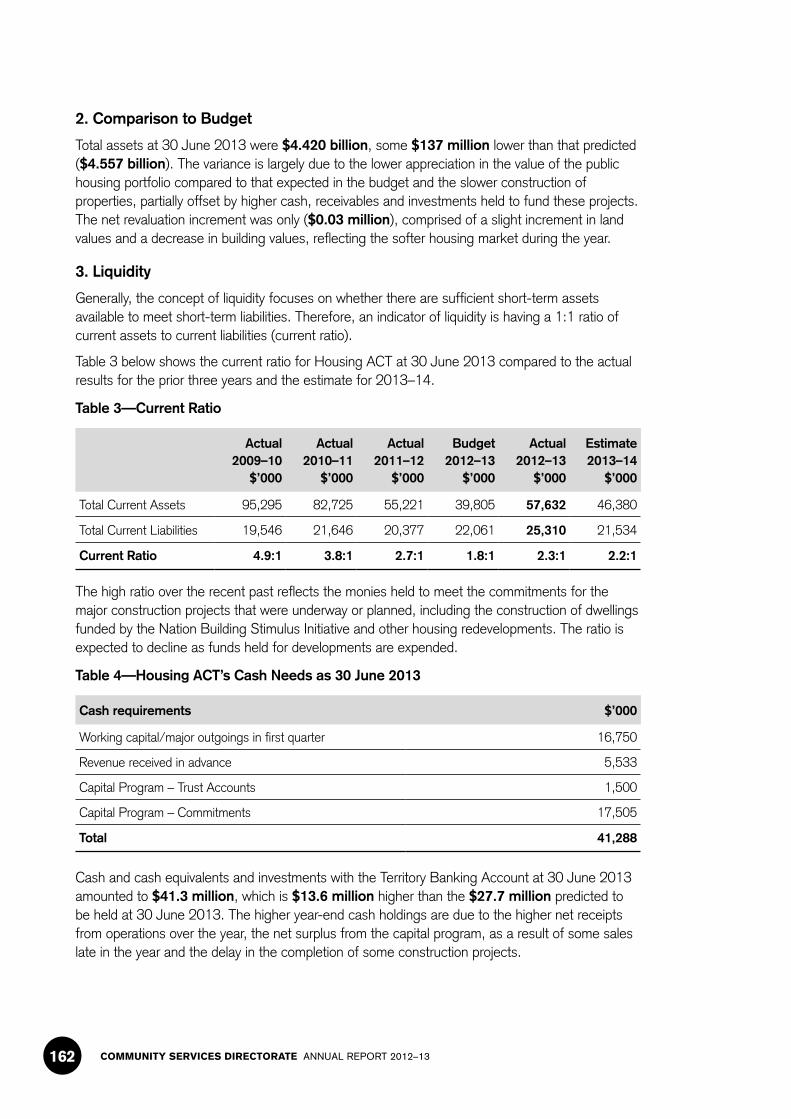
COMMUNITY SERVICES DIRECTORATE ANNUAL REPORT 2012–13162
2. Comparison to Budget
Total assets at 30 June 2013 were $4.420 billion, some $137 million lower than that predicted ($4.557 billion). The variance is largely due to the lower appreciation in the value of the public housing portfolio compared to that expected in the budget and the slower construction of properties, partially offset by higher cash, receivables and investments held to fund these projects. The net revaluation increment was only ($0.03 million), comprised of a slight increment in land values and a decrease in building values, reflecting the softer housing market during the year.
3. Liquidity
Generally, the concept of liquidity focuses on whether there are sufficient short-term assets available to meet short-term liabilities. Therefore, an indicator of liquidity is having a 1:1 ratio of current assets to current liabilities (current ratio).
Table 3 below shows the current ratio for Housing ACT at 30 June 2013 compared to the actual results for the prior three years and the estimate for 2013–14.
Table 3—Current Ratio
Actual2009–10
$’000
Actual 2010–11
$’000
Actual 2011–12
$’000
Budget 2012–13
$’000
Actual2012–13
$’000
Estimate2013–14
$’000
Total Current Assets 95,295 82,725 55,221 39,805 57,632 46,380
Total Current Liabilities 19,546 21,646 20,377 22,061 25,310 21,534
Current Ratio 4.9:1 3.8:1 2.7:1 1.8:1 2.3:1 2.2:1
The high ratio over the recent past reflects the monies held to meet the commitments for the major construction projects that were underway or planned, including the construction of dwellings funded by the Nation Building Stimulus Initiative and other housing redevelopments. The ratio is expected to decline as funds held for developments are expended.
Table 4—Housing ACT’s Cash Needs as 30 June 2013
Cash requirements $’000
Working capital/major outgoings in first quarter 16,750
Revenue received in advance 5,533
Capital Program – Trust Accounts 1,500
Capital Program – Commitments 17,505
Total 41,288
Cash and cash equivalents and investments with the Territory Banking Account at 30 June 2013 amounted to $41.3 million, which is $13.6 million higher than the $27.7 million predicted to be held at 30 June 2013. The higher year-end cash holdings are due to the higher net receipts from operations over the year, the net surplus from the capital program, as a result of some sales late in the year and the delay in the completion of some construction projects.
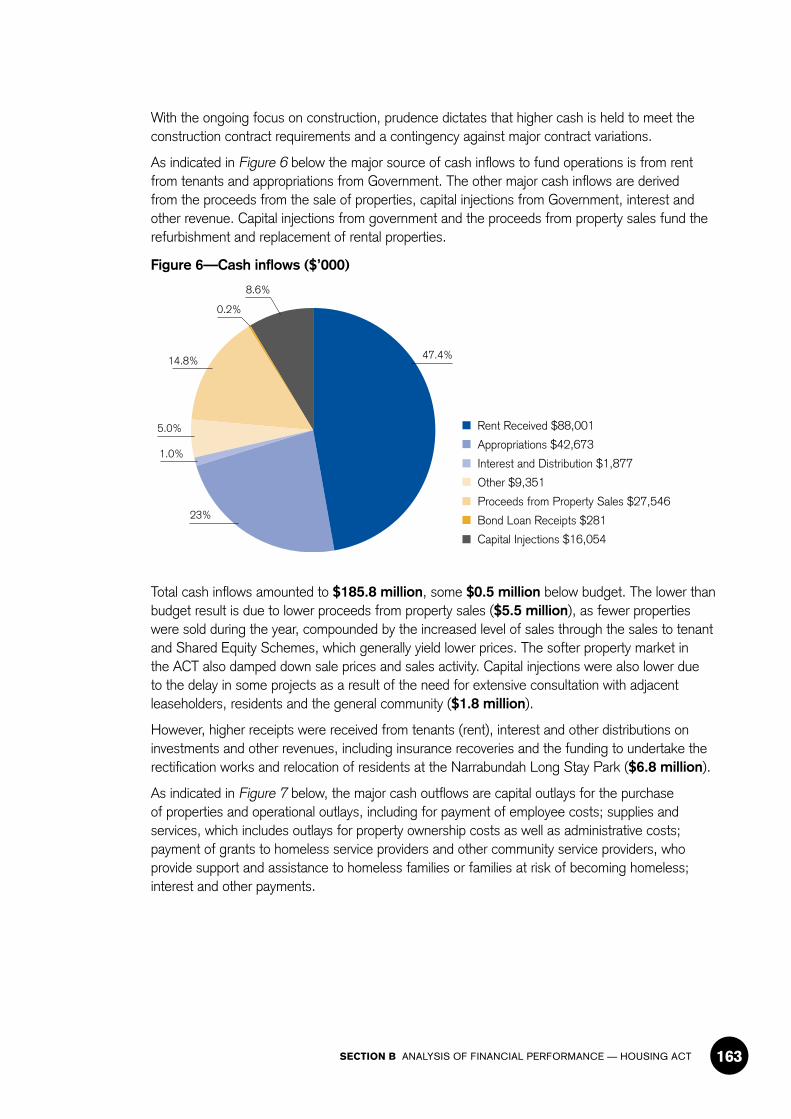
SECTION B ANALYSIS OF FINANCIAL PERFORMANCE — HOUSING ACT 163
With the ongoing focus on construction, prudence dictates that higher cash is held to meet the construction contract requirements and a contingency against major contract variations.
As indicated in Figure 6 below the major source of cash inflows to fund operations is from rent from tenants and appropriations from Government. The other major cash inflows are derived from the proceeds from the sale of properties, capital injections from Government, interest and other revenue. Capital injections from government and the proceeds from property sales fund the refurbishment and replacement of rental properties.
Figure 6—Cash inflows ($’000)
Rent Received $88,001
Appropriations $42,673
Interest and Distribution $1,877
Other $9,351
Proceeds from Property Sales $27,546
Bond Loan Receipts $281
Capital Injections $16,054
47.4%14.8%
0.2%
1.0%
5.0%
23%
8.6%
Total cash inflows amounted to $185.8 million, some $0.5 million below budget. The lower than budget result is due to lower proceeds from property sales ($5.5 million), as fewer properties were sold during the year, compounded by the increased level of sales through the sales to tenant and Shared Equity Schemes, which generally yield lower prices. The softer property market in the ACT also damped down sale prices and sales activity. Capital injections were also lower due to the delay in some projects as a result of the need for extensive consultation with adjacent leaseholders, residents and the general community ($1.8 million).
However, higher receipts were received from tenants (rent), interest and other distributions on investments and other revenues, including insurance recoveries and the funding to undertake the rectification works and relocation of residents at the Narrabundah Long Stay Park ($6.8 million).
As indicated in Figure 7 below, the major cash outflows are capital outlays for the purchase of properties and operational outlays, including for payment of employee costs; supplies and services, which includes outlays for property ownership costs as well as administrative costs; payment of grants to homeless service providers and other community service providers, who provide support and assistance to homeless families or families at risk of becoming homeless; interest and other payments.
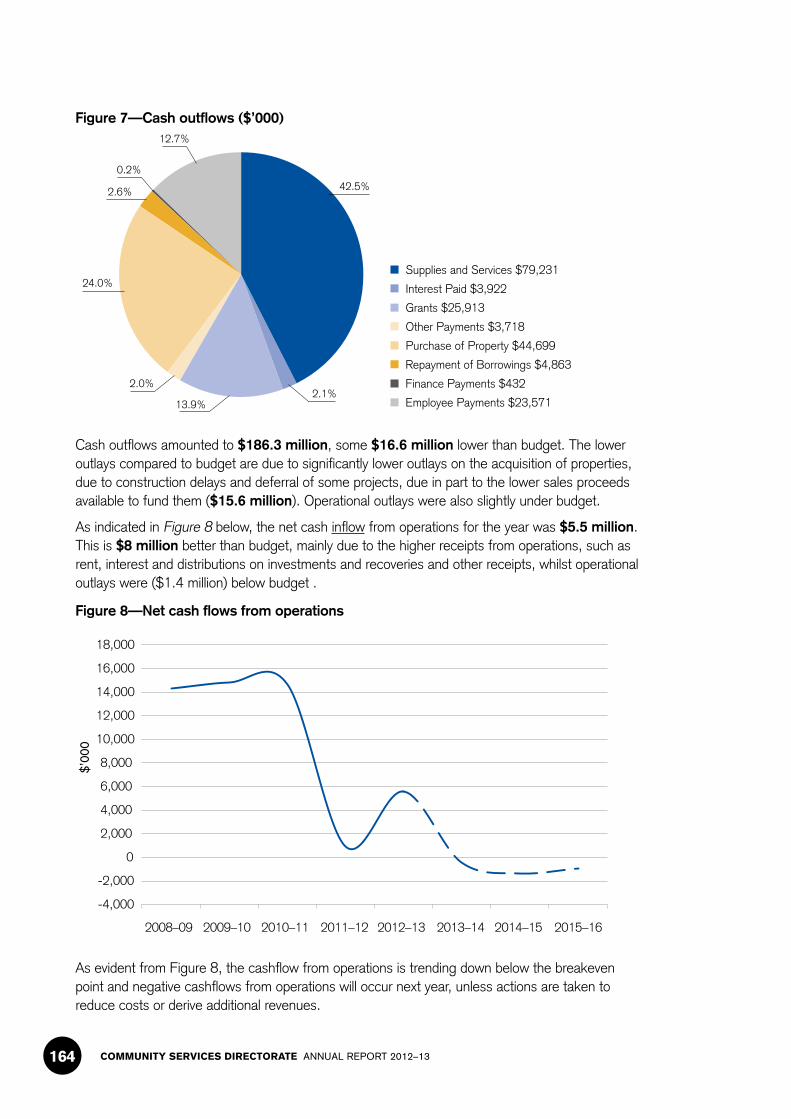
COMMUNITY SERVICES DIRECTORATE ANNUAL REPORT 2012–13164
Figure 7—Cash outflows ($’000)
Supplies and Services $79,231
Interest Paid $3,922
Grants $25,913
Other Payments $3,718
Purchase of Property $44,699
Repayment of Borrowings $4,863
Finance Payments $432
Employee Payments $23,571
42.5%
24.0%
0.2%
2.6%
12.7%
13.9%2.1%
2.0%
Cash outflows amounted to $186.3 million, some $16.6 million lower than budget. The lower outlays compared to budget are due to significantly lower outlays on the acquisition of properties, due to construction delays and deferral of some projects, due in part to the lower sales proceeds available to fund them ($15.6 million). Operational outlays were also slightly under budget.
As indicated in Figure 8 below, the net cash inflow from operations for the year was $5.5 million. This is $8 million better than budget, mainly due to the higher receipts from operations, such as rent, interest and distributions on investments and recoveries and other receipts, whilst operational outlays were ($1.4 million) below budget .
Figure 8—Net cash flows from operations
$’00
0
-4,000
-2,000
0
2,000
4,000
6,000
8,000
10,000
12,000
14,000
16,000
18,000
2008–09 2009–10 2010–11 2011–12 2012–13 2013–14 2014–15 2015–16
As evident from Figure 8, the cashflow from operations is trending down below the breakeven point and negative cashflows from operations will occur next year, unless actions are taken to reduce costs or derive additional revenues.
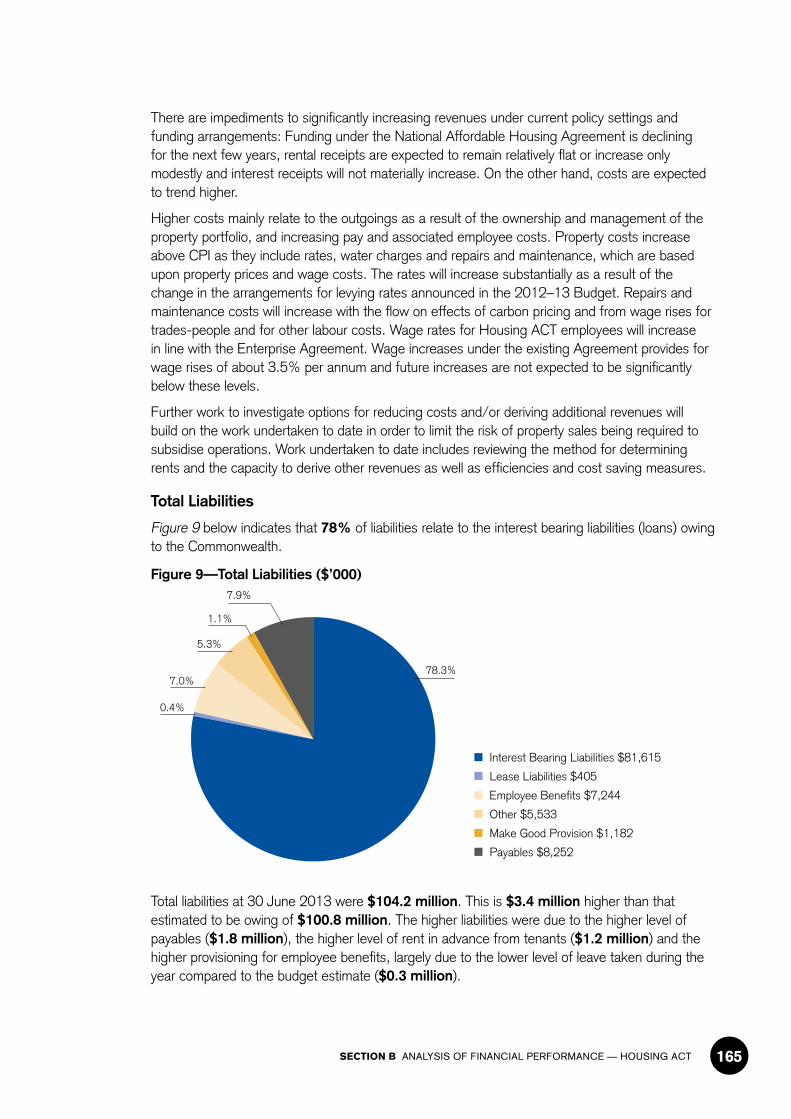
SECTION B ANALYSIS OF FINANCIAL PERFORMANCE — HOUSING ACT 165
There are impediments to significantly increasing revenues under current policy settings and funding arrangements: Funding under the National Affordable Housing Agreement is declining for the next few years, rental receipts are expected to remain relatively flat or increase only modestly and interest receipts will not materially increase. On the other hand, costs are expected to trend higher.
Higher costs mainly relate to the outgoings as a result of the ownership and management of the property portfolio, and increasing pay and associated employee costs. Property costs increase above CPI as they include rates, water charges and repairs and maintenance, which are based upon property prices and wage costs. The rates will increase substantially as a result of the change in the arrangements for levying rates announced in the 2012–13 Budget. Repairs and maintenance costs will increase with the flow on effects of carbon pricing and from wage rises for trades-people and for other labour costs. Wage rates for Housing ACT employees will increase in line with the Enterprise Agreement. Wage increases under the existing Agreement provides for wage rises of about 3.5% per annum and future increases are not expected to be significantly below these levels.
Further work to investigate options for reducing costs and/or deriving additional revenues will build on the work undertaken to date in order to limit the risk of property sales being required to subsidise operations. Work undertaken to date includes reviewing the method for determining rents and the capacity to derive other revenues as well as efficiencies and cost saving measures.
Total Liabilities
Figure 9 below indicates that 78% of liabilities relate to the interest bearing liabilities (loans) owing to the Commonwealth.
Figure 9—Total Liabilities ($’000)
Interest Bearing Liabilities $81,615
Lease Liabilities $405
Employee Benefits $7,244
Other $5,533
Make Good Provision $1,182
Payables $8,252
78.3%
1.1%
7.9%
0.4%
7.0%
5.3%
Total liabilities at 30 June 2013 were $104.2 million. This is $3.4 million higher than that estimated to be owing of $100.8 million. The higher liabilities were due to the higher level of payables ($1.8 million), the higher level of rent in advance from tenants ($1.2 million) and the higher provisioning for employee benefits, largely due to the lower level of leave taken during the year compared to the budget estimate ($0.3 million).

COMMUNITY SERVICES DIRECTORATE ANNUAL REPORT 2012–13166
Total liabilities will continue to decline with the repayment of the Commonwealth loans.
Table 5—Comparison of Net Cost of Services to Budget
Budget Jun YTD
$’000
Actual Jun YTD
$’000
Variance
$’000 %
Employee costs, including superannuation 23,715 23,496 -219 -0.93%
Supplies and Services 81,048 82,874 1,826 2.25%
Depreciation and Amortisation 17,653 15,975 -1,678 -9.50%
Borrowing Costs 3,995 3,975 -20 -0.50%
Grants and Purchased Services 25,854 41,106 15,252 58.99%
Other Expenses 3,763 4,511 748 19.88%
156,028 171,937 15,909 10.20%
Rents 86,573 88,477 1,904 2.20%
Interest 1,713 2,260 547 31.93%
Other revenues 3,852 8,036 4,184 108.62%
Resources Received free of Charge - 254 254 100.00%
92,138 99,027 6,889 7.48%
Net Cost of Services 63,890 72,910 9,020 14.12%

SECTION B ANALYSIS OF FINANCIAL PERFORMANCE — HOUSING ACT 167
B.2 Audited Financial Report
INDEPENDENT AUDIT REPORT
HOUSING ACT
To the Members of the ACT Legislative Assembly
Report on the financial statements
The financial statements of Housing ACT for the year ended 30 June 2013 have been audited. These comprise the operating statement, balance sheet, statement of changes in equity, cash flow statement, statement of appropriation and accompanying notes.
Responsibility for the financial statements
The Director-General of the Community Services Directorate is responsible for the preparation and fair presentation of the financial statements of Housing ACT in accordance with the Financial Management Act 1996. This includes responsibility for maintaining adequate accounting records and internal controls that are designed to prevent and detect fraud and error, and the accounting policies and estimates used in the preparation of the financial statements.
The auditor’s responsibility
Under the Financial Management Act 1996, I am responsible for expressing an independent audit opinion on the financial statements of Housing ACT.
The audit was conducted in accordance with Australian Auditing Standards to obtain reasonable assurance that the financial statements are free of material misstatement.
I formed the audit opinion following the use of audit procedures to obtain evidence about the amounts and disclosures in the financial statements. As these procedures are influenced by the use of professional judgement, selective testing of evidence supporting the amounts and other disclosures in the financial statements, inherent limitations of internal control and the availability of persuasive rather than conclusive evidence, an audit cannot guarantee that all material misstatements have been detected.
Although the effectiveness of internal controls is considered when determining the nature and extent of audit procedures, the audit was not designed to provide assurance on internal controls.
Level 4, 11 Moore Street, Canberra City, ACT 2601 | PO Box 275, Civic Square, ACT 2608 Telephone: 02 6207 0833 | Facsimile: 02 6207 0826 | Email: [email protected]
The audit is not designed to provide assurance on the appropriateness of budget information included in the financial statements or to evaluate the prudence of decisions made by Housing ACT.
Electronic presentation of the audited financial statements
Those viewing an electronic presentation of the financial statements should note that the audit does not provide assurance on the integrity of information presented electronically, and does not provide an opinion on any other information which may have been hyperlinked to or from the financial statements. If users of the financial statements are concerned with the inherent risks arising from the electronic presentation of information, they are advised to refer to the printed copy of the audited financial statements to confirm the accuracy of this electronically presented information.
Independence
Applicable independence requirements of Australian professional ethical pronouncements were followed in conducting the audit.
Audit opinion
In my opinion, the financial statements of Housing ACT for the year ended 30 June 2013:
(i) are presented in accordance with the Financial Management Act 1996, Accounting Standards and other mandatory financial reporting requirements in Australia; and
(ii) present fairly the financial position of Housing ACT as at 30 June 2013 and the results of its operations and cash flows for the year then ended.
This audit opinion should be read in conjunction with the other information disclosed in this report.

Housing ACT Financial Statements
For the Year Ended 30 June 2013
Statement of Responsibility
In my opinion, the financial statements are in agreement with Housing ACT’s accounts and records and fairly reflect the financial operations of Housing ACT for the year ended 30 June 2013 and the financial position of Housing ACT on that date.

Hidden words
Housing ACT Financial Statements
For the Year Ended 30 June 2013
Statement by the Chief Finance Officer
In my opinion, the financial statements have been prepared in accordance with generally accepted accounting principles, and are in agreement with Housing ACT’s accounts and records and fairly reflect the financial operations of Housing ACT for the year ended 30 June 2013 and the financial position of Housing ACT on that date.

Hidden word
Housing ACT Operating Statement
For the Year Ended 30 June 2013
Original Actual Budget Actual
Note 2013 2013 2012 No. $’000 $’000 $’000
Income
Revenue Government Payment for Outputs 4 42,673 42,295 43,336 User Charges – Non-ACT Government 5 88,477 86,573 84,651 Interest 6 524 640 873 Distribution from Investments with the
Territory Banking Account 7 1,736 1,073 2,734 Resources Received Free of Charge 8 254 - 24 Other Revenue 9 8,036 3,852 3,975 Total Revenue 141,700 134,433 135,593
Gains Gains from the Sale of Property 10 1,762 1,129 1,322 Gain On Investments 10 90 298 -Gain on Investment Properties 10 - - 62 Other Gains 10 335 - 42 Total Gains 2,187 1,427 1,426
Total Income 143,887 135,860 137,019
Expenses
Employee Expenses 11 20,598 20,589 20,996 Superannuation Expenses 12 2,898 3,126 2,732 Supplies and Services 13 82,874 81,048 79,128 Depreciation and Amortisation 14 15,975 17,653 16,033 Borrowing Costs 15 3,975 3,995 4,195 Grants and Purchased Services 16 41,106 25,854 29,750 Other Expenses 17 4,511 3,763 10,461
Total Expenses 171,937 156,028 163,295
Operating (Deficit) (28,050) (20,168) (26,276)
Other Comprehensive Income
Items that will not be reclassified subsequently to profit or loss
Increase/(decrease) in the Asset Revaluation Account 36 27,405 99,625 (332)
Total Other Comprehensive Income/(Deficit) 27,405 99,625 (332)
Total Comprehensive (Deficit)/Income (645) 79,457 (26,608)
The above Operating Statement should be read in conjunction with the accompanying notes. Housing ACT has only one output class and as such the above Operating Statement is also Housing ACT's operating statement for the Social Housing Services Output Class. As a result, a separate output class Operating Statement and Summary of Agency Output Classes has not been included in these financial statements.

Hidden words
Housing ACT Balance Sheet
As at 30 June 2013
Original Actual Budget Actual
Note 2013 2013 2012 No. $’000 $’000 $’000
Current Assets
Cash and Cash Equivalents 22 5,945 7,402 4,510 Receivables 23 9,027 7,428 6,418 Investments 24 35,343 20,249 37,253 Assets Held for Sale 25 7,045 4,336 6,285 Other Assets 26 272 390 755
Total Current Assets 57,632 39,805 55,221
Non-Current Assets
Receivables 23 4,878 5,175 4,828 Property, Plant and Equipment 27 4,330,039 4,481,642 4,311,466 Investment Properties 28 4,858 3,413 2,234 Intangible Assets 29 884 1,507 1,366 Capital Works in Progress 30 21,471 24,916 29,130
Total Non-Current Assets 4,362,130 4,516,653 4,349,024
Total Assets 4,419,762 4,556,458 4,404,245
Current Liabilities
Payables 31 8,252 6,460 4,714 Interest-Bearing Liabilities 32 4,728 4,729 4,863 Finance Leases 32 123 216 91 Employee Benefits 33 6,674 6,345 6,692 Other Liabilities 34 5,533 4,311 4,018
Total Current Liabilities 25,310 22,061 20,378
Non-Current Liabilities
Interest-Bearing Liabilities 32 76,887 76,887 81,615 Finance Leases 32 282 124 377 Employee Benefits 33 570 552 624 Other Provisions 35 1,182 1,182 1,129
Total Non-Current Liabilities 78,921 78,745 83,745
Total Liabilities 104,231 100,806 104,123
Net Assets 4,315,531 4,455,652 4,300,122
Equity
Accumulated Funds 1,165,839 1,168,326 1,145,667 Asset Revaluation Account 36 3,149,692 3,287,326 3,154,455
Total Equity 4,315,531 4,455,652 4,300,122
The above Balance Sheet should be read in conjunction with the accompanying notes. Housing ACT has only one output class and as such the above Balance Sheet is also Housing ACT's balance sheet for the Social Housing Services Output Class. Therefore, a separate disaggregated disclosure note has not been included in these financial statements.

Hidden words
Housing ACT Statement of Changes in Equity
For the Year Ended 30 June 2013
Asset Accumulated Revaluation Total
Funds Account Equity Original Actual Actual Actual Budget
Note 2013 2013 2013 2013 No. $’000 $’000 $’000 $’000
Balance at the Beginning of the Reporting Period 1,145,667 3,154,455 4,300,122 4,358,319
Comprehensive Income
Operating (Deficit) (28,050) - (28,050) (20,168) Increase in the Asset Revaluation
Account 36 - 27,405 27,405 99,625
Total Comprehensive (Deficit) Income (28,050) 27,405 (645) 79,457
Transfers to (from)/reserves 36 32,168 (32,168) - -
Transactions Involving Owners Affecting Accumulated Funds
Capital Injections 16,054 - 16,054 17,876
Total Transactions Involving Owners Affecting Accumulated Funds 16,054 - 16,054 17,876
Balance at the End of the Reporting Period 1,165,839 3,149,692 4,315,531 4,455,652
The above Statement of Changes in Equity should be read in conjunction with the accompanying notes.

Hidden words
Housing ACT Statement of Changes in Equity - Continued
For the Year Ended 30 June 2013
Asset Accumulated Revaluation Total
Funds Account Equity Actual Actual Actual
Note 2012 2012 2012 No. $’000 $’000 $’000
Balance at the Beginning of the Reporting Period 1,139,766 3,172,596 4,312,362
Comprehensive Income
Operating (Deficit) (26,276) - (26,276) (Decrease) in the Asset Revaluation
Account 36 - (332) (332)
Total Comprehensive (Deficit) (26,276) (332) (26,608)
Transfers to/(from) reserves 36 17,809 (17,809)
Transactions Involving Owners Affecting Accumulated Funds
Capital Injections 14,368 - 14,368
Total Transactions Involving Owners Affecting Accumulated Funds 14,368 - 14,368
Balance at the End of the Reporting Period 1,145,667 3,154,455 4,300,122
The above Statement of Changes in Equity should be read in conjunction with the accompanying notes.

Hidden words
Housing ACT Cash Flow Statement
For the Year Ended 30 June 2013
Cash Flows from Operating Activities
Receipts
Government Payment for Outputs User Charges – Non-ACT Government Interest Distribution from Investments Goods and Services Tax Input Tax Credits from the Australian
Taxation Office Goods and Services Tax Collected from Customers Other
Total Receipts from Operating Activities
Payments
Employee Superannuation Supplies and Services Grants and Purchased Services Borrowing Costs Goods and Services Tax Paid to Suppliers Goods and Services Tax Input Tax Credits to the Australian
Taxation Office Other
Total Payments from Operating Activities
Net Cash Inflows/(Outflows) from Operating Activities
Cash Flows from Investing Activities
Receipts
Proceeds from Sale of Property, Plant and Equipment Proceeds from Sale/Maturity of Investments
Total Receipts from Investing Activities
Payments
Purchase of Property, Plant and Equipment Purchase of Investments Property, Plant and Equipment Selling Expenses
Total Payment from Investing Activities
Net Cash (Outflows) from Investing Activities
Note No.
Actual 2013
$’000
Original Budget
2013 $’000
42,673 88,001
209 1,668
42,295 85,885
294 1,073
3,043 42
6,267
3,090 40
2,563
141,903 135,240 136,846
20,674 20,444 19,853 2,897 3,126 2,718
79,231 80,954 82,030 25,913 25,854 23,803
3,922 3,942 4,146 3,057 3,090 3,076
41 40 80 620 284 175
136,355 137,734 135,881
Actual 2012
$’000
43,336 84,412
371 2,665
3,210 58
2,794
37 5,548 (2,494) 965
27,546 51,100
78,646
33,055 66,751
99,806
19,642 54,000
73,642
44,081 49,100
618
59,563 50,000
605
56,260 29,000
656
93,799
(15,153)
110,168
(10,362)
85,916
(12,274)
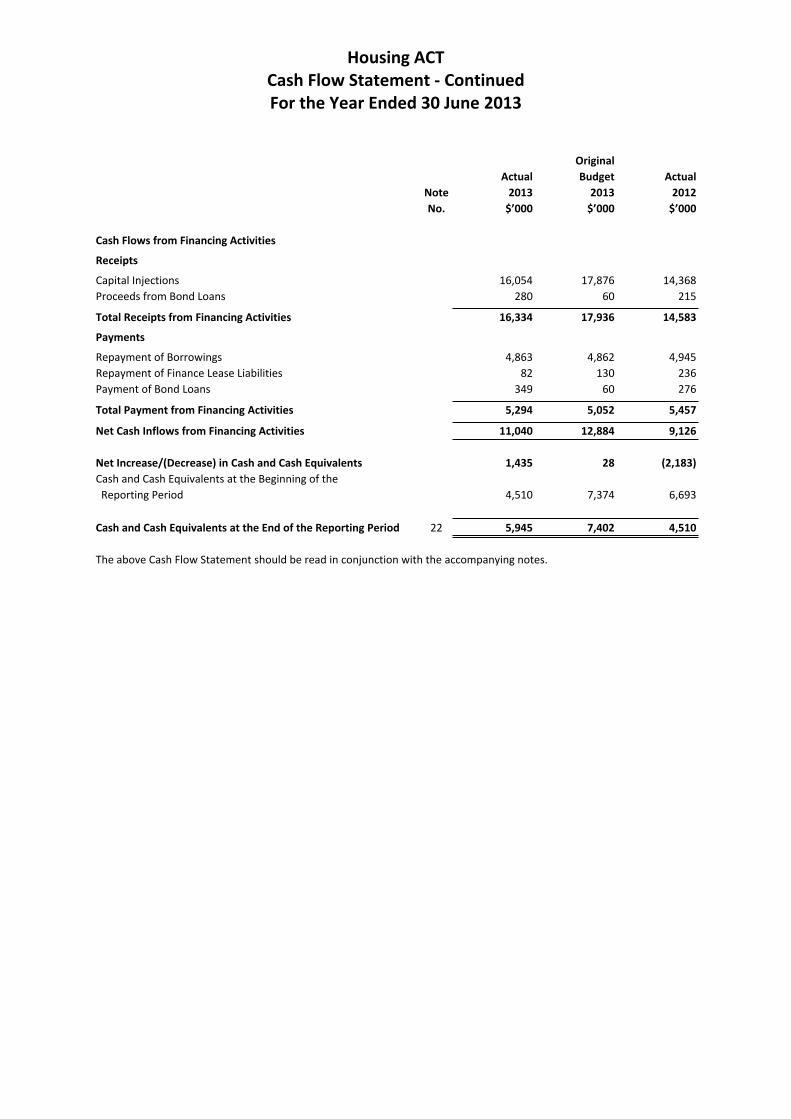
Hidden words
Housing ACT Cash Flow Statement - Continued For the Year Ended 30 June 2013
Cash Flows from Financing Activities
Receipts
Capital Injections Proceeds from Bond Loans
Total Receipts from Financing Activities
Payments
Repayment of Borrowings Repayment of Finance Lease Liabilities Payment of Bond Loans
Total Payment from Financing Activities
Net Cash Inflows from Financing Activities
Net Increase/(Decrease) in Cash and Cash Equivalents Cash and Cash Equivalents at the Beginning of the
Reporting Period
Note No.
Actual 2013
$’000
Original Budget
2013 $’000
Actual 2012
$’000
16,054 280
16,334
17,876 60
17,936
14,368 215
14,583
4,863 82
349
5,294
11,040
4,862 130
60
5,052
12,884
4,945 236 276
5,457
9,126
1,435 28 (2,183)
4,510 7,374 6,693
Cash and Cash Equivalents at the End of the Reporting Period 22 5,945 7,402 4,510
The above Cash Flow Statement should be read in conjunction with the accompanying notes.

Hidden words
Housing ACT Statement of Appropriation
For the Year Ended 30 June 2013
Original Total Appropriation Appropriation Budget Appropriated Drawn Drawn
2013 2013 2013 2012 $’000 $’000 $’000 $’000
Government Payment for Outputs 42,295 42,673 42,673 43,336 Capital Injections 17,876 16,054 16,054 14,368
Total Appropriation 60,171 58,727 58,727 57,704
The above Statement of Appropriation should be read in conjunction with the accompanying notes.
Column Heading Explanations The Original Budget column shows the amounts that appear in the Cash Flow Statement in the Budget Papers. This amount also appears in the Cash Flow Statement.
The Total Appropriated column is inclusive of all appropriation variations occurring after the Original Budget.
The Appropriation Drawn is the total amount of appropriation received by Housing ACT during the year. This amount also appears in the Cash Flow Statement.
Variances between ‘Original Budget’ and ‘Total Appropriated’ 2013 2012 $’000 $’000
Original Budget - Government Payment for Outputs 42,295 43,186
Additional Funding Received from the Commonwealth under the National Affordable Housing Agreement for ACT Relative Population Movements 378
Transfer - National Disaster Resilience Program from the Community Services Directorate - 150
Total Appropriated 42,673 43,336
Variance between 'Total Appropriated' and 'Appropriation Drawn'
Total Appropriated - Government Payment for Outputs 42,673 43,336
Appropriated Drawn 42,673 43,336
Government Payment for Outputs 42,673 43,336
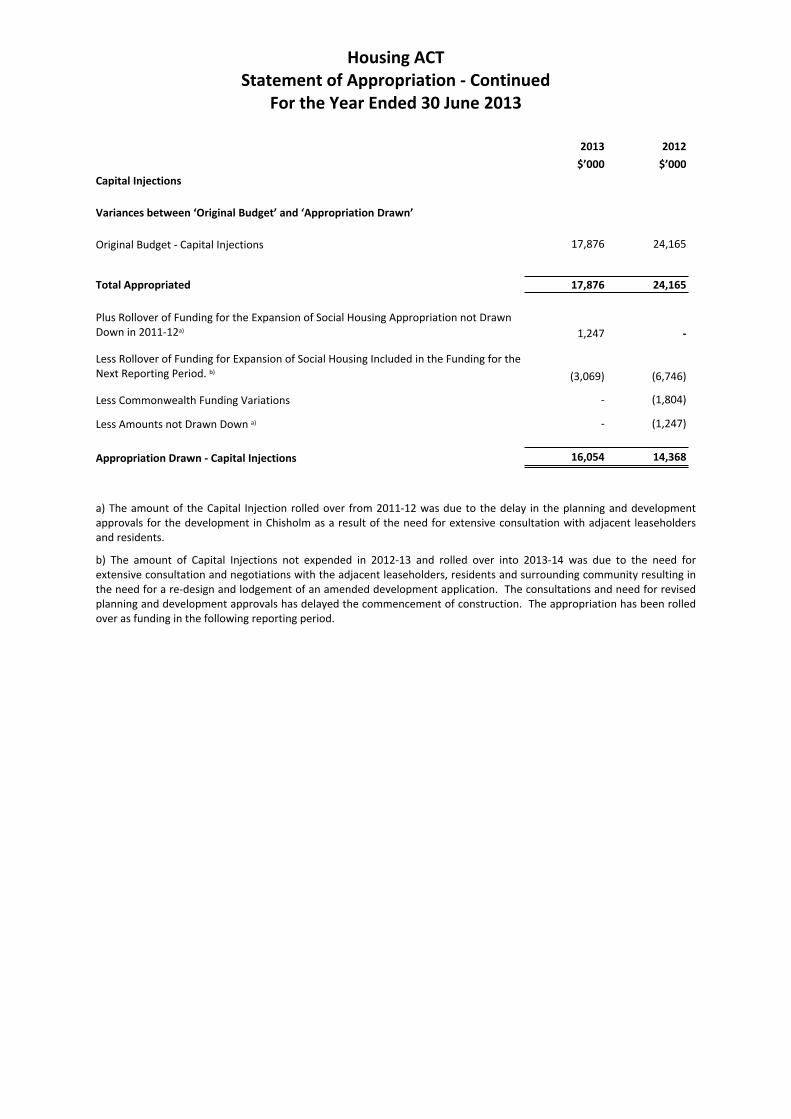
Hidden words
Housing ACT Statement of Appropriation - Continued
For the Year Ended 30 June 2013
2013 2012 $’000 $’000
Capital Injections
Variances between ‘Original Budget’ and ‘Appropriation Drawn’
Original Budget - Capital Injections 17,876 24,165
Total Appropriated 17,876 24,165
Plus Rollover of Funding for the Expansion of Social Housing Appropriation not Drawn Down in 2011-12a) 1,247 -
Less Rollover of Funding for Expansion of Social Housing Included in the Funding for the Next Reporting Period. b) (3,069) (6,746)
Less Commonwealth Funding Variations - (1,804)
Less Amounts not Drawn Down a) - (1,247)
Appropriation Drawn - Capital Injections 16,054 14,368
a) The amount of the Capital Injection rolled over from 2011-12 was due to the delay in the planning and development approvals for the development in Chisholm as a result of the need for extensive consultation with adjacent leaseholders and residents.
b) The amount of Capital Injections not expended in 2012-13 and rolled over into 2013-14 was due to the need for extensive consultation and negotiations with the adjacent leaseholders, residents and surrounding community resulting in the need for a re-design and lodgement of an amended development application. The consultations and need for revised planning and development approvals has delayed the commencement of construction. The appropriation has been rolled over as funding in the following reporting period.

Hidden words
Page 15
15 33
34
3435
36 36
3738
40
40 41
42 42
43 44
45 46
47 47
47
4851
51 52
53 57
59 59
62
63 65
66 66
7
Housing ACT NOTE INDEX
Note 1. Objectives of Housing ACT Note 2. Summary of Significant Accounting Policies Note 3. Change in Accounting Policy and Accounting Estimates,
and Correction of a Prior Period Error
Revenue Notes Note 4. Government Payment for Outputs Note 5. User Charges Note 6. Interest Note 7. Distribution from Investments with the Territory Banking Account Note 8. Resources Received Free of Charge Note 9. Other Revenue Note 10. Gains
Expense Notes Note 11. Employee Expenses Note 12. Superannuation Expenses Note 13. Supplies and Services Note 14. Depreciation and Amortisation Note 15. Borrowing Costs Note 16. Grants and Purchased Services Note 17. Other Expenses Note 18. Auditor's Remuneration Note 19. Waivers, Impairment Losses and Write-Offs Note 20. Act of Grace Payments Note 21. Executive Remuneration
Asset Notes Note 22. Cash and Cash Equivalents Note 23. Receivables Note 24. Investments Note 25. Assets Held for Sale Note 26. Other Assets Note 27. Property, Plant and Equipment Note 28. Investment Properties Note 29. Intangible Assets Note 30. Capital Works in Progress
Liability Notes Note 31. Payables Note 32. Interest-Bearing Liabilities and Finance Leases Note 33. Employee Benefits Note 34. Other Liabilities Note 35. Other Provisions
Equity Notes Note 36. Equity

Hidden words
Page
6869
69 70
70 71
78 79
80
Other Notes Note 37. Note 38. Note 39. Note 40. Note 41. Note 42. Note 43. Note 44. Note 45.
Housing ACT NOTE INDEX - CONTINUED
Cash Flow Reconciliation Commitments Contingent Liabilities Contingent Assets Economic Dependency Financial Instruments Interest in a Joint Venture Restricted Assets Events Occuring after Balance Date
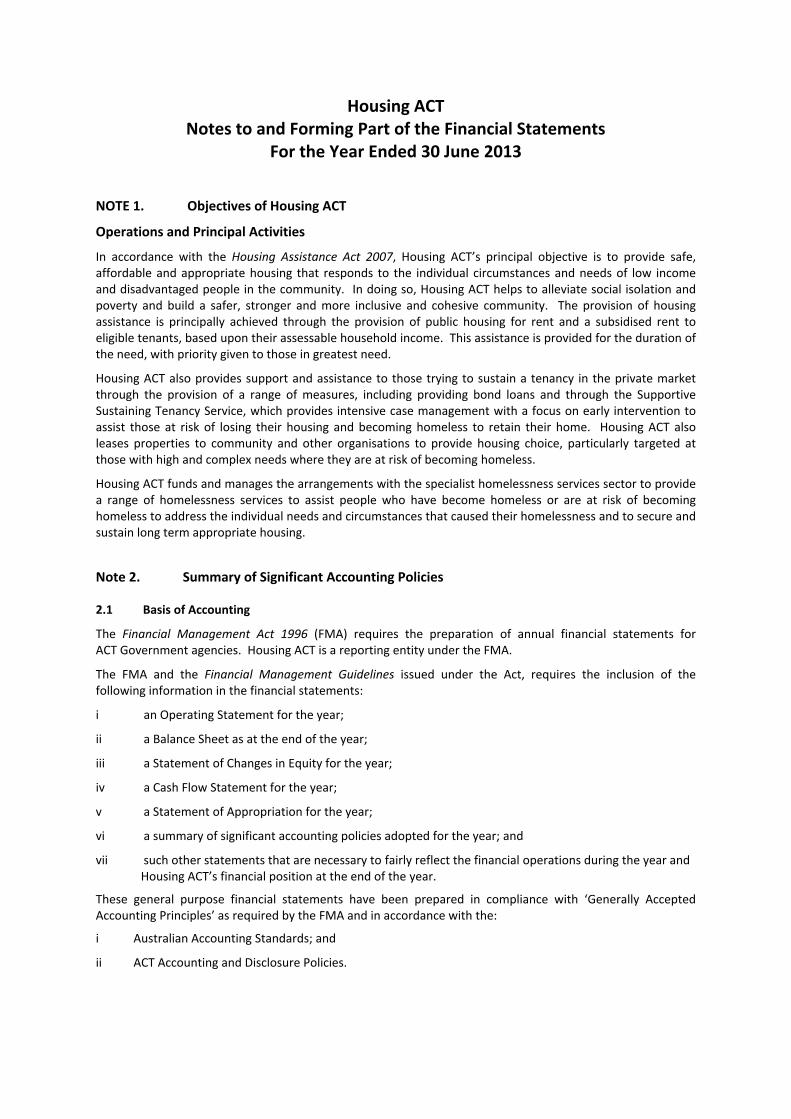
Hidden words
Housing ACT Notes to and Forming Part of the Financial Statements
For the Year Ended 30 June 2013
NOTE 1. Objectives of Housing ACT
Operations and Principal Activities
In accordance with the Housing Assistance Act 2007, Housing ACT’s principal objective is to provide safe, affordable and appropriate housing that responds to the individual circumstances and needs of low income and disadvantaged people in the community. In doing so, Housing ACT helps to alleviate social isolation and poverty and build a safer, stronger and more inclusive and cohesive community. The provision of housing assistance is principally achieved through the provision of public housing for rent and a subsidised rent to eligible tenants, based upon their assessable household income. This assistance is provided for the duration of the need, with priority given to those in greatest need.
Housing ACT also provides support and assistance to those trying to sustain a tenancy in the private market through the provision of a range of measures, including providing bond loans and through the Supportive Sustaining Tenancy Service, which provides intensive case management with a focus on early intervention to assist those at risk of losing their housing and becoming homeless to retain their home. Housing ACT also leases properties to community and other organisations to provide housing choice, particularly targeted at those with high and complex needs where they are at risk of becoming homeless.
Housing ACT funds and manages the arrangements with the specialist homelessness services sector to provide a range of homelessness services to assist people who have become homeless or are at risk of becoming homeless to address the individual needs and circumstances that caused their homelessness and to secure and sustain long term appropriate housing.
Note 2. Summary of Significant Accounting Policies
2.1 Basis of Accounting
The Financial Management Act 1996 (FMA) requires the preparation of annual financial statements for ACT Government agencies. Housing ACT is a reporting entity under the FMA.
The FMA and the Financial Management Guidelines issued under the Act, requires the inclusion of the following information in the financial statements:
i an Operating Statement for the year;
ii a Balance Sheet as at the end of the year;
iii a Statement of Changes in Equity for the year;
iv a Cash Flow Statement for the year;
v a Statement of Appropriation for the year;
vi a summary of significant accounting policies adopted for the year; and
vii such other statements that are necessary to fairly reflect the financial operations during the year and Housing ACT’s financial position at the end of the year.
These general purpose financial statements have been prepared in compliance with ‘Generally Accepted Accounting Principles’ as required by the FMA and in accordance with the:
Australian Accounting Standards; and
ACT Accounting and Disclosure Policies.
i
ii

Hidden words
Housing ACT Notes to and Forming Part of the Financial Statements
For the Year Ended 30 June 2013
Note 2. Summary of Significant Accounting Policies (continued)
2.1 Basis of Accounting – continued
The financial statements have been prepared using the accrual basis of accounting, which recognises the effects of transactions and events when they occur. The financial statements have also been prepared according to the historical cost convention, except for those assets which were valued in accordance with the valuation policies applicable to Housing ACT during the reporting period.
These financial statements are presented in Australian dollars, which is Housing ACT’s functional currency.
2.2 The Reporting Period
These financial statements state the financial performance, changes in equity and cash flows of Housing ACT for the year ended 30 June 2013 together with the financial position of Housing ACT as at 30 June 2013.
2.3 Comparative Figures
Budget Figures
To facilitate a comparison with the Budget, as required by the Financial Management Act 1996, budget information for 2012-13 has been presented in the financial statements. The budget numbers in the financial statements are the budget numbers that appear in the Budget Papers.
Prior Year Comparatives
Comparative information has been disclosed for the previous period for amounts reported in the financial statements, except where an Australian Accounting Standard does not require comparative information to be disclosed.
Where the presentation or classification of items in the financial statements is amended, the comparative amounts have been reclassified where practical. Where a reclassification has occurred, the nature, amount and reason for the reclassification is provided.
2.4 Rounding
All of amounts in the financial statements have been rounded to the nearest thousand dollars ($’000). Use of “-” represents zero amounts or amounts rounded down to zero.
2.5 Revenue Recognition
Revenue is recognised in the Operating Statement at the fair value of the consideration received or receivable. Revenue is recognised to the extent that it is probable that the economic benefits will flow to Housing ACT and the revenue can be reliably measured. In addition, the following specific recognition criteria must also be met before revenue is recognised:
Hidden words
Housing ACT Notes to and Forming Part of the Financial Statements
For the Year Ended 30 June 2013
Note 2. Summary of Significant Accounting Policies (continued)
2.5 Revenue Recognition (continued)
Rent Revenue
Housing ACT charges rent weekly in advance each Sunday. Tenants are required to pay market rent. However, pursuant to the Public Rental Housing Assistance Program, the program for the provision of public housing under the Housing Assistance Act 2007, tenants may apply for a rental rebate so that they pay no more than 25% of their assessable household income as rent. Eligibility for a rental rebate is generally determined every six months based upon the assessable income of the household at the time of assessment. The difference between market rent and the rebated rent payable by a tenant is an unfunded rental subsidy. In the Operating Statement, rent is disclosed net of the rent rebates provided.
The market rent for public housing properties are determined each year. An independent valuer provides advice on the market rent to be charged and this forms the basis by which the market rent applicable for the next twelve months is determined. Mr David James (AAPI Certified Practising Valuer and Director of Herron Todd White (Canberra) Pty Limited) provided an assessment of market rents in January 2013. Market rents were set in June 2013 based upon the January 2013 assessment of market rents.
Government Payment for Outputs
Funding provided by the ACT Government to meet the cost of Housing ACT’s outputs, (Government Payment for Outputs) is recognised on receipt of the fortnightly drawdown, but may be recorded in advance where specific conditions attach to the funding and the funding may be repayable if those conditions are not met.
Other Revenue
Interest revenue and distributions from investments are recognised on an accrual basis using data supplied by banking institutions and the Territory Banking Account.
Revenue from disposal of non-current assets is recognised on settlement.
Revenue from recovery of insurable losses is recognised when the cash is received
Other revenues and recoveries are recognised when the transaction is at a stage that the amount can be reliably measured and it is probable that the future economic benefits will flow to Housing ACT.
Hidden words
Housing ACT Notes to and Forming Part of the Financial Statements
For the Year Ended 30 June 2013
Note 2. Summary of Significant Accounting Policies (continued)
2.6 Resources Received Free of Charge
Goods and services received free of charge from ACT Government entities are recorded as a revenue and an expense in the Operating Statement at fair value. The revenue is separately disclosed under resources received free of charge, whilst the expense is recorded in the line item to which it relates.
Goods and services that are received free of charge are only recorded in the Operating Statement if they can be reliably measured and would have been purchased if not provided to Housing ACT free of charge.
Resources received free of charge from entities external to the ACT Government are recorded as donations.
2.7 Resources Provided Free of Charge
Resources provided free of charge are recorded at their fair value in the revenue or expense line in the Operating Statement to which they relate.
Resources provided free of charge includes the value of rent foregone for properties provided rent free or at a reduced rent, mainly to community and other organisations to provide housing assistance and support and the direct costs of activities undertaken for the Community Services Directorate or other ACT Government agencies and not directly related to the provision of housing assistance. These expenses are included in the expense line items to which they relate, though not separately identified.
2.8 Taxation
Housing ACT is generally exempt from taxation, except for Fringe Benefits Tax (FBT) and the Goods and Services Tax (GST). Housing ACT also pays General Rates, the Fire and Emergency Services Levy and the Utility Networks Facility Tax levied by the ACT Government.
As the provision of residential accommodation is input taxed, Housing ACT is unable to charge GST on its rent or claim input tax credits for its acquisitions, except on those costs attributable to activities not directly related to the provision of residential accommodation.
Pursuant to GST Bulletin 2001/3 - Simplified calculation of input tax for caravan park operators, Housing ACT is able to charge GST at the rate of 5.5 percent on the site fees at the Narrabundah Long Stay Park and claim input tax credits for the costs associated with the operation and management of the Park.
2.9 Borrowing Costs
All borrowing costs are expensed in the period in which they are incurred.
2.10 Waivers of Debt
Debts waived during the year under Section 131 of the FMA are expensed during the year in which the right to payment was waived.

Hidden words
Housing ACT Notes to and Forming Part of the Financial Statements
For the Year Ended 30 June 2013
Note 2. Summary of Significant Accounting Policies (continued)
2.11 Current and Non-Current Items
Assets and liabilities are classified as current or non-current in the Balance Sheet and in the relevant notes. Assets are classified as current when it is expected they will be realised within 12 months after the reporting date. Liabilities are classified as current when they are due to be settled within 12 months after the reporting date or where Housing ACT does not have an unconditional right to defer settlement of the liability for at least 12 months after the reporting date
Assets or liabilities which do not fall within the current classification are classified as non-current.
2.12 Impairment of Assets
Housing ACT assesses all assets at each reporting date to determine whether there is any indication that an asset may be impaired. Assets are also reviewed for impairment whenever events or changes in circumstances indicate that the carrying amount may not be recoverable. However, intangible assets, including those that are not yet available for use are tested annually for impairment, regardless of whether there is an indication of impairment, or more frequently if events or circumstances indicate they might be impaired.
Any impairment loss for land and buildings, including those that may be listed as a heritage asset, is recognised as a decrease to the available balance in the Asset Revaluation Account, if available. Where the impairment loss is greater than the balance available in the Asset Revaluation Account, the difference is expensed in the Operating Statement.
Leasehold improvements, plant and equipment and intangibles are recorded at cost and therefore any impairment loss for these asset classes is recognised in the Operating Statement.
An impairment loss is the amount by which the carrying amount of an asset (or a cash-generating unit) exceeds its recoverable amount. The recoverable amount is the higher of the asset’s ‘fair value less the cost to sell’ and its ‘value in use’. An asset’s ‘value in use’ is its depreciated replacement cost, where the asset would be replaced if Housing ACT were deprived of it.
Non-financial assets that have previously been impaired are reviewed for possible reversal of impairment at each reporting date.
2.13 Cash and Cash Equivalents
For the purposes of the Cash Flow Statement and the Balance Sheet, cash includes cash at bank, cash on hand and cash equivalents. Cash equivalents are short-term, highly liquid investments that are readily convertible to known amounts of cash and are subject to an insignificant risk of change in value. Bank overdrafts are included in cash and cash equivalents in the Cash Flow Statement, but not in cash and cash equivalents in the Balance Sheet.
Hidden words
Housing ACT Notes to and Forming Part of the Financial Statements
For the Year Ended 30 June 2013
Note 2. Summary of Significant Accounting Policies (continued)
2.14 Receivables
Accounts receivable (including trade receivables and other receivables) are measured at the fair value of the consideration receivable when initially recognised and at amortised cost after initial recognition, with any subsequent adjustments to the carrying amount recorded in the Operating Statement.
Trade receivables arise in the normal course of providing public housing for rent or the provision of other forms of housing assistance. Trade receivables consist of tenant rental arrears and recoveries from tenants pursuant to the tenancy agreement, bond loans outstanding and amounts owing from the sale of properties. Apart from rent from public housing tenants, which is payable two weeks in advance and bond loans that have an imbedded repayment schedule, trade receivables are due within 30 days after the issue of an invoice or the goods or services have been provided under a contract.
Bond loans are provided to eligible applicants who have signed a tenancy agreement with a private landlord. The bond loan is for no more than 90% of the bond that is payable under a residential tenancy under the Residential Tenancies Act 1997. The loans are interest free and repayable within 24 months. A repayment holiday is provided for the first seven or eight weeks of the loan period.
Other receivables arise from activities outside the normal course of providing housing assistance and are due within 30 days after the issue of an invoice, or the goods or services have been provided under a contract. Other receivables largely consist of accrued interest, distributions from investments, insurance and other recoveries from third parties.
The loan receivable is a loan to the Master Builders Association of the ACT to fund the construction of adaptable houses in display villages to educate the industry and the market of the benefits of adaptable house design. The loan is interest free and repayable after the expiry of ten years. The loan expires during 2013-14.
The Lyons land receivable consists of the value of the land contributed to the Lyons Estate Redevelopment Joint Venture to build a retirement village and residential dwelling complex, and any costs incurred by Housing ACT on behalf of the Joint Venture, plus simple interest at 8% per annum on the value of Housing ACT’s contribution each year. The contribution to the Joint Venture is repayable upon the completion of the development or a stage of a development or as agreed between the parties.
A right to receive is recognised as a non-current receivable for the value that Housing ACT retains in properties that have been sold by way of a long term sub-lease to elderly Canberrans in some of its older persons’ developments as a result of the requirement to sell the property back to Housing ACT at an agreed price. The sub-lease is sold at 75% of the current market value on the proviso that the property is sold back to Housing ACT by the licensee at the exit date at a price calculated in accordance with the terms set out in the sub-lease. The future sale-back price to Housing ACT is based upon an equal sharing of the appreciation in the value of the unit above the original fair value at the time that the sub-lease was entered into. The fair value of the right to receive reflects the fair value at the end of the reporting period, i.e., as determined by an annual valuation of the dwelling as at the end of the reporting period. Fair value is based upon the market value of the underlying property determined by independent valuation. Any adjustment to the carrying amount is recorded in the Operating Statement.

Hidden words
Housing ACT Notes to and Forming Part of the Financial Statements
For the Year Ended 30 June 2013
Note 2. Summary of Significant Accounting Policies (continued)
2.14 Receivables – continued
The collectability of receivables is reviewed on an ongoing basis. The allowance for impairment losses (doubtful debts) represents the amount of trade and other receivables that Housing ACT estimates will not be paid. The allowance for impairment is based upon a review of overdue debtor balances. Housing ACT considers non-payment of debt and the lack of a repayment agreement or non-compliance with the repayment agreement as objective evidence of impairment. The allowance for impairment is based on the age and type of debtors, historic data and trend analysis. The allowance for impairment losses is recognised in the Operating Statement.
The allowance for impairment losses is written back against the receivables account when Housing ACT ceases action to collect the debt as it considers that it will cost more to recover the debt than the debt is worth (bad debts written-off). Bad debts subsequently recovered are recorded in the Operating Statement as other revenue, for further details refer to Note 9 – Other Revenue.
Receivables that have been renegotiated because they are past due or impaired are accounted for based on the renegotiated terms.
2.15 Investments
Short-term investments are held with the Territory Banking Account in a unit trust called the Cash Enhanced Portfolio. The price of units in the unit trust fluctuates. The net gain or loss on investments consists of the fluctuation in price of the units in the trust between the end of last reporting period and the end of this reporting period, as well as any profit on the sale of units in the unit trust (the profit being the difference between the price at the end of last reporting period and the sale price). The net gain or loss does not include distributions.
Short-term investments are measured at fair value with any adjustments to the carrying amount recorded in the Operating Statement. Fair value is based on the underlying pool of investments which have quoted market prices at the reporting date.
Investment Properties
Investment properties consist of Housing ACT’s minority equity share in dwellings sold to tenants under the Shared Equity Scheme. The equity is held for the long term with repayment occurring after 5 years from the initial sale and final payment for any remaining equity held by Housing ACT within 15 years. The property investments are held for long term appreciation. Housing ACT does not charge interest on, or rent for its share of the equity in the property and is not liable for the normal property ownership costs. These long term investments are measured at fair value with any adjustment to the carrying amount recorded in the Operating Statement. The fair value of investment properties reflects market conditions at the end of the reporting period, i.e., they are valued annually as at the end of the reporting period. Fair value is based upon the market value of the underlying property determined by independent valuation.
Investment properties are not depreciated.
Hidden words
Housing ACT Notes to and Forming Part of the Financial Statements
For the Year Ended 30 June 2013
Note 2. Summary of Significant Accounting Policies (continued)
2.16 Assets Held for Sale
Assets held for sale are those properties that Housing ACT has identified as being available for immediate sale in their present condition, and the sale is highly probable.
Assets held for sale are measured at the lower of the carrying amount and fair value less costs to sell. An impairment loss is recognised for any initial or subsequent write down of the property to fair value less cost to sell.
Assets held for sale are not depreciated.
2.17 Acquisition and Recognition of Property, Plant and Equipment
Land and buildings are initially recorded at cost and recognised when control has passed to Housing ACT (on settlement for acquisitions and upon handover for construction contracts).
Land and buildings transferred to Housing ACT from other entities are initially recorded at the fair value advised by the transferring entity. The assets are subsequently revalued by an independent valuer to determine their fair value to Housing ACT. The difference between the carrying value and fair value of the asset is recorded against the Asset Revaluation Account, if there is a gain, and losses are recorded in the Operating Statement as an expense.
The motor vehicles subject of a finance lease are initially recognised as an asset and a liability at the lower of fair value of the asset and the present value of the minimum lease payments, each being determined at the inception of the lease.
Other items of property, plant and equipment are initially recognised at cost, except for those items costing less than $2,000 which are expensed in the year of acquisition. However, where items individually cost less than $2,000, but which are part of a group of similar items that are significant in total value or meet the definition of an asset, then they may be recognised as an asset.
2.18 Measurement of Property, Plant and Equipment after Initial Recognition
Property, plant and equipment are valued using the cost or revaluation model of valuation. Land and buildings, including those that are listed as heritage assets are measured at fair value. Leasehold improvements are measured at cost.
Fair value is the amount for which an asset could be exchanged between knowledgeable, willing parties in an arm’s length transaction. The public housing rental properties are valued at fair value using the market price in an active market for similar properties in a similar location and condition, as this is the best evidence of the property’s fair value. Where the market price for an asset cannot be obtained because the asset is specialised and is rarely sold, and where the asset would be replaced if Housing ACT was deprived of the asset, then depreciated replacement cost is used as fair value. Where the asset would not be replaced, the fair value is the asset’s selling price less cost to sell.

Hidden words
Housing ACT Notes to and Forming Part of the Financial Statements
For the Year Ended 30 June 2013
Note 2. Summary of Significant Accounting Policies (continued)
2.18 Measurement of Property, Plant and Equipment after Initial Recognition - continued
The public housing rental properties are valued each year. An independent valuer, Mr David James, AAPI Certified Practising Valuer and Director of Herron Todd White (Canberra) Pty Limited valued the rental properties as at 31 March 2013 on the following basis:
buildings excluding non-strata title flats are assessed in accordance with the current market price of similar assets;
non-strata title flats are assessed in accordance with the current market price of a similar strata title asset and reduced by the cost of conversion to strata title, if appropriate;
buildings on unleased rural land are assessed in accordance with the current market value of the building; and
Land is assessed in accordance with the current market price, taking into account the nature of the land, any legal restrictions on use and any opportunities for, or impediments to development of that land.
In valuing the public housing property portfolio, Herron Todd White uses a comparative sales approach, where sales of similar or substitute properties and related market data are used to establish a value for each property.
Any accumulated depreciation at the date of revaluation is written back against the gross carrying amount of the building and the net amount restated to the revalued amount of the property.
The cost of the leasehold improvements comprises the purchase price, any directly attributable costs, and the initial estimate of the costs of dismantling and removing the improvements and restoring the site on which they are located.
2.19 Depreciation and Amortisation of Non-Current Assets
Property, plant and equipment are systematically depreciated over their estimated useful lives in a manner that reflects the consumption of their future economic benefits or service potential to Housing ACT. The useful life commences when the asset is ready for use.
When an asset is revalued, it is depreciated or amortised over its newly assessed remaining useful life. Amortisation is used in relation to intangible assets while depreciation is applied to physical assets such as buildings and plant and equipment.
Land has an unlimited useful life and therefore is not depreciated.

Hidden words
Housing ACT Notes to and Forming Part of the Financial Statements
For the Year Ended 30 June 2013
Note 2. Summary of Significant Accounting Policies (continued)
2.19 Depreciation and Amortisation of Non-Current Assets (continued)
Appliances, fixtures and fittings that are an integral part of a public rental housing property and required to enable them to be leased for residential accommodation, such as hot water services, heaters and stoves, are included as part of the building for depreciation purposes. The cost of replacing these appliances is expensed.
Motor vehicles acquired by way of a finance lease are depreciated over the unexpired period of the lease, which is generally four years.
Leasehold improvements (office fitout costs) are depreciated over the estimated useful life of each improvement or the unexpired period of the lease, whichever is shorter.
All depreciation is calculated after first deducting any residual value for each asset.
The straight-line method of depreciation or amortisation is used. Amortisation and depreciation rates and the useful lives are reviewed annually.
The depreciation/amortisation rates applying to each class of assets are based on the following useful economic lives:
Class of Asset Useful Life Buildings Up to 80 years Leasehold Improvements (office fitout) Term of Lease Computer Software Not exceeding 5 years Plant and Equipment (motor vehicles) Term of Lease (4 years)
Note: Land improvements are included with buildings
2.20 Repairs and Maintenance
Repairs and maintenance to public housing rental properties is recorded as an expense in the Operating Statement. Repairs and maintenance comprises all urgent and minor expenses arising from normal fair wear and tear and any accidental damage, including plumbing and electrical repairs, replacing glass, tiles and flyscreens as well as major cyclical maintenance, including internal and external painting, replacing floor coverings and fencing and landscaping. However, where the maintenance results in an upgrade to the property and increases the service potential of the public housing property, that portion of the cost is capitalised.
Housing ACT may also carry out repairs and maintenance that the tenant is responsible for under the tenancy agreement. The tenant is charged the cost of these repairs and the amounts are included in other revenue and receivables.

Hidden words
Housing ACT Notes to and Forming Part of the Financial Statements
For the Year Ended 30 June 2013
Note 2. Summary of Significant Accounting Policies (continued)
2.21 Intangible Assets
Housing ACT’s intangible assets comprise internally generated and externally acquired software. The software is recognised and capitalised when: it is probable that the expected future economic benefits that are attributable to the software will flow
to Housing ACT; the cost of the software can be measured reliably; and the acquisition cost is equal to or exceeds $50,000.
Capitalised software has a finite useful life. Software is amortised on a straight-line basis over its useful life, but not exceeding 5 years.
Intangible assets are measured at cost.
2.22 Capital Works in Progress
Capital works in progress consist of expenditure incurred to the end of the reporting period on construction projects, projects for the improvement or upgrade of existing properties that are unfinished at 30 June and deposits and progress payments on property acquisitions not settled by 30 June.
Unfinished construction projects and unfinished improvement or upgrade projects are recorded at cost and include land and engineering costs, direct acquisition and construction costs and any related fees and holding costs.
2.23 Payables
Payables are financial liabilities that include trade and other payables and accrued expenses. Payables are measured at the fair value of the consideration received when initially recognised and at amortised cost after initial recognition, with any subsequent adjustment being recorded in the Operating Statement. All amounts are normally settled within 30 days after the invoice date.
Payables include trade payables and accrued expenses. Payables represent amounts owing for goods and services relating to the normal operations of Housing ACT received prior to 30 June but unpaid as at that date. Accrued expenses represent goods and services provided by other parties during the period that were unpaid at the end of the reporting period and where an invoice has not been received by 30 June.
2.24 Joint Ventures
Jointly Controlled Operations
On 16 May 2007, Housing ACT entered into the Lyons Estate Redevelopment Joint Venture with companies in the Hindmarsh Group to build residential units and a retirement village on Housing Act’s land at Lyons. The Joint Venture is being undertaken as a jointly controlled operation. The Hindmarsh Group is responsible for all of the construction, marketing and related activities for the redevelopment, including arranging and meeting

Hidden words
Housing ACT Notes to and Forming Part of the Financial Statements
For the Year Ended 30 June 2013
Note 2. Summary of Significant Accounting Policies (continued)
2.24 Joint Ventures – continued
all the financing costs. All assets, liabilities, income and expenses are reported by the Joint Venture in the relevant line items in its financial statements. Any costs incurred by Housing ACT on behalf of the Joint Venture have been added to the contribution to the Joint Venture and earn simple interest at 8% per annum.
2.25 Interest-Bearing Liabilities
Interest-bearing liabilities are a financial liability measured at the fair value of the consideration received when initially recognised and at amortised cost subsequent to initial recognition, with any adjustments to the carrying amount being recorded in the Operating Statement. The associated interest expense is recognised in the reporting period in which it occurs.
2.26 Employee Benefits
Employee benefits include salaries and wages, annual leave and annual leave loading, long service leave and applicable on-costs. On-costs include annual leave, long service leave, superannuation and other costs that are incurred when employees take annual leave and long service leave. Employee benefits accrue as a result of services provided by employees up to the reporting date that remain unpaid. They are recorded as a liability and an expense
No provision has been made for personal leave even though average personal leave taken is less than the annual entitlement for personal leave.
Wages and Salaries
Accrued salaries and wages are measured at the amount that remains unpaid to employees at the reporting date.
Annual and Long Service Leave
Annual leave and long service leave that fall due wholly within the next 12 months is measured based on the estimated amount of remuneration payable when the leave is taken.
Annual leave and long service leave, including applicable on-costs that do not fall due within the next 12 months are measured at the present value of estimated future payments to be made in respect of services provided by employees up to the end of the reporting date. Consideration is given to the future wage and salary levels, experience of employee departures and periods of service. At each reporting date, the present value of future payments is calculated using market yields on Commonwealth Government bonds with terms to maturity that match, as closely as possible, the estimated future cash flows. As at 30 June 2013, the rate used to estimate the present value for these future payments was 101.3% (106.6% in 2011-12).
The long service leave liability is estimated with reference to the minimum period of qualifying service. For employees with less than the required 7 years minimum period of qualifying service, the probability that they

Hidden words
Housing ACT Notes to and Forming Part of the Financial Statements
For the Year Ended 30 June 2013
Note 2. Summary of Significant Accounting Policies (continued)
2.26 Employee Benefits – continued
will reach the required minimum period has been taken into account in estimating the provision for long service leave and the applicable on-costs.
The provision for annual leave and long service leave includes estimated on-costs. As these on-costs only become payable if the employee takes annual leave and long service leave while in- service, the probability that employees will take annual leave and long service leave while in service has been taken into account when estimating the liability for on-costs.
Annual leave and long service leave liabilities are classified as current liabilities in the Balance Sheet where there are no unconditional rights to defer the settlement of the liability for at least 12 months. However, where there is an unconditional right to defer settlement of the liability for at least 12 months, the liability for annual leave and long service leave has been classified as non-current in the Balance Sheet.
2.27 Superannuation
Superannuation payments are made each fortnight to the Territory Banking Account to cover Housing ACT’s superannuation liability for the Commonwealth Superannuation Scheme (CSS) and the Public Sector Superannuation Scheme (PSS). This payment covers the employer contribution to each Scheme but does not include the productivity component. Housing ACT pays the productivity component directly to Comsuper.
The CSS and PSS are defined benefit superannuation schemes, meaning that the superannuation benefits received by employees are based on the employee’s years of service and average final salary.
Superannuation payments have also been made to superannuation funds for those employees who are members of superannuation accumulation schemes, including the Public Sector Superannuation Scheme Accumulation Plan (PSSAP) and employee schemes of choice.
Employer superannuation contribution payments for the CSS and PSS are calculated by taking the salary at an employee’s birthday date and multiplying it by the actuarially assessed nominal CSS or PSS employer contribution rate for each employee. The productivity component payments are calculated by taking the salary level, at an employee’s birthday date, and multiplying it by the employer contribution rate (approximately 3%) for each employee. Superannuation payments for the PSSAP are calculated by taking the salary level, at an employee’s birthday date, and multiplying it by the appropriate employer contribution rate. Superannuation payments for fund of choice arrangements are calculated by taking an employee’s salary each pay and multiplying it by the appropriate employer contribution rate.
A superannuation liability is not recognised in the Balance Sheet as the Territory’s Superannuation Provision Account recognises the Territory’s superannuation liability for the CSS and PSS, and Comsuper and the external schemes recognise the superannuation liability for the PSSAP and other super schemes respectively.
Hidden words
Housing ACT Notes to and Forming Part of the Financial Statements
For the Year Ended 30 June 2013
Note 2. Summary of Significant Accounting Policies (continued)
2.27 Superannuation – continued
The ACT Government is liable for the reimbursement of the emerging costs of benefits paid each year to members of the CSS and PSS in respect of the employee’s ACT Government Service provided after 1 July 1989. These reimbursement payments are made from the Superannuation Provision Account.
2.28 Insurance
Major risks are insured through the ACT Insurance Authority. The excess payable, under this arrangement, may vary depending on each class of insurance held.
2.29 Leases
Housing ACT has entered into finance leases and operating leases.
Finance Leases
Finance leases effectively transfer to Housing ACT substantially all the rewards and risks incidental to ownership of the assets under the finance lease. Title to the assets under a finance lease may or may not eventually be transferred to Housing ACT. Finance leases are initially recognised as an asset and a liability at the lower of the fair value of the asset and the present value of the minimum lease payments, each being determined at the inception of the lease.
The discount rate used to calculate the present value of the minimum lease payments is the interest rate implicit in the lease. Assets under a finance lease are depreciated over the shorter of the assets’ useful life and the lease term. Assets under a finance lease are depreciated on a straight-line basis. The depreciation is calculated after first deducting any residual value for each leased asset. Each lease payment is allocated between the interest expense and the reduction of the lease liability. Lease liabilities are classified as current and non-current.
Operating Leases
Operating leases do not effectively transfer substantially all the rewards and risks incidental to ownership of the asset to Housing ACT. Operating lease payments are recorded as an expense in the Operating Statement on a straight-line basis over the term of the lease. For further details refer to Note 38 – Commitments.
The lease for the accommodation at Nature Conservation House requires Housing ACT to make good or reinstate the premises to the same condition as at the inception of the lease on or before expiry of the lease. The make good provision is recorded as a liability.
Hidden words
Housing ACT Notes to and Forming Part of the Financial Statements
For the Year Ended 30 June 2013
Note 2. Summary of Significant Accounting Policies (continued)
2.30 Equity Contributions by the ACT Government
Capital injections made by the ACT Government as the owner of Housing ACT are treated as contributions of equity.
Increases or decreases in net assets as a result of Administrative Restructures are also recognised in equity.
2.31 Significant Accounting Judgements and Estimates
In the process of applying the accounting policies listed in this note, Housing ACT has made the following judgements that have a significant impact on the amounts recorded in the financial statements:
i. Fair Value of Assets: Housing ACT has made significant judgements and estimates in determining the fair value of its public housing portfolio. Land and buildings have been recorded at the market value of similar properties as determined by an independent valuer, Herron Todd White (Canberra) Pty Limited. The fair value of rental properties acquired after 31 March 2013 is based on their acquisition cost. In some circumstances, buildings that are purpose built or which have been substantially modified to house people with significant mobility impairments or physical and mental disabilities may realise more or less in the market.
ii. Fair Value of Investment Properties: Housing ACT has made significant judgements when determining that properties sold to tenants under the Shared Equity Scheme are to be treated as investment properties. The properties are held for the long term appreciation in their value. Housing ACT also uses judgement in assessing the fair value of the properties each reporting date and therefore the gain or loss to be recognised in the Operating Statement. The properties are valued at fair value each reporting date based upon the advice of an independent and professionally qualified valuer, Herron Todd White (Canberra) Pty Limited.
iii. Joint Arrangements: Housing ACT has made significant judgements in determining that its interest in the Lyons Land Redevelopment Joint Venture is a jointly controlled operation and also when assessing its share of costs and obligations incurred on behalf of the joint venture and how they should be treated.
iv. Employee Benefits: Significant judgements have been applied in estimating the liability for employee benefits. The estimated liability for employee benefits requires a consideration of the future wage and salary levels, experience of employee departures and periods of service. The estimate also includes an assessment of the probability that employees will meet the minimum service period required to qualify for long service leave and whether on-costs will become payable.
v. Estimation of Useful Lives of Property, Plant and Equipment and Intangible Assets: Housing ACT has made significant estimates in determining the useful lives over which property, plant and equipment are to be depreciated. The estimation of useful lives of property, plant and equipment has been based on the historical evidence of similar assets and also based on advice from the independent valuer - Herron Todd White (Canberra) Pty Limited. The useful lives are assessed on an annual basis and consider the location, type and structural integrity of the property and the likelihood of redevelopment or changes in demand for that type of property in that area. The residual values of assets have also been estimated by officers of Housing ACT or the independent valuer - Herron Todd White (Canberra) Pty Limited.
Hidden words
Housing ACT Notes to and Forming Part of the Financial Statements
For the Year Ended 30 June 2013
Note 2. Summary of Significant Accounting Policies (continued)
2.31 Significant Accounting Judgements and Estimates – continued
vi. Contingent Assets: Housing Act has made significant judgements and estimates when assessing the amount and disclosure of contingent assets. The contingent assets arise from the expected recoveries under insurance policies for claims made against Housing ACT for personal loss or injury, property damage or other public liability claims. Contingent assets may also arise from the recognition of any residual interest that Housing ACT may have in properties leased to community organisations under long term leasing arrangements. The recognition of the contingent assets considers the information and advice provided by the ACT Government Solicitor’s Office and the ACT Insurance Authority less any amounts that are the responsibility of Housing ACT to meet. The recognition of the contingent asset related to the residual interest in head-leased assets to community organisations considers the vesting of titles, the transfer of accounting control over the properties and the form and substance of the leasing arrangements.
vii. Contingent Liabilities: Housing ACT has made a significant judgement in disclosing the amount of contingent liabilities, using estimates provided by the ACT Government Solicitor’s Office and the ACT Insurance Authority, based on the assessed liability for claims against Housing ACT and reviewing contracts for any evidence that there may be a possibility that a contingent liability may arise from these contracts.
viii. Accruals and Allowance for Impairment Losses: Housing ACT has made significant estimates and assumptions to determine the accruals for revenues and expenses and in quantifying impairment losses, and in particular quantifying the allowance for impairment of receivables. The estimates are based upon the review of outstanding invoices, historical trends and transactions and events just prior to the reporting date.
ix. Assets Held For Sale: Housing ACT made significant estimates and assumptions when determining the timing and probability of sale and the likely sale proceeds for properties included in assets held for sale, including the inclusion or exclusion of the larger multi-unit sites that have been identified for future sale or redevelopment and sale. The determination of assets held for sale follows an analysis of properties as they become vacant to ascertain the need for properties in that area, of that size, type and construction to house people on the Social Housing Register, whether the homes has been modified to house people with a disability or impaired mobility, the potential for redevelopment and the cost to maintain to the standard required for re-letting for public housing. Properties that are assessed as being no longer suitable for public housing and/or have limited potential for redevelopment are identified for sale.

Hidden words
Housing ACT Notes to and Forming Part of the Financial Statements
For the Year Ended 30 June 2013
Note 2. Summary of Significant Accounting Policies (continued)
2.32 Impact of Accounting Standards Issued but yet to be Applied
The following new and revised accounting standards and interpretations have been issued by the Australian Accounting Standards Board but do not apply to the current reporting period. These standards and interpretations are applicable to future reporting periods. Housing ACT does not intend to adopt these standards and interpretations early. It is estimated that the effect of adopting the below pronouncements, when applicable, will have no material financial impact on Housing ACT in future reporting periods:
• AASB 9 Financial Instruments (application date 1 January 2015);
• AASB 10 Consolidated Financial Statements (application date 1 January 2013 for for-profit entities and 1 January 2014 for not-for-profit entities);
• AASB 11 Joint Arrangements (application date 1 January 2013 for for-profit entities and 1 January 2014 for not-for-profit entities);
• AASB 12 Disclosure of Interests in Other Entities (application date 1 January 2013 for for-profit entities and 1 January 2014 for not-for-profit entities);
• AASB 13 Fair Value Measurement (application date 1 January 2013);
• AASB 119 Employee Benefits (application date 1 January 2013);
• AASB 127 Separate Financial Statements (application date 1 January 2013 for for-profit entities and 1 January 2014 for not-for-profit entities);
• AASB 128 Investments in Associates and Joint Ventures (application date 1 January 2013 for for-profit entities and 1 January 2014 for not-for-profit entities);
• AASB 1055 Budgetary Reporting (application date 1 July 2014);
• AASB 2010-7 Amendments to Australian Accounting Standards arising from AASB 9 (December 2010) [AASB 1, 3, 4, 5, 7, 101, 102, 108, 112, 118, 120, 121, 127, 128, 131, 132, 136, 137, 139, 1023 & 1038 and Interpretations 2, 5, 10, 12, 19 & 127] (application date 1 January 2015);
• AASB 2011-7 Amendments to Australian Accounting Standards arising from the Consolidation and Joint Arrangements Standards [AASB 1, 2, 3, 5, 7, 9, 2009-11, 101, 107, 112, 118, 121, 124, 132, 133, 136, 138, 139, 1023 & 1038 and Interpretations 5, 9, 16 & 17] (application date 1 January 2013 for for-profit entities and 1 January 2014 for not-for-profit entities);
• AASB 2011-8 Amendments to Australian Accounting Standards arising from AASB 13 [AASB 1, 2, 3, 4, 5, 7, 9, 2009-11, 101, 107, 112, 118, 119, 120, 121, 128, 131, 132, 133, 134, 136, 138, 139, 140, 141, 1004, 1023 & 1038 and Interpretations 2, 4, 12, 13, 14, 17, 19, 131 & 132] (application date 1 January 2013);
Hidden words
Housing ACT Notes to and Forming Part of the Financial Statements
For the Year Ended 30 June 2013
Note 2. Summary of Significant Accounting Policies (continued)
2.32 Impact of Accounting Standards Issued but yet to be Applied (continued)
• AASB 2012-2 Amendments to Australian Accounting Standards – Disclosures – Offsetting Financial Assets and Financial Liabilities [AASB 7 & 132] (application date 1 January 2013);
• AASB 2012-3 Amendments to Australian Accounting Standards – Offsetting Financial Assets and Financial Liabilities [AASB 132] (application date 1 January 2014);
• AASB 2012-5 Amendments to Australian Accounting Standards arising from Annual Improvements 2009-2011 Cycle [AASB 1, 1010, 116, 132 & 134 and Interpretation 2] (application date 1 January 2013).
• AASB 2012-6 Amendment to Australian Accounting Standards – Mandatory Effective Date of AASB 9 and Transition Disclosures [AASB 9, 2009-11, 2010-7, & 2011-8] (application date 1 January 2013);
• AASB 2012-10 Amendments to Australian Accounting Standards – Transition Guidance and Other Amendments [AASB 1, 5, 7, 8, 10, 11, 12, 13, 101, 102, 108, 112, 118, 119, 127, 128, 132, 133, 134, 137, 1023, 1038, 1039, 1049 & 2] (application date 1 January 2013); and
• AASB 2013-3 Amendments to AASB 136 – Recoverable Amount Disclosures for Non–Financial Assets (application date 1 January 2014).
Hidden words
Housing ACT Notes to and Forming Part of the Financial Statements
For the Year Ended 30 June 2013
NOTE 3. Change in Accounting Policy and Accounting Estimates, and Correction of a Prior Period Error
Change in Accounting Policy
Housing ACT had no changes in Accounting Policy during the reporting period.
Change in Accounting Estimates
Revision of Estimation of the Employee Benefit Liability
As disclosed in Note 2.26 – Employee Benefits, annual leave and long service leave, including applicable on-costs, which do not fall due in the next 12 months, are measured at the present value of estimated payments to be made in respect of services provided by employees up to the reporting date. The present value of future payments is estimated using the relevant government bond rate.
Last financial year the present value rate was 106.6%. However, due to a change in the government bond rate, the rate is now 101.3%.
As such the estimate of the long service leave liability has changed. This change has resulted in a decrease of the estimated long service leave liability and expense in the current reporting period of $189,387. There was no change in the estimate of the annual leave liability and expense as it is assumed that the amounts will be paid within the next 12 months.
Correction of Prior Period Error
Housing ACT had no correction of prior period errors during the reporting period.
Hidden words
Housing ACT Notes to and Forming Part of the Financial Statements
For the Year Ended 30 June 2013
NOTE 4. GOVERNMENT PAYMENT FOR OUTPUTS
Government Payment for Outputs (GPO) refers to appropriations from the ACT Government and includes funding under the National Affordable Housing Agreement (NAHA). The Commonwealth Government pays the NAHA funding directly to the Chief Minister and Treasury Directorate monthly. Housing ACT draws GPO on a fortnightly basis.
2013 2012 $’000 $’000
Revenue from the ACT Government
Government Payment for Outputs 42,673 43,336
Total Government Payment for Outputs 42,673 43,336
The decrease in Government Payment for Outputs in 2012-13 is due to the reduction in Commonwealth funding under the National Affordable Housing Agreement, which flows through to a reduction in Government Payment for Outputs and from the ACT Government saving measures announced in the 2011-12 Budget.
NOTE 5. USER CHARGES
User charges are derived from the provision of goods and services to other ACT Government agencies and to the public.
User-charges are paid by the user of the goods or services and are commercial in nature, but subject to substantial discounting under current policy settings.
2013 2012 $’000 $’000
User Charges - Non-ACT Government
Market Renta) 228,712 218,784 Less: Rent Rebatesb) (139,194) (133,036) Less: Rent Provided Free of Chargec) (871) (914) Less: Other Rent Provided Freed) (170) (183)
Total User Charges - Non-ACT Government 88,477 84,651
Total User Charges 88,477 84,651
a) Market rents are assessed annually by an independent valuer, currently Mr David James, AAPI Certified Practising Valuer and Director of Herron Todd White (Canberra) Pty Limited. This assessment is used to determine the market rent applicable for each property in the public rental-housing portfolio. The public housing market rents increased in 2012-13 in line with the increase in rents in the residential market in the ACT.
b) Under current policy settings, tenants eligible for a rebate of their rent, pay no than 25% of their assessable household income as rent or market rent, whichever is the lesser. As over 92% of tenants are in receipt of a rebate, the rental rebates also increased following the increase in market rents.
c) Rent provided free of charge represents the amount of rent forgone on properties leased to community organisations at nil rent or a reduced rent.
d) Other rent provided free represents the rent free period provided to tenants at the commencement of their tenancies. The rent free period does not exceed three weeks.
Hidden words
Housing ACT Notes to and Forming Part of the Financial Statements
For the Year Ended 30 June 2013
NOTE 6. INTEREST 2013 2012
$’000 $’000 Revenue from Non-ACT Government Entities
Interest Revenue from Bank a) 146 276 Interest Revenue from the Joint Venture b) 346 472 Interest Received from the Solicitor's Trust Accounts c) 32 125
Total Interest Revenue from Non-ACT Government Entities 524 873
Total Interest 524 873
Total interest revenue from financial assets not at fair value through profit and loss 524 873
a) Housing ACT is able to earn interest on the balance in its Operating Account and other accounts held with the whole of government banking service provider. The decrease in interest revenue on the bank balances is due to the decline in interest rates over the year and more funds being invested in the Cash Enhanced Portfolio with the Territory Bank Account during the year to maximise interest earnings.
b) Interest is receivable on the value of the land contribution to the Lyons Estate Redevelopment Joint Venture from the date that an unconditional Development Application is approved. Simple interest at 8% per annum is payable by the Joint Venture, with payment of the interest due at the time that leases are issued to individual purchasers of units or at such later time, as agreed by the Joint Venture partners. The interest accrued is added to the value of the Joint Venture land receivable and shown in the Balance Sheet as a non-current receivable, as payment is not expected before 2015-16.
c) Housing ACT requires those solicitors who act for it, in the purchase and sale of properties, to open and maintain an interest-bearing account through which Housing ACT's property transactions are to occur. A float is provided to each solicitor to enable them to pay deposits and settle property purchases. Interest on the balance held in the solicitor's trust accounts is payable to Housing ACT. The decrease in interest received is due to the reduction in the number of solicitors acting on behalf of Housing ACT during 2012-13. The number of solicitors acting on behalf of Housing ACT reduced from three to one and therefore the amount of money held by the solicitors reduced from $4.5 million to $1.5 million.

Hidden words
Housing ACT Notes to and Forming Part of the Financial Statements
For the Year Ended 30 June 2013
NOTE 7. DISTRIBUTION FROM INVESTMENTS WITH THE TERRITORY BANKING ACCOUNT
2013 2012 $’000 $’000
Revenue from ACT Government Entities
Distribution from Investments with the Territory Banking Accounta) 1,736 2,734
Total Distribution from Investment with the Territory Banking Account 1,736 2,734
a) The decrease in distribution from investments is due in part to the decline in interest rates over the year and also from the timing of funds invested with the Territory Bank Account during the year. Funds were withdrawn when required to meet construction contract payments and operating expenses as they became due and payable during the year and particularly early in the year, whilst the sales proceeds for many of the higher value properties occurred later in the year.
NOTE 8. RESOURCES RECEIVED FREE OF CHARGE Resources received free of charge arise from goods or services being provided free of charge by other agencies in the ACT Government. Housing ACT did not receive any goods and services free of charge from entities external to the ACT Government, but if this occurred they would be classified as donations.
2013 2012 $’000 $’000
Revenue from ACT Government Entities
Legal Services 254 24
Total Resources Received Free of Charge 254 24
The ACT Government Solicitor’s Office provides advice and assistance on legal matters and represents Housing ACT at the ACT Civil and Administrative Tribunal or in the Courts on residential tenancy or housing assistance matters. The increase in legal services provided by the ACT Government Solicitor’s Office in 2012-13 is due to a number of factors, including that Housing ACT sought more Conditional Orders in the ACT Civil and Administrative Tribunal in 2012-13 seeking that tenants comply with their tenancy obligations, particularly around payment of rent and moderating inappropriate behaviours. Secondly, tenant advocacy groups are challenging more of the decisions by Housing ACT to seek Orders for eviction and this necessitates increased ACT Government Solicitor’s Office involvement in the appeals, particularly if they involve points of law, rather than simply tenancy matters, and with the changes to the administration of the ACT Civil and Administrative Tribunal, the uncertainty about likely outcomes has required more involvement by the ACT Government Solicitor’s Office in proceedings before the Tribunal.

Hidden words
Housing ACT Notes to and Forming Part of the Financial Statements
For the Year Ended 30 June 2013
NOTE 9. OTHER REVENUE
Other revenue arises from the core activities of Housing ACT providing a range of housing assistance measures and generally relate to recoveries from third parties. Other revenue is reported separately from other gains.
2013 2012 $’000 $’000
Revenue from ACT Government Entities
Insurance Recoveriesa) 1,974 1,160 Other Recoveries from ACT Government Entitiesb) 2,507 179
Total Other Revenue from ACT Government Entities 4,481 1,339
Revenue from Non-ACT Government Entities
Insurance Recoveries 56 -Recoveries from Tenantsc) 1,916 1,870 Bad Debts Recovered 50 12 Site Fees from the Narrabundah Caravan Park 452 500 Otherd) 1,081 254
Total Other Revenue from Non-ACT Government Entities 3,555 2,636
Total Other Revenue 8,036 3,975
a) The increase in insurance recoveries is due to the higher number of claims settled during 2012-13, particularly public liability claims. The settlement of public liability claims can take many years from the date of the incident or event and often involves a Court or out-of-court settlement after protracted negotiations. Therefore, insurance recoveries each year depend more on the timing of settlements notified by the ACT Insurance Authority during the year, than the occurrence of incidents during the year.
b) The increase in other recoveries from ACT Government Entities in 2012-13 is mainly due to the receipt of funding from the Economic Development Directorate for rectification works and the relocation of residents at the Narrabundah Long Stay Park and a higher recovery from the Community Services Directorate for accommodation and associated a on-costs for staff located in Nature Conservation House and paid in the first instance by Housing ACT.
c) Recoveries from tenants represents the amount charged to tenants for the cost of tenant responsible maintenance paid in the first instance by Housing ACT. This amount may vary from year to year due to a number of factors, such as the type and extent of damage to properties and the number of tenancies that have ceased during the year, as a large proportion of the damage is identified at the end of the tenancy and relates to cleaning and repair of the property in order to enable the property to be re-let.
d) The increase in other revenue from Non-ACT Government entities is mainly due to receipts from Community Housing Canberra Limited, trading as CHC Affordable Housing for payment for a number of units developed by Housing ACT in conjunction with Community Housing Canberra Limited and retained by them.
Hidden words
Housing ACT Notes to and Forming Part of the Financial Statements
For the Year Ended 30 June 2013
NOTE 10. GAINS
The sale of properties plays an important role in the revitalisation of public housing under Housing ACT's asset management strategy, as the proceeds from sales are used to fund the refurbishment or replacement of properties to better meet tenant needs. The sale of properties often leads to gains due to the higher amounts received from the sale compared to the carrying value.
Gains from investments arise from the increase in value of the Cash Enhanced Portfolio investments held with the Territory Banking Account and the increase in value of Housing ACT's investment properties as represented by as by the share of equity in properties sold under the Shared Equity Scheme retained by Housing ACT.
Other gains are reported separately from other revenue, as other revenue arises from Housing ACT's core activities. Other gains arise from the sale of plant and equipment (motor vehicles under a finance lease) and the return of properties from the community housing sector and the Affordable Rental Office.
Gains from the Sale of Property Gross Proceeds from the Sale of Property
Less: Carrying Value of Property Less: Selling Expenses
2013 2012 $’000 $’000
27,804 19,998 (25,424) (18,020)
(618) (656)
Total Gains from the Sale of Property a) 1,762 1,322
Gains On Investments Unrealised Gains on Investmentsb) 90
Total Gains on Investments 90 -
Gains On Investment Properties Unrealised Gains on Investment Properties c) - 62
Total Gains on Investment Properties - 62
Other Gains Assets Transferred from Other Entities Assets Transferred from Other Entitiesd) 319
Total Assets Transferred from Other Entities 319
Gains from Sale of Plant and Equipment Gross Proceeds from the Sale of Plant and Equipment 44 209
Less: Written-Down Value of Plant and Equipment (28) (167)
Total Gains from Sale of Plant and Equipment e) 16 42
Total Other Gains 335 42
Total Gains 2,187 1,426

Hidden words
Housing ACT Notes to and Forming Part of the Financial Statements
For the Year Ended 30 June 2013
NOTE 10. GAINS – CONTINUED
a) The increase in gains from the sale of properties is due to the number of high value properties sold during the year. The proceeds from the sales are used to purchase replacement properties to house people and families most in need or to refurbish existing properties.
b) The unrealised gain on investments arises from the movement in price of the underlying investments in the Cash Enhanced Portfolio with the Territory Bank Account. There was a loss in 2011-12, refer to Note 17 – Other Expenses for more details.
c) The unrealised gain on investment properties in 2011-12 relates to the increase in value of the equity in properties sold to tenants under the Shared Equity Scheme and derived from the increase in value of the underlying properties. In 2012-13 there was an unrealised loss due to a slight decrease in the value of the underlying properties held as investment properties, refer to Note 17 – Other Expenses for more details. The decline in value of the properties was in line with general market movements for residential properties in the ACT during 2012-13.
d) The gain from assets transferred to Housing ACT from other entities arose from the return of a dwelling from the Affordable Rental Office for use as public housing and is part of the normal arrangements for exchanging properties between the Affordable Rental Office and Housing ACT.
e) The gain from the sale of plant and equipment is derived from the sale of motor vehicles upon the expiration of the finance lease. The number of sales varies each year depending upon the timing of the original acquisition and the number leased each year.
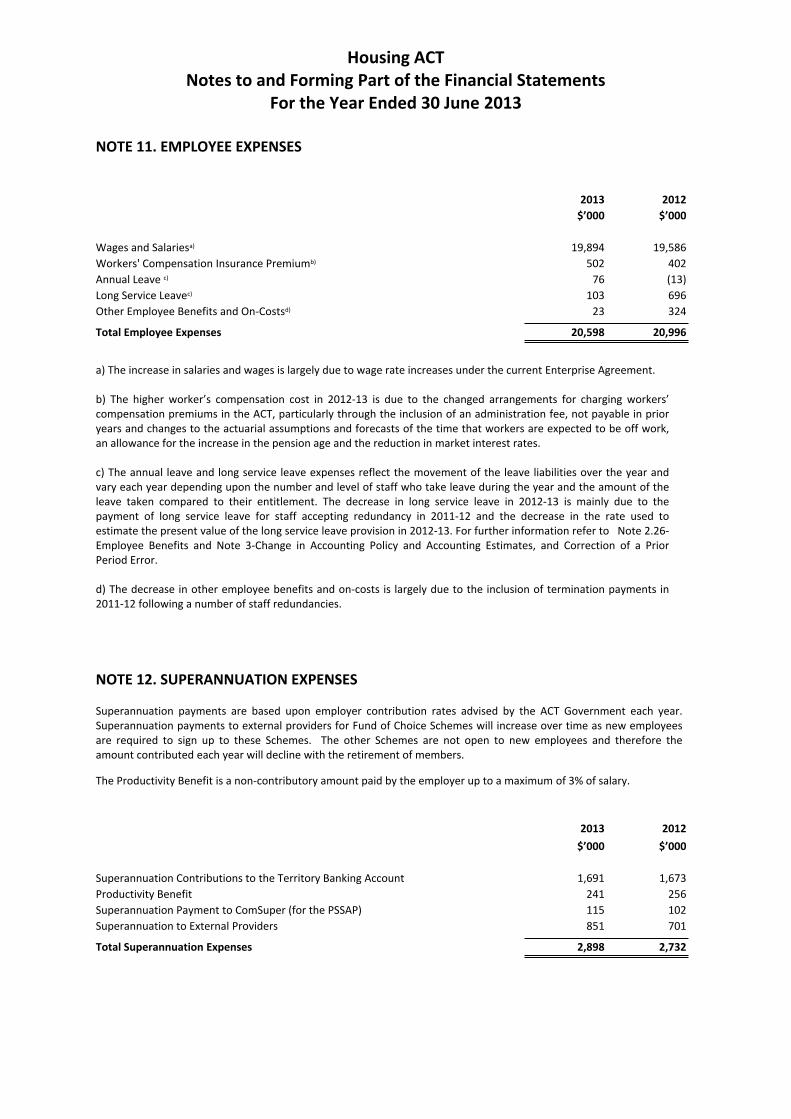
Hidden words
Housing ACT Notes to and Forming Part of the Financial Statements
For the Year Ended 30 June 2013
NOTE 11. EMPLOYEE EXPENSES
2013 2012 $’000 $’000
Wages and Salariesa) 19,894 19,586 Workers' Compensation Insurance Premiumb) 502 402 Annual Leave c) 76 (13) Long Service Leavec) 103 696 Other Employee Benefits and On-Costsd) 23 324
Total Employee Expenses 20,598 20,996
a) The increase in salaries and wages is largely due to wage rate increases under the current Enterprise Agreement.
b) The higher worker’s compensation cost in 2012-13 is due to the changed arrangements for charging workers’ compensation premiums in the ACT, particularly through the inclusion of an administration fee, not payable in prior years and changes to the actuarial assumptions and forecasts of the time that workers are expected to be off work, an allowance for the increase in the pension age and the reduction in market interest rates.
c) The annual leave and long service leave expenses reflect the movement of the leave liabilities over the year and vary each year depending upon the number and level of staff who take leave during the year and the amount of the leave taken compared to their entitlement. The decrease in long service leave in 2012-13 is mainly due to the payment of long service leave for staff accepting redundancy in 2011-12 and the decrease in the rate used to estimate the present value of the long service leave provision in 2012-13. For further information refer to Note 2.26Employee Benefits and Note 3-Change in Accounting Policy and Accounting Estimates, and Correction of a Prior Period Error.
d) The decrease in other employee benefits and on-costs is largely due to the inclusion of termination payments in 2011-12 following a number of staff redundancies.
NOTE 12. SUPERANNUATION EXPENSES
Superannuation payments are based upon employer contribution rates advised by the ACT Government each year. Superannuation payments to external providers for Fund of Choice Schemes will increase over time as new employees are required to sign up to these Schemes. The other Schemes are not open to new employees and therefore the amount contributed each year will decline with the retirement of members.
The Productivity Benefit is a non-contributory amount paid by the employer up to a maximum of 3% of salary.
2013 2012 $’000 $’000
Superannuation Contributions to the Territory Banking Account 1,691 1,673 Productivity Benefit 241 256 Superannuation Payment to ComSuper (for the PSSAP) 115 102 Superannuation to External Providers 851 701
Total Superannuation Expenses 2,898 2,732

Hidden words
Housing ACT Notes to and Forming Part of the Financial Statements
For the Year Ended 30 June 2013
NOTE 13. SUPPLIES AND SERVICES
2013 2012 $’000 $’000
Repairs and Maintenance 36,803 36,698 General Rates, Sewerage Rates, Water Rates and Consumptiona) 27,258 24,018 Professional Services b) 1,404 2,899 Property Services c) 1,441 601 Other Property Expenses 3,340 3,291 Systems Support d) 3,224 2,879 Insurance Premiumse) 2,477 2,152 Other Operating Expenses f) 3,844 3,686 Communications and Office Supplies 546 505 Accommodationg) 2,278 2,117 Recruitment, Training and Other Staff On-Costs 259 282
Total Supplies and Services 82,874 79,128
a) The higher expenditure on general rates, sewerage and water rates and consumption charges in 2012-13 is due to the increase in general rates payable as a result of the introduction of the taxation reforms announced in the 2011-12 Budget: A fairer, simpler and more efficient taxation system. Pursuant to these reforms the ACT Government is phasing out stamp duty charges on the acquisition of properties and the funding lost through this measure is replaced by an increase in the general rates payable for each property in the ACT. This change in the rating system increased the general rates cost to Housing ACT by over $1.2 million in 2012-13 and is expected to increase the rates payable in future years by a comparable amount. Higher water consumption charges also occurred for the year.
b) The decrease in professional service costs for the year is largely due to the lower expenditure on consultants. In 2011-12 significant consultancy costs were incurred in respect of the major redevelopment projects that commenced and were progressed during that year.
c) The increase in the cost of property services during 2012-13 is mainly due to the costs for rectification works at the Narrabundah Long Stay Park to repair and re-instate infrastructure and repair and rectify structures at the Park to achieve the agreed level of compliance with the Building Code of Australia.
d) The increase in 2012-13 for systems support is largely due to the payment of the Homenet system upgrade costs not capitalised.
e) The higher insurance costs in 2012-13 are due to higher premium charges. The increase is largely attributable to the increase in the cost of insuring the property portfolio and for business interruption from the loss of properties. The premium calculation is based upon an actuarial estimate of the past, current and future claims, including an allowance for claims management and re-insurance expense.
f) The higher other operating expenses in 2012-13 largely relate to the higher costs associated with relocating tenants and higher administration and overhead costs.
g) The higher accommodation costs in 2012-13 are due to the increased costs for leasing the office accommodation and some additional fitout works undertaken during the year.
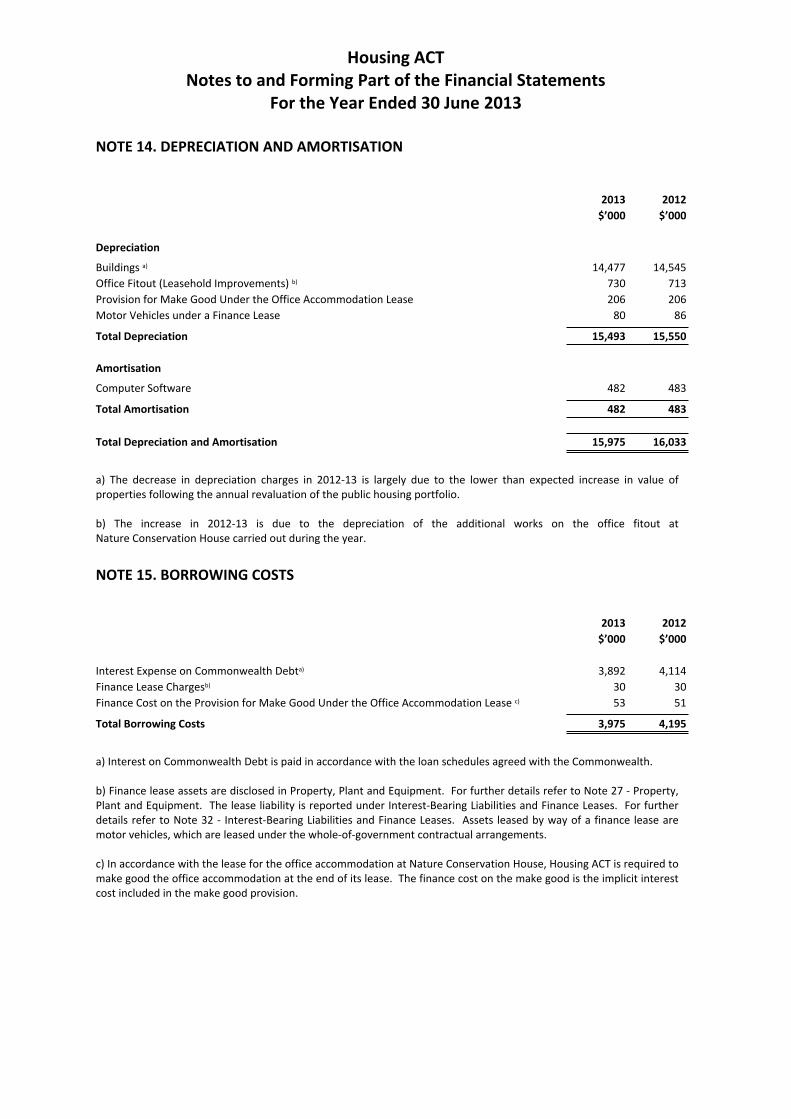
Hidden words
Housing ACT Notes to and Forming Part of the Financial Statements
For the Year Ended 30 June 2013
NOTE 14. DEPRECIATION AND AMORTISATION
2013 2012 $’000 $’000
Depreciation
Buildings a) 14,477 14,545 Office Fitout (Leasehold Improvements) b) 730 713 Provision for Make Good Under the Office Accommodation Lease 206 206 Motor Vehicles under a Finance Lease 80 86
Total Depreciation 15,493 15,550
Amortisation
Computer Software 482 483
Total Amortisation 482 483
Total Depreciation and Amortisation 15,975 16,033
a) The decrease in depreciation charges in 2012-13 is largely due to the lower than expected increase in value of properties following the annual revaluation of the public housing portfolio.
b) The increase in 2012-13 is due to the depreciation of the additional works on the office fitout at Nature Conservation House carried out during the year.
NOTE 15. BORROWING COSTS
2013 2012 $’000 $’000
Interest Expense on Commonwealth Debta) 3,892 4,114 Finance Lease Chargesb) 30 30 Finance Cost on the Provision for Make Good Under the Office Accommodation Lease c) 53 51
Total Borrowing Costs 3,975 4,195
a) Interest on Commonwealth Debt is paid in accordance with the loan schedules agreed with the Commonwealth.
b) Finance lease assets are disclosed in Property, Plant and Equipment. For further details refer to Note 27 - Property, Plant and Equipment. The lease liability is reported under Interest-Bearing Liabilities and Finance Leases. For further details refer to Note 32 - Interest-Bearing Liabilities and Finance Leases. Assets leased by way of a finance lease are motor vehicles, which are leased under the whole-of-government contractual arrangements.
c) In accordance with the lease for the office accommodation at Nature Conservation House, Housing ACT is required to make good the office accommodation at the end of its lease. The finance cost on the make good is the implicit interest cost included in the make good provision.
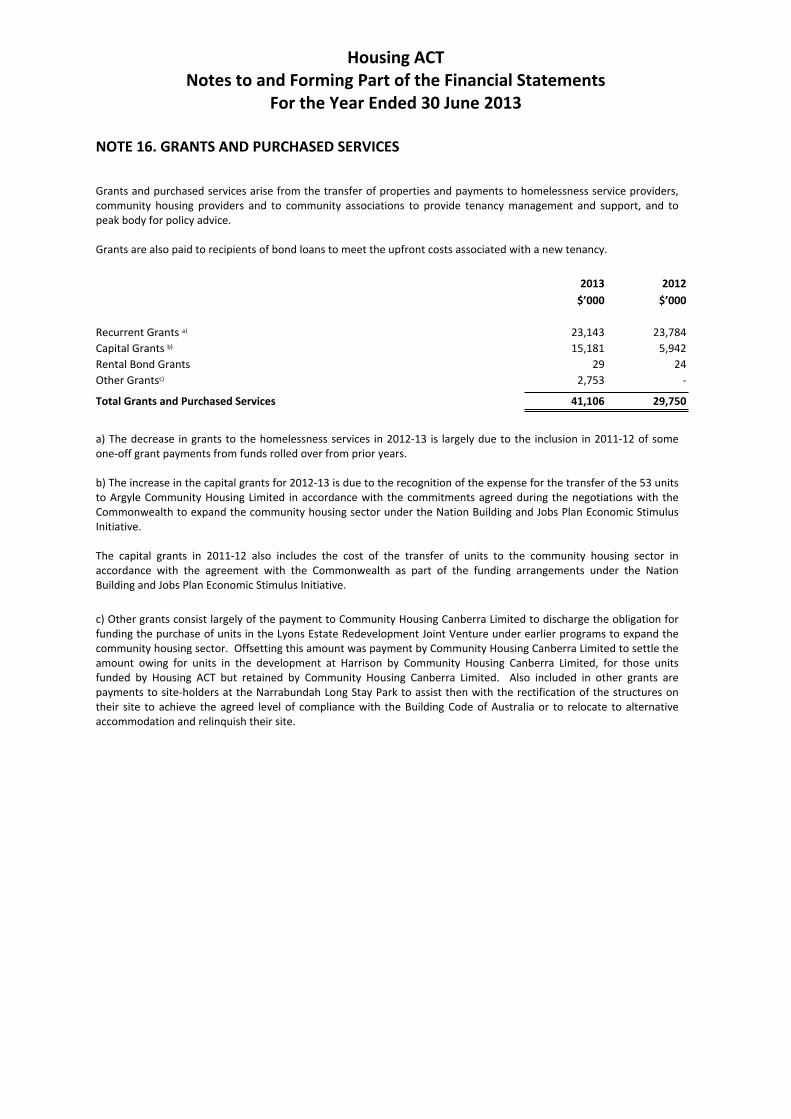
Hidden words
Housing ACT Notes to and Forming Part of the Financial Statements
For the Year Ended 30 June 2013
NOTE 16. GRANTS AND PURCHASED SERVICES
Grants and purchased services arise from the transfer of properties and payments to homelessness service providers, community housing providers and to community associations to provide tenancy management and support, and to peak body for policy advice.
Grants are also paid to recipients of bond loans to meet the upfront costs associated with a new tenancy.
2013 2012 $’000 $’000
Recurrent Grants a) 23,143 23,784 Capital Grants b) 15,181 5,942 Rental Bond Grants 29 24 Other Grantsc) 2,753 -
Total Grants and Purchased Services 41,106 29,750
a) The decrease in grants to the homelessness services in 2012-13 is largely due to the inclusion in 2011-12 of some one-off grant payments from funds rolled over from prior years.
b) The increase in the capital grants for 2012-13 is due to the recognition of the expense for the transfer of the 53 units to Argyle Community Housing Limited in accordance with the commitments agreed during the negotiations with the Commonwealth to expand the community housing sector under the Nation Building and Jobs Plan Economic Stimulus Initiative.
The capital grants in 2011-12 also includes the cost of the transfer of units to the community housing sector in accordance with the agreement with the Commonwealth as part of the funding arrangements under the Nation Building and Jobs Plan Economic Stimulus Initiative.
c) Other grants consist largely of the payment to Community Housing Canberra Limited to discharge the obligation for funding the purchase of units in the Lyons Estate Redevelopment Joint Venture under earlier programs to expand the community housing sector. Offsetting this amount was payment by Community Housing Canberra Limited to settle the amount owing for units in the development at Harrison by Community Housing Canberra Limited, for those units funded by Housing ACT but retained by Community Housing Canberra Limited. Also included in other grants are payments to site-holders at the Narrabundah Long Stay Park to assist then with the rectification of the structures on their site to achieve the agreed level of compliance with the Building Code of Australia or to relocate to alternative accommodation and relinquish their site.
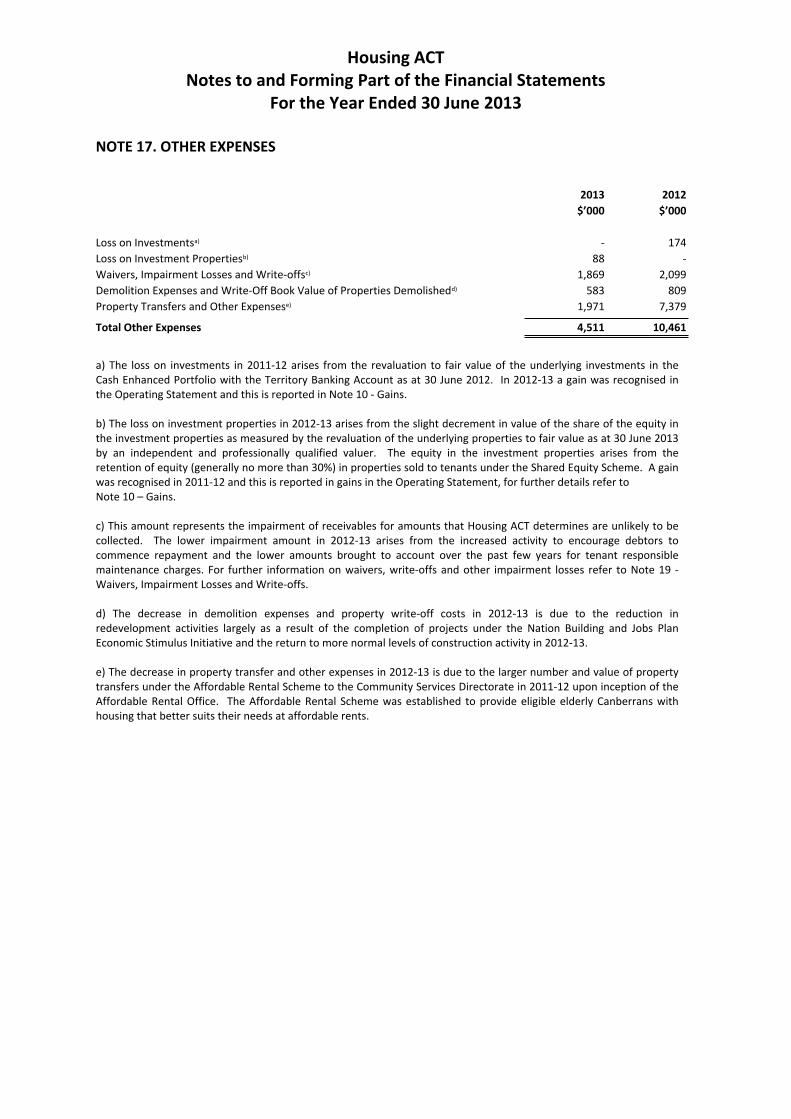
Hidden words
Housing ACT Notes to and Forming Part of the Financial Statements
For the Year Ended 30 June 2013
NOTE 17. OTHER EXPENSES
2013 2012 $’000 $’000
Loss on Investmentsa) - 174 Loss on Investment Propertiesb) 88 Waivers, Impairment Losses and Write-offsc) 1,869 2,099 Demolition Expenses and Write-Off Book Value of Properties Demolishedd) 583 809 Property Transfers and Other Expensese) 1,971 7,379
Total Other Expenses 4,511 10,461
a) The loss on investments in 2011-12 arises from the revaluation to fair value of the underlying investments in the Cash Enhanced Portfolio with the Territory Banking Account as at 30 June 2012. In 2012-13 a gain was recognised in the Operating Statement and this is reported in Note 10 - Gains.
b) The loss on investment properties in 2012-13 arises from the slight decrement in value of the share of the equity in the investment properties as measured by the revaluation of the underlying properties to fair value as at 30 June 2013 by an independent and professionally qualified valuer. The equity in the investment properties arises from the retention of equity (generally no more than 30%) in properties sold to tenants under the Shared Equity Scheme. A gain was recognised in 2011-12 and this is reported in gains in the Operating Statement, for further details refer to Note 10 – Gains.
c) This amount represents the impairment of receivables for amounts that Housing ACT determines are unlikely to be collected. The lower impairment amount in 2012-13 arises from the increased activity to encourage debtors to commence repayment and the lower amounts brought to account over the past few years for tenant responsible maintenance charges. For further information on waivers, write-offs and other impairment losses refer to Note 19 Waivers, Impairment Losses and Write-offs.
d) The decrease in demolition expenses and property write-off costs in 2012-13 is due to the reduction in redevelopment activities largely as a result of the completion of projects under the Nation Building and Jobs Plan Economic Stimulus Initiative and the return to more normal levels of construction activity in 2012-13.
e) The decrease in property transfer and other expenses in 2012-13 is due to the larger number and value of property transfers under the Affordable Rental Scheme to the Community Services Directorate in 2011-12 upon inception of the Affordable Rental Office. The Affordable Rental Scheme was established to provide eligible elderly Canberrans with housing that better suits their needs at affordable rents.

Hidden words
Housing ACT Notes to and Forming Part of the Financial Statements
For the Year Ended 30 June 2013
NOTE 18. AUDITOR’S REMUNERATION
Auditor's remuneration represents the payments for financial audit services provided by the ACT Auditor-General's Office.
2013 2012 $’000 $’000
Audit Services
Audit Fees Paid to the ACT Auditor-General's Office 107 100
Total Auditor's Remuneration 107 100
No other services were provided by the ACT Auditor-General's Office.
These costs are included in professional services in Supplies and Services, refer to Note 13 - Supplies and Services.

Hidden words
Housing ACT Notes to and Forming Part of the Financial Statements
For the Year Ended 30 June 2013
NOTE 19. WAIVERS, IMPAIRMENT LOSSES AND WRITE-OFFS
Under Section 131 of the Financial Management Act 1996, the Treasurer may waive the right to payment of an amount payable to Housing ACT. A waiver is the relinquishment of a legal claim to a debt. Waivers differ from write-offs as a write-off is the accounting action taken to remove a debt from the books, but does not relinquish the legal right of Housing ACT to recover the amount.
The waivers, impairment losses and write-offs listed below occurred during the reporting period.
2013 2012 Waivers No. $’000 No. $’000
In 2012-13, one waiver was made pursuant to Section 131 of the Financial Management Act 1996.
Waivers 1 1 1 5
Total Waivers 1 1 1 5
Impairment Losses
Impairment Losses from Receivables Rent Receivablesa), b) - 73 - 163 Other Trade Receivablesa), b) - 170 - 645 Total Impairment Losses from Receivables - 243 - 808
Total Impairment Losses - 243 - 808
Write-Offs
Irrecoverable Debtsa) 987 1,620 758 1,267 Capital Works in Progressc) 15 5 9 19
Total Write-Offs 1,002 1,625 767 1,286
Total Waivers, Impairment Losses and Write-Offs 1,003 1,869 768 2,099
a) The amount of impairment losses and irrecoverable debts written off varies each year depending upon a number of factors, including the amount and type of debt, the circumstances of each individual debtor and the date of the last transaction on the account. Whilst an allowance for impairment losses is made each year based upon the aging of the debt, the debtor's payment history and likelihood of collection, Housing ACT generally only writes off a debt as bad once a tenancy has terminated and there is very little likelihood of recovery.
b) The number of accounts that are the subject of impairment is not recorded as the impairment expense is not calculated by reference to individual debtor accounts, but is calculated based upon the age of accounts, the length of time since any action occurred on the account and the engagement or lack of engagement and negotiation with the debtor.
c) The write-off of capital works in progress occurs where expenditure incurred against a project, such as site investigations, preliminary investigations and feasibility and other studies bear no relationship with the final development works, i.e., the development does not occur in accordance with the plans originally contemplated when the studies and other works were undertaken and there is no project against which the costs can be capitalised.
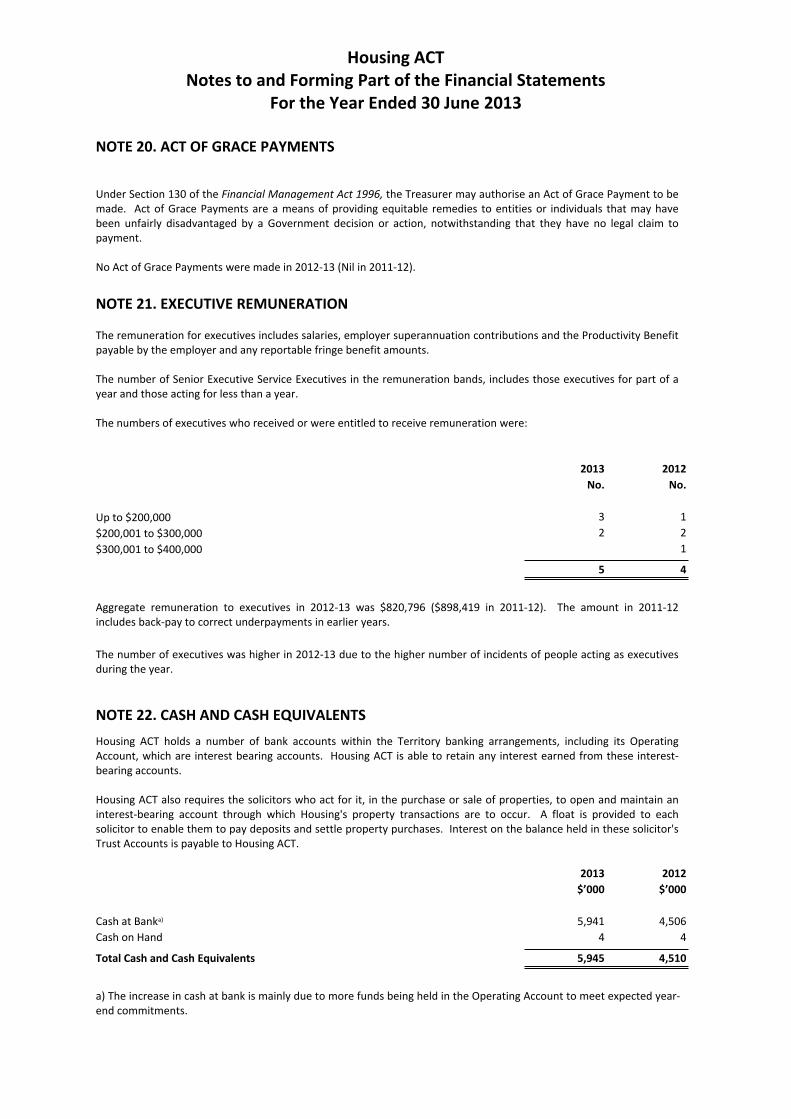
Hidden words
Housing ACT Notes to and Forming Part of the Financial Statements
For the Year Ended 30 June 2013
NOTE 20. ACT OF GRACE PAYMENTS
Under Section 130 of the Financial Management Act 1996, the Treasurer may authorise an Act of Grace Payment to be made. Act of Grace Payments are a means of providing equitable remedies to entities or individuals that may have been unfairly disadvantaged by a Government decision or action, notwithstanding that they have no legal claim to payment.
No Act of Grace Payments were made in 2012-13 (Nil in 2011-12).
NOTE 21. EXECUTIVE REMUNERATION
The remuneration for executives includes salaries, employer superannuation contributions and the Productivity Benefit payable by the employer and any reportable fringe benefit amounts.
The number of Senior Executive Service Executives in the remuneration bands, includes those executives for part of a year and those acting for less than a year.
The numbers of executives who received or were entitled to receive remuneration were:
2013 No.
2012 No.
Up to $200,000 $200,001 to $300,000 $300,001 to $400,000
3 2
5
1 2 1
4
Aggregate remuneration to executives in 2012-13 was $820,796 ($898,419 in 2011-12). The amount in 2011-12 includes back-pay to correct underpayments in earlier years.
The number of executives was higher in 2012-13 due to the higher number of incidents of people acting as executives during the year.
NOTE 22. CASH AND CASH EQUIVALENTS Housing ACT holds a number of bank accounts within the Territory banking arrangements, including its Operating Account, which are interest bearing accounts. Housing ACT is able to retain any interest earned from these interest-bearing accounts.
Housing ACT also requires the solicitors who act for it, in the purchase or sale of properties, to open and maintain an interest-bearing account through which Housing's property transactions are to occur. A float is provided to each solicitor to enable them to pay deposits and settle property purchases. Interest on the balance held in these solicitor's Trust Accounts is payable to Housing ACT.
2013 2012 $’000 $’000
Cash at Banka) 5,941 4,506 Cash on Hand 4 4
Total Cash and Cash Equivalents 5,945 4,510
a) The increase in cash at bank is mainly due to more funds being held in the Operating Account to meet expected year-end commitments.

Hidden words
Housing ACT Notes to and Forming Part of the Financial Statements
For the Year Ended 30 June 2013
NOTE 23. RECEIVABLES
2013 2012 $’000 $’000
Current Receivables
Rent Receivablesa) 4,346 2,759 Less: Allowance for Impairment Losses (1,241) (1,169)
Net Rent Receivable 3,105 1,590
Repairs and Maintenance Recoverable from Tenants and Others 6,657 6,574 Less: Allowance for Impairment Losses (3,813) (3,643)
Net Repairs and Maintenance Recoverable 2,844 2,931
Other Trade Receivablesb), c) 2,312 1,182 Other Current Receivables 85 71 Accrued Interest 681 644
Total Current Receivables 9,027 6,418
Non-Current Receivables
Loans Receivable (Secured) c) Right to Receive (Secured)d) 203 Lyons Land Receivable (Secured) e) 4,675 4,328
Total Non-Current Receivables 4,878 4,828
Total Receivables 13,905 11,246
a) Rent receivables are significantly higher in 2012-13 due to the rent raised in advance (6 days compared to nil in 2011-12) - $1.480 million.
b) Other trade receivables are higher in 2012-13 as a result of the following: the reporting of the Master Builders Association of the ACT loan receivable as current in 2012-13 as it becomes due and payable during 2013-14, increased bond loans outstanding as a result of the increased activity in 2012-13 and increased accruals for recoveries for insurance, tenant responsible maintenance and from other government agencies for services provided by Housing ACT to them during the year.
c) Loan receivable - Housing ACT and the Master Builders Association of the ACT agreed to jointly participate in the design and construction of accessible and adaptable housing in display villages over a ten-year period commencing in November 2003. To facilitate this, an interest-free loan was provided to the Master Builders Association of the ACT to enable them to arrange for the construction of the display homes. After the loan has been repaid and all costs paid, any surplus from the final sale of the adaptable display home is to be shared equally. The loan is secured by a mortgage over the display home. No interest is charged on the loan. The loan has been re-classified in 2012-13 as a current receivable, as it is due to be repaid during 2013-14, refer to item b) above.
500
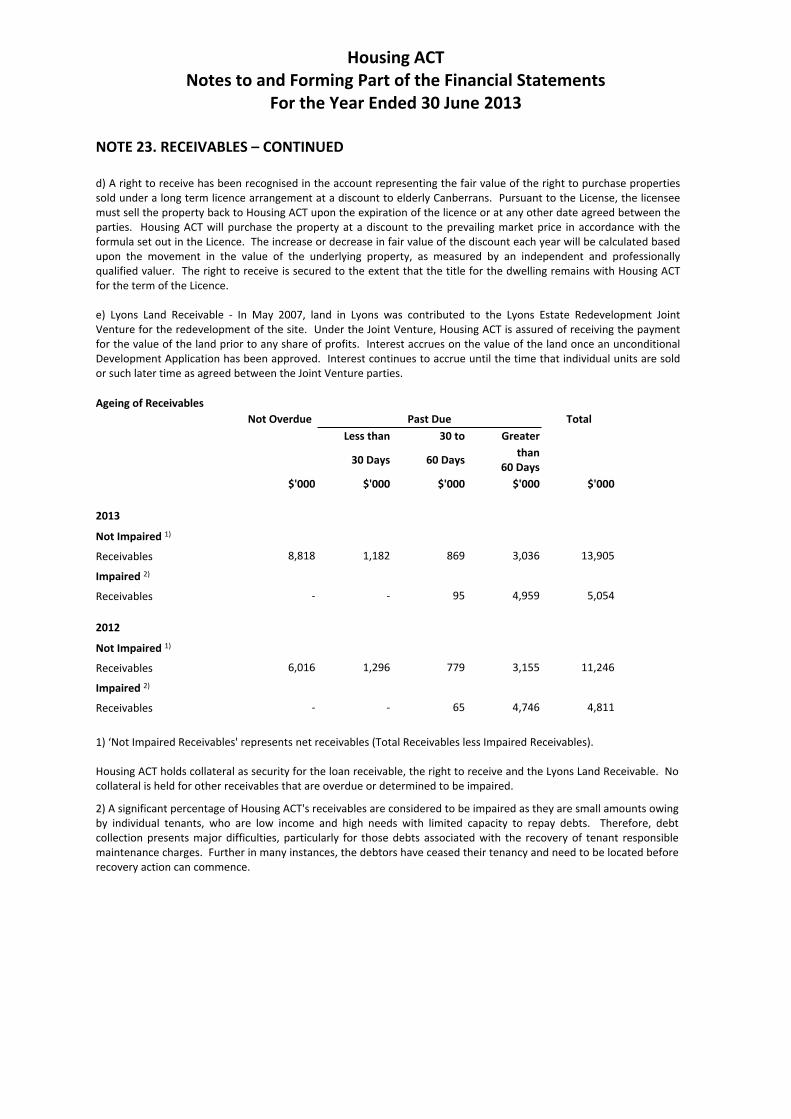
Hidden words
Housing ACT Notes to and Forming Part of the Financial Statements
For the Year Ended 30 June 2013
NOTE 23. RECEIVABLES – CONTINUED
d) A right to receive has been recognised in the account representing the fair value of the right to purchase properties sold under a long term licence arrangement at a discount to elderly Canberrans. Pursuant to the License, the licensee must sell the property back to Housing ACT upon the expiration of the licence or at any other date agreed between the parties. Housing ACT will purchase the property at a discount to the prevailing market price in accordance with the formula set out in the Licence. The increase or decrease in fair value of the discount each year will be calculated based upon the movement in the value of the underlying property, as measured by an independent and professionally qualified valuer. The right to receive is secured to the extent that the title for the dwelling remains with Housing ACT for the term of the Licence.
e) Lyons Land Receivable - In May 2007, land in Lyons was contributed to the Lyons Estate Redevelopment Joint Venture for the redevelopment of the site. Under the Joint Venture, Housing ACT is assured of receiving the payment for the value of the land prior to any share of profits. Interest accrues on the value of the land once an unconditional Development Application has been approved. Interest continues to accrue until the time that individual units are sold or such later time as agreed between the Joint Venture parties.
Ageing of Receivables Not Overdue Past Due Total
Less than 30 to Greater
30 Days 60 Days than 60 Days
$'000 $'000 $'000 $'000 $'000
2013
Not Impaired 1)
Receivables 8,818 1,182 869 3,036 13,905
Impaired 2)
Receivables - - 95 4,959 5,054
2012
Not Impaired 1)
Receivables 6,016 1,296 779 3,155 11,246
Impaired 2)
Receivables - - 65 4,746 4,811
1) ‘Not Impaired Receivables' represents net receivables (Total Receivables less Impaired Receivables).
Housing ACT holds collateral as security for the loan receivable, the right to receive and the Lyons Land Receivable. No collateral is held for other receivables that are overdue or determined to be impaired.
2) A significant percentage of Housing ACT's receivables are considered to be impaired as they are small amounts owing by individual tenants, who are low income and high needs with limited capacity to repay debts. Therefore, debt collection presents major difficulties, particularly for those debts associated with the recovery of tenant responsible maintenance charges. Further in many instances, the debtors have ceased their tenancy and need to be located before recovery action can commence.
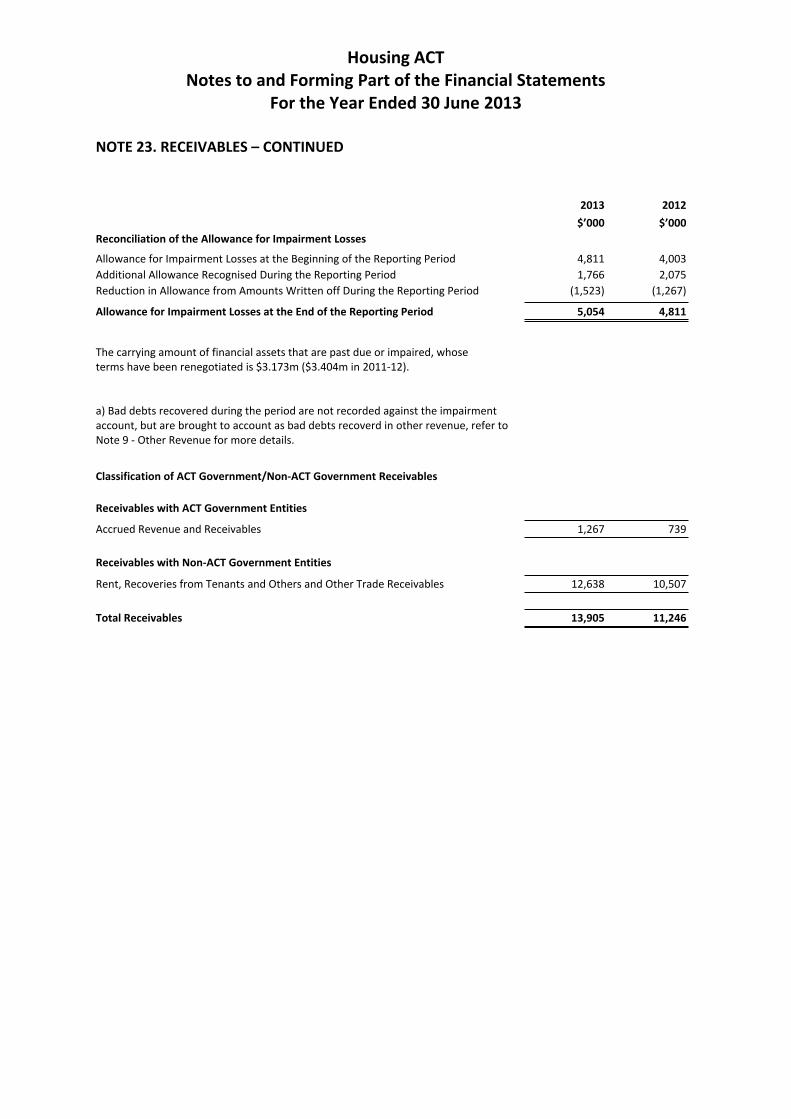
Hidden words
Housing ACT Notes to and Forming Part of the Financial Statements
For the Year Ended 30 June 2013
NOTE 23. RECEIVABLES – CONTINUED
Reconciliation of the Allowance for Impairment Losses
Allowance for Impairment Losses at the Beginning of the Reporting Period Additional Allowance Recognised During the Reporting Period Reduction in Allowance from Amounts Written off During the Reporting Period
Allowance for Impairment Losses at the End of the Reporting Period
2013 $’000
4,811 1,766
(1,523)
5,054
2012 $’000
4,003 2,075
(1,267)
4,811
The carrying amount of financial assets that are past due or impaired, whose terms have been renegotiated is $3.173m ($3.404m in 2011-12).
a) Bad debts recovered during the period are not recorded against the impairment account, but are brought to account as bad debts recoverd in other revenue, refer to Note 9 - Other Revenue for more details.
Classification of ACT Government/Non-ACT Government Receivables
Receivables with ACT Government Entities
Accrued Revenue and Receivables 1,267 739
Receivables with Non-ACT Government Entities
Rent, Recoveries from Tenants and Others and Other Trade Receivables 12,638 10,507
Total Receivables 13,905 11,246
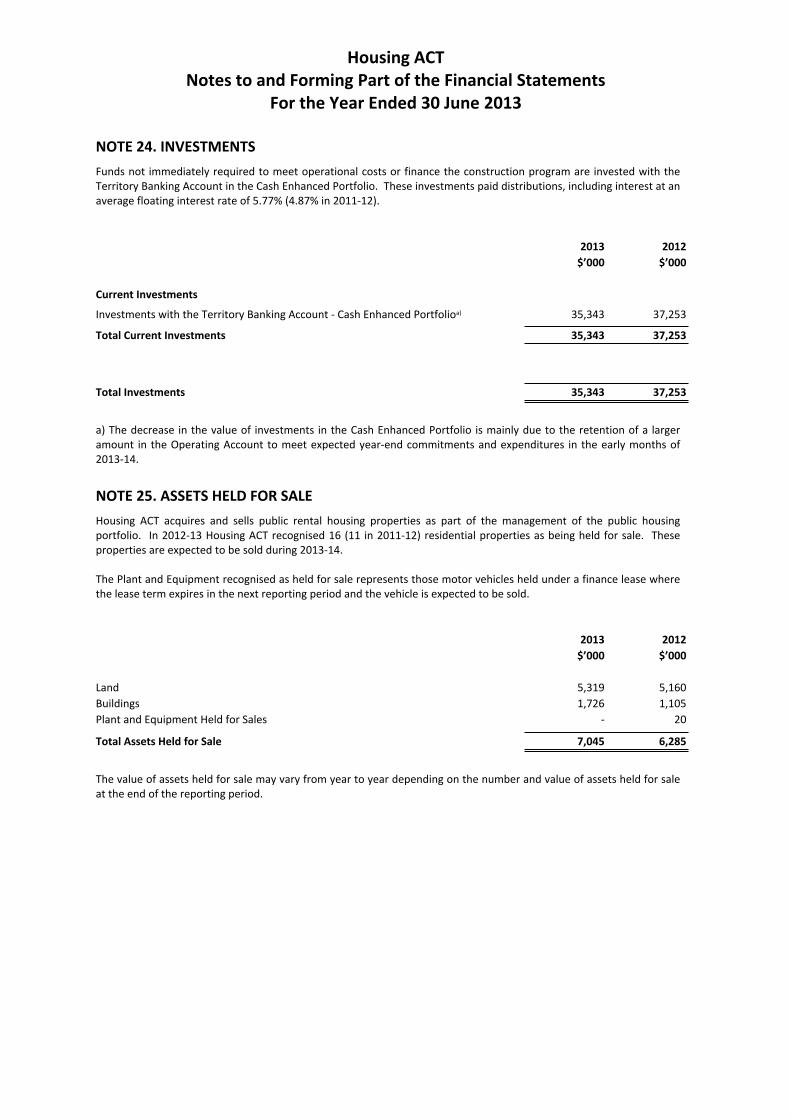
Hidden words
Housing ACT Notes to and Forming Part of the Financial Statements
For the Year Ended 30 June 2013
NOTE 24. INVESTMENTS
Funds not immediately required to meet operational costs or finance the construction program are invested with the Territory Banking Account in the Cash Enhanced Portfolio. These investments paid distributions, including interest at an average floating interest rate of 5.77% (4.87% in 2011-12).
2013 2012 $’000 $’000
Current Investments
Investments with the Territory Banking Account - Cash Enhanced Portfolioa) 35,343 37,253
Total Current Investments 35,343 37,253
Total Investments 35,343 37,253
a) The decrease in the value of investments in the Cash Enhanced Portfolio is mainly due to the retention of a larger amount in the Operating Account to meet expected year-end commitments and expenditures in the early months of 2013-14.
NOTE 25. ASSETS HELD FOR SALE Housing ACT acquires and sells public rental housing properties as part of the management of the public housing portfolio. In 2012-13 Housing ACT recognised 16 (11 in 2011-12) residential properties as being held for sale. These properties are expected to be sold during 2013-14.
The Plant and Equipment recognised as held for sale represents those motor vehicles held under a finance lease where the lease term expires in the next reporting period and the vehicle is expected to be sold.
2013 2012 $’000 $’000
Land 5,319 5,160 Buildings 1,726 1,105 Plant and Equipment Held for Sales - 20
Total Assets Held for Sale 7,045 6,285
The value of assets held for sale may vary from year to year depending on the number and value of assets held for sale at the end of the reporting period.

Hidden words
Housing ACT Notes to and Forming Part of the Financial Statements
For the Year Ended 30 June 2013
NOTE 26. OTHER ASSETS
2013 2012 $’000 $’000
Prepaymentsa) 270 755 Other 2
Total Other Assets 272 755
a) The decrease in the amount of prepaid expenses is mainly due to the prepayment of information and communication charges in 2011-12 that have been paid in 2012-13 by Shared Services ITC under the Service Level Agreement with Housing ACT. These costs will be paid to Shared Services ITC as part of the monthly payment to Shared Services ITC under the Service Level Agreement with them.

Hidden words
Housing ACT Notes to and Forming Part of the Financial Statements
For the Year Ended 30 June 2013
NOTE 27. PROPERTY, PLANT AND EQUIPMENT
Property, plant and equipment includes the following classes of assets – land, buildings, leasehold improvements, plant and equipment, and community and heritage assets. Property, plant and equipment does not include assets held for sale or investment properties.
Land includes leasehold land held by Housing ACT.
Buildings consist largely of residential properties for rent.
Leasehold improvements arise from the capital expenditure incurred on the fit-out of the leased office accommodation at Nature Conservation House.
Plant and equipment includes motor vehicles under a finance lease.
2013 2012 $’000 $’000
Land and Buildings
Land at Fair Value 3,050,023 3,035,965
Total Land Assets 3,050,023 3,035,965
Buildings at Fair Value 1,280,654 1,275,155 Less: Accumulated Depreciation (3,540) (3,554)
Total Written Down Value of Buildings 1,277,114 1,271,601
Total Land and Written Down Value of Buildings 4,327,137 4,307,566
Leasehold Improvements
Leasehold Improvements at Fair Value 4,679 4,679 Less: Accumulated Depreciation (2,160) (1,224)
Total Written Down Value of Leasehold Improvements 2,519 3,455
Plant and Equipment
Plant and Equipment at Cost 535 532 Less: Accumulated Depreciation (152) (87)
Total Written Down Value of Plant and Equipment 383 445
Total Written Down Value of Property, Plant and Equipment 4,330,039 4,311,466
The fair value of land and buildings reflects the valuation of the property portfolio in March 2013 by Mr David James (AAPI Certified Practising Valuer and Director of Herron Todd White (Canberra) Pty Limited).

Hidden words
Housing ACT Notes to and Forming Part of the Financial Statements
For the Year Ended 30 June 2013
NOTE 27. PROPERTY, PLANT AND EQUIPMENT – CONTINUED Cultural and Heritage Assets Included in Property, Plant and Equipment
The Cultural and Heritage Assets included in Property, Plant and Equipment are those public housing properties that are listed on the Heritage Register or the Interim Heritage Register. The dwellings continue to be used to house public housing tenants and are not a separate class of assets.
These properties generally have restrictions as to demolition or redevelopment and the nature of any refurbishment must be sympathetic to the surrounding neighbourhood and the original design and structure of the building, and in some cases this includes landscaping.
2013 2012 $’000 $’000
Land at Fair Value 85,130 85,200 Buildings at Fair Value 15,657 15,759 Less: Accumulated Depreciation (144) (202)
Total Written-Down Value of Cultural and Heritage Assets 100,643 100,757
The fair value of land and building of the heritage assets are based on the revaluation of the property portfolio in March 2013 by Mr David James (AAPI Certified Practising Valuer and Director of Herron Todd White (Canberra) Pty Limited).
Assets under a Finance Lease
Assets under a finance lease are included in the asset class to which they relate in the above disclosure. Assets under a finance lease are also required to be separately disclosed as outlined below. Housing ACT leases motor vehicles by way of finance leases under a whole-of-government contract.
2013 2012 $’000 $’000
Carrying Amount of Assets under a Finance Lease
Plant and Equipment under a Finance Lease 535 532 Accumulated Depreciation of Plant and Equipment under a Finance Lease (152) (87)
Total Written Down Value of Plant and Equipment under a Finance Lease 383 445
Total Written Down Value of Assets under a Finance Lease 383 445

Hidden words
Housing ACT Notes to and Forming Part of the Financial Statements
For the Year Ended 30 June 2013
NOTE 27. PROPERTY, PLANT AND EQUIPMENT - CONTINUED
Reconciliation of Property, Plant and Equipment
The following table shows the movement of Property, Plant and Equipment during 2012-13.
Leasehold Plant and Land Buildings Improvements Equipment Total
$’000 $’000 $’000 $’000 $’000
Carrying Amount at the Beginning of the Reporting Period 3,035,965 1,271,601 3,455 445 4,311,466 Additions 6,267 46,413 - 27 52,707 Assets Classified as Held for Sale (22,306) (6,655) - - (28,961) Revaluation Increment/(Decrement) 34,341 (6,936) - - 27,405 Depreciation - (14,477) (936) (80) (15,493) Disposals - (539) - (9) (548) (Disposal) from Transfers (4,244) (12,293) - - (16,537)
Carrying Amount at the End of the Reporting Period 3,050,023 1,277,114 2,519 383 4,330,038

Hidden words
Housing ACT Notes to and Forming Part of the Financial Statements
For the Year Ended 30 June 2013
NOTE 27. PROPERTY, PLANT AND EQUIPMENT - CONTINUED
Reconciliation of Property, Plant and Equipment
The following table shows the movement of Property, Plant and Equipment during 2011-12.
Leasehold Plant and Land Buildings Improvements Equipment Total
$’000 $’000 $’000 $’000 $’000
Carrying Amount at the Beginning of the Reporting Period 3,036,705 1,258,238 3,678 367 4,298,988 Additions 11,156 45,659 697 350 57,863 Assets Classified as Held for Sale (14,735) (3,833) - (19) (18,587) Revaluation Increment/(Decrement) 7,744 (8,076) - - (332) Depreciation - (14,545) (919) (86) (15,550) Disposals (2,740) (803) - (167) (3,710) Acquisition/(Disposal) from Transfers (2,166) (5,039) - - (7,205)
Carrying Amount at the End of the Reporting Period 3,035,965 1,271,601 3,455 445 4,311,466
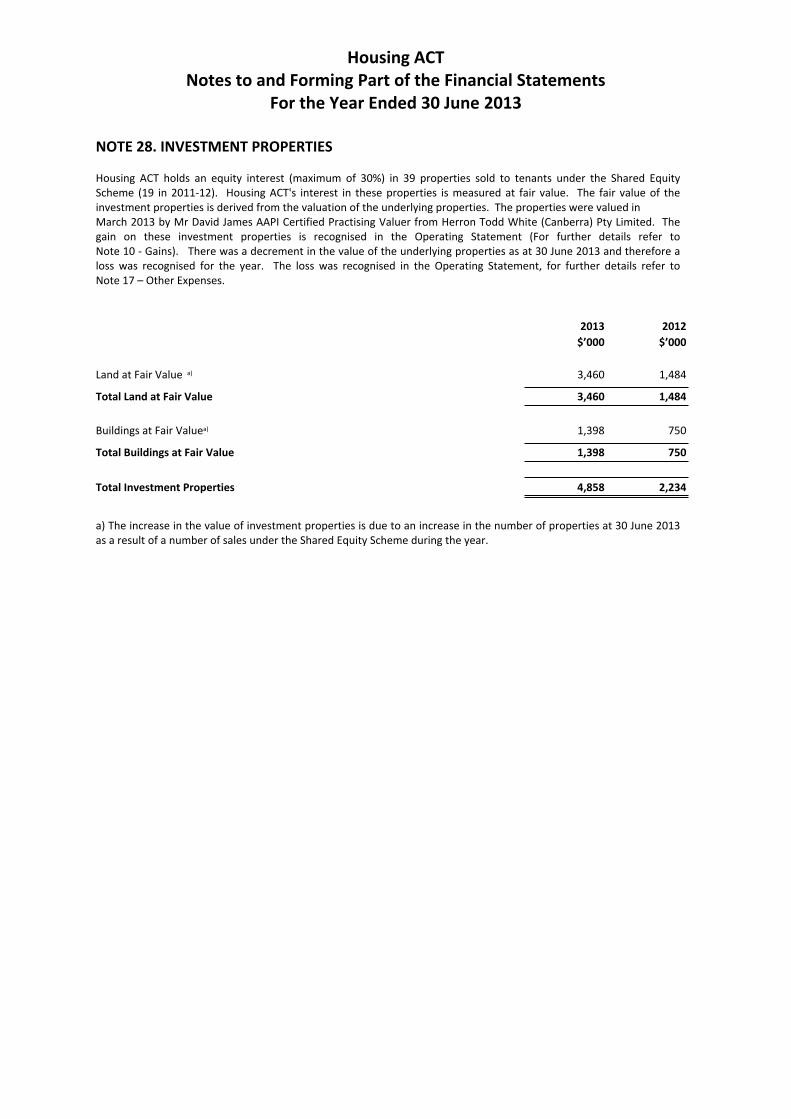
Hidden words
Housing ACT Notes to and Forming Part of the Financial Statements
For the Year Ended 30 June 2013
NOTE 28. INVESTMENT PROPERTIES
Housing ACT holds an equity interest (maximum of 30%) in 39 properties sold to tenants under the Shared Equity Scheme (19 in 2011-12). Housing ACT's interest in these properties is measured at fair value. The fair value of the investment properties is derived from the valuation of the underlying properties. The properties were valued in March 2013 by Mr David James AAPI Certified Practising Valuer from Herron Todd White (Canberra) Pty Limited. The gain on these investment properties is recognised in the Operating Statement (For further details refer to Note 10 - Gains). There was a decrement in the value of the underlying properties as at 30 June 2013 and therefore a loss was recognised for the year. The loss was recognised in the Operating Statement, for further details refer to Note 17 – Other Expenses.
2013 2012 $’000 $’000
Land at Fair Value a) 3,460 1,484
Total Land at Fair Value 3,460 1,484
Buildings at Fair Valuea) 1,398 750
Total Buildings at Fair Value 1,398 750
Total Investment Properties 4,858 2,234
a) The increase in the value of investment properties is due to an increase in the number of properties at 30 June 2013 as a result of a number of sales under the Shared Equity Scheme during the year.
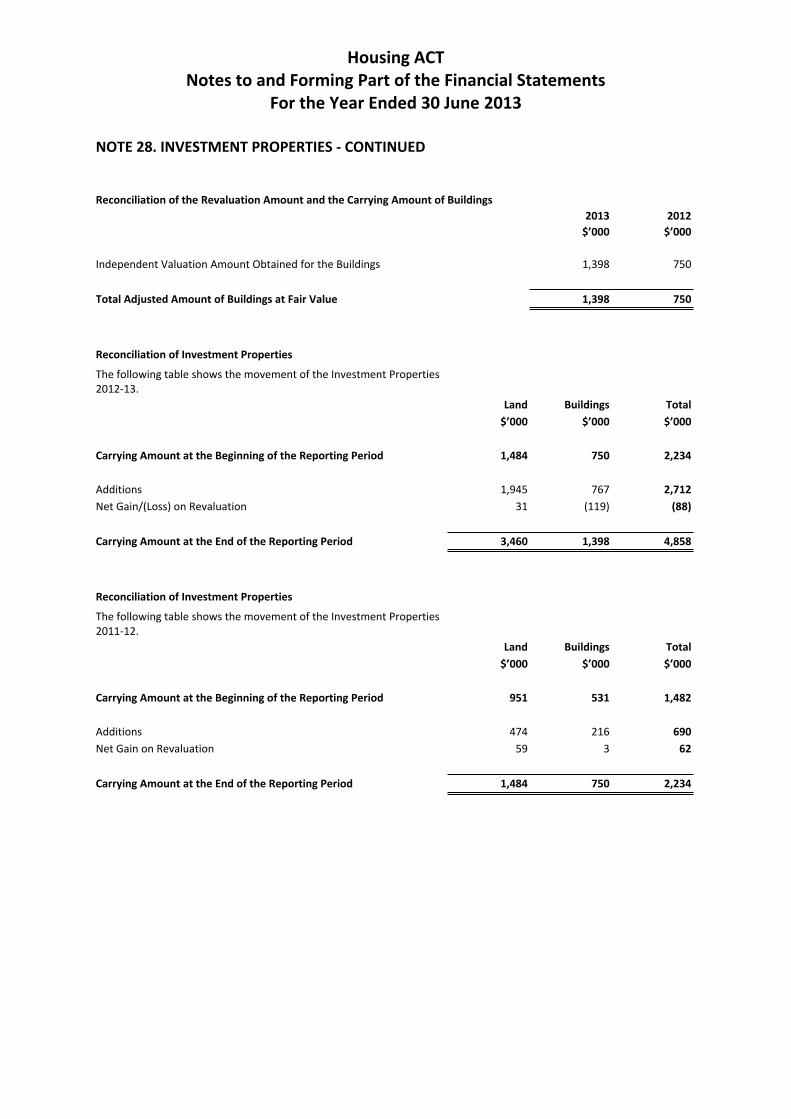
Hidden words
Housing ACT Notes to and Forming Part of the Financial Statements
For the Year Ended 30 June 2013
NOTE 28. INVESTMENT PROPERTIES - CONTINUED
Reconciliation of the Revaluation Amount and the Carrying Amount of Buildings 2013 2012
$’000 $’000
Independent Valuation Amount Obtained for the Buildings 1,398 750
Total Adjusted Amount of Buildings at Fair Value 1,398 750
Reconciliation of Investment Properties
The following table shows the movement of the Investment Properties 2012-13.
Land $’000
Carrying Amount at the Beginning of the Reporting Period 1,484
Additions 1,945 Net Gain/(Loss) on Revaluation 31
Buildings Total $’000 $’000
750 2,234
767 2,712 (119) (88)
Carrying Amount at the End of the Reporting Period 3,460 1,398 4,858
Reconciliation of Investment Properties
The following table shows the movement of the Investment Properties 2011-12.
Land $’000
Carrying Amount at the Beginning of the Reporting Period 951
Additions 474 Net Gain on Revaluation 59
Buildings Total $’000 $’000
531 1,482
216 690 3 62
Carrying Amount at the End of the Reporting Period 1,484 750 2,234
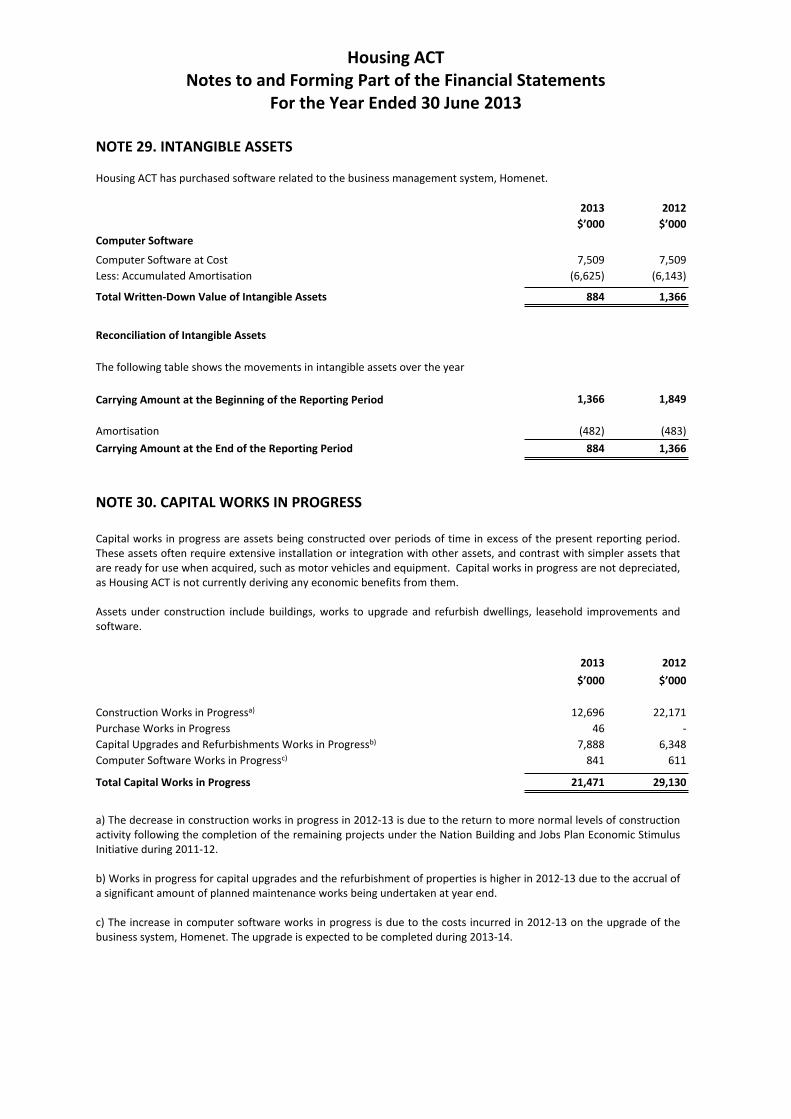
Hidden words
Housing ACT Notes to and Forming Part of the Financial Statements
For the Year Ended 30 June 2013
NOTE 29. INTANGIBLE ASSETS
Housing ACT has purchased software related to the business management system, Homenet.
2013 2012 $’000 $’000
Computer Software
Computer Software at Cost 7,509 7,509 Less: Accumulated Amortisation (6,625) (6,143)
Total Written-Down Value of Intangible Assets 884 1,366
Reconciliation of Intangible Assets
The following table shows the movements in intangible assets over the year
Carrying Amount at the Beginning of the Reporting Period 1,366 1,849
Amortisation (482) (483) Carrying Amount at the End of the Reporting Period 884 1,366
NOTE 30. CAPITAL WORKS IN PROGRESS
Capital works in progress are assets being constructed over periods of time in excess of the present reporting period. These assets often require extensive installation or integration with other assets, and contrast with simpler assets that are ready for use when acquired, such as motor vehicles and equipment. Capital works in progress are not depreciated, as Housing ACT is not currently deriving any economic benefits from them.
Assets under construction include buildings, works to upgrade and refurbish dwellings, leasehold improvements and software.
2013 2012 $’000 $’000
Construction Works in Progressa) 12,696 22,171 Purchase Works in Progress 46 -Capital Upgrades and Refurbishments Works in Progressb) 7,888 6,348 Computer Software Works in Progressc) 841 611
Total Capital Works in Progress 21,471 29,130
a) The decrease in construction works in progress in 2012-13 is due to the return to more normal levels of construction activity following the completion of the remaining projects under the Nation Building and Jobs Plan Economic Stimulus Initiative during 2011-12.
b) Works in progress for capital upgrades and the refurbishment of properties is higher in 2012-13 due to the accrual of a significant amount of planned maintenance works being undertaken at year end.
c) The increase in computer software works in progress is due to the costs incurred in 2012-13 on the upgrade of the business system, Homenet. The upgrade is expected to be completed during 2013-14.

Hidden words
Housing ACT Notes to and Forming Part of the Financial Statements
For the Year Ended 30 June 2013
NOTE 30. CAPITAL WORKS IN PROGRESS – CONTINUED
Construction works in progress represents construction expenditure incurred up to 30 June on residential building projects that have not been completed by 30 June. Purchase works in progress and improvement works in progress represent deposits paid for properties acquired but not settled prior to 30 June and expenditure on improvement or upgrade projects on existing properties that have not been completed by 30 June.
Reconciliation of Capital Works in Progress The following table shows the movement of Capital Works in Progress during 2012-13. Capital Up Grades
Buildings Purchase and Software Works in Works in Refurbishments in Works in Progress Progress Progress Progress Total
$’000 $’000 $’000 $’000 $’000
Carrying Amount at the Beginning of the Reporting Period 22,171 - 6,348 611 29,130 Additions 27,509 7,920 9,644 230 45,303 Capital Works in Progress Completed and Transferred to
Property, Plant and Equipment (36,984) (7,874) (8,104) - (52,962)
Carrying Amount at the End of the Reporting Period 12,696 46 7,888 841 21,471
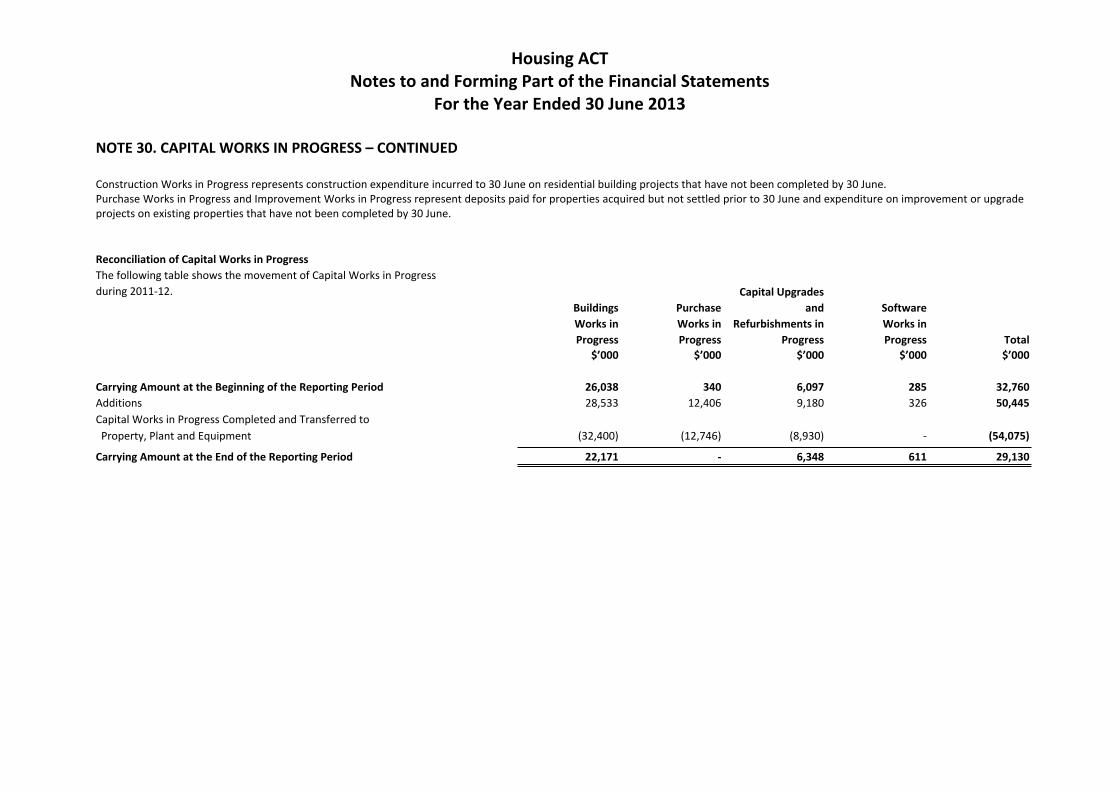
Hidden words
Housing ACT Notes to and Forming Part of the Financial Statements
For the Year Ended 30 June 2013
NOTE 30. CAPITAL WORKS IN PROGRESS – CONTINUED
Construction Works in Progress represents construction expenditure incurred to 30 June on residential building projects that have not been completed by 30 June. Purchase Works in Progress and Improvement Works in Progress represent deposits paid for properties acquired but not settled prior to 30 June and expenditure on improvement or upgrade projects on existing properties that have not been completed by 30 June.
Reconciliation of Capital Works in Progress The following table shows the movement of Capital Works in Progress during 2011-12. Capital Upgrades
Buildings Purchase and Software Works in Works in Refurbishments in Works in Progress Progress Progress Progress Total
$’000 $’000 $’000 $’000 $’000
Carrying Amount at the Beginning of the Reporting Period 26,038 340 6,097 285 32,760 Additions 28,533 12,406 9,180 326 50,445 Capital Works in Progress Completed and Transferred to
Property, Plant and Equipment (32,400) (12,746) (8,930) - (54,075)
Carrying Amount at the End of the Reporting Period 22,171 - 6,348 611 29,130

Hidden words
Housing ACT Notes to and Forming Part of the Financial Statements
For the Year Ended 30 June 2013
NOTE 31. PAYABLES
2013 2012 $’000 $’000
Current Payables
Payables 28 247 Accrued Expenses 8,224 4,467
Total Current Payablesa) 8,252 4,714
Total Payables 8,252 4,714
Payables are aged as followed
Not Overdue 8,252 4,714
Total Payables 8,252 4,714
Classification of ACT Government/Non-ACT Government Payables
Payables with ACT Government Entities
Trade Payables - 14 Accrued Expenses 1,579 1,438
Total Payables with ACT Government Entities 1,579 1,452
Payables with Non-ACT Government Entities
Trade Payables 28 233 Accrued Expenses 6,645 3,029
Total Payables with Non-ACT Government Entities 6,673 3,262
Total Payables 8,252 4,714
a) Payables are significantly higher in 2012-13 as a result of the large accrual for repairs and maintenance expenditure and capital upgrades ($3.6 million), higher accrual for water and sewerage costs at the 2013 year end ($0.204 million) offset by lower payables to third parties. The timing of the end of year arrangements in 2012-13 enabled most third party creditors to be paid within the financial year.
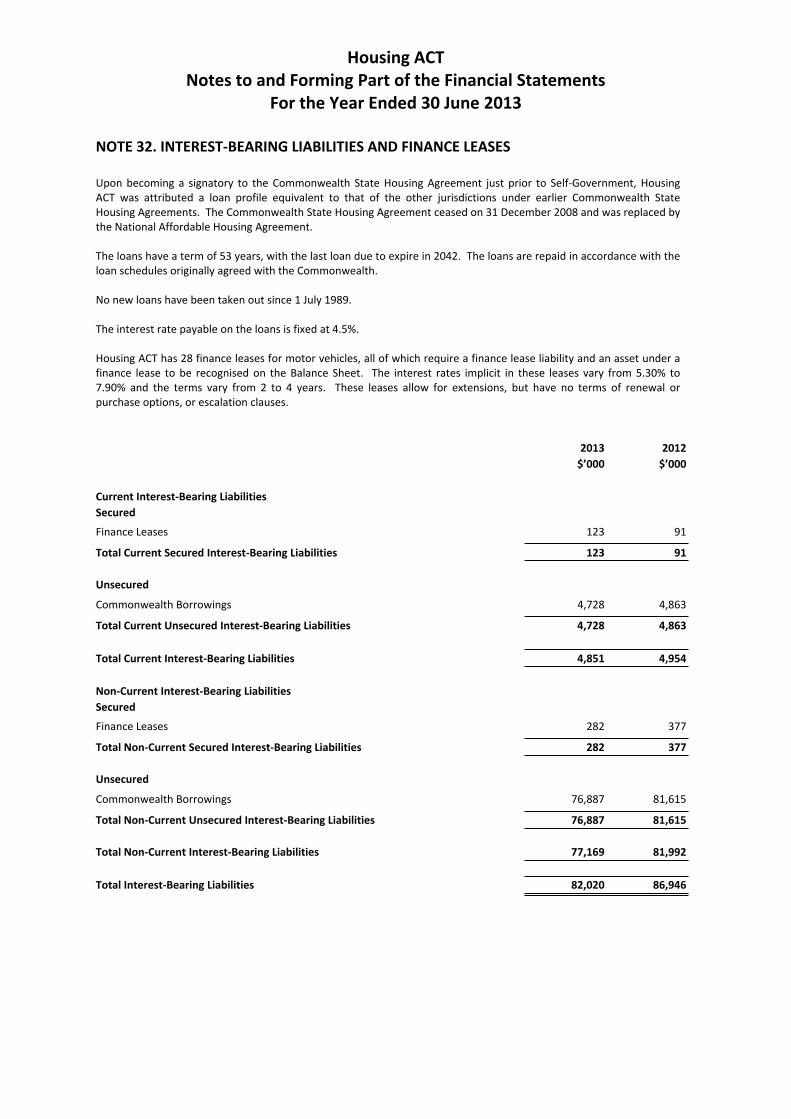
Hidden words
Housing ACT Notes to and Forming Part of the Financial Statements
For the Year Ended 30 June 2013
NOTE 32. INTEREST-BEARING LIABILITIES AND FINANCE LEASES
Upon becoming a signatory to the Commonwealth State Housing Agreement just prior to Self-Government, Housing ACT was attributed a loan profile equivalent to that of the other jurisdictions under earlier Commonwealth State Housing Agreements. The Commonwealth State Housing Agreement ceased on 31 December 2008 and was replaced by the National Affordable Housing Agreement.
The loans have a term of 53 years, with the last loan due to expire in 2042. The loans are repaid in accordance with the loan schedules originally agreed with the Commonwealth.
No new loans have been taken out since 1 July 1989.
The interest rate payable on the loans is fixed at 4.5%.
Housing ACT has 28 finance leases for motor vehicles, all of which require a finance lease liability and an asset under a finance lease to be recognised on the Balance Sheet. The interest rates implicit in these leases vary from 5.30% to 7.90% and the terms vary from 2 to 4 years. These leases allow for extensions, but have no terms of renewal or purchase options, or escalation clauses.
2013 2012 $’000 $’000
Current Interest-Bearing Liabilities Secured
Finance Leases 123 91
Total Current Secured Interest-Bearing Liabilities 123 91
Unsecured
Commonwealth Borrowings 4,728 4,863
Total Current Unsecured Interest-Bearing Liabilities 4,728 4,863
Total Current Interest-Bearing Liabilities 4,851 4,954
Non-Current Interest-Bearing Liabilities Secured
Finance Leases 282 377
Total Non-Current Secured Interest-Bearing Liabilities 282 377
Unsecured
Commonwealth Borrowings 76,887 81,615
Total Non-Current Unsecured Interest-Bearing Liabilities 76,887 81,615
Total Non-Current Interest-Bearing Liabilities 77,169 81,992
Total Interest-Bearing Liabilities 82,020 86,946
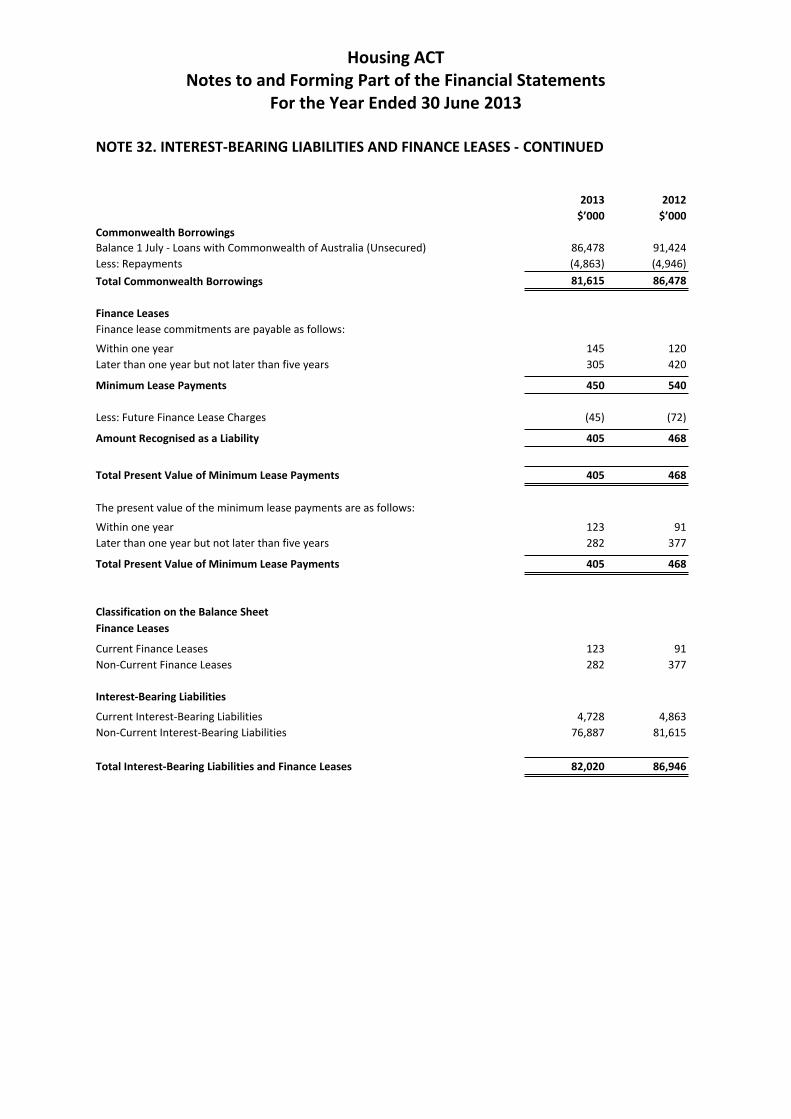
Hidden words
Housing ACT Notes to and Forming Part of the Financial Statements
For the Year Ended 30 June 2013
NOTE 32. INTEREST-BEARING LIABILITIES AND FINANCE LEASES - CONTINUED
2013 2012 $’000 $’000
Commonwealth Borrowings Balance 1 July - Loans with Commonwealth of Australia (Unsecured) 86,478 91,424 Less: Repayments (4,863) (4,946) Total Commonwealth Borrowings 81,615 86,478
Finance Leases Finance lease commitments are payable as follows:
Within one year 145 120 Later than one year but not later than five years 305 420
Minimum Lease Payments 450 540
Less: Future Finance Lease Charges (45) (72)
Amount Recognised as a Liability 405 468
Total Present Value of Minimum Lease Payments 405 468
The present value of the minimum lease payments are as follows:
Within one year 123 91 Later than one year but not later than five years 282 377
Total Present Value of Minimum Lease Payments 405 468
Classification on the Balance Sheet Finance Leases
Current Finance Leases 123 91 Non-Current Finance Leases 282 377
Interest-Bearing Liabilities
Current Interest-Bearing Liabilities 4,728 4,863 Non-Current Interest-Bearing Liabilities 76,887 81,615
Total Interest-Bearing Liabilities and Finance Leases 82,020 86,946
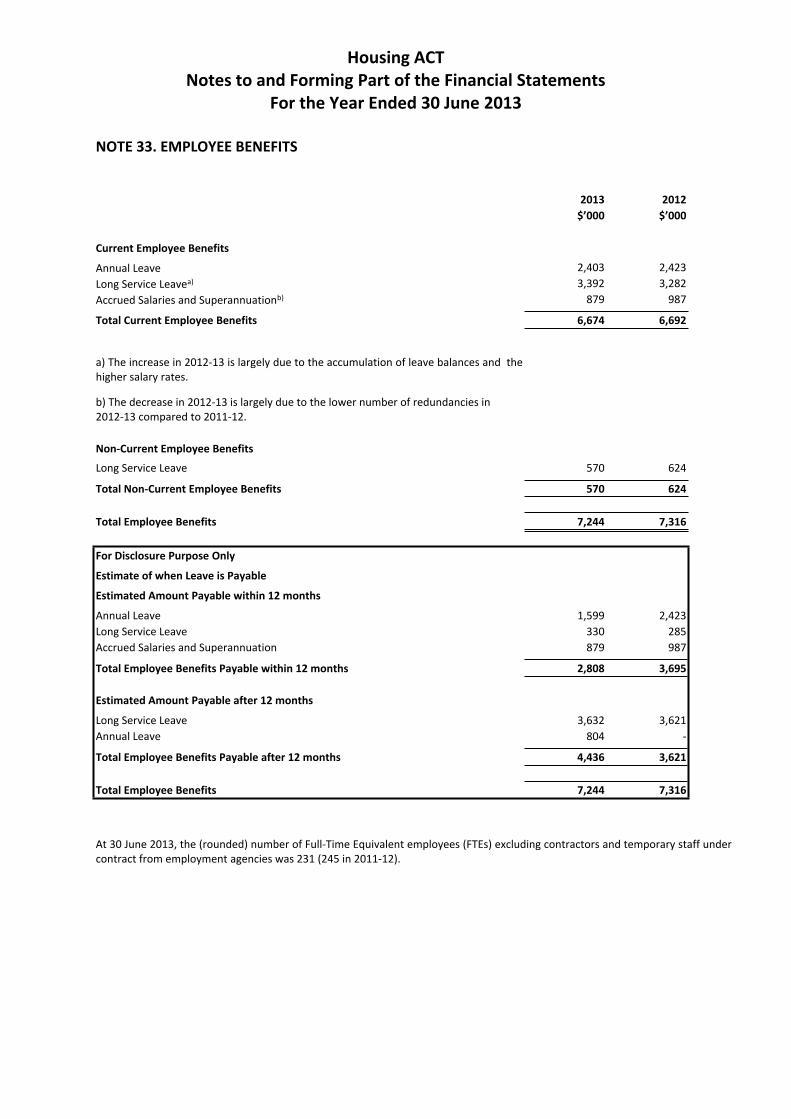
Hidden words
Housing ACT Notes to and Forming Part of the Financial Statements
For the Year Ended 30 June 2013
NOTE 33. EMPLOYEE BENEFITS
2013 2012 $’000 $’000
Current Employee Benefits
Annual Leave 2,403 2,423 Long Service Leavea) 3,392 3,282 Accrued Salaries and Superannuationb) 879 987
Total Current Employee Benefits 6,674 6,692
a) The increase in 2012-13 is largely due to the accumulation of leave balances and the higher salary rates.
b) The decrease in 2012-13 is largely due to the lower number of redundancies in 2012-13 compared to 2011-12.
Non-Current Employee Benefits
Long Service Leave 570 624
Total Non-Current Employee Benefits 570 624
Total Employee Benefits 7,244 7,316
For Disclosure Purpose Only
Estimate of when Leave is Payable
Estimated Amount Payable within 12 months
Annual Leave 1,599 2,423 Long Service Leave 330 285 Accrued Salaries and Superannuation 879 987
Total Employee Benefits Payable within 12 months 2,808 3,695
Estimated Amount Payable after 12 months
Long Service Leave 3,632 3,621 Annual Leave 804
Total Employee Benefits Payable after 12 months 4,436 3,621
Total Employee Benefits 7,244 7,316
At 30 June 2013, the (rounded) number of Full-Time Equivalent employees (FTEs) excluding contractors and temporary staff under contract from employment agencies was 231 (245 in 2011-12).

Hidden words
Housing ACT Notes to and Forming Part of the Financial Statements
For the Year Ended 30 June 2013
NOTE 34. OTHER LIABILITIES
Tenant revenue received in advance represents the rent in advance paid by tenants under the tenancy agreement.
Housing ACT employs a weekly rent charging cycle from Sunday to Saturday. Tenant rent raised in advance represents the balance of the rent raised prior to 30 June that relates to the next succeeding financial year. Six days were raised in advance in 2013, as the end of the year fell on Sunday 30 June 2013 (0 days in 2012).
2013 2012 $’000 $’000
Current Other Liabilities
Tenant Revenue Received in Advance 4,053 4,018 Tenant Rent Raised in Advance 1,480 -
Total Current Other Liabilities 5,533 4,018
Total Other Liabilities 5,533 4,018
NOTE 35. OTHER PROVISIONS
2013 2012 $’000 $’000
Non-Current Other Provisions
Provision for Make Good (Nature Conservation House) 1,182 1,129
Total Non-Current Other Provisions 1,182 1,129
Total Other Provisions 1,182 1,129
Provision for Make Good
On 1 May 2010, Housing ACT agreed to renew the lease agreement for office accommodation at Nature Conservation House in Belconnen for five years, with an option to extend for a further five years. Pursuant to that lease agreement, Housing ACT upon cessation of the tenancy, is required to return the office accommodation to the condition it was in before it was leased (this is referred to as 'make good').
2013 2012 $’000 $’000
Reconciliation of the Provision for Make Good
Provision for Make Good at the Beginning of the Reporting Period 1,129 1,078 Increase in Provision due to Unwinding of Discount 53 51
Provision for Make Good at the End of the Reporting Period 1,182 1,129

Hidden words
Housing ACT Notes to and Forming Part of the Financial Statements
For the Year Ended 30 June 2013
NOTE 36. EQUITY
Asset Revaluation Account
The Asset Revaluation Account is used to record the increments and decrements in the value of land and buildings. The Asset Evaluation Account records the movements in value of the land and buildings associated with the annual revaluation of the rental properties and movements arising from the transfer of valuation increments and/or decrements upon sale, demolition or transfer of properties.
Land
Opening Balance Add: Net Revaluation Increment Less: Transfer to Accumulated Funds on Disposal or Transfer of Land
2013 2012 $’000 $’000
2,626,010 2,633,295 34,341 7,744
(27,700) (15,029)
Total Land Asset Revaluation Account 2,632,651 2,626,010
Buildings
Opening Balance Less: Net Revaluation (Decrement) Less: Transfer to Accumulated Funds on Disposal, Demolition or Transfer
of Building
528,445 539,301 (6,936) (8,076)
(4,468) (2,780)
Total Buildings Asset Revaluation Account 517,041 528,445
Total Asset Revaluation Account 3,149,692 3,154,455
Net (Decrease)/Increase in the Asset Revaluation Account
Net Revaluation Increment - Land 34,341 7,744 Net Revaluation (Decrement) - Buildings (6,936) (8,076)
Total Net Revaluation Increment/(Decrement) 27,405 (332)
Transfer to Accumulated Funds - Land (27,700) (15,029) Transfer to Accumulated Funds - Buildings (4,468) (2,780)
Total Transferred to Accumulated Funds on Disposal, Demolition or Transfer (32,168) (17,809)
Net (Decrease) in the Asset Revaluation Account (4,763) (18,141)
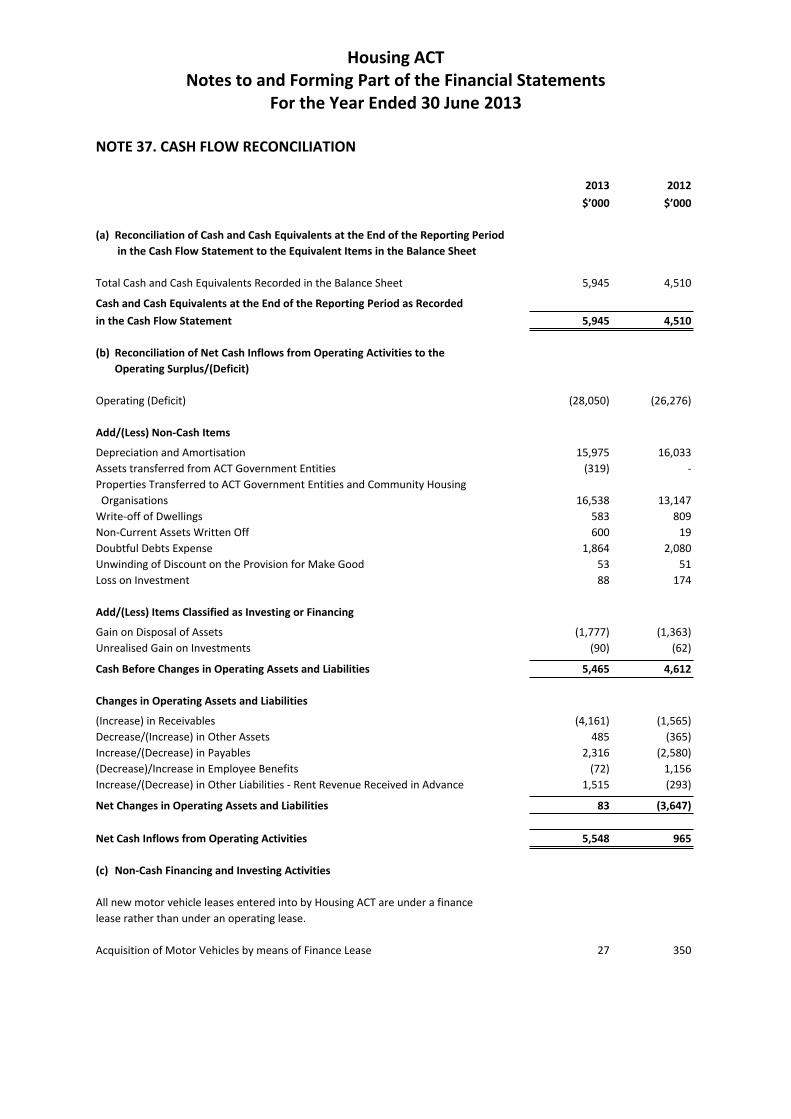
Hidden words
Housing ACT Notes to and Forming Part of the Financial Statements
For the Year Ended 30 June 2013
NOTE 37. CASH FLOW RECONCILIATION
2013 2012 $’000 $’000
(a) Reconciliation of Cash and Cash Equivalents at the End of the Reporting Period in the Cash Flow Statement to the Equivalent Items in the Balance Sheet
Total Cash and Cash Equivalents Recorded in the Balance Sheet 5,945 4,510
Cash and Cash Equivalents at the End of the Reporting Period as Recorded in the Cash Flow Statement 5,945 4,510
(b) Reconciliation of Net Cash Inflows from Operating Activities to the Operating Surplus/(Deficit)
Operating (Deficit) (28,050) (26,276)
Add/(Less) Non-Cash Items
Depreciation and Amortisation 15,975 16,033 Assets transferred from ACT Government Entities (319) Properties Transferred to ACT Government Entities and Community Housing
Organisations 16,538 13,147 Write-off of Dwellings 583 809 Non-Current Assets Written Off 600 19 Doubtful Debts Expense 1,864 2,080 Unwinding of Discount on the Provision for Make Good 53 51 Loss on Investment 88 174
Add/(Less) Items Classified as Investing or Financing
Gain on Disposal of Assets (1,777) (1,363) Unrealised Gain on Investments (90) (62)
Cash Before Changes in Operating Assets and Liabilities 5,465 4,612
Changes in Operating Assets and Liabilities
(Increase) in Receivables (4,161) (1,565) Decrease/(Increase) in Other Assets 485 (365) Increase/(Decrease) in Payables 2,316 (2,580) (Decrease)/Increase in Employee Benefits (72) 1,156 Increase/(Decrease) in Other Liabilities - Rent Revenue Received in Advance 1,515 (293)
Net Changes in Operating Assets and Liabilities 83 (3,647)
Net Cash Inflows from Operating Activities 5,548 965
(c) Non-Cash Financing and Investing Activities
All new motor vehicle leases entered into by Housing ACT are under a finance lease rather than under an operating lease.
Acquisition of Motor Vehicles by means of Finance Lease 27 350
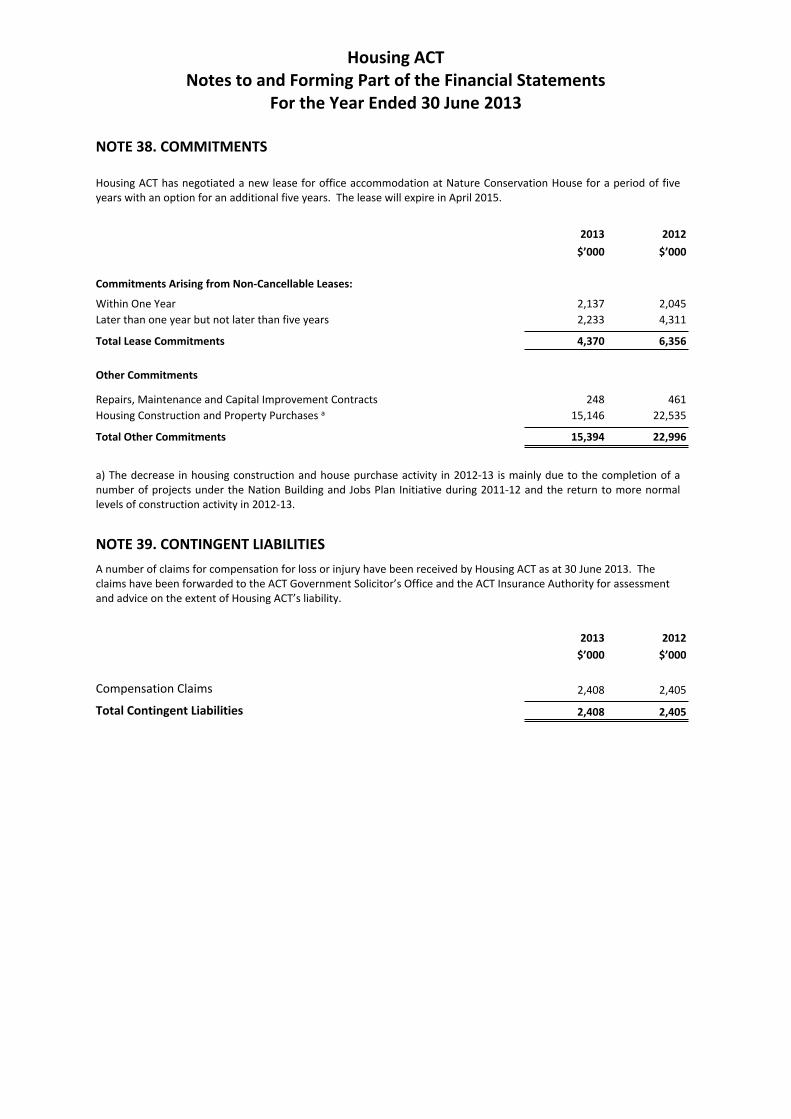
Hidden words
Housing ACT Notes to and Forming Part of the Financial Statements
For the Year Ended 30 June 2013
NOTE 38. COMMITMENTS
Housing ACT has negotiated a new lease for office accommodation at Nature Conservation House for a period of five years with an option for an additional five years. The lease will expire in April 2015.
2013 2012 $’000 $’000
Commitments Arising from Non-Cancellable Leases:
Within One Year 2,137 2,045 Later than one year but not later than five years 2,233 4,311
Total Lease Commitments 4,370 6,356
Other Commitments
Repairs, Maintenance and Capital Improvement Contracts 248 461 Housing Construction and Property Purchases a 15,146 22,535
Total Other Commitments 15,394 22,996
a) The decrease in housing construction and house purchase activity in 2012-13 is mainly due to the completion of a number of projects under the Nation Building and Jobs Plan Initiative during 2011-12 and the return to more normal levels of construction activity in 2012-13.
NOTE 39. CONTINGENT LIABILITIES A number of claims for compensation for loss or injury have been received by Housing ACT as at 30 June 2013. The claims have been forwarded to the ACT Government Solicitor’s Office and the ACT Insurance Authority for assessment and advice on the extent of Housing ACT’s liability.
2013 2012 $’000 $’000
Compensation Claims 2,408 2,405
Total Contingent Liabilities 2,408 2,405
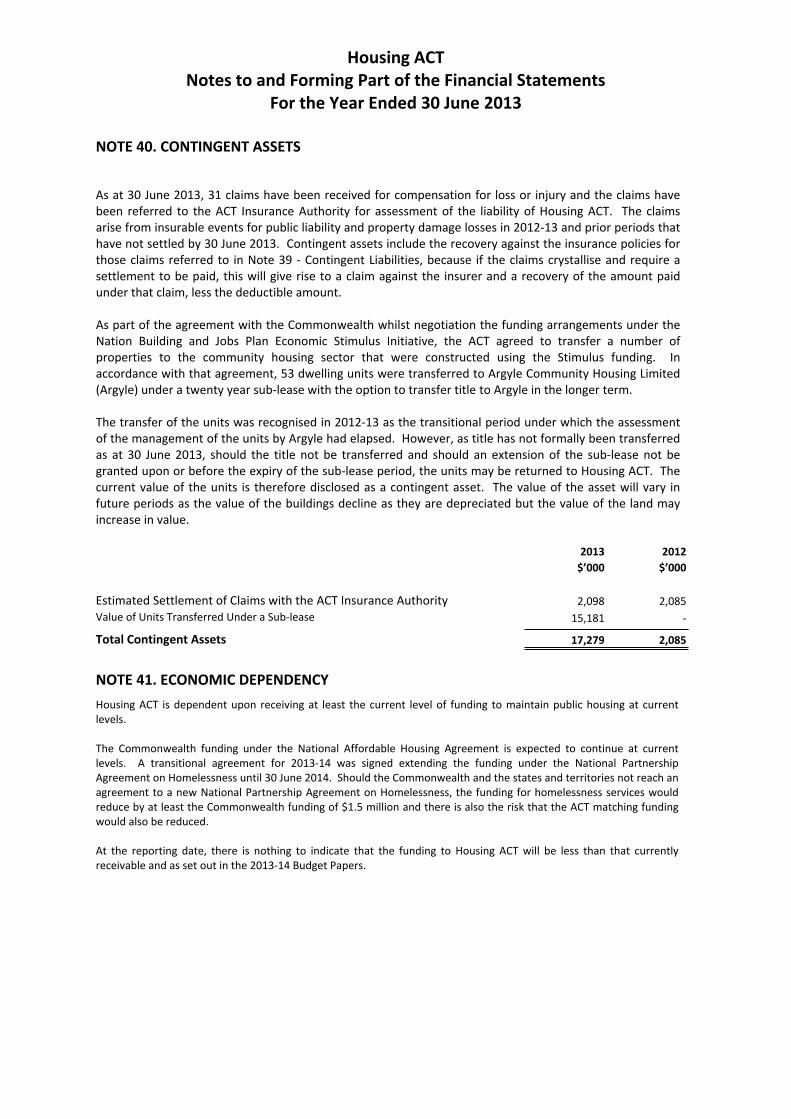
Hidden words
Housing ACT Notes to and Forming Part of the Financial Statements
For the Year Ended 30 June 2013
NOTE 40. CONTINGENT ASSETS
As at 30 June 2013, 31 claims have been received for compensation for loss or injury and the claims have been referred to the ACT Insurance Authority for assessment of the liability of Housing ACT. The claims arise from insurable events for public liability and property damage losses in 2012-13 and prior periods that have not settled by 30 June 2013. Contingent assets include the recovery against the insurance policies for those claims referred to in Note 39 - Contingent Liabilities, because if the claims crystallise and require a settlement to be paid, this will give rise to a claim against the insurer and a recovery of the amount paid under that claim, less the deductible amount.
As part of the agreement with the Commonwealth whilst negotiation the funding arrangements under the Nation Building and Jobs Plan Economic Stimulus Initiative, the ACT agreed to transfer a number of properties to the community housing sector that were constructed using the Stimulus funding. In accordance with that agreement, 53 dwelling units were transferred to Argyle Community Housing Limited (Argyle) under a twenty year sub-lease with the option to transfer title to Argyle in the longer term.
The transfer of the units was recognised in 2012-13 as the transitional period under which the assessment of the management of the units by Argyle had elapsed. However, as title has not formally been transferred as at 30 June 2013, should the title not be transferred and should an extension of the sub-lease not be granted upon or before the expiry of the sub-lease period, the units may be returned to Housing ACT. The current value of the units is therefore disclosed as a contingent asset. The value of the asset will vary in future periods as the value of the buildings decline as they are depreciated but the value of the land may increase in value.
2013 2012 $’000 $’000
Estimated Settlement of Claims with the ACT Insurance Authority 2,098 2,085 Value of Units Transferred Under a Sub-lease 15,181
Total Contingent Assets 17,279 2,085
NOTE 41. ECONOMIC DEPENDENCY Housing ACT is dependent upon receiving at least the current level of funding to maintain public housing at current levels.
The Commonwealth funding under the National Affordable Housing Agreement is expected to continue at current levels. A transitional agreement for 2013-14 was signed extending the funding under the National Partnership Agreement on Homelessness until 30 June 2014. Should the Commonwealth and the states and territories not reach an agreement to a new National Partnership Agreement on Homelessness, the funding for homelessness services would reduce by at least the Commonwealth funding of $1.5 million and there is also the risk that the ACT matching funding would also be reduced.
At the reporting date, there is nothing to indicate that the funding to Housing ACT will be less than that currently receivable and as set out in the 2013-14 Budget Papers.

Hidden words
Housing ACT Notes to and Forming Part of the Financial Statements
For the Year Ended 30 June 2013
NOTE 42. FINANCIAL INSTRUMENTS
Details of the significant policies and methods adopted, including the basis of measurement and the criteria on which income and expenses are recognised for each class of financial asset and financial liability are disclosed in Note 2 - Summary of Significant Accounting Policies.
Interest Rate Risk
Interest rate risk is the risk that the fair value or the future cash flows of a financial instrument will fluctuate because of changes in market interest rates.
Housing ACT's cash and cash equivalents and some receivables are exposed to floating interest rates. Housing ACT currently does not have any financial liabilities which are exposed to floating interest rates. The Commonwealth borrowings and the receivable for the Lyons land transferred to the Lyons Estate Redevelopment Joint Venture, are at fixed interest rates. This means that Housing ACT is exposed to movements in interest receivable but not exposed to movements in interest payable.
Interest rates have decreased during 2012-13 with the Reserve Bank cash rate falling from 3.50% in June 2012 to 2.75% in June 2013. This has resulted in an unfavourable impact upon interest receivable.
Housing ACT manages interest rate risk for financial assets by investing only in floating interest rate investments that have low risk. Interest rate risk for financial liabilities is not actively managed by Housing ACT, as Housing ACT does not have financial liabilities that are exposed to floating interest rates.
Sensitivity Analysis
A sensitivity analysis has not been undertaken for the interest rate risk of Housing ACT, as it has been determined that the possible impact on income and expense or total equity from fluctuations in interest rates is immaterial.
Credit Risk
Credit risk is the risk that one party to a financial instrument will fail to discharge an obligation and cause the other party to incur a financial loss. Housing ACT’s credit risk is limited to the carrying amount of the financial assets it holds net of any allowance for impairment.
The credit risk on cash and cash equivalents and investments is considered to be minimal as these monies are invested with the Territory Banking Account and Cash Enhanced Portfolio, which has appropriate risk-based investment criteria for managing the Portfolio. The monies held in the Solicitor's Trust Account are protected by indemnities from the solicitors and also under the Solicitor's Fidelity Fund of the ACT managed by the ACT Law Society. The credit risk for loan receivables is managed by having a mortgage over the underlying land and buildings to provide security for these financial assets. No other collateral is held as security for financial assets.
The credit risk for the non-current receivable for the receivable for the value of the land held by the Lyons Estate Redevelopment Joint Venture is mitigated by Housing ACT retaining title to the land as security, until the value of the land is paid. The credit risk for the right to receive is also mitigated by Housing ACT retaining the title to the properties sold by way of the long term sub-lease/Licence for the duration of the sub-lease/Licence. For further details refer to Note 23 - Receivables, Note 28 – Investment Properties and Note 43 - Interest in a Joint Venture.
Receivables include a large number of small amounts owing from tenants for rent arrears and to recover tenant responsible maintenance charges. To manage this credit risk, Housing ACT actively manages these debts and implements a range of debt management processes to assist tenants manage their debts. These debt management strategies include early intervention and engagement with tenants when they first enter into arrears, and encouraging tenants to enter into repayment agreements and where appropriate, undertake financial and budget counselling.
The process for managing credit risk has not changed this year.
Hidden words
Housing ACT Notes to and Forming Part of the Financial Statements
For the Year Ended 30 June 2013
NOTE 42. FINANCIAL INSTRUMENTS – CONTINUED
Liquidity Risk
Liquidity risk is the risk that Housing ACT will encounter difficulties in meeting its financial obligations as they fall due. To limit its exposure to liquidity risk, Housing ACT ensures that it does not have a large proportion of its financial liabilities maturing in any one reporting period and that, at any particular point in time, it has sufficient current financial assets to meet its current financial liabilities. Also, Housing ACT is able to draw down additional Government Payments for Outputs Appropriation in the next reporting period to assist cover its financial liabilities when they fall due.
Housing ACT's main financial obligations are payment for the purchase or construction of properties, the purchase of supplies and services and the repayment of Commonwealth borrowings. Purchases of supplies and services occur regularly throughout the year and are paid within 30 days of receipt of the goods or services. The acquisition and construction of properties are scheduled in accordance with Housing ACT's Asset Management Plan and funding capacity. The repayment of principal and the payment of interest on the Commonwealth borrowing occurs at the end of each reporting period. Cash reserves are accumulated throughout the year to ensure that sufficient cash is held to meet these commitments. The spread of payments throughout the year assists reduce liquidity risk and enables revenues to be earned to meet payments for purchases and salaries.
Housing ACT manages its liquidity risk through forecasting rent revenues and other revenues, including the drawdown of appropriations, managing its cash flows and retaining sufficient working capital. Revenues are received regularly throughout the year and as far as practicable are matched to expenditures. This enables the payment of obligations for salaries and supplies and services as and when they fall due. Housing ACT has a well-established process for reviewing the capital works programs on a monthly basis, which enables Housing ACT to coordinate the sales and the acquisition of properties to minimise the liquidity risk associated with the purchase and construction of properties and from operations.
Housing ACT's exposure to liquidity risk and the management of this risk has not changed since the previous reporting period.

Hidden words
Housing ACT Notes to and Forming Part of the Financial Statements
For the Year Ended 30 June 2013
NOTE 42. FINANCIAL INSTRUMENTS – CONTINUED
Price Risk
Price risk is the risk that the fair value or the future cash flows of a financial instrument will fluctuate because of changes in market prices (other than those arising from interest rate risk or currency risk), whether these changes are caused by factors specific to an individual financial instrument or its issuer, or factors affecting all similar financial instruments traded in the market.
Housing ACT has some exposure to price risk resulting from its investment in the Cash Enhanced Portfolio with the Territory Banking Account. Units in the Cash Enhanced Portfolio fluctuate in value due to movements in the underlying investments in the Portfolio. The underlying investments are managed by an external fund manager who invests in cash, bank bills and bank term deposits as well as a variety of different investment grade securities (with a long term credit rating of BBB- or greater), such as fixed interest bonds and mortgage-backed securities.
Fair Value of Financial Assets and Liabilities
The carrying amount and fair values of financial assets and liabilities at the end of the reporting period are:
Carrying Amount
2013 $’000
Financial Assets
Cash and Cash Equivalents 5,945 Investments 35,343 Receivables 13,905
Total Financial Assets 55,193
Financial Liabilities
Payables 8,252 Commonwealth Borrowings 81,615 Finance Leases 405
Total Financial Liabilities 90,272
Fair Value 2013
$’000
5,945 35,343 13,905
Carrying Amount
2012 $’000
4,510 37,253 11,246
Fair Value 2012
$’000
4,510 37,253 11,246
55,193
8,252 82,967
405
91,624
53,010
4,714 86,478
468
91,660
53,010
4,714 94,526
468
99,708

Hidden words
2013
Housing ACT Notes to and Forming Part of the Financial Statements
For the Year Ended 30 June 2013
NOTE 42. FINANCIAL INSTRUMENTS – CONTINUED
Fair Value Hierarchy
Housing ACT is required to classify financial assets and financial liabilities into a fair value hierarchy that reflects the significance of the inputs used in determining their fair value. The fair value hierarchy is made up of the following three levels:
Level 1 - quoted prices (unadjusted) in active markets for identical assets or liabilities;
Level 2 - inputs other than quoted prices included within Level 1 that are observable for the asset or liability, either directly (i.e. as prices) or indirectly (i.e. derived from prices); and
Level 3 - inputs for the asset or liability that are not based on observable market data (unobservable inputs).
The carrying amount of financial assets measured at fair value, as well as the methods used to estimate the fair value are summarised in the table below. All other financial assets and liabilities are measured, subsequent to initial recognition, at amortised cost and as such are not included in the table below.
Classification According to Fair Value Hierarchy Total
Level 1 Level 2 Level 3 $’000 $’000 $’000 $’000
Financial Assets
Financial Assets at Fair Value through Profit and Loss Investments with the Territory Banking Account Cash Enhanced Portfolio - 35,343 - 35,343
- 35,343 - 35,343
2012 Classification According to Fair Value Hierarchy
Level 1 Level 2 Level 3 Total
$’000 $’000 $’000 $’000
Financial Assets
Financial Assets at Fair Value through Profit and Loss Investments with the Territory Banking Account Cash Enhanced Portfolio - 37,253 - 37,253
- 37,253 - 37,253
Fair Value of Financial Instruments
The fair value of financial assets and financial liabilities are determined as follows:
- the fair value of financial assets and financial liabilities with standard terms and conditions and traded on an active liquid market are determined with reference to quoted market prices.
- the fair value of other financial assets and financial liabilities are determined in accordance with generally accepted pricing models based on discounted cash flow analysis, using prices from observable current market transactions (adjusted for credit spreads).
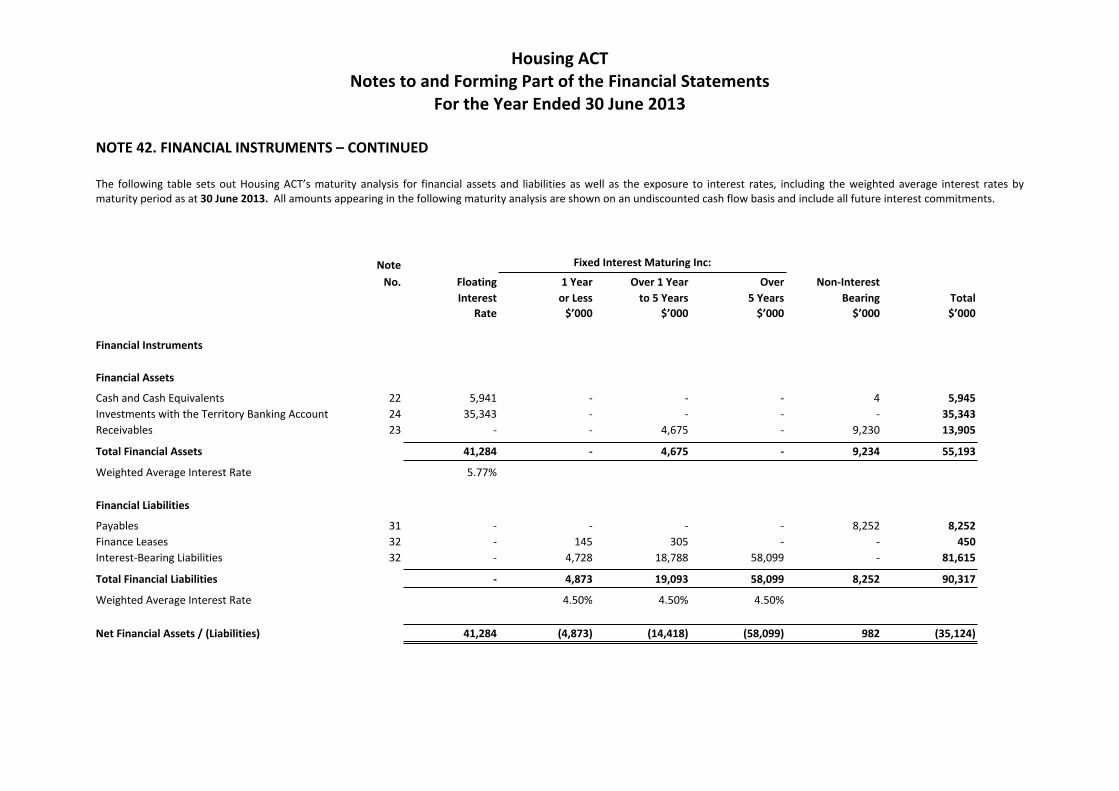
Hidden words
Housing ACT Notes to and Forming Part of the Financial Statements
For the Year Ended 30 June 2013
NOTE 42. FINANCIAL INSTRUMENTS – CONTINUED
The following table sets out Housing ACT’s maturity analysis for financial assets and liabilities as well as the exposure to interest rates, including the weighted average interest rates by maturity period as at 30 June 2013. All amounts appearing in the following maturity analysis are shown on an undiscounted cash flow basis and include all future interest commitments.
Note Fixed Interest Maturing Inc:
No. Floating Interest
Rate
1 Year or Less
$’000
Over 1 Year to 5 Years
$’000
Over 5 Years
$’000
Non-Interest Bearing
$’000 Total $’000
Financial Instruments
Financial Assets
Cash and Cash Equivalents Investments with the Territory Banking Account Receivables
Total Financial Assets
Weighted Average Interest Rate
22 24 23
5,941 35,343
-
41,284
5.77%
---
-
--
4,675
4,675
---
-
4 -
9,230
9,234
5,945 35,343 13,905
55,193
Financial Liabilities
Payables Finance Leases Interest-Bearing Liabilities
Total Financial Liabilities
Weighted Average Interest Rate
31 32 32
---
-
-145
4,728
4,873
4.50%
-305
18,788
19,093
4.50%
--
58,099
58,099
4.50%
8,252 --
8,252
8,252 450
81,615
90,317
Net Financial Assets / (Liabilities) 41,284 (4,873) (14,418) (58,099) 982 (35,124)

Hidden words
Housing ACT Notes to and Forming Part of the Financial Statements
For the Year Ended 30 June 2013
NOTE 42. FINANCIAL INSTRUMENTS – CONTINUED
The following table sets out Housing ACT’s maturity analysis for financial assets and liabilities as well as the exposure to interest rates, including the weighted average interest rates by maturity period as at 30 June 2012. All amounts appearing in the following maturity analysis are shown on an undiscounted cash flow basis and include all future interest commitments.
Note Fixed Interest Maturing Inc: No. Floating
Interest Rate
1 Year or Less
$’000
Over 1 Year to 5 Years
$’000
Over 5 Years
$’000
Non-Interest Bearing
$’000 Total $’000
Financial Instruments
Financial Assets
Cash and Cash Equivalents Investments with the Territory Banking Account Receivables
Total Financial Assets
Weighted Average Interest Rate
22 24 23
4,506 37,253
-
41,759
4.87%
---
-
--
4,328
4,328
---
-
4 -
6,918
6,922
4,510 37,253 11,246
53,010
Financial Liabilities
Payables Finance Leases Interest-Bearing Liabilities
Total Financial Liabilities
Weighted Average Interest Rate
31 32 32
---
-
-120
4,863
4,983
4.50%
-420
18,833
19,253
4.50%
--
62,782
62,782
4.50%
4,714 --
4,714
4,714 540
86,478
91,732
Net Financial Assets/(Liabilities) 41,759 (4,983) (14,925) (62,782) 2,208 (38,722)
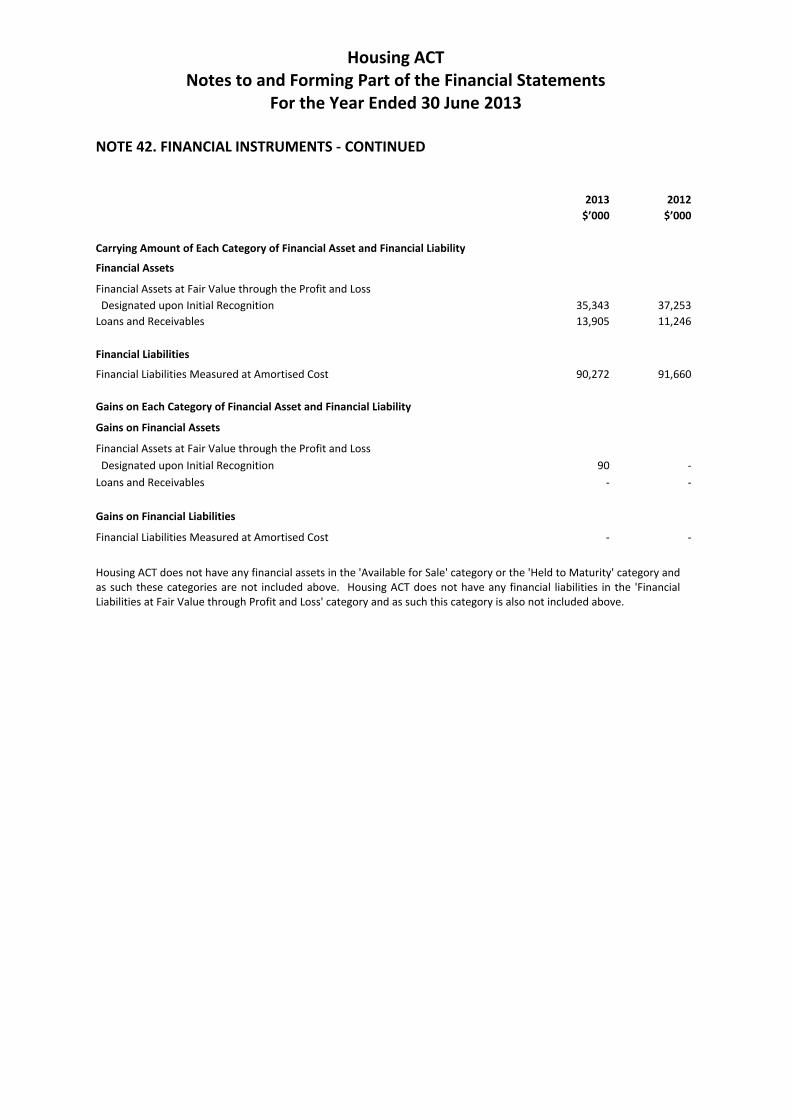
Hidden words
Housing ACT Notes to and Forming Part of the Financial Statements
For the Year Ended 30 June 2013
NOTE 42. FINANCIAL INSTRUMENTS - CONTINUED
2013 $’000
2012 $’000
Carrying Amount of Each Category of Financial Asset and Financial Liability
Financial Assets
Financial Assets at Fair Value through the Profit and Loss Designated upon Initial Recognition
Loans and Receivables 35,343 13,905
37,253 11,246
Financial Liabilities
Financial Liabilities Measured at Amortised Cost 90,272 91,660
Gains on Each Category of Financial Asset and Financial Liability
Gains on Financial Assets
Financial Assets at Fair Value through the Profit and Loss Designated upon Initial Recognition
Loans and Receivables 90
---
Gains on Financial Liabilities
Financial Liabilities Measured at Amortised Cost - -
Housing ACT does not have any financial assets in the 'Available for Sale' category or the 'Held to Maturity' category and as such these categories are not included above. Housing ACT does not have any financial liabilities in the 'Financial Liabilities at Fair Value through Profit and Loss' category and as such this category is also not included above.

Hidden words
Housing ACT Notes to and Forming Part of the Financial Statements
For the Year Ended 30 June 2013
NOTE 43. INTEREST IN A JOINT VENTURE
On 16 May 2007 Housing ACT entered into an unincorporated Joint Venture with the Hindmarsh Group for the redevelopment of land, consisting of blocks 3 and 4, section 69 in Lyons - the Lyons Estate Redevelopment Joint Venture.
Housing ACT contributed the land to the Joint Venture and the Hindmarsh Group will finance the Joint Venture operations and undertake the design, construction and marketing of residential units and a retirement village on the site. Housing ACT is entitled to the following:
· a 50% share of the profits from the sale of the residential units;
· a 35% share of the profits from the sale of the retirement units; and
· a 50% share of any other profits from the joint venture.
The Joint Venture is accounted for as a jointly controlled operation in accordance with the Australian Accounting Standard AASB 131: Interests in Joint Ventures, which requires the following to be recognised in the Financial Statements:
(a) the assets that Housing ACT controls and the liabilities that it incurs in respect of its interests in the jointly controlled venture; and
(b) the expenses that Housing ACT incurs and its share of the income that it earns from the sale of units by the Joint Venture.
The value of the land and any costs incurred by Housing ACT on behalf of the Joint Venture are included in receivables. For further details refer to Note 23 - Receivables.
2013 2012 $’000 $’000
Assets Employed in the Jointly Controlled Operation
Non-Current Assets
Lyons Land Receivable a) 4,675 4,328
Total Non-Current Assets 4,675 4,328
Total Assets Employed in the Jointly Controlled Operation 4,675 4,328
a) Housing ACT contributed land at an agreed value of $8.1 million to the Joint Venture in May 2007. Johrosa Pty Limited, a member of the Hindmarsh Group, and the operating company for the retirement village paid $4.4 million for the retirement village land in December 2008. The Lyons land receivable represents the remaining value of the land contributed to the Joint Venture ($3.7 million), plus any interest earned on the land value.
Housing ACT paid the general rates and water rates for the first few years after inception of the Joint Venture. As these are Joint Venture costs, they have been included in the receivable for the Joint Venture and interest accrued thereon each year. This amount will be paid to Housing ACT as part of the final accounting under the Joint Venture. No other transactions by Housing ACT have occurred in respect of the Joint Venture. The Hindmarsh Group have incurred all other costs related to the construction, marketing and administration of the Joint Venture operations.
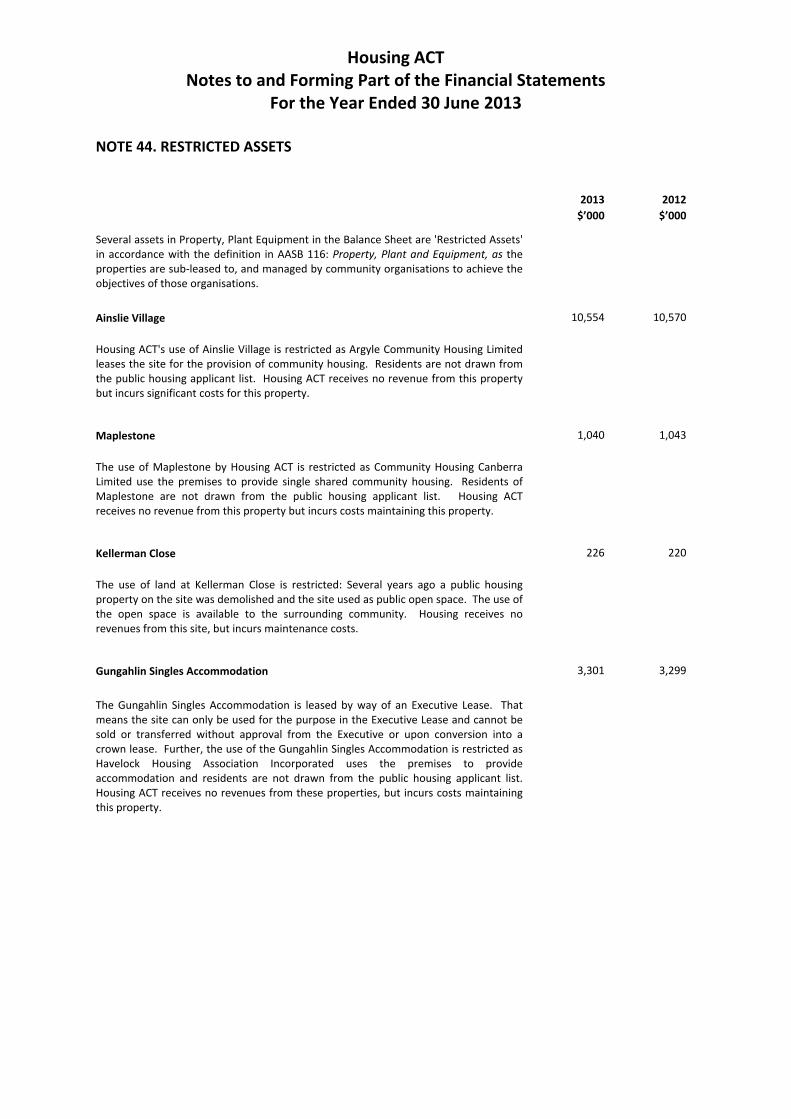
Hidden words
Housing ACT Notes to and Forming Part of the Financial Statements
For the Year Ended 30 June 2013
NOTE 44. RESTRICTED ASSETS
2013 $’000
2012 $’000
Several assets in Property, Plant Equipment in the Balance Sheet are 'Restricted Assets' in accordance with the definition in AASB 116: Property, Plant and Equipment, as the properties are sub-leased to, and managed by community organisations to achieve the objectives of those organisations.
Ainslie Village 10,554 10,570
Housing ACT's use of Ainslie Village is restricted as Argyle Community Housing Limited leases the site for the provision of community housing. Residents are not drawn from the public housing applicant list. Housing ACT receives no revenue from this property but incurs significant costs for this property.
Maplestone 1,040 1,043
The use of Maplestone by Housing ACT is restricted as Community Housing Canberra Limited use the premises to provide single shared community housing. Residents of Maplestone are not drawn from the public housing applicant list. Housing ACT receives no revenue from this property but incurs costs maintaining this property.
Kellerman Close 226 220
The use of land at Kellerman Close is restricted: Several years ago a public housing property on the site was demolished and the site used as public open space. The use of the open space is available to the surrounding community. Housing receives no revenues from this site, but incurs maintenance costs.
Gungahlin Singles Accommodation 3,301 3,299
The Gungahlin Singles Accommodation is leased by way of an Executive Lease. That means the site can only be used for the purpose in the Executive Lease and cannot be sold or transferred without approval from the Executive or upon conversion into a crown lease. Further, the use of the Gungahlin Singles Accommodation is restricted as Havelock Housing Association Incorporated uses the premises to provide accommodation and residents are not drawn from the public housing applicant list. Housing ACT receives no revenues from these properties, but incurs costs maintaining this property.

Hidden words
Housing ACT Notes to and Forming Part of the Financial Statements
For the Year Ended 30 June 2013
NOTE 45. EVENTS OCCURING AFTER BALANCE DATE
Changes to the method of calculating rebates will be implemented from 1 July 2013. Under the new arrangements rebates will be calculated on a twelve-monthly basis rather than the six-monthly cycle as is currently the case. The change in rebate calculation will streamline operations and simplify the arrangements for tenants, but will result in a loss of rental receipts due to the longer time before any increase in household income is assessed in calculating their rebate and therefore in determining the amount payable as rent. The change in policy is estimated to reduce rental revenues by about $0.5 million in 2013-14.
The ACT was successful in securing $4 million in capital funding from the Commonwealth under the National Partnership Agreement on Homelessness Development Fund to assist construct the Common Ground in Canberra. The ACT Government provided $7 million in capital funding for the construction of the Common Ground in the 2013-14 Budget as well as the land, valued at $2.08 million. Construction of the Common Ground is estimated to cost $15 million, excluding land costs. Discussions with the Chief Minister and Treasury Directorate for the shortfall funding have commenced. The outcome of the request for additional funding is unknown at the report date, but if unsuccessful, Housing ACT may be required to fund the shortfall, some $4 million.
The Common Ground will be owned and operated by the community housing provider, Argyle Community housing limited, once constructed by Housing ACT. The transfer of this asset will result in a transfer expense of at least $15 million to be recognised by Housing ACT in the year that the construction is completed and the development transferred to Argyle Community Housing Limited. It is expected that the construction will be completed before December 2014 to enable tenants to move in by this date, as required under the approval for Development Fund monies. An application for National Rental Affordability Scheme (NRAS) funding has also been lodged with the Commonwealth. That application has been successful and NRAS funding has been approved for the Common Ground development in the ACT.

SECTION B ANALYSIS OF FINANCIAL PERFORMANCE — HOUSING ACT 249
B.3 Statement of Performance
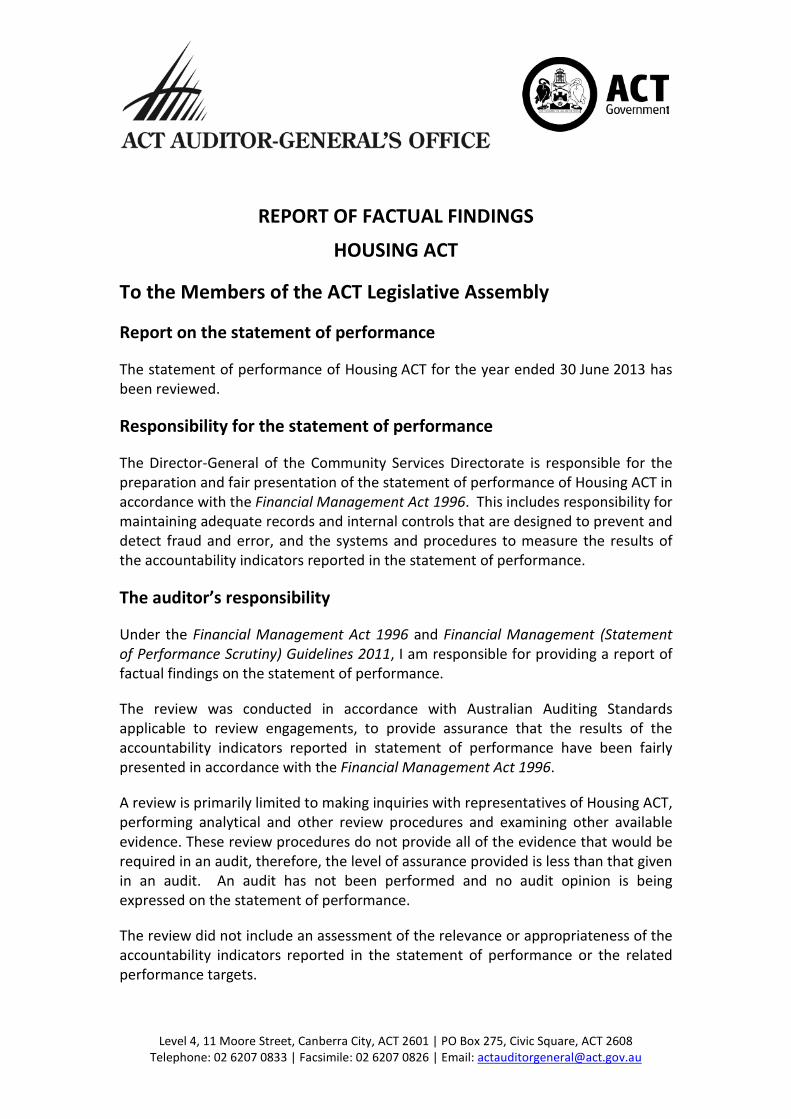
REPORT OF FACTUAL FINDINGS
HOUSING ACT
To the Members of the ACT Legislative Assembly
Report on the statement of performance
The statement of performance of Housing ACT for the year ended 30 June 2013 has been reviewed.
Responsibility for the statement of performance
The Director-General of the Community Services Directorate is responsible for the preparation and fair presentation of the statement of performance of Housing ACT in accordance with the Financial Management Act 1996. This includes responsibility for maintaining adequate records and internal controls that are designed to prevent and detect fraud and error, and the systems and procedures to measure the results of the accountability indicators reported in the statement of performance.
The auditor’s responsibility
Under the Financial Management Act 1996 and Financial Management (Statement of Performance Scrutiny) Guidelines 2011, I am responsible for providing a report of factual findings on the statement of performance.
The review was conducted in accordance with Australian Auditing Standards applicable to review engagements, to provide assurance that the results of the accountability indicators reported in statement of performance have been fairly presented in accordance with the Financial Management Act 1996.
A review is primarily limited to making inquiries with representatives of Housing ACT, performing analytical and other review procedures and examining other available evidence. These review procedures do not provide all of the evidence that would be required in an audit, therefore, the level of assurance provided is less than that given in an audit. An audit has not been performed and no audit opinion is being expressed on the statement of performance.
The review did not include an assessment of the relevance or appropriateness of the accountability indicators reported in the statement of performance or the related performance targets.
Level 4, 11 Moore Street, Canberra City, ACT 2601 | PO Box 275, Civic Square, ACT 2608 Telephone: 02 6207 0833 | Facsimile: 02 6207 0826 | Email: [email protected]

No opinion is expressed on the accuracy of explanations provided for variations between actual and targeted performance due to the often subjective nature of such explanations.
Electronic presentation of the statement of performance
Those viewing an electronic presentation of this statement of performance should note that the review does not provide assurance on the integrity of information presented electronically, and does not provide an opinion on any other information which may have been hyperlinked to or from this statement of performance. If users of this statement of performance are concerned with the inherent risks arising from the electronic presentation of information, they are advised to refer to the printed copy of the reviewed statement of performance to confirm the accuracy of this electronically presented information.
Independence
Applicable independence requirements of Australian professional ethical pronouncements were followed in conducting the review.
Review opinion
Based on the review procedures, no matters have come to my attention which indicate that the results of the accountability indicators, reported in the statement of performance of Housing ACT for the year ended 30 June 2013, are not fairly presented in accordance with the Financial Management Act 1996.
This review opinion should be read in conjunction with the other information disclosed in this report.

Housing ACT
Statement of Performance For the Year Ended 30 June 2013
Statement of Responsibility
In my opinion, the Statement of Performance is in agreement with
Housing ACT’s records and fairly reflects the service performance of
Housing ACT for the year ended 30 June 2013 and also fairly reflects
the judgements exercised in preparing it.
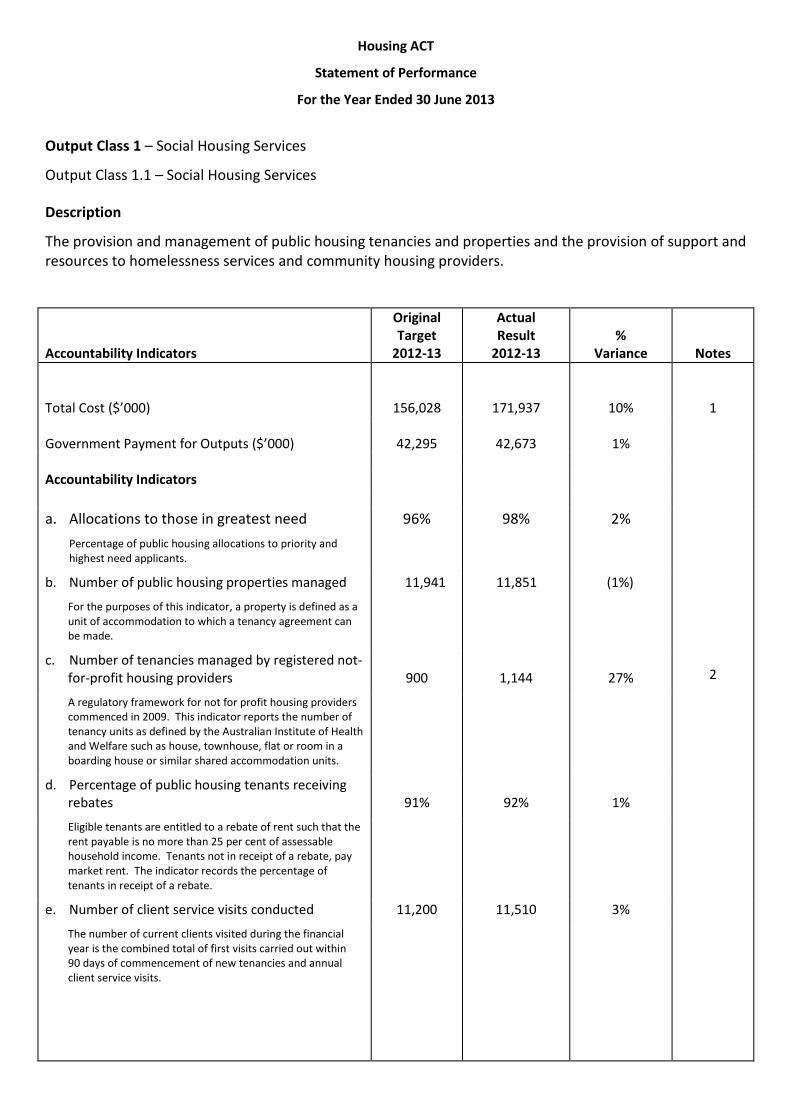
Housing ACT
Statement of Performance
For the Year Ended 30 June 2013
Output Class 1 – Social Housing Services
Output Class 1.1 – Social Housing Services
Description
The provision and management of public housing tenancies and properties and the provision of support and resources to homelessness services and community housing providers.
Accountability Indicators
Original Target
2012-13
Actual Result
2012-13 %
Variance Notes
Total Cost ($’000) 156,028 171,937 10% 1
Government Payment for Outputs ($’000)
Accountability Indicators
42,295 42,673 1%
a. Allocations to those in greatest need Percentage of public housing allocations to priority and highest need applicants.
96% 98% 2%
b. Number of public housing properties managed
For the purposes of this indicator, a property is defined as a unit of accommodation to which a tenancy agreement can be made.
c. Number of tenancies managed by registered not-
11,941 11,851 (1%)
for-profit housing providers
A regulatory framework for not for profit housing providers commenced in 2009. This indicator reports the number of tenancy units as defined by the Australian Institute of Health and Welfare such as house, townhouse, flat or room in a boarding house or similar shared accommodation units.
d. Percentage of public housing tenants receiving
900 1,144 27% 2
rebates
Eligible tenants are entitled to a rebate of rent such that the rent payable is no more than 25 per cent of assessable household income. Tenants not in receipt of a rebate, pay market rent. The indicator records the percentage of tenants in receipt of a rebate.
91% 92% 1%
e. Number of client service visits conducted
The number of current clients visited during the financial year is the combined total of first visits carried out within 90 days of commencement of new tenancies and annual client service visits.
11,200 11,510 3%

Housing ACT
Statement of Performance
For the Year Ended 30 June 2013
Accountability Indicators
Original Target
2012-13
Actual Result
2012-13 %
Variance Notes
f. Overall satisfaction with the provision of public housing
Tenant satisfaction is measured biennially through the National Social Housing Survey and in the alternative years through an internal survey.
g. Average cost per dwelling of public housing
Total cost of public housing excluding the direct grants to community service providers and to the community housing sector divided by the stock number.
h. Overall satisfaction with the provision of
75%
$10,901
74%
$10,925
(1%)
-
community housing
Tenant satisfaction is measured biennially through the National Community Housing Survey and in the alternative years through an internal survey.
i. Occupancy rate of properties managed by public housing
Total number of tenancies divided by the total number of lettable dwellings.
j. Percentage of tenant accounts > $500 and four or more weeks in arrears on repayment
75%
99%
67%
98%
(11%)
(1%)
3
agreements
Tenants with rent arrears exceeding four weeks rent and with debts exceeding $500 are required to enter into agreements to repay the arrears within a reasonable time either prior to an Order to repay the debt has been made by the ACT Civil and Administrative Tribunal or in conjunction with an Order. To maintain the sustainability of the tenancy and not create household stress, policy guidelines provide that the repayment of arrears and the rent payments are not to exceed 30 per cent of total income.
k. Percentage of rent received
Percentage of rent received from tenants compared to rent charged, after rebates.
90%
99%
84%
99%
(7%)
-
4
The above Statement of Performance should be read in conjunction with the accompanying notes.
Explanation of Material Variances
1. The higher than target total cost for social housing services is largely attributable to the cost of the dwellings transferred to the community housing sector. During the funding negotiations with the Commonwealth for the Nation Building and Jobs Plan Economic Stimulus Initiative, the Commonwealth required a proportion of the properties to be transferred to the community housing sector. This transfer is the final commitment under that Agreement. In addition, property costs such as water charges and general rates were also higher, but these costs were offset by the lower depreciation and amortisation costs due to the lower than expected increase in property values last

2.
3.
4.
Housing ACT
Statement of Performance
For the Year Ended 30 June 2013
year and the delay in upgrading the business system Homenet, which reduced the amortisation charge for the system for the year.
The number of tenancies managed by registered not-for-profit housing providers is substantially higher than the target as a result of two additional agencies being registered during the year, adding 142 tenancies under management. In addition, increases to the number of tenancies occur as a result of the construction of dwellings by the community and affordable housing sector from funding from the Commonwealth under the National Rental Affordability Scheme and the ACT revolving line of credit to CHC Affordable Housing.
A tenant satisfaction survey for community housing and public housing is undertaken every two years as part of the information to be included in the Report on Government Services published by the Productivity Commission. The ACT commissions a survey in the alternative years to report against the same measures. The 2013 results are from the ACT Survey. The satisfaction survey results for public housing are reported at the indicator (f) above. The satisfaction by tenants with the provision of housing by their community housing provider was lower than expected in 2013, although only slightly lower than the 2012 result (4%). The results varied quite markedly between providers, with a number of providers exceeding the 75% satisfaction target. However, several providers were lower than the target and when aggregated with all other providers, resulted in reducing the overall result. The level of satisfaction for some providers was affected by elements of the condition of the property and perceptions about the level of service that are expected for maintenance and other services.
There is a continuing focus on reducing tenant rental arrears through a range of strategies and early intervention measures to ensure that there is ongoing engagement with tenants, and housing managers maintain a dialogue with their tenants, in order to link them to the supports and assistance that will help them maintain and sustain their tenancy and address their rental arrears. However, given the pressures facing household budgets, particularly as a result of higher water, electricity, petrol and food etc, low income families are finding it increasingly difficult to meet their household bills, pay their rent and meet the additional requirements to pay rental arrears and other debts. The debt recovery rate is also affected by the policy that tenants need pay no more than 30% of their household income as rent and arrears, and this limits their capacity to enter into repayment agreements and quickly repay any rental arrears.

CSECTION
TRIPLE BOTTOM LINE REPORTING


SECTION C TRIPLE BOTTOM LINE REPORTING 259
C. Triple Bottom Line ReportingTable 1—Community Services Directorate’s Performance
INDICATOR2011–12
Result2012–13
Result%
Change
EC
ON
OM
IC
Employee Expenses Number of staff employed (head count)Total employee expenditure (’000)
1,312$116,596
1,320$122,664
0.6%5.2%
Operating StatementTotal expenditure (’000) Total own source revenue (’000) Total net cost of services (’000)
$399,360$105,813$293,547
$418,224$108,988$309,237
4.7%3.0%5.3%
Economic ViabilityTotal assets (’000) Total liabilities (’000)
$4,710,999$139,919
$4,701,827$144,219
(0.2%)3.1%
EN
VIR
ON
ME
NTA
L
TransportTotal number of fleet vehicles Total kilolitres of fuel usedTotal direct greenhouse emissions of the fleet (tonnes of CO2e)
184197.2
556.71
182188.08525.11
(1.09%)(4.62%)(5.68%)
Energy UseTotal office energy use (megajoules)Office energy use per FTE (megajoules/FTE)Office energy use per square metre (megajoules/m2)
5,513,1001
7,3551
447.71
5,575,2502
7,1662
452.752
1.13%(2.57%)
1.13%
Greenhouse EmissionsTotal office greenhouse emissions—direct and indirect (tonnes of CO2e)Total office greenhouse emissions per FTE (tonnes of CO2e/FTE)Total office greenhouse emissions per square metre (tonnes of CO2e/ m2)
951.221
1.271
0.0771
1,227.72
1.582
0.1002
29.07%24.41%29.87%
Water ConsumptionTotal water use (kilolitres)Office water use per FTE (kilolitres/FTE)Office water use per square metre (kilolitres/m2)
3,218.781
7.441
0.571
2,501.32
5.982
0.442
(22.29%)(19.62%)(22.81%)

COMMUNITY SERVICES DIRECTORATE ANNUAL REPORT 2012–13260
INDICATOR2011–12
Result2012–13
Result%
Change
Resource Efficiency and WasteEstimate of co-mingled office waste per FTE (litres)Estimate of paper recycled (litres)Estimate of paper used (by reams) per FTE
NA
91,40819.2
19,260
322,5513
21.5
NA
252.87%11.98%
SO
CIA
L
Diversity of Our WorkforceWomen (Female FTEs as a percentage of the total workforce)People with disability (as a percentage of the total workforce)Aboriginal and Torres Strait Islander people (as a percentage of the total workforce)Staff with English as a second language (as a percentage of the total workforce)
69.6%
2.4%
2.7%
13.8%
67.1%
2.8%
3%
15%
(3%)
19.4%
11.4%
9.4%
Staff Health and WellbeingOH&S Incident ReportsAccepted claims for compensation (as at 31 August 2011)Staff receiving influenza vaccinationsWorkstation assessments requested
27339
362NA
35036
34036
28.2%(7.7%)
(6.1%)
NA
Notes:
1 The 2011–12 utility figures have been recalculated to exclude the North building. In the 2011–12 Annual Report the energy usage per square metre was almost four times higher than average. This has been attributed to the extensive out of hours usage for functions and events, as well as the lack of sub metering to accurately determine the office component.
2 The 2012–13 results for energy use do not include the North Building (refer note 1 above).
3 The 2011–12 figures for paper usage only include secure paper while the 2012–13 figure includes unsecured paper also. Additional data was received from Recall allowing for a much more accurate figure.
Further information may be obtained from
Ms Meredith Whitten, Executive Director, Policy and Organisational ServicesPhone: 6207 9031 Fax: 6205 0343TTY: 6205 0888 Email: [email protected] Website: www.communityservices.act.gov.au
DSECTION
STRATEGIC ASSET MANAGEMENT

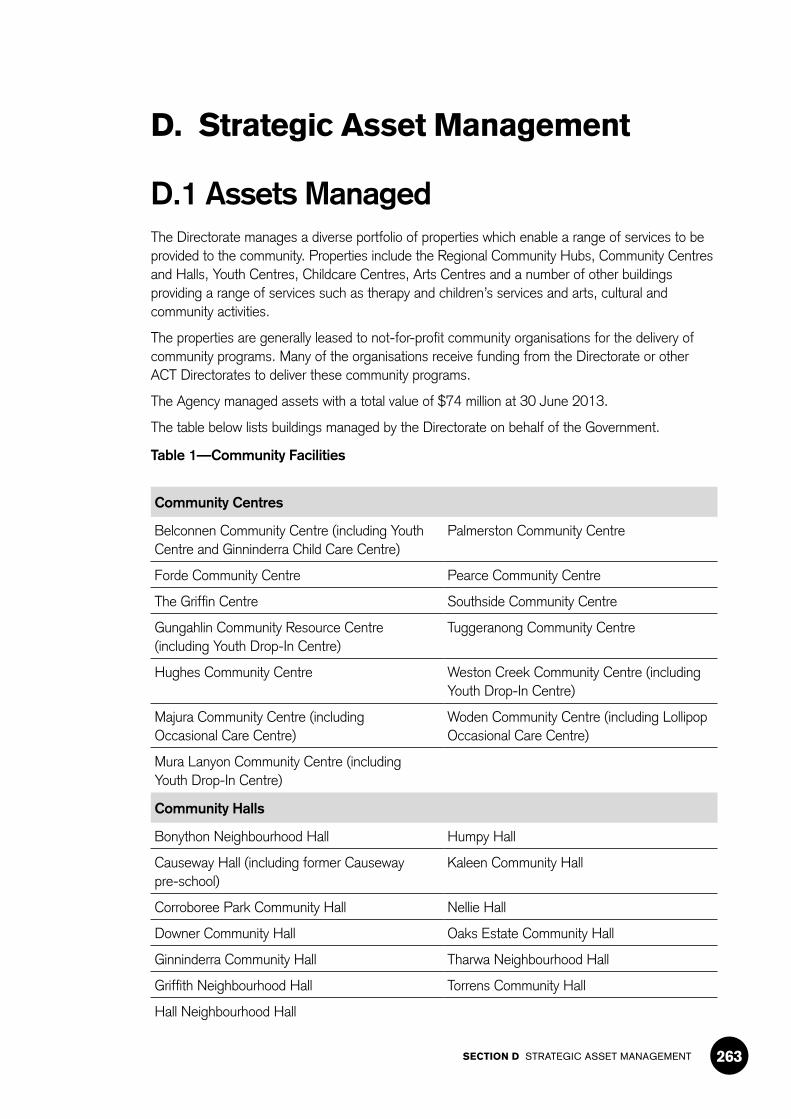
SECTION D STRATEGIC ASSET MANAGEMENT 263
D. Strategic Asset Management
D.1 Assets ManagedThe Directorate manages a diverse portfolio of properties which enable a range of services to be provided to the community. Properties include the Regional Community Hubs, Community Centres and Halls, Youth Centres, Childcare Centres, Arts Centres and a number of other buildings providing a range of services such as therapy and children’s services and arts, cultural and community activities.
The properties are generally leased to not-for-profit community organisations for the delivery of community programs. Many of the organisations receive funding from the Directorate or other ACT Directorates to deliver these community programs.
The Agency managed assets with a total value of $74 million at 30 June 2013.
The table below lists buildings managed by the Directorate on behalf of the Government.
Table 1—Community Facilities
Community Centres
Belconnen Community Centre (including Youth Centre and Ginninderra Child Care Centre)
Palmerston Community Centre
Forde Community Centre Pearce Community Centre
The Griffin Centre Southside Community Centre
Gungahlin Community Resource Centre (including Youth Drop-In Centre)
Tuggeranong Community Centre
Hughes Community Centre Weston Creek Community Centre (including Youth Drop-In Centre)
Majura Community Centre (including Occasional Care Centre)
Woden Community Centre (including Lollipop Occasional Care Centre)
Mura Lanyon Community Centre (including Youth Drop-In Centre)
Community Halls
Bonython Neighbourhood Hall Humpy Hall
Causeway Hall (including former Causeway pre-school)
Kaleen Community Hall
Corroboree Park Community Hall Nellie Hall
Downer Community Hall Oaks Estate Community Hall
Ginninderra Community Hall Tharwa Neighbourhood Hall
Griffith Neighbourhood Hall Torrens Community Hall
Hall Neighbourhood Hall

COMMUNITY SERVICES DIRECTORATE ANNUAL REPORT 2012–13264
Community Houses
Conder Community House and Child Care Centre
Richardson Community House
Gilmore Community House Thiess Cottage
Giralang Community House VOCAL House
Isabella Plains Community House Wanniassa Community House
Nicholls Community House
Neighbourhood Centres
Calwell Neighbourhood Centre Erindale Neighbourhood Centre
Charnwood Neighbourhood Centre (including childcare)
Ngunnawal Neighbourhood Centre
Chisholm Neighbourhood Centre Richardson Occasional Care/Family Centre (including childcare)
Community Rooms
CARE Inc. Financial Counselling Service (Waldorf Apartments)
Childcare Centres
Calwell Childcare Centre Causeway Childcare Centre
Flynn Childcare Centre Ginninderra Childcare Centre
Lollipop Children’s Centre Majura Childcare Centre
Richardson Occasional Care
Youth Centres
Club 12/25 Civic Youth Centre Tuggeranong Youth Centre
Gugan Gulwan Youth Centre Woden Youth Centre
Narrabundah Youth Drop-In Centre Youth Coalition
Special Care
Marlow Cottages
Cultural Centre
Aboriginal and Torres Strait Islander Cultural Centre
Therapy Centre
Therapy ACT, Holder
Child and Family Centres
Gungahlin Child and Family Centre
Tuggeranong Child and Family Centre
West Belconnen Child and Family Centre
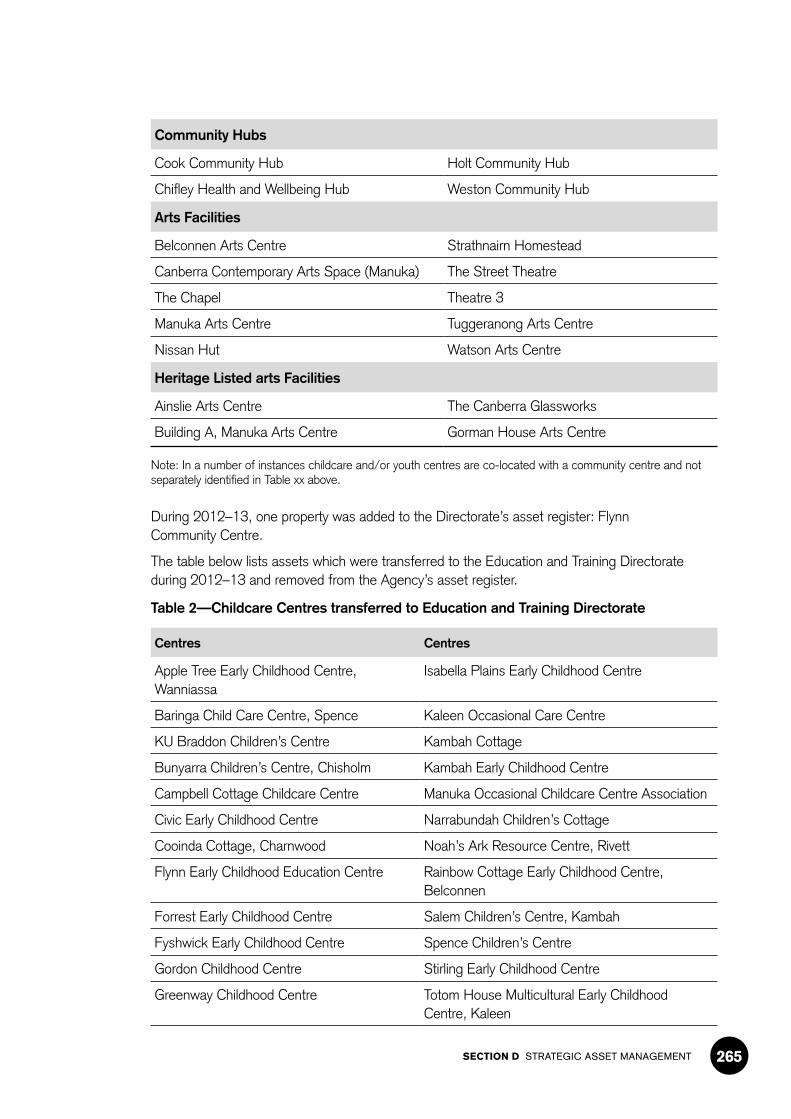
SECTION D STRATEGIC ASSET MANAGEMENT 265
Community Hubs
Cook Community Hub Holt Community Hub
Chifley Health and Wellbeing Hub Weston Community Hub
Arts Facilities
Belconnen Arts Centre Strathnairn Homestead
Canberra Contemporary Arts Space (Manuka) The Street Theatre
The Chapel Theatre 3
Manuka Arts Centre Tuggeranong Arts Centre
Nissan Hut Watson Arts Centre
Heritage Listed arts Facilities
Ainslie Arts Centre The Canberra Glassworks
Building A, Manuka Arts Centre Gorman House Arts Centre
Note: In a number of instances childcare and/or youth centres are co-located with a community centre and not separately identified in Table xx above.
During 2012–13, one property was added to the Directorate’s asset register: Flynn Community Centre.
The table below lists assets which were transferred to the Education and Training Directorate during 2012–13 and removed from the Agency’s asset register.
Table 2—Childcare Centres transferred to Education and Training Directorate
Centres Centres
Apple Tree Early Childhood Centre, Wanniassa
Isabella Plains Early Childhood Centre
Baringa Child Care Centre, Spence Kaleen Occasional Care Centre
KU Braddon Children’s Centre Kambah Cottage
Bunyarra Children’s Centre, Chisholm Kambah Early Childhood Centre
Campbell Cottage Childcare Centre Manuka Occasional Childcare Centre Association
Civic Early Childhood Centre Narrabundah Children’s Cottage
Cooinda Cottage, Charnwood Noah’s Ark Resource Centre, Rivett
Flynn Early Childhood Education Centre Rainbow Cottage Early Childhood Centre, Belconnen
Forrest Early Childhood Centre Salem Children’s Centre, Kambah
Fyshwick Early Childhood Centre Spence Children’s Centre
Gordon Childhood Centre Stirling Early Childhood Centre
Greenway Childhood Centre Totom House Multicultural Early Childhood Centre, Kaleen
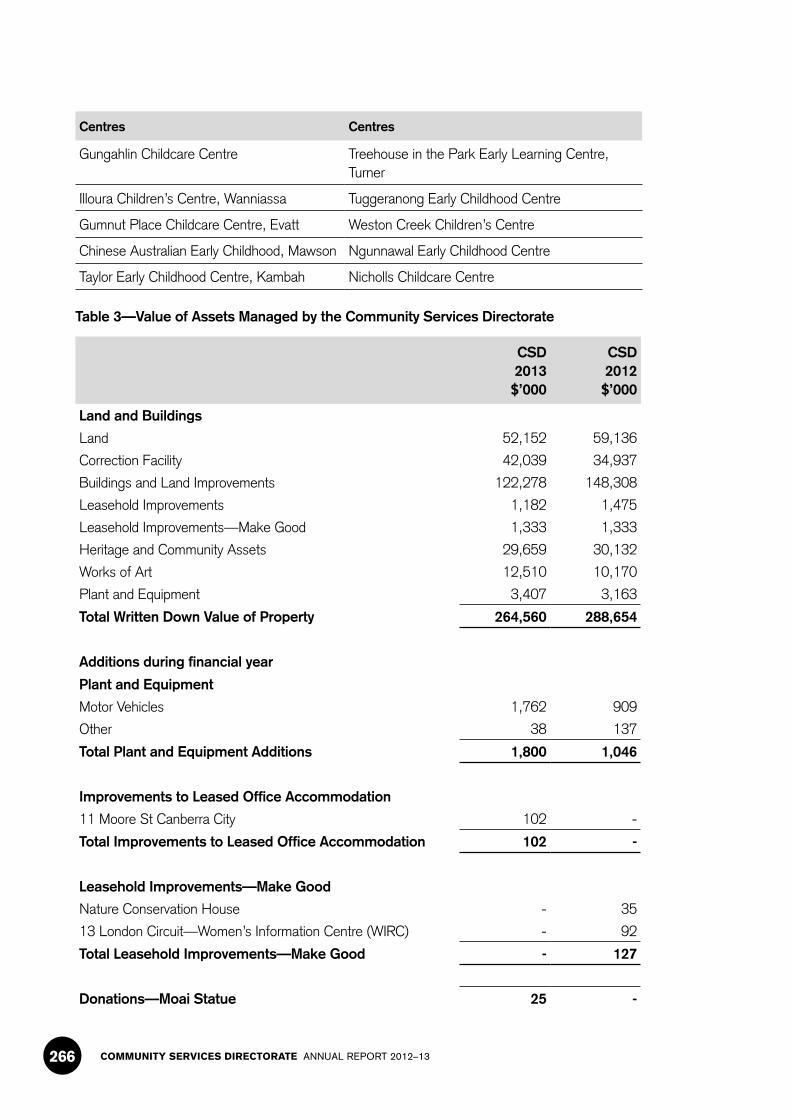
COMMUNITY SERVICES DIRECTORATE ANNUAL REPORT 2012–13266
Centres Centres
Gungahlin Childcare Centre Treehouse in the Park Early Learning Centre, Turner
Illoura Children’s Centre, Wanniassa Tuggeranong Early Childhood Centre
Gumnut Place Childcare Centre, Evatt Weston Creek Children’s Centre
Chinese Australian Early Childhood, Mawson Ngunnawal Early Childhood Centre
Taylor Early Childhood Centre, Kambah Nicholls Childcare Centre
Table 3—Value of Assets Managed by the Community Services Directorate
CSD2013$’000
CSD2012$’000
Land and Buildings
Land 52,152 59,136
Correction Facility 42,039 34,937
Buildings and Land Improvements 122,278 148,308
Leasehold Improvements 1,182 1,475
Leasehold Improvements—Make Good 1,333 1,333
Heritage and Community Assets 29,659 30,132
Works of Art 12,510 10,170
Plant and Equipment 3,407 3,163
Total Written Down Value of Property 264,560 288,654
Additions during financial year
Plant and Equipment
Motor Vehicles 1,762 909
Other 38 137
Total Plant and Equipment Additions 1,800 1,046
Improvements to Leased Office Accommodation
11 Moore St Canberra City 102 -
Total Improvements to Leased Office Accommodation 102 -
Leasehold Improvements—Make Good
Nature Conservation House - 35
13 London Circuit—Women’s Information Centre (WIRC) - 92
Total Leasehold Improvements—Make Good - 127
Donations—Moai Statue 25 -

SECTION D STRATEGIC ASSET MANAGEMENT 267
CSD2013$’000
CSD2012$’000
Capitalised from Capital Works for Buildings, Land Improvements and Heritage and Community Assets for Community and Childcare Facilities and artsACT Facilities 10,217 19,876
Total Asset Additions during financial year 12,144 21,049
Asset Disposals during financial year
Plant and Equipment
Motor Vehicles 815 842
Total Asset Disposals during financial year 815 366
Asset transfers during financial year to CSD
Land
Affordable Rental Office Housing 314 2,166
Buildings
Affordable Rental Office Housing 871 5,037
1,185 4,014
Asset transfers during financial year from CSD
Land
Affordable Rental Office Housing 7 -
Buildings
Affordable Rental Office Housing 222 -
229 -
Asset transfers under Administration Arrangements (AAs)
Land 15,432 -
Buildings and Land Improvements 16,557 -
Heritage and Community Assets 1,270 -
Total AA Transfers for artsACT 2012–13 33,259 -
Further information may be obtained from
Ms Meredith Whitten, Executive Director, Policy and Organisational ServicesPhone: 6207 9031 Fax: 6205 0343TTY: 6205 0888 Email: [email protected] Website: www.communityservices.act.gov.au
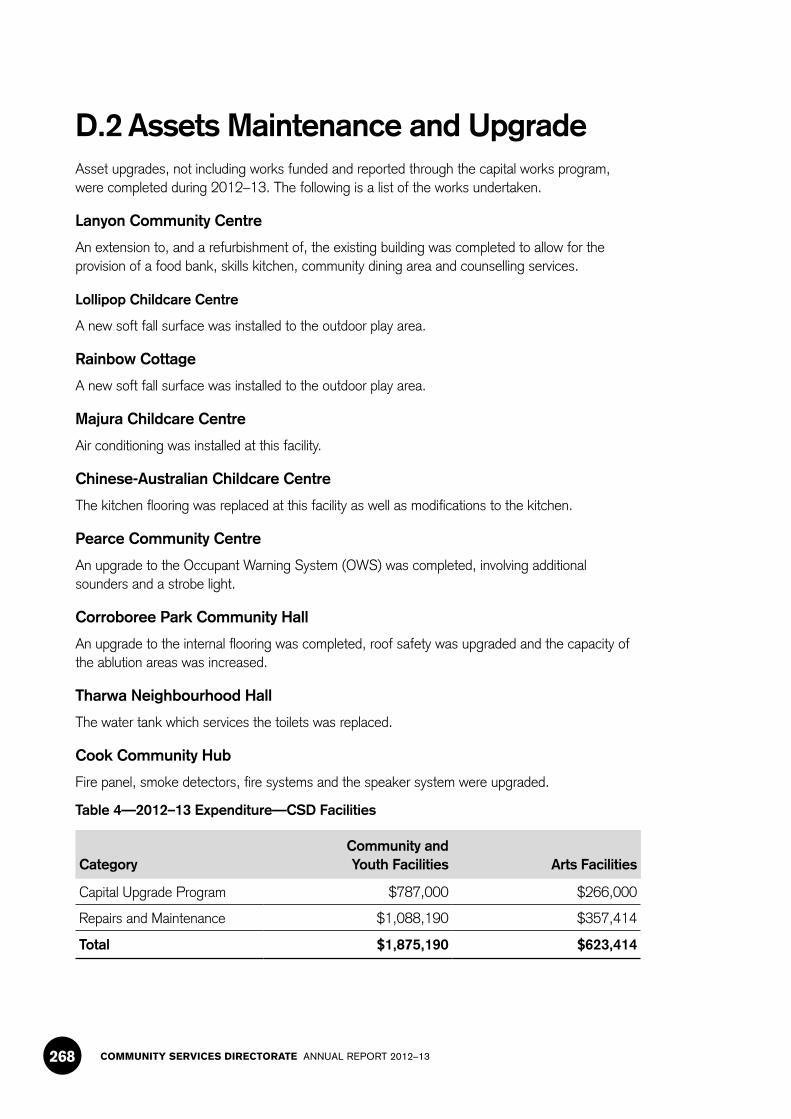
COMMUNITY SERVICES DIRECTORATE ANNUAL REPORT 2012–13268
D.2 Assets Maintenance and UpgradeAsset upgrades, not including works funded and reported through the capital works program, were completed during 2012–13. The following is a list of the works undertaken.
Lanyon Community Centre
An extension to, and a refurbishment of, the existing building was completed to allow for the provision of a food bank, skills kitchen, community dining area and counselling services.
Lollipop Childcare Centre
A new soft fall surface was installed to the outdoor play area.
Rainbow Cottage
A new soft fall surface was installed to the outdoor play area.
Majura Childcare Centre
Air conditioning was installed at this facility.
Chinese-Australian Childcare Centre
The kitchen flooring was replaced at this facility as well as modifications to the kitchen.
Pearce Community Centre
An upgrade to the Occupant Warning System (OWS) was completed, involving additional sounders and a strobe light.
Corroboree Park Community Hall
An upgrade to the internal flooring was completed, roof safety was upgraded and the capacity of the ablution areas was increased.
Tharwa Neighbourhood Hall
The water tank which services the toilets was replaced.
Cook Community Hub
Fire panel, smoke detectors, fire systems and the speaker system were upgraded.
Table 4—2012–13 Expenditure—CSD Facilities
CategoryCommunity and Youth Facilities Arts Facilities
Capital Upgrade Program $787,000 $266,000
Repairs and Maintenance $1,088,190 $357,414
Total $1,875,190 $623,414
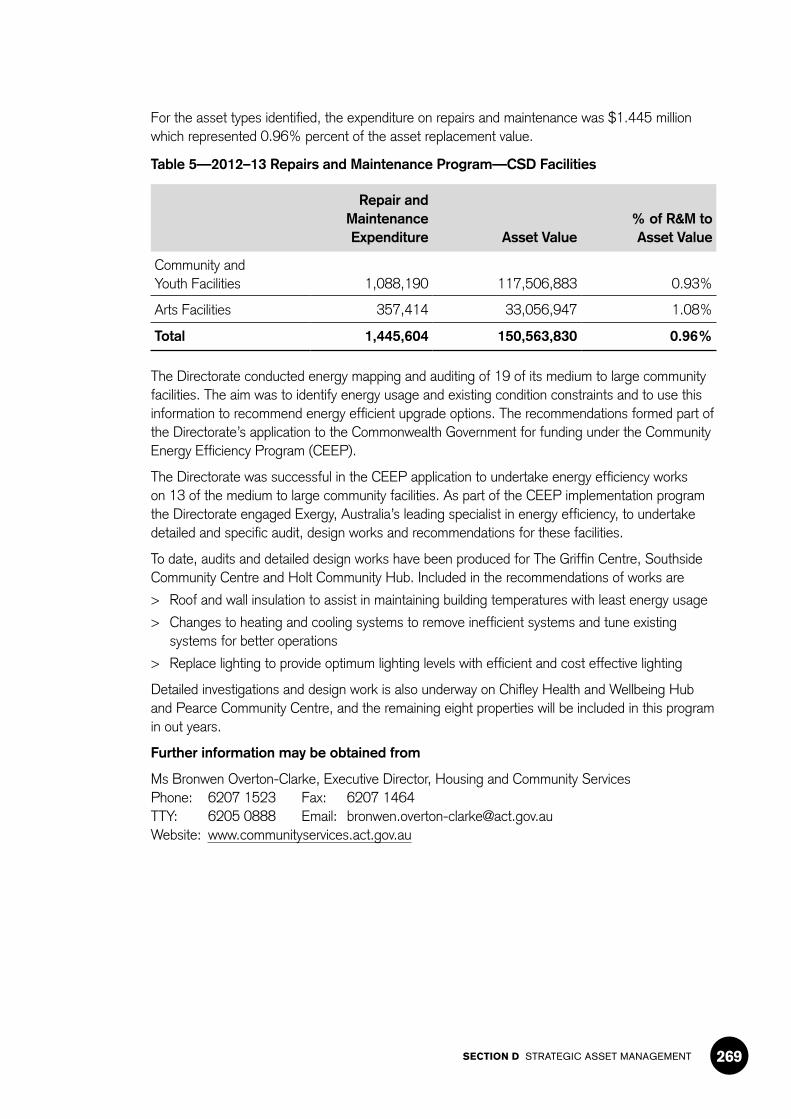
SECTION D STRATEGIC ASSET MANAGEMENT 269
For the asset types identified, the expenditure on repairs and maintenance was $1.445 million which represented 0.96% percent of the asset replacement value.
Table 5—2012–13 Repairs and Maintenance Program—CSD Facilities
Repair and
Maintenance Expenditure Asset Value
% of R&M to Asset Value
Community and Youth Facilities 1,088,190 117,506,883 0.93%
Arts Facilities 357,414 33,056,947 1.08%
Total 1,445,604 150,563,830 0.96%
The Directorate conducted energy mapping and auditing of 19 of its medium to large community facilities. The aim was to identify energy usage and existing condition constraints and to use this information to recommend energy efficient upgrade options. The recommendations formed part of the Directorate’s application to the Commonwealth Government for funding under the Community Energy Efficiency Program (CEEP).
The Directorate was successful in the CEEP application to undertake energy efficiency works on 13 of the medium to large community facilities. As part of the CEEP implementation program the Directorate engaged Exergy, Australia’s leading specialist in energy efficiency, to undertake detailed and specific audit, design works and recommendations for these facilities.
To date, audits and detailed design works have been produced for The Griffin Centre, Southside Community Centre and Holt Community Hub. Included in the recommendations of works are
> Roof and wall insulation to assist in maintaining building temperatures with least energy usage
> Changes to heating and cooling systems to remove inefficient systems and tune existing systems for better operations
> Replace lighting to provide optimum lighting levels with efficient and cost effective lighting
Detailed investigations and design work is also underway on Chifley Health and Wellbeing Hub and Pearce Community Centre, and the remaining eight properties will be included in this program in out years.
Further information may be obtained from
Ms Bronwen Overton-Clarke, Executive Director, Housing and Community ServicesPhone: 6207 1523 Fax: 6207 1464TTY: 6205 0888 Email: [email protected]: www.communityservices.act.gov.au
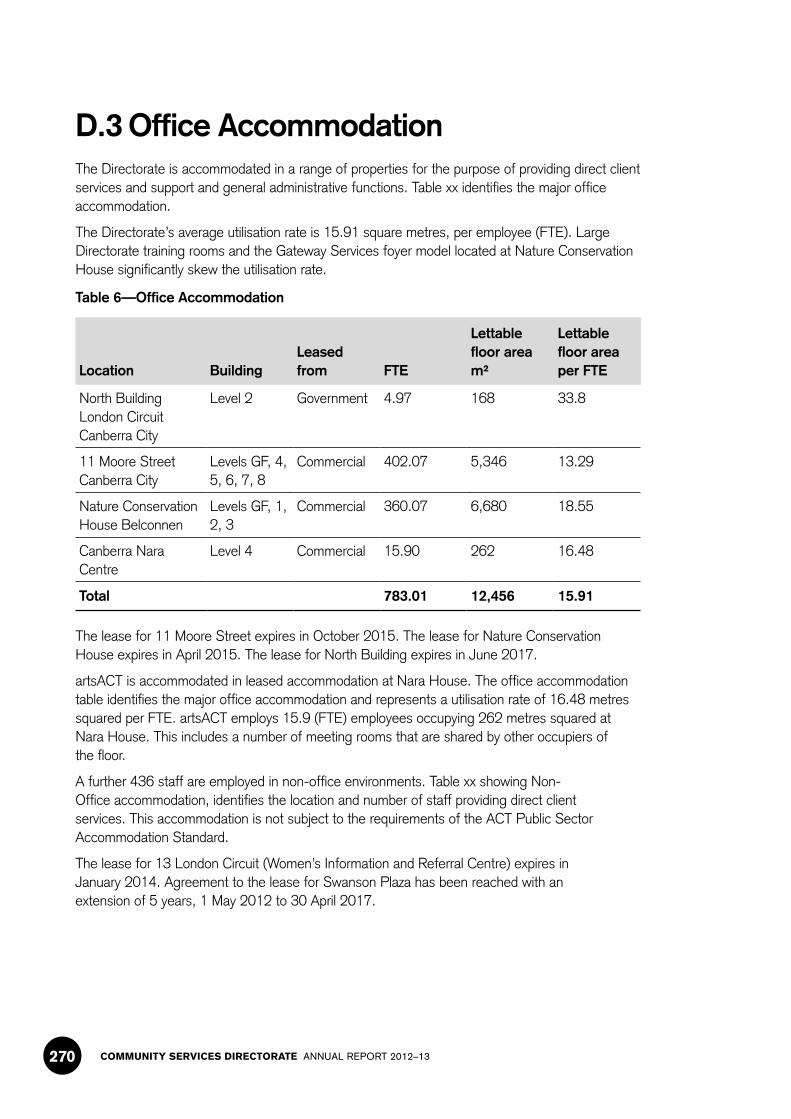
COMMUNITY SERVICES DIRECTORATE ANNUAL REPORT 2012–13270
D.3 Office AccommodationThe Directorate is accommodated in a range of properties for the purpose of providing direct client services and support and general administrative functions. Table xx identifies the major office accommodation.
The Directorate’s average utilisation rate is 15.91 square metres, per employee (FTE). Large Directorate training rooms and the Gateway Services foyer model located at Nature Conservation House significantly skew the utilisation rate.
Table 6—Office Accommodation
Location BuildingLeased from FTE
Lettable floor area m²
Lettable floor area per FTE
North Building London Circuit Canberra City
Level 2 Government 4.97 168 33.8
11 Moore Street Canberra City
Levels GF, 4, 5, 6, 7, 8
Commercial 402.07 5,346 13.29
Nature Conservation House Belconnen
Levels GF, 1, 2, 3
Commercial 360.07 6,680 18.55
Canberra Nara Centre
Level 4 Commercial 15.90 262 16.48
Total 783.01 12,456 15.91
The lease for 11 Moore Street expires in October 2015. The lease for Nature Conservation House expires in April 2015. The lease for North Building expires in June 2017.
artsACT is accommodated in leased accommodation at Nara House. The office accommodation table identifies the major office accommodation and represents a utilisation rate of 16.48 metres squared per FTE. artsACT employs 15.9 (FTE) employees occupying 262 metres squared at Nara House. This includes a number of meeting rooms that are shared by other occupiers of the floor.
A further 436 staff are employed in non-office environments. Table xx showing Non-Office accommodation, identifies the location and number of staff providing direct client services. This accommodation is not subject to the requirements of the ACT Public Sector Accommodation Standard.
The lease for 13 London Circuit (Women’s Information and Referral Centre) expires in January 2014. Agreement to the lease for Swanson Plaza has been reached with an extension of 5 years, 1 May 2012 to 30 April 2017.

SECTION D STRATEGIC ASSET MANAGEMENT 271
Table 7—Non-Office Accommodation
Building Location Leased / Owned Use FTE
Therapy ACT corner of Weingarth Street and Blackwood Terrace, Holder
Owned Therapy Services 61.05
Therapy ACT Swanson Plaza Belconnen
Leased Therapy Services 37.4
Women’s Information and Referral Service, 13 London Circuit City
Leased Shopfront Women’s Information Services
4.97
Tuggeranong Child and Family Centre
Owned Children’s Services 15.7
Gungahlin Child and Family Centre Owned Children’s Services 13.8
West Belconnen Child and Family Centre
Owned Children’s Services 15.4
Bimberi Youth Justice Centre Owned Youth Services 84.32
Narrabundah House, Narrabundah Owned Aboriginal Youth Services
0
Disability Group Homes Public housing Disability Services 203.56
Total 436.20
Further information may be obtained from
Ms Bronwen Overton-Clarke, Executive Director, Housing and Community ServicesPhone: 6207 1523 Fax: 6207 1464TTY: 6205 0888 Email: [email protected]: www.communityservices.act.gov.au


ESECTION
CAPITAL WORKS

SECTION E CAPITAL WORKS 275
E. Capital Works
E.1 Community Services DirectorateArts ACT Capital Program
The Capital Program was developed in accordance with the following criteria: occupational health and safety; access and equity; functional requirements; prudent asset management principles; demographics and accommodation needs.
The 2012–13 budget for capital projects was $3.114 million, funding a range of projects, minor new works, capital upgrades and refurbishment of existing facilities. This work included:
Tuggeranong Arts Centre
Construction of the Tuggeranong Arts Centre Improvements commenced in February 2013 and will provide a redeveloped entrance and foyer, new gallery, dance studio, lift to first floor and new office accommodation. Construction was well progressed as at 30 June 2013 and work is expected to be completed in September 2013.
Belconnen Arts Centre—Stage 2 Design
A cultural planner was engaged to provide a report into the future needs of the arts centre. This informed the brief that was developed to engage the architect. The tender to select the architect was nearing completion at the end of June 2013. The architect will be engaged to undertake a design option study, preliminary sketch plans, final sketch plans and a development approval submission.
Megalo Relocation
Work has been undertaken to refurbish the South Offices of the former Transport Depot on Wentworth Avenue Kingston as temporary accommodation for Megalo until a purpose built facility can be designed and constructed in the Kingston Arts Precinct. Works commenced on site in March 2013 and were completed in June 2013.
Community Facilities Capital Program
The 2012–13 capital program was developed to meet the needs of the community based on functional requirements, demographics, access and equity, occupational health and safety and security issues.
The 2012–13 budget for capital projects was $3.163 million, to fund works such as building renovations and extensions, building upgrades and grounds upgrades. This budget allocation was reduced to $2.656 million when the responsibility for childcare centres was transferred to the Education and Training Directorate (ETD) during the year. The list of works includes:
Holt Preschool Refurbishment
The proposal to refurbish the building for the purpose of a childcare centre was put on hold when the Territory announced the sale of the childcare centre site in the Holt Group Centre (Kippax). An Expression of Interest for the use of the space was issued and no interest by childcare operators was received. The intention is to use the space for programs run by Anglicare.
COMMUNITY SERVICES DIRECTORATE ANNUAL REPORT 2012–13276
Woden/Weston Community Hub
A consultancy commenced on a feasibility study into developing a community hub in the Woden/Weston Creek region. The community hub is to include a community centre, childcare centre and seniors centre. The study involved extensive consultation with the broad community as well as the Woden Seniors Centre and Woden Community Services. Work on the study was well advanced at 30 June 2013.
Civic Childcare Centre
The procurement process to engage a consultant to undertake a feasibility study to investigate options for redeveloping the Civic Childcare Centre in Marcus Street was commenced. As ETD took over responsibility for childcare during the year, the delivery of this initiative was transferred.
Flynn Community Centre—Stage 2
Construction of Stage 2 of the redevelopment of the former Flynn Primary School to provide a Community Hub commenced in January 2012. Completion of the Hub is expected to take place in August 2013. Negotiations with tenants who are proposing to occupy the Hub are underway.
Upgrade of Early Childhood Facilities
Housing and Community Services completed upgrades to KU Braddon Children’s Centre (Braddon), Campbell Cottage (Campbell), Cooinda Cottage (Charnwood) and Greenway Childhood Centre (Greenway). Work had also commenced on upgrades to further childcare centres in Forrest, Fyshwick and Narrabundah. These projects were transferred to the Education and Training Directorate as responsibility for childcare centres was transferred to that Directorate during the year.
Climate Change—Energy and Water Efficiency Measures
Commonwealth funding has been provided to improve the energy efficiency of Housing and Community Services’ community facilities through the Community Energy Efficiency Program (CEEP). Over the 4 year life of the project the total budget is $6.523 million, made up of $3.205 million from the Commonwealth and the remaining $3.318 million from the Directorate.
The CEEP implementation program will undertake major energy efficiency works on 13 of the medium to large community facilities. As part of the CEEP implementation program Housing and Community Services will complete detailed audits, design works and recommendations for these facilities. To date audits and design works have been completed at the Griffin Centre, Southside Community Centre and Holt Community Hub. Detailed design works are also underway at the Chifley Health and Wellbeing Hub and the Pearce Community Centre. The remaining eight facilities will be included in the program in the out years.

SECTION E CAPITAL WORKS 277
Tabl
e 1—
Sta
tem
ent o
f Cap
ital W
orks
Inco
me
and
Exp
endi
ture
201
2–13
Pro
ject
Not
es
Orig
inal
P
roje
ct
Valu
e ($
’000
)
Rev
ised
P
roje
ct
Valu
e ($
’000
)
Prio
r Y
r S
pend
($
’000
)
Prio
r Y
r Fi
nanc
ing
($’0
00)
2012
–13
Bud
gete
d Fu
ndin
g ($
’000
)
2012
–13
Rev
ised
Fi
nanc
ing
($’0
00)
2012
–13
Fore
cast
S
pend
($
’000
)
YTD
Exp
($
’000
) (I
nclu
ding
A
ccru
als)
Tota
l Fi
nanc
ing to
D
ate
($’0
00)
Tota
l E
xp to
D
ate
($’0
00)
Phy
sica
lly
Com
plet
ed
(Y/N
)
Fina
ncia
lly
Com
plet
ed
(Y/N
)
AB
CD
EF
GH
D+
FC
+H
NE
W C
AP
ITA
L W
OR
KS
Upg
rade
of C
omm
unity
Fac
ilitie
s an
d C
hild
care
Cen
tre Im
prov
emen
ts1
2,50
02,
383
--
1,00
027
3-
927
39
NN
Tugg
eran
ong
Arts
Cen
tre
Impr
ovem
ents
22,
000
2,00
0-
-80
01,
200
-98
31,
200
983
NN
Wod
en/W
esto
n C
reek
Com
mun
ity
Hub
(Fea
sibi
lity
and
forw
ard
Des
ign)
355
055
0-
-27
510
0-
5510
055
NN
Bel
conn
en A
rts C
entre
Sta
ge 2
(F
easi
bilit
y an
d Fo
rwar
d D
esig
n)4
300
300
--
300
220
-23
220
23N
N
Flyn
n R
egio
nal C
omm
unity
Hub
S
tage
25
1,20
01,
200
--
1,20
01,
175
-1,
175
1,17
51,
175
NN
Rep
lace
men
t of C
anbe
rra S
enio
rs
Cen
tre (D
esig
n)6
650
650
--
--
--
--
NN
Meg
alo
Prin
t Stu
dio
Rel
ocat
ion
7-
814
--
-24
2-
242
242
242
YN
Sub
-Tot
al
7,20
07,
897
--
3,57
53,
210
-2,
487
3,21
02,
487
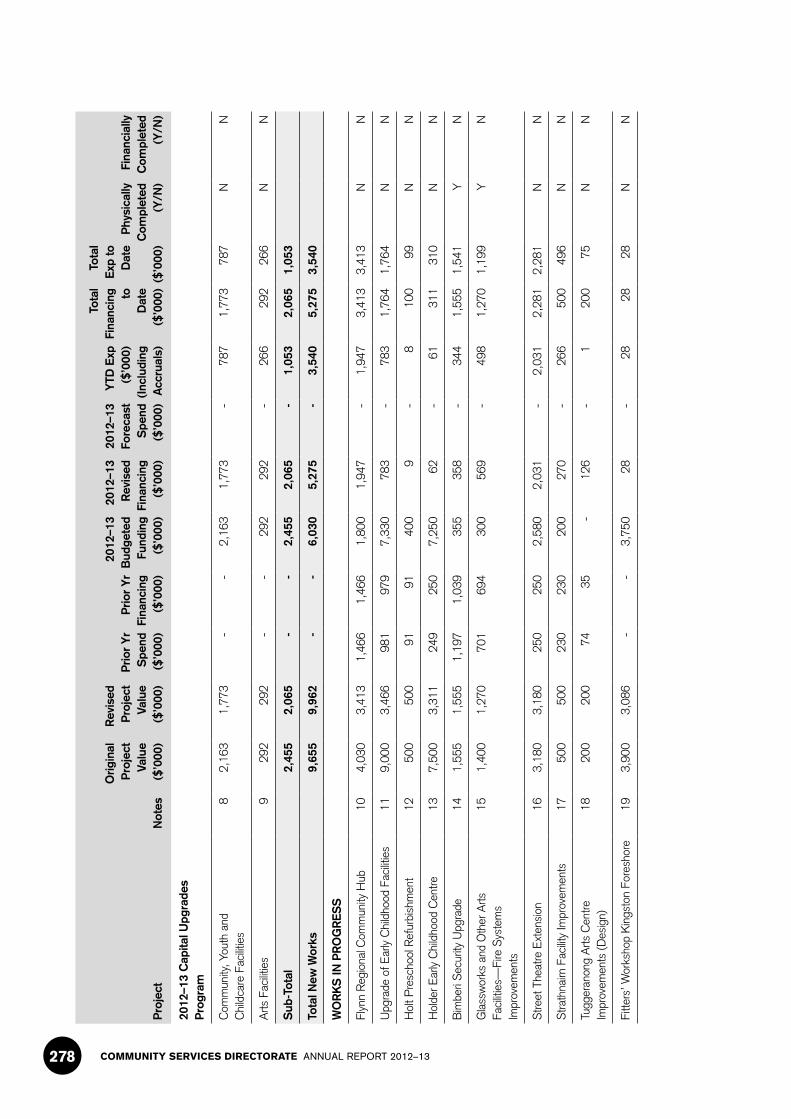
COMMUNITY SERVICES DIRECTORATE ANNUAL REPORT 2012–13278
Pro
ject
Not
es
Orig
inal
P
roje
ct
Valu
e ($
’000
)
Rev
ised
P
roje
ct
Valu
e ($
’000
)
Prio
r Y
r S
pend
($
’000
)
Prio
r Y
r Fi
nanc
ing
($’0
00)
2012
–13
Bud
gete
d Fu
ndin
g ($
’000
)
2012
–13
Rev
ised
Fi
nanc
ing
($’0
00)
2012
–13
Fore
cast
S
pend
($
’000
)
YTD
Exp
($
’000
) (I
nclu
ding
A
ccru
als)
Tota
l Fi
nanc
ing to
D
ate
($’0
00)
Tota
l E
xp to
D
ate
($’0
00)
Phy
sica
lly
Com
plet
ed
(Y/N
)
Fina
ncia
lly
Com
plet
ed
(Y/N
)
2012
–13
Cap
ital U
pgra
des
Pro
gram
Com
mun
ity, Y
outh
and
C
hild
care
Fac
ilitie
s8
2,16
31,
773
--
2,16
31,
773
-78
71,
773
787
NN
Arts
Fac
ilitie
s9
292
292
--
292
292
-26
629
226
6N
N
Sub
-Tot
al
2,45
52,
065
--
2,45
52,
065
-1,
053
2,06
51,
053
Tota
l New
Wor
ks
9,65
59,
962
--
6,03
05,
275
-3,
540
5,27
53,
540
WO
RK
S IN
PR
OG
RE
SS
Flyn
n R
egio
nal C
omm
unity
Hub
104,
030
3,41
31,
466
1,46
61,
800
1,94
7-
1,94
73,
413
3,41
3N
N
Upg
rade
of E
arly
Chi
ldho
od F
acilit
ies
119,
000
3,46
698
197
97,
330
783
-78
31,
764
1,76
4N
N
Hol
t Pre
scho
ol R
efur
bish
men
t12
500
500
9191
400
9-
810
099
NN
Hol
der E
arly
Chi
ldho
od C
entre
137,
500
3,31
124
925
07,
250
62-
6131
131
0N
N
Bim
beri
Sec
urity
Upg
rade
141,
555
1,55
51,
197
1,03
935
535
8-
344
1,55
51,
541
YN
Gla
ssw
orks
and
Oth
er A
rts
Faci
litie
s—Fi
re S
yste
ms
Impr
ovem
ents
151,
400
1,27
070
169
430
056
9-
498
1,27
01,
199
YN
Stre
et T
heat
re E
xten
sion
163,
180
3,18
025
025
02,
580
2,03
1-
2,03
12,
281
2,28
1N
N
Stra
thna
irn F
acilit
y Im
prov
emen
ts17
500
500
230
230
200
270
-26
650
049
6N
N
Tugg
eran
ong
Arts
Cen
tre
Impr
ovem
ents
(Des
ign)
1820
020
074
35-
126
-1
200
75N
N
Fitte
rs’ W
orks
hop
Kin
gsto
n Fo
resh
ore
193,
900
3,08
6-
-3,
750
28-
2828
28N
N
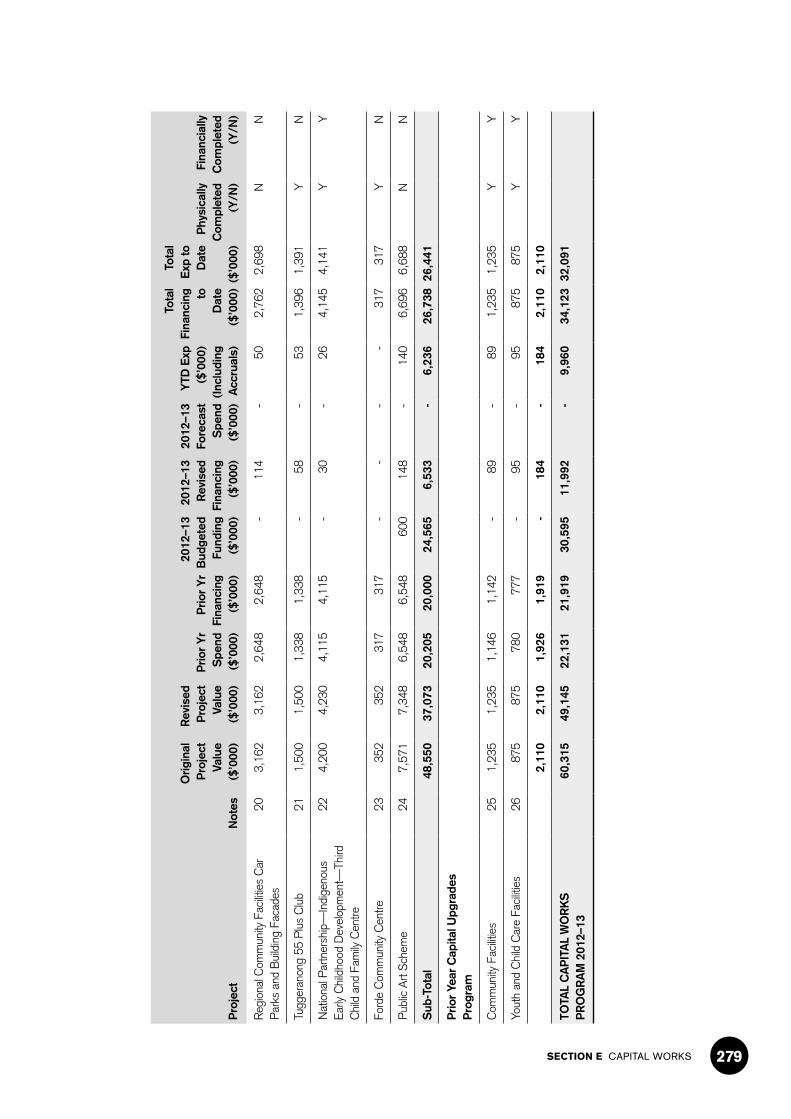
SECTION E CAPITAL WORKS 279
Pro
ject
Not
es
Orig
inal
P
roje
ct
Valu
e ($
’000
)
Rev
ised
P
roje
ct
Valu
e ($
’000
)
Prio
r Y
r S
pend
($
’000
)
Prio
r Y
r Fi
nanc
ing
($’0
00)
2012
–13
Bud
gete
d Fu
ndin
g ($
’000
)
2012
–13
Rev
ised
Fi
nanc
ing
($’0
00)
2012
–13
Fore
cast
S
pend
($
’000
)
YTD
Exp
($
’000
) (I
nclu
ding
A
ccru
als)
Tota
l Fi
nanc
ing to
D
ate
($’0
00)
Tota
l E
xp to
D
ate
($’0
00)
Phy
sica
lly
Com
plet
ed
(Y/N
)
Fina
ncia
lly
Com
plet
ed
(Y/N
)
Reg
iona
l Com
mun
ity F
acilit
ies
Car
P
arks
and
Bui
ldin
g Fa
cade
s20
3,16
23,
162
2,64
82,
648
-11
4-
502,
762
2,69
8N
N
Tugg
eran
ong
55 P
lus
Clu
b21
1,50
01,
500
1,33
81,
338
-58
-53
1,39
61,
391
YN
Nat
iona
l Par
tner
ship
—In
dige
nous
Ea
rly C
hild
hood
Dev
elop
men
t—Th
ird
Chi
ld a
nd F
amily
Cen
tre
224,
200
4,23
04,
115
4,11
5-
30-
264,
145
4,14
1Y
Y
Ford
e C
omm
unity
Cen
tre23
352
352
317
317
--
--
317
317
YN
Pub
lic A
rt S
chem
e24
7,57
17,
348
6,54
86,
548
600
148
-14
06,
696
6,68
8N
N
Sub
-Tot
al
48,5
5037
,073
20,2
0520
,000
24,5
656,
533
-6,
236
26,7
3826
,441
Prio
r Ye
ar C
apita
l Upg
rade
s P
rogr
am
Com
mun
ity F
acilit
ies
251,
235
1,23
51,
146
1,14
2-
89-
891,
235
1,23
5Y
Y
Yout
h an
d C
hild
Car
e Fa
cilit
ies
2687
587
578
077
7-
95-
9587
587
5Y
Y
2,11
02,
110
1,92
61,
919
-18
4-
184
2,11
02,
110
TOTA
L C
AP
ITA
L W
OR
KS
P
RO
GR
AM
201
2–13
60
,315
49,1
4522
,131
21,9
1930
,595
11,9
92-
9,96
034
,123
32,0
91

COMMUNITY SERVICES DIRECTORATE ANNUAL REPORT 2012–13280
COMMUNITY SERVICES DIRECTORATE Statement of Capital Works Income and Expenditure 2012–13
Table 1 Comments
1. Black Mountain Childcare Centre, Campbell Cottage Childcare Centre, Cooinda Childcare Centre and Greenway Childcare Centre upgrade works were completed during the year. These centres have been handed over to the Education and Training Directorate. Design work has been undertaken on childcare centres in Forrest, Fyshwick and Narrabundah and this work has also been transferred to the Education and Training Directorate. In November 2012 responsibility for childcare centres was transferred to the Education and Training Directorate resulting in the transfer of funding and facilities to that Directorate. The community facilities upgrade program involved works being undertaken at a variety of sites. As at 30 June 2013 there were three major works outstanding, improvements to the heating/ventilation system at Club 12/25, refurbishments to Southside Community Services and an extension to the Youth Coalition building.
2. Construction has commenced and is due to be completed in September 2013.
3. A consultant has been engaged to undertake the feasibility study into establishing a community hub in Woden/Weston Creek. The community hub includes a community centre, child care centre and seniors centre. As at 30 June 2013 the study was well progressed. Community consultation has commenced, including with the Woden Community Services and Woden Seniors Centre. The study is expected to be completed in November 2013.
4. The process to engage an architect was nearing completion at the end of June 2013. The architect will prepare plans leading to a Development Application.
5. As at 30 June 2013 work on refurbishing the buildings and grounds was substantially complete. The Expressions of Interest process to allocate space to tenants was progressed and space is to be offered to Belconnen Community Services and Marymead. Any vacant tenantable space will be offered to other community groups.
6. This project will commence in 2013–14 once the 2013–14 Budget has been passed by the Legislative Assembly. There had been discussions with the Canberra Seniors Centre about the tender documentation, and the procurement process has been initiated with Shared Services Procurement.
7. It was agreed that Megalo would be provided with temporary accommodation until a purpose built facility was constructed in the Kingston Arts Precinct. The Former Transport Depot on Wentworth Avenue Kingston was refurbished.
8. The Youth and Childcare upgrades program is dedicated to several projects across multiple facilities.
9. Public art funding is allocated to a number of facilities.
10. As at 30 June 2013 work on refurbishing the buildings and grounds was substantially complete. Improvements were made to the fire safety and electrical systems, with the existing heating system being retained. Some external changes were required to provide for disabled access. These changes were discussed with the original architect, Dr Enrico Taglietti and the heritage consultant, as well as the local community.
11. Black Mountain Childcare Centre, Campbell Cottage Childcare Centre, Cooinda Childcare Centre and Greenway Childcare Centre upgrade works were completed. Design work has been undertaken on childcare centres in Forrest, Fyshwick and Narrabundah.
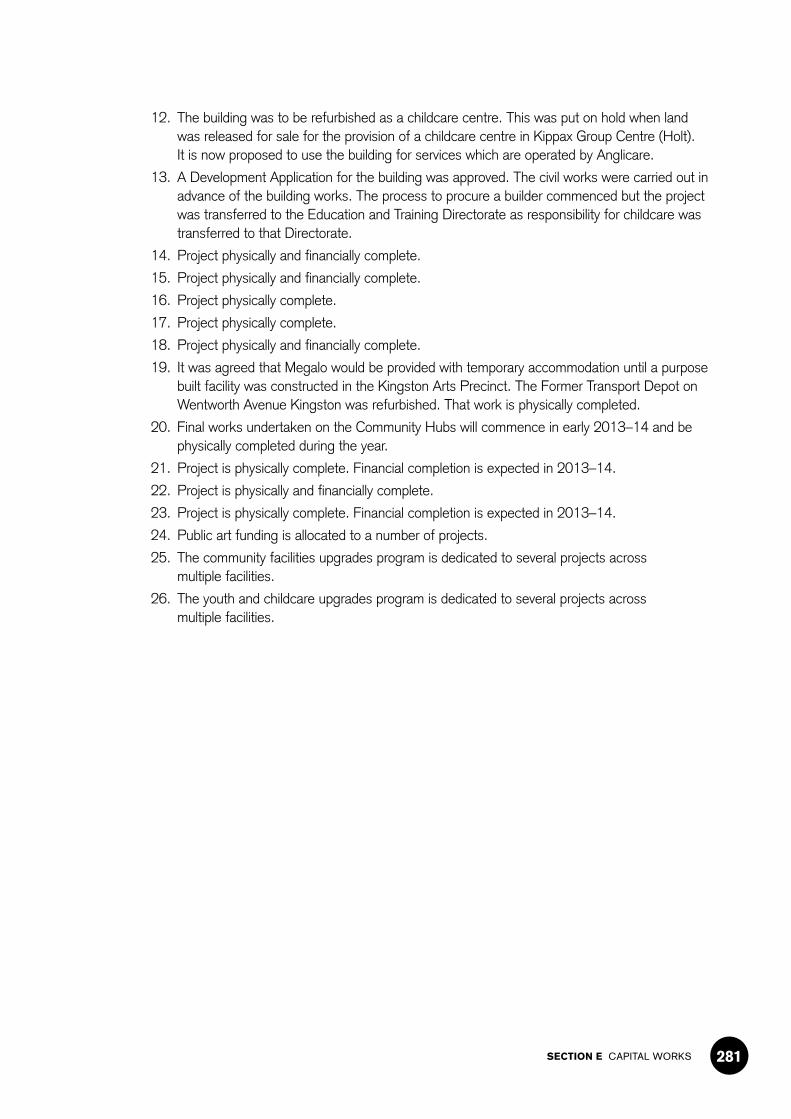
SECTION E CAPITAL WORKS 281
12. The building was to be refurbished as a childcare centre. This was put on hold when land was released for sale for the provision of a childcare centre in Kippax Group Centre (Holt). It is now proposed to use the building for services which are operated by Anglicare.
13. A Development Application for the building was approved. The civil works were carried out in advance of the building works. The process to procure a builder commenced but the project was transferred to the Education and Training Directorate as responsibility for childcare was transferred to that Directorate.
14. Project physically and financially complete.
15. Project physically and financially complete.
16. Project physically complete.
17. Project physically complete.
18. Project physically and financially complete.
19. It was agreed that Megalo would be provided with temporary accommodation until a purpose built facility was constructed in the Kingston Arts Precinct. The Former Transport Depot on Wentworth Avenue Kingston was refurbished. That work is physically completed.
20. Final works undertaken on the Community Hubs will commence in early 2013–14 and be physically completed during the year.
21. Project is physically complete. Financial completion is expected in 2013–14.
22. Project is physically and financially complete.
23. Project is physically complete. Financial completion is expected in 2013–14.
24. Public art funding is allocated to a number of projects.
25. The community facilities upgrades program is dedicated to several projects across multiple facilities.
26. The youth and childcare upgrades program is dedicated to several projects across multiple facilities.

COMMUNITY SERVICES DIRECTORATE ANNUAL REPORT 2012–13282
COMMUNITY SERVICES DIRECTORATE Statement of Capital Works Income and Expenditure 2012–13
$’000
Reconciliation of Total Current Year Financing
Total Current Year Capital Works Financing (per column F) 11,992
Subtract: Financing rollovers 2013–14 (2,032)
Add: Boundless Project Contribution 1,000
Add: Children and Young Death Review Committee Database 100
Add: Taxi Subsidy Scheme Project 300
Add: Prior Year (accrued) Expenditure 213
Capital Injection from Government per Cash Flow Statement 11,573
Reconciliation of Total Current Year Actual Expenditure— against financing
Total Current Year Capital Works Expenditure (per column H) 9,960
Add: Boundless Project Contribution 1,000
Add: Children and Young Death Review Committee Database 100
Add: Taxi Subsidy Scheme Project 300
Add: Prior Year (accrued) Expenditure 213
Capital Injection from Government per Cash Flow Statement 11,573
Reconciliation of Total Current Year Actual Expenditure
Total Current Year Capital Works Expenditure (per column H) 9,960
Subtract: Capital Works Expenditure expensed on the operating statement (68)
Add: Capital Works Expenditure funded from external sources 51
Add: Prior Year (accrued) Expenditure 213
Add: Assets purchases outside of capital works program 133
Less: Energy Efficiency Capital Upgrade of Community Facilities and Childcare Facilities
(276)
Purchase of Property Plant and Equipment as per Cash Flow Statement 10,013
SECTION E CAPITAL WORKS 283
E.2 Housing ACTThe public housing portfolio is realigned through the capital program to better meet the needs and emerging needs of tenants and applicants for public housing. The changing demographics of families seeking public housing means there is need for smaller two bedroom dwellings and larger four or more bedroom dwellings. This compares to a portfolio predominantly comprising three bedroom houses.
The capital program funds replacement properties and the upgrade and refurbishment of properties to maintain their standard and improve their amenity for tenants. The upgrade program includes a range of works to improve the energy efficiency of the dwellings, particularly through building shell improvements. These works consist of the installation of ceiling and wall insulation, the installation of pelmets and draught sealing. All of these measures aim to reduce the energy consumption by tenants, reducing their energy costs and the greenhouse gas emissions for the ACT.
The construction or purchase of properties and the sale of properties under the capital program also maintains the geographic spread of public housing in most suburbs across Canberra.
The most significant source of funding for the capital program is the proceeds from sales. In 2012–13 the net sales receipts amounted to $27.260 million. In addition capital injections from Government, including both ACT and Commonwealth funding, amounted to $15.054 million. The majority of sales occurred through the sale to tenant programs, including the Shared Equity Scheme.
During 2012–13 the first two, long-term subleases providing affordable long term accommodation for older Canberrans, were completed.
Under the capital program 127 dwellings were acquired during the year, most of which were delivered through the construction program. In line with the profile of applicants on the Social Housing Register, the majority of the dwellings constructed were one or two bedroom dwellings (100 or 85 per cent) and four or more bedroom properties (19 or 15 per cent). All properties constructed during the year achieved a minimum 6-star energy rating.
As part of the program to improve the energy efficiency of public housing, 5-star gas storage hot water systems or solar hot water systems were installed to 451 dwellings. As part of the upgrade and refurbishment program, dwellings were fitted with a number of water saving devices, including dual flush cisterns, water saving shower heads, water tanks and water recycling systems and water flow retardant devices.
Six dwellings were demolished during the year as part of the redevelopment of those sites into small scale residential complexes more suited to the needs of tenants on the Social Housing Register.
During 2012–13 a net 58 dwellings were transferred to other organisations, including the transfer of 53 older person’s dwellings to Argyle Community Housing Ltd. The remaining property transfers included the transfer of additional properties to the Affordable Rental Office and the transfer of dwellings to other Directorates for use in the delivery of their services.
COMMUNITY SERVICES DIRECTORATE ANNUAL REPORT 2012–13284
Special Projects
Work progressed on securing a Territory Plan Variation to support the redevelopment of the Allawah, Bega and Currong Apartments in Braddon and Reid. The draft Variation has been referred to the ACT Legislative Assembly Standing Committee on Planning, Environment and Territory and Municipal Services for review. The Committee had not finalised its inquiry into the proposed variation to the Territory Plan as at 30 June 2013.
The plans for the redevelopment of the Northbourne Flats and Northbourne Housing Precinct were also progressed during the year. The heritage issues associated with some of the development areas were not resolved at 30 June 2013. The redevelopment of these sites will need to be considered in light of the Capital Metro Project.
The joint venture redevelopment of the former Burnie Court site in Lyons is progressing with construction of the residential tower commencing and construction also underway on the final stage of the retirement complex.

SECTION E CAPITAL WORKS 285
Tabl
e 2—
Sta
tem
ent o
f Cap
ital W
orks
Inco
me
and
Exp
endi
ture
201
2–13
Pro
ject
Orig
inal
P
roje
ct
Valu
e
Rev
ised
P
roje
ct
Valu
e
Prio
r Ye
ars
Cur
rent
Yea
r
Not
e
Tota
l Fi
nanc
ing
to D
ate
Tota
l E
xpen
ditu
re
to D
ate
Prio
r Ye
ars
Exp
endi
ture
Prio
r Ye
ars
Fina
ncin
gB
udge
ted
Fina
ncin
gR
evis
ed
Fina
ncin
gB
udge
ted
Exp
endi
ture
Act
ual
Exp
endi
ture
New
Wor
ks
Con
stru
ctio
n36
,141
33,4
30-
-9,
041
33,4
3033
,430
110
133
,430
110
Ass
et Im
prov
emen
ts10
,550
9,01
1-
-10
,550
9,01
19,
011
8,35
19,
011
8,35
1
Pro
perty
Pur
chas
es7,
420
7,78
0-
-5,
000
7,78
07,
780
7,78
02
7,78
07,
780
Oth
er—
Min
or27
530
8-
-27
530
830
830
830
830
8
Sub
tota
l54
,386
50,5
29-
-24
,866
50,5
2950
,529
16,5
4950
,529
16,5
49
Wor
ks in
Pro
gres
s
Con
stru
ctio
n14
0,18
914
6,86
910
5,87
910
5,87
939
,692
40,9
9040
,990
27,4
191
146,
869
133,
298
Ass
et Im
prov
emen
ts-
--
--
--
--
-
Pro
perty
Pur
chas
es-
--
--
--
-2
--
Oth
er—
Min
or-
--
--
--
--
-
Sub
tota
l14
0,18
914
6,86
910
5,87
910
5,87
939
,692
40,9
9040
,990
27,4
1914
6,86
913
3,29
8
Tota
l19
4,57
519
7,39
810
5,87
910
5,87
964
,558
91,5
1991
,519
43,9
683
197,
398
149,
847
Not
es
1. C
onst
ruct
ion
(New
Wor
ks &
WIP
)—11
7 pr
oper
ties
wer
e co
mpl
eted
and
han
ded
over
dur
ing
the
year
.
2. P
rope
rty P
urch
ases
(New
Wor
ks &
WIP
)—10
dw
ellin
gs a
nd 1
1 bl
ocks
of l
and
wer
e pu
rcha
sed
in 2
012–
13.
3. V
aria
nce
Bud
gete
d Ex
pend
iture
to A
ctua
l—th
e ba
lanc
e of
bud
gete
d ex
pend
iture
has
bee
n ca
rried
ove
r to
fund
the
final
isat
ion
of c
onst
ruct
ion
activ
ity c
omm
itted
to in
201
2–13
.

COMMUNITY SERVICES DIRECTORATE ANNUAL REPORT 2012–13286
COMMUNITY SERVICES DIRECTORATE Statement of Capital Works Income and Expenditure 2012–13
$’000
Total Current Year Capital Works Financing 64,558
Less: Own Source Financing (48,504)
Add: Financing of other Assets (outside capital works) -
Add: Financing for other Capital Injections -
Capital Injection from Government per Cash Flow Statement 16,054
Reconciliation of Total Current Year Actual Expenditure—against Financing
Total Current Year Capital Works Expenditure 43,968
Less: Expenditure related to previous years unspent funding rolled forward (125)
Less: Capital Works expenditure funded by own source revenue (28,679)
Add: Asset purchases outside of capital works program funded by capital injection
-
Add: Expenditure of other Capital Injection funded items -
Add: Unspent current year Capital Injection rolled forward 890
Capital Injection from Government per Cash Flow Statement 16,054
Reconciliation of Total Current Year Actual Expenditure
Total Current Year Capital Works Expenditure 43,968
Less: Capital Works Expenditure expensed on the operating statement (118)
Add: Asset purchases outside of capital works program 848
Purchase of Property Plant and Equipment as per Cash Flow Statement 44,698
Further information may be obtained from
Ms Bronwen Overton-Clarke, Executive Director, Housing and Community ServicesPhone: 6207 1523 Fax: 6207 1464TTY: 6205 0888 Email: [email protected]: www.communityservices.act.gov.au
FSECTION
COMMUNITY GRANTS—PARTNERSHIPS—ASSISTANCE—SPONSORSHIPS

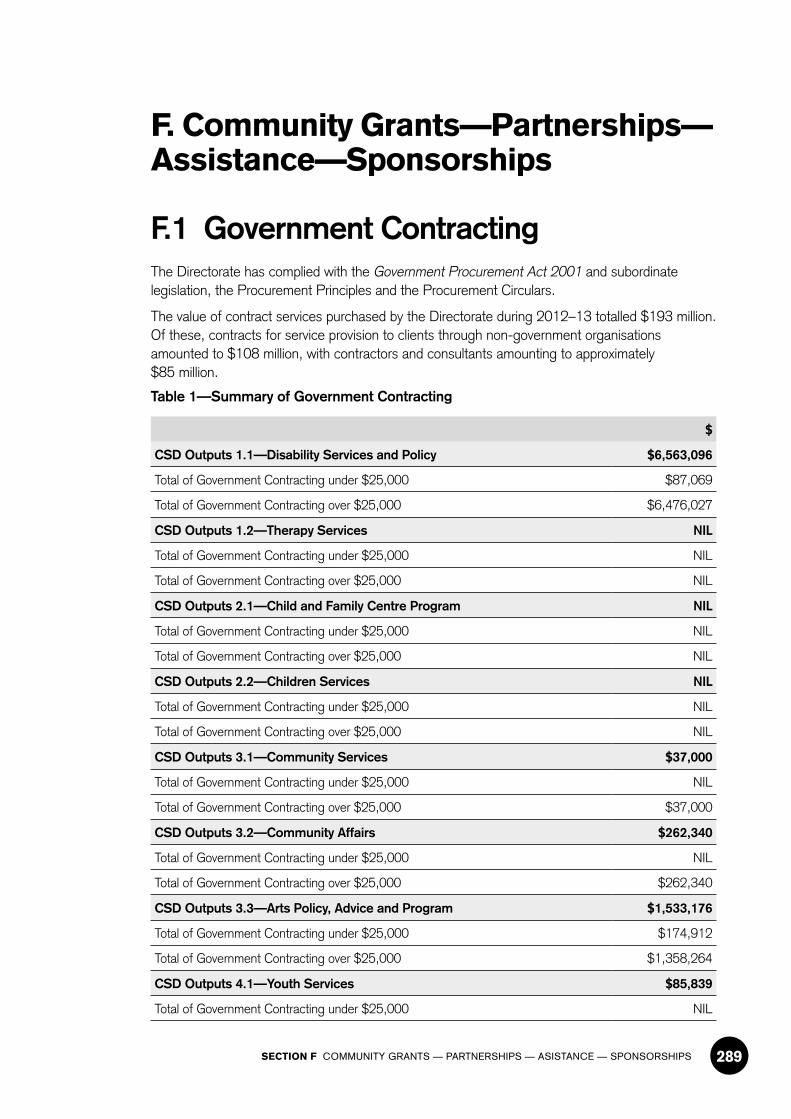
SECTION F COMMUNITY GRANTS — PARTNERSHIPS — ASISTANCE — SPONSORSHIPS 289
F. Community Grants—Partnerships—Assistance—Sponsorships
F.1 Government ContractingThe Directorate has complied with the Government Procurement Act 2001 and subordinate legislation, the Procurement Principles and the Procurement Circulars.
The value of contract services purchased by the Directorate during 2012–13 totalled $193 million. Of these, contracts for service provision to clients through non-government organisations amounted to $108 million, with contractors and consultants amounting to approximately $85 million.
Table 1—Summary of Government Contracting
$
CSD Outputs 1.1—Disability Services and Policy $6,563,096
Total of Government Contracting under $25,000 $87,069
Total of Government Contracting over $25,000 $6,476,027
CSD Outputs 1.2—Therapy Services NIL
Total of Government Contracting under $25,000 NIL
Total of Government Contracting over $25,000 NIL
CSD Outputs 2.1—Child and Family Centre Program NIL
Total of Government Contracting under $25,000 NIL
Total of Government Contracting over $25,000 NIL
CSD Outputs 2.2—Children Services NIL
Total of Government Contracting under $25,000 NIL
Total of Government Contracting over $25,000 NIL
CSD Outputs 3.1—Community Services $37,000
Total of Government Contracting under $25,000 NIL
Total of Government Contracting over $25,000 $37,000
CSD Outputs 3.2—Community Affairs $262,340
Total of Government Contracting under $25,000 NIL
Total of Government Contracting over $25,000 $262,340
CSD Outputs 3.3—Arts Policy, Advice and Program $1,533,176
Total of Government Contracting under $25,000 $174,912
Total of Government Contracting over $25,000 $1,358,264
CSD Outputs 4.1—Youth Services $85,839
Total of Government Contracting under $25,000 NIL

COMMUNITY SERVICES DIRECTORATE ANNUAL REPORT 2012–13290
$
Total of Government Contracting over $25,000 $85,839
CSD Outputs 4.2—Care and Protection Services $275,718
Total of Government Contracting under $25,000 NIL
Total of Government Contracting over $25,000 $275,718
CSD Contracts Distributed as Overheads $137,806
Total of Government Contracting under $25,000 NIL
Total of Government Contracting over $25,000 $137,806
Housing ACT Outputs 1.1—Social Housing Services $75,554,881
Total of Government Contracting under $25,000 Nil
Total of Government Contracting over $25,000 $75,554,881
Overall Total $84,449,856
Total of Government Contracting under $25,000 $261,981
Total of Government Contracting over $25,000 $84,187,875
Table 2—Output 1.1—Disability Services and Policy
Name of Contractor
Purpose of Funding
Amount funded2012–13
Date Contract Let
Period of Contract
Procurement Method
BDW Special Events Private Ltd
Provision for an Event Coordinator for the ACT Chief Minister’s Award 2013–15
$23,625 1 January 2013 3 years Open Tender
Nican Inc Know-Before-You-Go Disability Support Program
$12,995 8 March 2012 6 months Single Select
Completion State 1&2 Blitz Access
$24,777 8 May 2012 3 months Select Tender
Pink Hygiene Solution
Hygiene services for Respite Houses
$13,857 11 May 2012 11 months Quote
Hygiene services for Disability ACT Office
$11,815 11 May 2012 11 months Quote
Total Value of Government Contracting, under $25,000
$87,069
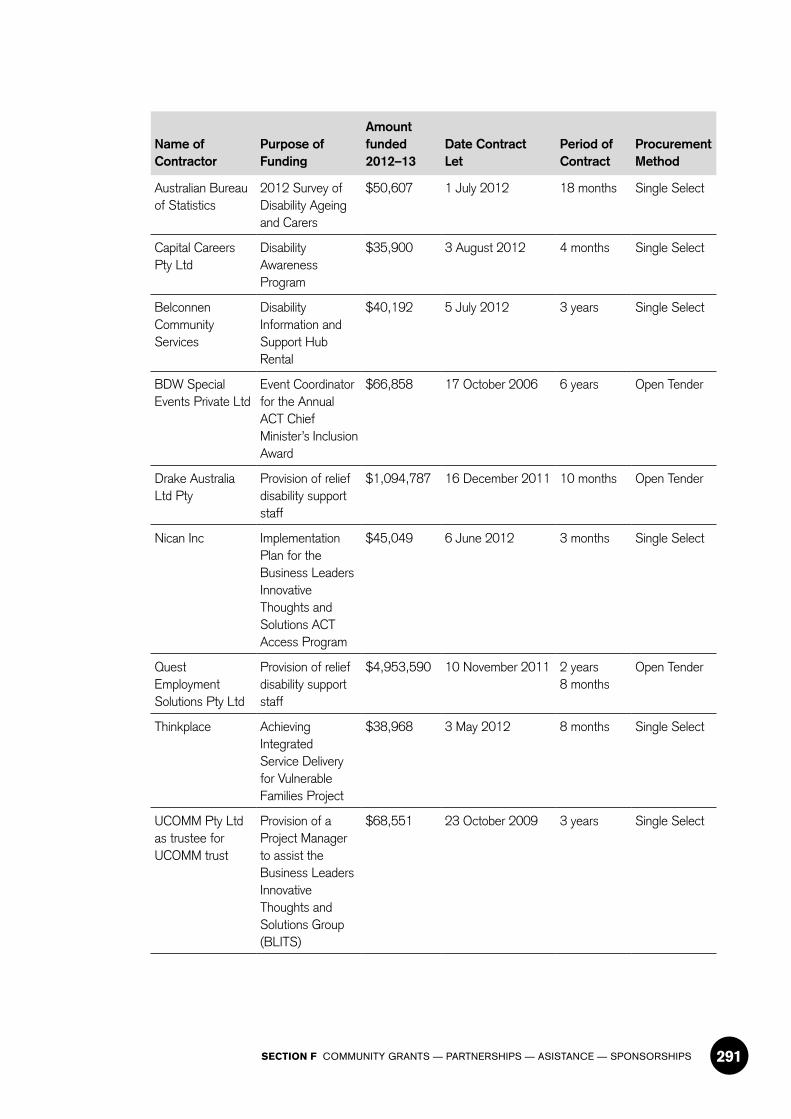
SECTION F COMMUNITY GRANTS — PARTNERSHIPS — ASISTANCE — SPONSORSHIPS 291
Name of Contractor
Purpose of Funding
Amount funded2012–13
Date Contract Let
Period of Contract
Procurement Method
Australian Bureau of Statistics
2012 Survey of Disability Ageing and Carers
$50,607 1 July 2012 18 months Single Select
Capital Careers Pty Ltd
Disability Awareness Program
$35,900 3 August 2012 4 months Single Select
Belconnen Community Services
Disability Information and Support Hub Rental
$40,192 5 July 2012 3 years Single Select
BDW Special Events Private Ltd
Event Coordinator for the Annual ACT Chief Minister’s Inclusion Award
$66,858 17 October 2006 6 years Open Tender
Drake Australia Ltd Pty
Provision of relief disability support staff
$1,094,787 16 December 2011 10 months Open Tender
Nican Inc Implementation Plan for the Business Leaders Innovative Thoughts and Solutions ACT Access Program
$45,049 6 June 2012 3 months Single Select
Quest Employment Solutions Pty Ltd
Provision of relief disability support staff
$4,953,590 10 November 2011 2 years 8 months
Open Tender
Thinkplace Achieving Integrated Service Delivery for Vulnerable Families Project
$38,968 3 May 2012 8 months Single Select
UCOMM Pty Ltd as trustee for UCOMM trust
Provision of a Project Manager to assist the Business Leaders Innovative Thoughts and Solutions Group (BLITS)
$68,551 23 October 2009 3 years Single Select

COMMUNITY SERVICES DIRECTORATE ANNUAL REPORT 2012–13292
Name of Contractor
Purpose of Funding
Amount funded2012–13
Date Contract Let
Period of Contract
Procurement Method
University of Canberra
Everyone, Everyday Disability Awareness Program
$45,000 2 August 2012 8 months Single Select
Wolfson, Julia Hannah
Quality Improvement Through Personal Outcome Measures
$36,525 20 June 2011 1 year 5 months
Single Select
Total Value of Government Contracting, over $25,000
6,476,027
Table 3—Output 3.1—Community Services
Name of Contractor
Purpose of Funding
Amount funded2012–13
Date Contract Let
Period of Contract
Procurement Method
University of Canberra
ACT Government’s Improving Services with Families Projects Contract
$37,000 1 January 2013 10 months Select Tender
Total Value of Government Contracting, over $25,000
$37,000
Table 4—Output 3.2—Community Affairs
Name of Contractor
Purpose of Funding
Amount funded2012–13
Date Contract Let
Period of Contract
Procurement Method
Capital Careers WESP program $87,340 3 December 2012 1 year Select Tender
CHANCES program
$55,000 26 February 2013 1 year Select Tender
Cabcharge Australia Limited
Purchase of smartcard for taxi subsidy scheme
$120,000 1 April 2013 1 year 2 months
Select Tender
Total Value of Government Contracting, over $25,000
$262,340
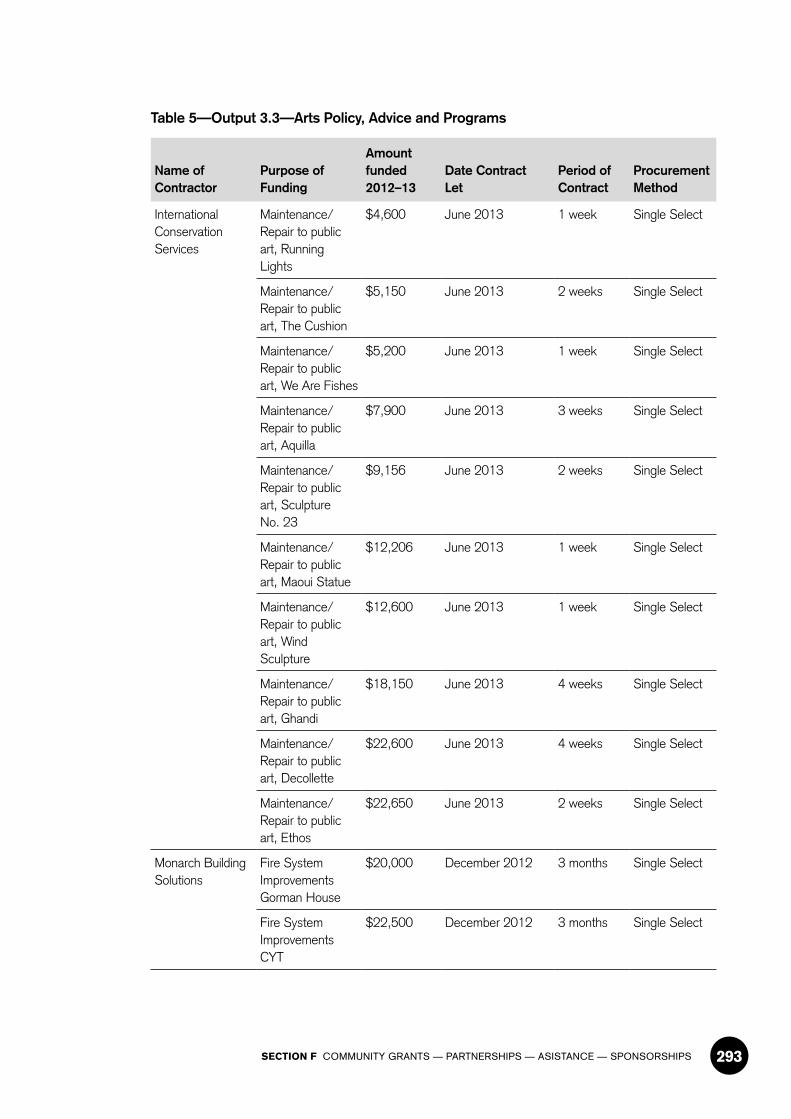
SECTION F COMMUNITY GRANTS — PARTNERSHIPS — ASISTANCE — SPONSORSHIPS 293
Table 5—Output 3.3—Arts Policy, Advice and Programs
Name of Contractor
Purpose of Funding
Amount funded2012–13
Date Contract Let
Period of Contract
Procurement Method
International Conservation Services
Maintenance/ Repair to public art, Running Lights
$4,600 June 2013 1 week Single Select
Maintenance/ Repair to public art, The Cushion
$5,150 June 2013 2 weeks Single Select
Maintenance/ Repair to public art, We Are Fishes
$5,200 June 2013 1 week Single Select
Maintenance/ Repair to public art, Aquilla
$7,900 June 2013 3 weeks Single Select
Maintenance/ Repair to public art, Sculpture No. 23
$9,156 June 2013 2 weeks Single Select
Maintenance/ Repair to public art, Maoui Statue
$12,206 June 2013 1 week Single Select
Maintenance/ Repair to public art, Wind Sculpture
$12,600 June 2013 1 week Single Select
Maintenance/ Repair to public art, Ghandi
$18,150 June 2013 4 weeks Single Select
Maintenance/ Repair to public art, Decollette
$22,600 June 2013 4 weeks Single Select
Maintenance/ Repair to public art, Ethos
$22,650 June 2013 2 weeks Single Select
Monarch Building Solutions
Fire System Improvements Gorman House
$20,000 December 2012 3 months Single Select
Fire System Improvements CYT
$22,500 December 2012 3 months Single Select

COMMUNITY SERVICES DIRECTORATE ANNUAL REPORT 2012–13294
Name of Contractor
Purpose of Funding
Amount funded2012–13
Date Contract Let
Period of Contract
Procurement Method
Urban Contractors Maintenance/Repair to public art, Toku
$12,200 June 2013 1 week Single Select
Total Value of Government Contracting, under $25,000
$174,912
Phillip Leeson Architects
Ainslie Arts Centre Scoping Study and Preliminary Design
$25,000 April 2013 3 months Single Select
Phillip Leeson Architects
Gorman House Arts Centre Scoping Study and Preliminary Design
$25,000 June 2013 1 month Single Select
Urban Contractors Strathnairn Landscaping
$76,383 April 2013 2 months Select Tender
Future Proof Electrical
CYT Electrical Upgrades
$79,574 October 2012 4 months Select Tender
Phillip Leeson Architects
Megalo relocation to former LDA offices, Design
$87,500 February 2013 5 months Single Select
Haden Engineering LTD and Wormald fire services
HVAC and Fire maintenance to nine Arts facilities including unexpected repairs.
$94,687 August 2003 12 months ongoing monthly
Originally Open Public Tender Extended through Single Select
Boss Constructions
Megalo relocation to former LDA offices, Construction
$970,120 March 2013 4 months Single Select
Total Value of Government Contracting, over $25,000
$1,358,264

SECTION F COMMUNITY GRANTS — PARTNERSHIPS — ASISTANCE — SPONSORSHIPS 295
Table 6—Output 4.1—Youth Services
Name of Contractor
Purpose of Funding
Amount funded2012–13
Date Contract Let
Period of Contract
Procurement Method
Australian Institute of Forensic Psychology Pty Ltd
Psychological Screening Services
$40,009 9 August 2012 3 years Single Select
The Trustee for SECOM Technical Services Unit Trust
Rectification of Microphonic Fence Repair
$45,830 1 May 2013 2 months Single Select
Total Value of Government Contracting, over $25,000
$85,839
Table 7—Output 4.2—Care and Protection Services
Name of Contractor
Purpose of Funding
Amount funded2012–13
Date Contract Let
Period of Contract
Procurement Method
Institute of Child, Protection Studies, Australian Catholic University
Evaluation Plan for Child, Youth and Family Services Program
$38,725 June 2013 1 month Single Select
Parenting Research Centre Inc
Out of Home Care Literature Review
$62,273 22 April 2012 3 months Select Tender
The Trustee for Makeham-Kirchner Trust
Provision of Policy Work for the Office of Children, Youth and Family Support
$141,300 10 September 2012
1 year Single Select
Upton Martin Consulting
Care and Protection Leadership Team Process
$33,420 June 2013 2 months Single Select
Total Value of Government Contracting, over $25,000
$275,718
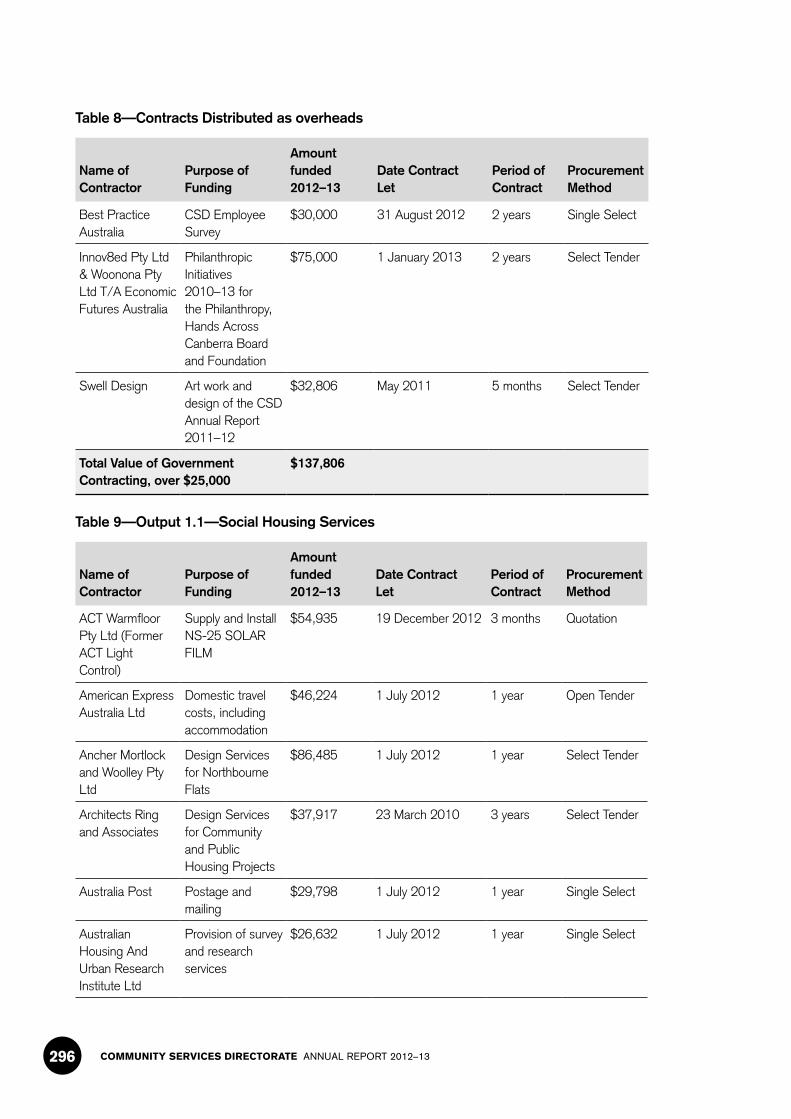
COMMUNITY SERVICES DIRECTORATE ANNUAL REPORT 2012–13296
Table 8—Contracts Distributed as overheads
Name of Contractor
Purpose of Funding
Amount funded2012–13
Date Contract Let
Period of Contract
Procurement Method
Best Practice Australia
CSD Employee Survey
$30,000 31 August 2012 2 years Single Select
Innov8ed Pty Ltd & Woonona Pty Ltd T/A Economic Futures Australia
Philanthropic Initiatives 2010–13 for the Philanthropy, Hands Across Canberra Board and Foundation
$75,000 1 January 2013 2 years Select Tender
Swell Design Art work and design of the CSD Annual Report 2011–12
$32,806 May 2011 5 months Select Tender
Total Value of Government Contracting, over $25,000
$137,806
Table 9—Output 1.1—Social Housing Services
Name of Contractor
Purpose of Funding
Amount funded2012–13
Date Contract Let
Period of Contract
Procurement Method
ACT Warmfloor Pty Ltd (Former ACT Light Control)
Supply and Install NS-25 SOLAR FILM
$54,935 19 December 2012 3 months Quotation
American Express Australia Ltd
Domestic travel costs, including accommodation
$46,224 1 July 2012 1 year Open Tender
Ancher Mortlock and Woolley Pty Ltd
Design Services for Northbourne Flats
$86,485 1 July 2012 1 year Select Tender
Architects Ring and Associates
Design Services for Community and Public Housing Projects
$37,917 23 March 2010 3 years Select Tender
Australia Post Postage and mailing
$29,798 1 July 2012 1 year Single Select
Australian Housing And Urban Research Institute Ltd
Provision of survey and research services
$26,632 1 July 2012 1 year Single Select
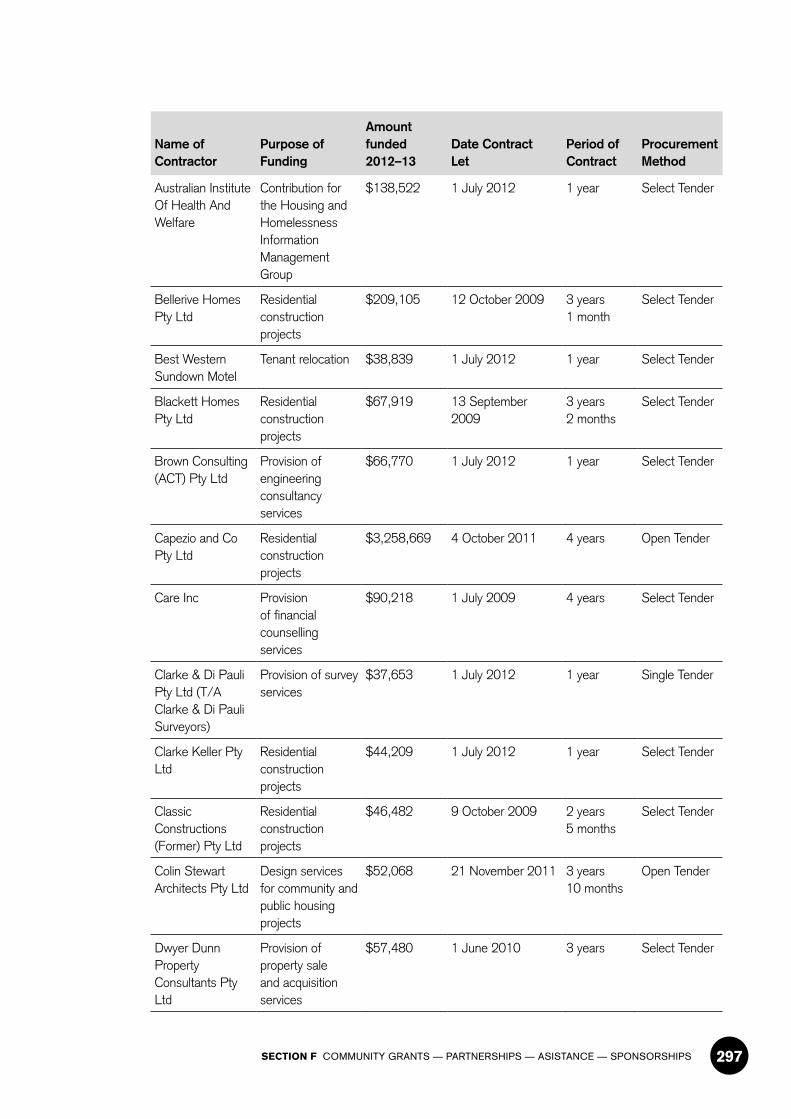
SECTION F COMMUNITY GRANTS — PARTNERSHIPS — ASISTANCE — SPONSORSHIPS 297
Name of Contractor
Purpose of Funding
Amount funded2012–13
Date Contract Let
Period of Contract
Procurement Method
Australian Institute Of Health And Welfare
Contribution for the Housing and Homelessness Information Management Group
$138,522 1 July 2012 1 year Select Tender
Bellerive Homes Pty Ltd
Residential construction projects
$209,105 12 October 2009 3 years 1 month
Select Tender
Best Western Sundown Motel
Tenant relocation $38,839 1 July 2012 1 year Select Tender
Blackett Homes Pty Ltd
Residential construction projects
$67,919 13 September 2009
3 years 2 months
Select Tender
Brown Consulting (ACT) Pty Ltd
Provision of engineering consultancy services
$66,770 1 July 2012 1 year Select Tender
Capezio and Co Pty Ltd
Residential construction projects
$3,258,669 4 October 2011 4 years Open Tender
Care Inc Provision of financial counselling services
$90,218 1 July 2009 4 years Select Tender
Clarke & Di Pauli Pty Ltd (T/A Clarke & Di Pauli Surveyors)
Provision of survey services
$37,653 1 July 2012 1 year Single Tender
Clarke Keller Pty Ltd
Residential construction projects
$44,209 1 July 2012 1 year Select Tender
Classic Constructions (Former) Pty Ltd
Residential construction projects
$46,482 9 October 2009 2 years 5 months
Select Tender
Colin Stewart Architects Pty Ltd
Design services for community and public housing projects
$52,068 21 November 2011 3 years 10 months
Open Tender
Dwyer Dunn Property Consultants Pty Ltd
Provision of property sale and acquisition services
$57,480 1 June 2010 3 years Select Tender

COMMUNITY SERVICES DIRECTORATE ANNUAL REPORT 2012–13298
Name of Contractor
Purpose of Funding
Amount funded2012–13
Date Contract Let
Period of Contract
Procurement Method
Egan National Valuers ACT
Provision of valuation services
$29,909 1 July 2012 1 year Open Tender
Franic, Anthony David (Canberra Capital Removals and Relocations)
Tenant relocation $77,908 1 July 2012 1 year Select Tender
Greenscope Developments Pty Ltd
Residential construction projects
$97,855 9 October 2009 3 years 1 month
Select Tender
Hays Specialist Recruitment Australia Pty Ltd
Provision of temporary contract staff
$60,848 1 July 2012 1 year Select Tender
Herron Todd White Canberra Pty Ltd
Provision of valuation services
$62,805 25 January 2010 3 years Open Tender
Indesco Pty Ltd Provision of engineering consultancy services
$74,635 1 July 2012 1 year Open Tender
ISS Security Pty Ltd
Provision of security services at multi-unit complexes and ad hoc patrols
$310,932 1 July 2012 4 months Open Tender
Jallcom Pty Ltd Provision of Support Services for Homenet
$300,520 7 March 2012 1 year Select Tender
John Wardle Pty Ltd
Design Services for Northbourne Flats
$58,150 1 July 2012 1 year Select Tender
Laurrie Scheele Real Estate
Provision of property sale and acquisition services
$27,817 1 June 2010 3 years Select Tender
Malone’s The Estate Agent
Provision of property sale and acquisition services
$94,344 1 June 2010 3 years Select Tender
Maximus Building Group Pty Ltd
Residential construction projects
$2,203,962 9 October 2009 2 years 5 months
Select Tender

SECTION F COMMUNITY GRANTS — PARTNERSHIPS — ASISTANCE — SPONSORSHIPS 299
Name of Contractor
Purpose of Funding
Amount funded2012–13
Date Contract Let
Period of Contract
Procurement Method
May And Russell Architects Pty Ltd
Design Services for Community and Public Housing Projects
$26,939 1 July 2012 1 year Open Tender
Meyer Vandenberg Lawyers
Supply of conveyancing services and general property advice
$83,142 1 July 2012 3 years Open Tender
Monarch Building Solutions Pty Ltd
Residential construction projects
$3,858,996 4 October 2011 4 years Open Tender
Mosaic Recruitment Pty Ltd
Provision of temporary contract staff
$62,220 1 July 2012 1 year Open Tender
N & M Popovich T/A NTA Construction Services
Medium to high density unit construction
$367,256 1 July 2012 1 year Select Tender
Narona Homes Residential construction projects
$5,612,362 1 July 2012 1 year Select Tender
Noetic Solutions Pty Ltd
Provision of consulting services
$38,350 1 July 2012 1 year Select Tender
Oztal Architects Pty Ltd
Design Services for Community and Public Housing Projects
$39,050 1 July 2012 1 year Select Tender
Pbs Homes (ACT) Pty Ltd
Residential construction projects
$1,846,551 1 November 2009 3 years 1 month
Select Tender
Philip Leeson Architects
Design Services for Community and Public Housing Projects
$124,222 22 December 2009 3 years Open Tender
Pink Hygiene Solutions
Hygiene services $42,481 1 July 2012 1 year Open Tender
Property Works Pty Ltd
Provision of valuation services
$32,022 1 July 2012 1 year Select Tender
Ram Constructions
Residential construction projects
$134,619 1 July 2012 1 year Select Tender
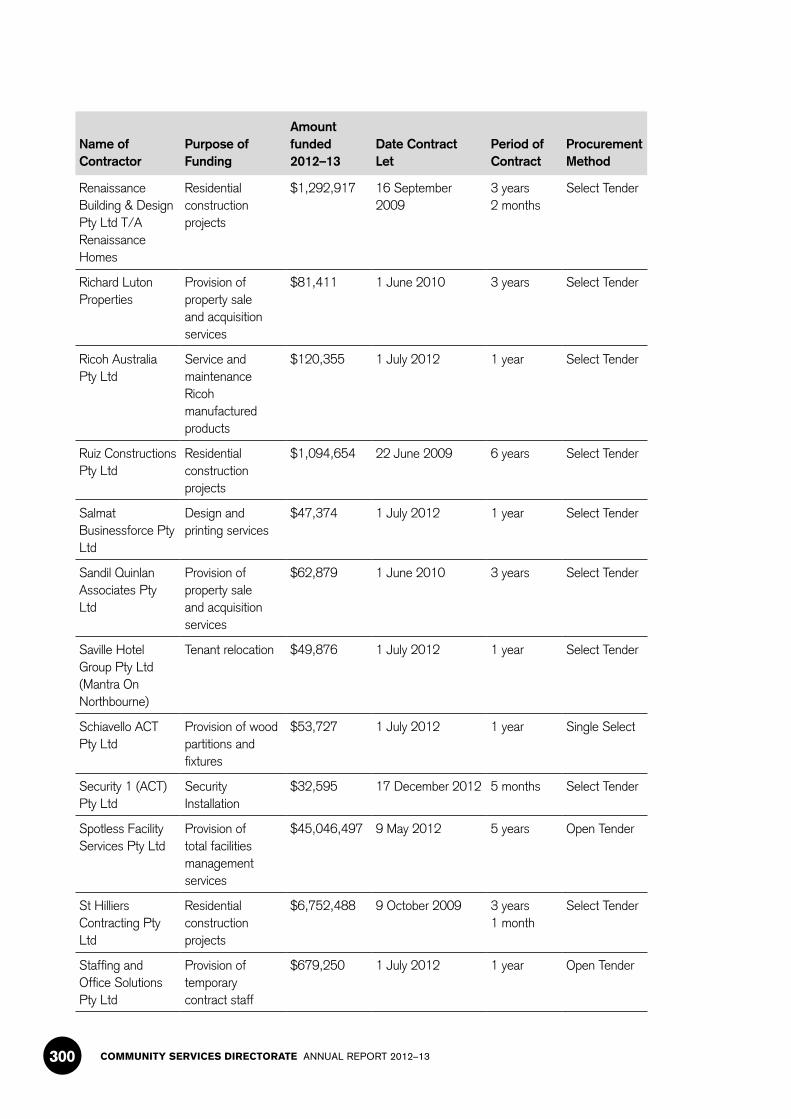
COMMUNITY SERVICES DIRECTORATE ANNUAL REPORT 2012–13300
Name of Contractor
Purpose of Funding
Amount funded2012–13
Date Contract Let
Period of Contract
Procurement Method
Renaissance Building & Design Pty Ltd T/A Renaissance Homes
Residential construction projects
$1,292,917 16 September 2009
3 years 2 months
Select Tender
Richard Luton Properties
Provision of property sale and acquisition services
$81,411 1 June 2010 3 years Select Tender
Ricoh Australia Pty Ltd
Service and maintenance Ricoh manufactured products
$120,355 1 July 2012 1 year Select Tender
Ruiz Constructions Pty Ltd
Residential construction projects
$1,094,654 22 June 2009 6 years Select Tender
Salmat Businessforce Pty Ltd
Design and printing services
$47,374 1 July 2012 1 year Select Tender
Sandil Quinlan Associates Pty Ltd
Provision of property sale and acquisition services
$62,879 1 June 2010 3 years Select Tender
Saville Hotel Group Pty Ltd (Mantra On Northbourne)
Tenant relocation $49,876 1 July 2012 1 year Select Tender
Schiavello ACT Pty Ltd
Provision of wood partitions and fixtures
$53,727 1 July 2012 1 year Single Select
Security 1 (ACT) Pty Ltd
Security Installation
$32,595 17 December 2012 5 months Select Tender
Spotless Facility Services Pty Ltd
Provision of total facilities management services
$45,046,497 9 May 2012 5 years Open Tender
St Hilliers Contracting Pty Ltd
Residential construction projects
$6,752,488 9 October 2009 3 years 1 month
Select Tender
Staffing and Office Solutions Pty Ltd
Provision of temporary contract staff
$679,250 1 July 2012 1 year Open Tender

SECTION F COMMUNITY GRANTS — PARTNERSHIPS — ASISTANCE — SPONSORSHIPS 301
Name of Contractor
Purpose of Funding
Amount funded2012–13
Date Contract Let
Period of Contract
Procurement Method
The Trustee For Mclennan Family Trust (Intelligent Services)
Security Installation
$38,903 12 October 2012 3 months Select Tender
Union Offset Co. Pty Ltd T/A Union Offset Printers
Design and printing services
$29,461 1 July 2012 1 year Select Tender
Vogue Constructions Pty Ltd
Residential construction projects
$67,936 22 June 2009 6 years 3 months
Select Tender
Yakka Pty Ltd T/A Pacific Brands Workwears
Supply of corporate wardrobe
$46,738 17 January 2011 2 years Open Tender
Total Value of Government Contracting, over $25,000
$75,554,881

COMMUNITY SERVICES DIRECTORATE ANNUAL REPORT 2012–13302
F.2 Service Funding Agreements, Community Grants and SponsorshipTable 10—Summary of Service Funding Agreements, Community Grants and Sponsorship
$
CSD Outputs 1.1—Disability Services and Policy $36,361,180
Service Funding Agreements $35,196,115
Community Grants $1,176,005
Sponsorships $3,500
CSD Outputs 1.2—Therapy Services NIL
Service Funding Agreements NIL
Community Grants NIL
Sponsorships NIL
CSD Outputs 2.1—Child and Family Centre Program NIL
Service Funding Agreements NIL
Community Grants NIL
Sponsorships NIL
CSD Outputs 2.2—Children Services $2,129,364
Service Funding Agreements $2,119,364
Community Grants NIL
Sponsorships $10,000
CSD Outputs 3.1—Community Services $7,247,897
Service Funding Agreements $6,852,750
Community Grants $395,147
Sponsorships NIL
CSD Outputs 3.2—Community Affairs $1,205,232
Service Funding Agreements $390,070
Community Grants $773,356
Sponsorships $41,806
CSD Outputs 3.3—Arts Policy, Advice and Programs $8,239,470
Service Funding Agreements NIL
Community Grants $8,239,470
Sponsorships NIL
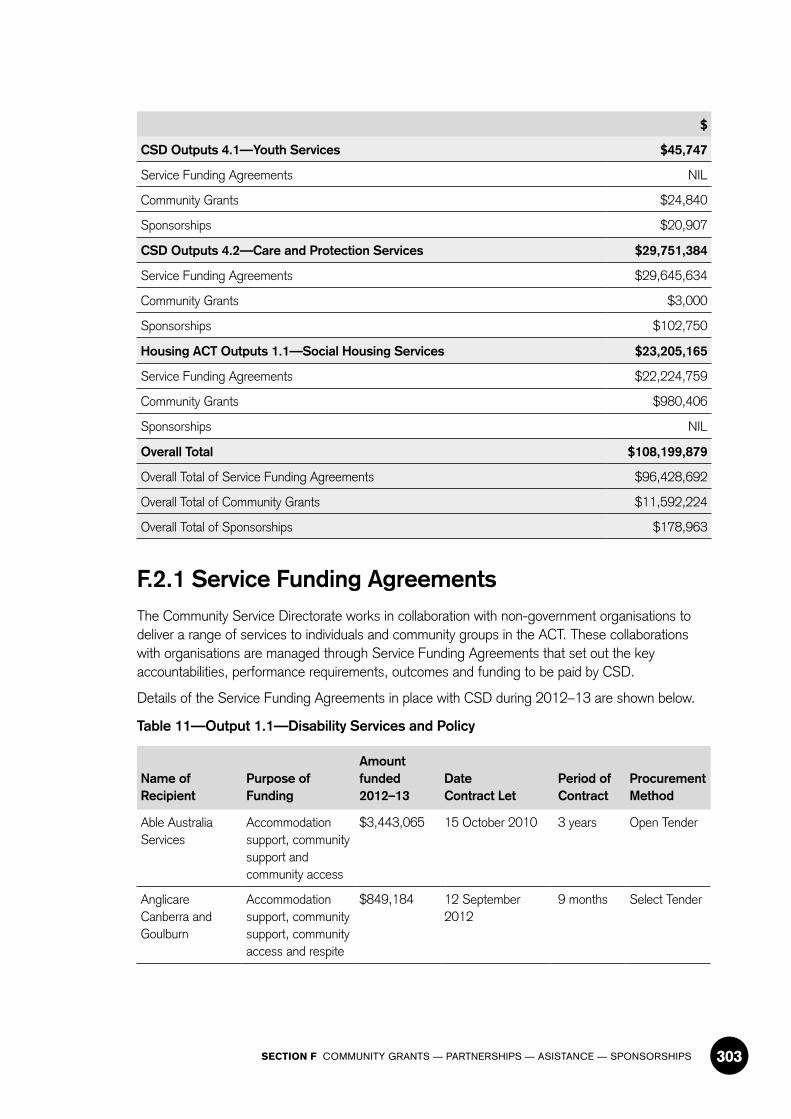
SECTION F COMMUNITY GRANTS — PARTNERSHIPS — ASISTANCE — SPONSORSHIPS 303
$
CSD Outputs 4.1—Youth Services $45,747
Service Funding Agreements NIL
Community Grants $24,840
Sponsorships $20,907
CSD Outputs 4.2—Care and Protection Services $29,751,384
Service Funding Agreements $29,645,634
Community Grants $3,000
Sponsorships $102,750
Housing ACT Outputs 1.1—Social Housing Services $23,205,165
Service Funding Agreements $22,224,759
Community Grants $980,406
Sponsorships NIL
Overall Total $108,199,879
Overall Total of Service Funding Agreements $96,428,692
Overall Total of Community Grants $11,592,224
Overall Total of Sponsorships $178,963
F.2.1 Service Funding AgreementsThe Community Service Directorate works in collaboration with non-government organisations to deliver a range of services to individuals and community groups in the ACT. These collaborations with organisations are managed through Service Funding Agreements that set out the key accountabilities, performance requirements, outcomes and funding to be paid by CSD.
Details of the Service Funding Agreements in place with CSD during 2012–13 are shown below.
Table 11—Output 1.1—Disability Services and Policy
Name of Recipient
Purpose of Funding
Amount funded2012–13
Date Contract Let
Period of Contract
Procurement Method
Able Australia Services
Accommodation support, community support and community access
$3,443,065 15 October 2010 3 years Open Tender
Anglicare Canberra and Goulburn
Accommodation support, community support, community access and respite
$849,184 12 September 2012
9 months Select Tender
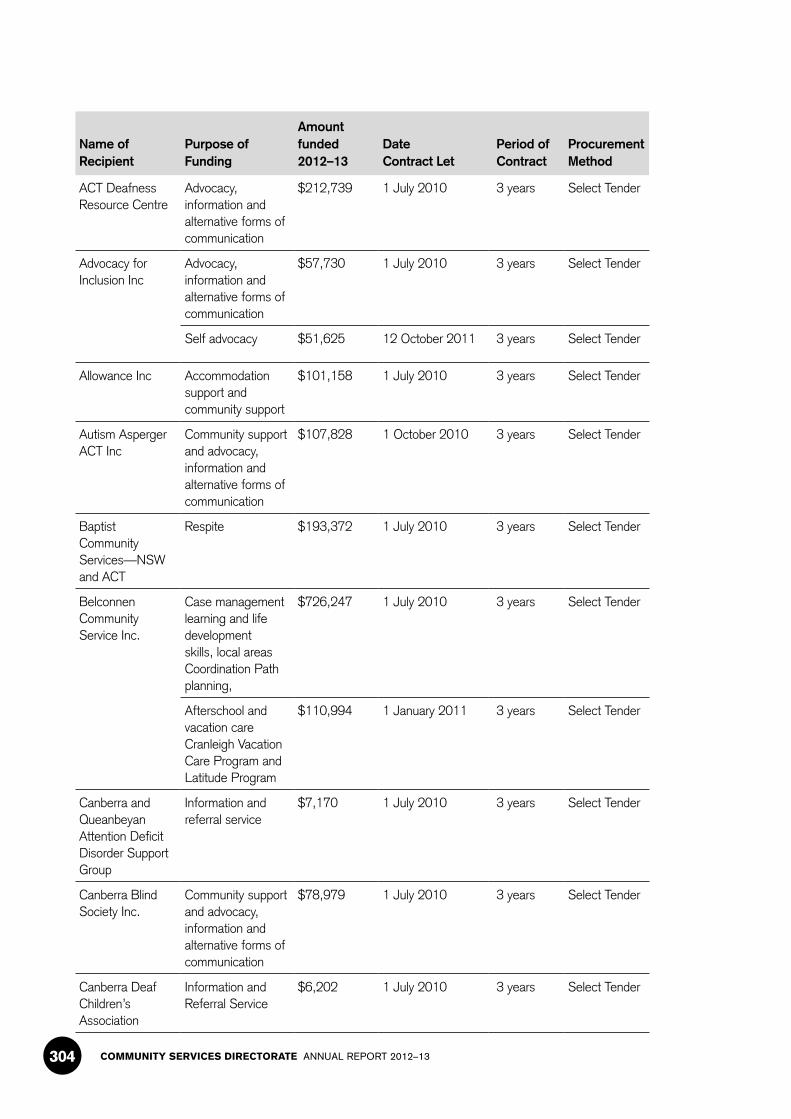
COMMUNITY SERVICES DIRECTORATE ANNUAL REPORT 2012–13304
Name of Recipient
Purpose of Funding
Amount funded2012–13
Date Contract Let
Period of Contract
Procurement Method
ACT Deafness Resource Centre
Advocacy, information and alternative forms of communication
$212,739 1 July 2010 3 years Select Tender
Advocacy for Inclusion Inc
Advocacy, information and alternative forms of communication
$57,730 1 July 2010 3 years Select Tender
Self advocacy $51,625 12 October 2011 3 years Select Tender
Allowance Inc Accommodation support and community support
$101,158 1 July 2010 3 years Select Tender
Autism Asperger ACT Inc
Community support and advocacy, information and alternative forms of communication
$107,828 1 October 2010 3 years Select Tender
Baptist Community Services—NSW and ACT
Respite $193,372 1 July 2010 3 years Select Tender
Belconnen Community Service Inc.
Case management learning and life development skills, local areas Coordination Path planning,
$726,247 1 July 2010 3 years Select Tender
Afterschool and vacation care Cranleigh Vacation Care Program and Latitude Program
$110,994 1 January 2011 3 years Select Tender
Canberra and Queanbeyan Attention Deficit Disorder Support Group
Information and referral service
$7,170 1 July 2010 3 years Select Tender
Canberra Blind Society Inc.
Community support and advocacy, information and alternative forms of communication
$78,979 1 July 2010 3 years Select Tender
Canberra Deaf Children’s Association
Information and Referral Service
$6,202 1 July 2010 3 years Select Tender
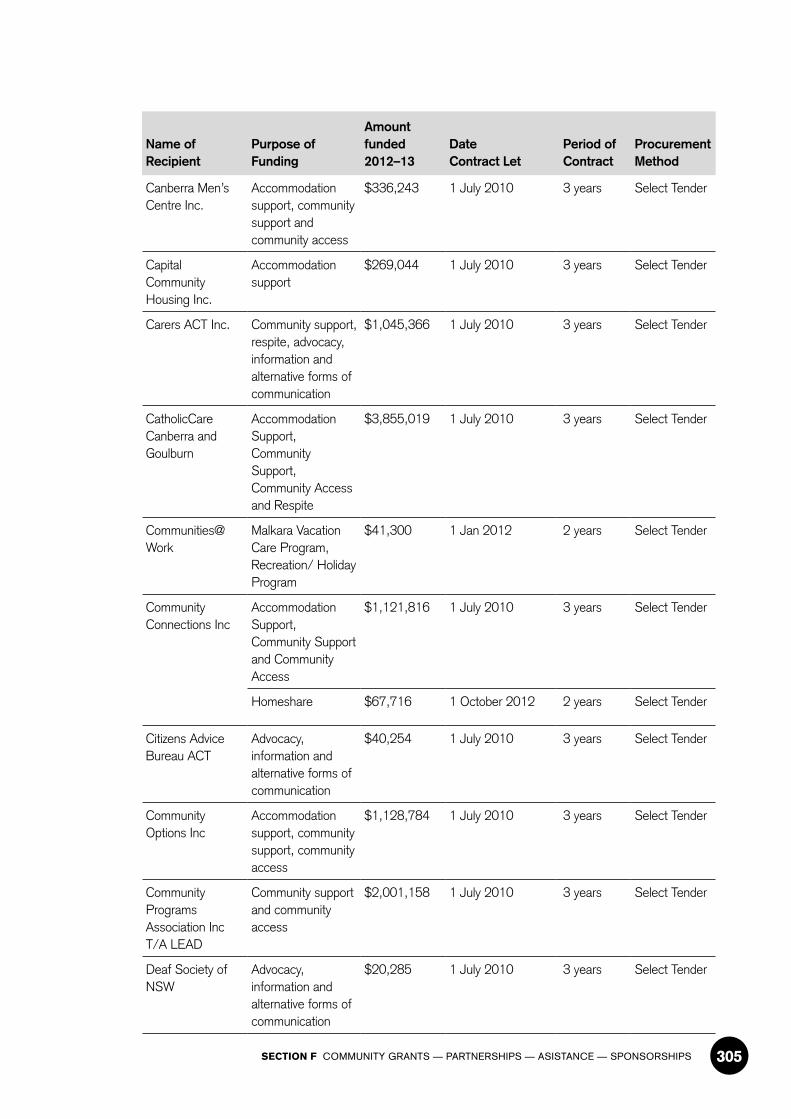
SECTION F COMMUNITY GRANTS — PARTNERSHIPS — ASISTANCE — SPONSORSHIPS 305
Name of Recipient
Purpose of Funding
Amount funded2012–13
Date Contract Let
Period of Contract
Procurement Method
Canberra Men’s Centre Inc.
Accommodation support, community support and community access
$336,243 1 July 2010 3 years Select Tender
Capital Community Housing Inc.
Accommodation support
$269,044 1 July 2010 3 years Select Tender
Carers ACT Inc. Community support, respite, advocacy, information and alternative forms of communication
$1,045,366 1 July 2010 3 years Select Tender
CatholicCare Canberra and Goulburn
Accommodation Support, Community Support, Community Access and Respite
$3,855,019 1 July 2010 3 years Select Tender
Communities@Work
Malkara Vacation Care Program, Recreation/ Holiday Program
$41,300 1 Jan 2012 2 years Select Tender
Community Connections Inc
Accommodation Support, Community Support and Community Access
$1,121,816 1 July 2010 3 years Select Tender
Homeshare $67,716 1 October 2012 2 years Select Tender
Citizens Advice Bureau ACT
Advocacy, information and alternative forms of communication
$40,254 1 July 2010 3 years Select Tender
Community Options Inc
Accommodation support, community support, community access
$1,128,784 1 July 2010 3 years Select Tender
Community Programs Association Inc T/A LEAD
Community support and community access
$2,001,158 1 July 2010 3 years Select Tender
Deaf Society of NSW
Advocacy, information and alternative forms of communication
$20,285 1 July 2010 3 years Select Tender
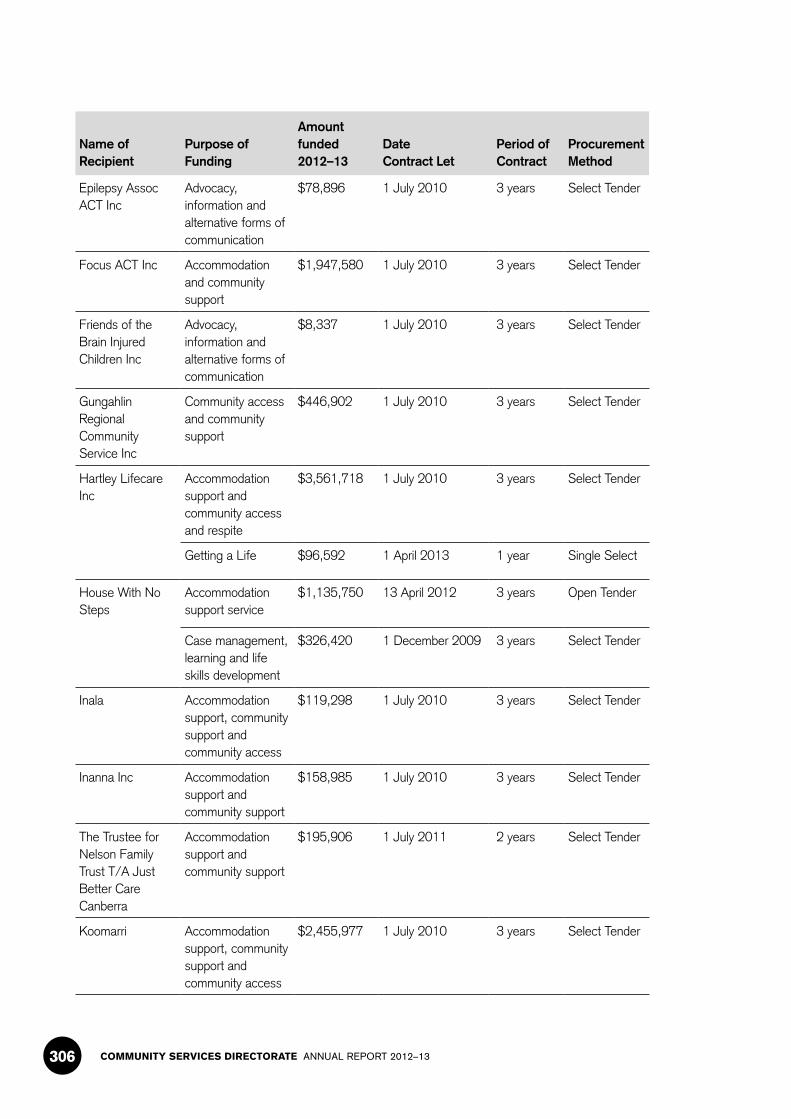
COMMUNITY SERVICES DIRECTORATE ANNUAL REPORT 2012–13306
Name of Recipient
Purpose of Funding
Amount funded2012–13
Date Contract Let
Period of Contract
Procurement Method
Epilepsy Assoc ACT Inc
Advocacy, information and alternative forms of communication
$78,896 1 July 2010 3 years Select Tender
Focus ACT Inc Accommodation and community support
$1,947,580 1 July 2010 3 years Select Tender
Friends of the Brain Injured Children Inc
Advocacy, information and alternative forms of communication
$8,337 1 July 2010 3 years Select Tender
Gungahlin Regional Community Service Inc
Community access and community support
$446,902 1 July 2010 3 years Select Tender
Hartley Lifecare Inc
Accommodation support and community access and respite
$3,561,718 1 July 2010 3 years Select Tender
Getting a Life $96,592 1 April 2013 1 year Single Select
House With No Steps
Accommodation support service
$1,135,750 13 April 2012 3 years Open Tender
Case management, learning and life skills development
$326,420 1 December 2009 3 years Select Tender
Inala Accommodation support, community support and community access
$119,298 1 July 2010 3 years Select Tender
Inanna Inc Accommodation support and community support
$158,985 1 July 2010 3 years Select Tender
The Trustee for Nelson Family Trust T/A Just Better Care Canberra
Accommodation support and community support
$195,906 1 July 2011 2 years Select Tender
Koomarri Accommodation support, community support and community access
$2,455,977 1 July 2010 3 years Select Tender
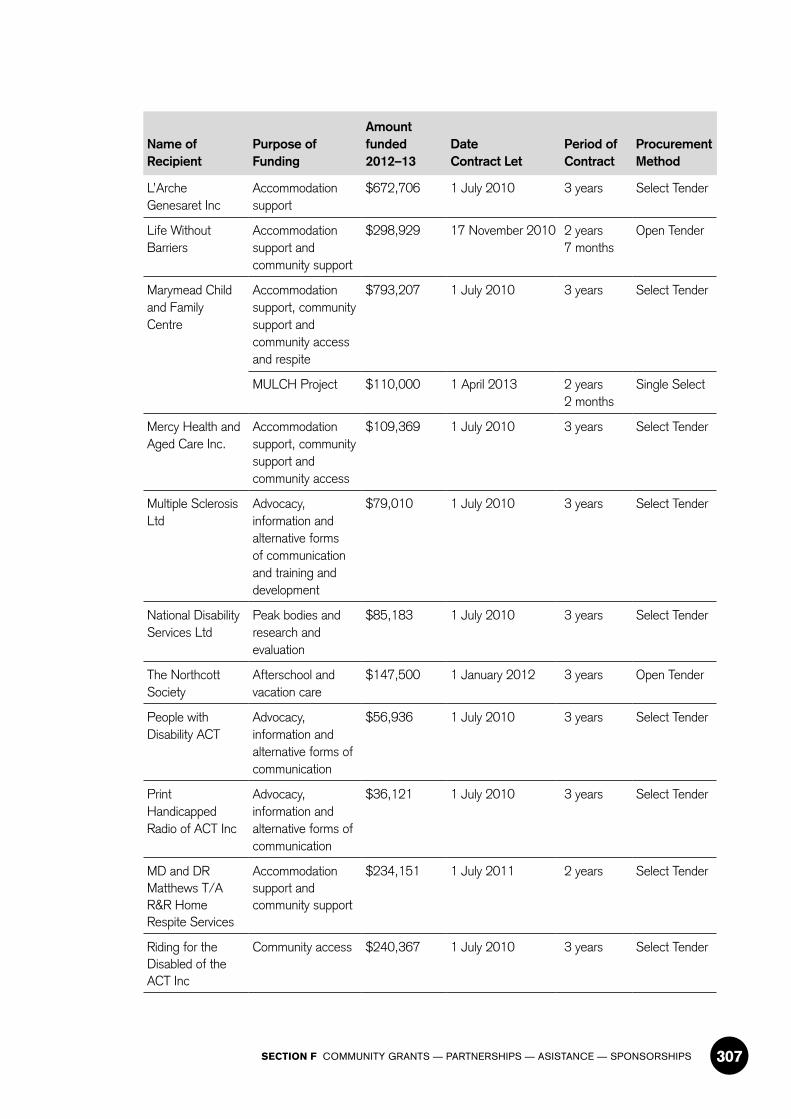
SECTION F COMMUNITY GRANTS — PARTNERSHIPS — ASISTANCE — SPONSORSHIPS 307
Name of Recipient
Purpose of Funding
Amount funded2012–13
Date Contract Let
Period of Contract
Procurement Method
L’Arche Genesaret Inc
Accommodation support
$672,706 1 July 2010 3 years Select Tender
Life Without Barriers
Accommodation support and community support
$298,929 17 November 2010 2 years 7 months
Open Tender
Marymead Child and Family Centre
Accommodation support, community support and community access and respite
$793,207 1 July 2010 3 years Select Tender
MULCH Project $110,000 1 April 2013 2 years 2 months
Single Select
Mercy Health and Aged Care Inc.
Accommodation support, community support and community access
$109,369 1 July 2010 3 years Select Tender
Multiple Sclerosis Ltd
Advocacy, information and alternative forms of communication and training and development
$79,010 1 July 2010 3 years Select Tender
National Disability Services Ltd
Peak bodies and research and evaluation
$85,183 1 July 2010 3 years Select Tender
The Northcott Society
Afterschool and vacation care
$147,500 1 January 2012 3 years Open Tender
People with Disability ACT
Advocacy, information and alternative forms of communication
$56,936 1 July 2010 3 years Select Tender
Print Handicapped Radio of ACT Inc
Advocacy, information and alternative forms of communication
$36,121 1 July 2010 3 years Select Tender
MD and DR Matthews T/A R&R Home Respite Services
Accommodation support and community support
$234,151 1 July 2011 2 years Select Tender
Riding for the Disabled of the ACT Inc
Community access $240,367 1 July 2010 3 years Select Tender
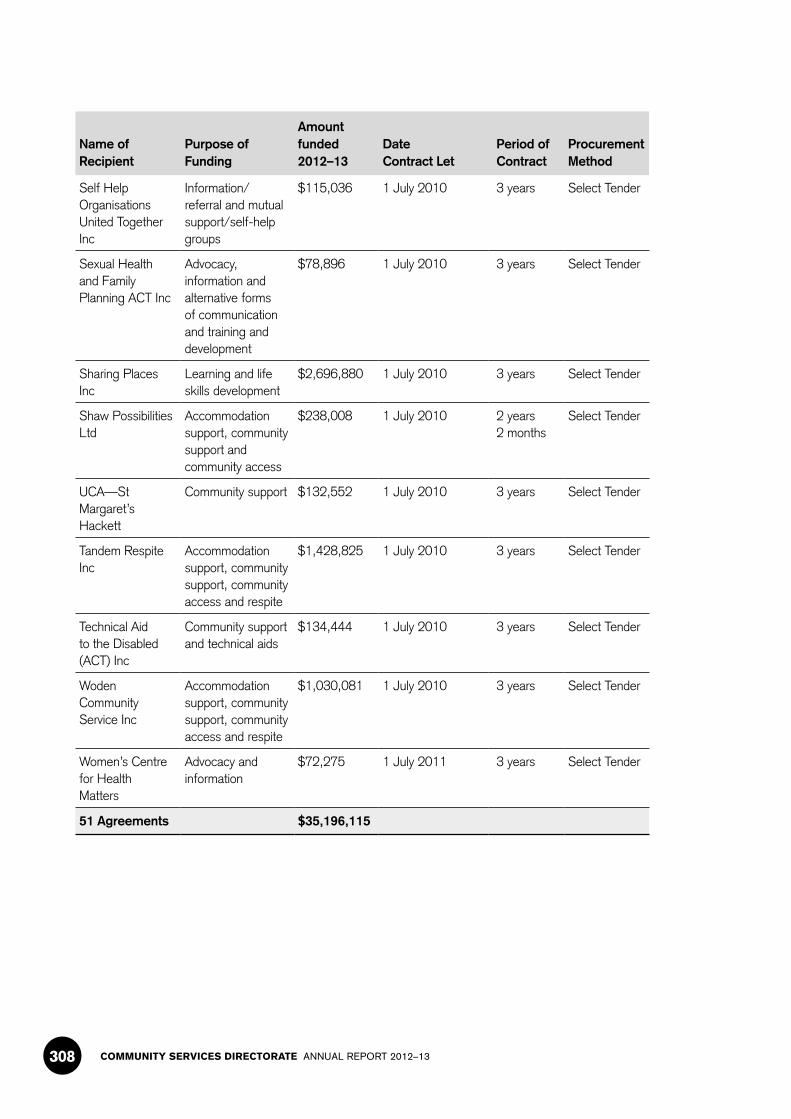
COMMUNITY SERVICES DIRECTORATE ANNUAL REPORT 2012–13308
Name of Recipient
Purpose of Funding
Amount funded2012–13
Date Contract Let
Period of Contract
Procurement Method
Self Help Organisations United Together Inc
Information/referral and mutual support/self-help groups
$115,036 1 July 2010 3 years Select Tender
Sexual Health and Family Planning ACT Inc
Advocacy, information and alternative forms of communication and training and development
$78,896 1 July 2010 3 years Select Tender
Sharing Places Inc
Learning and life skills development
$2,696,880 1 July 2010 3 years Select Tender
Shaw Possibilities Ltd
Accommodation support, community support and community access
$238,008 1 July 2010 2 years 2 months
Select Tender
UCA—St Margaret’s Hackett
Community support $132,552 1 July 2010 3 years Select Tender
Tandem Respite Inc
Accommodation support, community support, community access and respite
$1,428,825 1 July 2010 3 years Select Tender
Technical Aid to the Disabled (ACT) Inc
Community support and technical aids
$134,444 1 July 2010 3 years Select Tender
Woden Community Service Inc
Accommodation support, community support, community access and respite
$1,030,081 1 July 2010 3 years Select Tender
Women’s Centre for Health Matters
Advocacy and information
$72,275 1 July 2011 3 years Select Tender
51 Agreements $35,196,115
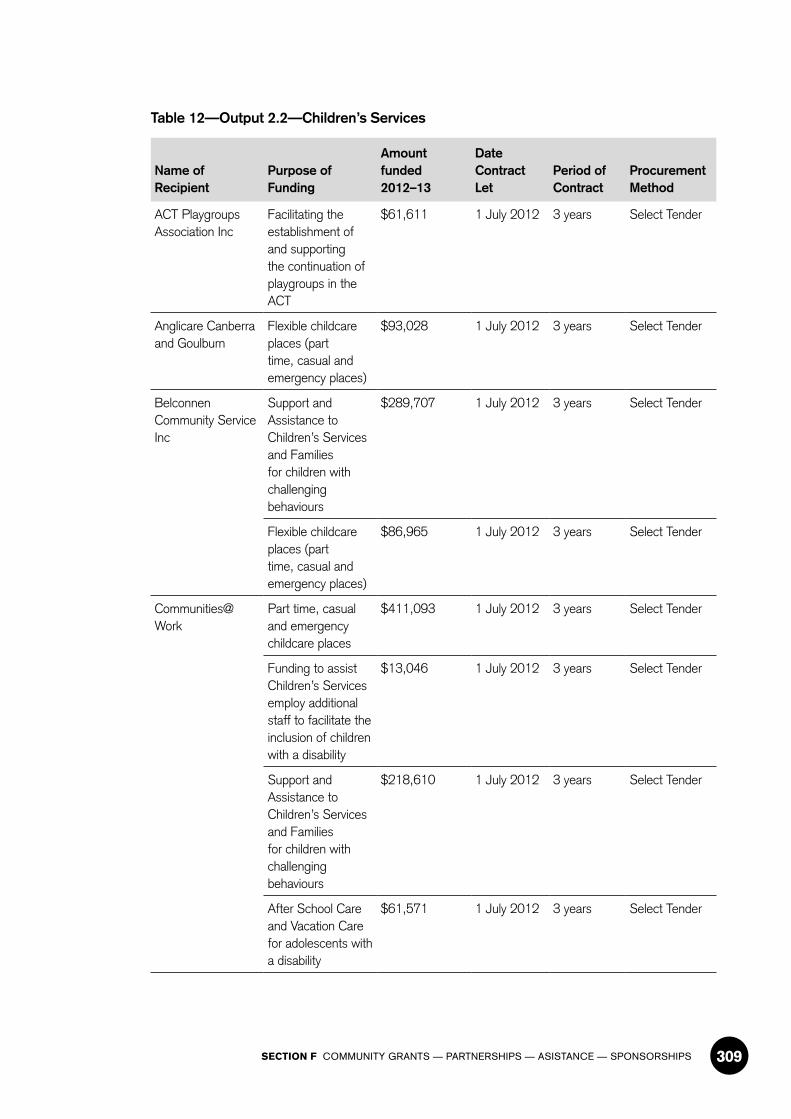
SECTION F COMMUNITY GRANTS — PARTNERSHIPS — ASISTANCE — SPONSORSHIPS 309
Table 12—Output 2.2—Children’s Services
Name of Recipient
Purpose of Funding
Amount funded2012–13
Date Contract Let
Period of Contract
Procurement Method
ACT Playgroups Association Inc
Facilitating the establishment of and supporting the continuation of playgroups in the ACT
$61,611 1 July 2012 3 years Select Tender
Anglicare Canberra and Goulburn
Flexible childcare places (part time, casual and emergency places)
$93,028 1 July 2012 3 years Select Tender
Belconnen Community Service Inc
Support and Assistance to Children’s Services and Families for children with challenging behaviours
$289,707 1 July 2012 3 years Select Tender
Flexible childcare places (part time, casual and emergency places)
$86,965 1 July 2012 3 years Select Tender
Communities@Work
Part time, casual and emergency childcare places
$411,093 1 July 2012 3 years Select Tender
Funding to assist Children’s Services employ additional staff to facilitate the inclusion of children with a disability
$13,046 1 July 2012 3 years Select Tender
Support and Assistance to Children’s Services and Families for children with challenging behaviours
$218,610 1 July 2012 3 years Select Tender
After School Care and Vacation Care for adolescents with a disability
$61,571 1 July 2012 3 years Select Tender
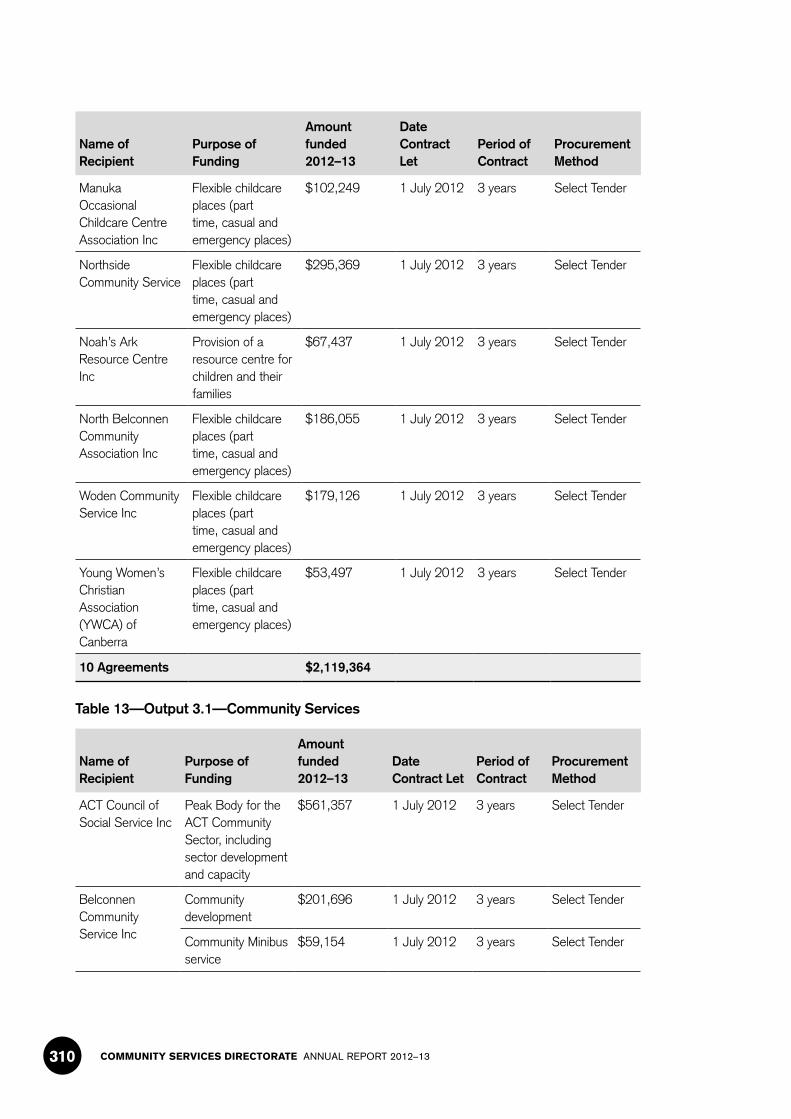
COMMUNITY SERVICES DIRECTORATE ANNUAL REPORT 2012–13310
Name of Recipient
Purpose of Funding
Amount funded2012–13
Date Contract Let
Period of Contract
Procurement Method
Manuka Occasional Childcare Centre Association Inc
Flexible childcare places (part time, casual and emergency places)
$102,249 1 July 2012 3 years Select Tender
Northside Community Service
Flexible childcare places (part time, casual and emergency places)
$295,369 1 July 2012 3 years Select Tender
Noah’s Ark Resource Centre Inc
Provision of a resource centre for children and their families
$67,437 1 July 2012 3 years Select Tender
North Belconnen Community Association Inc
Flexible childcare places (part time, casual and emergency places)
$186,055 1 July 2012 3 years Select Tender
Woden Community Service Inc
Flexible childcare places (part time, casual and emergency places)
$179,126 1 July 2012 3 years Select Tender
Young Women’s Christian Association (YWCA) of Canberra
Flexible childcare places (part time, casual and emergency places)
$53,497 1 July 2012 3 years Select Tender
10 Agreements $2,119,364
Table 13—Output 3.1—Community Services
Name of Recipient
Purpose of Funding
Amount funded2012–13
Date Contract Let
Period of Contract
Procurement Method
ACT Council of Social Service Inc
Peak Body for the ACT Community Sector, including sector development and capacity
$561,357 1 July 2012 3 years Select Tender
Belconnen Community Service Inc
Community development
$201,696 1 July 2012 3 years Select Tender
Community Minibus service
$59,154 1 July 2012 3 years Select Tender

SECTION F COMMUNITY GRANTS — PARTNERSHIPS — ASISTANCE — SPONSORSHIPS 311
Name of Recipient
Purpose of Funding
Amount funded2012–13
Date Contract Let
Period of Contract
Procurement Method
Canberra Men’s Centre Inc
Canberra Mens Centre
$232,993 1 July 2012 3 years Select Tender
Working With the Man
$103,250 1 July 2012 3 years Select Tender
Canberra Rape Crisis Centre Inc
Canberra Rape Crisis Centre—CSP
$151,953 1 July 2012 3 years Select Tender
Sexual Assault Response Program—SARP
$110,284 1 July 2012 3 years Select Tender
Prevention of Violence Against Women
$128,149 1 July 2012 3 years Select Tender
Nguru Program—ATSIS and Education
$128,294 1 July 2012 3 years Select Tender
Service Assisting Male Survivors of Sexual Assault (SAMSSA)
$136,763 1 July 2012 3 years Select Tender
CARE Inc ACT No Interest Loans Scheme
$13,047 1 July 2012 3 years Select Tender
Financial counselling service
$409,058 1 July 2012 3 years Select Tender
Additional outreach financial counselling
$30,975 1 July 2012 3 years Select Tender
No Interest Loan Scheme—Service Provider
$21,666 30 May 2013 3 years 1 month
Open tender
No Interest Loan Scheme—Service Provider—Establishment cost (non-recurrent)
$9,870 30 May 2013 1 month Open tender
No Interest Loan Scheme—development, Coordinate and Support Providers
$18,333 30 May 2013 1 month Open Tender
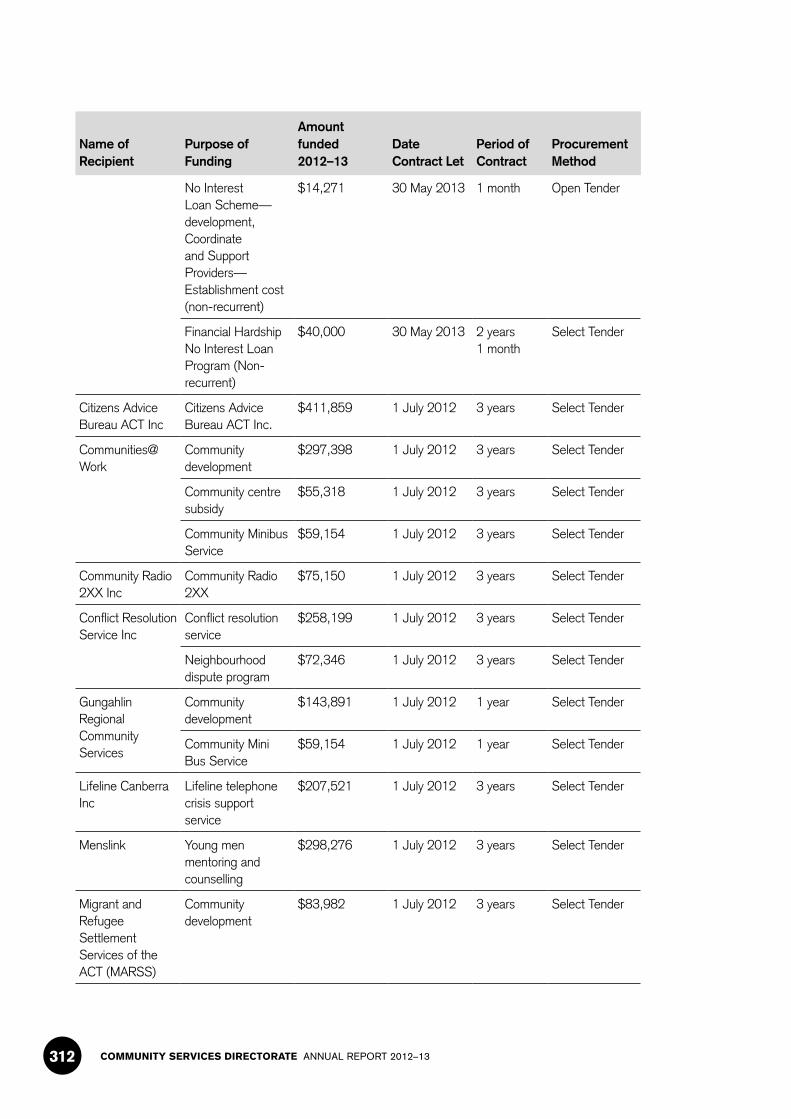
COMMUNITY SERVICES DIRECTORATE ANNUAL REPORT 2012–13312
Name of Recipient
Purpose of Funding
Amount funded2012–13
Date Contract Let
Period of Contract
Procurement Method
No Interest Loan Scheme—development, Coordinate and Support Providers—Establishment cost (non-recurrent)
$14,271 30 May 2013 1 month Open Tender
Financial Hardship No Interest Loan Program (Non-recurrent)
$40,000 30 May 2013 2 years 1 month
Select Tender
Citizens Advice Bureau ACT Inc
Citizens Advice Bureau ACT Inc.
$411,859 1 July 2012 3 years Select Tender
Communities@Work
Community development
$297,398 1 July 2012 3 years Select Tender
Community centre subsidy
$55,318 1 July 2012 3 years Select Tender
Community Minibus Service
$59,154 1 July 2012 3 years Select Tender
Community Radio 2XX Inc
Community Radio 2XX
$75,150 1 July 2012 3 years Select Tender
Conflict Resolution Service Inc
Conflict resolution service
$258,199 1 July 2012 3 years Select Tender
Neighbourhood dispute program
$72,346 1 July 2012 3 years Select Tender
Gungahlin Regional Community Services
Community development
$143,891 1 July 2012 1 year Select Tender
Community Mini Bus Service
$59,154 1 July 2012 1 year Select Tender
Lifeline Canberra Inc
Lifeline telephone crisis support service
$207,521 1 July 2012 3 years Select Tender
Menslink Young men mentoring and counselling
$298,276 1 July 2012 3 years Select Tender
Migrant and Refugee Settlement Services of the ACT (MARSS)
Community development
$83,982 1 July 2012 3 years Select Tender
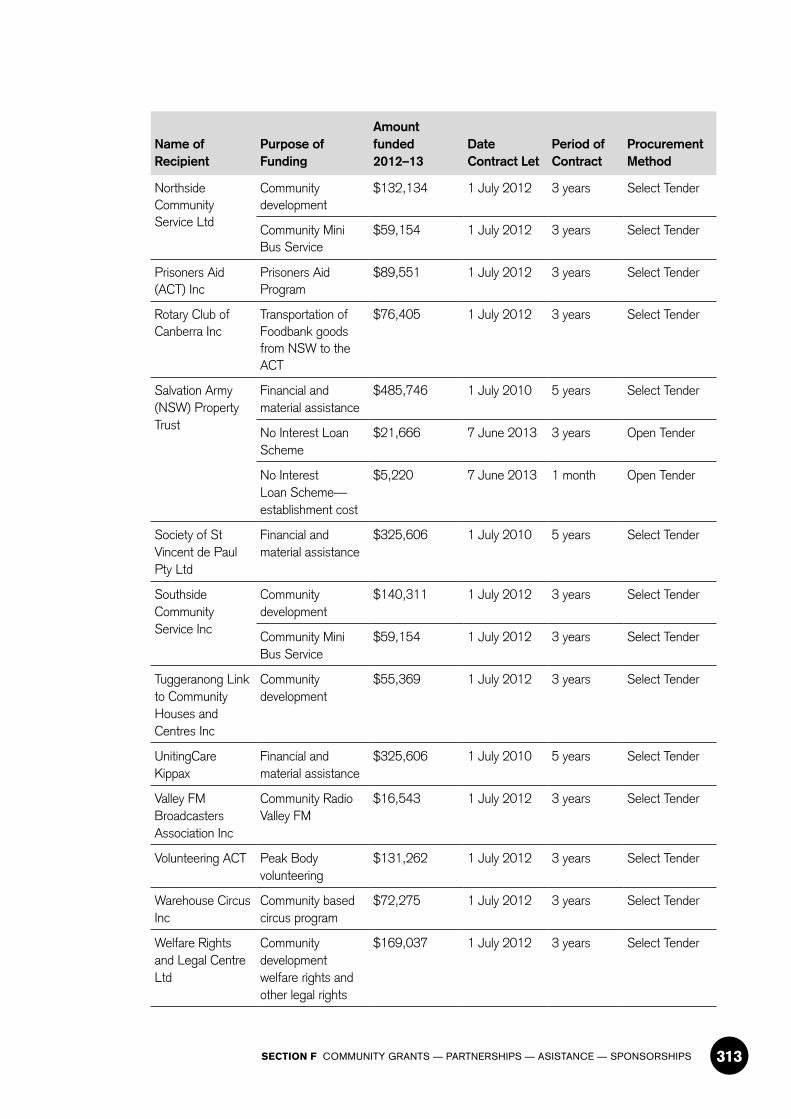
SECTION F COMMUNITY GRANTS — PARTNERSHIPS — ASISTANCE — SPONSORSHIPS 313
Name of Recipient
Purpose of Funding
Amount funded2012–13
Date Contract Let
Period of Contract
Procurement Method
Northside Community Service Ltd
Community development
$132,134 1 July 2012 3 years Select Tender
Community Mini Bus Service
$59,154 1 July 2012 3 years Select Tender
Prisoners Aid (ACT) Inc
Prisoners Aid Program
$89,551 1 July 2012 3 years Select Tender
Rotary Club of Canberra Inc
Transportation of Foodbank goods from NSW to the ACT
$76,405 1 July 2012 3 years Select Tender
Salvation Army (NSW) Property Trust
Financial and material assistance
$485,746 1 July 2010 5 years Select Tender
No Interest Loan Scheme
$21,666 7 June 2013 3 years Open Tender
No Interest Loan Scheme—establishment cost
$5,220 7 June 2013 1 month Open Tender
Society of St Vincent de Paul Pty Ltd
Financial and material assistance
$325,606 1 July 2010 5 years Select Tender
Southside Community Service Inc
Community development
$140,311 1 July 2012 3 years Select Tender
Community Mini Bus Service
$59,154 1 July 2012 3 years Select Tender
Tuggeranong Link to Community Houses and Centres Inc
Community development
$55,369 1 July 2012 3 years Select Tender
UnitingCare Kippax
Financial and material assistance
$325,606 1 July 2010 5 years Select Tender
Valley FM Broadcasters Association Inc
Community Radio Valley FM
$16,543 1 July 2012 3 years Select Tender
Volunteering ACT Peak Body volunteering
$131,262 1 July 2012 3 years Select Tender
Warehouse Circus Inc
Community based circus program
$72,275 1 July 2012 3 years Select Tender
Welfare Rights and Legal Centre Ltd
Community development welfare rights and other legal rights
$169,037 1 July 2012 3 years Select Tender

COMMUNITY SERVICES DIRECTORATE ANNUAL REPORT 2012–13314
Name of Recipient
Purpose of Funding
Amount funded2012–13
Date Contract Let
Period of Contract
Procurement Method
Woden Community Service Inc
Community development
$123,653 1 July 2012 3 years Select Tender
Community Mini Bus Service
$59,154 1 July 2012 3 years Select Tender
Young Women’s Christian Association of Canberra
Lanyon Community Development Mura Lanyon Youth and Community Centre
$111,543 1 July 2012 3 years Select Tender
27 Agreements $6,852,750
Table 14—Output 3.2—Community Affairs
Name of Recipient
Purpose of Funding
Amount funded2012–13
Date Contract Let
Period of Contract
Procurement Method
ACT Community Language Schools Association Inc
Community Language School Program
$34,417 1 September 2012 3 years Select Tender
Anglicare Canberra and Goulburn
ACT Elder Abuse Prevention Program
$74,732 1 February 2011 3 years Open Tender
Council of the Ageing (ACT)
ACT Seniors Card Program
$98,067 1 July 2012 3 years Open Tender
Coordination of ACT Seniors Week
$22,829 1 January 2011 3 years Open Tender
Migrant and Refugee Settlement Services of the ACT (MARSS)
Migrants Refugee Settlement Services ACT
$50,000 1 July 2009 6 years Select Tender
Northside Community Service Ltd
CHANCES program
$82,000 26 February 2013 1 year Select Tender
Queanbeyan Multilingual Centre and Youth Coalition of the ACT Consortia
Multicultural Youth Services ACT
$28,025 30 November 2010
4 years Select Tender
6 Agreements $390,070

SECTION F COMMUNITY GRANTS — PARTNERSHIPS — ASISTANCE — SPONSORSHIPS 315
Table 15—Output 4.2—Care and Protection Services
Name of Recipient
Purpose of Funding
Amount funded2012–13
Date Contract Let
Period of Contract
Procurement Method
Out of Home Care Program
Anglicare Canberra and Goulburn
General foster care $550,773 1 July 2012 3 years Select Tender
Intensive foster care $693,567 1 July 2012 3 years Select Tender
Community referred respite
$15,531 1 July 2012 3 years Select Tender
Therapeutic foster care support
$90,000 1 July 2012 3 years Select Tender
Australian Childhood Foundation
Specialist therapeutic foster care support
$190,242 1 July 2009 3 years 3 months
Select Tender
Barnardos Australia
General foster care $4,079,821 1 July 2012 3 years Select Tender
Intensive foster care $462,376 1 July 2012 3 years Select Tender
Therapeutic foster care
$923,784 1 July 2012 3 years Select Tender
Community referred respite
$143,724 1 July 2012 3 years Select Tender
CREATE Foundation Ltd
Club Create $89,567 1 July 2009 3 years 3 months
Select Tender
Office premises and rental subsidy
$5,421 1 July 2009 3 years 3 months
Select Tender
Create your Future $71,994 1 July 2009 3 years 3 months
Select Tender
Communities@Work
General foster care $1,427,937 1 July 2012 3 years Select Tender
Intensive foster care $154,125 1 July 2012 3 years Select Tender
Galilee School $254,986 1 July 2012 3 years Select Tender
Marymead Child and Family Centre
General foster care $2,125,323 1 July 2012 3 years Select Tender
Intensive foster care $230,946 1 July 2012 3 years Select Tender
Community referred respite
$83,928 1 July 2012 3 years Select Tender
Residential care $1,369,833 1 July 2009 3 years 3 months
Select Tender
Grandparents $21,223 1 July 2012 3 years Select Tender
KARSS $42,559 1 July 2010 3 years Select Tender

COMMUNITY SERVICES DIRECTORATE ANNUAL REPORT 2012–13316
Name of Recipient
Purpose of Funding
Amount funded2012–13
Date Contract Let
Period of Contract
Procurement Method
Northside Community Service Ltd
Head Leasing and accommodation management
$85,394 1 July 2009 3 years 3 months
Select Tender
Repairs and maintenance
$5,487 1 July 2009 3 years 3 months
Select Tender
Premier Youthworks Pty Ltd
Intensive Residential Care
$2,742,496 1 July 2012 3 years Select Tender
Richmond Fellowship ACT Inc
General Residential Care
$2,300,528 1 July 2012 3 years Select Tender
Intensive Residential Care
$2,742,496 1 July 2012 3 years Select Tender
Child, Youth and Family Services Program
Anglicare Canberra and Goulburn
CYCLOPS—Young Carers and their Families Engagement and Support Service
$314,396 1 March 2012 3 years 3 months
Open Tender
Barnardos Australia
Network coordination
$112,284 1 March 2012 3 years 3 months
Open Tender
Case management $512,541 1 March 2012 3 years 3 months
Open Tender
Intensive intervention services
$808,964 1 March 2012 3 years 3 months
Open Tender
Information, engagement and coordination services
$232,167 12 December 2012 2 years 6 months
Open Tender
Belconnen Community Service Inc
Network coordination
$112,284 1 March 2012 3 years 3 months
Open Tender
Case management and group programs
$702,622 1 March 2012 3 years 3 months
Open Tender
Youth engagement $215,599 1 March 2012 3 years 3 months
Open Tender
Canberra Police and Community Youth Club Inc
Case management $241,605 1 March 2012 3 years 3 months
Open Tender
Group programs $347,976 1 March 2012 3 years 3 months
Open Tender
CatholicCare Canberra and Goulburn
Case management $261,882 1 March 2012 3 years 3 months
Open Tender
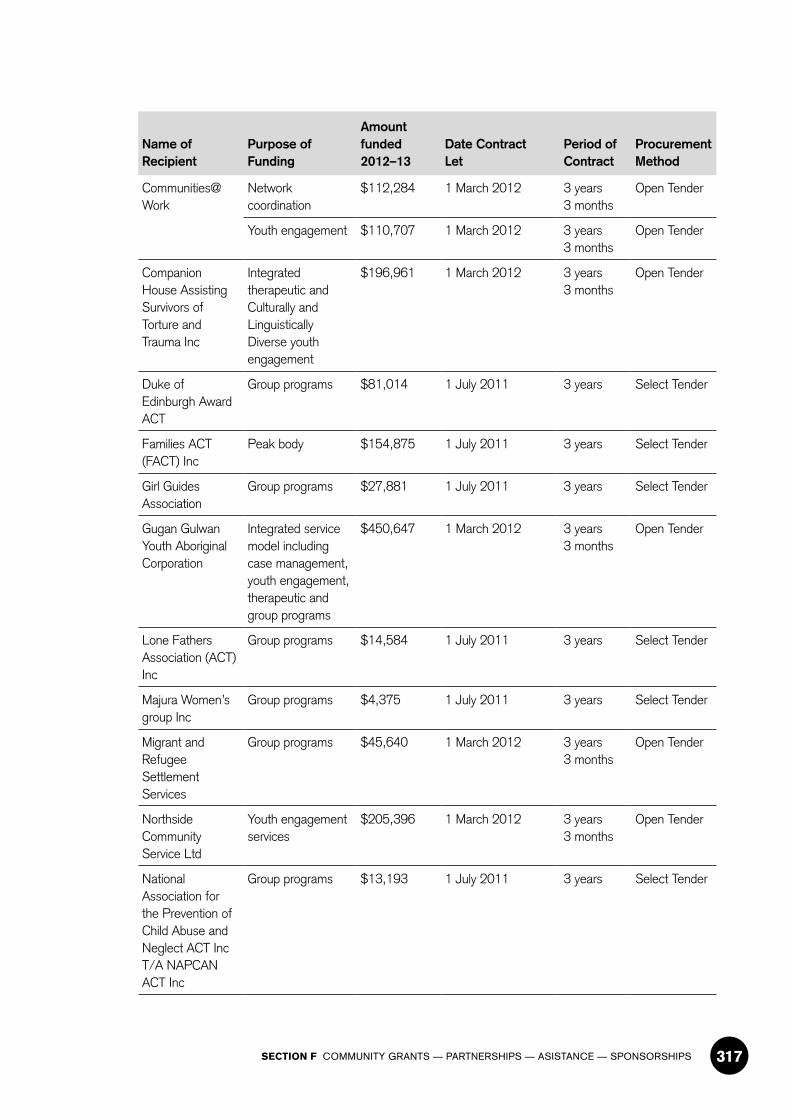
SECTION F COMMUNITY GRANTS — PARTNERSHIPS — ASISTANCE — SPONSORSHIPS 317
Name of Recipient
Purpose of Funding
Amount funded2012–13
Date Contract Let
Period of Contract
Procurement Method
Communities@Work
Network coordination
$112,284 1 March 2012 3 years 3 months
Open Tender
Youth engagement $110,707 1 March 2012 3 years 3 months
Open Tender
Companion House Assisting Survivors of Torture and Trauma Inc
Integrated therapeutic and Culturally and Linguistically Diverse youth engagement
$196,961 1 March 2012 3 years 3 months
Open Tender
Duke of Edinburgh Award ACT
Group programs $81,014 1 July 2011 3 years Select Tender
Families ACT (FACT) Inc
Peak body $154,875 1 July 2011 3 years Select Tender
Girl Guides Association
Group programs $27,881 1 July 2011 3 years Select Tender
Gugan Gulwan Youth Aboriginal Corporation
Integrated service model including case management, youth engagement, therapeutic and group programs
$450,647 1 March 2012 3 years 3 months
Open Tender
Lone Fathers Association (ACT) Inc
Group programs $14,584 1 July 2011 3 years Select Tender
Majura Women’s group Inc
Group programs $4,375 1 July 2011 3 years Select Tender
Migrant and Refugee Settlement Services
Group programs $45,640 1 March 2012 3 years 3 months
Open Tender
Northside Community Service Ltd
Youth engagement services
$205,396 1 March 2012 3 years 3 months
Open Tender
National Association for the Prevention of Child Abuse and Neglect ACT Inc T/A NAPCAN ACT Inc
Group programs $13,193 1 July 2011 3 years Select Tender

COMMUNITY SERVICES DIRECTORATE ANNUAL REPORT 2012–13318
Name of Recipient
Purpose of Funding
Amount funded2012–13
Date Contract Let
Period of Contract
Procurement Method
Parentline ACT Inc
Information, engagement and coordination services
$358,346 1 March 2012 9 months Open Tender
Queanbeyan Multilingual Centre and Youth Coalition of the ACT Consortia
Culturally and Linguistically Diverse youth engagement service
$126,002 1 March 2012 3 years 3 months
Open Tender
Relationships Australia Canberra and Region Inc
Group programs $102,263 1 March 2012 3 years 3 months
Open Tender
Therapeutic services
$273,651 1 March 2012 3 years 3 months
Open Tender
Society of St Vincent de Paul Pty Ltd
Group programs $211,707 1 March 2012 3 years 3 months
Open Tender
The Scout Association of Australia ACT Branch Inc
Group programs $29,679 1 July 2011 3 years Select Tender
The Smith Family Case management $181,157 1 March 2012 3 years 3 months
Open Tender
The Youth Coalition of the ACT
Peak body $323,404 1 July 2011 3 years Select Tender
Tuggeranong Community Arts Association
Group programs $206,312 1 March 2012 3 years 3 months
Open Tender
UnitingCare Kippax
Case management $303,033 1 March 2012 3 years 3 months
Open Tender
New Parent Infant Network (NEWPIN)
$99,254 1 March 2012 3 years 3 months
Open Tender
Kippax Kid program $32,007 1 July 2012 3 years Select Tender
Woden Community Inc
Network coordination
$112,284 1 March 2012 3 years 3 months
Open Tender
Case management $550,268 1 March 2012 3 years 3 months
Open Tender
Youth engagement services
$165,554 1 March 2012 3 years 3 months
Open Tender
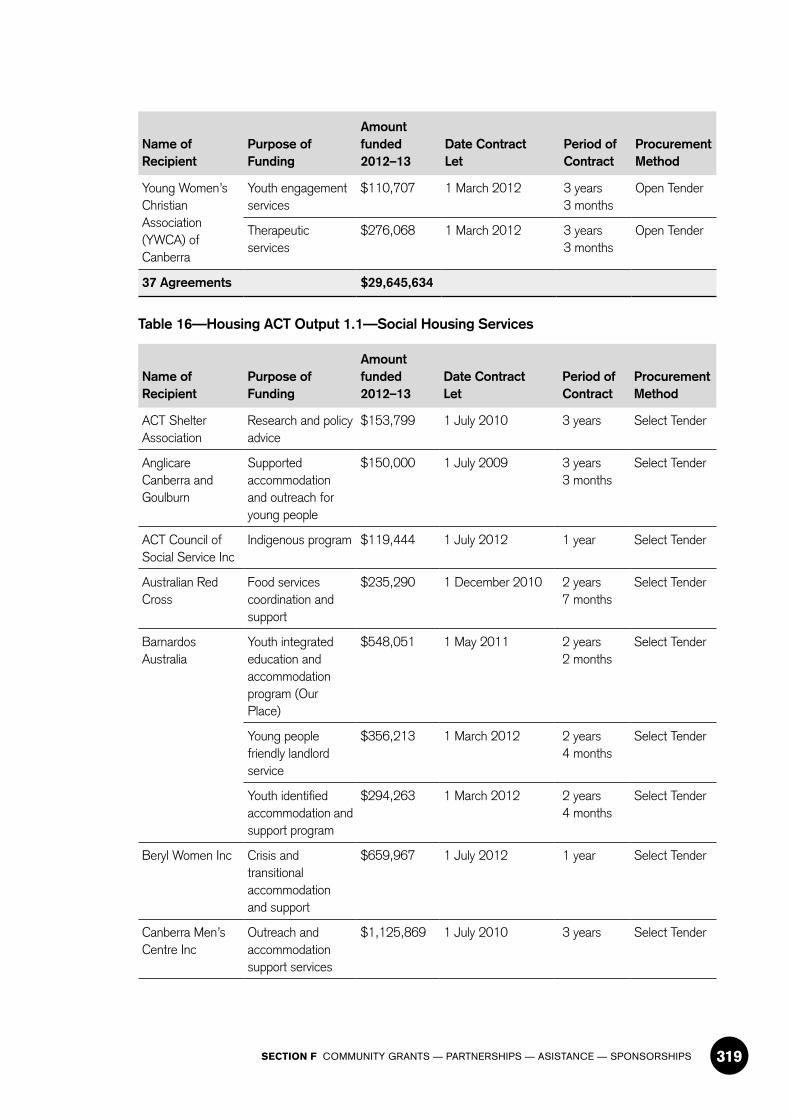
SECTION F COMMUNITY GRANTS — PARTNERSHIPS — ASISTANCE — SPONSORSHIPS 319
Name of Recipient
Purpose of Funding
Amount funded2012–13
Date Contract Let
Period of Contract
Procurement Method
Young Women’s Christian Association (YWCA) of Canberra
Youth engagement services
$110,707 1 March 2012 3 years 3 months
Open Tender
Therapeutic services
$276,068 1 March 2012 3 years 3 months
Open Tender
37 Agreements $29,645,634
Table 16—Housing ACT Output 1.1—Social Housing Services
Name of Recipient
Purpose of Funding
Amount funded 2012–13
Date Contract Let
Period of Contract
Procurement Method
ACT Shelter Association
Research and policy advice
$153,799 1 July 2010 3 years Select Tender
Anglicare Canberra and Goulburn
Supported accommodation and outreach for young people
$150,000 1 July 2009 3 years 3 months
Select Tender
ACT Council of Social Service Inc
Indigenous program $119,444 1 July 2012 1 year Select Tender
Australian Red Cross
Food services coordination and support
$235,290 1 December 2010 2 years 7 months
Select Tender
Barnardos Australia
Youth integrated education and accommodation program (Our Place)
$548,051 1 May 2011 2 years 2 months
Select Tender
Young people friendly landlord service
$356,213 1 March 2012 2 years 4 months
Select Tender
Youth identified accommodation and support program
$294,263 1 March 2012 2 years 4 months
Select Tender
Beryl Women Inc Crisis and transitional accommodation and support
$659,967 1 July 2012 1 year Select Tender
Canberra Men’s Centre Inc
Outreach and accommodation support services
$1,125,869 1 July 2010 3 years Select Tender

COMMUNITY SERVICES DIRECTORATE ANNUAL REPORT 2012–13320
Name of Recipient
Purpose of Funding
Amount funded 2012–13
Date Contract Let
Period of Contract
Procurement Method
Canberra Rape Crisis Centre Inc
Sexual assault crisis intervention and counselling
$552,948 1 July 2012 1 year Select Tender
Capital Community Housing Inc
Community housing tenancy management and support
$43,738 1 July 2011 2 years Select Tender
Care Inc Financial counselling service
$90,525 1 July 2010 3 years Select Tender
CatholicCare Canberra and Goulburn
MINOSA House and ASSIST
$680,027 1 July 2010 3 years Select Tender
Youth housing support service
$273,613 1 March 2012 2 years 4 months
Select Tender
Communities@Work Ltd
Women’s housing program
$183,441 1 July 2012 1 year Select Tender
Conflict Resolution Services Inc
Youth crisis mediation service
$252,963 1 March 2012 2 years 4 months
Open Tender
Connections ACT Inc
First Point-central intake services for homelessness
$635,443 1 July 2010 3 years Open Tender
Support to prevent and address homelessness for sole fathers families
$900,217 1 July 2010 3 years Select Tender
Council on the Ageing (ACT)
Housing advisory service
$73,483 1 July 2012 1 year Select Tender
Domestic Violence Crisis Service
Court advocacy $213,521 1 July 2012 1 year Select Tender
Domestic Violence Crisis Service
$1,632,803 1 July 2012 1 year Select Tender
Young people’s outreach program
$186,831 1 July 2012 1 year Select Tender
Doris Women’s Refuge Inc
Women’s refuge $673,897 1 July 2012 1 year Select Tender
Gugan Gulwan Youth Aboriginal Corporation
Supported assistance for young people experiencing homelessness
$71,717 1 July 2011 3 years Select Tender
Havelock Housing Association
Havelock House $12,524 1 July 2010 3 years Select Tender

SECTION F COMMUNITY GRANTS — PARTNERSHIPS — ASISTANCE — SPONSORSHIPS 321
Name of Recipient
Purpose of Funding
Amount funded 2012–13
Date Contract Let
Period of Contract
Procurement Method
Inanna Inc Indigenous boarding house network support
$284,394 1 July 2012 1 year Select Tender
Head leasing $80,000 1 July 2012 1 year Select Tender
Indigenous supported accommodation service
$532,326 1 July 2012 1 year Select Tender
Crisis and medium term accommodation—north
$1,064,651 1 July 2012 1 year Select Tender
Crisis supported accommodation for women—south
$600,083 1 July 2012 1 year Select Tender
Karinya House Home for Mothers and Babies
Karinya House and Erin House
$464,404 1 July 2012 1 year Select Tender
Northside Community Service Ltd
Women’s supported accommodation program
$336,150 1 July 2012 1 year Select Tender
The Salvation Army
Youth emergency accommodation network
$2,314,645 1 March 2012 2 years 4 months
Open Tender
Society of St. Vincent de Paul Pty Ltd
Blue Door drop-in centre
$164,662 1 July 2010 3 years Select Tender
Family service $765,446 1 July 2010 3 years Select Tender
Samaritan House $645,778 1 July 2010 3 years Select Tender
Young parents’ accommodation and support program
$191,013 1 July 2010 3 years Select Tender
Street to Home $374,000 1 March 2010 3 years 4 months
Select Tender
Tamil Senior Citizens’ Association (ACT) Inc
Tenancy management and support
$8,425 1 July 2012 1 year Select Tender
Ted Noffs Foundation
Mentoring, life skills and social enterprise services
$160,038 1 March 2012 2 years 4 months
Open Tender
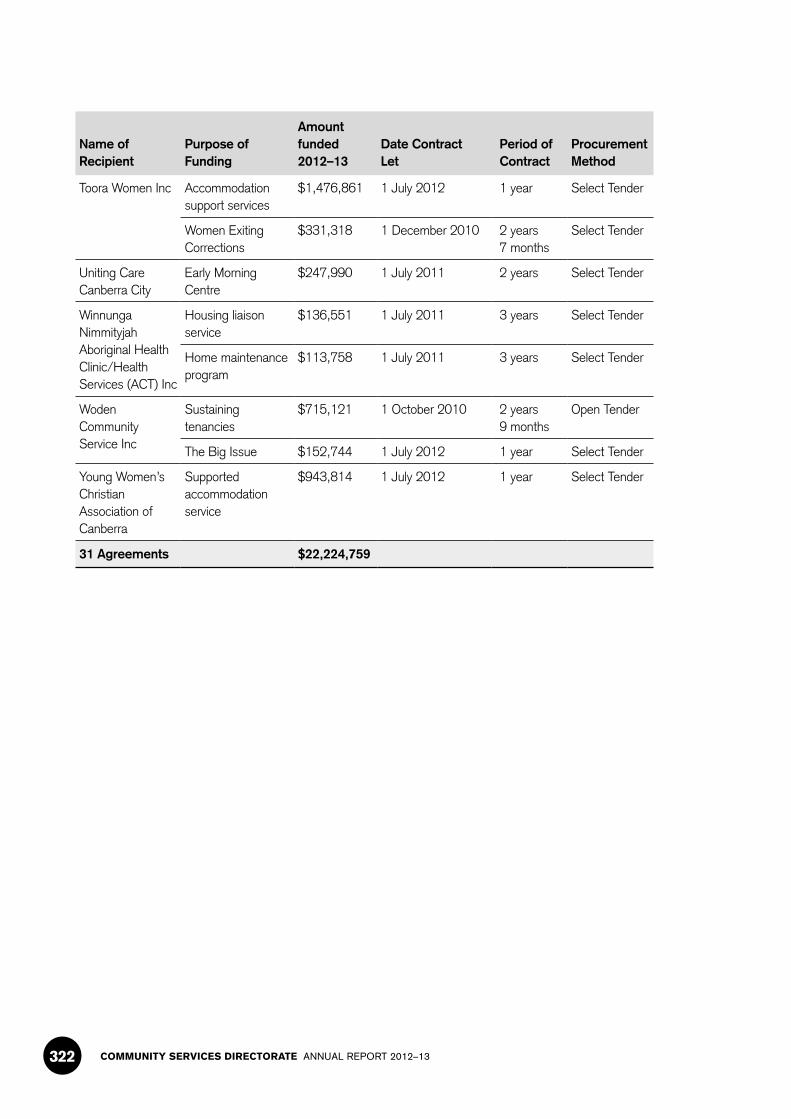
COMMUNITY SERVICES DIRECTORATE ANNUAL REPORT 2012–13322
Name of Recipient
Purpose of Funding
Amount funded 2012–13
Date Contract Let
Period of Contract
Procurement Method
Toora Women Inc Accommodation support services
$1,476,861 1 July 2012 1 year Select Tender
Women Exiting Corrections
$331,318 1 December 2010 2 years 7 months
Select Tender
Uniting Care Canberra City
Early Morning Centre
$247,990 1 July 2011 2 years Select Tender
Winnunga Nimmityjah Aboriginal Health Clinic/Health Services (ACT) Inc
Housing liaison service
$136,551 1 July 2011 3 years Select Tender
Home maintenance program
$113,758 1 July 2011 3 years Select Tender
Woden Community Service Inc
Sustaining tenancies
$715,121 1 October 2010 2 years 9 months
Open Tender
The Big Issue $152,744 1 July 2012 1 year Select Tender
Young Women’s Christian Association of Canberra
Supported accommodation service
$943,814 1 July 2012 1 year Select Tender
31 Agreements $22,224,759

SECTION F COMMUNITY GRANTS — PARTNERSHIPS — ASISTANCE — SPONSORSHIPS 323
F.2.2 Community Grants and Sponsorship
2012–13 International Day of People with Disabilities—I-DAY
The International Day of People with Disabilities (I-Day) is a United Nations Sanctioned day that aims to promote awareness and understanding of disability issues and encourage support for the dignity, rights and well-being of people with disability.
Table 17—International Day of People with Disability
Output 1.1—Disability Services and Policy
Name of Recipient PurposeAmount funded
2012–13
ACT Community Living Project 2012 Expo and Market $5,000
Canberra Dance Theatre I-Dance-Day: An evening of dance performances $1,000
Carers ACT Launch Uniquely Us Café social enterprise $2,850
Catholic Care Hosting a lunch with the focus on increasing sensory experience for people with a disability
$650
Communities@Work Walk and Talk—Fun4Youth and Connections@Cooleman
$550
Gorman House Arts /Belconnen Arts
Activities include: I AM... and exhibition at Belconnen Arts Centre by artsAbility artists
$2,050
Gungahlin Regional Community Services
I Can Day Community Event $1,500
Human Rights Commission A gala event will feature a selection of the best films from the 2012 screening of the Other Film Festival
$2,500
NICAN Inc I-DAY Initiative $5,000
To manage I-DAY Grants $2,000
People with Disabilities ACT A morning tea for people with disabilities and friends $350
Technical Aid to the Disabled ACT
2012 Walk a Loop $3,550
12 Grants $27,000
2012–13 Quality of Life Grant and Young People in Residential Aged Care
Grants up to the maximum of $5,000 are offered for goods and services that make a real difference to the lives of people with disabilities, and their families and carers who assist them.

COMMUNITY SERVICES DIRECTORATE ANNUAL REPORT 2012–13324
Table 18—Quality of Life Grant
Output 1.1—Disability Services and Policy
Name of Recipient PurposeAmount funded
2012–13
231 individual grants Quality of Life $500,000
231 Individual Grants $500,000
2012–13 Good Life Planning Grant
Grants up to the maximum of $5,000 were offered to assist people, not linked to a government-funded service provider, to assist them in developing and implementing their future plans.
Table 19—Good Life Planning Grant
Output 1.1—Disability Services and Policy
Name of Recipient PurposeAmount funded
2012–13
8 individual grants To employ a planning facilitator; and to attend training $14,440
8 Individual Grants $14,440
2012–13 Innovation Grant
Individual Grants up to the maximum of $50,000 are offered to individuals and organisations to support once-off strategic projects or initiatives that aim to do things differently for vulnerable people, including those with disabilities. Innovation Grants were available for projects or initiatives with the potential to assist a number of people with a disability including by way of services or supports for carers and families; or by their potential to influence systemic change.
Table 20—Innovation Grant
Output 1.1—Disability Services and Policy
Name of Recipient PurposeAmount funded
2012–13
Enable Development Pty Ltd Development of an ACT assistive devices collaboration network
$27,400
Goalball ACT Inc ACT Junior Goalball development $5,000
Individual Grant Vela Microboards Canberra $8,100
Nican Inc Cut through Crew project $15,900
Paperworks Inc Paper marking program for migrant and refugees $8,586
Social Ventures Australia Limited
Social enterprise seed fund $39,544
Summer Foundation Ltd Engaging with anticipated impact of National Disability Insurance Scheme for people with disability in the ACT
$36,670
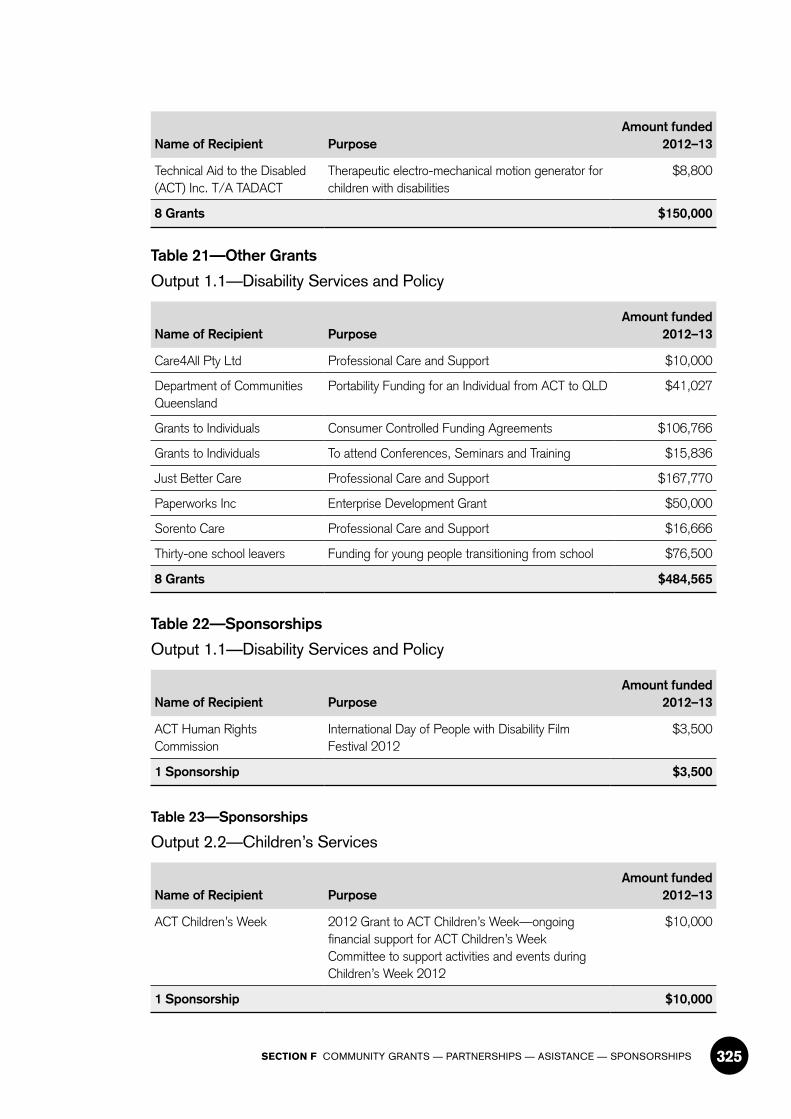
SECTION F COMMUNITY GRANTS — PARTNERSHIPS — ASISTANCE — SPONSORSHIPS 325
Name of Recipient PurposeAmount funded
2012–13
Technical Aid to the Disabled (ACT) Inc. T/A TADACT
Therapeutic electro-mechanical motion generator for children with disabilities
$8,800
8 Grants $150,000
Table 21—Other Grants
Output 1.1—Disability Services and Policy
Name of Recipient PurposeAmount funded
2012–13
Care4All Pty Ltd Professional Care and Support $10,000
Department of Communities Queensland
Portability Funding for an Individual from ACT to QLD $41,027
Grants to Individuals Consumer Controlled Funding Agreements $106,766
Grants to Individuals To attend Conferences, Seminars and Training $15,836
Just Better Care Professional Care and Support $167,770
Paperworks Inc Enterprise Development Grant $50,000
Sorento Care Professional Care and Support $16,666
Thirty-one school leavers Funding for young people transitioning from school $76,500
8 Grants $484,565
Table 22—Sponsorships
Output 1.1—Disability Services and Policy
Name of Recipient PurposeAmount funded
2012–13
ACT Human Rights Commission
International Day of People with Disability Film Festival 2012
$3,500
1 Sponsorship $3,500
Table 23—Sponsorships
Output 2.2—Children’s Services
Name of Recipient PurposeAmount funded
2012–13
ACT Children’s Week 2012 Grant to ACT Children’s Week—ongoing financial support for ACT Children’s Week Committee to support activities and events during Children’s Week 2012
$10,000
1 Sponsorship $10,000
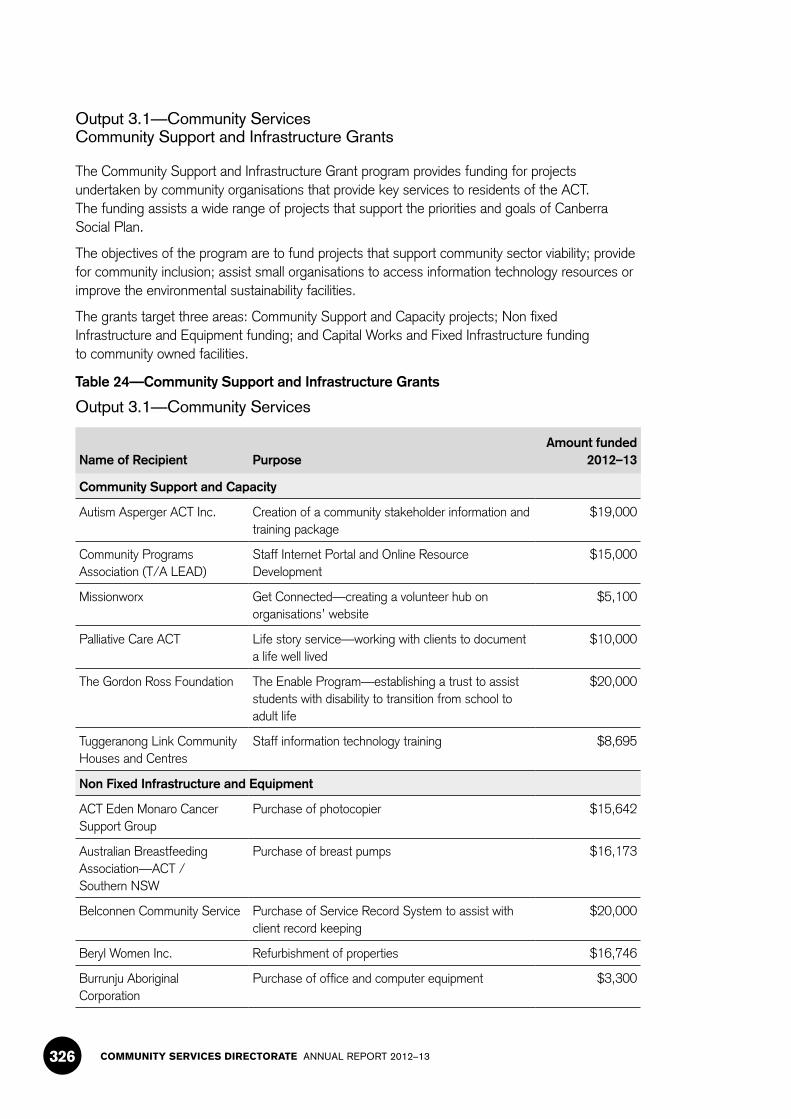
COMMUNITY SERVICES DIRECTORATE ANNUAL REPORT 2012–13326
Output 3.1—Community ServicesCommunity Support and Infrastructure Grants
The Community Support and Infrastructure Grant program provides funding for projects undertaken by community organisations that provide key services to residents of the ACT. The funding assists a wide range of projects that support the priorities and goals of Canberra Social Plan.
The objectives of the program are to fund projects that support community sector viability; provide for community inclusion; assist small organisations to access information technology resources or improve the environmental sustainability facilities.
The grants target three areas: Community Support and Capacity projects; Non fixed Infrastructure and Equipment funding; and Capital Works and Fixed Infrastructure funding to community owned facilities.
Table 24—Community Support and Infrastructure Grants
Output 3.1—Community Services
Name of Recipient PurposeAmount funded
2012–13
Community Support and Capacity
Autism Asperger ACT Inc. Creation of a community stakeholder information and training package
$19,000
Community Programs Association (T/A LEAD)
Staff Internet Portal and Online Resource Development
$15,000
Missionworx Get Connected—creating a volunteer hub on organisations’ website
$5,100
Palliative Care ACT Life story service—working with clients to document a life well lived
$10,000
The Gordon Ross Foundation The Enable Program—establishing a trust to assist students with disability to transition from school to adult life
$20,000
Tuggeranong Link Community Houses and Centres
Staff information technology training $8,695
Non Fixed Infrastructure and Equipment
ACT Eden Monaro Cancer Support Group
Purchase of photocopier $15,642
Australian Breastfeeding Association—ACT / Southern NSW
Purchase of breast pumps $16,173
Belconnen Community Service Purchase of Service Record System to assist with client record keeping
$20,000
Beryl Women Inc. Refurbishment of properties $16,746
Burrunju Aboriginal Corporation
Purchase of office and computer equipment $3,300

SECTION F COMMUNITY GRANTS — PARTNERSHIPS — ASISTANCE — SPONSORSHIPS 327
Name of Recipient PurposeAmount funded
2012–13
Canberra Blind Society Acquisition of Fuji Xerox Multi Function Device $12,025
Connections ACT Purchase of office equipment $6,285
Kidsafe ACT Inc Information technology and furniture upgrade $6,261
L’Arche Genesaret Inc Purchase of computer and office equipment $17,500
Paperworks Inc. Purchase of an etching press $3,363
Post and Ante Natal Depression Support Inc
Upgrade of library $883
RSI and Overuse Injury Association of the ACT, Inc.
Purchase of ergonomic computer equipment $845
St. Paul’s Ginninderra Anglican Church, Spence
Purchase of commercial scales $545
The Brite Notes Inc. Purchase of keyboard and associated equipment $1,370
Warehouse Circus Inc. Purchase of equipment for the Kaleen Core Circus Program
$12,464
Woden Seniors Modular storage facilities for the veranda area of Woden Seniors
$5,276
YWCA of Canberra Mura Lanyon Youth and Community Centre painting upgrade and chair refurbishment
$9,950
Capital Works and Fixed Infrastructure
Argyle Community Housing Ainslie Village Community BBQ and common area $13,116
Communities@Work Refurbishment of youth centre at Tuggeranong $30,000
Lifeline Canberra Security door and entry mechanism $1,625
Meg’s Toy Box Capital works and fixed infrastructure grant to enhance the toy storage and community room facilities at Meg’s Toy Box
$11,250
Pearce Community Centre Replacement of blinds in Community Hall $2,578
St Philip’s Anglican Church Parish Council, O’Connor
St Philip’s Care Service Centre, O’Connor $30,000
Tandem Respite Inc. Wheelchair accessible ramp for Tandem House $8,000
UnitingCare Kippax Paving and entrance way to office and Community Centre
$14,155
Other Grant
West Belconnen Health Co-op Ltd
Assistance to expand services into the Tuggeranong region
$50,000
32 Grants $387,147
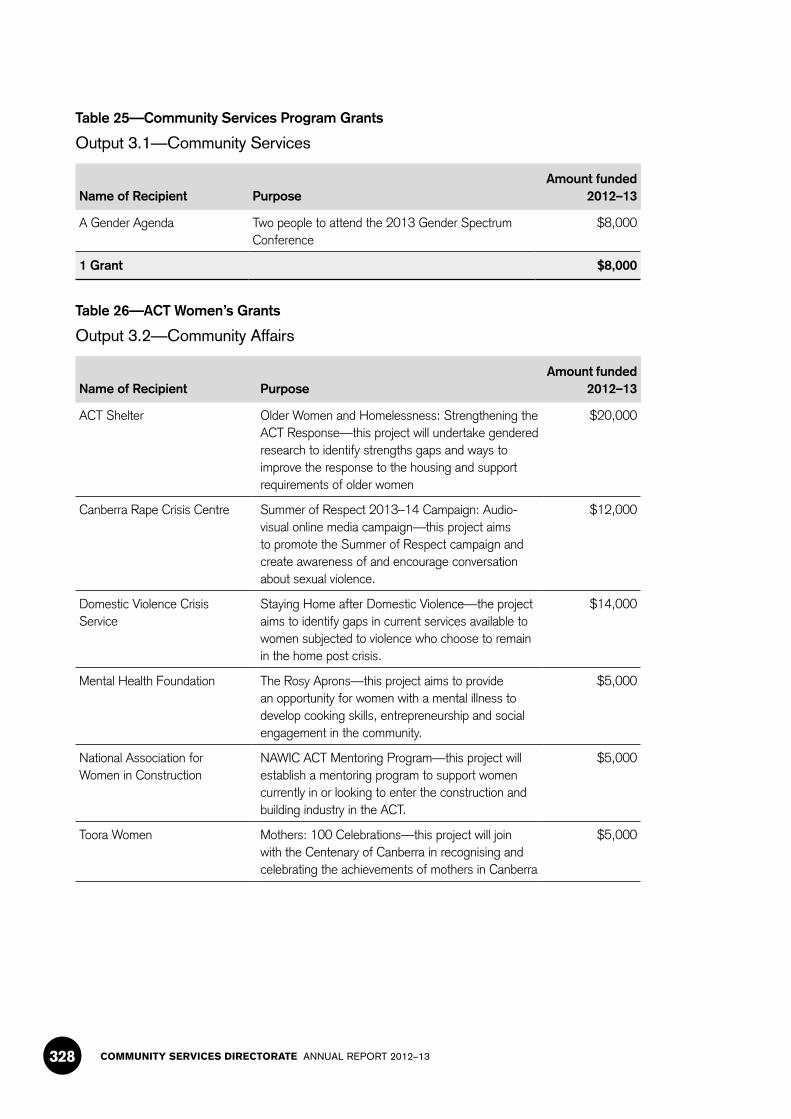
COMMUNITY SERVICES DIRECTORATE ANNUAL REPORT 2012–13328
Table 25—Community Services Program Grants
Output 3.1—Community Services
Name of Recipient PurposeAmount funded
2012–13
A Gender Agenda Two people to attend the 2013 Gender Spectrum Conference
$8,000
1 Grant $8,000
Table 26—ACT Women’s Grants
Output 3.2—Community Affairs
Name of Recipient PurposeAmount funded
2012–13
ACT Shelter Older Women and Homelessness: Strengthening the ACT Response—this project will undertake gendered research to identify strengths gaps and ways to improve the response to the housing and support requirements of older women
$20,000
Canberra Rape Crisis Centre Summer of Respect 2013–14 Campaign: Audio-visual online media campaign—this project aims to promote the Summer of Respect campaign and create awareness of and encourage conversation about sexual violence.
$12,000
Domestic Violence Crisis Service
Staying Home after Domestic Violence—the project aims to identify gaps in current services available to women subjected to violence who choose to remain in the home post crisis.
$14,000
Mental Health Foundation The Rosy Aprons—this project aims to provide an opportunity for women with a mental illness to develop cooking skills, entrepreneurship and social engagement in the community.
$5,000
National Association for Women in Construction
NAWIC ACT Mentoring Program—this project will establish a mentoring program to support women currently in or looking to enter the construction and building industry in the ACT.
$5,000
Toora Women Mothers: 100 Celebrations—this project will join with the Centenary of Canberra in recognising and celebrating the achievements of mothers in Canberra
$5,000
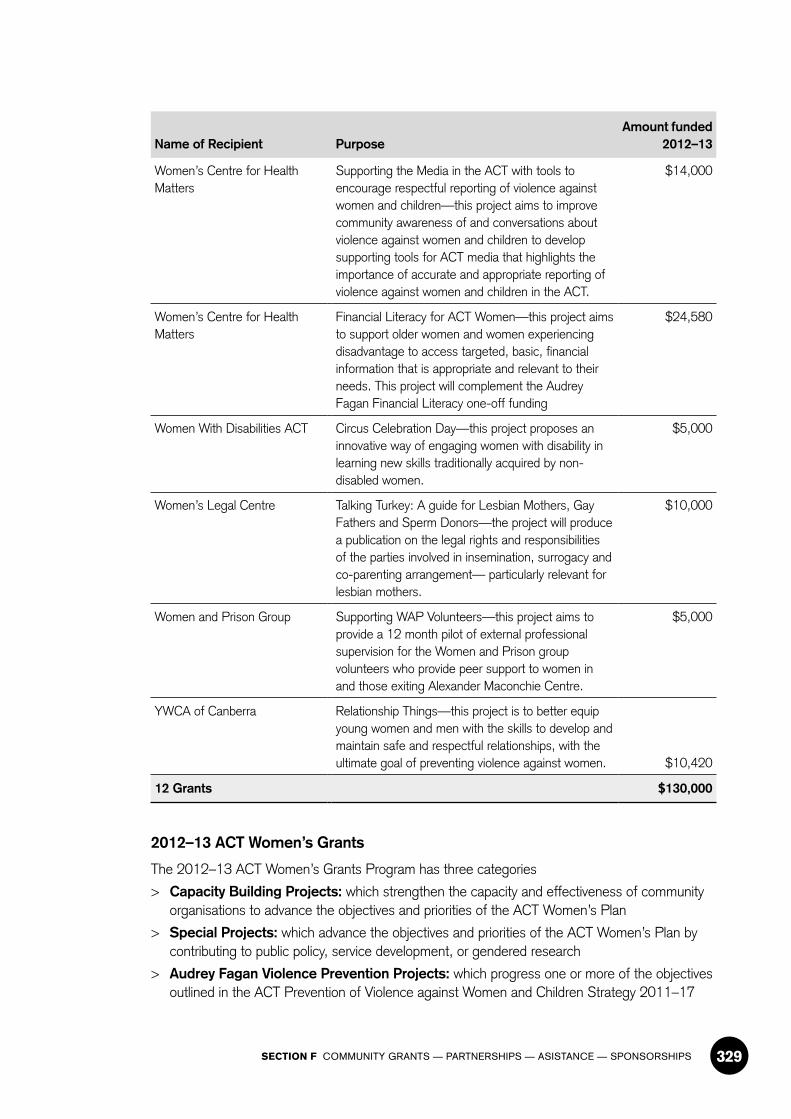
SECTION F COMMUNITY GRANTS — PARTNERSHIPS — ASISTANCE — SPONSORSHIPS 329
Name of Recipient PurposeAmount funded
2012–13
Women’s Centre for Health Matters
Supporting the Media in the ACT with tools to encourage respectful reporting of violence against women and children—this project aims to improve community awareness of and conversations about violence against women and children to develop supporting tools for ACT media that highlights the importance of accurate and appropriate reporting of violence against women and children in the ACT.
$14,000
Women’s Centre for Health Matters
Financial Literacy for ACT Women—this project aims to support older women and women experiencing disadvantage to access targeted, basic, financial information that is appropriate and relevant to their needs. This project will complement the Audrey Fagan Financial Literacy one-off funding
$24,580
Women With Disabilities ACT Circus Celebration Day—this project proposes an innovative way of engaging women with disability in learning new skills traditionally acquired by non-disabled women.
$5,000
Women’s Legal Centre Talking Turkey: A guide for Lesbian Mothers, Gay Fathers and Sperm Donors—the project will produce a publication on the legal rights and responsibilities of the parties involved in insemination, surrogacy and co-parenting arrangement— particularly relevant for lesbian mothers.
$10,000
Women and Prison Group Supporting WAP Volunteers—this project aims to provide a 12 month pilot of external professional supervision for the Women and Prison group volunteers who provide peer support to women in and those exiting Alexander Maconchie Centre.
$5,000
YWCA of Canberra Relationship Things—this project is to better equip young women and men with the skills to develop and maintain safe and respectful relationships, with the ultimate goal of preventing violence against women. $10,420
12 Grants $130,000
2012–13 ACT Women’s Grants
The 2012–13 ACT Women’s Grants Program has three categories
> Capacity Building Projects: which strengthen the capacity and effectiveness of community organisations to advance the objectives and priorities of the ACT Women’s Plan
> Special Projects: which advance the objectives and priorities of the ACT Women’s Plan by contributing to public policy, service development, or gendered research
> Audrey Fagan Violence Prevention Projects: which progress one or more of the objectives outlined in the ACT Prevention of Violence against Women and Children Strategy 2011–17
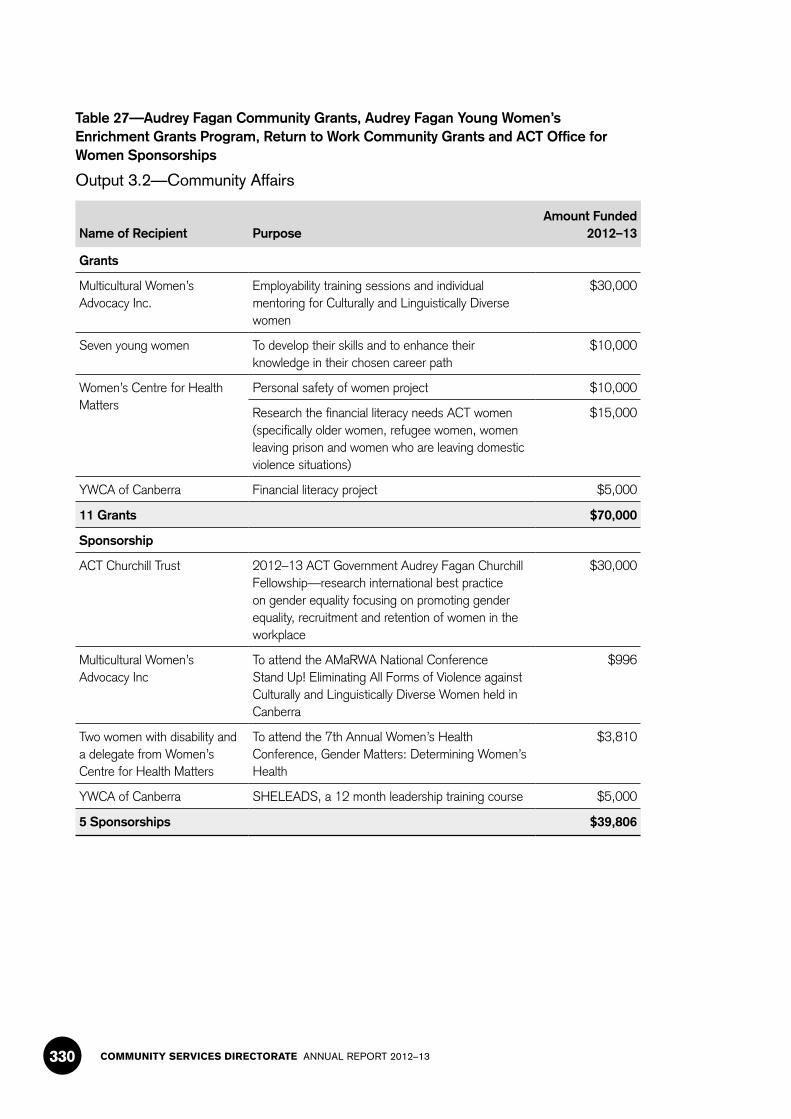
COMMUNITY SERVICES DIRECTORATE ANNUAL REPORT 2012–13330
Table 27—Audrey Fagan Community Grants, Audrey Fagan Young Women’s Enrichment Grants Program, Return to Work Community Grants and ACT Office for Women Sponsorships
Output 3.2—Community Affairs
Name of Recipient PurposeAmount Funded
2012–13
Grants
Multicultural Women’s Advocacy Inc.
Employability training sessions and individual mentoring for Culturally and Linguistically Diverse women
$30,000
Seven young women To develop their skills and to enhance their knowledge in their chosen career path
$10,000
Women’s Centre for Health Matters
Personal safety of women project $10,000
Research the financial literacy needs ACT women (specifically older women, refugee women, women leaving prison and women who are leaving domestic violence situations)
$15,000
YWCA of Canberra Financial literacy project $5,000
11 Grants $70,000
Sponsorship
ACT Churchill Trust 2012–13 ACT Government Audrey Fagan Churchill Fellowship—research international best practice on gender equality focusing on promoting gender equality, recruitment and retention of women in the workplace
$30,000
Multicultural Women’s Advocacy Inc
To attend the AMaRWA National Conference Stand Up! Eliminating All Forms of Violence against Culturally and Linguistically Diverse Women held in Canberra
$996
Two women with disability and a delegate from Women’s Centre for Health Matters
To attend the 7th Annual Women’s Health Conference, Gender Matters: Determining Women’s Health
$3,810
YWCA of Canberra SHELEADS, a 12 month leadership training course $5,000
5 Sponsorships $39,806

SECTION F COMMUNITY GRANTS — PARTNERSHIPS — ASISTANCE — SPONSORSHIPS 331
2012–13 ACT Seniors Grants and Sponsorship Program
The Seniors Participation Grants and Sponsorship Program provides funding towards activities and events which promote positive ageing in the ACT, supporting older Canberrans to maintain their wellbeing and to remain active and connected in their community.
Table 28—ACT Seniors Grants and Sponsorship Program
Output 3.2—Community Affairs
Name of Recipient PurposeAmount funded
2012–13
Arthritis Foundation of the ACT Inc wii together as seniors $9,000
Barbershop Harmony Club of Canberra Inc ACT
Seniors in harmony: social program—aged care module
$6,000
Bangladeshi Seniors Club Canberra Shine a light and ageing positively $5,000
Belconnen Senior Citizens Club Inc 30 year celebration $2,000
Canberra Dance Theatre Inc Contribution $8,000
Canberra Multicultural Community Forum (CMCF) Inc
Information support—promote healthy ageing and wellbeing for multicultural seniors
$3,000
Communities@Work Tuggeranong men’s shed setup $4,500
Embroiderers’ Guild ACT Inc Update of computer equipment’ $1,600
Friends of the Australian National Botanic Gardens Inc
Family Picnic Day $7,000
Lighthouse Business Innovation Centre Limited
Leading lights, a ACT seniors mentors program $10,500
Parkinsons ACT Inc Contribution $1,250
Southside Community Service Inc Nordic walking ACT $5,000
Southside Community Service Inc Everything old is new again $5,000
The Australian Nutrition Foundation ACT Division T/A Nutrition Australia ACT Division
Simple eats for seniors $5,000
The Brite Notes Inc The brite notes travel costs $2,000
The Young Women’s Christian Association of Canberra T/A YWCA of Canberra
Connecting seniors $5,000
Tuggeranong 55 Plus Club Inc Development of club website $3,000
Vietnam Veterans and Veterans Federation ACT Inc
Old diggers jolly jaunts $7,000
Woden Community Service Inc Seniors café $1,550
Young Men’s Christian Association of Canberra T/A YMCA of Canberra inc
Discover sailing for seniors $3,600
2013 YMCA seniors sports carnival $5,000
21 Grants $100,000

COMMUNITY SERVICES DIRECTORATE ANNUAL REPORT 2012–13332
Name of Recipient PurposeAmount funded
2012–13
Sponsorship
ACT Division Australian Association of Gerontology
Centenarians forum video project $2,000
1 Sponsorship $2,000
2012–13 Community Languages Grants
The objective of the ACT Community Languages Grant is to assist ACT based Community Language Schools, new and emerging schools, and ACT Community Organisations with projects which facilitate speaking Languages other than English.
Table 29—Community Languages Grants
Output 3.2 – Community Affairs
Name of Recipient PurposeAmount funded
2012–13
ACT Bhutan Community Language School
Administration and rent $1,300
ACT Community Language Schools Association (ACT CLSA)
Operational costs of ACT Community Language Schools Association
$5,100
ACT German Language School Inc Administration and rent $1,580
ACT Maori Performing Arts Inc Purchase of text books and other learning resources
$1,000
ACT Playgroups Association Inc Language teaching aids and Personal development
$1,780
ACT Tibetan Community Language School
Language teaching aids $1,000
Australia Sri Lanka Buddist Association Canberra Inc
Administration, Language teaching aids, rent and IT support
$2,880
Australian Tamil Cultural Society of the ACT Inc
Language teaching aids $500
Bangla Language and Cultural School
Language teaching aids, rent and IT support $2,380
Canberra and District Hungarian Cultural Association Inc
Operational costs of administration, insurance and rent
$1,980
Canberra Dutch School Administration, Language teaching aids and IT support
$1,700
Canberra Hindi School Language teaching aids, personal development, rent and IT support
$2,880
Canberra Japanese Supplementary School Inc
Administration and Language teaching aids $1,650
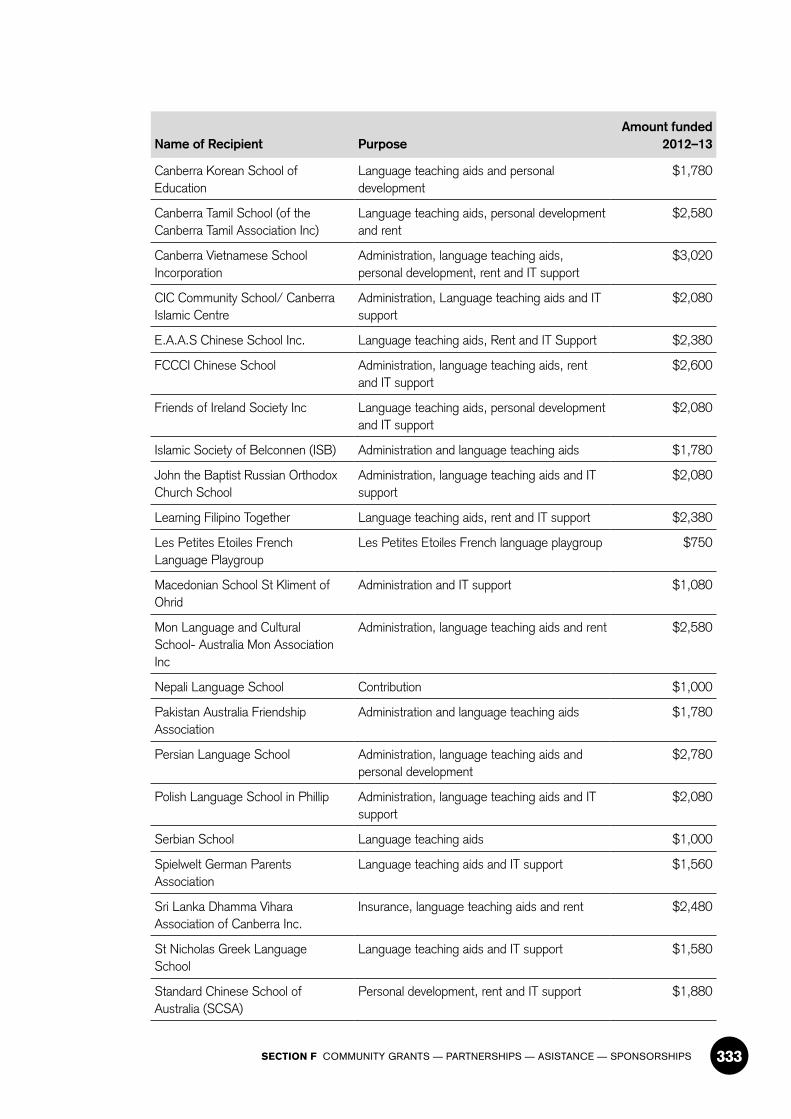
SECTION F COMMUNITY GRANTS — PARTNERSHIPS — ASISTANCE — SPONSORSHIPS 333
Name of Recipient PurposeAmount funded
2012–13
Canberra Korean School of Education
Language teaching aids and personal development
$1,780
Canberra Tamil School (of the Canberra Tamil Association Inc)
Language teaching aids, personal development and rent
$2,580
Canberra Vietnamese School Incorporation
Administration, language teaching aids, personal development, rent and IT support
$3,020
CIC Community School/ Canberra Islamic Centre
Administration, Language teaching aids and IT support
$2,080
E.A.A.S Chinese School Inc. Language teaching aids, Rent and IT Support $2,380
FCCCI Chinese School Administration, language teaching aids, rent and IT support
$2,600
Friends of Ireland Society Inc Language teaching aids, personal development and IT support
$2,080
Islamic Society of Belconnen (ISB) Administration and language teaching aids $1,780
John the Baptist Russian Orthodox Church School
Administration, language teaching aids and IT support
$2,080
Learning Filipino Together Language teaching aids, rent and IT support $2,380
Les Petites Etoiles French Language Playgroup
Les Petites Etoiles French language playgroup $750
Macedonian School St Kliment of Ohrid
Administration and IT support $1,080
Mon Language and Cultural School- Australia Mon Association Inc
Administration, language teaching aids and rent $2,580
Nepali Language School Contribution $1,000
Pakistan Australia Friendship Association
Administration and language teaching aids $1,780
Persian Language School Administration, language teaching aids and personal development
$2,780
Polish Language School in Phillip Administration, language teaching aids and IT support
$2,080
Serbian School Language teaching aids $1,000
Spielwelt German Parents Association
Language teaching aids and IT support $1,560
Sri Lanka Dhamma Vihara Association of Canberra Inc.
Insurance, language teaching aids and rent $2,480
St Nicholas Greek Language School
Language teaching aids and IT support $1,580
Standard Chinese School of Australia (SCSA)
Personal development, rent and IT support $1,880
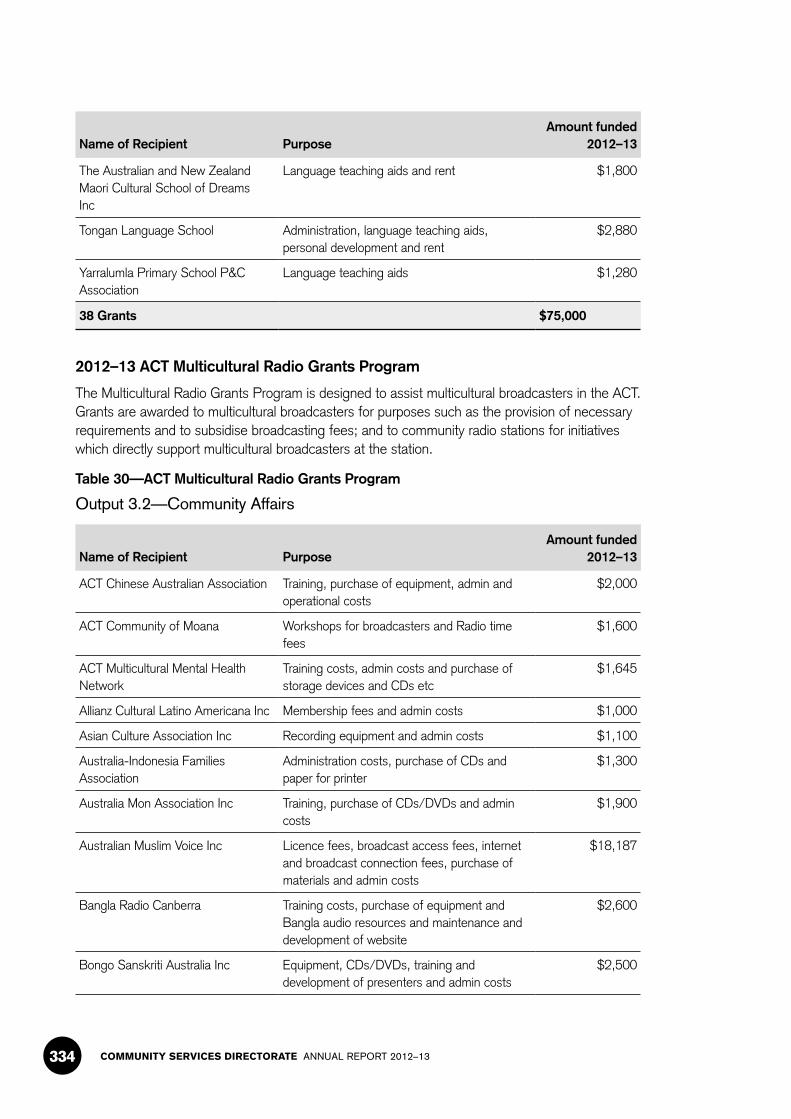
COMMUNITY SERVICES DIRECTORATE ANNUAL REPORT 2012–13334
Name of Recipient PurposeAmount funded
2012–13
The Australian and New Zealand Maori Cultural School of Dreams Inc
Language teaching aids and rent $1,800
Tongan Language School Administration, language teaching aids, personal development and rent
$2,880
Yarralumla Primary School P&C Association
Language teaching aids $1,280
38 Grants $75,000
2012–13 ACT Multicultural Radio Grants Program
The Multicultural Radio Grants Program is designed to assist multicultural broadcasters in the ACT. Grants are awarded to multicultural broadcasters for purposes such as the provision of necessary requirements and to subsidise broadcasting fees; and to community radio stations for initiatives which directly support multicultural broadcasters at the station.
Table 30—ACT Multicultural Radio Grants Program
Output 3.2—Community Affairs
Name of Recipient PurposeAmount funded
2012–13
ACT Chinese Australian Association Training, purchase of equipment, admin and operational costs
$2,000
ACT Community of Moana Workshops for broadcasters and Radio time fees
$1,600
ACT Multicultural Mental Health Network
Training costs, admin costs and purchase of storage devices and CDs etc
$1,645
Allianz Cultural Latino Americana Inc Membership fees and admin costs $1,000
Asian Culture Association Inc Recording equipment and admin costs $1,100
Australia-Indonesia Families Association
Administration costs, purchase of CDs and paper for printer
$1,300
Australia Mon Association Inc Training, purchase of CDs/DVDs and admin costs
$1,900
Australian Muslim Voice Inc Licence fees, broadcast access fees, internet and broadcast connection fees, purchase of materials and admin costs
$18,187
Bangla Radio Canberra Training costs, purchase of equipment and Bangla audio resources and maintenance and development of website
$2,600
Bongo Sanskriti Australia Inc Equipment, CDs/DVDs, training and development of presenters and admin costs
$2,500

SECTION F COMMUNITY GRANTS — PARTNERSHIPS — ASISTANCE — SPONSORSHIPS 335
Name of Recipient PurposeAmount funded
2012–13
Bosnian and Herzegovinian Association
Internet costs, purchase of headphones, CDs, newspapers and books
$1,730
Canberra Ethnic Broadcasters Association Inc
Membership and broadcasting fees; and purchase of CDs / DVDs
$1,300
Canberra Multicultural Community Forum
Membership and subscription fees, training for new broadcasters and purchase of new tape recorder with playback sound
$2,200
Canberra Tamil Association Inc Membership fees, training and purchase of media storage devices
$2,100
Canberra Spanish Speaking Community Radio Inc
Membership fees, purchase of headphones, CDs/DVDs
$1,900
Canberra Swiss Club Purchase of headphones, CDs, storage material, newspapers and internet costs
$1,900
Community Radio 2XX Inc Station broadcast fees and training for program presenters
$24,580
Cyprus Radio Internet costs, purchase of CDs, books and newspapers, software
$2,000
Ethnic Broadcasters Council CMS Radio
Training and workshops for broadcasters of station
$9,330
Greek Orthodox Community and Church of Canberra and District
Internet costs and purchase of CDs and administration costs
$1,900
Hellenic Radio Internet costs, purchase of CDs, books and newspapers, software
$2,000
Hindi Samaj of Canberra Inc Staff development costs and purchase of equipment and CDs/DVDs, stationery
$2,500
Macedonian Community Radio ACT Internet costs, purchase of microphone, stationery, printer cartridges and CDs/DVDs
$2,500
Pakistan Cultural Association Internet costs, purchase of equipment and other costs
$1,700
Pakistan Australia Friendship Association
Admin costs, purchase of equipment, training and website costs
$2,800
Radio CIC Ramadan Professional development of presenters, Valley FM membership and headphones
$2,200
Radyo Filipino Canberra Inc Administration costs and website development $1,500
Samoa Community Training costs and purchase of headphones, CDs, books
$2,000
Serbian Radio Program, Lets Be Friends, Inc
Purchase of CDs, stationery, newspapers and internet costs
$1,900
Sinhala Cultural Association of Australia Inc
Purchase of Microsoft Surface, microphone FM and audio system to convert cassettes to CDs
$2,000

COMMUNITY SERVICES DIRECTORATE ANNUAL REPORT 2012–13336
Name of Recipient PurposeAmount funded
2012–13
Thai Media and Cultural Association of Canberra Inc
Expenses relating to training internet, equipment and CDs
$2,600
The Canberra Seniors Centre Inc (Turner)
Internet costs, purchase of audio equipment, CDs/DVDs and administration costs
$2,000
Tongan Association of Canberra and Queanbeyan
Training of broadcasters and technicians, purchase of music materials and pay for Internet and administration costs
$2,500
VBC Radio Training and Internet costs, purchase of headphones, podcast microphone and CDs etc
$2,500
34 Grants $113,472
2012–13 ACT Multicultural Grants Program
The aim of the ACT Multicultural Grants Program is to enhance the ACT Community through the development of innovative projects that contribute to sustainable communities by highlighting and promoting cultural diversity and social harmony.
The objective of the ACT Multicultural Grants Program is to assist community organisation in
> developing initiatives that will advance multiculturalism in the ACT
> promoting the ACT as a socially cohesive and harmonious community
> fostering opportunities for community groups to maintain, develop and express their cultural diversity
Table 31—ACT Multicultural Grants Program
Output 3.2—Community Affairs
Name of Recipient PurposeAmount funded
2012–13
ACT Bilingual Education Alliance A language stall at the 2013 National Multicultural Festival and production of newsletters
$1,000
ACT Chinese Australian Association Inc
Ring of Friends project, an initiative to bring together new migrants mostly who are aged over fifty
$500
ACT Chinese Australian Association Inc
25UP—Year of Celebration project, to mark the 25th Anniversary of ACT Chinese Australian Association Inc, including participation in the 2013 National Multicultural Festival and Centenary year celebrations
$1,000
ACT Chinese Women Cultural Association Inc
The production of the Association’s newsletter $500
ACT Football Federation (Capital Football)
Training and capacity building for youth and funding for transportation, promotion, equipment and administration costs
$2,000

SECTION F COMMUNITY GRANTS — PARTNERSHIPS — ASISTANCE — SPONSORSHIPS 337
Name of Recipient PurposeAmount funded
2012–13
ACT Hazara Community Promote and conduct cultural events of significance to the Hazara Community
$1,000
ACT Maori Performing Arts Inc Participation in the 2013 National Multicultural Festival and purchase of musical instruments
$1,000
ACT Pacific Islands United Council
Develop the talents of Oceania Pacific Islander Youth in performing arts and participation in the 2013 National Multicultural Festival
$1,500
ACT Pacific Islands United Council (Pacific Islands Student Support Unit)
Engage young students with Pacific Island Heritage in Canberra and Queanbeyan
$1,500
ACT Russian Ethnic Association Inc
Participation in the 2013 National Multicultural Festival and purchase of costumes
$1,000
ACT Tibetan Community Inc Losar, Tibetan New Year 2013 Celebrations $1,000
Adria Village Ltd Translation of newsletters from English to Croatian
$500
ANU Student Equity My Story project $1,000
Association for Learning Mandarin in Australia Inc (ALMA)
Newsletter production and website costs, and to participate in the 2013 National Multicultural Festival
$1,000
Aussie Forum Inc. Forums on ACT Elections, Multiculturalism and Indigenous Australians—closing the gap and to celebrate the centenary of Canberra
$2,500
Australia Bhutan Association of Canberra
Showcase Bhutanese culture and tradition $1,000
Australia China Friendship Society, ACT Branch, Inc
Chinese Lantern Festival$1,000
Australia Mon Association Invite two Mon professional cultural dance teachers in preparation for the 2013 National Multicultural Festival and to cover associated costs
$2,000
Australia Sri Lanka Buddhist Association of Canberra Inc
Cultural programs and participation in the 2013 National Multicultural Festival
$1,000
Australian and New Zealand Maori Cultural School of Dreams
Junior members to perform at the 2013 National Multicultural Festival
$1,000
Australian Chinese Culture Exchange and Promotion Association
Participate in and perform in the 2013 National Multicultural Festival and Canberra Centenary Celebrations
$1,000
Australian Chinese Culture Exchange and Promotion Association
Chinese Art Exhibition at the 2013 National Multicultural Festival
$500
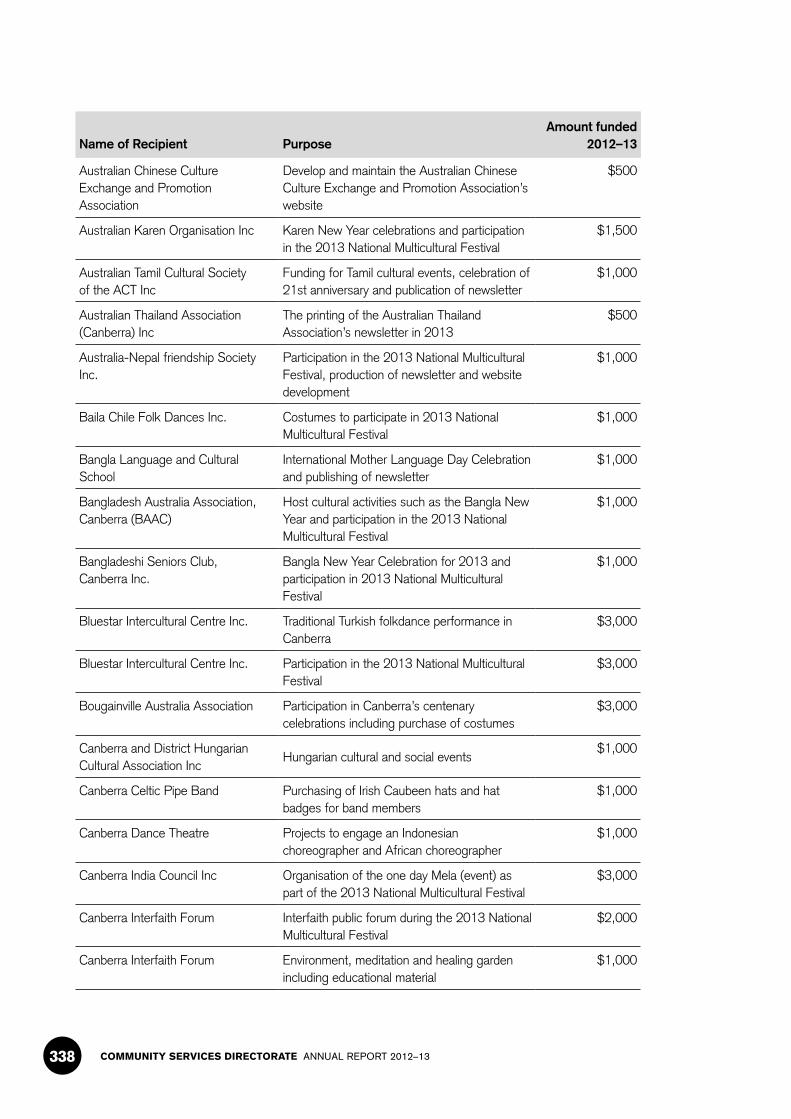
COMMUNITY SERVICES DIRECTORATE ANNUAL REPORT 2012–13338
Name of Recipient PurposeAmount funded
2012–13
Australian Chinese Culture Exchange and Promotion Association
Develop and maintain the Australian Chinese Culture Exchange and Promotion Association’s website
$500
Australian Karen Organisation Inc Karen New Year celebrations and participation in the 2013 National Multicultural Festival
$1,500
Australian Tamil Cultural Society of the ACT Inc
Funding for Tamil cultural events, celebration of 21st anniversary and publication of newsletter
$1,000
Australian Thailand Association (Canberra) Inc
The printing of the Australian Thailand Association’s newsletter in 2013
$500
Australia-Nepal friendship Society Inc.
Participation in the 2013 National Multicultural Festival, production of newsletter and website development
$1,000
Baila Chile Folk Dances Inc. Costumes to participate in 2013 National Multicultural Festival
$1,000
Bangla Language and Cultural School
International Mother Language Day Celebration and publishing of newsletter
$1,000
Bangladesh Australia Association, Canberra (BAAC)
Host cultural activities such as the Bangla New Year and participation in the 2013 National Multicultural Festival
$1,000
Bangladeshi Seniors Club, Canberra Inc.
Bangla New Year Celebration for 2013 and participation in 2013 National Multicultural Festival
$1,000
Bluestar Intercultural Centre Inc. Traditional Turkish folkdance performance in Canberra
$3,000
Bluestar Intercultural Centre Inc. Participation in the 2013 National Multicultural Festival
$3,000
Bougainville Australia Association Participation in Canberra’s centenary celebrations including purchase of costumes
$3,000
Canberra and District Hungarian Cultural Association Inc
Hungarian cultural and social events$1,000
Canberra Celtic Pipe Band Purchasing of Irish Caubeen hats and hat badges for band members
$1,000
Canberra Dance Theatre Projects to engage an Indonesian choreographer and African choreographer
$1,000
Canberra India Council Inc Organisation of the one day Mela (event) as part of the 2013 National Multicultural Festival
$3,000
Canberra Interfaith Forum Interfaith public forum during the 2013 National Multicultural Festival
$2,000
Canberra Interfaith Forum Environment, meditation and healing garden including educational material
$1,000
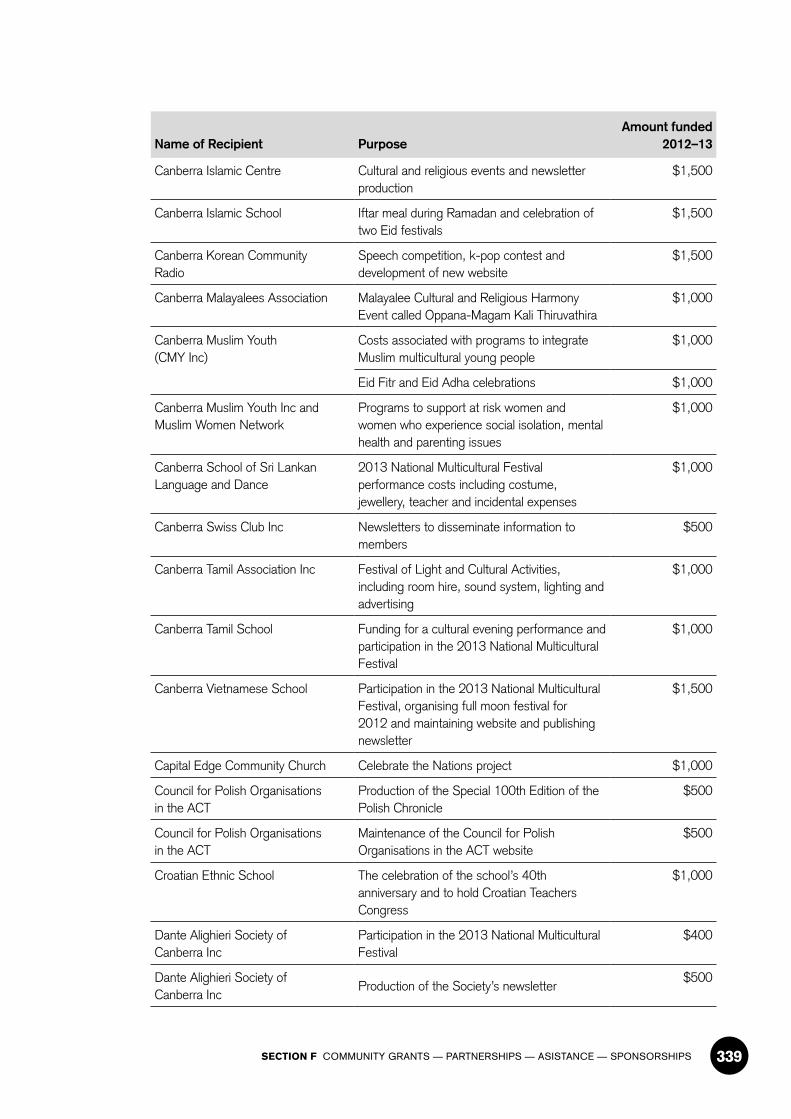
SECTION F COMMUNITY GRANTS — PARTNERSHIPS — ASISTANCE — SPONSORSHIPS 339
Name of Recipient PurposeAmount funded
2012–13
Canberra Islamic Centre Cultural and religious events and newsletter production
$1,500
Canberra Islamic School Iftar meal during Ramadan and celebration of two Eid festivals
$1,500
Canberra Korean Community Radio
Speech competition, k-pop contest and development of new website
$1,500
Canberra Malayalees Association Malayalee Cultural and Religious Harmony Event called Oppana-Magam Kali Thiruvathira
$1,000
Canberra Muslim Youth (CMY Inc)
Costs associated with programs to integrate Muslim multicultural young people
$1,000
Eid Fitr and Eid Adha celebrations $1,000
Canberra Muslim Youth Inc and Muslim Women Network
Programs to support at risk women and women who experience social isolation, mental health and parenting issues
$1,000
Canberra School of Sri Lankan Language and Dance
2013 National Multicultural Festival performance costs including costume, jewellery, teacher and incidental expenses
$1,000
Canberra Swiss Club Inc Newsletters to disseminate information to members
$500
Canberra Tamil Association Inc Festival of Light and Cultural Activities, including room hire, sound system, lighting and advertising
$1,000
Canberra Tamil School Funding for a cultural evening performance and participation in the 2013 National Multicultural Festival
$1,000
Canberra Vietnamese School Participation in the 2013 National Multicultural Festival, organising full moon festival for 2012 and maintaining website and publishing newsletter
$1,500
Capital Edge Community Church Celebrate the Nations project $1,000
Council for Polish Organisations in the ACT
Production of the Special 100th Edition of the Polish Chronicle
$500
Council for Polish Organisations in the ACT
Maintenance of the Council for Polish Organisations in the ACT website
$500
Croatian Ethnic School The celebration of the school’s 40th anniversary and to hold Croatian Teachers Congress
$1,000
Dante Alighieri Society of Canberra Inc
Participation in the 2013 National Multicultural Festival
$400
Dante Alighieri Society of Canberra Inc
Production of the Society’s newsletter$500
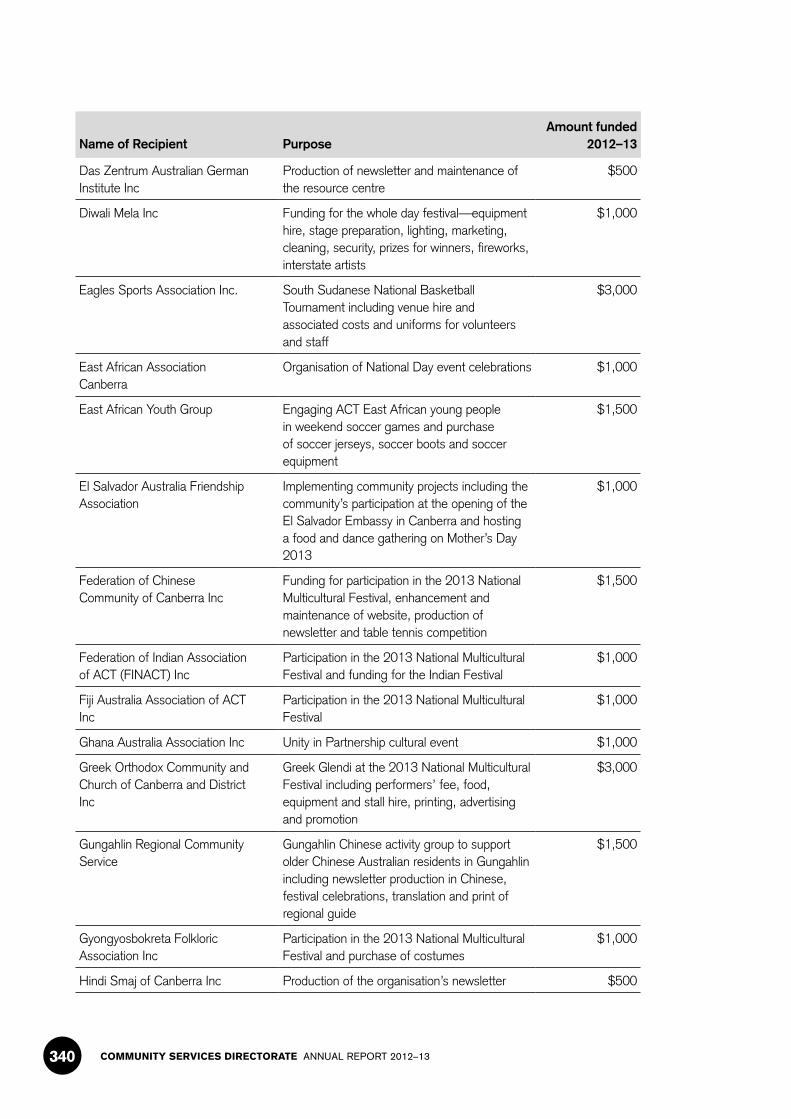
COMMUNITY SERVICES DIRECTORATE ANNUAL REPORT 2012–13340
Name of Recipient PurposeAmount funded
2012–13
Das Zentrum Australian German Institute Inc
Production of newsletter and maintenance of the resource centre
$500
Diwali Mela Inc Funding for the whole day festival—equipment hire, stage preparation, lighting, marketing, cleaning, security, prizes for winners, fireworks, interstate artists
$1,000
Eagles Sports Association Inc. South Sudanese National Basketball Tournament including venue hire and associated costs and uniforms for volunteers and staff
$3,000
East African Association Canberra
Organisation of National Day event celebrations $1,000
East African Youth Group Engaging ACT East African young people in weekend soccer games and purchase of soccer jerseys, soccer boots and soccer equipment
$1,500
El Salvador Australia Friendship Association
Implementing community projects including the community’s participation at the opening of the El Salvador Embassy in Canberra and hosting a food and dance gathering on Mother’s Day 2013
$1,000
Federation of Chinese Community of Canberra Inc
Funding for participation in the 2013 National Multicultural Festival, enhancement and maintenance of website, production of newsletter and table tennis competition
$1,500
Federation of Indian Association of ACT (FINACT) Inc
Participation in the 2013 National Multicultural Festival and funding for the Indian Festival
$1,000
Fiji Australia Association of ACT Inc
Participation in the 2013 National Multicultural Festival
$1,000
Ghana Australia Association Inc Unity in Partnership cultural event $1,000
Greek Orthodox Community and Church of Canberra and District Inc
Greek Glendi at the 2013 National Multicultural Festival including performers’ fee, food, equipment and stall hire, printing, advertising and promotion
$3,000
Gungahlin Regional Community Service
Gungahlin Chinese activity group to support older Chinese Australian residents in Gungahlin including newsletter production in Chinese, festival celebrations, translation and print of regional guide
$1,500
Gyongyosbokreta Folkloric Association Inc
Participation in the 2013 National Multicultural Festival and purchase of costumes
$1,000
Hindi Smaj of Canberra Inc Production of the organisation’s newsletter $500
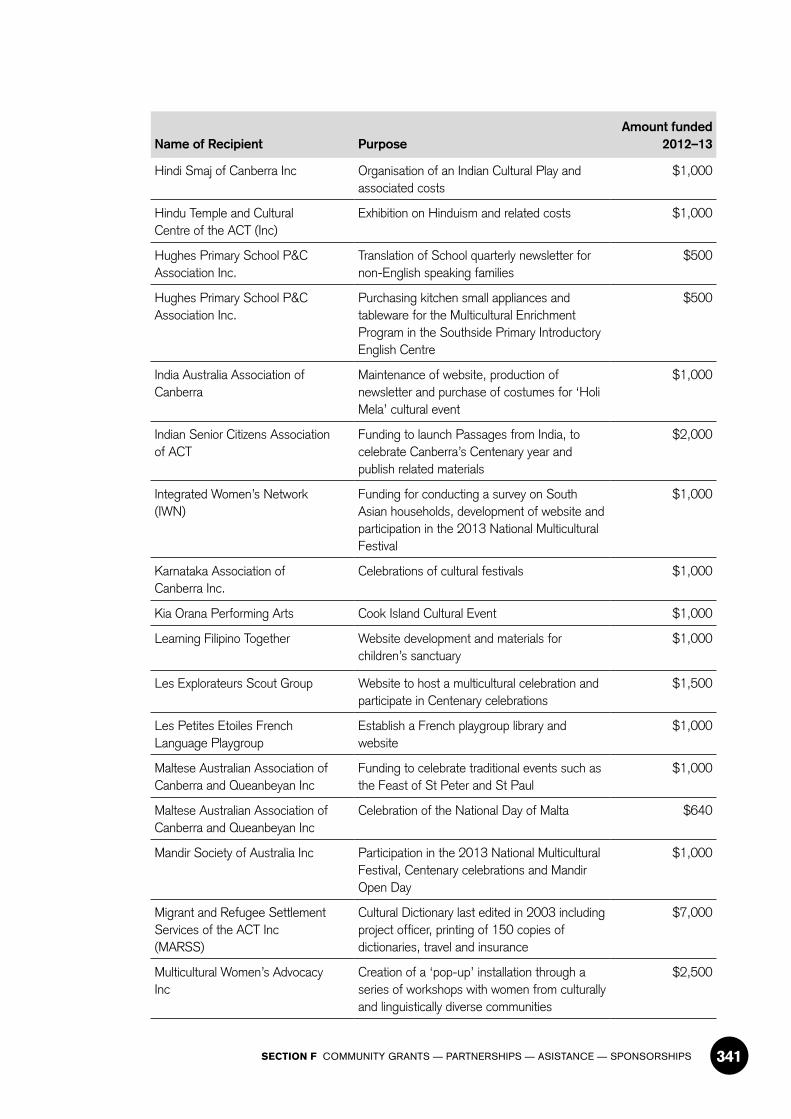
SECTION F COMMUNITY GRANTS — PARTNERSHIPS — ASISTANCE — SPONSORSHIPS 341
Name of Recipient PurposeAmount funded
2012–13
Hindi Smaj of Canberra Inc Organisation of an Indian Cultural Play and associated costs
$1,000
Hindu Temple and Cultural Centre of the ACT (Inc)
Exhibition on Hinduism and related costs $1,000
Hughes Primary School P&C Association Inc.
Translation of School quarterly newsletter for non-English speaking families
$500
Hughes Primary School P&C Association Inc.
Purchasing kitchen small appliances and tableware for the Multicultural Enrichment Program in the Southside Primary Introductory English Centre
$500
India Australia Association of Canberra
Maintenance of website, production of newsletter and purchase of costumes for ‘Holi Mela’ cultural event
$1,000
Indian Senior Citizens Association of ACT
Funding to launch Passages from India, to celebrate Canberra’s Centenary year and publish related materials
$2,000
Integrated Women’s Network (IWN)
Funding for conducting a survey on South Asian households, development of website and participation in the 2013 National Multicultural Festival
$1,000
Karnataka Association of Canberra Inc.
Celebrations of cultural festivals $1,000
Kia Orana Performing Arts Cook Island Cultural Event $1,000
Learning Filipino Together Website development and materials for children’s sanctuary
$1,000
Les Explorateurs Scout Group Website to host a multicultural celebration and participate in Centenary celebrations
$1,500
Les Petites Etoiles French Language Playgroup
Establish a French playgroup library and website
$1,000
Maltese Australian Association of Canberra and Queanbeyan Inc
Funding to celebrate traditional events such as the Feast of St Peter and St Paul
$1,000
Maltese Australian Association of Canberra and Queanbeyan Inc
Celebration of the National Day of Malta $640
Mandir Society of Australia Inc Participation in the 2013 National Multicultural Festival, Centenary celebrations and Mandir Open Day
$1,000
Migrant and Refugee Settlement Services of the ACT Inc (MARSS)
Cultural Dictionary last edited in 2003 including project officer, printing of 150 copies of dictionaries, travel and insurance
$7,000
Multicultural Women’s Advocacy Inc
Creation of a ‘pop-up’ installation through a series of workshops with women from culturally and linguistically diverse communities
$2,500

COMMUNITY SERVICES DIRECTORATE ANNUAL REPORT 2012–13342
Name of Recipient PurposeAmount funded
2012–13
National Ethnic Disability Alliance (NEDA)
Funding for further development of the NEDA website
$500
Olive Branch Participation in the 2013 National Multicultural Festival and production of a booklet outlining stories of refugees in Canberra
$1,000
OriOZ Inc. Participation in the 2013 National Multicultural Festival and production of annual newsletter
$1,000
Pakistan Australia Friendship Association
Participation in the 2013 National Multicultural Festival and Centenary Celebrations with cultural programs
$1,000
Pakistan Cultural Association (PCA) Inc
Cultural celebrations and participation in the 2013 National Multicultural Festival
$1,000
Pakistan Cultural Association (PCA) Inc
Production of newsletter publications $500
Peace and Harmony Association of Canberra (PHAC) Inc
Lectures on Ramadan including five pillars of Islam, cultural programs and counselling services
$1,000
Pearl of the Pacific Samoan Cultural and Dance Group Inc.
A fete to celebrate Samoan Independence Day $1,000
Philippine Australian Association of the ACT and Monaro Region Inc
Philippine Heritage Day $800
Production of the Association’s newsletter $500
Musical resources for the choir $500
Rotuman Community in ACT Workshops and sessions on various traditional ceremonies, art and craft; and celebration of National Day
$1,000
Royal Commonwealth Society Commonwealth Day, Multicultural and Multi-Faith Celebrations
$1,000
Samoa Community in Canberra and Queanbeyan
Participation in the 2013 National Multicultural Festival 2013 including costs for a drama production
$1,000
Saudi Students Society Women and children’s Eid celebrations including marquees, food, gifts, promotion and recording
$3,000
Scandinavian Australian Association Ltd
Participation in Canberra’s centenary celebrations and to mark the 50 Anniversary of the Association
$1,000
Sene Canberra Inc Participation in the 2013 National Multicultural Festival and Centenary Celebrations including purchase of costumes and administration costs
$3,000

SECTION F COMMUNITY GRANTS — PARTNERSHIPS — ASISTANCE — SPONSORSHIPS 343
Name of Recipient PurposeAmount funded
2012–13
Sierra Leone Community Sierra Leone Drumming Therapy Program for engaging families and young people from refugee backgrounds including the costs for drums, costumes, hall hire, trainer, interstate dancers and transport
$7,000
Sol De Espana Costumes and participation in the 2013 National Multicultural Festival
$1,000
Spielwelt German Parents Association Inc
Traditional German Cultural Event in 2013 $844
Sri Lanka Dhamma ViharaCelebration of Sri Lankan New Year and organisation of a Buddhist function
$1,000
St John the Baptist Russian Orthodox Church School
Participation in the 2013 National Multicultural Festival and purchase of costumes
$1,000
Standard Chinese School of Australia (SCSA) Inc
Celebration of 10th Anniversary of the Chinese School in Canberra
$1,000
Support Asian Women’s Friendship Association Inc
Chinese Art and Music Exchange program $1,000
Telugu Association of Canberra Production of newsletters and participation in the 2013 National Multicultural Festival
$1,000
The Association of the Aged Free Vietnamese in the ACT and Surrounding Areas Inc
Vietnamese Seniors’ quarterly newsletters $500
Participation and performance, in the 2013 National Multicultural Festival
$1,000
The Australian Anglo-Indian Association of Canberra
Annual Ball and India in the Park events $1,000
The Australian National Eisteddfod Inc.
Provision of two prizes for the ACT Multicultural and Community Choirs including costumes
$2,000
The Bengali Cultural Association of Canberra Inc
Cultural programs and participation in the 2013 National Multicultural Festival
$1,000
The Canberra Academy of Cantonese Opera Inc.
Training Cantonese opera performers$500
The Federation of Chinese Associations of ACT (FCA-ACT) Inc
Chinese New Year Spring Festival event showcasing Chinese art and culture and associated costs
$5,000
The General Delegation of Palestine to Australia, New Zealand and the Pacific
Deke Dance Troop to perform in the 2013 National Multicultural Festival
$1,000
The Lao Association ACT Inc Development of the Lao Dance group including cost for lessons and costumes
$1,000
The Multicultural Group Participation in the 2013 National Multicultural Festival and production of newsletter
$1,000

COMMUNITY SERVICES DIRECTORATE ANNUAL REPORT 2012–13344
Name of Recipient PurposeAmount funded
2012–13
The Polish Playgroup ‘Krasnoludki’
Purchasing of new learning materials and the expansion of the ACT Polish Children’s Library and ACT Polish Children’s Folk Dancing Group
$1,000
Tongan Association of Canberra and Queanbeyan
Participation in the 2013 National Multicultural Festival including costs for costumes
$1,000
Vietnamese Catholic Community in Canberra
Participation in the 2013 National Multicultural Festival and celebration of Vietnamese New Year
$1,000
Yarralumla Primary School P&C Association Inc
Connecting older bilingual Italian community members with young learners through reading / writing assistance, games, discussion of life in Italy
$1,000
Young at Heart Seniors Group (Capital Edge Community Church Inc)
Culturally and linguistically diverse seniors group projects
$1,700
Zimbabwe Canberra Cultural Association
Hosting the 2013 Australian Zim-Pride Soccer Tournament and Fringe Food and Cultural events
$1,000
126 Grants $164,884
2012–13 Aboriginal and Torres Strait Islander Small (Cultural) Grants Program
The aim of the Aboriginal and Torres Strait Islander Small (Cultural) Grants Program is to showcase the cultural of Aboriginal and Torres Strait Islander people living in the ACT community through the development of innovative projects that contribute to sustainable communities by highlighting the promoting cultural diversity and social harmony.
Table 32—Aboriginal and Torres Strait Islander Cultural Grants
Output 3.2—Community Affairs
Name of Recipient PurposeAmount funded
2012–13
Belconnen Arts Centre Showcase the artistic and cultural contribution of Mr Kevin Gilbert (1933–1993), as well-known Canberra identity
$7,000
Burrunju Aboriginal Corporation Showcase Aboriginal and Torres Strait Islander cultures as part of the Indigenous Program for the 2013 Canberra Centenary Year celebrations
$15,370
Canberra and District NAIDOC Week Committee
Showcase Indigenous talent on 9–10 February 2013 as part of the National Multicultural Festival
$14,500

SECTION F COMMUNITY GRANTS — PARTNERSHIPS — ASISTANCE — SPONSORSHIPS 345
Name of Recipient PurposeAmount funded
2012–13
Hughes Primary School Wiradjuri Echoes project to guide the Indigenous and non-Indigenous students in Aboriginal and Torres Strait Islander culture during 2013 NAIDOC Week
$4,544
Lyneham High School Two night camp for 25 Aboriginal and Torres Strait Islander students and participates in a range of Aboriginal activities within the Jervis Bay area
$8,150
Us Mob Writing Compile and produce a collection of poetry and prose for publication and distribution from the written works of Us Mob Writing Group members during 2012–13
$5,436
Wanniassa School Establish a bush tucker garden and set up an exchange with a NSW school to learn about the culture and heritage of each other’s local Aboriginal population.
$5,000
7 Grants TOTAL $60,000
2012–13 Aboriginal and Torres Strait Islander Leadership Grants Program
The aim of the program is to provide funding support to Aboriginal and Torres Strait Islander people for leadership training for both formal and informal development opportunities for participants.
Table 33—Aboriginal and Torres Strait Islander Leadership Grants Program
Output 3.2—Community Affairs
Name of Recipient PurposeAmount funded
2012–13
Australian Indigenous Leadership Centre
Opportunities for 25 local young people (aged 18–30) through an Introduction to Indigenous Leadership program
$39,637
Petersen, Fiona Support to undertake a Master of Business Administration at either Harvard Business School, Oxford Said Business School or Cambridge Judge Business School
$2,163
Solid Young Fulla’s Aboriginal Corporation
Take five mentors on a leadership learning journey to Bawaka, Northern Territory
$18,200
3 Grants Total $60,000

COMMUNITY SERVICES DIRECTORATE ANNUAL REPORT 2012–13346
Output 3.3: Arts Policy, Advice and Programs
2012–13 artsACT
The ACT Government provides funding directly to the arts through the ACT Arts Fund. The ACT arts Fund is open to all members of the ACT Community and focuses on projects and programs that develop the arts. The Fund supports all art forms, including dance, digital/ new media arts, film, literature, multi-arts, music, theatre and visual arts. The Fund supports the full spectrum of the arts, from community arts to the fine arts, individual artists as well as groups and organisations. The Fund has a number of categories including Key Art Organisation, Program, Projects, Communities Working with Artists, Creative Arts Fellowships, Out of Round, Start-Up Grants the ACT Poetry Prize and the ACT book of the Year Award.
Table 34—ACT Arts Fund—Key Arts Organisation Funding
Output 3.3—Arts Policy, Advice and Programs
Name of Recipient PurposeAmount funded
2012–13
ACT Writers Centre Inc Literature programs and services $132,750
Art Sound FM Inc Broadcasting, recording and editing services $64,750
Ausdance ACT Inc Dance program and services $120,800
Belconnen Arts Centre Inc Community Cultural Inclusion Program $151,300
Canberra Contemporary Art Space Inc
A range of visual art programs and exhibitions $171,700
Canberra Potters Society Inc A range of ceramic programs and exhibitions, and manage the Watson Arts Centre
$38,000
Canberra Symphony Orchestra Inc A range of orchestral concerts $300,750
Canberra Youth Music Inc A range of youth music programs $143,250
Canberra Youth Theatre Company Inc
A range of youth theatre programs and workshops
$221,542
Craft ACT Inc A range of visual art programs and exhibitions $186,350
Gorman House Arts Centre Inc Community Cultural Inclusion Program and managing the Ainslie and Gorman House Arts Centres
$261,150
Jigsaw Theatre Company Inc A range of theatre productions for young audiences
$184,750
Megalo Access Arts Inc A range of visual art programs and exhibitions $258,350
Music For Everyone Inc A range of music programs for all abilities $135,750
Photo Access Inc A range of visual art programs and exhibitions, and to manage the Manuka Arts Centre
$150,500
QL2 Centre for Youth Dance Inc A range of youth dance programs and services $290,500
The Stagemaster Inc A range of performing arts programs and manage The Street Theatre
$737,500

SECTION F COMMUNITY GRANTS — PARTNERSHIPS — ASISTANCE — SPONSORSHIPS 347
Name of Recipient PurposeAmount funded
2012–13
Tuggeranong Community Arts Association Inc
A range of community arts programs and exhibitions including the Community Cultural Inclusion Program and to manage the Tuggeranong Arts Centre
$480,750
Warehouse Circus Inc A range of youth physical theatre programs $70,150
19 Grants $4,100,592
Table 35—ACT Arts Fund—Project Funding
Output 3.3—Arts Policy, Advice and Programs
Name of Recipient PurposeAmount funded
2012–13
Art Monthly Australia Produce Art Monthly Australia including a special Canberra Centennial issue
$20,000
Art Song Canberra Inc Presentation of seven vocal recitals $6,645
Asialink Facilitate Arts Residency Grants to Asia for ACT practitioners
$20,000
Basketry ACT Facilitate artist participation in the Canberra 2013 Basketry Gathering
$7,600
Batchelor, James Present a dance and film installation $8,140
Boho Interactive Stage an original theatrical production as part of the Centenary of Canberra
$23,789
Buining, Philippa Create and produce a new work of theatre entitled Anthology
$40,000
Costello, David Mount an exhibition $3,280
Curham, Louise Develop an expanded cinema re-enactment based on 1970s work by artist Malcolm Le Grice
$7,348
Curtis, Matthew Produce a specialised glass melting pot furnace for contemporary colour application techniques
$5,000
Dunstan, Kaylia Manuscript appraisal and mentorship for an unpublished manuscript
$2,340
Foster, Cara Produce three issues of a creative writing journal
$4,218
France, Sandra Present a semi-staged, fully orchestrated performance of a new opera, From a Black Sky
$37,000
Heath, Jack Edit a book $9,808
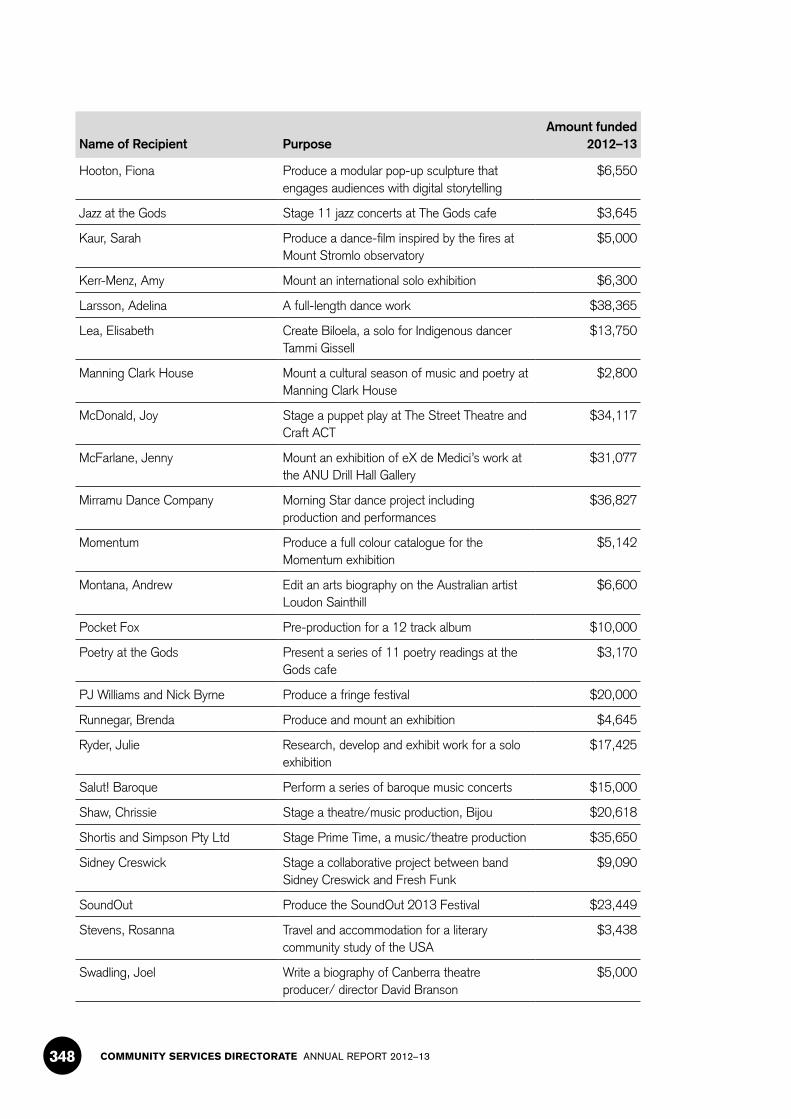
COMMUNITY SERVICES DIRECTORATE ANNUAL REPORT 2012–13348
Name of Recipient PurposeAmount funded
2012–13
Hooton, Fiona Produce a modular pop-up sculpture that engages audiences with digital storytelling
$6,550
Jazz at the Gods Stage 11 jazz concerts at The Gods cafe $3,645
Kaur, Sarah Produce a dance-film inspired by the fires at Mount Stromlo observatory
$5,000
Kerr-Menz, Amy Mount an international solo exhibition $6,300
Larsson, Adelina A full-length dance work $38,365
Lea, Elisabeth Create Biloela, a solo for Indigenous dancer Tammi Gissell
$13,750
Manning Clark House Mount a cultural season of music and poetry at Manning Clark House
$2,800
McDonald, Joy Stage a puppet play at The Street Theatre and Craft ACT
$34,117
McFarlane, Jenny Mount an exhibition of eX de Medici’s work at the ANU Drill Hall Gallery
$31,077
Mirramu Dance Company Morning Star dance project including production and performances
$36,827
Momentum Produce a full colour catalogue for the Momentum exhibition
$5,142
Montana, Andrew Edit an arts biography on the Australian artist Loudon Sainthill
$6,600
Pocket Fox Pre-production for a 12 track album $10,000
Poetry at the Gods Present a series of 11 poetry readings at the Gods cafe
$3,170
PJ Williams and Nick Byrne Produce a fringe festival $20,000
Runnegar, Brenda Produce and mount an exhibition $4,645
Ryder, Julie Research, develop and exhibit work for a solo exhibition
$17,425
Salut! Baroque Perform a series of baroque music concerts $15,000
Shaw, Chrissie Stage a theatre/music production, Bijou $20,618
Shortis and Simpson Pty Ltd Stage Prime Time, a music/theatre production $35,650
Sidney Creswick Stage a collaborative project between band Sidney Creswick and Fresh Funk
$9,090
SoundOut Produce the SoundOut 2013 Festival $23,449
Stevens, Rosanna Travel and accommodation for a literary community study of the USA
$3,438
Swadling, Joel Write a biography of Canberra theatre producer/ director David Branson
$5,000

SECTION F COMMUNITY GRANTS — PARTNERSHIPS — ASISTANCE — SPONSORSHIPS 349
Name of Recipient PurposeAmount funded
2012–13
The Griffyn Ensemble Collaboration of Swedish-Australian music cultural exchange
$14,959
Todo, Kensuke Creation of new work $12,912
Tunks, Benita Mount an exhibition and produce a printed catalogue
$14,867
Wilson, Steph Create a body of work and mount an exhibition $2,545
Wodak, Josh Produce and stage a photography exhibition at PhotoAccess Gallery
$3,130
You Are Here Festival Professional development for three emerging producers
$12,930
44 Grants $614,169
Table 36—ACT Arts Fund—Out Of Round Funding
Output 3.3—Arts Policy, Advice and Programs
Name of Recipient PurposeAmount funded
2012–13
Australian Performing Arts Association
Twenty-one ACT artists attending the 2013 APACA conference
$15,225
Aitkin, Antonia Two artist residency opportunities in Tasmania $1,809
Chaseling, Scott Exhibit and attend an artist in residency in the USA
$2,000
Halestorm Music Collaboration with Corey Woods $2,000
Gibson, Emma Attend the 9th Women Playwrights International Conference $2,000
Laudenbach, Cathy Travel and accommodation for the Broken Hill Art Exchange $800
Lea, Liz Attend the Australian Performing Arts Market $1,398
Loebenstein, Elaine Participate in the Rocks Pop Up arts initiative in Sydney $2,000
Musa, Omar Attend spoken word poetry festival in Malaysia $935
Meaney, Dr Janet Participate in a performance art festival in Estonia, Finland and France $2,000
Smith, Duncan Creating works for an exhibition $2,000
Smith, Fred Attend the Australian Performing Arts Market $1,081
Worrall, Dr David Present work in three European centres $2,000
13 Grants $35,248

COMMUNITY SERVICES DIRECTORATE ANNUAL REPORT 2012–13350
Table 37—ACT Creative Arts Fellowship
Output 3.3—Arts Policy, Advice and Programs
Name of Recipient PurposeAmount funded
2012–13
Kirk, Valerie Creative Arts Fellow to produce a centenary tapestry
$45,000
1 Grant $45,000
Table 38—Start-Up Funding
Output 3.3—Arts Policy, Advice and Programs
Name of Recipient PurposeAmount funded
2012–13
Bosshard, Elia Purchase music scores $500
Capezio, Oscar Purchase materials for artwork and its presentation
$500
Chan, Sebastian Hire equipment, purchase materials and promotion of a film
$500
Gryglewski, Melissa Hire a rehearsal space and printing promotional material
$500
Jackson, William Commission, promotion and equipment hire of a performance installation
$500
Lole, Rachel Equipment purchase and mixing and mastering of a live performance
$500
van Os-Schmitt, Emilie Produce an animation for Tropfest $500
Whitton, Rebecca Materials, advertising, and venue hire for an album launch
$500
8 Grants $4,000
Table 39—Australian National University—Community Outreach Program
Output 3.3—Arts Policy, Advice and Programs
Name of Recipient PurposeAmount funded
2012–13
Australian National University Deliver a range of music and visual art community access programs
$1,481,000
Australian National Eisteddfod Society Inc
Hire Llewellyn Hall $11,969
Canberra Area Theatre Awards Inc Hire Llewellyn Hall $14,165
Canberra Youth Music Inc Hire Llewellyn Hall $33,336
Canberra Symphony Orchestra Inc Hire Llewellyn Hall $100,000
5 Grants $1,640,470
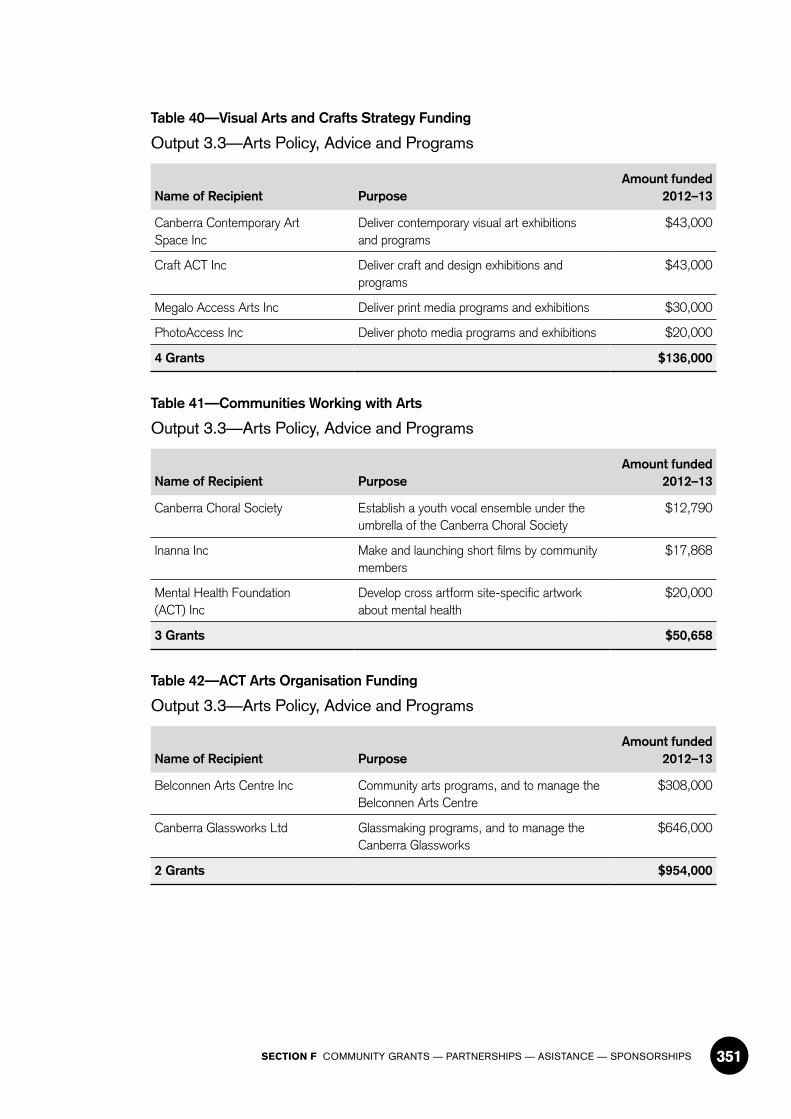
SECTION F COMMUNITY GRANTS — PARTNERSHIPS — ASISTANCE — SPONSORSHIPS 351
Table 40—Visual Arts and Crafts Strategy Funding
Output 3.3—Arts Policy, Advice and Programs
Name of Recipient PurposeAmount funded
2012–13
Canberra Contemporary Art Space Inc
Deliver contemporary visual art exhibitions and programs
$43,000
Craft ACT Inc Deliver craft and design exhibitions and programs
$43,000
Megalo Access Arts Inc Deliver print media programs and exhibitions $30,000
PhotoAccess Inc Deliver photo media programs and exhibitions $20,000
4 Grants $136,000
Table 41—Communities Working with Arts
Output 3.3—Arts Policy, Advice and Programs
Name of Recipient PurposeAmount funded
2012–13
Canberra Choral Society Establish a youth vocal ensemble under the umbrella of the Canberra Choral Society
$12,790
Inanna Inc Make and launching short films by community members
$17,868
Mental Health Foundation (ACT) Inc
Develop cross artform site-specific artwork about mental health
$20,000
3 Grants $50,658
Table 42—ACT Arts Organisation Funding
Output 3.3—Arts Policy, Advice and Programs
Name of Recipient PurposeAmount funded
2012–13
Belconnen Arts Centre Inc Community arts programs, and to manage the Belconnen Arts Centre
$308,000
Canberra Glassworks Ltd Glassmaking programs, and to manage the Canberra Glassworks
$646,000
2 Grants $954,000
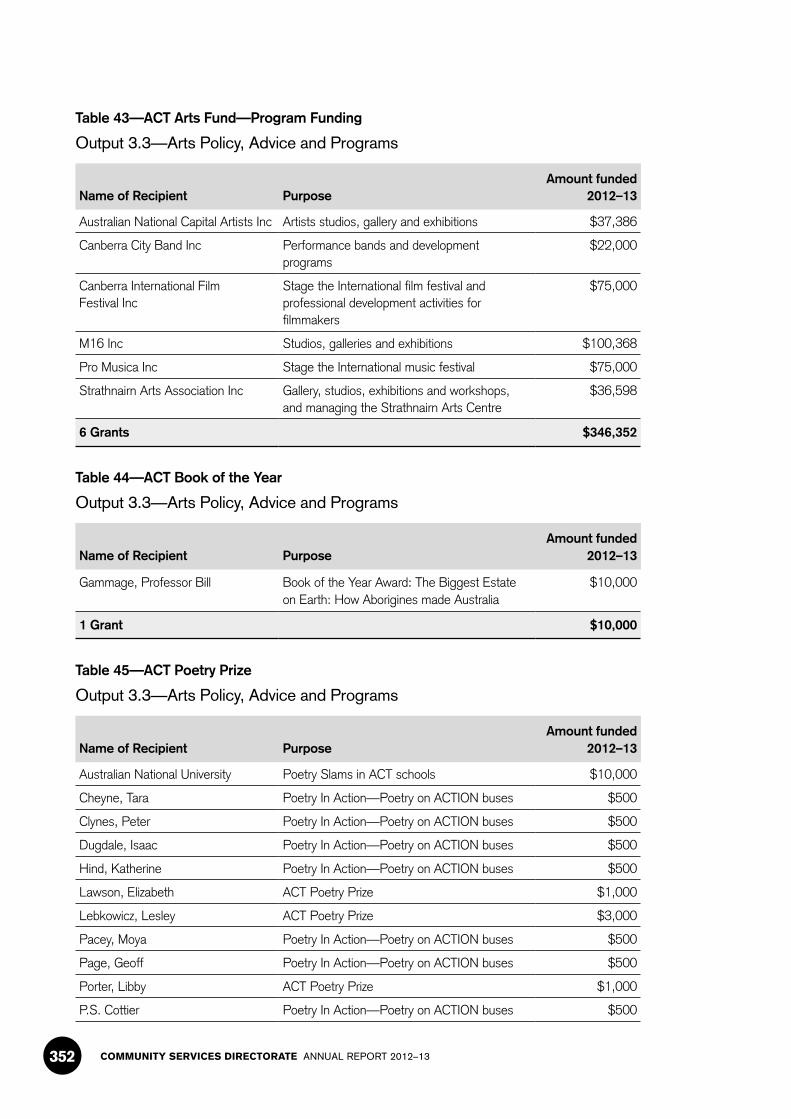
COMMUNITY SERVICES DIRECTORATE ANNUAL REPORT 2012–13352
Table 43—ACT Arts Fund—Program Funding
Output 3.3—Arts Policy, Advice and Programs
Name of Recipient PurposeAmount funded
2012–13
Australian National Capital Artists Inc Artists studios, gallery and exhibitions $37,386
Canberra City Band Inc Performance bands and development programs
$22,000
Canberra International Film Festival Inc
Stage the International film festival and professional development activities for filmmakers
$75,000
M16 Inc Studios, galleries and exhibitions $100,368
Pro Musica Inc Stage the International music festival $75,000
Strathnairn Arts Association Inc Gallery, studios, exhibitions and workshops, and managing the Strathnairn Arts Centre
$36,598
6 Grants $346,352
Table 44—ACT Book of the Year
Output 3.3—Arts Policy, Advice and Programs
Name of Recipient PurposeAmount funded
2012–13
Gammage, Professor Bill Book of the Year Award: The Biggest Estate on Earth: How Aborigines made Australia
$10,000
1 Grant $10,000
Table 45—ACT Poetry Prize
Output 3.3—Arts Policy, Advice and Programs
Name of Recipient PurposeAmount funded
2012–13
Australian National University Poetry Slams in ACT schools $10,000
Cheyne, Tara Poetry In Action—Poetry on ACTION buses $500
Clynes, Peter Poetry In Action—Poetry on ACTION buses $500
Dugdale, Isaac Poetry In Action—Poetry on ACTION buses $500
Hind, Katherine Poetry In Action—Poetry on ACTION buses $500
Lawson, Elizabeth ACT Poetry Prize $1,000
Lebkowicz, Lesley ACT Poetry Prize $3,000
Pacey, Moya Poetry In Action—Poetry on ACTION buses $500
Page, Geoff Poetry In Action—Poetry on ACTION buses $500
Porter, Libby ACT Poetry Prize $1,000
P.S. Cottier Poetry In Action—Poetry on ACTION buses $500

SECTION F COMMUNITY GRANTS — PARTNERSHIPS — ASISTANCE — SPONSORSHIPS 353
Name of Recipient PurposeAmount funded
2012–13
Rice, Sarah Poetry In Action—Poetry on ACTION buses $500
O’Kane, Rosa Poetry In Action—Poetry on ACTION buses $500
Yarbakhsh, Elisabeth Poetry In Action—Poetry on ACTION buses $500
14 Grants $20,000
Table 46—Special Initiative Funding
Output 3.3—Arts Policy, Advice and Programs
Name of Recipient PurposeAmount funded
2012–13
ACT AbaF Office Provide business and arts partnerships and advice
$39,000
Arts Law Centre Inc Provide arts law advice $7,000
First Nation Writers Group Indigenous artists attending the First Nations Australia Writers Network Workshop
$10,000
ScreenACT Film/screen projects, programs and services $146,175
4 Grants $202,175
Table 47—Regional Arts Fund
Output 3.3—Arts Policy, Advice and Programs
Name of Recipient PurposeAmount funded
2012–13
Belconnen Arts Centre Regional arts support to the Community Cultural Inclusion Program
$15,503
Tuggeranong Arts Centre Regional arts support to the Community Cultural Inclusion Program
$15,503
2 Grants $31,006
Table 48—Artists in Schools Program
Output 3.3—Arts Policy, Advice and Programs
Name of Recipient PurposeAmount funded
2012–13
Searle, Joanne McGregor Primary School—incorporating arts and creative engagement into schools
$16,600
Sharrock, Jim Wanniassa Hills Primary School—incorporating arts and creative engagement into schools
$16,600
Sparke, Franki Mawson Primary School—incorporating arts and creative engagement into schools
$16,600
3 Grants $49,800
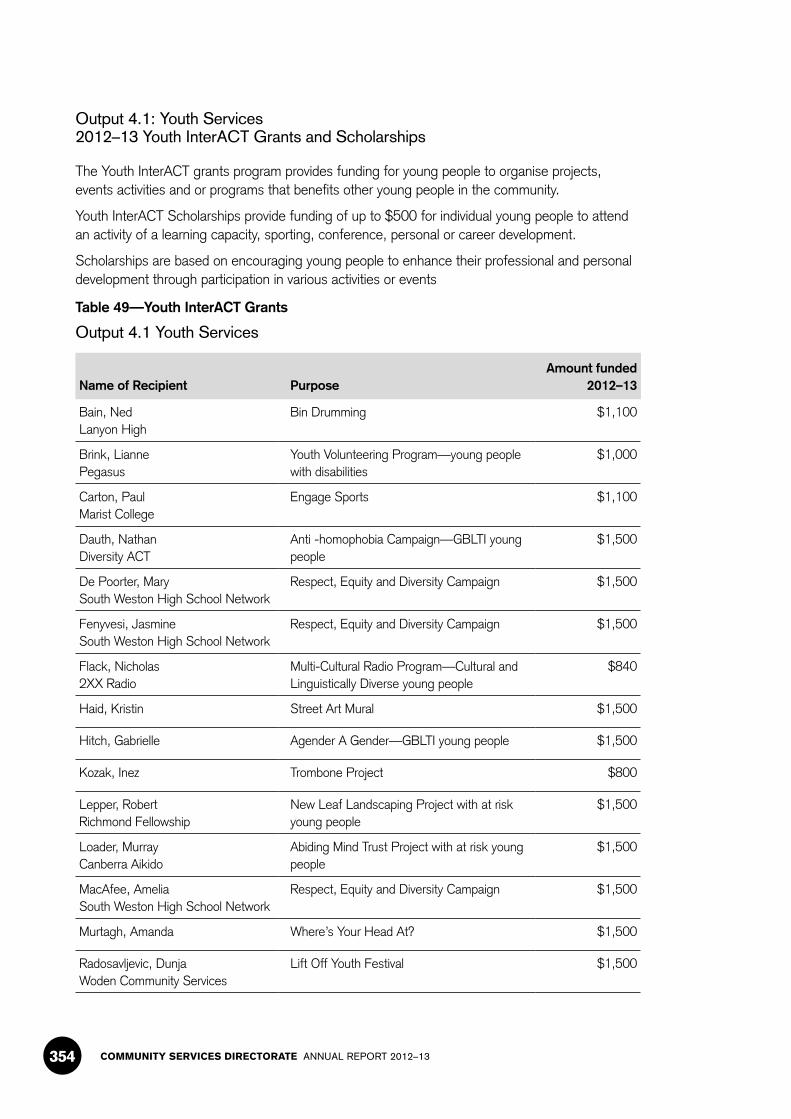
COMMUNITY SERVICES DIRECTORATE ANNUAL REPORT 2012–13354
Output 4.1: Youth Services2012–13 Youth InterACT Grants and Scholarships
The Youth InterACT grants program provides funding for young people to organise projects, events activities and or programs that benefits other young people in the community.
Youth InterACT Scholarships provide funding of up to $500 for individual young people to attend an activity of a learning capacity, sporting, conference, personal or career development.
Scholarships are based on encouraging young people to enhance their professional and personal development through participation in various activities or events
Table 49—Youth InterACT Grants
Output 4.1 Youth Services
Name of Recipient PurposeAmount funded
2012–13
Bain, NedLanyon High
Bin Drumming $1,100
Brink, LiannePegasus
Youth Volunteering Program—young people with disabilities
$1,000
Carton, PaulMarist College
Engage Sports $1,100
Dauth, NathanDiversity ACT
Anti -homophobia Campaign—GBLTI young people
$1,500
De Poorter, MarySouth Weston High School Network
Respect, Equity and Diversity Campaign $1,500
Fenyvesi, JasmineSouth Weston High School Network
Respect, Equity and Diversity Campaign $1,500
Flack, Nicholas2XX Radio
Multi-Cultural Radio Program—Cultural and Linguistically Diverse young people
$840
Haid, Kristin Street Art Mural $1,500
Hitch, Gabrielle Agender A Gender—GBLTI young people $1,500
Kozak, Inez Trombone Project $800
Lepper, RobertRichmond Fellowship
New Leaf Landscaping Project with at risk young people
$1,500
Loader, MurrayCanberra Aikido
Abiding Mind Trust Project with at risk young people
$1,500
MacAfee, AmeliaSouth Weston High School Network
Respect, Equity and Diversity Campaign $1,500
Murtagh, Amanda Where’s Your Head At? $1,500
Radosavljevic, DunjaWoden Community Services
Lift Off Youth Festival $1,500

SECTION F COMMUNITY GRANTS — PARTNERSHIPS — ASISTANCE — SPONSORSHIPS 355
Name of Recipient PurposeAmount funded
2012–13
Rees, Abby Our Space $1,500
Robinson, DouglasDiversity ACT
YQ Radio Canberra—GBLTI young people $500
Smith, Simon M.A.S.H Project with at risk young people $1,500
Tammaro, Rachel Young Carers Week $1,500
19 Grants $24,840
59 young people ranging from $100 to $500 $20,907
59 Scholarships $20,907
Table 50—Care and Protection Services Sponsorships
Output 4.2—Care and Protection Services
Name of Recipient PurposeAmount funded
2012–13
Care Leavers of Australia Network (CLAN)
Provide support services to individuals who have been in the care of the Director-General, including Indigenous members of the stolen generation
$3,000
1 Grant $3,000
Australian Catholic University Institute of Child Protection Studies $102,750
1 Sponsorship $102,750
Table 51—Social Housing and Homelessness Services Grants
Output 1.1—Social Housing Services
Name of Recipient PurposeAmount funded
2012–13
Connections ACT Inc Data migration $10,285
Dabrowski, Stanislawa Soup kitchen $28,238
Domestic Violence Christmas Program
Domestic Violence Christmas Housing Program
$42,859
Hare Krishna Contribution towards the food for life program $11,017
Housing and Accommodation Support Service
Housing and mental health support $345,031
The Salvation Army Emergency Accommodation Network—property set-up cost
$90,000
Office licence fee for office space $9,928
Tenant Participation Grants Social interaction for public housing tenants $91,748
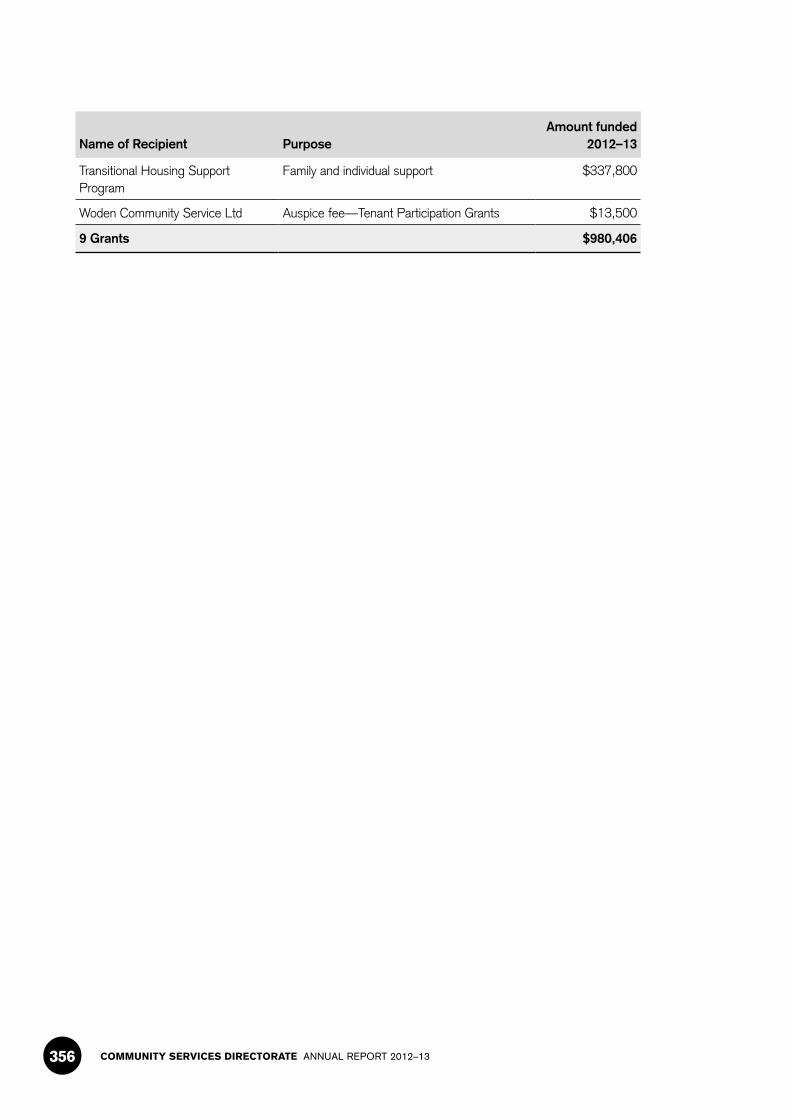
COMMUNITY SERVICES DIRECTORATE ANNUAL REPORT 2012–13356
Name of Recipient PurposeAmount funded
2012–13
Transitional Housing Support Program
Family and individual support $337,800
Woden Community Service Ltd Auspice fee—Tenant Participation Grants $13,500
9 Grants $980,406
GSECTION
STRATEGIC OBJECTIVES AND INDICATORS


SECTION G STRATEGIC OBJECTIVES AND INDICATORS 359
G. Strategic Objectives and Indicators
G.1 Community Services Directorate
Report on Strategic Indicators for the Year Ended 30 June 2013
Under the Financial Management (Statement of Performance Scrutiny) Guidelines 2011, the strategic indicators are not examined by the ACT Auditor–General’s Office.
Strategic Objective 1
Provide Services to Strengthen the Capacity of People with Disabilities, their Families and Carers to Maximise Control over their lives
The Directorate provides disability services through government and non-government service providers to meet the accommodation support, community access, community support, respite care and wellbeing needs of people with moderate to severe disabilities.
Growth in service user numbers is an indicator of the effect increased funding in the disability services sector has on reaching the target population of approximately 12,000 people with a profound or severe core activity limitation in the ACT community.
Strategic Indicator 1: Number of Service Users by Service Type Accessed
Original Target 2012–13
Actual Result2012–13
Variance
Number of Service Users by Service Type Accessed 4,260 4,593 8%
ResultThis result was from the Australian Institute of Health and Welfare report on Disability Support Services released on 11 July 2013.
Strategic Objective 2
Provide Services to Improve Developmental Outcomes for Children, Young People and Adults with Physical, Intellectual, Communication and other Functional Difficulties
The Directorate aims to improve developmental outcomes by providing therapy services for children with delays in development from birth to age eight, and for children, young people and adults with disabilities (i.e. from birth to 65 years), including counselling and support, and assistance with physical, intellectual, communication and other functional disabilities.
Growth in the number of clients accessing therapy service is an indicator of the availability of services to improve outcomes for people with physical, intellectual, communication and other functional difficulties.
Strategic Indicator 2: Number of Clients Accessing Services
Original Target 2012–13
Actual Result 2012–13
Variance
Number of Clients Accessing Services 4,410 4,736 7%
ResultThe result is above target due to the increased number of clients seen for brief intervention services including drop-ins and Therapy Assistant Program assessment in schools.

COMMUNITY SERVICES DIRECTORATE ANNUAL REPORT 2012–13360
Strategic Objective 3
Improve Outcomes for Children and Families through the Provision of Coordinated Locally Based Services
The Directorate aims to improve outcomes for children and families through the Child and Family Centres Program. The Child and Family Centres Program has been developed on an evidence-based, best practice model and offers a one-stop shop for services and programs for children and families. Services and programs are delivered in partnerships with other ACT Government agencies and local community based organisations.
The number of families accessing the centres indicates the number of families supported in the ACT by a range of early intervention and prevention services and also indicates community awareness of the centres.
Strategic Indicator 3: Number of Families Accessing Services
Original Target 2012–13
Actual Result 2012–13
Variance
Number of Families Accessing Services 1,720 1,830 6%
ResultDemand for services remains strong across the centres.
Strategic Objective 4
Provision of Services and Interventions that Reduce the Risk of Re-Substantiated Reports of Abuse
The Directorate provides care and protection services for children and young people.
A reduced re-substantiation rate is an indication that appropriate assessment, evaluation of risk and action have been taken to minimise opportunities for abuse or neglect or the risk of abuse and neglect to reoccur. Repeated occurrences of maltreatment, as indicated by re-substantiation, are also an indicator of cumulative harm which can have a damaging impact on children and young people. It is a national indicator for child protection services.
Strategic Indicator 4: Re–substantiation Rates
Original Target2012–13
%
Actual Result 2012–13
%
Variance
Re-substantiation Rate—within 3 Months 15 17 13%
Re-substantiation Rate—within 12 Months 28 35 25%
ResultThis indicator is based on a measure reported nationally in the Report on Government Services. Small number changes in the ACT impact on increase and decrease of percentage. This figure fluctuates regularly and continues to be monitored carefully.
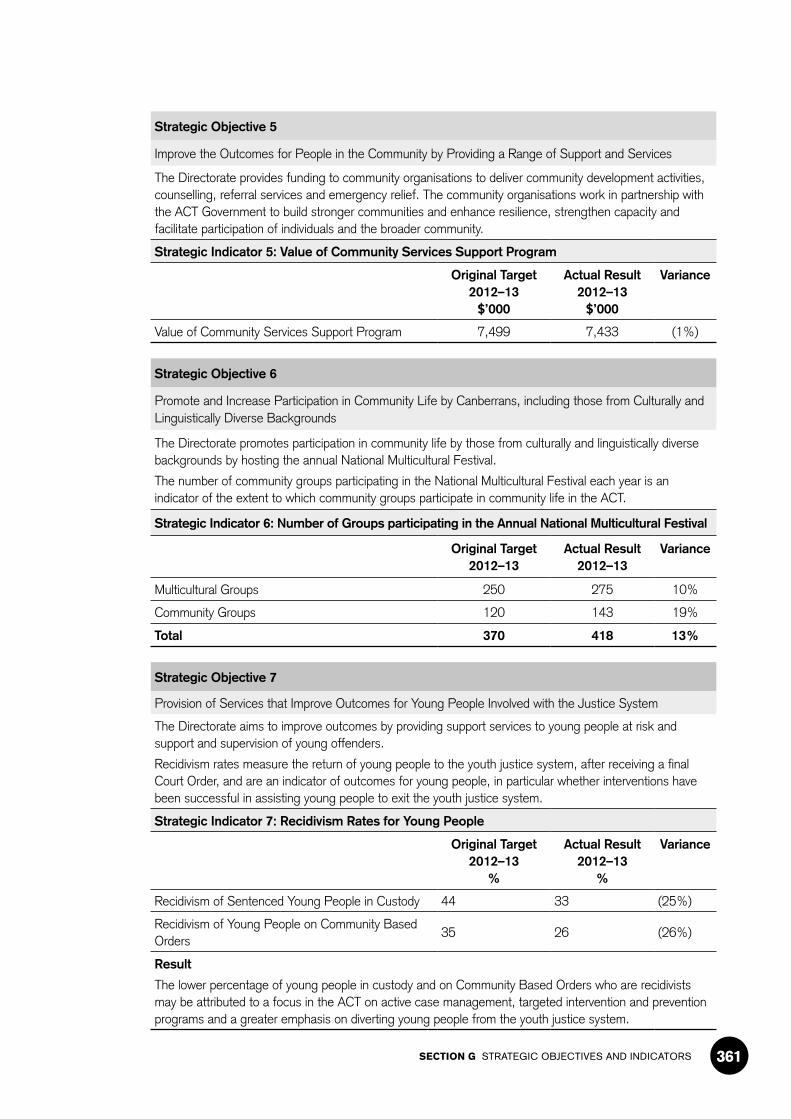
SECTION G STRATEGIC OBJECTIVES AND INDICATORS 361
Strategic Objective 5
Improve the Outcomes for People in the Community by Providing a Range of Support and Services
The Directorate provides funding to community organisations to deliver community development activities, counselling, referral services and emergency relief. The community organisations work in partnership with the ACT Government to build stronger communities and enhance resilience, strengthen capacity and facilitate participation of individuals and the broader community.
Strategic Indicator 5: Value of Community Services Support Program
Original Target 2012–13
$’000
Actual Result2012–13
$’000
Variance
Value of Community Services Support Program 7,499 7,433 (1%)
Strategic Objective 6
Promote and Increase Participation in Community Life by Canberrans, including those from Culturally and Linguistically Diverse Backgrounds
The Directorate promotes participation in community life by those from culturally and linguistically diverse backgrounds by hosting the annual National Multicultural Festival.
The number of community groups participating in the National Multicultural Festival each year is an indicator of the extent to which community groups participate in community life in the ACT.
Strategic Indicator 6: Number of Groups participating in the Annual National Multicultural Festival
Original Target2012–13
Actual Result2012–13
Variance
Multicultural Groups 250 275 10%
Community Groups 120 143 19%
Total 370 418 13%
Strategic Objective 7
Provision of Services that Improve Outcomes for Young People Involved with the Justice System
The Directorate aims to improve outcomes by providing support services to young people at risk and support and supervision of young offenders.
Recidivism rates measure the return of young people to the youth justice system, after receiving a final Court Order, and are an indicator of outcomes for young people, in particular whether interventions have been successful in assisting young people to exit the youth justice system.
Strategic Indicator 7: Recidivism Rates for Young People
Original Target 2012–13
%
Actual Result2012–13
%
Variance
Recidivism of Sentenced Young People in Custody 44 33 (25%)
Recidivism of Young People on Community Based Orders
35 26 (26%)
Result
The lower percentage of young people in custody and on Community Based Orders who are recidivists may be attributed to a focus in the ACT on active case management, targeted intervention and prevention programs and a greater emphasis on diverting young people from the youth justice system.
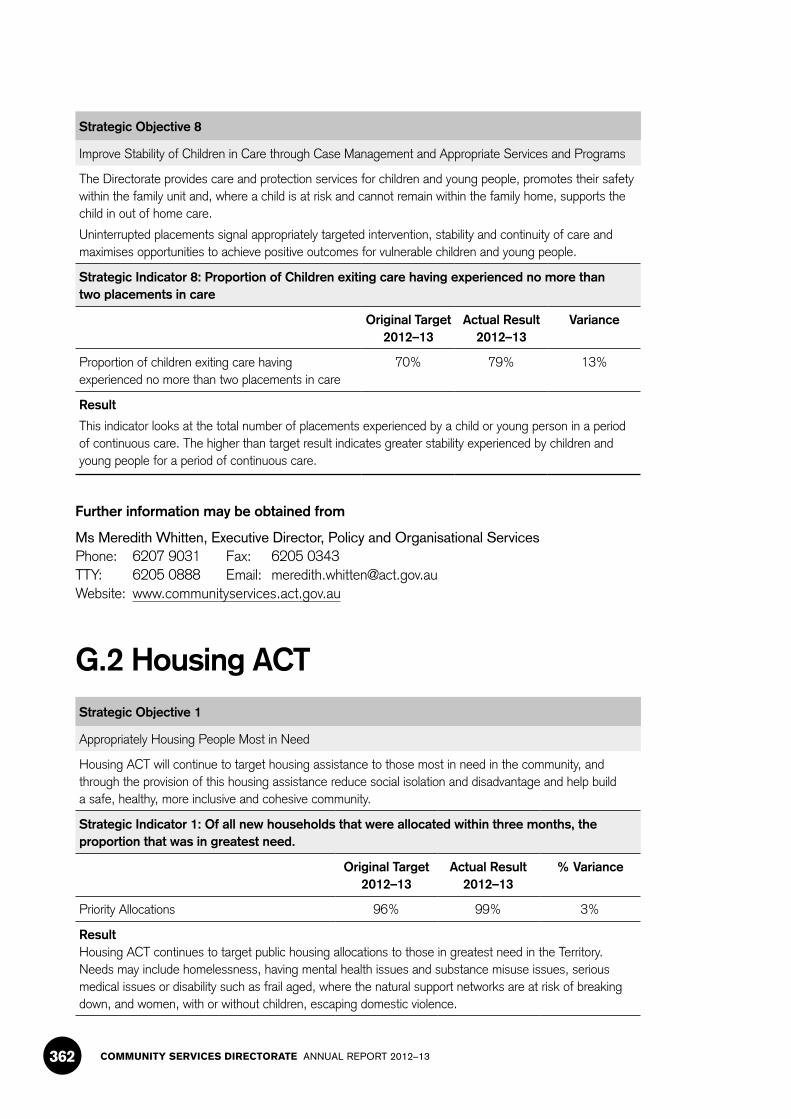
COMMUNITY SERVICES DIRECTORATE ANNUAL REPORT 2012–13362
Strategic Objective 8
Improve Stability of Children in Care through Case Management and Appropriate Services and Programs
The Directorate provides care and protection services for children and young people, promotes their safety within the family unit and, where a child is at risk and cannot remain within the family home, supports the child in out of home care.
Uninterrupted placements signal appropriately targeted intervention, stability and continuity of care and maximises opportunities to achieve positive outcomes for vulnerable children and young people.
Strategic Indicator 8: Proportion of Children exiting care having experienced no more than two placements in care
Original Target 2012–13
Actual Result2012–13
Variance
Proportion of children exiting care having experienced no more than two placements in care
70% 79% 13%
Result
This indicator looks at the total number of placements experienced by a child or young person in a period of continuous care. The higher than target result indicates greater stability experienced by children and young people for a period of continuous care.
Further information may be obtained from
Ms Meredith Whitten, Executive Director, Policy and Organisational ServicesPhone: 6207 9031 Fax: 6205 0343TTY: 6205 0888 Email: [email protected] Website: www.communityservices.act.gov.au
G.2 Housing ACTStrategic Objective 1
Appropriately Housing People Most in Need
Housing ACT will continue to target housing assistance to those most in need in the community, and through the provision of this housing assistance reduce social isolation and disadvantage and help build a safe, healthy, more inclusive and cohesive community.
Strategic Indicator 1: Of all new households that were allocated within three months, the proportion that was in greatest need.
Original Target2012–13
Actual Result2012–13
% Variance
Priority Allocations 96% 99% 3%
ResultHousing ACT continues to target public housing allocations to those in greatest need in the Territory. Needs may include homelessness, having mental health issues and substance misuse issues, serious medical issues or disability such as frail aged, where the natural support networks are at risk of breaking down, and women, with or without children, escaping domestic violence.

SECTION G STRATEGIC OBJECTIVES AND INDICATORS 363
Strategic Objective 2
Access to Safe, Affordable and Sustainable Housing that Contributes to Social and Economic Participation
Housing ACT aims to assist tenants to participate more fully in their community and make the most of their life, by assertively engaging with rough sleepers and streamlining access to services and providing transitional housing as a crisis response. Working in partnership with specialist homelessness providers, Housing ACT is able to transfer foundation skills and improve social inclusion with the aim of assisting homelessness and vulnerable families to secure appropriate long-term accommodation with support to enable them to sustain their tenancy.
Strategic Indicator 2: Providing Tenants with the Opportunity to be part of the Community
Original Target2012–13
Actual Result2012–13
% Variance
Percentage of Tenants 74% 70% 5%
ResultThe tenant satisfaction survey specifically includes a question that asks tenants whether being in public housing assists them to participate in the community.
The Strategic Indicator provides for increasing levels of participation by tenants in line with the strategic theme of the Directorate. The result for 2012–13 indicates a slightly lower than expected percentage of tenants who responded that living in public housing has assisted them to participate in the community. The tough economic environment and higher cost of living pressures facing low income and vulnerable families is likely to have negatively impacted the result as tenants would have less disposable income to participate in social and community activities.
Strategic Indicator 3: The provision of Outreach Services to Sustain Tenants in Longer Term Housing
Original Target2012–13
Actual Result2012–13
% Variance
Outreach Support 73% 70% (4)%
ResultA key to successful housing outcomes for those tenants transitioning from homelessness or crisis accommodation into public or mainstream housing is the ability to access adequate and appropriate support that will assist them to maintain and sustain their home. This Indicator measures the proportion of support provided as outreach support to tenants compared to the total levels of support, to enable them to sustain their tenancy in long term housing, i.e. compares support with and without short term and crisis accommodation.
Further information may be obtained from
Ms Bronwen Overton-Clarke, Executive Director, Housing and Community ServicesPhone: 6207 1523 Fax: 6207 1464TTY: 6205 0888 Email: [email protected]: www.communityservices.act.gov.au
COMMUNITY SERVICES DIRECTORATE ANNUAL REPORT 2012–13364
Index
A. Analysis of Financial Performance—Community Services Directorate, 1
A.1. Management Discussion and Analysis, 3
A.2. Audited Financial Report, 14
A.3. Territorial Financial Statements, 106
A.4. Statement of Performance, 129
B. Analysis of Financial Performance—Housing ACT, 153
B.1. Management Discussion and Analysis, 155
B.2. Audited Financial Report, 167
B.3. Statement of Performance, 249
C. Triple Bottom Line Reporting, 257
D. Strategic Asset Management, 261
D.1. Assets Management, 263
D.2. Assets Management Upgrade, 268
D.3. Office Accommodation, 270
E. Capital Works, 273
E.1. Community Services Directorate, 275
E.2. Housing ACT, 283
F. Community Partnerships, 287
F.1. Government Contracting, 289
F.2. Service Funding Agreements, Community Grants and Sponsorship, 302
F.2.1. Service Funding Agreements, 303
F.2.2. Community Grants and Sponsorship, 323
G. Strategic Objectives and Indicators, 357
G.1. Community Services—Strategic Indicators, 359
G.2. Housing ACT—Strategic Objectives and Indicators, 362

ZOO
49094
Copyright © 2022 FDOKUMEN