
Deutsche Börse Aktiengesellschaft, Frankfurt/Main Balance ...
Upload
khangminh22Category
view
1download
0
Fran
k H
orst
Co
ins
stud
y –
Imp
act
asse
ssm
ent
of
roun
din
g in
the
ret
ail s
ecto
r
Coins studyImpact assessment of rounding in the retail sector
Frank Horst
EHI Retail Institute GmbH in conjunctionwith the Deutsche Bundesbank

1
Frank Horst
Coins studyImpact assessment of rounding in the retail sector
EHI Retail Institute GmbH in conjunctionwith the Deutsche Bundesbank

2
Coins study Impact assessment of rounding in the retail sector
Summary
This study investigates the effects on consumer prices of rounding final total prices or individual prices in the retail sector. The empirical analysis based on around 70,000 sales receipts shows that, when the final total price is rounded commercially to the nearest whole 5 euro cent increment, virtually no effect on the price level can be expected. By contrast, if individual prices are subject to commercial rounding or a general rounding up, minimal one-off increases in the price level can be expected. The intro-duction of a rounding rule for 1 and 2 euro cent coins results in no significant savings for the retail sector.
Interviews carried out as part of this study also show that the retail sector will not implement a rounding rule of its own initiative. The total cost of supplying coins has risen much less sharply than roll prices, as the latter account for just 10 % to 20 % of total costs.

3
Coins study Impact assessment of rounding in the retail sector
Contents
Preface . . . . . . . . . . . . . . . . . . . . . . . . . . . . . . . . . . . . . . . . . . . . . . . . . . . . . . . . . . . . . . . 6Carl-Ludwig Thiele (Member of the Executive Board of the Deutsche Bundesbank)
Preface . . . . . . . . . . . . . . . . . . . . . . . . . . . . . . . . . . . . . . . . . . . . . . . . . . . . . . . . . . . . . . . 8Frank Horst (EHI Retail Institute GmbH)
1 Introduction and subject of the study . . . . . . . . . . . . . . . . . . . . . . . . . . . . . . . . . . 9
2 How the study relates to the current debate . . . . . . . . . . . . . . . . . . . . . . . . . . . . 10
3 Collection and utilisation of data . . . . . . . . . . . . . . . . . . . . . . . . . . . . . . . . . . . . . 13
4 Results of quantitative simulations . . . . . . . . . . . . . . . . . . . . . . . . . . . . . . . . . . . 15 4.1 Examining the effects of rounding final total prices . . . . . . . . . . . . . . . . . . . . 15 4.2 Examining the effects of rounding individual prices . . . . . . . . . . . . . . . . . . . 24 4.3 Effects of rounding final total prices on coin requirements . . . . . . . . . . . . . 30
5 Results of qualitative interviews . . . . . . . . . . . . . . . . . . . . . . . . . . . . . . . . . . . . . . 38 5.1 Preliminary remarks and general findings . . . . . . . . . . . . . . . . . . . . . . . . . . . .38 5.2 Saving effects of eliminating small coins in cash handling . . . . . . . . . . . . . . .40 5.3 Savings potential for supplying coins . . . . . . . . . . . . . . . . . . . . . . . . . . . . . . . . .42 5.4 Price effects by rounding scenario . . . . . . . . . . . . . . . . . . . . . . . . . . . . . . . . . . .42
6 Cost of cash logistics in the retail sector . . . . . . . . . . . . . . . . . . . . . . . . . . . . . . . 43
7 Conclusions . . . . . . . . . . . . . . . . . . . . . . . . . . . . . . . . . . . . . . . . . . . . . . . . . . . . . . . 50
Appendix A: Interview guideline . . . . . . . . . . . . . . . . . . . . . . . . . . . . . . . . . . . . . . . . 52
Appendix B: Detailed tables . . . . . . . . . . . . . . . . . . . . . . . . . . . . . . . . . . . . . . . . . . . . 55

4
Coins study Impact assessment of rounding in the retail sector
List of figures
Figure 1 Revenue effects of rounding final total prices . . . . . . . . . . . . . . . . . . .15Figure 2 Distribution of final digits of final total prices. . . . . . . . . . . . . . . . . . .16Figure 3 Range of revenue effects of rounding final total prices . . . . . . . . . . .17Figure 4 Revenue effects of rounding final total prices by market situation . . . . . . . . . . . . . . . . . . . . . . . . . . . . . . . . . . . . . . . . .18Figure 5 Revenue effects of rounding final total prices by daily revenue level . . . . . . . . . . . . . . . . . . . . . . . . . . . . . . . . . . . . . . .19Figure 6 Revenue effects in relation to average final total price . . . . . . . . . . . .22Figure 7 Price effects of rounding individual prices . . . . . . . . . . . . . . . . . . . . . .25Figure 8 Distribution of final digits of individual prices . . . . . . . . . . . . . . . . . .26Figure 9 Range of price effects of rounding individual prices . . . . . . . . . . . . .29Figure 10 Distribution of ranges around the mean value in the case of commercial rounding . . . . . . . . . . . . . . . . . . . . . . . . . . .29Figure 11 Percentage decrease in coin units by rounding scenario . . . . . . . . . .34Figure 12 Percentage decrease in coin rolls by rounding scenario . . . . . . . . . . .35
5
Coins study Impact assessment of rounding in the retail sector
List of tables
Table 1 Distribution of the 20 most common prices . . . . . . . . . . . . . . . . . . . . . . . .27Table 2 Effects of rounding final total prices on coin requirements . . . . . . . . . . .32Table 3 Shifts to other coins (units) . . . . . . . . . . . . . . . . . . . . . . . . . . . . . . . . . . . . . .36Table 4 Distribution of final digits of final total prices . . . . . . . . . . . . . . . . . . . . . .36Table 5 Development of average roll prices . . . . . . . . . . . . . . . . . . . . . . . . . . . . . . .48Table 6 Development of average stop prices . . . . . . . . . . . . . . . . . . . . . . . . . . . . . . .48Table 7 Development of cash handling costs . . . . . . . . . . . . . . . . . . . . . . . . . . . . . .48Table 8 Development of the total cost of external cash logistics . . . . . . . . . . . . . .48Table B.1 Overview of revenue effects of rounding final total prices . . . . . . . . . . . .56Table B.2 Overview of price effects of rounding individual prices . . . . . . . . . . . . . .58

6
Coins study Impact assessment of rounding in the retail sector
Dear readers
Most of us have, at some point, had to wait in line at the supermarket while the customer in front of us painstakingly looks for small change. This may have prompted you to ask why Germany does not follow the example of other countries, such as Finland, the Netherlands and most recently Belgium, and introduce a rounding rule which does away with small coins.
The results of opinion polls on the euro show that only around one in five respondents in Germany consider the number of denominations of euro coins to be too high. The majority of those people consider small coins to be superfluous. When asked specifi-cally about introducing a rounding rule, almost half of all respondents said they were in favour. However, an equally large proportion of the population is against it. There is therefore less support for a rounding rule in Germany than in most other euro-area countries. A negative attitude towards the rounding of purchase amounts at the point of sale could be indicative of an inherent fear of inflation. The Deutsche Bundesbank therefore commissioned the external study which you now have in your hands. This coins study helps improve the objectivity of the discussion and reveals the extent of revenue and price effects which would be caused by the introduction of a rounding rule in the retail sector.
Carl-Ludwig Thiele
Member of the Executive Boardof the Deutsche Bundesbank

7
Coins study Impact assessment of rounding in the retail sector
Another effect investigated as part of this study is the impact which a rounding rule would have on the cost of cash handling. Market participants complain that the cost of the supply and disposal of coins has increased. A rounding rule could potentially reduce the need for coins and therefore stem the rise in costs for the market. The infor-mation provided by a non-representative sample of enterprises interviewed as part of this study do indeed point to an increase in the cost of coin supplies in the past. This study shows that no significant cost savings could be expected as a result of introducing a rounding rule.
The Deutsche Bundesbank, as a neutral entity for which a well-functioning payment system is vital, places particular emphasis on the possible inflationary effects of a rounding rule. This study shows that the introduction of a rounding rule in Germany would not have any inflationary impact.
I hope this study proves to be an interesting and insightful read.
Yours
Carl-Ludwig ThieleMember of the Executive Board of the Deutsche Bundesbank

8
Coins study Impact assessment of rounding in the retail sector
The discussion, initiated by the European Commission, as to whether or not to eliminate 1 and 2 euro cent coins from cash payments affects retailers and consumers alike and is often the subject of fierce debate. However, most arguments are based on personal opinion rather than fact. For some, small coins are essential and an integral part of our payment habits, while for others they are merely a nuisance.
To establish a scientific basis for the supposition, speculation and uncertainty surrounding the possible effects on the retail sector, EHI Retail Institute was commissioned by the Deutsche Bundesbank to carry out this study. Simulations based on real sales receipts data show the effects on revenue, consumer prices, coin requirements and cost savings. After all, any decision should be based on a knowledge of the facts and real consequences, not just on gut instinct.
To come to the point straightaway: no matter which rounding scenario were to prevail, the economic impact would be relatively low. Fear of price rises is unfounded, there would be no perceptible time savings at the point of sale, and phasing out prices ending in 9 euro cent amounts is inconceivable in the retail food sector.
I hope that the detailed results of this study offer clear insights which allow you to make up your own mind about the future of small coins in the euro area.
Frank Horst
Director Research Loss Prevention + Security, EHI Retail Institute, Cologne, Germany

9
Coins study Impact assessment of rounding in the retail sector
1 Introduction and subject of the study
In recent times – especially in other European countries – the denominational structure of euro coins has been the subject of debate, the use of small coins (1 and 2 euro cents) has been called into question and there have been calls for the introduction of a rounding rule.1 Cost is often cited as the main argument.
A frequent argument against the introduction of a rounding rule is that the rounding itself or an associated increase in individual prices (second-round effects) could have an impact on inflation. Consumers often complain about problems distinguishing between small coins, which can cause problems during the payment process.
The European Council is responsible for the denominational structure and design of euro coins. The Deutsche Bundesbank adopts a neutral, facilitating stance with regard to the use of small coins and the introduction of a rounding rule and, in order to objectify the, at times, emotionally charged discussion (fear of inflation owing to increases in individual prices following the introduction of a rounding rule) commis-sioned a study to be carried out by EHI Retail Institute GmbH. The key findings are summarised in this paper.
The aim of this analysis is to assess the impact of various rounding rules on price levels in the retail sector and on consumer prices (Harmonised Index of Consumer Prices, HICP) by analysing a variety of scenarios based on real customer sales receipts and expert interviews. Further considerations include the probability of individual price adjustments (based on supporting expert interviews), possible economic effects in the retail sector, and general cost and volume developments in the area of cash logistics, as well as anticipated changes.
The overall aim is to analyse and present the effects of various rounding rules for final total prices (purchase amounts), the price development of individual prices on the shelf and the development of coin costs.
1 The introduction of a rounding rule to the nearest whole 5 euro cent increment – even on a voluntary basis – would, in effect, lead to the abolition of small coins or severely limit the circulation of such coins. However, these coins would continue to be legal tender, as shown by the examples of the Netherlands and Finland.

10
Coins study Impact assessment of rounding in the retail sector
The study is structured as follows. Section 2 provides an overview of the current deba-te. The data sources, process of data collection and related methodology are described in Section 3. Section 4 describes the issues at the heart of the study, ie how the intro-duction of a rounding rule would affect revenue and consumer prices. Section 4.3 also analyses the anticipated effects on coin requirements. The results of expert interviews are presented in Section 5. Section 6 examines the cost of cash logistics in the retail sector based on a sample of enterprises. The key findings are summarised and evaluated in Section 7. Appendix A and Appendix B take a closer look at the sources of data used.
2 How the study relates to the current debate
This section initially looks at how other euro-area countries, namely Finland and the Netherlands, have reduced the circulation of small coins. It then provides a short over-view of comparable developments in other countries outside the euro area, before briefly examining a European Commission study which addresses in detail the cost problems associated with small coins and outlines possible solutions.
Small coins in Finland and the NetherlandsTwo euro-area countries – Finland and the Netherlands – have stopped issuing natio-nal small coins for payment transactions and introduced a rounding rule.
When the single currency was introduced in 2002, small quantities of 1 and 2 euro cent coins were issued in Finland. Shortly thereafter, the country stopped issuing small coins for payment transactions. A statutory rounding rule was introduced. However, this does not apply to electronic payments. The exact amount is therefore still charged for card payments. Coins are only issued for collectors.
In the Netherlands, the initial issuance of 1 and 2 euro cent coins ceased in 2004. Pay-ment amounts are rounded on a voluntary basis, which has been well received by both the public and retailers. Only payment amounts paid in cash are rounded. There is no voluntary rounding of cashless payments.
Both countries consider the production and handling costs of these coins relative to their face value and benefit in payment transactions to be too high. While the coins

11
Coins study Impact assessment of rounding in the retail sector
continue to be legal tender, their circulation has effectively been limited by the intro-duction of a rounding rule. Purchase amounts are rounded commercially up or down to the nearest 5 euro cent increment in the case of cash payments. This rule is also consistent with a European Commission recommendation which states that 1 and 2 euro cent coins must remain accepted legal tender in countries in which a rounding rule has been introduced.2
Rules prior to the introduction of the euro banknotes and coins and in non-euro-area countries3
Prior to the introduction of euro banknotes and coins, the small coins of the national currencies in Belgium, Finland, Greece, the Netherlands and Slovakia were abolished. Luxembourg, the Netherlands, Portugal and Spain altered the composition of coins to reduce costs.
Countries outside Europe also no longer issue small coins due to a decline in their use in transactions, while production costs have increased. In Canada, the cost of producing 1 cent coins is higher than their face value; the government calculates that this costs the national economy € 8 million per year. In May 2012, the minting of this denomination was stopped and this coin has not been issued since February 2013. However, it continues to be legal tender and serve as the smallest unit of account for the pricing of goods and services.
In the United States, abolishing 1 cent coins has been the subject of debate for some time. However, recent developments suggest that the preferred solution is the use of an alternative material to produce these coins. Australia abolished 1 and 2 cent coins in 1992, Brazil abolished the 1 real coin in 2005, Israel abolished 1 and 5 agorot coins in 2008 (equivalent to the sub-division into cents) and New Zealand abolished 1, 2 and 5 cent coins in 2006.
2 See European Commission, Commission Recommendation of 22 March 2010 on the scope and effects of legal tender of euro banknotes and coins (2010/191/EU), Official Journal of the European Union, 2010.3 See European Commission, Issues related to the continued issuance of the 1 and 2 euro cent coins, Commission staff working document, Brussels, Belgium, 2013.

12
Coins study Impact assessment of rounding in the retail sector
European Commission working paperIn 2012, the European Parliament and the European Council decided to regularly examine the use of euro coins and banknotes by denomination from the perspective of, among other things, public acceptance.4 Based on this decision, the European Commission drafted a working paper5 which analyses the effects of the continued issuance of 1 and 2 euro cent coins and the possible withdrawal of these denominations. Within the scope of a cost-benefit analysis also included in the working paper, actual production costs were also compared with the benefit and value of these coins. According to the Commission’s paper, the cost of producing small coins is close to or, in some countries, higher than the face value of these coins. The high loss rate associated with these coins, their decrease in purchasing power and the issue of inflation or perceived inflation6 were also taken into account.
The results presented above must be qualified by the fact that, when collecting data, the European Commission received answers from only a few member states. The database is therefore very small. The production and procurement costs calculated by the Commission are based on information provided by just five member states. It seems questionable whether extrapolation would produce viable results for all euro-area countries. The results are therefore not representative of the euro area as a whole.
Furthermore, individual euro-area countries alone are responsible for decisions regarding coins, the denominational structure of coins and seigniorage.7 A well-functioning payment system is vital for the Bundesbank as a central bank, and as a neutral entity it places particular emphasis on the possible inflationary effects of a rounding rule in Germany. With this in mind, EHI Retail Institute GmbH was commissioned to carry out this study, the results of which are presented below.
4 Recital 7 of Regulation (EU) No 651/2012 on the issuance of euro coins (OJ L 201, 27.7.2012, p 135). 5 See European Commission, Issues related to the continued issuance of the 1 and 2 euro cent coins, Commission staff working document, Brussels, Belgium, 2013.6 A distinction is made between inflation and perceived inflation, as the general public fears that consumer prices could rise if the issuance of coins is terminated and a rounding rule introduced. Even if individual prices do not change as a result of introducing a rounding rule, prices could still rise in the future.7 Examining minting profit requires a comprehensive analysis of all denominations. Even in the event of possible negative seigniorage of the denominations in question, seigniorage from minting coins is positive overall. Further consideration is therefore superfluous for Germany.

13
Coins study Impact assessment of rounding in the retail sector
3 Collection and utilisation of data
This section explains the data sources and describes the collection methodology used.
Final total prices as a basis for simulationsThe analysis of final total prices takes into account 70,647 sales receipts (irrespective of payment method) from 22 markets (discount stores, supermarkets, superstores, hyper-markets, drugstores)8 with revenue of around € 1.29 million. The retail enterprises, which include 22 markets from 11 sales lines, represent total annual revenue of € 40.9 billion,9 € 27.9 billion of which is accounted for by cash payments. Cash payments therefore represent a share of 68.2 %.10
From each participating enterprise, one branch was selected in an inner-city location and one in a more rural region11 to map the different purchasing behaviour of households,12 which affects the average final total price. The participating markets are located throughout Germany. From each of these markets, final total prices were analysed from a day with a large transaction volume and a day with a low transaction volume to reflect different sales receipt lengths. The raw data contained, as a minimum, information on the final total price (clear identification of a sales receipt and positions), item text, row total per item (price per position), number of units of an item, individual price of the item and amount given (where available). Owing to the sample of enterprises, the results are not, however, representative of all food retailers and drugstores.13
8 A supermarket is a retail enterprise with a sales area of between 400 and 2,500 square metres, a superstore is a large supermarket with a sales area of between 2,500 and 5,000 square metres and a hypermarket has a sales area of at least 5,000 square metres. All three supermarket categories stock a full range of foods and differing ranges of non-food I and II items (definition according to EHI Retail Institute).9 The enterprises included in this study represent a share of 25 % of total annual revenue in the food retail and drugstore markets.10 Later in the study, a share of cash payments of 70.2 % is used; this is based on data collected by EHI Retail Institute in 2013. See EHI Retail Institute (2013), Kartengestützte Zahlungssysteme im Einzelhandel 2013 (Card-based payment systems in the retail sector 2013), Bonn, Germany, EHI Retail Institute.11 Branches were selected according to this regional criterion based on the subjective assessment of the participating enterprises.12 It can be assumed that the average final total price differs by regional location owing to varying household size and journey time.13 Owing to the large number of enterprises in the food retail sector and drugstore market and due to the enterprises sampled for this study, the results presented here are not representative.

14
Coins study Impact assessment of rounding in the retail sector
All data from participating enterprises were converted into a uniform data format and the plausibility of each individual receipt was tested. To this end, a check was made of whether the sum of individual items matched the final total price and the amount given minus the change.
To calculate the effect of rounding the final total price, only the final total price to be paid by the customer was taken into consideration. To examine the effect of rounding all individual prices, all receipts were adjusted for deposits, empties, returns, cancella-tions, negative entries, discounts, vouchers and credit. Weighed items – such as cold meats or weighed fruit and vegetables – were treated as single items, ie the individual price was used.
Database for interviewsIn addition to the analysis of sales receipts, interviews were conducted with ten cash logistics specialists and another ten sales or marketing specialists based on a structured interview guideline. In three cases, one person was responsible for both functions; thus 17 expert interviews14 were conducted in total.
Database for cash logistics costsTo calculate the cost of external cash logistics, data from 11 enterprises15 with total revenue of € 67.4 billion in 2012 were examined. The cash takings of participating enterprises totalled € 41.3 billion, which represents a cash share of 61.3 %.
14 The group of persons interviewed – subject to their consent – consisted mainly of employees of the enterprises which provided the sales receipt data.15 These enterprises are largely identical to those used for the analysis of data from sales receipts. To ensure a good sector mix when examining the cost of cash logistics, other enterprises were also included (drug-stores, food retailers and DIY stores as well as enterprises with a sector mix including food retail).

15
Coins study Impact assessment of rounding in the retail sector
4 Results of quantitative simulations
4 .1 Examining the effects of rounding final total pricesFor the rounding of final total prices to the nearest whole 5 euro cent increment,16 only 63,682 sales receipts from cash payments of the 70,647 sales receipts collected were examined. This distinction is made to simulate a rounding rule which applies to cash payments only, as is the case in the Netherlands, for example. Non-cash payments would still be charged to the exact cent. The differences in the average revenue effects of a general rounding up or down of final total prices to the nearest 5 euro cent increment, as shown in Figure 1 are the result of the uneven distribution of the final digits of final total prices.
16 For better readability, the abbreviated form “to the nearest 5 euro cent increment” is hereinafter used.
Figure 1:Revenue effects of rounding final total prices
% – 0.2 – 0.1 0 + 0.1 + 0.2
General rounding down
General rounding up
0.02 %
0.14 %
– 0.17 %
Asymmetric rounding
Source: EHI Retail Institute.

16
Coins study Impact assessment of rounding in the retail sector
The distribution of final digits, as shown in Figure 2, is the result of individual prices (here, an average of more than 60 % of product prices end in a 9 euro cent amount) and the number of items purchased per sales receipt. This reflects actual purchasing behaviour and the pricing policies of enterprises from the sample taken.
Revenue effects vary in individual markets. For example, in the case of a general rounding down, values range from -0.41 % to -0.06 % (see page 17, Figure 3). The margin of fluctuation is chiefly due to the average final total price in the examined markets. The higher the purchase amount to be paid, the smaller the percentage change (see also page 22, Figure 6).
The location of markets appears to play an important role when the average final total price is the main influence on value ranges. The density of markets tends to be higher in urban areas than in rural areas, making journeys for each individual purchase shorter. It can therefore be assumed that purchases are made more frequently in urban areas, but that the average final total price is also lower.
Figure 2:Distribution of final digits of final total prices
Source: EHI Retail Institute.
12.7
6.5 7.08.1
9.711.2
7.99.1
12.2
15.6

17
Coins study Impact assessment of rounding in the retail sector
Conversely, a higher average final total price can be observed in markets in rural areas.17 As shown in Figure 4 (see page 18), the average final total price in urban areas of € 14.86 is lower than in rural areas, where the average final total price is € 17.66. Revenue effects also vary according to the regional location of markets. The lower average final total price in urban areas compared with rural areas is accompanied by a more pro-nounced average revenue effect.
Results of commercial rounding to the nearest 5 euro cent incrementIn the case of commercial rounding to the nearest 5 euro cent increment, the average marginal revenue increase is 0.2 ‰. Contrary to the statistical expectation of no over-all change in revenue level, a slight increase in revenue was observed across all examined markets and sales days (see page 18, Figure 4, and page 19, Figure 5). The distribution of final digits of final total prices (see page 16, Figure 2) shows a disproportionate number
Figure 3:Range of revenue effects of rounding final total prices
% – 0.4 – 0.3 – 0.2 – 0.1 0 + 0.1 + 0.2 + 0.3 + 0.4
– 0.06 to – 0.41 %
0.05 to 0.31 %
General rounding down
General rounding up
0.00 to 0.07 %Commercial rounding
Source: EHI Retail Institute.
17 The average final total price may be influenced not only by the regional location of the market but also by regional differences in household size. It was not possible at this juncture to differentiate between these potential influences on the overall effect.

18
Coins study Impact assessment of rounding in the retail sector
of final amounts ending in 8 and 9. Final total prices are therefore, to a small extent, rounded up more often than they are rounded down, which leads to a marginal net increase in revenue. For example, 45.6 % of sales receipts would be rounded up in this study compared to the 30.5 % which would be rounded down.18
When purchase amounts are subject to commercial rounding, the revenue effect increases as the average final total price in a market decreases. Conversely, this means that, in the case of longer sales receipts and larger final total prices, as is usual in hypermarkets and discount stores, the effect is less pronounced and moves closer to zero as the final total price increases.
Figure 4:Revenue effects of rounding final total prices by market situation
Source: EHI Retail Institute.
18 For the simulations of commercial rounding, purchase amounts (and also individual prices) ending in 1, 2, 6 and 7 euro cents were rounded down and amounts ending in 3, 4, 8 and 9 euro cents were rounded up. The remaining 23.9 % of sales receipts were not rounded as the final total prices already ended in a whole 5 euro cent amount.
Rural average final total price, € 17.66Urban average final total price, € 14.86
General rounding up.
.
.
.
. . . .
.
.
Commercial rounding
General rounding down

19
Coins study Impact assessment of rounding in the retail sector
Revenue effects in the examined markets range from 0.0 ‰ to 0.7 ‰ (see page 17, Figure 3). The distribution of revenue effects in individual markets by market size shows that a higher average purchase amount results in a below-average revenue effect (less than 0.2 ‰). With the exception of two outliers, this is the case from an average final total price of around € 12. In markets with a below-average revenue effect, the final total price was, on average, twice as high as in markets with an average or above-average revenue effect. Moreover, if the final total price were to increase by € 1, the revenue effect would decrease by 0.002 percentage points or 10 %.
Overall, commercial rounding of the final total price would have a below-average revenue effect on more than half of all markets. Of the markets with an above-average revenue effect, slightly more than 60 % were located in urban areas and just under 40 % in rural areas, irrespective of the daily revenue level.
Figure 5:Revenue effects of rounding final total prices by daily revenue level
Source: EHI Retail Institute.
Low-revenue average final total price, € 12.32High-revenue average final total price, € 17.98
General rounding up.
.
Commercial rounding
General rounding down
.
.
. . . .
.
.

20
Coins study Impact assessment of rounding in the retail sector
Results of a general rounding down to the nearest 5 euro cent incrementWhen all final total prices are rounded down to the nearest 5 euro cent increment, the average net revenue decrease is 1.7 ‰. Revenue decrease in the examined markets ranges from 0.6 ‰ to 4.1 ‰ (see page 17, Figure 3). The slightly more pronounced effect of 1.7 ‰ compared with the scenario of a general rounding up (mean value of 1.4 ‰) is due to the distribution of final total prices. Overall, around 76 % of all sales receipts are subject to rounding owing to the distribution of the final digit of final total prices. Maximum absolute changes occur when the final digit is 3, 4, 8 or 9 euro cents and minimum changes occur when the final digit is 1, 2, 6 or 7 euro cents. Of the rounded sales receipts, around 60 % are subject to the maximum revenue loss per receipt of 3 to 4 euro cents and just 40 % to a lower loss of 1 to 2 euro cents. In the case of a general rounding up, the exact opposite is true.
If the suspected link between market density and purchase amount were to prove correct, lower average final total prices would be expected in urban areas than in rural areas. As shown in Figures 4 and 5 (see pages 18 and 19), the average revenue effects are also more pronounced in urban areas than in rural areas. The same applies to daily revenue. On low-revenue days, revenue effects are more pronounced than on high-revenue days as the average final total price is lower.
Overall, slightly more than 60 % of all markets would incur a below-average revenue loss in the event of a general rounding down of final total prices. By contrast, around one-third of examined markets would be affected by an above-average revenue effect. This also explains the uneven distribution between the average revenue effect and the upper and lower range limits.
Based on an average proportion of cash payments of 70.2 % for the examined food and drugstore retail markets, the average revenue loss in relation to total retail revenue would be 1.2 ‰ [0.17 % revenue loss for cash payments x 70.2 % average proportion of cash payments].
Results of a general rounding up to the nearest 5 euro cent incrementIn the case of a general rounding up of all final total prices to the nearest 5 euro cent increment, the average revenue increase is 1.4 ‰ for cash payments (see page 15, Figure 1). As is the case for a general rounding down of final total prices, around 60 %

21
Coins study Impact assessment of rounding in the retail sector
of markets would experience a below-average revenue increase, while around one-third would experience an above-average revenue increase. These effects vary depending on the regional location of the market. Markets in urban areas experience an above-average revenue effect much more often than markets in rural areas. By contrast, the frequency of below-average revenue increases is distributed almost evenly from a regional perspective.
Revenue growth in the examined markets varies between 0.5 ‰ and 3.1 ‰ (see page 17, Figure 3). In this rounding scenario, the range of revenue effects – ie the difference between the maximum and minimum values – is therefore smaller than in the case of a general rounding down owing to the distribution of the final digits of the final total prices. The maximum value of 3.1 ‰ is smaller than the maximum value in the case of a general rounding down (4.1 ‰) because in the rounding up scenario a maximum rounding gain of 4 euro cents occurs in just 14.4 % of examined final total prices, whe-reas in the rounding down scenario a maximum rounding loss of 4 euro cents occurs in 25.3 % of cases.19 Of a total of 76 % of sales receipts affected by rounding, revenue gains of 1 to 2 euro cents would occur in 60 % of all cases and gains of 3 to 4 euro cents in just 40 % of cases.
Taking into account the proportion of cash payments, the average revenue increase in relation to total revenue would therefore be just under 1 ‰ [0.14 % revenue growth for cash payments x 70.2 % average proportion of cash payments].
Revenue effects in relation to the average final total price in a marketIt is almost trivial to compare revenue effects in relation to the average final total prices in the examined markets. The higher the average purchase amount, the lower the per-centage revenue effect (see also page 22, Figure 6).
At first glance, the economic effects of rounding final total prices appear to be almost negligible for both the retail sector and the customer. However, if a general rounding down of final total prices were to result in an average loss of 1.7 ‰ of cash revenues for retailers, most enterprises would feel obliged, or at least try, to offset these losses by
19 Revenue increases of 1 to 2 euro cents occur when the final digit is 3, 4, 8 or 9 euro cents. Increases of 3 to 4 euro cents occur when the final digit of 1, 2, 6 or 7 euro cents is rounded up.

22
Coins study Impact assessment of rounding in the retail sector
increasing prices. To put this into perspective: 1.7 ‰ of revenue corresponds roughly to the average total cost of external cash logistics (see Section 6) for large retail chains.
However, the overview of revenue effects in relation to average final total prices shows that, when the average final total price is less than € 10, the revenue effect is 3 ‰ to 4 ‰. This would have a greater impact on enterprises.
In the extreme case of a final total price of less than € 1, revenue effects can range from over 1 % to as much as 10 % – this would be the case, for example, if a final total price of 49 euro cents was rounded down. Such cases are relatively rare in the enterprises
Figure 6:Revenue effects in relation to average final total price
5 10 15 20 25 30 35
0
%
Source: EHI Retail Institute.
General rounding up
Commercial rounding
General rounding down
+ 0.3
Final total price in euro
+ 0.2
+ 0.1
– 0.1
– 0.2
– 0.3
– 0.4

23
Coins study Impact assessment of rounding in the retail sector
examined in this study – the proportion of final total prices amounting to less than € 1 accounts for less than 4.5 % of all purchases in the sample – and the revenue effects are relevant only as a percentage value. By contrast, the absolute value in these exceptional cases is negligible from a commercial perspective, amounting to a maximum of 2 euro cents in the case of commercial rounding or a maximum of 4 euro cents in the case of a general rounding up or down of the final total price.
Effects of rounding final total prices to the Harmonised Index of Consumer PricesThe effects of rounding purchase amounts to the Harmonised Index of Consumer Prices is purely theoretical inasmuch as this takes into account only the price of products on the shelf and not all point-of-sale data – for example, discounts are largely ignored. Thus, the remarks and effects explained in this section cannot be applied directly to reality as, in a scenario in which the final total price is rounded, only the amount to be paid at the point of sale would be rounded and not the individual product price.
In the case of a general rounding up of final total prices for customers, the average price rise is 1.4 ‰ for cash payments. If only cash payments are taken into account, this effect is cushioned somewhat, amounting to around 1.0 ‰ when the average pro-portion of cash payments is assumed to be 70.2 % [0.14 % revenue increase x 70.2 % average proportion of cash payments]. In addition, the categories of goods examined represent only approximately 20 % to 25 % of the goods included in the Harmonised Index of Consumer Prices. If all final total prices were to be rounded up, the one-off inflationary effect would be no more than 0.35 ‰ [0.14 % revenue increase x 25 % proportion of basket of goods]. If, in addition, only the proportion of payments made exclusively in cash is considered, the one-off inflationary effect falls to around 0.25 ‰.
Only individual product price adjustments actually have an effect on the Harmonised Index of Consumer Prices. According to the interview results, however, this would only be expected in the case of a general rounding down of final total prices. If such a rounding rule were implemented, enterprises would have to try to compensate for revenue losses by raising individual prices. Paradoxically, an inflationary effect would occur in the case of a general rounding down of final total prices. In the event of a general rounding down of final total prices, the average revenue loss of 0.17 % for cash payments could, for example, be offset by a general price increase of the same amount for all payments. After adjusting the revenue loss for cash payments, based on an

24
Coins study Impact assessment of rounding in the retail sector
average proportion of cash payments of 70.2 %, the average price increase across the entire product range would be 0.12 %. The one-off inflationary effect measured in the Harmonised Index of Consumer Prices would then be no more than 0.3 ‰ [0.12 % average price increase x 25 % proportion of basket of goods].
In summary, the theoretical and practical effects on the Harmonised Index of Consumer Prices of rounding final total prices to the nearest 5 euro cent increment are marginal in all scenarios.
4 .2 Examining the effects of rounding individual pricesDepending on the rounding scenario, average revenue effects vary greatly (see page 25, Figure 7). Compared with 0.53 % for a “general rounding up” and 0.32 % for “commercial rounding”, the relatively marked revenue effect of -1.5 % for a “general rounding down” is striking. The variations in effect are attributable to the distribution of the final digits of individual prices, especially the common 9 euro cent ending.
The distribution of the final digits of all sold items shows that 62.6 % of all prices end in a 9 euro cent amount, while 22.8 % of all sold items end in a 0 or a 5. All other final digits (1, 2, 3, 4, 6, 7 and 8 euro cents) account for a share of around 2 % each (see page 26, Figure 8). Consequently, approximately 77 % of all individual prices would be rounded and a total of, for example, just under 65 % of all individual prices would be rounded down with a maximum rounding loss. By contrast, in the rounding up scenario a maximum rounding gain would be incurred in only just under 4 % of all cases, which explains the above-mentioned variation of average price effects.
The frequency distribution of individual prices (see page 27, Table 1) also shows that exactly half of all items are sold at the 20 most common prices, which corresponds to a value of just under 30 %. The most common prices of € 0.99, € 1.99 and € 0.49 ac-count for a cumulated share of just under 15 % of all items sold. € 0.99 and € 1.99 are the key threshold prices in the retail sector; exceeding these prices would result in a serious drop in sales.
Price effects of commercial rounding to the nearest 5 euro cent incrementThe commercial rounding of all individual prices to the nearest 5 euro cent increment would give rise to an average price increase of 3.2 ‰ (see page 25, Figure 7). This more

25
Coins study Impact assessment of rounding in the retail sector
pronounced effect in relation to the commercial rounding of final total prices (0.2 ‰) is due, among other things, to the multiple application of the rounding rule. The abso-lute revenue effect when rounding individual prices is greater because each individual item price of a purchase is rounded, resulting in several rounded amounts per sales receipt. By contrast, rounding only occurs once when the final total price is rounded.
Furthermore, the distributions of final digits of final total prices and individual prices differ, which affects the frequency of rounding up or rounding down. Accordingly, 45.6 % of examined final total prices would be rounded up in the case of commercial rounding and 30.5 % would be rounded down. By contrast, around 69 % of all individual prices would be rounded up on the basis of the distribution of individual prices, while just 8.3 % would be rounded down.
Price effects in the examined markets vary between 1.2 ‰ and 6.1 ‰, which is con-siderably wider than the range for the commercial rounding of final total prices (see page 29, Figure 9). However, if the range (difference between the maximum and minimum
Figure 7:Price effects of rounding individual prices
Source: EHI Retail Institute.
General rounding up
.
Commercial rounding
General rounding down
.
.
. . . . .

26
Coins study Impact assessment of rounding in the retail sector
values) is viewed in relation to the respective mean value, the result is less than half that achieved when rounding final total prices.20
Moreover, the range is also distributed more evenly between its extreme values and the mean value. For example, closer inspection of the percentage of range between the mean value and the maximum and minimum values shows that 59 % is distributed above and 41 % below the mean. When final total prices are subject to commercial rounding, the corresponding figures are 71 % and 29 % (see page 29, Figure 10).
This dispersion of the range around the mean is due to different frequency distributions of markets in the case of the commercial rounding of final total prices and individual prices. Here, the selected market sample was divided according to below-average and
Figure 8:Distribution of final digits of individual prices
Source: EHI Retail Institute.
.. . . .
.
. . .
.
20 For the rounding of individual prices, the difference between the maximum and minimum values of the range is 0.49 %. If this value is expressed in relation to the mean value of 0.32 %, the result is 1.53. Using the same calculation method, the resulting value in the case of the commercial rounding of final total prices is 3.5.

27
Coins study Impact assessment of rounding in the retail sector
above-average price effects, and a frequency distribution of individual markets, aggre-gated by market type (discount stores, supermarkets, superstores, hypermarkets and drugstores), was prepared for each sub-group. If these frequency distributions are compared with the overall frequency distribution (without distinguishing between the level of price effect), the difference is smaller when individual prices are rounded than when final total prices are rounded, which explains the more even distribution of the range around the mean value.
Table 1:Distribution of the 20 most common prices
Ranking Price Number % of itemsCum % of items Value
Ranking value % of value
Cum % of value
1 € 0 .99 39,768 6.3 % 6.3 % € 39,370.32 2 3.0 % 3.0 %2 € 1 .99 32,409 5.1 % 11.4 % € 64,493.91 1 4.9 % 7.9 %3 € 0 .49 19,349 3.1 % 14.5 % € 9,481.01 29 0.7 % 8.6 %4 € 0 .79 19,216 3.0 % 17.5 % € 15,180.64 17 1.2 % 9.8 %5 € 1 .49 18,927 3.0 % 20.5 % € 28,201.23 4 2.2 % 12.0 %6 € 1 .29 18,284 2.9 % 23.4 % € 23,586.36 8 1.8 % 13.8 %7 € 0 .89 18,249 2.9 % 26.3 % € 16,241.61 14 1.2 % 15.0 %8 € 0 .59 16,136 2.6 % 28.9 % € 9,520.24 28 0.7 % 15.7 %9 € 1 .79 15,102 2.4 % 31.3 % € 27,032.58 6 2.1 % 17.8 %
10 € 0 .69 13,549 2.1 % 33.4 % € 9,348.81 31 0.7 % 18.5 %11 € 1 .19 13,475 2.1 % 35.5 % € 16,035.25 15 1.2 % 19.7 %12 € 2 .99 12,168 1.9 % 37.5 % € 36,382.32 3 2.8 % 22.5 %13 € 1 .59 11,343 1.8 % 39.3 % € 18,035.37 11 1.4 % 23.9 %14 € 1 .39 10,921 1.7 % 41.0 % € 15,180.19 18 1.2 % 25.0 %15 € 1 .69 10,355 1.6 % 42.6 % € 17,499.95 12 1.3 % 26.4 %16 € 0 .45 9,849 1.6 % 44.2 % € 4,432.05 56 0.3 % 26.7 %17 € 1 .89 9,217 1.5 % 45.6 % € 17,420.13 13 1.3 % 28.0 %18 € 0 .85 9,160 1.5 % 47.1 % € 7,786.00 34 0.6 % 28.6 %19 € 0 .39 9,141 1.4 % 48.5 % € 3,564.99 70 0.3 % 28.9 %20 € 0 .29 8,968 1.4 % 50.0 % € 2,600.72 91 0.2 % 29.1 %
Source: EHI Retail Institute

28
Coins study Impact assessment of rounding in the retail sector
Price effects of a general rounding down to the nearest 5 euro cent incrementIf all individual prices are rounded down to the nearest 5 euro cent increment, the average revenue loss based on the examined sales receipts is 1.5 % (see page 25, Figure 7). Once again, the effect is more pronounced in this scenario than in the case of rounding final total prices (price decrease of 0.17 %). The greatest percentage effect occurs when prices ending in a 9 or 4 euro cent amount are rounded down. In both these cases, the change in price caused by rounding corresponds to the maximum possible value of 4 euro cents. Because this occurs in just 25.3 % of cases when final total prices are rounded, but in 64.8 % of cases when individual prices are rounded, the revenue loss here is greater.
Price effects range from – 0.47 % to – 2.62 % (see page 29, Figure 9) depending on the individual market and sales day. It is determined by the number of items purchased (sales receipt items) and the pricing policy of individual markets. As described above, the largest absolute rounding loss occurs when prices end in 4 or 9 euro cent amounts. The more common these prices are in a market and the fewer items per purchase, the higher the percentage price effect.
Overall, a general rounding down of individual prices would result in a below-average price reduction in just over half of markets, primarily in markets located in rural areas. Markets in urban areas would be affected to a greater extent by an above-average price reduction. This is due to the different average prices per item sold in urban and rural markets. The lower the average item price and the higher the number of items sold, the higher the average price reduction. Accordingly, a lower average item price and a slightly higher average number of items sold were observed in the examined markets in urban areas than those in markets in rural areas.21
Price effects of a general rounding up to the nearest 5 euro cent incrementIn the case of a general rounding up of all individual prices to the nearest 5 euro cent increment, the resulting effect is much less pronounced, giving rise to an average price increase of just 0.53 % (see page 25, Figure 7). By contrast, the average revenue effects of rounding up or down vary less for the rounding of final total prices (0.14 % and
21 For markets in urban areas, the average item price was € 1.87 and the average number of items per sales receipt is 9.1. For markets in rural areas, the respective values were € 2.17 and 8.9.

29
Coins study Impact assessment of rounding in the retail sector
Figure 10:Distribution of ranges around the mean value in the case of commercial rounding
41 %59 %
29 %71 %
Source: Deutsche Bundesbank.
Figure 9:Range of price effects of rounding individual prices
Source: EHI Retail Institute.
General rounding up
Commercial rounding
General rounding down
.
0.13 % to 1.14 %
– 0.47 % to – 2.62 %
0.12 % to 0.61 %
. . . .
Upper extreme value to mean value Lower extreme value to mean value
Distribution when final total prices are rounded
Distribution when individual prices are rounded
30
Coins study Impact assessment of rounding in the retail sector
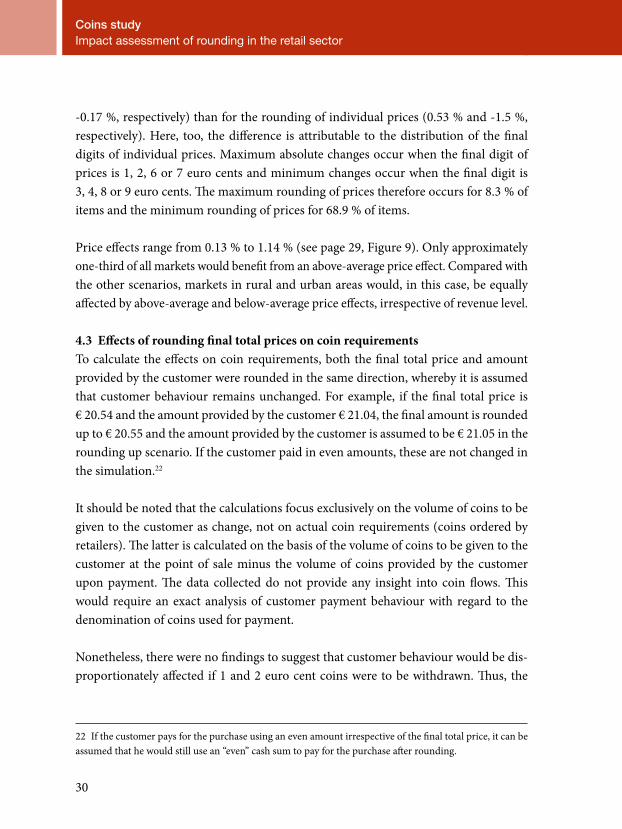
-0.17 %, respectively) than for the rounding of individual prices (0.53 % and -1.5 %, respectively). Here, too, the difference is attributable to the distribution of the final digits of individual prices. Maximum absolute changes occur when the final digit of prices is 1, 2, 6 or 7 euro cents and minimum changes occur when the final digit is 3, 4, 8 or 9 euro cents. The maximum rounding of prices therefore occurs for 8.3 % of items and the minimum rounding of prices for 68.9 % of items.
Price effects range from 0.13 % to 1.14 % (see page 29, Figure 9). Only approximately one-third of all markets would benefit from an above-average price effect. Compared with the other scenarios, markets in rural and urban areas would, in this case, be equally affected by above-average and below-average price effects, irrespective of revenue level.
4 .3 Effects of rounding final total prices on coin requirementsTo calculate the effects on coin requirements, both the final total price and amount provided by the customer were rounded in the same direction, whereby it is assumed that customer behaviour remains unchanged. For example, if the final total price is € 20.54 and the amount provided by the customer € 21.04, the final amount is rounded up to € 20.55 and the amount provided by the customer is assumed to be € 21.05 in the rounding up scenario. If the customer paid in even amounts, these are not changed in the simulation.22
It should be noted that the calculations focus exclusively on the volume of coins to be given to the customer as change, not on actual coin requirements (coins ordered by retailers). The latter is calculated on the basis of the volume of coins to be given to the customer at the point of sale minus the volume of coins provided by the customer upon payment. The data collected do not provide any insight into coin flows. This would require an exact analysis of customer payment behaviour with regard to the denomination of coins used for payment.
Nonetheless, there were no findings to suggest that customer behaviour would be dis-proportionately affected if 1 and 2 euro cent coins were to be withdrawn. Thus, the
22 If the customer pays for the purchase using an even amount irrespective of the final total price, it can be assumed that he would still use an “even” cash sum to pay for the purchase after rounding.

31
Coins study Impact assessment of rounding in the retail sector
following calculations are based on unaltered customer behaviour, which suggests that coin takings will also remain unchanged in proportionate terms.
The reduction in coins from 8 to 6 denominations is not reflected equally in actual coin requirements (the assumed reduction would be 25 %). In the initial analysis, the proportion of 1 and 2 euro cent coins accounted for just over 29 % of all coins required; however, shifts to other coins lead to much lower reductions in two scenarios (coins required in rolls and value) (see pages 32-33, Table 2).
In addition, it should be noted that it is not the number of coins, but the number of coin rolls that is significant for retailers, especially with regard to potential cost sa-vings. Because 1, 2, and 5 euro cent coins are rolled in units of 50 and all other deno-minations in lower unit numbers (40 or 25), the decrease in the number of rolls requi-red is much less pronounced.
Coin effects of commercial rounding of final total prices to the nearest 5 euro cent incrementIn the case of commercial rounding of final total prices to the nearest 5 euro cent increment, the quantity of coins required would decrease by around 26 % based on the sales receipts examined (see page 34, Figure 11) and the number of coin rolls by almost 20 % (see page 35, Figure 12). Requirements would shift most notably towards 5 euro cent coins, which would lead to an increase in demand of approximately 23 % compared with current requirements (see pages 36 – 37, Table 3). Further shifts would lead to increased demand for 10, 20 and 50 euro cent coins of well below 3 %.
Coin effects of a general rounding down of final total prices to the nearest 5 euro cent incrementIn the case of a general rounding down of final total prices to the nearest 5 euro cent increment, the quantity of coin units required would decrease by only just under 20 % (see page 34, Figure 11) and the quantity of coin rolls (see page 35, Figure 12) by only just under 15 %. Substitution effects with other coins are therefore significantly greater. Demand for 5 euro cent coins would increase by more than 70 %, demand for 10 euro cent coins by almost 9 % and demand for 20 euro cent coins by just under 5 % (see pages 36 – 37, Table 3). Savings effects are therefore lowest in the case of a general rounding down of final total prices.

32
Coins study Impact assessment of rounding in the retail sector
Table 2 :Effects of rounding final total prices on coin requirements
Sim
ulat
ion
of fi
nal t
otal
pri
ce a
nd a
mou
nt p
rovi
ded
Scenario € 2 .00 € 1 .00 € 0 .50 € 0 .20 € 0 .10 € 0 .05 € 0 .02 € 0 .01 UnitsCoins required (units)
Status quo 21,187 15,027 13,660 23,134 14,493 14,983 24,166 17,928 144,578
Commercial Rounding 21,181 15,049 13,839 23,515 14,866 18,395 0 0 106,845
Rounding down 21,252 15,083 14,200 24,282 15,727 25,711 0 0 116,255
Rounding up 21,166 15,033 13,621 23,044 14,508 14,961 0 0 102,333
Change (%)
Status quo 21,187 15,027 13,660 23,134 14,493 14,983 24,166 17,928 144,578
Commercial Rounding - 0.03 % 0.15 % 1.31 % 1.65 % 2.57 % 22.77 % – – - 26.10 %
Rounding down 0.31 % 0.37 % 3.95 % 4.96 % 8.51 % 71.60 % – – - 19.59 %
Rounding up - 0.10 % 0.04 % - 0.29 % - 0.39 % 0.10 % - 0.15 % – – - 29.22 %
Scenario € 2 .00 € 1 .00 € 0 .50 € 0 .20 € 0 .10 € 0 .05 € 0 .02 € 0 .01 RollsCoins required (rolls)
Status quo 847 601 342 578 362 300 483 359 3,872
Commercial Rounding 847 602 346 588 372 368 0 0 3,123
Rounding down 850 603 355 607 393 514 0 0 3,323
Rounding up 847 601 341 576 363 299 0 0 3,027
Change (%)
Status quo 847 601 342 578 362 300 483 359 3,872
Commercial Rounding - 0.03 % 0.15 % 1.31 % 1.65 % 2.57 % 22.77 % – – - 19.36 %
Rounding down 0.31 % 0.37 % 3.95 % 4.96 % 8.51 % 71.60 % – – - 14.19 %
Rounding up - 0.10 % 0.04 % - 0.29 % - 0.39 % 0.10 % - 0.15 % – – - 21.84 %
Scenario € 2 .00 € 1 .00 € 0 .50 € 0 .20 € 0 .10 € 0 .05 € 0 .02 € 0 .01 ValueCoins required (value)
Status quo € 42,374.00 € 15,027.00 € 6,830.00 € 4,626.80 € 1,449.30 € 749.15 € 483.32 € 179.28 € 71,718.85
Commercial Rounding € 42,362.00 € 15,049.00 € 6,919.50 € 4,703.00 € 1,486.60 € 919.75 – – € 71,439.85
Rounding down € 42,504.00 € 15,083.00 € 7,100.00 € 4,856.40 € 1,572.70 € 1,285.55 – – € 72,401.65
Rounding up € 42,332.00 € 15,033.00 € 6,810.50 € 4,608.80 € 1,450.80 € 748.05 – – € 70,983.15
Based only on cash payments with documentation of the amount provided (53,933 sales receipts)
Change (%)
Status quo € 42,374.00 € 15,027.00 € 6,830.00 € 4,626.80 € 1,449.30 € 749.15 € 483.32 € 179.28 € 71,718.85
Commercial Rounding - 0.03 % 0.15 % 1.31 % 1.65 % 2.57 % 22.77 % – – - 0.39 %
Rounding down 0.31 % 0.37 % 3.95 % 4.96 % 8.51 % 71.60 % – – 0.95 %
Rounding up - 0.10 % 0.04 % - 0.29 % - 0.39 % 0.10 % - 0.15 % – – - 1.03 %

33
Coins study Impact assessment of rounding in the retail sector
Table 2 :Effects of rounding final total prices on coin requirements
Sim
ulat
ion
of fi
nal t
otal
pri
ce a
nd a
mou
nt p
rovi
ded
Scenario € 2 .00 € 1 .00 € 0 .50 € 0 .20 € 0 .10 € 0 .05 € 0 .02 € 0 .01 UnitsCoins required (units)
Status quo 21,187 15,027 13,660 23,134 14,493 14,983 24,166 17,928 144,578
Commercial Rounding 21,181 15,049 13,839 23,515 14,866 18,395 0 0 106,845
Rounding down 21,252 15,083 14,200 24,282 15,727 25,711 0 0 116,255
Rounding up 21,166 15,033 13,621 23,044 14,508 14,961 0 0 102,333
Change (%)
Status quo 21,187 15,027 13,660 23,134 14,493 14,983 24,166 17,928 144,578
Commercial Rounding - 0.03 % 0.15 % 1.31 % 1.65 % 2.57 % 22.77 % – – - 26.10 %
Rounding down 0.31 % 0.37 % 3.95 % 4.96 % 8.51 % 71.60 % – – - 19.59 %
Rounding up - 0.10 % 0.04 % - 0.29 % - 0.39 % 0.10 % - 0.15 % – – - 29.22 %
Scenario € 2 .00 € 1 .00 € 0 .50 € 0 .20 € 0 .10 € 0 .05 € 0 .02 € 0 .01 RollsCoins required (rolls)
Status quo 847 601 342 578 362 300 483 359 3,872
Commercial Rounding 847 602 346 588 372 368 0 0 3,123
Rounding down 850 603 355 607 393 514 0 0 3,323
Rounding up 847 601 341 576 363 299 0 0 3,027
Change (%)
Status quo 847 601 342 578 362 300 483 359 3,872
Commercial Rounding - 0.03 % 0.15 % 1.31 % 1.65 % 2.57 % 22.77 % – – - 19.36 %
Rounding down 0.31 % 0.37 % 3.95 % 4.96 % 8.51 % 71.60 % – – - 14.19 %
Rounding up - 0.10 % 0.04 % - 0.29 % - 0.39 % 0.10 % - 0.15 % – – - 21.84 %
Scenario € 2 .00 € 1 .00 € 0 .50 € 0 .20 € 0 .10 € 0 .05 € 0 .02 € 0 .01 ValueCoins required (value)
Status quo € 42,374.00 € 15,027.00 € 6,830.00 € 4,626.80 € 1,449.30 € 749.15 € 483.32 € 179.28 € 71,718.85
Commercial Rounding € 42,362.00 € 15,049.00 € 6,919.50 € 4,703.00 € 1,486.60 € 919.75 – – € 71,439.85
Rounding down € 42,504.00 € 15,083.00 € 7,100.00 € 4,856.40 € 1,572.70 € 1,285.55 – – € 72,401.65
Rounding up € 42,332.00 € 15,033.00 € 6,810.50 € 4,608.80 € 1,450.80 € 748.05 – – € 70,983.15
Based only on cash payments with documentation of the amount provided (53,933 sales receipts)
Change (%)
Status quo € 42,374.00 € 15,027.00 € 6,830.00 € 4,626.80 € 1,449.30 € 749.15 € 483.32 € 179.28 € 71,718.85
Commercial Rounding - 0.03 % 0.15 % 1.31 % 1.65 % 2.57 % 22.77 % – – - 0.39 %
Rounding down 0.31 % 0.37 % 3.95 % 4.96 % 8.51 % 71.60 % – – 0.95 %
Rounding up - 0.10 % 0.04 % - 0.29 % - 0.39 % 0.10 % - 0.15 % – – - 1.03 %

34
Coins study Impact assessment of rounding in the retail sector
In this scenario, the average difference compared to the amount provided is greater as no rounding down occurs when even amounts are provided. This is because it is assu-med that customer payment behaviour remains the same. This results in a dispropor-tionate reduction in the quantity of coin units required (down 19.6 %) compared with commercial rounding.
Coin effects of a general rounding up of final total prices to the nearest 5 euro cent incrementThe greatest savings would be achieved in the case of a general rounding up of final total prices. The quantity of coin units required would decrease by just under 30 % and the quantity of coin rolls by just over 20 %. In this case, there are virtually no substitution effects with other coins.
The lack of shifts can be explained by the statistical distribution of the final digits of purchase amounts. Prior to rounding, a 5 euro cent coin is required as change for 42.3 % of all final total prices, where the customer does not pay the exact amount (see
Figure 11:Percentage decrease in coin units by rounding scenario
Source: EHI Retail Institute.
General rounding upCommercial rounding General rounding down
..
.

35
Coins study Impact assessment of rounding in the retail sector
pages 36 – 37, Table 4). This corresponds exactly to the frequency of 5 euro cent coins required after the rounding up of all final total prices. This means that, in this scenario, 1 and 2 euro cent coins can be eliminated completely without giving rise to increased demand for other coins.
In the case of a general rounding up of final total prices, the average difference compared to the amount provided becomes smaller because even amounts are not rounded up. Compared with commerical rounding, this results in a disproportionate decrease in the quantity of coin units required of -29.2 % (see page 34, Figure 11). The sales receipts examined show that a large proportion of payments are paid in even amounts. This compounds the above-mentioned relationship.
Figure 12:Percentage decrease in coin rolls by rounding scenario
– 25
– 20
– 15
– 10
– 5
0
%
Source: EHI Retail Institute.
General rounding up
– 19.4
Commercial rounding General rounding down
– 14.2
– 21.8

36
Coins study Impact assessment of rounding in the retail sector
Table 3 :Shifts to other coins (units)
Sim
ulat
ions
of fi
nal t
otal
pri
ce a
nd a
mou
nt p
rovi
ded Scenario € 2 .00 € 1 .00 € 0 .50 € 0 .20 € 0 .10 € 0 .05 € 0 .02 € 0 .01 Units
Coins required (units)
Status quo 21,187 15,027 13,660 23,134 14,493 14,983 24,166 17,928 144,578
Commercial rounding 21,181 15,049 13,839 23,515 14,866 18,395 0 0 106,845
Rounding down 21,252 15,083 14,200 24,282 15,727 25,711 0 0 116,255
Rounding up 21,166 15,033 13,621 23,044 14,508 14,961 0 0 102,333
Change (%)
Status quo 21,187 15,027 13,660 23,134 14,493 14,983 24,166 17,928 144,578
Based only on cash payments with documentation of the amount provided (53,933 sales receipts)
Commercial rounding - 0.03 % 0.15 % 1.31 % 1.65 % 2.57 % 22.77 % – – - 26.10 %
Rounding down 0.31 % 0.37 % 3.95 % 4.96 % 8.51 % 71.60 % – – - 19.59 %
Rounding up - 0.10 % 0.04 % - 0.29 % - 0.39 % 0.10 % - 0.15 % – – - 29.22 %
Table 4 :Distribution of final digits of final total prices
Final digit
Absolute distribution Percentage distribution
Actual number Rounding upCommercial
RoundingRounding
down Actual number Rounding upCommercial
RoundingRounding
down
0 6,646 31,099 29,171 23,164 12.3 % 57.7 % 54.1 % 42.9 %
1 3,474 --- --- --- 6.4 % --- --- ---
2 3,736 --- --- --- 6.9 % --- --- ---
3 4,266 --- --- --- 7.9 % --- --- ---
4 5,041 --- --- --- 9.3 % --- --- ---
5 6,319 22,834 24,762 30,769 11.7 % 42.3 % 45.9 % 57.1 %
6 4,227 --- --- --- 7.8 % --- --- ---
7 4,909 --- --- --- 9.1 % --- --- ---
Based only on cash payments with documentation of the amount provided (53,933 sales receipts)
8 6,539 --- --- --- 12.1 % --- --- ---
9 8,776 --- --- --- 16.3 % --- --- ---
53,933 53,933 53,933 53,933 100.0 % 100.0 % 100.0 % 100.0 %

37
Coins study Impact assessment of rounding in the retail sector
Table 3 :Shifts to other coins (units)
Sim
ulat
ions
of fi
nal t
otal
pri
ce a
nd a
mou
nt p
rovi
ded Scenario € 2 .00 € 1 .00 € 0 .50 € 0 .20 € 0 .10 € 0 .05 € 0 .02 € 0 .01 Units
Coins required (units)
Status quo 21,187 15,027 13,660 23,134 14,493 14,983 24,166 17,928 144,578
Commercial rounding 21,181 15,049 13,839 23,515 14,866 18,395 0 0 106,845
Rounding down 21,252 15,083 14,200 24,282 15,727 25,711 0 0 116,255
Rounding up 21,166 15,033 13,621 23,044 14,508 14,961 0 0 102,333
Change (%)
Status quo 21,187 15,027 13,660 23,134 14,493 14,983 24,166 17,928 144,578
Based only on cash payments with documentation of the amount provided (53,933 sales receipts)
Commercial rounding - 0.03 % 0.15 % 1.31 % 1.65 % 2.57 % 22.77 % – – - 26.10 %
Rounding down 0.31 % 0.37 % 3.95 % 4.96 % 8.51 % 71.60 % – – - 19.59 %
Rounding up - 0.10 % 0.04 % - 0.29 % - 0.39 % 0.10 % - 0.15 % – – - 29.22 %
Table 4 :Distribution of final digits of final total prices
Final digit
Absolute distribution Percentage distribution
Actual number Rounding upCommercial
RoundingRounding
down Actual number Rounding upCommercial
RoundingRounding
down
0 6,646 31,099 29,171 23,164 12.3 % 57.7 % 54.1 % 42.9 %
1 3,474 --- --- --- 6.4 % --- --- ---
2 3,736 --- --- --- 6.9 % --- --- ---
3 4,266 --- --- --- 7.9 % --- --- ---
4 5,041 --- --- --- 9.3 % --- --- ---
5 6,319 22,834 24,762 30,769 11.7 % 42.3 % 45.9 % 57.1 %
6 4,227 --- --- --- 7.8 % --- --- ---
7 4,909 --- --- --- 9.1 % --- --- ---
Based only on cash payments with documentation of the amount provided (53,933 sales receipts)
8 6,539 --- --- --- 12.1 % --- --- ---
9 8,776 --- --- --- 16.3 % --- --- ---
53,933 53,933 53,933 53,933 100.0 % 100.0 % 100.0 % 100.0 %
Total
42 .3 %

38
Coins study Impact assessment of rounding in the retail sector
5 Results of qualitative interviews
5 .1 Preliminary remarks and general findingsThe interviews clearly showed that participating retail enterprises have not yet, or at least not yet intensively, addressed the possible effects of a rounding rule and the various courses of action. The initial assessments were therefore provided more or less spontaneously.
It should be added by way of qualification that the opinions expressed in the interviews are preliminary declarations of intent only. It is therefore not possible to assess whether actual behaviour after the introduction of a rounding rule will correspond with the subjective opinions expressed. The majority of participants stated at the beginning of the interview that the answers provided were initial personal opinions since no corpo-rate strategies are yet available on this issue. In the event of a legal ruling, the enterprises intend to carry out a detailed analysis of the specific potential effects on their business and use that as a basis for their internal decisions.
Essentially, the withdrawal of 1 and 2 euro cent coins is not a priority issue for retailers. Most view the topic with a certain scepticism as there do not appear to be any clear advantages. Although they recognise that simplifications would be one benefit, they believe that the associated cost reductions would be low. The withdrawal of 1 and 2 euro cent coins is not considered to be necessary, and questions remain regarding profile enhancement opportunities for retailers as well as customer acceptance and customer wishes.
Nonetheless, around one-third of participants find the prospect very interesting, but maintain that further analysis of the possible effects is required before any decisions are made. This shows that strategic considerations have yet to be made. Given retailer reticence, it is unlikely that any of the participating retail enterprises will act of their own accord. There is also no willingness to lead by example when it comes to rounding final total prices.
The propensity to change individual prices is very low in the retail sector. None of the enterprises interviewed would change their item prices or existing pricing system if this were not necessary. The pricing systems used by enterprises have proven their

39
Coins study Impact assessment of rounding in the retail sector
worth over many years, have in some cases been optimised based on scientific methods and take into account psychological price thresholds, competitive pricing and achievable sales volumes. In some enterprises, they give retailers a competitive edge, are based on item-specific rather than general considerations, and are accepted and expected by customers in their prevalent form. Thus, any calculation which aims to simulate a general price change to the nearest price level (whatever form that might take) would be far removed from reality and of no informative value for the actual pricing behaviour of retail enterprises.
Almost all interview partners assume that the behaviour of leading food discount stores, in particular, will play a crucial role in the implementation of any rules for rounding final total prices and possible price adjustments in the food retail sector as a whole. Owing to strong competition, however, none of the enterprises interviewed expect price levels to rise in the three scenarios. In this connection, three retailers in-dependently cited the example of the introduction of the euro. Leading discount stores reduced (rounded down) their prices at that time and all other food retailers were forced to do the same for relevant “key items”, resulting in margin losses for these re-tailers. However, this effect was never perceived as such by consumers.
In the event of a statutory regulation, almost all enterprises would favour the commer-cial rounding of final total prices as this is considered equally fair for customers and retailers and would not necessitate price changes. The price level would therefore not be affected, either as a result of adjusting individual prices (to compensate for losses in the event of a general rounding down of final total prices) or as a result of direct effects on the Harmonised Index of Consumer Prices.23 In the medium term, almost half of all interviewees believe that competitive behaviour could result in a race to round down prices.
23 In the case of a commercial rounding rule, the resulting increase in revenue and therefore the aggregated final total price to be paid by all customers is 0.2 ‰. The Harmonised Index of Consumer Prices would not be affected as this only takes into account shelf prices. There should also be no “perceived” increase in the price level as the revenue effect weighted by the proportion of cash payments and the proportion of the consumer basket would be 0.04 ‰. Because retailers would not incur any losses as a result of the commercial rounding of final total prices, it would also not be necessary to adjust individual prices to compensate for losses.

40
Coins study Impact assessment of rounding in the retail sector
In the opinion of the interview partners, a general rounding down would inevitably lead to certain price changes as the average revenue loss of 0.16 % for cash payments, as calculated by this EHI Retail Institute study, would be unacceptable. Furthermore, the expected reduction in the quantity of coin units required of around 15 % in the case of a general rounding down cannot compensate for revenue losses when savings are expected to amount to no more than 0.01 % of cash revenue.
5 .2 Saving effects of eliminating small coins in cash handling Eliminating 1 and 2 euro cent coins could have various saving effects for retailers in the area of cash handling. The participating enterprises believe that savings potential exists only in terms of time savings in cash transactions, when filling and cashing up individual points of sale and in the cash office, and with regard to the cost of coin supplies.
Discussions with interview partners showed that a small time-saving effect per cash transaction can potentially be expected – an estimated average of around two to three seconds per cash transaction according to the interview partners. However, most are extremely sceptical as to whether this will actually lead to any realisable savings.
In mathematical terms, a full-time employee who serves around 250 to 300 customers per day could save up to 15 minutes per shift. However, in view of a high number of part-time employees and the fact that points of sale are rarely staffed simultaneously, it is highly questionable whether any reduction in cashier hours24 can actually be achieved. In two enterprises, there are also additional restrictions (constant flow of customers, cash desk) which explicitly prevent the cost savings from cashier hours which would result from the withdrawal of 1 and 2 euro cent coins.
For the vast majority of retail enterprises, no actual savings can therefore be expected at the point of sale. Only in large retail enterprises where many points of sale are staffed simultaneously would it be possible to realise minimal savings; however, these cannot be quantified by the enterprises at present.
To assess the situation, EHI Retail Institute also carried out an evaluation of around 2,400 time measurements taken at supermarket checkouts in 2012 based on the final
24 A cashier hour is the working time in hours spent at the point of sale.

41
Coins study Impact assessment of rounding in the retail sector
digit of sales receipts. The average payment time for final total prices ending in 0 or 5 euro cent increments was, however, not significantly shorter than in the case of all other final digits. The shortest average payment time was measured for final total prices ending in a nine. It can therefore be assumed that, when exchanging small coins, the time taken by the cashier to dispense change plays only a secondary role, while it is much more time-consuming for customers to pay using small coins.
There is virtually no savings potential for enterprises with regard to filling cash drawers. The same applies to the cashing-up of individual points of sale as almost all surveyed enterprises weigh coins by denomination. The weighing process is so fast that the omission of two coin denominations would make little difference. It would be a question of a few seconds per process which, according to the interviewees, would have no impact on cost-effectiveness.
While the interviewees believe that the activities of the cash office would be simplified to a certain extent, the supply of coins would still have to be replenished at individual points of sale and change would still have to be ordered and delivered in the cash office. The elimination of two coin denominations therefore offers almost no savings potential. Likewise, no significant advantages are expected with regard to balancing the cash drawers.
The enterprises are somewhat sceptical with regard to the potential savings which can be realised from lower capital commitments following the elimination of 1 and 2 euro cent coins as the associated values are relatively low. Some interviewees suggested that shifts to other coins could even increase capital commitments for change.
Ultimately, eliminating 1 and 2 euro cent coins cost could give rise to cost savings with regard to the supply of coins. These are analysed in greater detail in the next section.
Overall, the enterprises believe that slight advantages could be achieved with regard to handling and process simplifications. However, because no process steps are omitted, the potential to convert these advantages into actual cost savings is considered to be low. The enterprises are therefore able to identify few advantages for cash handling.

42
Coins study Impact assessment of rounding in the retail sector
5 .3 Savings potential for the supply of coinsThe surveyed enterprises therefore expect tangible and measurable savings to be gene-rated almost exclusively in the reduction of procurement costs for coin rolls.
The interviewees estimate that the reduction in the quantity of coin rolls required would be between 15 % and 30 %, whereby these estimates are based only on current orders as shifts to other coin denominations cannot be assessed with any degree of certainty.
Based on the coin scenario of commercial rounding with a reduction in the quantity of coin rolls required of just under 20 %, around 55,000,000 rolls could be saved per year based on the annual cash revenue for the entire food retail sector and drugstore market of around € 110 billion and an annual requirement of around 280,000,000 coin rolls. Valued at current roll prices, this corresponds to around € 4.5 million or 0.041 ‰ of cash revenue. In the event of a general rounding down of purchase amounts, the saving would only be around € 3.4 million per year or 0.031 ‰ of cash revenue.
5 .4 Price effects by rounding scenarioIf final total prices were subject to commercial rounding, there would be virtually no need for enterprises to change item prices. Only in the case of items which are frequently sold individually and cost less than € 1 would rounding prices to the nearest 5 euro cent increment be conceivable.
The enterprises generally rule out, or at least consider extremely unlikely, a general rounding of individual prices to the nearest 5 euro cent increment. However, this does not rule out individual price adjustments. Most enterprises do not currently see any potential to enhance their profile in rounding individual prices to the nearest 5 euro cent increment, but remain open to making decisions in individual cases once they have monitored the competition. A great many prices are at or close to price thresholds which, primarily for psychological pricing reasons, cannot be exceeded without enter-prises anticipating margin losses. Enterprises are therefore very keen to stick to their existing pricing policies.
Even if price adjustments were necessary (for example, in the case of a general rounding down), most retailers would not deviate from their existing prices. A shift to prices ending in 0 and 5 euro cent amounts is therefore not expected. The interviewees did

43
Coins study Impact assessment of rounding in the retail sector
not comment on the possibility of individual price changes in the case of a general rounding up of purchase amounts, as this scenario has essentially been ruled out.
Due to intense competition and the enormous associated price pressure, participating enterprises agree that, in all scenarios, there is no opportunity to force through price increases beyond existing price levels.
If price adjustments have to be made in the case of a general rounding down of final total prices, the enterprises are currently unable to predict what form that could take. One thing is clear: the key psychological price thresholds, notably € 0.99, € 1.99 and € 2.99 as well as some others for certain enterprises, would certainly not be exceeded. It is much more likely that low-price items would move up to threshold prices and only in cases where consumers are unaware of the item price or demand for the item is not especially price-elastic would these thresholds be exceeded. In the medium term, content adjustments by industry, for example, would also be conceivable.
All in all, the decision-making process is highly complex and invariably different for each item, which makes it difficult to predict behaviour as there are many uncertain factors. Nonetheless, it is highly unlikely that the existing price level would be exceeded overall.
6 Cost of cash logistics in the retail sector
Findings from interviews with cash logistics specialistsAll 11 interviewed specialists for cash logistics and cash management currently have no difficulties in the areas of coin storage, ordering, supply and needs forecasting. However, they state that the cost of procuring coins has risen considerably since 2010. Rough estimates from the interviews suggest that the prices have risen by between 40 % and 60 %, which is consistent with the calculations below.
Normal seasonal fluctuations aside, none of the enterprises have recorded any perceptible change in coin order quantities. This is true of both storage in branches and order frequency. Only as a result of revenue growth or branch expansion have quantity structures changed at the interviewed enterprises.

44
Coins study Impact assessment of rounding in the retail sector
All enterprises constantly endeavour to optimise their branches’ disposal cycles; however, no major changes were observed at any of the participating enterprises between 2010 and 2012. Three enterprises stated that they had reduced the average number of disposal collections from their branches from 3.2 to 3.1 and from 3.1 to 3.0 per week. It can therefore be assumed that disposal frequency in the retail sector remained virtually unchanged over-all. According to the retailers, there is little potential to further reduce disposal frequency.
In addition, the retailers report no difficulties in receiving supplies from cash-in-transit companies. On the contrary, processes are largely standardised, monitored and tested. More than half of all interviewees believe that processes are now better and more secure, even if many also say that prices have risen considerably. The exchange of cash when ordering change has now largely been replaced by centralised transfers. There are currently no known shortages and there were very few in the past. Only three enterprises indicated that they had experienced supply problems once in the last two years. They subsequently experienced no such problems.
The enterprises believe that customers have few problems distinguishing between 1 and 2 euro cent coins and say that distinguishing between 2 and 5 euro cent coins is more of a problem.
Payment delays during transactions at the point of sale invariably occur when customers pay using large amounts of small coins; however, enterprises do not consider this to be a problem.
Retail enterprises expect the cost of cash logistics to rise further. Owing mainly to rises in negotiated rates of pay in the cash transport industry, significant price increases are anticipated, above all, in the case of stop prices and coin rolls. Small retail enterprises, in particular, anticipate further rises in the cost of coin supplies.
From the perspective of cash-in-transit companies, vehicles are loaded with change up to the maximum load limit because armoured vehicles have a maximum load capacity of 500 to 800 kilograms. Coins therefore regularly have to be delivered as part of disposal collections. Orders of larger quantities by individual enterprises would mean that only a few retailers could receive deliveries per trip owing to weight restrictions. Fewer coins in the retail sector would therefore provide greater flexibility.

45
Coins study Impact assessment of rounding in the retail sector
According to cash-in-transit companies, the process of supplying coins is largely unproblematic. Difficulties only arise when special requests are made which deviate from standardised procedures, for example, requests for loose coins to fill back-office vending machines. This opinion is shared by retail enterprises.
Cost types and general remarksThe total cost of external cash supply and disposal in the retail sector consists mainly of the cost of supplying change as well as cash transport costs and cash handling costs.
The cost of supplying change is usually reflected in roll prices (euro cents per roll). In addition to the price per roll, some enterprises also pay a lump sum per order/delivery to the cash-in-transit company. Through the involvement of banks, retail enterprises are usually also charged a “recycling fee” of around 4 euro cents per roll either directly by the bank, a process service provider, or via the cash-in-transit company. To improve cost comparability, the costs were calculated on a per roll basis and added to the typi-cally lower roll prices.
Cash transport costs are usually expressed in terms of stop prices. Most enterprises have agreed monthly lump-sum prices for cash transport which, for the sake of com-parability, have been converted into average stop prices.
Cash handling costs in cash centres are usually calculated as a percentage of the cash value to be processed. In some cases, minimum charges per safebag25 (or the equivalent) also apply. However, coin disposal is extremely rare for retail companies as demand for coins is usually high in the retail sector.26
In addition to the above-mentioned costs, deposit fees also apply at Bundesbank branches or commercial banks, as do the resulting booking fees, which are not explicitly levied. Overall, however, these do not account for a large proportion of the total cost of external cash logistics. In most cases, deposit costs for chains with a high branch
25 Safebags are a common type of packaging for cash and are used to separate smaller monetary units. Containers are also used for larger monetary quantities.26 Exception: when exact daily takings are removed from premises (usually for organisational reasons), excess coins are also removed.

46
Coins study Impact assessment of rounding in the retail sector
density are negligible. If cash from several branches is deposited in one sum, deposit and booking fees account for less than 1 % or just a few percent of costs. Only in indi-vidual cases, when lower cash quantities are deposited and booked – for instance, the takings from just one branch – can deposit and booking fees account for more than 5 % of total external cash logistics costs.
The average values for roll prices, stop prices and cash handling costs are of limited informative value as the respective enterprise-specific circumstances must also be taken into account. For example, when roll prices are low, stop prices or cash handling costs are often high, and vice versa. Ultimately, all three cost items must be analysed together as pricing by cash-in-transit companies is often based on mixed calculations.
The main cost components of external cash supply and disposal are usually transport costs and cash handling costs, which each account for between 30 % and 50 %, while the cost of supplying change normally accounts for no more than 10 % to 20 % of the total cost of external cash logistics. Owing to the above-mentioned “mixed calculations” and differing quantity structures, however, the components of cost vary greatly in reality.
In the case of nationwide chains, in particular, it is difficult to determine the average value. Regional differences in transport costs have a major impact. Disposal cycles and cash volumes also vary greatly depending on the size of the branch.
With regard to external transport costs, enterprise-specific factors which affect the three cost components of external cash supply and disposal are the tightness of the defined time windows and the time of day (fixed or flexible collection times/collection windows), branch density in the “collection region”, frequency of collections per business per week, accessibility of the collection point and proximity to other collection points. Another enterprise-specific factor is the duration of the collection/disposal transaction itself (excluding the cash transport vehicle), which depends on local infrastructure.
The total annual order volume, frequency of orders per week and total roll weight per order are the decisive factors for roll prices. Enterprise-specific factors for cash hand-ling costs are the average content of a safebag (value or number of banknotes) and banknote-only or mixed safebags (for example, banknotes and excess coins when all takings are removed from premises).

47
Coins study Impact assessment of rounding in the retail sector
Comparative cost of cash logistics from 2010 to 2012
Development of roll prices from 2010 to 2012According to retail enterprises, roll prices increased by an unweighted average of almost 53 % in the two years from 2010 to 2012. The increase is even slightly higher in the case of the average weighted according to the number of rolls procured per year, which is just under 54 %, thus confirming this trend (see pages 48 – 49, Table 5).
The main reason for the considerable price hikes is the involvement of at least one other partner, namely banks. Depending on the business model, additional costs are also incurred by involving further process service providers in the supply of coins.
Retail enterprises which do not generate large orders of coin rolls currently pay at least € 0.10 to € 0.12 per roll to the cash-in-transit company plus a direct or indirect “recy-cling fee” of around € 0.04 per roll to the bank or process service provider. The average values calculated are therefore prices which apply exclusively to large retail enterprises.
Development of stop prices from 2010 to 2012The cash transport costs expressed in terms of stop prices have increased from € 17.25 to € 18.23 as an arithmetic average in the last two years (see pages 48 – 49, Table 6). This represents an average increase of 5.6 %, which corresponds roughly to the average increase in wages in the cash-in-transit sector. While average stop prices in western Germany rose by just under 5 %, those in eastern Germany increased by close to 10 % due to higher collectively agreed wages. Development of cash handling costsIn the period from 2010 to 2012, cash handling costs rose relatively sharply, by 8.2 %, as an arithmetic average (see pages 48 – 49, Table 7). Excluding outliers, the average price increase is just 5.9 %, which provides a more realistic reflection of the situation for most market participants.
Cost of cash logistics as a percentage of cash revenueIn general, the cost of external cash logistics remains within a relatively narrow range of between 1.5 ‰ and 2.3 ‰ of the monetary value to be processed, excluding outliers. In 2010, the range was between 0.62 ‰ and 2.11 ‰ of cash revenue and, in 2012,

48
Coins study Impact assessment of rounding in the retail sector
Table 528 :Developmentof average roll prices
Source: EHI Retail Institute
Overview of individual values for the cost of supplying change: average roll prices
E-1 E-2 E-3 E-4 E-5 E-6 E-7 E-8 E-9 E-10 E-11 Average
2010 € 0.050 € 0.050 € 0.040 € 0.055 € 0.041 € 0.045 € 0.040 € 0.070 € 0.050 € 0.060 € 0.080 € 0.053
2012 € 0.080 € 0.070 € 0.081 € 0.087 € 0.056 € 0.085 € 0.040 € 0.100 € 0.074 € 0.095 € 0.120 € 0.081
Change 60.0 % 40.0 % 102.5 % 58.2 % 36.6 % 88.9 % 0.0 % 42.9 % 48.0 % 58.3 % 50.0 % 52.8 %
Table 6:Developmentof average stop prices
Source: EHI Retail Institute
Overview of individual values for cash transport costs: average stop prices
E-1 E-2 E-3 E-4 E-5 E-6 E-7 E-8 E-9 E-10 E-11 Average
2010 € 14.80 € 24.00 € 14.48 € 16.11 € 16.50 € 14.85 € 21.00 € 17.75 € 16.70 € 15.20 € 18.40 € 17.25
2012 € 15.10 € 24.81 € 15.30 € 16.93 € 17.33 € 15.79 € 22.00 € 19.07 € 17.65 € 16.10 € 20.40 € 18.23
Change 2.03 % 3.37 % 5.66 % 5.09 % 5.03 % 6.33 % 4.76 % 7.44 % 5.69 % 5.92 % 10.87 % 5.63 %
Table 7:Development of cash handling costs
Source: EHI Retail Institute
Overview of individual values of cash handling costs as a percentage of monetary value to be processed
E-1 E-2 E-3 E-4 E-5 E-6 E-7 E-8 E-9 E-10 E-11 Average
2010 0.032 % 0.044 % 0.031 % 0.047 % n/a 0.038 % 0.043 % 0.048 % 0.043 % 0.045 % 0.037 % 0.041 %
2012 0.034 % 0.047 % 0.031 % 0.060 % n/a 0.040 % 0.046 % 0.050 % 0.046 % 0.048 % 0.039 % 0.044 %
Change 6.25 % 6.82 % 1.96 % 29 27.66 % n/a 5.26 % 6.05 % 4.17 % 6.98 % 6.67 % 5.41 % 8.15 %
Table 8:Developmentof the total cost of external cash logisticsSource: EHI Retail Institute
Overview of individual values of total cost of external cash logistics as a percentage of cash revenue
R-1 R-2 R-3 R-4 R-5 R-6 R-7 R-8 R-9 R-10 R-11 Average
2010 0.149 % 0.203 % 0.062 % 0.140 % 0.148 % 0.094 % 0.151 % 0.145 % 0.172 % 0.211 % 0.165 % 0.149 %
2012 0.151 % 0.212 % 0.065 % 0.150 % 0.159 % 0.102 % 0.165 % 0.159 % 0.190 % 0.236 % 0.185 % 0.161 %
Change 1.34 % 4.43 % 4.84 % 7.14 % 7.43 % 8.51 % 9.27 % 9.66 % 10.47 % 11.85 % 12.12 % 8.17 %
28 E-1 stands for enterprise 1, E-2 for enterprise 2, etc.29 Here, handling costs as a percentage of the monetary value to be processed are shown as 0.031 % in both cases due only to rounding. The change of 1.96 % results from handling costs of 0.0306 % for 2010 and 0.0312 % for 2012.
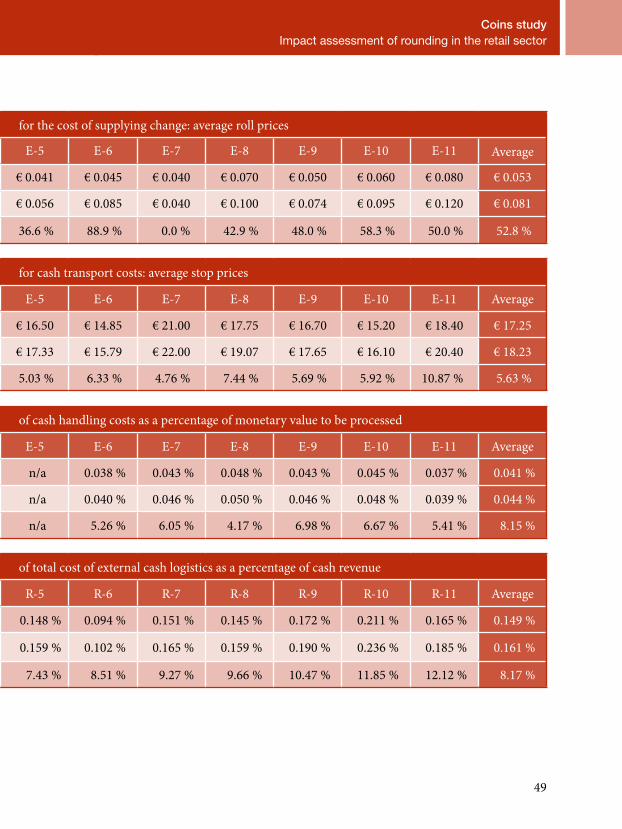
49
Coins study Impact assessment of rounding in the retail sector
Table 528 :Developmentof average roll prices
Source: EHI Retail Institute
Overview of individual values for the cost of supplying change: average roll prices
E-1 E-2 E-3 E-4 E-5 E-6 E-7 E-8 E-9 E-10 E-11 Average
2010 € 0.050 € 0.050 € 0.040 € 0.055 € 0.041 € 0.045 € 0.040 € 0.070 € 0.050 € 0.060 € 0.080 € 0.053
2012 € 0.080 € 0.070 € 0.081 € 0.087 € 0.056 € 0.085 € 0.040 € 0.100 € 0.074 € 0.095 € 0.120 € 0.081
Change 60.0 % 40.0 % 102.5 % 58.2 % 36.6 % 88.9 % 0.0 % 42.9 % 48.0 % 58.3 % 50.0 % 52.8 %
Table 6:Developmentof average stop prices
Source: EHI Retail Institute
Overview of individual values for cash transport costs: average stop prices
E-1 E-2 E-3 E-4 E-5 E-6 E-7 E-8 E-9 E-10 E-11 Average
2010 € 14.80 € 24.00 € 14.48 € 16.11 € 16.50 € 14.85 € 21.00 € 17.75 € 16.70 € 15.20 € 18.40 € 17.25
2012 € 15.10 € 24.81 € 15.30 € 16.93 € 17.33 € 15.79 € 22.00 € 19.07 € 17.65 € 16.10 € 20.40 € 18.23
Change 2.03 % 3.37 % 5.66 % 5.09 % 5.03 % 6.33 % 4.76 % 7.44 % 5.69 % 5.92 % 10.87 % 5.63 %
Table 7:Development of cash handling costs
Source: EHI Retail Institute
Overview of individual values of cash handling costs as a percentage of monetary value to be processed
E-1 E-2 E-3 E-4 E-5 E-6 E-7 E-8 E-9 E-10 E-11 Average
2010 0.032 % 0.044 % 0.031 % 0.047 % n/a 0.038 % 0.043 % 0.048 % 0.043 % 0.045 % 0.037 % 0.041 %
2012 0.034 % 0.047 % 0.031 % 0.060 % n/a 0.040 % 0.046 % 0.050 % 0.046 % 0.048 % 0.039 % 0.044 %
Change 6.25 % 6.82 % 1.96 % 29 27.66 % n/a 5.26 % 6.05 % 4.17 % 6.98 % 6.67 % 5.41 % 8.15 %
Table 8:Developmentof the total cost of external cash logisticsSource: EHI Retail Institute
Overview of individual values of total cost of external cash logistics as a percentage of cash revenue
R-1 R-2 R-3 R-4 R-5 R-6 R-7 R-8 R-9 R-10 R-11 Average
2010 0.149 % 0.203 % 0.062 % 0.140 % 0.148 % 0.094 % 0.151 % 0.145 % 0.172 % 0.211 % 0.165 % 0.149 %
2012 0.151 % 0.212 % 0.065 % 0.150 % 0.159 % 0.102 % 0.165 % 0.159 % 0.190 % 0.236 % 0.185 % 0.161 %
Change 1.34 % 4.43 % 4.84 % 7.14 % 7.43 % 8.51 % 9.27 % 9.66 % 10.47 % 11.85 % 12.12 % 8.17 %
50
Coins study Impact assessment of rounding in the retail sector
between 0.65 ‰ and 2.36 ‰. The relative cost increases of individual enterprises in relation to cash revenue range from 1.4 % to 12.1 % and average 8.2 % (see pages 48 – 49, Table 8).
To preserve the anonymity of participating retailers, the enterprises are arranged differently in this table.
Based on the cash revenue of € 41.3 billion for participating enterprises, € 59.1 million was spent on cash logistics in 2012 compared with € 54.5 million in 2010 (a cost increase of 8.2 % in two years).
Ignoring revenue effects resulting from revenue increases, shifts to cashless payment methods and atypical retail organisations,27 the average and therefore market-typical cost increase for cash logistics costs in the period from 2010 to 2012 is 9.8 %.
Taking into account these special factors, the remaining retail enterprises spent € 48.4 million on cash logistics in 2012 compared with € 44.1 million in 2010 (a market-typical cost increase of 9.8 %).
7 Conclusions
Both the simulations and interviews with selected retail enterprises show that no significant price changes or increase in the price level can be expected as a result of rounding scenarios for purchase amounts at the point of sale in the retail sector.
The estimated cost savings of eliminating 1 and 2 euro cent coins and the calculations regarding the reduction in the quantity of coins required in the various scenarios show, on the one hand, that the realisable cost savings are low and, on the other, that these cannot under any circumstances compensate for revenue losses in the event of a general rounding down of purchase amounts.
27 These are extreme values which are unusual and considered to be atypical of the industry.

51
Coins study Impact assessment of rounding in the retail sector
Retailers are reluctant to deviate from their established and tried-and-tested pricing strategies and currently see no need to change their prices to 5 euro cent increments. To this day, no other German retailer has followed the example of pioneering drug-store chain “dm-drogerie markt”, which based on the rounding down of final total prices and pricing of goods in 5 euro cent increments stopped issuing 1 and 2 euro cent coins to customers in 2002.
Cost savings are not the primary objective for retail enterprises; consumer acceptance and compatibility with their own freely selectable pricing and promotional policies are more important.
The vast majority of retailers will not voluntarily round the final total prices on sales receipts. This would require a legal basis which establishes the same conditions for all enterprises.
If a legal regulation were to be introduced, most enterprises would favour the option of commercial rounding to 5 euro cent increments, although many fear that, as a result of competitive behaviour, this scenario could effectively lead to a general rounding down of purchase amounts in the medium term.
The reservations regarding the withdrawal of 1 and 2 euro cent coins in the retail sector can be explained, on the one hand, by the failure thus far to intensively address the potential effects, difficulties in precisely evaluating cost savings and the insistence on sticking to tried-and-tested habits and, on the other, by the key issue for retailers, ie whether customers are, in fact, willing to accept a rounding scenario.
However, pragmatic analysis of the effects shows that rounding final total prices would have no dramatic impact.
In communications with consumers and retail enterprises, a clear distinction should be drawn between rounding final total prices and individual price adjustments, as the rounding of final total prices need not necessarily lead to individual price adjustments.

52
Coins study Impact assessment of rounding in the retail sector
Appendix A: Interview guideline
The interviewees were asked the following questions.
A Problems with small coins (for cash logistics specialists only)
■ Handling problems: Are you currently experiencing any difficulties storing or ordering coins or forecasting coin requirements?
■ Cost of coin procurement: Have you noticed any change in the cost of coin supplies since 2010?
■ If so, has the change been adjusted to reflect endogenous effects, such as an expansion of the branch network?
■ Has your quantity structure changed since 2010, for example due to increased coin storage?
■ Have you experienced any difficulties obtaining supplies from cash-in-transit companies, such as delivery delays or higher risks owing to advance payments?
■ Are there any shortages of supply, or is the quantity of change always sufficient?
■ Is the time period between the identification of needs and delivery now longer?
■ Are there any problems relating specifically to small coins, for example distinguishing between 1 and 2 euro cent coins or payment delays at the point of sale?

53
Coins study Impact assessment of rounding in the retail sector
B Questions for all interview partners
■ Would you generally welcome the elimination of 1 and 2 euro cent coins in pay-ment transactions?
■ If so, what expectations do you associate with this?
■ If not, what are the main arguments against this?
■ What savings potential do you expect with regard to the cost of supplying coins (including savings in the areas of storage and shorter processing times at the point of sale) as a result of eliminating small coins?
■ Under what circumstances would your enterprise eliminate 1 and 2 euro cent coins from cash payments?
■ In the event of the introduction of a legal regulation, what regulation would you favour for final total prices? How would you assess the alternatives?
– general rounding down/general rounding up/commercial rounding
■ How would you assess customer reactions/preferences for rounding rules for final total prices? – general rounding down/general rounding up/commercial rounding
■ How likely is it that individual price adjustments in 5 euro cent increments will be made at your enterprise?
■ What developments do you expect for typical retail threshold prices? (based on the most common prices)
■ What are the key influencing factors?
■ In your opinion, what are the key price points for price adjustments in 5 euro cent increments?

54
Coins study Impact assessment of rounding in the retail sector
■ In your opinion, is there a price limit (for example, € 2 or € 3), from which price adjustments up or down in 5 euro cent increments are unproblematic?
■ Would different pricing strategies be used depending on the rounding rule?
■ What effects would you expect with regard to price level in the event of individual price adjustments at your enterprise?
■ In the event of the withdrawal of 1 and 2 euro cent coins, do you expect a change or improvement in your branch-internal cash process? If so, to what extent?

55
Coins study Impact assessment of rounding in the retail sector
Appendix B: Detailed tables
Table B.1: Overview of revenue effects of rounding final total prices Source: EHI Retail Institute
Table B.2: Overview of revenue effects of rounding individual prices Source: EHI Retail Institute

56
Coins study Impact assessment of rounding in the retail sector
Table B.1:Overview of revenue effects of roundingfinal total prices 30
Source: EHI Retail Institute
Market Type No of sales receipts Revenue Average final
total priceScenarios for final total price Change in revenue (€) Change in revenue (%)
Commercial rounding Rounding down Rounding up Commercial
roundingRounding
down Rounding up Commercial rounding
Rounding down Rounding up
Market-01-city-high SM/SS 3,137 € 20,329.69 € 6.48 € 20,341.30 € 20,253.80 € 20,384.15 € 11.61 - € 75.89 € 54.46 0.06 % - 0.37 % 0.27 %
Market-01-city-low SM/SS 2,881 € 16,659.50 € 5.78 € 16,669.70 € 16,590.90 € 16,711.45 € 10.20 - € 68.60 € 51.95 0.06 % - 0.41 % 0.31 %
Market-02-rural-high SM/SS 2,239 € 34,246.32 € 15.30 € 34,248.50 € 34,210.95 € 34,277.30 € 2.18 - € 35.37 € 30.98 0.01 % - 0.10 % 0.09 %
Market-02-rural-low SM/SS 1,492 € 19,123.33 € 12.82 € 19,125.10 € 19,097.55 € 19,146.00 € 1.77 - € 25.78 € 22.67 0.01 % - 0.13 % 0.12 %
Market-03-city-high SM/SS 215 € 3,411.00 € 15.87 € 3,411.15 € 3,406.45 € 3,414.80 € 0.15 - € 4.55 € 3.80 0.00 % - 0.13 % 0.11 %
Market-03-city-low SM/SS 183 € 3,150.27 € 17.21 € 3,150.70 € 3,146.20 € 3,153.75 € 0.43 - € 4.07 € 3.48 0.01 % - 0.13 % 0.11 %
Market-04-rural-high SM/SS 385 € 5,942.56 € 15.44 € 5,942.60 € 5,935.05 € 5,950.05 € 0.04 - € 7.51 € 7.49 0.00 % - 0.13 % 0.13 %
Market-04-rural-low SM/SS 472 € 5,766.06 € 12.22 € 5,767.10 € 5,756.55 € 5,774.30 € 1.04 - € 9.51 € 8.24 0.02 % - 0.16 % 0.14 %
Market-05-city-high DS 3,941 € 33,532.86 € 8.51 € 33,544.80 € 33,455.85 € 33,585.25 € 11.94 - € 77.01 € 52.39 0.04 % - 0.23 % 0.16 %
Market-05-city-low DS 4,155 € 33,792.33 € 8.13 € 33,805.80 € 33,707.05 € 33,852.20 € 13.47 - € 85.28 € 59.87 0.04 % - 0.25 % 0.18 %
Market-06-rural-high DS 985 € 11,459.65 € 11.63 € 11,463.60 € 11,440.70 € 11,470.15 € 3.95 - € 18.95 € 10.50 0.03 % - 0.17 % 0.09 %
Market-06-rural-low DS 616 € 7,162.27 € 11.63 € 7,164.20 € 7,150.45 € 7,169.75 € 1.93 - € 11.82 € 7.48 0.03 % - 0.17 % 0.10 %
Market-07-rural-high HM 3,219 € 102,051.71 € 31.70 € 102,056.40 € 101,985.05 € 102,110.80 € 4.69 - € 66.66 € 59.09 0.00 % - 0.07 % 0.06 %
Market-07-rural-low HM 2,107 € 44,816.09 € 21.27 € 44,819.50 € 44,771.05 € 44,854.15 € 3.41 - € 45.04 € 38.06 0.01 % - 0.10 % 0.08 %
Market-08-city-high HM 3,134 € 110,085.80 € 35.13 € 110,090.65 € 110,019.55 € 110,143.15 € 4.85 - € 66.25 € 57.35 0.00 % - 0.06 % 0.05 %
Market-08-city-low HM 2,052 € 54,283.02 € 26.45 € 54,286.65 € 54,238.55 € 54,320.25 € 3.63 - € 44.47 € 37.23 0.01 % - 0.08 % 0.07 %
Market-09-rural-high DS 1,042 € 10,436.18 € 10.02 € 10,438.90 € 10,413.75 € 10,453.90 € 2.72 - € 22.43 € 17.72 0.03 % - 0.21 % 0.17 %
Market-09-rural-low DS 747 € 6,437.38 € 8.62 € 6,440.40 € 6,419.40 € 6,449.55 € 3.02 - € 17.98 € 12.17 0.05 % - 0.28 % 0.19 %
Market-10-city-high DS 1,030 € 7,909.29 € 7.68 € 7,912.70 € 7,885.40 € 7,926.85 € 3.41 - € 23.89 € 17.56 0.04 % - 0.30 % 0.22 %
Market-10-city-low DS 978 € 6,452.54 € 6.60 € 6,457.05 € 6,429.00 € 6,467.55 € 4.51 - € 23.54 € 15.01 0.07 % - 0.36 % 0.23 %
Market-11-city-high Dis 1,916 € 16,226.27 € 8.47 € 16,229.10 € 16,185.80 € 16,260.85 € 2.83 - € 40.47 € 34.58 0.02 % - 0.25 % 0.21 %
Market-11-city-low Dis 1,523 € 9,385.39 € 6.16 € 9,388.80 € 9,352.45 € 9,411.85 € 3.41 - € 32.94 € 26.46 0.04 % - 0.35 % 0.28 %
Market-12-rural-high Dis 1,015 € 18,455.13 € 18.18 € 18,456.00 € 18,435.05 € 18,473.65 € 0.87 - € 20.08 € 18.52 0.00 % - 0.11 % 0.10 %
Market-12-rural-low Dis 613 € 8,134.04 € 13.27 € 8,134.20 € 8,121.75 € 8,145.25 € 0.16 - € 12.29 € 11.21 0.00 % - 0.15 % 0.14 %
Market-13-rural-high SM/SS 1,113 € 18,135.18 € 16.29 € 18,136.75 € 18,111.65 € 18,155.80 € 1.57 - € 23.53 € 20.62 0.01 % - 0.13 % 0.11 %
Market-13-rural-low SM/SS 580 € 5,988.66 € 10.33 € 5,989.35 € 5,975.80 € 5,999.75 € 0.69 - € 12.86 € 11.09 0.01 % - 0.21 % 0.19 %
Market-14-city-high SM/SS 2,237 € 35,251.31 € 15.76 € 35,254.55 € 35,211.25 € 35,284.10 € 3.24 - € 40.06 € 32.79 0.01 % - 0.11 % 0.09 %
Market-14-city-low SM/SS 1,603 € 13,765.43 € 8.59 € 13,768.50 € 13,736.75 € 13,787.85 € 3.07 - € 28.68 € 22.42 0.02 % - 0.21 % 0.16 %
Market-15-city-high SM/SS 3,262 € 74,754.64 € 22.92 € 74,758.60 € 74,689.05 € 74,813.60 € 3.96 - € 65.59 € 58.96 0.01 % - 0.09 % 0.08 %
Market-15-city-low SM/SS 1,827 € 25,919.35 € 14.19 € 25,922.10 € 25,881.95 € 25,952.20 € 2.75 - € 37.40 € 32.85 0.01 % - 0.14 % 0.13 %
Market-16-rural-high SM/SS 2,377 € 47,386.79 € 19.94 € 47,390.60 € 47,337.95 € 47,428.50 € 3.81 - € 48.84 € 41.71 0.01 % - 0.10 % 0.09 %
Market-16-rural-low SM/SS 1,077 € 13,724.65 € 12.74 € 13,727.15 € 13,702.25 € 13,742.15 € 2.50 - € 22.40 € 17.50 0.02 % - 0.16 % 0.13 %
Market-17-rural-high Dis 811 € 7,178.84 € 8.85 € 7,180.25 € 7,161.90 € 7,192.70 € 1.41 - € 16.94 € 13.86 0.02 % - 0.24 % 0.19 %
Market-17-rural-low Dis 491 € 3,414.20 € 6.95 € 3,414.90 € 3,404.45 € 3,422.50 € 0.70 - € 9.75 € 8.30 0.02 % - 0.29 % 0.24 %
30 Business type “SM” stands for supermarket,“SS” for superstore, “DS” for drugstore“Dis” for discount store and “HM” for hypermarket.
Market-18-city-high Dis 968 € 12,996.24 € 13.43 € 12,998.20 € 12,975.95 € 13,013.65 € 1.96 - € 20.29 € 17.41 0.02 % - 0.16 % 0.13 %
Market-18-city-low Dis 634 € 5,686.71 € 8.97 € 5,687.85 € 5,673.45 € 5,697.55 € 1.14 - € 13.26 € 10.84 0.02 % - 0.23 % 0.19 %
Market-19-city-high SM/SS 912 € 16,823.32 € 18.45 € 16,824.45 € 16,805.75 € 16,839.45 € 1.13 - € 17.57 € 16.13 0.01 % - 0.10 % 0.10 %
Market-19-city-low SM/SS 1,616 € 20,261.02 € 12.54 € 20,262.95 € 20,228.40 € 20,288.95 € 1.93 - € 32.62 € 27.93 0.01 % - 0.16 % 0.14 %
Market-20-city-high HM 681 € 23,840.25 € 35.01 € 23,840.65 € 23,826.10 € 23,853.55 € 0.40 - € 14.15 € 13.30 0.00 % - 0.06 % 0.06 %
Market-20-city-low HM 1,251 € 21,259.78 € 16.99 € 21,261.75 € 21,232.45 € 21,283.20 € 1.97 - € 27.33 € 23.42 0.01 % - 0.13 % 0.11 %
Market-21-rural-high HM 550 € 16,179.89 € 29.42 € 16,180.30 € 16,168.45 € 16,190.55 € 0.41 - € 11.44 € 10.66 0.00 % - 0.07 % 0.07 %
Market-21-rural-low HM 531 € 10,638.75 € 20.04 € 10,639.75 € 10,628.05 € 10,647.55 € 1.00 - € 10.70 € 8.80 0.01 % - 0.10 % 0.08 %
Market-22-rural-high SM/SS 523 € 11,786.70 € 22.54 € 11,786.75 € 11,776.65 € 11,795.95 € 0.05 - € 10.05 € 9.25 0.00 % - 0.09 % 0.08 %
Market-22-rural-low SM/SS 561 € 8,901.25 € 15.87 € 8,901.60 € 8,890.10 € 8,911.20 € 0.35 - € 11.15 € 9.95 0.00 % - 0.13 % 0.11 %
63,682 € 983,141.64 € 15.44 € 983,271.90 € 981,826.65 € 984,207.70 Average 0 .02 % - 0 .17 % 0 .14 %
min 0 .00 % - 0 .41 % 0 .05 %
max 0 .07 % - 0 .06 % 0 .31 %

57
Coins study Impact assessment of rounding in the retail sector
Table B.1:Overview of revenue effects of roundingfinal total prices 30
Source: EHI Retail Institute
Market Type No of sales receipts Revenue Average final
total priceScenarios for final total price Change in revenue (€) Change in revenue (%)
Commercial rounding Rounding down Rounding up Commercial
roundingRounding
down Rounding up Commercial rounding
Rounding down Rounding up
Market-01-city-high SM/SS 3,137 € 20,329.69 € 6.48 € 20,341.30 € 20,253.80 € 20,384.15 € 11.61 - € 75.89 € 54.46 0.06 % - 0.37 % 0.27 %
Market-01-city-low SM/SS 2,881 € 16,659.50 € 5.78 € 16,669.70 € 16,590.90 € 16,711.45 € 10.20 - € 68.60 € 51.95 0.06 % - 0.41 % 0.31 %
Market-02-rural-high SM/SS 2,239 € 34,246.32 € 15.30 € 34,248.50 € 34,210.95 € 34,277.30 € 2.18 - € 35.37 € 30.98 0.01 % - 0.10 % 0.09 %
Market-02-rural-low SM/SS 1,492 € 19,123.33 € 12.82 € 19,125.10 € 19,097.55 € 19,146.00 € 1.77 - € 25.78 € 22.67 0.01 % - 0.13 % 0.12 %
Market-03-city-high SM/SS 215 € 3,411.00 € 15.87 € 3,411.15 € 3,406.45 € 3,414.80 € 0.15 - € 4.55 € 3.80 0.00 % - 0.13 % 0.11 %
Market-03-city-low SM/SS 183 € 3,150.27 € 17.21 € 3,150.70 € 3,146.20 € 3,153.75 € 0.43 - € 4.07 € 3.48 0.01 % - 0.13 % 0.11 %
Market-04-rural-high SM/SS 385 € 5,942.56 € 15.44 € 5,942.60 € 5,935.05 € 5,950.05 € 0.04 - € 7.51 € 7.49 0.00 % - 0.13 % 0.13 %
Market-04-rural-low SM/SS 472 € 5,766.06 € 12.22 € 5,767.10 € 5,756.55 € 5,774.30 € 1.04 - € 9.51 € 8.24 0.02 % - 0.16 % 0.14 %
Market-05-city-high DS 3,941 € 33,532.86 € 8.51 € 33,544.80 € 33,455.85 € 33,585.25 € 11.94 - € 77.01 € 52.39 0.04 % - 0.23 % 0.16 %
Market-05-city-low DS 4,155 € 33,792.33 € 8.13 € 33,805.80 € 33,707.05 € 33,852.20 € 13.47 - € 85.28 € 59.87 0.04 % - 0.25 % 0.18 %
Market-06-rural-high DS 985 € 11,459.65 € 11.63 € 11,463.60 € 11,440.70 € 11,470.15 € 3.95 - € 18.95 € 10.50 0.03 % - 0.17 % 0.09 %
Market-06-rural-low DS 616 € 7,162.27 € 11.63 € 7,164.20 € 7,150.45 € 7,169.75 € 1.93 - € 11.82 € 7.48 0.03 % - 0.17 % 0.10 %
Market-07-rural-high HM 3,219 € 102,051.71 € 31.70 € 102,056.40 € 101,985.05 € 102,110.80 € 4.69 - € 66.66 € 59.09 0.00 % - 0.07 % 0.06 %
Market-07-rural-low HM 2,107 € 44,816.09 € 21.27 € 44,819.50 € 44,771.05 € 44,854.15 € 3.41 - € 45.04 € 38.06 0.01 % - 0.10 % 0.08 %
Market-08-city-high HM 3,134 € 110,085.80 € 35.13 € 110,090.65 € 110,019.55 € 110,143.15 € 4.85 - € 66.25 € 57.35 0.00 % - 0.06 % 0.05 %
Market-08-city-low HM 2,052 € 54,283.02 € 26.45 € 54,286.65 € 54,238.55 € 54,320.25 € 3.63 - € 44.47 € 37.23 0.01 % - 0.08 % 0.07 %
Market-09-rural-high DS 1,042 € 10,436.18 € 10.02 € 10,438.90 € 10,413.75 € 10,453.90 € 2.72 - € 22.43 € 17.72 0.03 % - 0.21 % 0.17 %
Market-09-rural-low DS 747 € 6,437.38 € 8.62 € 6,440.40 € 6,419.40 € 6,449.55 € 3.02 - € 17.98 € 12.17 0.05 % - 0.28 % 0.19 %
Market-10-city-high DS 1,030 € 7,909.29 € 7.68 € 7,912.70 € 7,885.40 € 7,926.85 € 3.41 - € 23.89 € 17.56 0.04 % - 0.30 % 0.22 %
Market-10-city-low DS 978 € 6,452.54 € 6.60 € 6,457.05 € 6,429.00 € 6,467.55 € 4.51 - € 23.54 € 15.01 0.07 % - 0.36 % 0.23 %
Market-11-city-high Dis 1,916 € 16,226.27 € 8.47 € 16,229.10 € 16,185.80 € 16,260.85 € 2.83 - € 40.47 € 34.58 0.02 % - 0.25 % 0.21 %
Market-11-city-low Dis 1,523 € 9,385.39 € 6.16 € 9,388.80 € 9,352.45 € 9,411.85 € 3.41 - € 32.94 € 26.46 0.04 % - 0.35 % 0.28 %
Market-12-rural-high Dis 1,015 € 18,455.13 € 18.18 € 18,456.00 € 18,435.05 € 18,473.65 € 0.87 - € 20.08 € 18.52 0.00 % - 0.11 % 0.10 %
Market-12-rural-low Dis 613 € 8,134.04 € 13.27 € 8,134.20 € 8,121.75 € 8,145.25 € 0.16 - € 12.29 € 11.21 0.00 % - 0.15 % 0.14 %
Market-13-rural-high SM/SS 1,113 € 18,135.18 € 16.29 € 18,136.75 € 18,111.65 € 18,155.80 € 1.57 - € 23.53 € 20.62 0.01 % - 0.13 % 0.11 %
Market-13-rural-low SM/SS 580 € 5,988.66 € 10.33 € 5,989.35 € 5,975.80 € 5,999.75 € 0.69 - € 12.86 € 11.09 0.01 % - 0.21 % 0.19 %
Market-14-city-high SM/SS 2,237 € 35,251.31 € 15.76 € 35,254.55 € 35,211.25 € 35,284.10 € 3.24 - € 40.06 € 32.79 0.01 % - 0.11 % 0.09 %
Market-14-city-low SM/SS 1,603 € 13,765.43 € 8.59 € 13,768.50 € 13,736.75 € 13,787.85 € 3.07 - € 28.68 € 22.42 0.02 % - 0.21 % 0.16 %
Market-15-city-high SM/SS 3,262 € 74,754.64 € 22.92 € 74,758.60 € 74,689.05 € 74,813.60 € 3.96 - € 65.59 € 58.96 0.01 % - 0.09 % 0.08 %
Market-15-city-low SM/SS 1,827 € 25,919.35 € 14.19 € 25,922.10 € 25,881.95 € 25,952.20 € 2.75 - € 37.40 € 32.85 0.01 % - 0.14 % 0.13 %
Market-16-rural-high SM/SS 2,377 € 47,386.79 € 19.94 € 47,390.60 € 47,337.95 € 47,428.50 € 3.81 - € 48.84 € 41.71 0.01 % - 0.10 % 0.09 %
Market-16-rural-low SM/SS 1,077 € 13,724.65 € 12.74 € 13,727.15 € 13,702.25 € 13,742.15 € 2.50 - € 22.40 € 17.50 0.02 % - 0.16 % 0.13 %
Market-17-rural-high Dis 811 € 7,178.84 € 8.85 € 7,180.25 € 7,161.90 € 7,192.70 € 1.41 - € 16.94 € 13.86 0.02 % - 0.24 % 0.19 %
Market-17-rural-low Dis 491 € 3,414.20 € 6.95 € 3,414.90 € 3,404.45 € 3,422.50 € 0.70 - € 9.75 € 8.30 0.02 % - 0.29 % 0.24 %
30 Business type “SM” stands for supermarket,“SS” for superstore, “DS” for drugstore“Dis” for discount store and “HM” for hypermarket.
Market-18-city-high Dis 968 € 12,996.24 € 13.43 € 12,998.20 € 12,975.95 € 13,013.65 € 1.96 - € 20.29 € 17.41 0.02 % - 0.16 % 0.13 %
Market-18-city-low Dis 634 € 5,686.71 € 8.97 € 5,687.85 € 5,673.45 € 5,697.55 € 1.14 - € 13.26 € 10.84 0.02 % - 0.23 % 0.19 %
Market-19-city-high SM/SS 912 € 16,823.32 € 18.45 € 16,824.45 € 16,805.75 € 16,839.45 € 1.13 - € 17.57 € 16.13 0.01 % - 0.10 % 0.10 %
Market-19-city-low SM/SS 1,616 € 20,261.02 € 12.54 € 20,262.95 € 20,228.40 € 20,288.95 € 1.93 - € 32.62 € 27.93 0.01 % - 0.16 % 0.14 %
Market-20-city-high HM 681 € 23,840.25 € 35.01 € 23,840.65 € 23,826.10 € 23,853.55 € 0.40 - € 14.15 € 13.30 0.00 % - 0.06 % 0.06 %
Market-20-city-low HM 1,251 € 21,259.78 € 16.99 € 21,261.75 € 21,232.45 € 21,283.20 € 1.97 - € 27.33 € 23.42 0.01 % - 0.13 % 0.11 %
Market-21-rural-high HM 550 € 16,179.89 € 29.42 € 16,180.30 € 16,168.45 € 16,190.55 € 0.41 - € 11.44 € 10.66 0.00 % - 0.07 % 0.07 %
Market-21-rural-low HM 531 € 10,638.75 € 20.04 € 10,639.75 € 10,628.05 € 10,647.55 € 1.00 - € 10.70 € 8.80 0.01 % - 0.10 % 0.08 %
Market-22-rural-high SM/SS 523 € 11,786.70 € 22.54 € 11,786.75 € 11,776.65 € 11,795.95 € 0.05 - € 10.05 € 9.25 0.00 % - 0.09 % 0.08 %
Market-22-rural-low SM/SS 561 € 8,901.25 € 15.87 € 8,901.60 € 8,890.10 € 8,911.20 € 0.35 - € 11.15 € 9.95 0.00 % - 0.13 % 0.11 %
63,682 € 983,141.64 € 15.44 € 983,271.90 € 981,826.65 € 984,207.70 Average 0 .02 % - 0 .17 % 0 .14 %
min 0 .00 % - 0 .41 % 0 .05 %
max 0 .07 % - 0 .06 % 0 .31 %

58
Coins study Impact assessment of rounding in the retail sector
Table B.2:Overview of price effects of roundingindividual prices 31
Source: EHI Retail Institute
Market Type No of item prices No of items Revenue Average
item priceScenarios for individual prices Change in revenue (€) Change in revenue (%)
Commercial rounding Rounding down Rounding up Commercial
roundingRounding
down Rounding up Commercial rounding
Rounding down Rounding up
Market-01-city-high SM/SS 525 13,684 € 20,030.20 € 1.46 € 20,120.70 € 19,633.90 € 20,161.50 € 90.50 - € 396.30 € 131.30 0.45 % - 1.98 % 0.66 %
Market-01-city-low SM/SS 461 12,275 € 16,480.25 € 1.34 € 16,561.95 € 16,125.60 € 16,598.35 € 81.70 - € 354.65 € 118.10 0.50 % - 2.15 % 0.72 %
Market-02-rural-high SM/SS 790 16,134 € 32,040.25 € 1.99 € 32,135.50 € 31,589.95 € 32,202.70 € 95.25 - € 450.30 € 162.45 0.30 % - 1.41 % 0.51 %
Market-02-rural-low SM/SS 577 9,318 € 17,865.62 € 1.92 € 17,921.30 € 17,599.70 € 17,959.45 € 55.68 - € 265.92 € 93.83 0.31 % - 1.49 % 0.53 %
Market-03-city-high SM/SS 416 2,456 € 5,149.30 € 2.10 € 5,162.85 € 5,083.70 € 5,174.55 € 13.55 - € 65.60 € 25.25 0.26 % - 1.27 % 0.49 %
Market-03-city-low SM/SS 294 1,670 € 3,149.68 € 1.89 € 3,158.85 € 3,101.95 € 3,167.05 € 9.17 - € 47.73 € 17.37 0.29 % - 1.52 % 0.55 %
Market-04-rural-high SM/SS 500 3,687 € 7,792.34 € 2.11 € 7,813.75 € 7,689.20 € 7,832.30 € 21.41 - € 103.14 € 39.96 0.27 % - 1.32 % 0.51 %
Market-04-rural-low SM/SS 497 3,886 € 7,885.82 € 2.03 € 7,907.15 € 7,778.50 € 7,926.00 € 21.33 - € 107.32 € 40.18 0.27 % - 1.36 % 0.51 %
Market-05-city-high DS 429 14,357 € 46,896.11 € 3.27 € 46,952.75 € 46,636.15 € 46,973.15 € 56.64 - € 259.96 € 77.04 0.12 % - 0.55 % 0.16 %
Market-05-city-low DS 460 15,372 € 47,676.27 € 3.10 € 47,754.80 € 47,360.80 € 47,763.45 € 78.53 - € 315.47 € 87.18 0.16 % - 0.66 % 0.18 %
Market-06-rural-high DS 283 3,025 € 12,054.37 € 3.98 € 12,068.90 € 11,997.80 € 12,070.40 € 14.53 - € 56.57 € 16.03 0.12 % - 0.47 % 0.13 %
Market-06-rural-low DS 217 2,559 € 7,632.76 € 2.98 € 7,643.65 € 7,591.95 € 7,644.20 € 10.89 - € 40.81 € 11.44 0.14 % - 0.53 % 0.15 %
Market-07-rural-high HM 974 29,966 € 110,209.70 € 3.68 € 110,420.20 € 109,298.90 € 110,504.95 € 210.50 - € 910.80 € 295.25 0.19 % - 0.83 % 0.27 %
Market-07-rural-low HM 800 18,081 € 44,903.42 € 2.48 € 45,026.10 € 44,357.75 € 45,081.30 € 122.68 - € 545.67 € 177.88 0.27 % - 1.22 % 0.40 %
Market-08-city-high HM 1,151 47,774 € 109,727.69 € 2.30 € 110,064.25 € 108,238.30 € 110,202.80 € 336.56 - € 1,489.39 € 475.11 0.31 % - 1.36 % 0.43 %
Market-08-city-low HM 812 24,277 € 54,490.64 € 2.24 € 54,658.25 € 53,739.00 € 54,729.40 € 167.61 - € 751.64 € 238.76 0.31 % - 1.38 % 0.44 %
Market-09-rural-high DS 227 4,992 € 10,436.90 € 2.09 € 10,475.50 € 10,281.50 € 10,480.55 € 38.60 - € 155.40 € 43.65 0.37 % - 1.49 % 0.42 %
Market-09-rural-low DS 179 3,045 € 6,428.63 € 2.11 € 6,449.20 € 6,345.50 € 6,450.10 € 20.57 - € 83.13 € 21.47 0.32 % - 1.29 % 0.33 %
Market-10-city-high DS 190 4,032 € 7,884.54 € 1.96 € 7,914.25 € 7,762.90 € 7,918.15 € 29.71 - € 121.64 € 33.61 0.38 % - 1.54 % 0.43 %
Market-10-city-low DS 171 3,075 € 6,419.04 € 2.09 € 6,440.00 € 6,333.95 € 6,440.95 € 20.96 - € 85.09 € 21.91 0.33 % - 1.33 % 0.34 %
Market-11-city-high Dis 399 18,080 € 21,644.18 € 1.20 € 21,746.55 € 21,149.50 € 21,817.65 € 102.37 - € 494.68 € 173.47 0.47 % - 2.29 % 0.80 %
Market-11-city-low Dis 302 10,502 € 11,421.26 € 1.09 € 11,491.45 € 11,122.45 € 11,526.25 € 70.19 - € 298.81 € 104.99 0.61 % - 2.62 % 0.92 %
Market-12-rural-high Dis 460 19,628 € 28,269.57 € 1.44 € 28,372.70 € 27,714.50 € 28,468.75 € 103.13 - € 555.07 € 199.18 0.36 % - 1.96 % 0.70 %
Market-12-rural-low Dis 326 8,309 € 11,779.66 € 1.42 € 11,834.75 € 11,539.80 € 11,858.05 € 55.09 - € 239.86 € 78.39 0.47 % - 2.04 % 0.67 %
Market-13-rural-high SM/SS 798 12,343 € 28,126.97 € 2.28 € 28,213.90 € 27,742.95 € 28,246.15 € 86.93 - € 384.02 € 119.18 0.31 % - 1.37 % 0.42 %
Market-13-rural-low SM/SS 429 4,115 € 7,775.55 € 1.89 € 7,804.75 € 7,647.10 € 7,816.40 € 29.20 - € 128.45 € 40.85 0.38 % - 1.65 % 0.53 %
Market-14-city-high SM/SS 1,278 34,603 € 75,226.59 € 2.17 € 75,465.20 € 74,188.55 € 75,568.60 € 238.61 - € 1,038.04 € 342.01 0.32 % - 1.38 % 0.45 %
Market-14-city-low SM/SS 619 12,243 € 20,679.71 € 1.69 € 20,755.15 € 20,330.35 € 20,797.20 € 75.44 - € 349.36 € 117.49 0.36 % - 1.69 % 0.57 %
Market-15-city-high SM/SS 1,173 71,307 € 127,590.96 € 1.79 € 127,907.85 € 125,581.90 € 128,539.85 € 316.89 - € 2,009.06 € 948.89 0.25 % - 1.57 % 0.74 %
Market-15-city-low SM/SS 600 20,849 € 35,516.48 € 1.70 € 35,650.80 € 34,875.25 € 35,736.10 € 134.32 - € 641.23 € 219.62 0.38 % - 1.81 % 0.62 %
Market-16-rural-high SM/SS 1,048 36,506 € 74,023.65 € 2.03 € 74,205.50 € 72,998.70 € 74,472.40 € 181.85 - € 1,024.95 € 448.75 0.25 % - 1.38 % 0.61 %
Market-16-rural-low SM/SS 536 9,575 € 18,691.79 € 1.95 € 18,752.05 € 18,401.20 € 18,790.90 € 60.26 - € 290.59 € 99.11 0.32 % - 1.55 % 0.53 %
Market-17-rural-low Dis 205 3,115 € 3,704.08 € 1.19 € 3,721.05 € 3,618.50 € 3,734.35 € 16.97 - € 85.58 € 30.27 0.46 % - 2.31 % 0.82 %
Market-17-rural-low Dis 335 6,454 € 7,630.04 € 1.18 € 7,670.10 € 7,460.95 € 7,714.45 € 40.06 - € 169.09 € 84.41 0.53 % - 2.22 % 1.11 %
31 Business type “SM” stands for supermarket.“SS” for superstore. “DS” for drugstore“Dis” for discount store and “HM” for hypermarket.
Market-18-city-high Dis 391 11,811 € 16,087.61 € 1.36 € 16,135.70 € 15,790.75 € 16,271.30 € 48.09 - € 296.86 € 183.69 0.30 % - 1.85 % 1.14 %
Market-18-city-low Dis 263 5,059 € 6,361.10 € 1.26 € 6,386.95 € 6,222.45 € 6,421.85 € 25.85 - € 138.65 € 60.75 0.41 % - 2.18 % 0.96 %
Market-19-city-high SM/SS 632 15,195 € 28,658.18 € 1.89 € 28,746.10 € 28,244.70 € 28,799.50 € 87.92 - € 413.48 € 141.32 0.31 % - 1.44 % 0.49 %
Market-19-city-low SM/SS 574 16,761 € 29,136.33 € 1.74 € 29,232.10 € 28,682.15 € 29,287.50 € 95.77 - € 454.18 € 151.17 0.33 % - 1.56 % 0.52 %
Market-20-city-high HM 915 24,038 € 52,727.02 € 1.19 € 52,885.80 € 52,031.00 € 52,946.45 € 158.78 - € 696.02 € 219.43 0.30 % - 1.32 % 0.42 %
Market-20-city-low HM 699 15,416 € 34,367.74 € 2.23 € 34,463.50 € 33,940.00 € 34,519.75 € 95.76 - € 427.74 € 152.01 0.28 % - 1.24 % 0.44 %
Market-21-rural-high HM 786 15,323 € 35,989.11 € 2.35 € 36,081.65 € 35,559.50 € 36,131.40 € 92.54 - € 429.61 € 142.29 0.26 % - 1.19 % 0.40 %
Market-21-rural-low HM 520 8,496 € 23,113.64 € 2.72 € 23,171.95 € 22,857.85 € 23,191.95 € 58.31 - € 255.79 € 78.31 0.25 % - 1.11 % 0.34 %
Market-22-rural-high SM/SS 583 10,544 € 22,945.76 € 2.18 € 23,015.95 € 22,629.15 € 23,043.40 € 70.19 - € 316.61 € 97.64 0.31 % - 1.38 % 0.43 %
Market-22-rural-low SM/SS 548 7,786 € 14,206.02 € 1.82 € 14,257.90 € 13,980.45 € 14,274.35 € 51.88 - € 225.57 € 68.33 0.37 % - 1.59 % 0.48 %
631,723 € 1,310,826.53 € 2.08 € 1,314,619.30 € 1,292,856.70 € 1,317,255.85 Average 0 .32 % - 1 .50 % 0 .53 %
min 0 .12 % - 2 .62 % 0 .13 %
max 0 .61 % - 0 .47 % 1 .14 %

59
Coins study Impact assessment of rounding in the retail sector
Table B.2:Overview of price effects of roundingindividual prices 31
Source: EHI Retail Institute
Market Type No of item prices No of items Revenue Average
item priceScenarios for individual prices Change in revenue (€) Change in revenue (%)
Commercial rounding Rounding down Rounding up Commercial
roundingRounding
down Rounding up Commercial rounding
Rounding down Rounding up
Market-01-city-high SM/SS 525 13,684 € 20,030.20 € 1.46 € 20,120.70 € 19,633.90 € 20,161.50 € 90.50 - € 396.30 € 131.30 0.45 % - 1.98 % 0.66 %
Market-01-city-low SM/SS 461 12,275 € 16,480.25 € 1.34 € 16,561.95 € 16,125.60 € 16,598.35 € 81.70 - € 354.65 € 118.10 0.50 % - 2.15 % 0.72 %
Market-02-rural-high SM/SS 790 16,134 € 32,040.25 € 1.99 € 32,135.50 € 31,589.95 € 32,202.70 € 95.25 - € 450.30 € 162.45 0.30 % - 1.41 % 0.51 %
Market-02-rural-low SM/SS 577 9,318 € 17,865.62 € 1.92 € 17,921.30 € 17,599.70 € 17,959.45 € 55.68 - € 265.92 € 93.83 0.31 % - 1.49 % 0.53 %
Market-03-city-high SM/SS 416 2,456 € 5,149.30 € 2.10 € 5,162.85 € 5,083.70 € 5,174.55 € 13.55 - € 65.60 € 25.25 0.26 % - 1.27 % 0.49 %
Market-03-city-low SM/SS 294 1,670 € 3,149.68 € 1.89 € 3,158.85 € 3,101.95 € 3,167.05 € 9.17 - € 47.73 € 17.37 0.29 % - 1.52 % 0.55 %
Market-04-rural-high SM/SS 500 3,687 € 7,792.34 € 2.11 € 7,813.75 € 7,689.20 € 7,832.30 € 21.41 - € 103.14 € 39.96 0.27 % - 1.32 % 0.51 %
Market-04-rural-low SM/SS 497 3,886 € 7,885.82 € 2.03 € 7,907.15 € 7,778.50 € 7,926.00 € 21.33 - € 107.32 € 40.18 0.27 % - 1.36 % 0.51 %
Market-05-city-high DS 429 14,357 € 46,896.11 € 3.27 € 46,952.75 € 46,636.15 € 46,973.15 € 56.64 - € 259.96 € 77.04 0.12 % - 0.55 % 0.16 %
Market-05-city-low DS 460 15,372 € 47,676.27 € 3.10 € 47,754.80 € 47,360.80 € 47,763.45 € 78.53 - € 315.47 € 87.18 0.16 % - 0.66 % 0.18 %
Market-06-rural-high DS 283 3,025 € 12,054.37 € 3.98 € 12,068.90 € 11,997.80 € 12,070.40 € 14.53 - € 56.57 € 16.03 0.12 % - 0.47 % 0.13 %
Market-06-rural-low DS 217 2,559 € 7,632.76 € 2.98 € 7,643.65 € 7,591.95 € 7,644.20 € 10.89 - € 40.81 € 11.44 0.14 % - 0.53 % 0.15 %
Market-07-rural-high HM 974 29,966 € 110,209.70 € 3.68 € 110,420.20 € 109,298.90 € 110,504.95 € 210.50 - € 910.80 € 295.25 0.19 % - 0.83 % 0.27 %
Market-07-rural-low HM 800 18,081 € 44,903.42 € 2.48 € 45,026.10 € 44,357.75 € 45,081.30 € 122.68 - € 545.67 € 177.88 0.27 % - 1.22 % 0.40 %
Market-08-city-high HM 1,151 47,774 € 109,727.69 € 2.30 € 110,064.25 € 108,238.30 € 110,202.80 € 336.56 - € 1,489.39 € 475.11 0.31 % - 1.36 % 0.43 %
Market-08-city-low HM 812 24,277 € 54,490.64 € 2.24 € 54,658.25 € 53,739.00 € 54,729.40 € 167.61 - € 751.64 € 238.76 0.31 % - 1.38 % 0.44 %
Market-09-rural-high DS 227 4,992 € 10,436.90 € 2.09 € 10,475.50 € 10,281.50 € 10,480.55 € 38.60 - € 155.40 € 43.65 0.37 % - 1.49 % 0.42 %
Market-09-rural-low DS 179 3,045 € 6,428.63 € 2.11 € 6,449.20 € 6,345.50 € 6,450.10 € 20.57 - € 83.13 € 21.47 0.32 % - 1.29 % 0.33 %
Market-10-city-high DS 190 4,032 € 7,884.54 € 1.96 € 7,914.25 € 7,762.90 € 7,918.15 € 29.71 - € 121.64 € 33.61 0.38 % - 1.54 % 0.43 %
Market-10-city-low DS 171 3,075 € 6,419.04 € 2.09 € 6,440.00 € 6,333.95 € 6,440.95 € 20.96 - € 85.09 € 21.91 0.33 % - 1.33 % 0.34 %
Market-11-city-high Dis 399 18,080 € 21,644.18 € 1.20 € 21,746.55 € 21,149.50 € 21,817.65 € 102.37 - € 494.68 € 173.47 0.47 % - 2.29 % 0.80 %
Market-11-city-low Dis 302 10,502 € 11,421.26 € 1.09 € 11,491.45 € 11,122.45 € 11,526.25 € 70.19 - € 298.81 € 104.99 0.61 % - 2.62 % 0.92 %
Market-12-rural-high Dis 460 19,628 € 28,269.57 € 1.44 € 28,372.70 € 27,714.50 € 28,468.75 € 103.13 - € 555.07 € 199.18 0.36 % - 1.96 % 0.70 %
Market-12-rural-low Dis 326 8,309 € 11,779.66 € 1.42 € 11,834.75 € 11,539.80 € 11,858.05 € 55.09 - € 239.86 € 78.39 0.47 % - 2.04 % 0.67 %
Market-13-rural-high SM/SS 798 12,343 € 28,126.97 € 2.28 € 28,213.90 € 27,742.95 € 28,246.15 € 86.93 - € 384.02 € 119.18 0.31 % - 1.37 % 0.42 %
Market-13-rural-low SM/SS 429 4,115 € 7,775.55 € 1.89 € 7,804.75 € 7,647.10 € 7,816.40 € 29.20 - € 128.45 € 40.85 0.38 % - 1.65 % 0.53 %
Market-14-city-high SM/SS 1,278 34,603 € 75,226.59 € 2.17 € 75,465.20 € 74,188.55 € 75,568.60 € 238.61 - € 1,038.04 € 342.01 0.32 % - 1.38 % 0.45 %
Market-14-city-low SM/SS 619 12,243 € 20,679.71 € 1.69 € 20,755.15 € 20,330.35 € 20,797.20 € 75.44 - € 349.36 € 117.49 0.36 % - 1.69 % 0.57 %
Market-15-city-high SM/SS 1,173 71,307 € 127,590.96 € 1.79 € 127,907.85 € 125,581.90 € 128,539.85 € 316.89 - € 2,009.06 € 948.89 0.25 % - 1.57 % 0.74 %
Market-15-city-low SM/SS 600 20,849 € 35,516.48 € 1.70 € 35,650.80 € 34,875.25 € 35,736.10 € 134.32 - € 641.23 € 219.62 0.38 % - 1.81 % 0.62 %
Market-16-rural-high SM/SS 1,048 36,506 € 74,023.65 € 2.03 € 74,205.50 € 72,998.70 € 74,472.40 € 181.85 - € 1,024.95 € 448.75 0.25 % - 1.38 % 0.61 %
Market-16-rural-low SM/SS 536 9,575 € 18,691.79 € 1.95 € 18,752.05 € 18,401.20 € 18,790.90 € 60.26 - € 290.59 € 99.11 0.32 % - 1.55 % 0.53 %
Market-17-rural-low Dis 205 3,115 € 3,704.08 € 1.19 € 3,721.05 € 3,618.50 € 3,734.35 € 16.97 - € 85.58 € 30.27 0.46 % - 2.31 % 0.82 %
Market-17-rural-low Dis 335 6,454 € 7,630.04 € 1.18 € 7,670.10 € 7,460.95 € 7,714.45 € 40.06 - € 169.09 € 84.41 0.53 % - 2.22 % 1.11 %
31 Business type “SM” stands for supermarket.“SS” for superstore. “DS” for drugstore“Dis” for discount store and “HM” for hypermarket.
Market-18-city-high Dis 391 11,811 € 16,087.61 € 1.36 € 16,135.70 € 15,790.75 € 16,271.30 € 48.09 - € 296.86 € 183.69 0.30 % - 1.85 % 1.14 %
Market-18-city-low Dis 263 5,059 € 6,361.10 € 1.26 € 6,386.95 € 6,222.45 € 6,421.85 € 25.85 - € 138.65 € 60.75 0.41 % - 2.18 % 0.96 %
Market-19-city-high SM/SS 632 15,195 € 28,658.18 € 1.89 € 28,746.10 € 28,244.70 € 28,799.50 € 87.92 - € 413.48 € 141.32 0.31 % - 1.44 % 0.49 %
Market-19-city-low SM/SS 574 16,761 € 29,136.33 € 1.74 € 29,232.10 € 28,682.15 € 29,287.50 € 95.77 - € 454.18 € 151.17 0.33 % - 1.56 % 0.52 %
Market-20-city-high HM 915 24,038 € 52,727.02 € 1.19 € 52,885.80 € 52,031.00 € 52,946.45 € 158.78 - € 696.02 € 219.43 0.30 % - 1.32 % 0.42 %
Market-20-city-low HM 699 15,416 € 34,367.74 € 2.23 € 34,463.50 € 33,940.00 € 34,519.75 € 95.76 - € 427.74 € 152.01 0.28 % - 1.24 % 0.44 %
Market-21-rural-high HM 786 15,323 € 35,989.11 € 2.35 € 36,081.65 € 35,559.50 € 36,131.40 € 92.54 - € 429.61 € 142.29 0.26 % - 1.19 % 0.40 %
Market-21-rural-low HM 520 8,496 € 23,113.64 € 2.72 € 23,171.95 € 22,857.85 € 23,191.95 € 58.31 - € 255.79 € 78.31 0.25 % - 1.11 % 0.34 %
Market-22-rural-high SM/SS 583 10,544 € 22,945.76 € 2.18 € 23,015.95 € 22,629.15 € 23,043.40 € 70.19 - € 316.61 € 97.64 0.31 % - 1.38 % 0.43 %
Market-22-rural-low SM/SS 548 7,786 € 14,206.02 € 1.82 € 14,257.90 € 13,980.45 € 14,274.35 € 51.88 - € 225.57 € 68.33 0.37 % - 1.59 % 0.48 %
631,723 € 1,310,826.53 € 2.08 € 1,314,619.30 € 1,292,856.70 € 1,317,255.85 Average 0 .32 % - 1 .50 % 0 .53 %
min 0 .12 % - 2 .62 % 0 .13 %
max 0 .61 % - 0 .47 % 1 .14 %

Imprint
Published by:Deutsche BundesbankWilhelm-Epstein-Strasse 1460431 Frankfurt am MainGermany www.bundesbank.de
Prepared by:Silvia Welander (Deutsche Bundesbank)
ISBN (print) 978-3-95729-229-2ISBN (online) 978-3-95729-230-8
Cover picture: © 2013 Isabel Pavia
Reproduction is permitted only with the approval of the Deutsche Bundesbank and the authors. Last revised: May 2015.
This is a translation of the original German language version, which is the sole authoritative text.

Fran
k H
orst
Co
ins
stud
y –
Imp
act
asse
ssm
ent
of
roun
din
g in
the
ret
ail s
ecto
r
Copyright © 2022 FDOKUMEN