Cognitive Affective State (CAS), an ecological component of executive function, explains variance...
22
Cognitive-Affective State (CAS), an Ecological Component of Executive Function, Explains Variance between CAT scores and GCSE Grade Predictions Simon P Walker Centre for Human Ecology Theory, UK www.humanecology.webeden.co.uk http://heeducation.webeden.co.uk/#/research/4574561474 (checked 24.3.2012) Abstract This study reviews data collected from cohorts of yr 10 students in the UK, across four different, independent learning environments, to identify potential correlations between learner-environment state and academic performance. The data was collected between December 2012 and December 2013 at four UK secondary schools. 496 Yr 10 students took part and more than 2,500 subject lesson assessments were made. This study provides evidence that Footprints Rank, a measure of what we have titled in this study the learner’s lesson-specific Cognitive-Affective State (CAS), correlates with a measure of general intelligence (g), CAT score. This supports the finding by Walker (2013) that Footprints Rank can be a measure of academic performance by measuring the adaptive cognition of a student to their learning environment. The study data also shows that this model of CAS explains variance in predicted GCSE grade that CAT scores cannot account for. On the basis of this, a model of the relationship between CAS and g is conceptualised and represented in a schematic diagram in which CAS describes the cognitive-affective state of the learner to their learning environment. CAS is conceived therefore as an ecological component of cognition. A hypothesis called ‘optimal CAS’ is proposed whereby academic performance is influenced by both g and optimal CAS. Optimal and sub-optimal CAS have an influence on academic performance that explains variance within and in addition to CAT score. Finally, a relationship between CAS and executive function (EF) is proposed, suggesting that CAS is an ecological sub-component of EF. CAS describes the management cognitive-affective state in response to the requirements of the learning environment.
Transcript of Cognitive Affective State (CAS), an ecological component of executive function, explains variance...
Cognitive-Affective State (CAS), an Ecological Component of
Executive Function, Explains Variance between CAT scores and
GCSE Grade Predictions
Simon P Walker
Centre for Human Ecology Theory, UK
www.humanecology.webeden.co.uk
http://heeducation.webeden.co.uk/#/research/4574561474 (checked 24.3.2012)
Abstract
This study reviews data collected from cohorts of yr 10 students in the UK, across four different,
independent learning environments, to identify potential correlations between learner-environment
state and academic performance. The data was collected between December 2012 and December 2013
at four UK secondary schools. 496 Yr 10 students took part and more than 2,500 subject lesson
assessments were made.
This study provides evidence that Footprints Rank, a measure of what we have titled in this
study the learner’s lesson-specific Cognitive-Affective State (CAS), correlates with a measure of
general intelligence (g), CAT score. This supports the finding by Walker (2013) that Footprints Rank
can be a measure of academic performance by measuring the adaptive cognition of a student to their
learning environment. The study data also shows that this model of CAS explains variance in
predicted GCSE grade that CAT scores cannot account for. On the basis of this, a model of the
relationship between CAS and g is conceptualised and represented in a schematic diagram in which
CAS describes the cognitive-affective state of the learner to their learning environment. CAS is
conceived therefore as an ecological component of cognition.
A hypothesis called ‘optimal CAS’ is proposed whereby academic performance is influenced
by both g and optimal CAS. Optimal and sub-optimal CAS have an influence on academic
performance that explains variance within and in addition to CAT score.
Finally, a relationship between CAS and executive function (EF) is proposed, suggesting that
CAS is an ecological sub-component of EF. CAS describes the management cognitive-affective state
in response to the requirements of the learning environment.
2
Introduction: An ecological view of cognitive ability
Intrinsic models of learning emphasise the intrinsic cognitive ability of the learner. Traditional IQ
models, for example, assume that a learner’s cognitive ability (or general intelligence, g) can be
measured in abstract and the resulting score will hold good for the learner whatever the context he is
learning in.
More recently, the construct of executive function (EF) has been proposed to describe the
relationship between g and the cognitive ability required to deal with in situ problems when handling
novel situations (Banich 2009). EF is a generalised construct that sits over a range of elements that
relate to the effective handling of novel situations (Miyake et al. 2000). These include events that
involve planning or decision making; that involve error correction or troubleshooting; situations
where responses are not well-rehearsed or contain novel sequences of actions; dangerous or
technically difficult situations; situations that require the overcoming of a strong habitual response or
resisting temptation. Growing evidence supports the conceptualisation that EF is a neurologically
overlapping but distinct construct from g (Barbey et al. 2012; Brydges et al. 2012; Blair 2006; Bull,
Scerif 2001; Burgess et al. 2006; Carlson et al. 2002; Crinella, Yu 1999; Lehto et al. 2003; Friedman
et al. 2006; Gray et al. 2003; Blair 2006; Conway et al. 2003).
Assessing an adaptive component of Executive Function using the Footprints technology
Some authors have criticised current assessments used to measure executive function (EF). Burgess et
al. (Burgess et al. 2006; Rabbitt 1997) argue that current EF tests are non-ecological in that they test
for atomised characteristics in abstract rather than in situ. Ecological tests would take account of the
environmental context of the behaviours, a recognition of the fact that EF is a construct which refers
to agency in situ, the ability to respond to novel situations. They would also accept that psychological
dimensions such as affective state, social role and personality should be incorporated into measures of
EF.
Walker has developed an assessment (the Footprints assessment technology), which he claims
may address some of these concerns, offering a ecological approach to testing some aspects of EF.
The Footprints technology, described in the Method section, is an instrument developed on the basis
of Walker’s Human Ecology Theory. He regards learning as an interaction between the learner and
the learning environment. Both the learner and the learning environment (constituted by peers,
teacher, classroom etc) are active co-creating agents in the learning process (Walker 2009). The
learner, therefore, cannot be studied in abstract or isolation; instead he must be looked at in situ,
within the contexts in which he is learning (Walker 2013). The cognitive strategies that the learner
deploys, refines and habituates must be understood as a situational response to the environmental
opportunities and conditions within which he is engaged in learning. I deploy the term Cognitive
Affective State to refer to this mental state that exists in the learner at any moment of interaction with
their environment. Within this proposal, CAS is a responsive cognitive system by which the learner
may adjust affective and cognitive state, upon receipt of an environmental cue, as a mode of
environmental adaptation.
The Footprints technology provides an online assessment environment through which a
learner simulates their interaction with their environment, within which CAS may be assessed.
Executive function, cognitive ability and academic achievement
This study seeks to extend our understanding of the relationships between Footprints scores, general
intelligence as measured by a cognitive ability test (CAT) and academic achievement as measured by
predicted grades in yr 10 students (aged 14-15).
General intelligence tests internationally show a strong correlation with academic
achievement (Barber 2005). The CAT whilst not claiming to be a general intelligence test, claims an
overall correlation with GCSE grades of 0.65 (GL Assessments 2012). Other environmental factors
which determine variance between intelligence tests and GCSE grades include socio-economic
3
factors; family and domestic situation; life situations; quality of educational support; physical and
mental health.
In this study these wider factors are controlled for. The cohort studied is a group of 60 yr 10
students from one school all of whom are eligible for free school meals. They represent a group from
a similar socio-economic context and receive the same educational resource and teaching from the
school. Our hypothesis is that this group will exhibit a higher degree of correlation between CAT
score and predicted GCSE grades because these other factors have been controlled; therefore the
influence of CAT score on GCSE grade will greater because the overall variance will be reduced.
Outstanding variance between CAT scores and GCSE predicted grades may be largely
attributed to within-school factors rather than between or outside school factors. If the Footprints
technology measures the state of the learner in her various learning environments as claimed, one
would expect Footprints scores to account for a significant proportion of the variance between CAT
scores and GCSE predicted grades. We argue that the experimental design offers a reliable
environment for assessing what additional proportion of variance can be explained by this technology
which cannot be explained by CAT score.
Method
Data collection
The study involved one cohort of a 60 yr 10 students with CAT scores from school H. Three further
yr 10 cohorts without CAT scores but with setting data, from schools B, E and M numbering 176, 121
and 55. All students undertook the Footprints assessments. Students undertook their baseline
assessments within the context of an ICT session, and then a minimum of three further subject
assessments including Maths, Science and English.
Assessment method
The Footprints assessment requires candidates to complete an online computer-based imagination
exercise. The exercise involves a series of verbal instructions, listened to through headphones, which
invite the candidate to imagine a space in their own imagination. See appendix for further explanation.
The instructions enable the candidate to form the dimensions, shape, features and activities of a space
they imagine in their mind. Having created their space, the candidate is then invited to score a set of
multiple choice statements about their space. These answers give a baseline score against a model of a
candidate’s instinctive Cognitive Affective State (CAS). Throughout the remainder of this paper, CAS
refers to the model of CAS measured by the Footprints assessment.
Measuring student imagined cognitive self-operation in learning contexts
Having established the individual’s baseline scores for instinctive CAS, the Footprints assessment
instrument then leads the candidate through three sets of further enquiries about their space.
Specifically, the candidate is invited to imagine, in turn, a particular learning context taking place
within their space; for example, their maths lesson, or their science lesson.
The chosen learning context is one which the candidate experiences in reality within school.
For example, if they are in maths set one in school, then in the Footprints imagination exercise, they
imagine maths set one as the learning context within their space. The candidate is cued up by verbal
cues to imagine how their space might be changed by each of the learning context taking place within
their space and how their activity might change.
The candidate then scores a comparative set of statements to the first baseline statement
which identifies how their instinctive CAS score modulates when participating in each learning
4
context in their imagined space. By this method, the Footprints assessments obtain four comparative
sets of data about each candidate; their instinctive CAS as baseline and then their situational CAS
when participating in three specific learning contexts.
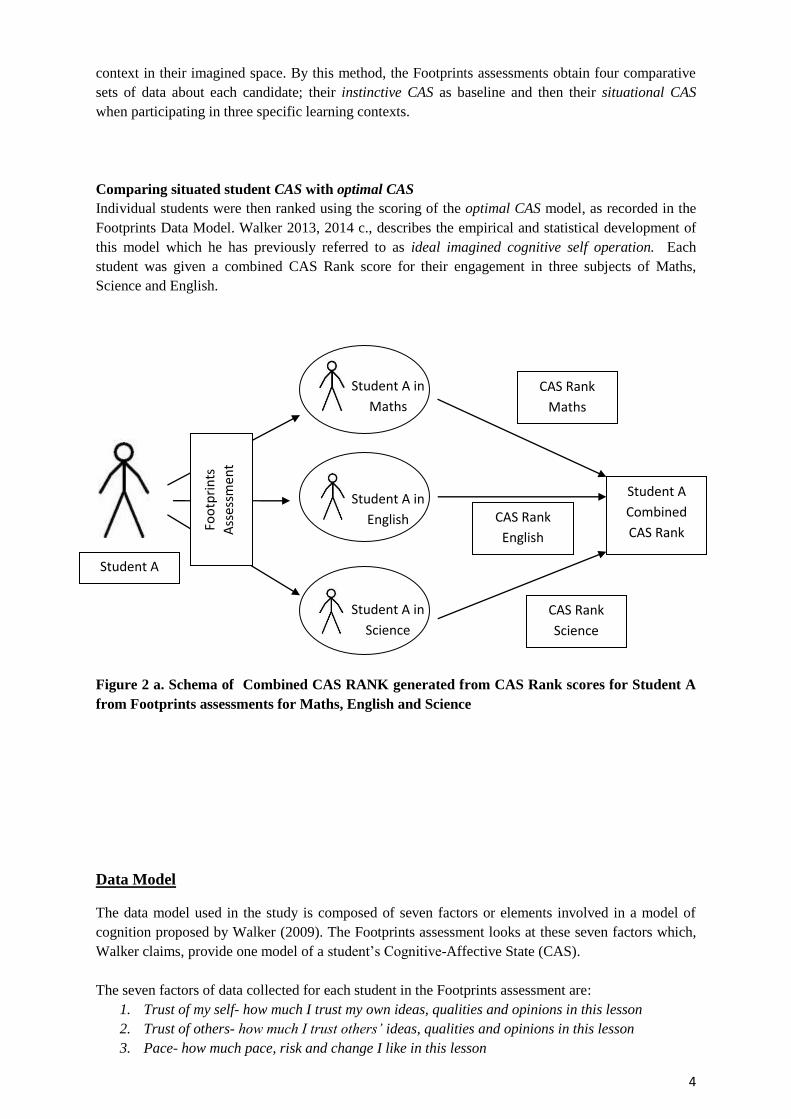
Comparing situated student CAS with optimal CAS
Individual students were then ranked using the scoring of the optimal CAS model, as recorded in the
Footprints Data Model. Walker 2013, 2014 c., describes the empirical and statistical development of
this model which he has previously referred to as ideal imagined cognitive self operation. Each
student was given a combined CAS Rank score for their engagement in three subjects of Maths,
Science and English.
Figure 2 a. Schema of Combined CAS RANK generated from CAS Rank scores for Student A
from Footprints assessments for Maths, English and Science
Data Model
The data model used in the study is composed of seven factors or elements involved in a model of
cognition proposed by Walker (2009). The Footprints assessment looks at these seven factors which,
Walker claims, provide one model of a student’s Cognitive-Affective State (CAS).
The seven factors of data collected for each student in the Footprints assessment are:
1. Trust of my self- how much I trust my own ideas, qualities and opinions in this lesson
2. Trust of others- how much I trust others’ ideas, qualities and opinions in this lesson
3. Pace- how much pace, risk and change I like in this lesson
Student A in
Maths
Student A in
English
Student A in
Science
CAS Rank
Science
CAS Rank
Maths
CAS Rank
English
Student A
Combined
CAS Rank
Student A
Foo
tpri
nts
Ass
essm
ent
5
4. Disclosure- how willing am I share to share thoughts, ideas, opinions and questions in this
lesson
5. Perspective- whether I see things from a detached or personal perspective in this lesson
6. Processing- whether I focus on making connections or following step by step in this lesson
7. Planning- whether I focus on the learning outcome or am open ended in this lesson
Walker identifies these seven factors as forming two clusters:
Cluster one Learning posture (factors 1-4) which are social and emotional strategies:
1. Trust of my self- how much I trust my own ideas, qualities and opinions in this lesson
2. Trust of other’s- how much I trust other’s ideas, qualities and opinions in this lesson
3. Pace- how much pace, risk and change I like in this lesson
4. Disclosure- how willing I am share to share thoughts, ideas, opinions and questions in this
lesson
Cluster Two Thinking strategy (5-7), which are cognitive strategies:
5. Perspective- whether I see things from a detached or personal perspective in this lesson
6. Processing- whether I focus on making connections or following step by step in this lesson
7. Planning- whether I focus on the learning outcome or am open ended in this lesson
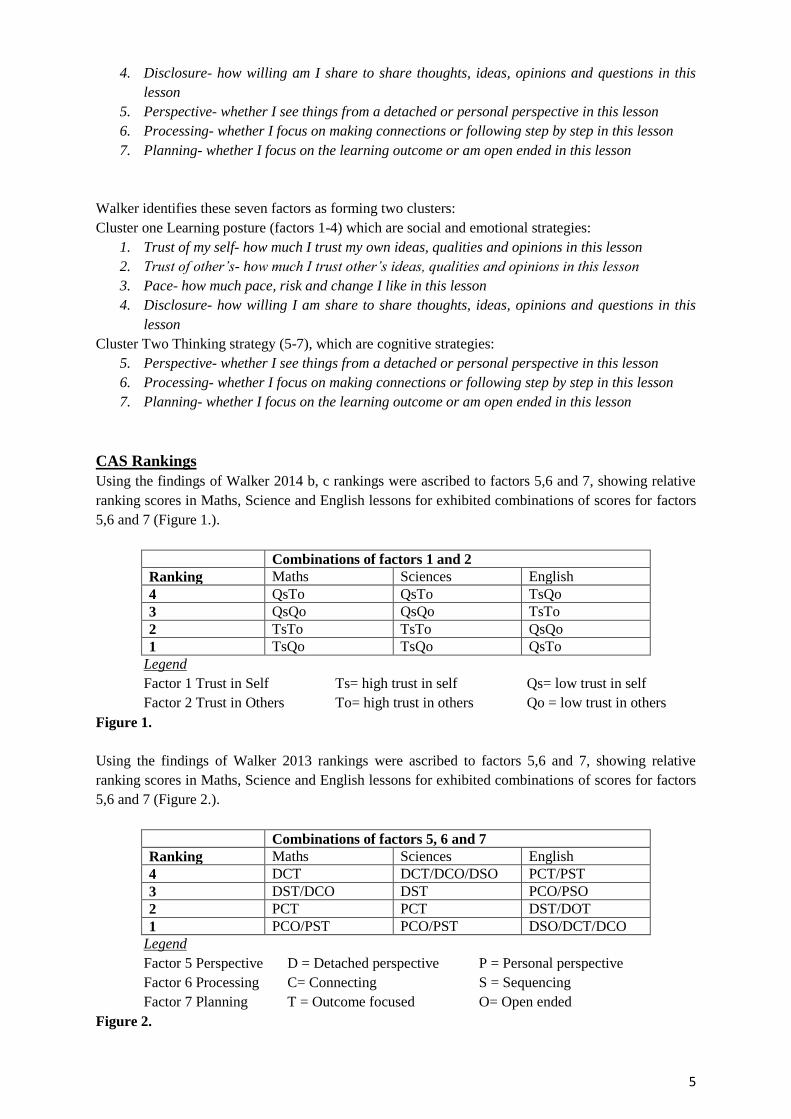
CAS Rankings
Using the findings of Walker 2014 b, c rankings were ascribed to factors 5,6 and 7, showing relative
ranking scores in Maths, Science and English lessons for exhibited combinations of scores for factors
5,6 and 7 (Figure 1.).
Combinations of factors 1 and 2
Ranking Maths Sciences English
4 QsTo QsTo TsQo
3 QsQo QsQo TsTo
2 TsTo TsTo QsQo
1 TsQo TsQo QsTo
Legend
Factor 1 Trust in Self Ts= high trust in self Qs= low trust in self
Factor 2 Trust in Others To= high trust in others Qo = low trust in others
Figure 1.
Using the findings of Walker 2013 rankings were ascribed to factors 5,6 and 7, showing relative
ranking scores in Maths, Science and English lessons for exhibited combinations of scores for factors
5,6 and 7 (Figure 2.).
Combinations of factors 5, 6 and 7
Ranking Maths Sciences English
4 DCT DCT/DCO/DSO PCT/PST
3 DST/DCO DST PCO/PSO
2 PCT PCT DST/DOT
1 PCO/PST PCO/PST DSO/DCT/DCO
Legend
Factor 5 Perspective D = Detached perspective P = Personal perspective
Factor 6 Processing C= Connecting S = Sequencing
Factor 7 Planning T = Outcome focused O= Open ended
Figure 2.
6
Factors 3 and 4 were not included in the CAS Ranking model because the significance of their role
has not been clearly correlated with set or cognitive ability in any study.
Inter-lesson CAS Rank scores
A total inter-lesson CAS Rank score was given to each student, representing the addition of their
individual lesson CAS rank scores in their English, Science and Maths lessons. This resulted in a
student’s inter-lesson CAS score of 5 being the lowest potential score and a CAS Rank of 20 being
the highest potential CAS Rank score. CAS Rank is therefore seen as the measure of the optimality of
a student’s adjustment of CAS to the subject lessons they are engaged in.
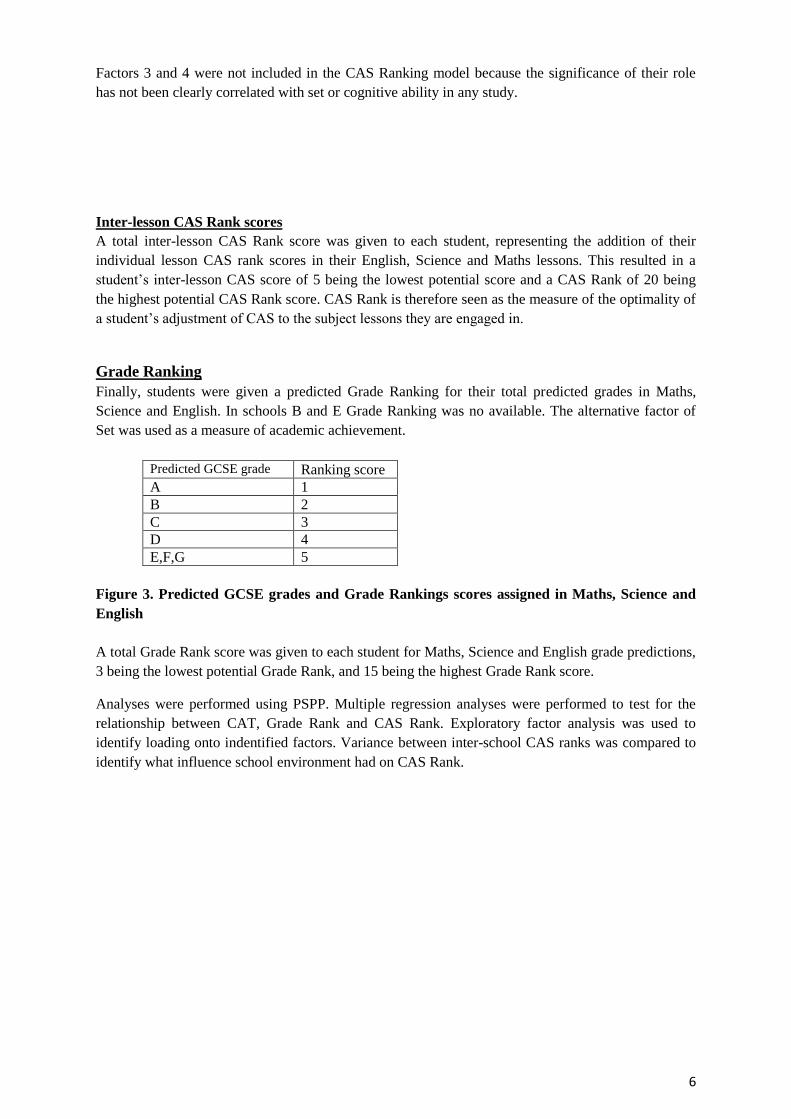
Grade Ranking
Finally, students were given a predicted Grade Ranking for their total predicted grades in Maths,
Science and English. In schools B and E Grade Ranking was no available. The alternative factor of
Set was used as a measure of academic achievement.
Predicted GCSE grade Ranking score
A 1
B 2
C 3
D 4
E,F,G 5
Figure 3. Predicted GCSE grades and Grade Rankings scores assigned in Maths, Science and
English
A total Grade Rank score was given to each student for Maths, Science and English grade predictions,
3 being the lowest potential Grade Rank, and 15 being the highest Grade Rank score.
Analyses were performed using PSPP. Multiple regression analyses were performed to test for the
relationship between CAT, Grade Rank and CAS Rank. Exploratory factor analysis was used to
identify loading onto indentified factors. Variance between inter-school CAS ranks was compared to
identify what influence school environment had on CAS Rank.
7
Results
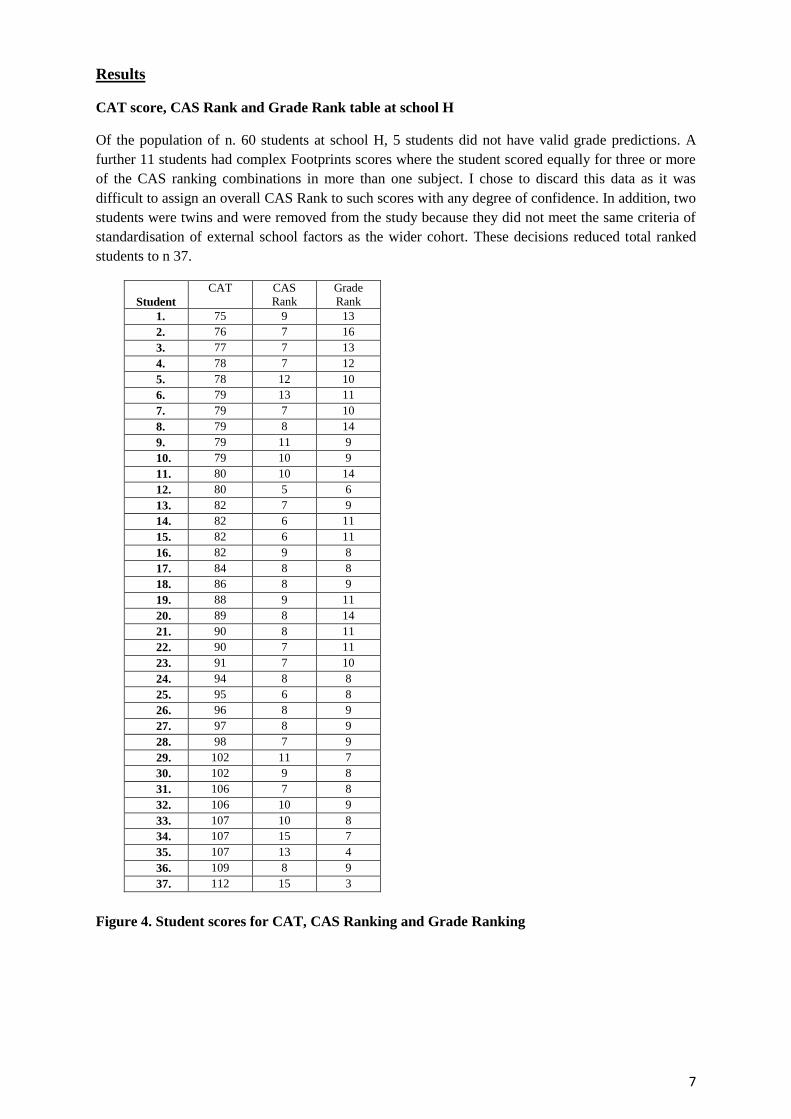
CAT score, CAS Rank and Grade Rank table at school H
Of the population of n. 60 students at school H, 5 students did not have valid grade predictions. A
further 11 students had complex Footprints scores where the student scored equally for three or more
of the CAS ranking combinations in more than one subject. I chose to discard this data as it was
difficult to assign an overall CAS Rank to such scores with any degree of confidence. In addition, two
students were twins and were removed from the study because they did not meet the same criteria of
standardisation of external school factors as the wider cohort. These decisions reduced total ranked
students to n 37.
Student
CAT CAS
Rank
Grade
Rank
1. 75 9 13
2. 76 7 16
3. 77 7 13
4. 78 7 12
5. 78 12 10
6. 79 13 11
7. 79 7 10
8. 79 8 14
9. 79 11 9
10. 79 10 9
11. 80 10 14
12. 80 5 6
13. 82 7 9
14. 82 6 11
15. 82 6 11
16. 82 9 8
17. 84 8 8
18. 86 8 9
19. 88 9 11
20. 89 8 14
21. 90 8 11
22. 90 7 11
23. 91 7 10
24. 94 8 8
25. 95 6 8
26. 96 8 9
27. 97 8 9
28. 98 7 9
29. 102 11 7
30. 102 9 8
31. 106 7 8
32. 106 10 9
33. 107 10 8
34. 107 15 7
35. 107 13 4
36. 109 8 9
37. 112 15 3
Figure 4. Student scores for CAT, CAS Ranking and Grade Ranking
8
Correlation between CAT score, CAS Rank and Grade Rank
PSPP was used to perform multiple rank correlations. A strong correlation (0.6451) between CAT
score and Grade Rank at school H was measured. A correlation of 0.6654 was measured when the
CAS Rank was added to the CAT score indicating that CAT score + CAS rank gives a slightly
stronger indicator of GCSE grade than CAT score alone.
A significant correlation of 0.3997 was measured between the CAS rank and Grade Rank at school H
confirming that CAS rank correlates with grade rank. This compared to a slightly lower but still
significant correlation of 0.3610 between CAS rank and CAT score.
Analysis of Variance between CAT score and CAS rank
The CAS Ranking scores were then correlated against CAT score. CAT score is a categorical
independent variable and CAS Ranking score is a categorical dependent variable; there are more than
two levels of the independent variable, thus the appropriate analysis is the one way analysis of
variance.
The relationship between CAT score and CAS Rank differed significantly F (1, 96) = 13102,
p = 0.0297
df SS MS F
Significance
F
Regression 1 502.049 502.049 4.871914 0.02968
Residual 96 9892.767 103.0497
Total 97 10394.82
Coefficients
Standard
Error t Stat P-value Lower 95%
Upper
95%
Lower
95.0%
Upper
95.0%
Intercept 93.18433 2.436399 38.24674 6.58E-60 88.34812 98.02055 88.34812 98.02055
1 -2.84562 1.289221 -2.20724 0.02968 -5.40471 -0.28654 -5.40471 -0.28654
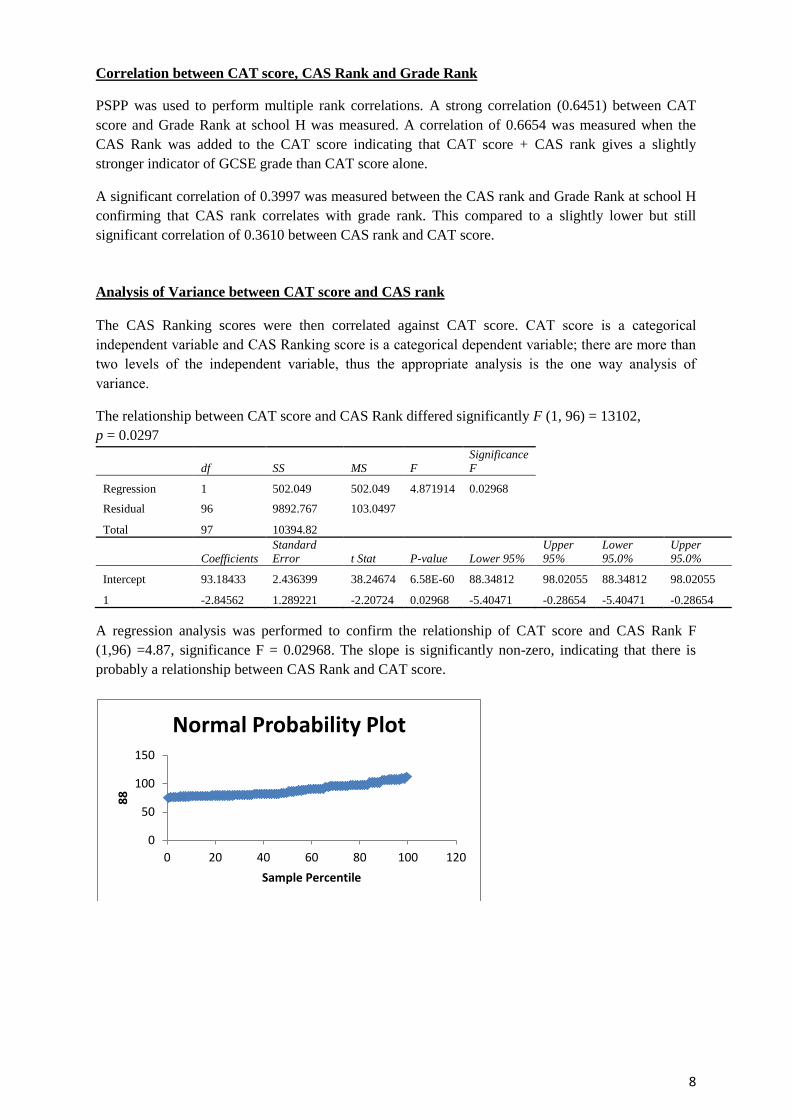
A regression analysis was performed to confirm the relationship of CAT score and CAS Rank F
(1,96) =4.87, significance F = 0.02968. The slope is significantly non-zero, indicating that there is
probably a relationship between CAS Rank and CAT score.
0
50
100
150
0 20 40 60 80 100 120
88
Sample Percentile
Normal Probability Plot
9
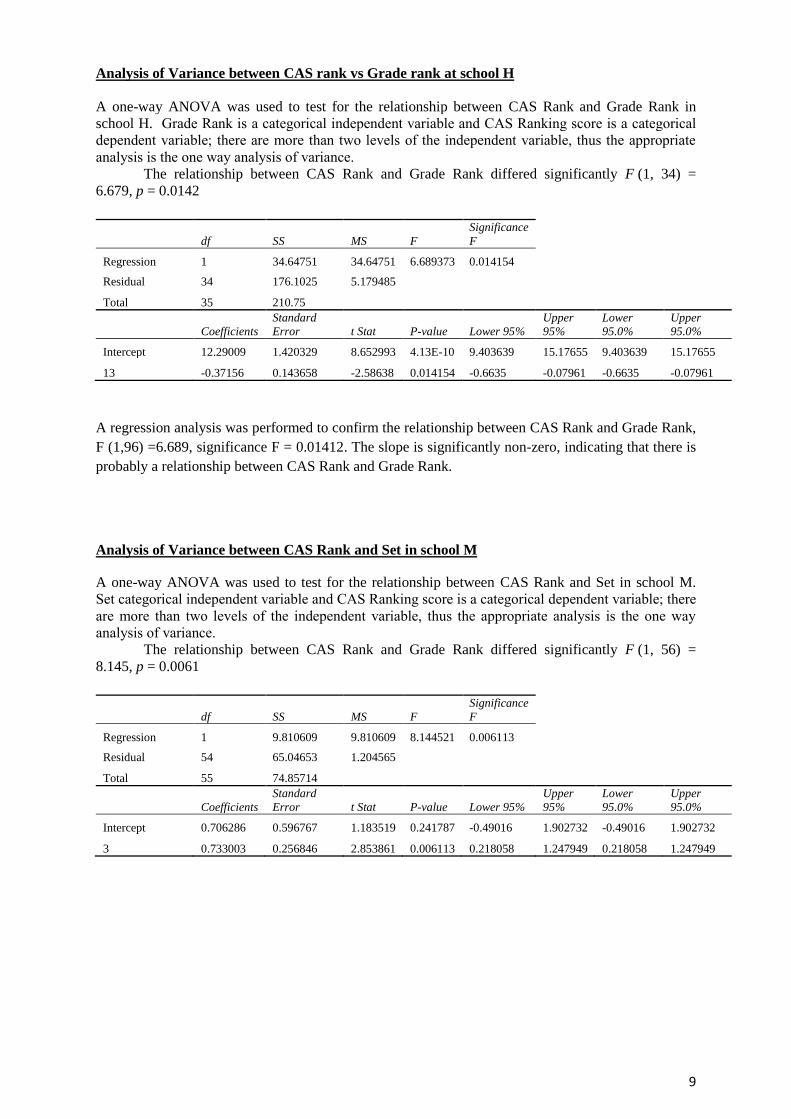
Analysis of Variance between CAS rank vs Grade rank at school H
A one-way ANOVA was used to test for the relationship between CAS Rank and Grade Rank in
school H. Grade Rank is a categorical independent variable and CAS Ranking score is a categorical
dependent variable; there are more than two levels of the independent variable, thus the appropriate
analysis is the one way analysis of variance. The relationship between CAS Rank and Grade Rank differed significantly F (1, 34) =
6.679, p = 0.0142
df SS MS F
Significance
F
Regression 1 34.64751 34.64751 6.689373 0.014154
Residual 34 176.1025 5.179485
Total 35 210.75
Coefficients
Standard
Error t Stat P-value Lower 95%
Upper
95%
Lower
95.0%
Upper
95.0%
Intercept 12.29009 1.420329 8.652993 4.13E-10 9.403639 15.17655 9.403639 15.17655
13 -0.37156 0.143658 -2.58638 0.014154 -0.6635 -0.07961 -0.6635 -0.07961
A regression analysis was performed to confirm the relationship between CAS Rank and Grade Rank,
F (1,96) =6.689, significance F = 0.01412. The slope is significantly non-zero, indicating that there is
probably a relationship between CAS Rank and Grade Rank.
Analysis of Variance between CAS Rank and Set in school M
A one-way ANOVA was used to test for the relationship between CAS Rank and Set in school M.
Set categorical independent variable and CAS Ranking score is a categorical dependent variable; there
are more than two levels of the independent variable, thus the appropriate analysis is the one way
analysis of variance.
The relationship between CAS Rank and Grade Rank differed significantly F (1, 56) =
8.145, p = 0.0061
df SS MS F
Significance
F
Regression 1 9.810609 9.810609 8.144521 0.006113
Residual 54 65.04653 1.204565
Total 55 74.85714
Coefficients
Standard
Error t Stat P-value Lower 95%
Upper
95%
Lower
95.0%
Upper
95.0%
Intercept 0.706286 0.596767 1.183519 0.241787 -0.49016 1.902732 -0.49016 1.902732
3 0.733003 0.256846 2.853861 0.006113 0.218058 1.247949 0.218058 1.247949
10
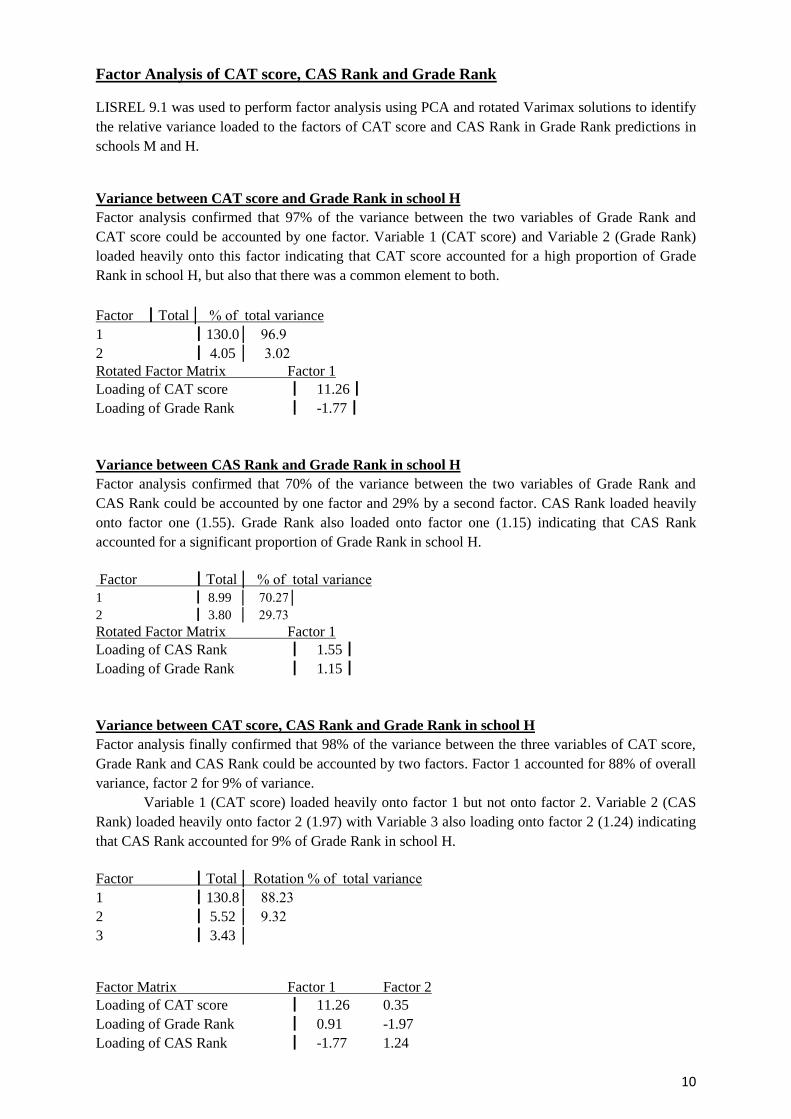
Factor Analysis of CAT score, CAS Rank and Grade Rank
LISREL 9.1 was used to perform factor analysis using PCA and rotated Varimax solutions to identify
the relative variance loaded to the factors of CAT score and CAS Rank in Grade Rank predictions in
schools M and H.
Variance between CAT score and Grade Rank in school H
Factor analysis confirmed that 97% of the variance between the two variables of Grade Rank and
CAT score could be accounted by one factor. Variable 1 (CAT score) and Variable 2 (Grade Rank)
loaded heavily onto this factor indicating that CAT score accounted for a high proportion of Grade
Rank in school H, but also that there was a common element to both.
Factor ┃Total │ % of total variance
1 ┃130.0 │ 96.9
2 ┃ 4.05 │ 3.02
Rotated Factor Matrix Factor 1
Loading of CAT score ┃ 11.26┃
Loading of Grade Rank ┃ -1.77┃
Variance between CAS Rank and Grade Rank in school H
Factor analysis confirmed that 70% of the variance between the two variables of Grade Rank and
CAS Rank could be accounted by one factor and 29% by a second factor. CAS Rank loaded heavily
onto factor one (1.55). Grade Rank also loaded onto factor one (1.15) indicating that CAS Rank
accounted for a significant proportion of Grade Rank in school H.
Factor ┃Total │ % of total variance
1 ┃ 8.99 │ 70.27│
2 ┃ 3.80 │ 29.73
Rotated Factor Matrix Factor 1
Loading of CAS Rank ┃ 1.55┃
Loading of Grade Rank ┃ 1.15┃
Variance between CAT score, CAS Rank and Grade Rank in school H
Factor analysis finally confirmed that 98% of the variance between the three variables of CAT score,
Grade Rank and CAS Rank could be accounted by two factors. Factor 1 accounted for 88% of overall
variance, factor 2 for 9% of variance.
Variable 1 (CAT score) loaded heavily onto factor 1 but not onto factor 2. Variable 2 (CAS
Rank) loaded heavily onto factor 2 (1.97) with Variable 3 also loading onto factor 2 (1.24) indicating
that CAS Rank accounted for 9% of Grade Rank in school H.
Factor ┃Total │ Rotation % of total variance
1 ┃130.8 │ 88.23
2 ┃ 5.52 │ 9.32
3 ┃ 3.43 │
Factor Matrix Factor 1 Factor 2
Loading of CAT score ┃ 11.26 0.35
Loading of Grade Rank ┃ 0.91 -1.97
Loading of CAS Rank ┃ -1.77 1.24
11
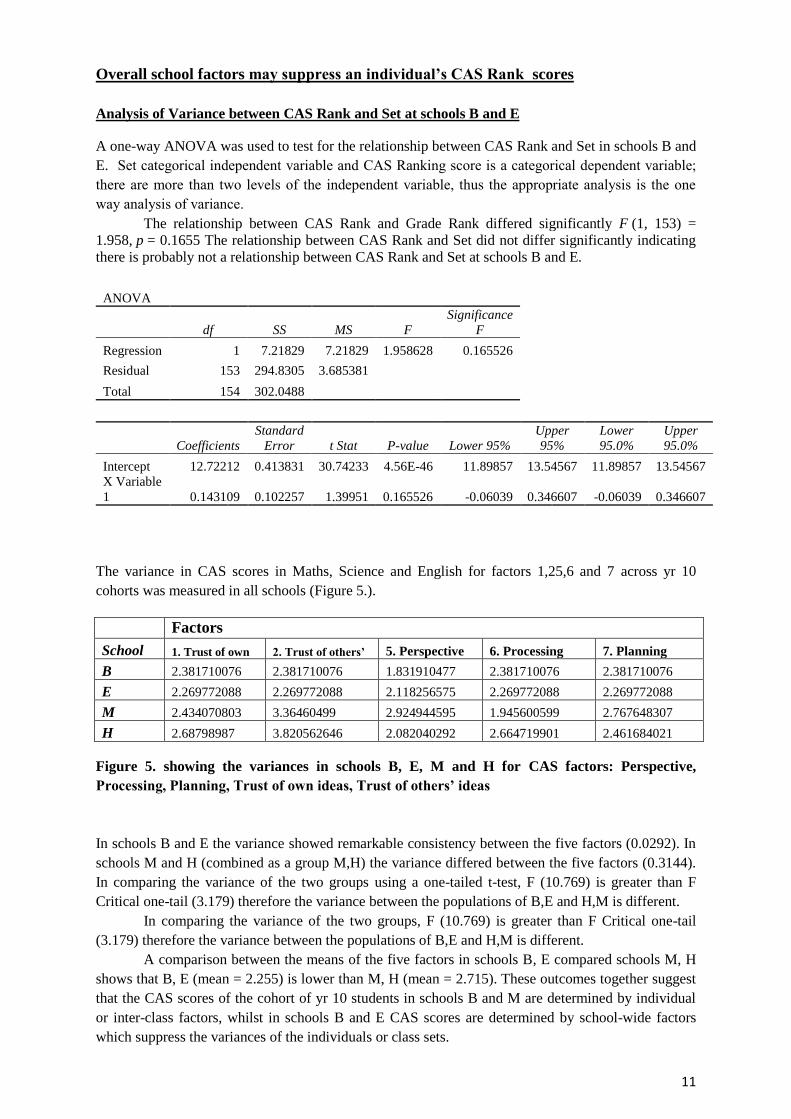
Overall school factors may suppress an individual’s CAS Rank scores
Analysis of Variance between CAS Rank and Set at schools B and E
A one-way ANOVA was used to test for the relationship between CAS Rank and Set in schools B and
E. Set categorical independent variable and CAS Ranking score is a categorical dependent variable;
there are more than two levels of the independent variable, thus the appropriate analysis is the one
way analysis of variance.
The relationship between CAS Rank and Grade Rank differed significantly F (1, 153) =
1.958, p = 0.1655 The relationship between CAS Rank and Set did not differ significantly indicating
there is probably not a relationship between CAS Rank and Set at schools B and E.
ANOVA
df SS MS F
Significance
F
Regression 1 7.21829 7.21829 1.958628 0.165526
Residual 153 294.8305 3.685381
Total 154 302.0488
Coefficients
Standard
Error t Stat P-value Lower 95%
Upper
95%
Lower
95.0%
Upper
95.0%
Intercept 12.72212 0.413831 30.74233 4.56E-46 11.89857 13.54567 11.89857 13.54567
X Variable
1 0.143109 0.102257 1.39951 0.165526 -0.06039 0.346607 -0.06039 0.346607
The variance in CAS scores in Maths, Science and English for factors 1,25,6 and 7 across yr 10
cohorts was measured in all schools (Figure 5.).
Factors
School 1. Trust of own 2. Trust of others’ 5. Perspective 6. Processing 7. Planning
B 2.381710076 2.381710076 1.831910477 2.381710076 2.381710076
E 2.269772088 2.269772088 2.118256575 2.269772088 2.269772088
M 2.434070803 3.36460499 2.924944595 1.945600599 2.767648307
H 2.68798987 3.820562646 2.082040292 2.664719901 2.461684021
Figure 5. showing the variances in schools B, E, M and H for CAS factors: Perspective,
Processing, Planning, Trust of own ideas, Trust of others’ ideas
In schools B and E the variance showed remarkable consistency between the five factors (0.0292). In
schools M and H (combined as a group M,H) the variance differed between the five factors (0.3144).
In comparing the variance of the two groups using a one-tailed t-test, F (10.769) is greater than F
Critical one-tail (3.179) therefore the variance between the populations of B,E and H,M is different.
In comparing the variance of the two groups, F (10.769) is greater than F Critical one-tail
(3.179) therefore the variance between the populations of B,E and H,M is different.
A comparison between the means of the five factors in schools B, E compared schools M, H
shows that B, E (mean = 2.255) is lower than M, H (mean = 2.715). These outcomes together suggest
that the CAS scores of the cohort of yr 10 students in schools B and M are determined by individual
or inter-class factors, whilst in schools B and E CAS scores are determined by school-wide factors
which suppress the variances of the individuals or class sets.

12
This result offers an ecological explanation for the non-significant correlation between Set
and CAS Rank in schools B and E, in contrast to the significant correlation between Set/Grade
Prediction and CAS Rank in schools H and M. Individual students would not be expected to exhibit a
correlation between Set and CAS Rank in a school in which CAS Rank was principally determined by
overall school factors.
These findings are discussed in greater detail by Walker in a further paper (2014b.)
13
Discussion
These results indicate that both cognitive ability as measured by CAT and CAS Rank contribute
significantly to GCSE grade prediction in yr 10 students in school H.
Correlation data from this study suggests CAS Rank correlates 0.39 with grade prediction.
This suggests that it accounts for about 20% of the variance in within-school GCSE grade prediction
in this study.
The proportion of GCSE grade variance in school H that cannot be assigned to CAT is 9%. In
addition CAS Rank contributes to the 88% that can be assigned to CAT, indicated by the high factor
loading of CAS Rank onto the factor onto which CAT score very largely loads.
The factor analysis of CAS Rank and Grade Rank indicates that a single factor accounts for
70% of the variance between the two, and that CAS Rank loads more heavily onto this one factor than
Grade Rank.
From these results we can suggest that whilst CAS Rank contributes to CAT score, CAT
score does appear to not contribute significantly to the distinctive factor of CAS Rank. CAS Rank is
an ecological factor which correlates identifies a component of Grade prediction missing from the
non-ecological CAT score which is to do with the leaner-learning environment interaction.
Ecological and non-ecological measures
CAS Rank and CAT appear to be measuring overlapping but different factors that are involved in the
prediction of academic achievement. The CAT test does not claim to be a test of general intelligence
(Ig or g) test (GL Assessments 2012) but does measure constructs regarded as components of g;
verbal, quantitative and nonverbal, as well as an element of spatial, ability. In a 5 year longitudinal
study Deary, Strand et al. (2007) found an overall correlation of 0.69 between GCSE grades with
CAT2s’ factor for g.
Multiple environmental factors have been shown to affect the relationship between a child’s
score for g and their GCSE grades. These may include parenting, school environment, quality of
teaching, socio-economic factors, health and wellbeing. In this study some of these environmental
factors were controlled for by the experimental design. The cohort was drawn from the same school;
school and teaching are therefore controlled for. In addition, this group were drawn from a similar
lower socio-economic group as measured by their receipt of additional government support called
pupil premium funding. One would therefore expect a higher correlation between CAT score and
predicted grade with these variables controlled for.
However, this study suggests that a proportion of the variance in predicted student grade
could not be accounted for by CAT but can be accounted for by CAS Rank. CAS Rank is an
ecological measure of cognitive and social components of metacognition. It assesses the interactivity
between the candidate and their immediate learning environment t in relation to seven boundary
factors identified in the Data Model. The score against these seven boundary factors constitutes what
Walker calls the ‘state’ that the candidate is in when engaged in that learning environment. A
candidate’s CAS Rank is a measure of their ability to alter their ‘Cognitive–Affective State’, in terms
of these seven factors, when engaging across a range of learning environments.
CAS therefore, can be conceptualised as representing the internal-external cognitive/affective
interaction between the learner and their environment. A schema can describe the postulated
relationship between CAS and g and the internal learning processes of the learner (i.e. their cognitive-
affective state) and the external learning environment (i.e. the context in which the learner is engaging
in the subject) (Figure 6.)
14
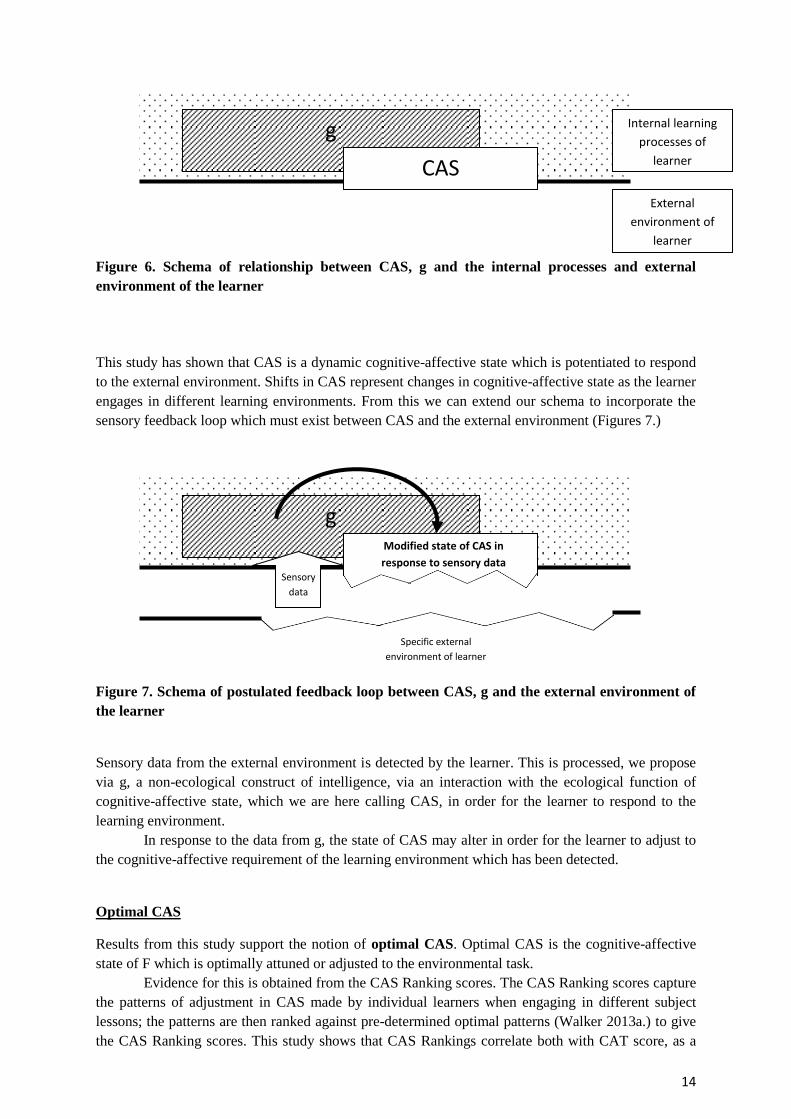
Figure 6. Schema of relationship between CAS, g and the internal processes and external
environment of the learner
This study has shown that CAS is a dynamic cognitive-affective state which is potentiated to respond
to the external environment. Shifts in CAS represent changes in cognitive-affective state as the learner
engages in different learning environments. From this we can extend our schema to incorporate the
sensory feedback loop which must exist between CAS and the external environment (Figures 7.)
Figure 7. Schema of postulated feedback loop between CAS, g and the external environment of
the learner
Sensory data from the external environment is detected by the learner. This is processed, we propose
via g, a non-ecological construct of intelligence, via an interaction with the ecological function of
cognitive-affective state, which we are here calling CAS, in order for the learner to respond to the
learning environment.
In response to the data from g, the state of CAS may alter in order for the learner to adjust to
the cognitive-affective requirement of the learning environment which has been detected.
Optimal CAS
Results from this study support the notion of optimal CAS. Optimal CAS is the cognitive-affective
state of F which is optimally attuned or adjusted to the environmental task.
Evidence for this is obtained from the CAS Ranking scores. The CAS Ranking scores capture
the patterns of adjustment in CAS made by individual learners when engaging in different subject
lessons; the patterns are then ranked against pre-determined optimal patterns (Walker 2013a.) to give
the CAS Ranking scores. This study shows that CAS Rankings correlate both with CAT score, as a
Internal learning
processes of
learner
External
environment of
learner
g
CAS
g
Specific external
environment of learner
Sensory
data
Modified state of CAS in
response to sensory data
15
measure of g, and also with GCSE grade predictions but explain a component of GCSE grade
prediction not explained by CAT score. The CAS Ranking score then, must be attributed to the
internal-external attunement which we are calling CAS.
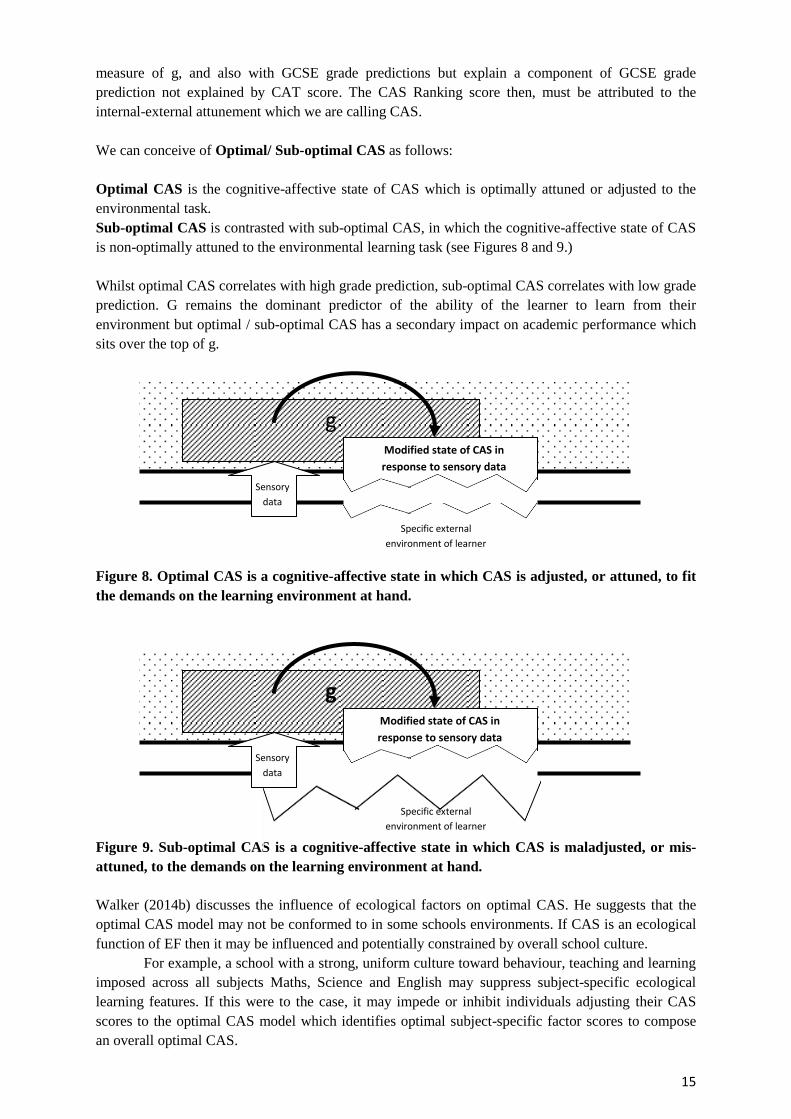
We can conceive of Optimal/ Sub-optimal CAS as follows:
Optimal CAS is the cognitive-affective state of CAS which is optimally attuned or adjusted to the
environmental task.
Sub-optimal CAS is contrasted with sub-optimal CAS, in which the cognitive-affective state of CAS
is non-optimally attuned to the environmental learning task (see Figures 8 and 9.)
Whilst optimal CAS correlates with high grade prediction, sub-optimal CAS correlates with low grade
prediction. G remains the dominant predictor of the ability of the learner to learn from their
environment but optimal / sub-optimal CAS has a secondary impact on academic performance which
sits over the top of g.
Figure 8. Optimal CAS is a cognitive-affective state in which CAS is adjusted, or attuned, to fit
the demands on the learning environment at hand.
Figure 9. Sub-optimal CAS is a cognitive-affective state in which CAS is maladjusted, or mis-
attuned, to the demands on the learning environment at hand.
Walker (2014b) discusses the influence of ecological factors on optimal CAS. He suggests that the
optimal CAS model may not be conformed to in some schools environments. If CAS is an ecological
function of EF then it may be influenced and potentially constrained by overall school culture.
For example, a school with a strong, uniform culture toward behaviour, teaching and learning
imposed across all subjects Maths, Science and English may suppress subject-specific ecological
learning features. If this were to the case, it may impede or inhibit individuals adjusting their CAS
scores to the optimal CAS model which identifies optimal subject-specific factor scores to compose
an overall optimal CAS.
g
Specific external
environment of learner
Sensory
data
g
Specific external
environment of learner
Sensory
data
Modified state of CAS in
response to sensory data
Modified state of CAS in
response to sensory data
16
CAS and Executive Function
The function of CAS, then, can be conceived as an internal-external cognitive-affective tuning system
by which the individual adjusts, shifts, regulates and directs attention and behaviour toward their
environment.
Walker has previously cited evidence (2013) that less academically successful students fail
because their cognitive-affective attunement is either inaccurate or inflexible. Inflexible students fail
because they do not adjust their cognitive-affective state of CAS at all in different learning contexts.
These students appear to lack contextual awareness and the cognitive flexibility. Other students, do
adjust CAS but their attunement is inaccurate. In other words, they adopt a sub-optimal state of CAS
for the learning contexts.
Metacognitive ability is regarded as closely related to the multi-component construct of
Executive Function (EF) (Halloran 2011; Miyake et al. 2000; Fernandez-Duque et al. 2000). This
study provides evidence that the ability to attune cognitive-affective state (CAS) to the immediate
learning environment does correlate with academic performance as measured by grade prediction.
Moreover, it explains a component of academic performance which is not explained by a measure of g
(CAT score). Miyake and Friedman’s theory proposes that there are three aspects of executive
function: updating, inhibition, and shifting (Miyake, Friedman et al. 2000) each of which relates to the
capacity to adapt one’s cognition to the task in hand. Updating is defined as the continuous
monitoring and quick addition or deletion of contents within one’s working memory. Inhibition is
one’s capacity to supersede responses that are prepotent in a given situation. Shifting is one’s
cognitive flexibility to switch between different tasks or mental states.
Bull and Scerif have identified that inhibition and shifting are predictors of children’s
mathematical ability (Bull, Scerif 2001). Walker (2014) has shown evidence that the ability to shift
one’s state of trust of one’s self and of others in relation to the learning environment and, thereby
learning task, correlates with one measure of cognitive ability. ‘Adaptive state’ of ‘trust of self-others’
correlates with higher CAT score.
In this study I identify five further constructs I propose influence the ‘adaptive state’ of the
learner to their environment and provide evidence that the ability to adapt the state of one’s CAS for
the learning task in hand is a function of academic performance. The study supports a contribution of
CAS toward EF, describing CAS as a dynamic cognitive-affective interface between the learner and
their environment; the ability of the learner to interact with, adjust to and interpret and learn from
environments in which they are placed.
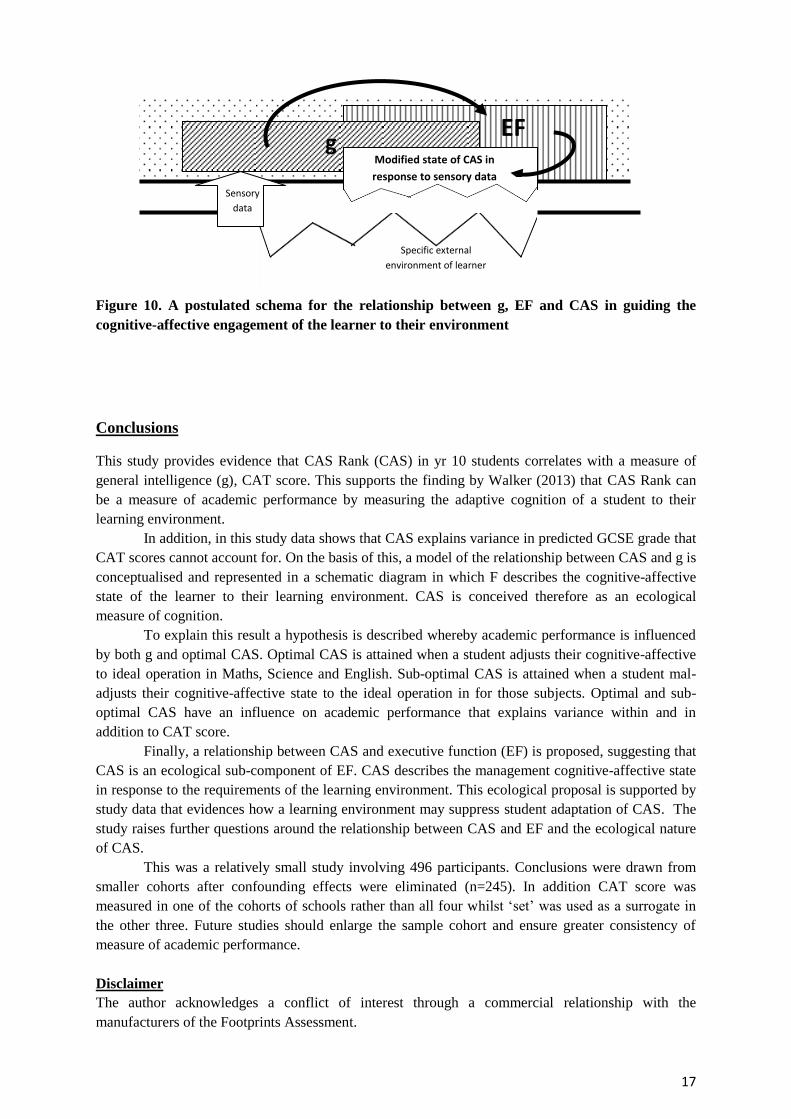
CAS can be conceptualised as a subset of EF which is responsible for guiding the cognitive-
affective engagement of the learner to their environment. CAS is responsible for the action of the
learner, their agency toward the environment which can be seen as an embodied rather that merely
cerebral posture (Figure 10.) The Miyake and Friedman model of executive function of updating,
inhibition and shifting provides a consonant framework for understanding that conceiving of the
relationship between g, CAS and the environment.
17
Figure 10. A postulated schema for the relationship between g, EF and CAS in guiding the
cognitive-affective engagement of the learner to their environment
Conclusions
This study provides evidence that CAS Rank (CAS) in yr 10 students correlates with a measure of
general intelligence (g), CAT score. This supports the finding by Walker (2013) that CAS Rank can
be a measure of academic performance by measuring the adaptive cognition of a student to their
learning environment.
In addition, in this study data shows that CAS explains variance in predicted GCSE grade that
CAT scores cannot account for. On the basis of this, a model of the relationship between CAS and g is
conceptualised and represented in a schematic diagram in which F describes the cognitive-affective
state of the learner to their learning environment. CAS is conceived therefore as an ecological
measure of cognition.
To explain this result a hypothesis is described whereby academic performance is influenced
by both g and optimal CAS. Optimal CAS is attained when a student adjusts their cognitive-affective
to ideal operation in Maths, Science and English. Sub-optimal CAS is attained when a student mal-
adjusts their cognitive-affective state to the ideal operation in for those subjects. Optimal and sub-
optimal CAS have an influence on academic performance that explains variance within and in
addition to CAT score.
Finally, a relationship between CAS and executive function (EF) is proposed, suggesting that
CAS is an ecological sub-component of EF. CAS describes the management cognitive-affective state
in response to the requirements of the learning environment. This ecological proposal is supported by
study data that evidences how a learning environment may suppress student adaptation of CAS. The
study raises further questions around the relationship between CAS and EF and the ecological nature
of CAS.
This was a relatively small study involving 496 participants. Conclusions were drawn from
smaller cohorts after confounding effects were eliminated (n=245). In addition CAT score was
measured in one of the cohorts of schools rather than all four whilst ‘set’ was used as a surrogate in
the other three. Future studies should enlarge the sample cohort and ensure greater consistency of
measure of academic performance.
Disclaimer
The author acknowledges a conflict of interest through a commercial relationship with the
manufacturers of the Footprints Assessment.
EF g
Specific external
environment of learner
Sensory
data
Modified state of CAS in
response to sensory data
18
Appendix
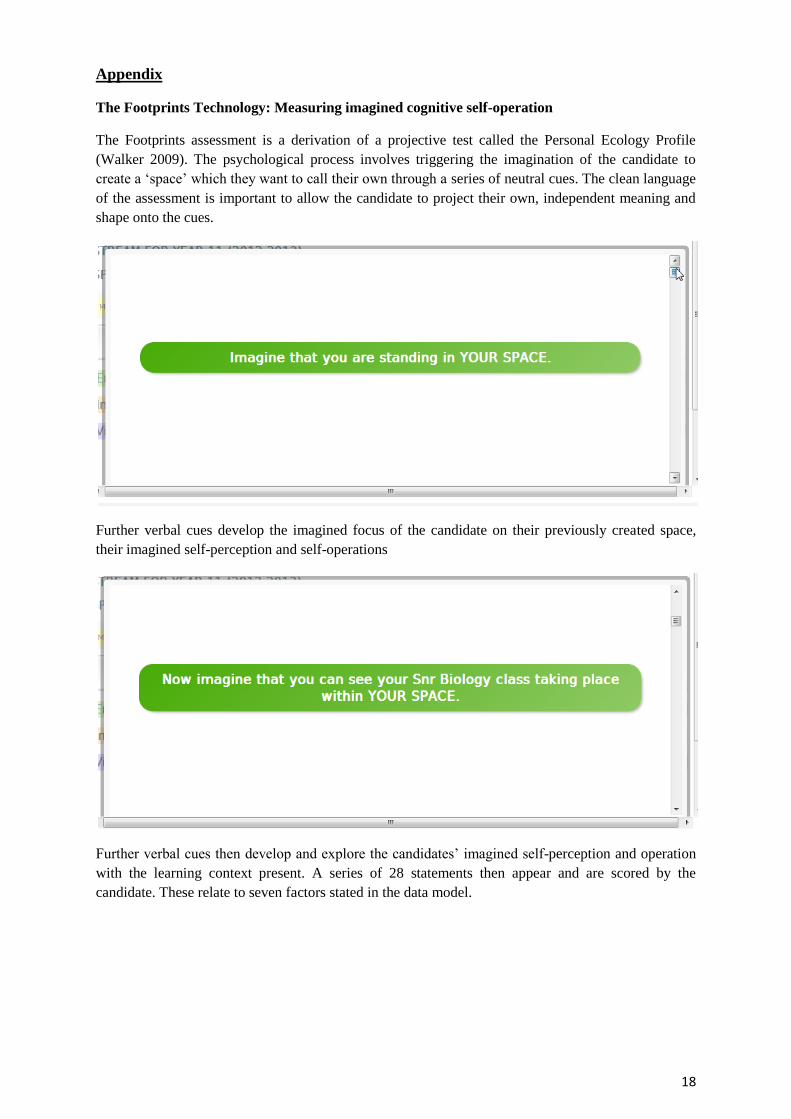
The Footprints Technology: Measuring imagined cognitive self-operation
The Footprints assessment is a derivation of a projective test called the Personal Ecology Profile
(Walker 2009). The psychological process involves triggering the imagination of the candidate to
create a ‘space’ which they want to call their own through a series of neutral cues. The clean language
of the assessment is important to allow the candidate to project their own, independent meaning and
shape onto the cues.
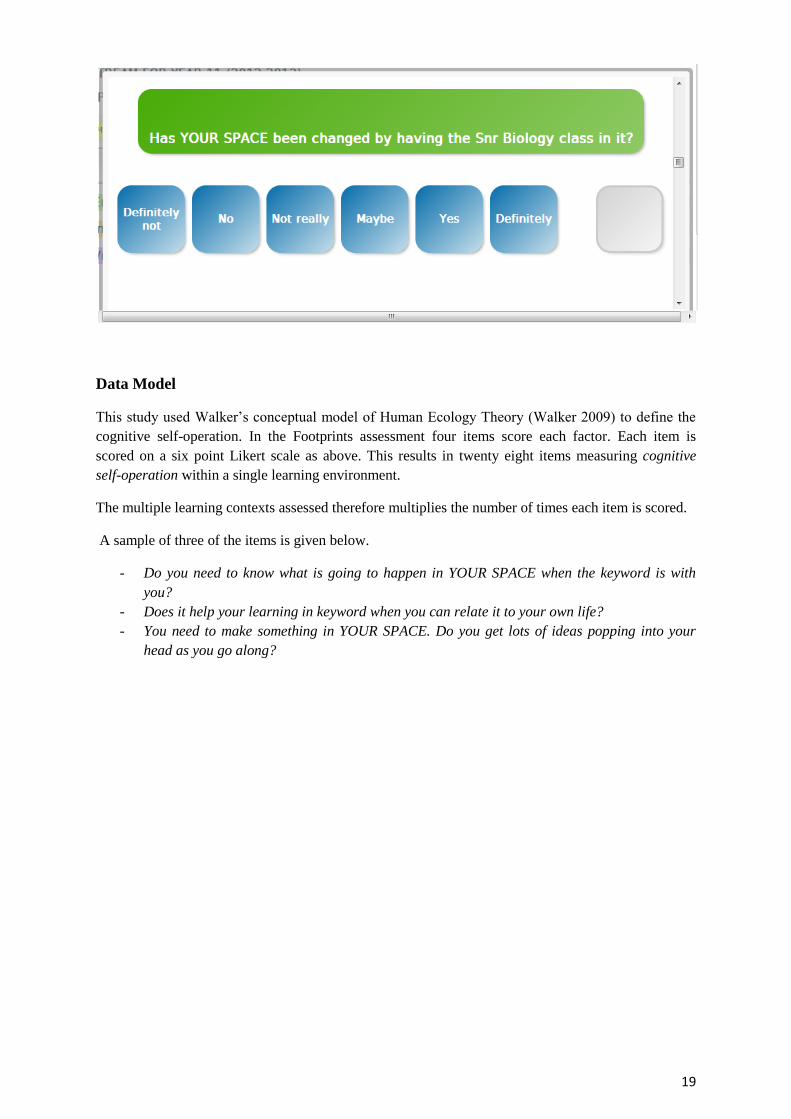
Further verbal cues develop the imagined focus of the candidate on their previously created space,
their imagined self-perception and self-operations
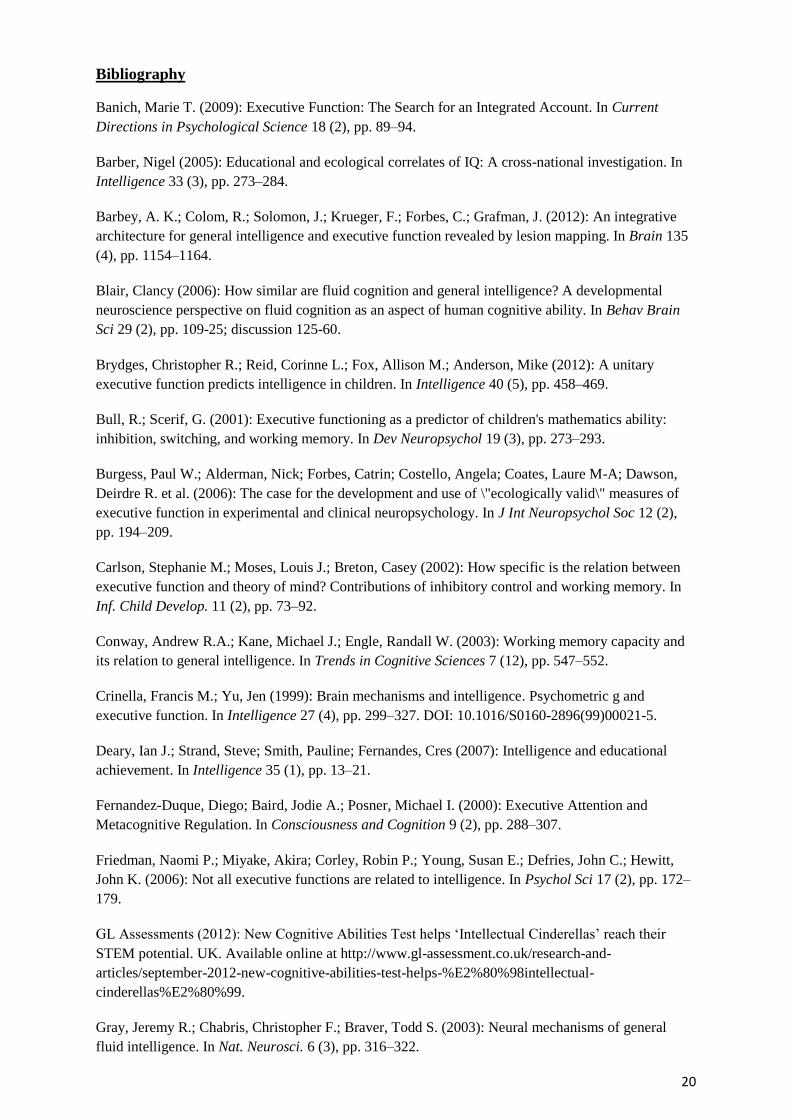
Further verbal cues then develop and explore the candidates’ imagined self-perception and operation
with the learning context present. A series of 28 statements then appear and are scored by the
candidate. These relate to seven factors stated in the data model.
19
Data Model
This study used Walker’s conceptual model of Human Ecology Theory (Walker 2009) to define the
cognitive self-operation. In the Footprints assessment four items score each factor. Each item is
scored on a six point Likert scale as above. This results in twenty eight items measuring cognitive
self-operation within a single learning environment.
The multiple learning contexts assessed therefore multiplies the number of times each item is scored.
A sample of three of the items is given below.
- Do you need to know what is going to happen in YOUR SPACE when the keyword is with
you?
- Does it help your learning in keyword when you can relate it to your own life?
- You need to make something in YOUR SPACE. Do you get lots of ideas popping into your
head as you go along?
20
Bibliography
Banich, Marie T. (2009): Executive Function: The Search for an Integrated Account. In Current
Directions in Psychological Science 18 (2), pp. 89–94.
Barber, Nigel (2005): Educational and ecological correlates of IQ: A cross-national investigation. In
Intelligence 33 (3), pp. 273–284.
Barbey, A. K.; Colom, R.; Solomon, J.; Krueger, F.; Forbes, C.; Grafman, J. (2012): An integrative
architecture for general intelligence and executive function revealed by lesion mapping. In Brain 135
(4), pp. 1154–1164.
Blair, Clancy (2006): How similar are fluid cognition and general intelligence? A developmental
neuroscience perspective on fluid cognition as an aspect of human cognitive ability. In Behav Brain
Sci 29 (2), pp. 109-25; discussion 125-60.
Brydges, Christopher R.; Reid, Corinne L.; Fox, Allison M.; Anderson, Mike (2012): A unitary
executive function predicts intelligence in children. In Intelligence 40 (5), pp. 458–469.
Bull, R.; Scerif, G. (2001): Executive functioning as a predictor of children's mathematics ability:
inhibition, switching, and working memory. In Dev Neuropsychol 19 (3), pp. 273–293.
Burgess, Paul W.; Alderman, Nick; Forbes, Catrin; Costello, Angela; Coates, Laure M-A; Dawson,
Deirdre R. et al. (2006): The case for the development and use of \"ecologically valid\" measures of
executive function in experimental and clinical neuropsychology. In J Int Neuropsychol Soc 12 (2),
pp. 194–209.
Carlson, Stephanie M.; Moses, Louis J.; Breton, Casey (2002): How specific is the relation between
executive function and theory of mind? Contributions of inhibitory control and working memory. In
Inf. Child Develop. 11 (2), pp. 73–92.
Conway, Andrew R.A.; Kane, Michael J.; Engle, Randall W. (2003): Working memory capacity and
its relation to general intelligence. In Trends in Cognitive Sciences 7 (12), pp. 547–552.
Crinella, Francis M.; Yu, Jen (1999): Brain mechanisms and intelligence. Psychometric g and
executive function. In Intelligence 27 (4), pp. 299–327. DOI: 10.1016/S0160-2896(99)00021-5.
Deary, Ian J.; Strand, Steve; Smith, Pauline; Fernandes, Cres (2007): Intelligence and educational
achievement. In Intelligence 35 (1), pp. 13–21.
Fernandez-Duque, Diego; Baird, Jodie A.; Posner, Michael I. (2000): Executive Attention and
Metacognitive Regulation. In Consciousness and Cognition 9 (2), pp. 288–307.
Friedman, Naomi P.; Miyake, Akira; Corley, Robin P.; Young, Susan E.; Defries, John C.; Hewitt,
John K. (2006): Not all executive functions are related to intelligence. In Psychol Sci 17 (2), pp. 172–
179.
GL Assessments (2012): New Cognitive Abilities Test helps ‘Intellectual Cinderellas’ reach their
STEM potential. UK. Available online at http://www.gl-assessment.co.uk/research-and-
articles/september-2012-new-cognitive-abilities-test-helps-%E2%80%98intellectual-
cinderellas%E2%80%99.
Gray, Jeremy R.; Chabris, Christopher F.; Braver, Todd S. (2003): Neural mechanisms of general
fluid intelligence. In Nat. Neurosci. 6 (3), pp. 316–322.
21
Halloran, Roberta Kathryn (2011): Self-regulation, executive function, working memory, and
academic achievement of female high school students. In ETD Collection for Fordham University,
pp. 1–139. Available online at http://fordham.bepress.com/dissertations/AAI3452791.
Lehto, Juhani E.; Juujärvi, Petri; Kooistra, Libbe; Pulkkinen, Lea (2003): Dimensions of executive
functioning: Evidence from children. In British Journal of Developmental Psychology 21 (1), pp. 59–
80.
Miyake, A.; Friedman, N. P.; Emerson, M. J.; Witzki, A. H.; Howerter, A.; Wager, T. D. (2000): The
unity and diversity of executive functions and their contributions to complex \"Frontal Lobe\" tasks: a
latent variable analysis. In Cogn Psychol 41 (1), pp. 49–100.
Rabbitt, Patrick. (1997): Methodology of frontal and executive function. Hove: Psychology Press.
Walker, Simon P., (2009 a.) A Brief Introduction to the Theory of Human Ecology, Human Ecology
Partners.
Walker, Simon P., (2009 b.): The Ecology of Coaching, A New Approach to Transformational
Coaching. Human Ecology Partners.
Walker, Simon P., (2013), The Operation of the Imagined Self and its Potential in Assessing
Cognitive Adaptation, 2013, Centre for Human Ecology Theory,
http://heeducation.webeden.co.uk/#/research/4574561474 (checked 24.3.2014).
Walker, Simon P., (2014 a.): The Relation of Cognitive Ability Test Scores in yr 10 students and their
State of Self-Trust in Lessons. Centre for Human Ecology Theory.
http://heeducation.webeden.co.uk/#/research/4574561474 (checked 24.3.2014).
Walker, Simon P., (2014 b.): Footprints Rank is a Measure of an Ecological Component
of Executive Function. Centre for Human Ecology Theory.
http://heeducation.webeden.co.uk/#/research/4574561474 (checked 24.3.2014).
Walker, Simon P., (2014 c.): The crystallisation of seven factors in a measure of cognitive-affective
state. Centre for Human Ecology Theory,.
http://heeducation.webeden.co.uk/#/research/4574561474 (checked 24.3.2014).
22
Centre for Human Ecology Theory, UK
www.humanecology.webeden.co.uk
The Centre for Human Ecology Theory was launched in 2013 and aims to develop insight into human
behaviour using Walker's Human Ecology Theory as its major tool through its research projects. The
Centre aims to bring together a community of practitioners from around the world committed to
developing understanding of human behaviour and how to engender more humane, sustainable living
through application of these ideas.
Walker's Human Ecology Theory was developed over a decade, from 2000-2010, by the author
through his work initially carried out whilst doing postgraduate studies at Oxford University in the
UK. Encompassing areas of human behaviour from personality theory, through to leadership,
organisational dynamics, teaching and learning, coaching and market cycles, Walker's Human
Ecology Theory claims to be a comprehensive human systems paradigm.
Resume of the researcher: Simon P Walker
Simon Walker taught at Wycliffe Hall, Oxford University between 2002-2009. He worked as a
consultant to the corporate world from 2002 and founded in 2004 The Leadership Community, an
alumni of graduates from his Undefended Leader course that grew to around five hundred over the
next five years.
In 2011 he announced a refocus on the area of education and schools, with a commitment to develop a
curriculum for social, emotional and cognitive development. Walker co-authored with Jo Walker, also
his wife, the Footprints schools programme, a version of the Human Ecology Approach for children.
He became a Coach in Residence at Monkton Combe School in 2012.
Walker is the author of several ideas about human behaviour including a distinctive theory which he
calls 'Human Ecology Theory', described in a monograph 'A Brief Introduction To The Theory of
Human Ecology.'
From his Human Ecology Theory Walker has developed a number of other ideas in the areas of
leadership, learning and coaching. He published the idea of 'undefended leadership' in a trilogy of
books launched at the Oxford Literary Festival. His ideas have had an influence on writers in the area
of Christian leadership (MODEM) school leadership (Seldon) and power in leadership (Preece).
Walker has also set out a basis for being 'undefended' upon Christian spirituality which he calls the
Undefended Life and has taught the principles of Undefended Life in Africa, Norway, India and
Australia. This has stimulated numerous responses from other commentators in the church.
Over the years, Walker has developed and commercialised several proprietary psychological
technologies and instruments to analyse and develop people using a Human Ecology Approach. These
including the Personal Ecology Profile, Leadership Signatures, Footprints Assessments and Coaching
Signatures. He has collaborated with Meredith Belbin on several projects.
Prior to his wider adult education career, Walker was ordained as an Anglican vicar in 1997 and
served his curacy in Abingdon, Oxfordshire. He has bachelor degrees in Biology and Theology from
Oxford, an MPhil in Applied Theology from Oxford. He has just submitted his DProf by Public
Works at Winchester University in 2014, a review of his contribution to the adult education between
1997-2014. He is an accredited member of The Association of Executive Coaching and Supervision.
References at http://humanecology.webeden.co.uk/#/who-is-simon-p-Walker/4575814295