
Cloud Service Provider Evaluation System using Fuzzy Rough ...
12
PREPRINT SUBMITTED TO IEEE TRANSACTIONS ON CLOUD COMPUTING 1 Cloud Service Provider Evaluation System using Fuzzy Rough Set Technique Parwat Singh Anjana 1 , Priyanka Badiwal 2 , Rajeev Wankar 2 , and C. Raghavendra Rao 2 [email protected], {priyanka.badiwal, rajeev.wankar, crrcs.ailab}@gmail.com Abstract—Cloud Service Providers (CSPs) offer a wide variety of scalable, flexible, and cost-efficient services to cloud users on demand and pay-per-utilization basis. However, vast diversity in available services leads to various challenges to determine and select the best suitable service for a user. Also, sometimes user need to hire the required services from multiple CSPs which introduce interface, account, security, support, and Service Level Agreements (SLAs) management difficulties. To circumvent such problems having a Cloud Service Broker (CSB) be aware of service offerings and user Quality of Service (QoS) requirements will benefit both the CSPs as well as a user. In this work, we proposed a Fuzzy Rough Set based Cloud Service Brokerage Architecture, which is responsible for ranking and selecting services based on users QoS requirements, and finally monitor the service execution. We have used fuzzy rough set technique for dimension reduction. Used weighted Euclidean distance to rank the CSPs. To prioritize user QoS request, we intended to use user assign weights, also incorporated system assigned weights to give the relative importance to QoS attributes. We compared the proposed ranking technique with an existing method based on the system response time. The case study experiment result shows that the proposed approach is scalable, resilience, and produce better results with less searching time. Index Terms—Cloud Service Provider (CSP), Cloud Service Broker (CSB), Fuzzy Rough Set Theory (FRST), Reduct, Quality of Service (QoS), Service Provider Ranking, Service Provider Selection. ✦ 1 I NTRODUCTION W ITH the emergence of Cloud, Cloud Service Providers (CSPs) offers a wide variety of flexible, scalable, on- demand, and pay-as go online resources to the cloud users [1]. Nowadays, Cloud becomes an indispensable component of the many organizations; it requires a right approach for adoption, deployment, and preservation of the resources [2]. Also, it introduces several challenges for the cloud user for choosing the best CSP among a considerable number of CSPs [3]. Further, organizations may even need to rent different services from different CSPs which lead to the chal- lenges of operating multiple interfaces, accounts, supports, and Service Level Agreements (SLAs) [2]. To facilitate the CSPs and to circumvent the difficulties faced by an organiza- tion (while for ranking, selecting, and dealing with multiple CSPs) we need a Cloud Service Broker (CSB). According to Gartner [4], a CSB is a third party (individual or an orga- nization) between CSPs and users. It provides intermedia- tion, aggregation, and arbitrage services to consult, mediate, and facilitates the cloud computing solutions on behalf of the users or business organizations [4]. An Intermediation service broker offers additional value-added service on top of existing services by appending specific capabilities, for example, identity, security, and access reporting and admin- istration. To advance data transfer security and integration, • Parwat Singh Anjana is with the 1 Department of CSE, Indian Institute of Technology Hyderabad, Hyderabad, India - 502285. E-mail: [email protected] • Priyanka Badiwal, Rajeev Wankar, and C. Raghavendra Rao are with 2 School of Computer and Information Sciences, Hyderabad Central University, Hyderabad, India - 500019. Email: {priyanka.badiwal, ra- jeev.wankar, crrcs.ailab}@gmail.com an Aggregation service broker includes consolidation and integration of various services, for example, data integration and portability assurance between different CSPs and users. An Arbitrage service broker is similar to aggregation broker, but the number of services being aggregated will not be fixed. An Arbitrage service broker acquires comprehensive services and presents it in smaller containers with more excellent cumulative value to the users, for example, a large block of bandwidth at wholesale rates. A CSB reduces processing costs, increase flexibility, provides access to var- ious CSPs within one contract channel, and offers timely execution of services by removing acquisition limits through reporting and billing policies [5]. The proposed architecture is an Aggregation service broker. Recent advancement in CSB focuses on developing ef- ficient systems and strategies that help the user to se- lect and monitor cloud resource efficiently. Service execu- tion and evaluation help in getting historical information about services and affected by dynamic, quantifiable and non-quantifiable QoS attribute [6]. A quantifiable QoS at- tribute mainly refers to functional QoS requirements and can efficiently be measured without any ambiguity, e.g., vCPU speed (frequency), service response time, cost, etc. While a non-quantifiable attribute primarily depends on non-functional QoS requirements and cannot be quanti- fied easily. In general, a non-quantifiable attribute depends on user experience, e.g., accountability, security, feedback, support, etc. [1]. However, the importance of quantifiable and non-quantifiable attributes are classified, existing ap- proaches do not present an efficient technique to handle non-quantifiable QoS attributes efficiently and objectively. Furthermore, quantified patterns are used to analyze user QoS requirements in existing techniques [1] [7]. While user arXiv:1810.07423v2 [cs.DC] 27 Oct 2018
-
Upload
khangminh22 -
Category
Documents
-
view
2 -
download
0
Transcript of Cloud Service Provider Evaluation System using Fuzzy Rough ...

PREPRINT SUBMITTED TO IEEE TRANSACTIONS ON CLOUD COMPUTING 1
Cloud Service Provider Evaluation System usingFuzzy Rough Set Technique
Parwat Singh Anjana1, Priyanka Badiwal2, Rajeev Wankar2, and C. Raghavendra Rao2
[email protected], {priyanka.badiwal, rajeev.wankar, crrcs.ailab}@gmail.com
Abstract—Cloud Service Providers (CSPs) offer a wide variety of scalable, flexible, and cost-efficient services to cloud users ondemand and pay-per-utilization basis. However, vast diversity in available services leads to various challenges to determine and selectthe best suitable service for a user. Also, sometimes user need to hire the required services from multiple CSPs which introduceinterface, account, security, support, and Service Level Agreements (SLAs) management difficulties. To circumvent such problemshaving a Cloud Service Broker (CSB) be aware of service offerings and user Quality of Service (QoS) requirements will benefit boththe CSPs as well as a user. In this work, we proposed a Fuzzy Rough Set based Cloud Service Brokerage Architecture, which isresponsible for ranking and selecting services based on users QoS requirements, and finally monitor the service execution. We haveused fuzzy rough set technique for dimension reduction. Used weighted Euclidean distance to rank the CSPs. To prioritize user QoSrequest, we intended to use user assign weights, also incorporated system assigned weights to give the relative importance to QoSattributes. We compared the proposed ranking technique with an existing method based on the system response time. The case studyexperiment result shows that the proposed approach is scalable, resilience, and produce better results with less searching time.
Index Terms—Cloud Service Provider (CSP), Cloud Service Broker (CSB), Fuzzy Rough Set Theory (FRST), Reduct, Quality ofService (QoS), Service Provider Ranking, Service Provider Selection.
F
1 INTRODUCTION
W ITH the emergence of Cloud, Cloud Service Providers(CSPs) offers a wide variety of flexible, scalable, on-
demand, and pay-as go online resources to the cloud users[1]. Nowadays, Cloud becomes an indispensable componentof the many organizations; it requires a right approach foradoption, deployment, and preservation of the resources[2]. Also, it introduces several challenges for the cloud userfor choosing the best CSP among a considerable numberof CSPs [3]. Further, organizations may even need to rentdifferent services from different CSPs which lead to the chal-lenges of operating multiple interfaces, accounts, supports,and Service Level Agreements (SLAs) [2]. To facilitate theCSPs and to circumvent the difficulties faced by an organiza-tion (while for ranking, selecting, and dealing with multipleCSPs) we need a Cloud Service Broker (CSB). According toGartner [4], a CSB is a third party (individual or an orga-nization) between CSPs and users. It provides intermedia-tion, aggregation, and arbitrage services to consult, mediate,and facilitates the cloud computing solutions on behalf ofthe users or business organizations [4]. An Intermediationservice broker offers additional value-added service on topof existing services by appending specific capabilities, forexample, identity, security, and access reporting and admin-istration. To advance data transfer security and integration,
• Parwat Singh Anjana is with the 1Department of CSE, Indian Instituteof Technology Hyderabad, Hyderabad, India - 502285.E-mail: [email protected]
• Priyanka Badiwal, Rajeev Wankar, and C. Raghavendra Rao are with2School of Computer and Information Sciences, Hyderabad CentralUniversity, Hyderabad, India - 500019. Email: {priyanka.badiwal, ra-jeev.wankar, crrcs.ailab}@gmail.com
an Aggregation service broker includes consolidation andintegration of various services, for example, data integrationand portability assurance between different CSPs and users.An Arbitrage service broker is similar to aggregation broker,but the number of services being aggregated will not befixed. An Arbitrage service broker acquires comprehensiveservices and presents it in smaller containers with moreexcellent cumulative value to the users, for example, alarge block of bandwidth at wholesale rates. A CSB reducesprocessing costs, increase flexibility, provides access to var-ious CSPs within one contract channel, and offers timelyexecution of services by removing acquisition limits throughreporting and billing policies [5]. The proposed architectureis an Aggregation service broker.
Recent advancement in CSB focuses on developing ef-ficient systems and strategies that help the user to se-lect and monitor cloud resource efficiently. Service execu-tion and evaluation help in getting historical informationabout services and affected by dynamic, quantifiable andnon-quantifiable QoS attribute [6]. A quantifiable QoS at-tribute mainly refers to functional QoS requirements andcan efficiently be measured without any ambiguity, e.g.,vCPU speed (frequency), service response time, cost, etc.While a non-quantifiable attribute primarily depends onnon-functional QoS requirements and cannot be quanti-fied easily. In general, a non-quantifiable attribute dependson user experience, e.g., accountability, security, feedback,support, etc. [1]. However, the importance of quantifiableand non-quantifiable attributes are classified, existing ap-proaches do not present an efficient technique to handlenon-quantifiable QoS attributes efficiently and objectively.Furthermore, quantified patterns are used to analyze userQoS requirements in existing techniques [1] [7]. While user
arX
iv:1
810.
0742
3v2
[cs
.DC
] 2
7 O
ct 2
018

PREPRINT SUBMITTED TO IEEE TRANSACTIONS ON CLOUD COMPUTING 2
requirements are imprecise or vague, we need a techniqueto handle it efficiently. The precise QoS attribute comprisesonly crisp values (un-ambiguous) while imprecise QoS at-tribute usually includes fuzzy values that cannot be quan-tified. We presented a hybrid imprecision technique whichconsists of quantifiable and non-quantifiable QoS attributes.A service user submits his desired QoS requirement alongwith weights using a Graphical User Interface (GUI) duringCSP ranking phase.
In the proposed architecture information system con-sists both quantifiable and non-quantifiable QoS attributes(to describe CSP service offerings and to formulate user’sQoS requirements). We employ Fuzzy Rough Set Technique(FRST) to deal with hybrid information system with real-valued entries (to provide the solution for real-time condi-tional attributes with a fuzzy decision) and for search spacereduction. For search space reduction all reducts of the de-cision system are computed using FRST, and the best reductis selected to generate Reduced Decision System (RDS). Thebest reduct is the reduct which consists maximum overlap-ping QoS attributes with user QoS request. The proposedarchitecture is an Aggregation broker designed using FRSTthat offers the cloud user facility to rank, select, and monitorthe services based on their desired QoS requirements.
The major contribution of this work includes:
• An effective cloud service broker to rank serviceproviders based on the user QoS requirements, to se-lect and monitor the service execution of the selectedservice provider.
• The principal focus is on dealing with hybrid systemand search space reduction using fuzzy rough settechnique. And to improve the accuracy of serviceprovider selection with the incorporation of dynamicand network layer QoS parameters (dynamic andNetwork QoS parameter changes with time andavailability of the resources).
• To oblige the CSPs to give satisfying services tocompete in further assignments by induction of userexperience (feedback) along with CSPs performancemonitoring during execution. By using this factor(past performances, user experience) in the servicedescription, we enhance the correctness of rankingprocedure.
• Introduction to user assigned weights to supportuser to prioritize their needs along with system as-signed weights to QoS attributes during the rank-ing procedure to improve ranking efficiency. Subse-quently allowing the user to choose their desired CSPfrom a ranked list.
The rest of the paper is structured in five sections asfollows. The detailed study of existing work and significantcontributions to CSP selection (using rough, fuzzy set) pre-sented in Section 2. Section 3 provides the overview ofFuzzy Rough Set and need of Fuzzy Rough Set Approach.Section 4 introduce proposed architecture and basic blocksof the architecture along with ranking algorithm. Section5 gives a comprehensive case study on ranking computecloud service providers (Infrastructure as a Service) alongwith results. At the end Section 6, conclude with somefuture directions.
2 RELATED WORK
With the advancement and increasing use of cloud services,researchers analyzed the CSPs for various types of appli-cation. A wide range of discovery and selection techniqueshave been developed for the evaluation of CSPs based onQoS requirements of the user. This section presents the workcarried out by researchers for CSP ranking and selectionusing rough, fuzzy set theory based techniques, along withsome other significant contribution which includes essentialspecification used in this paper.
To address the challenges of CSPs discovery and se-lection, Le et al., [8] presented a comprehensive surveyof existing service selection approaches. They evaluate theCSP selection approaches based on five aspects and charac-terized into four groups (Multi-Criteria Decision Making,Multi-Criteria Optimization, Logic-Based, and Other Ap-proaches). The Multi-Criteria Decision-Making based ap-proaches have successfully implemented to discover de-sired cloud services. It includes Analytic Hierarchy Process(AHP), Multi-Attribute Utility Theory (MAUT), Outrank-ing, and Simple Additive Weighting based techniques [8]which are an extension of Web services. Godse et al., [9]presented an MCDM based cloud services selection tech-nique, performed a case study to prove the significanceof methodology to solve SaaS selection. Garg et al., [1]introduced AHP technique based CSP ranking frameworkknown as SMICloud. This framework enables users to com-pare and select the CSP using “Service Measurement Index(SMI)” attributes to satisfy users QoS requirements. Theycomputed key performance indicators defined in the “CloudService Measurement Index Consortium [10] QoS standardsto compare cloud services. However, they did not examinetrustworthiness, user experience, and Network Layer QoSattribute for ranking and selection of CSPs.
Alhamad et al., [11] introduced a fuzzy set theory basedtechnique for CSP selection using availability, security, us-ability, and scalability as QoS attributes. Hussain et al., [12]proposed an MCDM based CSP selection technique for IaaSservices and presented a case study on service providerselection among thirteen providers using five performancecriteria. A Cloud-QoS Management Strategy (C-QoSMS)using rough set technique was proposed by Ganghishetti etal., [13]. Specifically, they considered ranking of IaaS cloudservices using SLA and QoS attributes. They also extendedtheir work in Modified C-QoSMS [14] and presented acase study using Random and Round Robin algorithms.However, they did not examine non-quantifiable QoS at-tribute and considered only categorical information hencethey need to discretize the numerical value for selection ofcloud services. Qu et al., [7] introduced a fuzzy hierarchybased trust evaluation using inference system to evaluatesusers trust based on fuzzy QoS requirements of users andprogressive fulfillment of services to advance CSP selection.With a case study and simulation, they illustrated the effec-tiveness and efficiency of their model. In [15] Patiniotakiset al., introduced a PuLSaR: Preference-based Cloud ServiceRecommender system which is an MCDM based optimiza-tion brokerage technique, in the proposed method to dealvagueness of imprecise QoS attributes they used fuzzy settheory. Furthermore, to demonstrate the performance of the
PREPRINT SUBMITTED TO IEEE TRANSACTIONS ON CLOUD COMPUTING 3
proposed procedure, they conducted experiments. In [16]Aruna et al., suggested a fuzzy set based ranking frameworkfor federated cloud IaaS infrastructure to rank the CSPsbased on QoS attributes and SLAs. Their proposed frame-work consists of three phases of AHP process as decompo-sition of the problem, priority judgment, and aggregationwith simple rule inductions. The first contribution to FuzzyRough Set based CSP ranking is introduced by Anjana etal., [3]. They proposed a Fuzzy Rough Set Based CloudService Broker (FRSCB) architecture in which they did theQoS Attribute Categorization into different types, also in-cludes network layer and non-quantifiable QoS attributes,ranked the CSPs by mean of the total score using Euclideandistance. They presented a case study with fifteen serviceprovider along with fifteen SMI based QoS attributes.
The proposed work E-FRSCB is an extension of workpresented in FRSCB architecture [3]. In our work, to dealwith dynamic quantifiable, and non-quantifiable character-istics of service measurement index based QoS attributes,we used the fuzzy rough set based hybrid technique. Weassigned different weights to attributes at different levelsof ranking procedure, incorporate quantifiable and non-quantifiable QoS attributes including network layer param-eters, fetch real-time values of dynamic attributes, monitorservice execution to improve next ranking assignment. Wealso simulated the behavior of our proposed work usingCloudSim [17] and demonstrated the significance of E-FRSCB against FRSCB.
3 FUZZY ROUGH SET THEORY (FRST)In traditional set theory, human reasoning is described usinga Boolean logic i.e. true or false (0/1) and are not enoughto reason efficiently. Therefore there is a need for decisionterms that take the value ranging within an interval from 0to 1 to represent human reasoning. The Fuzzy Set Theory(FST) proposed by Lotfi Zadeh [18] in 1965 can realizehuman reasoning in the form of a degree ’d’ such that 0<= d <= 1. For example, in FST a person is healthy by 70%(d = 0.7) or unhealthy by 30% (d = 0.3), while in traditionalset theory a person can be healthy (1/true) or unhealthy(0/false). FST based set membership function determinedby the Equation 1.
µy(X) ∈ [0, 1] (1)
Where: y ∈ X i.e. y is an element of X , and X is a set ofelements.
Rough Set Theory (RST) proposed by Pawlak [19] isa mathematical way to deal with vagueness (uncertainty)present in the data. RST proves its importance in Artifi-cial Intelligence manly in expert systems, decision systems,knowledge discovery, acquisition, and many more. Thefundamental advantage of using RST is that there is noneed for holding any prior knowledge or information aboutdata. The notion of boundary region is used to describe theuncertainty associated with data in RST. A set is definedas a rough set when boundary region is non-empty whiledefined as a crisp set when boundary region is empty [19].
One limitation of the RST is that it can deal with onlycategorical or non-quantifiable attributes. In general, quan-tifiable and interval-fuzzy values also exist in real-world
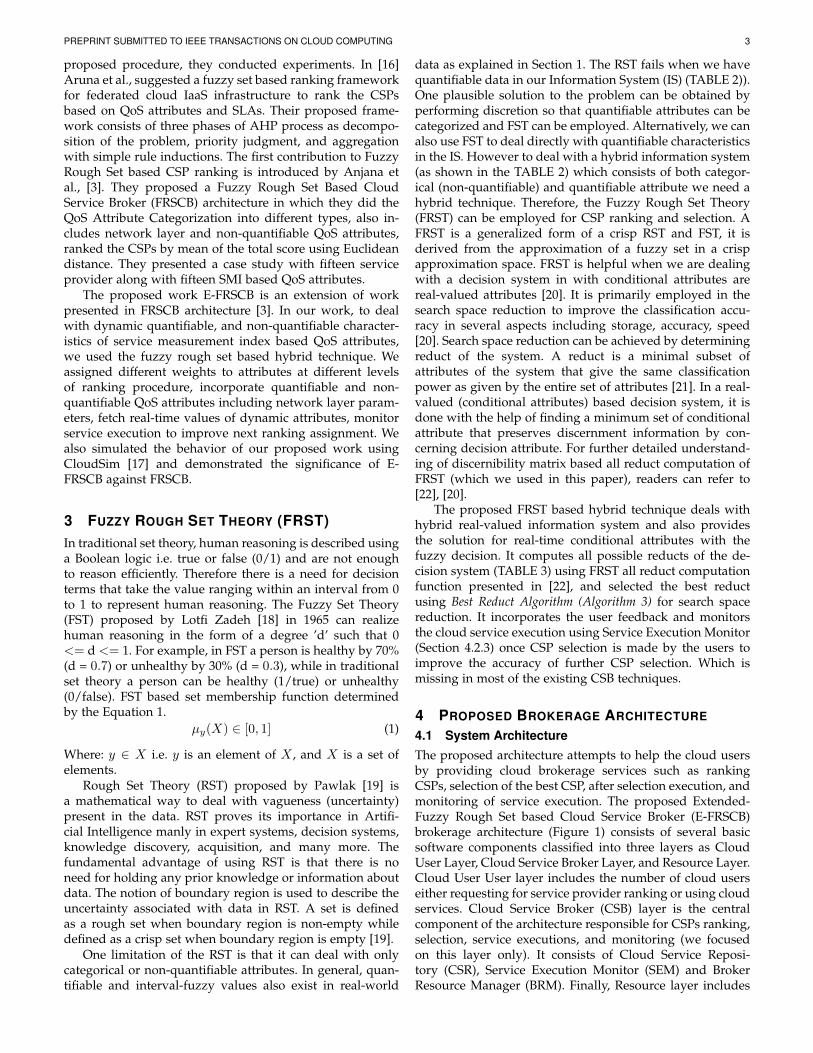
data as explained in Section 1. The RST fails when we havequantifiable data in our Information System (IS) (TABLE 2)).One plausible solution to the problem can be obtained byperforming discretion so that quantifiable attributes can becategorized and FST can be employed. Alternatively, we canalso use FST to deal directly with quantifiable characteristicsin the IS. However to deal with a hybrid information system(as shown in the TABLE 2) which consists of both categor-ical (non-quantifiable) and quantifiable attribute we need ahybrid technique. Therefore, the Fuzzy Rough Set Theory(FRST) can be employed for CSP ranking and selection. AFRST is a generalized form of a crisp RST and FST, it isderived from the approximation of a fuzzy set in a crispapproximation space. FRST is helpful when we are dealingwith a decision system in with conditional attributes arereal-valued attributes [20]. It is primarily employed in thesearch space reduction to improve the classification accu-racy in several aspects including storage, accuracy, speed[20]. Search space reduction can be achieved by determiningreduct of the system. A reduct is a minimal subset ofattributes of the system that give the same classificationpower as given by the entire set of attributes [21]. In a real-valued (conditional attributes) based decision system, it isdone with the help of finding a minimum set of conditionalattribute that preserves discernment information by con-cerning decision attribute. For further detailed understand-ing of discernibility matrix based all reduct computation ofFRST (which we used in this paper), readers can refer to[22], [20].
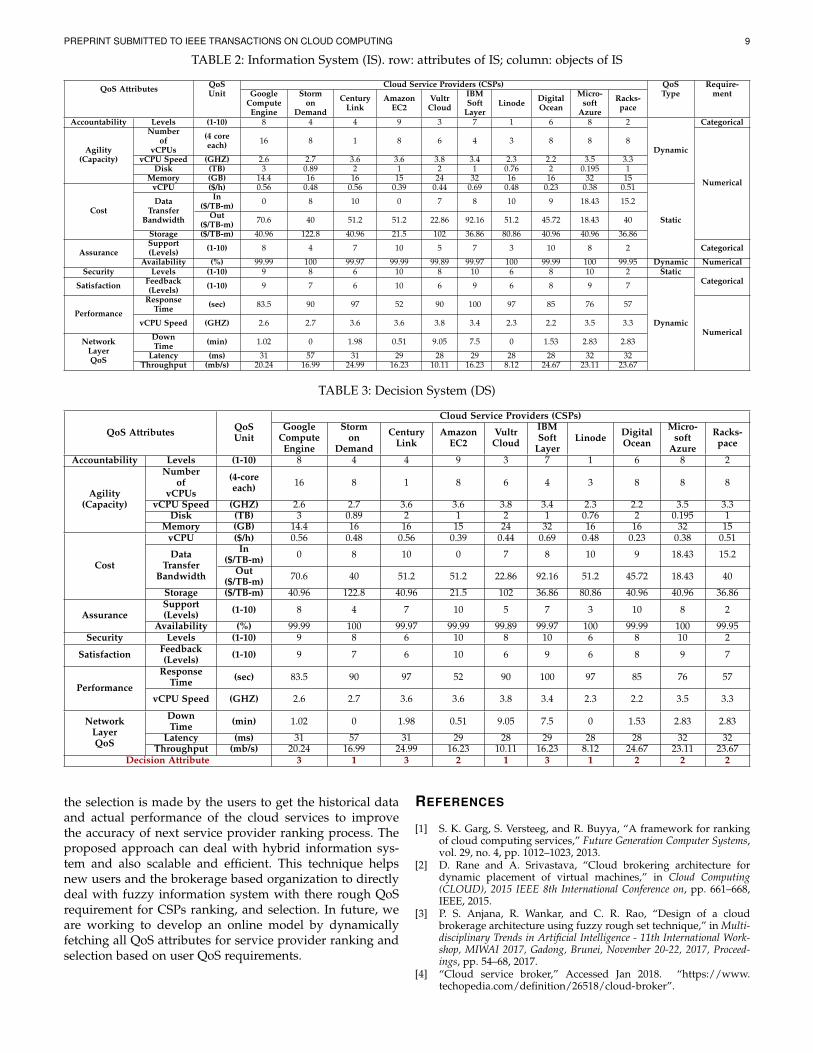
The proposed FRST based hybrid technique deals withhybrid real-valued information system and also providesthe solution for real-time conditional attributes with thefuzzy decision. It computes all possible reducts of the de-cision system (TABLE 3) using FRST all reduct computationfunction presented in [22], and selected the best reductusing Best Reduct Algorithm (Algorithm 3) for search spacereduction. It incorporates the user feedback and monitorsthe cloud service execution using Service Execution Monitor(Section 4.2.3) once CSP selection is made by the users toimprove the accuracy of further CSP selection. Which ismissing in most of the existing CSB techniques.
4 PROPOSED BROKERAGE ARCHITECTURE
4.1 System ArchitectureThe proposed architecture attempts to help the cloud usersby providing cloud brokerage services such as rankingCSPs, selection of the best CSP, after selection execution, andmonitoring of service execution. The proposed Extended-Fuzzy Rough Set based Cloud Service Broker (E-FRSCB)brokerage architecture (Figure 1) consists of several basicsoftware components classified into three layers as CloudUser Layer, Cloud Service Broker Layer, and Resource Layer.Cloud User User layer includes the number of cloud userseither requesting for service provider ranking or using cloudservices. Cloud Service Broker (CSB) layer is the centralcomponent of the architecture responsible for CSPs ranking,selection, service executions, and monitoring (we focusedon this layer only). It consists of Cloud Service Reposi-tory (CSR), Service Execution Monitor (SEM) and BrokerResource Manager (BRM). Finally, Resource layer includes

PREPRINT SUBMITTED TO IEEE TRANSACTIONS ON CLOUD COMPUTING 4
the number of CSPs along with service models which ispracticed using a simulator (CloudSim) [17]. A cloud userrequesting for brokering services at time ‘t’ with QoS re-quest and attribute weight is stored in an individual servicedefinition document with BRM. The detailed introductionto each component of E-FRSCB is introduced in Subsection4.2.
CSP2 CSPn
CSAPI CSAPI CSAPI
Cloud Service Providers (CSPs) R
esou
rce
Laye
r C
loud
Ser
vice
Bro
ker
Laye
r
Cloud Service Consumers
Con
sum
eLa
yer
4.2.3 ServiceExecutionMonitor
(2) RankingComponent
SLA
[C] Cloud Service API Invocation
(3) Web Service Component
[A] Consumers QoS Request and Weights
[B] Ranked List of CSPs
(1) DefinitionDocument
CSP1
4.2 E
FRSC
B[D]
Cloud Service Execution
4.2.1 Broker ResourceManager
4.2.2Cloud ServiceRepository
Consumer1
Consumer2
Consumern
[E] Consumer Feedback
Fig. 1: Extended Fuzzy Rough Set based Cloud ServiceBrokerage Architecture. (Square Bracket shows E-FRSCBalgorithm steps)
[1] (i) Co
nsum
er QoS
request and weights
Profiling Phase (Information System)
(2) R
anking Com
ponent
(3) Web ServiceComponent
Search SpaceReduction Phase (Reduced Decision
System)
Clustering Phase (Decision System)
Ranking Phase (Score = Weighted EuclideanDistance(Weighted System,
User Request))
Network Layer QoS Attributes
Dynamic QoSAttributes
[2] (
i) (a
)
[2] (i) (b)
[2] (
i) (c
)
[6] (iv)(1) Definition
Document
Request
Request
Reply Reply
Request
Reply
(4.2.3) ServiceExecutionMonitor
SLA (4.2.2)
Cloud ServiceRepository
Ranked List of CSPs
[1] (ii)ConsumerFeedback
[2][3]
[4][5] [6]
Fig. 2: Service Ranking Procedure a High-level View(Information-flow)
4.2 E-FRSCB Components4.2.1 Broker Resource Manager (BRM):The overall functionality of our proposed system is con-trolled by Broker Resource Manager (BRM) from rank-ing CSPs to service execution monitoring. Figure 1 showsBRM as a principal component of E-FRSCB architecture. Ithas several sub-components such as Cloud Service Reposi-tory (CSR), Ranking Component (RC), Web Service Component
(WSC), and Service Execution Monitor (SEM). The profile ofservice providers are accumulated in the information con-tainer know as Cloud Service Repository. Ranking Componenttakes user QoS request, performs CSP ranking, and returnsthe ranked list as shown in Figure 2. On every new userrequest, Web Service Component is used to fetch the real-time values of dynamic QoS attributes including networklayer QoS parameters. A user submits his QoS request usingGUI, on submission E-FRSCB Algorithm (Algorithm 1) isinvoked. Once service selection is made by user, E-FRSCBalgorithm contacts the selected service provider. The SLAwill be established between user and CSP via negotiationprocess. Furthermore, resources will be reserved, and ser-vice execution will be performed. Finally, Service ExecutionMonitor monitors the execution of the services and main-tain an Execution Monitoring Log to keep track of the CSPsperformance and to facilitate next CSP ranking process.
(1) Definition Document: Definition document is usedto record the user QoS request along with desire prioritygiven by the user in the form of weights to each requestedQoS attribute (TABLE 4). The Definition document is uti-lized in ranking and service execution monitoring phase.
(2) Ranking Component: Ranking begins with invoca-tion of Ranking Algorithm (Algorithm 2) of Ranking Com-ponent. It is a central part of the BRM and is composedof several phases such as information gathering, analysis,search space reduction, and ranking. For these, it interactswith Cloud Service Repository (CSR), Service ExecutionMonitor (SEM), and Web Service Components (WSC).
• Profiling Phase does the information gathering bysending a request to CSR, SEM, and WSC. Onceprofiling phase receives the response from all thepart, it generates the Information System (IS) basedon the latest information of monitoring phase anddynamic QoS attribute including network layer QoSattributes (using WSC gets the current value of QoSattributes). At the end of this phase, it sends the ISalong with user QoS request to next phase (clusteringphase) for further information analysis.
• At Clustering Phase to designing Decision System(DS) K-means [23] is employed over the IS whichgives different clustering labels. Each object of the IS(CSP) is associated with respective clustering label togenerate the DS, i.e., each cluster is labeled with dis-tinct labels and labels are used as a decision attributein DS. During this process, if CSPs are grouped underthe same clustering label then they offer relatedservice. In the proposed method to determine theoptimal number of clustering labels Elbow method[24] is employed, and decision attribute is kept at theend of the DS (i.e., last row) as shown in TABLE 3.
• Search Space Reduction Phase In this phase, reductconcept of Fuzzy Rough Set Theory (FRST) is ap-plied. All reducts of the DS (TABLE 5) are com-puted using all reduct computation function presentedin [22], and the best reduct is selected using BestReduct Algorithm (Algorithm 3). The best reduct isthe reduct which consists the maximum overlappingQoS attributes with user QoS requests. If more thenone reducts have the same number of user requested

PREPRINT SUBMITTED TO IEEE TRANSACTIONS ON CLOUD COMPUTING 5
Algorithm 1 E-FRSCB AlgorithmInput: Definition Document, Feedback, CSPs Service InformationOutput: Ranked List of Cloud Service Providers (CSPs), Service Execution
procedure e-frscb(useri)
STEP [A] (i) E-FRSCB← User-Request(QoS values, weights)
STEP [B] (i) Definition Document← STEP [A] (i)(ii) Ranked CSPs List← Ranking Algorithm(DD, CF, SEM, WSC, CSR)
STEP [C] (i) User-ID← STEP [B] (ii)(ii) User-Select one CSP, send CSP-ID to E-FRSCB(iii) User-invoke(CS-API)← Selected(CSP)(iv) E-FRSCB-SLA-User-ID← establish-SLA(User-ID, CSP-ID)
STEP [D] (i) E-FRSCB-BRM-Resource Reservation(User-ID, Service API)(ii) E-FRSCB-BRM-Service Exe(User-ID, Service API, SLA-User-ID)
STEP [E] (i) Profile-CSP-ID← User-ID-Feedback
/∗ BRM: Broker Resource Manager; CSR: Cloud Service Registry; DD: Definition Document; CF: User Feedback; SEM: ServiceExecution Monitor; SLA: Service Level Agreement; DS: Decision System; DQoS: Dynamic QoS Attributes; NLQoS: Network LayerQoS Attributes; CSP: Cloud Service Provider. ∗/
QoS attribute then to break the tie Best Reduct Al-gorithm selects the reduct which has more number ofdynamic QoS attributes. Based on the selected reductReduced Decision System (RDS) is generated. Finallybased on the RDS and Definition Document rankingof CSPs is performed.
• Ranking Phase, Weighted Euclidean Distance (Score) iscomputed for CSPs by using attribute values of CSPand user request. Smaller the Score represents betterCSPs, therefore ranking is done based on increasingorder of Score. Finally, ranking algorithm terminateswith sending ranked list of CSPs to BRM.
Relative Weight Assignment for QoS Attributes: Weneed to consider the relative importance of QoS attributesfor service provider comparison before calculating respec-tive Score of the CSPs. For this, we need to assign someweights to QoS attributes. We employed System AssignedWeights and User Assigned Weights to respective QoS at-tributes (user requested QoS and Network Layer QoS inRDS TABLE 6). During weight assignment, at the first-level system will assign weights, while at the second-levelcustomer can assign his QoS preferred weights. By doingthis, we try to incorporate both user preferences and ac-tual relative importance of quality attributes in the rankingprocess. Assigning the weight at lower levels prioritize theuser request alongside also gives importance to the qualitieswhich are not part of the user request but have a critical rolein the ranking process (e.g., network QoS attributes) at thehigher level.
System Assigned Weights: If user requested attribute isnot present in RDS, then that quality does not have enoughpotential concerning selected reduct and hence not countedfor ranking process. However, all other attributes whichare not part of the user request and are part of the RDSare assigned the weights based on Golden Section SearchMethod [25]. Where 66.67% (i.e., 0.67) weights allocatedto user requested attributes and 33.33% (i.e., 0.33) weightsto others which are part of the RDS (e.g., Network Layer
QoS attributes, monitored qualities). Here the sum of theweight is considered to be equal to 1. A critical remark toacknowledge here is that if the user does not wish to assignweights. Then only one level of weight assignment will bedone for the ranking process.
User Assigned Weights: The user assigned weights indi-cate the relative importance of QoS attribute sought by theusers in their request. A user can use his/her own scaleto assign different weights to QoS attributes in his request[1] (as shown in TABLE 1). This weight assignment is donebased on the suggestion given in AHP technique [26], forthis, the restriction of the sum of all weights need not beequal to one, unlike system assigned weights. However, foreach first level user requested QoS attribute (e.g., Account-ability, Agility, Cost, Assurance, Security, and Satisfaction)we considered the sum of the weights is equal to 1 as shownin TABLE 4. This weight assignment technique is proposedoriginally to assign different weights to each QoS attributesin AHP technique which we adopted for weight assignmentin our proposed E-FRSCB architecture.
TABLE 1: Relative Importance of QoS Attributes
Relative Importance ValueEqualy important 1
Somewhat more important 3Definitely more important 5
Much more important 7Extremely more important 9
(3) Web Service Component (WSC): It is used to fetchesthe current state of dynamic QoS attributes including net-work layer QoS attributes from CSPs using web-services.The state of dynamic QoS attributes change from one rank-ing process to another ranking process, and we need thereal-time values to improve the accuracy of the rankingprocess. For this, we used various APIs (Cloud HarmonyAPIs [27]) to fetch the current state of dynamic QoS attributeof selected CSPs. Dynamic QoS attributes are specified in

PREPRINT SUBMITTED TO IEEE TRANSACTIONS ON CLOUD COMPUTING 6
advance, so there is no need of determining them againduring each ranking process.
4.2.2 Cloud Service Repository (CSR):
It is a repository service employed to store informationabout CSPs services. CSPs needs to register their QoSplans/services, capabilities, offerings, and initial SLAs inour Cloud Service Repository (CSR). In the proposed archi-tecture, we assume CSPs have been recorded their servicesin CSR beforehand. So from CSR, we can obtain requiredinformation of the CSPs, their QoS service offerings, andother information to generate the initial Information System(IS) as shown in TABLE 2. In the absence of global CSR, theCSPs need to register their services in our local CSR registry.In the Figure 1 and Figure 2 we have shown our local CSR,as for experiment purpose we used local CSR.
4.2.3 Service Execution Monitor (SEM):
The process of cloud monitoring includes dynamic trackingof the QoS attributes relevant to virtualized cloud resources,for example, vCPU, Storage, Network, etc. [28]. The cloudcomputing resources configuration is a genuinely challeng-ing task which consists of various heterogeneous virtualizedcloud computing resources [29]. Furthermore, sometime,there will be a massive demand for a specific cloud service.And because of the change in requirement and availabilityof various resources including network parameter the per-formance may change. Which directly and indirectly alsoaffects the user service experience. Therefore, there is a needfor cloud monitoring to keep track of resources operation athigh demand, to detect fluctuations in performance and toaccount the SLA breaches of specific QoS attributes [30]. Theperformance fluctuations may also happen due to failuresand other runtime configuration. Cloud monitoring solu-tions (tools) can be classified into three types as Generic so-lutions, Cluster-Grid solutions, and Cloud specific solutions.Cloud specific solutions are designed explicitly to monitorcomputing environments in the cloud and developed byacademic researchers or commercial efforts [28]. ExistingCloud specific solutions (tools) includes Amazon Cloud-Watch, Private Cloud Monitoring Systems (PCMONS) (opensource [31]), Cloud Management System (CMS), RuntimeModel for Cloud Monitoring (RMCM), CAdvisor (opensource), and Flexible Automated Cloud Monitoring Slices(Flex-ACMS) [28].
In CSB, cloud service monitoring can be used to improvethe CSP ranking and to build healthy competition betweenCSPs to adhere to provide excellent services to the user tocontest in next CSP ranking process. In proposed E-FRSCBexecution monitor is implemented using [31]. Furthermore,it can also be implemented as a third party monitoringservice offered by CSPs (e.g., Amazon CloudWatch, App-Dynamics). Service execution monitor is used to provide theguarantee that the deployed cloud services perform (perfor-mance monitoring aspect) at the expected level to satisfy theSLA established between user and CSPs. This componentincludes monitoring task regarding the currently runningservices (offered by CSPs selected by respective users). Thisresponsibility consists of the detection and collection ofQoS attribute values. Data collected during monitoring is
utilized for next CSP ranking process and is send to BRMwhenever BRM issues a new request for data.
5 CASE STUDY: COMPUTE CLOUD SERVICEPROVIDER (IAAS CSP) RANKING BASED ON USERQOS REQUIREMENT
The ranking method of E-FRSCB Architecture given inthe Section 4 is analyzed for Computation Services (IaaS)offered by CSPs with the help of a case study example inthis section. However, this can also work with other typesof services like SaaS, PaaS also. RStudio [32] is used as adevelopment IDE and R − language [33] for implemen-tation. To submit the user QoS request to the system GUIis developed using fgui [34] package. We have referredCloud Service Measurement Index Consortium (CSMIC)[10], defined Service Measurement Index (SMI) matricesfor evaluation of Compute Cloud Service Providers and todesign initial Information System (IS) (TABLE 2) for thiswe considered 10 CSPs along with total 17 QoS Attributes(scalable). We have designed IS for general purpose Com-pute Cloud Service Provider (IaaS) services by considering8 first level SMI matrices which consist of 17 third levelQoS attributes. We experimented with synthesized data,however, tried to incorporate actual QoS values. We havetaken data from different sources including CSPs websites,SLAs, literature [1], and CloudSim [17] for most of the QoSas shown in TABLE 2. For dynamic and Network LayerQoS attributes (Availability, Latency, Throughput, ServiceDowntime) data is collected using Cloud Harmony API[27]. For performance-intensive QoS attribute (vCPU speed,Response Time) information from Service Execution Moni-tor is used. However, in initial IS design, actual values ofvCPU speed offered by CSPs are used, and for ResponseTime values are assigned randomly. The categorical (non-quantifiable) QoS attribute (such as security, accountability,user feedback, and supports) values are randomly assigned.System assigned weights to QoS attribute are assigned usingGolden Section Search Method [25], while the user specifiesdesired weights along with QoS request (as explained in theSection 4.2.1).
In the literature to standardize the categorical(qualitative/non-quantifiable) QoS attributes for CSPs rank-ing, there is no single globally accepted standardization. Thecategorical attribute represents the enumerated type of qual-ity where the expected value of the attribute is presented inthe form of levels [35]. In proposed architecture for cate-gorical attributes such as accountability, support, security,and user feedback different levels ([1:10]) are introducedbased on the work presented in [3]. We demonstrate herethe quantification of Security Levels in proposed technique(for support type, accountability, and user feedback levelquantification is done similarly).
To rank the CSPs security is one of the critical Cloud QoSmetrics; its primary objective is to strengthen the securitymechanisms and mitigate threats. It helps in developingthe user trust and improves the operational performance.In E-FRSCB, security consists the ten different level whererandom values are assigned for all the CSPs. It includes vari-ous performance indicators such as certificates provisioning,vCPU configuration, firewall, access and log management

PREPRINT SUBMITTED TO IEEE TRANSACTIONS ON CLOUD COMPUTING 7
Algorithm 2 Ranking AlgorithmInput: Definition Document, User Feedback, QoS Attributes, Optimal Number of ClustersOutput: Ranked List of Cloud Service Providers (CSPs)
procedure ranking(definition Document, user Feedback, qos, clustering Labels, optimal Clusters)STEP [1] (i) RC← definition Document
(ii) RC← user Feedback
STEP [2] (i) Fetch latest information about QoS from different components(a) qoS Attribute← request(CSR)(b) dynamic QoS Values← request(WSC)(c) performance QoS← request(SEM)
(ii) IS← generate([1](ii), [2](i)(a), [2](i)(b), [2](i)(c))
STEP [3] (i) clustering Labels← kmeans(IS, optimal Clusters, nstart)(ii) decision Attribute← clustering Label(IS)(iii) DS← generateDS(IS, decision Attribute)
STEP [4] (i) all Reducts← FS.all.reducts.computation(DS)(ii) best Reduct← best.Reduct(DS, definition Document)(iii) RDS← generate(DS, best Reduct)
STEP [5] (i) RDSN← generate(RDS, NQoS)(ii) Weight Assignment
(a) W RDSN← assign(RDS QoS 67%, NQoS 33%)(b) if(definition Document(user.Weights))
W RDSN← assign(W RDSN, user.Weights)
STEP [6] (i) score-CSP← weighted Euclidean Distance(user Request, W RDSN)(ii) if CSPs Score is equal, give priority to CSP with more Dynamic QoS(iii) ranked List CSPs← ascending order(score-CSP)(iv) return(ranked List CSPs)
/∗ RC: Ranking Component; IS: Information System; DS: Decision System; RDS: Reduced Decision System; NQoS: Network QoSAttributes; RDSN: Reduced Decision System + Network QoS Attributes; W RDSN: Weighted RDSN; ∗/
Algorithm 3 Best Reduct AlgorithmInput: Decision System, All Reducts of Decision System, Definition DocumentOutput: Best Reduct
procedure best.Reduct(Decision System,All Reducts,Definition Document)STEP [A] find number of overlapping QoS with User QoS Request for Each Reduct
STEP [B] select all the Reduct which has maximum number of overlapping QoS
STEP [C] if more then one such Reduct selected which have maximum overlapping QoS(i) count Number of Dynamic QoS in each such Reduct(ii) select the Reduct which has more number of Dynamic QoS(iii) if more then one such Reduct has equal number of Dynamic QoS select anyone Reduct
STEP [D] return(selected.Reduct)
policies, encryption/masking of data, etc. Assurance frame-work proposed by European Union Network InformationSecurity Agency (ENISA) for Cloud consists of 10, 69, 130first, second, and third-degree security indicators respec-tively [36]. Cloud Security Alliance introduced fundamentalprinciples that service providers must follow and supportuser for security estimation [37]. We did security levelsquantification into ten different levels [1:10] (can be easilyextended) based on the risk of security threat and securityperformance indicators. In quantization, level 1 representsthe most straightforward security mechanisms while level10 represent the complex and highest level of securitymechanisms offered by CSPs. Each level of quantized se-curity level consists of one or more security performanceindices (130 third-degree security indicators). The straight-
forward example can be at level 1 only provider and userauthentication is done, at level 2 including level 1 multi-factor and fine granular authentication and authorizationis performed. Similarly, at further levels (i.e., from level 3-10) including upper-level different firewall administration,privileged controls over accesses, application identificationand other security metrics takes place to achieve highersecurity. In the following, we present the proposed rankingmethod in multiple steps.
In the first step, whenever a new user submits his QoSrequest (TABLE 4), Ranking Algorithm (Algorithm 2) isinvoked. During this process to generate the initial IS, itfetches the data from CSR for Compute Cloud Services(IaaS) offered by CSPs, as shown in TABLE 2. To fetch theactual values of dynamic and network layer QoS attribute

PREPRINT SUBMITTED TO IEEE TRANSACTIONS ON CLOUD COMPUTING 8
ranking algorithm send a request to WSC component toexecute the web services.
In the second step, on generated IS, K-means Clustering(optimal number of clusters (i.e., k value) is determinedusing Elbow Method [24]) is performed. Where generatedclustering labels are used as a decision attribute to designthe Decision System (DS) and corresponding clustering labelis attached to the CSPs. In the paper, for presentation clarity,we transferred the tables (IS, DS, Reduced Decision System,and Ranking Table) where row shows attribute and columnshows the object of the IS/DS. Therefore clustering labelsare kept in the last row as shown in TABLE 3.
In the third step, once DS is generated, search spacereduction is achieved by employing all reduct concept ofFuzzy Rough Set Theory (R Language package Rough-Set [38]) all reduct computation() function. This functiongives all possible reducts of the DS, out of which one reductis selected. Further, the number of reducts depend on theprecision value (α precision), we also analyzed the precisionvalue impact on the number of reducts as shown in Table8 and in Figure 4 5. With the change in precision valuenumber of QoS attributes in reduct is decreases but thetotal number of reducts increases. For the experiment, wefixed the α precision = 0.15 as default value and got fourreducts as shown in TABLE 5. Among four reducts the bestreduct is selected using Best Reduct Algorithm (Algorithm 3).Here all four reducts consists of seven dynamic attributes,among these reducts anyone reduct can be selected. Basedon selected reduct-1 Reduced Decision System (RDS) isgenerated and shown in TABLE 6. During the best reductselection, Network Layer QoS attributes may not presentin the reduct since user request does not consist this QoSattribute. The apparent reason for that can be that user doesnot have control over Network Layer QoS, it depends onthe network traffic. Hence we added the Network LayerQoS in RDS if attributes are not part of RDS. A criticalobservation here is that in primary IS (TABLE 2) we have17 different quality attributes while after performing searchspace reduction based on selected best reduct and NetworkQoS attributes (if not in RDS add them) we have only 11QoS attributes. In search space reduction the reduction ofinformation we achieved is 35.29%. At present, more than500 CSPs offering more than thousand different services(this static are based on the number of CSPs registered withCloud Service Market [39] and Cloud Harmony [27]). So ifIS is vast (thousands of CSPs and a large number of QoSattributes), search space reduction will help a lot in betterranking of the CSPs.
In the fourth step, once RDS is available, two-levelweight assignment to QoS attribute is performed (as ex-plained earlier in Section 4.2.1). After weight assignment,by using User QoS Request (as shown in TABLE 4) andRDS (TABLE 6), Weighted Euclidean Distance (Score) ofrespective CSP is computed. Based on the Score CSPs aresorted in ascending order where smaller score representsbetter CSPs by concerning user QoS request (TABLE 7).Hence, the corresponding ranking of all the CSPs can bedetermined based on Score (Weighted Euclidean Distance)(4.989, 5.404, 6.843, 7.372, 7.387, 7.916, 8.403, 8.450, 8.668,8.814). The ranked list of the CSPs is as follows: AmazonEC2 > Rackspace > Microsoft Azure > Google Compute Engine
> Digital Ocean > Vultr Cloud > Century Link > IBM SoftLayer> Storm on Demand. Finally, based on user QoS requestAmazon EC2 give the best service. In next step, a rankedlist of CSPs is sent to the user for service selection. Finally,the user selects a CSP and gives his selection responseto the system, system communicated with selected serviceprovider for resource reservation and service execution.During service execution we monitor the execution basedon SLA to improve the accuracy and use the monitoringdata in designing IS for next ranking process (as shown inFigure 2).
Two different experiments are performed to analyzethe performance of the proposed technique with existingfuzzy rough set-based technique (FRSCB [3]). To simulateCompute cloud service infrastructure we used CloudSim[17]. During simulation for the first test, we kept the numberof CSPs to fix 100 and submitted 1 to 5000 number of theuser request for CSP ranking. In second experiment user,QoS request was set to 100, and the number of CSPs rangesfrom 10 to 5000. For simulation, random QoS values aregenerated to design the IS based on the domain of eachQoS attribute. For user request also QoS values and weightsare assigned randomly. Furthermore using the informationavailable in IS, service providers were created where eachCSP consists of time shared Virtual Machine Schedulerand 50 computing hosts. During simulation for each taskexecution time is selected randomly from 0.1 to 1.0 ms.Finally based on both the experiment set up the responsetime (in the sec.) of proposed and FRSCB ranking techniqueis recorded. Experiment result shows (Figure 6, 7) that pro-posed method outperforms then FRSCB ranking technique.Here, Figure 6, 7 shows that our proposed architecture isscalable when both number user QoS request increases andalso when the number of CSPs increases.
6 CONCLUSIONS AND FUTURE WORK
Because of the vast diversity of available cloud service fromthe user point of view, it leads to many challenges fordiscovering and managing their desired cloud services. Ascloud service discovery and management involve variousoperational aspects, it is desired to have a cloud servicebroker who can do this task on behalf of the user. In this pa-per, we have presented an efficient Cloud Service Providerevaluation system using the Fuzzy Rough Set technique andpresented a case study on IaaS service provider ranking.Our proposed architecture not only rank the cloud servicesbut also monitor execution. The significant contributions ofproposed brokerage system can be summarized as follows:1) it evaluates the number of cloud service providers basedon user QoS requirements and offers an opportunity tothe user to select the best cloud service from a rankedlist of the CSPs. 2) it also priorities the user request byincorporating user assign weights and gives the relativepriority to non-user requested QoS by considering systemassigned weights. 3) the primary focus was on search spacereduction so that we can minimize the searching time andalso improve the efficiency of the ranking procedure. 4) weused Weighted Euclidean Distance to lead to the ideal value(i.e., zero line) it shows the improved representation of themethod. 5) finally we monitor the service execution once
PREPRINT SUBMITTED TO IEEE TRANSACTIONS ON CLOUD COMPUTING 9
TABLE 2: Information System (IS). row: attributes of IS; column: objects of IS
QoS Attributes QoSUnit
Cloud Service Providers (CSPs) QoSType
Require-mentGoogle
ComputeEngine
Stormon
Demand
CenturyLink
AmazonEC2
VultrCloud
IBMSoft
LayerLinode Digital
Ocean
Micro-soft
Azure
Racks-pace
Accountability Levels (1-10) 8 4 4 9 3 7 1 6 8 2
Dynamic
Categorical
Agility(Capacity)
Numberof
vCPUs
(4 coreeach) 16 8 1 8 6 4 3 8 8 8
Numerical
vCPU Speed (GHZ) 2.6 2.7 3.6 3.6 3.8 3.4 2.3 2.2 3.5 3.3Disk (TB) 3 0.89 2 1 2 1 0.76 2 0.195 1
Memory (GB) 14.4 16 16 15 24 32 16 16 32 15
Cost
vCPU ($/h) 0.56 0.48 0.56 0.39 0.44 0.69 0.48 0.23 0.38 0.51
Static
DataTransfer
Bandwidth
In($/TB-m) 0 8 10 0 7 8 10 9 18.43 15.2
Out($/TB-m) 70.6 40 51.2 51.2 22.86 92.16 51.2 45.72 18.43 40
Storage ($/TB-m) 40.96 122.8 40.96 21.5 102 36.86 80.86 40.96 40.96 36.86
AssuranceSupport(Levels) (1-10) 8 4 7 10 5 7 3 10 8 2 Categorical
Availability (%) 99.99 100 99.97 99.99 99.89 99.97 100 99.99 100 99.95 Dynamic NumericalSecurity Levels (1-10) 9 8 6 10 8 10 6 8 10 2 Static
CategoricalSatisfaction Feedback(Levels) (1-10) 9 7 6 10 6 9 6 8 9 7
DynamicPerformance
ResponseTime (sec) 83.5 90 97 52 90 100 97 85 76 57
NumericalvCPU Speed (GHZ) 2.6 2.7 3.6 3.6 3.8 3.4 2.3 2.2 3.5 3.3
NetworkLayerQoS
DownTime (min) 1.02 0 1.98 0.51 9.05 7.5 0 1.53 2.83 2.83
Latency (ms) 31 57 31 29 28 29 28 28 32 32Throughput (mb/s) 20.24 16.99 24.99 16.23 10.11 16.23 8.12 24.67 23.11 23.67
TABLE 3: Decision System (DS)
Cloud Service Providers (CSPs)
QoS Attributes QoSUnit
GoogleComputeEngine
Stormon
Demand
CenturyLink
AmazonEC2
VultrCloud
IBMSoft
LayerLinode Digital
Ocean
Micro-soft
Azure
Racks-pace
Accountability Levels (1-10) 8 4 4 9 3 7 1 6 8 2Number
ofvCPUs
(4-coreeach) 16 8 1 8 6 4 3 8 8 8
vCPU Speed (GHZ) 2.6 2.7 3.6 3.6 3.8 3.4 2.3 2.2 3.5 3.3Disk (TB) 3 0.89 2 1 2 1 0.76 2 0.195 1
Agility(Capacity)
Memory (GB) 14.4 16 16 15 24 32 16 16 32 15vCPU ($/h) 0.56 0.48 0.56 0.39 0.44 0.69 0.48 0.23 0.38 0.51
In($/TB-m) 0 8 10 0 7 8 10 9 18.43 15.2Data
TransferBandwidth Out
($/TB-m) 70.6 40 51.2 51.2 22.86 92.16 51.2 45.72 18.43 40Cost
Storage ($/TB-m) 40.96 122.8 40.96 21.5 102 36.86 80.86 40.96 40.96 36.86Support(Levels) (1-10) 8 4 7 10 5 7 3 10 8 2Assurance
Availability (%) 99.99 100 99.97 99.99 99.89 99.97 100 99.99 100 99.95Security Levels (1-10) 9 8 6 10 8 10 6 8 10 2
Satisfaction Feedback(Levels) (1-10) 9 7 6 10 6 9 6 8 9 7
ResponseTime (sec) 83.5 90 97 52 90 100 97 85 76 57
PerformancevCPU Speed (GHZ) 2.6 2.7 3.6 3.6 3.8 3.4 2.3 2.2 3.5 3.3
DownTime (min) 1.02 0 1.98 0.51 9.05 7.5 0 1.53 2.83 2.83
Latency (ms) 31 57 31 29 28 29 28 28 32 32
NetworkLayerQoS Throughput (mb/s) 20.24 16.99 24.99 16.23 10.11 16.23 8.12 24.67 23.11 23.67
Decision Attribute 3 1 3 2 1 3 1 2 2 2
the selection is made by the users to get the historical dataand actual performance of the cloud services to improvethe accuracy of next service provider ranking process. Theproposed approach can deal with hybrid information sys-tem and also scalable and efficient. This technique helpsnew users and the brokerage based organization to directlydeal with fuzzy information system with there rough QoSrequirement for CSPs ranking, and selection. In future, weare working to develop an online model by dynamicallyfetching all QoS attributes for service provider ranking andselection based on user QoS requirements.
REFERENCES
[1] S. K. Garg, S. Versteeg, and R. Buyya, “A framework for rankingof cloud computing services,” Future Generation Computer Systems,vol. 29, no. 4, pp. 1012–1023, 2013.
[2] D. Rane and A. Srivastava, “Cloud brokering architecture fordynamic placement of virtual machines,” in Cloud Computing(CLOUD), 2015 IEEE 8th International Conference on, pp. 661–668,IEEE, 2015.
[3] P. S. Anjana, R. Wankar, and C. R. Rao, “Design of a cloudbrokerage architecture using fuzzy rough set technique,” in Multi-disciplinary Trends in Artificial Intelligence - 11th International Work-shop, MIWAI 2017, Gadong, Brunei, November 20-22, 2017, Proceed-ings, pp. 54–68, 2017.
[4] “Cloud service broker,” Accessed Jan 2018. “https://www.techopedia.com/definition/26518/cloud-broker”.

PREPRINT SUBMITTED TO IEEE TRANSACTIONS ON CLOUD COMPUTING 10
Fig. 3: Cloud Service Provider QoS Values
TABLE 4: Definition Document: User QoS Request andWeights
QoS Attributes QoSUnit
ConsumerQoS Request
ConsumerQoS Weights
Accountability Levels (1-10) 4 1.0 = 1
Agility(Capacity)
Numberof
vCPUs
(4-coreeach) 4 0.4
= 1vCPU Speed (GHZ) 3.6 0.2Disk (TB) 0.5 0.3
Memory (GB) 16 0.1
Cost
vCPU ($/h) 0.54 0.6
= 1Data
TransferBandwidth
In($/TB-m) 10 0.1
Out($/TB-m) 51 0.1
Storage ($/TB-m) 50 0.2
AssuranceSupport(Levels) (1-10) 8 0.3 = 1
Availability (%) 99.9 0.7Security Levels (1-10) 10 1.0 = 1
Satisfaction Feedback(Levels) (1-10) 9 1.0 = 1
Performance
ResponseTime (sec)
vCPU Speed (GHZ)
NetworkLayerQoS
DownTime (min)
Latency (ms)Throughput (mb/s)
[5] M. Guzek, A. Gniewek, P. Bouvry, J. Musial, and J. Blazewicz,“Cloud brokering: Current practices and upcoming challenges,”IEEE Cloud Computing, vol. 2, no. 2, pp. 40–47, 2015.
[6] R. Buyya, C. S. Yeo, S. Venugopal, J. Broberg, and I. Brandic,“Cloud computing and emerging it platforms: Vision, hype, andreality for delivering computing as the 5th utility,” Future Genera-tion computer systems, vol. 25, no. 6, pp. 599–616, 2009.
[7] C. Qu and R. Buyya, “A cloud trust evaluation system usinghierarchical fuzzy inference system for service selection,” in Ad-vanced information networking and applications (aina), 2014 ieee 28thinternational conference on, pp. 850–857, IEEE, 2014.
TABLE 5: All Possible Reducts of The Decision System
Reduct 1 2 3 4Accountability Level vCPU Accountability Level vCPU
vCPU Speed vCPU Speed vCPU Speed vCPU SpeedMemory Memory Memory Memory
Green Color:DynamicAttributes
vCPU Cost vCPU Cost vCPU Cost vCPU CostIn Bound Cost In Bound Cost Security Level Security Level
Out Bound Cost Out Bound Cost Out Bound Cost Out Bound Cost
Red Color:Static
AttributeAvailability Availability Availability Availability
Response Time Response Time Response Time Response TimeLatency Latency Latency Latency
QoSAttributes
Throughput Throughput Throughput Throughput
Blue Color:Network
QoS Attributes(Dynamic)
Fig. 4: Precision Value vs Number of Reducts
[8] L. Sun, H. Dong, F. K. Hussain, O. K. Hussain, and E. Chang,“Cloud service selection: State-of-the-art and future research di-rections,” Journal of Network and Computer Applications, vol. 45,pp. 134–150, 2014.
[9] M. Godse and S. Mulik, “An approach for selecting software-as-a-service (saas) product,” in Cloud Computing, 2009. CLOUD’09.IEEE International Conference on, pp. 155–158, IEEE, 2009.

PREPRINT SUBMITTED TO IEEE TRANSACTIONS ON CLOUD COMPUTING 11
TABLE 6: Reduced Decision System (RDS) with QoS Weights
Cloud Service Providers (CSPs)
QoS Attributes QoSUnit
GoogleCompute
Engine
Stormon
Demand
CenturyLink
AmazonEC2
VultrCloud
IBMSoft
LayerLinode Digital
Ocean
Micro-soft
Azure
Racks-pace
System QoSWeights(Level-1)
ConsumerQoS Weights
(Level-2)Accountability Levels (1-10) 8 4 4 9 3 7 1 6 8 2 0.095 1.0
vCPU Speed (GHZ) 2.6 2.7 3.6 3.6 3.8 3.4 2.3 2.2 3.5 3.3 0.095 0.2Agility(Capacity) Memory (GB) 14.4 16 16 15 24 32 16 16 32 15 0.095 0.1
vCPU ($/h) 0.56 0.48 0.56 0.39 0.44 0.69 0.48 0.23 0.38 0.51 0.095 0.6In
($/TB-m) 0 8 10 0 7 8 10 9 18.43 15.2 0.095 0.1Cost DataTransfer
Bandwidth Out($/TB-m) 70.6 40 51.2 51.2 22.86 92.16 51.2 45.72 18.43 40 0.095 0.1
Assurance Availability (%) 99.99 100 99.97 99.99 99.89 99.97 100 99.99 100 99.95 0.095
0.095*7=
0.67
0.1Performance Response Time (sec) 83.5 90 97 52 90 100 97 85 76 57 0.082
DownTime (min) 1.02 0 1.98 0.51 9.05 7.5 0 1.53 2.83 2.83 0.082
Latency (ms) 31 57 31 29 28 29 28 28 32 32 0.082
NetworkLayerQoS Throughput (mb/s) 20.24 16.99 24.99 16.23 10.11 16.23 8.12 24.67 23.11 23.67 0.082
0.082 * 4=
0.33
Decision Attribute 3 1 3 2 1 3 1 2 2 2 -
TABLE 7: Normalized Weighted Reduced Decision System and Weighted Euclidean Distance
QoSAttributes Unit
Cloud Service Providers (CSPs)
AmazonEC2 Rackspace Microsoft
Azure
GoogleComputeEngine
DigitalOcean
VultrCloud
CenturyLink Linode
IBMSoft
Layer
Stormon
DemandAccountability Levels (1-10) 0.861 0.191 0.766 0.766 0.574 0.287 0.383 0.096 0.670 0.383
Agility(Capacity)
vCPU Speed (GHZ) 0.069 0.063 0.067 0.050 0.042 0.073 0.069 0.044 0.065 0.052Memory (GB) 0.431 0.431 0.919 0.413 0.459 0.689 0.459 0.459 0.919 0.459
Cost
vCPU ($/h) 0.022 0.029 0.022 0.032 0.013 0.025 0.032 0.028 0.040 0.028
DataTransfer
Bandwidth
In($/TB-m) 0.000 0.145 0.176 0.000 0.086 0.067 0.096 0.096 0.077 0.077
Out($/TB-m) 0.490 0.383 0.176 0.676 0.438 0.219 0.490 0.490 0.882 0.383
Assurance Availability (%) 6.699 6.697 6.700 6.699 6.699 6.693 6.698 6.700 6.698 6.700
Performance ResponseTime (sec) 4.290 4.703 6.270 6.889 7.013 7.425 8.003 8.003 8.250 7.425
NetworkLayerQoS
Down Time (min) 0.042 0.233 0.233 0.084 0.126 0.747 0.163 0.000 0.619 0.000Latency (ms) 2.393 2.640 2.640 2.558 2.310 2.310 2.558 2.310 2.393 4.703
Throughput (mb/s) 1.339 1.953 1.907 1.670 2.035 0.834 2.062 0.670 1.339 1.402
Weighted Euclidean Distance (Score) 4.989 5.404 6.843 7.372 7.387 7.916 8.403 8.450 8.668 8.814
Service Provider Rank 1 2 3 4 5 6 7 8 9 10
TABLE 8: Change in the Number of Reducts, Static, and Dynamic Attributes in Maximum and Minimum QoS Reduct withChange in Precision Value (0 <= α <= 1).
Precision Value 0.05 0.1 0.15 0.2 0.25 0.3 0.35 0.4 0.45 0.5 0.55 0.6 0.65 0.7 0.75 0.8 0.85 0.9 0.95 1Number of Reducts 2 2 4 8 20 14 84 89 78 289 365 405 301 291 226 240 203 172 106 1
Dynamic Attributes 6 6 8 7 7 6 5 5 4 6 4 5 5 4 3 4 4 3 2 12Static Attributes 3 3 3 3 4 4 4 3 5 2 3 2 1 2 2 1 0 1 1 5
Reduct WithMaximumNo. of QoS Total Attributes 9 9 11 10 11 10 9 8 9 8 7 7 6 6 5 5 4 4 3 17
Dynamic Attributes 6 6 8 6 6 5 4 4 3 2 2 2 1 2 1 1 0 1 1 12Static Attributes 3 3 3 4 3 2 2 2 2 3 2 2 2 1 1 1 2 1 1 5
Reduct WithMinimum
No. of QoS Total Attributes 9 9 11 10 9 7 6 6 5 5 4 4 3 3 2 2 2 2 2 17
Fig. 5: Precision Value vs Static and Dynamic Attributes inMaximum and Minimum Size QoS Reduct
[10] “Cloud service measurement index consortium (csmic), smiframework,” Accessed Jan 2018. “http://csmic.org”.
[11] M. Alhamad, T. Dillon, and E. Chang, “A trust-evaluation metricfor cloud applications,” International Journal of Machine Learning
and Computing, vol. 1, no. 4, p. 416, 2011.[12] Z. ur Rehman, O. K. Hussain, and F. K. Hussain, “Iaas cloud
selection using mcdm methods,” in e-Business Engineering (ICEBE),2012 IEEE Ninth International Conference on, pp. 246–251, IEEE,2012.
[13] P. Ganghishetti and R. Wankar, “Quality of service design inclouds,” CSI Communications, vol. 35, no. 2, pp. 12–15, 2011.
[14] P. Ganghishetti, R. Wankar, R. M. Almuttairi, and C. R. Rao,“Rough set based quality of service design for service provisioningin clouds,” in Rough Sets and Knowledge Technology, pp. 268–273,Springer, 2011.
[15] I. Patiniotakis, Y. Verginadis, and G. Mentzas, “Pulsar: preference-based cloud service selection for cloud service brokers,” Journal ofInternet Services and Applications, vol. 6, no. 1, p. 26, 2015.
[16] L. Aruna and M. Aramudhan, “Framework for ranking serviceproviders of federated cloud architecture using fuzzy sets,” Inter-national Journal of Technology, vol. 7, no. 4, pp. 643–653, 2016.
[17] R. N. Calheiros, R. Ranjan, A. Beloglazov, C. A. De Rose, andR. Buyya, “Cloudsim: a toolkit for modeling and simulation ofcloud computing environments and evaluation of resource provi-sioning algorithms,” Software: Practice and experience, vol. 41, no. 1,pp. 23–50, 2011.
[18] L. A. Zadeh, “Fuzzy sets,” Information and control, vol. 8, no. 3,pp. 338–353, 1965.
[19] Z. Pawlak and A. Skowron, “Rudiments of rough sets,” Informationsciences, vol. 177, no. 1, pp. 3–27, 2007.

PREPRINT SUBMITTED TO IEEE TRANSACTIONS ON CLOUD COMPUTING 12
Fig. 6: Number of QoS Request vs System Response Time
Fig. 7: Number of CSPs vs System Response Time
[20] D. Chen, L. Zhang, S. Zhao, Q. Hu, and P. Zhu, “A novel algorithmfor finding reducts with fuzzy rough sets,” IEEE Transactions onFuzzy Systems, vol. 20, no. 2, pp. 385–389, 2012.
[21] R. Jensen and Q. Shen, “Rough set-based feature selection,” RoughComputing: Theories, Technologies, p. 70, 2008.
[22] “Package roughsets,” Accessed Jan 2018. “https://cran.r-project.org/web/packages/RoughSets/RoughSets.pdf”.
[23] A. K. Jain, “Data clustering: 50 years beyond k-means,” Patternrecognition letters, vol. 31, no. 8, pp. 651–666, 2010.
[24] R. Tibshirani, G. Walther, and T. Hastie, “Estimating the numberof clusters in a data set via the gap statistic,” Journal of the RoyalStatistical Society: Series B (Statistical Methodology), vol. 63, no. 2,pp. 411–423, 2001.
[25] B. Zhao and Y.-K. Tung, “Determination of optimal unit hy-drographs by linear programming,” Water resources management,vol. 8, no. 2, pp. 101–119, 1994.
[26] T. L. Saaty, Theory and applications of the analytic network process:decision making with benefits, opportunities, costs, and risks. RWSpublications, 2006.
[27] “Cloud harmony,” Accessed Jan 2018. “http://cloudharmony.com”.
[28] G. Da Cunha Rodrigues, R. N. Calheiros, V. T. Guimaraes, G. L. d.Santos, M. B. De Carvalho, L. Z. Granville, L. M. R. Tarouco,and R. Buyya, “Monitoring of cloud computing environments:concepts, solutions, trends, and future directions,” in Proceedingsof the 31st Annual ACM Symposium on Applied Computing, pp. 378–383, ACM, 2016.
[29] K. Alhamazani, R. Ranjan, K. Mitra, F. Rabhi, P. P. Jayaraman,
S. U. Khan, A. Guabtni, and V. Bhatnagar, “An overview of thecommercial cloud monitoring tools: research dimensions, designissues, and state-of-the-art,” Computing, vol. 97, no. 4, pp. 357–377,2015.
[30] H. J. Syed, A. Gani, R. W. Ahmad, M. K. Khan, and A. I. A. Ahmed,“Cloud monitoring: A review, taxonomy, and open research is-sues,” Journal of Network and Computer Applications, 2017.
[31] “Private cloud monitoring systems (pcmons),” Accessed Jan 2018.“https://github.com/pedrovitti/pcmons”.
[32] “R development environment,” Accessed Jan 2018. “https://www.rstudio.com/”.
[33] R. C. Team, “R language definition,” Vienna, Austria: R foundationfor statistical computing, 2000.
[34] “Cran-package fgui: Gui interface,” Accessed Jan 2018. “https://cran.r-project.org/web/packages/fgui/index.html”.
[35] R. N. Gould and C. N. Ryan, Introductory statistics: Exploring theworld through data. Pearson, 2015.
[36] D. Catteddu, G. Hogben, et al., “Cloud computing informationassurance framework,” European Network and Information SecurityAgency (ENISA), 2009.
[37] “Cloud security alliance (csa): Cloud control matrix (ccm),”Accessed Jan 2018. “https://cloudsecurityalliance.org/group/cloud-controls-matrix/”.
[38] “Cran-package roughsets,” Online; Accessed July 2017. “https://CRAN.R-project.org/package=RoughSets”.
[39] “Cloud service market: A comprehensive overview of cloudcomputing services,” Accessed Jan 2018. “http://www.cloudservicemarket.info”.