Children in a Digital World - Caribbean Elections
215
THE STATE OF THE WORLD’S CHILDREN 2017 Children in a Digital World THE STATE OF THE WORLD’S CHILDREN 2017
-
Upload
khangminh22 -
Category
Documents
-
view
3 -
download
0
Transcript of Children in a Digital World - Caribbean Elections

THE STATE OF THE WORLD’S CHILDREN 2017
Children in a Digital World
THE STATE OF THE WORLD’S CHILDREN 2017

ACKNOWLEDGEMENTS
This report is the result of collaboration among many individuals and institutions. The editorial and research team thanks all who gave so willingly of their time, expertise and energy, in particular:
UNICEF colleagues in Bangladesh, Belarus, Bhutan, Brazil, Burundi, Central African Republic, Democratic Republic of the Congo, Guatemala, Japan, Jordan, Malaysia, Republic of Korea, Republic of Moldova, Nigeria, Pacific Islands (Fiji, Kiribati, Solomon Islands and Vanuatu), Paraguay, Peru, Portugal, Senegal, Thailand, Timor-Leste, Tunisia and Uruguay for facilitating The State of the World’s Children workshops.
UNICEF colleagues in Brazil, Burkina Faso, Burundi, Cameroon, Central African Republic, Chad, Chile, Côte d’Ivoire, El Salvador, Guatemala, India, Indonesia, Ireland, Liberia, Malaysia, Mexico, Myanmar, Pakistan, Senegal, Swaziland, Syrian Arab Republic, Thailand, Uganda, Ukraine and United Kingdom for participating in The State of the World’s Children U-Report poll.
Patrizia Di Giovanni, James Elder, Ephantus Ena, Duncan Kagio, Charles Kamonde, Minu Limbu, Ousmane Niang, Edita Nsubuga, Leila Pakkala and Werner Schultink, in Nairobi, Kenya; Aida Girma, Cary McCormick and Joy, Doreen Mulenga, Jaya Murthy and Patrick Oburu in Kampala, Uganda; and Samir Badran, Robert Jenkins, Emad Mohammad and Miraj Pradhan in Amman, Jordan, for their patience, support and good humour during The State of the World’s Children report team’s site visits.
Sanjay Asthana, Monica Bulger, Patrick Burton, Sandra Cortesi, Urs Gasser, Mimi Ito, Daniel Kardefelt-Winther, Sonia Livingstone, Kathryn L. Mills, Jelena Surculija Milojevic, Kentaro Toyama and Mario Viola de Azevedo Cunha for providing guidance and authoring background papers and special features.
Rachel Botsman, Niels Christiansen, Juan Enriquez, Anab Jain, Pony Ma, Khadija Patel, Kartik Sawhney, Karim Sy and Laura Maclet for participating in the Perspectives essay series. And to Phoebe Adler-Ryan, Kathrine Bisgaard Vase, Jin Cheng, Thierry Delvigne-Jean, Rana Flowers, Lisa Goldberg, Danielle Knight, Denise Lauritsen, Xiaohui Li, Li Liu, Patsy Nakell, Priscilla Ofori-Amanfo, Ron Pouwels, Wenying Su, Matthew Whitby, Winnie Wong and Jingjie Yang for their help with these essays.
Ashley, Devonnie, Emmanuella, Gary, Ivan, Jack, Jen and Yousef for participating in the Voices of Youth blog series for this report.
UNICEF Global Innovation Centre for their help and effort carrying out and analysing The State of the World’s Children U-Report poll.
Delphine Bellerose, Girish Lala and Amanda Third from Western Sydney University for their work designing the methodology and analysing the results from The State of the World’s Children workshops held globally for this report.
danah boyd, Drew Davidson, Mark Graham, John Horrigan, Sonia Livingstone, Chris Locke, Juliana Rotich and Michael Trucano for providing guidance and advice.
Tristan Harris for participating in the Conversations with Thought Leaders speaker series at UNICEF House in January 2017.
Fredrik Eriksson and Ivan Vallejo Vall from the International Telecommunication Union (ITU) for providing original data used in this report; and Joss Gillet and Jenny Jones from GSM Association for guidance and statistical support.
Lucia Hug and Olga Oleszczu for their help producing the ITU map on unconnected youth.
Programme and Policy Guidance: Victor Aguayo, Patty Alleman, David Anthony, Maaike Arts, Wivina Belmonte, Anjan Bose, Katlin Brasic, Matt Brossard, Anna Burlyaeva, Laurence Chandy, Sarah Cook, Judith Diers, Eliana Drakopoulos, Laurent Duvillier, Andres Franco, Juan Pablo Giraldo Ospino, Amaya Gorostiaga, Sarah Green, Jumana Haj-Ahmad, Runar Holen, Karin Hulshof, Blandine Ledoux, Katell Le Goulven, Robert MacTavish, Andrew Mawson, Gopal Mitra, Ariam Mogos, Indra Kumari Nadchatram, Yulia Oleinik, Clara Sommarin and Morgan Strecker.
Office of Innovation: Stuart Campo, Christopher Fabian, Sunita Grote, Angelica Gustilo Ong, Erica Kochi, Shruti Kunduri, Milja Laakso, Cynthia McCaffrey, Guillaume Michels, Blair Palmer, James Powell, Maria Luisa Sotomayor, Christopher Szymczak and Naroa Zurutuza.
Communication team: Justin Forsyth, Deputy Executive Director; Paloma Escudero, Director, Division of Communication; Lisa Benenson and Caroline den Dulk, Deputy Directors, Division of Communication; and Maurico Aguayo, Anna Baldursdottir, Nigina Baykabulova, Gerrit Beger, Penni Berns, Marissa Buckanoff, Lely Djuhari, Laurent Duvillier, Madeline Eisner, Kristen Elsby, Joe English, Merva Faddoul, Jedd Flanscha, Toby Fricker, Claudia Gonzalez Romo, Chulho Hyun, Angus Ingham, Deborah Toskovic Kavanagh, Me Me Khine, Catherine Langevin-Falcon, Mischa Liatowitch, Selenge Lkhagva, Jarrod Lovett, Gbolayemi Lufadeju, Najwa Mekki, Christine Mills, Matti Navellou, Christine Nesbitt, Edita Nsubuga, Rebecca Obstler, Katarzyna Pawelczyk, Priyanka Pruthi, Anne Santiago, Leah Selim, Arissa Sidoti, Aline Stein, Georgina Thompson, Juliette Touma, Tanya Turkovich, Nikita White and Judith Yemane.
REPORT TEAM
EDITORIAL AND RESEARCHBrian Keeley, Lead Editor; Céline Little, Editor; Achila Imchen, Research Officer and Data Coordination; Juliano Diniz de Oliveira, Research Officer and Youth Engagement Specialist; Daniel Kardefelt-Winther, Researcher and Global Kids Online Data Coordinator; Jordan Tamagni, Editorial Advisor; Timothy Ledwith, Editorial Advisor; Jasmina Byrne, Policy Advisor; Carlos Perellón, Spanish Editor; Alix Reboul-Salze, French Editor; Anastasia Warpinski, Lead Writer; Xinyi Ge, Yasmine Hage and Baishalee Nayak, Research and Fact-Checking; Natalie Leston, Kristin Moehlmann and Charlotte Rutsch, Copy Editors.
DATA AND ANALYTICSRobert Bain, Nassim Benali, Claudia Cappa, Liliana Carvajal, Mamadou Diallo, Martin Evans, Karoline Hassfurter, Chika Hayashi, Mark Hereward, Lucia Hug, Priscilla Idele, Claes Johansson, Aleya Khalifa, Julia Krasevec, Richard Kumapley, Christina Misunas, Suguru Mizunoya, Vrinda Mehra, Padraic Murphy, Colleen Murray, Rada Noeva, Khin Wityee Oo, Nicole Petrowski, Tyler Porth, Tom Slaymaker, Danzhen You, Xinxin Yu.
PUBLICATION DESIGN AND PRODUCTIONSamantha Wauchope, Head of Publishing; Germain Ake and Ernest Califra.
Graphic design: Soapbox, www.soapbox.co.uk
© United Nations Children’s Fund (UNICEF)
December 2017
Permission is required to reproduce any part of this publication. Please contact:
Division of Communication, UNICEF Attn: Permissions 3 United Nations Plaza, New York, NY 10017, USA Tel: +1 (212) 326-7434 Email: [email protected]
For the latest data, please visit <data.unicef.org>
ISBN: 978-92-806-4930-7
Cover Photo © UNICEF/UN036675/Sharma

Children in a Digital World
THE STATE OF THE WORLD’S CHILDREN 2017

Foreword v
Key messages 1
U-report poll: What do adolescents and youth think of life online? 4
Introduction: Children in a Digital World 6
Chapter 1DIGITAL OPPORTUNITY – The promise of connectivity 12
Education and learning in a digital world 14
What do adolescents think about … how schools are preparing them for the digital age? 18
Giving children a voice in their communities 22
What do adolescents think about … using ICTs to drive social change? 26
Online my wheelchair is invisible 33
Pointing the way forward 34
Special Section: How ICTs are supporting humanitarian action 39
Chapter 2DIGITAL DIVIDES – Missed opportunities 42
Who are the unconnected children? 45A persistent gender gap 48What do adolescents think about …the barriers that stop them from going online? 52Once connected, how do you use? 55Pointing the way forward 61
Special Section: What do connected children do online? 64
Chapter 3DIGITAL DANGERS – The harms of life online 70
Three forms of risk: Content, contact, conduct 72
Cyberbullying: “Nobody deserves this” 74
Online child sexual abuse and exploitation 76
Which children are most vulnerable? 80
What do adolescents think about … online risks and harms 82
Preventing harm in the digital age 84
Pointing the way forward 89
Special Section: Protecting children’s privacy online 91
Chapter 4 DIGITAL CHILDHOODS – Living online 98
A new generation gap 100
What do adolescents think about … the impact of ICTs on families? 102
Being online and well-being: The evidence 105
The debate over digital dependency 111
This is your child’s brain on digital 115
What do adolescents think about … technology and health in the digital age? 116
Chapter 5 DIGITAL PRIORITIES – Harness the good, limit the harm 122
Contents

Endnotes 132
Methodologies for U-Report poll and adolescent workshops 142
Statistical tables 146
Perspectives
Realizing Limitless Possibilities: Technology empowers people with disabilities, by Kartik Sawhney 36How digital technologies herald a bright future, by Karim Sy and Laura Maclet 50A Vision for the Future: Reflections on children’s rights in the digital age, by Pony Ma 68Are you tattooed … yet? by Juan Enriquez 94Look, Mum, no data! by Anab Jain 96Hey, Alexa, should I wear the pink or the sparkly dress today? by Rachel Botsman 106Empowering children to engage in the digital world, by Niels B. Christiansen 120
Figures
1.1 Older children are more likely to be civically engaged online 282.1 Youth in low-income countries are least likely to connect 462.2 About three out of five youth in Africa are not online 462.3 Children from the lowest-income countries use the internet least 472.4 Youth in rural areas are less likely to go online 482.5 Girls are less likely to go online in low-connectivity countries 492.6 Children rely heavily on smartphones to go online 562.7 What are children doing online? 673.1 Parts of the internet 99

Adolescents in Bhutan and 25 other countries talked about what digital technology means to them in the State of the World’s Children 2017 workshops. To hear what they had to say, look out for the “What do adolescents think about …” boxes in this report or read the companion report, Young and Online: Children’s perspectives on life in the digital age. ©UNICEF BHUTAN/2017/SHERPA

v FOREWORD
Foreword
The State of the World’s Children 2017 is about an extraordinary subject that increasingly affects almost every aspect of life for millions of children around the world and, indeed, for us all: digital tech nology.
As the influence of digital tech nology – and especially the internet – has increased, the debate about its impact has grown louder: Is it a boon to humankind, offering unlimited opportunity for communication and commerce, learning and free expression? Or is it a threat to our way of life, undermining the social fabric, even the political order, and threatening our well-being?
This is an interesting but essentially academic debate. Because for better and for worse, digital tech nology is a fact of our lives. Irreversibly.
For better:
The boy living with cerebral palsy, interacting online on an equal footing with his peers, for the first time in his life his abilities more ‘visible’ than his disability.
The girl who fled the violence in the Syrian Arab Republic with her family, recapturing her future guided by a teacher at the Za’atari refugee camp as she uses a digital tablet to learn.
The young blogger in the Democratic Republic of the Congo using the internet to report on the lack of safe water and sanitation and other serious issues in his community.
For worse:
The girl who is forbidden by the rules of her family or her society to go online, missing out on the chance to learn and connect with friends.
The teenager whose personal information is misused by marketers and shared online.
The boy whose video game habit has taken over his life, at least according to his parents.
And worse still:
A boy driven nearly to suicide by cyberbullying that follows him everywhere.
A 14-year-old girl whose ex-boyfriend created a social media profile featuring nude pictures he forced her to take of herself.
An eight-year-old girl in the Philippines forced to perform live-stream sex acts by a neighbour who operates a child sexual abuse website.

UNICEF – THE STATE OF THE WORLD’S CHILDREN 2017vi
Beyond the harm to individual children that digital tech nology can enable or abet is its capacity to incite violence on a massive scale that affects the lives and futures of hundreds of thousands of children. We need look no further for confirmation of this grim potential than an insidious social media campaign in Myanmar this year that incited horrific violence against members of the Rohingya eth nic minority, which resulted in the killing and maiming of children and forced hundreds of thousands to flee towards uncertain futures.
The internet is all of these things, reflecting and amplifying the best and worst of human nature. It is a tool that will always be used for good and for ill. Our job is to mitigate the harms and expand the opportunities digital tech nology makes possible.
That’s what this report is about. It surveys the landscape of digital opportunity as it relates to – and affects – children. It examines the digital divides that prevent millions of children from accessing through the internet new opportunities to learn and, someday, to participate in the digital economy, helping to break intergenerational cycles of poverty.
It also explores the undeniably dark side of the internet and digital tech nology, from cyberbullying to online child sexual abuse to Dark web transactions and currencies that can make it easier to conceal trafficking and other illegal activities that harm children. It reviews some of the debates about less obvious harms children may suffer from life in a digital age – from digital dependencies to the possible impact of digital tech nology on brain development and cognition. And it outlines a set of practical recommendations
that can help guide more effective policymaking and more responsible business practices to benefit children in a digital age.
Equally important, this report includes the perspectives of children and young people on the impact of digital tech nology in their lives – telling their own stories about the issues that most affect them.
Their voices matter ever more – and are louder than ever before – in a digital world. A world they are not only inheriting, but helping to shape.
By protecting children from the worst digital tech nology has to offer, and expanding their access to the best, we can tip the balance for the better.
Anthony Lake UNICEF Executive Director
© UNICEF/UN024828/Nesbitt

Key messages 1
Key messagesThe State of the World’s Children — Children in a Digital World
Digital tech nology has already changed the world – and as more and more children go online around the world, it is increasingly changing childhood.
Youth (ages 15–24) is the most connected age group. Worldwide, 71 per cent are online compared with 48 per cent of the total population.
Children and adolescents under 18 account for an estimated one in three internet users around the world.
A growing body of evidence indicates that children are accessing the internet at increasingly younger ages. In some countries, children under 15 are as likely to use the internet as adults over 25.
Smartphones are fuelling a ‘bedroom culture’, with online access for many children becoming more personal, more private and less supervised.
Connectivity can be a game changer for some of the world’s most marginalized children, helping them fulfil their potential and break intergenerational cycles of poverty.
Digital tech nologies are bringing opportunities for learning and education to children, especially in remote regions and during humanitarian crises.
Digital tech nologies also allow children to access information on issues that affect their communities and can give them a role in helping to solve them.
Digital tech nologies can deliver economic opportunity by providing young people with training opportunities and job-matching services, and by creating new kinds of work.
To accelerate learning, information and communication tech nology (ICT) in education needs to be backed by training for teachers and strong pedagogy.
But digital access is becoming the new dividing line, as millions of the children who could most benefit from digital tech nology are missing out.
About 29 per cent of youth worldwide – around 346 million individuals – are not online.
African youth are the least connected. Around 60 per cent are not online, compared with just 4 per cent in Europe.
Digital divides go beyond the question of access. Children who rely on mobile phones rather than computers may get only a second-best online experience, and those who lack digital skills or speak minority languages often can’t find relevant content online.
Digital divides also mirror prevailing economic gaps, amplifying the advantages of children from wealthier backgrounds and failing to deliver opportunities to the poorest and most disadvantaged children.
There is a digital gender gap as well. Globally, 12 per cent more men than women used the internet in 2017. In India, less than one third of internet users are female.

UNICEF – THE STATE OF THE WORLD’S CHILDREN 20172
Digital tech nology can also make children more susceptible to harm both online and off. Already-vulnerable children may be at greater risk of harm, including loss of privacy.
ICTs are intensifying traditional childhood risks, such as bullying, and fuelling new forms of child abuse and exploitation, such as ‘made-to-order’ child sexual abuse material and live streaming of child sexual abuse.
Predators can more easily make contact with unsuspecting children through anonymous and unprotected social media profiles and game forums.
New tech nologies – like cryptocurrencies and the Dark web – are fuelling live streaming of child sexual abuse and other harmful content, and challenging the ability of law enforcement to keep up.
Ninety-two per cent of all child sexual abuse URLs identified globally by the Internet Watch Foundation are hosted in just five countries: the Netherlands, the United States, Canada, France and the Russian Federation.
Efforts to protect children need to focus particularly on vulnerable and disadvantaged children, who may be less likely to understand online risks – including loss of privacy – and more likely to suffer harms.
While attitudes vary by culture, children often turn first to their peers when they experience risks and harms online, making it harder for parents to protect their children.
The potential impact of ICTs on children’s health and happiness is a matter of growing public concern – and an area that is ripe for further research and data.
Although most children who are online view it as a positive experience, many parents and teachers worry that immersion in screens is making children depressed, creating internet dependency and even contributing to obesity.
Inconsistent advice can be confusing for caregivers and educators, underlining the need for more high-quality research on the impact of ICTs on well-being.
Researchers acknowledge that excessive use of digital tech nology can contribute to childhood depression and anxiety. Conversely, children who struggle offline can sometimes develop friendships and receive social support online that they are not receiving elsewhere.
For most children, underlying issues – such as depression or problems at home – have a greater impact on health and happiness than screen time.
Taking a ‘Goldilocks’ approach to children’s screen time – not too much, not too little – and focusing more on what children are doing online and less on how long they are online, can better protect them and help them make the most of their time online.
Voices of Youth is UNICEF’s digital platform for young people to learn more about issues affecting their lives. This vibrant community of youth bloggers from all over the world offers inspiring, original insights and opinions on a variety of topics.
Full articles by youth contributors featured in The State of the World’s Children 2017 can be found at: <www voicesofyouth.org/ en/sections/content/pages/ sowc-2017>
VOICES OF YOUTHYoung bloggers speak out
DENNAR GARY ALVAREZ MEJIA, 19 PLURINATIONAL STATE OF BOLIVIA
“ One of the key challenges many young people are struggling with is the proper verification of sources. Even though technological innovations have accelerated the pace of life, it’s important that we take our time to check the validity, credibility and overall quality of the sources of information that we use.”

Key messages 3
The private sector – especially in the tech nology and telecommunication industries – has a special responsibility and a unique ability to shape the impact of digital tech nology on children.
The power and influence of the private sector should be leveraged to advance industry-wide ethical standards on data and privacy, as well as other practices that benefit and protect children online.
Governments can promote market strategies and incentives that foster innovation and competition among service providers to help lower the cost of connecting to the internet, thereby expanding access for disadvantaged children and families.
Tech nology and internet companies should take steps to prevent their networks and services from being used by offenders to collect and distribute child sexual abuse images or commit other violations against children.
Media stories about the potential impact of connectivity on children’s healthy development and well-being should be grounded in empirical research and data analysis.
And internet companies should work with partners to create more locally developed and locally relevant content, especially content for children who speak minority languages, live in remote locations and belong to marginalized groups.
Digital tech nology has already changed the world – and as more and more children go online around the world, it is increasingly changing childhood.
Youth (ages 15–24) is the most connected age group. Worldwide, 71 per cent are online compared with 48 per cent of the total population.
Children and adolescents under 18 account for an estimated one in three internet users around the world.
A growing body of evidence indicates that children are accessing the internet at increasingly younger ages. In some countries, children under 15 are as likely to use the internet as adults over 25.
Smartphones are fuelling a ‘bedroom culture’, with online access for many children becoming more personal, more private and less supervised.
DEVONNIE GARVEY, 19JAMAICA
“Without the ready availability of knowledge and the global network accessible through the internet, my economic prospects would seem grim. But that’s not the case. Instead I find myself with more hope than many people employed in a bricks-and-mortar 9-to-5 job.”

U report page
What do you dislike about the internet?
How did you learn to use the internet?
“There is nothing I dis like about the internet.”Reported more
often by those in low-income countries.
Learned from friends or siblings
39%
As part of the research for The State of the World’s Children 2017, U-Report – an innovative social messaging tool used by nearly 4 million young people around the world to share their views on a range of common concerns – sent four questions to U-Reporters worldwide. The poll garnered a total of 63,000 responses. Data highlighted here refl ect the responses of adolescents and youth (ages 13–24) from 24 countries.*
* Only countries with a minimum of 100 respondents each were included in the ‘country’ category analysis, namely: Algeria, Bangladesh, Brazil, Burkina Faso, Burundi, Cameroon, Central African Republic, Chad, Chile, Côte d’Ivoire, El Salvador, Guatemala, Honduras, India, Indonesia, Liberia, Malaysia, Mexico, Mongolia, Pakistan, Peru, Philippines, Thailand and Ukraine.
https://ureport.in< >
What would make the internet better for you?
Young people from low-income countries were 2.5 times more likely to ask for greater access to digital devices
What do you like about the internet?
Learning things for school or health
40%
Read about politics and/or improving my community
More popular among older age groups.
9%
31%
12% 9% 10%
What do adolescents and youth think of life online?
Low income
Lower middle income
Upper middle income
High income
Learned on their own
42%69% of young people in Honduras said they learned on their own compared to 19% in the Central African Republic (CAR).
Honduras
CAR
Violence
23%Girls are more likely to be upset by violence (27% vs. 20% for boys).
Boys
Girls
24%
Learning skills I can’t learn at school
“Learning skills that I can’t learn at school” was especially important to those in Indonesia (47%), Burundi (35%) and Brazil (34%).
Burundi
Indonesia
Brazil
Young people in low-income countries are more likely to be upset by unwanted sexual content (42% vs. 16% in high-income countries).
Unwanted sexual content
33% Reported equally by girls (32%) and boys (33%).
Boys
Girls
High-income countries
Low-income countries
13% Low-income countries
3% High-income countries

UNICEF – THE STATE OF THE WORLD’S CHILDREN 20176
The State of the World’s Children 2017: Children in a Digital World examines the ways in which digital technology has already changed children’s lives and life chances – and explores what the future may hold.
If leveraged in the right way and made universally accessible, digital technology can be a game changer for children being left behind – whether because of poverty, race, ethnicity, gender, disability, displacement or geographic isolation – connecting them to a world of opportunity and providing them with the skills they need to succeed in a digital world.
But unless we expand access, digital technology may create new divides that prevent children from fulfilling their potential. And if we don’t act now to keep pace with rapid change, online risks may make vulnerable children more susceptible to exploitation, abuse and even trafficking – as well as more subtle threats to their well-being.
This report argues for faster action, focused investment and greater cooperation to protect children from the harms of a more connected world – while harnessing the opportunities of the digital age to benefit every child.
Introduction: Children in a Digital World

introduction: children in a digital World 7
The constant churn of new technologies, such as virtual reality – enjoyed here by 12-year-old Mansoor in the Za’atari refugee camp, Jordan – is making it hard for policy to keep up. © UNICEF/UN051295/HERWIG

UNICEF – THE STATE OF THE WORLD’S CHILDREN 20178
Like globalization and urbanization, ‘digitalization’ has already changed the world. The rapid proliferation of information and communications technology (ICT) is an unstoppable force, touching virtually every sphere of modern life, from economies to societies to cultures … and shaping everyday life.
Childhood is no exception. From the moment hundreds of millions of children enter the world, they are steeped in a steady stream of digital communication and connection – from the way their medical care is managed and delivered to the online pictures of their first precious moments.
As children grow, the capacity of digitalization to shape their life experiences grows with them, offering seemingly
limitless opportunities to learn and to socialize, to be counted and to be heard.
Especially for children living in remote locations, or those held back by poverty, exclusion and emergencies that force them to flee their homes, digital technology and innovation can open a door to a better future, offering greater access to learning, communities of interest, markets and services, and other benefits that can help them fulfil their potential, in turn breaking cycles of disadvantage.
But millions of children do not enjoy that access, or their access is intermittent or of inferior quality – and they are most often the children who are already most deprived. This only compounds their deprivation, effectively denying them the skills and knowledge that could help them fulfil their potential and helping break intergenerational cycles of disadvantage and poverty.
Digital technology and interactivity also pose significant risks to children’s safety, privacy and well-being, magnifying threats and harms that many children already face offline and making already-vulnerable children even more vulnerable.
Even as ICT has made it easier to share knowledge and collaborate, so, too, has it made it easier to produce, distribute and share sexually explicit material and other illegal content that exploits and abuses children. Such technology has opened new channels for the trafficking of children and new means of concealing those transactions from law enforcement. It has also made it far easier for children to access inappropriate and potentially harmful content – and, more shockingly, to produce such content themselves.
Even as ICT has made it easier for children to connect to one another and share experiences online, it has also made it easier to use those new channels of connectivity and communication for online bullying, with a much greater reach – and thus potentially
Digital technology allows 17-year-old Gabriela Vlad (seen here with a neighbour) to keep in touch with her mother, who, like many Moldovan parents, works abroad to support her family. Learn more about Gabriela’s story at <http://www.unicef.org/sowc2017> © UNICEF/UN0139536/
GILBERTSON VII PHOTO

introduction: children in a digital World 9
greater risk – than offline bullying. Similarly, it has increased opportunities for wider misuse and exploitation of children’s privacy, and changed the way children regard their own private information.
Even as the internet and digital entertainment have spurred tremendous creativity and expanded children’s access to a wealth of enriching and entertaining content, they have also raised questions of digital dependency, and ‘screen addiction’, among children. And even as such technologies have greatly enlarged platforms for the free expression of ideas, they have also broadened the distribution of hate speech and other negative content that can shape our children’s view of the world – and of themselves.
Some of the impacts of digitalization on children’s well-being are not universally agreed. Indeed, some are the subject of growing public debate among policymakers and parents alike. And while the potentially equalizing power of digitalization on children’s chances in life cannot be denied, that promise has yet to be realized.
These challenges will only intensify as the reach and range of digitalization expands and its many opportunities continue to be exploited commercially and otherwise. More digital devices, online platforms and applications will be available for children’s use. The Internet of Things, artificial intelligence and machine learning are here to stay, creating new opportunities but also new challenges.
What can governments, international organizations, civil society, communities, families and children themselves do to help limit the harms of a more connected world, while harnessing the opportunities of a digital world to benefit every child?
First and foremost, we need to identify and close the gaps: in access to quality online resources, in knowledge about how children use the internet and children’s knowledge
of how to protect themselves online, and in both policymaking and regulatory frameworks that have not caught up with the pace of change.
Despite the rapid spread of access to digital and online experiences around the world, there are still wide gaps in children’s access to digital and communications technology. Access to ICTs – and the quality of that access – has become a new dividing line. For example, children whose access is limited to a small range of local content services viewed via inferior devices with a slow connection are missing out on the full range of content and opportunities their better-connected peers enjoy. These disparities mirror and potentially exacerbate those already affecting disadvantaged children offline.
Gaps in our knowledge about children’s lives online, including the impact of connectivity on a range of areas, such as cognition, learning and social emotional development, make it more difficult to develop dynamic policies that get ahead of issues by addressing risks and making the most of opportunities. Gaps in our understanding of how children feel about their experience of connectivity – including their perceptions of risks – further limit us.
There are also clear gaps in children’s knowledge about risks online, and despite rapidly increasing usage among children and adolescents, many lack digital skills and the critical ability to gauge the safety and credibility of content and relationships they experience online. This reflects a need for much more widespread digital literacy opportunities that can both safeguard and empower children.
Finally, and crucially, all these gaps both reflect and produce lags in policymaking: Regulatory frameworks for digital protection, digital opportunity, digital governance and digital accountability are not keeping pace with the rapidly changing digital landscape, and are overlooking the unique impact

UNICEF – THE STATE OF THE WORLD’S CHILDREN 201710
digital technologies have on children. If left unclosed, those regulatory gaps will quickly be exploited. There is no shortage of principles and guidelines for digital policymaking; what is lacking is consistent coordination and a commitment to tackling common challenges with children’s interests at the fore.
Especially now, as the world works to realize the Sustainable Development Goals (SDGs), ICTs and the internet can be powerful enablers, helping realize the promise of the SDGs to leave no one behind. But action – by governments, international organizations, civil society, academia, the private sector, and families, children and young people – must match the pace of change.
The State of the World’s Children 2017: Children in a Digital World provides a timely review based on prevailing and new data sources of children’s lives in a digital world – examining the evidence, discussing the issues and exploring some of the key controversies, as well as proposing principles and concrete recommendations.
Throughout, the report presents the perspectives of industry leaders and digital activists, and includes the views of children and young people, gleaned through adolescent workshops carried out in 26 countries, a specially commissioned U-Report poll presents opinions from adolescents in 24 countries about their digital experiences, commentary by youth bloggers from UNICEF’s Voices of Youth, and analysis drawn from the pioneering Global Kids Online Survey.
Chapter One looks at the opportunities digitalization offers to children everywhere, but especially children disadvantaged by poverty, exclusion, conflicts and other crises. For example, ICTs are bringing education to children in remote parts of Brazil and Cameroon and to girls in Afghanistan who cannot leave their homes. ICTs are also enabling child bloggers and reporters in
the Democratic Republic of the Congo to advocate for their rights. They’re increasingly supporting children and their families in emergencies. And they’re literally giving a voice to children with disabilities: “The day I received an electronic notepad connected to the internet, my life literally changed,” Ivan Bakaidov, an 18-year-old with cerebral palsy, writes in this report.
Chapter Two examines the data on who is being left behind and what it means to be unconnected in a digital world. The top-line numbers are striking: Nearly one third of all youth worldwide – around 346 million 15–24 year olds – are not online. In Africa, 3 out of 5 youth (aged 15 to 24) are offline; in Europe, the proportion is just 1 in 25. But digital divides go deeper than just connectivity. In a world where 56 per cent of websites are in English, many children cannot find content they understand or that’s relevant to their lives. Many also lack the skills, as well as the access to devices like laptops, that would allow them to make the most of online opportunities. If these digital divides are not bridged, they will deepen existing socio-economic divisions.
Chapter Three delves into the digital dark side and the risks and harms of life online, including the internet’s impact on children’s right to privacy and expression. ICTs have amplified some of the traditional dangers of childhood: Once confined to the schoolyard, the bully can now follow victims into their homes. But they have also created new dangers, such as expanding the reach of predators, fostering the creation of made-to-order child sexual abuse material, and broadening the market for the broadcasting of live sex abuse. As one child victim of online streaming said, “When the foreigner says, ‘get naked’, then we undress.” And then there are the dangers that many children and parents are unaware of – the threats to children’s privacy and identity, for example, from the industrial-scale data processing that the internet has now made possible.

introduction: children in a digital World 11
Chapter Four explores some of the ways digitalization is changing childhood, for better and for worse. ICTs have changed how children form and maintain their friendships, allowing them to maintain almost-constant contact with their peers. They have also transformed how many children spend their leisure time, providing them with a constant feed of videos, social media updates and highly immersive games. Many adults fear these changes are not all for the better, and worry that excessive screen time is isolating children from their families and surroundings, fuelling depression and even making children obese.
The report concludes with priority actions and practical recommendations for how society can harness the power of digitalization to benefit the most disadvantaged children and limit the harms to protect those children who are most vulnerable. These include:
1. Provide all children with affordable access to high-quality online resources. Actions should include creating incentives to encourage telecom and technology companies to lower the costs of connectivity; taking the needs of the unconnected into account when developing infrastructure plans; investing in more public hotspots and the creation of more culturally and linguistically appropriate content; and confronting cultural and other barriers that prevent children – especially girls – from going online.
2. Protect children from harm online. Actions should include coordinating more closely at the international and national levels and deepening collaboration between law enforcement and the technology industry to keep pace with digital technology that can enable and conceal illegal trafficking and other online child sexual abuse.
3. Safeguard children’s privacy. Actions should include urging a much greater commitment by the private sector and government to protect and not misuse
children’s data and to respect its encryption; enforcing the application of international standards in collecting and using data about children online; and teaching children how to protect themselves from threats to their own privacy.
4. Teach digital literacy to keep children informed, engaged and safe online. Actions should include greater collaboration between governments and technologists to develop ICT platforms and curricula from primary school through high school, supporting online libraries and expanding the capacity of public libraries to teach digital skills; investing in teacher training in digital technology; teaching children how to recognize and protect themselves from online dangers; and making digital citizenship a core component of digital literacy instruction.
5. Leverage the power of the private sector to advance ethical standards and practices that protect and benefit children online. Actions should include ethical product development and marketing that mitigates risks to children and a greater commitment to expanding children’s access to connectivity and content online. The private sector – especially technology and telecom industries – has a special responsibility and a unique ability to shape the impact of digital technology on children.
6. Put children at the centre of digital policy. Actions should include investing in better data about children’s access and activities online; developing regulatory frameworks that recognize the distinct needs of children; strengthening coordination and knowledge sharing at the global level to address the challenges of a digital world; deepening collaboration with children’s organizations; and engaging more systematically with policymakers and lawmakers.

Full articles by youth contributors featured in The State of the World’s Children 2017 can be found at: <www.voicesofyouth.org/en/sections/content/pages/sowc-2017>
JACK LIDDALL, 16 UNITED KINGDOM
“ Nowadays, at the touch of a button, it is possible to contact a friend on the other side of the world, from Edinburgh to New York to Paris to Beijing. Anywhere is possible. With such power and the endless possibilities, it should come as no surprise that people, let alone the younger generation, are now more and more civically engaged.”
01Digital Opportunity: The promise of connectivity

13
Digital technology is already the great game changer of our time – and it could be transformative for the world’s most disadvantaged and vulnerable children, helping them learn, grow and fulfil their potential.
Digitalization allows children with disabilities to connect with friends and make decisions for themselves; provides access to education for children living in remote or marginalized areas; and, in humanitarian settings, helps children on the move find a safe route and connect with their families. Greater online connectivity has opened new avenues for civic engagement, social inclusion and other opportunities, with the potential to break cycles of poverty and disadvantage.
We are the most computerized generation, so we have to talk to people where they are: on the internet.
“
In Za’atari refugee camp in Jordan, a class of girls is learning English. Their classroom is rough and ready, its bare walls marked only by brown patches where the paint has peeled away. But the girls are smiling. At the head of the classroom, their young teacher calls out a question in English: “Where is the lamp?”
The girls carefully hold electronic tablets showing colourful images of the inside of a home. The girls search for the lamp. If they touch the right picture, the tablet calls out “good job”; if they get it wrong, it asks them to try again. “It’s fun to learn with this,” says 11-year-old Saha. “It’s very useful for us. We can use it to learn things we didn’t know before.”1
In Kinshasa, 17-year-old Glodi is preparing to go on a reporting assignment. Three years ago, he was inspired to become a ‘Young Reporter’ following a presentation by a journalism network2 in his school: “It was new to me,” he says. “I had never heard of the right to participation, for example.” After a week of training, Glodi began writing about issues in his community. “In my neighbourhood, many people do not have access to water, hygiene and sanitation, so it was logical for me to write about this subject.” His articles appear on the Ponabana (For the Children) blog, which provides a voice for children in the Democratic Republic of the Congo (<www.ponabana.com>). “Writing for Ponabana allows me to reach a wide
audience,” says Glodi. “We are the most computerized generation, so we have to talk to people where they are: on the internet.”
In the Russian Federation, Ivan is chatting online. But if his friends were to meet him in person, “they would not understand a word that I say,” he writes (see page 33). That’s because the 18-year-old has severe speech problems, a result of cerebral palsy. Being online, however, allows him to chat like any other teenager: “Some of my virtual friends don’t even know that I have a disability.” It’s not just socializing where the internet is making a difference in Ivan’s life: “Even though I am a student, I can’t physically access my school. However, with the help of the internet and phones I am attending the classes and following the teachers’ instructions.”
In southern Chad, 17-year-old Oudah is dreaming of home. Like tens of thousands of others, he was forced to flee conflict in the Central African Republic. For the past few years he’s been living in the Danamadja refugee camp, just across the border from his home country. Staying connected with his friends and family is a constant challenge, but digital technologies provide him with a lifeline. “I use the internet to stay in touch with my brothers who are still in the Central African Republic,” he says. “It’s been three years since I’ve been separated from my family and friends. It is important to stay in touch with them so I don’t feel too lonely.”

UNICEF – THE STATE OF THE WORLD’S CHILDREN 201714
Saha, Glodi, Ivan and Oudah live very different lives, but they are linked by one thing: In big ways and small, they are enjoying the opportunities brought by digital technologies and connectivity.
They are not alone: There are countless stories and examples of how children around the world are capturing opportunities to learn and enjoy themselves online and to shape their own paths into adulthood. Often without the help of adults, they are using online platforms to do their homework; learn how to play the guitar or make their mother’s favourite soup; chat with friends; access health information; bring positive change to their communities; find out what’s happening locally and globally; and design and write blogs to express their talents and opinions.
These opportunities must be considered alongside the reality that they are not available to millions of children (see Chapter 2), as well the risks of life online (see Chapter 3) and the potential impact of connectivity on children’s well-being (see Chapter 4). But they provide an exciting window on what is already happening and a sense of what could happen in the future.
Education and learning in a digital world
The idea that digital connectivity could transform education has attracted global interest and opened up new possibilities, as development organizations, commercial software and hardware producers and educational institutions develop, pilot and try to scale up new digital products and services in the education sector. Information and communication technologies (ICTs) are already expanding access to high-quality educational content, including textbooks, video material and remote instruction, and at a much lower cost than in the past. They can potentially
increase student motivation by making learning more fun and relatable. And they create opportunities for personalized learning, helping students to learn at their own pace and helping educators with limited resources provide students with better learning opportunities.
How well are digital technologies fulfilling this promise? Without question, they have opened access to learning opportunities for children around the world, especially those in remote regions. They have allowed children to participate in e-learning and to access a wide range of educational and learning content that was unavailable to previous generations of children.
But when it comes to whether or not digital technologies are accelerating learning in the classroom, the picture has up to now been much more mixed. This paradox of the digital revolution in education was captured by the late Steve Jobs, founder and CEO of Apple. According to Jobs, while he “spearheaded giving away more computer equipment to schools than anybody on the planet,” he concluded that “what’s wrong with education cannot be fixed with technology.”3 Research increasingly supports Jobs’s view. It shows that if such technologies are to have any chance of improving learning outcomes, they need to be supported by strong teachers, motivated learners and sound pedagogy.
How ICTs can expand access to learning
Digital tools and connectivity can provide children with access to education in places where few such opportunities exist. A sense of their promise was evident at a United Nations Educational, Scientific and Cultural Organization (UNESCO) gathering of education and development professionals in 2015 that looked at the role of ICTs in meeting the education aims of the Sustainable Development Goals. This gathering put forward the idea that innovations in ICTs could
Technology needs to be supported by strong teachers, motivated learners and sound pedagogy.
“

01 DIGITAL OPPORTUNITY: THE PROMISE OF CONNECTIVITY 15
help bridge the knowledge divide by creating both formal and informal learning pathways – through, for example, the distribution of education content and e-learning – and by fostering the development of job-related skills.4
Digital connectivity is already bringing educational content to children in rural and other marginalized areas. For example, in Brazil, the Amazonas state government’s educational initiative, Centro de Mídias de Educação do Amazonas (Media Centre for Education), has been providing educational content since 2007 to children and youth living remotely. Using satellite television, classes are taught by teachers in the state capital of Manaus and beamed into classrooms in rural communities. The students are supported by professional face-to-face tutors and can ask teachers questions in real time. In addition to paper-based material, they also have access to digital textbooks and other educational resources via the internet.5
In Cameroon, a pilot project called Connect My School aims to provide access to educational content and digital tools to children living in remote areas of the country. Internet connectivity is provided by solar-powered equipment within a 500-metre range, allowing a whole school to be connected. And child-friendly tablets, with a parental control system, allow access to educational apps such as Wikipedia and learning games, as well as drawing, text and photo/video apps. About 2,000 fifth-year students have participated in this initiative, and teachers report that children are benefiting from the online content.
The Afghan Institute of Learning is reaching girls and women who cannot travel outside their home owing to social restrictions6 with an SMS-based literacy programme. Results in reading skills show promise. Significantly, the programme is run in conjunction with teachers and physical classes operated by a devoted non-profit organization, underlining
Internet connectivity is provided by solar-powered equipment, allowing a whole school to be connected.
“
“ We are the most computerized generation,” says Glodi, 17, a Ponabana blogger in Kinshasa, Democratic Republic of the Congo. “So we have to talk to people where they are: on the internet.” © UNICEF/
DRC/2017/Wingi

UNICEF – THE STATE OF THE WORLD’S CHILDREN 201716
the importance of providing children with strong teaching and pedagogical support in their use of ICTs in education.
Virtual, or online, schools can bring specific programmes of instruction to children. The promise of this model for underserved or marginalized children is evident in such efforts as those of the Jaago Foundation, a small organization in Bangladesh founded in 2007. Using interactive video conferencing technology, the organization connects an online teacher in Dhaka with a rural or underserved urban classroom and two local teachers to provide instruction and follow-up. This project currently serves 2,500 students living in poverty in 13 schools.
According to UNESCO, the volume of open educational resources (OERs) – materials in the public domain or introduced with an open license and thus freely usable by anyone – has increased significantly in recent years, providing a strategic opportunity to improve the quality of education and facilitate policy dialogue, knowledge sharing and capacity-building.7
But content quality can vary significantly,
underscoring the need for serious critical appraisal of materials to make sure they really will contribute to children’s learning. The upside, however, is that once a satisfactory level of quality is attained, digital tools allow such resources to be easily scaled up and distributed, reaching areas of the world previously unreached by traditional information sharing and content distribution.
A second chance to learn
Skills and vocational training programmes are areas where digital connectivity is opening opportunities to learn. This is particularly true for disadvantaged children, who sometimes leave formal schooling to bring in income for their families8 (see section on economic participation), and for underserved or marginalized children.
For example, in Kampala, Uganda, the Women in Technology Uganda organization offers digital vocational training for young women in underserved communities. The set-up enables students to go at their own pace, which may benefit those not accustomed to formal schooling. In addition to teaching young women digital skills, the training also focuses on building confidence, leadership and life skills. Girls attending the programme have reported learning ICT and entrepreneurship skills and going on to use the internet to identify their own business opportunities.
Similarly, the Youth for Technology Foundation in Nigeria is implementing an initiative to empower young people and create opportunities for income generation and access to new market services. The TechCommunities programme, for example, engages students in technology projects, field work and meaningful internships, setting them up to become leaders and innovators in their communities. According to the organization, 90 per cent of the programme graduates are engaged in entrepreneurship activities.9
The internet has greatly increased the supply of open educational resources, with the potential to increase children’s learning opportunities. © UNICEF/UNI48335/Pirozzi

01 DIGITAL OPPORTUNITY: THE PROMISE OF CONNECTIVITY 17
IT Girls – Bosnia and Herzegovina
Globally, there were 250 million fewer women online than men in 2016, according to the International Telecommunication Union. Women are also notably under-represented in STEM – science, technology, engineering and mathematics – jobs. Bridging this gender digital divide is a considerable challenge, but a number of initiatives point to how girls’ digital access can be improved. One promising path is to promote ICT skills among girls, which also has the benefit of building up confidence and fundamental employment and entrepreneurship skills.
In Bosnia and Herzegovina, UNICEF, the United Nations Development Programme and UN Women have since 2016 been implementing an initiative called IT Girls, which aims to increase job opportunities for young women and girls by providing them with computer programming skills. The pilot organized six training programmes for 67 adolescent girls
in both urban and rural locations. Currently, three additional training programmes are under way aiming to reach an additional 60 girls. The training, which covers basic web development skills, also enhances girls’ knowledge of online safety and boosts their presentation skills. An important feature of IT Girls is its equity component: The training sessions are organized in parts of the country where children typically have less access to technology and information about ICTs, reaching girls from minorities, rural communities and other vulnerable groups.
According to the first-year evaluation, the initiative has successfully raised young girls’ awareness of opportunities in the ICT sector, not only by promoting the ICT industry as exciting, diverse and lucrative, but also by bolstering their confidence and inspiring them to take on new challenges.10
Do ICTs improve learning outcomes in formal education?
Harnessing the power of digital technologies to improve student learning outcomes – and to give students the skills they need to transition to adulthood – seems natural in a connected world. Delivering on this potential has proved considerably more complicated, however. This is not to say that ICTs cannot be designed to improve student learning. But this will only happen if educators and technology designers learn the lessons of the past.
A first lesson is that it’s not enough merely to provide children with access to digital
technology, such as laptop computers and tablets, without also supporting them with trained teachers and software that complement school curricula. Simply giving students digital tools results in their using the technology, but appears to do little to enhance learning.11
As an example, take the One Laptop Per Child (OLPC) project, which launched to great fanfare in 2006 when the first prototypes were shipped. More than 3 million laptops had been distributed to primary schools around the world by 2016. Several countries, including Argentina, Mexico, Peru, Rwanda and Uruguay – which rolled out a national programme for every

In mid-2017, almost 500 adolescents from 26 countries took part in workshops to discuss their experiences with information and communication technologies (ICTs) and their hopes and fears for the digital age. The events were organized with the support of UNICEF Country Offices and National Committees and Western Sydney University (WSU) in Australia. Findings from the workshops appear throughout this report and in a companion report from WSU.
What do adolescents think about … how schools are preparing them for the digital age?
Most participants in the State of the World’s Children 2017 workshops* said they believed digital technologies were vital to their futures …“ If we do not use the computer, if we do not know computer, then we do not know anything, including … good things for our lives.” GIRL, 14, TIMOR-LESTE
and many had clear ideas about how they could use such technologies when they grew up.“ To produce music, get clients and send work
done, make jingles for companies, run a free music download site and application.” BOY, 19, NIGERIA
“ To become a better person and get a degree to find a job.” GIRL, 15, PORTUGAL
“ To call or text people on the phone, do research on the internet, to listen to music, to do some presentations on the laptop, and play some games on the phone, laptop and computer.” GIRL, 13, VANUATU
They thought digital technology skills mattered, but so did other skills.“ Critical thinking skills.” GIRL, 16, MALAYSIA
“ Coding!!! To create new programmes and games!!” GIRL, 17, MALAYSIA
About one in five participants said they had no access to digital technology at school.“ Zero technology is available to us.”
BOY, 15, CENTRAL AFRICAN REPUBLIC
Access for the rest varied greatly …“ There is a computer, but it’s located in the
principal’s office.” GIRL, 15, PERU
“ My school approves use of computer, it’s
mandatory. School provides Wi-Fi signal, but not much more. My computer or laptop is always in my backpack.” GIRL, 15, PARAGUAY
but most could use computer labs … “ We have computers and computer lab. We can
use it whenever we want.” GIRL, 16, BHUTAN
although the facilities were not always perfect.“ The school has a rather large number
of computers in the computer lab, but unfortunately it can be difficult for students to use them due to problems such as regular electricity shortages.” BOY, 16, DEMOCRATIC
REPUBLIC OF THE CONGO
School computers were also sometimes underused.“ We have a computer lab in my college but the
teachers don’t allow [us] to use [it].” BOY, 16, BANGLADESH
Participants thought such underuse often reflected teachers’ lack of technological confidence.“ My teacher takes good care about digital education, but other teachers in school don’t. It’s because they are not familiar with digital technology.” BOY, 12, REPUBLIC OF KOREA
Half the participants said they had done some digital technology training outside school. Their motivations ranged from securing a better future …“ I have attended a course at CEBRAC [an employment agency] where I learned to use Excel and spreadsheets. I participated because I could do it for free and I thought it would be important to have something like this in my CV.” GIRL, 16, BRAZIL

to supporting their education …“ I attended [IT training outside school] because learning how to use computers will help me with the work I get at school.” BOY, 17, PERU
to building their capacity for innovation and social entrepreneurship …“ I participated in the Technovation challenge and built an app that solves an issue in our community to learn coding and pitch my ideas.” GIRL, 17, TUNISIA
to exploring the digital world …“ I went to online media literacy camp because I want to learn more about how to be safe online and how to use it in a constructive way.” BOY, 15, THAILAND
to following their parents’ orders.“ Honestly, I attended that class because my father forced me.” GIRL, 16, BHUTAN
Some participants said they had also taught themselves digital skills.“ I learned coding through YouTube. I watched so many videos about coding and thus I have learned coding.” GIRL, 17, BANGLADESH
Participants in the workshops said information technology (IT) education in schools focused mainly on ‘traditional’ skills, such as using software, saving files and typing. Some also learned about online safety or coding. Few were learning skills for more creative practices, such as building websites or apps or making videos.
“ They could teach us not only more things related to ‘the typical job’, but also designing and programming [and] not only from the intellectual side, but also social and personal.” GIRL, 14, URUGUAY
“ The school programme has got old and doesn’t correspond with modern world.” GIRL, 16, BELARUS
Indeed, they had clear views on what schools needed to do to educate them about digital technology. They wanted training to begin earlier …“ [We] ask the authorities to go into every school so that children start learning computer science from primary school.” GROUP RESPONSE, CENTRAL AFRICAN REPUBLIC
and they wanted better connectivity …“ Considering that we already have access to some devices at school, I would suggest that we are provided with free internet connection to allow us to complete our research and work.” GIRL, 14, DEMOCRATIC REPUBLIC
OF THE CONGO
as well as more highly skilled teachers.“ Hire young specialists.” GIRL, 15, BELARUS
And they wanted more guidance on the positives and negatives of technology.“ School educators should make time for children to better understand and therefore make better use of technology, to know the advantages and the disadvantages.” BOY, 16, DEMOCRATIC REPUBLIC OF THE CONGO
“ Teachers should teach classes that help us to use digital technology appropriately.” GIRL, 17, JAPAN
IN SUMMARYAdolescents said technology use in schools generally lagged significantly behind their digital practices outside of school hours. They felt that digital technologies were compartmentalized in IT subjects and inadequately harnessed for broader learning at school.
* Participants’ responses have been shortened and edited for clarity where necessary.

UNICEF – THE STATE OF THE WORLD’S CHILDREN 201720
child in Years 1–6 – made large purchases. According to a study conducted in 2009, the children in Uruguay seemed to find the computers easy and fun to use.12 However, studies in Peru13 (in 2012) found no evidence that the programme increased learning in mathematics or languages, nor that the laptops improved attendance, increased time spent on homework, influenced reading habits or raised motivation. Today, the One Laptop Per Child programme is no longer expanding. Key offices are closed, and only minimal support is provided to countries that previously purchased OLPC devices.14
Adult supervision
The vast majority of student-focused computer-delivery programmes, however,
rely on adult guidance to help students, who use the technology as an additional tool. While most interventions that provide computer-assisted learning and materials may achieve modest learning gains, they are not always cost-effective,15 even in high-income, high-connectivity settings. Implementation can also be an issue: Research suggests that blended learning – where students use digital tools under adult guidance in a traditional classroom setting – can boost learning outcomes, but only when well planned and if teachers are well supported.16
Some blended learning projects – curricula combining digital and traditional components overseen by a teacher – show promise: In one randomized controlled trial in 2007 involving 111 schools in India, for example,
In Cameroon, 12-year-old Waibai Buka is benefiting from the Connect My School initiative. She recently had a chance to show the tablet to her mother: “I showed her what I was doing at school with my tablet. She was so proud of me.” Learn more about Waibai’s story at <http://www.unicef.org/sowc2017> © UNICEF/UN0143476/Prinsloo

01 DIGITAL OPPORTUNITY: THE PROMISE OF CONNECTIVITY 21
students in Year 4 who participated in a computer-aided mathematics-focused learning programme increased their scores compared to the control group.17
Also in India, a 2017 evaluation of a blended-approach after-school learning programme for middle school students showed increased test scores in mathematics and Hindi after approximately five months. The programme provided individually customized educational content to match each student’s level and rate of progress.18
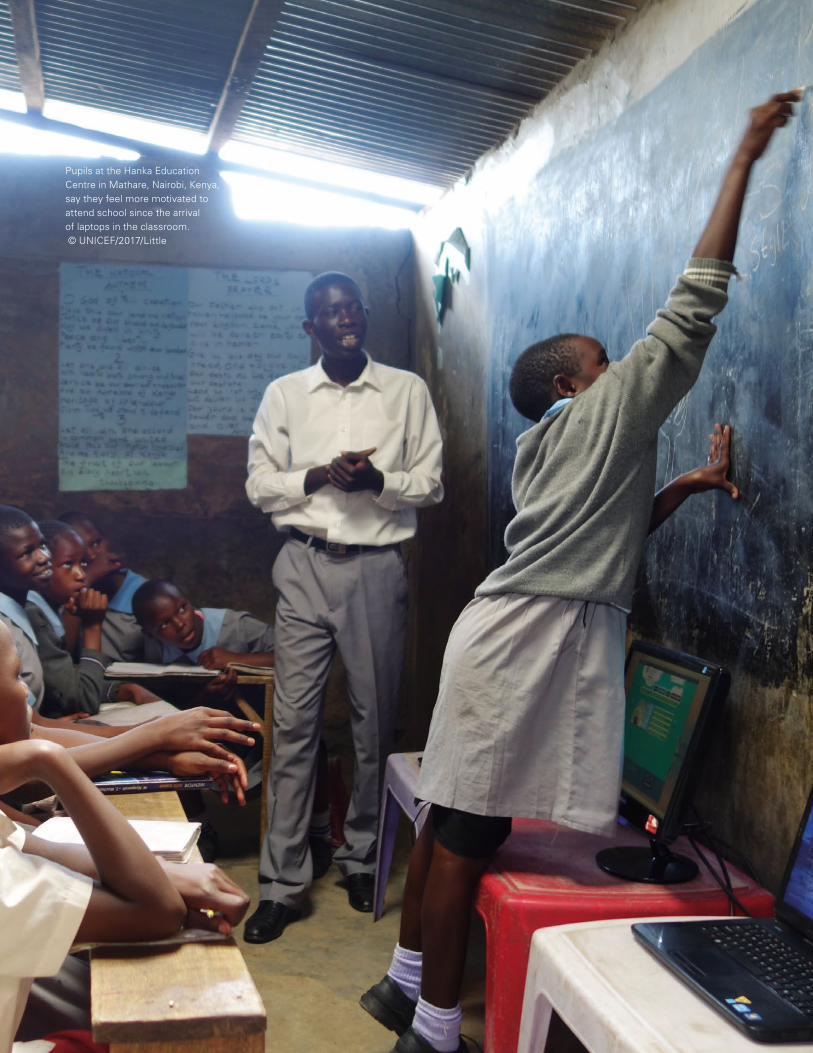
The work of the Avallain Foundation19 in Kenya is also having a positive impact on student performance and motivation using a blended-learning approach. According to an impact study in 2017, learning outcomes have considerably improved for students using the organization’s digital learning platform, a-ACADEMY. Students who benefited the most were those from slum areas.20 During a group discussion in Nairobi’s Mathare slum, some of the students (aged 11 to 12) told The State of the World’s Children 2017 report team that they felt more motivated to attend school and learn and, with the integration of digital tools such as a laptop in the classroom, saw a rise in their test scores.21
But it is important to note that many similar programmes have failed to show improved learning. These include the Computers in Education programme in Colombia, which a 2009 World Bank study said had “little impact on students’ math and Spanish test scores … hours of study, perceptions of school, and relationships with their peers.”22 Similarly, a 2013 experimental study of 1,123 students in Years 6–12 in California found that, while distribution of computers had a great effect on computer ownership and total hours of computer use, there was no evidence that this affected education outcomes such as grades, standardized test scores, credits earned, attendance and disciplinary action.23 The reasons why some programmes succeed while others fail is not always apparent – and more research and
analysis is needed to help bring the best of these programmes to scale, while learning from some of the ‘fails’.
How can the performance of ICTs in education be improved?
Understanding the impact of ICTs on student learning is a challenge, in part because it is not always possible to determine precisely what’s driving any change in student learning outcomes. Is it just the technology or are other factors at work?
For example, several key studies24 showing strong learning outcomes had very capable implementing partners. Paradoxically, because it is difficult to conduct experimental trials without such a partner, the possibility that a capable organization itself is a prerequisite for an effective digital learning programme is difficult to see in field experiments.25
Nevertheless, some factors are clearly needed if ICTs are to work effectively in education. At the top of the list are well-trained teachers and appropriate teaching practices. The importance of these is underscored in a number of international studies. The Organisation for Economic Co-operation and Development (OECD), which has studied the impact of ICTs on learning outcomes in more than 60 countries through its Programme for International Student Assessment (PISA), suggests that without strong pedagogy, there is no benefit to having technology in the classroom.26 Similarly, the World Bank’s World Development Report 2018: Learning to realize education’s promise also stresses that ICTs have the potential to increase learning, but only if they enhance the teacher-learner relationship.27
A second point is the need to understand students’ starting points. Evidence shows that well-prepared students under good adult guidance may be able to take advantage of technology (or at least not

UNICEF – THE STATE OF THE WORLD’S CHILDREN 201722
be harmed by its distractions), but poorly prepared students without enough adult guidance are often distracted by technology.28 Indeed, the risk that technology can distract children in the classroom, especially weaker students, is clear.
For example, a study carried out in 91 schools in England among children aged 11–16 found that banning mobile phones had a positive effect on their standardized test scores. What’s more, the effect was strongest for low-performing students and absent for the best-performing, which suggests that technology in some cases can have a negative effect on low-achieving students.29 The authors of this study conclude that restricting mobile phone use in schools could be a low-cost policy to reduce educational inequalities.
What about the future of ICTs in education? A number of technologies offer promising fields of exploration, including laptop content aligned with the curriculum, photo-based monitoring of teachers30 and, in particular, computer-assisted personalized learning,31 which is attracting growing interest in international development circles.
This sort of adaptive-learning approach, which is built around the idea of ‘teaching at the right level’,32 is not new, but ICTs have increased their potential to boost learning, especially for children attending schools with limited resources. Instead of using the child’s age or year as the trigger for what he or she should be taught next, ICT-based adaptive learning designs a course of instruction based on the child’s actual abilities – as monitored by a digital interface that enables students to follow their own path through a subject based on their current level of understanding and at a pace that feels comfortable and manageable.
Given advances in artificial intelligence and neuroscience, further testing and experimentation may help unlock the potential of ICTs across a range of learning settings, particularly in under-resourced
low-income communities. But to have a positive impact, technology in education should be focused on precise learning objectives.33 In other words, discussion must begin with the educational goal – not the technology.
Giving children a voice in their communities
This generation of young people grew up in the era of digital activism – and digital ‘slacktivism’. Children and adolescents are using social media and digital technology to amplify their voices and seek solutions to problems affecting their communities that affect them.
Organized efforts to encourage, cultivate and channel children’s participation using digital tools are varied and growing in scope. For example, since 2009, a community-mapping initiative called Map Kibera – which uses digital open mapping techniques and GPS devices, along with digital information sharing – has helped young people in a Nairobi slum identify hazards in their communities and advocate for solutions to specific concerns.34 This information, in turn, is being shared with and used by policymakers, helping drive real change.
U-Report, a free tool for community participation, is also playing an important role in providing young people with a new channel for participation. What started out as a local innovation to help young Ugandans engage on issues that affect their lives and futures has become a global network of nearly 4 million users who use it to voice their opinions, connect to their leaders and help change the conditions in their communities. Information from U-Reporters can be instantly mapped and analysed, yielding vital information and real-time insights about how young people see their world and what they think is most important. In turn, these aggregated views are used
01 DIGITAL OPPORTUNITY: THE PROMISE OF CONNECTIVITY 23
Pupils at the Hanka Education Centre in Mathare, Nairobi, Kenya, say they feel more motivated to attend school since the arrival of laptops in the classroom. © UNICEF/2017/Little

UNICEF – THE STATE OF THE WORLD’S CHILDREN 201724In Port-au-Prince, Haiti, young people use mobile phones to make geotagged photographs of abandoned cars, as part of a project to map safe and unsafe zones in the city. © UNICEF/UNI128320/Dormino

01 DIGITAL OPPORTUNITY: THE PROMISE OF CONNECTIVITY 25
by development partners in their advocacy with governments – and even shared directly with elected leaders.
Another such project is the Climate Change Digital Map, which involves children and young people from over 18 countries. This project empowers children and young people to look at what is happening in their communities, capture it on a digital map and use the results for advocacy. At the United Nations Framework Convention on Climate Change Conference of the Parties in 2015 and 2016, selected climate mappers spoke about climate change and its impact on children drawing on their experience and knowledge gained from the project.
Social media activism
For young people – digital natives – using social media for social activism is practically second nature. From the Ice Bucket Challenge in 2014 – where a stunt by young people trying to raise money for a terminally ill friend unleashed a global movement that raised millions of dollars for disease research – to pre-teens using the internet to launch local campaigns around personal concerns, digital technology has enabled a new age of digital participation.
The impact of social media has also been felt in political issues. In Brazil in 2013, for example, thousands of mostly young people used social media platforms to coordinate a protest against corruption and demand better public policies. One of the young people to give a face to this nationwide phenomenon was 17-year-old Jimmy Lima, who used social media to mobilize approximately 15,000 protesters in Brasilia alone.35
Children and young people are also making their voices heard through blogging. Perhaps the most well-known example is the story of Malala Yousafzai. Using a pseudonym, Malala began blogging for the BBC about girls’ right to education in
Pakistan in 2009. Only 12, she used the reach of cyberspace to spotlight education under the restrictive Taliban regime. Once her identity was known, Malala was subject to a death threat issued by the Taliban and, in 2012, was shot and seriously wounded. Her recovery and fearless continuation of her advocacy for girls’ education captured the attention of the world – and won her the 2014 Nobel Peace Prize.
In the Democratic Republic of the Congo, the digital platform Ponabana is offering children the chance to speak and be heard about what’s happening in their communities. Through the active participation of child bloggers and reporters, Ponabana is helping to create awareness and advocate for children’s rights among local decision-makers.
Challenges to participation
Digital connectivity has opened exciting opportunities for children’s participation, but some significant obstacles to such participation cannot be ignored.
One is the political realities facing web users in much of the world. Malala and many others have brought attention to child rights violations by speaking out online. But their words have also created tensions, both in their communities and with their governments. Since 2011, the influence of social media on activism has been a major concern among governments. According to Freedom House, internet freedom has declined in recent years, as measured by the number of governments that have targeted social media and communication apps (WhatsApp and Telegram, for example) to stop information flows, especially during political protests. Two thirds of all internet users – adults and children – live in countries where criticism of the government, military or ruling family is censored.36
A second obstacle is that children often don’t appreciate the possibilities of using
2/3 of all internet users live in countries where criticism of the government, military or ruling family is censored.
“

What do adolescents think about … using ICTs to drive social change?
Participants in the State of the World’s Children 2017 workshops* were confident that digital technologies would help them meet the challenges facing their communities and the world.
“When I grow up,” they said … “ I will use technology to spread advocacy on climate change and ending violence, and to help others in need.” GIRL, 15, FIJI
“ I will use technology to research ways to develop Third World countries and implement changes that would decrease poverty levels in the world.” GIRL, 15, KIRIBATI
“ I will use technology to advocate to people about health issues.” GIRL, 15, NIGERIA
“ I will use technology to change the world. Use it to design better stuff, create new things, make education more interesting through technology.” BOY, 17, FIJI
They viewed digital technologies as powerful tools for raising their own awareness …“ [To] inform myself and other people about what’s happening in my country and in other places of the world.” GIRL, 15, PARAGUAY
sharing knowledge and awareness in society …“ [We would] make a survey, find out the organizations that work on it and spread awareness … online.”
GROUP RESPONSE, BANGLADESH
“ [We would raise] online awareness: advertise youth programmes, produce educational clips, participate in online forums on ways of addressing the issues.” GROUP RESPONSE, SOLOMON ISLANDS
building support for social change …“ [Digital technologies can change] the attitude of society to the people in need.” GROUP RESPONSE, REPUBLIC OF MOLDOVA
“ [They can help us] to abandon the old ways of thinking and break stereotypes.” GROUP RESPONSE, REPUBLIC OF KOREA
and addressing specific social challenges, such as reducing violence and social inequalities. “ Child abuse needs to be stopped and children’s rights respected by using social media sites … to disseminate information and spread our message.” GROUP RESPONSE, SENEGAL
“ Children with special needs can’t study on equal terms with other children. It is important to introduce inclusiveness in schools of the country. [We can design] online actions/info campaigns.” GROUP RESPONSE, BELARUS
But their ideas for using ICTs to promote social change were limited – for example, only a few highlighted how ICTs could be used to create and share content.“ We can make videos, groups to [make] people aware of child labour through internet.” GIRL, 15, BANGLADESH
“ [To help solve delinquency] we can create a platform where young people can know and show their skills and talents so they can have more opportunities which they can invest their time.” GROUP RESPONSE, GUATEMALA

That said, they had other ideas about how technology could help address social challenges. A key theme for many was the potential to put people in contact with services … “ Developing an app for drug addicts so that they can avail themselves of counselling services.” GROUP RESPONSE, BHUTAN
“ I want to use social media to spread information on disabled children and link them to organizations who work [with] disabled children.” GIRL, 15, BANGLADESH
while others saw the potential of ICTs to give a voice to marginalized or vulnerable groups.“ Create discussion forums for girls to express themselves.” GROUP RESPONSE, SENEGAL
Participants believed digital technologies could amplify their voice in debates and decision-making processes on issues that affect their lives …“ Do a campaign to have impact, and to make us understand that we have voices and votes.” GROUP RESPONSE, GUATEMALA
“ [They help] communication with society, with the representatives of the community, with influential people.” GROUP RESPONSE, BELARUS
but there were barriers that could prevent this from happening, including limited online access and, especially, low levels of digital literacy. They had views on how this could be addressed.“ We should create a technological centre, sort
of cyber centre, open to everyone and located in every province to give internet access to all of those who do not currently have access with staff ready to help everyone who comes in.” GROUP RESPONSE, BURUNDI
They saw schools as having a key role to play in facilitating their engagement and participation in their communities … “ Schools can offer lectures about issues that are covered by the press and encourage the students to be interested in debating and be brave to show their ideals.” GIRL, 19, BRAZIL
and in helping them deploy digital technologies to seek social change.“ I think school is the first and safest place to create a social platform … it prepares us to have better relationships with others, including communications skills. Maybe we can have more smart access to technology devices to facilitate our involvement and engagement in the community.” GIRL, 19, TUNISIA
IN SUMMARY A key goal of digital literacy is to help people understand the opportunities inherent in digital technologies, including their power to help meet the world’s challenges. But without adequate online access, children and adolescents in many places find it hard to understand and grasp these opportunities.
* Participants’ responses have been shortened and edited for clarity where necessary.
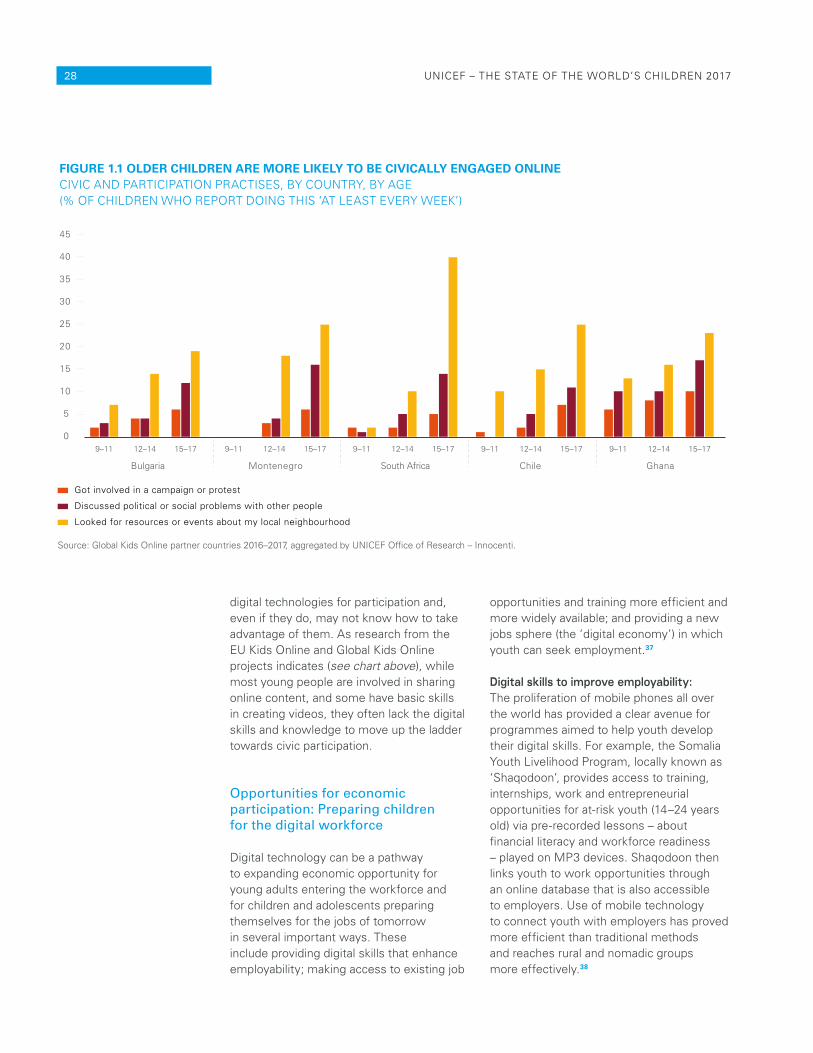
UNICEF – THE STATE OF THE WORLD’S CHILDREN 201728
digital technologies for participation and, even if they do, may not know how to take advantage of them. As research from the EU Kids Online and Global Kids Online projects indicates (see chart above), while most young people are involved in sharing online content, and some have basic skills in creating videos, they often lack the digital skills and knowledge to move up the ladder towards civic participation.
Opportunities for economic participation: Preparing children for the digital workforce
Digital technology can be a pathway to expanding economic opportunity for young adults entering the workforce and for children and adolescents preparing themselves for the jobs of tomorrow in several important ways. These include providing digital skills that enhance employability; making access to existing job
opportunities and training more efficient and more widely available; and providing a new jobs sphere (the ‘digital economy’) in which youth can seek employment.37
Digital skills to improve employability: The proliferation of mobile phones all over the world has provided a clear avenue for programmes aimed to help youth develop their digital skills. For example, the Somalia Youth Livelihood Program, locally known as ‘Shaqodoon’, provides access to training, internships, work and entrepreneurial opportunities for at-risk youth (14–24 years old) via pre-recorded lessons – about financial literacy and workforce readiness – played on MP3 devices. Shaqodoon then links youth to work opportunities through an online database that is also accessible to employers. Use of mobile technology to connect youth with employers has proved more efficient than traditional methods and reaches rural and nomadic groups more effectively.38
FIGURE 1.1 OLDER CHILDREN ARE MORE LIKELY TO BE CIVICALLY ENGAGED ONLINE CIVIC AND PARTICIPATION PRACTISES, BY COUNTRY, BY AGE (% OF CHILDREN WHO REPORT DOING THIS ‘AT LEAST EVERY WEEK’)
0
5
10
15
20
25
30
35
40
45
Bulgaria Montenegro South Africa Chile Ghana
9–11 12–14 15–17
Source: Global Kids Online partner countries 2016–2017, aggregated by UNICEF Office of Research – Innocenti.
Got involved in a campaign or protest
Discussed political or social problems with other people
Looked for resources or events about my local neighbourhood
9–11 12–14 15–17 9–11 12–14 15–17 9–11 12–14 15–17 9–11 12–14 15–17

01 DIGITAL OPPORTUNITY: THE PROMISE OF CONNECTIVITY 29
Accessing job opportunities: Young people are also increasingly using mobile technology to look for employment; mobile job-matching services are growing, with more countries covered, more employers posting on them, and more young people searching through them.39 It will be important to understand this dynamic to help prepare youth to enter the workforce of the future, and shape the workforce of the future so that it can best serve a youth population that is growing in many places (see box on Connecting Africa’s youth, Chapter 2).
Networking is a common way to connect job seekers and employers, and it seems
a natural fit for a generation that is heavily connected via social media. As of October 2017, the free digital platform Oportunidades para Internacionalistas connects more than 34,000 young people in Mexico.40 Youth can market their skills online and reach potential employers efficiently.
‘Digital economy’ jobs: The digital economy has been criticized for eliminating some jobs, but it has also created new ones for which digitally literate young people may be particularly well suited. These include ‘microwork’, a sort of digital assembly line of discrete digital tasks that contribute towards a larger project, and
Skills for the twenty-first century
Today’s children will enter a labour market that, for many, will be profoundly different from the one in which their parents worked. This transformation – often dubbed the Fourth Industrial Revolution – is built on a raft of developments in areas like machine learning, robotics, nanotechnology and biotechnology.45 Once largely disconnected, these technologies are becoming increasingly integrated and, as a result, are driving economic change at a pace without historical precedent.46
Complicating this shift is that some of the poorest countries have yet to experience even the equivalent of the rapid industrialization wrought by the Second Industrial Revolution. But they, too, will be affected. Some will be able to take advantage of new technologies, allowing at least parts of their economies to leapfrog into the future; but others may suffer, as automation eats into their competitive advantage of low-cost, low-skilled labour.47
Are children acquiring the skills to thrive in the Fourth Industrial Revolution? There are reasons to be concerned. According to UNESCO, 250 million children worldwide are basically illiterate and innumerate, while 200 million young people will leave school lacking the skills they need to
thrive.48 And even for those who are acquiring basic reading and numeracy skills, the workplaces of the future increasingly require digital skills – and digital literacy.
Definitions vary, but, according to the World Economic Forum, these skills can be divided into three broad categories: Foundational Literacies, including traditional literacy and numeracy and also – among others – ICT, scientific and cultural literacies; Competencies, including critical thinking, creativity, communication and collaboration; and Character Qualities, including curiosity, adaptability and leadership.49 The OECD also emphasizes that non-cognitive skills, such as communication, creativity, collaboration and empathy, will continue to determine career success.50
While acquiring a broader range of skills is clearly an advantage for any individual, there is much debate over whether even highly skilled workers – such as radiographers and economists – can expect to enjoy stable job prospects in the twenty-first century.51 On the other hand, while previous industrial revolutions did indeed destroy jobs, over time, more jobs were created than were lost.52 Whether that pattern will hold true in the Fourth Industrial Revolution remains to be seen.

UNICEF – THE STATE OF THE WORLD’S CHILDREN 201730
work as an ‘infomediary’, or helping less digitally literate consumers use and access digital information.41 The ITU also points to crowdsourcing (distribution of mostly skilled tasks by an online aggregator) as well as app and game development as new types of employment available in the digital age.42
While ICTs offer promising avenues for preparing young people to enter the workforce, there are still barriers that prevent them from realizing their full potential. In many parts of the world, for example, girls and women still face significant cultural barriers in digital access and skill development. Cost remains an obstacle to access for many children and young people, while the quality of educational instruction to build children’s digital skills varies widely.43 More broadly, traditional development challenges – among them improving education, access to health care, promoting good governance and improving the business climate – are “preventing the digital revolution from fulfilling its transformative potential.”44
Opportunities for social inclusion
Digital tools and connectivity can be game changers for the most disadvantaged children, especially children on the move, children living with disabilities and children who experience exclusion and marginalization because of their ethnicity or sexual identity.
Children on the move
Around the world today, nearly 50 million children are on the move – 28 million of them driven from their homes by conflict and millions more migrating to escape crushing poverty and the growing impact of climate change.53 These children increasingly rely on digital technology – especially mobile connectivity – throughout their journeys.
For example, in the Za’atari refugee camp for Syrian refugees in Jordan, 88 per cent of youth surveyed in 2015 owned a mobile phone and more than half used the internet either once or multiple times per day.54
Digital technology is especially important for children who are traveling unaccompanied by their families or caring adults.55
Plan International found that children and youth (up to 24 years) migrating without parents or other guardians used ICTs to plan and prepare for migration; facilitate the actual journey; stay in touch with their families; connect to support and work opportunities; and cope with integration and sometimes forced repatriation. Some of them also used social platforms such as Facebook to connect with people in other countries who were going through similar experiences, to share information and provide support.56
Despite this great promise for children on the move, most have low to no access. Overall, however, one third of refugee households have a basic phone; a little more than a third have an internet-capable phone; and just under a third have no phone. Even in areas with minimal connectivity, refugees have less than others: In rural areas, refugees are twice as likely as the rural population in general to have no 2G or 3G network available to them.57
Recognizing the growing role of digital technology in humanitarian situations, the United Nations High Commissioner for Refugees has called for all refugees and the communities that host them to be connected to the internet so that they can use these technologies to improve their lives.
The agency’s Innovation Learn Lab has developed projects using various digital platforms with an eye to assessing what works, what doesn’t and what can be brought to scale. In one Learn Lab example, children in the network of refugee camps in Dadaab, Kenya – the largest and most
In Danamadja, we are in a closed box. Without internet, the outside world moves forward but we are lagging behind.
“

01 DIGITAL OPPORTUNITY: THE PROMISE OF CONNECTIVITY 31
Staying connected far from home
In Chad, the refugee camp of Danamadja stands in the midst of a vast forest. Here, for refugees from conflict in the Central African Republic, just across the border, staying connected represents a challenge. “Most of the young people who want to use the internet have to walk long distances to connect to the network,” says Mahamat Djida, 25, who owns a phone-charging booth. “Service is really weak and unstable but we do not have many options.”
“My parents stayed behind in Bangui. The only way for me to stay in touch with them is through WhatsApp and Messenger,” explains Fatima, “I speak to them two to three times a week but it depends on what I can afford.”
Beyond helping to stay in touch with families and friends, mobile phones and the internet have also
offered young people opportunities to cope with life in the camp. Adam Souleymane, a 16-year-old refugee, is very proud of his new smartphone. “I bought a phone and now I use the internet to do research, especially in biology. There is no library in the camp,” he says.
“I do not have a phone and I miss my Facebook” adds his friend Ali Amine, 18 years old, while playing with Adam’s phone. “In Danamadja, we are in a closed box. Without internet, the outside world moves forward but we are lagging behind.”
Being born on the wrong side of the digital divide has many implications for these children. In that context, it is vital to advocate for improved access to digital technologies and support for youth seeking to use them to solve the issues that affect their lives.
Forced to flee her home in Nigeria, Khadija, 15, now lives in the Dar es Salaam refugee camp in Chad. She hopes one day to work in IT and says the internet is “the best way to learn and to share knowledge.” © UNICEF/UN028860/Tremeau

UNICEF – THE STATE OF THE WORLD’S CHILDREN 201732
protracted refugee agglomeration in the world – are benefiting from 13 Instant Network Schools. This type of digital ‘school in a box’ features tablet computers, internet access and educational content developed jointly with the local community. Initial reports indicate that the effort has increased teacher and student motivation.58
Excluded and marginalized children
Digital tools and connectivity have also helped minority groups feel more integrated in their communities59 and opened new windows for expression, networking, political activism and social inclusion.
For indigenous people, such as the Aboriginal and Torres Strait Islander populations in Australia, social media use provides a sense of power and control over their identities and communities.60
Online resources and environments have also been important sources of information and socialization for lesbian, gay, bisexual and transgender (LGBT) youth, who use digital platforms to learn more about their community and find a sense of belonging.61 According to a 2013 study by GLSEN, an organization dedicated to ending discrimination based on gender identity in schools, LGBT adolescents usually do not receive LGBT-relevant health information in schools or at home, and thus turn to online resources to find information on topics of health and sexuality.62 Consequently, the digital age can help empower and bring together different groups, breaking cultural barriers and enhancing social cohesion.
Child helplines have historically helped children needing support find someone to talk to. Each year, millions of children reach out through helpline services; in 2015, such helplines received around 20 million contacts.63 From Egypt to Sweden, digital technologies are transforming this sector of child aid by
introducing new communication tools for children whose preferred communication method may be by text/SMS messaging, email, chat rooms, online bulletin boards and other ways that have expanded the capacity to reach children in need.64
Children living with disabilities
Many of the world’s children with disabilities are isolated and struggle with stigma, discrimination and a social environment that does not accommodate their needs or support realization of their rights. For example, they are often subject to more adult interventions than other children, which can limit their agency. Digital communication offers them a way to express themselves, make their own choices and participate in decisions affecting them. It also has the potential to facilitate communication with friends and reduce feelings of isolation.65 Digital technologies can also provide access to education, skills training and employment.
Mobile applications can help children and young people with disabilities be more independent. They can be used for instant communication and activities that address unique sensory, physical and cognitive needs: iSign, for example, facilitates communication between deaf students, teachers and peers who do not know sign language.
Yuudee is an application that facilitates communication for children with autism, who can press an icon to ‘speak’ an idea or an answer or express a need. This app can also help teachers and parents teach children with autism communication and cognitive skills. Other digital platforms help children with special needs take tests on the same subject matter as their peers. The DAISY consortium of talking book libraries, which now has a global reach, makes text accessible to children who, because of visual impairment or for some other reason, cannot read print.
Children with autism can press an icon to ‘speak’ an idea or express a need.
“

33
IVAN BAKAIDOV, 18, RUSSIAN FEDERATION
Online, my wheelchair is invisible
Nowadays digital technologies are being developed with the speed of optical fibre, changing the lives of millions of people in this world. But especially for children with disabilities, modern technologies play a central role.
I am 18 years old and I have cerebral palsy, a physical disability that affects my movement and posture, which is why I am using a wheelchair. The day I received an electronic notepad connected to the internet, my life literally changed.
The notepad provides me with freedom of communication. Channels of communication have changed drastically over the past 300 years: from physical mail brought to you by a postman on a horse to real-time digital messengers. This progress has highly benefited persons with disabilities, as now communication requires less mobility. Today, children and young people with disabilities can communicate with family members and peers online. I have multiple friends online, from various parts of the world. If we were to meet in person, they would not understand a word that I say, as I have a speech impediment. However, due to the help of technology, I can seamlessly communicate with them. Some of my virtual friends don’t even know that I have a disability.
In a similar way I can communicate with teachers. Education is another area in which modern technology is invaluable for children with disabilities. The opportunities for self-education are unlimited. Even though I am a student, I can’t physically access my school. However, with the help of the internet and phones I am attending the classes and following the teachers’ instructions, regardless of my physical condition. There are also online platforms that allow young people to obtain work diplomas without ever having to leave their wheelchairs.
This leads me to another field where digital technologies create more opportunities: employment. In the
modern economy, where mental labour is more valued than physical labour, someone with a physical disability can find a job much more easily than a hundred years ago.
Today’s employer doesn’t care whether his programmer, journalist or SEO manager uses a wheelchair or not, as long as the employee does the work. Particularly in the world of coding, persons with disabilities might even have an advantage sometimes. For example, nowadays specialists in site accessibility are in high demand in Russia. In my case, I just recently consulted and supported a group of graphic designers in St. Petersburg on that issue.
The increased use of digital technologies has inspired me to develop my own programmes for alternative communication, helping people who are mute, have speech impediments or severe physical disabilities. For example, DisType is a software I developed that helped me to speak as an advocate at the World Humanitarian Summit, which took place in Istanbul in 2016.
DisQwerty allows searching for a word or expression with only one button, which can be tremendously helpful. Another programme I developed, DisTalk, allows someone to speak by using only images. All the programmes are free of charge and anyone can access them – you can learn more about the projects at <http://en.aacidov.ru>.
As you can see well from my example, digital technologies help to remove barriers and open opportunities for children and young people with disabilities.
Ivan Bakaidov, 18, is a young advocate from the Russian Federation who has cerebral palsy and cleft palate. Having had a speech impairment since childhood, Ivan wants to help other children and young people with disabilities solve communication problems and fulfil their right to be included.
01 digital oPPortunity: the Promise oF connectivity

UNICEF – THE STATE OF THE WORLD’S CHILDREN 201734
Access to such services remains limited, so for most children with disabilities, especially those living in underserved or otherwise marginalized contexts, this type of assistive application remains out of reach.
The barriers preventing access for children with disabilities include the fact that they live in rural areas without access to the technology; they can’t afford it; their parents are not aware of it; or appropriate devices for their particular needs are not yet available. Surveys from 2006 of people living with disabilities in developed countries have found that they are half as likely to have a computer at home as someone without a disability, even less likely to have internet access – and even less likely to go online when they do.66 While these surveys did not look specifically at children, they point to the need to understand the barriers to access. When they do access the internet, children with disabilities, in particular those with learning disabilities or developmental delays, may face specific risks (see Chapter 3).
Pointing the way forward
There is no question that ICTs have already opened avenues for children to develop, learn, participate and improve themselves and their situation. As the next chapter shows, these benefits are far from equally shared – and the benefits and opportunities emerging for children do not necessarily look the same in all parts of the world. Countries are still in different phases of technological development and internet penetration, and many have significant social, economic and cultural barriers to connectivity. Most of the research is still concentrated in high-income countries, while a lot still needs to be done in other parts of the world. In addition, listening to children themselves is paramount when approaching issues that deal with their rights.67
But assessing the extent to which these opportunities can expand, and the actual benefits they bring for children, is challenging for several reasons. A key one is time: While they are indeed exciting and inspiring, many of the examples cited in this report and elsewhere are still too new to evaluate for impact. In such a fast-moving area, research has a hard time keeping up with what is happening right now. In addition, and except for formal education, rigorous studies that quantify or evaluate the gains stemming from children seizing these opportunities are rare. Even less documented and researched are the digital experiences of disadvantaged children, especially those in low- and middle-income countries.68
This underscores the need for more research and evaluation to better understand how children are availing themselves of opportunities in the digital age and, especially, to understand why some children benefit more than others.
To transform opportunities into real benefits for children in a digital age, especially for learning, participation and social inclusion, it is critical to understand the context of children’s digital experiences and provide adequate guidance and support, especially for children on the move, excluded children and those living with disabilities.
Technology is still at the service of human capacities and human constraints. In education, these would include student motivation, teacher capability and sound pedagogy. Evidence suggests that technology has benefits where positive human forces for learning are already in place. A digital tool cannot fix dysfunctional bureaucracies or decrease educational inequality where these are not being addressed by the larger society.
To truly benefit children, especially the most disadvantaged, the design process for digital products must begin by

01 DIGITAL OPPORTUNITY: THE PROMISE OF CONNECTIVITY 35
considering children’s specific needs – using the principles of Universal Design as a guiding reference, for example.
Connected children see digital connectivity as an overwhelmingly positive part of their lives.69 Their enthusiasm, fascination and motivation to connect is a reflection of the clear power and
potential these tools have to offer – not just to improve their everyday lives but also to expand their chances for a better future. This power and potential needs to be fully supported, in particular by bringing connectivity to as many children as possible and giving them the skills to maximize the benefits of life in the digital world.
Digital technology could be a game changer for children living in some of the lowest-income countries, such as Bangladesh. © UNICEF/UNI157753/Mawa

UNICEF – THE STATE OF THE WORLD’S CHILDREN 2017
PERSPECTIVE
Realizing Limitless Possibilities: Technology empowers people with disabilities
Kartik Sawhney
It was 2001 when I started out at a mainstream primary school in India. Having attended a special school for the blind until then, I found the new school challenging and daunting. I had no idea how to interact with my peers and teachers, or simply how to adapt to the new environment. I completed my homework in Braille, and every day my mother patiently transcribed it into print so that my teachers could understand it. None of them had expertise in teaching blind students, yet their support and encouragement, along with that of my parents, helped me to excel and have a great experience.
The next year, my life changed completely. I was exposed to a computer – an amazing computer that could speak to me. I would spend the entire day playing with it, only to be even more amazed with every new feature I found. My introduction to the Web and the prospect of getting whatever information I needed by pressing the Enter key was unbelievable and empowering.
As I grew fond of this new toy, I wanted to understand it more deeply. How could my computer in India get information from a computer at Google headquarters in the United States? How could I watch TV shows on my computer? How did it know what websites I’d be interested in without me necessarily typing them? These questions encouraged me to start reading textbooks on computer science and computer programming in the sixth grade, which allowed me to start developing an application that could help me be more efficient. While a lot of these were simple apps that helped me apply my knowledge, others were born of my frustration at not being able to have the same learning experience as my peers.
In the 11th grade, for example, I could not understand graphs and curves in my calculus class. Despite several attempts to visualize these based on their verbal descriptions, I was unable to picture them well. I almost gave up, until I was struck by an idea that
combined my passion for music and tech. Thus was born Audio Graph Describer, software that converts a graph into its tonal representation. Visualizing a graph through variation in frequencies not only allowed me to understand the complicated graphs that once distressed me, but helped rekindle my interest in math and science. This is the power of technology!
As I continued with school, my interest in tech increased. I knew I wanted to study computer science in college in order to develop technology that can empower people to realize their potential. Once there, I met others who shared a similar vision. In the United States, I was pleasantly surprised to meet several developers with disabilities, since there are few in India. With firsthand experience about everyday challenges, I found them well equipped to brainstorm, conceptualize and implement transformative ideas to enhance accessibility for the disabled community.
I have been fortunate to try out several of these ideas – from a pair of augmented reality glasses that allow a volunteer to describe things a blind user sees in real time, to an app that uses computer vision to help with object and text recognition and scene descriptions; from a wheelchair that uses eye gaze to move around, to tremendous advances in real-time automated captioning.
As a young person passionate about technology and disability advocacy, these technologies excite me more than ever, and I can’t wait for other revolutionary technologies in the near future that will reduce the word ‘disability’ to a mere nuisance.
While recent and upcoming technology has been very helpful, there are still concerns that need our attention. Most people with disabilities around the world are consumers of this technology, but not innovators. As is evident from several successful engineers with disabilities, disability is no barrier to

37 01 PersPective
Digital technology is creating opportunities for children with disabilities, such as this blind boy in Kuala Lumpur, Malaysia, who uses text-to-speech software to take part in classes. © UNICEF/UNI182589/Pirozzi)
technical excellence. Thus, there is a dire need to encourage and, more importantly, provide necessary support and resources to help people with disabilities consider technology as a potential career avenue.
Similarly, several applications and websites fail to comply with accessibility standards, compelling more than 1 billion people with disabilities around the world to miss out. This is due not just to lack of accessibility training, but also disability awareness. It thus
becomes important to intensify our efforts in this space. I look forward to all of us working in our own little ways to truly realize the limitless possibilities of technology.
Kartik Sawhney is pursuing a Master of Science in computer science at Stanford University with a focus on artificial intelligence. His technical interests lie in machine learning, natural language processing, accessibility and assistive technologies.
Disability is no barrier to technical excellence.
“

38
It’s increasingly recognized that children need to be better prepared for lives suffused in digital technologies. As one mother in Za’atari refugee camp in Jordan said, “In my time, someone who was illiterate could not read and write. Now, someone who is illiterate does not know how to use the internet. I don’t want our children to be illiterate. It’s really important. We want a better future for our kids.”70
But what does it mean to be ‘literate’ in the digital era? More broadly, what skills and attributes do children need to avoid online risks and maximize opportunities? These questions have produced a host of responses from parents, teachers, policymakers and academics, most of which can be grouped into two broad concepts – ‘digital (and media) literacy’ and ‘digital citizenship’. Definitions of both these concepts vary and often overlap, which may affect the design of educational programmes for children – for example, some skills or attributes may be overemphasized at the expense of others.
So how might these concepts be more clearly defined?
Digital literacy: Work by Global Kids Online, UNESCO and others strongly emphasizes four sets of abilities. Children should be able to:
1. Access and operate in digital environments safely and effectively;
2. Critically evaluate information;
3. Communicate safely, responsibly and effectively through digital technology; and
4. Create digital content.
The value of digital literacy is widely recognized. During the 2014 Day of General Discussion on digital media and children’s rights, the United Nations Committee on the Rights of the Child tasked Member States to include digital literacy in their school curricula.71
Developing children’s digital and media literacy from an early age has also been identified as a crucial prerequisite for an effective democratic society in the twenty-first century.
Digital citizenship: Earlier definitions of digital citizenship were often quite broad, but more recent research supports a narrower definition for several reasons, including to improve the focus of teaching on the subject and to ensure that learning goals are well defined.72 Two principles are put forward as being at the core of digital citizenship, namely:
1. Respectful and tolerant behaviour towards others; and
2. Online civic engagement.
UNICEF – THE STATE OF THE WORLD’S CHILDREN 2017
Based on research contributions from Petar Kanchev, Expert of the Safer Internet programme at the Applied Research and Communications Fund in Bulgaria; Sanjay Asthana, School of Journalism, Middle Tennessee State University; and The State of the World’s Children report team.
Even if the definitions are sometimes fuzzy, the overall goal of teaching digital literacy and digital citizenship is clear: To equip children with a full portfolio of skills and knowledge that allows them to avoid online risks, maximize online opportunities and exercise their full rights in the digital world. This last point is significant: Findings from Global Kids Online suggest that while most young people share online content and many create videos, they often lack the required digital skills and knowledge to move up the ‘ladder of opportunities’ towards civic participation – a significant area of online opportunity.73
What do children need to know for the digitial world?

39 01 DIGITAL OPPORTUNITY: SPECIAL SECTION
SPECIAL SECTION: How ICTs are supporting humanitarian action
For the past two years, drought has stricken much of Somalia, laying waste to the land and forcing families to leave their homes in the countryside in the hope of finding help in towns and cities. In this ancient landscape, some of the assistance is coming in the most modern form – digital cash straight to families’ phones. The help is a lifesaver for parents and children: As one father told an Oxfam official, “We can decide [how to spend the money] and buy what food and how much water we need or whether to invest in hay for a lamb or education for a child.”
Digital cash is just one example of how ICTs are being used increasingly to support children and their families living through humanitarian emergencies and other challenging situations. Their impact can be seen in many areas: For example, by improving communications, they’re allowing humanitarian workers to better coordinate responses and keep affected populations informed during crises (see box: Staying connected far from home, page 31).
Big data in health emergencies
In health emergencies, digital technologies are being used to save millions of lives. During disease outbreaks, for example, mobile network platforms can provide infected individuals and affected households with life-saving information, essential commodities and financial support.74 In Uganda, for example, the national Ebola task force operationalized an mHealth platform, mTrac, that enables real-time alerts and surveillance via SMS from communities and health workers. A similar tool, mHero, was used during the Ebola outbreak in Liberia, supporting updates to the national health worker registry, strengthening communications and providing real-time data on critical health services.75
The use of ‘big data’ to help manage health emergencies – as well as other humanitarian situations – is attracting growing interest. Big data – large data sets that can be used to analyse trends – from mobile phones, for example, can
provide vital information during disease outbreaks, helping countries to respond more effectively or even prevent outbreaks from becoming epidemics.
During the dengue outbreak in Pakistan in 2013, anonymized call data from almost 40 million Telenor Pakistan subscribers were used to predict the spread and timing of the disease, contributing to better national response mechanisms.76
During the Zika outbreak, UNICEF and Amadeus – which provides technical support to the global travel industry – partnered and analysed global travel data to better understand patterns of the spread of Zika and potential outbreak zones.77
Similarly, a pilot UNICEF initiative, Magic Box, is being developed to work with real-time information and support life-saving humanitarian responses in emergency situations.78 Magic Box collects real-time anonymized data, such as from mobile phone usage, to better understand human activity. An analysis of the data is then used
Mobile phone data are helping countries respond more effectively and prevent outbreaks altogether.
“

UNICEF – THE STATE OF THE WORLD’S CHILDREN 201740
ICTs are playing an increasing role during humanitarian crises, such as the Ebola outbreak in Liberia in 2014. © UNICEF/UNI176804/Ryeng
to improve the management of humanitarian disasters, providing alarms and supporting critical response and recovery.
Education, emergencies and ICTs
Around the world today, an estimated 27 million children living in conflict zones are out of school.79 The absence of resources, such as books, adequate classrooms and trained teachers, is the main barrier to children’s education in emergencies.
Digital technologies can help fill these gaps, by helping to create opportunities for distance learning for children and teachers, improving coordination of educational activities during emergencies, disseminating educational information and supporting the development and dissemination of digital curricula.
ICTs can also help governments and local authorities to better manage education systems in emergencies and chronic crises. For example, in the Central African Republic, where violence and unrest have forced many children out of school, the government is using EduTrac, a mobile-phone-based
data-collection system, to collect basic information including which schools are functioning and how many students are attending school, even in the most hard-to-reach areas.
Biometrics, refugees and social protection
One striking application of ICTs in recent humanitarian situations has been the use of biometrics to register the identity of refugees, which is then used to provide them with essential services. Biometrics uses an individual’s physical characteristics, such as the face, iris or fingerprint, to create a unique identity record. In humanitarian work, iris scanning has already been used to repatriate Afghan refugees and to provide cash transfers to Syrian refugees in Jordan.80
Indeed, cash transfer systems – whether supported by biometrics or not – are another aspect of humanitarian assistance that is benefiting greatly from ICTs. Increasingly, these transfers are administered through mobile money systems, which is expanding their reach and improving their efficiency.
Digital payments are expanding the reach and efficiency of cash transfer programmes.
“

41 01 DIGITAL OPPORTUNITY: SPECIAL SECTION
According to data from GSMA, a trade group of mobile network operators, in many of the countries hosting displaced populations, mobile money networks are more developed than the formal banking system.81 Cash transfers in humanitarian settings improve children’s lives in a range of ways, in part because households receiving payments prioritize spending on child-specific needs, such as food, housing, health and education.82 By offering recipients a basic transaction account, digital payments can also foster longer-term financial inclusion.83
Ethics and privacy in data collection and sharing in emergencies
There are obvious benefits to using digital technologies for collecting and sharing data in emergencies. But these uses also raise important ethical issues, reflecting the ways in which the digital revolution is transforming who can generate, access and transmit this growing flood of data.84
Protection of affected populations – their rights, safety and dignity – is fundamental to humanitarian principles, as is assuring that risks are properly addressed with appropriate and timely interventions. Vulnerable groups such as children and adolescent girls are especially at risk of violence, abuse and exploitation in humanitarian situations. Technologies connecting data with individuals’ identities inevitably raise the risk that data may be breached or misused in manners that cause harm, whether intended or inadvertent.
In the case of refugees and migrants, the consequences of data breaches can become matters of life and death. In the wrong hands, data could be used to identify and target people based on their ethnicity, immigration status or other identity signifier.
Without broader and coherent ethical frameworks for data science governance, children may suffer the consequences hardest and longest,85 since the full impact of privacy violations later in life is still largely unpredictable. As United Nations Under-Secretary-General for Humanitarian Affairs Stephen O’Brien, has noted, “safeguarding privacy and ensuring sensitive data is handled appropriately, especially in conflict settings, are critical issues for our community as it becomes data-driven.”86
Developing common standards for data collection, use and management is a task for the entire humanitarian sector. The literature suggests three critical areas where minimum standards should be developed to start building a solid framework in the area:
Rights, privacy and consent. Common ethical standards are needed to govern the use of data and privacy protections.
Data sharing and retention. Clear guidance is needed on who should share data and when, and there need to be protocols on what data should be retained, from what sources, for how long and for what purpose.
Protection of vulnerable populations. There needs to be a shared understanding of how sharing or using certain types of data can increase the risks faced by certain groups.87
It is understandable that humanitarian organizations in the field are rightly more focused on responding to emergencies than working through legal details about data collection and sharing. However, to fully benefit from the potential of digital technologies in emergencies and other contexts, the international community must simultaneously address concerns on how to respect privacy and fundamental rights, particularly for the world’s most vulnerable populations, including children and adolescents.
The consequences of data breaches can become matters of life and death.
“

Full articles by youth contributors featured in The State of the World’s Children 2017 can be found at: <www.voicesofyouth.org/en/sections/content/pages/sowc-2017>
EMMANUELLA AYIVI, 15BENIN
“ In Benin, a lot of young people and children do not have access to digital technologies and the internet. This lack of access to the digital world puts young people at a grave disadvantage. I have been in numerous situations where the lack of internet access was a serious problem.”
02Digital Divides: Missed opportunities

43
To be unconnected in a digital world is to be deprived of new opportunities to learn, communicate and develop skills for the twenty-first century workplace. Unless these gaps in access and skills are identified and closed, rather than being an equalizer of opportunity, connectivity may deepen inequity, reinforcing intergenerational cycles of deprivation.
In a world where digital access and digital skills increasingly influence children’s futures, the contours of global connectivity are troubling. Just over 29 per cent of the world’s youth (15–24 years old) – or 346 million – do not use the internet.1 Nearly 9 out of 10 of the young people currently not using the internet live in Africa, Asia or the Pacific. Africa has the highest share of non-users.
Disparities in access are particularly striking in low-income countries: Fewer than 5 per cent of children under 15 use the internet in Bangladesh and Zimbabwe.
These digital divides mirror broader socio-economic divides – between rich and poor, men and women,2 cities and rural areas, and between those with education and those without.3 For example, 81 per cent of people in developed countries use the internet, more than double the proportion in developing countries (40 per cent), which, in turn, is more than double the proportion in least developed countries (15 per cent).4
But digital divides do not merely separate the connected and the unconnected. They go deeper, concerning how people – including children – use information and communication technologies (ICT), as well as the quality of the online experience. Both of these can vary greatly, reflecting factors that include the level of users’ skills and education, the types of device they use, family income and the availability of content in their own language. Some children going online for the first time find themselves in a digital space where their language, culture and concerns are notable by their absence.
Why does all this matter? Regardless of whether they are fully online, partly
online or completely unconnected, every child today is growing up in a digital world powered by technology and information. In the immediate term, children who are unconnected are missing out on rich educational resources, access to global information and online opportunities for learning; they are also forgoing ways to explore new friendships and self-expression (see Special Section: Connected children).5
For disadvantaged children, such as those living with disabilities, connectivity can mean the difference between social exclusion and equal opportunity. For children on the move, it can mean a safer journey, the chance to remain in touch with family members and a better chance to find work and educational opportunities in a foreign land.6
As children reach adulthood and enter the world of work, connectivity will increasingly mean the difference between their ability to earn a living or not. Those with access to digital technologies and the skills to make the best use of them will have the advantage over those who are unconnected and unskilled. Evidence from adult populations shows that the benefits of digital technology go to those with the skills to leverage it.7
According to Organisation for Economic Co-operation and Development (OECD)
Connectivity will increasingly mean the difference between the ability to earn a living or not.
“

UNICEF – THE STATE OF THE WORLD’S CHILDREN 201744Africa’s children, like this boy in the Côte d’Ivoire town of Odienné, rely heavily on mobiles for internet access, which leaves them at risk of a ‘second-best’ online experience. © UNICEF/
UN061732/DEJONGH

02 DIGITAL DIVIDES: MISSED OPPORTUNITIES 45
data from the world’s wealthiest countries, ICT experience has had a large impact on participation in the labour force and on wages in countries like Australia and the United States. Adults without ICT experience, even if employed, were likely to earn less than those with ICT skills.8 Other studies of adult populations in countries such as India9 and Tunisia10 reflect similar findings.
The risk that connectivity can become a driver of inequity, not an equalizer of opportunity, is both real and immediate. Consider mobile technology, which has become embedded in every aspect of daily life – and at a singular pace. As the World Bank’s World Development Report 2016: Digital dividends points out, “More households in developing countries own a mobile phone than have access to electricity or clean water, and nearly 70 per cent of the bottom fifth of the population in developing countries own a mobile phone.” Connectivity via mobile may have a long way to go to shrink the divide. However, as smartphone adoption skyrockets in many countries, including emerging economies,11 it is easy to imagine how central access will be or is already.
Digital connectivity is not only the “new necessity of our times”;12 it offers the potential to break intergenerational cycles of disadvantage from which the poorest children may not otherwise be able to break away.13
Who are the unconnected children?
Global data on children’s access to, and use of, the internet are hard to find. Many countries do not collect relevant data and, even if they do, the age range used to estimate ‘children’ often varies, posing challenges to uniformity in data. What is clear, however, is that existing
socio-economic disparities are strongly reflected in which children are – and are not – online.
Nearly 9 out of 10 of the young people (aged 15–24) currently not using the internet live in Africa or Asia and the Pacific.14 In 2017, Africa was also the region with the highest proportion of non-users among 15- to 24-year-olds – the population segment often considered to be highly connected (see Figures 2.1 and 2.2).15
These disparities in access are particularly striking in some low-income countries. In Bangladesh and Zimbabwe, fewer than 1 in 20 children under 15 uses the internet (see Figure 2.3).16 For children in these countries, challenges of poor quality connectivity are likely compounded by high data costs – most of the countries with the least affordable mobile-broadband prices are also among the least developed countries in Africa and Asia and the Pacific.17
Although scarce, available data on the urban-rural digital divide for young people (15–24 years old) in countries such as Cameroon, Malawi and Zimbabwe also show marked disparities, with rural youth in these countries experiencing very low levels of connectivity (see Figure 2.4).
But it is not only in low-income countries that children face barriers of access. Even in high-connectivity countries, family income does much to determine children’s ability to meet their online needs.
In 2015, the OECD’s Programme for International Student Assessment (PISA) revealed substantial discrepancies between advantaged students and disadvantaged students for both computer and internet access. Across countries and economies, on an average, 88 per cent of the advantaged students had two or more computers at home compared with only 55 per cent of the disadvantaged students. Variations in internet access were
Even in high-connectivity countries, family income does much to determine children’s ability to meet their online needs.
“

UNICEF – THE STATE OF THE WORLD’S CHILDREN 201746
0 20 40 60 80 100
Percentage
FIGURE 2.1 YOUTH IN LOW-INCOME COUNTRIES ARE LEAST LIKELY TO CONNECTPROPORTION OF YOUTH (15–24) WHO ARE NOT USING THE INTERNET (%)
Source: International Telecommunication Union estimates, 2017. Note: This map does not reflect a position by UNICEF on the legal status of any country or territory or the delimitation of any frontiers. The dotted line represents approximately the Line of Control in Jammu and Kashmir agreed upon by India and Pakistan. The final status of Jammu and Kashmir has not yet been agreed upon by the parties. The final boundary between the Sudan and South Sudan has not yet been determined. The final status of the Abyei area has not yet been determined.
FIGURE 2.2 ABOUT THREE OUT OF FIVE YOUTH IN AFRICA ARE NOT ONLINEPERCENTAGE OF 15–24-YEAR-OLDS WHO ARE NON-INTERNET USERS BY REGION, 2017
* Commonwealth of Independent States.** Estimates for the 'World' figure include a few 'other economies' not included in any of the regions. Source: International Telecommunication Union (ITU) estimates, 2017.
0 20 40 60 80 100
Connected Unconnected
World**
Europe
CIS*
The Americas
Asia and the Pacific
Arab States
Africa

FIGURE 2.3 CHILDREN FROM THE LOWEST-INCOME COUNTRIES USE THE INTERNET LEASTPERCENTAGE OF UNDER-15 CHILDREN USING THE INTERNET, SELECTED COUNTRIES AND TERRITORIES, 2012–2016
20 40 60 80 100
Source: Eurostat, ITU and UNICEF, 2012–2016.Note: Income classification follows World Bank income classification as of August 2017.
Slovakia (age 12+)
Switzerland (age 14+)
Singapore (7+)
Japan (age 6+)
United States (age 3+)
Uruguay (age 6+)
Oman (age 5+)
Belarus (age 6+)
Brazil (age 10+)
Panama (age 10+)
Colombia (age 5+)
Mexico (age 6+)
Costa Rica (age 5+)
Thailand (age 6+)
Venezuela (BolivarianRepublic of) (age 7+)
Kazakhstan (age 6+)
Mauritius (age 5+)
Ecuador (age 5+)
Peru (age 6+)
Paraguay (age 10+)
Iran (IslamicRepublic of) (age 6+)
Georgia (age 6+)
State of Palestine (age 10+)
Morocco (age 5+)
El Salvador (age 10+)
Egypt (age 6+)
Bolivia (PlurinationalState of) (age 5+)
Indonesia (age 5+)
Zimbabwe (age 3+)
Bangladesh (age 5+)
0
Low
er M
idd
le-
and
Low
-In
com
e C
ou
ntr
ies
Up
per
Mid
dle
-In
com
ev C
ou
ntr
ies
Hig
h-I
nco
me
Co
un
trie
s

UNICEF – THE STATE OF THE WORLD’S CHILDREN 201748
also clear. In 40 countries and economies, virtually every student (99 per cent) in the top socio-economic quartile had home internet, but in 15 countries this was true for only one in two students in the bottom quartile.18
These inequalities in access within countries can reinforce existing inequities for children who cannot meet the demands of the digital age. The case of the homework gap in the United States, where the lack of home broadband access puts low-income schoolchildren at a disadvantage, is a telling example (see box: Mind the homework gap).
A persistent gender gap
The world over, more men than women use the internet; what’s more this gap is not narrowing but widening. The global gap in internet use between men and women grew from 11 per cent in 2013 to 12 per cent in 2016.19 The gap is particularly striking in some low-income countries (see Figure 2.5). From a global perspective, the gender digital divide is proving “incredibly difficult to overcome, reflecting broader social gender inequalities,” according to the Broadband
0 20 10040 60 80
FIGURE 2.4 YOUTH IN RURAL AREAS ARE LESS LIKELY TO GO ONLINE PERCENTAGE OF 15–24-YEAR-OLDS WHO USED THE INTERNET OVER THE PAST YEAR IN SELECTED COUNTRIES, 2012–2016
Urban
Rural
Source: UNICEF analysis based on Demographic and Health Surveys and Multiple Indicator Cluster Surveys.* All references to Kosovo are made in the context of UN Security Council Resolution 1244 (1999).
Belarus
Bosnia and Herzegovina
Cameroon
Guinea-Bissau
Guyana
Kosovo*
Lao People's Democratic Republic
Malawi
Mongolia
Republic of Moldova
Sao Tome and Principe
Swaziland
Ukraine
United Republic of Tanzania
Zimbabwe

02 DIGITAL DIVIDES: MISSED OPPORTUNITIES 49
Commission for Digital Development’s 2015 report.20
What’s behind this divide? A survey by the GSM Association (GSMA) of 22 low- and middle-income countries in 2015 found that various socio-economic and cultural barriers – among them social norms, education levels, lack of technical literacy and lack of confidence – tend to keep girls and women from using mobile phones.21 Women used phones less frequently and less intensively than men, especially
for higher-level uses such as accessing the internet.22
Country-level examples give a sense of the kinds of barriers girls and women confront. In India, where only 29 per cent of all internet users are female, girls in rural areas often face restrictions on their use of ICTs solely because of their gender. One village governing body in rural Rajasthan stated that girls were not to use mobile phones or social media. Another village in Uttar Pradesh banned unmarried girls from using mobile phones (and from wearing jeans
In India, only 29% of all internet users are female.
“
FIG 2.5 GIRLS ARE LEAST LIKELY TO GO ONLINE IN LOW-CONNECTIVITY COUNTRIESPERCENTAGE OF 15–19-YEAR-OLDS WHO USED THE INTERNET OVER THE PAST YEAR IN SELECTED COUNTRIES, 2012–2016
0 50
Boys
Source: UNICEF analysis based on Demographic and Health Surveys and Multiple Indicator Cluster Surveys conducted 2012–2016.* All references to Kosovo are made in the context of UN Security Council Resolution 1244 (1999).
Girls
Belarus
Kosovo*
Bosnia and Herzegovina
Republic of Moldova
Ukraine
Mongolia
Guyana
Sao Tome and Principe
Swaziland
Cameroon
Zimbabwe
Guinea-Bissau
United Republic of Tanzania
Lao People's Democratic Republic
Malawi
100 150 200

UNICEF – THE STATE OF THE WORLD’S CHILDREN 2017
PERSPECTIVE
How digital technologies herald a bright future
Karim Sy and Laura Maclet
It goes without saying that digital technologies are invading every aspect of our lives. But transitioning to an inclusive information society that offers opportunities for all is a major global challenge. New technologies give us a different perspective on the world and help us address problems from a new angle. That is why they are so important.
People in Africa understand this all too well. The pace of technological progress there is faster than anywhere else in the world – between 2010 and 2015, mobile cellular subscriptions jumped 70 per cent and almost half of the people on the continent now have a mobile phone contract. Despite the uneven digital and technological landscape, these technologies are increasingly becoming part and parcel of everyday life – even in rural areas, where people have shown a readiness to embrace mobile technologies. New apps are appearing all the time, across areas such as agriculture, health and education. A prime example is Farmdrive – an initiative that connects small-scale farmers to lenders in rural areas of Kenya using mobile telephones.
Mobile internet is heralding new opportunities in many different areas, and the success of mobile banking, which has revolutionized the banking sector, is now prompting innovative approaches to education. By 2050, more than half of the world’s population growth is expected to occur in Africa, while, by some estimates, 65 per cent of children starting primary school today will work in jobs that are yet to exist – jobs in artificial intelligence, machine learning, robotics, 3D printing and nanotechnologies. As these new occupations emerge, people will need to continue learning and acquiring skills throughout their lives. And we will have to learn to adapt. The internet is also opening up new opportunities for people in remote areas to earn an income from simple activities. Samasource, a project that aims to reduce poverty through creating digital jobs, is a prime example of how
empowerment and basic digital education can drive value creation.
So how can African children learn the skills they need to thrive in the future? How should we be educating people in today’s world of technological advances and societal upheaval?
Technologies serve no purpose without a human dimension. So, if we want everyone to use digital devices, we need to spread knowledge widely and rethink the respective roles of both the technologies and educators. The internet is steadily breaking down barriers to accessing knowledge, which is no longer the preserve of the classroom. Technology and multimedia bring with them opportunities to learn in new ways and develop customized learning pathways. Yet as technology opens up access to knowledge, there is a real risk that people who cannot use these new tools will be left behind. The answer is to get everyone on board – teachers, entrepreneurs, parents, technology communities, charities and non-profits, and public policymakers. If children know how to use digital technologies and get the support they need, they will be able to access – and use – a whole new world of technical and personal skills. What’s more, educators will be able to add these technologies to their arsenal of resources – doing away with the conventional model of centralized, top-down public education.
Right now, children lack the safe and secure learning opportunities they need to reach their full potential. The digital revolution is about more than learning to use new tools and technologies. It is about a major paradigm shift in people’s mindsets and habits.
The Jokkokids project, supported by the Open Society Initiative for West Africa (OSIWA), organizes extra-curricular workshops where children learn about the connections between digital technologies and other areas, such as

02 PERSPECTIVE 51
Connectivity rates are very low in some countries. Fewer than 5 per cent of children under 15 use the internet in Zimbabwe. © UNICEF/UN050415/MUKWAZHI
manufacturing (do-it-yourself, recycling, etc.), self-expression and the arts. The idea is that learning stems first and foremost from great teaching, high-quality multidisciplinary content, and the teacher’s relationship with technology. If we want children to gain confidence in their abilities and make steady progress towards their full potential, we should encourage them to learn digital skills alongside other subject areas. This is a long-term process of continuous improvement, based on feedback from the global educational community. The aim is to do something that, ultimately, benefits everyone.
At its training centre in Ziguinchor, NGO Futur au Présent works with girls aged 6–10 who have previously been engaged in child labour. The scheme began in 2014 and, by 2016, 60 young girls had stopped working and returned to school. After 18 months, 90 per cent of these girls were at the top of their class. Outside of lessons, the girls are enrolled in the Jokkokids scheme, as well as the Ideas Box project run by the NGO Libraries Without Borders, which fosters digital inclusion through cross-cutting sessions in which children learn about digital technologies, robotics and self-expression in a friendly and welcoming setting.
Programmes like these help children see the link between theory and practice. By revisiting what they have learned in the classroom during extra-curricular time, getting to grips with new tools and materials, and thinking about themselves and the people and world around them, children steadily build the resilience they need to cope in an ever-changing, complex, uncertain and ambiguous world. Never has there been a more urgent need to rethink the way we do things, especially in teaching and learning. But that change can only come about if we get everyone on board.
Karim Sy is a successful serial entrepreneur. In 2010, he founded Jokkolabs – an open innovation ecosystem that runs a network of ‘creative spaces’ in France and eight African countries. A member of Ashoka since 2012, Karim has kick-started a series of digital innovation projects, fuelling the entrepreneurial ecosystem in Africa and Europe. He was recently named as a member of the Presidential Council for Africa by French President Emmanuel Macron.
Laura Maclet coordinates Jokkolabs’ Education & Training Cluster. She holds a degree in politics, linguistics and information science, and is a qualified secondary-level teacher. She specializes in educational programme design, deployment and dissemination.
Never hasthere been a more urgent need to rethinkthe way we do things.
“

What do adolescents think about … the barriers that stop them from going online?
Many participants in the State of the World’s Children 2017 workshops* said they faced barriers to going online. Limited connectivity was at the top of their list of challenges …
“ I want to search … the internet but the signal is very bad.” BOY, 16, TIMOR-LESTE
“ Slow connection – it’s always shutting down and all my tabs get lost.” GIRL, 16, TUNISIA
while, in a third of the countries, participants cited unreliable power as a problem.“ No electricity.” GIRL, 13, VANUATU
Connectivity issues were worse in rural areas.“ When I go to the countryside and there’s
no signal, I get desperate because I can’t communicate.” GIRL, 14, PARAGUAY
A lack of devices at home or at school was another barrier, with significant numbers saying they could not regularly access a desktop computer, laptop, tablet or mobile phone.“ We don’t have a computer at home.”
GIRL, 15, BURUNDI
“ No availability of technology.” BOY, 15, JORDAN
Many said they had to share devices with other family members …“ I need to share the iPad with all my family so I use it just a little bit.” GIRL, 15, REPUBLIC
OF MOLDOVA
or rely on old devices that were not powerful enough or had weak batteries – a source of frustration.“ I cannot use the mobile phone outside my home because the battery [life is] too short.” BOY, 14, URUGUAY
Participants had a range of workarounds, including switching between devices to maximize their time online.“ My laptop becomes slow after using for some time so I use my smartphone for solving this issue.” BOY, 17, BANGLADESH
Cost was another barrier, with ‘running out of credit’ being the challenge most often reported by participants.“ I had a phone but no credit to make calls.”
BOY, 14, CENTRAL AFRICAN REPUBLIC
“ I want to call my mum to tell her that my little brother is sick but I have run out of credit.” GIRL, 10, CENTRAL AFRICAN REPUBLIC
“ There’s no money to recharge.” GIRL, 16, PERU
A number of participants thought the state should do more.“ The state should provide free internet.”
GIRL, 10, CENTRAL
AFRICAN REPUBLIC
“ Government should decrease the cost of internet.” BOY, 17, BANGLADESH
Participants faced other barriers to going online, including concerns over loss of privacy …“ Sometimes I am afraid to enter in some website for cybersecurity problems like hacking.” BOY, 16, BANGLADESH
“ Being worried about my privacy makes me reluctant to go online.” GIRL, (AGE NOT GIVEN),
THAILAND

and school rules – many noted that they were forbidden to bring personal devices to school or to use them during school hours.“ Bringing your own device is not allowed and devices can be confiscated, which is why students need to wait for the computer class to access [technology].” BOY, 16, DEMOCRATIC
REPUBLIC OF THE CONGO
“ I think it would be fine to use digital devices at school, but those are only allowed during the break time and lunch time.” BOY, 15, REPUBLIC OF KOREA
Some participants responded by breaking the rules.“ The usage of devices are not allowed at school … [My solution is to] sneakily use it.” GIRL, 18,
THAILAND
Some also felt schools should be more open and responsive to students’ wants and needs.“ [We need] spaces/moments in which we can use it at school.” GIRL, 14, PARAGUAY
“ [Schools should be] analysing the reason for which a student wants to use his mobile phone or computer.” BOY, 17, PARAGUAY
Family rules were another barrier, with restrictions on when participants could use devices …“ Our parents switch off the Wi-Fi at night because of negative waves.” GIRL, 16, TUNISIA
“ I am not happy because my father gets angry at me if I spend a lot of time playing on my phone.” BOY, 19, TIMOR-LESTE
and at what age.“ I don’t have a smartphone because my family thinks I’m still young.” GIRL, 17, BANGLADESH
Many participants believed that parents needed to ensure children were using technology appropriately, even if the rules were sometimes annoying or caused friction.“ [I can] accept why it’s forbidden and think about it.” BOY, 15, PARAGUAY
“ [I will] wait until I am in Grade 7 [to get a smartphone].” BOY, 15, THAILAND
Some participants said their lack of digital literacy was a barrier … “ Sometimes I want to go online but there is no one to help me and show me.” GIRL, 12, CENTRAL
AFRICAN REPUBLIC
“ Not knowing how to use social media [stops me going online].” GIRL, 15, BURUNDI
as was lack of time.“ Because we are at school and once we arrive home we should do other things first: to study, to wash dishes, etc.” GIRL, 14, URUGUAY
“ [I have a] lot of homework [or am] busy doing home chores.” GIRL, 15, KIRIBATI
“ Most of my time I use it for study or work so I only have the night to use the internet.” BOY, 17, GUATEMALA
Finally, many participants reported experiencing multiple barriers to using digital technology. “ The obstacles that I face are mainly to
find someone who can lend me his phone, secondly, it is to find money to buy units, finally, the lack of electricity.” BOY, 17, BURUNDI
IN SUMMARYBarriers preventing children from maximizing opportunity in the digital age are multifaceted – a complexity that needs to be reflected in efforts to improve children’s online access. But these efforts can take novel approaches. For example, they may not have to replicate the ‘one device per person’ model common in wealthier countries. A final insight is that rules guiding technology use in schools and other settings should ideally be developed in conjunction with children to increase the likelihood of their abiding by them.
* Participants’ responses have been shortened and edited for clarity where necessary.

UNICEF – THE STATE OF THE WORLD’S CHILDREN 201754
and T-shirts).30 This council believed that mobile phone use would increase crimes against girls and women. In Sri Lanka, a 2015 national study31 of 11- to 18-year-olds found that girls accounted for only a third of adolescents using computers and mobile phones to go online. In focus group discussions, parents revealed that they often restricted girls from accessing the internet.32
A 2017 review of evidence from low- and middle-income countries revealed important patterns of gender-based discrepancies among adolescents: When parents or caregivers provide the technology, girls get access at an older age than boys;
girls’ access is also more curtailed or supervised; and the idea of ICT-related careers is associated more with boys than with girls.33
There are potentially serious consequences for girls excluded from the digital age. They may be unable to access online services and information, including about issues related to their health and sexuality, such as HIV and puberty; they may face barriers to furthering their education and to developing the skills necessary in the global economy of the twenty-first century; they may not be able to access social and political information that affects them; and
Mind the Homework Gap: The divide facing the lowest-income children in the United States
The United States presents a particularly compelling case of the sort of digital inequality children can face in high-connectivity countries. While most American households with school-aged children (aged 6–17) had home broadband access in 2015, around 5 million did not.23
For some, this was because they lived in an area without a connection or with only a very slow connection. Cost was also an important factor – the unconnected households were likely to have an annual income below US$50,000. But the access fault line did not stop at income: Among the low-income households, black and Hispanic households trailed similar-income white families in broadband by 10 percentage points.24
What does this mean for schoolchildren? Across the country, students from households without high-speed home internet are facing what policymakers and
educators call ‘the homework gap’.25 As school curricula increasingly incorporate internet-based learning and online testing, low-income students in areas with poor internet connectivity or those who cannot afford broadband are left at a marked disadvantage. High school students report being unable to complete school work or getting lower grades due to lack of home broadband access.26
The reality of the divide has been captured eloquently by the popular press: school buses equipped with Wi-Fi being parked overnight in underserved neighbourhoods so that children can connect for their studies;27 children heading to local libraries and fast-food chains to access free hotspots;28 and children hanging out on the sidewalks of the local elementary school well into the evening with the family’s only phone, trying to download an assignment.29

02 DIGITAL DIVIDES: MISSED OPPORTUNITIES 55
they may be excluded from opportunities to make their voices heard.
Once connected, how do you use?
The digital divide is typically thought of in terms of access – the haves and have-nots of connectivity. But since the 1990s, researchers have paid more attention to a ‘second level’34 of divides that goes beyond access. The idea of second-level divides broadly covers differences in people’s online skills and abilities, types of online activities pursued, patterns of internet use and the devices used to go online.35 Put otherwise, people’s personal circumstances – skills, education and so on – affect how they use the internet.
For example, internet users with higher levels of education appear to use more advanced online services, such as e-commerce and financial activities, than users with lower education levels, who tend to limit their online activities to communications and entertainment.36 So, even though the primary digital divide of access is narrowing, digital divides could be shifting to second-level divides based on growing inequalities in digital skills and usage.37
Research on second-level divides among children is scarce, but there are exceptions. In 2011, EU Kids Online, a research network that interviewed 25,000 children and their parents in 25 European countries, found that children from wealthier households engaged in a wider ‘repertoire’ of activities than those from less wealthy households.38 More recently, the 2015 OECD PISA study showed that across countries, students from higher socio-economic backgrounds were more likely to use the internet to obtain practical information or read the news. Their lower-income peers, on the other hand, tended to spend online time chatting and playing games.
The study noted that these differences were similar to those found in studies of adult populations, suggesting a strong correlation of second-level divides with wider social inequalities and cultural preferences.39
All this points to worrying prospects for the most excluded children and the world at large. The digital ‘haves’ will likely continue to have more, in terms of connectivity, access to a range of devices and advanced digital skills than the digital ‘have-nots’, and will have it earlier in life, perpetuating cycles of disadvantage and reinforcing privilege.40
Emerging second-level divides
There is increasing interest in how other digital divides may manifest themselves, and whether they may create new digital silos or lead to exclusion. Two divides in particular may have implications for children’s lives: First, the leapfrogging of first-time internet users directly to mobile devices in low-income countries; and second, the relative lack of online content in minority languages and the absence of content concerning large swathes of the world, especially low- and middle-income countries.
Many users in middle- and low-income countries without consistent access to internet access on personal computers are using mobile phones to leapfrog into the information age (see Figure 2.6). However, mobile phones are not “functionally equivalent substitutes” for personal computers, providing users with only a ‘second-best’ online experience.41 The constraints of the mobile internet – particularly for tasks associated with producing information such as long-form writing, video editing and design42 – may not always be apparent to new users in low-income countries. Many go online for the first time only through mobile phones and may be unaware “of the degree to which their online experience falls short of a PC-based online experience.”43
While the gap in access is narrowing, digital divides could be shifting to second-level divides.
“

UNICEF – THE STATE OF THE WORLD’S CHILDREN 201756
In the United States, research on smartphone adoption by adolescents showed that those from lower-income households were more likely to go online primarily through their mobile devices.44 In addition, children in low-income households who had internet access only via mobile devices used it less frequently, and for a narrower set of activities.45
Findings from Global Kids Online (see box opposite) also suggest that the user experience of children who have internet access via mobile phone alone may differ
from that of others because “the small screen limits the amount and complexity of content that can be readily viewed.” When searching for information online, for example, “mobile users tend to scan content rather than process and analyse it more deeply.”46
Given the role of mobile technologies in connecting children in some of the world’s least-connected regions (see box: Connecting Africa’s youth), there are clear concerns that offering children only a second-best experience risks spurring new forms of inequity.
0
20
40
60
80
100
Games consoleTabletLaptopDesktopSmartphone
FIGURE 2.6 CHILDREN RELY HEAVILY ON SMARTPHONES TO GO ONLINEPERCENTAGE OF CHILDREN USING EACH DEVICE AT LEAST ONCE A MONTH, 2016–2017
South Africa GhanaMontenegroChile BulgariaArgentina
Source: Global Kids Online partner countries 2016–2017, aggregated by UNICEF Office of Research – Innocenti.

02 DIGITAL DIVIDES: MISSED OPPORTUNITIES 57
In 2016, 56% of websites were in English.
“
In response to the access problems of some of the lowest-income and lowest-connectivity markets, some global content providers offer free or lower-priced data plans. Similar to generic ‘zero rating’ programmes that exempt certain sites from the customer’s data limit,47 these initiatives allow customers who find data costs prohibitive to access selected content for free or at low cost when they sign up with certain service providers. Examples include Facebook’s Free Basics, Wikipedia Zero and Google Free Zone,48 as well as UNICEF’s Internet of Good Things (IoGT), which, in partnership with a group of mobile network operators and Free Basics, provides information to in-need populations in 60 countries and territories and 12 languages on issues such as children rights, internet safety, maternal health, hygiene, epidemics, HIV/AIDS and positive parenting. Such programmes bring affordable internet services and access to critical information to users who might otherwise go completely without.
But zero-rating programmes are not without their critics. Some raise concerns that the next billion internet users, both adults and children, may be led not to an inclusive, participatory internet to which they can contribute but rather to an internet where “they will have little to do but post on social networks and consume media using the apps, services and platforms developed by a few big players” from a few countries.49
The absence of relevant content and languages
Besides issues of affordability and accessibility, there is another barrier facing many of the billions of unconnected people in the digital space – namely, the lack of useful online content in their native language.50 This may discourage potential users from trying to go online or prevent them from
directly gauging the potential utility and relevance of the internet.51 But it raises a bigger concern, too: namely, that the absence of content that speaks directly to children’s diverse cultural contexts and experiences may widen knowledge gaps.
The internet of today is, of course, far more multilingual than it was at the beginning of the century. But the fact remains that, in 2016, just 10 languages accounted for the majority of websites, with 56 per cent of them in English.52
Global Kids Online
Global Kids Online (GKO) is a research project and network that supports worldwide efforts to conduct rigorous, comparable research on children’s use of digital technology. It is coordinated by the UNICEF Office of Research-Innocenti in partnership with the London School of Economics and the EU Kids Online network. GKO provides well-tested and robust research tools – a baseline survey, methodological guides and qualitative protocols – to support quality research on children’s online experiences that can be used to influence policy or programming and inform campaigns and advocacy efforts.
Each GKO project is implemented by a local partner to ensure contextual relevance and national impact. Since 2016, nearly 10,000 children and 5,000 parents have been surveyed in 10 countries through the work of UNICEF country offices and research institutions in Argentina, Brazil, Bulgaria, Chile, Ghana, Montenegro, Philippines, Serbia, South Africa and Uruguay.

UNICEF – THE STATE OF THE WORLD’S CHILDREN 201758
Translation tools such as Google Translate, which currently supports 103 languages, can help, but they still leave many people in the world uncovered,53 particularly users in low-income countries.54 However, Google’s Neural Machine Translation system, aimed at increasing the fluency and accuracy of Google Translate, could set the standard for future machine translation. Not only does it provide better translation of spoken language into translated text, but it can translate languages rarely written down, such as Haitian Creole or Japanese Ainu. This will make a huge difference in humanitarian settings, for example, where
relief workers can struggle to communicate with children and families in need.55 Or, in the context of skills and learning, where the instant translation of Massive Open Online Courses (MOOCs), which provide a free and flexible way to learn new skills, could reach disadvantaged or remote populations.
Gaps in content reflect not just how users’ lives and concerns are represented online but also who gets to create content.56 Using the example of Wikipedia, the Oxford Internet Institute (OII) has shown the scale of these gaps in content and content creation. Wikipedia, “the world’s
Artificial intelligence and its potential impact on children By Sandra Cortesi and Urs Gasser
Over the past few years, technologies based on artificial intelligence (AI) have begun to change our daily lives as they are rolled out at an accelerated pace not only in professional working environments but also at home and in schools.
Hello Barbie and Green DIno are just two examples of AI-enabled toys that have already made their way into some children’s homes, with many more under development across the globe – including internet-connected teddy bears with embedded mics, cameras, sensors and other networked technologies. These AI-enabled toys might be fun for children to play with and may foster language development and socio-emotional learning, but they also raise serious privacy and safety concerns, particularly when connected to the internet.
For older children, AI-based technologies play an increasingly important role in learning, whether they are studying in formal educational institutions or interacting with interactive online platforms, advanced games or the like in individual and social learning environments. Again, AI-fuelled ‘ed tech’ – including AI-powered digital tutors, learning assistants and personalized educational programmes – can offer wonderful opportunities to young learners and lead to better learning outcomes. At the same time, the
complex interplay between data sets and algorithms that power these ‘black box’ AI systems give rise to pressing questions about bias and discrimination as well as concerns related to transparency and accountability. Moreover, and perhaps most fundamentally, absent appropriate safeguards, legal protections and sound policies, AI-based technologies may further exacerbate existing inequalities among children and young people, leading to an even deeper and arguably more decisive digital divide that shapes learning outcomes and future opportunities for young people to develop and flourish.
The stakes are high, in terms of both potential benefits and risks, and it is the shared responsibility of AI companies, caregivers, educators and policymakers to ensure that AI-based applications used by children are designed and deployed in such ways that they embrace the positive potential while avoiding the pitfalls.
Sandra Cortesi is Director of Youth and Media and Urs Gasser is Executive Director of the Berkman Klein Center for Internet & Society at Harvard University. Since 2010, the Berkman Klein Center and UNICEF have collaborated to promote a holistic understanding of the impact that digital technology has on children’s lives. Learn more at <http://www.digitallyconnected.org/>

02 DIGITAL DIVIDES: MISSED OPPORTUNITIES 59
Young people living in many parts of Africa and Asia, such as these girls in Sudan, often struggle to find information online that’s relevant to their own lives and in their own language. © UNICEF/UNI166091/NOORANI

UNICEF – THE STATE OF THE WORLD’S CHILDREN 201760
largest and most used repository of user-generated content,”57 averages more than 18 billion page views per month.58 It is a platform where, technically, anyone with internet access can write or make changes to content.
Notably, OII’s mapping of Wikipedia articles shows marked geographical unevenness in content. In 2014, most of the articles in the 44 language versions mapped were
found to focus mainly on places, events and people in North America, Europe, Australia and parts of Asia, such as India and Japan. Certain regions, such as Africa, were greatly under-represented. In fact, information about many countries in Africa and Asia was written up in a non-local language, predominantly English, but also French and German. The researchers argued that on Wikipedia, “the South is largely being defined and described by others.”59
Information poverty
Digital exclusion manifests itself in varied ways in a child’s life, both in the short and long term. A child deprived of access to information – whether from a newspaper, television or the internet – is denied a fair chance to develop and better her or his situation. Imagine a girl living in a poor, rural household anywhere in the world. How will she compete with her advantaged counterparts in the classroom or, later, for a job, if she is not equipped with the same access to information about the world? What will be her job prospects without equal access to social networking sites, learning platforms and online job postings?
UNICEF’s Office of Innovation is contributing to research on solutions to the very real problem of ‘information poverty’. Its approach is built on the idea that access to information is a right – leading to opportunity and better outcomes for children and their communities. Denial of that right contributes to expanding and extending gaps in opportunity for children, making the most disadvantaged even worse off and fuelling intergenerational cycles of poverty.
But how is a child’s information poverty measured? Hundreds of ever-changing variables must be taken into account and data are scarce. To start with, who and where are the children most deprived of information? What are the underlying causes and barriers to access? And why are some of those with access not using it? To date, dimensions of information poverty include availability, access, usage, resilience, social graph, content and skills.
Machine learning and the combination of new data sources – such as satellite imagery, mobile phone data, social media and online search analyses – with traditional ones could help to provide a measurement. Quantifying such poverty would be a valuable advocacy tool for programme development and influencing policy and resource allocation.
Information poverty pilot projects are under way in Brazil, Liberia and Mozambique. In Liberia, for example, building on lessons from the Ebola crisis – namely, how a lack of information about the disease contributed to its spread – UNICEF Innovation is working with partners to measure the impact of access to information across different sectors, with a special focus on health and resilience.
To better understand the needs of youth in vulnerable communities, the pilot in Mozambique is mapping how access to their main channels of information (TV, radio, family and phone) affects their decisions and outcomes around life-and-death issues such as malaria and child marriage.
A world without information poverty could be one with less spread of infectious disease; better insights on how digital education can improve and accelerate learning outcomes for the most disadvantaged children; reduced gender inequality; and improved financial inclusion – just to name a few benefits.

02 DIGITAL DIVIDES: MISSED OPPORTUNITIES 61
Wikipedia is just one small slice of the internet. But its content gaps underscore the point that increased connectivity may not necessarily reduce unequal access to and production of information.60 They also highlight the need for policy on digital divides to go beyond the issue of access and for children to be given the skills, education and tools that would allow them to participate in the digital realm as creators, and not mere consumers, of content, with more to look forward to than being stuck in a whirlpool of social media and videos of “singing dogs [and] snoring camels.”61
Pointing the way forward
For children to not only survive but also thrive in a digital world, they need a new set of tools. Whether they’re called ‘digital literacy’ or ‘digital citizenship’, these tools go well beyond simple technical ability such as usage skills: They equip children to evaluate the information they find online; to understand what it means to socialize online; to behave responsibly and keep themselves safe online; to advocate for their interests or those of their communities;
Cuba’s first online generation
Something has changed on the streets of Cuba. After school and on weekends, and in parks and on avenues, groups of children can be seen chatting away on video calls with relatives and friends or playing the sort of games that children almost everywhere play online. The sight is familiar in much of the world, but in Cuba it would have been unimaginable just two years ago.
That’s because it was only in 2015 that the government launched paid Wi-Fi hotspots in public spaces across the island. By the end of 2016, more than 600 collective ‘surfing spaces’ and more than 300 public Wi-Fi hotspots had been set up. The initiative has transformed access to the internet for adults and children. According to official figures, some 250,000 connections are made from the Wi-Fi hotspots every day.62
The hotspots, which allow access to international sites, are proving popular with young Cubans: “Connecting to the internet is the coolest right now,” says Diego, a 14-year-old from Havana. “Having the money for an internet card is better than a new T-shirt. If you don’t go online, you’re out, you are missing out.”
This is not, however, the first encounter with the online world for Cuban children. Since 1987, the Joven Club (Youth Club) system has been providing young people with a gateway to the technology of the digital world in a country where personal computers and
internet access are not common. Currently, almost 4,000 children and adolescents63 visit the more-than 600 clubs every day to attend courses, surf national sites featuring approved educational content with built-in child protection elements and access entertainment and educational content.
Jennifer, 17, is one of them: “Online, I can find information for school in EcuRed [the Cuban encyclopedia] and also chat with people. The internet opens up another world that we don’t see. It’s exciting.”
Away from such official access points, and reflecting the island’s make-do culture, many young Cubans also ‘connect’ offline, swapping content by Bluetooth or buying terabyte-sized ‘Paquete’ – packages of TV shows, films, video clips, magazines and apps stored on hard drives and USBs. Concerned at the sometimes-inappropriate content in these packages, the Joven Club distributes its own ‘Mochila’ package of information and entertainment. The packages feature safe content seeking to promote healthy lifestyles and spiritual development.
Cuba is just at the dawn of its own digital age – and the government is committed to continue increasing connectivity. Acting now to anticipate the opportunities for children to come, as well as the potential risks, is an important task for all in Cuba.

UNICEF – THE STATE OF THE WORLD’S CHILDREN 201762
to improve their learning; and to develop new talents and skills. Children who have these tools will have the advantage in a knowledge-based society.
Policy action is also needed to improve education, raise literacy and otherwise strengthen children’s non-digital foundations, so that they can make the most out of being connected. Both the World Bank’s World Development Report 2016: Digital dividends and Facebook’s State of Connectivity 2015 emphasized the importance of foundational skills such as the quality of education, learning and teaching, to create conditions not only for greater adoption of the internet but also for better quality of its use.
Literacy, too, is key. As the OECD’s 2015 PISA study stressed, ensuring that every child attains “a baseline level of proficiency in reading and mathematics will do more
to create equal opportunities in a digital world than can be achieved by expanding or subsidizing access to high-tech devices and services”.64
But technology will certainly play a role, and state action is likely to be needed to plug the communications gaps. Bringing equitable online access to some of the least-connected communities will be challenging. For example, for those living on less than US$2 a day in countries like India and the United Republic of Tanzania, the average cost of a smartphone is 16 per cent of their annual income.65 Even if mobile phones with internet capabilities were to become more affordable, the extreme poor would still have to contend with high airtime and data costs.66 GSMA estimates that 90 per cent of the one billion new mobile subscribers expected by 2020 will come from “developing markets”
Without state-led commitment, children will be further left behind.
“
These girls attend computer classes in the West Bengal city of Howrah. Women and girls account for only 29 per cent of India’s internet users. © UNICEF/UN063162/ALTAF AHMAD

02 DIGITAL DIVIDES: MISSED OPPORTUNITIES 63
Connecting Africa’s youth
Africa will see its youth population almost double from 240 million in 2016 to 460 million in 205069 – a youth bulge that will meet a global connectivity revolution in full swing. What is the potential outcome of seizing this window of opportunity? The region’s high proportion of youth (15–24 years old) could take advantage of broadband’s expansion to work in the global digital economy.
But given current trends and evidence to date, how likely is this to happen?
This depends on whether youth will have the ability (and means) to connect to the internet, the digital skills to navigate their way around it and the educational foundation to take advantage of the opportunities they find there. The jobs themselves, or a climate that fosters entrepreneurship, must also be available.
First, connectivity: Today, only about 1 in 10 people in sub-Saharan Africa living in areas covered by 3G networks actually subscribes to mobile broadband.70 And it is estimated that by 2020, only about two out of
five Africans will be connected to broadband, primarily through mobile devices. Only one African country (Nigeria) is among the 10 countries adding the most mobile subscribers by 2020.71
Rapid urbanization will likely exert a complex influence on young Africans’ ability to connect. In 2013, two out of five people in Africa lived in cities;72 by 2050, it will be three out of five.73 Urban youth will be more likely to have access to 3G coverage, but may be less likely to have access to work or other means of enhancing their ability to afford the technology to connect. With many young Africans today working in the informal economy, using mobile devices to access job opportunities will require a shift in the current paradigm.
Digital connectivity, for those young Africans who have it, provides an outlet for urbanized, educated youth to make their voices heard and a platform for demanding that governments respond to their concerns. Equipping young Africans with the digital skills today to navigate their world of tomorrow is crucial to their future.
and acknowledges that affordable mobile services and extending network coverage for the rural poor are particular challenges on the way to universal, affordable access.67
As the World Bank’s 2016 report on digital dividends points out, expanding communication networks in lower-income countries, which are primarily based on mobile networks built by the private sector, may leave gaps in the ‘backbone infrastructure’ of a country, especially in rural areas, for providing universal high-speed networks. This trajectory is different from that followed in most high-income countries, which was based on initial state led investments in telephone infrastructure, followed only later by private sector participation and mobile
and internet networks. Without state-led commitment to complement market-based and private sector solutions, children left behind in a digitally connected world will be at great risk of further exclusion and marginalization.
Finally, the need for more in-depth data to capture different aspects of children’s lives in the digital age cannot be emphasized enough. There is a serious lack of comprehensive data collation at country, regional and global levels on how children access and use ICTs. Unless such evidence- based information is documented, stakeholders, including policymakers, will continue to be limited in their understanding of the digital inequalities facing children and, therefore, unable to take effective action.

THE STATE OF THE WORLD’S CHILDREN 201764
SPECIAL SECTION: What do connected children do online?
The world’s connected children are digital pioneers: In countries with relatively high levels of connectivity, 15- to 24-year-olds typically outnumber the overall online population.74 Data are scarce on users below age 15, but evidence from a number of countries indicates they often use the internet at a rate similar to, or even in excess of, adults aged 25 and over.75
Many are always online: In high-income contexts, it is becoming difficult “to draw the line between offline and online” in children’s lives.76 In the United States, for example, 92 per cent of 13- to 17-year-olds report going online daily. Mobile devices, particularly smartphones – and 73 per cent of this age group have smartphones – enable some to be online “almost constantly.”77 The picture is similar in Europe, where children access the internet from multiple locations and using multiple devices,78 especially smartphones but also desktop and laptop computers, tablets and game consoles.
They are becoming younger and more mobile: Evidence from high-connectivity countries suggests children are going online at ever-younger ages. In Bulgaria, for example, the age at which children first used the internet was commonly 10 in 2010 but had dropped to 7 by 2016.79 In China, children under 10 made up 2.9 per cent of all internet users in 2016, up from 2.7 per cent in 2015.80 In Brazil, the proportion of 9- and 10-year-olds using the internet increased from 35 per cent in 2012 to 37 per cent in 2013.81 It is not uncommon for children who are not yet even teenagers to own their own phones. A survey in Algeria, Egypt, Iraq and Saudi Arabia in 2013 found that age 10 or 12 was the most common age for receiving a first mobile phone.82 In 2015, age 10 was found to be the common age for a child to first own a mobile
phone in the Philippines, while in Honduras it was age 12.83
They’re increasingly part of a ‘bedroom culture’: Devices like smartphones and tablets are changing how and where children go online. Mobile phones enable children to access the internet in the privacy of their bedrooms or from a friend’s house.84 The result is online access that is more personal, more private and less supervised.
They go online to strengthen friendships and find new friends: The role of social networking in expanding friendships can be seen in countries as diverse as Egypt, India, Indonesia, Iraq and Saudi Arabia, where more than 90 per cent of children using mobiles reported that social networking strengthens relationships with close friends. Children also reported that it helps them build relationships with friends to whom they are not so close and with friends of friends.85 But these platforms can also be a venue where conflicts and drama among friends play out. For some, they can be a source of pressure, with adolescents feeling the need to post ‘attractive’ content about themselves, for example, or content that would be ‘liked’ by others (see box by Mizuko Ito).86
And they go online to access information and learning: Using the internet to do homework is increasingly common in high-income countries,87 but it is also a primary online practice in some middle-income

65 02 DIGITAL DIVIDES: SPECIAL SECTION
countries. In Brazil in 2013, schoolwork ranked first among children’s main activities on the internet.88 In Argentina, around 80 per cent of adolescents reported searching on Wikipedia or Google, and using video tutorials on subjects such as mathematics and history. “I flunked math,” said a boy in Argentina, “so I watched a couple of vids where they explained what I had to study.”89 Children value the information they can access online,90 including information on a wide range of recreational activities91 and health issues.92 As an adolescent in South Africa put it, the
value-added of the internet was “just that you know more about things you do not know much about.”93
But, overall, they have a narrow range of online activities: The conventional wisdom is that children and adolescents are well ahead of adults in how they navigate and take advantage of digital technologies. However, the range of what children do online appears often to be quite narrow.
Evidence for this comes from the Global Kids Online94 (GKO) international research
For children living in high-connectivity countries, such as Ahmad Abdul-Halim in Germany, it’s increasingly hard to “draw the line between offline and online”. © UNICEF/UN043764/GILBERTSON VII PHOTO

THE STATE OF THE WORLD’S CHILDREN 201766
Why do teens <3 mobile and social media? By Mizuko Ito
In the late nineties, my research focused on Tokyo teens who were at the forefront of the text messaging and mobile internet revolution. The mobile phone had just pivoted from being a status symbol of the business executive to a fashion item for high school girls. The grownup world was up in arms about teens using these mobile phones for their frivolous social banter, and dubbed them oyayubizoku (thumb tribe) and nagarazoku (multitasking tribe). The poster child for the nagarazoku was the teen texting while walking or riding a bike.
Researchers puzzled over why teens were such enthusiastic adopters of mobile communication. Many attributed this to a natural affinity to new technology and teen obsession with peer communication. After conducting extensive studies, we reached a different conclusion.96 Teens take to mobile and social media so they can communicate with their peers in peace.
Unlike adults, teens lack spaces for private communication, particularly in urban environments like Tokyo. In their daily lives, they move between home, where they lack access to their peers, and school, where they are with their peers but can’t communicate privately. The landline phone is shared with family,
so it is not truly private. The mobile phone was more revolutionary for teens than their elders because it was the first time they could easily communicate directly with a peer or romantic partner. When these same teens moved in with their romantic partner, the volume of text messaging decreased dramatically.
It’s common to assign quirks of teen behaviour to their developmental stage or generational identity. Yet more often than not, teens behave like anyone would under the same circumstances. They have less resistance to new technology because they lack certain habits, but they often offer a preview of how other age groups will come to adopt a new technology. Now that people of all ages have flocked to texting and Facebook, I feel our early research has been validated. Teens take to mobile and social media for the same reasons that the rest of us do – because they want to be connected with people they care about.
Mizuko Ito is a cultural anthropologist, educational researcher, entrepreneur and advocate. She is director of the Connected Learning Lab at the University of California, Irvine, and a co-founder of Connected Camps, a non-profit organization offering online, project-based, social STEM learning for kids in all walks of life.
project. Figure 2.7 (“What are children doing online?”) presents data collected by GKO on 17 children’s online practices, grouping them into three loose categories: social, entertainment and learning; information and exploration; and civic engagement and creativity.
In all three countries represented here – Bulgaria, Chile and South Africa – the highest number of children engaged in just five to nine online practices. And the practices of more than half of these children fell into just one category: social, entertainment and learning. At the other end of the scale, the smallest group of children were those engaging in 15 or more practices. Users in this group were more
engaged in creative practices, such as developing videos and creating blogs as well as activities related to civic engagement, such as discussing political issues online. Although not presented in the graphic, age was a factor, with older children more likely to engage in a greater number of practices.
The data from these three countries highlight the point that while connected children avail themselves of many online opportunities, their fuller engagement with the internet – doing more diverse or sophisticated activities – is not a given. A challenge for research and policy is to find ways to support children to engage in more creative and participatory activities.95

FIGURE 2.7 WHAT ARE CHILDREN DOING ONLINE?PERCENTAGE OF CHILDREN AGED 9-17 REPORTING INVOLVEMENT IN ONLINE ACTIVITIES, 2016–2017
ChileBulgaria South Africa
Source: Global Kids Online partner countries 2016–2017, aggregated by UNICEF Office of Research – Innocenti.
0 20 40 60 80 100
Got involved onlinein a campaign or protest
Discussed political or socialproblems with others
Created a blog or storyor website online
Looked for resources or eventsin their neighbourhood
Created and uploadedtheir own video or music
Social, entertainment and learning
Information and exploration
Civic engagement and creativity
Used the internet for schoolwork
Talked to family or friendswho live farther away
Learned by searching online
Visited a social networking site
Played online games
Watched video clips
Posted photos or comments online
Looked for health information
Used the internet to talk to peoplefrom different places or backgrounds
Looked for news online
Looked for information aboutwork or study opportunities
Participated in a site where peopleshare their interests or hobbies
89%52%
73%64%53%
73%64%
88%
71%
76%68%59%
55% 55% 58%
52% 64%
50% 70% 77%
21% 29% 33%
20% 29% 45%
28% 31% 35%
47%
20% 21%44%
11% 26% 29%
14% 33%9%
13% 17% 16%
7%18%3%
6%17%5%
3% 4% 4%

UNICEF – THE STATE OF THE WORLD’S CHILDREN 2017
PERSPECTIVE
A Vision for the Future: Reflections on children’s rights in the digital age
Pony Ma
As a father, my wish is to see my child grow and strive, a wish shared by parents the world over. How can our children grow up happy and safe from harm and disease? Do they need fresh air, clean water, a beautiful environment, a harmonious family, a supportive society or a country that is rich and strong? I believe they need all of those, and more.
My child was born ‘digital’, into a generation whose members have been dubbed ’digital natives’. They are the happiest generation because they have convenient, fast and effective access to information and can enjoy their lives like no other before them.
Meanwhile, we are increasingly aware that not all children are realizing their rights. And we are seeing how the denial of child rights takes on a new meaning in the internet age. Regardless of their region, wealth or status, children have the right to develop; to fully participate in family, cultural and social life; and to have equal access to information, self-expression and education.
However, even with better technologies and improvements in productivity, the gap between those with and without access to computers and the internet is expanding. In December 2016, the number of ‘netizens’ under 19 years of age reached 171 million – in China alone. Yet, many children in China, and around the world, lack access for economic and social reasons. The internet, as a public property, can and should be leveraged to bridge this digital divide.
To connect people in rural parts of China, in 2015 we initiated a mobile internet programme called WeCountry. Two years later, while problems remain to be solved, we are pleasantly surprised to find that the programme has helped teach those new to the internet how to use it and has given many disadvantaged children access to information and learning opportunities.
But, implementing child rights in a digital age is not only about closing the
digital gap. As one of China’s largest comprehensive internet service providers, Tencent bears a considerable responsiblity: Millions of children are using our products to communicate, learn and entertain themselves every day. Children and parents need to understand there are risks behind these opportunities. False or malicious information and violent or pornographic material online put children at risk of harm. Data breaches releasing personal or private information, such as children’s photos or identities, can be used to exploit them and lead to serious consequences. Cyber violence and bullying has become a global problem. Finally, internet fraud, organized crime and child trafficking threaten to translate online shadows into offline evils.
As a father, I am deeply worried by the online risks children face daily. As an internet entrepreneur, I am very aware of the responsibilities on my shoulders.
Tencent is accountable for protecting the online safety of every child. To this end, Tencent incorporates online child protection in all aspects of its business practices. For example, in November 2016, the company launched the ‘Tencent for children – Child rights protection in a digital world’ initiative and announced the Child Online Protection Project with UNICEF. The partnership will dive into a wide range of issues including cyber violence, cyberbullying, exposure to inappropriate content and online gaming. The aim is to form a balanced understanding of children’s internet usage for the purposes of policy advocacy, raising public awareness and building an industry coalition. This project will help advance the agenda of online child protection across sectors – government, the information and communication technology (ICT) industry, academia and civil society organizations – and explore the positive impact of the internet on children.
The internet age is characterized by rapid, innovative changes in technology and human-computer interactions and has the

69 02 PERSPECTIVE
The ICT industry is duty-bound toplace child rights and protection at the heartof technology and product innovation.
“
In Cebu, the Philippines, 16-year-old Jan (background centre) suffered cyberbullying and read posts about self-harm during a difficult time in her life. She now works to educate her peers about online safety. © UNICEF/UN014975/ESTEY
potential to broaden children’s experiences and development. It is easy to imagine how image recognition, artificial intelligence (AI), augmented reality, gene sequencing and even neural technology will improve children’s lives.
At the same time, new technologies will demand our full attention in terms of potential risks. Take, for example, the debate around potential biases or discrimination by AI algorithms. It is still unclear whether algorithms are introducing gender or racial biases into decision-making.
As a driving force for technological innovation, the ICT industry is duty-bound to place child rights and protection at the heart of technology and product innovation efforts, where they will serve to influence legislation and policymaking, improve public awareness and develop industry standards to safeguard the global Child Online Protection Initiative.
Protecting every child from all forms of online harms is our common aspiration.
Each and every child also needs the patience and proper guidance of parents, which allows them to be curious about the world around them – real or virtual – so they can keep exploring and grow up healthy, happy and independent.
An old Chinese saying advises, “Take care of one’s own children first and then extend the same care to the children of others.” Protection of children’s rights should cross the boundaries of industries, organizations and countries. Only cooperation can hold us accountable and allow us to protect children for the benefit of all humankind. Let’s join our hands and forge ahead for the next generation and beyond.
Pony Ma is the co-founder of Tencent, one of the largest internet companies in China, and currently serves as its executive director, chairman of the board and chief executive officer. Pony oversees strategic development, overall direction and management of Tencent. He received his Bachelor of Science in Computer Science from Shenzhen University in 1993.

Full articles by youth contributors featured in The State of the World’s Children 2017 can be found at: <www.voicesofyouth.org/en/sections/content/pages/sowc-2017>
YOUSEF AL HEREK, 17SYRIAN ARAB REPUBLIC
“ I started to dig deeper and read about hacking – what if someone illegally accessed my account and started reading my private messages? I decided that my privacy is priority, so I updated the operation systems of my phone and computer and added additional security layers to protect my accounts and myself.”
03Digital Dangers: The harms of life online

71
It has never been easier for bullies, sex offenders, traffickers and those who harm children to contact potential victims around the world, share images of their abuse and encourage each other to commit further crimes. Digital connectivity has made children more accessible through unprotected social media profiles and online game forums. It also allows offenders to be anonymous – reducing their risk of identification and prosecution – expand their networks, increase profits and pursue many victims at once.
Children’s privacy is also at stake. Most children – and many parents – have very limited, if any, awareness of how much personal data they are feeding into the internet, much less how it might one day be used.
No child is safe from online risk, but the most vulnerable are those most likely to suffer the harms.
In Madagascar, a 17-year-old girl was asked by her teacher for the equivalent of about US$300.00 in exchange for a passing grade. Desperate to find the money, she reached out to a man she’d been in contact with online for six months. “He kidnapped me and kept me locked in his house for two months. He raped me repeatedly,” she said. After her rescue by a new cybercrime police unit, she received medical attention, advice and psychological support at a One-Stop Service Centre managed by the government with support from UNICEF. The man and teacher were both arrested. “I’m doing OK now. I’ve gone back to school,” she said. “I wish I had had some guidance. My parents didn’t know I was talking to strangers.”1
For most parents and caregivers, the girl’s story represents their worst nightmare of what can happen when a child goes online. Although her experience represents an extreme example of online harms, it goes to the heart of widespread concerns about the threats facing children on the internet: Namely, that going online can dismantle the traditional protections most societies try to place around children, exposing them to unacceptable content,
unacceptable behaviour and potentially dangerous contacts with the outside world.
These risks are not entirely new – children have long bullied and been bullied, have often been exposed to, or sought out, violent and sexual material, and have always been at risk from sexual offenders. But most parents probably feel it was easier to protect previous generations from such risks. The front door was once a barrier to schoolyard bullies; now, social media allows them to follow their victims into their homes.
These risks must be seen in context, however. All children face the possibility of encountering harm as a result of internet technologies. But for most children, the possibility remains just that – a possibility. Understanding why risk translates into actual harm for certain children, and not for others, is crucial. It opens our eyes to the underlying vulnerabilities in the child’s life that can place him or her at greater risk in the digital age. By better understanding and addressing these vulnerabilities, we can better protect children both online and offline, and better enable them to enjoy the opportunities that come from being connected in the digital age.
Going online can dismantle the traditional protections most societies try to place around children.
“

UNICEF – THE STATE OF THE WORLD’S CHILDREN 201772
Three forms of risk: Content, contact, conduct
Researchers now typically organize the wide range of risks encountered online into three categories – content, contact and conduct risks.2
Content risks: Where a child is exposed to unwelcome and inappropriate content. This can include sexual, pornographic and violent images; some forms of advertising; racist, discriminatory or hate-speech material; and websites advocating unhealthy or dangerous behaviours, such as self-harm, suicide and anorexia.
Contact risks: Where a child participates in risky communication, such as with an adult seeking inappropriate contact or soliciting a child for sexual purposes, or with individuals attempting to radicalize a child or persuade him or her to take part in unhealthy or dangerous behaviours.
Conduct risks: Where a child behaves in a way that contributes to risky content or contact. This may include children writing or creating hateful materials about other children, inciting racism or posting or distributing sexual images, including material they have produced themselves.
Winny Moreira, centre, used her experience of being cyberbullied to create the YouTube video shown on the screens, which aims to help other Brazilian girls protect themselves online. © UNICEF/UN017649/UESLEI
MARCELINO

03 DIGITAL DANGERS: THE HARMS OF LIFE ONLINE 73
TYPOLOGY OF ICT-RELATED HARMS
Content Child as recipient
Contact Child as participant in adult-initiated activity
Conduct Child as victim / actor
Aggression and violence
• Self-abuse and self-harm
• Suicidal content• Discrimination• Exposure to
extremist/violent/gory content
• Radicalization• Ideological persuasion• Hate speech
• Cyberbullying, stalking and harassment
• Hostile and violent peer activity
Sexual abuse • Unwanted/harmful exposure to pornographic content
• Sexual harassment• Sexual solicitation• Sexual grooming
• Child sexual abuse• Production and
consumption of child abuse material
• Child-produced indecent images
Commercial exploitation
• Embedded marketing• Online gambling
• Violation and misuse of personal data
• Hacking• Fraud and theft• Sexual extortion
• Live streaming of child sexual abuse
• Sexual exploitation of children
• Trafficking for the purpose of sexual exploitation
• Sexual exploitation of children in travel and tourism
Source: Burton, Patrick, Brian O’Neill and Monica Bulger, A Global Review of Evidence of What Works in Preventing ICT-related Violence, Abuse and Exploitation of Children and in Promoting Digital Citizenship, forthcoming.
While it is relatively easy to categorize various forms of risk in general, it is much harder to determine the risk relationship between, for instance, a particular online image or activity and an individual child. One reason for this is that attitudes towards what constitutes a risk vary greatly among cultures. For example, consensual sexual exploration among children using offline and online mediums, including texting or ’sexting‘, is acceptable in some cultures
but not in others. Risks, therefore, are not always a function of the behaviour itself but are in some cases a reflection of how society perceives that behaviour.3
Equally, different children can have the same experience online and yet experience very different outcomes.4 One 2009 pan-European survey found a range of responses among children to pornographic content seen online: Some children were not

UNICEF – THE STATE OF THE WORLD’S CHILDREN 201774
concerned about it, some thought it was funny and others wished they had never seen it5 (a response that would normally be interpreted as indicating the child had suffered harm). When faced with these types of risks, most children in the study responded with strategies that were either positive (seeking help from others) or neutral (ignoring the risk). Others seemed less able to diminish the risk and ended up, in turn, perpetrating other ‘conduct’ risks themselves.
A final point: In and of itself, risk is not inherently bad. Developmental psychologists believe that some exposure to risk is essential for children to learn how to adapt and become resilient.6 In the offline world, this idea is so familiar that it is usually taken for granted – think of when a child is first learning to swim or to ride a bicycle. But while tolerance of risk varies among societies, cultures, communities and individual families, most can agree that some risks are uncomfortably close to the line crossing into harm.
When risk becomes harm
Assessing the extent to which risks translate into actual harms is extremely difficult. The content-contact-conduct framework used to describe risks also provides a way of thinking about the actual harms that children may experience online, as the typology table shows.
But even if the number of children suffering severe harm is probably not that high, when harm does occur, according to one review of evidence in this area, its impact on the child can be very significant and justifies substantial resources and attention.7 As numerous cases over the years have demonstrated, severe harm can manifest itself as much in mental distress as in real physical injuries, including self-harm and suicide. Major areas of concern in terms of harm include pro-eating disorder and pro-suicide
websites,8 as well as cyberbullying and online child sexual abuse and exploitation.
Cyberbullying: “Nobody deserves this”
When Amanda Todd, a Canadian adolescent, was about 13, a man she met in a video chat room convinced her to expose her breasts on camera. He captured the image and used it to blackmail her, threatening to send the image to her friends and family. She ignored the threat and over the next two years was subject to bullying (both online and offline), harassment and physical assault. Despite her efforts to escape the torment – she moved both schools and cities – the attacks continued, both by the online offender and by her classmates. During this time, she struggled with depression, drug and alcohol abuse, isolation, loneliness and self-harm. Two years later, in October 2012, at 15, Amanda committed suicide.
The Cyberbullying Research Center defines cyberbullying as “willful and repeated harm inflicted through the use of computers, cell phones and other electronic devices.” Whereas in previous generations, children being bullied could escape such abuse or harassment by going home or being alone, no such safe haven exists for children in a digital world. Carrying a mobile phone, laptop or other connected device means that texts, emails, chats and social media posts can arrive anytime, day or night. And online bullying carries on, spreading widely among peers and inflicting reputational harm whether the child is online or off.
The potential for bullies to hide behind a nameless profile, pose as someone other than themselves and – in a single click – instantly disseminate violent, hurtful or humiliating words or images is unprecedented. Moreover, once such
The potential for bullies to instantly disseminate violent, hurtful or humiliating words or images is unprecedented.
“

03 DIGITAL DANGERS: THE HARMS OF LIFE ONLINE 75
content is posted, deleting it is difficult, which increases the risk of victims being revictimized and makes it hard for them to recover.
Victims of cyberbullying are more likely to use alcohol and drugs, to not attend school, to experience in-person bullying, to receive poor grades and to experience lower self-esteem and more health problems than others. Survivors of such abuse express the severity of the impact, which sometimes leads to suicide or thoughts of suicide.9
Amanda’s story, told above, illustrates both the potentially extreme impact of cyberbullying and the loss of control over content once it has appeared online (see box: Self-generated sexually explicit material). Strong evidence shows that girls face much greater pressure to send sexually explicit images and suffer much harsher judgements when those images are shared beyond the intended recipient.10
Her experience also illustrates the fluidity between cyberbullying and traditional
bullying. A month before her suicide, using a series of 73 flashcards, Amanda told her story in a nine-minute video on YouTube. During one brutal in-person confrontation with classmates described on her cards, “In front of my new school (50) people… / A guy than [sic] yelled just punch her already / So she did… She threw me to the ground a [sic] punched me several times / Kids filmed it. I was all alone and left on the ground. / I felt like a joke in this world… I thought nobody deserves this:/”
Amanda’s video went viral and by the time of this writing had received approximately 40 million views. Because of her story and those of other victims, in 2014, the Canadian government introduced legislation aimed at combating online harassment by making it illegal to distribute intimate images of a person without his or her consent. The bill has been criticized as a potential privacy violation because it allows police to access online data, phone records and digital tracking. In response to the criticisms, however, Carol Todd, Amanda’s mother and founder of the Amanda Todd Legacy Society,
In Madagascar, 16-year-old Charmela’s family can’t afford to send her to school. She spends much of her time on the internet, where she has experienced online soliciting. © UNICEF/ UN015588/PRINSLOO

UNICEF – THE STATE OF THE WORLD’S CHILDREN 201776
which participates in advocacy and outreach with a particular focus on adolescents’ mental health issues, told the Commons Committee on Justice, “We should not have to choose between privacy and our safety.”
Online child sexual abuse and exploitation
It has never been easier for child sex offenders to contact potential victims around the world, share images of their abuse and encourage each other to commit further crimes. “The scale of this crime is shocking,” Jürgen Stock, secretary general of INTERPOL, has said, “made worse by the fact that these images can be shared online globally at the touch of a button and can exist forever. Each time an image or video clip is shared or viewed, the child is being re-victimized.”
Advances in technology allow offenders to remain anonymous, cover their digital tracks, create false identities, pursue many victims at once and monitor their whereabouts. The increased use of mobile devices and greater access to broadband internet has made children more accessible than ever through unprotected social media profiles and online game forums. Offenders often begin grooming their victims on these platforms, where they gain a child’s attention or trust, before moving the communication to video- and photo-sharing platforms, which can lead to content-driven or financially driven extortion or meeting offline.11
Old crimes, and new
A 12-year-old girl in the Philippines who was forced to live-stream sexual acts from her neighbour’s house spoke about her experience: “When the foreigner says ‘get naked,’ then we undress.… The foreigners were from USA, Australia, UK, China. I would say, ‘You want to buy a show?’ And
the foreigner would say, ‘Yes’.” She would earn the equivalent of about US$3.00 for each ‘show’. At one point, one of her online abusers travelled from the United States to meet her, but she was able to escape that encounter and was later rescued by the police in a raid. “My parents didn’t know that I was doing the shows. I lied to them about it. But I regret that I did it.” She is required to stay in a shelter until her neighbour is tried in court.12
The online world did not create crimes of child sexual abuse and exploitation, but it has changed them in two significant ways: It has facilitated existing ‘common’ forms and created wholly new forms.
These impacts are set out in a recent study by the United Nations Office on Drugs and Crime (UNODC),13 which shows that new ICTs can increase access to victims and to child sexual abuse material, increase profits for criminal enterprises, reduce risk of identification and prosecution for perpetrators, provide social affirmation for offenders and increase levels of harm for victims. As a result, there is now greater opportunity for such ‘common’ forms of crime against children and greater potential for harm. As for the new forms of child abuse and exploitation described by UNODC, these include ‘made-to-order’ child sexual abuse material, self-generated content and the broadcasting of live sex abuse.
The UNODC study also examines the sexual exploitation of children – namely, trafficking in children for the purposes of sexual exploitation, and the sexual exploitation of children in travel and tourism. The study notes that ICTs have lowered the costs of trafficking operations. Traffickers are able to “recruit, advertise, organize and communicate primarily, or even exclusively, via mobile phone or devices such as tablets, effectively streamlining their activities and expanding their networks.” This creates a new digital marketplace for modern-day slavery.14 Offenders also have more control
Traffickers are able to recruit, advertise, organize and communicate primarily, or even exclusively, via mobile.
“
03 DIGITAL DANGERS: THE HARMS OF LIFE ONLINE 77
over their victims’ movements. Not only can they require victims to call them at the beginning and end of each encounter, but they can also track their movements using GPS-enabled devices.15
A crime without borders
According to the Internet Watch Foundation (IWF), 57,335 uniform resource locators (URLs) contained child sexual abuse material in 2016. Of these, 60 per cent were hosted in Europe and 37 per cent in North America. Ninety-two per cent of all child sexual abuse URLs identified by the IWF are hosted in five countries: the Netherlands, the United States, Canada, France and the Russian Federation (listed by most to fewest URLs).16
Fifty-three per cent of the victims of such abuse were 10 years old or younger – a staggering figure, but also a drop from
69 per cent in 2015. However, the number of images of 11- to 15-year-old children increased: from 30 per cent in 2015 to 45 per cent in 2016. One reason for this shift is an increase in self-produced content shared online (see box: Self-generated sexually explicit material).
In the 2016 NetClean Report, a survey of police officers in 26 countries showed that the material they handle in their investigations primarily depicts children from Europe and North America. One respondent to the survey explained that children are more likely to be victims if they live in “countries with high internet devices per person and reliable internet service” or in countries that have “poor or no laws prohibiting sex offenses against children and also have easy access to children.”17
Europol’s 2016 report points out that between 2012 and 2017, as many as
92% of all child sexualabuse URLs arehosted in 5 countries:the Netherlands, theUnited States, Canada,France and theRussian Federation.
“
Self-generated sexually explicit material
A new challenge in the identification of child sexual abuse material is the emergence of self-generated sexually explicit material.19 This is often conflated with consensual ‘sexting’ but it can also include material produced non-consensually – for example, through online solicitation and grooming and sexual extortion.20
While this trend requires further research, a 2015 Internet Watch Foundation (IWF) report on youth-produced sexual content highlighted the extent to which control over the content is lost once it has appeared online: 89.9 per cent of the images and videos assessed as part of their study had been “harvested from the original upload location and
were being redistributed by third party websites.”
While it is often assumed that material from self-generated sexual content is produced using mobile devices, 85.9 per cent of content depicting children 15 and under was created using a webcam.
A third key finding of this study was the high proportion of content depicting children 13 and under. IWF calls for “further research aimed at understanding the drivers for children to create and distribute such content” and the “need for awareness-raising campaigns aimed at younger age groups to highlight to younger children and their parents the risks which they are taking online.”21

UNICEF – THE STATE OF THE WORLD’S CHILDREN 201778Children’s attitudes to online risk can differ from those of adults: Where adults may consider meeting a stranger online as particularly dangerous, a child may view such encounters as an opportunity to make a new friend. © UNICEF/UNI190722/D’AKI

03 DIGITAL DANGERS: THE HARMS OF LIFE ONLINE 79
“100 million children will be coming online for the first time … and that 80 per cent of those will be connecting via mobile devices. A significant proportion of these children will be connecting from African and South-East Asian countries.” Without proper safeguards in place, more children will be vulnerable to online risks of harm in these emerging ICT-enabled countries and regions.
New challenges
One challenge of combating online sexual crimes against children is the constantly evolving nature of digital technology. Peer-to-peer networks (P2P) and, increasingly, the Dark web (see graphic) continue to facilitate the exchange of child sexual abuse material (CSAM), but there are also relatively new challenges, such as live-streaming of child sexual abuse and self-generated sexually explicit material (see box Self-generated sexually explicit material), which are adding to the volume of CSAM.18
Digital currencies and the Dark web
Another factor contributing to the escalation in the live-streaming of child abuse is the growing use of cryptocurrencies, or anonymous payment systems and of end-to-end encrypted platforms for sharing media. These pose a real problem for law enforcement seeking to gather evidence of child abuse, as such content does not require downloading, and, even if downloaded, can be inaccessible or quickly wiped out by pre-installed software.22 File sharing through P2P networks has transformed and expanded the distribution of CSAM,23 whether on the Surface web or via the Deep web, the part of the internet not indexed by search engines and thus invisible to most users.
Within the Deep web is the ‘Dark web’, which contains intentionally concealed content. Special anonymity-granting web browsers are used to access it. One such
example is Tor (The Onion Router). As research by the Global Commission on Internet Governance (GCIG) points out, “The Dark Web poses a dilemma. Illegal markets, trolls and online child abuse rings proliferate due to the technology of Tor and other similar systems. However, the anonymity provided by such systems gives cover for people in repressive regimes that need the protection of technology in order to surf the Web, access censored content and otherwise exercise their genuine right to free expression.”24
The GCIG paper concludes by recommending that “like every other aspect of human society, the Dark Web needs to be policed.”25 This means
Like every other aspect of human society, the Dark Web needs to be policed.
“
DARK WEBTOR, Peer-to-peer networks, Child sexual abuse material,
Illegal content and activities, etc.
DEEP WEBDatabases, records
and documents (Medical, Academic, Legal, Financial), etc.
Other content not indexed by standard search engines
SURFACE WEB Google, YouTube, Facebook,
Snapchat, Instagram, etc.
FIGURE 3.1 PARTS OF THE INTERNET

UNICEF – THE STATE OF THE WORLD’S CHILDREN 201780
supporting local law enforcement’s efforts to track down global criminals and bring them to justice – including by increasing resources for cybercrime and building capacity by training law enforcement officers to deal with cybercrime.
Which children are most vulnerable?
All children who go online face some level of risk, but not all face the same level of risk. Equally, some are more likely to suffer harm than others. Why? Not surprisingly, research increasingly indicates that children who are more vulnerable offline are more vulnerable online. Not only do children who report more offline risks report more online risks, they are also more likely to report harm resulting from those risks.26 This link between online and offline vulnerability can deepen the challenges facing some of the world’s most vulnerable and marginalized children.
Who are the most vulnerable children? Although there is a regrettable lack of research on some of the most marginalized communities and groups, existing evidence indicates that the children who are most vulnerable to online harms include girls, children from poor households, children in communities with a limited understanding of different forms of sexual abuse and exploitation of children, children who are out of school, children with disabilities, children who suffer depression or mental health problems and children from marginalized groups. Unguided digital access and a lack of awareness also put children at risk.27
Online and offline risks: “Two sides of the same coin”
The links between the online and offline contexts of cyberbullying are particularly striking. A large-scale study in the United Kingdom, involving responses from over
100,000 children, found that very few experienced cyberbullying without also being bullied offline.28 “The main takeaway here is that it doesn’t make sense to think of cyber-bullying as its own thing,” a co-author of the study, Andrew Przybylski of the Oxford Internet Institute, told the BBC. “If you’re a parent or you’re running a school or designing an intervention, [online and offline bullying] are two sides of the same coin.”29
The role of gender in cyberbullying and online harassment is also clear. According to the authors of an Australian study, harassment of women online, particularly those under 30, is in danger of becoming “an established norm.”30 Such harassment online is a clear continuation of offline sexism and misogyny. A 2015 report by the UN Broadband Commission for Digital Development titled Cyber Violence Against Women and Girls: A world-wide wake-up call notes, “Violence online and offline, or ‘physical’ VAWG [violence against women and girls] and ‘cyber’ VAWG, feed into each other.”
Children’s sexual identity also appears to be a factor. A 2013 study of 5,907 internet users in the United States aged 13–18 found that those who self-identified as lesbian, gay, bisexual or transgender were disproportionately at risk of online sexual harassment.31 Similarly, a 2008 study of Swedish children found that bisexuality or homosexuality was a considerable factor in predicting online sexual solicitation.32
Another important factor is disability. Data collected as part of the Youth Internet Safety Survey, which covered ages 10–17, showed that children with special education needs were more likely to experience risk online.33 Again, there were clear gender differences: Girls receiving special education services were three times more likely than boys to report online sexual solicitation.
Although specific evidence is lacking, there are reasons to be concerned about
Harassment of women online, particularly those under 30, is in danger of becoming “an established norm.”
“

03 DIGITAL DANGERS: THE HARMS OF LIFE ONLINE 81
I decided to tell my story to help other girls so this doesn’t happen to them.
“the possible online vulnerability of migrant children as well as children on the move or living in refugee camps.
Research in Italy indicates that migrant children tend to be at higher risk of bullying than native children.34 In addition, there are particular risks for children on the move and those living in camps, with the United Nations High Commissioner for Refugees warning that some are at “heightened risk of violence and abuse.” Given the documented links between offline and online violence, and how children on the move use digital technologies as a means of communication, entertainment and accessing information, the potential online risks facing these children deserve further investigation.
It is possible that children from minority groups are especially vulnerable to harm stemming from online violence and exploitation. The online space can be a refuge for children who seek companionship or information because they are ‘different’, a benefit of the internet that has been well documented.35 That a space perceived as supportive can then be a place of harassment and bullying may exacerbate the trauma and harm attached to the incident.36
Vulnerability to online sexual abuse and exploitation
In the Philippines, where online child abuse was a leading form of cybercrime in 2014, an 8-year-old girl was forced to perform sexual acts three times a day in front of her neighbour’s webcam for foreigners who would pay to watch. “I bought food [with the payment]. It was about 300 pesos” (US$6.00), she said. “My mother did not know anything about it.” Following a police rescue operation, she is now required to stay in a shelter until the case against her neighbour is resolved. “I really miss my mother and my family.” Reflecting on what she went through, she said, “I feel angry and I want to forget it.”37
When it comes to online sexual abuse and exploitation, vulnerabilities can vary depending on the child’s age. Younger children, for example, are particularly vulnerable to abuse by an adult or older peer within the family or in a setting or relationship where there is a position of trust.
By contrast, adolescents, are often exposed to a wider range of risks from abusers outside the family, including from offenders in the digital sphere. In El Salvador, a girl who was sexually exploited online at age 14 – not by a stranger but by her ex-boyfriend – explained that he asked for pictures of her “without a lot of clothes on or with no clothes at all,” she said. “That made me more uncomfortable.” After she broke up with him a few months later, he created a social media profile with her nude photos. “When I got the friend request … I felt my world crumbling. He’d sent friend requests to all my friends, to my mother, to my sister.” When the profile was made public, she went to the police. “They said it was my fault because I had sent the pictures.” After the incident, she said, “I felt abused. I felt really hurt. He didn’t get any punishment at all.” She hopes that other children can learn from her experience: “I decided to tell my story to help other girls so this doesn’t happen to them.”38
Children’s awareness of risks
In assessing vulnerabilities, it is also important to take account of children’s own attitudes towards online risks – which often differ considerably from those of adults.
While adults might consider meeting a stranger online one of the most dangerous things that could happen to their children on the internet, children and teens may see this as an opportunity to meet new people – and even develop romantic relationships.39 And while children value their privacy online (see Special section: Protecting children’s privacy online), they see risks

What do adolescents think about … online risks and harms
When participants in the State of the World’s Children 2017 workshops* were asked about their concerns in the online world, they came up with a wide variety of responses. Some echoed adult concerns about content, contact and conduct risks (see table: Typology of ICT-related harms), but others did not: For example, participants cited technological problems and parental intrusion in their online lives as things to be concerned about.
Nevertheless, their top concern was online privacy, especially the possibility of strangers accessing their personal information.“ I am careful to avoid privacy invasion.”
GIRL, 17, BRAZIL
“ I take care of my privacy, I make sure not everyone can see what I share, my pictures and status.” BOY, 15, GUATEMALA
“ Social media has negative aspects because people can use my profile to create others, which is absolutely wrong.” GIRL, 15,
PORTUGAL
They understood that privacy breaches might lead to further issues, such as identity theft or exploitation of their images.“ I am concerned about leakage of personal information – because this means leakage of my money and personal information.” BOY, 14, REPUBLIC OF KOREA
“ I don’t upload certain pics with which bad people can make dirty videos of us.” GIRL, 16, BHUTAN
while a few also reported concerns that their parents or caregivers might view what they post online. “ I think, would my parents read my messages?”
GIRL, 15, BURUNDI
They cited a wide range of strategies for protecting privacy, across a variety of platforms and devices.“ I am … careful not to disclose personal information, especially when chatting.” GIRL, 16, DEMOCRATIC REPUBLIC OF THE CONGO
“ I lock my Twitter account and make it a rule to not follow people I do not know in real life. I stop and think twice before uploading pictures of faces or locations.” GIRL, 17, JAPAN
Another concern of participants was unpleasant or negative encounters online, or accessing inappropriate or suspicious websites. “ I try to be careful with the content of websites both for the issue of virus and [my information that] the website tries to transmit to the internet.” GIRL, 16, BRAZIL
“ The fact that sexual photos or obnoxious advertisements are being uploaded … leads me to avoid using Facebook.” BOY, 14,
REPUBLIC OF KOREA
Concerns over privacy and cyberbullying made some of them hesitate to use digital technology …“ I am personally most worried about attitudes such as cyberbullying, other ways of harassment and online discrimination, and every time I see, I try to stop.” GIRL, 14,
URUGUAY
“ Cyberbullying. I am afraid of my friends commenting on my photo posted on Facebook.” GIRL, 16, SOLOMON ISLANDS.
“ I’ve been [cyberbullied by my friends] … they blame me because I have weird interest like anime and etc., and they keep mocking me until now.” GIRL, 17, MALAYSIA
as did the possibility of encountering annoying or disturbing content – such as violence, persistent pop-ups and unsolicited advertising.“ Sometimes, when we use Google or social media on a laptop then there is like a pop-out of a porn website.” GIRL, 16, MALAYSIA

They were particularly concerned about potential exposure to hacking, viruses and malware.“ I worry that one might publish bad things in my name if my account is hacked.” GIRL, 16, BURUNDI
“ I am careful about the ads on the sites that can affect my PC. I worry about the viruses that can affect my PC.” GIRL, 16, REPUBLIC
OF MOLDOVA
Participants discussed their parents’ concerns over adolescents’ use of digital technology. Noting that these concerns sometimes differed from their own, participants said parents appeared to be primarily worried about the bad influence the internet might have on their children …“ My parents worried that I learn bad things online like smoking, taking alcohol.” BOY, 17, MALAYSIA
“ Parents are usually careful about people I don’t know. Nowadays this type of caution makes sense because it is dangerous.” BOY, 16, BRAZIL
and that these online contacts might have serious consequences.“ I think that adults worry for our own good because it is also through the internet that many young people join terrorist groups.” BOY, 15, CENTRAL AFRICAN REPUBLIC
A few felt that parents and caregivers did not trust them to behave appropriately online. “ They are worried not so much about whether
people are speaking ill of me as whether I am speaking ill of others.” GIRL, 16, JAPAN
or worried about them viewing – intentionally or otherwise – inappropriate content, especially sexual content.“ We worry because our parents might
think that we are using internet to see pornography.” BOY, 13, TIMOR-LESTE
They also said that adults were worried about children being distracted from their schoolwork if they spent too much time on digital devices. Indeed, participants often shared those concerns. “ I am afraid of my school performance being worse.” GIRL, 16, THAILAND
“ My teacher was scared that I am not going to do homework that she gave me and then I am going to waste time online.” BOY, 17, MALAYSIA
Despite occasional frustrations with the older generation, participants felt parents’ concerns arose out of a genuine love for their children and a wish to keep them safe. “ They obviously worry about these things
because they care and love us. They don’t want us to get involved in some problems.” GIRL, 16, BHUTAN
“ Because they want the best for us. Because they want a better future for us.” GIRL, 16, GUATEMALA
“ Adults worry about those things because they see the child as a fragile person, easily fooled and who can get involved in bad stories and be kidnapped.” BOY, 17, BURUNDI
IN SUMMARYAdolescents have real concerns about the place of digital technology in their everyday lives. They are sensitive to the tensions created when their desire to engage online has to be weighed against their need to protect themselves, their responsibilities to themselves and others, and the responsibilities of adults to help them live and grow well in the digital age.
* Participants’ responses have been shortened and edited for clarity where necessary.

UNICEF – THE STATE OF THE WORLD’S CHILDREN 201784
to their privacy coming both from outside their sphere, such as from businesses and governments, and from within their own circle: overprotective parents, nosy parents and those who spy.40
One 2012 study of South African children aged 13–17 found that most were aware of the risks that could be encountered online, including how those risks translated from online to offline spaces. They also said they felt equipped to handle these risks and, importantly, that they were willing to take them in order to reap the benefits of going online, in particular, a sense of connectedness.41
There is variation, however, on how this sense of agency seems to play out across countries and among children of varying ages. In recent Global Kids Online studies in Argentina, the Philippines, Serbia and South Africa, the percentage of children aged 15–17 who knew how to activate and change their privacy settings ranged from 68 per cent to 98 per cent. Where younger children in the Philippines, Serbia and South Africa were surveyed, the rate was significantly lower, ranging from 5 per cent to 40 per cent.42
Preventing harm in the digital age
The wide range of risks that children can face online demands a great diversity of responses, some focusing on children’s behaviour and others on technological solutions. What links all these responses, however, is the need for a broad vision: Protecting children online, regardless of the particular risk they’re facing, requires holistic and coordinated responses that take account of the full circumstances of the child’s life and the wide range of players – parents, teachers, governments, businesses and children themselves – who have a part to play in keeping them safe.
Understanding the full context of a child’s life
Because children’s offline and online vulnerabilities are so linked, the risks they face online need to be approached within the context of the child’s total circumstances, including their offline risks. INSPIRE, a framework for preventing and responding to violence against children – developed by the World Health Organization in collaboration with UNICEF, the Global Partnership to End Violence Against Children and others, and promoted by the Special Representative of the United Nations Secretary-General on Violence against Children – identifies seven strategies for addressing violence, abuse and exploitation:
Implementation and enforcement of laws Laws banning violent punishment of children by parents, teachers or other caregivers; laws criminalizing all forms of sexual abuse and exploitation of children, including online; laws that prevent alcohol misuse; and laws limiting youth access to firearms and other weapons.
Norms and values Changing adherence to restrictive and harmful gender and social norms; community mobilization programmes; and bystander interventions.
Safe environments Reducing violence by addressing ’hotspots‘; interrupting the spread of violence; and improving the built environment.
Parent and caregiver support Delivered through home visits, in groups in community settings and through comprehensive programmes.
Income and economic strengthening Through cash transfers; group saving and loans combined with gender equity training; and microfinance combined with gender norm training.

03 DIGITAL DANGERS: THE HARMS OF LIFE ONLINE 85
Response and support services Counselling and therapeutic approaches; screening combined with interventions; treatment programmes for juvenile offenders in the criminal justice system; and foster care interventions involving social welfare services.
Education and life skills Increase enrolment in preschool, primary and secondary schools; establish a safe and enabling school environment; improve children’s knowledge about sexual abuse and how to protect themselves against it; life and social skills training; and adolescent intimate partner violence prevention programmes.
How do these strategies work in practice? As an example, cyberbullying can be prevented by changing norms and values so that they no longer enable such violence or condone it. Influencing what is considered acceptable and unacceptable can influence what peer bullies do.43
For example, the ConRed Cyberbullying Prevention Programme, which has been used primarily in Spain,44 provides young people with a forum to discuss what is socially acceptable and desirable within their school environment. Students then promote empathy for the bullying victim and draw out the negative consequences of cyberbullying. Quasi-experimental evaluations of this programme find that
In El Salvador, the ex-boyfriend of this girl posted nude photos of her online after they split up. The images subsequently appeared on other websites. © UNICEF/UN018651/
ZEHBRAUSKAS

UNICEF – THE STATE OF THE WORLD’S CHILDREN 201786
it reduces cyberbullying (along with cyber-dependence) and improves students’ perceptions of safety.45
Some programmes have focused on parents as gateways to child internet safety. The Cyber-Training for Parents Programme, part of the European Union’s Lifelong Learning Programme, is a blended learning initiative that combines online training with traditional classroom teaching – parents go to online platforms to improve their own digital skills and at the same time are provided with key safety messages concerning how to prevent and identify cyberbullying.
Preventing online child sexual abuse and exploitation
Through global efforts such as the WePROTECT Global Alliance to End Child Sexual Exploitation Online, leading technology companies, international organizations and 77 countries have made an urgent commitment to end child sexual abuse and exploitation through a coordinated response.
UNICEF, as part of the WePROTECT initiative, has implemented a global programme to build the capacity of governments, civil society and the private sector to tackle online
Internet safety campaigns
Around the world, many national campaigns have been created to raise awareness of internet safety issues, to encourage responsible online behaviour and to promote policy change. In Argentina, for example, UNICEF and the provincial government of Buenos Aires designed the ongoing Digital Coexistence programme to promote children’s rights online. Information guides were produced to show children how to use the internet safely and responsibly and to help parents support their children. UNICEF Argentina has also organized a campaign, using the hashtag #nodacompartir (‘It’s not cool to share’), with the Ministry of Justice and Human Rights to raise awareness among adolescents of the consequences of sharing offensive, insulting and discriminatory content online.
In Brazil, UNICEF’s Surf Safe campaign promoted safe online behaviour among adolescents and addressed issues including cyberbullying and sexting, online friendships and privacy. The campaign, launched in 2015, reached almost 14.5 million people and generated more than a million social media views. UNICEF’s implementing partner, Safernet, also maintains a helpline to assist children, adolescents and young people affected by online violence. The main topics addressed by the helpline in 2016 were cyberbullying,
with 312 cases; sexting, 301 cases; and problems with personal data, 273 cases.
In Albania, the #openyoureyes campaign was launched in December 2016 to increase awareness of internet safety issues and provide information to children, parents, teachers and service providers. The campaign, developed by UNICEF and supported with funding from the Government of the United Kingdom, used a combination of TV spots, billboards and posters to tell children that when they went online they would probably encounter risky content and behaviour, but they could handle those risks by supporting each other and talking to parents and teachers. Albania has also launched an online platform, <www.Isigurt.al>, for reporting of online abuse and offences.
In India, the #staysafeonline campaign has also aimed to raise awareness among boys and girls on how to safely navigate the online world and how to help each other to stay safe online. The campaign, which was designed in line with findings and recommendations from the UNICEF Child Online Protection in India report, launched in September 2016, has worked to disseminate three core messages among children: Be there for a friend in need, treat others with respect and advise others to be real friends.

03 DIGITAL DANGERS: THE HARMS OF LIFE ONLINE 87
child sexual exploitation. Since 2013, more than 60,000 children, parents and teachers in 12 countries have been provided with information on how to mitigate online risks for children. More than 1,000 ICT industry representatives in 23 countries participated in consultations on their role and responsibilities in relation to online protection. And more than 1,000 law enforcement officers, prosecutors and judges in 14 countries improved their capacity to investigate and prosecute crimes of online child sexual exploitation.46
In nine countries, specialized units within law enforcement agencies and prosecutors’ offices are enhancing national capacity to investigate and prosecute such crimes. For example, in Guatemala, the Cybercrime Investigation Unit and the National Prosecutor’s Office have dismantled two networks that produced online child sexual abuse materials. In Jordan, a newly established police unit for online crimes against children received specialized training and visited schools to raise children’s awareness of the risks of online exploitation and abuse, how to protect themselves and how to report these crimes. The unit has dealt with 21 cases since its opening in November 2016.
“It is important for children to be aware of how to use the internet safely,” explains Captain Al-Refaie of the Cybercrime Unit in Jordan’s Public Security Directorate. “Schools should provide them with the basic rules and awareness, as part of their education. Parents, too, play an essential role and should encourage an open dialogue with their children, but sometimes they lack knowledge of what is safe use. When children are not learning about safe use in schools or from their parents, we, as police, try to provide the necessary awareness.”47
Among upcoming challenges, Europol points out that the increased use of digital currencies, anonymous payment
systems and the development of new software encryptions help predators and traffickers conceal transactions for both online and offline child sexual abuse and exploitation. Facial recognition and geolocation software could also heighten risks for vulnerable children by allowing offenders to identify and locate potential victims48 – but they can also help law enforcement identify and rescue victims.
Solutions using artificial intelligence
Over a decade of studies show that hundreds of searches for child abuse images occur every second, and hundreds of thousands of pieces of child sexual abuse material (CSAM) are shared through peer-to-peer (P2P) networks every year.49 The sheer volume of material makes manual detection and identification close to impossible. Fortunately, some new tools using artificial intelligence may be helping meet this urgent challenge.
Digital forensic tools such as RoundUp and Child Protection System can monitor activity in P2P networks and offer geolocation and identification of points in the computer network that are involved in the sharing of CSAM.
Microsoft donated its PhotoDNA technology to the International Centre for Missing and Exploited Children. The technology, which was integrated into INTERPOL’s International Child Sexual Exploitation (ICSE) database, creates a unique signature – a digital ‘fingerprint’ – from an image that allows for comparisons to find matching images, even if the image has been altered.50
The fingerprint is generated from the binary data of a photo or video and can be used to find the image anywhere online. This allows law enforcement agencies to maintain a database and detect modified versions of known CSAM. To date, use of the database has led to the identification of about 7,800 victims from
Schools should provide [children] with the basic rules and awareness, as part of their education.
“

UNICEF – THE STATE OF THE WORLD’S CHILDREN 201788
R.AGE against predators
With more than 7 out of 10 people online in 2015, Malaysia has seen rapid growth in internet connectivity. But the pace of change in national laws and the social understanding of internet-related crime has not always been so quick. In 2016, the R.AGE group of young journalists set out to draw attention to some of these issues through a campaign backed by UNICEF, among others. Their objective was clear: Catch on tape sexual predators who use chat apps to groom children and show how vulnerable children are to perpetrators exploiting digital technology to sexually abuse children. At the time, there was no comprehensive law against sexual grooming in Malaysia.
In one secretly filmed sting, a 26-year-old reporter posed as a 15-year-old girl to meet a man she had encountered on a mobile chat app. He tried to convince her to come to his hotel room, telling her, “You’re not the only young girl I know. There are many.”
The R.AGE group’s videos went viral, with over 3.7 million views in just over six months, starting a public debate and movement calling for stronger legislation. The facts were undeniable: Grooming and online child sexual abuse occurs in Malaysia and is perpetrated by Malaysian nationals. “It shocked me to find out how prevalent this issue was in Malaysia,” wrote Samantha Chow, a R.AGE reporter.
In support of legislative efforts undertaken by Dato’ Seri Azalina Othman Said, Malaysia’s Minister of Law, the journalists used social media and interactive mapping to mobilize Members of Parliament one by one, under the hashtag #MPsAgainstPredators. And it worked. In April 2017, Malaysia’s Parliament passed the landmark Sexual Offences Against Children Act. New offences are now encompassed, including online grooming and exploitation of children in pornography, to keep children safe online and offline.
Seventeen-year-old Angeline Chong (centre), who has experienced cyberbullying, recently joined R.AGE’s young journalist programme. Learn more about Angeline and R.AGE’s at <www.unicef.org/sowc2017> © UNICEF/UN0140092/HUMPHRIES

03 DIGITAL DANGERS: THE HARMS OF LIFE ONLINE 89
nearly 50 countries – an average of seven identifications per day – and the arrest of more than 3,800 offenders.51
To identify new or previously unknown CSAM being shared in P2P networks, researchers in Europe have developed a new software tool called ’iCOP’. It uses machine learning to triage thousands of files and go beyond matching files to known materials to looking for new file names. In addition to performing live forensic analysis outside of human capacities, the material detected by this software – new CSAM – is critical, as it can link to recent or even ongoing child abuse.52
Pointing the way forward
Any discussion of the risks and harms facing children in the digital age must not fail to consider two additional points: First, in a recent survey, most children who are online reported it as a real positive in their lives.53 In seeking to protect children online, the focus should thus be less on restriction and more on open communication between children and caregivers and on developing children’s digital awareness, resilience and capacity to manage risks – not only for the present but for the rest of their lives.
Second, there is a real tension between protecting children online and defending their rights to access information and make their voices heard. A recent UNICEF paper argued that “current public policy is increasingly driven by overemphasized, albeit real, risks faced by children online, with little consideration for potential negative impacts on children’s rights to freedom of expression and access to information.”54 There is no easy resolution to this tension, which, in many countries, reflects deeper political issues of control over access to information and expression.
A shared responsibility
The task of keeping children safe online is not for any one sector or actor; collaboration and cooperation between caregivers, teachers, schools, governments, law enforcement, civil society and the private sector is essential.
In the area of sexual abuse and exploitation, for example, it is crucial to break the silence around sexual violence. To do this means to challenge attitudes, norms and behaviours that support child sexual abuse and exploitation through mobilization, education and raising awareness among children, families, teachers and communities – including religious communities, media, the travel and tourism sector and the ICT sector.
It is also imperative that law enforcement agencies receive adequate resources and frequent training to allow them to keep pace with the constant evolution of cybercrimes involving children, because it is difficult, if not impossible, for them to keep up with rapid technological change. To do so, they need the help of their governments and the private sector, among others. With the introduction of innovative tools, the tech industry and its researchers are playing a vital role in the detection, identification and removal of CSAM, as well as identifying victims and tracking down offenders.
The global and interconnected nature of the internet means that protecting children is not a challenge that any one country can meet on its own, which is why international efforts, such as those led by the WePROTECT Global Alliance Against Child Sexual Abuse Online, need to be supported. The urgency of this call only intensifies as more children around the world spend more time online. For the most disadvantaged – some of them connecting today for the very first time – the right, unified action could make the difference between a childhood blighted by abuse or exploitation and a gateway to expanded chances in life.
The tech industry plays a vital role in removing child sexual abuse material, identifying victims and tracking down offenders.
“

UNICEF – THE STATE OF THE WORLD’S CHILDREN 201790
“Don’t be a victim of cybercrime!!!” warns this screen during an internet safety class in El Salvador. © UNICEF/UN018678/ZEHBRAUSKAS

91 03 THE HARMS OF LIFE ONLINE: SPECIAL SECTION
Data processing from online and other activity affects everybody, and not always in negative ways (see Special Section: How ICTs are supporting humanitarian action). However, there are significant concerns over how industrial-scale data processing, especially by business and the state, may affect the young. Children may have a very limited understanding of the risks such processing poses and may set low, or no, limits regarding all the bits of information they feed into the internet. Children also risk having their rights violated or abused55 as ‘big data’ transform the internet into the Internet of Things and ultimately the Internet of Everything, where any and every bit of information can be seized upon as being useful to someone. Parents, too, often do not understand what data are collected from and about their children.56
Collecting personal data is now seen by companies as ‘business critical’.57 As The Economist recently commented, the most valuable resource for business today is not oil but data.58 For businesses, children can be important targets as sources of data because they influence their friends’ and families’ consumer decisions.59 Some may also be significant consumers themselves – both today and, crucially, in the future, when investment in securing their brand loyalty may really pay off.
‘Behavioural’ advertising, targeting online ads to specific behaviours, as well as other advertising techniques, can contribute
to the growing commercialization of childhood.60 But beyond being targeted as consumers, children risk something even greater when businesses become interested in what they are doing online: Their whole private world may be opened up to the marketing machine, which will not only watch and record what a child is doing but also reconstruct and manipulate the online social environment in ways that impact the child’s sense of self and security.
Children’s privacy may also be targeted by the state. Governments can collect vast amounts of online personal data on children, a type of surveillance largely unimaginable in the pre-internet era.61 Often neither lawful nor publicly acknowledged, mass surveillance now forms a key part of national security efforts in many countries. Not only does it undermine basic notions of privacy, it also threatens other basic human rights, such as freedom of expression, and opens the door to potential abuses of state power. As a recent UNICEF discussion paper noted, given the lack of information on how much data governments are collecting and how long they are holding the data for, the full implications of mass surveillance for children are unclear, but the potential outcomes are worrying: “If governments are able to link individual profiles with data intercepted by mass surveillance, as many believe feasible, this would allow authorities to build and maintain records of children’s entire digital existence.”62
SPECIAL SECTION: Protecting children’s privacy online
Every time a child posts a photo on social media, browses for products or searches for something online, he or she generates data. Those data, in turn, feed into an industry that processes the child’s personal information, including identity, location, preferences and many other details.
The most valuable resource for business today is not oil but data.
“

UNICEF – THE STATE OF THE WORLD’S CHILDREN 201792
A final potential source of abuse of children’s data comes from their own parents. A 2010 survey found that 81 per cent of children under age 2 in 10 high-income countries (Australia, Canada, France, Germany, Italy, Japan, New Zealand, Spain, the United Kingdom and the United States) had a digital footprint, meaning that they had a profile or images of them posted online.63
Parents oversharing information about their children is nothing new. However, today’s digital lifestyle can take it to a new level, turning parents into “potentially the distributors of information about their children to mass audiences.”64 Such ‘sharenting’, which is becoming more and more common,65 can harm a child’s reputation. It can create potentially serious results in an economy where individuals’ online histories may increasingly outweigh their credit histories in the eyes of retailers, insurers and service providers.66 Parents’ lack of awareness can cause damage to a child’s well-being when these digital assets depict a child without clothing, as they can be misused by child sex offenders. It can also harm child well-being in the longer term by interfering with children’s ability to self-actualize, create their own identity67 and find employment.68
Regulation of children’s privacy
Despite the greatly expanding threats, national law does not always provide adequate protection of children’s privacy rights. Similarly, international documents have had little to say on the topic. A rare exception came in early 2017, when the United Nations Human Rights Council passed a resolution that noted that violations of the right to privacy in the digital age could have “particular effects” on certain groups, among them children.69
Most regulatory approaches to protecting child privacy online have been based on principles of parental consent. Approaches
vary among countries, but typically service providers are required, or in some cases advised, to obtain verified parental consent before offering services to, or collecting data from, children below a certain threshold age – for example, 13 in the United States,70 14 in Spain71 and 18 in South Africa.72
This sort of approach is not without criticisms, including that it can impact children’s freedom of expression, access to information and development of digital literacy.73 Because in many cases children are not willing to share their online experiences with their parents, requiring parental consent for any data sharing on the part of the children would in effect reduce their autonomy and freedom online,74 which runs counter to Convention on the Rights of the Child commitments that children be able to exercise agency based on their evolving capacities. Any regulatory approach would need to strike a balance between
‘Sharenting’, can harm a child’s reputation, with potentially serious results.
“
Simplifying the rules
Why do terms and conditions need to be so long? They probably don’t. The pages of rules that many online service providers ask users to sign could in many cases be made more child-friendly and thus help build children’s digital literacy. To show how this could be done, Jenny Afia, a privacy lawyer and member of a Children’s Commissioner for England task force, examined a paragraph of text from one service provider that began, “You are responsible for any activity that occurs through your account and you agree you will not sell, transfer, license or assign your account, followers, username, or any account rights….” She rewrote the 112-word section as follows: “Don’t use anybody else’s account without their permission or try to find out their login details.”77

93 03 THE HARMS OF LIFE ONLINE: SPECIAL SECTION
protecting children online and respecting their independence as they grow up.
The need for parental consent may also contradict some recent evidence showing that children have some awareness of privacy threats and share some of the same concerns about identify theft and data mining as adults.75 Research by Global Kids Online underscores how this plays out in the digital sphere, finding that the older children in its surveys typically know how to manage their privacy settings online, whereas younger children more often do not.76
There have been criticisms, too, of setting certain threshold ages for consent, such as age 16 in the European Union’s General Data Protection Regulation (although member States can lower this to 13), which is set to take effect in 2018.78 Arguably, this may encourage children to lie about their age to online service providers, a phenomenon that
some studies show is already widespread.79 Critics argue it may also provide potential child groomers with a plausible defence that they assumed someone contacted through a social media site was at least 16 – the age of sexual consent in many countries.80
Some advocates point out that there are better ways than requiring parental consent to protect children’s right to privacy while also safeguarding their other rights. These include education initiatives and changing default privacy settings.81 But a greater burden of responsibility needs to be placed on online service providers to set clear limits to their collection, processing and retention of children’s data. Policies should also include “transparency in methods of data collection and clear explanations of how resulting data will be used.”82 These explanations should also be adapted to children’s information needs and understanding.
A greater burden of responsibility needs to be placed on online service providers.
“
Regulatory approaches to protecting children’s privacy online tend to be based on the principle of parental consent. Some argue this relieves online service providers of too much of the responsibility of safeguarding children’s privacy and identity online. © UNICEF/UN055396/ROMANA

UNICEF – THE STATE OF THE WORLD’S CHILDREN 2017
PERSPECTIVE
Are you tattooed … yet?
Juan Enriquez
Most of you, dear readers, might initially think to answer that question with an emphatic “no.” Tattoos are painful to acquire, pretty permanent and oft an embarrassment in later life. Most parents are adamant: Do Not Get a Tattoo. Period. If you must… then wait a long, long time, and be very careful what you choose. Seems like good advice. So why, then, do most parents allow their kids to get virtually tattooed? Let me explain…
When you use Facebook, Twitter, Instagram, Google, LinkedIn or a host of other services, you share parts of yourself. Pictures, activities, thoughts, quotes, tweets, friends, comments – all become breadcrumbs that, collectively, reflect you, your thoughts, interests, activities, talents, achievements, loves, break-ups and lives online. These images and words reflect what you think is important, what you care about. Just like tattoos. So in a sense, these are electronic tattoos, but more intimate and more descriptive than any ink on your skin.
Unless you chose to ink your face or hands, you can easily cover up most tattoos, say if you go to a job interview or choose not to show them on a date. The same is not true for electronic tattoos. Almost impossible to cover up. Removing a real tattoo is painful and messy, but possible. Removing an electronic tattoo is almost impossible. Go online and you can find out a whole lot about almost anyone. In a sense, we are all permanently tattooed. And it takes ever more work to remain even partially anonymous.
Legislating privacy on the extremes is far easier than legislating the everyday. Most privacy debates focus on actions like ‘revenge porn’, where an angry ex posts compromising pictures or videos of a former love. But that is nowhere near as common as the information we and our friends voluntarily share after an innocent party, site visit, job comment or family interaction. Because this data is so easy to access decades later, and because it is so widely
disseminated, there are many who may eventually be amused, insulted, angered, surprised and entertained by the most innocent of electronic tattoos.
In a sense, we are all celebrities. According to an ex-mayor of London, “When you walk down the streets of London, you are a movie star. You are being filmed by more cameras than you can possibly imagine.” Not surprising, given that there are by some estimates more than a million closed-circuit television cameras watching you. We now live under greater scrutiny than a major Hollywood figure or head of state might have lived under a few decades ago. But whereas it took a team of highly skilled investigative reporters or paparazzi to uncover the lives of the rich and famous of yore, today what we say, to whom, about what and how we looked can be easily scrutinized and shared.
As adults, today’s children and adolescents will be subject to a scrutiny and historical record that we cannot begin to imagine. While most of us were, blessedly, able to forget, reimagine or reinvent part of our early lives, loves, jobs, thoughts, deeds, comments and mistakes, today’s children will be in a very different spot. A single stupid comment can lead to decades of disdain and cyberbullying. A single stupid action can be reviewed by authorities, voters or employers decades later.
For better and worse, each of today’s children has become an individual historical figure, subject to an ever more powerful and permanent panopticon. Even in utero, the details of each individual sometimes begin to become a public tattoo as parents share ultrasounds or even gene-sequence data. Before children hit their early teens and begin to share their own stories, there is already a broad tattoo out there that can define who they are perceived to be: Where do you live? Did your parents divorce? Who are they, anyway? What school did you go to? What did you look like? Played sports? All easy to find.

03 PERSPECTIVE 95
“ We now live under greater scrutiny than a major Hollywood figure or head of state might have lived under a few decades ago,” writes Juan Enriquez. © UNICEF/UN036674/SHARMA
Hiding may not be a viable option. In a world of ever more prevalent and visible digital tattoos, coming across someone with no profile at all would really make one wonder. So as our kids face challenges we never faced, it is important that we have early conversations about one’s public persona and profiles, about one’s history and long-term reputation. In the same way as parents used to teach kids manners early, kids need to learn the rules and consequences
of being electronically tattooed. Turns out we are all tattooed, and we already all carry far more electronic ink on our bodies than the most colorfully decorated biker gangs…
Juan Enriquez is the managing director of Excel Venture Management, a fund that invests in entrepreneurial life science companies and big data platforms. He is a global speaker, futurist and best-selling author of books on politics, science and international affairs.

UNICEF – THE STATE OF THE WORLD’S CHILDREN 2017
PERSPECTIVE
Look, Mum, no data!
Anab Jain
We are at a turning point in the development of toys and technology made for children and adolescents. In recent years, Apple’s iPhone, iPod and iPad were named some of the most desirable toys of the year, marking the first time that technologies produced for adults, with significant online capabilities, were so widely touted as must-have toys for children. Infants play with tablets, smartphones and voice technologies before they can walk or talk. Childhood discovery is no longer constrained within a physical world children can touch and taste to understand. Their imagination can explore digital dimensions. Ways to learn and access information are endless.
Yet both producers and consumers face fresh challenges when toys are integrated into new technologies. The potential of toys and software accessible to children and adolescents reaches far beyond their marketed appeal. From environmental sensing, to passing data to the cloud, children’s sensory and communicative capacities are extended, but so too are corporations’ ability to influence children’s thoughts, beliefs and decision-making.
In the 1980s, the deregulation of advertising aimed at children in the United States allowed marketers and companies to build huge franchises that demonstrably increased the emotional bonds children had to products. They did this through the development of cartoons, expensive advertising campaigns and blockbuster movies. Today there is precious little regulation holding back toy manufacturers and the technology industry. They continue to innovate and disrupt, faster than parents can understand, consumer groups can advise and governments can legislate.
From the smart toys that listen to children while they play, to the family use of Amazon Echo, and the abundance of other software and hardware in use around them, children are exploring an emergent frontier of life, play and learning driven by connected technology. New research has drawn
attention to the nature of the invasion of children’s privacy by toys that capture, record and share audio information during play. This raises serious questions about privacy and safety in the home and online. It also raises important issues about what companies can do with the information their products record during a child’s play, how this can be used, how it should be protected and who is able to access it.
Children have always confided in their toys and teddy bears, but mainly in private, with the occasional overheard complaint or confession. Is it right to limit our children’s privacy in this way, or should parents be given total access to their child’s private moments to help aid their development? What are the incentives of the designers and producers?
The data gathered across our digital lives is often collected without privacy mandates, and it seems to be our responsibility to demand our data be encrypted. Reading the terms and conditions for every product is hardly something even the most diligent parent has time for. Consent becomes convoluted as our children’s data is easily passed to third parties who can use it for marketing purposes or to train new systems and artificial intelligence.
The sheer mass of quantitative data we can gather on our children raises concerns about how parents use it. How are children going to be protected from well-meaning but increasingly invasive parental practices? Should children have agency in their technological experiences and, if so, how?
Ubiquitous technology in the home creates some challenges for children and their parents. Designers need to be aware of the ethical issues involved in developing new software and hardware that are accessible to minors, because these technologies have the opportunity to help shape and enhance young users’ knowledge of the world and themselves.

03 PERSPECTIVE 97
“ Designers need to be aware of the ethical issues involved in developing new software and hardware that are accessible to minors, because these technologies have the opportunity to help shape and enhance young users’ knowledge of the world and themselves,” writes Anab Jain. © UNICEF/UN040656/
But intentional design is crucial, because new technologies also expand opportunities for bullying, harassment and other more serious behaviour. Children and young people in their bedrooms can be exposed to crime, abuse and radicalisation. Software such as Snapchat has even been designed to limit the readability of shared content by making it unavailable after a user-determined time selection. WhatsApp, Signal and others offer encrypted communication channels. From a developmental perspective, how does the live streaming of our lives distort or develop who we are, and how do we nurture the best practices in our children?
With increasingly autonomous software and hardware, hidden discreetly within the technology that accompanies us wherever we go, we are ever more ignorant of how our devices actually work and the extent of what they are doing. Toy manufacturers and
technology companies need to design their products and services with these things in mind. We need a better understanding of privacy, the fair use of data and the concerns of parents. As parents, we need to do a better job of holding these companies to account; we need to demand that our children be protected. We have more work to do in designing and building ethical, responsible and trustworthy technologies for children. We have more work to do understanding and using technology, and figuring out how to teach our children to steer themselves through the turbulence of our technological landscape.
Anab Jain is the director and co-founder of Superflux, a lab focused on emerging technologies for business, cultural and social purposes. She is also professor of industrial design at the University of Applied Arts Vienna. This essay was written in discussion with Jake Charles Rees, futures researcher at Superflux.

Full articles by youth contributors featured in The State of the World’s Children 2017 can be found at: <www.voicesofyouth.org/en/sections/content/pages/sowc-2017>
ASHLEY TAN, 17, SINGAPORE
“ It is pointless attempting to compare ourselves to unattainable standards that are reflected in social media posts, because many of these pictures are, in truth, just a warped version of reality.”
Digital childhoods: Living online
04

99
As children spend more and more time on digital devices, families, educators and children’s advocates are growing more concerned – and more confused – by the lack of consensus among experts on the rewards and risks of connectivity. Many parents also struggle with conflicting messages that they should limit screen time, on the one hand, or get the latest device so their children can keep up, on the other.
As the debates continue, one thing is clear: Unlimited – and especially unsupervised – connectivity has the potential to cause harm, just as access to the wealth of information, entertainment and social opportunity has the potential to benefit children around the world. So the task is to find ways to provide children with the support and guidance they need to make the most of their online experiences.
Video games. Television. Comic books. Radio. A Google search on societal – and parental – worries about the impact of technology on children’s well-being makes clear that such concerns are nothing new.
Radio was blamed for sleeplessness. Comic books for making children ‘criminal and promiscuous’. Television for social isolation. And video games for offline aggression.1
As far back as the sixteenth century, some feared writing would increase forgetfulness, because people would no longer rely on memory for information. They also worried that books and the printing press would lead to what today we would call information overload.
Yet, compared with its innovative predecessors, the internet – and how children use it – raises concerns of a different magnitude. Connectivity and interactivity are harder to take away or turn off. Their use by children is harder to monitor. And while children access entertainment, information or social networks via a connected device, those devices gather information on them, too.
Questions about the impact of connectivity and interactivity abound among parents,
educators, policymakers and industry leaders. Is digital engagement a threat to children’s well-being? Are they spending too much time at it? Is it making them depressed? Dependent? Obese? Who is most at risk? What can parents and caregivers do to allow children space to explore and develop independently while also providing enough oversight?
This chapter will examine these questions, summarize evidence on the impact of digital engagement on aspects of children’s well-being (mental, social and physical) and present their perspectives on the subject.
As seen in previous chapters, whether and how much children benefit from digital experiences has much to do with their starting points in life. While those with strong social and familial relationships are likely to use the internet to bolster these relationships – leading to improved well-being – children experiencing loneliness, stress, depression or problems at home, for example, may find that the internet compounds some of these existing difficulties. Conversely, children who struggle with their social lives offline can sometimes develop friendships and receive social support online that they are not receiving elsewhere.2
How much children benefit from digital experiences has much to do with their starting points.
“

UNICEF – THE STATE OF THE WORLD’S CHILDREN 2017100
Questions of screen time for connected children, while still debated, are increasingly obsolete. This is because there is no clear agreement on when time spent on digital technology shifts from moderate to excessive; ‘how much is too much’ is highly individual, dependent on a child’s age, individual characteristics and broader life context. And many children in high-connectivity contexts find it difficult to estimate how much time they spend with digital technology, because they are more or less using it all of the time.3
As these issues are debated and studied, some basic truths seem to be emerging. Rather than restricting children’s digital media use, more attentive and supportive mediation by parents and educators holds the most promise for enabling children to draw maximum benefit and minimum risk from connectivity. More attention should be given to the content and activities of children’s digital experiences – what they are doing online and why – rather than strictly to how much time they spend in front of screens. Finally, future research and policy should consider a child’s full life context – age, gender, personality, life situation, social and cultural environment and other factors – to understand where to draw the line between healthy and harmful use.
A new generation gap
Parents, educators and those with an interest in children’s health and well-being seem to be growing more concerned as children spend more time on digital devices. For every new article or study that says growing connectivity is harming children there is another that shoots down these claims with competing evidence.
Adults who think children spend too much time engaging with screens wonder whether children will miss out
on important areas of life – or the areas of life that were important to them as children: giggling with a friend after playing a practical joke, or climbing a tree, or being fascinated by an ant crawling across the ground.
Some parental concerns cut across cultural contexts. For example, a report from the Swedish Media Council described how parents in Sweden were at once quite positive about the benefits their children could reap by playing digital games and at the same time worried about how much time they spent doing it.4 Likewise, in South Africa, parent focus groups acknowledged the benefits of the internet for their children even though they were also concerned about how much time their children spent online and the potential online risks their children faced.5
Sociologists and psychologists say that children today interact more with their phones than with each other, and speculate that they might miss out on important social experiences.6 Others have noted the concern that children’s social skills will be negatively affected or otherwise altered because their friendships and communications with peers are digitally mediated.7
Some experts say children still interact with one another as much as before and that the interactions are of similar quality. It is the venues for social interaction that have changed to digital.8
On the low- or no connectivity side of the digital divide, parents and caregivers may be concerned that their children are missing out on developing social fluencies, a digital identity or the skills and knowledge they will need to compete for jobs (see Chapter 2).
Connected children point out that adults are the ones missing out, as one girl phrased it in an interview with The
More attention should be given to what children are doing online and why.
“

04 DIGITAL CHILDHOODS: LIVING ONLINE 101
Washington Post, “on the whole world.”9
Other children complain that because their parents spend so much time online, they must compete with digital devices for their parents’ attention.10
Despite these divergent views, children and their parents are finding ways to bridge the gap by regularly talking to each other about thoughtful, responsible digital behaviour (see box: Parenting’s new digital frontier).
Some say children now interact more with their phones than with each other; others argue that the only change is that the venues for children’s social interactions are now increasingly digital. © UNICEF/UN036679/SHARMA

Adults often paint a picture of young people as being technologically connected but socially disconnected, and even participants in the State of the World’s Children 2017 workshops* admit this image has some truth.
What do adolescents think about … the impact of ICTs on families?
“ I think that the internet brought us closer to those who are far away and pulled us away from those who are close by. Within my family, there are times where we can all be in the same room without saying a single word because each of us is glued to the screen of our smartphone.” GIRL, 16, DEMOCRATIC
REPUBLIC OF THE CONGO
But, overall, they painted a much more positive picture of how digital technologies are changing family life. They were enthusiastic, for example, about how technology supported relationships with family members by allowing them to connect, communicate and share …“ When we watch movies that make us
laugh … what makes us happy is to stay in harmony.” GIRL, 10, PORTUGAL
“ Playing games together on the desktop computer [with] my sister … makes us feel happy.” GIRL, 17, NIGERIA
“ I sometimes show funny videos to my grandparents on YouTube.” BOY, 17, PERU
and by giving families things to talk about.“ Each time we find something interesting on social media it brings up a conversation.” GIRL, 16, TUNISIA
Digital technologies also allowed participants to stay in touch with relatives abroad …“ My father is in Syria and I am in Jordan, I can communicate through social media and talk to him.” GIRL, 16, JORDAN
“ My sister made a video call from Spain and filled my family with joy.” BOY, 16, PERU
enabled them to share moments in their lives …“ My mom, she moved to Spain when I was a kid. I can share with her each moment that she or I live every day.” GIRL, 17, PARAGUAY
“ We use the phone to celebrate birthdays … even just to say happy birthday through a call.” GIRL, 14, TIMOR-LESTE
and created a sense of closeness that would not otherwise be possible.“ My brother lives abroad and the internet has helped us keep our close relationship. We talk all the time through Skype and I never felt that he left home.” GIRL, 16, TUNISIA
“ Now WhatsApp allows me to talk to my mother who is abroad without any problems. Before we had to buy credit but now with 100F [US$0.20] I can connect and chat with her and see her photos. Technology really makes our lives easier.” GIRL, 14, SENEGAL
Digital technologies also helped during emergencies or when a family member needed support.“ My little sister was sick so I used my phone to call my mother and take her to the hospital.” GIRL, 17, VANUATU
“ A cousin who lives in South Africa had to have surgery, and afterwards she couldn’t go out. So, with my sister and other cousins who live in different places around the world, we created a group, just to tell each other funny stories and distract her from her illness.” GIRL, 14, DEMOCRATIC REPUBLIC OF THE CONGO
“ My grandmother needs some medications that [are not available] in our country. So I used my PC to find them and order.” BOY, 15, REPUBLIC
OF MOLDOVA

But there were negatives: For example, many participants spoke of tensions with siblings over access to devices.“ Me and my siblings sometimes fight over my mother’s computer to watch movies.” GIRL, 17, VANUATU
In response, some tried to convince parents to help them buy their own devices … “ To save enough money to buy
the device I want, I have to ask my parents for an increase in my allowance.” BOY, 17, THAILAND
but often with little hope of success. “ I am trying to convince my father but I think that my father will not be convinced.” BOY, 14, BANGLADESH
Some participants also spoke of arguments with parents or caregivers about how ICTs might be distracting them from their schoolwork or home responsibilities.“ I got on bad terms with my mom for spending too much time with digital devices and not spending enough time on school studies.” GIRL, 13, REPUBLIC
OF KOREA
“ I have argued with my family because I didn’t fulfil my responsibilities due to my distraction with the laptop.” GIRL, 14, URUGUAY
Others experienced family frictions when they used digital technologies after bedtime or at the wrong time.“ I disturbed my father while on the mobile when it was prayer time.” BOY, 16, JORDAN
But adolescents weren’t the only ones distracted by glowing screens.“ When mum switches her computer
on to work at home, she has no time to talk to us.” GIRL, 18, BURUNDI
“ When we all went dining outside, my mom got her feelings hurt because my dad and I only looked at our smartphones.” GIRL, 14, REPUBLIC OF KOREA
There were other sources of tension: Sometimes parental monitoring of online activity led to misunderstandings …“ My family tends to spy on my private life through social media. In consequence, we fight over misunderstandings.” GIRL, 16, TUNISIA
“ Misunderstandings because porn sites appear as pop-ups and my parents think we search for them.” GIRL, 16, GUATEMALA
and there were also intergenerational misunderstandings … “ My mother’s use of emoji online does not reflect her feelings in reality. Therefore, I find it difficult to understand how my mother feels.” GIRL, 17, JAPAN
as well as concerns over online safety … “ When my dad’s account was hacked and
everyone in my family was concerned.” BOY, 16, PERU
that could even lead to arguments between parents or caregivers.“ I shared on Facebook something that my mom thought was inappropriate, and she and my dad had a strong argument about that.” GIRL, 15, PARAGUAY
But it wasn’t just adolescents’ use of technology that created family tensions.“ I get upset when my mom posts a photo of mine without my permission.” GIRL, 15, PARAGUAY
“ [It’s wrong] when parents neglect their children while concentrating on their devices.” BOY, 16, FIJI
IN SUMMARYAdolescents see the impact of digital technologies on family dynamics as both positive and negative. Interestingly, the views of participants on these issues were strikingly similar around the world, suggesting there may be opportunities for countries to collaborate in creating solutions to support families in making effective use of technologies.
* Participants’ responses have been shortened and edited for clarity where necessary.

104 UNICEF – THE STATE OF THE WORLD’S CHILDREN 2017
Parenting’s new digital frontier
Parents are the first line of responsibility in protecting children and helping them learn and grow into productive adults – and their responsibilities to help their children realize the benefits of a digital world are no different. Yet many parents feel unprepared for this role. In a new and rapidly evolving realm, they must take on an age-old challenge: allowing independent exploration while providing parental oversight.11
In an environment where digital media is constantly becoming more personal and complex, parental anxiety around their children’s internet use can be intense. Many parents and caregivers do not have the time, knowledge or resources to promote their children’s digital opportunities or minimize their risks. Many also struggle with conflicting messages that they should “limit screen time” on the one hand, or “get the latest device” – so their children can “keep up” – on the other.
To whom do children turn when they encounter problems online? Generally, not to adults.12 Studies consistently show that children tend to first turn to other children to talk about their online experiences. One study in South Africa showed that the number going to peers when they faced risks online was double the number reaching out to adults.13 This was echoed in Global Kids Online research in Argentina, the Philippines and Serbia.14 The reason is unsurprising: In places like Argentina, children believe their peers know more about technology, social media and the internet than adults do.15
On this new frontier of parenting, parents can feel disempowered and ignorant of what their children are doing online – and thus more likely to exaggerate concerns about internet predators and pornography. As a result, many parents are restrictive in managing their children’s internet access.
In response, children often find ways to avoid adult oversight. These can include creating multiple profiles on social media so that they can ‘friend’ their parents in one and keep the others for their real use.16 As a result, their parents may be even more in the dark – with the effect of making their children potentially more vulnerable to the very threats they fear.
At the same time, such restrictive parental mediation, one of the most common parenting styles vis-à-vis the internet, may limit the quality of children’s online experience, preventing them from experiencing a range of appropriate, informative and entertaining content.17
While parents’ concerns about children’s online usage are fairly consistent, their ways of managing it are not. Parental mediation differs according to the age of the child: In one large-scale study in eight European countries, parents seemed to adapt their style from a more restrictive strategy with younger children to a more enabling strategy for older children. It also differs according to gender. A study involving children between the ages of 7 and 18 in Bahrain found that restrictions around use of digital media led girls to conceal activity online that would be considered ‘unacceptable’ by their parents.18 A third variable concerns the parents: Research shows that poorer and less-educated parents prefer ‘restrictive mediation’,19 and it is these same families that are struggling to update digital technology at home and acquire the skills to use it and guide their children’s use.20
Whether parenting online or offline, one thing is clear: Key dimensions of parenting developed by the World Health Organization in 2007 still hold. Connection, behaviour control, respect for a child’s individuality, modelling appropriate behaviour and provision and protection have a positive effect on adolescent well-being.
UNICEF – THE STATE OF THE WORLD’S CHILDREN 2017
Jasmina Byrne is a Child Protection Specialist who leads UNICEF Office of Research – Innocenti’s work on children’s rights in the digital age as well as research on family and parenting support. Sonia Livingstone OBE is Professor of Social Psychology in the Department of Media and Communications at London School of Economics and Political Science.
JASMINA BYRNE AND SONIA LIVINGSTONE

04 DIGITAL CHILDHOODS: LIVING ONLINE 105
Being online and well-being: The evidence
Research is also struggling to keep up with the ever-evolving subject of children’s well-being online. In preparation for this report, UNICEF’s Office of Research performed a literature review to answer the question “How does the time children spend using digital technology impact their well-being?” While the evidence is mixed, recent research shows that children’s use of digital tech has a mostly positive effect. The evidence summarized here looks at screen time and its impact on mental well-being, social relationships and physical activity, considers the debate over digital dependency and, finally, examines the effects digital experiences have on children’s brains.
Assumptions about restricting screen time
While parents and caregivers may think they are protecting their children by restricting the time spent on digital technology, this may not be the case.
Common measures to restrict internet use – by governments, businesses, parents and others – usually take the form of parental controls, content blocking and internet filters. While well meaning, these are not always well designed to achieve their desired purpose and may even create unintended negative effects. For example, such restrictions can cut adolescents, especially, off from their social circles, from access to information and from the relaxation and learning that come from play. Tension around these restrictions can also damage trust between parents and children. And extreme restrictions can hold children back from developing the digital literacy skills needed to critically evaluate information and communicate safely, responsibly and effectively through digital technology – skills they will need for their future.
Without consensus on screen time, it is important for parents, policymakers, researchers and the media not to jump to conclusions about what is healthy or unhealthy digital use. Considering the full context of a child’s life – together with an emphasis on content and experiences rather than screen time – may prove more useful for understanding the effects of digital connectivity on children’s well-being.
A common assumption is that time spent online will detract from other activities thought to be more valuable, such as face-to-face socializing, reading books or exercising. This is sometimes referred to as the ‘displacement theory’ (discussed later in this chapter). While this assumption originally received support and served to inform policy statements, such as the former digital media guidelines of the American Academy of Pediatrics (AAP), more recent evidence suggests it might be simplistic or even inaccurate. One reason for this shift is the growing recognition that digital technologies offer many opportunities for children to pursue developmentally valuable activities, and these opportunities are both increasing and improving. For example, some video games positively influence cognitive, motivational, emotional and social development.21 This recognition is reflected in the AAP’s updated policy, which contains less-restrictive recommendations concerning both time and age limits.
Recent research suggests that youth seem quite resilient to screen consumption at higher levels – up to six hours daily – than is typically recommended by most policy statements.22 That said, while it is a relief that children are not harmed by the sheer amount of time spent online, more research is needed to understand the benefits of spending up to a third of one’s waking hours online. In addition, users – children and adults alike – should consider just who is benefiting the most, the user or the tech company (see box: The role of (un)ethical design).
Parents, policymakers, researchers and the media should not jump to conclusions about what is healthy or unhealthy digital use.
“

UNICEF – THE STATE OF THE WORLD’S CHILDREN 2017
PERSPECTIVE
Hey, Alexa, should I wear the pink or the sparkly dress today?
Rachel Botsman
I invited ‘Alexa’, also known as the Amazon Echo, into my home for an experiment with my daughter, Grace, 3. Pointing at the black cylindrical device, I explained it was a talking speaker, a bit like ‘Siri’ but different. “You can ask it anything you want,” I said.
“Hello, Alexa,” said Grace. “Will it rain today?” The turquoise rim around the speaker glowed into life. “Currently, it is 60 degrees,” a female voice answered and assured her it wouldn’t rain.
Over the next hour, Grace quickly figured she could ask Alexa to play her favourite music from the film Sing. She realized Alexa could tell jokes, do maths or give interesting facts. “Hey, Alexa, what do brown horses eat?” Her favourite interaction was realizing she could tell the assistant to stop with a simple command. “Alexa, shut up,” Grace barked in a raised voice. Looking a little sheepish, she asked me if it was okay to be rude to her. Did she think it had feelings or even deserved respect?
By the next morning, Alexa was the first ‘person’ Grace said hello to as she bounded into the kitchen. My preschool daughter, who can’t yet ride a bike, read a book or properly decipher good from bad, had also quickly mastered that she could buy things. “Alexa, buy the movie Frozen,” she said. Of course, Grace had no idea that Amazon, the world’s biggest retailer, was the corporate master behind the helpful assistant.
This simple experiment is a telling illustration of a profound technological shift. It’s easy enough for adults to be coaxed into giving away their trust to a seemingly ‘helpful’ bot cleverly designed by marketing and technology experts. But when it comes to children, few checks and balances exist to deter them from giving away their trust very quickly.
Two days in of living with Alexa, something significant happened. “Alexa, what should I do today?” Grace asked nonchalantly. It
was shortly followed by a question about her fashion choice. “Alexa, what should I wear today?” I unplugged the thing.
In April 2017, Amazon launched the Echo Look device, which comes with a camera. In other words, Alexa doesn’t just hear you, it sees you. The Style Check feature uses machine learning algorithms to judge our outfit choices, awarding them an overall rating from Alexa.
Confronting, isn’t it? We’re no longer trusting machines just to do something but to decide what to do and when to do it.
For generations, our trust in technology has resided in a confidence that the technology will do what it’s expected to do – we trust a washing machine to clean our clothes or an ATM machine to dispense money. But what happens if I, say, step into an autonomous car? I’ll need to trust the system itself to decide whether to go left or right, to swerve or stop. It’s an often-cited example of how technology is enabling millions to take what I call a ‘trust leap’ – when we take a risk and do something new or in a fundamentally different way.
The artificial intelligence trust leap, and others like it, raises a new and pressing question: When an automated machine can have so much power over our children’s lives, how do they set about trusting its intentions?
The next generation will grow up in an age of autonomous agents making decisions in their homes, schools, hospitals and even their love lives. The question for them won’t be, “How will we trust robots?” but “Do we trust them too much?” In our rush to reject the old and embrace the new, children may end up placing too much trust, too easily, in the wrong places.
One of our key challenges is deciding where and when it is appropriate to make trust a matter of computer code. We need to be giving children the tools

04 PERSPECTIVE 107
to judge whether automated machines are trustworthy (or secure) enough to make decisions. Beyond security concerns, the bigger question is whether we can trust these bots to act ethically. Specifically, how do they ‘learn’ what’s right and wrong?
It would be a shame to find ourselves in a world so automated that we depend solely on machines and algorithms to make decisions about whom to trust. That’s a world devoid of the colour and movement born of human imperfection, and, if we take our hands off the wheel too much, possibly even dangerous. It’s humans, with all our wonderful quirks and mutations, who make trust possible – not technology or mathematics.
If we want the upcoming generation to understand that, we need to design for a ‘trust pause’, an interval in which children stop and think before they automatically click, swipe, share or accept. To ask “Are you sure?” And we need to provide them with the knowledge and education that helps them decide: Is this person, information or thing worthy of my trust?
Rachel Botsman is an author, speaker, university lecturer and global expert on trust. Her work examines how technology is transforming human relationships. She is the author of Who Can You Trust? (Penguin Portfolio, 2017) and co-author of What’s Mine Is Yours (HarperCollins, 2010). She teaches the world’s first MBA course on the collaborative economy, which she designed, at the University of Oxford’s Saïd Business School.
In our rush to reject the old and embrace the new, children may end up placing too much trust, too easily, in the wrong places,” writes Rachel Botsman. © UNICEF/UN040853/BICANSKI

UNICEF – THE STATE OF THE WORLD’S CHILDREN 2017108
Social media bolsters existing friendships
Overall, research on the impact of social connections online has shifted over the past several decades. Early research, from the 1990s, tended to find internet use detrimental to social well-being.23 One reason could be that, at the time, the bulk of people’s social networks were yet to come online, so it was difficult to use the internet to maintain existing friendships, make new ones or renew old ones. More recent evidence portrays a mostly positive picture of how internet connection affects friendships and social capital24 – and this is true for children as well as adults.
For example, adolescents’ use of social networking sites has been found to provide greater feelings of connectedness to peers25
– bolstering existing friendships26 – and to contribute to less peer-related loneliness.27
One reason for this, as studies from the past decade have shown, is that it is easier to talk about sensitive or personal topics online28, in particular for boys.29 However, among adolescents using social media to compensate for weak social cognitive skills, such use was found to increase feelings of loneliness.30
In terms of social networking and happiness, several studies have found a negative association between passive social media use (browsing friends’ posts
The role of (un)ethical design
Never before has such a small number of tech designers had such a big impact on how a billion people around the world spend their time. In some places, people check their phones more than 150 times per day. Knowledge workers spend a third of their day in email. Some teenagers send 4,000 texts per month, or every six minutes awake.
Designers themselves say today’s technologies are deliberately designed to exploit human weaknesses. They try to grab users’ attention – and keep it for as long as possible – in order to tap into psychological biases and vulnerabilities. The aim is to play on the desire for social acceptance and exploit the fear of rejection. While the average user might disengage from the platform minutes or hours later than intended, coming away with little or no benefit, tech companies come away with financial gain from advertisers, plus their users’ time, attention and personal data. Adolescents, already experiencing new and complex emotions, might not realize the potential impacts on their privacy or how they spend their time.
Until tech companies start thinking about ethical design, users – especially children and young people – will continue to face the consequences of technologies designed for social media firms’ financial incentives and not users’ real needs.
It is the collective responsibility of civil society, in particular the tech industry and governments, to advocate for children’s best interests to be represented in debates on the design of technologies.
If not, technologies of tomorrow, such as artificial intelligence and the Internet of Things, might come at a cost to children’s privacy and well-being. A first step is to learn from the organic food and green car movements. These started with educating consumers and creating new incentives for businesses that align with what’s good for people.
This box is based on a Conversations with Thought Leaders Series event, ‘Ethical Design for Digital Natives’, held at UNICEF House on 31 January 2017 with Tristan Harris, former design ethicist and product philosopher at Google and co-founder of the Time Well Spent movement.
Today’s technologies are deliberately designed to exploit human weaknesses.
“

04 DIGITAL CHILDHOODS: LIVING ONLINE 109
without interacting) and well-being,31
which researchers hypothesize stems from increased feelings of envy32 or from users’ (undergraduates, in the case of this particular study) impression that other posters were happier than they were.33
Screen Time: Not too little, not too much
Despite concerns, mainly among parents and educators, regarding the effects of extensive screen time (see section: The debate over digital dependency), a recent large-scale cross-sectional study of more than 120,000 15-year-olds in the United Kingdom found that the time children spent using digital tech had only a negligible impact. This study, which controlled for gender, ethnicity and economic factors, included watching TV and movies, playing video games, using computers and using smartphones. The activities differed somewhat in their respective impacts, but the authors conclude that, in general, no use at all was associated with lower mental well-being, while moderate use (between approximately two and five hours per day, depending on the activity) seemed to have a small positive effect on mental well-being.34
This ‘Goldilocks effect’35 – not too much, not too little, but just the right amount – seemed to be fine for children.
To give some perspective on the relative importance of screen time compared to other daily life activities, the negative effect of excessive gaming (defined in this study as more than seven hours per day) on mental well-being was less than a third of the positive effect of eating breakfast regularly or getting enough sleep.36
For very young children, findings from a large cohort study in 2010 of more than 13,000 5-year-old children in the United Kingdom found no evidence that longer duration of screen usage was associated with any other mental health
problems investigated for boys or girls, such as hyperactivity, peer problems or prosocial problems.37
However, the day and time digital technologies are used – for example, weekday versus weekend38 – has been shown to matter. Intensive use on weekdays might have a stronger negative influence than use on weekends, indicating that for some children screen time might interfere with other structured activities during the week, such as homework.
Taken together, the impact of digital tech on child well-being seems to depend on the activity, how much time is spent and when time is spent. However, these effects – positive or negative – are generally weak and only contribute a very small part to explaining children’s overall well-being.39
To improve children’s mental well-being, it is important to take a holistic approach and focus on other factors known to have a stronger impact than screen time, such as family functioning, social dynamics at school and socio-economic conditions,40 while also encouraging the moderate use of digital technology.
Limitations in the research
Still relatively new, the evidence is describing the impact of ever-evolving technologies on a young population that is diverse, also ever-evolving and using technologies in a variety of ways and from different starting points.
Another limitation is the research methodology used for most studies in this field (see box: Research challenges). Studies have found associations between the use of digital technologies and reduced well-being.41 However, it remains unclear if the use of digital technology is the cause or consequence of reduced well-being. For example, is spending too much time online making children feel lonely or are children
Focus on factors known to have a stronger impact than screen time, such as family functioning, social dynamics and socio-economic conditions.
“

UNICEF – THE STATE OF THE WORLD’S CHILDREN 2017110
who already feel lonely spending more time online?
It is also important to note that much of the research has centred on children in high connectivity settings and may not be applicable to contexts of low connectivity.
Opportunity costs: Is time online replacing physical activity?
Any parent who has ever watched a child sit before a screen for hours inside on a beautiful day has considered the possibility that time online is cutting down on time engaged in physical activity. However, evidence on the impact of time spent using digital technology on physical activity50 is decidedly mixed. Some studies show a link
between online activity and reduced physical activity, while others show no associations between the two.51
Unfortunately, several key studies are based only on estimates of time use, with little disaggregation by digital device, activity or content, when these have been shown to matter.
But some large-scale studies are trying to find answers. One cross-national 2010 study drawing on survey data from over 200,000 adolescents aged 11–15 in Europe and North America found that spending two hours or more per day on screen-based activities resulted on average in half an hour less per week spent on leisure-type physical activity – but that the relationship differed according to age, gender and nationality.52 And, the
Research challenges
Studies looking at mental, social or physical well-being have often been correlational (looking to identify relationships between two or more variables) or drawn from cross-sectional samples (where the data are taken at only one point in time). From these types of studies, it is difficult to determine what is cause and what is effect; it is also hard to estimate long-term consequences of the use of digital technology. To assess causality and long-term effects reliably will require longitudinal studies and other improvements in research methodology.
Another issue with current research is the tendency to focus on a limited number of background variables, when studies have shown that there are indeed major individual differences in how regular, excessive or problematic use of digital
technology impacts children – based on their age, gender, personality, life situation, social and cultural environment, and other factors.42
Thus, there is an inclination to either overestimate digital technology’s effect on children or to assume that digital technology has an effect when that effect actually stems from another cause.43
The last caveat regarding the evidence is to look at how studies are counting and what they are covering. Studies that focus on time use alone, without describing or assessing the content or activity engaged in during that time, have limited value. Similarly, neurobiological studies (related to online behaviours) that focus on an unrepresentative portion of the developing population should not be applied to the majority of adolescents.

04 DIGITAL CHILDHOODS: LIVING ONLINE 111
form of screen-based activity adolescents engaged in mattered, too: Regular computer use was associated with an increase in physical activity, while gaming and TV watching were associated with a decrease.
The study generally concluded that physical inactivity is unlikely to be a direct consequence of adolescents spending too much time on screen-based activities.
Some studies suggest that online activity and physical activity may be more independent of one another than they seem. Some hypothesize that children are not forgoing physical activity because they want to go online. Instead, they may be going online because they are already physically inactive, for a variety of reasons.53 Or they may be less physically active, and also go online, as two separate outcomes to their circumstances.
Digital use is just one part of a complex picture of what children are doing, and why. Some children’s circumstances make it difficult to engage in physical activity –
because their neighborhoods are unsafe to play in, because they don’t live close to parks, playgrounds or sports facilities, or because their parents don’t have the time, the interest or the resources to accompany and encourage them.
Finally, interventions targeting screen time alone are unlikely to significantly increase time spent on physical activity.54
Instead of asking “How does screen time affect physical activity?,” perhaps the right question is “Are children leading lives where they can get a healthy, balanced amount of activity for optimal growth and well-being?” Promoting physical activity and a healthy diet might prove a better strategy than merely reducing screen time.
The debate over digital dependency
Who hasn’t seen or heard about an adolescent who can barely put
Promoting physical activity and a healthy diet might prove a better strategy than merely reducing screen time.
“
Theories about friendships online
Three key hypotheses put forward and studied by researchers echo parents’ concerns and perceptions about the impact of online behaviours on young people’s relationships.
The displacement theory offers the idea that online interaction replaces face-to-face interaction, resulting in children and young people having lower social capital and fewer personal acquaintances.44
As previously discussed, while this hypothesis initially received some support, new evidence suggests that it may be simplistic or even inaccurate today.
The ‘rich-get-richer’ theory asserts that those with strong social skills and networks offline will benefit more from online social opportunities than those who have weaker social connections to begin with.45 An alternative to the ‘rich-get-richer’ hypothesis is the social compensation hypothesis, which suggests that online communication will benefit those who are socially anxious and even isolated, because it will be easier for them to develop friendships online than offline.
Lastly, the stimulation hypothesis holds that online communication stimulates communication with existing friends and is mostly positive.46

UNICEF – THE STATE OF THE WORLD’S CHILDREN 2017112
down her smartphone, or a tween who loses control when his iPad privileges are taken away, or a young online gamer who seems to do little else?
There is no consensus on how to label the problem behaviour that many parents and educators are concerned about: children and adolescents who spend so much time with digital technology that it often seems as if they are actually as dependent on their screens as substance abusers are to their drugs of choice.
Some believe ‘addiction’ is a useful term to describe this problem behaviour – and the chilling possibility that it may be accurate drives headlines that in turn deepen parents’ concerns. But the analogy is just an analogy.
In fact, there is very little evidence demonstrating that any significant number of children and adolescents are so dependent on their devices that they experience severe impairment in a major area of life – the definition of addiction – or are at risk of significant and snowballing health risks as a result.
As yet, researchers have not found robust evidence that any severe negative life outcomes from excessive use of digital technology are directly attributable to the use of technology alone.55 Few studies have even explored in-depth which problems may occur as a consequence of excessive use of technology.56 And there is little indication that such severe cases constitute a growing problem in society.
Still, the fears of parents are grounded in direct experience of their children’s altered
Who hasn’t heard about an adolescent who can barely put down her smartphone?
“
Although children seem resilient to relatively high levels of screen time, much more research is needed to understand the impact of spending up to a third of one’s waking hours online. © UNICEF/
UN046200/KLJAJO

113
MIZUKO ITO
How do new media change teens’ social lives and identities?
Ever since the early days of the internet and mobile communications, researchers have debated whether these new technologies bring us together or push us apart. Adults have fretted that teens’ real life communication skills are atrophying, and that social media encourages empty exchanges that ultimately make them lonely and isolated. We often jump to the question of whether these new media are good or bad, but it’s important to first understand the role they play in young people’s everyday social lives.
People of all ages take to mobile and social media because they offer a greater range of choice and flexibility for when and with whom we communicate. Misa Matsuda, who conducted some of the first studies of mobile communication in Japan, described the growth of ’selective sociality‘ in teen relationships.47 When interviewing high school students, she noticed a new term, chu-tomo (a friend from middle school), that didn’t exist before the advent of mobile phones. In the past, if students split up to go to high school, they would lose track of their friends from middle school. Now they can keep in touch with friends even if they aren’t in the same school or community. The question is not whether we are more or less connected, but with whom we are connected. Matsuda also looked at how mobile media changed family communication. What she found was that text messaging increased parent-child communication for families who were close and connected, but for those who weren’t, it had the opposite effect. In other words, we connect more with people we feel closest to.
In a study of teens in the United States during the first major wave of social media adoption in the early 2000s, we found different genres in how young people socialized online.48 Most youth were engaged in casual social communication with peers they knew from school. A smaller number were going online to connect with specialized communities around gaming, popular culture and other interests. Often
the identities young people cultivated were quite different in these two kinds of settings. For example, one young man we spoke to projected his identity as a popular athlete with his school peer group on Myspace, but was also active in the online community for the game The Sims. He kept these identities and social networks quite separate.
The only constant today is greater choice and diversity in how new media play out in young people’s lives. Young people can take to online communication to mobilize millions through a Facebook cause, or spend their time exchanging mindless gossip. It’s futile to speculate whether these technologies are generically good or bad for all young people. It’s more important to ask how we can best support the positives.
Given the broader range of experiences that new media open up for young people, we shoulder a greater responsibility in guiding them to making wise choices. It’s not enough to say yes or no to specific devices or platforms or to clock screen time. We have to look at the substance and specifics of digital content and communities where young people are connecting, and actively engaging. I’m part of a community of researchers, educators and technology makers who have been advocating for ‘connected learning’, an approach to guiding young people to productive learning and relationships online.49
Our research has identified a persistent generation gap in how young people and adults view the value of new communications technologies. While young people see mobile phones and the internet as a lifeline to media, information and social connection, adults often view young people’s engagement with these technologies as a waste of time. This generation gap represents a missed opportunity. New media can be a vehicle for parents, educators and young people to come together around shared interests and concerns rather than something that drives us apart.
Mizuko Ito is a cultural anthropologist, educational researcher, entrepreneur and advocate. She is director of the Connected Learning Lab at the University of California, Irvine, and a co-founder of Connected Camps, a non-profit organization offering online project-based, social STEM learning for kids in all walks of life.
04 digital childhoods: living online

UNICEF – THE STATE OF THE WORLD’S CHILDREN 2017114
behaviour, and founded in legitimate concerns for their children’s overall well-being. These concerns must be considered and addressed.
Many studies conducted over the past two decades suggest that problems might arise as children use digital technology to cope with difficult real-life situations as a form of self-medication. For example, if a child is feeling sad or stressed, he or she might go online to be distracted from the sadness or stress, facilitated by an application where immersion or distraction is afforded, such as an online game or a social networking site. The consequences can be both positive (he or she might feel better temporarily) and negative (the real cause may not be addressed). In the long run, this might make the coping behaviour a recurring habit, unless the underlying problem is
resolved. Researchers tend to agree that the underlying problems that can prompt life-impairing digital engagement need to be addressed to successfully overcome this problem behaviour, whereas a forced reduction in screen time would represent a surface intervention that is unlikely to serve its purpose.57
Quite possibly, labelling excessive screen use as an addiction may just be a proxy for expressing concerns about the impact disagreements about screen time are having on family dynamics. For the great majority of connected children, disagreements over screen time are likely a new iteration of generational tension between the old and the young. But wildly divergent views of how much screen time is too much can trigger serious family fights. In this respect, parents and caregivers face a difficult but important
When it comes to setting limits on screen time, the child’s age, individual characteristics, culture and life context all need to be taken into account. © UNICEF/
UN017636/UESLEI MARCELINO

04 DIGITAL CHILDHOODS: LIVING ONLINE 115
task in mediating their children’s use – and their own use – of digital technology.
Such divergent views on digital technology can lead to arguments and fights at home, which are then used by some parents and researchers as evidence that the addiction to technology is real, while the actual cause of the arguments might be found in intergenerational disagreements around how children should spend their time.58
There are risks in employing addiction terminology to describe concerns regarding children’s growing use of digital technology. Careless use of addiction terminology downplays the very real consequences of the behaviour for those who are seriously affected, while overstating the risk of harm for those who at times engage in somewhat excessive, but ultimately not harmful, use of digital technology. Applying clinical concepts to children’s everyday behaviour does not help support them in developing healthy screen time habits.
And conflating the screen time debate with addiction can even be harmful. For example, in some countries, the idea of addiction to technology has been used to justify the incarceration of children in treatment camps despite a lack of evidence for the efficacy of such approaches.59 Media reports from these camps suggest that disciplinary methods employed by staff involved physical punishment and electric shocks.60
According to one research team focused on the East Asian phenomenon of corrective boot camps: “Internet addiction, although descriptively meaningful, is diagnostically of questionable value because it is conceptually vague, possesses a degree of cultural loading and fails to distinguish between symptoms and primary conditions.”61
This is your child’s brain on digital
Right next to fears that digital technology could be addictive is the idea that it can, on a neurophysiological level, rewire a child’s brain, interfere with the brain’s own reward system or affect brain development in other ways.
Investigating the impact of digital tech on brain development and cognitive processes
Current research shows that children’s experiences and environment during early childhood have an impact on the development of their brains. Whether a child receives adequate nutrition, is stimulated, loved and protected from adversity and stress all affect the formation of neural connections – with potentially lifelong impact. The first 1,000 days of life are a unique window of opportunity to support a child’s optimal brain development – and also a period of special vulnerability.
But research also shows that experience and environment have an impact on adolescent brain development, too – that adolescence is period of consolidation and pruning of neural connections.
Key cognitive processes are developing in adolescence and into young adulthood: working memory, taking in and responding to social cues and the ability to choose what to pay attention to and what to ignore. Internet use seems to have an impact on all these areas, both positive and negative, and with many uncertainties and caveats.62
This has led some to wonder whether excessive use of digital technology might be among the experiences with a potential impact on brain development. Do common activities associated with children’s online lives – use of social media and media
Internet use seems to have an impact on cognitive areas, both positive and negative, and with many uncertainties and caveats.
“

What do adolescents think about … technology and health in the digital age?
For participants in the State of the World’s Children 2017 workshops,* the connections between digital technology and health and well-being – both their own and that of others – were complex. Reflecting their generally positive views of connectivity, they saw great hope in how digital technology could treat illness and support a healthy lifestyle. But they also had clear views on how it could affect their happiness and mental well-being, both for better and worse.
Participants believed digital technology was advancing medical knowledge and the availability of treatments …“ Digital technology allows improving medical practices.” GROUP RESPONSE,
DEMOCRATIC REPUBLIC OF THE CONGO
and enabling people living with disabilities to participate more fully in everyday activities.“ Digital technology helps people in need: lenses, artificial limbs, special computers for people who can’t speak or move.” GROUP RESPONSE, REPUBLIC OF MOLDOVA
“ New digital technologies for communication will help children with special needs to feel at ease with their classmates.” GROUP RESPONSE, BELARUS
They also pointed to the role digital technology played in alerting them to the latest medical and/or health innovations …“ [It] helps people to know about the latest evolution in the world.” GROUP RESPONSE,
DEMOCRATIC REPUBLIC OF THE CONGO
and helping them to access information on particular health issues. “ You can find … information that describes
your health condition, so it’s really useful for our health and happiness.” GROUP RESPONSE,
REPUBLIC OF MOLDOVA
Participants felt that digital technology could support both their physical health …“ Technology aids physical exercise by
listening to music while working out.” GROUP RESPONSE, NIGERIA
and their mental health, for example by promoting social connection and providing them with access to entertainment.“ It is good for our health, because watching funny videos distracts us. It also helps us de-stress a little.” GROUP RESPONSE, PERU
On the negative side, participants argued that digital technology could exacerbate risks to health and well-being. They noted that overuse of digital technology could impair their hearing and vision …. “ The brightness of your phone or computer …
can also destroy your eyes.” BOY, 17, KIRIBATI
and distract from other activities, such as exercise, thereby increasing the incidence of obesity.“ We do less sport. We walk less.”
GIRL, 17, NIGERIA
And they were sceptical about the idea that biometric devices could support positive physical health outcomes.“ App to track your health doesn’t really work.”
GROUP RESPONSE, NIGERIA
They were also concerned about health misinformation.“ Some health ideas and tips online are wrong.”
GROUP RESPONSE, NIGERIA
In particular, participants highlighted the negative impacts of digital technology for their mental health and well-being. Prominent concerns centred on discriminatory or hurtful exchanges and content shared online, both of which could prompt powerful negative effects.“ I had an argument with a friend on Facebook. I experienced dreadful moments on Facebook. I saw miserable/regrettable posts. I received embarrassing comments.” BOY, 14, SENEGAL

“ When you publish something [online] and suddenly others attack you with no reason, without knowing you.” GIRL, 14, URUGUAY
“ I … posted a photo on Facebook and I received a comment that threw me into a panic.” BOY, 14, SENEGAL
Interestingly, some children noted that they were affected – sometimes deeply – by the negative online experiences of their friends.“ One of my friends posted a photo and one of her enemies made a bad comment and that really affected me because she’s one of my best friends.” GIRL, 16, SENEGAL
Others were very aware that their own online engagements might impact others.“ We can destroy other people’s happiness
with what we publish.” GROUP RESPONSE,
DEMOCRATIC REPUBLIC OF THE CONGO
They also noted that engaging with digital technology could be frustrating, which could lead to increased anxiety or anger. “ It creates stress because it’s very slow.”
GROUP RESPONSE, PERU
Some participants said that online platforms were not amenable to communicating feelings in ways that made them feel understood. “ We talk less often [because parents,
siblings or I play games or spend time on social networking services]: My parents are not able to grasp my state, [such as mental health or problems at school].” BOY, 15, JAPAN
Children in some countries expressed concern about excessive use of digital technologies.“ Addiction to technology – a thing that spoils the relationship with relatives.” BOY, 14, REPUBLIC OF MOLDOVA
“ There have been so many devices around since childhood and it is so easy to get addicted.” BOY, 15, JAPAN
Other participants suggested that digital technology could cause depression, anxiety and loss of contact with reality, noting, for example, that laptops, smartphones and computers can produce“ social isolation … by creating a virtual part-real world.” BOY, 16, REPUBLIC OF MOLDOVA
“ Digital technology also causes moral anxiety. If digital technology causes moral anxiety, how will it now aid health and happiness?” GROUP RESPONSE, NIGERIA
The displacement of other activities by digital technology meant, for some, that “ [people] forget the little things that [cause] happiness.” GROUP RESPONSE, NIGERIA
IN SUMMARYDespite their concerns about the potential negative impacts of digital technology on their health and happiness, the vast majority of participants stated either that technology’s effects were positive or were a balance of positives and negatives.
* Participants’ responses have been shortened and edited for clarity where necessary.

UNICEF – THE STATE OF THE WORLD’S CHILDREN 2017118
multitasking – affect how their brains function? If so, can we say how? Just as the possibility of addiction to digital technology has spawned fevered media stories, so too does the possibility of ‘brain damage’ send parents into frenzies of concern.
Fortunately, for the vast majority of children and adolescents, these fears are unfounded. Very few adolescents are excessive users of the internet or gamers whose total play time exceeds healthy bounds.63No evidence exists to suggest that moderate use of any digital technology has a negative impact on children’s brains.
This is not to say that evidence of the impact of excessive use should be ignored. Studies measuring the relationship between online behaviours and brain development may focus on a very small percentage of adolescents, but the findings of some studies do demonstrate an impact in extreme cases. They also show that it is not necessarily how much time is spent online as the kinds of activities pursued while online.
An oft-expressed concern of parents is that excessive participation in violent video games can cause children to act violently offline, but there is no evidence that demonstrates such a connection. In fact, new studies show that video games may even have beneficial effects on children’s visual faculty64 and ability to learn.65
Effect of ‘likes’ on the brain
Adolescents spend considerable time engaging with the content their peers post online and reacting to it. In a digital world ‘likes’ are a coin of the adolescent realm, influencing preferences and behaviour – and possibly even registering in the brain.
When exposed to different types of photographs, accompanied by the number of ‘likes’ for each photograph, adolescents in one naturalistic experimental study
using MRIs showed greater activity in the areas of the brain associated with social understanding and reward processing.66
The study also found that looking at pictures showing health-risking behaviours was linked to less activity in the parts of the brain affecting cognitive control and inhibition of actions.
However, despite these associations, there is not yet evidence on whether these variations in brain patterns have an actual impact or actually make adolescents behave in a certain way. Researchers do not know what the corresponding cognitive processes of the brain activity as seen on the MRI are and cannot predict whether the adolescents will indeed make certain behavioural choices when exposed to certain stimuli. Also, such ‘peer pressure’ may be the same offline – where it is much harder to measure with precision.
Benefits of media multitasking
Adolescents are known to multitask on their devices, flipping from watching a video to messaging their friends and back again, and then glancing to check social media status updates. Adults do it, too, of course – leading to a plethora of articles about whether the use of digital technology is causing attention-deficit/hyperactivity disorder (ADHD).
Studies show that adolescents and young adults who engage in more media multitasking need to employ more executive control and effort when working in distracting environments.67 But researchers have not been able to determine whether the increased brain activity in those areas of the brain was the result of media multitasking, or whether engagement in media multitasking68 is affected by brain activity. Similar research looked at how daily gaming affects memory and multitasking. The study measured how fluidly the young subjects between the ages of 13 and 24 switched attention while keeping track of
Video games may even have beneficial effects on children’s visual faculty and ability to learn.
“

04 DIGITAL CHILDHOODS: LIVING ONLINE 119
Too many news articles share evidence from studies that are methodologically weak or exaggerate or misrepresent the evidence provided.
“multiple items at once while undergoing an MRI scan. The findings showed that, based on their brain activity, subjects who were more frequent gamers might be better at switching attention and keeping track of a lot of information than those who reported less daily gaming.69
Pointing the way forward
The temptation to draw overarching conclusions from limited research is understandable but not useful to evaluate and address risks and benefits of online activity among children and adolescents. There is a need for longitudinal, representative studies and much more child-centred research. In addition, in an age when some children feel like they use internet all the time, researchers face new challenges in measuring and controlling their studies of use or excessive use.
In terms of identifying thresholds for use – How much is normal? How much is too much? Is it interfering with sleep or meals or homework? – the answers will depend on the child’s age, individual characteristics, culture and life context. At the same time, parents and caregivers must learn to pay greater attention to content and children’s online experiences and less attention to time use alone. Responses to problematic or unhealthy digital behaviours should first consider the broader life factors, such as school environment and relationships with family and friends.
Another issue in making recommendations with regard to screen time is that adult perceptions of excessive use tend to drive the debate. Children use digital technology for specific reasons and it is important to take their opinions and explanations seriously.
Children are in many ways the pioneers and experts in this area. Some are creating apps and programmes on their own. To effectively adjust to this situation and build constructive
dialogues around healthy and harmful use of digital technology in the family, school and society at large, we will need to rely more on children’s voices and experiences.
Media outlets also play an important role in the public’s understanding of the impact of digital media use on children’s well-being. Media coverage can both reflect and influence societal fears, which emphasizes the importance of providing a nuanced picture. This is not easy to do, however, given that evidence in this area is inconclusive and conflicting. Too many news articles share evidence from studies that are methodologically weak or exaggerate or misrepresent the evidence provided. This can distract attention from more pressing issues for children, or lead to situations where research and policy seek to address problems too quickly via interventions that have not been properly evaluated. This is not necessarily the fault of the media outlets or journalists: It also signals that there may be problems in the way universities and research institutes communicate their findings. One way to tackle this issue is for researchers to play a more direct role in how their findings are presented to the world, so they can highlight limitations and prevent overstating or mischaracterizing findings.
Adapting to increased use of digital technology will demand some adjustments in how parents raise children, how researchers undertake studies and how decision-makers develop policies and recommendations. As discussed, some have called for reducing screen time, but the evidence to date does not justify such interventions given the lack of evidence for notable negative effects on children’s lives or on the quality of their online experience. A better, shared understanding of how to use the internet – through mediation and positive and supportive parenting rather than restriction – holds the most promise for advancing children’s digital opportunities while minimizing their risks.

UNICEF – THE STATE OF THE WORLD’S CHILDREN 2017
PERSPECTIVE
Empowering children to engage in the digital world
Niels B. Christiansen
At the LEGO Group, children are our role models. They are always exploring, creating and discovering. They are intuitive learners with a hands-on and minds-on approach to life. Play is critical to inspiring this innate approach to learning, and creative play experiences can empower children to learn and develop critical life skills.
I have seen how important play was for my own two children. It encouraged them to invent, problem-solve, collaborate and have fun. It is a powerful force and an essential element of every child’s development. Research has consistently shown that play is not just enjoyable – it also fulfils a crucial role in learning and preparing children for challenges in childhood and throughout adulthood.
As more and more children around the world connect digitally, the importance of delivering playful experiences within safe online playgrounds has become a vital issue for the toy industry to address. For 85 years our company values of imagination, creativity, fun, learning, caring and quality have been instrumental in the LEGO Group’s commitment to providing the best play experiences with LEGO® bricks. Those same values now guide our ambition to deliver inspiring and safe digital experiences.
Innovation in digital technology represents a tremendous opportunity for bringing playful and educational experiences to children around the world. However, it also presents fresh challenges for responsible brands that strive to deliver high levels of safety, while inspiring empowerment and creativity in children as they grow and develop.
Together with our partners and industry experts, we strive for our digital experiences to be as safe for children as our physical play materials. We were the first company in the toy industry to establish a global partnership with UNICEF, and we are committed to promoting and implementing the Children’s Rights and Business Principles in our work. UNICEF and the International
Telecommunication Union’s Guidelines for Industry on Child Online Protection have been incorporated into the development and implementation of the LEGO Group’s Digital Child Safety policy. The policy affirms our respect and support for the rights of children, strengthens child protection governance across the company and underlines the LEGO Group’s commitment to providing safe and enjoyable digital experiences, while empowering children to play, learn and share.
We’ve learned from millions of consumers around the world that parents understand that digital technology is now integral to their children’s lives, and there is overwhelming support for trusted partners to provide social media channels designed for children’s use.
Social media offers fantastic possibilities for children to connect with each other across the world and share creativity and play experiences. We believe children should have access to social networking and have developed LEGO® Life, a safe social platform just for children and ‘tweens’ that inspires them to build and share their stories and creations with thousands of other children around the world. It is designed to be a child’s first digital social experience, taking users by the hand and introducing them to some of the core concepts of a social network.
Included in LEGO Life is our safety pledge, which provides support for parents to talk to their children about digital safety while establishing a shared commitment to ground rules for online social behaviour. We encourage parents to share digital experiences together with their children, take interest in their favourite apps, talk about digital protection and take the safety pledge (Be Safe, Be Cool, Respect Others and Have Fun) together with their children.
We believe that responsible brands, hand in hand with parents, have a significant role to play in ensuring that the evolution of technology contributes to children’s

04 PERSPECTIVE 121
“ Innovation in digital technology represents a tremendous opportunity for bringing playful and educational experiences to children around the world,” writes Neils B. Christiansen. © UNICEF/UN040222
well-being and development. However, governments also have an important role to play – a role that is not simply about adding new rules and restrictions, but one that reflects on the broader legislative framework and seeks to ensure that this does not stifle children’s creativity, nor tie the hands of responsible companies seeking to use technology to inspire and excite.
As we look to the future, therefore, it is important that we strike the right balance. A balance between protection and empowerment. A balance that gives children and parents the confidence necessary for fun and independent play but avoids the level of disruption that may drive children away from safe online spaces. A balance that respects children’s right to privacy
and the importance of parental consent yet recognizes that digital play experiences can help children develop vital skills for the twenty-first century.
At the LEGO Group, we believe that the road to success is found through strong partnerships. By working together, industry, parents, policymakers and civil society can deliver safe, inspiring and empowering digital play experiences for children.
Niels B. Christiansen has been CEO of the LEGO Group since October 2017. Before joining the company, he was the CEO of Danfoss A/S and, earlier, executive vice president at GN Store Nord. Niels has a Master of Science in Engineering from the Technical University of Denmark and holds an MBA from INSEAD in France.

Full articles by youth contributors featured in The State of the World’s Children 2017 can be found at: <www.voicesofyouth.org/en/sections/content/pages/sowc-2017>
JENN LITTLE, 16UNITED STATES
“ For me, it took exactly 20 clicks to reach out to an organization that provides students in the US with fundraising opportunities to help other kids go to school. … To my peers in Generation Z: We must all remember that as children of the digital age we have immense power. Let’s use it for good.”
05Digital Priorities: Harness the good, limit the harm

123
It has been said that it’s never a good idea to make predictions, especially about the future.
But there is no doubt that the futures of a rapidly growing number of children will be increasingly affected by digital technology.
Children already account for a substantial percentage of the global networked population, and their share will only increase in the future as internet penetration reaches ever further into regions with the most rapidly growing share of children and young people. Africa, for example, is expected by the middle of the century to become home to 40 per cent of all global under-fives, and 37 per cent of under-18s.1
More digital devices and online platforms, not fewer, will be available for children’s use. ICTs will continue shaping children’s lives, for better and for worse, just as emerging technologies like the Internet of Things and artificial intelligence help transform the digital landscape at a global scale.
As this report has shown, children will continue to experience these transformations in varied ways that also reflect how they experience ‘the real world’. Not surprisingly, the most disadvantaged and marginalized are least likely to reap the benefits of the internet and connectivity and most likely to experience harm from the negative aspects of technology. Other critical factors – including gender, education status, traditional norms, language and location – all play a role in the impact digital technologies have in children’s lives, for better and for worse.2
There are significant gaps in our understanding about those impacts, about the way children experience digital technology, and about the way they themselves regard the opportunities and risks of connectivity. There is an urgent need for more robust data collection, not only about whether children are or are not connected, but also why and how they
connect, and the conditions that facilitate or block their access. And more must be done to understand the opportunity costs for children living on both sides of digital divides – especially those lost by disadvantaged children with little or no access, but also offline opportunities potentially forgone by the most digitally connected children.
Especially in the absence of such information, policymakers face considerable challenges in keeping up with the rapid pace of technological change and its impact on children’s lives. The internet as we know it was developed and has been regulated primarily with adult users in mind – and the assumption that users are adults continues to inform legislators, regulators and internet governance organizations.3
But today’s children are digital natives and the internet is their second home. Policies and regulatory frameworks must catch up with this reality – especially when it comes to protecting children from the worst risks of connectivity, as those who use the internet to exploit and harm children make quick use of every loophole. But while less urgent, not less important is the need to develop policies and promote business practices that expand equitable access to online content.
The internet was developed primarily with adult users in mind.
“

UNICEF – THE STATE OF THE WORLD’S CHILDREN 2017124
There is no shortage of international instruments, guidelines, agreements and principles that deal with issues such as internet freedom, openness, net neutrality, accessibility and respect for human rights. What is needed are not more guidelines, per se, but agreed-upon principles and priority actions that recognize the responsibility we share to protect children from the perils of a digital world and to help all children benefit from the promise of connectivity.
This is not only in the best interests of children. In a digital world, it is also in the best interests of their societies, which can only benefit from children who are digitally literate, able to navigate among the myriad opportunities and risks of connectivity and chart a course to more productive futures.
Making the digital space better for children requires collaboration and cooperation among governments, United Nations agencies and other international children’s organizations, civil society, the private sector,
To survive and thrive in the digital world, children need to develop a broad set of digital literacy skills. © UNICEF/UN015600/PRINSLOO

05 DIGITAL PRIORITIES: HARNESS THE GOOD, LIMIT THE HARM 125
academia and the technical community, families and children themselves. Besides international guidelines and agreements, it requires child-focused national policy, coordinated response and sharing of best practice models.
The action points outlined here are by no means exhaustive, but together they reflect a core principle that should guide policymaking and practical action in the digital sphere: Respect and protect the child.
1. Provide all children with affordable access to high-quality online resources
Digital access is increasingly a determinant of equal opportunity for children, enabling them to benefit from access to information, knowledge, employment opportunities, community participation and social engagement. However, as discussed in Chapter 2, children face a range of barriers to accessing the internet and, if they do manage to get online, making the best use of online resources.
Chief among these, is the high cost of online access, but there are also physical barriers, including geography, poor infrastructure and lack of access to digital devices. Invisible barriers, such as gender and social norms, cultural practices and minority status, also play a role. Girls, for example, are particularly at risk of missing out on online access because of social concerns that the internet is a dangerous and inappropriate place for them. In addition, the lack of relevant content in children’s own language greatly limits the usefulness of the internet for many, especially those speaking minority languages or living in remote regions.
There are issues, too, around the sort of devices that children use to access
the internet. Mobile devices have allowed some communities to leapfrog to connectivity, but these devices can provide only a ‘second-best’ experience, greatly limiting what children can do online in terms of extended writing and content creation. Similarly, some approaches to providing online access to underserved communities have relied on providing them with a ‘walled garden’ of online access – in other words, access to only a very limited number of websites.
There is real potential for all these digital divides to deepen existing socio-economic divisions. In response, it is essential to develop a full picture of how social and economic factors are shaping children’s use of ICTs and the impact of ICTs on equity and opportunity.
Bring down the cost of connectivity. Market strategies that foster innovation and competition among service providers can help lower the cost of connecting to the internet. Integrating fibre-optic cables into existing infrastructure construction for transportation, gas and electricity, telecoms and sewerage can also lower the cost of expanding connectivity. And providing tax and other incentives for the telecom industry to bring down the cost of connectivity for disadvantaged communities and families could make a significant difference.
Invest in public-access hotspots. Public access points in schools, libraries, community centres, parks and shopping centres can dramatically increase access for unconnected children. In low-income neighbourhoods, mobile units, such as buses with Wi-Fi access, can similarly boost connectivity (see ‘Cuba’s first online generation’ and ‘Mind the homework gap’ boxes in Chapter 2).
Promote the creation of content that is relevant to children and in their own languages. Both the public and the private sectors should work to create
Digital access is increasingly a determinantof equal opportunity for children.
“
UNICEF – THE STATE OF THE WORLD’S CHILDREN 2017126
more locally developed and locally relevant content, especially in minority languages, and targeting remote areas with low population density.
Break cultural, social and gender barriers to equal online access. Training programmes that provide girls with opportunities for safe internet use and enhance their digital skills can both build girls’ confidence in using digital technology and help address family concerns (see ‘IT Girls: Bosnia and Herzegovina’, Chapter 1). Promoting community dialogue can help dispel myths around girls’ use of technology and the internet. Assistive technologies and internet platforms can enable children living with disabilities to communicate more easily, support them in learning, and help them be more independent (see iSign and Yuudee applications, Chapter 1).
Provide children on the move with access to digital devices and connectivity. Governments, aid agencies and the private sector should provide public internet access in refugee camps, immigration centres and other public spaces frequented by children on the move to help them stay in touch with families and friends (see Chad box, Chapter 1). Aid agencies should also consider working with the private sector more closely to include data services and digital devices as part of their overall aid packages.
2. Protect children from harm online
The digital age has amplified existing risks to children and created new ones. Child abuse, exploitation and trafficking online are still prevalent, not only on the Dark web but also on mainstream digital platforms and social media. In addition, children face a range of other online risks, including cyberbullying and exposure to unsuitable materials such as pornographic
or gambling sites. While most children navigate these latter risks successfully, for some the impact can be devastating and life-changing.
The international community has made some progress in formulating policies and approaches to eliminate the most egregious online risks, such as sexual exploitation, and there has been significant progress in law enforcement and support for victims. Initiatives such as the WePROTECT Global Alliance have created a framework that lays out what needs to be done at the levels of policy and governance, criminal justice, victim support, societal change, industry engagement and ethical and informed media reporting.
We need to build on these efforts – increasing coordination and knowledge sharing, scaling up approaches to help law enforcement stay ahead of online offenders, and working with the private sector to develop ethical standards that protect children.
Support law enforcement and child protection efforts. The private sector, and particularly technology firms, have a vital role to play in sharing digital tools, knowledge and expertise with law enforcement agencies to protect children online (see Chapter 3).
Adopt and implement the WePROTECT Global Alliance strategic framework. Designed to combat sexual exploitation online, the WePROTECT Global Alliance framework (see above) has already been adopted by 77 countries. The model sets out a coordinated response, with recommendations for action across a range of areas.
Tailor protections to reflect children’s evolving capacities. Strategies to promote children’s safety online should take account of a child’s age and maturity. Younger children are likely to need a great deal of support and guidance from parents, teachers

05 DIGITAL PRIORITIES: HARNESS THE GOOD, LIMIT THE HARM 127
and other trusted adults. But older children are likely to have greater agency and a desire to sometimes take risks. Within reason, such risk-taking is necessary for children to learn how to adapt and to develop resilience.
Support the people who can support children. Evidence-based programmes and policies can guide us to develop strategies for parents and other caregivers to gain the skills they need to positively mediate – rather than simply restrict – children’s use of ICTs. In addition, peer mentoring programmes can help children help each other more effectively, reflecting the reality that children often turn to their peers for support when they encounter online risks and harms.4
3. Safeguard children’s privacy and identities online
In a world where every digital move can be recorded and content can reach vast audiences with a single click, children face new risks to their privacy, reputations and identities. Data generated through their use of social media, for example, can be used for inappropriate advertising and marketing, profiling and surveillance. In addition, toys connected to the internet can transmit the thoughts and feelings of even very young children to toy manufacturers and, potentially, other adults (see ‘Perspective’ by Anab Jain in Special Section: Protecting children’s privacy online).
Children often do not fully understand the risks associated with using digital media or the loss of control over content – how an embarrassing photograph or comment posted online has the potential to follow them into adulthood. More savvy children often have different views about privacy online than their parents, but they are concerned about violations committed by their peers through bullying, hate speech and harassment; by corporations and industry through the breach of their
privacy rights; by government prying and potentially interfering with their freedom of expression; and even by intrusive parents who use restrictive monitoring or spying techniques. Because children are key players in protecting their own privacy online, understanding their attitudes and opinions on these issues is important.
Put safeguards in place to protect children’s privacy, personal information and reputation. Governments, businesses, schools and many other institutions handle an increasing amount of data related to children that are either collected or stored online. All actors need to put in place safeguards to protect these data in accordance with international and ethical standards, such as consent, data anonymization, secure data storage and prohibition of unlawful disclosure of information.5
Set children’s privacy settings at maximum by default. Maximum privacy protection should be the basic setting for digital tools and platforms used by children, and privacy should be included in the design of all new technologies from the outset. In addition, social media and other platform companies should write their terms and conditions and privacy policies in clear language that children can understand and provide them with easy ways to report breaches of privacy or other concerns (see ‘Simplifying the Rules’ in Special Section: Protecting children’s privacy online).
Don’t exploit children’s personal data for commercial gain. Businesses should not seek to monetize children’s personal information, such as through targeted advertising. They should develop ethical protocols and implement heightened scrutiny and protection for the full range of data concerning children, including information on children’s location and browsing habits and especially regarding their personal information.

UNICEF – THE STATE OF THE WORLD’S CHILDREN 2017128
Respect encryption for child-related and children’s data. Given children’s potential vulnerabilities, additional layers of protection and privacy should be used to safeguard their data. Decisions to decrypt children’s data to aid law enforcement agencies investigating online crimes, such as child sexual abuse and grooming, should be guided by the best interests of the child.
4. Teach digital literacy to keep children informed, engaged and safe online
Today’s children are digital natives, but that doesn’t mean they do not require guidance and support to make the most of connectivity. Similarly, they do not automatically understand their vulnerability to online risks or their own responsibility to be good digital citizens.
Digital literacy encompasses all these areas, implying a set of competencies that goes beyond digital and technical skills. It includes the ability to search, evaluate and manage information found online; interact, share and collaborate online; develop and create content; use safety and protection features, and solve problems and be creative.6
It also includes teaching children how to protect themselves from online dangers like cyberbullying, sextortion, loss of privacy and reputational risk. Seemingly innocuous activities, such as sharing photos, commenting on social media and filling in personal details on online forms, can have serious consequences, for example, if data fall into the wrong hands or if a private exchange between two children is spread more widely.
Investment in more sophisticated, complex digital skills is now becoming standard in schools in many higher-income countries, as well as in out-of-school initiatives that
teach children coding and programming. As ICTs become more widespread in lower-income countries, similar investment will be needed to prepare children in less-wealthy countries both for life online and to equip them to work in the twenty-first century digital economy.
To improve digital literacy and make better use of ICTs in education …
Teach digital literacy in schools. With children going online at ever-younger ages, schools – and especially public schools – need to incorporate digital literacy programmes from the earliest years.
Provide children with access to proven online education opportunities. The somewhat disappointing track record of ICTs in education underscores the need to pilot and test various models that really improve learning outcomes and can widen access to effective education opportunities.
Develop opportunities to learn ICT skills in non-formal education. Disadvantaged children who have slipped outside, or were never part of, formal education systems frequently have the most to gain from online learning opportunities. Providing digital access in training centres, such as Women in Technology Uganda (see Chapter 1), may be their only chance to engage with ICTs.
Support the development of teachers’ digital skills and literacies. Teachers need to be able to develop their own skills and knowledge to support their students’ use of ICTs and to help them develop an understanding of safe internet use beyond the classroom.
Support the establishment of online libraries. Online libraries, such as the Library for All, can open

05 DIGITAL PRIORITIES: HARNESS THE GOOD, LIMIT THE HARM 129
up a world of resources – including digital books and textbooks, videos and music – to children who would otherwise lack such access.
To teach children to keep themselves safe online and respect other users …
Understand the risks of content creation and sharing. Children need to be taught that everything they post online – from social media comments to videos – can no longer be considered private and potentially cannot be erased. Equally, children need to be made aware that self-generated content, such as sharing sexually explicit images, opens them up to the risk of extortion and their content may well end up being exchanged by strangers online.
Learn how to protect privacy and personal data online. Children need to be taught how to control their privacy settings to protect their personal information – name, date of birth, address, friends, family, school and personal photographs – and understand the danger that if such data are made public it may lead to identity theft and data mining among other risks.
Strengthen the teaching of online tolerance and empathy. Children need to be helped to understand the ways in which communicating online – with its lack of verbal and facial clues to meaning and its potential for anonymity – is different from traditional communication. Socio-emotional learning and the teaching of empathy can develop children’s online resilience and help diminish online abuse and hateful language. Such themes need to be incorporated into curricula for digital literacy.
Be good digital role models for children. It’s not just children who
are fascinated by digital technologies. Parents and other adults need to offer children models of responsible and respectful use of ICTs.
5. Leverage the power of the private sector to advance ethical standards and practices that protect and benefit children online
The private sector has been a key driver of the digital revolution. As providers of internet access, producers and providers of content and other digital goods, and purveyors of online goods and services, businesses are now increasingly integrated into children’s lives. As gatekeepers controlling the flow of information across the networks, they also have access to vast amounts of children’s information and data. These roles provide businesses with considerable power and influence – and with these come heightened responsibilities.
Businesses have an indispensable role to play in protecting children, working with governments to take down child-abuse material or other inappropriate content, raising awareness of safe and responsible internet use, and protecting children’s privacy. It is not enough to preach personal responsibility – the private sector must actively help children to guard their privacy, such as by changing default settings and providing regular advice to users.
The private sector must also lead in developing ethical technologies. For example, social media apps should aim to do more than simply keep children logged on for as long as possible (see box, ‘The role of (un)ethical design’, Chapter 4). Instead, technology companies should set out to serve children’s real needs, even if that means children spend less time online.
Everything children post online can no longer be considered private and potentially cannot be erased.
“

UNICEF – THE STATE OF THE WORLD’S CHILDREN 2017130
These issues will become ever more pressing as more powerful technologies like artificial intelligence and more immersive technologies like augmented and virtual reality become ever more integrated into children’s lives.
These actions are not only the right thing to do; they are sound business decisions. There is a real risk of reputational harm for any business that is seen to be failing some of its most vulnerable customers – children.
Prevent networks and services from disseminating child-abuse material. Technology and internet companies should take steps to prevent their networks and services from being used by offenders to collect and distribute child sexual abuse images. Continuously monitoring the flow of goods, services, images and texts that pose the greatest threats to children and working with law enforcement and other stakeholders to find innovative solutions to online criminal activities can help keep children safer online and off. (See, for example, ‘Microsoft’s Photo DNA’ on page 87.)
Promote non-discriminatory access. Companies can do more to provide children, particularly those in underserved areas, with access to the internet. They should also uphold shared principles, such as net neutrality, especially when these enable children to access a wide variety of sources and information.
Develop ethical standards for businesses and technologies. Businesses should work with policymakers and child rights advocates to develop minimum ethical standards for their services, and embrace the principle of ‘safety by design’, incorporating safety, privacy and security features into their products before they are made available to the public.
Offer parents the tools to create an age-appropriate online environment. Businesses should offer parents a fuller
Internet policies fail to take sufficient account of children’s distinctive needs and rights.
“
range of easy-to-use tools – such as password protection, block/allow lists, age verification and filtering – that will allow them to create a safe online space for their children, especially younger children. Businesses should commit to constant monitoring and evaluation of these tools to make sure they really are contributing to child safety online without unfairly restricting children’s legitimate freedoms.
6. Put children at the centre of digital policy
Despite estimates that children account for one third of internet users, current international and national internet policies fail to take sufficient account of children’s distinctive needs and rights. Policies related to cybersecurity, artificial intelligence and machine learning, net neutrality and internet openness look first and foremost at the adult user. On the other hand, broader national policies that deal with children’s rights and welfare, health and education have yet to universally embrace the power of digital technologies to help meet sectoral goals.7
To understand the power of the internet in helping to realize children’s rights and to help create greater equality of opportunity, a determined effort is needed to collect data on barriers to access and on how and why children use ICTs. Children’s needs must also be integrated in all ICT regulation and policy, the development of which should be informed by children’s own views and outlooks.
Give children and young people a voice in the development of digital policies that affect their lives. Policymakers should seek out children’s distinctive experiences and needs by engaging institutions that uphold children’s rights, including human

05 DIGITAL PRIORITIES: HARNESS THE GOOD, LIMIT THE HARM 131
Internet governance
Who runs the internet? The simple answer is no one. Instead, a broad system of ‘internet governance’ is spread out across a range of entities, including international bodies, national governments, the private sector and civil society. Without central coordination, these entities have over time developed the principles, norms, rules, decision-making procedures and programmes that allow the internet to operate and expand its reach.
Initially, internet governance focused mainly on technical issues and infrastructure, but it gradually expanded to include issues such as cybersecurity, e-commerce, net neutrality, human rights and other issues.
More recently, there is growing interest in exploring how more coordinated internet governance can specifically support economic and social
development. In 2015, the World Summit on the Information Society (WSIS+10) emphasized that access to ICTs has also become a development indicator and aspiration in and of itself. Even though none of the 17 Sustainable Development Goals focuses specifically on ICT, digital technology can contribute to the achievement of a number of child-focused goals, including ending poverty and hunger (SDGs 1 and 2), improving health and well-being (SDG 3), expanding educational opportunity (SDG 4), achieving gender equity (SDG 5) and tackling inequality (SDG 10).
Youth initiatives, such as Youth@IGF and NextGen@ICANN, focus on engaging young people in debates about the future of internet governance – though more can and should be done to incorporate children’s experiences and perspectives now in shaping the debate around a safer and more inclusive internet.
rights commissioners, civil society organizations and children themselves. More broadly, government and civil society should encourage children to use digital platforms to improve their communities and societies.
Track disparities in, and barriers to, access. To track the impact of internet access on equity and opportunity, it is vital to invest in the collection of data on children’s connectivity (see ‘Information Poverty’ in Chapter 2). Data should be disaggregated by wealth, geography, gender, age and other factors to spotlight disparities in access and opportunity and to target programmes and monitor progress. Evidence should be used to guide policymaking, monitor and evaluate the impact of government policies and strategies, and support the international sharing of best practices.
Integrate child- and gender-specific issues into national policies and strategies. The legitimate needs and concerns of children should be integrated
in all policies concerning ICTs and other emerging technologies, such as artificial intelligence. Policies should be guided by international standards and should seek to safeguard children’s rights and guard against discrimination and the restriction of children’s freedoms.
The testimonials and perspectives of children and young people in this report make it very clear that if given the chance – and provided with the skills – children will make the most of connectivity. Even with low access to ICTs, inadequate equipment, teachers who know less about digital technology than they do, and adults who are uncomfortable with the pace of change, millions of children around the world are already using the internet to learn, socialize and prepare themselves to take their place as adults in the workplace – and to make their mark upon the world.
They are eager for that chance – and they deserve it. It is up to all of us to see that every one of them gets it.

UNICEF – THE STATE OF THE WORLD’S CHILDREN 2017132
CHAPTER 1: DIGITAL OPPORTUNITIES: THE PROMISE OF CONNECTIVITY
1 Based on reporting by The State of the World’s Children report team at Za’atari refugee camp in May 2017.
2 Réseau des journalistes amis de l’enfant (Journalists Network of Friends of the Child).
3 Gary Wolf, ‘Steve Jobs: The next insanely great thing’, Wired, 1 February 1996, pp. 102–163.
4 United Nations Educational, Scientific and Cultural Organization, Leveraging Information and Communication Technologies to Achieve the Post-2015 Education Goal: Report of the International Conference on ICT and Post-2015 Education, UNESCO, Paris, 2015, p. 22.
5 United Nations Children’s Fund and Move, ‘Igarité: Overview of face-to-face teaching with technological mediation in the state of Amazonas’, UNICEF Brazil, 2017.
6 Pence, Audrey, ‘Mobilizing Literacy: Cell phones help Afghan women learn to read’, Solutions, vol. 6, no. 3, 2015, pp. 8–9.
7 United Nations Educational, Scientific and Cultural Organization, ‘Study on International Collaboration on Open Educational Resources (OER)’, Commissioned study prepared under a consultant contract for UNESCO, December 2016.
8 See Inoue, Keiko, et al., ‘Out-of-School Youth in Sub-Saharan Africa: A policy perspective’, World Bank, Washington, D.C., 2015; and Scott, Molly M., Simone Zhang and Heather Koball, ‘Dropping Out and Clocking In: A portrait of teens who leave school early and work’, Urban Institute, Washington, D.C., April 2015.
9 Njideka, Harry, ‘Pioneering the Youth and Technology Movement in Africa and Beyond’, MIT Press Journals, vol. 10, no. 1–2, 2015, p. 8.
10 Evaluation of UNDP/UNICEF/UN Women, IT Girls Project: Final report, Sarajevo, December 2016.
11 Toyama, Kentaro, ‘Children’s Education in a Digital Age’, Background research paper for The State of the World’s Children 2017: Children in a Digital World, University of Michigan, 2 February 2017.
12 Flores, Pablo, and Juan Pablo Hourcade, ‘Under Development: One year of experiences with XO laptops in Uruguay’, Interactions, vol. 16, no. 4, 2009, pp. 52–55.
13 Cristia, Julián P., et al., ‘Technology and Child Development: Evidence from the One Laptop per Child Program’, IZA Discussion Paper no. 6401, IZA, Bonn, March 2012, p. 4.
14 ‘Goodbye, One Laptop Per Child’, OLPC News, 11 March 2014.
15 ‘The Learning Generation: Investing in education for a changing world’, A Report on the International Commission for Financing Global Education Opportunity, New York, 2016, p. 59, fig. 13.
16 Toyama, ‘Children’s Education in a Digital Age’.
17 Banerjee, Abhijeet V., et al., ‘Remedying Education: Evidence from two randomized experiments in India’, Quarterly Journal of Economics, vol. 122, no. 3, 1 August 2007, pp. 1235–1264.
18 Muralidharan, Karthik, Abhijeet Singh and Alejandro J. Ganimian, Disrupting Education? Experimental evidence on technology-aided instruction in India,
NBER Working Paper no. 22923, National Bureau of Economic Research, Cambridge, Mass., 2016.
19 <www.avallainfoundation.org>
20 Avallain Foundation, ‘The Avallain Foundation RCT-Based Impact Study: The impact of a-ACADEMY digital learning platform on children’s performance in class 6 science in Kenya’, 2017.
21 Focus group discussion conducted by The State of the World’s Children report team with children in the Hanka Educational Centre, located in Mathare, Kenya.
22 Barrera-Osorio, Felipe, and Leigh L. Linden, ‘The Use and Misuse of Computers in Education: Evidence from a randomized experiment in Colombia’, Policy Research Working Paper no. 4836, World Bank, February 2009.
23 Fairlie, Robert W., and Jonathan Robinson, ‘Experimental Evidence on the Effects of Home Computers on Academic Achievement among Schoolchildren’, American Economic Journal: Applied Economics, vol. 5, no. 3, 2013, pp. 211–240.
24 Banerjee et al., ‘Remedying Education’.
25 Toyama, ‘Children’s Education in a Digital Age’.
26 Organisation for Economic Co-operation and Development, ‘Students, Computers and Learning: Making the connection’, OECD Publishing, Paris 2015.
27 World Bank, World Development Report 2018: Learning to realize education’s promise, World Bank, Washington, D.C., 2018, p. 145.
Endnotes

ENDNOTES 133
28 Toyama, Children’s Education in a Digital Age.
29 Beland, Louis-Philippe, and Richard Murphy, ‘Ill communication: Technology, distraction & student performance’, Labour Economics, vol. 41, no. C, 2016, pp. 61–76. <www.sciencedirect.com/science/article/pii/S0927537116300136>
30 Duflo, Esther, Rema Hanna and Stephen P. Ryan, ‘Incentives Work: Getting teachers to come to school’, American Economic Review, vol. 102, no. 4, 2012, pp. 1241–1278.
31 Bannerjee et al., ‘Remedying Education’; and Muralidharan et al., Disrupting Education?
32 Abdul Latif Jameel Poverty Action Lab, ‘Remedial Education: Reorienting classroom instruction has improved learning opportunities for 47.7 million students in India, J-PAL.
33 Penuel, William R., ‘Implementation and Effects of One-to-One Computing Initiatives: A research synthesis’, Journal of Research on Technology in Education, vol. 38, no. 3, 2006, pp. 329–348 <www.tandfonline.com/doi/pdf/10.1080/15391523.2006.10782463>
34 Hagen, Erica, ‘Mapping Change: Community information empowerment in Kibera (Innovations Case Narrative: Map Kibera)’, Innovations: Technology, Governance, Globalization, vol. 6, no. 1, Winter 2011, MIT pp. 69–94.
35 Lazzeri, Thais, ‘O menino tímido que abalou Brasilia’ (The shy boy who shook Brasilia), Epóca, 17 July 2013; and Lima, Luciana, ‘Em Brasília, jovem de 17 anos mobilizou mais de 10 mil pessoas’ (In Brasilia, a 17-year-old young man mobilized 10,000 people), Último Segundo’, 20 June 2013.
36 Kelly, Sanja, et al., ‘Freedom on the Net 2016: Silencing the messenger – Communication apps under pressure’, Freedom House, Washington, D.C., 2016, p. 19.
37 International Telecommunications Union, Digital Opportunities: Innovative ICT solutions for youth employment, ITU, Geneva, 2014; and World Bank, World Development
Report 2016: Digital dividends, World Bank, Washington, D.C., 2016.
38 Raftree, Linda, ‘Landscape Review: Mobiles for youth workforce development’, JBS International, Rockland, Maryland, 2013, p. 25.
39 Ibid., p. 3.
40 <www.facebook.com/groups/oportunidadesp arainternacionalistas>
41 Raftree, ‘Landscape Review’, p. 2.
42 International Telecommunications Union, Digital Opportunities, ITU, Geneva, 2014, pp. 18–21.
43 Raftree, ‘Landscape Review’, p. 2.
44 World Bank, World Development Report 2016, p. xiii.
45 World Economic Forum, ‘The Future of Jobs: Employment, skills and workforce strategy for the fourth industrial revolution’, Global Challenge Insight Report, World Economic Forum, Geneva, January 2016, p. v.
46 Schwab, Klaus, ‘The Fourth Industrial Revolution: What it means and how to respond’, Foreign Affairs, December 2015.
47 Jütting, Johannes, and Christopher Garroway, ‘The Rise of the Robots: Friend or foe for developing countries?’, OECD Insights: Debate the issues, Organisation for Economic Co-operation and Development, 2 March 2016.
48 United Nations Educational, Scientific and Cultural Organization, The Global Learning Crisis: Why every child deserves a quality education, UNESCO, Paris, 2013, p. 2.
49 World Economic Forum, ‘New Vision for Education: Unlocking the potential of technology’, World Economic Forum, Geneva, 2015, p. 3.
50 Kautz, Tim, et al., ‘Fostering and Measuring Skills: Improving cognitive and non-cognitive skills to promote lifetime success’, Organisation for Economic Co-operation and Development, Paris, p. 54.
51 Morgenstern, Michael, ‘Automation and Anxiety: Will smarter machines cause mass unemployment?’, The Economist, 25 June 2016.
52 Ian Stewart, Debapratim De and Alex Cole, ‘Technology and People: The great job-creating machine’, Deloitte LLP, August 2015.
53 United Nations Children’s Fund, Uprooted: The growing crisis for refugee and migrant children, UNICEF, New York, 2016, p. 1.
54 Maitland, Carleen, et al., ‘Youth Mobile Phone and Internet Use: January 2015 – Za’atari Camp, Mafraq, Jordan’, Penn State College of Information Sciences and Technology, October 2015, p. 3.
55 Raftree, Linda, Katie Appel and Anika Ganness, ‘Modern Mobility: The role of ICTs in child and youth migration’, Plan International, Washington, D.C., 2013, p. 17, 20–25.
56 Ibid., p. 3.
57 Vernon, Alan, Kamel Deriche and Samantha Eisenhauer, Connecting Refugees: How internet and mobile connectivity can improve refugee well-being and transform humanitarian action, UNHCR, Geneva, September 2016, pp. 12–13.
58 Ibid., p. 25.
59 United Nations Educational, Scientific and Cultural Organization, ‘Debates on the implementation of the 2005 Convention on the Protection and Promotion of the Diversity of Cultural Expressions’, UNESCO, Paris, 2015. p. 2.
60 Rice, Emma S., et al., ‘Social Media and Digital Technology Use among Indigenous Young People in Australia: A literature review’, International Journal for Equity in Health, vol. 15, no. 81, 2016.
61 Jenzen, Olu, and Irmi Karl, ‘Make, Share, Care: Social media and LGBTQ youth engagement’, Ada: A Journal of Gender, New Media & Technology, no. 5, 2014, p. 4.
62 The Gay, Lesbian & Straight Education Network, Center for Innovative Public Health Research and Crimes Against Children Research Center, ‘Out Online: The experiences of lesbian, gay, bisexual and transgender youth on the internet’, GLSEN, New York, 2013.

UNICEF – THE STATE OF THE WORLD’S CHILDREN 2017134
63 Child Helpline International, ‘The Voices of Children and Young People. 2015 in Numbers: Child Helpline Global Highlights, CHI, Amsterdam, 2015, p. 1.
64 Child Helpline International, ‘2015 Annual Report’, CHI, Amsterdam, p. 7.
65 United Nations Children’s Fund, The State of the World’s Children 2013: Children with disabilities, UNICEF, New York, 2013, p. 20.
66 Kaye, Stephen H., ‘Disability and the Digital Divide’, U.S. Department of Education, Washington, D.C., 2000; and Dobransky, Kerry, and Eszter Hargittai, ‘The Disability Divide in Internet Access and Use’, Information Communication and Society, vol. 9, no. 3, 2006, pp. 313–334.
67 Livingstone, Sonia, and Monica E. Bulger, ‘A Global Agenda for Children’s Rights in the Digital Age: Recommendations for developing UNICEF’s research strategy’, UNICEF Office of Research-Innocenti, Florence, September 2013.
68 Third, Amanda, ‘Method Guide 6: Researching the benefits and opportunities for children online’, Global Kids Online, London, November 2016, p. 21.
69 Byrne, Jasmina, et al., ‘Global Kids Online Research Synthesis: 2015–2016’, UNICEF Office of Research-Innocenti and London School of Economics and Political Science, Florence, November 2016, p. 11.
70 Based on an interview conducted by Brian Keeley and Céline Little (and translated by Samir Badran) with a family in the Za’atari Refugee Camp in Jordan on 14 May 2017.
71 United Nations Committee on the Rights of the Child, Report of the 2014 Day of General Discussion on Digital Media and Children’s Rights, p. 9.
72 Jones, Lisa M., and Kimberly J. Mitchell, ‘Defining and Measuring Youth Digital Citizenship’, News Media & Society, vol. 18, no. 9, 2015, p. 2074.
73 Byrne et al., ‘Global Kids Online Research Synthesis: 2015–2016’, pp. 44–45.
74 United States Agency for International Development, ‘Technical Brief: Use of technology in the Ebola response in West Africa’, USAID, November 2014.
75 Ibid.
76 United Nations Global Pulse and GSMA, ‘The State of Mobile Data for Social Good Report’, UN Global Pulse and GSMA, 2017, p. 7.
77 Lopez Fernebrand, Tomas, ‘How Travel Data Can Help Manage the Spread of the Zika Virus’, UNICEF Stories of Innovation, 19 July 2016.
78 Fabian, Christopher, ‘Can Big Data be Used as a Social Good in the Fight against Disease Epidemics?’, UNICEF Stories of Innovation, 19 July 2016.
79 United Nations Children’s Fund, Education Uprooted: For every migrant,
refugee and displaced child, education, UNICEF, New York, September 2017.
80 Gaunt, Anna, ‘UNHCR Cash Assistance: Improving refugee lives and supporting local economies – Post distribution monitoring for Syrian refugees’, UNHCR, Jordan, 2016.
81 GSMA, ‘Landscape Report: Mobile money, humanitarian cash transfers and displaced populations’, GSMA, London, 2017, pp. 12–13.
82 United Nations Children’s Fund, ‘Cash Based Approaches in UNICEF’s Humanitarian Action’, UNICEF, May 2016, p. 2.
83 Global Innovation Exchange, ‘Principles for Digital Payments in Humanitarian Response’, 2016, p. 1.
84 Raymond, Nathaniel A., and Casey S. Harrity, ‘Addressing the ‘Doctrine Gap’: Professionalising the use of information communication technologies in humanitarian action’, Humanitarian Exchange, no. 66, Humanitarian Practice Network at the Overseas Development Institute, London, April 2016, p. 13.
85 Berman, Gabrielle, and Kerry Albright, ‘Children and the Data Cycle: Rights and ethics in a big data world’, Innocenti Working Paper 2017–05, UNICEF Office of Research-Innocenti, Florence, 2017, p. 10.
86 O’Brien, Stephen, ‘This Is How We Build a Stronger, Data-Driven Humanitarian Sector’, World Economic Forum, January 2017.
87 Raymond and Harrity, ‘Addressing the ‘Doctrine Gap’, p. 13.
CHAPTER 2: DIGITAL DIVIDES: MISSED OPPORTUNITIES
1 ITU estimates for this report, 2017.
2 International Telecommunication Union, ICT Facts and Figures 2016, ITU, Geneva, p. 3; Facebook, State of Connectivity 2015: A report on global internet access, Facebook, Menlo Park, Calif., 2016, p. 36.
3 Measuring the Information Society Report 2016, ITU, Geneva, pp. 179–181, 190.
4 International Telecommunication Union, ICT Facts and Figures 2016.
5 Livingstone, Sonia, ‘Method Guide 1: A framework for researching Global Kids Online – Understanding children’s well-being and rights in the digital age’, Global Kids Online, London, November 2016, p. 17.
6 Raftree, Linda, Katie Appel and Anika Ganness, ‘Modern Mobility: The role
of ICTs in child and youth migration’, Plan International, Washington, D.C., 2013, p. 17, 20–25.
7 World Bank, World Development Report 2016: Digital dividends, World Bank, Washington, D.C., 2016, p. 14.
8 Organisation for Economic Co-operation and Development, ‘Does Having Digital Skills Really

ENDNOTES 135
Pay Off?’, Adult Skills in Focus No. 1, OECD Publishing, Paris, June 2015, p. 3.
9 Liu, CheWei, and Sunil Mithas, ‘The Returns to Digital Skills: Evidence from India – 2005–2011’, Research Paper submitted at the Thirty-Seventh International Conference on Information Systems, Dublin, 2016, p. 11.
10 Aissaoui, Najeh, and Lobna Ben Hassen, ‘Skills-biased Technological Change, E-Skills and Wage Inequality: Evidence from Tunisia’, Journal of Economics Studies and Research, vol. 2016, art. ID 492224, 2016, pp. 13–14.
11 Poushter, Jacob, ‘Smartphone Ownership and Internet Usage Continues to Climb in Emerging Economies’, Pew Research Center, 22 February 2016, p. 16.
12 Basu, Kaushik, ‘Development in the digital age’, Let’s Talk Development, World Bank, Washington, D.C., 28 September 2015.
13 Kleine, Dorothea, David Hollow and Sammia Poveda, ‘Children, ICT and Development: Capturing the potential, meeting the challenges’, Innocenti Insight, Unicef Office of Research, Florence, 2013, p. 19.
14 International Telecommunication Union, ICT Facts and Figures 2017, ITU, Geneva, 2017, p. 1.
15 ITU estimates, 2017.
16 Eurostat, ITU and UNICEF, 2012–2016.
17 International Telecommunication Union, Measuring the Information Society Report 2016, p. 135.
18 Organisation for Economic Co-operation and Development, ‘Students, Computers and Learning: Making the connection’, OECD Publishing, Paris, 2015, p. 129.
19 International Telecommunication Union, ICT Facts and Figures 2016.
20 International Telecommunication Union and the United Nations Educational, Scientific and Cultural Organization, The State of Broadband 2015: Broadband as a foundation for sustainable development, ITU and UNESCO, Geneva, September 2015, p. 9.
21 GSM Association, ‘Bridging the Gender Gap: Mobile access and usage in low- and middle-income countries’, GSMA, London, 2015, pp. 6–9, 29.
22 Ibid., p. 6.
23 Horrigan, John B., ‘The Numbers behind the Broadband ‘Homework Gap’, Pew Research Center, 20 April 2015.
24 Ibid.
25 McLaughlin, Clare, ‘The Homework Gap: The ”cruelest part of the digital divide”’, neaToday (News and Features from the National Education Association), 20 April 2016.
26 Hispanic Heritage Foundation, myCollege Options and Family Online Safety Institute, ‘Taking the Pulse of the High School Student Experience in America: Research Findings – ‘Access to technology’ Phase 1 of 6’, 2015, p. 11.
27 Kang, Cecilia, ‘Bridging a Digital Divide that Leaves Schoolchildren Behind’, The New York Times, 22 February 2016.
28 Vick, Carl, ‘internet for All’, Time, 10 April 2017, pp. 34–35.
29 Kang ‘Bridging a Digital Divide that Leaves Schoolchildren Behind’.
30 UNICEF India, Child Online Protection in India, UNICEF India, New Delhi, 2016, p. 46; and DNA India, ‘Uttar Pradesh: Muslim village panchayat bans jeans, mobile phones for girls’, Daily News & Analysis (DNA), 20 September 2015.
31 The study included a sample of 5,349 children from government, private and international schools. Information was also collected from school principals and IT teachers. Focus group discussions were also held with parents and heavy users.
32 UNICEF Sri Lanka, Keeping Children in Sri Lanka Safe and Empowered Online: A study on Sri Lanka’s digital landscape – potential risks to children and young people who are online, UNICEF, Colombo, Sri Lanka, 2015.
33 Livingstone, Sonia, et al., ‘Young Adolescents and Digital Media Uses, Risks and Opportunities in Low- and Middle-Income Countries: A Rapid Evidence review’, Gender and
Adolescence: Global Evidence (GAGE), London, 2017, p. 3.
34 Hargittai, Eszter, ‘Second-Level Digital Divide: Differences in people’s online skills’, First Monday, vol. 7, no. 4, April 2002.
35 Van Deursen, Alexander J.A.M., and Jan A.G.M. van Dijk, ‘The Digital Divide Shifts to Differences in Usage’, New Media & Society, Vol. 16, no. 3, 2014, p. 520; Van DIJK, Jan A.G.M., ‘The Evolution of the Digital Divide: The digital divide turns to inequality of skills and usage’, Digital Enlightenment Yearbook 2012, IOS Press, Amsterdam, 2012, pp. 57–75; Pearce, Katy E., and Ronald E. Rice, ‘Digital Divides from Access to Activities: Comparing mobile and personal internet users’, Journal of Communication, vol. 63, no. 4, August 2013, pp. 721–744; and Hargittai, Eszter, and Amanda Hinnant, ‘Differences in Young Adults’ Use of the Internet’, Communication Research, vol. 35, no. 5, 3 September 2008.
36 International Telecommunication Union, Measuring the Information Society Report 2016, pp. 199–201; Van Deursen and van Dijk, ‘The Digital Divide Shifts to Differences in Usage’.
37 Van DIJK, Jan A.G.M., ‘The Evolution of the Digital Divide’; and Andreasson, Kim, ‘Redefining the Digital Divide: A Report from The Economist Intelligence Unit’, The Economist Intelligence Unit Limited, London, 2013, pp. 8–9.
38 Sonck, N., et al, ‘Digital Literacy and Safety Skills’, EU Kids Online, London School of Economics and Political Science, London, July 2011, p. 2; Livingstone, Sonia, et al., ‘EU Kids Online: Final report’, London School of Economics and Political Science, London, 2011.
39 Organisation for Economic Co-operation and Development, ‘Students, Computers and Learning’ p. 137; and Van Deursen and van Dijk, ‘The Digital Divide Shifts to Differences in Usage’.
40 Livingstone, Sonia, and Ellen Helsper, ‘Gradations in Digital Inclusion: Children, young people and the digital divide’, New Media & Society, vol. 9, no. 4, 2007, p. 6.

UNICEF – THE STATE OF THE WORLD’S CHILDREN 2017136
41 Napoli, Philip M., and Jonathan A. Obar, ‘Mobile Leapfrogging and Digital Divide Policy: Assessing the limitations of mobile internet access’, New America Foundation, Washington, D.C., April 2013, p. 9; Pearce and Rice, ‘Digital Divides from Access to Activities’, pp. 737–738; and Horrigan, John B., ‘Smartphone and Broadband: Tech users see them as complements and very few would give up their home broadband subscription in favor of their smartphone’, Discussion paper Prepared for the Silicon Flatirons/MIT Workshop 2015 on ‘The internet & Television Expo’, Cambridge, Mass., November 2014.
42 Caribou Digital, ‘Digital Access in Africa’, Farnham, Surrey, UK, p. 14.
43 Napoli, Philip M., and Jonathan A. Obar, ‘Mobile Leapfrogging and Digital Divide Policy’, p. 9.
44 Madden, Mary, et al., ‘Teens and Technology 2013’, Pew Research Center, Washington, D.C., 13 March 2013, p. 8.
45 Katz, Vikki, ‘Opportunity for all? Digital equity in the lives of lower-income U.S. families’, <http://digitalequityforlearning .org> Learning Research Network, 24 February 2017.
46 Byrne, Jasmina, et al., ‘Global Kids Online Research Synthesis: 2015–2016’, UNICEF Office of Research-Innocenti and London School of Economics and Political Science, Florence, 2016, pp. 36–37.
47 Malcolm, Jeremy, Corynne McSherry and Kit Walsh, ‘Zero Rating: What it is and why you should care’, Electronic Frontier Foundation, 18 February 2016.
48 International Telecommunication Union, Measuring the Information Society Report 2016, p. 101.
49 Surman, Mark, Corina Gardner and David Ascher, ‘Local Content, Smartphones and Digital Inclusion’, Innovations, vol. 9, 2014, p. 65.
50 International Telecommunication Union and the United Nations Educational, Scientific and Cultural Organization, The State of Broadband 2016: Broadband catalzying sustainable development, ITU and UNESCO, Geneva, p. 11; Pearce, Katy E., and Ronald E. Rice, ‘The Language Divide: The persistence
of English proficiency as a gateway to the internet – The cases of Armenia, Azerbaijan, and Georgia’, International Journal of Communication, vol. 8, 2014, pp. 2834–2859.
51 Facebook, State of Connectivity 2015, pp. 26–27; World Bank, World Development Report 2016, p. 104; and McKinsey & Company, ‘Offline and Falling Behind: Barriers to internet adoption, technology, media, and telecom’, McKinsey & Company, 2014.
52 Statista, The Statistics Portal, available at <www.statista.com/statistics/262946/share-of-the-most-common-languages-on-the-internet>; and Facebook, State of Connectivity 2015, pp. 26–27.
53 Facebook, State of Connectivity 2015, p. 27.
54 Ibid.
55 Johnson, Melvin, et al., ‘Google’s Multilingual Neural Machine Translation System: Enabling Zero-Shot translation’, Transactions of the Association for Computational Linguistics, vol. 5, 2017, pp. 339–351.
56 Hargittai, Eszter, and Gina Walejko, ‘The Participation Divide: Content creation and sharing in the digital age’, Information, Communication and Society, vol. 11, no. 2, 2008, pp. 239–256 <https://soc334technolo gyandsociety.files.wordpress.com/2012/08/hargittaiwale jko2008.pdf>; and Graham, Mark, et al., ‘Uneven Geographies of User-Generated Information: Patterns of increasing informational poverty’, Annals of the Association of America Geographers, vol. 104, no. 4, 2014, pp. 746–764; and <http://geography.oii.ox.ac.uk/?page=the-geographically-uneven-coverage-of-wikipedia>.
57 Graham, Mark, et al., ‘Uneven Geographies of User-Generated Information’.
58 Anderson, Monica, ‘Wikipedia at 15: Millions of readers in scores of languages’, Pew Research Center, Washington, D.C., 14 January 2016.
59 Graham, Mark, et al., ‘Uneven Geographies of User-Generated Information’.
60 World Bank, World Development Report 2016: Digital dividends, p. 8.
61 Public Empiricus, ‘From Snoring Camels to Product Diversification: A gendered analysis of internet participation in Ghana, Kenya, Nigeria and South Africa’, 20 February 2017.
62 ETECSA Directorate of Institutional Communication, 2017.
63 Cuban Ministry of Commerce and Foreign Investment, 2017.
64 Organisation for Economic Co-operation and Development, ‘Students, Computers and Learning’, p. 16.
65 GSM Association, ‘Accelerating affordable smartphone ownership in emerging Markets’, GSM Association, London, July 2017, p. 9.
66 Caribou Digital, ‘Digital Access in Africa’, p. 13.
67 GSM Association, ‘The Mobile Economy 2016’, GSMA, London, 2016, pp. 2–4.
68 Kleine, Hollow and Poveda, ‘Children, ICT and Development’, p. 16; GSM Association, ‘The Mobile Economy 2016’, p. 4.
69 Data from UNICEF’s Data and Analytics Section, Division of Research and Policy.
70 GSM Association, ‘Connected Society: Consumer barriers to mobile internet adoption in Africa’, GSMA, London, 2016, p. 6.
71 GSM Association, ‘The Mobile Economy 2017’, GSMA, London, 2016, p. 11.
72 Lall, Somik Vinay, et al., Africa’s Cities: Opening Doors to the World, World Bank, Washington, D.C., 2017, p. 17.
73 United Nations Children’s Fund, ‘Generation 2030 Africa’, UNICEF, New York, 2014, p. 9.
74 International Telecommunication Union, Measuring the Information Society Report 2016, p. 210.
75 ITU 2017 Data; Byrne, Jasmina, et al., ‘Global Kids Online Research Synthesis: 2015–2016’, p. 16.
76 Livingstone, Sonia, and Monica Bulger, ‘A Global Agenda for Children’s Rights in the Digital Age: Recommendations for developing UNICEF’s research strategy’, London School of Economics

ENDNOTES 137
and Political Science and UNICEF Office of Research-Innocenti, London and Florence, 2013, p. 4.
77 Lenhart, Amanda, ‘Teens, Social Media & Technology Overview 2015’, Pew Research Center, Washington, D. C., April 2015, p. 16.
78 Mascheroni, Giovanna, and Andrea Cuman, ‘Net Children Go Mobile: Final Report (with country fact sheets) – Deliverables D6.4 and D5.2’, Educatt, Milan, November 2014, pp. 5–6; Third, Amanda, et al., ‘Children’s Rights in the Digital Age: A Download from Children Around the world’, Young and Well Cooperative Research Centre, Melbourne, 2014, p. 31.
79 Hajdinjak, Marko, et al., ‘Online Experiences of Children in Bulgaria: Risks and safety – A National Representative survey’, Bulgarian Safer Internet Centre, Applied Research and Communications Fund, Sofia, p. 4.
80 China Internet Network Information Center, ‘Statistical Report on internet Development in China’, CINIC, July 2016, p. 19.
81 Doneda, Danilo, and Carolina Rossini, ‘ICT Kids online Brazil 2014: Survey on internet use by children in Brazil’, Brazilian Internet Steering Committee, São Paulo, Brazil, 2015, p. 230.
82 GSM Association, ‘Children’s Use of Mobile Phones: An international comparison 2013’, GSMA and NTT Docomo Inc.’s Mobile Society Research Institute, London and Tokyo, 2014, p. 9.
83 GSM Association, ‘Children’s Use of Mobile Phones: An international comparison 2015’, GSMA and NTT Docomo Inc.’s Mobile Society Research Institute, London and Tokyo, 2016, pp. 6–7.
84 Mascheroni and Cuman, ‘Net Children Go Mobile’, p. 6; Hasebrink, Uwe, et al., ‘Patterns of Risk and Safety Online: In-depth analysis from the EU Kids Online survey of 9- to 16-year-olds and their parents in 25 European countries’, EU Kids Online, London, August 2011, p. 7.
85 GSM Association, ‘Children’s Use of Mobile Phones: An international comparison 2012’, GSMA, and NTT Docomo Inc.’s Mobile Society Research Institute, London and Tokyo, 2013, p. 51; GSM Association, ‘Children’s Use of Mobile Phones: An international comparison 2013’, pp. 44–45 <www.gsma.co m/publicpolicy/wp-content/uploads/2012/03/GSMA_ChildrensMobilePhones2013WEB.pdf>; and Mascheroni and Cuman, ‘Net Children Go Mobile’, p. 16.
86 Lenhart, Amada, et al., ‘Teens, Technology and Friendships’, Pew Research Center, Washington, D.C., August 2015, pp. 60–61.
87 Livingstone, Sonia, et al., ‘Children’s Online Risks and Opportunities: Comparative findings from EU Kids Online and Net Children Go Mobile’, London School of Economics and Political Science, London, November 2014, p. 10.
88 Doneda and Rossini, ‘ICT Kids online Brazil 2014’, pp. 236–223.
89 Ravalli, María José, and Paoloni, Paola Carolina, ‘Global Kids Online Argentina: Research study on the perceptions and habits of children and adolescents on the use of technologies, the internet and social media’, Global Kids Online and United Nations Children’s Fund, November 2016, p. 21.
90 Burton, Patrick, Lezanne Leoschut and Joanne Phyfer, ‘South African Kids
Online: A glimpse into children’s internet use and online activities’, Centre for Justice and Crime Prevention, Cape Town, South Africa, 2016, pp. 25–27.
91 Ravalli and Paoloni, ‘Global Kids Online Argentina’, p. 20; Burton, Leoschut and Phyfer, ‘South African Kids Online’ p. 23.
92 Global Kids Online database 2016.
93 Burton, Leoschut and Phyfer, ‘South African Kids Online’, p. 23.
94 The Global Kids Online research project <www.globalkidsonline.net> was developed as a collaborative initiative between the UNICEF Office of Research, the London School of Economics and Political Science, and the EU Kids Online network. The project has developed a global research toolkit that enables academics, governments, civil society and other actors to carry out reliable and standardized national research with children and their parents on the opportunities, risks and protective factors of children’s internet use.
95 Livingstone, Sonia, and Brian O’Neill, ‘Children’s Rights Online: Challenges, dilemmas and emerging directions’, in Minding Minors Wandering the Web: Regulating online child safety, edited by Simone van der Hof, et al., Asser Press, The Hague, 2014, pp. 20–38; and Third, Amanda, ‘Method Guide 6: Researching the benefits and opportunities for children online’, Global Kids Online, London, November 2016.
96 Ito, Mizuko, and Daisuke Okabe, ‘Technosocial Situations: Emergent structures of mobile e-mail use’, ch. 13 in Personal, Portable, Pedestrian: Mobile phones in Japanese life, edited by Matsuda Ito, Daisuke Okabe and Misa Matsuda, MIT Press, Cambridge, Mass., 2005. Based on interviews by UNICEF in March 2016.
CHAPTER 3: DIGITAL DANGERS: THE HARMS OF LIFE ONLINE
1 Based on interviews by UNICEF in March 2016.
2 Livingstone, Sonia, Giovanna Mascheroni and Elisabeth Staksrud, ‘Developing a Framework for Researching Children’s Online Risks and Opportunities in Europe’, EU Kids Online, London, 2015.
3 Burton, Patrick, ‘Risks and Harms for Children in the Digital Age’, Background paper prepared for The State of the World’s Children 2017: Children in a Digital World, United Nations Children’s Fund, New York, 2017, p. 2.
4 Ibid., p. 1.
5 Staksrud, Elisabeth, and Sonia Livingstone, ‘Children and Online Risk: Powerless victims or resourceful participants?’ Information, Communication & Society, vol. 12, no. 3, 2009, pp. 364–387.

UNICEF – THE STATE OF THE WORLD’S CHILDREN 2017138
6 Coleman, John, and Ann Hagell, ‘The Nature of Risk and Resilience in Adolescence’, ch. 1 in Adolescents, Risks and Resilience: Against the odds, edited by John Coleman and Ann Hagell, John Wiley & Sons, Hoboken, N.J., 2007.
7 Vera Slavtcheva-Petkova, Victoria Jane Nash and Monica Bulger, ‘Evidence on the Extent of Harms Experienced by Children as a Result of Online Risks: Implications for policy and research’, Information, Communication & Society, vol. 18, no. 1, 2015, pp. 48–62.
8 Ibid.
9 Nixon, Charisse L., ‘Current Perspectives: The impact of cyberbullying on adolescent health’, Adolescent Health, Medicine and Therapeutics, vol. 5, August 2014, pp. 143–158; and Kowalski, Robin M., and Susan P. Limber, ‘Psychological, Physical, and Academic Correlates of Cyberbullying and Traditional Bullying’, Journal of Adolescent Health, vol. 53, no. 1, suppl., July 2013, pp. S13–S20.
10 Livingstone, Sonia, and Jessica Mason, ‘Sexual Rights and Sexual Risks among Youth Online: A review of existing knowledge regarding children and young people’s developing sexuality in relation to new media environments’, report prepared for the European NGO Alliance for Child Safety Online (eNASCO), September 2015; and Boyd, Danah, Jenny Ryan and Alex Leavitt, ‘Pro-Self-Harm and the Visibility of Youth-Generated Problematic Content’, I/S: A Journal of Law and Policy for the Information Society, vol. 7, no. 1, 2011, p. 40.
11 European Police Office, ‘Internet Organised Crime Threat Assessment (IOCTA) 2016’, Europol, The Hague, pp. 24–27.
12 Based on interviews by UNICEF in March 2016.
13 United Nations Office on Drugs and Crime, ‘Study on the Effects of New Information Technologies on the Abuse and Exploitation of Children’, UNODC, Vienna, May 2015.
14 U.S. Department of State, ‘Trafficking in Persons Report’, U.S. Department of State, Washington, D.C., June 2013, p. 14.
15 ‘Study on the Effects of New Information Technologies’.
16 Internet Watch Foundation, ‘Annual Report 2016’, IWF, Cambridge, UK, 3 April 2017.
17 ‘The NetClean Report 2016: 10 important insights into child sexual abuse crime’, NetClean, Gothenburg, Sweden, November 2016.
18 Ibid.
19 Ibid.
20 Europol’s European Cybercrime Centre, ‘Virtual Global Taskforce Child Sexual Exploitation Environmental Scan 2015’, EC3-Europol, October 2015, p. 12.
21 Internet Watch Foundation and Microsoft, ‘Emerging Patterns and Trends Report #1: Online-produced sexual content’, Internet Watch Foundation, March 2015.
22 ‘IOCTA 2016’, pp. 24–27.
23 Peersman, Claudia, et al., ‘iCOP: Live forensics to reveal previously unknown criminal media on P2P networks’, Digital Investigation, vol. 18, September 2016, pp. 50–64.
24 Jardine, Eric, ‘The Dark Web Dilemma: Tor, anonymity and online policing’, The Centre for International Governance Innovation and Chatham House, Ontario, Canada, and London, September 2015.
25 Ibid.
26 ‘Risks and Harms for Children in the Digital Age’.
27 Ibid.
28 Przybylski, Andrew K., and Lucy Bowes, ‘Cyberbullying and Adolescent Well-Being in England: A population-based cross-sectional study’, The Lancet Child & Adolescent Health, vol. 1, no. 1, September 2017, pp. 19–26.
29 Baraniuk, Chris, ‘Cyber-Bullying Relatively Rare, Says Study’, BBC News, 11 July 2017.
30 Hunt, Elle, ‘Online Harassment of Women at Risk of Becoming “Established Norm”, Study Finds’, The Guardian, 7 March 2016.
31 Mitchell, Kimberly J., Michele L. Ybarra and Josephine D. Korchmaros, ‘Sexual Harassment among Adolescents of
Different Sexual Orientations and Gender Identifies’, Child Abuse and Neglect, vol. 38, no. 1, 2014, pp. 43–71.
32 Suseg, Helle, et al., ‘Seksuelle krenkelser via nettet – hvor stort er problemet?’ (Sexual Harassment on the Internet – How great is the problem?), Report 16/2008, NOVA – Norwegian Social Research, Oslo, 2008.
33 Wells, Melissa, and Kimberly J. Mitchell, ‘Patterns of Internet Use and Risk of Online Victimization for Youth with and without Disabilities’, The Journal of Special Education, vol. 48, no. 3, 2014, pp. 204–213.
34 Caravita, Simona C. S., et al., ‘Being Immigrant as a Risk Factor to Being Bullied: An Italian study on individual characteristics and group processes’, Child Abuse and Neglect, vol. 18, no. 1, March 2016, pp. 59–87.
35 Livingstone and Mason, ‘Sexual Rights and Sexual Risks among Youth Online’; and Boyd, Ryan and Leavitt, ‘Pro-Self-Harm and the Visibility of Youth-Generated Problematic Content’.
36 Office of the United Nations Special Representative of the Secretary-General on Violence against Children, Releasing Children’s Potential and Minimizing Risks: ICTs, the internet, and violence against children, Office of the United Nations Special Representative to the Secretary-General on Violence against Children, New York, October 2014, pp. 39–40.
37 Based on interviews by UNICEF in March 2016.
38 Based on interviews by UNICEF in April 2016.
39 Phyfer, Joanne, Patrick Burton and Lezanne Leoschut, ‘South African Kids Online: Barriers, opportunities and risks – A glimpse into South African children’s internet use and online activities’, Centre for Justice and Crime Prevention, Cape Town, South Africa, 2016, pp. 25, 28; Mascheroni, Giovanna, and Andrea Cuman, ‘Net Children Go Mobile: Final report (with country fact sheets) – Deliverables D6.4 & D5.2’, Educatt, Milan, November 2014, <http://netchildrengomobile.eu/reports/>, accessed 1 November 2016.

ENDNOTES 139
40 Third, Amanda, et al., ‘Children’s Rights in the Digital Age: A download from children around the world’, Young and Well Cooperative Research Centre, Melbourne, 2014, p. 47.
41 Samuels, Crystal, et al., ‘Connected Dot Com: Young people’s navigation of online risks – Social media, ICTs and online safety’, Centre for Justice and Crime Prevention and UNICEF South Africa, Cape Town, 2013, pp. 5–6.
42 Byrne, Jasmina, et al., ‘Global Kids Online Research Synthesis: 2015–2016’, UNICEF Office of Research-Innocenti and The London School of Economics and Political Science, Florence, 2016, p. 50.
43 Menesini, Ersilia, and Christina Salmivalli, ‘Bullying in Schools: The state of knowledge and effective interventions’, Psychology, Health & Medicine, vol. 22, suppl. 1, January 2017, pp. 240–253.
44 Ortega-Ruiz, Rosario, Rosario Del Rey and José A. Casas, ‘Knowing, Building and Living Together on Internet and Social Networks: The ConRed Cyberbullying Prevention Program’, International Journal of Conflict and Violence, vol. 6, no. 2, 2012, pp. 302–312.
45 Ibid.
46 United Nations Children’s Fund, ‘UNICEF Global Programme to Build Capacity to Tackle Online Sexual Exploitation’, Final Report to the Government of the United Kingdom of Great Britain and Northern Ireland, Reporting Period: 24 May 2015–30 March 2016, UNICEF Child Protection Section, Programme Division, New York.
47 Based on interviews by UNICEF in May 2017.
48 ‘IOCTA 2016’, pp. 24–27.
49 Peersman, et al., ‘iCOP: Live forensics to reveal previously unknown criminal media on P2P networks’.
50 Interpol, ‘Annual Report 2015’, Interpol, Lyon, France.
51 Interpol, ‘Crimes against Children’, Fact Sheet, Interpol.
52 Peersman et al., ‘iCOP: Live forensics to reveal previously unknown criminal media on P2P networks’.
53 Byrne et al., ‘Global Kids Online Research Synthesis: 2015–2016’, p. 11.
54 United Nations Children’s Fund, ‘Freedom of Expression, Association, Access to Information and Participation’, Discussion Paper Series: Children’s Rights and Business in a Digital World, UNICEF Child Rights and Business Unit, June 2017, p. 4.
55 Olavsrud, Thor, ’21 Data and Analytics Trends that Will Dominate in 2016’, CIO, 18 January 2016.
56 Livingstone, Sonia, John Carr and Jasmina Byrne, ‘One in Three: Internet governance and children’s rights’, Discussion paper 2016–01, UNICEF Office of Research-Innocenti, Florence, January 2016, p. 11.
57 As one example of this, see Cooper, Tim, and Ryan LaSalle, ‘Guarding and Growing Personal Data Value’, Accenture Consulting Co.
58 ‘Data Is Giving Rise to a New Economy’, The Economist, 6 May 2017.
59 Doneda, Danilo, and Carolina Rossini, ‘ICT Kids Online Brazil 2014: Survey on internet use by children in Brazil’, Brazilian Internet Steering Committee, São Paulo, Brazil, 2015, p. 37.
60 Palfrey, John, Urs Gasser and Danah Boyd, ‘Response to FCC Notice of Inquiry 09 –94: Empowering parents and protecting children in an evolving media landscape’, The Berkman Center for Internet & Society at Harvard University, Cambridge, Mass., 2010.
61 Brown, Duncan H., and Norma Pecora, ‘Online Data Privacy as a Children’s Media Right: Toward global policy principles’, Journal of Children and Media, vol. 8, no. 2, 2014, p. 201.
62 United Nations Children’s Fund, ‘Privacy, Protection of Personal Information and Reputation Rights’, Discussion Paper Series: Children’s Rights and Business in a Digital World, UNICEF, March 2017.
63 ‘Digital Birth: Welcome to the online world’, Business Wire, 6 October 2010.
64 LaFrance, Adrienne, ‘The Perils of “Sharenting”’, The Atlantic, 6 October 2016.
65 Steinberg, Stacey B., ‘Sharenting: Children’s privacy in the age of social
media’, University of Florida Levin College of Law Legal Studies Research Paper Series, vol. 66,839, 2016.
66 ‘Privacy, Protection of Personal Information and Reputation Rights’.
67 Steinberg, ‘Sharenting: Children’s Privacy in the Age of Social Media’.
68 Organisation for Economic Co-operation and Development, ‘The Protection of Children Online: Risks faced by children online and policies to protect them’, OECD Digital Economy Papers No. 179, OECD Publishing, Paris, 2011, p. 37.
69 United Nations, Human Rights Council Resolution, ‘The Right to Privacy in the Digital Age’, A/HRC/34/L.7/Rev.1, United Nations, New York, 2017, preamble and section 5.g.
70 U.S. Federal Trade Commission, ‘Children’s Online Privacy Protection Rule’, § 312.5 Parental consent.
71 See Agencia Española de Protección de Datos (Spanish Data Protection Agency), ‘Guidelines on Rights of Children and Duties of Parents’, 2008.
72 2009 Protection of Personal Information Bill.
73 ‘Privacy, Protection of Personal Information and Reputation Rights’, p. 9.
74 Shin, Wonsun, and Hyunjin Kang, ‘Adolescent’s Privacy Concerns and Information Disclosure Online: The role of parents and the internet’, Computers in Human Behavior, vol. 54, January 2016, p. 114.
75 Jasmontaite, Lina, and Paul De Hert, ‘The EU, Children under 13 years, and Parental Consent: A human rights analysis of a new, age-based bright-line for the protection of children on the internet’, International Data Privacy Law, vol. 5, no. 1, 2015, pp. 28–29.
76 Byrne et al., ‘Global Kids Online Research Synthesis: 2015–2016’, p. 50.
77 Wang, Amy B., ‘A Lawyer Rewrote Instagram’s Terms of Use “In Plain English” So Kids Would Know Their Privacy Rights’, The Washington Post, 8 January 2017.
78 Art. 8 (1), Regulation (EU) 2016/679 of the European Parliament and of the Council of the European Union of 27 April 2016 on the protection of

UNICEF – THE STATE OF THE WORLD’S CHILDREN 2017140
natural persons with regard to the processing of personal data and on the free movement of such data, and repealing Directive 95/46/EC (General Data Protection Regulation).
79 Coughlan, Sean, ‘Safer Internet Day: Young ignore “social media age limit”’, BBC News, 9 February 2016.
80 Carr, John, ‘The Point about 16: Implications of the GDPR for child grooming’, The London School of Economics and Political Science Media Policy Project Blog, 1 December 2016.
81 Jasmontaite, and De Hert, ‘The EU, Children under 13 years, and Parental Consent’, p. 32.
82 Brown and Pecora, ‘Online Data Privacy as a Children’s Media Right’, p. 205.
CHAPTER 4: DIGITAL LIVELIHOODS: LIVING ONLINE
1 Critcher, Chas, ‘Making Waves: Panic discourses about the media and children or young people, past and present,’ ch. 5 in The International Handbook of Children, Media and Culture, edited by Kirsten Drotner and Sonia Livingstone, Sage, London, 2008.
2 McKenna, Katelyn Y. A., Amie S. Green and Marci E. J. Gleason, ‘Relationship Formation on the Internet: What’s the big attraction?’, Journal of Social Issues, vol. 58, no. 1, 2002, pp. 9–31. 6
3 Byrne, Jasmina, et al., ‘Global Kids Online Research Synthesis: 2015–2016’, UNICEF Office of Research-Innocenti and The London School of Economics and Political Science, Florence, November 2016, p. 28.
4 Statens Medieråd, ‘Föräldrar & Medier: 2015’, Statens Medieråd, Stockholm, 2015.
5 Burton, Patrick, Lezanne Leoschut and Joanne Phyfer, ‘South African Kids Online: A glimpse into children’s internet use and online activities’, Centre for Justice and Crime Prevention, Cape Town, South Africa, 2016, p. 20.
6 Turkle, Sherry, Alone Together: Why we expect more from technology and less from each other, Basic Books, New York, 2011.
7 George, Madeleine J., and Candice L. Odgers, ‘Seven Fears and the Science of How Mobile Technologies May Be Influencing Adolescents in the Digital Age’, Perspectives on Psychological Science, vol. 10, no. 6, 2015, pp. 832–851.
8 Boyd, Danah, It’s Complicated: The social lives of networked teens, Yale University Press, New Haven, Conn., 2014.
9 ‘Meet Generation Z’ video, The Washington Post, 25 May 2016, available at <www.washingtonpost.com/video/entertainment/meet-gen eration-z/2016/05/ 25/290c2 c00-21db-11e6-b944-5 2f7b 1793dae_video.html>.
10 Henn, Steve, ‘When Parents Are the Ones too Distracted by Devices’, All Things Considered, National Public Radio, 16 April 2014.
11 Pew Research Center, Parents, Teens and Digital Monitoring, Pew Research Center, Washington, D.C., 2016.
12 Byrne et al., ‘Global Kids Online Research Synthesis: 2015–2016’.
13 Burton, Leoschut and Phyfer, ‘South African Kids Online’, p. 41.
14 Byrne et al., ‘Global Kids Online Research Synthesis: 2015–2016’, p. 68.
15 Ravalli, María José, and Paoloni, Paola Carolina, ‘Global Kids Online Argentina: Research study on the perceptions and habits of children and adolescents on the use of technologies, the internet and social media’, Global Kids Online and United Nations Children’s Fund, November 2016, p. 29.
16 Burton, Leoschut and Phyfer, ‘South African Kids Online’, p. 70.
17 Lupiáñez-Villanueva, Francisco, et al., ‘Study on the Impact of Marketing through Social Media, Online Games and Mobile Applications on Children’s Behaviour’, Publications Office of the European Union, European Commission, Brussels, 2016.
18 Davidson, Julia, and Elena Martellozzo, ‘Exploring Young People’s Use of Social Networking Sites and Digital Media in the Internet Safety Context’,
Information, Communication & Society, vol. 16, no. 9, 2012, pp. 1456–1476.
19 Byrne, Jasmina, and Sonia Livingstone, ‘Challenges of Parental Responsibility in a Global Perspective’, Background paper prepared for The State of the World’s Children 2017: Children in a Digital World, United Nations Children’s Fund, New York, 2017.
20 Livingstone, Sonia, et al., How Parents of Young Children Manage Digital Devices at Home: The role of income, education and parental style, EU Kids Online, The London School of Economics and Political Science, London, 2015.
21 Granic, Isabela, Adam Lobel and Rutger C. M. E. Engels, ‘The Benefits of Playing Video Games’, American Psychologist, vol. 69, no. 1, 2014, pp. 66–78.
22 Ferguson, Christopher J., ‘Everything in Moderation: Moderate use of screens unassociated with child behavior problems’, article submitted to Psychiatric Quarterly; and Przybylski, Andrew, and Netta Weinstein, ‘A Large-Scale Test of the Goldilocks Hypothesis: Quantifying the relations between digital-screen use and the mental well-being of adolescents’, Psychological Science, vol. 28, no. 2, 2017, pp. 204–215.
23 Valkenburg, Patti M., and Jochen Peter, ‘Social Consequences of the Internet for Adolescents: A decade of research’, Current Directions in Psychological Science, vol. 18, no. 1, 2009, pp. 1–5.
24 McKenna, Katelyn Y. A., and John A. Bargh, ’Plan 9 from Cyberspace: The implications of the internet for personality and social psychology’, Personality and Social Psychology Review, vol. 4, no. 1, 2000, pp. 57–75; and Peter, Jochen, Patti

ENDNOTES 141
M. Valkenburg, and Alexander P. Shouten, ‘Developing a Model of Adolescent Friendship Formation on the Internet’, CyberPsychology & Behavior, vol. 8, no. 5, October 2005, pp. 423–429.
25 Spies Shapiro, Laura A., and Gayla Margolin, ‘Growing Up Wired: Social networking sites and adolescent psychosocial development’, Clinical Child and Family Psychology Review, vol. 17, no. 1, 2014, pp. 1–18.
26 Kardefelt-Winther, Daniel, ‘How Does the Time Children Spend Using Digital Technology Impact their Mental Well-Being, Social Relationships and Physical Activity? An evidence-focused literature review’, Background paper written for The State of the World’s Children 2017: Children in a Digital World, United Nations Children’s Fund, New York, 2017.
27 Teppers, Eveline, et al., ‘Loneliness and Facebook Motives in Adolescents: A longitudinal inquiry into directionality of effect’, Journal of Adolescence, vol. 37, no. 5, July 2014, pp. 691–699.
28 Peter, Valkenburg and Shouten, ‘Developing a Model of Adolescent Friendship Formation on the Internet’.
29 Valkenburg and Peter, ‘Social Consequences of the Internet for Adolescents’.
30 Teppers et al., ‘Loneliness and Facebook Motives in Adolescents’.
31 Chou, Hui-Tzu Grace, and Nicholas Edge, ‘“They Are Happier and Having Better Lives than I Am”: The impact of using Facebook on perceptions of others’ lives’, Cyberpsychology, Behavior, and Social Networking, vol. 15, no.2, February 2012, pp. 117–121; and Verduyn, Philippe, et al., Passive Facebook Usage Undermines Affective Well-Being: Experimental and longitudinal evidence’, Journal of Experimental Psychology, vol. 144, no. 2, 2015, pp. 480–488.
32 Verduyn et al., ‘Passive Facebook Usage Undermines Affective Well-Being’.
33 Chou and Edge, ‘“They are Happier and Having Better Lives than I Am”’.
34 Przybylski and Weinstein, ‘A Large-Scale Test of the Goldilocks Hypothesis’, pp. 209–210.
35 Ibid.
36 Ibid.
37 Griffiths, Lucy. J. et al., ‘Associations between Sport and Screen-Entertainment with Mental Health Problems in 5-Year-Old Children’, The International Journal of Behavioral Nutrition and Physical Activity, vol. 7, no. 30, April 2010.
38 Przybylski and Weinstein, ‘A Large-Scale Test of the Goldilocks Hypothesis’.
39 Kardefelt-Winther, ‘How Does the Time Children Spend Using Digital Technology Impact Their Mental Well-Being, Social Relationships and Physical Activity?’.
40 Przybylski, Andrew K., ‘Electronic Gaming and Psychosocial Adjustment’, Pediatrics, vol. 134, no. 3, September 2014, pp. e716–e722.
41 Caplan, Scott, Dmitri Williams and Nick Yee, ‘Problematic Internet Use and Psychosocial Well-Being among MMO Players’, Computers in Human Behavior, vol. 25, no. 6, 2009, pp. 1312–1319; and Lemmens, Jeroen S., Patti M. Valkenburg and Jochen Peter, ‘Psychosocial Causes and Consequences of Pathological Gaming’, Computers in Human Behavior, vol. 27, no. 1, 2011, pp. 144–152.
42 See Livingstone, Sonia, et al., Risks and Safety on the Internet: The perspective of European children – Full findings and policy implications from the EU Kids Online survey of 9–16–year–olds and their parents in 25 countries’, EU Kids Online, The London School of Economics and Political Science, London, 2011; Livingstone, Sonia, ‘A Framework for Researching Global Kids Online: Understanding children’s well-being and rights in the Digital Age’, Global Kids Online, London, November 2016; Kardefelt-Winther, Daniel, ‘Excessive Internet Use: Fascination or compulsion?’, PhD thesis, The London School of Economics and Political Science, London, 2014; Byrne et al., ‘Global Kids Online Research Synthesis: 2015–2016’; and Banaji, Shakauntala, ‘Global Research on Children’s Online Experiences: Addressing diversities and inequalities’, Global Kids Online, London, November 2016.
43 Kardefelt-Winther, ‘How Does the Time Children Spend Using Digital Technology Impact Their Mental Well-Being, Social Relationships and Physical Activity?’, p. 6.
44 Kraut, Robert, et al., ‘Internet Paradox: A social technology that reduces social involvement and psychological well-being?’, American Psychologist, vol. 53, no. 9, September 1998, pp. 1017–1031; Putnam, Robert D., Bowling Alone: The collapse and revival of American community, Simon and Schuster, New York, 2000; and Turkle, Alone Together.
45 Kraut, Robert, et al., ‘Internet Paradox Revisited’, Journal of Social Issues, vol. 58, no. 1, 2002, pp. 49–74.
46 Valkenburg, Patti. M., and Jochen Peter, ‘Online Communication and Adolescent Well-Being: Testing the stimulation versus displacement hypothesis’, Journal of Computer-Mediated Communication, vol. 12, no. 4, July 2007, pp. 1169–1182.
47 Matsuda, Misa, ‘Mobile Communication and Selective Sociality’, ch. 6 in Personal, Portable, Pedestrian: Mobile phones in Japanese life, edited by Mizuko Ito, Daisuke Okabe and Misa Matsuda, MIT Press, Cambridge, Mass., 2005.
48 Ito, Mizuko, et al., Hanging Out, Messing Around, and Geeking Out: Kids living and learning with new media, MIT Press, Cambridge, Mass., 2009.
49 Ito, Mizuko, et al., Connected Learning: An agenda for research and design’, Digital Media and Learning Research Hub, Irvine, Calif., 2013.
50 World Health Organization, Adolescent Obesity and Related Behaviours: Trends and inequalities in the WHO European Region – 2002–2014, WHO Regional Office for Europe, Copenhagen, 2017, p. 44.
51 Laurson, Kelly R., et al., ‘Concurrent Associations between Physical Activity, Screen Time, and Sleep Duration with Childhood Obesity’, ISRN Obesity, vol. 2014, 2014.
52 Melkevik, Ole, et al., ‘Is Spending Time in Screen-Based Sedentary Behaviors Associated with Less Physical Activity: A cross-national investigation’, International Journal of Behavioral

UNICEF – THE STATE OF THE WORLD’S CHILDREN 2017142
Nutrition and Physical Activity, vol. 7, 2010.
53 Melkevik, ‘Is Spending Time in Screen-Based Sedentary Behaviors Associated with Less Physical Activity’.
54 Iannotti, Ronald J., et al., ‘Patterns of Adolescent Physical Activity, Screen-Based Media Use, and Positive and Negative Health Indicators in the U.S. and Canada’, Journal of Adolescent Health, vol. 44, no. 5, May 2009, pp. 493–499.
55 Kardefelt-Winther, Daniel, et al., ‘How Can We Conceptualize Behavioral Addiction without Pathologizing Common Behaviors?’, Addiction, vol. 112, no. 10, October 2017, pp. 1–7.
56 Kardefelt-Winther, ‘How Does the Time Children Spend Using Digital Technology Impact Their Mental Well-Being, Social Relationships and Physical Activity?’.
57 Griffiths, Mark D., et al., ‘Working towards an International Consensus on Criteria for Assessing Internet Gaming Disorder: A critical commentary on Petry et al.’, Addiction, vol. 111, no. 1, January 2016, pp. 167–175.
58 Bax, Trent, ‘Internet Addiction in China: The battle for the hearts and minds of youth’, Deviant Behavior, vol. 35, no. 9, 2014, pp. 687–702.
59 Aarseth, Espen, et al., ‘Scholars’ Open Debate Paper on the World Health Organization ICD-11 Gaming Disorder Proposal’, Journal of Behavioral Addictions, vol. 6, no. 3, January 2017, pp. 1–4.
60 Russon, Mary-Ann, ‘Abductions, Beatings and Death: The horrifying truth behind China’s internet addiction boot camps’, International Business Times, 23 September 2016; and Ives, Mike, ‘Electroshock Therapy for Internet Addicts? China vows to end it’, New York Times, 13 January 2017.
61 Kwee, Alex W., Eiko Komuro-Venovic and Janelle L. Kwee, ‘Treatment Implications and Etiological and Diagnostic Considerations of Internet Addiction: Cautions with the boot camp approach’, ResearchGate, 2014.
62 Mills, Kathryn L., ‘Possible Effects of Internet Use on Cognitive Development in Adolescence’, Media and Communication, vol. 4, no. 3, 2016, pp. 4–12.
63 Blinka, Lukas, et al., ‘Excessive Internet Use in European Adolescents: What determines differences in severity?’, International Journal of Public Health, vol. 60, no. 2, February 2015, pp. 249–256.
64 Granic, Lobel and Engels, ‘The Benefits of Playing Video Games’.
65 Bejjanki, Vikranth R., et al., ‘Action Video Game Play Facilitates the Development of Better Perceptual Templates’, Proceedings of the National Academy of Sciences of the United States of America, vol. 111, no. 47, November 2014, pp. 16961–16966.
66 Sherman, Lauren E., et al., ‘The Power of the Like in Adolescence: Effects of peer influence on neural and behavioral responses to social media’, Psychological Science, vol. 27, no. 7, July 2016, pp. 1027–1035.
67 Moisala, Mona, et al., ‘Media Multitasking is Associated with Distractibility and Increased Prefrontal Activity in Adolescents and Young Adults’, NeuroImage, vol. 134, 2016, pp. 113–121.
68 Moisala, Mona, et al., ‘Gaming Is Related to Enhanced Working Memory Performance and Task-Related Cortical Activity’, Brain Research, vol. 1655, January 2017, pp. 204–215.
69 Ibid.
CHAPTER 5: DIGITAL PRIORITIES: HARNESS THE GOOD, LIMIT THE HARM
1 United Nations Children’s Fund, Generation 2030 Africa, Child demographics in Africa, UNICEF, New York, August 2014, p. 5.
2 Byrne, Jasmina, et. al., ‘Global Kids Online Research Synthesis: 2015–2016’, UNICEF Office of Research-Innocenti and The London School of Economics and Political Science, Florence, p. 83.
3 Livingstone, Sonia, John Carr and Jasmina Byrne, ‘One in Three: Internet governance and children’s rights’, Discussion Paper 2016–01, UNICEF Office of Research-Innocenti, Florence, 2016, p. 9.
4 GSM Association, ‘Children’s Use of Mobile Phones: An international
comparison 2012’, GSM Association and NTT Docomo Inc.’s Mobile Society Research Institute, London and Tokyo, 2013, p. 50; and GSM Association, ‘Children’s Use of Mobile Phones: An international comparison 2013’, GSM Association and NTT Docomo Inc.’s Mobile Society Research Institute, London and Tokyo, 2014, pp. 44–45.
5 Regulation (EU) 2016/679 of the European Parliament and of the Council of the European Union of 27 April 2016 on the protection of natural persons with regard to the processing of personal data and on the free movement of such data, and repealing Directive 95/46/EC (General Data Protection Regulation).
6 Vuorikari, Riina, et al., ‘DigComp 2.0: The digital competence framework for citizens’, JRC Science for Policy Report, European Union, Luxemburg, 2016.
7 Byrne, Jasmina, and Patrick Burton, ‘Children as Internet Users: How can evidence better inform policy debate?’, Journal of Cyber Policy, vol. 2, no. 1, 2017, pp. 39–52.

143 METHODOLOGIES FOR U-REPORT POLL AND ADOLESCENT WORKSHOPS
Methodologies for U-Report poll and adolescent workshopsU-Report poll
As part of The State of the World’s Children 2017 adolescent engagement strategy, a U-Report poll was organized in May and June 2017. U-Report sent
four questions to U-Reporters worldwide. About 63,000 responses from 13-year-olds to 24-year-olds in 24 countries were analysed (see below).
U-Report survey questions:
1. What do you dislike the most about the internet? Choose 1
a. I see violent stories, photos, videos b. I see sexual content I don’t want to see c. There is bullying to me and my friend d. People share embarrassing things
about mee. Scams f. There is nothing I dislike
2. What are things you like the most about the internet?
a. Learn things (for school or health) b. Read about politics and improving my
communityc. Learn things important for my future
(jobs, university)d. Share things I like with people e. Learn skills that I can’t learn in school
3. How did you learn to use the Internet? From…
a. Parents/caregivers b. Friends/siblings c. Teachers at school d. Clubs/organizations outside school e. No one helped me
4. What would make the internet better for you?
a. Better internet coverage b. Cheaper data plans c. Easier access to mobile phones
and computersd. Higher speed connectivity e. Other (open-ended)
Note: Questions and options were adapted in some cases to reflect local contexts.

UNICEF – THE STATE OF THE WORLD’S CHILDREN 2017144
Adolescent workshops
For The State of the World’s Children 2017, adolescents’ insights on their access to and use of digital technologies were collected using a process designed by the RErights.org team and UNICEF. RErights is a child-centred initiative led by Western Sydney University in partnership with Digitally Connected and UNICEF’s Voices of Youth that enables adolescents (ages 10 to 19) to discuss and share their insights and experiences regarding the digital age.
RErights and UNICEF developed a distributed data-gathering methodology for use by UNICEF regional and country offices and national committees. The methodology was designed to facilitate four-hour face-to-face workshops with adolescents focusing on five to seven themes:
Digital technology in their homes;
Barriers to their digital technology use;
Digital technology and learning;
Digital technology and their futures;
Using digital technology to create positive change;
Concerns about digital technology (optional); and
Digital technology and health (optional).
Workshops were held in 26 countries: Bangladesh, Belarus, Bhutan, Brazil, Burundi, Central African Republic, Democratic Republic of the Congo, Fiji, Guatemala, Japan, Jordan, Kiribati, Malaysia, Nigeria, Paraguay, Peru, Portugal, Republic of Korea Republic of Moldova, Senegal, Solomon Islands, Thailand, Timor-Leste, Tunisia, Uruguay and Vanuatu.
A total of 484 adolescents took part in 36 workshops (eight countries hosted more than one workshop). The average workshop size was 13 participants. Participating offices recruited a diverse sample of adolescents, and some also ran workshops with specific groups – for example, adolescent refugees in Jordan, homeless adolescents in Nigeria and LGBT adolescents in Brazil.
In advance of organizing the workshops, facilitators were briefed about workshop recruitment, content and administration.
The research received ethics approval from Western Sydney University’s Human Research Ethics Committee (reference no. H11101).
Key analytical issues
Data were analysed by five categories: country, country income group, gender, age band and age.
Only countries with a minimum of 100 respondents each were included in the ‘country’ category analysis, namely: Algeria, Bangladesh, Brazil, Burkina Faso, Burundi, Cameroon, Central African Republic, Chad, Chile, Côte d’Ivoire, El Salvador, Guatemala, Honduras, India, Indonesia, Liberia, Malaysia, Mexico, Mongolia, Pakistan, Peru, Philippines, Thailand and Ukraine.
All invalid responses provided by respondents or submitted by country offices were discarded.

145 METHODOLOGIES FOR U-REPORT POLL AND ADOLESCENT WORKSHOPS
Data collection and analysis
Data and analysis from the workshops are not statistically representative. Rather, the aim was to enable adolescents to use their own words to talk about their access to and use of digital technology and the meanings and aspirations they associate with their technology practices.
Apart from one short survey, the bulk of collected data was qualitative. Participants worked individually and in groups to complete surveys, short-answer questions, creative exercises (e.g., drawing), scenario-based exercises and small group discussions. Data gathered consisted of paper-based surveys, diagrams, drawings, written text and photographs. All data were digitized by participating offices and uploaded to secure digital repositories. The data were then collated by the RErights team using data analysis software. The research team worked in English, French and Spanish. All content received in other languages was translated into English by participating offices.
Thematic analysis was applied as the primary technique for understanding the data.
During data entry, individual researchers categorized relevant data blocks (e.g., phrases, quotes and sentences) according to the pre-existing themes and derived new themes in response to the data. The team then reviewed and discussed relevant data and individual analyses, checking and refining interpretations. Analyses were summarized and presented using quotes and images from participants; synopses, which included core insights and ideas derived from data; and charts and graphics depicting key concepts and general trends.
Where necessary, quotes from the workshops included in The State of the World’s Children 2017 have been edited and shortened for clarity.
A companion report, Young and Online: Children’s perspectives on life in the digital age, containing more extensive results and analysis from the workshops will be published in late 2017 and will be available at <www.westernsydney.edu.au/__data/assets/pdf_file/0006/1334805/Young_and_Online_Report.pdf>

UNICEF – THE STATE OF THE WORLD’S CHILDREN 2017146
OverviewThis reference guide presents the most recent key statistics on child survival, development and protection for the world’s countries, areas and regions.
The statistical tables in this volume support UNICEF’s focus on progress and results towards internationally agreed-upon goals and compacts relating to children’s rights and development.
Efforts have been made to maximize the comparability of statistics across countries and time. Nevertheless, data used at the country level may differ in terms of the methods used to collect data or arrive at estimates, and in terms of the populations covered. Furthermore, data presented here are subject to evolving methodologies, revisions of time series data (e.g., immunization, maternal mortality ratios) and changing regional classifications. Also, data comparable from one year to the next are unavailable for some indicators. It is therefore not advisable to compare data from consecutive editions of The State of the World’s Children.
The numbers presented in this reference guide are available online at <www.unicef.org/sowc2017> and via the UNICEF global statistical databases at <data.unicef.org>. Please refer to these websites for the latest tables and for any updates or corrigenda subsequent to printing.
General note on the dataData presented in the following statistical tables are derived from the UNICEF global databases and are accompanied by definitions, sources and, where necessary, additional footnotes. The tables draw on
inter-agency estimates and nationally representative household surveys such as Multiple Indicator Cluster Surveys (MICS) and Demographic and Health Surveys (DHS). In addition, data from administrative sources and other United Nations organizations have been used.
Data presented in this year’s statistical tables generally reflect information available as of July 2017. More detailed information on methodology and data sources is available at <data.unicef.org>.
This volume includes the latest population estimates and projections from World Population Prospects: The 2017 revision and World Urbanization Prospects: The 2014 revision (United Nations Department of Economic and Social Affairs, Population Division). Data quality is likely to be adversely affected for countries that have recently suffered disasters, especially where basic country infrastructure has been fragmented or where major population movements have occurred.
Multiple Indicator Cluster Surveys (MICS): UNICEF assists countries in collecting and analyzing data in order to fill data gaps for monitoring the situation of children and women through its international household survey initiative, the Multiple Indicator Cluster Surveys (MICS). Since 1995, close to 300 surveys have been completed in more than 100 countries and areas.
MICS was a major source of data for monitoring progress on the Millennium Development Goals (MDG) indicators and will continue to be a major data source during the 2030 Sustainable Development Agenda to measure Sustainable Development Goal (SDG) indicators. More information is available at <mics.unicef.org>.
Statistical Tables

STATISTICAL TABLES 147
Under-five mortality rate (per 1,000 live births)
UNICEF Region 1990 1995 2000 2005 2010 2015 2016
East Asia and the Pacific 57 49 40 30 22 17 16Europe and Central Asia 31 28 22 16 13 10 10 Eastern Europe and Central Asia 47 45 36 27 20 15 14 Western Europe 11 8 6 5 5 4 4Latin America and the Caribbean 55 44 33 26 25 18 18Middle East and North Africa 66 53 43 34 28 25 24North America 11 9 8 8 7 7 6South Asia 129 112 94 77 63 50 48Sub-Saharan Africa 181 173 155 127 101 81 78 Eastern and Southern Africa 164 156 138 108 82 64 61 West and Central Africa 199 191 173 145 119 98 95Least developed countries 176 160 139 111 89 71 68World 93 87 78 64 52 42 41
Under-five deaths (thousands)
UNICEF Region 1990 1995 2000 2005 2010 2015 2016
East Asia and the Pacific 2,329 1,706 1,221 899 692 537 510 Europe and Central Asia 388 307 223 169 139 112 107 Eastern Europe and Central Asia 331 266 192 143 117 93 88 Western Europe 58 41 30 26 23 20 19 Latin America and the Caribbean 652 513 387 293 270 194 187 Middle East and North Africa 558 427 330 277 255 242 237 North America 47 40 35 35 32 28 28 South Asia 4,730 4,149 3,523 2,904 2,313 1,794 1,713 Sub-Saharan Africa 3,893 4,152 4,149 3,767 3,312 2,923 2,860 Eastern and Southern Africa 1,851 1,945 1,893 1,632 1,352 1,134 1,104 West and Central Africa 2,042 2,207 2,256 2,135 1,959 1,789 1,756 Least developed countries 3,669 3,639 3,437 2,966 2,544 2,154 2,101 World 12,598 11,293 9,868 8,344 7,014 5,831 5,642
Child mortality estimatesEach year, in The State of the World’s Children, UNICEF reports a series of mortality estimates for children – including the annual neonatal mortality rate, infant mortality rate, the under-five mortality rate (total, male and female) and the number of under-five deaths. These figures represent the best estimates available at the time of printing and are based on the work of the United Nations Inter-agency Group for Child Mortality Estimation (UN IGME), which includes UNICEF, the World Health Organization (WHO), the World Bank group and the United Nations Population Division.
UN IGME mortality estimates are updated annually through a detailed review of all newly available data points, which often results in adjustments to previously reported estimates. As a result, consecutive editions of The State of the World’s Children should not be used for analysing mortality trends over time. Comparable global and regional under-five mortality estimates for the period 1990–2016 are presented on page 154. Country-specific mortality indicators for 1990 and 2016, based on the most recent UN IGME estimates, are presented in Table 1 and are available at <data.unicef.org/child-mortality/under-five> and <www.childmortality.org>.

UNICEF – THE STATE OF THE WORLD’S CHILDREN 2017
Somalia 133 1
Chad 127 2
Central African Republic 124 3
Sierra Leone 114 4
Mali 111 5
Nigeria 104 6
Benin 98 7
Democratic Republic of the Congo
94 8
Lesotho 94 8
Côte d'Ivoire 92 10
Equatorial Guinea 91 11
Niger 91 11
South Sudan 91 11
Guinea 89 14
Guinea-Bissau 88 15
Burkina Faso 85 16
Angola 83 17
Mauritania 81 18
Cameroon 80 19
Pakistan 79 20
Togo 76 21
Comoros 73 22
Burundi 72 23
Mozambique 71 24
Afghanistan 70 25
Swaziland 70 25
Haiti 67 27
Liberia 67 27
Gambia 65 29
Sudan 65 29
Djibouti 64 31
Lao People's Democratic Republic
64 31
Zambia 63 33
The following list ranks countries and areas in descending order of their estimated 2016 under-five mortality rate, a critical indicator of the well-being of children. Countries and areas are listed alphabetically in the tables on the following pages.
Countries and areas
Under-5 mortality rate (2016)
Value Rank Countries and areas
Under-5 mortality rate (2016)
Value Rank Countries and areas
Under-5 mortality rate (2016)
Value Rank
HIGHEST UNDER-FIVE MORTALITY RATE
Ghana 59 34
Ethiopia 58 35
United Republic of Tanzania
57 36
Zimbabwe 56 37
Malawi 55 38
Yemen 55 38
Congo 54 40
Kiribati 54 40
Papua New Guinea 54 40
Uganda 53 43
Myanmar 51 44
Turkmenistan 51 44
Timor-Leste 50 46
Kenya 49 47
Gabon 47 48
Senegal 47 48
Madagascar 46 50
Eritrea 45 51
Namibia 45 51
India 43 53
South Africa 43 53
Tajikistan 43 53
Botswana 41 56
Rwanda 39 57
Bolivia (Plurinational State of)
37 58
Marshall Islands 35 59
Nauru 35 59
Nepal 35 59
Bangladesh 34 62
Dominica 34 62
Sao Tome and Principe 34 62
Micronesia (Federated States of)
33 65
Bhutan 32 66
Guyana 32 66
Azerbaijan 31 68
Cambodia 31 68
Dominican Republic 31 68
Iraq 31 68
Guatemala 29 72
Vanuatu 28 73
Morocco 27 74
Philippines 27 74
Indonesia 26 76
Solomon Islands 26 76
Algeria 25 78
Tuvalu 25 78
Uzbekistan 24 80
Egypt 23 81
Fiji 22 82
Niue 22 82
Viet Nam 22 82
Cabo Verde 21 85
Ecuador 21 85
Kyrgyzstan 21 85
Democratic People's Republic of Korea
20 88
Nicaragua 20 88
Paraguay 20 88
Suriname 20 88
Honduras 19 92
State of Palestine 19 92
Trinidad and Tobago 19 92
Jordan 18 95
Mongolia 18 95
Syrian Arab Republic 18 95
Saint Vincent and the Grenadines
17 98
UNDER-FIVE MORTALITY RANKINGS
UNICEF – THE STATE OF THE WORLD’S CHILDREN 2017148

Samoa 17 98
Grenada 16 100
Palau 16 100
Panama 16 100
Republic of Moldova 16 100
Tonga 16 100
Venezuela (Bolivarian Republic of)
16 100
Belize 15 106
Brazil 15 106
Colombia 15 106
El Salvador 15 106
Iran (Islamic Republic of) 15 106
Jamaica 15 106
Mexico 15 106
Peru 15 106
Albania 14 114
Mauritius 14 114
Seychelles 14 114
Tunisia 14 114
Armenia 13 118
Libya 13 118
Saint Lucia 13 118
Saudi Arabia 13 118
Turkey 13 118
Barbados 12 123
Thailand 12 123
The former Yugoslav Republic of Macedonia
12 123
Argentina 11 126
Bahamas 11 126
Georgia 11 126
Kazakhstan 11 126
Oman 11 126
Brunei Darussalam 10 131
China 10 131
Antigua and Barbuda 9 133
Costa Rica 9 133
Maldives 9 133
Qatar 9 133
Romania 9 133
Saint Kitts and Nevis 9 133
Sri Lanka 9 133
Ukraine 9 133
Uruguay 9 133
Bahrain 8 142
Bulgaria 8 142
Chile 8 142
Cook Islands 8 142
Kuwait 8 142
Lebanon 8 142
Malaysia 8 142
Russian Federation 8 142
United Arab Emirates 8 142
Malta 7 151
United States 7 151
Bosnia and Herzegovina 6 153
Cuba 6 153
Serbia 6 153
Slovakia 6 153
Canada 5 157
Croatia 5 157
Hungary 5 157
Latvia 5 157
Lithuania 5 157
New Zealand 5 157
Poland 5 157
Australia 4 164
Austria 4 164
Belarus 4 164
Belgium 4 164
Denmark 4 164
France 4 164
Germany 4 164
Greece 4 164
Ireland 4 164
Israel 4 164
Montenegro 4 164
Netherlands 4 164
Portugal 4 164
Switzerland 4 164
United Kingdom 4 164
Andorra 3 179
Cyprus 3 179
Czechia 3 179
Estonia 3 179
Italy 3 179
Japan 3 179
Monaco 3 179
Norway 3 179
Republic of Korea 3 179
San Marino 3 179
Singapore 3 179
Spain 3 179
Sweden 3 179
Finland 2 192
Iceland 2 192
Luxembourg 2 192
Slovenia 2 192
Anguilla - -
British Virgin Islands - -
Holy See - -
Liechtenstein - -
Montserrat - -
Tokelau - -
Turks and Caicos Islands - -
LOWEST UNDER-5 MORTALITY RATE
ABOUT 15,000 CHILDREN UNDER 5 YEARS OLD STILL DIE EVERY DAY.
Countries and areas
Under-5 mortality rate (2016)
Value Rank Countries and areas
Under-5 mortality rate (2016)
Value Rank Countries and areas
Under-5 mortality rate (2016)
Value Rank
statisical taBles 149

UNICEF – THE STATE OF THE WORLD’S CHILDREN 2017150
Regional classificationAverages presented at the end of each of the 13 statistical tables are calculated using data from countries and areas as classified below.
East Asia and the PacificAustralia; Brunei Darussalam; Cambodia; China; Cook Islands; Democratic People’s Republic of Korea; Fiji; Indonesia; Japan; Kiribati; Lao People’s Democratic Republic; Malaysia; Marshall Islands; Micronesia (Federated States of); Mongolia; Myanmar; Nauru; New Zealand; Niue; Palau; Papua New Guinea; Philippines; Republic of Korea; Samoa; Singapore; Solomon Islands; Thailand; Timor-Leste; Tokelau ; Tonga; Tuvalu; Vanuatu; Viet Nam
Europe and Central AsiaEastern Europe and Central Asia; Western Europe
Eastern Europe and Central AsiaAlbania; Armenia; Azerbaijan; Belarus; Bosnia and Herzegovina; Bulgaria; Croatia; Georgia; Kazakhstan; Kyrgyzstan; Montenegro; Republic of Moldova; Romania; Russian Federation; Serbia; Tajikistan; the former Yugoslav Republic of Macedonia; Turkey; Turkmenistan; Ukraine; Uzbekistan
Western Europe Andorra; Austria; Belgium; Cyprus; Czechia; Denmark; Estonia; Finland; France; Germany; Greece; Holy See; Hungary; Iceland; Ireland; Italy; Latvia; Liechtenstein; Lithuania; Luxembourg; Malta; Monaco; Netherlands; Norway; Poland; Portugal; San Marino; Slovakia; Slovenia; Spain; Sweden; Switzerland; United Kingdom
Latin America and the CaribbeanAnguilla; Antigua and Barbuda; Argentina; Bahamas; Barbados; Belize; Bolivia (Plurinational State of); Brazil; British Virgin Islands; Chile; Colombia; Costa Rica; Cuba; Dominica; Dominican Republic; Ecuador; El Salvador; Grenada; Guatemala; Guyana; Haiti; Honduras; Jamaica; Mexico; Montserrat; Nicaragua; Panama; Paraguay; Peru; Saint Kitts and Nevis; Saint Lucia; Saint Vincent and the Grenadines; Suriname; Trinidad and
Tobago; Turks and Caicos Islands; Uruguay; Venezuela (Bolivarian Republic of)
Middle East and North AfricaAlgeria; Bahrain; Egypt; Iran (Islamic Republic of); Iraq; Israel; Jordan; Kuwait; Lebanon; Libya; Morocco; Oman; Qatar; Saudi Arabia; State of Palestine; Syrian Arab Republic; Tunisia; United Arab Emirates; Yemen
North AmericaCanada; United States
South AsiaAfghanistan; Bangladesh; Bhutan; India; Maldives; Nepal; Pakistan; Sri Lanka
Sub-Saharan AfricaEastern and Southern Africa; West and Central Africa
Eastern and Southern AfricaAngola; Botswana; Burundi; Comoros; Djibouti; Eritrea; Ethiopia; Kenya; Lesotho; Madagascar; Malawi; Mauritius; Mozambique; Namibia; Rwanda; Seychelles; Somalia; South Africa; South Sudan; Sudan; Swaziland; Uganda; United Republic of Tanzania; Zambia; Zimbabwe
West and Central AfricaBenin; Burkina Faso; Cabo Verde; Cameroon; Central African Republic; Chad; Congo; Côte d’Ivoire; Democratic Republic of the Congo; Equatorial Guinea; Gabon; Gambia; Ghana; Guinea; Guinea-Bissau; Liberia; Mali; Mauritania; Niger; Nigeria; Sao Tome and Principe; Senegal; Sierra Leone; Togo
Least developed countries/areas[Classified as such by the United Nations High Representative for the Least Developed Countries, Landlocked Developing Countries and Small Island Developing States (UN-OHRLLS)].
Afghanistan; Angola; Bangladesh; Benin; Bhutan; Burkina Faso; Burundi; Cambodia; Central African Republic; Chad; Comoros; Democratic Republic of the Congo; Djibouti; Eritrea; Ethiopia; Gambia; Guinea; Guinea-Bissau; Haiti; Kiribati; Lao People’s Democratic Republic; Lesotho; Liberia;

STATISTICAL TABLES 151
Madagascar; Malawi; Mali; Mauritania; Mozambique; Myanmar; Nepal; Niger; Rwanda; Sao Tome and Principe; Senegal; Sierra Leone; Solomon Islands; Somalia; South Sudan; Sudan; Timor-Leste; Togo; Tuvalu; Uganda; United Republic of Tanzania; Vanuatu; Yemen; Zambia
Notes on specific tablesTABLE 2. NUTRITION Stunting, wasting and overweight: UNICEF, WHO and the World Bank have continued a process to harmonize anthropometric data used for computation and estimation of regional and global averages and trend analysis. As part of this process, regional and global averages for stunting, wasting and overweight prevalences are derived from a model described in M. de Onis et al., ‘Methodology for Estimating Regional and Global Trends of Child Malnutrition’ (International Journal of Epidemiology, vol. 33, 2004, pp. 1260–1270).
Vitamin A supplementation: Emphasizing the importance for children of receiving two annual doses of vitamin A (spaced 4–6 months apart), this report presents only full coverage of vitamin A supplementation. In the absence of a direct method to measure this indicator, full coverage is reported as the lower coverage estimate from semester 1 (Jan – June) and semester 2 (July – Dec), in a given year. The regional and global aggregates only contain the 82 countries indicated as priority countries for national level programmes. Hence the aggregates are published where at least 50 per cent of the population coverage for the priority countries in each region have been met. In other words, East Asia and Pacific estimates are presented despite there being no data for China, because China is not a priority country for a national level programme.
Low birthweight: The data have not been updated since October 2014 due to ongoing methodological work to revise the analysis method for estimates from household surveys where a large number of children
are not weighed. New methods are currently being applied to generate estimates through an inter-agency process, and updates will be available in the next edition of The State of the World’s Children.
Iodized salt: The definition of the indicator presented in this report has changed from the past when it was about households consuming adequately iodized salt. Now it is about salt with any iodine, as such, global and regional average prevalence estimates are not comparable to the averages published in previous editions of The State of the World’s Children.
TABLE 3. HEALTH Water, sanitation and hygiene: The drinking water, sanitation and hygiene estimates in this report come from the WHO/UNICEF Joint Monitoring Programme for Water Supply, Sanitation and Hygiene (JMP). Full details of the JMP methodology can be found at <www.washdata.org>. New estimates are released every 2 years which supersede all previous estimates and should not be compared.
Immunization: This report presents WHO and UNICEF estimates of national immunization coverage. Since 2000, the estimates are updated once annually in July, following a consultation process wherein countries are provided draft reports for review and comment. As the system incorporates new empirical data, each annual revision supersedes prior data releases, and coverage levels from earlier revisions are not comparable. A more detailed explanation of the process can be found at <data.unicef.org/child-health/immunization>.
Regional averages for the reported antigens are computed as follows:
• For BCG, regional averages include only those countries where BCG is included in the national routine immunization schedule.
• For DPT, polio, measles, HepB, Hib, PCV and rotavirus vaccines, regional averages include all countries,

UNICEF – THE STATE OF THE WORLD’S CHILDREN 2017152
as these vaccines are universally recommended by WHO.
• For protection at birth (PAB) from tetanus, regional averages include only the countries where maternal and neonatal tetanus is endemic.
TABLE 4. HIV/AIDS In 2017, the Joint United Nations Programme on HIV/AIDS (UNAIDS) released new global, regional and country-level HIV and AIDS estimates for 2016 that reflect the most up-to-date epidemiological estimates, as well as antiretroviral therapy (ART) for adults and children, and prevention of mother-to-child transmission (PMTCT) of HIV coverage data. The estimates are based on the most current available science and WHO programme guidelines, which have resulted in improvements in assumptions of the probability of HIV transmission from mother-to-child, fertility among women by age and HIV serostatus, net survival rates for HIV-infected children and more. Furthermore, this table includes the most recent and reliable data available from population-based surveys and programme service statistics. Based on the refined methodology, UNAIDS has retrospectively generated new estimates of HIV prevalence, the number of people living with HIV and those needing treatment, AIDS-related deaths, new HIV infections and the number of children whose parents have died due to all causes including AIDS for past years.
Only new estimates should be used for trend analysis as the global and regional figures published in The State of the World’s Children are not comparable to estimates previously published. The new HIV and AIDS estimates included in this table are also available on <data.unicef.org> as well as <http://www.aidsinfoonline.org>. More information on HIV and AIDS estimates, methodology and updates can be found at <www.unaids.org>.
The indicators included in Table 4 have been revised from previous editions of The State of the World’s Children in order to better reflect progress in current HIV/AIDS programmes and policy.
TABLE 7. WOMEN Maternal mortality ratio (adjusted): The table presents the ‘adjusted’ maternal mortality ratios for the year 2015, as published by the Maternal Mortality Estimation Inter-agency Group (MMEIG), composed of WHO, UNICEF, the United Nations Population Fund (UNFPA), The World Bank, and the United Nations Population Division, together with independent technical experts. To derive these estimates, the inter-agency group used a dual approach: making adjustments to correct misclassification and underreporting in existing estimates of maternal mortality from civil registration systems, and using a model to generate estimates for countries without reliable national-level estimates of maternal mortality. These ‘adjusted’ estimates should not be compared with previous inter-agency estimates. The full report – with complete country and regional estimates for the years 1990, 1995, 2000, 2005, 2010 and 2015, in addition to details on the methodology – can be found at <data.unicef.org/maternal-health/maternal-mortality.html>.
Demand for family planning satisfied with modern methods: This indicator has been added to replace contraceptive prevalence.
TABLE 8. CHILD PROTECTION Birth Registration: Changes in the definition of birth registration were made from the second and third rounds of MICS (MICS2 and MICS3) to the fourth round (MICS4). In order to allow for comparability with later rounds, data from MICS2 and MICS3 on birth registration were recalculated according to the MICS4 indicator definition. Therefore, the recalculated data presented here may differ from estimates included in MICS2 and MICS3 national reports.
Child labour: The prevalence rates of child labour presented in the table vary widely across countries due to significant differences in survey methodology, questionnaire content, national definitions and thresholds used to establish child labour prevalence. Only a limited number of countries have produced child labour prevalence data based on international

STATISTICAL TABLES 153
standards and classifications. Data from the fourth round of MICS (MICS4, 2009–2012) included in the table have been recalculated according to the indicator definition used in MICS3 surveys, to ensure cross-country comparability. In this definition, the activities of fetching water or collecting firewood are classified as household chores rather than as an economic activity. Under this approach, a child aged 5–14 would have to be engaged in fetching water or collecting firewood for at least 28 hours per week to be considered as a child labourer.
Female genital mutilation/cutting (FGM/C): Data on the prevalence of FGM/C among girls aged 0–14 were recalculated for technical reasons and may differ from that presented in original DHS and MICS country reports. For further details, refer to Female Genital Mutilation/Cutting: A statistical overview and exploration of the dynamics of change, UNICEF, New York, 2013. Regional estimates on the prevalence of FGM/C and attitudes towards the practice are based on available data from only practising countries with nationally representative data and therefore reflect the situation among those living in these affected countries within the region, and not the region as a whole, as there are some non-practising countries in each region as well.
Violent discipline: Estimates used in UNICEF publications and in MICS country reports prior to 2010 were calculated using household weights that did not take into account the last-stage selection of children for the administration of the child discipline module in MICS surveys. (A random selection of one child aged 2–14 is undertaken for the administration of the child discipline module.) In January 2010, it was decided that more accurate estimates are produced by using a household weight that takes the last-stage selection into
account. MICS3 data were recalculated using this approach.
TABLE 12. EARLY CHILDHOOD DEVELOPMENTFather’s support for learning: Data from the third and fourth rounds of MICS (MICS3 and MICS4) refer to father’s engagement in one or more activities to promote learning and school readiness, while the definition was changed in the fifth round (MICS5) to reflect father’s engagement in four or more activities. Therefore, estimates of father’s support for learning from MICS3 and MICS4 are lower than those based on MICS5 results.
Children with inadequate supervision: This indicator was previously referred to as ‘children left in inadequate care’ but has been renamed to more accurately reflect the nature of the underlying construct.
TABLE 13. ECONOMIC INDICATORSNational monetary child poverty has been added in 2016 and 2017 to reflect Sustainable Development Goal 1, Target 1.2 that includes an explicit commitment to reduce poverty among children. This indicator measures “the percentage of children aged 0-17 years old living in households that have income or consumption level below the government defined national poverty threshold”. Data come from official government sources such as Statistical Office tabulations, national household survey and poverty reports and from regional databases such as Eurostat. Note that the methodology used to calculate national poverty prevalence varies by country. For instance, some countries using income and others consumption, some applying an absolute poverty line and others a relative poverty threshold. Therefore, national child poverty rates should be used to monitor progress, but should not be used to compare or rank countries.

UNICEF – THE STATE OF THE WORLD’S CHILDREN 2017
Countries and areas
Under-5 mortality
rank
Under-5 mortality rate
Under-5 mortality rate by
sex2016
Infant mortality rate
(under 1)
Neonatal mortality
rate
Total population (thousands)
Annual number of births
(thousands)
Annual number
of under-5 deaths
(thousands)
Life expectancy at birth (years)
Total adult literacy rate
(%)
Primary school net enrolment
ratio (%)
1990 2016 male female 1990 2016 2016 2016 2016 2016 2016 2011−2016* 2011−2016*
Afghanistan 25 177 70 74 66 120 53 40 34,656 1,143 80 64 32 –Albania 114 40 14 15 12 35 12 6 2,926 35 0 78 97 96Algeria 78 49 25 27 24 41 22 16 40,606 949 24 76 75 x 97Andorra 179 9 3 3 3 7 2 1 77 – 0 – 100 –Angola 17 221 83 88 76 131 55 29 28,813 1,181 96 62 66 84Anguilla – – – – – – – – 15 – – – – –Antigua and Barbuda 133 26 9 9 8 25 5 4 101 2 0 76 99 x 87Argentina 126 29 11 12 10 26 10 6 43,847 754 8 77 98 99Armenia 118 50 13 15 12 42 12 7 2,925 40 1 75 100 96Australia 164 9 4 4 3 8 3 2 24,126 311 1 83 – 97Austria 164 10 4 4 3 8 3 2 8,712 83 0 82 – –Azerbaijan 68 95 31 34 28 75 27 18 9,725 176 5 72 100 94Bahamas 126 24 11 11 10 20 9 6 391 6 0 76 – 98 xBahrain 142 23 8 8 7 20 7 3 1,425 21 0 77 95 x 96Bangladesh 62 144 34 37 32 100 28 20 162,952 3,110 106 72 73 91 xBarbados 123 18 12 13 11 16 11 8 285 3 0 76 – 91Belarus 164 15 4 4 3 12 3 2 9,480 114 0 73 100 x 95Belgium 164 10 4 4 4 8 3 2 11,358 129 1 81 – 99Belize 106 39 15 16 13 32 13 10 367 8 0 70 – 96Benin 7 178 98 102 93 107 63 31 10,872 397 38 61 33 96Bhutan 66 128 32 36 29 90 27 18 798 15 0 70 57 86Bolivia (Plurinational State of) 58 124 37 40 33 85 30 19 10,888 253 9 69 92 88Bosnia and Herzegovina 153 18 6 7 5 16 5 5 3,517 33 0 77 97 –Botswana 56 54 41 44 37 42 33 26 2,250 53 2 67 81 x 91Brazil 106 64 15 16 14 53 14 8 207,653 2,966 45 76 92 93British Virgin Islands – – – – – – – – 31 – – – – –Brunei Darussalam 131 13 10 11 9 10 9 4 423 7 0 77 96 –Bulgaria 142 18 8 8 7 15 7 4 7,131 67 1 75 98 93Burkina Faso 16 199 85 89 80 99 53 26 18,646 716 60 60 35 69Burundi 23 170 72 77 66 103 48 24 10,524 437 31 57 62 94Cabo Verde 85 63 21 23 19 48 18 10 540 11 0 73 87 97Cambodia 68 116 31 34 27 85 26 16 15,762 368 11 69 74 x 95Cameroon 19 143 80 85 74 89 53 24 23,439 842 66 58 71 x 92Canada 157 8 5 5 5 7 4 3 36,290 387 2 82 – 99Central African Republic 3 174 124 130 117 114 89 42 4,595 166 20 52 37 x 71Chad 2 211 127 133 121 111 75 35 14,453 615 77 53 22 79Chile 142 19 8 9 8 16 7 5 17,910 239 2 80 96 94China 131 54 10 11 9 42 9 5 1,403,500 17,035 168 76 95 x –Colombia 106 35 15 17 14 29 13 9 48,653 746 11 74 94 91Comoros 22 126 73 78 68 88 55 33 796 26 2 64 49 79Congo 40 91 54 58 49 59 39 21 5,126 176 9 65 79 91Cook Islands 142 24 8 9 7 21 7 4 17 – 0 – – 95Costa Rica 133 17 9 10 8 14 8 6 4,857 70 1 80 97 96Côte d'Ivoire 10 151 92 101 82 104 66 37 23,696 858 78 54 44 79Croatia 157 13 5 5 4 11 4 3 4,213 39 0 78 99 89Cuba 153 13 6 6 5 11 4 2 11,476 125 1 80 100 92Cyprus 179 11 3 3 2 10 2 1 1,170 13 0 81 99 97Czechia 179 12 3 4 3 10 3 2 10,611 109 0 79 – –Democratic People's Republic of Korea 88 43 20 22 18 33 15 11 25,369 350 7 72 – 94 x
Democratic Republic of the Congo 8 184 94 101 87 118 72 29 78,736 3,269 304 60 77 35 xDenmark 164 9 4 5 4 7 4 3 5,712 59 0 81 – 98Djibouti 31 118 64 70 58 91 54 33 942 22 1 62 – 53Dominica 62 17 34 36 31 14 31 24 74 – 0 – – 93 xDominican Republic 68 60 31 34 28 46 26 21 10,649 216 7 74 92 87Ecuador 85 57 21 23 18 44 18 11 16,385 331 7 76 94 92Egypt 81 86 23 24 22 63 19 13 95,689 2,541 57 71 75 98El Salvador 106 60 15 17 13 46 13 8 6,345 118 2 74 88 91Equatorial Guinea 11 191 91 97 84 129 66 32 1,221 41 4 58 88 x 56Eritrea 51 151 45 49 39 93 33 18 4,955 160 7 65 65 x 39Estonia 179 18 3 3 3 14 2 1 1,312 14 0 78 100 95Ethiopia 35 203 58 64 53 121 41 28 102,403 3,230 187 65 39 x 86Fiji 82 28 22 24 20 24 19 9 899 18 0 70 – 98
Finland 192 7 2 3 2 6 2 1 5,503 59 0 81 – 100
TABLE 1. BASIC INDICATORS

155
Countries and areas
Under-5 mortality
rank
Under-5 mortality rate
Under-5 mortality rate by
sex2016
Infant mortality rate
(under 1)
Neonatal mortality
rate
Total population (thousands)
Annual number of births
(thousands)
Annual number
of under-5 deaths
(thousands)
Life expectancy at birth (years)
Total adult literacy rate
(%)
Primary school net enrolment
ratio (%)
1990 2016 male female 1990 2016 2016 2016 2016 2016 2016 2011−2016* 2011−2016*
France 164 9 4 4 4 7 3 2 64,721 766 3 83 – 99Gabon 48 92 47 52 43 60 34 22 1,980 58 3 66 82 –Gambia 29 168 65 70 61 82 42 28 2,039 79 5 61 42 75Georgia 126 47 11 12 9 40 10 7 3,925 55 1 73 100 99Germany 164 9 4 4 4 7 3 2 81,915 711 3 81 – 99Ghana 34 127 59 64 53 80 41 27 28,207 870 51 63 71 x 87Greece 164 11 4 4 4 9 3 2 11,184 94 0 81 97 96Grenada 100 22 16 17 15 18 14 8 107 2 0 74 – 96Guatemala 72 82 29 31 26 60 24 14 16,582 417 12 73 81 85Guinea 14 235 89 94 84 139 58 25 12,396 442 39 60 32 76Guinea-Bissau 15 219 88 96 80 130 58 38 1,816 66 6 57 46 68 xGuyana 66 60 32 37 28 46 27 20 773 16 1 67 86 81Haiti 27 145 67 73 61 100 51 25 10,847 263 17 63 49 x –Holy See – – – – – – – – 1 – – – – –Honduras 92 58 19 21 17 45 16 10 9,113 198 4 74 89 93Hungary 157 17 5 6 5 15 4 3 9,753 88 0 76 – 91
Iceland 192 6 2 2 2 5 2 1 332 4 0 83 – 99
India 53 126 43 42 44 88 35 25 1,324,171 25,244 1,081 69 69 92Indonesia 76 84 26 29 23 62 22 14 261,115 4,991 131 69 95 90Iran (Islamic Republic of) 106 57 15 16 15 44 13 10 80,277 1,355 20 76 85 99Iraq 68 54 31 34 28 42 26 18 37,203 1,212 38 70 44 92 xIreland 164 9 4 4 3 8 3 2 4,726 69 0 81 – 95Israel 164 12 4 4 3 10 3 2 8,192 167 1 83 – 97Italy 179 10 3 4 3 8 3 2 59,430 495 2 83 99 97Jamaica 106 30 15 17 13 25 13 11 2,881 48 1 76 80 x 92 xJapan 179 6 3 3 3 5 2 1 127,749 1,053 3 84 – 100Jordan 95 37 18 19 17 30 15 11 9,456 243 4 74 98 89Kazakhstan 126 52 11 13 10 44 10 6 17,988 385 4 70 100 x 87Kenya 47 98 49 53 45 63 36 23 48,462 1,504 74 67 79 85Kiribati 40 96 54 59 49 69 42 23 114 3 0 66 – 95Kuwait 142 18 8 9 8 15 7 4 4,053 65 1 75 96 93Kyrgyzstan 85 65 21 24 19 54 19 12 5,956 152 3 71 99 x 89Lao People's Democratic Republic 31 162 64 70 58 111 49 29 6,758 163 10 67 58 93Latvia 157 17 5 5 4 13 4 2 1,971 20 0 75 100 96Lebanon 142 33 8 8 8 27 7 5 6,007 86 1 80 91 x 82Lesotho 8 91 94 101 86 73 72 39 2,204 61 6 54 77 80Liberia 27 258 67 72 62 172 51 23 4,614 157 10 63 43 x 38Libya 118 42 13 14 12 36 11 7 6,293 127 2 72 – –Liechtenstein – – – – – – – – 38 – – – – 94Lithuania 157 15 5 6 5 12 4 3 2,908 31 0 75 100 98Luxembourg 192 9 2 3 2 7 2 2 576 6 0 82 – 93Madagascar 50 160 46 51 42 97 34 19 24,895 812 37 66 72 77 xMalawi 38 232 55 60 50 137 39 23 18,092 653 36 63 62 97 xMalaysia 142 17 8 9 8 14 7 4 31,187 524 4 75 93 x 98Maldives 133 94 9 9 8 68 7 5 428 8 0 77 99 95Mali 5 254 111 115 105 130 68 36 17,995 758 82 58 33 56Malta 151 11 7 7 6 10 6 5 429 4 0 81 93 98Marshall Islands 59 51 35 39 31 40 29 16 53 – 0 – 98 77Mauritania 18 117 81 88 74 71 54 34 4,301 145 12 63 46 x 79Mauritius 114 23 14 15 12 20 12 8 1,262 13 0 75 93 96Mexico 106 46 15 16 13 37 13 8 127,540 2,330 34 77 94 95Micronesia (Federated States of) 65 55 33 37 30 43 28 17 105 2 0 69 – 84Monaco 179 8 3 4 3 6 3 2 38 – 0 – – –Mongolia 95 109 18 21 14 77 15 10 3,027 73 1 69 98 x 97Montenegro 164 17 4 4 4 15 4 2 629 7 0 77 98 93Montserrat – – – – – – – – 5 – – – – 92 xMorocco 74 80 27 30 24 63 23 18 35,277 709 19 76 69 98Mozambique 24 248 71 76 67 165 53 27 28,829 1,105 78 58 51 x 89Myanmar 44 116 51 55 46 82 40 25 52,885 944 48 67 76 95Namibia 51 71 45 49 41 48 32 18 2,480 72 3 64 88 90Nauru 59 58 35 38 31 45 29 22 11 – 0 – – 86Nepal 59 141 35 37 32 98 28 21 28,983 573 20 70 60 97Netherlands 164 8 4 4 3 7 3 3 16,987 179 1 82 – 98New Zealand 157 11 5 6 5 9 5 3 4,661 62 0 82 – 99
TABLE 1. BASIC INDICATORS

UNICEF – THE STATE OF THE WORLD’S CHILDREN 2017
Countries and areas
Under-5 mortality
rank
Under-5 mortality rate
Under-5 mortality rate by
sex2016
Infant mortality rate
(under 1)
Neonatal mortality
rate
Total population (thousands)
Annual number of births
(thousands)
Annual number
of under-5 deaths
(thousands)
Life expectancy at birth (years)
Total adult literacy rate
(%)
Primary school net enrolment
ratio (%)
1990 2016 male female 1990 2016 2016 2016 2016 2016 2016 2011−2016* 2011−2016*
Nicaragua 88 68 20 22 17 51 17 9 6,150 121 2 75 78 x 97 xNiger 11 329 91 95 87 133 51 26 20,673 967 86 60 15 62Nigeria 6 213 104 110 98 126 67 34 185,990 7,141 733 53 51 x 64 xNiue 82 14 22 25 20 12 19 12 2 – 0 – – –Norway 179 9 3 3 2 7 2 2 5,255 62 0 82 – 100Oman 126 39 11 12 10 32 9 5 4,425 81 1 77 93 95Pakistan 20 139 79 82 75 106 64 46 193,203 5,439 424 66 57 74Palau 100 36 16 18 14 31 14 8 22 – 0 – 97 80Panama 100 31 16 18 15 26 14 10 4,034 79 1 78 94 x 93Papua New Guinea 40 88 54 59 50 64 42 24 8,085 221 12 66 57 x 86Paraguay 88 47 20 22 18 37 17 11 6,725 140 3 73 95 89Peru 106 80 15 17 14 57 12 8 31,774 615 9 75 94 94Philippines 74 58 27 30 24 41 22 13 103,320 2,386 64 69 96 96Poland 157 17 5 5 4 15 4 3 38,224 365 2 78 – 96Portugal 164 15 4 4 3 12 3 2 10,372 83 0 81 94 98Qatar 133 21 9 9 8 18 7 4 2,570 25 0 78 98 92Republic of Korea 179 16 3 4 3 14 3 2 50,792 449 2 82 – 98Republic of Moldova 100 33 16 18 14 27 14 12 4,060 43 1 72 99 87Romania 133 31 9 10 8 25 8 4 19,778 192 2 75 99 87Russian Federation 142 22 8 9 7 18 7 3 143,965 1,852 14 71 100 x 97Rwanda 57 151 39 42 35 93 29 17 11,918 370 14 67 68 95Saint Kitts and Nevis 133 32 9 10 8 26 8 6 55 – 0 – – 78Saint Lucia 118 21 13 15 12 18 12 9 178 2 0 75 – 93 xSaint Vincent and the Grenadines 98 24 17 18 15 20 15 10 110 2 0 73 – 94Samoa 98 31 17 19 16 26 15 9 195 5 0 75 99 96San Marino 179 11 3 3 3 10 3 1 33 – 0 – – 93Sao Tome and Principe 62 105 34 37 30 67 26 15 200 7 0 67 90 95Saudi Arabia 118 45 13 14 12 36 11 7 32,276 626 8 75 94 98Senegal 48 140 47 51 43 72 34 21 15,412 542 25 67 43 71Serbia 153 28 6 6 5 24 5 4 8,820 94 1 75 99 96Seychelles 114 17 14 16 13 14 12 9 94 2 0 74 94 x 95Sierra Leone 4 262 114 120 106 156 83 33 7,396 258 29 52 32 99Singapore 179 8 3 3 3 6 2 1 5,622 50 0 83 97 –Slovakia 153 15 6 6 5 13 5 3 5,444 57 0 77 – –Slovenia 192 10 2 3 2 9 2 1 2,078 21 0 81 – 98Solomon Islands 76 38 26 28 23 31 22 10 599 17 0 71 77 71Somalia 1 181 133 139 126 109 83 39 14,318 609 79 56 – –South Africa 53 57 43 48 39 45 34 12 56,015 1,176 51 63 94 83 xSouth Sudan 11 256 91 96 85 152 59 38 12,231 431 38 57 27 x 31Spain 179 9 3 4 3 7 3 2 46,348 415 1 83 98 99Sri Lanka 133 21 9 10 9 18 8 5 20,798 323 3 75 91 x 99State of Palestine 92 45 19 21 18 36 17 11 4,791 150 3 73 97 90Sudan 29 131 65 70 60 82 45 29 39,579 1,290 83 64 54 54Suriname 88 46 20 22 18 40 18 11 558 10 0 71 93 93Swaziland 25 66 70 76 65 50 52 21 1,343 39 3 58 83 x 80Sweden 179 7 3 3 3 6 2 2 9,838 119 0 82 – 99Switzerland 164 8 4 4 4 7 4 3 8,402 86 0 83 – 93Syrian Arab Republic 95 37 18 19 16 30 14 9 18,430 427 7 70 81 x 67Tajikistan 53 107 43 48 38 84 37 20 8,735 251 11 71 99 x 98Thailand 123 38 12 14 11 31 11 7 68,864 726 9 75 93 91The former Yugoslav Republic of Macedonia 123 37 12 13 11 34 11 8 2,081 23 0 76 96 x 91
Timor-Leste 46 175 50 54 46 132 42 22 1,269 44 2 69 58 x 96Togo 21 145 76 82 70 89 51 26 7,606 256 19 60 64 95Tokelau – – – – – – – – 1 – – – – –Tonga 100 22 16 15 18 19 14 7 107 3 0 73 99 88Trinidad and Tobago 92 30 19 20 17 26 17 13 1,365 19 0 71 – 95 xTunisia 114 57 14 15 12 44 12 8 11,403 210 3 76 79 99Turkey 118 74 13 13 12 56 11 7 79,512 1,294 16 76 96 94Turkmenistan 44 86 51 60 42 70 43 22 5,663 144 7 68 – –Turks and Caicos Islands – – – – – – – – 35 – – – – –Tuvalu 78 57 25 28 23 44 21 17 11 – 0 – – 84Uganda 43 175 53 58 48 104 38 21 41,488 1,715 90 60 70 94Ukraine 133 19 9 10 8 17 8 5 44,439 479 4 72 100 96
TABLE 1. BASIC INDICATORS

157
Countries and areas
Under-5 mortality
rank
Under-5 mortality rate
Under-5 mortality rate by
sex2016
Infant mortality rate
(under 1)
Neonatal mortality
rate
Total population (thousands)
Annual number of births
(thousands)
Annual number
of under-5 deaths
(thousands)
Life expectancy at birth (years)
Total adult literacy rate
(%)
Primary school net enrolment
ratio (%)
1990 2016 male female 1990 2016 2016 2016 2016 2016 2016 2011−2016* 2011−2016*
United Arab Emirates 142 17 8 9 7 14 7 4 9,270 92 1 77 90 x 93United Kingdom 164 9 4 5 4 8 4 3 65,789 805 3 82 – 100United Republic of Tanzania 36 179 57 60 53 108 40 22 55,572 2,087 117 66 78 80United States 151 11 7 7 6 9 6 4 322,180 4,003 26 79 – 94Uruguay 133 23 9 10 8 21 8 5 3,444 49 0 77 99 94Uzbekistan 80 72 24 27 21 59 21 14 31,447 663 16 71 100 95Vanuatu 73 36 28 30 25 29 23 12 270 7 0 72 74 x 86Venezuela (Bolivarian Republic of) 100 30 16 18 15 25 14 10 31,568 602 10 75 97 90Viet Nam 82 51 22 25 18 37 17 12 94,569 1,582 34 76 94 x 98Yemen 38 126 55 59 51 88 43 27 27,584 867 48 65 – 85Zambia 33 182 63 68 58 110 44 23 16,591 620 39 62 83 x 87Zimbabwe 37 75 56 62 51 50 40 23 16,150 535 30 61 89 86
SUMMARYEast Asia and the Pacific – 57 16 18 15 43 14 8 2,291,492 31,393 510 75 – 94 **Europe and Central Asia – 31 10 11 9 25 8 5 908,161 11,087 107 77 – 96
Eastern Europe and Central Asia – 47 14 16 13 38 13 7 416,914 6,139 88 73 98 94Western Europe – 11 4 4 4 9 3 2 491,247 4,948 19 81 – 98
Latin America and the Caribbean – 55 18 19 16 44 15 9 633,773 10,749 187 76 94 93Middle East and North Africa – 66 24 26 22 50 20 14 435,225 9,953 237 74 78 94North America – 11 6 7 6 9 6 4 358,469 4,389 28 80 – 94South Asia – 129 48 48 48 92 39 28 1,765,989 35,853 1,713 69 68 90Sub-Saharan Africa – 181 78 84 73 108 53 28 1,034,153 37,038 2,860 60 65 80
Eastern and Southern Africa – 164 61 66 56 101 43 25 542,206 18,203 1,104 63 75 82West and Central Africa – 199 95 101 89 116 63 31 491,947 18,835 1,756 57 – –
Least developed countries – 176 68 73 63 109 48 26 979,388 31,163 2,101 64 63 81World – 93 41 43 39 65 31 19 7,427,263 140,462 5,642 72 78 90 **
For a complete list of countries and areas in the regions, subregions and country categories, see page 150 or visit <data.unicef.org/regionalclassifications>.It is not advisable to compare data from consecutive editions of The State of the World’s Children.
TABLE 1. BASIC INDICATORS
Under-5 mortality rate – Probability of dying between birth and exactly 5 years of age, expressed per 1,000 live births.Infant mortality rate – Probability of dying between birth and exactly 1 year of age, expressed per 1,000 live births.Neonatal mortality rate – Probability of dying during the first 28 days of life, expressed per 1,000 live births.Life expectancy at birth – Number of years newborn children would live if subject to the mortality risks prevailing for the cross section of population at the time of their birth.Total adult literacy rate – Percentage of population aged 15 years and over who can both read and write with understanding a short simple statement on his/her everyday life.
Primary school net enrolment ratio – Number of children enrolled in primary or secondary school who are of official primary school age, expressed as a percentage of the total number of children of official primary school age. Because of the inclusion of primary-school-aged children enrolled in secondary school, this indicator can also be referred to as a primary adjusted net enrolment ratio.
Under-5, infant and neonatal mortality rates – United Nations Inter-agency Group for Child Mortality Estimation (UNICEF, World Health Organization, United Nations Population Division and the World Bank).Total population and births – United Nations Population Division.Under-five deaths – United Nations Inter-agency Group for Child Mortality
Estimation (UNICEF, World Health Organization, United Nations Population Division and the World Bank).Life expectancy at birth – United Nations Population Division.Total adult literacy rate and primary school enrolment ratio – UNESCO Institute for Statistics (UIS).
– Data not available.x Data refer to years or periods other
than those specified in the column heading. Such data are not included in the calculation of regional and global averages, with the exception of 2005–2006 data from India. Estimates from data years prior to 2000 are not displayed.
* Data refer to the most recent year available during the period specified in the column heading.
** Excludes China.
NOTES
DEFINITIONS OF THE INDICATORS MAIN DATA SOURCES

UNICEF – THE STATE OF THE WORLD’S CHILDREN 2017
TABLE 2. NUTRITION
Countries and areas
Low birthweight
(%)U
Early initiation of breast- feeding
(%)
Exclusive breast- feeding
<6 months (%)
Introduction to solid,
semi-solid or soft foods 6–8
months (%)
Minimum acceptable
diet 6–23 months
(%)
Breast- feeding at age 2
(%)
Stunting(%)
Overweight (%)
Wasting (%) Vitamin A
supplementa-tion, full
coverageΔ (%)
Households consuming salt
with iodine(%)
moderate & severeθ
moderate & severeθ
moderate & severeθ severeθ
2011–2016* 2011–2016* 2011–2016* 2015 2011–2016*
Afghanistan – 41 43 61 16 59 41 5 10 4 98 α 57 SAlbania – 43 x 39 x 78 x – 31 x 23 x 23 x 9 x 6 x – 91 x,SAlgeria 6 x 36 26 28 – 27 12 12 4 1 – 81 SAndorra – – – – – – – – – – – –Angola 12 x 48 38 – 13 42 38 3 5 1 14 α 82 SAnguilla – – – – – – – – – – – –Antigua and Barbuda 6 – – – – – – – – – – –Argentina 7 53 33 93 – 29 8 x 10 x 1 x 0 x – –Armenia 8 x 41 45 90 24 22 9 14 4 2 – 99 SAustralia 6 x – – – – – 2 x 8 x 0 x 0 x – –Austria 7 – – – – – – – – – – –Azerbaijan 10 x 20 12 77 22 16 x 18 13 3 1 96 α,w 94 yb
Bahamas 12 – – – – – – – – – – –Bahrain 10 – – – – – – – – – – –Bangladesh 22 x 51 55 65 23 87 36 1 14 3 99 α 69 ya
Barbados 12 40 20 p – – – 8 12 7 2 – 37 SBelarus 5 53 19 64 – 12 5 x 10 x 2 x 1 x – –Belgium 7 x – – – – – – – – – – –Belize 11 68 33 79 – 35 15 7 2 1 – 85Benin 15 x 47 41 73 14 46 34 2 5 1 95 α 69Bhutan 10 x 78 51 87 – 61 34 x 8 x 6 x 2 x – α –Bolivia (Plurinational State of) 6 x 78 64 83 x – 40 x 18 9 x 2 1 – α 85 x,SBosnia and Herzegovina 5 42 19 71 – 12 9 17 2 2 – –Botswana 13 x 40 x 20 x – – 6 x 31 x 11 x 7 x 3 x 57 α 83 x,SBrazil 9 43 x 39 x 94 x – 26 x 7 x 7 x 2 x 0 x – 98 x,SBritish Virgin Islands – – – – – – – – – – – –Brunei Darussalam 12 – – – – – 20 x 8 x 3 x 0 x – –Bulgaria 9 – – – – – 9 x 14 x 3 x 1 x – 92 ya
Burkina Faso 14 x 42 50 59 3 80 27 1 8 1 99 α 92 x,SBurundi 13 x 74 x 83 70 x 10 81 56 1 5 1 71 α 87 x,SCabo Verde 6 x 73 x 60 x – – 13 x – – – – – –Cambodia 11 x 63 65 82 30 37 32 2 10 2 63 α 68 SCameroon 11 x 31 28 83 17 19 32 7 5 1 99 α 86 SCanada 6 – – – – – – 10 x – – – –Central African Republic 14 x 44 x 34 x 59 x – 32 x 41 2 7 2 x 3 α 77 SChad 20 x 23 0 59 6 65 40 3 13 4 85 α 77 SChile 6 – – – – – 2 9 0 – – –China – 41 x 21 60 x – 9 x 8 7 x 2 1 x – 96 yb
Colombia 10 57 x 43 x 86 x 60 x 33 x 13 x 5 x 1 x 0 x – –Comoros 25 x 34 12 81 6 57 32 11 11 4 12 α 82 SCongo 13 x 25 33 84 6 11 21 6 8 3 99 α 90 SCook Islands – – – – – – – – – – – –Costa Rica 7 60 33 86 – 28 6 x 8 x 1 x – – –Côte d'Ivoire 17 x 31 12 64 5 38 30 3 8 2 72 α 82 SCroatia 5 – – – – – – – – – – –Cuba 5 48 33 91 56 24 7 x – 2 x – – –Cyprus 12 x – – – – – – – – – – –Czechia 8 – – – – – 3 x 4 x 5 x 1 x – –Democratic People's Republic of Korea 6 x 28 69 66 – 22 28 0 x 4 1 99 α –
Democratic Republic of the Congo 10 x 52 48 79 8 66 43 4 8 3 94 α 82 SDenmark 5 – – – – – – – – – – –Djibouti 10 x 55 x 1 x 35 x – 18 x 34 8 22 9 72 α 4 x,SDominica 11 – – – – – – – – – – –Dominican Republic 11 x 38 5 81 45 12 7 8 2 1 – 30 x,SEcuador 9 55 40 x 74 – 19 25 8 2 1 – –Egypt 13 x 27 40 77 23 20 22 16 10 5 – α 93 yb
El Salvador 9 42 47 90 67 57 14 6 2 0 – –Equatorial Guinea 13 x 21 7 76 11 5 26 10 3 2 – α 57 x,SEritrea 14 x 93 x 69 x 40 x – 73 x 50 x 2 x 15 x 4 x 51 α 72 x,SEstonia 5 – – – – – – – – – – –Ethiopia 20 x 73 58 60 7 76 38 3 10 3 74 α 86 SFiji 10 x 57 x 40 x – – – 8 x 5 x 6 x 2 x – –Finland 4 – – – – – – – – – – –

159TABLE 2. NUTRITION
Countries and areas
Low birthweight
(%)U
Early initiation of breast- feeding
(%)
Exclusive breast- feeding
<6 months (%)
Introduction to solid,
semi-solid or soft foods 6–8
months (%)
Minimum acceptable
diet 6–23 months
(%)
Breast- feeding at age 2
(%)
Stunting(%)
Overweight (%)
Wasting (%) Vitamin A
supplementa-tion, full
coverageΔ (%)
Households consuming salt
with iodine(%)
moderate & severeθ
moderate & severeθ
moderate & severeθ severeθ
2011–2016* 2011–2016* 2011–2016* 2015 2011–2016*
France 7 – – – – – – – – – – –Gabon 14 x 32 6 82 5 4 18 8 3 1 – α 90 SGambia 10 x 52 47 47 8 42 25 3 11 4 27 α 69 SGeorgia 7 69 55 x 85 x – 17 x 11 x 20 x 2 x 1 x – –Germany 7 – – – – – 1 x 4 x 1 x 0 x – –Ghana 11 56 52 73 13 50 19 3 5 1 28 α 57 SGreece 10 – – – – – – – – – – –Grenada 9 – – – – – – – – – – –Guatemala 11 x 63 53 – 52 57 47 5 1 0 15 α –Guinea 12 x 17 21 43 4 66 31 4 10 4 69 α 61 SGuinea-Bissau 11 x 34 53 71 8 51 28 2 6 1 87 α 26 SGuyana 14 x 49 23 81 40 41 12 5 6 2 – 43 SHaiti 23 47 40 87 14 31 22 4 5 1 21 α 16 SHoly See – – – – – – – – – – – –Honduras 10 64 31 70 54 43 23 5 1 0 – α –Hungary 9 – – – – – – – – – – –Iceland 4 – – – – – – – – – – –India 28 x 42 55 52 10 67 38 2 x 21 8 53 α 93 ya
Indonesia 9 x 49 42 91 37 55 36 12 14 7 82 α 92 yb
Iran (Islamic Republic of) 8 69 53 76 – 51 7 – 4 1 – –Iraq 13 43 20 36 – 23 23 12 7 4 – 55 SIreland 5 – – – – – – – – – – –Israel 8 – – – – – – – – – – –Italy 7 x – – – – – – – – – – –Jamaica 11 65 24 55 – 31 6 9 4 1 x – –Japan 10 – – – – – 7 x 2 x 2 x 0 x – –Jordan 13 x 19 23 92 33 13 8 5 2 1 – 88 x, yb
Kazakhstan 6 83 38 67 45 21 8 9 3 1 – α 94 SKenya 8 x 62 61 80 22 53 26 4 4 1 37 α 95 SKiribati 8 – 69 x – – 82 x – – – – – α –Kuwait 8 – – – – – 5 6 3 1 – –Kyrgyzstan 6 83 41 85 36 23 13 7 3 1 – α 99 SLao People's Democratic Republic 15 39 40 52 – 40 44 2 6 2 88 α 80 SLatvia 5 – – – – – – – – – – –Lebanon 12 x 41 x 27 x – – 11 x 17 x 17 x 7 x 3 x – 95 x,SLesotho 11 x 65 67 83 11 30 33 7 3 1 – α 85 SLiberia 14 x 61 55 46 4 44 32 3 6 2 61 α 91 SLibya – – – – – – 21 x 22 x 7 x 3 x – –Liechtenstein – – – – – – – – – – – –Lithuania 5 – – – – – – – – – – –Luxembourg 7 – – – – – – – – – – –Madagascar 16 x 66 42 90 – 83 49 x 6 x 15 x 6 x 97 α 68 x,SMalawi 14 x 76 61 89 8 72 37 5 3 1 16 α 78 SMalaysia 11 – – – – – 18 7 8 – – –Maldives 11 x 64 x 48 x 91 x – 68 x 20 x 7 x 10 x 3 x 79 α –Mali 18 x 53 33 42 3 53 30 2 14 3 88 α 81 x,SMalta 7 – – – – – – – – – – –Marshall Islands 18 x 73 x 31 x – – 53 x – – – – – α –Mauritania 35 62 41 66 – 40 28 1 15 4 83 α 24 SMauritius 14 x – 21 x – – – – – – – – –Mexico 9 51 31 82 53 24 12 5 1 0 – α –Micronesia (Federated States of) 11 x – – – – – – – – – – α –Monaco 6 – – – – – – – – – – –Mongolia 5 x 71 47 95 35 53 11 11 1 0 38 α 80 SMontenegro 5 14 17 95 66 9 9 22 3 1 – –Montserrat – – – – – – – – – – – –Morocco 15 x 30 28 86 x – 25 15 11 2 1 – α –Mozambique 17 69 41 95 11 52 43 8 6 2 99 α 43 SMyanmar 9 x 67 51 75 16 64 29 1 7 1 88 α 81 SNamibia 16 x 71 49 80 13 21 23 4 7 3 – α 74 SNauru 27 x 76 x 67 x – – 65 x 24 x 3 x 1 x 0 x – –Nepal 18 55 66 84 32 89 36 1 10 2 79 α 94 SNetherlands 6 x – – – – – – – – – – –

UNICEF – THE STATE OF THE WORLD’S CHILDREN 2017
TABLE 2. NUTRITION
Countries and areas
Low birthweight
(%)U
Early initiation of breast- feeding
(%)
Exclusive breast- feeding
<6 months (%)
Introduction to solid,
semi-solid or soft foods 6–8
months (%)
Minimum acceptable
diet 6–23 months
(%)
Breast- feeding at age 2
(%)
Stunting(%)
Overweight (%)
Wasting (%) Vitamin A
supplementa-tion, full
coverageΔ (%)
Households consuming salt
with iodine(%)
moderate & severeθ
moderate & severeθ
moderate & severeθ severeθ
2011–2016* 2011–2016* 2011–2016* 2015 2011–2016*
New Zealand 6 – – – – – – – – – – –Nicaragua 8 68 32 – – 43 23 x 6 x 2 x 1 x 3 α –Niger 27 x 53 23 – 6 50 42 3 10 2 99 α 59 SNigeria 15 33 17 67 10 35 33 2 7 2 76 α 93 SNiue – – – – – – – – – – – –Norway 5 x – – – – – – – – – – –Oman 10 71 33 90 – 48 14 4 8 2 – –Pakistan 32 x 18 38 66 15 56 45 5 11 3 98 α 69 ya
Palau 7 x – – – – – – – – – – –Panama 8 47 22 61 – 34 19 x – 1 x 0 x – –Papua New Guinea 11 x – 56 x – – 72 x 50 14 14 7 – α –Paraguay 6 x 47 x 24 x – – 14 x 11 12 3 0 – 93 yb
Peru 7 55 68 78 53 55 y 14 7 1 0 – 90 SPhilippines 21 x 50 34 x 90 x – 41 33 4 7 2 72 α 52 yb
Poland 6 – – – – – – – – – – –Portugal 9 – – – – – – – – – – –Qatar 8 x 34 29 50 – 32 – – – – – –Republic of Korea 4 x – – – – – 3 7 1 0 – –Republic of Moldova 6 61 36 62 – 12 6 5 2 1 – 58 SRomania 8 12 x 16 x – – – 13 x 8 x 4 x 1 x – –Russian Federation 6 – – – – – – – – – – –Rwanda 7 x 81 87 57 19 87 37 8 2 1 96 α 91 SSaint Kitts and Nevis 10 – – – – – – – – – – –Saint Lucia 10 50 – – – – 3 6 4 1 – 75 SSaint Vincent and the Grenadines 11 – – – – – – – – – – –Samoa 10 x 88 x 51 x – – 74 x 5 5 4 1 – 96 SSan Marino 10 – – – – – – – – – – –Sao Tome and Principe 10 x 38 74 74 22 24 17 2 4 1 42 α 91 SSaudi Arabia 9 – – – – – 9 x 6 x 12 x 5 x – –Senegal 19 31 33 63 10 48 17 1 7 1 29 α 57 SSerbia 6 51 13 97 72 9 6 14 4 1 – –Seychelles – – – – – – 8 10 4 1 – –Sierra Leone 11 x 54 32 63 7 48 38 9 9 4 97 α 74 SSingapore 10 – – – – – 4 x 3 x 4 x 1 x – –Slovakia 8 – – – – – – – – – – –Slovenia 6 – – – – – – – – – – –Solomon Islands 13 x 75 x 74 x – – 67 x 32 4 8 3 – –Somalia – 23 x 5 x 16 x – 27 x 25 x 3 x 15 x 5 x 33 α 7 x,SSouth Africa – 61 x 32 – 23 13 27 13 3 1 – α –South Sudan – 48 x 45 x 21 x – 38 x 31 x 6 x 23 x 10 x – α 60 x,SSpain 8 – – – – – – – – – – –Sri Lanka 17 x 80 x 76 x – – 84 x 17 2 15 3 74 α –State of Palestine 9 x 41 39 90 42 12 7 8 1 0 – 88 SSudan – 69 55 51 15 49 38 3 16 5 72 α 34 SSuriname 14 x 45 x 3 x 47 x – 15 x 9 x 4 x 5 x 1 x – –Swaziland 9 x 48 64 90 38 8 26 9 2 0 – α 90 SSweden 5 – – – – – – – – – – –Switzerland 7 – – – – – – – – – – –Syrian Arab Republic 10 x 46 x 43 x – – 25 x 28 x 18 x 12 x 6 x – –Tajikistan 10 x 50 34 49 20 50 27 7 10 4 97 α 84 SThailand 11 x 40 23 85 56 16 11 8 5 1 – 85The former Yugoslav Republic of Macedonia 6 21 23 41 – 13 5 12 2 0 – –
Timor-Leste 12 x 93 62 97 18 39 50 2 11 2 61 α 76 x,STogo 11 x 61 58 67 12 61 28 2 7 2 6 α 77 STokelau – – – – – – – – – – – –Tonga – 79 52 – – 30 8 17 5 2 – –Trinidad and Tobago 12 41 x 13 x 83 x – 22 x 5 x 5 x 5 x 1 x – 53 x,STunisia 7 40 9 27 – 19 10 14 3 2 – –Turkey 11 x 50 30 75 – 34 10 11 2 0 – 85 x,STurkmenistan 5 73 59 82 77 20 12 6 4 1 – α 100 STurks and Caicos Islands – – – – – – – – – – – –Tuvalu 6 x 15 x 35 x – – 51 x 10 x 6 x 3 x 1 x – –Uganda 12 53 66 67 14 43 29 4 4 1 – α 92 S

161TABLE 2. NUTRITION
Low birthweight – Percentage of infants weighing less than 2,500 grams at birth.Early initiation of breastfeeding – Percentage of infants who are put to the breast within one hour of birth.Exclusive breastfeeding <6 months – Percentage of children aged 0–5 months who are fed exclusively with breast milk in the 24 hours prior to the survey.Introduction of solid, semi-solid or soft foods (6–8 months) – Percentage of children aged 6–8 months who received solid, semi-solid or soft foods in the 24 hours prior to the survey.Minimum Acceptable Diet (6–23 months) – Percentage of breastfed children 6–23 months of age who had at least the minimum dietary diversity and the minimum meal frequency during the previous day AND percentage of non-breastfed children 6–23 months of age who received at least 2 milk feedings and had at least the minimum dietary diversity not including milk feeds and the minimum meal frequency during the previous day.Breastfeeding at age 2 – Percentage of children aged 20–23 months who received breast milk in the 24 hours prior to the survey.
Stunting – Moderate and severe: Percentage of children aged 0–59 months who are below minus two standard deviations from median height-for-age of the WHO Child Growth Standards.Overweight – Moderate and severe: Percentage of children aged 0–59 months who are above two standard deviations from median weight-for-height of the WHO Child Growth Standards (includes obesity). Wasting – Moderate and severe: Percentage of children aged 0–59 months who are below minus two standard deviations from median weight-for-height of the WHO Child Growth Standards.Wasting –severe: Percentage of children aged 0–59 months who are below minus three standard deviations from median weight-for-height of the WHO Child Growth Standards.Vitamin A supplementation, full coverage – The estimated percentage of children aged 6–59 months reached with 2 doses of vitamin A supplements approximately 4–6 months apart in a given calendar year.Households consuming salt with iodine– Percentage of households consuming salt with any iodine (>0 ppm).
Low birthweight – Demographic and Health Surveys (DHS), Multiple Indicator Cluster Surveys (MICS), other national household surveys, data from routine reporting systems, UNICEF and WHO.Infant and young child feeding – DHS, MICS, other national household surveys and UNICEF.
Stunting, overweight, wasting and severe wasting – DHS, MICS, other national household surveys, WHO and UNICEF.Vitamin A supplementation – UNICEF.Iodized salt consumption – DHS, MICS, other national household surveys, school-based surveys and UNICEF.
– Data not available.x Data refer to years or periods other than those
specified in the column heading. Such data are not included in the calculation of regional and global averages, with the exception of 2008 data from China for ‘Early initiation of breastfeeding’, ‘Introduction to solids’ and Breastfeeding at age 2’. Estimates from data years prior to 2000 are not displayed.
y Data differ from the standard definition or refer to only part of a country. If they fall within the noted reference period, such data are included in the calculation of regional and global averages. Surveys with a superscript footnote of “a” are mainly DHS surveys awaiting re-analysis to add the households that did not have salt to the estimate. Surveys with a superscript footnote of “b” cannot be confirmed in whether the reported value includes households without salt or not.
p Based on small denominators (typically 25–49 unweighted cases). No data based on fewer than 25 unweighted cases are displayed.
θ Global and regional averages for stunting (moderate and severe), overweight (moderate and severe), wasting (moderate and severe) and wasting (severe) are estimated using statistical modelling data from the UNICEF-WHO-World Bank Group Joint Child Malnutrition Estimates, May 2017 Edition. For more information see <data.unicef.org/malnutrition>. Disaggregations for stunting (moderate and severe) as shown in tables 10 and 11, are population-weight-ed, which means using the most recent estimate for each country with data between 2011 and 2016; therefore disaggregations may not coincide with total estimates at the global and regional level presented in this table.
Δ Full coverage with vitamin A supplements is reported as the lower percentage of 2 annual coverage points (i.e., lower point between semester 1 (January–June) and semester 2 (July–December) of 2015). Data are only presented for VAS priority countries; thus aggregates are only based on and representative of these priority countries.
w Identifies countries with national vitamin A supple-mentation programmes targeted towards a reduced age range. Coverage figure is reported as targeted.
α Identifies countries which are designated ‘priority’. Priority countries for national vitamin A supplemen-tation programmes are identified as those having high under-five mortality rates (over 70 per 1,000 live births), and/or evidence of vitamin A deficiency among this age group, and/or a history of vitamin A supplementation programmes.
U The low birth weight database has not been updated since October 2014. Given that the data are out of date, aggregates for a number of regions and the global value have been suppressed. New methods are currently being applied to generate estimates through an inter-agency process and updates will be available in the next State of the World’s Children Report.
j Estimates for Eastern Europe and Central Asia are based on a model fit for all of Europe and Central Asia. Data were not available for the Russian Federation and were mainly from countries in Eastern Europe and Central Asia.
k Due to consecutive low population coverage for the two most recent time periods of 2008–2012 and 2013–2016, overweight data for South Asia are not presented in SOWC; however, the estimates are available through the Joint Malnutrition Estimates which can be downloaded at <https://data.unicef.org/topic/nutrition/malnutrition/> but should be interpreted with caution.
S Re-analyzed by adjusting the denominator to include households without salt.
* Data refer to the most recent year available during the period specified in the column heading.
** Excludes China.r Excludes the Russian Federation.N Excludes Brazil.
NOTESDEFINITIONS OF THE INDICATORS
MAIN DATA SOURCES
Countries and areas
Low birthweight
(%)U
Early initiation of breast- feeding
(%)
Exclusive breast- feeding
<6 months (%)
Introduction to solid,
semi-solid or soft foods 6–8
months (%)
Minimum acceptable
diet 6–23 months
(%)
Breast- feeding at age 2
(%)
Stunting(%)
Overweight (%)
Wasting (%) Vitamin A
supplementa-tion, full
coverageΔ (%)
Households consuming salt
with iodine(%)
moderate & severeθ
moderate & severeθ
moderate & severeθ severeθ
2011–2016* 2011–2016* 2011–2016* 2015 2011–2016*
Ukraine 5 66 20 43 – 22 4 x 27 x 0 x 4 x – 36 SUnited Arab Emirates 6 x – – – – – – – – – – –United Kingdom 7 – – – – – – – – – – –United Republic of Tanzania 8 x 51 59 92 9 43 34 4 5 1 87 α 76 SUnited States 8 x – 24 – – – 2 6 1 0 – –Uruguay 8 77 – – – – 11 7 1 0 – –Uzbekistan 5 x 67 x 26 x 47 x – 38 x 20 x 13 x 5 x 2 x 98 α 82 x,SVanuatu 10 x 85 73 72 – 49 29 5 4 1 – 33 x,SVenezuela (Bolivarian Republic of) 9 – – – – – 13 x 6 x 4 x – – –Viet Nam 5 27 24 91 59 22 25 5 6 1 97 α,w 61 SYemen 32 x 53 10 69 15 45 47 2 16 5 8 α 49 SZambia 11 x 66 73 82 11 42 40 6 6 3 – α 88 SZimbabwe 11 58 48 91 8 14 27 6 3 1 45 α 93 S
SUMMARYEast Asia and Pacific – 43 28 69 40 ** 23 9 6 3 1 82 91Europe and Central Asia 6 – – – – – – – – – – –
Eastern Europe and Central Asia 6 57 30 69 – 28 r 6 j 13 j 2 j 0 j – –Western Europe 7 – – – – – – – – – – –
Latin America and Caribbean 9 54 38 82 N 51 N 32 11 7 1 0 – –Middle East and North Africa – 40 32 63 – 29 15 11 7 3 – –North America – – 24 – – – 2 8 1 0 – –South Asia – 39 52 56 12 68 36 4 k 16 5 66 88Sub-Saharan Africa – 51 42 71 11 50 34 4 8 2 72 80
Eastern and Southern Africa – 63 55 75 13 53 34 4 7 2 65 78West and Central Africa – 40 29 68 9 47 34 4 9 3 78 81
Least developed countries – 56 49 70 12 62 – – – – 77 72World – 45 40 66 17 45 23 6 8 3 70 86
For a complete list of countries and areas in the regions, subregions and country categories, see page 150 or visit <data.unicef.org/regionalclassifications>.It is not advisable to compare data from consecutive editions of The State of the World’s Children.

UNICEF – THE STATE OF THE WORLD’S CHILDREN 2017
Countries and areas
Use of basic drinking water
services (%)
Use of basic sanitation
services (%)
Immunization coverage (%) Pneumonia Diarrhoea Malaria
BCG DTP1β DTP3β polio3 MCV1 MCV2^ HepB3 Hib3 rota PCV3
Protection at birth (PAB)
against tetanusλ
Care seeking for children
with symptoms of pneumonia
(%)
Treatment with oral rehydra-tion salts (ORS) (%)
Care seeking for
children with fever
(%)
Children sleep-
ing under
ITNs (%)
House-holds
with at least one ITN (%)2015 2015
total urban rural total urban rural 2016 2011–2016*
Afghanistan 63 89 53 39 56 33 74 73 65 60 62 39 65 65 0 65 65 62 46 63 5 26Albania 91 93 90 98 98 97 99 99 98 98 96 98 98 98 0 98 92 70 x 54 x 71 x – –Algeria 93 95 89 87 90 82 99 96 91 91 94 96 91 91 0 61 92 66 25 – – –Andorra 100 100 100 100 100 100 – 99 98 98 97 90 94 98 0 92 – – – – – –Angola 41 63 23 39 62 21 58 79 64 66 49 26 64 64 53 58 78 49 43 51 22 31Anguilla 98 98 – 97 97 – – – – – – – – – – – – – – – – –Antigua and Barbuda 97 – – 88 – – – 99 99 86 98 87 99 99 0 0 – – – – – –Argentina 100 100 100 95 95 94 92 97 92 87 90 88 92 92 75 82 – 94 18 – – –Armenia 99 99 99 92 96 83 99 97 94 96 97 97 94 94 94 94 – 57 x 37 71 – –Australia 100 100 100 100 – – – 98 94 94 95 94 94 94 87 94 – – – – – –Austria 100 100 100 100 100 100 – 99 87 87 95 89 87 87 61 0 – – – – – –Azerbaijan 84 95 72 89 92 87 98 98 97 98 98 98 97 97 0 97 – 36 x 11 – 1 x –Bahamas 98 – – 92 – – – 95 94 94 89 74 94 94 0 94 100 – – – – –Bahrain 100 – – 100 – – – 99 99 99 99 99 99 99 98 99 98 – – – – –Bangladesh 97 98 97 47 54 43 99 99 97 97 94 93 97 97 0 97 97 42 77 55 – –Barbados 98 – – 96 – – – 99 97 97 92 87 97 97 0 96 – – – – – –Belarus 98 98 99 94 94 95 98 99 98 98 98 98 96 11 0 0 – 93 45 – – –Belgium 100 100 100 99 99 99 – 99 98 98 96 85 97 97 87 94 – – – – – –Belize 97 99 96 87 91 84 94 98 95 96 95 96 95 95 0 0 91 67 55 71 – –Benin 67 77 60 14 25 5 96 86 82 78 74 0 82 82 0 75 85 23 25 44 73 77Bhutan 98 97 98 63 72 57 99 99 98 97 97 90 98 98 0 0 89 74 x 61 x – – –Bolivia (Plurinational State of) 93 99 79 53 64 27 99 99 99 99 99 0 99 99 99 97 87 62 22 – – –Bosnia and Herzegovina 98 97 98 95 99 92 97 90 78 79 83 78 78 69 0 0 – 87 36 – – –Botswana 79 95 58 60 75 39 98 98 95 96 97 74 95 95 95 95 92 14 x 43 x 75 x 31 53Brazil 97 99 87 86 91 58 99 89 86 98 96 72 86 86 94 94 93 50 x – – – –British Virgin Islands 100 – – 97 – – – – – – – – – – – – – – – – – –Brunei Darussalam 100 100 99 96 96 97 99 99 99 99 98 97 99 99 0 0 95 – – – – –Bulgaria 99 99 99 86 87 84 96 94 92 92 92 88 91 92 0 90 – – – – – –Burkina Faso 54 79 43 23 48 12 98 95 91 91 88 50 91 91 91 91 92 52 40 61 75 90Burundi 56 88 52 50 46 51 93 97 94 94 93 72 94 94 96 94 85 63 36 69 40 46Cabo Verde 86 93 74 65 73 51 96 96 96 95 92 95 96 96 0 0 92 – – – – –Cambodia 75 96 70 49 88 39 97 92 90 87 81 58 90 90 0 87 93 69 35 61 4 x 5 xCameroon 65 84 43 39 56 19 70 92 85 83 78 0 85 85 80 84 85 28 16 33 55 71Canada 99 – – 99 – – – 96 91 91 90 86 55 91 0 79 – – – – – –Central African Republic 54 74 41 25 49 9 74 69 47 47 49 0 47 47 0 47 60 30 x 16 x – 36 x 47 xChad 43 78 32 10 33 3 56 60 46 44 58 0 46 46 0 0 80 26 20 23 36 77Chile 100 100 100 100 100 99 97 99 95 95 93 87 95 95 0 90 – – – – – –China 96 96 96 75 86 61 99 99 99 99 99 99 99 0 0 0 – – – – – –Colombia 97 100 86 84 88 72 88 93 91 91 93 87 91 91 90 89 90 64 x 54 x 54 x – 3 xComoros 84 93 80 34 47 29 94 96 91 92 99 0 91 91 0 0 85 38 38 45 41 59Congo 68 85 37 15 20 6 85 85 80 80 80 0 80 80 80 80 85 28 28 51 61 66Cook Islands 100 – – 98 – – 99 99 99 99 90 90 99 99 0 0 – – – – – –Costa Rica 100 100 100 97 98 94 89 99 97 97 93 87 97 97 0 94 – 77 40 – – –Côte d'Ivoire 73 89 54 30 45 13 95 98 85 80 77 0 85 85 0 83 90 38 17 43 37 67Croatia 100 100 100 97 98 96 99 98 93 93 90 96 93 93 0 0 – – – – – –Cuba 95 97 90 91 92 88 99 99 99 98 99 99 99 99 0 0 – 93 61 93 – –Cyprus 100 100 100 99 100 99 – 98 97 97 90 88 97 96 0 81 – – – – – –Czechia 100 100 100 99 99 99 – 98 96 96 98 93 96 96 0 0 – – – – – –Democratic People's Republic of Korea 100 100 99 77 83 68 97 97 96 99 99 98 96 96 0 0 97 80 x 74 x – – –
Democratic Republic of the Congo 42 70 21 20 23 18 80 80 79 74 77 0 79 79 0 77 85 42 39 55 56 70Denmark 100 100 100 100 100 100 – 97 94 94 94 85 0 94 0 94 – – – – – –Djibouti 77 83 55 51 63 13 90 90 84 84 75 82 84 84 86 82 85 94 94 – 20 x 32Dominica 97 – – 78 – – 98 99 99 99 96 92 99 99 0 0 – – – – – –Dominican Republic 94 97 86 83 85 74 99 98 87 82 85 0 80 73 75 30 90 73 48 65 – –Ecuador 93 100 80 86 89 80 84 94 83 79 86 76 84 84 80 84 88 – 46 – – –Egypt 98 99 98 93 97 90 96 96 95 95 95 96 95 95 0 0 80 68 28 68 – –El Salvador 93 98 83 91 93 87 99 97 93 95 90 87 93 93 93 90 90 80 70 – – –Equatorial Guinea 50 78 31 75 80 71 48 40 19 20 30 0 19 19 0 0 70 54 40 62 23 38Eritrea 19 66 6 11 29 6 97 97 95 95 93 85 95 95 96 95 94 45 x 43 x – 20 x 71 xEstonia 100 100 99 100 100 100 95 94 93 93 93 92 93 93 85 0 – – – – – –Ethiopia 39 77 30 7 18 4 75 86 77 75 70 0 77 77 63 76 80 30 30 35 45 64Fiji 94 98 89 96 96 95 99 99 99 99 94 94 99 99 99 99 94 – – – – –
TABLE 3. HEALTH

163
Countries and areas
Use of basic drinking water
services (%)
Use of basic sanitation
services (%)
Immunization coverage (%) Pneumonia Diarrhoea Malaria
BCG DTP1β DTP3β polio3 MCV1 MCV2^ HepB3 Hib3 rota PCV3
Protection at birth (PAB)
against tetanusλ
Care seeking for children
with symptoms of pneumonia
(%)
Treatment with oral rehydra-tion salts (ORS) (%)
Care seeking for
children with fever
(%)
Children sleep-
ing under
ITNs (%)
House-holds
with at least one ITN (%)2015 2015
total urban rural total urban rural 2016 2011–2016*
Finland 100 100 100 99 99 99 – 99 92 92 94 85 0 92 84 87 – – – – – –France 100 100 100 99 99 99 – 99 97 97 90 79 88 96 0 91 – – – – – –Gabon 88 92 59 41 42 32 94 83 75 74 64 0 75 75 0 0 90 68 26 67 39 36Gambia 80 88 68 42 46 35 98 99 95 95 97 79 95 95 95 95 92 68 59 65 47 69Georgia 93 98 87 85 95 73 98 97 92 92 93 85 92 92 75 75 – 74 x 40 x – – –Germany 100 100 100 99 99 99 – 95 95 94 97 93 88 93 66 86 – – – – – –Ghana 78 88 66 14 19 9 94 94 93 95 89 75 93 93 94 93 88 56 49 77 47 68Greece 100 100 100 99 99 98 – 99 99 99 97 83 96 99 20 96 – – – – – –Grenada 96 – – 78 – – – 98 96 98 95 85 96 96 0 0 – – – – – –Guatemala 94 97 89 67 81 53 87 96 80 82 86 65 80 80 82 81 90 52 49 50 – –Guinea 67 88 55 22 34 15 72 65 57 42 54 0 57 57 0 0 80 37 34 37 26 47Guinea-Bissau 69 85 54 21 35 8 94 95 87 87 81 0 87 87 61 80 80 34 35 51 81 90Guyana 95 100 93 86 89 85 95 97 97 94 99 94 97 97 96 92 99 84 43 71 7 5Haiti 64 81 40 31 37 22 72 78 58 56 53 26 58 58 48 0 88 38 53 40 12 19Holy See – – – – – – – – – – – – – – – – – – – – – –Honduras 92 99 84 80 84 75 99 99 97 97 88 0 97 97 97 97 94 64 60 62 – –Hungary 100 100 100 98 98 99 99 99 99 99 99 99 0 99 0 98 – – – – – –Iceland 100 100 100 99 99 100 – 96 91 91 91 95 0 91 0 90 – – – – – –India 88 93 85 44 65 34 89 91 88 86 88 76 88 80 4 0 87 73 51 71 x – –Indonesia 90 97 81 68 77 57 81 95 79 80 76 56 79 79 0 0 85 75 39 74 3 x 3 xIran (Islamic Republic of) 95 97 89 88 92 79 99 99 99 99 99 98 99 99 0 0 95 76 x 61 x – – –Iraq 86 90 78 86 86 86 94 73 63 68 66 64 61 63 34 0 75 74 23 – – –Ireland 99 99 99 92 91 95 18 98 95 95 92 0 95 95 0 91 – – – – – –Israel 100 100 100 100 100 100 – 94 94 94 97 97 95 94 81 93 – – – – – –Italy 100 100 100 99 99 99 – 97 93 93 85 83 93 93 0 89 – – – – – –Jamaica 93 97 88 85 84 87 96 99 99 99 95 85 98 99 0 0 80 82 64 – – –Japan 99 – – 100 – – 84 99 99 99 96 93 0 99 0 99 – – – – – –Jordan 99 99 97 97 97 96 99 99 98 98 96 99 98 98 97 0 90 77 20 69 – –Kazakhstan 91 97 84 98 97 99 95 93 82 82 99 99 82 82 0 97 – 81 62 – – –Kenya 58 83 50 30 35 28 99 96 89 88 75 32 89 89 74 78 85 66 54 72 56 59Kiribati 64 90 44 40 49 32 79 82 81 82 80 79 81 81 79 79 90 81 x 62 x 27 x – –Kuwait 100 – – 100 – – 99 99 99 99 93 96 99 99 0 99 95 – – – – –Kyrgyzstan 87 97 82 97 93 99 97 97 96 97 97 98 96 96 0 0 – 60 33 56 – –Lao People's Democratic Republic 80 92 73 73 93 60 78 85 82 83 76 0 82 82 0 78 90 54 42 – 43 50Latvia 99 99 98 93 97 84 96 99 98 98 93 89 98 98 83 82 – – – – – –Lebanon 92 – – 95 – – – 84 81 75 79 75 81 81 0 0 – 74 x 44 x – – –Lesotho 72 87 66 44 46 43 98 98 93 90 90 82 93 93 0 93 85 63 53 61 – –Liberia 70 80 60 17 28 6 97 99 79 79 80 0 79 79 48 79 89 51 60 78 44 62Libya 97 – – 100 – – 99 98 97 97 97 96 97 97 97 96 – – – – – –Liechtenstein 100 – – 100 – – – – – – – – – – – – – – – – – –Lithuania 97 100 93 94 97 86 98 97 94 94 94 92 95 94 0 82 – – – – – –Luxembourg 100 100 100 98 97 99 – 99 99 99 99 86 94 99 89 95 – – – – – –Madagascar 51 82 34 10 16 6 70 84 77 75 58 0 77 77 78 76 78 41 15 46 73 80Malawi 67 87 63 44 49 43 86 89 84 83 81 61 84 84 81 83 89 78 65 67 43 57Malaysia 96 99 89 100 100 99 98 99 98 98 96 99 98 98 0 0 90 – – – – –Maldives 98 96 100 96 93 98 99 99 99 99 99 99 99 99 0 0 99 22 x 57 x 84 x – –Mali 74 91 63 31 46 22 92 86 68 67 75 0 68 68 60 70 85 23 22 x 49 79 93Malta 100 100 100 100 100 100 – 97 97 97 93 86 97 97 0 0 – – – – – –Marshall Islands 78 70 99 87 95 66 94 87 71 69 75 49 73 58 38 51 – – 38 x 63 x – –Mauritania 70 86 45 45 63 17 85 87 73 67 70 0 73 73 73 73 80 34 19 35 18 67Mauritius 100 100 100 93 94 93 98 97 96 96 92 92 72 96 92 10 95 – – – – –Mexico 98 100 94 89 91 81 99 99 97 96 96 98 93 97 72 92 90 73 61 – – –Micronesia (Federated States of) 88 97 86 – – – 85 95 69 68 70 74 76 61 46 63 – – – – – –Monaco 100 100 – 100 100 – 89 99 99 99 99 0 99 99 0 0 – – – – – –Mongolia 83 94 56 59 66 41 99 99 99 99 98 90 99 99 0 0 – 70 42 – – –Montenegro 98 97 99 96 98 92 88 97 89 89 47 86 75 89 0 0 – 89 x 16 x 74 – –Montserrat 97 – – 89 – – – – – – – – – – – – – – – – – –Morocco 83 96 64 83 89 75 99 99 99 99 99 99 99 99 99 98 90 70 22 – – –Mozambique 47 79 32 24 47 12 95 90 80 80 91 51 80 80 76 80 83 50 55 56 36 51Myanmar 68 82 60 65 76 59 88 94 90 89 91 86 90 90 0 14 87 58 62 65 19 27Namibia 79 97 63 34 55 15 94 98 92 92 85 0 92 92 86 81 88 68 72 63 6 24Nauru 100 100 – 66 66 – 99 98 91 91 98 96 91 91 0 0 – 69 x 23 x 51 x – –Nepal 88 89 87 46 52 45 93 92 87 85 83 25 87 87 0 46 82 85 37 46 – –
TABLE 3. HEALTH

UNICEF – THE STATE OF THE WORLD’S CHILDREN 2017
Countries and areas
Use of basic drinking water
services (%)
Use of basic sanitation
services (%)
Immunization coverage (%) Pneumonia Diarrhoea Malaria
BCG DTP1β DTP3β polio3 MCV1 MCV2^ HepB3 Hib3 rota PCV3
Protection at birth (PAB)
against tetanusλ
Care seeking for children
with symptoms of pneumonia
(%)
Treatment with oral rehydra-tion salts (ORS) (%)
Care seeking for
children with fever
(%)
Children sleep-
ing under
ITNs (%)
House-holds
with at least one ITN (%)2015 2015
total urban rural total urban rural 2016 2011–2016*
Netherlands 100 100 100 98 98 100 – 98 95 95 94 91 93 95 0 94 – – – – – –New Zealand 100 100 100 100 100 100 – 92 92 92 92 89 92 92 66 93 – – – – – –Nicaragua 82 97 61 76 86 63 98 99 98 99 99 0 98 98 98 98 85 58 x 65 – – –Niger 46 89 36 13 44 6 77 87 67 67 74 37 67 67 61 64 85 59 41 51 20 61Nigeria 67 82 54 33 39 27 64 64 49 49 51 0 49 49 0 26 63 35 34 66 44 69Niue 98 – – 97 – – 99 99 99 99 99 99 99 99 0 99 – – – – – –Norway 100 100 100 98 98 98 – 99 96 96 96 91 0 96 0 94 – – – – – –Oman 91 95 78 99 99 99 99 99 99 99 99 99 99 99 0 99 98 56 59 – – –Pakistan 89 92 87 58 74 48 85 79 72 72 61 53 72 72 0 72 80 64 38 65 0 x 1Palau 100 100 97 100 100 100 – 99 98 98 96 95 98 98 98 98 – – – – – –Panama 95 99 87 77 86 59 99 96 73 72 90 92 73 73 92 83 – 82 52 – – –Papua New Guinea 37 84 29 19 55 13 89 87 72 73 70 0 66 72 0 20 75 63 x – – – –Paraguay 99 99 98 91 98 81 99 99 93 89 99 92 93 93 92 99 85 – – – – –Peru 90 95 72 77 82 58 90 94 89 88 88 66 89 89 87 86 85 62 32 61 – –Philippines 91 96 86 75 79 72 76 87 86 72 80 66 86 86 0 36 90 64 49 50 – –Poland 98 99 96 98 98 98 94 99 98 92 96 94 96 98 0 0 – – – – – –Portugal 100 100 100 99 99 100 32 99 98 98 98 95 98 98 0 0 – – – – – –Qatar 100 – – 100 – – 97 99 98 98 99 92 98 98 99 97 – – – – – –Republic of Korea 100 – – 100 – – 97 98 98 98 98 97 98 98 0 98 – – – – – –Republic of Moldova 87 96 79 78 89 70 97 94 89 91 88 95 90 89 70 77 – 79 42 – – –Romania 100 100 100 82 93 68 84 96 89 89 86 76 90 89 0 0 – – – – – –Russian Federation 96 99 90 89 93 76 96 97 97 97 98 97 97 0 0 35 – – – – – –Rwanda 57 77 49 62 57 64 99 99 98 99 95 90 98 98 98 98 90 54 28 57 68 81Saint Kitts and Nevis – – – – – – 96 99 97 99 98 97 98 98 0 0 – – – – – –Saint Lucia 98 98 98 91 86 92 96 95 95 95 99 88 95 95 0 0 – – – – – –Saint Vincent and the Grenadines 95 – – 87 – – 99 99 98 97 99 99 98 99 0 0 – – – – – –Samoa 96 99 95 97 98 96 76 95 62 57 68 44 55 55 0 0 – 78 63 59 – –San Marino 100 – – 100 – – – 78 66 66 62 36 66 65 0 12 – – – – – –Sao Tome and Principe 80 83 74 40 47 28 92 97 96 96 93 76 96 96 24 96 99 69 49 66 61 78Saudi Arabia 100 – – 100 – – 98 98 98 97 98 96 98 98 95 98 – – – – – –Senegal 75 91 63 48 66 35 97 96 93 92 93 75 93 93 93 93 91 48 32 49 55 77Serbia 91 88 95 95 98 91 98 97 92 93 82 90 91 92 0 0 – 90 x 36 x – – –Seychelles 96 – – 100 – – 99 98 96 96 97 99 97 96 0 0 100 – – – – –Sierra Leone 58 75 47 15 24 8 92 97 84 84 83 50 84 84 95 84 90 72 85 72 49 64Singapore 100 100 – 100 100 – 99 98 97 96 95 88 96 96 57 78 – – – – – –Slovakia 98 99 97 99 99 98 0 99 96 96 95 97 96 96 0 96 – – – – – –Slovenia 100 100 99 99 99 99 – 98 94 94 92 93 0 94 0 50 – – – – – –Solomon Islands 64 90 56 31 76 18 98 99 99 99 99 0 99 99 0 87 85 79 37 61 70 86Somalia 40 70 20 16 28 8 37 52 42 47 46 0 42 42 0 0 67 13 x 13 x – 11 x 12 xSouth Africa 85 97 63 73 76 69 74 78 66 66 75 70 66 66 73 69 80 88 51 68 – –South Sudan 50 60 48 10 28 6 37 35 26 31 20 0 26 26 0 0 75 48 x 39 x 57 46 66Spain 100 100 100 100 100 100 – 99 97 97 97 95 97 97 0 0 – – – – – –Sri Lanka 92 96 91 94 89 95 99 99 99 99 99 99 99 99 0 0 95 58 x 51 x 85 x 3 x 5 xState of Palestine 88 86 94 96 95 99 99 99 99 99 99 99 99 99 0 99 – 77 32 – – –Sudan 59 73 52 35 58 23 96 97 93 93 86 69 93 93 90 93 77 48 20 – 30 x 25 xSuriname 95 98 88 79 88 61 – 92 91 91 97 44 91 91 0 0 93 76 x 42 x – 43 x 61 xSwaziland 68 95 60 58 58 58 97 96 90 90 89 89 90 90 95 90 90 60 84 63 2 x 10 xSweden 100 100 100 99 99 100 26 99 98 98 97 95 67 98 0 97 – – – – – –Switzerland 100 100 100 100 100 100 – 99 97 97 94 89 0 97 0 81 – – – – – –Syrian Arab Republic 97 99 94 93 96 89 66 61 42 48 62 52 50 42 0 0 91 77 x 50 x – – –Tajikistan 74 92 68 95 94 96 98 98 96 97 97 97 97 97 96 0 – 63 60 57 1 x 2 xThailand 98 99 97 95 94 96 99 99 99 99 99 95 99 0 0 0 95 80 73 76 – –The former Yugoslav Republic of Macedonia 97 96 98 91 97 83 99 97 95 95 82 93 94 94 0 0 – 93 x 62 – – –
Timor-Leste 70 91 60 44 73 30 85 95 85 83 78 22 85 85 0 0 81 71 x 71 x 73 x 41 x 41 xTogo 63 90 45 14 28 5 79 93 89 89 87 0 89 89 90 89 83 49 19 58 43 65Tokelau 100 – 100 93 – 93 – – – – – – – – – – – – – – – –Tonga 100 100 100 93 97 92 80 83 78 80 84 85 78 78 0 0 – – – 64 – –Trinidad and Tobago 97 – – 92 – – – 97 97 84 86 65 97 97 0 91 – 74 x – – – –Tunisia 94 100 83 93 98 83 95 99 98 98 96 97 98 98 0 0 96 60 65 – – –Turkey 99 99 100 96 99 89 96 99 98 98 98 85 98 98 0 98 90 – – – – –Turkmenistan 94 91 98 97 94 99 98 99 98 98 99 99 98 98 0 0 – 59 47 – – –Turks and Caicos Islands 94 – – 88 – – – – – – – – – – – – – – – – – –Tuvalu 99 100 99 91 92 91 98 99 94 94 96 92 94 94 0 0 – – 44 x 79 x – –
TABLE 3. HEALTH

165TABLE 3. HEALTH
Countries and areas
Use of basic drinking water
services (%)
Use of basic sanitation
services (%)
Immunization coverage (%) Pneumonia Diarrhoea Malaria
BCG DTP1β DTP3β polio3 MCV1 MCV2^ HepB3 Hib3 rota PCV3
Protection at birth (PAB)
against tetanusλ
Care seeking for children
with symptoms of pneumonia
(%)
Treatment with oral rehydra-tion salts (ORS) (%)
Care seeking for
children with fever
(%)
Children sleep-
ing under
ITNs (%)
House-holds
with at least one ITN (%)2015 2015
total urban rural total urban rural 2016 2011–2016*
Uganda 39 73 32 19 28 17 93 89 78 82 82 0 78 78 0 78 87 80 47 81 62 78Ukraine 98 97 100 96 97 93 75 42 19 56 42 31 26 47 0 0 – 92 59 – – –United Arab Emirates 100 100 100 100 100 100 99 99 99 99 99 99 99 99 92 99 – – – – – –United Kingdom 100 100 100 99 99 99 – 98 94 94 92 89 0 94 90 92 – – – – – –United Republic of Tanzania 50 79 37 24 37 17 99 99 97 93 90 71 97 97 96 96 90 55 45 50 54 66United States 99 100 97 100 100 100 – 97 95 94 92 0 93 93 73 93 – – – – – –Uruguay 99 100 94 96 96 95 98 97 95 95 95 92 95 95 0 94 – 91 – – – –Uzbekistan – 99 – 100 100 100 99 99 99 99 99 99 99 99 99 99 – 68 x 28 x – – –Vanuatu 91 99 87 53 61 51 73 75 64 65 53 0 64 64 0 0 78 72 48 57 51 83Venezuela (Bolivarian Republic of) 97 99 86 95 98 72 99 98 84 82 88 53 84 84 47 7 75 72 x 38 x – – –Viet Nam 91 92 91 78 91 72 95 96 96 95 99 95 96 96 0 0 94 81 51 – 9 10Yemen 70 85 63 60 90 44 73 76 71 65 70 49 71 71 59 71 70 34 25 33 – –Zambia 61 86 44 31 49 19 99 99 91 87 93 58 91 91 90 90 85 70 64 75 41 68Zimbabwe 67 94 54 39 54 31 95 94 90 90 95 63 90 90 91 90 80 51 41 50 9 48
SUMMARYEast Asia and Pacific 94 96 91 77 87 63 93 97 94 93 93 87 90 38 1 11 89 ** 72 ** 47 ** 67 ** – –Europe and Central Asia 98 99 94 96 98 92 91 95 92 94 93 88 81 76 22 62 – – – – – –
Eastern Europe and Central Asia 95 98 90 93 95 87 95 93 90 93 93 88 90 61 16 54 – – – – – –Western Europe 100 100 99 99 99 99 66 98 96 95 93 88 69 95 30 71 – – – – – –
Latin America and Caribbean 96 99 86 86 90 68 95 94 90 92 92 73 89 89 77 81 89 72 48 – – –Middle East and North Africa 93 96 87 89 94 81 94 91 88 88 89 87 88 88 29 32 84 65 27 – – –North America 99 100 97 100 100 100 – 97 95 94 92 8 90 93 67 92 – – – – – –South Asia 88 93 86 46 65 37 89 89 86 84 84 72 86 80 3 22 86 69 51 61 ‡ – 5 ‡Sub-Saharan Africa 58 82 43 28 42 20 80 83 74 73 72 24 74 74 45 65 80 47 38 57 48 66
Eastern and Southern Africa 53 82 40 30 48 21 84 88 80 80 76 36 80 80 66 76 82 56 42 56 48 62West and Central Africa 62 82 46 27 37 19 76 77 67 65 67 11 67 67 25 54 77 39 34 57 48 70
Least developed countries 62 83 52 32 46 26 84 87 80 78 77 37 80 80 42 72 84 49 44 53 46 60World 89 95 80 68 83 50 88 91 86 85 85 64 84 70 25 42 84 ** 62 ** 44 ** 59 ‡** – –
For a complete list of countries and areas in the regions, subregions and country categories, see page 150 or visit <data.unicef.org/regionalclassifications>.It is not advisable to compare data from consecutive editions of The State of the World’s Children.
Population using basic drinking water services – Percentage of the population using an improved drinking water source, where collection time is not more than 30 minutes for a round trip including queuing (improved sources include: piped water; boreholes or tubewells; protected dug wells; protected springs; rainwater; and packaged or delivered water.Population using basic sanitation services – Percentage of the population using an improved sanitation facility that is not shared with other households (improved facilities include: flush/pour flush to piped sewerage systems, septic tanks or pit latrines; ventilated improved pit latrines; composting toilets or pit latrines with slabs.EPI – Expanded Programme on Immunization: The first diseases targeted by the EPI were diphtheria, pertussis (whooping cough) and tetanus (DPT); measles; poliomyelitis; and tuberculosis (TB). Additional vaccines have been added to the original six recommended in 1974 and include vaccines to protect against hepatitis B (HepB), and Haemophilus influenzae type b (Hib). Pneumococcal conjugate vaccine (PCV) and rotavirus vaccine, also recommended by the WHO, are increasingly being added to national schedules.BCG – Percentage of live births who received bacille Calmette-Guérin (vaccine against tuberculosis).DTP1 – Percentage of surviving infants who received the first dose of diphtheria, pertussis and tetanus vaccine.DTP3 – Percentage of surviving infants who received three doses of diphtheria, pertussis and tetanus vaccine.Polio3 – Percentage of surviving infants who received three doses of the polio vaccine.MCV1 – Percentage of surviving infants who received the first dose of the measles-containing vaccine.MCV2 – Percentage of children who received the second dose of measles-containing vaccine as per national schedule.
HepB3 – Percentage of surviving infants who received three doses of hepatitis B vaccine.Hib3 – Percentage of surviving infants who received three doses of Haemophilus influenzae type b vaccine.Rota – Percentage of surviving infants who received the last dose of rotavirus vaccine as recommended.PCV3 – Percentage of surviving infants who received three doses of pneumococcal conjugate vaccine.Protection at birth (PAB) – Percentage of newborns protected at birth against tetanus with Tetanus Toxoid.Care-seeking for children with symptoms of pneumonia – Percentage of children under age 5 with symptoms of pneumonia (cough and fast or difficult breathing due to a problem in the chest) in the two weeks preceding the survey for whom advice or treatment was sought from a health facility or provider.Diarrhoea treatment with oral rehydration salts (ORS) – Percentage of children under age 5 who had diarrhoea in the two weeks preceding the survey and who received oral rehydration salts (ORS packets or pre-packaged ORS fluids). Care-seeking for children with fever – Percentage of children under five years of age with fever for whom advice or treatment was sought from a health facility or provider. Excludes drug vendor, stores, shops and traditional healer. In some countries, particularly non-malaria endemic countries, pharmacies have also been excluded from the calculation.Children sleeping under ITNs – Percentage of children under age 5 who slept under an insecticide-treated mosquito net the night prior to the survey.Households with at least one ITN – Percentage of households with at least one insecticide-treated mosquito net.
Use of basic drinking water services and basic sanitation services – WHO/UNICEF Joint Monitoring Programme for Water Supply, Sanitation and Hygiene (JMP).Immunization – WHO and UNICEF estimates of national immunization coverage, 2016 revision.Care-seeking for children with symptoms of pneumonia –
Demographic and Health Surveys (DHS), Multiple Indicator Cluster Surveys (MICS) and other national household surveys.Diarrhoea treatment with oral rehydration salts (ORS) – DHS, MICS and other national household surveys.Malaria prevention and treatment – DHS, MICS, Malaria Indicator Surveys (MIS) and other national household surveys.
– Data not available.x Data refer to years or periods other
than those specified in the column heading. Such data are not included in the calculation of regional and global averages. Estimates from data years prior to 2000 are not displayed.
β Coverage for DPT1 should be at least as high as DPT3. Discrepancies where DPT1 coverage is less than DPT3 reflect deficiencies in the data collection and reporting process. UNICEF and WHO are working with national and territorial systems to eliminate these discrepancies.
^ Generally, the second dose of measles containing vaccine (MCV2) is recommended for administration during the second year of life; however, in many countries, MCV2 is scheduled after the second year. For the calculation of regional aggregates, the coverage of the countries that did not report MCV2
data for 2016 is considered to be 0%, e.g. the regional coverage calculation for North America includes the United States with 0% MCV2 coverage in 2016.
λ WHO and UNICEF employ a complex process employing adminitrative data, surveys (routine and supple-mental), serosurveys, and information on other vaccines to calculate the percentage of births that can be considered as protected against tetanus because pregnant women were given two doses or more of tetanus toxoid (TT) vaccine. The complete methodology can be found at <http://who.int/immunization/monitoring_surveillance/data/en/>.
* Data refer to the most recent year available during the period specified in the column heading.
** Excludes China.‡ Excludes India.
NOTES
DEFINITIONS OF THE INDICATORS MAIN DATA SOURCES

UNICEF – THE STATE OF THE WORLD’S CHILDREN 2017
Countries and areas
HIV incidence per 1,000 uninfected population
2016
Epidemiology Intervention coverage
People living with HIV2016
New HIV infections2016
AIDS-related deaths2016
Preg-nant
women receiv-
ing ARVs
for PMTCT
(%)2016*
People living with HIV receiving antiretroviral
therapy (ART) (%)
2016*
Condom use among
adolescents with multiple partners
(%) 2011–2016*
Adolescents tested for HIV in the last
12 months and received results (%) 2011–2016*
All ages
chil-dren <5
adoles-cents 15–19 All ages
children <15
adoles-cents 10–19 All ages
children <5
adoles-cents 15–19 All ages
children <15
adoles-cents 10–19
All ages
chil-dren <15
adoles-cents 10–19 male female male female
Afghanistan 0.03 0.01 0.02 7,500 <500 <500 <1,000 <100 <100 <500 <100 <100 5 7 17 16 – – <0.1 1
Albania 0.08 0.04 0.16 1,700 – – <500 – <100 <100 – – – 30 – – – – 0 x 0 x
Algeria 0.02 0.01 0.05 13,000 <500 <500 <1,000 <100 <200 <200 <100 <100 49 76 >95 77 – – – 1
Andorra – – – – – – – – – – – – – – – – – – – –
Angola 0.94 0.76 0.81 280,000 23,000 13,000 25,000 3,600 2,400 11,000 2,100 <500 44 22 14 – 39 31 4 16
Anguilla – – – – – – – – – – – – – – – – – – – –
Antigua and Barbuda – – – – – – – – – – – – – – – – 100 x 54 x – –
Argentina 0.13 0.02 0.28 120,000 1,200 3,700 5,500 <100 <1,000 2,400 <100 <100 91 64 >95 – – – – –
Armenia 0.09 <0.01 0.18 3,300 – – <500 – <100 <200 – – – 36 – – – – 0 1
Australia 0.05 <0.01 0.02 25,000 <100 <100 1,100 <100 <100 <500 <100 <100 >95 90 93 – – – – –
Austria – – – – – – – – – – – – – – – – – – – –
Azerbaijan 0.10 0.01 0.05 9,200 <200 <100 <1,000 <100 <100 <500 <100 <100 75 30 76 36 – – – –
Bahamas – – – 8,200 – – – – – – – – – 28 – – – – – –
Bahrain 0.04 0.02 0.02 <500 – – <100 – <100 <100 – – – 42 – – – – – –
Bangladesh 0.01 <0.01 <0.01 12,000 <500 <500 1,500 <100 <100 1,000 <100 <100 17 16 39 23 – – – –
Barbados 0.58 0.08 0.33 2,600 – – <200 – <100 <100 – – – 46 – – – – – 10
Belarus 0.20 0.01 0.13 19,000 <100 <200 1,800 <100 <100 <200 <100 <100 92 45 >95 – – – 15 15
Belgium – – – – – – – – – – – – – – – – – – – –
Belize 0.75 0.46 1.48 4,300 <200 <500 <500 <100 <100 <200 <100 <100 35 32 64 – – – – 14
Benin 0.34 0.25 0.58 67,000 6,300 5,100 3,600 <500 <1,000 2,400 <500 <200 >95 57 32 – 43 38 6 7
Bhutan – – – – – – – – – – – – – – – – – – – 3 x
Bolivia (Plurinational State of) 0.10 0.01 0.21 19,000 <500 <1,000 1,100 <100 <500 <1,000 <100 <100 68 25 43 40 43 x – 1 x –
Bosnia and Herzegovina – – – – – – – – – – – – – – – – – – <0.1 <0.1
Botswana 5.52 2.30 7.18 360,000 12,000 17,000 10,000 <1,000 1,400 3,900 <500 <500 >95 83 60 77 – – – –
Brazil 0.24 0.04 0.48 830,000 11,000 30,000 48,000 <1,000 8,200 14,000 <1,000 <500 89 60 37 32 – – – –
British Virgin Islands – – – – – – – – – – – – – – – – – – – –
Brunei Darussalam – – – – – – – – – – – – – – – – – – – –
Bulgaria – – – 3,500 – – <500 – – <200 – – – 26 – – – – – –
Burkina Faso 0.19 0.18 0.47 95,000 10,000 12,000 3,400 <1,000 <1,000 3,100 <500 <500 83 60 24 – 76 x,p 57 x,p 4 x 8 x
Burundi 0.20 0.20 0.15 84,000 12,000 8,100 2,200 <500 <200 2,900 <1,000 <500 84 61 25 – – – 8 13
Cabo Verde – – – 2,800 <200 <200 <200 <100 – <100 <100 <100 >95 57 65 40 – – – –
Cambodia 0.04 0.05 0.08 71,000 4,200 3,300 <1,000 <100 <200 1,800 <100 <100 75 80 87 – – – 3 7
Cameroon 1.39 1.09 2.41 560,000 46,000 40,000 32,000 4,000 5,900 29,000 3,200 1,400 74 37 18 – 70 52 7 15
Canada – – – – – – – – – – – – – – – – – – – –
Central African Republic 1.80 0.80 1.51 130,000 9,200 8,700 8,700 <1,000 <1,000 7,300 <1,000 <500 81 24 18 25 50 x 28 x 7 x 15 x
Chad 0.34 0.38 0.38 110,000 11,000 7,600 4,800 <1,000 <1,000 2,800 <1,000 <500 63 39 14 – – 54 2 5
Chile 0.28 0.08 0.59 61,000 <500 2,200 5,000 <100 <1,000 – – – 38 53 35 7 – – – –
China – – – – – – – – – – – – – – – – – – – –
Colombia 0.12 0.01 0.22 120,000 <1,000 3,500 5,600 <100 <1,000 2,800 <100 <100 >95 – – – – 45 x – 8 x
Comoros 0.01 0.01 0.02 <200 – – <100 – <100 <100 – – – 35 – – 51 p – 3 2
Congo 1.65 1.39 1.38 91,000 6,000 4,100 7,600 1,100 <1,000 3,800 <1,000 <200 16 23 25 – 56 46 4 8
Cook Islands – – – – – – – – – – – – – – – – – – – –
Costa Rica 0.19 0.02 0.36 13,000 <100 <500 <1,000 <100 <200 <500 <100 <100 65 49 80 – – 59 p – 9
Côte d'Ivoire 0.86 0.87 0.60 460,000 36,000 25,000 20,000 3,300 1,500 25,000 2,600 1,100 73 41 25 – 70 32 5 10
Croatia 0.02 <0.01 0.05 1,500 – – <100 – <100 <100 – – – 70 – – – – – –
Cuba 0.29 0.05 0.68 25,000 <200 1,100 3,300 <100 <500 <200 <100 <100 63 70 24 9 – 79 p 16 19
Cyprus – – – – – – – – – – – – – – – – – – – –
Czechia 0.04 <0.01 0.08 3,400 – – <500 – <100 <100 – – – 52 – – – – – –
Democratic People's Republic of Korea
– – – – – – – – – – – – – – – – – – – –
Democratic Republic of the Congo
0.17 0.21 0.24 370,000 48,000 32,000 13,000 2,900 2,100 19,000 2,800 1,400 70 42 30 – 17 12 1 5
Denmark – – – – – – – – – – – – – – – – – – – –
Djibouti 0.58 0.68 0.40 8,600 <1,000 <1,000 <500 <100 <100 <1,000 <100 <100 35 26 9 10 – – – –
Dominica – – – – – – – – – – – – – – – – 74 x 86 x – –
Dominican Republic 0.24 0.07 0.52 67,000 1,700 3,100 2,500 <100 <500 2,200 <100 <100 83 46 45 30 – 40 – 11
Ecuador – – – 33,000 <500 1,400 1,900 <100 – <1,000 <100 <100 >95 52 >95 – – – – –
Egypt 0.02 <0.01 0.04 11,000 <500 <1,000 1,600 <100 <500 <500 <100 <100 18 27 38 – – – – –
El Salvador 0.16 0.09 0.31 24,000 <500 <1,000 <1,000 <100 <200 <1,000 <100 <100 44 48 50 – – 31 p 8 8
Equatorial Guinea 2.71 1.35 2.36 35,000 2,400 1,300 2,300 <200 <200 <1,000 <200 <100 90 43 16 – 31 17 7 27
Eritrea 0.15 0.22 0.11 15,000 1,500 1,300 <1,000 <200 <100 <1,000 <200 <100 37 59 34 – – – – –
Estonia – – – – – – – – – – – – – – – – – – – –
Ethiopia 0.33 0.26 0.23 710,000 62,000 67,000 30,000 3,800 2,700 20,000 2,900 2,500 69 59 35 – 57 p – 9 12
Fiji – – – <1,000 – – <200 – – <100 – – – 32 – – – – – –
TABLE 4. HIV/AIDS

167
Countries and areas
HIV incidence per 1,000 uninfected population
2016
Epidemiology Intervention coverage
People living with HIV2016
New HIV infections2016
AIDS-related deaths2016
Preg-nant
women receiv-
ing ARVs
for PMTCT
(%)2016*
People living with HIV receiving antiretroviral
therapy (ART) (%)
2016*
Condom use among
adolescents with multiple partners
(%) 2011–2016*
Adolescents tested for HIV in the last
12 months and received results (%) 2011–2016*
All ages
chil-dren <5
adoles-cents 15–19 All ages
children <15
adoles-cents 10–19 All ages
children <5
adoles-cents 15–19 All ages
children <15
adoles-cents 10–19
All ages
chil-dren <15
adoles-cents 10–19 male female male female
Finland – – – – – – – – – – – – – – – – – – – –
France 0.09 0.01 0.25 180,000 <500 2,800 6,000 <100 <1,000 <1,000 <100 <100 >95 78 >95 – – – – –
Gabon 0.92 0.95 1.57 48,000 3,700 2,900 1,700 <500 <500 1,500 <500 <100 76 63 39 61 77 58 6 20
Gambia 0.65 0.47 0.23 20,000 1,600 <1,000 1,300 <200 <100 1,100 <200 <100 69 30 33 – – – 2 6
Georgia 0.28 0.06 0.15 12,000 <100 <100 1,100 <100 <100 <500 <100 <100 46 32 50 62 – – – 2 x
Germany – – – – – – – – – – – – – – – – – – – –
Ghana 0.78 0.79 0.83 290,000 32,000 23,000 20,000 3,000 2,200 15,000 2,500 1,100 56 34 15 – – 22 p 1 5
Greece – – – – – – – – – – – – – – – – – – – –
Grenada – – – – – – – – – – – – – – – – 80 x 92 x – –
Guatemala 0.18 0.15 0.35 46,000 1,800 2,300 2,900 <500 <1,000 1,600 <200 <100 19 36 42 25 66 38 2 5
Guinea 0.67 0.68 1.08 120,000 10,000 8,700 8,300 1,300 1,400 5,800 <1,000 <500 43 35 18 – 46 p 30 1 3
Guinea-Bissau 0.72 0.72 0.56 36,000 4,200 2,100 1,300 <500 <200 2,000 <500 <200 85 33 15 – 60 41 2 5
Guyana 0.77 0.32 1.62 8,500 <500 <1,000 <1,000 <100 <200 <200 <100 <100 66 58 69 – 83 p – 10 16
Haiti 0.77 0.50 0.59 150,000 7,200 6,200 7,900 <1,000 <1,000 4,600 <500 <200 71 55 49 53 58 42 4 9
Holy See – – – – – – – – – – – – – – – – – – – –
Honduras 0.11 0.05 0.21 21,000 <1,000 1,300 <1,000 <100 <200 <1,000 <100 <100 54 51 69 60 73 39 3 10
Hungary – – – – – – – – – – – – – – – – – – – –
Iceland – – – – – – – – – – – – – – – – – – – –
India 0.06 – – 2,100,000 130,000 130,000 80,000 9,100 16,000 62,000 7,000 3,100 41 49 33 – 39 x – 0 x 1 x
Indonesia 0.19 0.13 0.29 620,000 14,000 17,000 48,000 3,200 6,300 38,000 1,900 <500 14 13 21 – – – – –
Iran (Islamic Republic of) 0.06 0.01 0.03 66,000 1,000 <1,000 5,000 <100 <200 4,000 <100 <100 51 14 28 19 – – – –
Iraq – – – – – – – – – – – – – – – – – – – 0
Ireland 0.06 <0.01 0.03 6,200 <100 <100 <500 <100 <100 – – – >95 77 >95 – – – – –
Israel – – – – – – – – – – – – – – – – – – – –
Italy 0.06 0.02 0.04 130,000 <1,000 <500 3,600 <100 <200 – – – 58 80 94 – – – – –
Jamaica – – – 30,000 <500 1,300 1,700 <100 – 1,300 <100 <100 >95 35 >95 – 75 56 p 20 35
Japan – – – – – – – – – – – – – – – – – – – –
Jordan <0.01 <0.01 0.01 <500 – – <100 – <100 <100 – – – 55 – – – – – –
Kazakhstan 0.16 0.03 0.08 26,000 <500 <500 2,900 <100 <100 <1,000 <100 <100 87 31 89 >95 94 p – – 11
Kenya 1.46 0.87 2.69 1,600,000 120,000 140,000 62,000 6,100 14,000 36,000 4,800 3,300 80 64 65 – 64 26 27 35
Kiribati – – – – – – – – – – – – – – – – 29 x – – –
Kuwait 0.02 0.01 0.03 <500 – – <100 – <100 <100 – – – 80 – – – – – –
Kyrgyzstan 0.13 0.02 0.07 8,500 <200 <200 <1,000 <100 <100 <500 <100 <100 – 28 88 >95 – – – 11
Lao People's Democratic Republic
0.10 0.10 0.10 11,000 <1,000 <500 <1,000 <100 <100 <500 <100 <100 50 41 34 – – – 1 1
Latvia 0.23 0.02 0.63 6,600 <100 <200 <500 <100 <100 <500 <100 <100 >95 26 93 – – – – –
Lebanon 0.02 0.02 0.05 2,200 – – <200 – <100 <100 – – – 51 – – – – – –
Lesotho 12.68 7.57 13.73 330,000 – – 21,000 – 2,900 9,900 – – 66 53 – – 80 58 25 41
Liberia 0.66 0.47 1.49 43,000 4,200 5,000 2,900 <500 <1,000 2,800 <500 <500 70 19 11 – 22 p 27 4 13
Libya – – – – – – – – – – – – – – – – – – – –
Liechtenstein – – – – – – – – – – – – – – – – – – – –
Lithuania 0.09 <0.01 0.05 2,900 – – <500 – <100 <200 – – – 23 – – – – – –
Luxembourg 0.18 0.03 0.40 – – – <200 <100 <100 <100 <100 <100 56 – – – – – – –
Madagascar 0.18 0.09 0.37 31,000 1,900 3,200 4,300 <500 <1,000 1,600 <500 <100 3 5 2 52 5 6 p 1 2
Malawi 2.29 1.61 2.58 1,000,000 110,000 90,000 36,000 4,300 4,800 24,000 4,100 3,200 84 66 49 – 59 44 22 32
Malaysia 0.19 0.01 0.07 97,000 <500 <1,000 5,700 <100 <200 7,000 <100 <100 73 37 >95 71 – – – –
Maldives – – – – – – – – – – – – – – – – – – – –
Mali 0.33 0.51 0.62 110,000 14,000 9,900 5,900 1,600 1,200 6,100 <1,000 <500 35 35 21 7 47 26 1 8
Malta – – – <500 – – <100 – – <100 – – – 75 – – – – – –
Marshall Islands – – – – – – – – – – – – – – – – – – – –
Mauritania – – – 11,000 <1,000 <1,000 <500 <100 – <1,000 <100 <100 34 23 23 15 – – – –
Mauritius – – – – – – – – – – – – – – – – – – – –
Mexico 0.10 0.02 0.19 220,000 2,500 7,200 12,000 <500 2,200 4,200 <200 <100 58 60 74 28 – 36 p – 7
Micronesia (Federated States of) – – – – – – – – – – – – – – – – – – – –
Monaco – – – – – – – – – – – – – – – – – – – –
Mongolia 0.01 <0.01 0.02 <500 – – <100 – <100 <100 – – – 33 – – 78 p – – –
Montenegro 0.11 0.05 0.30 <500 – – <100 – <100 <100 – – – 60 – – 64 p – <0.1 0
Montserrat – – – – – – – – – – – – – – – – – – – –
Morocco 0.03 0.01 0.06 22,000 <500 <1,000 <1,000 <100 <200 <1,000 <100 <100 62 48 >95 – – – – –
Mozambique 3.63 2.77 3.03 1,800,000 200,000 120,000 83,000 13,000 9,000 62,000 9,200 4,400 80 54 38 – 39 43 p 10 25
Myanmar 0.22 0.12 0.49 230,000 9,300 11,000 11,000 <1,000 2,300 7,800 <500 <200 87 55 78 – – – 2 1
Namibia 4.37 1.32 5.31 230,000 15,000 13,000 9,600 <500 1,300 4,300 <500 <500 >95 64 66 – 75 61 14 29
Nauru – – – – – – – – – – – – – – – – – – – –
Nepal 0.03 0.02 0.02 32,000 1,200 <1,000 <1,000 <100 <100 1,700 <100 <100 64 40 83 – – – 3 3
TABLE 4. HIV/AIDS

UNICEF – THE STATE OF THE WORLD’S CHILDREN 2017
Countries and areas
HIV incidence per 1,000 uninfected population
2016
Epidemiology Intervention coverage
People living with HIV2016
New HIV infections2016
AIDS-related deaths2016
Preg-nant
women receiv-
ing ARVs
for PMTCT
(%)2016*
People living with HIV receiving antiretroviral
therapy (ART) (%)
2016*
Condom use among
adolescents with multiple partners
(%) 2011–2016*
Adolescents tested for HIV in the last
12 months and received results (%) 2011–2016*
All ages
chil-dren <5
adoles-cents 15–19 All ages
children <15
adoles-cents 10–19 All ages
children <5
adoles-cents 15–19 All ages
children <15
adoles-cents 10–19
All ages
chil-dren <15
adoles-cents 10–19 male female male female
Netherlands 0.03 <0.01 0.07 23,000 <100 <500 <500 <100 <100 <200 <100 <100 >95 80 >95 – – – – –
New Zealand – – – – – – – – – – – – – – – – – – – –
Nicaragua 0.06 0.01 0.13 8,900 <200 <500 <500 <100 <100 <500 <100 <100 >95 43 71 33 – – – –
Niger 0.09 0.13 0.18 48,000 5,800 4,400 1,800 <1,000 <500 3,400 <500 <500 52 32 17 14 – – 2 4
Nigeria 1.23 1.19 2.18 3,200,000 270,000 240,000 220,000 37,000 40,000 160,000 24,000 7,900 32 30 21 – 46 p 38 2 4
Niue – – – – – – – – – – – – – – – – – – – –
Norway – – – – – – – – – – – – – – – – – – – –
Oman – – – – – – – – – – – – – – – – – – – –
Pakistan 0.10 0.04 0.05 130,000 3,300 2,300 19,000 <1,000 <1,000 5,500 <500 <100 4 7 10 85 – – – –
Palau – – – – – – – – – – – – – – – – – – – –
Panama 0.34 0.08 0.70 21,000 – – 1,300 – <500 <1,000 – – – 54 – – – – – –
Papua New Guinea 0.37 0.42 0.27 46,000 3,400 2,000 2,800 <500 <500 1,100 <500 <100 33 52 37 – – – – –
Paraguay 0.20 0.05 0.38 19,000 <500 <1,000 1,300 <100 <500 <1,000 <100 <100 71 35 55 25 – 50 x – –
Peru – – – 70,000 1,300 2,400 2,700 <100 – 2,200 <100 <100 85 60 73 15 – 20 – –
Philippines 0.11 0.01 0.25 56,000 <500 5,200 10,000 <200 2,400 <1,000 <100 <100 12 32 10 3 – – – <0.1
Poland – – – – – – – – – – – – – – – – – – – –
Portugal – – – – – – – – – – – – – – – – – – – –
Qatar 0.02 0.03 0.04 <100 – – <100 – <100 <100 – – – 86 – – – – – –
Republic of Korea – – – – – – – – – – – – – – – – – – – –
Republic of Moldova 0.38 0.06 0.19 15,000 <200 <200 1,600 <100 <100 <500 <100 <100 >95 29 83 55 – – 6 10
Romania 0.04 <0.01 0.10 16,000 <100 <500 <1,000 <100 <200 <200 <100 <100 >95 68 >95 66 – – – –
Russian Federation – – – – – – – – – – – – – – – – – – – –
Rwanda 0.70 0.50 0.85 220,000 16,000 16,000 7,500 <1,000 <1,000 3,300 <1,000 <500 82 80 55 – – – 22 27
Saint Kitts and Nevis – – – – – – – – – – – – – – – – 54 x 50 x – –
Saint Lucia – – – – – – – – – – – – – – – – – – – 12
Saint Vincent and the Grenadines
– – – – – – – – – – – – – – – – – – – –
Samoa – – – – – – – – – – – – – – – – – – 1 x 0 x
San Marino – – – – – – – – – – – – – – – – – – – –
Sao Tome and Principe – – – – – – – – – – – – – – – – 79 – 8 22
Saudi Arabia 0.02 0.01 0.01 8,200 <500 <200 <500 <100 <100 <500 <100 <100 39 60 48 >95 – – – –
Senegal 0.08 0.16 0.12 41,000 4,800 2,900 1,100 <500 <200 1,900 <500 <200 55 52 26 31 – – 6 10
Serbia 0.03 0.01 0.06 2,700 – – <500 – <100 <100 – – – 62 – – 63 x – 1 x 1 x
Seychelles – – – – – – – – – – – – – – – – – – – –
Sierra Leone – – – 67,000 4,400 5,000 5,300 <500 – 2,800 <500 <200 87 26 18 – 24 10 3 11
Singapore – – – – – – – – – – – – – – – – – – – –
Slovakia 0.02 <0.01 0.04 <1,000 – – <200 – <100 <100 – – – 59 – – – – – –
Slovenia 0.03 <0.01 0.06 <1,000 – – <100 – <100 <100 – – – – – – – – – –
Solomon Islands – – – – – – – – – – – – – – – – 54 x,p 15 x,p – –
Somalia 0.17 0.18 0.13 24,000 2,500 1,400 1,800 <500 <200 1,700 <500 <100 7 11 5 – – – – –
South Africa 5.58 2.19 10.51 7,100,000 320,000 370,000 270,000 12,000 50,000 110,000 9,300 6,200 >95 56 55 – 88 – 29 38
South Sudan 1.35 1.25 1.08 200,000 18,000 10,000 16,000 2,400 1,500 13,000 1,700 <500 29 10 5 – – 6 x,p – 4 x
Spain 0.09 <0.01 0.21 140,000 <100 1,200 3,900 <100 <500 – – – >95 77 >95 – – – – –
Sri Lanka 0.03 <0.01 0.06 4,000 – – <1,000 – <100 <200 – – – 27 – – – – – –
State of Palestine – – – – – – – – – – – – – – – – – – – –
Sudan 0.13 0.10 0.26 56,000 3,000 3,800 5,000 <1,000 1,100 3,000 <500 <100 4 10 16 – – – – –
Suriname 0.62 0.17 1.35 4,900 <200 <500 <500 <100 <100 <200 <100 <100 89 48 81 36 – 86 x,p – 11 x
Swaziland 9.37 4.50 11.91 220,000 15,000 15,000 8,800 <1,000 1,400 3,900 <1,000 <500 95 79 64 91 – – 30 41
Sweden 0.06 <0.01 0.14 11,000 <100 <200 <1,000 <100 <100 <100 <100 <100 >95 83 >95 – – – – –
Switzerland – – – – – – – – – – – – – – – – – – – –
Syrian Arab Republic – – – – – – – – – – – – – – – – – – – –
Tajikistan 0.15 0.02 0.07 14,000 <500 <500 1,300 <100 <100 <1,000 <100 <100 85 30 88 90 – – – 1
Thailand 0.10 0.01 0.23 450,000 4,100 9,700 6,400 <100 <1,000 16,000 <100 <100 95 69 86 >95 – – 4 6
The former Yugoslav Republic of Macedonia
0.02 <0.01 0.03 <500 – – <100 – <100 <100 – – – 48 – – – – – –
Timor-Leste – – – – – – – – – – – – – – – – – – – –
Togo 0.59 0.65 0.49 100,000 12,000 7,600 4,100 <1,000 <500 5,100 <1,000 <500 86 51 26 27 – – 7 11
Tokelau – – – – – – – – – – – – – – – – – – – –
Tonga – – – – – – – – – – – – – – – – – – 2 0
Trinidad and Tobago 0.29 0.05 0.60 11,000 <100 <500 <500 <100 <100 <500 <100 <100 95 62 >95 – – – – –
Tunisia 0.03 0.01 0.06 2,900 – – <500 – <100 <100 – – – 29 – – – – – <0.1
Turkey – – – – – – – – – – – – – – – – – – – –
Turkmenistan – – – – – – – – – – – – – – – – – – – 5
Turks and Caicos Islands – – – – – – – – – – – – – – – – – – – –
Tuvalu – – – – – – – – – – – – – – – – – – – –
TABLE 4. HIV/AIDS

169
Countries and areas
HIV incidence per 1,000 uninfected population
2016
Epidemiology Intervention coverage
People living with HIV2016
New HIV infections2016
AIDS-related deaths2016
Preg-nant
women receiv-
ing ARVs
for PMTCT
(%)2016*
People living with HIV receiving antiretroviral
therapy (ART) (%)
2016*
Condom use among
adolescents with multiple partners
(%) 2011–2016*
Adolescents tested for HIV in the last
12 months and received results (%) 2011–2016*
All ages
chil-dren <5
adoles-cents 15–19 All ages
children <15
adoles-cents 10–19 All ages
children <5
adoles-cents 15–19 All ages
children <15
adoles-cents 10–19
All ages
chil-dren <15
adoles-cents 10–19 male female male female
Uganda 1.50 0.69 2.55 1,400,000 130,000 120,000 52,000 4,600 10,000 28,000 5,800 3,800 >95 67 47 – 52 26 28 39
Ukraine 0.38 0.17 0.57 240,000 4,000 5,100 17,000 <500 1,200 8,500 <200 <100 84 37 64 – 90 – 10 7
United Arab Emirates – – – – – – – – – – – – – – – – – – – –
United Kingdom – – – – – – – – – – – – – – – – – – – –
United Republic of Tanzania 1.19 1.28 1.04 1,400,000 110,000 98,000 55,000 10,000 5,500 33,000 6,500 3,200 84 62 48 – 45 38 13 21
United States – – – – – – – – – – – – – – – – – – – –
Uruguay – – – 12,000 <100 <500 <1,000 <100 – <500 <100 <100 83 53 >95 – – 67 p – 7
Uzbekistan – – – – – – – – – – – – – – – – – – – –
Vanuatu – – – – – – – – – – – – – – – – – – – –
Venezuela (Bolivarian Republic of)
0.21 0.10 0.44 120,000 2,500 4,400 6,500 <500 1,200 2,500 <200 <100 48 – – – – – – –
Viet Nam 0.12 0.04 0.06 250,000 5,800 3,200 11,000 <500 <500 8,000 <200 <100 66 47 84 – – – – 4
Yemen 0.04 0.02 0.08 9,900 <500 <1,000 1,100 <100 <500 <500 <100 <100 8 18 21 – – – – –
Zambia 4.08 3.28 6.46 1,200,000 94,000 95,000 59,000 8,900 11,000 21,000 5,700 2,300 83 65 52 – 38 33 19 33
Zimbabwe 3.03 1.36 3.50 1,300,000 – – 40,000 – 5,800 30,000 – – 93 75 – – 71 – 19 30
SUMMARYEast Asia and Pacific 0.07 0.03 0.11 2,800,000 48,000 60,000 160,000 5,100 15,000 100,000 3,000 <1,000 54 48 62 – – – – –
Europe & Central Asia 0.25 0.02 0.19 2,400,000 – – 220,000 – 9,900 49,000 – – – 46 – – – – – –
Eastern Europe & Central Asia 0.47 0.03 0.28 1,600,000 – – 190,000 – 7,200 41,000 – – – 29 – – – – – –
Western Europe 0.06 0.01 0.11 840,000 – – 29,000 – 2,700 8,400 – – – 77 – – – – – –
Latin America and Caribbean 0.19 0.05 0.36 2,100,000 34,000 77,000 120,000 2,600 19,000 45,000 2,000 <1,000 75 57 53 – – – – –
Middle East and North Africa 0.03 0.01 0.04 150,000 3,000 4,000 11,000 <500 1,100 6,300 <200 <100 37 33 62 – – – – –
North America – 0.01 0.24 – – – – – – – – – – – – – – – – –
South Asia 0.06 0.02 0.03 2,300,000 140,000 130,000 100,000 10,000 18,000 71,000 7,600 3,100 38 46 33 – – – – –
Sub-Saharan Africa 1.23 0.87 1.83 25,700,000 1,900,000 1,700,000 1,200,000 140,000 190,000 730,000 100,000 50,000 78 54 42 – 49 32 10 15
Eastern and Southern Africa 1.68 1.01 2.34 19,600,000 1,400,000 1,300,000 800,000 79,000 130,000 420,000 59,000 34,000 88 60 51 – 54 – 16 24
West and Central Africa 0.78 0.74 1.25 6,100,000 540,000 450,000 360,000 60,000 62,000 300,000 43,000 16,000 49 34 21 – 43 32 3 6
Least developed countries 0.54 0.46 0.70 10,800,000 980,000 800,000 490,000 69,000 68,000 320,000 52,000 27,000 81 56 40 – – – 8 13
World 0.26 0.29 0.55 36,700,000 2,100,000 2,100,000 1,800,000 160,000 260,000 1,000,000 120,000 55,000 76 53 43 – – – – –
For a complete list of countries and areas in the regions, subregions and country categories, see page 150 or visit <data.unicef.org/regionalclassifications>.It is not advisable to compare data from consecutive editions of The State of the World’s Children.
HIV incidence per 1,000 uninfected population – Estimated number of new HIV infections per 1,000 uninfected population, 2016. Data reported for children (aged <5), adolescents (aged 15–19) and all ages.People living with HIV – Estimated number of people living with HIV, 2016. Data reported for children (aged 0–14), adolescents (aged 10–19) and all ages.New HIV infections – Estimated number of new HIV infections, 2016. Data reported for children (aged <5), adolescents (aged 15–19) and all ages.AIDS-related deaths – Estimated number of AIDS-related deaths, 2016. Data reported for children (aged 0–14), adolescents (aged 10–19) and all ages.Pregnant women receiving ARVs for PMTCT – Per cent of the estimated number of pregnant women living with HIV receiving effective regimens (excludes single-dose nevirapine)
of antiretroviral medicines (ARVs) for preventing mother-to-child transmission (PMTCT) of HIV, 2016. People living with HIV receiving ART – Per cent of the estimated number of people living with HIV receiving antiretroviral therapy (ART), 2016. Data reported for children (aged 0–14), adolescents (aged 10–19) and all ages. Condom use among adolescents with multiple partners– Among adolescent males and females (aged 15–19) who reported having had more than one sexual partner in the last 12 months, the percentage who reported the use of a condom the last time they had sex with any partner, 2011–2016.Adolescents tested for HIV in the last 12 months and received results – Percentage of adolescent boys and girls (aged 15–19) who were tested for HIV in the last 12 months and received the result of the most recent test, 2011–2016.
HIV incidence per 1,000 uninfected population – UNAIDS 2017 estimates, July 2017.People living with HIV – UNAIDS 2017 estimates, July 2017.New HIV infections – UNAIDS 2017 estimates, July 2017.AIDS-related deaths – UNAIDS 2017 estimates, July 2017.Pregnant women receiving ARVs for PMTCT – UNAIDS 2017 estimates, July 2017.
People living with HIV receiving ART – UNAIDS 2017 estimates, July 2017.Condom use among adolescents with multiple partners – UNICEF global databases based on Multiple Indicator Cluster Surveys (MICS), Demographic and Health Surveys (DHS), AIDS Indicator Surveys (AIS), and other national household surveys.Adolescents tested for HIV in the last 12 months and received results – UNICEF global databases based on MICS, DHS, AIS, and other national household surveys.
– Data not available.x Data refer to years or periods other
than those specified in the column heading. Such data are not included in the calculation of regional and global averages. Estimates from years prior to 2006 are not displayed.
p Based on small denominators (typically 25–49 unweighted cases). No data based on fewer than 25 unweighted cases are displayed.
* Data refer to the most recent year available during the period specified in the column heading.
NOTES
DEFINITIONS OF THE INDICATORS MAIN DATA SOURCES
TABLE 4. HIV/AIDS

UNICEF – THE STATE OF THE WORLD’S CHILDREN 2017
Youth (15–24 years) literacy
rate (%)Number per 100
population
Pre-primary school
participation Primary school participationLower secondary school
participation
Gross enrolment ratio (%)
Gross enrolment ratio (%)
Net enrolment ratio (%)
Net attendance ratio (%)
Out-of-school rate of children of primary
school age (%)
Survival rate to last primary
grade (%) Net enrolment
ratio (%)Net attendance
ratio (%)
Countries and areas
2011–2016* 2016 2011–2016* 2011–2016* 2011–2016* 2011–2016* 2011–2016* 2011–2016* 2011–2016* 2011–2016*
male femalemobile phones
internet users male female male female male female male female male female male female male female male female
Afghanistan 62 32 66 11 – – 132 91 – – 73 53 – – – – 62 38 48 28Albania 99 99 105 66 90 87 116 112 96 95 92 93 3 5 95 96 91 90 90 x 92 xAlgeria 96 x 92 x 117 43 79 79 120 113 – – 98 97 – – 93 95 – – 82 85Andorra 100 100 87 98 – – – – – – – – – – 71 70 – – – –Angola 85 71 55 13 64 94 157 100 95 73 76 76 5 27 – – – – 32 31Anguilla – – 178 x 82 – – – – – – – – – – – – – – – –Antigua and Barbuda – – 194 73 97 95 100 94 88 86 – – 9 10 – – 78 82 – –Argentina 99 99 151 70 72 73 110 110 100 99 98 99 0 1 96 96 – – 75 77Armenia 100 100 115 62 52 53 98 98 96 96 100 99 3 4 100 99 – – 97 98Australia – – 110 88 127 123 102 102 97 97 – – 3 3 – – – – – –Austria – – 166 84 103 104 104 102 – – – – – – 99 100 – – – –Azerbaijan 100 100 106 78 24 24 107 106 95 93 69 y 67 y 5 7 100 95 85 82 – –Bahamas – – 92 80 – – – – – – – – – – – – – – – –Bahrain 99 x 98 x 217 98 56 55 101 102 96 97 86 x 87 x 2 2 99 97 90 88 – –Bangladesh 91 94 78 18 31 31 116 125 – – 90 93 – – – – 61 75 51 60Barbados – – 115 80 83 86 93 94 90 92 100 99 9 8 – – 80 87 89 89Belarus 100 x 100 x 124 71 106 101 101 101 95 96 93 90 5 4 98 99 – – 94 97Belgium – – 111 87 117 116 104 104 99 99 – – 1 1 92 95 85 87 – –Belize – – 64 45 49 50 116 110 97 95 96 97 0 1 96 94 70 73 – –Benin 64 41 80 12 24 24 134 124 100 88 77 72 0 12 59 56 49 41 40 34Bhutan 90 84 89 42 25 27 97 103 85 87 96 95 12 10 78 79 57 67 52 54Bolivia (Plurinational State of) 99 99 91 40 71 71 98 96 89 88 97 x 97 x 9 11 96 97 64 66 – –Bosnia and Herzegovina 100 100 89 69 – – – – – – 97 95 – – 96 98 – – 94 96Botswana 92 x 96 x 159 39 18 18 109 106 90 92 – – 9 8 93 95 46 57 – –Brazil 98 99 119 60 93 92 117 114 92 93 97 97 6 5 – – 76 80 – –British Virgin Islands – – 199 x 38 x – – – – – – – – – – – – – – – –Brunei Darussalam 99 100 121 75 71 73 108 108 – – – – – – 98 95 – – – –Bulgaria 98 98 127 60 84 82 98 97 94 93 – – 5 5 96 96 81 78 – –Burkina Faso 57 44 84 14 4 4 90 86 71 67 54 50 29 32 62 71 27 26 19 17Burundi 85 75 48 5 13 13 123 124 93 95 85 84 6 4 41 48 21 25 12 11Cabo Verde 98 99 122 48 74 73 113 107 97 97 – – 3 3 88 90 66 75 – –Cambodia 88 x 86 x 125 26 17 19 117 116 94 96 92 94 6 4 41 55 44 49 47 54Cameroon 85 x 76 x 68 25 38 38 123 111 97 87 87 84 0 9 65 67 44 40 51 49Canada – – 84 90 74 73 100 101 – – – – – – – – – – – –Central African Republic 49 x 27 x 25 4 6 6 107 80 79 62 78 68 21 38 47 45 16 9 17 13Chad 41 22 44 5 1 1 115 88 89 69 53 47 11 31 54 46 – – 16 11Chile 99 99 127 66 88 86 103 100 94 94 91 y 92 y 6 6 99 100 75 82 – –China 100 x 100 x 97 53 83 84 104 104 – – 97 y 97 y – – – – – – – –Colombia 98 99 117 58 85 84 115 112 91 91 94 95 7 7 86 91 72 78 74 81Comoros 74 70 58 8 20 21 107 99 81 78 84 84 17 20 65 78 38 42 45 52Congo 86 77 113 8 14 14 107 115 88 95 96 97 11 3 – – – – 65 61Cook Islands – – 56 x 54 84 97 106 99 97 93 – – 2 3 79 74 90 91 – –Costa Rica 99 99 159 66 53 52 110 109 97 96 96 96 3 4 93 95 74 76 71 73Côte d'Ivoire 59 47 126 27 7 7 99 88 84 75 79 74 16 25 85 80 39 28 26 20Croatia 100 100 104 73 64 61 98 98 89 89 – – 3 0 99 99 91 92 – –Cuba 100 100 35 39 102 103 100 95 92 92 – – 8 8 94 95 91 95 – –Cyprus 100 100 134 76 81 80 99 99 97 98 – – 2 2 98 97 94 95 – –Czechia – – 115 76 107 104 100 100 – – – – – – 99 100 – – – –Democratic People's Republic of Korea 100 x 100 x 14 0 x 51 51 – – – – 99 99 – – – – 57 57 – –
Democratic Republic of the Congo 91 80 39 6 4 4 112 102 – – 88 85 – – 56 55 – – 39 31Denmark – – 123 97 96 96 102 101 98 98 – – 1 1 100 100 89 94 – –Djibouti – – 38 13 5 5 69 62 61 54 71 y 68 y 39 46 80 71 44 37 – –Dominica – – 107 67 87 88 117 115 – – – – – – 81 77 – – – –Dominican Republic 97 98 81 61 43 45 108 99 88 86 94 96 11 12 77 81 48 58 58 72Ecuador 99 99 84 54 70 73 107 114 91 93 97 y 97 y 3 1 81 83 74 78 – –Egypt 94 90 114 39 31 30 104 104 98 98 97 97 1 1 – – 83 88 84 86El Salvador 97 98 141 29 71 73 111 107 91 92 95 96 8 7 76 80 67 72 69 73Equatorial Guinea 98 x 97 x 66 24 58 58 80 78 55 56 61 x 60 x 43 43 72 72 22 24 – –Eritrea 91 x 83 x 7 1 13 13 53 46 41 37 83 y 79 y 59 63 72 74 20 19 63 y 55 yEstonia 100 100 149 87 90 87 98 99 94 95 – – 6 4 98 98 – – – –Ethiopia 63 x 47 x 51 15 31 30 107 97 89 82 64 y 67 y 11 17 37 39 35 33 21 26Fiji – – 103 47 – – 106 105 97 98 – – 2 2 98 96 87 91 – –
TABLE 5. EDUCATION

171TABLE 5. EDUCATION
Youth (15–24 years) literacy
rate (%)Number per 100
population
Pre-primary school
participation Primary school participationLower secondary school
participation
Gross enrolment ratio (%)
Gross enrolment ratio (%)
Net enrolment ratio (%)
Net attendance ratio (%)
Out-of-school rate of children of primary
school age (%)
Survival rate to last primary
grade (%) Net enrolment
ratio (%)Net attendance
ratio (%)
Countries and areas
2011–2016* 2016 2011–2016* 2011–2016* 2011–2016* 2011–2016* 2011–2016* 2011–2016* 2011–2016* 2011–2016*
male femalemobile phones
internet users male female male female male female male female male female male female male female male female
Finland – – 134 88 79 79 102 101 99 100 – – 1 0 100 100 96 97 – –France – – 103 86 109 109 106 105 99 99 – – 1 0 – – – – – –Gabon 87 89 144 48 36 38 144 140 – – 97 98 – – – – – – 51 59Gambia 66 56 140 19 37 39 90 94 71 78 65 66 28 20 73 77 35 41 32 32Georgia 100 100 129 50 – – 116 118 – – 98 97 – – 99 99 93 91 99 y 99 yGermany – – 115 90 112 111 105 105 – – – – – – 97 96 – – – –Ghana 88 x 83 x 139 35 117 119 107 110 87 88 70 70 13 11 85 82 50 50 33 35Greece 99 99 113 69 49 49 98 97 97 96 – – 3 4 92 92 95 94 – –Grenada – – 111 56 89 83 107 103 96 95 – – 2 2 – – 79 82 – –Guatemala 95 93 115 35 44 45 104 100 86 85 94 93 12 12 75 74 47 46 54 50Guinea 57 37 85 10 15 15 99 84 81 70 63 58 16 28 67 65 35 24 32 26Guinea-Bissau 71 50 70 4 – – – – – – 62 62 – – – – – – 10 9Guyana 96 97 66 36 95 93 87 84 83 80 97 97 14 16 90 95 77 75 92 95Haiti 74 x 70 x 61 12 – – – – – – 83 84 – – – – – – 19 26Holy See – – – – – – – – – – – – – – – – – – – –Honduras 95 97 91 30 45 47 111 110 92 94 95 y 92 y 7 6 74 82 43 50 48 57Hungary – – 119 79 80 78 102 101 91 90 – – 4 4 98 98 90 89 – –Iceland – – 118 98 97 97 100 99 100 99 – – 0 1 97 99 96 98 – –India 90 82 87 30 13 12 103 115 92 93 85 x 82 x 3 2 82 81 64 69 – –Indonesia 100 100 149 25 57 59 107 104 90 89 99 99 9 10 – – 74 79 85 y 89 yIran (Islamic Republic of) 98 98 100 53 51 50 106 112 – – 96 97 – – 98 97 90 92 – –Iraq 57 49 82 21 – – – – – – 93 87 – – – – – – 51 47Ireland – – 104 82 95 99 101 102 94 95 – – 2 0 – – – – – –Israel – – 132 80 111 111 104 105 97 98 – – 3 2 100 98 – – – –Italy 100 100 140 61 100 97 101 101 98 97 – – 1 1 99 99 – – – –Jamaica – – 116 45 96 103 – – – – 97 99 – – 93 96 68 78 92 92Japan – – 130 92 – – 101 101 100 100 – – 0 0 100 100 – – – –Jordan 99 99 196 62 33 32 97 98 89 89 98 98 11 11 – – 82 83 92 94Kazakhstan 100 x 100 x 150 77 59 60 109 111 88 87 100 100 0 0 99 99 – – 99 100Kenya 87 86 81 26 77 76 109 109 83 87 84 87 16 12 – – – – 38 46Kiribati – – 51 14 – – 103 106 – – 83 87 – – – – 68 88 – –Kuwait 99 99 147 78 82 80 102 103 93 93 – – 2 1 95 96 81 88 – –Kyrgyzstan 100 x 100 x 131 35 28 28 108 107 90 88 99 99 2 3 96 97 88 87 98 98Lao People's Democratic Republic 77 67 55 22 35 36 114 109 93 92 85 85 7 8 77 80 55 57 40 44Latvia 100 100 131 80 89 88 100 99 96 96 – – 3 3 95 95 – – – –Lebanon 99 x 99 x 96 76 80 75 97 88 85 79 98 98 14 19 87 94 67 67 – –Lesotho 80 94 107 27 33 35 107 104 79 82 90 94 21 18 57 74 22 39 20 37Liberia 63 x 37 x 83 7 159 153 99 89 39 36 42 43 61 64 – – 7 6 14 15Libya – – 120 20 – – – – – – – – – – – – – – – –Liechtenstein – – 116 98 102 106 106 105 91 90 – – 3 2 – – 90 84 – –Lithuania 100 100 141 74 92 91 103 104 98 98 – – 1 0 98 98 97 96 – –Luxembourg – – 148 97 94 93 97 97 93 93 – – 4 4 82 84 83 87 – –Madagascar 78 75 42 5 17 19 149 149 – – 68 y 71 y – – 41 44 28 31 22 x 25 xMalawi 72 73 40 10 81 82 144 147 – – 93 95 – – 54 55 29 30 25 31Malaysia 98 x 98 x 141 79 92 96 102 102 98 98 – – 2 2 92 92 85 89 – –Maldives 99 99 223 59 101 102 97 – 94 96 94 95 6 4 80 84 70 67 64 x 78 xMali 61 39 120 11 4 4 79 72 59 52 55 51 36 43 64 59 33 28 34 26Malta 98 99 125 77 109 113 102 105 97 100 – – 3 0 95 98 96 96 – –Marshall Islands 98 99 29 x 30 40 41 93 93 75 79 – – 24 19 – – 58 64 – –Mauritania 66 x 48 x 87 18 9 12 100 105 77 81 58 62 22 18 65 63 22 21 21 20Mauritius 98 99 144 53 103 105 102 104 95 97 – – 5 3 96 96 82 86 – –Mexico 99 99 88 60 68 70 104 103 95 95 98 98 3 2 95 96 79 82 86 89Micronesia (Federated States of) – – 22 33 34 32 95 96 83 85 – – 17 15 – – 49 56 – –Monaco – – 86 95 – – – – – – – – – – – – – – – –Mongolia 98 x 99 x 114 22 85 86 102 100 97 96 98 99 2 3 – – – – 91 95Montenegro 99 99 167 70 57 54 95 93 93 92 98 98 6 7 80 81 93 93 93 96Montserrat – – 97 x 55 x – – – – – – – – – – – – – – – –Morocco 95 88 121 58 63 51 118 112 99 98 91 x 88 x 1 1 91 87 62 63 – –Mozambique 80 x 57 x 66 18 – – 110 101 91 87 71 72 9 13 34 32 17 19 15 17Myanmar 85 84 89 25 23 24 101 98 – – 93 92 – – – – 53 52 67 71Namibia 93 95 109 31 21 22 113 110 88 91 92 93 11 8 89 92 41 55 54 67Nauru – – 97 54 x 85 96 110 100 88 84 97 y 98 y 11 16 – – 66 71 – –

UNICEF – THE STATE OF THE WORLD’S CHILDREN 2017
Youth (15–24 years) literacy
rate (%)Number per 100
population
Pre-primary school
participation Primary school participationLower secondary school
participation
Gross enrolment ratio (%)
Gross enrolment ratio (%)
Net enrolment ratio (%)
Net attendance ratio (%)
Out-of-school rate of children of primary
school age (%)
Survival rate to last primary
grade (%) Net enrolment
ratio (%)Net attendance
ratio (%)
Countries and areas
2011–2016* 2016 2011–2016* 2011–2016* 2011–2016* 2011–2016* 2011–2016* 2011–2016* 2011–2016* 2011–2016*
male femalemobile phones
internet users male female male female male female male female male female male female male female male female
Nepal 90 80 112 20 85 83 131 141 97 97 76 76 3 3 75 78 55 53 42 46Netherlands – – 130 90 95 97 105 104 98 99 – – 2 1 – – – – – –New Zealand – – 125 88 93 93 100 99 99 99 – – 1 1 – – 97 98 – –Nicaragua 85 x 89 x 122 25 – – – – – – 71 x,y 70 x,y – – – – – – – –Niger 35 15 49 4 7 8 78 67 67 57 55 46 32 42 63 66 23 16 21 17Nigeria 76 x 58 x 82 26 – – 94 93 – – 70 66 – – – – – – 50 49Niue – – 38 x 80 x 113 125 147 120 – – 100 100 – – – – – – – –Norway – – 110 97 97 98 101 100 100 100 – – 0 0 99 100 99 99 – –Oman 99 99 159 70 55 56 107 111 95 94 97 98 2 2 98 99 81 86 – –Pakistan 80 66 71 16 77 67 100 85 79 68 67 60 21 32 64 64 58 48 36 34Palau 98 99 91 x – 71 77 100 112 74 87 – – 26 13 – – 33 38 – –Panama 98 x 97 x 172 54 48 49 104 101 94 93 97 97 6 7 85 87 71 74 78 86Papua New Guinea 69 x 64 x 49 10 – – 120 109 89 83 – – 10 16 – – 17 14 – –Paraguay 98 99 105 51 38 38 108 104 89 88 90 y 91 y 11 11 83 86 58 63 – –Peru 99 99 117 45 88 89 102 102 94 94 92 y 91 y 2 2 89 92 71 72 85 87Philippines 97 99 109 56 – – 117 117 94 98 88 x 89 x 5 1 – – 58 70 – –Poland – – 146 73 79 79 100 101 96 96 – – 3 3 98 98 93 94 – –Portugal 99 99 109 70 94 93 109 105 98 98 – – 2 2 – – – – – –Qatar 98 100 147 94 58 60 102 104 92 93 96 97 4 3 99 96 76 83 – –Republic of Korea – – 123 93 94 94 99 99 98 98 – – 1 1 99 100 98 97 – –Republic of Moldova 99 100 111 71 84 83 93 92 87 86 99 98 10 10 95 95 83 82 96 97Romania 99 99 106 60 91 91 91 89 87 87 92 y 91 y 10 10 94 94 84 83 90 y 90 yRussian Federation 100 x 100 x 163 76 88 86 100 101 96 97 – – 3 2 99 100 97 98 – –Rwanda 81 83 70 20 18 18 132 133 94 96 93 96 6 4 41 48 19 24 25 34Saint Kitts and Nevis – – 137 77 91 81 82 83 77 80 – – 21 18 96 95 80 82 – –Saint Lucia – – 95 47 56 59 – – – – 100 99 – – 90 90 74 75 95 90Saint Vincent and the Grenadines – – 103 56 93 93 106 103 94 94 – – 1 1 – – 88 89 – –Samoa 99 99 69 29 39 42 107 107 96 96 88 y 89 y 3 2 92 89 66 68 – –San Marino – – 114 50 x 106 108 94 93 93 92 – – 7 7 95 98 91 94 – –Sao Tome and Principe 97 96 85 28 52 56 118 111 96 94 94 94 3 5 – – 50 60 46 57Saudi Arabia 99 99 158 74 17 18 108 111 97 98 – – 3 2 – – 76 70 – –Senegal 61 51 99 26 14 16 78 87 68 75 53 55 30 24 56 60 39 42 27 30Serbia 100 100 121 67 59 58 101 101 96 96 99 99 1 1 100 97 97 97 97 96Seychelles 99 x 99 x 161 57 88 93 101 104 94 96 – – 5 4 – – – – – –Sierra Leone 65 51 98 12 10 11 127 128 99 99 74 78 1 1 48 48 31 29 36 36Singapore 100 100 147 81 – – – – – – – – – – – – – – – –Slovakia – – 128 80 95 93 100 99 – – – – – – 99 99 – – – –Slovenia – – 115 75 95 92 99 99 97 98 – – 3 2 99 99 95 97 – –Solomon Islands – – 70 11 100 100 115 114 70 71 65 68 30 29 68 78 23 25 – –Somalia – – 58 2 – – – – – – 24 x 19 x – – – – – – – –South Africa 99 99 142 54 77 78 102 97 – – 97 97 – – – – – – – –South Sudan 44 x 30 x 25 x 16 x 10 10 75 53 35 27 26 21 65 73 – – 1 1 6 3Spain 100 100 110 81 97 96 104 106 99 100 – – 1 0 97 98 – – – –Sri Lanka 98 x 99 x 118 32 93 93 103 101 98 96 – – 2 4 99 99 96 96 – –State of Palestine 99 99 77 61 53 52 94 94 90 91 99 99 8 7 94 99 83 87 92 97Sudan 69 x 63 x 69 28 36 48 74 67 52 55 69 67 47 44 80 79 – – 31 32Suriname 98 97 146 45 90 97 124 121 93 94 95 96 6 5 85 98 50 61 46 61Swaziland 92 x 95 x 76 29 25 26 118 108 80 79 97 98 20 20 72 77 20 31 33 48Sweden – – 127 92 94 94 121 126 99 99 – – 0 0 99 100 – – – –Switzerland – – 136 89 105 104 104 104 93 93 – – 1 0 – – 87 87 – –Syrian Arab Republic 95 x 90 x 54 32 6 6 81 79 67 66 97 x 96 x 28 30 93 93 53 52 – –Tajikistan 100 x 100 x 107 20 12 10 100 98 97 98 85 86 2 0 99 99 98 95 86 84Thailand 98 98 173 48 74 64 106 99 94 87 95 95 6 13 – – 79 79 83 86The former Yugoslav Republic of Macedonia – 98 x 101 72 36 36 94 93 91 91 98 98 9 9 97 96 78 76 86 85
Timor-Leste 80 x 79 x 125 25 18 20 137 136 94 97 71 73 5 1 81 84 39 48 30 34Togo 90 78 75 11 17 18 125 118 94 88 90 87 4 10 55 53 – – 45 40Tokelau – – 0 x 1 x 175 160 121 – – – – – – – – – – – – –Tonga 99 100 75 40 39 38 109 107 92 94 93 y 93 y 5 3 – – 78 84 – –Trinidad and Tobago – – 161 73 – – – – – – 98 x 98 x – – – – – – – –Tunisia 97 96 126 51 44 44 116 113 – – 98 98 – – 93 95 80 85 76 85Turkey 100 99 97 58 30 28 103 102 95 94 94 97 5 6 88 88 88 86 – –Turkmenistan – – 158 18 64 62 90 89 – – 98 98 – – – – – – 98 98
TABLE 5. EDUCATION

173TABLE 5. EDUCATION
Youth (15–24 years) literacy
rate (%)Number per 100
population
Pre-primary school
participation Primary school participationLower secondary school
participation
Gross enrolment ratio (%)
Gross enrolment ratio (%)
Net enrolment ratio (%)
Net attendance ratio (%)
Out-of-school rate of children of primary
school age (%)
Survival rate to last primary
grade (%) Net enrolment
ratio (%)Net attendance
ratio (%)
Countries and areas
2011–2016* 2016 2011–2016* 2011–2016* 2011–2016* 2011–2016* 2011–2016* 2011–2016* 2011–2016* 2011–2016*
male femalemobile phones
internet users male female male female male female male female male female male female male female male female
Turks and Caicos Islands – – 100 x 0 – – – – – – – – – – – – – – – –Tuvalu – – 76 46 96 93 103 104 84 85 97 x,y 99 x,y 5 2 – – 73 77 – –Uganda 86 82 55 22 11 12 109 111 92 95 86 87 8 5 21 22 – – 15 20Ukraine 100 100 133 52 86 84 103 105 95 97 100 100 4 2 68 68 91 91 98 98United Arab Emirates 94 x 97 x 204 91 83 84 117 116 94 93 – – 4 4 91 93 76 83 – –United Kingdom – – 122 95 88 88 108 108 100 100 – – 0 0 – – 96 96 – –United Republic of Tanzania 87 85 74 13 31 32 80 83 79 81 78 83 21 19 62 71 – – 25 31United States – – 127 76 72 70 100 100 93 94 – – 6 5 – – 87 90 – –Uruguay 99 99 149 66 88 89 110 107 94 94 97 98 5 6 99 100 68 73 75 77Uzbekistan 100 100 77 47 26 26 106 101 96 93 – – 2 4 99 100 94 92 – –Vanuatu – – 71 24 103 100 121 119 85 87 76 y 78 y 14 12 – – 42 48 – –Venezuela (Bolivarian Republic of) 98 99 87 60 75 76 101 99 90 90 91 x 93 x 8 8 90 90 69 74 – –Viet Nam 97 x 97 x 128 47 84 82 109 108 – – 98 98 – – 94 98 93 95 89 92Yemen – – 67 25 1 1 106 89 92 78 80 72 8 22 72 67 47 34 43 34Zambia 91 x 87 x 75 26 – – 103 104 86 88 86 88 12 10 57 54 31 30 46 51Zimbabwe 88 93 83 23 42 43 101 99 85 86 94 96 14 13 75 78 33 41 48 63
SUMMARYEast Asia and Pacific 99 97 109 52 77 77 106 105 93 ** 93 ** 97 97 6 ** 6 ** – – 71 ** 76 ** 81 ** 84 **Europe and Central Asia – – 125 74 76 75 103 103 96 96 – – 3 2 95 95 93 92 – –
Eastern Europe and Central Asia 100 99 129 64 60 59 102 102 95 94 94 95 4 4 93 93 93 92 – –Western Europe – – 122 83 97 97 105 104 98 98 – – 1 1 97 98 – – – –
Latin America and Caribbean 98 99 109 56 76 76 109 107 93 93 96 96 5 4 90 92 74 77 76 79Middle East and North Africa 91 88 112 48 35 34 106 104 93 91 94 93 6 8 91 90 74 74 72 72North America – – 123 78 72 70 100 100 93 94 – – 6 – – – 87 – – –South Asia 88 80 85 26 22 21 105 112 90 89 – – 5 6 80 79 63 66 43 44Sub-Saharan Africa 79 72 75 20 31 32 104 98 82 78 75 74 17 21 55 56 32 31 32 32
Eastern and Southern Africa 87 85 71 21 39 40 106 100 83 81 78 79 17 19 48 51 29 30 24 29West and Central Africa 69 55 80 19 20 21 101 95 – – 72 68 – – 63 63 – – 39 36
Least developed countries 80 73 68 16 23 24 108 101 82 78 76 75 17 22 52 54 41 41 33 35World 92 85 101 46 49 48 105 105 90 ** 89 ** 87 85 8 ** 9 ** 76 77 66 ** 68 ** 53 ** 54 **
For a complete list of countries and areas in the regions, subregions and country categories, see page 150 or visit <data.unicef.org/regionalclassifications>.It is not advisable to compare data from consecutive editions of The State of the World’s Children.
Youth literacy rate – Number of literate persons aged 15–24 years, expressed as a percentage of the total population in that group.Mobile phones – The number of active subscriptions to a public mobile telephone service, including the number of prepaid SIM cards active during the past three months.Internet users – The estimated number of Internet users out of the total population. This includes those using the Internet from any device (including mobile phones) in the last 12 months.Pre-primary school gross enrolment ratio – Number of children enrolled in pre-primary school, regardless of age, expressed as a percentage of the total number of children of official pre-primary school age.Primary school gross enrolment ratio – Number of children enrolled in primary school, regardless of age, expressed as a percentage of the total number of children of official primary school age.Primary school net enrolment ratio – Number of children enrolled in primary or secondary school who are of official primary school age, expressed as a percentage of the total number of children of official primary school age. Because of the inclusion of primary-school-aged children enrolled in secondary school, this indicator can also be referred to as a primary adjusted net enrolment ratio.Primary school net attendance ratio – Number of children attending primary or secondary school who are of official primary school age, expressed as a percentage of the total number of children of official primary school age. Because of the inclusion of primary-school-aged children attending secondary school, this indicator can also be referred to as a primary adjusted net attendance ratio.
Rate of out-of-school children of primary school age – Number of children of official primary school age who are not enrolled in primary or secondary school, expressed as a percentage of the population of official primary school age. Out-of-school children of primary school age – Children in the official primary school age range who are not enrolled in either primary or secondary schools. Children enrolled in pre-primary education are excluded and considered out of school.Survival rate to last primary grade – Percentage of children entering the first grade of primary school who eventually reach the last grade of primary school. Lower secondary school net enrolment ratio – Number of children enrolled in lower secondary school who are of official lower secondary school age, expressed as a percentage of the total number of children of official lower secondary school age. Lower secondary net enrolment ratio does not include lower-secondary-school-aged children enrolled in tertiary education owing to challenges in age reporting and recording at that level. Lower secondary school net attendance ratio – Number of children attending lower secondary or tertiary school who are of official lower secondary school age, expressed as a percentage of the total number of children of official lower secondary school age. Because of the inclusion of lower-secondary-school-aged children attending tertiary school, this indicator can also be referred to as a lower secondary adjusted net attendance ratio.All data refer to official International Standard Classifications of Education (ISCED) for the primary and lower secondary education levels and thus may not directly correspond to a country-specific school system.
Youth literacy – UNESCO Institute for Statistics (UIS).Mobile phone and Internet use – International Telecommunications Union, Geneva.Pre-primary, primary and lower secondary enrolment and rate of out-of-school children – UIS. Estimates based on administrative data from national Education Management Information Systems (EMIS) with UN population estimates.
Primary and lower secondary school attendance – Demographic and Health Surveys (DHS), Multiple Indicator Cluster Surveys (MICS) and other national household surveys.Survival rate to last primary grade – Administrative data: UIS; survey data: DHS, MICS and other national household surveys.
− Data not available.x Data refer to years or periods other
than those specified in the column heading. Such data are not included in the calculation of regional and global averages, with the exception of 2005–2006 data from India. Estimates from data years prior to 2000 are not displayed.
y Data differ from the standard defini-tion or refer to only part of a country. If they fall within the noted reference period, such data are included in the calculation of regional and global averages.
* Data refer to the most recent year available during the period specified in the column heading.
** Excludes China.
NOTES
MAIN DATA SOURCESDEFINITIONS OF THE INDICATORS

UNICEF – THE STATE OF THE WORLD’S CHILDREN 2017
Countries and areas
Population (thousands)Population
annual growth rate (%) Crude death rate Crude birth rate Life expectancy
Total fertility
rate
Urbanized population
(%)
Average annual growth rate of urban
population (%)2016
total under 18 under 5 1990–2016 2016–2030α 1970 1990 2016 1970 1990 2016 1970 1990 2016 2016 2016 1990–2016 2016–2030α
Afghanistan 34,656 17,744 5,233 4.0 2.1 28 16 7 52 49 33 37 50 64 4.6 27 5.5 3.6Albania 2,926 659 177 -0.4 0.0 8 6 7 32 25 12 67 72 78 1.7 58 1.5 1.4Algeria 40,606 13,495 4,699 1.7 1.3 17 6 5 47 32 23 50 67 76 2.8 71 3.0 1.7Andorra 77 13 3 1.3 0.1 – – – – – – – – – – 85 1.1 0.2Angola 28,813 15,416 5,277 3.3 3.1 27 23 9 53 53 42 37 42 62 5.7 45 5.3 4.2Anguilla 15 4 1 2.2 0.5 – – – – – – – – – – 100 2.2 0.5Antigua and Barbuda 101 30 8 1.6 0.9 7 7 6 31 19 16 66 71 76 2.1 23 0.0 0.3Argentina 43,847 13,076 3,736 1.1 0.8 9 8 8 23 22 17 66 72 77 2.3 92 1.2 0.8Armenia 2,925 685 202 -0.7 0.0 6 8 10 23 22 13 70 68 75 1.6 63 -0.9 0.1Australia 24,126 5,433 1,551 1.3 1.1 9 7 7 20 15 13 71 77 83 1.8 90 1.5 1.2Austria 8,712 1,489 412 0.5 0.2 13 11 10 16 11 10 70 76 82 1.5 66 0.5 0.6Azerbaijan 9,725 2,653 891 1.1 0.7 9 9 7 32 29 18 63 65 72 2.1 55 1.2 1.2Bahamas 391 97 28 1.6 0.8 6 5 6 26 24 14 66 71 76 1.8 83 1.8 1.1Bahrain 1,425 334 107 4.1 2.5 7 3 2 38 29 15 63 72 77 2.0 89 4.0 1.3Bangladesh 162,952 56,869 15,236 1.6 0.9 19 10 5 48 35 19 48 58 72 2.1 35 3.8 2.7Barbados 285 66 17 0.3 0.1 10 10 11 22 16 12 66 71 76 1.8 31 0.3 0.7Belarus 9,480 1,821 579 -0.3 -0.2 9 11 13 16 14 12 71 71 73 1.7 77 0.2 -0.2Belgium 11,358 2,309 643 0.5 0.4 12 11 10 14 12 11 71 76 81 1.8 98 0.5 0.3Belize 367 141 40 2.6 1.8 8 5 5 42 36 23 66 71 70 2.5 44 2.2 2.0Benin 10,872 5,379 1,775 3.0 2.6 24 15 9 47 46 37 42 54 61 5.0 44 4.1 3.4Bhutan 798 259 70 1.5 1.0 24 13 6 49 39 18 40 53 70 2.1 39 4.8 2.3Bolivia (Plurinational State of) 10,888 4,150 1,189 1.8 1.4 20 13 7 42 35 23 46 55 69 2.9 69 2.8 1.9Bosnia and Herzegovina 3,517 628 157 -0.9 -0.2 7 8 11 24 15 9 66 71 77 1.4 40 -0.6 0.6Botswana 2,250 840 259 1.9 1.6 13 8 7 46 34 24 55 62 67 2.7 58 2.8 1.4Brazil 207,653 56,235 14,919 1.3 0.6 10 7 6 35 25 14 59 65 76 1.7 86 1.8 0.8British Virgin Islands 31 9 3 2.4 1.0 – – – – – – – – – – 47 3.0 1.4Brunei Darussalam 423 120 34 1.9 1.0 6 4 4 37 29 16 67 73 77 1.9 78 2.6 1.3Bulgaria 7,131 1,183 324 -0.8 -0.7 9 12 15 16 12 9 71 71 75 1.6 74 -0.4 -0.5Burkina Faso 18,646 9,724 3,221 2.9 2.7 25 17 9 47 47 39 39 49 60 5.4 31 5.9 4.7Burundi 10,524 5,372 1,901 2.6 2.9 21 18 11 47 50 42 44 48 57 5.7 12 5.3 5.1Cabo Verde 540 200 55 1.8 1.2 14 8 6 42 40 21 54 65 73 2.3 66 3.0 1.5Cambodia 15,762 5,854 1,761 2.2 1.3 20 13 6 43 42 23 42 54 69 2.6 21 3.3 2.7Cameroon 23,439 11,578 3,804 2.7 2.4 19 15 10 45 45 36 46 52 58 4.7 55 3.9 3.2Canada 36,290 6,999 1,929 1.0 0.8 7 7 7 17 14 11 73 77 82 1.6 82 1.3 1.0Central African Republic 4,595 2,326 730 1.7 2.1 23 17 14 43 41 36 42 49 52 4.9 40 2.3 2.8Chad 14,453 7,854 2,666 3.4 2.8 23 19 13 47 51 43 41 47 53 5.9 23 3.6 4.0Chile 17,910 4,462 1,184 1.2 0.7 10 6 6 30 22 13 62 74 80 1.8 90 1.5 0.8China 1,403,500 295,112 85,866 0.7 0.2 11 7 7 36 22 12 59 69 76 1.6 57 3.7 1.6Colombia 48,653 14,055 3,712 1.3 0.6 9 6 6 38 26 15 61 68 74 1.9 77 2.0 1.3Comoros 796 369 119 2.5 2.1 19 12 7 46 43 33 46 57 64 4.3 28 2.6 2.8Congo 5,126 2,489 824 2.9 2.5 14 12 7 43 38 35 53 56 65 4.7 66 3.4 3.0Cook Islands 17 6 2 -0.2 0.2 – – – – – – – – – – 75 1.7 0.7Costa Rica 4,857 1,296 346 1.7 0.8 7 4 5 33 27 14 66 76 80 1.8 78 3.6 1.6Côte d'Ivoire 23,696 11,689 3,861 2.5 2.4 21 14 12 52 43 37 44 52 54 4.9 55 3.5 3.1Croatia 4,213 756 196 -0.5 -0.6 11 11 13 15 11 9 68 72 78 1.5 59 -0.1 0.2Cuba 11,476 2,260 636 0.3 0.0 7 7 8 29 17 11 70 75 80 1.7 77 0.4 -0.1Cyprus 1,170 241 66 1.6 0.7 7 7 7 19 19 11 73 77 81 1.3 67 1.6 0.8Czechia 10,611 1,881 534 0.1 -0.1 12 12 11 16 12 10 70 72 79 1.5 73 0.1 0.3Democratic People's Republic of Korea 25,369 6,452 1,726 0.9 0.4 10 6 9 37 21 14 60 70 72 1.9 61 1.0 0.8
Democratic Republic of the Congo 78,736 41,553 14,494 3.2 3.0 20 17 10 47 46 42 44 49 60 6.1 43 4.2 3.6Denmark 5,712 1,157 285 0.4 0.4 10 12 9 15 12 10 73 75 81 1.7 88 0.5 0.6Djibouti 942 356 102 1.8 1.3 15 11 8 45 40 23 49 57 62 2.8 77 1.8 1.3Dominica 74 22 6 0.1 0.4 – – – – – – – – – – 70 0.5 0.7Dominican Republic 10,649 3,750 1,060 1.5 0.9 11 6 6 42 30 20 58 68 74 2.4 80 2.9 1.5Ecuador 16,385 5,606 1,611 1.8 1.3 12 6 5 41 30 20 58 69 76 2.5 64 2.4 1.7Egypt 95,689 36,997 12,876 2.0 1.6 16 8 6 42 34 26 52 65 71 3.3 43 1.6 1.8El Salvador 6,345 2,153 577 0.7 0.5 13 8 7 43 31 19 55 64 74 2.1 67 1.9 1.0Equatorial Guinea 1,221 521 182 4.0 3.0 26 18 10 42 42 34 40 48 58 4.7 40 3.6 3.0Eritrea 4,955 2,397 744 1.8 2.2 21 16 7 47 42 32 43 50 65 4.1 23 4.3 4.4Estonia 1,312 247 68 -0.7 -0.3 11 13 12 15 14 11 70 69 78 1.6 67 -1.0 -0.3Ethiopia 102,403 49,500 15,177 2.9 2.2 21 18 7 48 48 32 43 47 65 4.2 20 4.6 4.3Fiji 899 303 87 0.8 0.5 8 6 7 34 29 19 60 66 70 2.5 54 1.8 0.9Finland 5,503 1,078 297 0.4 0.3 10 10 10 14 13 11 70 75 81 1.8 84 0.6 0.4France 64,721 14,080 3,842 0.5 0.3 11 9 9 17 13 12 72 77 83 2.0 80 0.8 0.7Gabon 1,980 822 274 2.8 1.9 20 11 8 37 37 30 47 61 66 3.8 87 3.4 2.2
TABLE 6. DEMOGRAPHIC INDICATORS

175
Countries and areas
Population (thousands)Population
annual growth rate (%) Crude death rate Crude birth rate Life expectancy
Total fertility
rate
Urbanized population
(%)
Average annual growth rate of urban
population (%)2016
total under 18 under 5 1990–2016 2016–2030α 1970 1990 2016 1970 1990 2016 1970 1990 2016 2016 2016 1990–2016 2016–2030α
Gambia 2,039 1,065 360 3.1 2.8 26 14 8 50 47 39 38 52 61 5.4 60 4.8 3.6Georgia 3,925 875 271 -1.2 -0.3 9 9 13 20 17 13 67 70 73 2.0 54 -1.0 -0.1Germany 81,915 13,103 3,557 0.1 0.0 12 12 11 14 10 9 71 75 81 1.5 76 0.2 0.0Ghana 28,207 12,689 4,085 2.5 2.0 16 11 8 47 39 31 49 57 63 4.0 55 4.0 2.7Greece 11,184 1,937 474 0.3 -0.3 10 9 11 18 11 8 71 77 81 1.3 78 0.7 0.2Grenada 107 34 10 0.4 0.3 9 9 7 28 28 19 64 69 74 2.1 36 0.7 0.4Guatemala 16,582 7,047 2,023 2.2 1.8 14 9 5 45 39 25 53 62 73 3.0 52 3.3 3.0Guinea 12,396 6,082 1,983 2.8 2.5 27 17 9 45 47 36 37 50 60 4.9 38 4.0 3.5Guinea-Bissau 1,816 872 291 2.2 2.3 22 17 11 43 46 37 42 49 57 4.6 50 4.5 3.2Guyana 773 277 76 0.2 0.5 9 8 8 36 28 21 62 63 67 2.5 29 0.3 1.1Haiti 10,847 4,296 1,233 1.6 1.0 18 13 9 39 37 24 47 55 63 2.9 60 4.4 2.2Holy See 1 0 0 0.2 0.0 – – – – – – – – – – 100 0.2 0.0Honduras 9,113 3,541 951 2.3 1.4 15 7 5 48 39 22 53 67 74 2.5 55 3.4 2.5Hungary 9,753 1,694 436 -0.2 -0.4 11 14 13 15 12 9 69 69 76 1.4 72 0.1 0.2Iceland 332 80 22 1.0 0.7 7 7 6 21 17 13 74 78 83 1.9 94 1.3 0.9India 1,324,171 448,314 119,998 1.6 1.0 17 11 7 39 32 19 48 58 69 2.3 33 2.5 2.2Indonesia 261,115 85,965 24,822 1.4 0.9 13 8 7 40 26 19 55 63 69 2.4 54 3.6 1.9Iran (Islamic Republic of) 80,277 22,149 6,823 1.4 0.7 16 7 5 42 33 17 51 64 76 1.7 74 2.4 1.4Iraq 37,203 17,460 5,738 2.9 2.6 12 7 5 46 38 33 58 66 70 4.4 70 2.8 2.6Ireland 4,726 1,197 344 1.1 0.7 11 9 6 22 14 14 71 75 81 2.0 64 1.6 1.3Israel 8,192 2,672 841 2.3 1.4 7 6 5 26 22 20 72 77 83 3.0 92 2.3 1.4Italy 59,430 9,761 2,482 0.2 -0.2 10 10 10 17 10 8 72 77 83 1.5 69 0.4 0.3Jamaica 2,881 820 205 0.7 0.1 8 7 7 35 25 17 68 72 76 2.0 55 1.1 0.9Japan 127,749 20,051 5,343 0.1 -0.4 7 7 11 19 10 8 72 79 84 1.5 94 0.9 -0.1Jordan 9,456 3,959 1,227 3.8 1.2 10 5 4 51 35 26 60 70 74 3.4 84 3.8 1.5Kazakhstan 17,988 5,566 1,997 0.3 0.9 9 9 9 26 23 21 63 67 70 2.6 53 0.0 1.0Kenya 48,462 23,094 7,023 2.8 2.3 15 10 6 51 42 31 52 58 67 3.9 26 4.5 4.0Kiribati 114 47 14 1.8 1.5 13 10 7 35 37 28 54 60 66 3.7 44 2.5 1.9Kuwait 4,053 989 316 2.5 1.3 6 3 3 48 23 16 66 72 75 2.0 98 2.2 2.0Kyrgyzstan 5,956 2,167 760 1.2 1.2 11 8 6 32 32 25 60 66 71 3.0 36 0.9 2.0Lao People's Democratic Republic 6,758 2,674 766 1.8 1.2 18 14 7 43 43 24 46 54 67 2.7 40 5.6 3.3Latvia 1,971 350 97 -1.2 -0.9 11 13 15 14 14 10 70 69 75 1.5 67 -1.2 -0.5Lebanon 6,007 1,743 483 3.1 -0.8 8 7 5 32 25 15 66 70 80 1.7 88 2.6 0.3Lesotho 2,204 932 286 1.2 1.2 17 10 13 43 35 28 49 59 54 3.1 28 3.8 2.6Liberia 4,614 2,249 715 3.0 2.4 24 18 8 49 45 34 39 47 63 4.6 50 2.6 3.2Libya 6,293 2,111 627 1.3 1.1 13 5 5 51 29 20 56 69 72 2.3 79 1.7 1.4Liechtenstein 38 7 2 1.0 0.6 – – – – – – – – – – 14 0.4 1.1Lithuania 2,908 519 152 -0.9 -0.5 9 11 14 17 15 11 71 71 75 1.7 67 -0.9 -0.2Luxembourg 576 115 32 1.6 1.1 12 10 7 13 12 11 70 75 82 1.6 90 1.8 1.2Madagascar 24,895 11,988 3,769 2.9 2.6 21 15 6 48 44 33 45 51 66 4.2 36 4.6 4.2Malawi 18,092 9,265 2,908 2.5 2.7 25 19 7 54 49 37 41 47 63 4.6 16 3.8 4.2Malaysia 31,187 9,350 2,612 2.1 1.2 7 5 5 34 28 17 64 71 75 2.0 75 3.7 1.8Maldives 428 117 39 2.5 1.3 21 9 3 50 41 18 44 61 77 2.1 47 4.3 2.6Mali 17,995 9,806 3,332 2.9 2.9 32 20 10 50 49 43 32 46 58 6.1 41 5.0 4.7Malta 429 75 21 0.6 0.2 9 8 9 16 15 10 71 76 81 1.5 96 0.8 0.2Marshall Islands 53 19 5 0.4 0.3 – – – – – – – – – – 73 0.9 0.9Mauritania 4,301 1,996 655 2.9 2.5 16 11 8 46 41 34 49 58 63 4.7 60 4.2 2.9Mauritius 1,262 295 68 0.7 0.1 7 6 8 29 21 11 63 69 75 1.4 40 0.3 0.3Mexico 127,540 41,600 11,581 1.5 1.0 10 5 5 44 29 18 61 71 77 2.2 80 1.9 1.2Micronesia (Federated States of) 105 43 12 0.3 0.8 9 7 6 41 34 24 62 66 69 3.1 22 -0.2 1.6Monaco 38 7 2 1.0 0.5 – – – – – – – – – – 100 1.0 0.9Mongolia 3,027 1,017 368 1.3 1.2 15 10 6 44 32 24 55 60 69 2.8 73 2.1 1.7Montenegro 629 139 36 0.1 0.0 7 7 10 22 16 11 70 75 77 1.7 64 1.2 0.2Montserrat 5 2 0 -2.8 0.3 – – – – – – – – – – 9 -4.0 1.0Morocco 35,277 11,491 3,508 1.3 1.1 14 7 5 43 29 20 53 65 76 2.5 61 2.1 1.6Mozambique 28,829 14,929 4,950 3.0 2.8 25 21 10 48 46 39 39 43 58 5.2 33 3.8 3.5Myanmar 52,885 17,485 4,538 1.0 0.8 15 10 8 39 27 18 51 59 67 2.2 35 2.3 2.0Namibia 2,480 1,076 344 2.2 1.9 15 9 7 43 38 29 52 62 64 3.4 48 4.2 3.1Nauru 11 4 1 0.8 0.1 – – – – – – – – – – 100 0.4 0.5Nepal 28,983 11,190 2,756 1.7 1.0 23 13 6 43 39 20 41 54 70 2.1 19 4.7 2.9Netherlands 16,987 3,425 894 0.5 0.3 8 9 9 18 13 11 74 77 82 1.7 91 1.6 0.5New Zealand 4,661 1,109 304 1.2 0.8 8 8 7 22 17 13 71 75 82 2.0 86 1.3 0.9Nicaragua 6,150 2,174 597 1.5 1.0 13 7 5 46 36 20 54 64 75 2.2 59 2.1 1.7Niger 20,673 11,752 4,218 3.6 3.8 28 23 10 57 56 48 36 44 60 7.2 19 4.5 5.7Nigeria 185,990 93,965 31,802 2.6 2.5 23 19 12 46 44 39 41 46 53 5.5 49 4.5 3.9
TABLE 6. DEMOGRAPHIC INDICATORS

UNICEF – THE STATE OF THE WORLD’S CHILDREN 2017
Countries and areas
Population (thousands)Population
annual growth rate (%) Crude death rate Crude birth rate Life expectancy
Total fertility
rate
Urbanized population
(%)
Average annual growth rate of urban
population (%)2016
total under 18 under 5 1990–2016 2016–2030α 1970 1990 2016 1970 1990 2016 1970 1990 2016 2016 2016 1990–2016 2016–2030α
Niue 2 1 0 -1.4 0.2 – – – – – – – – – – 43 -1.1 0.2Norway 5,255 1,130 306 0.8 0.9 10 11 8 17 14 12 74 77 82 1.8 81 1.2 1.1Oman 4,425 1,118 401 3.4 2.1 16 5 3 48 38 19 50 67 77 2.7 78 4.0 1.4Pakistan 193,203 79,005 24,963 2.2 1.7 15 11 7 43 40 28 53 60 66 3.5 39 3.0 2.6Palau 22 8 2 1.4 1.0 – – – – – – – – – – 88 2.2 1.3Panama 4,034 1,324 388 1.9 1.4 8 5 5 38 26 20 66 73 78 2.5 67 2.7 1.8Papua New Guinea 8,085 3,449 1,033 2.4 1.9 16 9 7 41 35 28 49 59 66 3.7 13 1.9 2.8Paraguay 6,725 2,404 672 1.8 1.1 7 6 6 37 34 21 65 68 73 2.5 60 2.8 1.9Peru 31,774 10,454 3,033 1.4 1.1 14 7 6 42 30 19 53 66 75 2.4 79 1.9 1.4Philippines 103,320 39,204 11,530 2.0 1.4 9 7 7 39 33 23 61 65 69 2.9 44 1.6 1.8Poland 38,224 6,785 1,819 0.0 -0.3 8 10 10 17 15 9 70 71 78 1.3 61 0.0 0.1Portugal 10,372 1,764 431 0.2 -0.3 11 10 11 21 11 8 67 74 81 1.2 64 1.4 0.6Qatar 2,570 417 130 6.5 1.6 5 2 2 36 22 10 68 75 78 1.9 99 6.5 1.0Republic of Korea 50,792 8,678 2,226 0.6 0.3 9 6 6 30 15 9 61 72 82 1.3 83 1.0 0.5Republic of Moldova 4,060 768 218 -0.3 -0.4 10 10 11 20 19 10 65 68 72 1.2 45 -1.1 -0.2Romania 19,778 3,667 944 -0.7 -0.5 10 11 13 21 14 10 68 70 75 1.5 55 -0.2 0.1Russian Federation 143,965 28,642 9,561 -0.1 -0.2 9 12 13 15 14 13 69 68 71 1.8 74 -0.1 -0.2Rwanda 11,918 5,593 1,740 1.9 2.1 20 32 6 50 47 31 44 34 67 3.9 30 8.7 4.7Saint Kitts and Nevis 55 16 5 1.1 0.7 – – – – – – – – – – 32 0.9 1.5Saint Lucia 178 43 11 1.0 0.3 9 6 8 39 28 12 63 71 75 1.5 19 -0.6 1.1Saint Vincent and the Grenadines 110 32 8 0.1 0.2 9 7 7 40 25 16 65 70 73 1.9 51 0.9 0.7Samoa 195 85 23 0.7 0.6 11 7 5 41 33 25 55 65 75 4.0 19 0.3 0.5San Marino 33 6 1 1.2 0.3 – – – – – – – – – – 94 1.2 0.3Sao Tome and Principe 200 100 31 2.2 2.1 13 10 7 41 40 34 56 62 67 4.5 66 3.8 2.6Saudi Arabia 32,276 9,641 2,966 2.6 1.4 15 5 4 47 36 20 53 69 75 2.5 83 2.7 1.3Senegal 15,412 7,616 2,544 2.7 2.6 25 11 6 50 43 36 39 57 67 4.8 44 3.2 3.5Serbia 8,820 1,780 469 -0.3 -0.4 9 10 13 19 15 11 68 71 75 1.6 56 0.2 -0.2Seychelles 94 24 8 1.1 0.3 9 7 8 35 23 16 66 71 74 2.3 54 1.5 0.9Sierra Leone 7,396 3,638 1,141 2.1 2.0 30 26 13 49 47 35 35 37 52 4.5 40 2.5 2.7Singapore 5,622 1,062 265 2.4 0.9 5 4 5 23 18 9 68 76 83 1.2 100 2.5 1.0Slovakia 5,444 996 281 0.1 -0.1 9 10 10 18 15 10 70 71 77 1.4 53 -0.1 0.1Slovenia 2,078 363 107 0.1 -0.1 10 10 10 17 11 10 69 73 81 1.6 50 0.1 0.3Solomon Islands 599 275 83 2.5 1.8 13 11 5 45 40 29 54 57 71 3.9 23 4.5 3.4Somalia 14,318 7,642 2,617 2.5 2.9 23 20 11 47 48 43 41 45 56 6.3 40 3.4 4.0South Africa 56,015 19,428 5,705 1.5 1.0 12 8 10 38 29 21 56 62 63 2.5 65 2.3 1.2South Sudan 12,231 5,944 1,925 2.9 2.5 28 21 11 51 47 36 36 44 57 4.9 19 4.4 3.8Spain 46,348 8,135 2,065 0.6 0.0 9 8 9 20 10 9 72 77 83 1.4 80 1.0 0.4Sri Lanka 20,798 6,020 1,602 0.7 0.2 8 6 7 31 21 15 64 70 75 2.0 18 0.8 1.4State of Palestine 4,791 2,231 712 3.2 2.4 13 5 3 50 46 32 56 68 73 4.0 75 3.5 2.6Sudan 39,579 18,971 5,940 2.6 2.3 15 12 7 47 42 33 52 56 64 4.5 34 3.4 3.1Suriname 558 179 50 1.2 0.7 9 7 7 37 28 18 63 67 71 2.4 66 1.2 0.7Swaziland 1,343 592 180 1.7 1.5 18 9 10 49 43 29 48 60 58 3.1 21 1.3 1.6Sweden 9,838 2,006 584 0.5 0.6 10 11 9 14 14 12 74 78 82 1.9 86 0.6 0.8Switzerland 8,402 1,499 434 0.9 0.7 9 9 8 16 12 10 73 78 83 1.5 74 0.9 1.1Syrian Arab Republic 18,430 8,231 2,100 1.5 2.6 11 5 6 46 36 21 59 71 70 2.9 58 3.0 2.6Tajikistan 8,735 3,581 1,183 1.9 1.8 12 10 5 42 41 29 60 63 71 3.4 27 1.3 2.7Thailand 68,864 14,961 3,768 0.8 0.1 10 6 8 38 19 10 59 70 75 1.5 52 2.8 1.5The former Yugoslav Republic of Macedonia 2,081 425 118 0.2 0.0 7 8 10 25 18 11 66 71 76 1.5 57 0.1 0.3
Timor-Leste 1,269 650 206 2.0 2.1 23 16 6 43 43 35 40 48 69 5.5 33 3.6 3.4Togo 7,606 3,668 1,176 2.7 2.3 19 12 9 48 42 34 47 56 60 4.5 40 3.9 3.4Tokelau 1 0 0 -0.9 0.8 – – – – – – – – – – 0 0 0Tonga 107 46 13 0.5 0.9 7 6 6 36 31 24 65 70 73 3.6 24 0.6 1.5Trinidad and Tobago 1,365 335 95 0.4 0.0 7 8 10 27 21 14 65 68 71 1.8 8 0.3 -0.4Tunisia 11,403 3,205 1,052 1.3 0.8 16 6 6 41 26 18 51 69 76 2.2 67 1.8 1.1Turkey 79,512 24,162 6,775 1.5 0.8 15 8 6 40 26 16 52 64 76 2.1 74 2.2 1.3Turkmenistan 5,663 2,021 709 1.7 1.3 12 9 7 38 35 25 58 63 68 2.9 50 1.9 1.7Turks and Caicos Islands 35 10 3 4.3 1.2 – – – – – – – – – – 93 5.1 1.3Tuvalu 11 4 1 0.8 1.0 – – – – – – – – – – 61 1.9 1.5Uganda 41,488 22,807 7,699 3.3 3.1 17 18 9 49 50 42 49 46 60 5.6 16 4.8 5.1Ukraine 44,439 7,948 2,334 -0.6 -0.5 9 13 15 15 13 11 71 70 72 1.5 70 -0.4 -0.4United Arab Emirates 9,270 1,498 464 6.2 1.3 7 3 2 37 26 10 62 72 77 1.7 86 6.8 1.9United Kingdom 65,789 13,785 4,000 0.5 0.5 12 11 9 15 14 12 72 76 82 1.9 83 0.7 0.7United Republic of Tanzania 55,572 28,698 9,655 3.0 2.9 18 15 7 48 44 38 47 50 66 5.0 32 4.9 4.6United States 322,180 73,928 19,607 0.9 0.7 10 9 8 16 16 13 71 75 79 1.9 82 1.3 0.9Uruguay 3,444 884 240 0.4 0.3 10 10 9 21 18 14 69 73 77 2.0 95 0.7 0.4
TABLE 6. DEMOGRAPHIC INDICATORS

177
Countries and areas
Population (thousands)Population
annual growth rate (%) Crude death rate Crude birth rate Life expectancy
Total fertility
rate
Urbanized population
(%)
Average annual growth rate of urban
population (%)2016
total under 18 under 5 1990–2016 2016–2030α 1970 1990 2016 1970 1990 2016 1970 1990 2016 2016 2016 1990–2016 2016–2030α
Uzbekistan 31,447 10,386 3,184 1.7 1.1 10 8 6 37 35 21 62 66 71 2.3 36 1.1 1.7Vanuatu 270 114 34 2.4 1.9 14 8 5 42 36 26 52 63 72 3.3 26 3.7 3.0Venezuela (Bolivarian Republic of) 31,568 10,493 2,974 1.8 1.1 7 5 6 37 29 19 65 70 75 2.3 89 2.0 1.2Viet Nam 94,569 25,780 7,761 1.3 0.8 12 6 6 36 29 17 60 71 76 2.0 34 3.2 2.2Yemen 27,584 12,957 4,075 3.2 2.1 25 11 6 53 52 32 41 58 65 4.0 35 5.1 3.4Zambia 16,591 8,647 2,820 2.8 2.9 17 18 8 50 45 38 49 45 62 5.0 41 2.9 4.3Zimbabwe 16,150 7,726 2,539 1.8 2.1 13 10 8 47 37 33 55 58 61 3.8 32 1.9 2.3
SUMMARY East Asia and Pacific 2,291,492 545,358 156,758 0.9 0.4 11 7 7 35 22 14 60 69 75 1.8 57 3.0 1.5Europe and Central Asia 908,161 191,748 55,778 0.3 0.2 10 11 10 18 15 12 69 72 77 1.8 71 0.5 0.4
Eastern Europe and Central Asia 416,914 100,514 31,087 0.2 0.2 10 11 11 21 18 15 66 68 73 1.9 64 0.3 0.4Western Europe 491,247 91,234 24,691 0.3 0.1 11 10 10 16 12 10 71 75 81 1.6 76 0.6 0.4
Latin America and Caribbean 633,773 193,378 53,227 1.4 0.8 10 7 6 37 27 17 60 68 76 2.1 80 1.9 1.1Middle East and North Africa 435,225 152,698 49,143 2.1 1.5 15 7 5 44 34 23 53 66 74 2.8 63 2.6 1.8North America 358,469 80,927 21,535 0.9 0.7 9 9 8 16 16 12 71 75 80 1.8 83 1.3 0.9South Asia 1,765,989 619,518 169,895 1.7 1.0 17 11 7 40 33 20 48 58 69 2.5 33 2.7 2.3Sub-Saharan Africa 1,034,153 511,533 167,977 2.7 2.5 21 16 9 47 44 36 45 50 60 4.8 37 4.0 3.6
Eastern and Southern Africa 542,206 261,901 83,757 2.6 2.4 19 16 8 47 43 34 47 51 63 4.4 31 3.7 3.5West and Central Africa 491,947 249,631 84,220 2.8 2.6 23 17 11 47 45 39 42 49 57 5.4 45 4.2 3.7
Least developed countries 979,388 454,924 142,971 2.5 2.2 21 15 8 47 42 32 44 52 64 4.1 31 4.0 3.6World 7,427,263 2,295,160 674,314 1.3 1.0 13 9 8 33 26 19 59 65 72 2.4 54 2.2 1.6
For a complete list of countries and areas in the regions, subregions and country categories, see page 150 or visit <data.unicef.org/regionalclassifications>.It is not advisable to compare data from consecutive editions of The State of the World’s Children.
TABLE 6. DEMOGRAPHIC INDICATORS
Crude death rate – Annual number of deaths per 1,000 population.Crude birth rate – Annual number of births per 1,000 population.Life expectancy– Number of years newborn children would live if subject to the mortality risks prevailing for the cross section of population at the time of their birth.Total fertility rate – Number of children who would be born per woman if she lived to the end of her childbearing years and bore children at each age in accordance with prevailing age-specific fertility rates.Urbanized population – Percentage of population living in urban areas as defined according to the national definition used in the most recent population census.
Population – United Nations Population Division. Growth rates calculated by UNICEF based on data from United Nations Population Division. Crude death and birth rates – United Nations Population Division.Life expectancy – United Nations Population Division.Total fertility rate – United Nations Population Division.
− Data not available. α Based on medium-fertility variant projections.
NOTES
DEFINITIONS OF THE INDICATORS MAIN DATA SOURCES

UNICEF – THE STATE OF THE WORLD’S CHILDREN 2017
TABLE 7. WOMEN
Countries and areas
Life expec-tancy:
females as a %
of males
Adult literacy
rate: females as a % of
males
Enrolment ratios: females as a % of males
Survival rate to the last grade of primary: females as
a % of males
Demand for family
planning satisfied
with modern methods
(%)
Antenatal care (%) Delivery care (%)Post-natal health
check (%)+ Maternal mortality ratio†
Primary GER
Second-ary GER
At least one visit
At least four
visits
Skilled birth
attendant
Institu-tional
deliveryC-
section
For new-borns
For mothers Reported Adjusted
Lifetime risk of
maternal death (1 in:)
20162011–2016* 2011–2016* 2011–2016* 2011–2016* 2011–2016*
2013–2016*
2011–2016*
2011–2016* 2011–2016* 2011–2016* 2015
Afghanistan 104 39 69 56 – 42 59 18 51 48 3 9 40 1,300 396 52Albania 105 98 97 94 101 13 x 97 x 67 x 99 x 97 x 19 x 1 x 83 x 6 29 1,900Algeria 103 82 x 94 104 102 77 93 67 97 97 16 – – – 140 240Andorra – 100 – – 99 – – – – – – – – – – –Angola 110 67 64 65 – 24 82 61 50 46 4 21 23 – 477 32Anguilla – – – – – – – – – – – – – – – –Antigua and Barbuda 107 101 x 94 102 – – 100 x 100 100 – – – – 0 x – –Argentina 110 100 100 107 100 – 98 90 100 99 29 – – 39 52 790Armenia 109 100 100 101 99 40 100 96 100 99 18 98 97 17 25 2,300Australia 105 – 100 95 – – 98 x 92 x – 99 31 x – – – 6 8,700Austria 106 – 99 95 101 – – – 99 99 24 x – – – 4 18,200Azerbaijan 109 100 98 – 95 22 x 92 66 100 93 20 3 x 83 14 25 1,600Bahamas 108 – – – – – 98 x 85 98 – – – – 37 80 660Bahrain 103 95 x 101 100 97 – 100 x 100 100 98 x – – – 17 x 15 3,000Bangladesh 105 92 108 113 – 73 64 31 42 37 23 32 36 180 176 240Barbados 107 – 101 103 – 70 93 88 99 100 21 98 97 52 27 2,100Belarus 116 100 x 100 99 100 74 100 100 100 100 25 100 100 0 4 13,800Belgium 106 – 100 114 102 – – – – – 18 x – – – 7 8,000Belize 108 – 95 102 98 66 97 93 97 96 34 96 96 45 28 1,300Benin 105 49 92 70 95 25 83 59 77 87 5 80 78 350 405 51Bhutan 101 73 107 107 101 85 x 98 85 86 x 74 12 x 30 x 41 x 86 148 310Bolivia (Plurinational State of) 108 92 97 98 101 43 x 90 75 85 x 71 27 76 x 77 x 310 x 206 160Bosnia and Herzegovina 107 96 – – 101 22 87 84 100 100 14 – – 0 11 6,800Botswana 109 102 x 97 – 103 82 x 94 x 73 x 99 x 100 – – – 130 129 270Brazil 110 101 97 105 – 90 97 91 99 99 56 – – 55 44 1,200British Virgin Islands – – – – – – – – – – – – – – – –Brunei Darussalam 104 97 100 100 97 – 99 x 93 100 100 x – – – – 23 2,300Bulgaria 110 99 99 97 100 – – – 100 94 36 – – 6 11 6,200Burkina Faso 102 59 96 92 114 44 93 47 80 82 4 33 74 330 371 48Burundi 107 78 101 91 118 33 99 49 85 84 4 x 8 x 49 500 x 712 23Cabo Verde 106 89 95 112 101 73 x 98 x 72 x 92 76 x 11 x – – 10 42 900Cambodia 106 80 x 99 – 134 56 95 76 89 83 6 79 90 170 161 210Cameroon 104 83 x 90 86 104 40 83 59 65 61 2 69 65 780 596 35Canada 105 – 101 100 – – 100 x 99 x 100 x 98 26 x – – 11 7 8,800Central African Republic 107 48 x 74 51 96 29 68 x 38 x 40 x 53 x 5 x – – 540 x 882 27Chad 105 45 77 46 85 18 55 31 20 22 1 5 16 860 856 18Chile 107 100 97 101 101 – – – 100 100 50 – – 14 22 2,600China 104 95 x 100 103 – 97 x 97 69 100 100 41 – – 20 27 2,400Colombia 110 100 97 107 106 84 x 97 90 99 99 46 7 x 1 54 64 800Comoros 105 75 93 107 121 28 92 49 82 x 76 10 14 49 170 335 66Congo 105 84 107 87 – 39 93 79 94 92 5 86 80 440 442 45Cook Islands – – 94 108 94 – 100 x – 100 x 100 x – – – 0 – –Costa Rica 106 100 99 104 101 89 98 90 99 99 22 – – 28 25 2,100Côte d'Ivoire 106 73 89 72 95 31 91 44 59 x 57 3 34 70 610 645 32Croatia 109 99 100 105 99 – – 92 100 – 21 – – 3 8 7,900Cuba 105 100 95 105 100 88 99 98 99 100 40 98 99 42 39 1,800Cyprus 106 99 100 99 99 – 99 x – – 97 – – – – 7 9,400Czechia 108 – 100 101 100 86 x – – 100 x 100 20 x – – 1 4 14,800Democratic People's Republic of Korea 110 – – 101 – 90 100 x 94 x 100 x 95 x 13 x – – 77 x 82 660
Democratic Republic of the Congo 105 75 91 62 99 16 88 48 80 80 5 8 44 850 693 24Denmark 105 – 98 104 100 – – – – – 21 x – – – 6 9,500Djibouti 105 – 91 82 88 – 88 23 87 x 87 11 – – 380 229 140Dominica – – 98 99 95 – 100 x – 100 – – – – 110 – –Dominican Republic 109 101 91 110 105 84 98 93 98 98 58 95 95 110 92 400Ecuador 107 98 106 104 102 81 84 x 58 x 96 93 46 – – 46 64 580Egypt 106 81 100 99 – 80 90 83 92 87 52 14 82 49 33 810El Salvador 113 96 96 101 105 82 96 90 98 98 32 97 94 42 54 890Equatorial Guinea 105 86 x 98 – 100 21 91 67 68 x 67 7 – – 310 342 61Eritrea 107 73 x 86 85 103 20 x 89 x 57 x 34 x 34 x 3 x – 5 x 490 x 501 43Estonia 113 100 100 99 101 – – 97 100 x 99 – – – 7 9 6,300Ethiopia 106 59 x 91 96 105 59 62 32 28 26 2 0 17 410 353 64Fiji 109 – 99 111 98 – 100 x 94 100 99 – – – 59 30 1,200

179TABLE 7. WOMEN
Countries and areas
Life expec-tancy:
females as a %
of males
Adult literacy
rate: females as a % of
males
Enrolment ratios: females as a % of males
Survival rate to the last grade of primary: females as
a % of males
Demand for family
planning satisfied
with modern methods
(%)
Antenatal care (%) Delivery care (%)Post-natal health
check (%)+ Maternal mortality ratio†
Primary GER
Second-ary GER
At least one visit
At least four
visits
Skilled birth
attendant
Institu-tional
deliveryC-
section
For new-borns
For mothers Reported Adjusted
Lifetime risk of
maternal death (1 in:)
20162011–2016* 2011–2016* 2011–2016* 2011–2016* 2011–2016*
2013–2016*
2011–2016*
2011–2016* 2011–2016* 2011–2016* 2015
Finland 107 – 100 109 100 – 100 x – – 100 16 x – – – 3 21,700France 108 – 99 101 – 96 x 100 x 99 x – 98 21 x – – – 8 6,100Gabon 105 94 97 – – 34 95 78 89 x 90 10 25 60 320 291 85Gambia 104 65 105 – 106 24 86 78 57 63 2 6 76 430 706 24Georgia 112 100 102 100 100 53 x 98 x 88 100 100 41 – – 32 36 1,500Germany 106 – 99 94 100 – 100 x 99 – 99 29 x – – – 6 11,700Ghana 103 83 x 102 97 97 41 91 87 71 73 13 23 81 450 x 319 74Greece 107 98 99 94 100 – – – – – – – – – 3 23,700Grenada 107 – 96 100 – – 100 x – 99 – – – – 23 27 1,500Guatemala 109 88 96 93 99 66 91 86 66 65 26 8 78 140 88 330Guinea 102 50 85 66 97 16 85 57 45 x 40 2 25 37 720 679 29Guinea–Bissau 106 50 – – – 38 92 65 45 44 4 55 48 900 549 38Guyana 107 99 97 99 105 53 91 87 86 93 17 95 93 86 x 229 170Haiti 107 84 x – – – 45 90 67 49 36 6 19 32 380 359 90Holy See – – – – – – – – – – – – – – – –Honduras 107 100 99 119 110 76 97 89 83 x 83 19 81 85 73 x 129 300Hungary 110 – 99 100 100 – – – 99 x – 31 x – – 15 17 4,400Iceland 104 – 99 104 102 – – – – – 17 x – – – 3 14,600India 105 75 112 101 99 72 74 x 51 81 79 17 24 62 170 174 220Indonesia 106 96 97 100 – 79 95 84 93 80 12 48 80 360 126 320Iran (Islamic Republic of) 103 89 105 99 99 69 97 x 94 x 96 x 95 x 46 x – – 25 x 25 2,000Iraq 107 72 – – – 59 78 50 91 x 77 22 – – 35 50 420Ireland 105 – 101 103 – – 100 x – 100 x 100 25 x – – – 8 6,100Israel 104 – 101 101 98 – – – – – – – – – 5 6,200Italy 106 99 99 98 100 – 99 x 68 x – 100 40 x – – – 4 19,700Jamaica 107 116 x – 107 103 83 x 98 86 99 x 99 21 – – 80 89 520Japan 108 – 100 100 100 – – – – 100 – – – – 5 13,400Jordan 105 99 101 106 – 58 99 95 100 x 99 28 75 82 19 x 58 490Kazakhstan 115 100 x 102 103 101 80 99 95 99 99 15 99 98 13 12 3,000Kenya 108 88 99 – – 75 94 58 62 61 9 36 53 360 510 42Kiribati 110 – 103 – – 36 x 88 x 71 x 98 x 66 x 10 x – – 33 90 300Kuwait 103 98 101 116 101 – 100 x – 99 x 99 – – – 2 4 10,300Kyrgyzstan 112 99 x 99 102 100 62 98 95 98 98 7 99 98 36 76 390Lao People's Democratic Republic 105 74 96 93 104 61 54 37 40 x 38 4 41 40 210 197 150Latvia 114 100 99 99 100 – 92 x – 100 x 98 – – – 24 18 3,500Lebanon 105 93 x 91 99 108 – 96 x – 98 x 100 x – – – – 15 3,700Lesotho 109 125 97 136 129 76 95 74 78 77 10 18 62 1,000 487 61Liberia 103 44 x 90 78 – 37 96 78 61 56 4 35 71 1,100 725 28Libya 108 – – – – 30 x 93 x – – 100 – – – – 9 4,200Liechtenstein – – 98 78 – – – – – – – – – – – –Lithuania 115 100 100 96 100 – 100 x – 100 x – – – – 7 10 6,300Luxembourg 106 – 100 102 103 – – 97 100 x 100 x 29 x – – – 10 6,500Madagascar 105 91 100 98 105 50 x 82 51 44 38 2 13 x 46 x 480 353 60Malawi 109 79 102 90 102 75 95 51 90 91 6 60 42 440 634 29Malaysia 106 95 x 100 108 101 – 97 – 99 99 – – – 24 40 1,200Maldives 103 100 – – 106 43 x 99 x 85 x 96 x 95 x 32 x 1 x 70 x 110 68 600Mali 102 49 91 81 94 48 48 38 44 65 2 63 58 460 x 587 27Malta 104 103 102 107 104 – 100 x – – 100 – – – – 9 8,300Marshall Islands – 100 100 110 – 81 x 81 x 77 x 90 x 85 x 9 x – – 110 – –Mauritania 105 62 x 105 93 98 30 85 63 64 69 5 58 57 630 602 36Mauritius 110 96 102 105 99 41 – – 100 98 x – – – 22 x 53 1,300Mexico 107 98 100 107 102 81 99 94 98 97 41 95 95 35 38 1,100Micronesia (Federated States of) 103 – 100 – – – 80 x – 100 x 87 x 11 x – – 160 100 310Monaco – – – – – – – – – – – – – – – –Mongolia 113 100 x 98 102 – 68 99 90 98 98 23 99 95 26 44 800Montenegro 106 98 98 100 102 34 92 87 99 99 20 99 95 0 x 7 8,300Montserrat – – – – – – – – – – – – – – – –Morocco 103 74 95 85 96 75 77 55 74 x 73 16 – 1 x 110 x 121 320Mozambique 108 54 x 92 92 94 28 91 51 54 x 55 4 – 5 x 410 489 40Myanmar 107 90 97 103 – 75 81 59 60 37 17 36 71 230 178 260Namibia 109 99 97 – 104 75 97 63 88 87 14 20 69 390 265 100Nauru – – 92 102 – 43 x 95 x 40 x 97 x 99 x 8 x – – 0 – –Nepal 105 68 108 107 104 56 84 69 58 57 9 58 57 280 x 258 150

UNICEF – THE STATE OF THE WORLD’S CHILDREN 2017
Countries and areas
Life expec-tancy:
females as a %
of males
Adult literacy
rate: females as a % of
males
Enrolment ratios: females as a % of males
Survival rate to the last grade of primary: females as
a % of males
Demand for family
planning satisfied
with modern methods
(%)
Antenatal care (%) Delivery care (%)Post-natal health
check (%)+ Maternal mortality ratio†
Primary GER
Second-ary GER
At least one visit
At least four
visits
Skilled birth
attendant
Institu-tional
deliveryC-
section
For new-borns
For mothers Reported Adjusted
Lifetime risk of
maternal death (1 in:)
20162011–2016* 2011–2016* 2011–2016* 2011–2016* 2011–2016*
2013–2016*
2011–2016*
2011–2016* 2011–2016* 2011–2016* 2015
Netherlands 105 – 99 101 – – – – – – 14 x – – – 7 8,700New Zealand 104 – 100 106 – – – – – 97 23 x – – – 11 4,500Nicaragua 108 100 x – – – 90 95 88 88 x 71 30 – 3 x 51 150 270Niger 103 38 86 71 104 35 83 38 40 59 1 13 37 520 553 23Nigeria 103 68 x 98 93 – 33 61 51 35 36 2 14 40 550 814 22Niue – – 82 110 – – 100 x – 100 x – – – – 0 – –Norway 105 – 100 97 100 – – – – 99 16 x – – – 5 11,500Oman 106 89 103 107 101 19 x 99 94 99 99 19 98 95 18 17 1,900Pakistan 103 64 85 79 99 47 73 37 55 48 14 43 60 280 x 178 140Palau – 100 111 99 – – 90 x 81 x 100 100 x – – – 0 x – –Panama 108 99 x 97 107 102 76 93 88 94 91 28 93 92 81 94 420Papua New Guinea 108 80 x 91 76 – 41 x 79 x 55 x 53 x 43 – – – 730 x 215 120Paraguay 106 98 97 107 104 84 x 96 x 83 96 x 97 49 – – 82 132 270Peru 107 94 100 100 103 63 97 96 92 91 32 96 93 93 x 68 570Philippines 110 101 100 110 – 52 95 84 73 61 9 53 72 220 114 280Poland 111 – 100 96 100 – – – 100 x 100 21 x – – 2 3 22,100Portugal 108 96 96 97 – – 100 x – 100 x 99 31 x – – – 10 8,200Qatar 103 100 101 126 97 69 91 85 100 99 20 – – 11 13 3,500Republic of Korea 108 – 99 99 100 – – 97 – 100 32 x – – – 11 7,200Republic of Moldova 113 100 99 101 100 60 99 95 100 99 16 – 87 x 30 23 3,200Romania 110 99 98 99 100 47 x 76 76 x 95 95 34 – – 14 31 2,300Russian Federation 117 100 x 101 98 101 72 – – 100 x 99 13 – – 11 25 2,300Rwanda 107 89 101 109 118 66 99 44 91 91 13 19 43 210 290 85Saint Kitts and Nevis – – 102 105 98 – 100 x – 100 – – – – 310 – –Saint Lucia 107 – – 99 100 72 97 90 99 x 100 19 100 90 34 48 1,100Saint Vincent and the Grenadines 106 – 98 97 – – 100 x 100 x 99 – – – – 45 45 1,100Samoa 109 100 100 111 97 39 93 73 83 82 5 – 63 29 x 51 500San Marino – – 99 103 103 – – – – – – – – – – –Sao Tome and Principe 107 90 94 113 – 50 98 84 93 91 6 91 87 160 x 156 140Saudi Arabia 104 95 103 76 – – 97 x – 98 – – – – 14 12 3,100Senegal 106 64 112 98 108 44 95 47 53 75 5 50 74 430 315 61Serbia 108 99 100 101 97 25 98 94 98 98 29 – – 12 17 3,900Seychelles 113 101 x 103 107 – – – – 99 x – – – – 57 x – –Sierra Leone 102 60 101 86 101 38 97 76 60 54 3 39 73 1,200 1,360 17Singapore 105 97 – – – – – – – 100 – – – – 10 8,200Slovakia 110 – 99 101 101 – 97 x – 99 x – 24 x – – 0 6 12,100Slovenia 107 – 100 100 100 – 100 x – 100 x 100 – – – 0 9 7,000Solomon Islands 104 – 99 94 114 60 x 89 69 86 85 6 16 69 150 x 114 220Somalia 106 – – – – – 26 x 6 x 9 x 9 x – – – 1,000 x 732 22South Africa 112 98 95 127 – 81 x 94 76 97 96 26 – 84 580 138 300South Sudan 104 55 x 71 54 – 6 x 62 17 x 19 x 12 x 1 x – – 2,100 x 789 26Spain 107 99 101 100 100 – – – – – 26 x – – – 5 14,700Sri Lanka 109 97 x 98 105 100 69 x 99 x 93 x 99 x 100 32 – – 32 30 1,600State of Palestine 105 97 100 110 105 65 99 96 100 99 20 94 91 – 45 490Sudan 105 – 90 95 99 30 79 51 78 28 9 28 27 220 x 311 72Suriname 109 96 98 127 115 73 x 91 x 67 x 90 x 92 x 19 x – – 130 155 270Swaziland 112 98 x 92 99 107 81 99 76 88 88 12 90 88 590 x 389 76Sweden 104 – 104 114 100 – 100 x – – – – – – – 4 12,900Switzerland 105 – 100 97 – – – – – – 30 x – – – 5 12,400Syrian Arab Republic 120 84 x 97 100 101 53 x 88 x 64 x 96 x 78 x 26 x – – 65 x 68 440Tajikistan 109 100 x 99 90 101 51 79 53 98 77 4 54 81 29 32 790Thailand 111 96 94 94 – 89 98 91 99 99 33 – – 12 x 20 3,600The former Yugoslav Republic of Macedonia 105 96 x 99 97 99 22 99 94 100 100 25 – – 4 8 8,500
Timor–Leste 105 83 x 99 107 103 38 x 84 x 55 x 29 x 21 x 2 x 2 x 24 x 570 x 215 82Togo 103 66 95 – 96 32 73 57 45 73 7 35 71 400 368 58Tokelau – – – 93 – – – – – – – – – – – –Tonga 109 100 99 109 – 48 99 70 96 x 98 17 – – 36 x 124 230Trinidad and Tobago 110 – – – – 55 x 96 x 100 100 97 x – – – 84 63 860Tunisia 106 84 97 105 103 73 98 85 74 x 99 27 98 92 – 62 710Turkey 109 94 99 97 99 60 97 89 97 97 48 72 88 29 x 16 3,000Turkmenistan 111 – 98 96 – 76 100 96 100 100 6 100 100 7 x 42 940Turks and Caicos Islands – – – – – – – – – – – – – – – –
TABLE 7. WOMEN

181
Countries and areas
Life expec-tancy:
females as a %
of males
Adult literacy
rate: females as a % of
males
Enrolment ratios: females as a % of males
Survival rate to the last grade of primary: females as
a % of males
Demand for family
planning satisfied
with modern methods
(%)
Antenatal care (%) Delivery care (%)Post-natal health
check (%)+ Maternal mortality ratio†
Primary GER
Second-ary GER
At least one visit
At least four
visits
Skilled birth
attendant
Institu-tional
deliveryC-
section
For new-borns
For mothers Reported Adjusted
Lifetime risk of
maternal death (1 in:)
20162011–2016* 2011–2016* 2011–2016* 2011–2016* 2011–2016*
2013–2016*
2011–2016*
2011–2016* 2011–2016* 2011–2016* 2015
Tuvalu – – 101 128 – 41 x 97 x 67 x 93 x 93 x 7 x – – 0 x – –Uganda 108 78 102 91 103 48 97 60 57 x 73 5 11 54 340 343 47Ukraine 115 100 102 98 100 68 99 87 99 x 99 12 99 96 14 24 2,600United Arab Emirates 103 102 x 99 – 103 – 100 x – 100 x 100 – – – 0 x 6 7,900United Kingdom 105 – 100 104 – – – – – – 26 x – – – 9 5,800United Republic of Tanzania 106 88 103 91 115 53 91 51 64 63 6 42 34 560 398 45United States 106 – 100 102 – 83 x – 97 99 – 31 x – – 28 14 3,800Uruguay 110 101 98 111 101 – 97 77 100 100 30 – – 17 15 3,300Uzbekistan 108 100 96 98 101 – 99 – 100 100 14 – – 19 36 1,000Vanuatu 106 – 98 106 – 51 76 52 89 89 12 – – 86 x 78 360Venezuela (Bolivarian Republic of) 112 100 97 108 100 – 98 84 100 99 52 – – 69 95 420Viet Nam 113 95 x 99 – 104 70 96 74 94 94 28 89 90 67 54 870Yemen 105 – 84 69 93 47 60 25 45 30 5 11 20 150 385 60Zambia 108 88 x 101 – 94 64 96 56 63 67 4 16 63 400 224 79Zimbabwe 106 99 98 98 104 85 93 76 78 77 6 73 57 650 443 52
SUMMARYEast Asia and Pacific 106 – 99 102 – 89 96 74 95 90 31 56 ** 79 ** – 59 930Europe and Central Asia 109 – 100 99 100 75 – – – 98 22 – – – 16 3400
Eastern Europe and Central Asia 113 98 100 98 100 68 96 87 99 97 22 – – – 25 2000Western Europe 107 – 100 100 100 82 – – – 99 – – – – 7 9600
Latin America and Caribbean 109 99 98 105 102 83 97 90 96 94 43 – – – 68 670Middle East and North Africa 105 84 98 95 99 71 84 66 86 80 30 – – – 81 400North America 106 – 100 102 – 86 – 97 99 – – – – – 13 4100South Asia 104 75 107 99 99 71 69 ‡ 46 73 70 17 28 59 – 182 200Sub–Saharan Africa 106 78 95 87 102 50 80 52 56 56 5 24 46 – 546 36
Eastern and Southern Africa 107 88 94 94 105 61 85 52 60 57 7 24 40 – 409 52West and Central Africa 104 – 95 81 99 35 75 52 52 56 3 24 50 – 679 27
Least developed countries 105 77 94 89 103 58 79 46 56 54 7 25 42 – 436 52World 106 85 100 98 100 78 86 ‡ 62 78 75 20 34 ** 59 ** – 216 180
For a complete list of countries and areas in the regions, subregions and country categories, see page 150 or visit <data.unicef.org/regionalclassifications>.It is not advisable to compare data from consecutive editions of The State of the World’s Children.
Life expectancy – Number of years newborn children would live if subject to the mortality risks prevailing for the cross section of population at the time of their birth.Adult literacy rate – Percentage of the population aged 15 years and over who can both read and write with understanding a short, simple statement on his/her everyday life.Primary gross enrolment ratio (GER) – Total enrolment in primary school, regardless of age, expressed as a percentage of the official primary-school-aged population.Secondary gross enrolment ratio (GER) – Total enrolment in secondary school, regardless of age, expressed as a percentage of the official secondary-school-aged population.Survival rate to last grade of primary – Percentage of children entering the first grade of primary school who eventually reach the last grade (administrative data).Demand for family planning satisfied with modern methods – Percentage of women of reproductive age (15−49 years) who have their need for family planning satisfied with modern methods. Antenatal care – Percentage of women (aged 15–49) attended at least once during pregnancy by skilled health personnel (doctor, nurse or midwife) and the percentage attended by any provider at least four times.Skilled birth attendant – Percentage of births attended by skilled heath personnel (doctor, nurse or midwife).Institutional delivery – Percentage of women (aged 15–49) who gave birth in a health facility.
C-section – Percentage of births delivered by Caesarean section. NB: C-section rates between 5 per cent and 15 per cent expected with adequate levels of emergency obstetric care.Post-natal health check for newborn – Percentage of last live births in the last 2 years who received a health check within 2 days after delivery. NB: For MICS, health check refers to a health check while in facility or at home following delivery or a postnatal visit.Post-natal health check for mother – Percentage of women age 15–49 years who received a health check within 2 days after delivery of their most recent live birth in the last 2 years. NB: For MICS, health check refers to a health check while in facility or at home following delivery or a postnatal visit.Maternal mortality ratio – Number of deaths of women from pregnancy-related causes per 100,000 live births during the same time period. The ‘reported’ column shows country-reported figures that are not adjusted for under-reporting and misclassification. For the ‘adjusted’ column, see note below (†). Maternal mortality ratio values have been rounded according to the following scheme: Reported: <100, no rounding; 100–999, rounded to nearest 10; and >1,000, rounded to nearest 100. Adjusted: <1000, rounded to nearest 1; and ≥1,000, rounded to nearest 10.Lifetime risk of maternal death – Lifetime risk of maternal death takes into account both the probability of becoming pregnant and the probability of dying as a result of that pregnancy, accumulated across a woman’s reproductive years. Lifetime risk values have been rounded according to the following scheme: <1000, rounded to nearest 1; and ≥1,000, rounded to nearest 10.
Life expectancy – United Nations Population Division.Adult literacy – UNESCO Institute for Statistics (UIS).Primary and secondary school enrolment – UIS.Survival rate to last grade of primary – UIS.Demand for family planning satisfied with modern methods – SDG Global Database based on Demographic and Health Surveys (DHS), Multiple Indicator Cluster Surveys (MICS), Reproductive Health Surveys, other national surveys, National Health Information Systems (HIS)Antenatal care – DHS, MICS and other nationally representative sources.Skilled birth attendant – Joint UNICEF/WHO SBA database, November 2017 update, based on DHS, MICS and other nationally representative sources.
Institutional delivery – DHS, MICS and other nationally representative sources.C-section – DHS, MICS and other nationally representative sources.Post-natal health check for newborn and mother – DHS and MICS.Maternal mortality ratio (reported) – Nationally representative sources, including household surveys and vital registration.Maternal mortality ratio (adjusted) – United Nations Maternal Mortality Estimation Inter-agency Group (WHO, UNICEF, UNFPA, The World Bank and the United Nations Population Division).Lifetime risk of maternal death – United Nations Maternal Mortality Estimation Inter-agency Group (WHO, UNICEF, UNFPA, The World Bank and the United Nations Population Division).
– Data not available.x Data refer to years or periods other than those
specified in the column heading. Such data are not included in the calculation of regional and global averages. Estimates from data years prior to 2000 are not displayed.
+ Data collection method for this indicator varies across surveys and may affect comparability of the coverage estimates. For detailed explana-tion see General Note on the Data, page 146.
† The maternal mortality data in the column head-ed ‘reported’ refer to data reported by national authorities. The data in the column headed ‘adjusted’ refer to the 2015 United Nations inter–agency maternal mortality estimates. Peri-odically, the United Nations Maternal Mortality Estimation Inter–agency Group (WHO, UNICEF, UNFPA The World Bank and the United Nations
Population Division) produces internationally comparable sets of maternal mortality data that account for the well–documented problems of under–reporting and misclassification of maternal deaths, including also estimates for countries with no data. Please note that owing to an evolving methodology, these values are not comparable with previously reported maternal mortality ratio ‘adjusted’ values. Comparable time series on maternal mortality ratios for the years 1990, 1995, 2000, 2005 and 2015 are available at < http://data.unicef.org/maternal–health/maternal–mortality.html>.
* Data refer to the most recent year available during the period specified in the column heading.
** Excludes China.‡ Excludes India.
NOTES
MAIN DATA SOURCESDEFINITIONS OF THE INDICATORS
TABLE 7. WOMEN

UNICEF – THE STATE OF THE WORLD’S CHILDREN 2017
Countries and areas
Child labour (%)+
2010–2016*Child marriage (%)
2010–2016*
Birth registration
(%)++ 2010–2016*
Female genital mutilation/cutting (%)+ 2004–2016* Justification of
wife-beating (%) 2010–2016*
Violent discipline (%)+
2010–2016*prevalence attitudes
total male femalemarried by
15married by
18 total womena girlsb support for
the practicec male female total male female
Afghanistan 29 34 24 9 35 42 – – – 72 y 80 y 74 y 75 y 74 yAlbania 5 y 6 y 4 y 0 x 10 x 99 x – – – 36 x 30 x 77 x,y 81 x,y 73 x,yAlgeria 5 y 6 y 5 y 0 3 100 – – – – 59 y 86 y 88 y 85 yAndorra – – – – – 100 v – – – – – – – –Angola 23 22 25 8 30 25 – – – 20 25 – – –Anguilla – – – – – – – – – – – – – –Antigua and Barbuda – – – – – – – – – – – – – –Argentina 4 y 5 y 4 y – – 100 y – – – – 2 72 y 74 y 71 yArmenia 9 y 11 y 6 y 0 5 99 – – – 23 10 69 71 67Australia – – – – – 100 v – – – – – – – –Austria – – – – – 100 v – – – – – – – –Azerbaijan 7 x,y 8 x,y 5 x,y 2 11 94 x – – – – 28 77 x,y 80 x,y 74 x,yBahamas – – – – – – – – – – – – – –Bahrain 5 x,y 6 x,y 3 x,y – – – – – – – – – – –Bangladesh 4 y 5 y 4 y 22 59 20 – – – – 28 y 82 83 82Barbados 2 y 3 y 1 y 1 11 99 – – – – 3 75 y 78 y 72 yBelarus 1 y 1 y 2 y 0 3 100 y – – – 4 4 65 y 67 y 62 yBelgium – – – – – 100 v – – – – – – – –Belize 3 y 5 y 1 y 3 26 96 – – – 5 5 65 67 63Benin 53 54 51 7 26 85 9 0 3 17 36 91 92 90Bhutan 3 y 3 y 3 y 6 26 100 – – – – 68 – – –Bolivia (Plurinational State of) 26 x,y 28 x,y 24 x,y 3 x 22 x 76 x,y – – – – 16 x – – –Bosnia and Herzegovina 5 x,y 7 x,y 4 x,y 0 4 100 x – – – 6 5 55 y 60 y 50 yBotswana 9 x,y 11 x,y 7 x,y – – 83 y – – – – – – – –Brazil 7 y 9 y 5 y 11 x 36 x 96 – – – – – – – –British Virgin Islands – – – – – – – – – – – – – –Brunei Darussalam – – – – – – – – – – – – – –Bulgaria – – – – – 100 y – – – – – – – –Burkina Faso 39 y 42 y 36 y 10 52 77 76 13 9 34 44 83 x,y 84 x,y 82 x,yBurundi 26 y 26 y 27 y 3 20 75 – – – 44 73 – – –Cabo Verde 6 y – – 3 x 18 x 91 – – – 17 x,y 17 x,y – – –Cambodia 19 y 20 y 19 y 2 19 73 – – – 27 y 50 y – – –Cameroon 47 50 44 10 31 66 1 1 y 7 39 36 85 85 85Canada – – – – – 100 v – – – – – – – –Central African Republic 29 y 27 y 30 y 29 68 61 24 1 11 75 80 92 y 92 y 92 yChad 52 51 52 30 67 12 38 10 29 51 74 71 72 71Chile 7 y – – – – 99 y – – – – – – – –China – – – – – – – – – – – – – –Colombia 8 y 10 y 5 y 5 23 99 – – – – – – – –Comoros 22 y 20 y 24 y 10 32 87 – – – 17 39 – – –Congo 23 – – 6 33 96 – – – 40 54 83 – –Cook Islands – – – – – – – – – – – – – –Costa Rica 4 y 4 y 5 y 7 21 100 y – – – – 4 46 y 52 y 39 yCôte d'Ivoire 26 y 25 y 28 y 10 33 65 38 10 14 42 48 91 x,y 91 x,y 91 x,yCroatia – – – – – – – – – – – – – –Cuba – – – 5 26 100 – – – 7 y 4 y 36 37 35Cyprus – – – – – 100 v – – – – – – – –Czechia – – – – – 100 v – – – – – – – –Democratic People's Republic of Korea – – – – – 100 x – – – – – – – –
Democratic Republic of the Congo 38 36 41 10 37 25 – – – 61 75 82 82 81Denmark – – – – – 100 v – – – – – – – –Djibouti 8 x,y 8 x,y 8 x,y 2 x 5 x 92 x 93 49 y 37 – – 72 x,y 73 x,y 71 x,yDominica – – – – – – – – – – – – – –Dominican Republic 13 17 9 12 36 88 – – – – 2 63 64 61Ecuador 5 y 5 y 5 y 4 x 22 x 94 – – – – – – – –Egypt 7 8 6 2 17 99 87 14 y 54 – 36 y 93 93 93El Salvador 9 y 13 y 5 y 6 26 99 – – – – 8 52 55 50Equatorial Guinea 28 x,y 28 x,y 28 x,y 9 30 54 – – – 52 53 – – –Eritrea – – – 13 41 – 83 33 12 45 51 – – –Estonia – – – – – 100 v – – – – – – – –Ethiopia 27 y 31 y 24 y 14 40 3 65 16 18 28 63 – – –Fiji – – – – – – – – – – – 72 x,y – –Finland – – – – – 100 v – – – – – – – –
TABLE 8. CHILD PROTECTION

183TABLE 8. CHILD PROTECTION
Countries and areas
Child labour (%)+
2010–2016*Child marriage (%)
2010–2016*
Birth registration
(%)++ 2010–2016*
Female genital mutilation/cutting (%)+ 2004–2016* Justification of
wife-beating (%) 2010–2016*
Violent discipline (%)+
2010–2016*prevalence attitudes
total male femalemarried by
15married by
18 total womena girlsb support for
the practicec male female total male female
France – – – – – 100 v – – – – – – – –Gabon 13 y 15 y 12 y 6 22 90 – – – 40 50 – – –Gambia 19 y 21 y 18 y 9 30 72 75 56 65 33 58 90 y 90 y 91 yGeorgia 4 y 6 y 2 y 1 14 100 – – – – 7 x 67 x,y 70 x,y 63 x,yGermany – – – – – 100 v – – – – – – – –Ghana 22 y 23 y 21 y 5 21 71 4 1 2 13 28 94 y 94 y 94 yGreece – – – – – 100 v – – – – – – – –Grenada – – – – – – – – – – – – – –Guatemala 26 y 35 y 16 y 6 30 96 y – – – 7 11 – – –Guinea 28 y 29 y 27 y 21 52 58 97 46 76 66 92 – – –Guinea-Bissau 51 50 53 6 24 24 45 30 13 29 42 82 83 82Guyana 18 20 17 4 30 89 – – – 10 10 70 74 65Haiti 24 y 25 y 24 y 3 18 80 – – – 15 17 85 y 85 y 84 yHoly See – – – – – – – – – – – – – –Honduras 14 y 21 y 8 y 8 34 94 – – – 10 12 – – –Hungary – – – – – 100 v – – – – – – – –Iceland – – – – – 100 v – – – – – – – –India 12 x,y 12 x,y 12 x,y 18 x 47 x 72 – – – 42 x 47 x – – –Indonesia 7 x,y 8 x,y 6 x,y 1 14 73 y – 49 y – 18 y 35 – – –Iran (Islamic Republic of) 11 y 13 y 10 y 3 17 99 y – – – – – – – –Iraq 5 y 5 y 4 y 5 24 99 8 3 y 5 – 51 79 y 81 y 77 yIreland – – – – – 100 v – – – – – – – –Israel – – – – – 100 v – – – – – – – –Italy – – – – – 100 v – – – – – – – –Jamaica 3 y 4 y 3 y 1 8 100 – – – – 5 85 y 87 y 82 yJapan – – – – – 100 v – – – – – – – –Jordan 2 y 3 y 0 y 0 8 99 – – – – 70 y 90 y 91 y 89 yKazakhstan 2 x,y 2 x,y 2 x,y 0 7 100 – – – – 14 53 55 50Kenya 26 x,y 27 x,y 25 x,y 4 23 67 21 3 6 36 42 – – –Kiribati – – – 3 x 20 x 94 x – – – 60 x 76 x 81 x,y – –Kuwait – – – – – – – – – – – – – –Kyrgyzstan 26 30 22 1 12 98 – – – – 33 57 60 54Lao People's Democratic Republic 10 y 9 y 11 y 9 35 75 – – – 49 58 76 y 77 y 74 yLatvia – – – – – 100 v – – – – – – – –Lebanon 2 x,y 3 x,y 1 x,y 1 x 6 x 100 x – – – – 10 x,y 82 x,y 82 x,y 82 x,yLesotho 23 x,y 25 x,y 21 x,y 1 17 43 – – – 40 33 – – –Liberia 21 x,y 21 x,y 21 x,y 9 36 25 y 50 – 39 24 43 90 x,y 90 x,y 90 x,yLibya – – – – – – – – – – – – – –Liechtenstein – – – – – 100 v – – – – – – – –Lithuania – – – – – 100 v – – – – – – – –Luxembourg – – – – – 100 v – – – – – – – –Madagascar 23 y 23 y 23 y 12 41 83 – – – 46 y 45 – – –Malawi 39 42 37 9 42 67 – – – 13 16 72 73 72Malaysia – – – – – – – – – – – 71 y 74 y 67 yMaldives – – – 0 x 4 x 93 x – – – 14 x,y 31 x,y – – –Mali 56 59 52 17 52 87 83 76 75 51 73 73 73 73Malta – – – – – 100 v – – – – – – – –Marshall Islands – – – 6 x 26 x 96 x – – – 58 x 56 x – – –Mauritania 38 – – 14 34 66 67 53 36 21 y 27 y 80 – –Mauritius – – – – – – – – – – – – – –Mexico 12 16 9 4 26 95 – – – – 5 63 63 63Micronesia (Federated States of) – – – – – – – – – – – – – –Monaco – – – – – 100 v – – – – – – – –Mongolia 17 19 15 0 5 99 – – – 9 y 10 49 52 46Montenegro 13 15 10 1 5 99 – – – 5 3 69 73 66Montserrat – – – – – – – – – – – – – –Morocco 8 x,y 9 x,y 8 x,y 3 x 16 x 94 y – – – – 64 x 91 x,y 92 x,y 90 x,yMozambique 22 x,y 21 x,y 24 x,y 14 48 48 – – – 20 23 – – –Myanmar 9 y 10 y 9 y 2 16 81 – – – 49 51 77 y 80 y 75 yNamibia – – – 2 7 87 y – – – 22 28 – – –Nauru – – – 2 x 27 x 83 x – – – – – – – –Nepal 37 37 38 10 37 58 – – – – 43 82 83 81Netherlands – – – – – 100 v – – – – – – – –New Zealand – – – – – 100 v – – – – – – – –

UNICEF – THE STATE OF THE WORLD’S CHILDREN 2017
Countries and areas
Child labour (%)+
2010–2016*Child marriage (%)
2010–2016*
Birth registration
(%)++ 2010–2016*
Female genital mutilation/cutting (%)+ 2004–2016* Justification of
wife-beating (%) 2010–2016*
Violent discipline (%)+
2010–2016*prevalence attitudes
total male femalemarried by
15married by
18 total womena girlsb support for
the practicec male female total male female
Nicaragua 15 x,y 18 x,y 11 x,y 10 x 41 x 85 – – – – 14 x,y – – –Niger 31 y 31 y 30 y 28 76 64 2 2 y 6 27 60 82 y 82 y 81 yNigeria 25 y 24 y 25 y 17 43 30 y 25 17 23 25 35 91 y 91 y 90 yNiue – – – – – – – – – – – – – –Norway – – – – – 100 v – – – – – – – –Oman – – – – – – – – – – 8 – – –Pakistan – – – 3 21 34 – – – 32 y 42 y – – –Palau – – – – – – – – – – – – – –Panama 3 y 4 y 1 y 7 26 96 – – – – 6 45 47 43Papua New Guinea – – – 2 x 21 x – – – – – – – – –Paraguay 28 y 32 y 24 y 2 x 18 x 85 y – – – – – – – –Peru 22 y 24 y 19 y 3 22 98 y – – – – – – – –Philippines 11 y 14 y 8 y 2 15 90 – – – – 13 – – –Poland – – – – – 100 v – – – – – – – –Portugal 3 x,y 4 x,y 3 x,y – – 100 v – – – – – – – –Qatar – – – 0 4 100 y – – – 16 7 50 y 53 y 46 yRepublic of Korea – – – – – – – – – – – – – –Republic of Moldova 16 x,y 20 x,y 12 x,y 0 12 100 – – – 13 11 76 y 77 y 74 yRomania 1 x,y 1 x,y 1 x,y – – – – – – – – – – –Russian Federation – – – – – 100 v – – – – – – – –Rwanda 29 y 27 y 30 y 0 7 56 – – – 18 41 – – –Saint Kitts and Nevis – – – – – – – – – – – – – –Saint Lucia 4 y 5 y 3 y 1 8 92 – – – – 7 68 y 71 y 64 ySaint Vincent and the Grenadines – – – – – – – – – – – – – –Samoa – – – 1 11 59 – – – 30 37 – – –San Marino – – – – – 100 v – – – – – – – –Sao Tome and Principe 26 25 28 8 35 95 – – – 14 19 80 80 79Saudi Arabia – – – – – – – – – – – – – –Senegal 23 29 17 9 31 68 24 15 19 25 57 – – –Serbia 10 12 7 0 3 99 – – – – 4 43 44 42Seychelles – – – – – – – – – – – – – –Sierra Leone 37 y 38 y 37 y 13 39 77 90 31 y 69 34 63 82 y 81 y 82 ySingapore – – – – – – – – – – – – – –Slovakia – – – – – 100 v – – – – – – – –Slovenia – – – – – 100 v – – – – – – – –Solomon Islands 48 y 47 y 49 y 6 21 88 – – – 57 77 86 y 86 y 85 ySomalia 49 x,y 45 x,y 54 x,y 8 x 45 x 3 x 98 46 y 65 – 76 x,y – – –South Africa – – – 1 x 6 x 85 y – – – – – – – –South Sudan – – – 9 52 35 – – – – 79 – – –Spain – – – – – 100 v – – – – – – – –Sri Lanka 1 y 1 y 1 y 2 x 12 x 97 x – – – – 53 x,y – – –State of Palestine 6 y 7 y 4 y 1 15 99 – – – – – 92 93 92Sudan 25 28 22 12 34 67 87 32 41 – 34 64 65 63Suriname 4 y 4 y 4 y 5 19 99 – – – – 13 86 y 87 y 85 ySwaziland 7 y 8 y 7 y 1 5 54 – – – 17 20 88 89 88Sweden – – – – – 100 v – – – – – – – –Switzerland – – – – – 100 v – – – – – – – –Syrian Arab Republic 4 x,y 5 x,y 3 x,y 3 x 13 x 96 x – – – – – 89 x,y 90 x,y 88 x,yTajikistan 10 x,y 9 x,y 11 x,y 0 12 88 – – – – 60 78 x,y 80 x,y 75 x,yThailand 8 x,y 8 x,y 8 x,y 4 23 100 y – – – 9 9 75 77 73The former Yugoslav Republic of Macedonia 13 y 12 y 13 y 1 7 100 – – – – 15 69 y 71 y 67 y
Timor-Leste 4 x,y 4 x,y 4 x,y 3 19 55 – – – 81 86 – – –Togo 28 29 27 6 22 78 5 0 1 18 29 81 81 80Tokelau – – – – – – – – – – – – – –Tonga – – – 0 6 93 – – – 21 29 – – –Trinidad and Tobago 1 x,y 1 x,y 1 x,y 2 x 8 x 97 x – – – – 8 x 77 x,y 78 x,y 77 x,yTunisia 2 y 3 y 2 y 0 2 99 – – – – 30 93 y 94 y 92 yTurkey 6 y 8 y 4 y 1 15 99 y – – – – 13 – – –Turkmenistan 0 1 0 0 6 100 – – – – 26 37 y 39 y 34 yTurks and Caicos Islands – – – – – – – – – – – – – –Tuvalu – – – 0 x 10 x 50 x – – – 73 x 70 x – – –Uganda 16 y 17 y 16 y 10 40 30 1 1 9 44 58 – – –Ukraine 2 y 3 y 2 y 0 9 100 – – – 9 3 61 y 68 y 55 yUnited Arab Emirates – – – – – 100 y – – – – – – – –
TABLE 8. CHILD PROTECTION

185TABLE 8. CHILD PROTECTION
Countries and areas
Child labour (%)+
2010–2016*Child marriage (%)
2010–2016*
Birth registration
(%)++ 2010–2016*
Female genital mutilation/cutting (%)+ 2004–2016* Justification of
wife-beating (%) 2010–2016*
Violent discipline (%)+
2010–2016*prevalence attitudes
total male femalemarried by
15married by
18 total womena girlsb support for
the practicec male female total male female
United Kingdom – – – – – 100 v – – – – – – – –United Republic of Tanzania 29 y 29 y 28 y 5 31 26 10 0 3 40 58 – – –United States – – – – – 100 v – – – – – – – –Uruguay 8 x,y 8 x,y 8 x,y 1 25 100 – – – – 2 55 y 58 y 51 yUzbekistan – – – 0 x 7 x 100 x – – – 61 x 70 x – – –Vanuatu 15 y 15 y 16 y 3 21 43 y – – – 60 60 84 y 83 y 84 yVenezuela (Bolivarian Republic of) 8 x,y 9 x,y 6 x,y – – 81 y – – – – – – – –Viet Nam 16 17 16 1 11 96 – – – – 28 68 72 65Yemen 23 x,y 21 x,y 24 x,y 9 32 31 19 16 y 19 – 49 79 y 81 y 77 yZambia 41 x,y 42 x,y 40 x,y 6 31 11 – – – 32 47 – – –Zimbabwe – – – 4 32 44 – – – 33 39 63 63 62
SUMMARY East Asia and Pacific – – – 2 ** 15 ** 84 ** – – – – 29 ** – – –Europe and Central Asia – – – – – 99 – – – – – – – –
Eastern Europe and Central Asia – – – 1 11 99 – – – – 14 – – –Western Europe – – – – – 100 – – – – – – – –
Latin America and Caribbean 11 13 8 – – 95 – – – – – – – –Middle East and North Africa 7 8 6 3 17 92 – – – – 45 87 88 86North America – – – – – 100 – – – – – – – –South Asia – – – – – 60 – – – – – – – –Sub-Saharan Africa 29 30 29 12 38 43 37 15 20 34 48 – – –
Eastern and Southern Africa 26 27 24 9 35 41 45 12 17 32 48 – – –West and Central Africa 32 32 32 14 41 45 31 17 23 35 48 86 87 86
Least developed countries 26 26 24 12 40 40 – – – 39 49 79 79 78World – – – 6 ** 25 ** 71 ** – – – – – – – –
For a complete list of countries and areas in the regions, subregions and country categories, see page 150 or visit <data.unicef.org/regionalclassifications>.It is not advisable to compare data from consecutive editions of The State of the World’s Children.
Child labour – Percentage of children 5–17 years old involved in child labour at the moment of the survey. A child is considered to be involved in child labour under the following conditions: (a) children 5–11 years old who, during the reference week, did at least one hour of economic activity or at least 28 hours of household chores, (b) children 12–14 years old who, during the reference week, did at least 14 hours of economic activity or at least 28 hours of household chores, (c) children 15–17 years old who, during the reference week, did at least 43 hours of economic activity or household chores, and (d) children aged 5–17 years old in hazardous working conditions.Child marriage – Percentage of women 20–24 years old who were first married or in union before they were 15 years old and percentage of women 20–24 years old who were first married or in union before they were 18 years old.Birth registration – Percentage of children under age 5 who were registered at the moment of the survey. The numerator of this indicator includes children reported to have a birth
certificate, regardless of whether or not it was seen by the interviewer, and those without a birth certificate whose mother or caregiver says the birth has been registered.Female genital mutilation/cutting (FGM/C) – (a) Women: percentage of women 15–49 years old who have undergone FGM/C; (b) girls: percentage of girls 0–14 years old who have undergone FGM/C (as reported by their mothers); (c) support for the practice: percentage of women 15–49 years old who have heard about FGM/C and think the practice should continue.Justification of wife-beating – Percentage of women and men 15–49 years old who consider a husband to be justified in hitting or beating his wife for at least one of the specified reasons, i.e., if his wife burns the food, argues with him, goes out without telling him, neglects the children or refuses sexual relations.Violent discipline – Percentage of children 1–14 years old who experience any violent discipline (psychological aggression and/or physical punishment).
Child labour –Demographic and Health Surveys (DHS), Multiple Indicator Cluster Surveys (MICS) and other national surveys.Child marriage – DHS, MICS and other national surveys.Birth registration – DHS, MICS, other national surveys, censuses and vital registration systems.
Female genital mutilation/cutting – DHS, MICS and other national surveys.Justification of wife-beating – DHS, MICS and other national surveys.Violent discipline – DHS, MICS and other national surveys.
– Data not available.v Estimates of 100% were assumed
given that civil registration systems in these countries are complete and all vital events (including births) are registered. Source: United Nations, Department of Economic and Social Affairs, Statistics Division, Population and Vital Statistics Report, Series A Vol. LXV, New York, 2013.
x Data refer to years or periods other than those specified in the column heading. Such data are not included in the calculation of regional and global averages.
y Data differ from the standard defini-tion or refer to only part of a country. If they fall within the noted reference period, such data are included in the calculation of regional and global averages.
+ A more detailed explanation of the methodology and the changes in calculating these estimates can be found in the General Note on the Data, page 146.
++ Changes in the definition of birth reg-istration were made from the second and third rounds of MICS (MICS2 and MICS3) to the fourth round (MICS4). In order to allow for comparability with later rounds, data from MICS2 and MICS3 on birth registration were recalculated according to the MICS4 indicator definition. Therefore, the recalculated data presented here may differ from estimates included in MICS2 and MICS3 national reports.
* Data refer to the most recent year available during the period specified in the column heading.
** Excludes China.
NOTESDEFINITIONS OF THE INDICATORS
MAIN DATA SOURCES
Italicized data are from different sources than the data presented for the same indicators in other tables of the report.

UNICEF – THE STATE OF THE WORLD’S CHILDREN 2017
Countries and areas
Adolescent populationAdolescents
currently married/ in union
(%)2010–2016*
Births by age 18
(%)Adolescent
birth rate
Justification of wife-beating among
adolescents (%)
2010–2016*
Use of mass media among adolescents
(%)2010–2016*
Lower secondary
school gross enrolment ratio
Upper secondary
school gross enrolment ratio
Comprehensive knowledge of HIV
among adolescents (%)
2011–2016* Aged 10–19 (thousands)
Proportion of total
population (%)
2016 2016 male female2011–2016* 2009–2014* male female male female 2011–2016* male female
Afghanistan 8,587 25 3 17 20 90 x 71 y 78 y 70 y 52 y 67 43 4 1Albania 446 15 1 x 8 x 3 x 18 37 x 24 x 97 x 99 x 101 89 21 x 36 xAlgeria 5,942 15 – 3 1 12 – 55 y – – 132 63 – 7Andorra – – – – – 5 – – – – – – – – Angola 6,486 23 2 18 38 191 24 25 84 77 36 21 29 31Anguilla – – – – – 46 x – – – – – – – – Antigua and Barbuda 17 17 – – – 67 x – – – – 117 82 55 x 40 xArgentina 7,020 16 – – 12 70 – 2 – – 128 85 – 36Armenia 356 12 0 5 1 23 25 9 88 92 88 90 9 15Australia 2,897 12 – – – 14 – – – – 112 186 – – Austria 873 10 – – – 8 – – – – 100 100 – – Azerbaijan 1,358 14 – 9 4 47 – 24 – 98 91 – 2 x 3 xBahamas 55 14 – – – 40 x – – – – – – – – Bahrain 158 11 – – – 15 – – – – 101 103 – – Bangladesh 32,575 20 – 44 36 83 – 29 y – 54 y 83 48 – 12Barbados 37 13 – 1 7 49 x – 5 – 98 107 113 – 66Belarus 904 10 1 7 3 x 22 3 3 – – 102 119 53 51Belgium 1,253 11 – – – 8 – – – – 185 158 – – Belize 78 21 11 21 17 64 8 6 92 92 91 60 – 39Benin 2,440 22 1 16 19 98 19 31 68 57 70 38 29 22Bhutan 148 19 – 15 15 x 28 – 70 – – 96 69 – 22 x,pBolivia (Plurinational State of) 2,216 20 4 x 13 x 20 x 89 x – 17 x 100 x 97 x 96 81 24 x 20 xBosnia and Herzegovina 410 12 0 1 – 11 5 1 100 100 – – 41 42Botswana 431 19 – – – 39 – – – – 91 – – – Brazil 33,760 16 1 4 – 65 – – – – 106 91 – – British Virgin Islands – – – – – 27 x – – – – 111 80 – – Brunei Darussalam 70 16 – – – 17 x – – – – 105 93 – – Bulgaria 620 9 – 2 y 5 43 – – – – 90 108 – – Burkina Faso 4,306 23 2 32 28 x 136 x 40 39 61 55 47 13 31 x 29 xBurundi 2,243 21 1 9 11 x 65 x 56 74 83 69 54 25 50 46Cabo Verde 114 21 2 x 8 x 22 x 92 x 24 x 23 x 88 x 88 x 115 73 – – Cambodia 3,052 19 3 16 7 57 26 y 46 y 77 74 63 – 42 33Cameroon 5,206 22 1 20 28 128 x 45 37 80 64 68 43 30 26Canada 3,968 11 – – – 13 – – – – 100 119 – – Central African Republic 1,117 24 11 55 45 x 229 83 79 – – 23 9 26 x 17 xChad 3,433 24 3 38 51 203 54 69 30 23 26 18 12 10Chile 2,591 14 – – – 50 – – – – 103 100 – – China 159,642 11 1 2 – 6 – – – – 99 90 – – Colombia 8,139 17 – 13 20 85 x – – – – 106 82 – 21 xComoros 173 22 8 16 17 71 29 43 79 67 66 52 21 18Congo 1,083 21 2 16 26 147 76 y 73 y 56 68 65 38 25 p 16Cook Islands – – – – – 56 – – – – 96 73 – – Costa Rica 759 16 2 10 13 67 – 3 – – 133 109 – 29Côte d'Ivoire 5,409 23 1 21 31 125 51 51 73 62 55 28 21 15Croatia 447 11 – – – 12 – – – – 104 93 – – Cuba 1,336 12 7 16 6 50 5 y 4 y – – 101 100 48 59Cyprus 143 12 – – – 4 – – – – 100 100 – – Czechia 936 9 – – – 11 – – – – 101 110 – – Democratic People's Republic of Korea 3,839 15 – – – 1 x – – – – 92 95 – 7 x
Democratic Republic of the Congo 17,401 22 1 21 27 135 69 75 49 38 56 37 20 17Denmark 690 12 – – – 2 – – – – 117 144 – – Djibouti 196 21 1 3 – 21 – – – – 53 41 – 16 xDominica – – – – – 47 x – – – – 115 81 39 x 49 xDominican Republic 2,007 19 – 28 21 90 – 3 – 98 86 74 39 – Ecuador 3,005 18 – 16 x – 100 x – – – – 116 96 – – Egypt 17,041 18 – 14 7 56 – 46 y 100 100 99 73 5 3El Salvador 1,289 20 – 16 18 63 – 10 – 98 99 61 25 28Equatorial Guinea 217 18 5 22 42 177 x 56 57 91 91 39 – 12 17Eritrea 1,085 22 1 17 19 x – 60 51 70 54 39 23 32 x 22 xEstonia 122 9 – – – 16 – – – – 112 118 – – Ethiopia 24,772 24 1 17 22 71 33 60 38 31 43 18 32 24Fiji 157 17 – – – 28 x – – – – 103 76 – – Finland 594 11 – – – 7 – – – – 102 194 – –
TABLE 9. ADOLESCENTS

187
Countries and areas
Adolescent populationAdolescents
currently married/ in union
(%)2010–2016*
Births by age 18
(%)Adolescent
birth rate
Justification of wife-beating among
adolescents (%)
2010–2016*
Use of mass media among adolescents
(%)2010–2016*
Lower secondary
school gross enrolment ratio
Upper secondary
school gross enrolment ratio
Comprehensive knowledge of HIV
among adolescents (%)
2011–2016* Aged 10–19 (thousands)
Proportion of total
population (%)
2016 2016 male female2011–2016* 2009–2014* male female male female 2011–2016* male female
France 7,723 12 – – – 9 – – – – 108 115 – – Gabon 379 19 1 14 28 115 47 58 95 94 – – 35 29Gambia 467 23 0 24 19 88 42 58 82 70 64 – 27 22Georgia 450 11 – 11 6 x 40 – 5 x – – 114 95 – – Germany 7,795 10 – – – 8 – – – – 101 105 – – Ghana 6,009 21 1 6 17 65 20 35 81 67 89 39 25 18Greece 1,108 10 – – – 9 – – – – 101 111 – – Grenada 19 17 – – – 53 x – – – – 100 98 67 x 59 xGuatemala 3,787 23 6 20 20 92 12 14 95 90 72 55 18 20Guinea 2,786 22 1 33 40 154 63 89 55 53 44 31 29 20Guinea-Bissau 395 22 0 11 28 137 37 40 96 89 – – 19 20Guyana 165 21 13 13 16 97 x 14 10 95 96 93 83 33 48Haiti 2,285 21 2 12 13 65 22 24 85 80 – – 25 32Holy See – – – – – – – – – – – – – – Honduras 1,990 22 5 23 22 99 18 15 98 94 74 66 33 29Hungary 996 10 – – – 20 – – – – 100 110 – – Iceland 43 13 – – – 7 – – – – 97 133 – – India 250,086 19 5 x 30 x 22 x 39 47 x 45 x 88 x 72 x 88 64 35 x 19 xIndonesia 46,188 18 – 9 y 7 47 48 y 45 88 y,p 91 95 76 4 p 9Iran (Islamic Republic of) 10,928 14 – 16 x 5 x 35 – – – – 99 85 – – Iraq 8,019 22 – 21 12 68 x – 50 – – – – – 3Ireland 583 12 – – – 9 – – – – 111 154 – – Israel 1,296 16 – – – 10 – – – – 104 101 – – Italy 5,592 9 – – – 6 – – – – 106 101 – – Jamaica 520 18 – 3 15 72 x – 8 – – 86 76 34 39Japan 11,650 9 – – – 4 – – – – 102 101 – – Jordan 1,918 20 – 6 4 27 – 84 y – 100 y 87 74 – 6Kazakhstan 2,269 13 – 6 2 31 x – 8 – 96 114 103 30 – Kenya 11,065 23 1 12 23 101 37 45 84 75 97 – 58 52Kiribati 23 20 5 x 16 x 9 x 49 65 x 77 x 58 x 57 x 105 – 46 x 41 xKuwait 450 11 – – – 8 – – – – 99 85 – – Kyrgyzstan 991 17 – 14 4 42 – 22 – 100 97 81 18 – Lao People's Democratic Republic 1,432 21 9 25 18 94 50 56 92 93 76 43 25 23Latvia 181 9 – – – 15 – – – – 116 123 – – Lebanon 1,061 18 – 3 x – 18 x – 22 x,y – – 68 55 – – Lesotho 495 22 1 18 14 94 49 48 60 66 63 40 30 35Liberia 1,041 23 2 14 37 147 29 45 59 47 44 29 19 35Libya 1,093 17 – – – 4 x – – – – – – – – Liechtenstein – – – – – 2 – – – – 98 139 – – Lithuania 307 11 – – – 14 – – – – 106 114 – – Luxembourg 65 11 – – – 6 – – – – 114 94 – – Madagascar 5,740 23 7 28 36 147 x 44 47 62 59 50 22 24 21Malawi 4,262 24 3 24 31 143 24 21 50 35 53 22 43 39Malaysia 5,513 18 5 6 – 13 – – – – 89 69 – – Maldives 59 14 – 5 x 1 x 14 – 41 x,y – 100 x 97 – – 22 xMali 4,135 23 2 40 37 178 54 68 83 75 52 29 27 21Malta 44 10 – – – 16 – – – – 102 90 – – Marshall Islands – – 5 x 21 x 21 x 85 71 x 47 x 86 x 85 x 81 67 35 x 27 xMauritania 917 21 1 28 22 71 – 36 55 x 44 x 37 21 10 – Mauritius 189 15 – – – 31 – – – – 111 84 – – Mexico 23,416 18 6 15 21 84 – 6 – 96 116 65 – 28Micronesia (Federated States of) 25 24 – – – 33 – – – – 81 – – – Monaco – – – – – – – – – – – – – – Mongolia 448 15 1 5 3 40 9 14 98 98 93 90 17 18Montenegro 81 13 0 2 3 12 5 2 – – 95 86 35 42Montserrat – – – – – 36 – – – – – – – – Morocco 5,982 17 1 11 8 x 32 x – 64 x – 90 x 97 55 – – Mozambique 6,649 23 8 37 40 166 20 24 73 57 39 21 28 28Myanmar 10,042 19 5 13 5 17 x 57 53 75 76 59 34 14 13Namibia 539 22 1 5 15 78 30 28 65 y 69 92 – 51 56Nauru – – 9 x 18 x 22 x 106 – – 89 x 86 x 77 94 8 x 8 xNepal 6,625 23 – 25 16 87 x – 35 – 77 93 50 24 18Netherlands 2,021 12 – – – 5 – – – – 136 134 – –
TABLE 9. ADOLESCENTS

UNICEF – THE STATE OF THE WORLD’S CHILDREN 2017
Countries and areas
Adolescent populationAdolescents
currently married/ in union
(%)2010–2016*
Births by age 18
(%)Adolescent
birth rate
Justification of wife-beating among
adolescents (%)
2010–2016*
Use of mass media among adolescents
(%)2010–2016*
Lower secondary
school gross enrolment ratio
Upper secondary
school gross enrolment ratio
Comprehensive knowledge of HIV
among adolescents (%)
2011–2016* Aged 10–19 (thousands)
Proportion of total
population (%)
2016 2016 male female2011–2016* 2009–2014* male female male female 2011–2016* male female
New Zealand 616 13 – – – 22 – – – – 103 134 – – Nicaragua 1,207 20 – 24 x 28 x 92 – 19 x,y – 95 x – – – – Niger 4,704 23 3 61 48 210 41 54 35 44 27 10 21 12Nigeria 41,050 22 1 29 29 123 27 33 54 50 52 60 29 22Niue – – – – – 16 – – – – 119 95 – – Norway 633 12 – – – 6 – – – – 100 125 – – Oman 480 11 – 3 2 12 – 10 – – 113 96 – – Pakistan 38,907 20 2 14 8 48 33 y,p 53 y 59 y,p 49 y 57 35 5 p 1Palau – – – – – 27 – – – – 78 119 – – Panama 696 17 – 14 – 89 – 9 – 96 94 57 – – Papua New Guinea 1,728 21 3 x 15 x 14 x 65 x – – – – 73 22 – – Paraguay 1,342 20 – 11 x – 63 x – – – – 84 69 – – Peru 5,606 18 – 11 16 68 – – – 90 100 90 – 21 xPhilippines 20,667 20 – 10 8 59 – 14 – 90 92 77 – 19 xPoland 3,814 10 – – – 14 – – – – 101 115 – – Portugal 1,080 10 – – – 12 – – – – 119 119 – – Qatar 200 8 1 4 – 16 22 6 y 98 98 100 82 23 10Republic of Korea 5,686 11 – – – 2 – – – – 103 95 – – Republic of Moldova 444 11 1 10 4 25 14 13 96 96 87 85 26 35Romania 2,132 11 – – – 36 – – – – 93 92 – – Russian Federation 13,260 9 – – – 27 – – – – 101 114 – – Rwanda 2,607 22 0 3 6 41 x 24 45 78 71 42 31 60 62Saint Kitts and Nevis – – – – – 75 x – – – – 93 86 55 x 54 xSaint Lucia 29 16 – 4 – 50 x – 15 – 99 87 82 – 58Saint Vincent and the Grenadines 19 17 – – – 70 – – – – 120 86 – – Samoa 43 22 1 8 6 39 28 34 99 97 102 78 5 x 2 xSan Marino – – – – – 1 – – – – 94 95 – – Sao Tome and Principe 46 23 1 15 27 110 x 19 24 97 97 110 61 42 41Saudi Arabia 4,818 15 – – – 7 x – – – – 108 108 – – Senegal 3,380 22 0 21 18 80 36 57 69 76 59 36 28 26Serbia 1,063 12 – 4 1 22 – 2 99 100 102 91 43 x 53 xSeychelles 12 12 – – – 62 – – – – 112 59 – – Sierra Leone 1,704 23 1 19 36 131 32 55 55 49 61 28 29 28Singapore 665 12 – – – 3 – – – – – – – – Slovakia 553 10 – – – 21 – – – – 98 86 – – Slovenia 186 9 – – – 5 – – – – 100 118 – – Solomon Islands 134 22 2 11 15 62 x 60 78 37 28 78 29 26 x 29 xSomalia 3,333 23 – 25 x – 123 x – 75 x,y – – – – – 3 xSouth Africa 10,319 18 2 x 4 x 15 x 54 x – – – – 97 88 – – South Sudan 2,767 23 – 40 28 x 158 x – 72 – – 18 5 – 8 xSpain 4,386 9 – – – 9 – – – – 124 136 – – Sri Lanka 3,284 16 – 9 x 4 x 24 x – 54 x,y – 88 x,y 99 99 – – State of Palestine 1,083 23 – 9 22 67 – – – – 88 66 – 5Sudan 9,060 23 – 21 22 102 – 36 – – 54 35 10 – Suriname 99 18 – 12 – 66 x – 19 – 99 101 54 – 40 xSwaziland 302 23 0 4 17 89 29 32 89 86 75 52 44 45Sweden 1,025 10 – – – 3 – – – – 115 164 – – Switzerland 833 10 – – – 3 – – – – 106 98 – – Syrian Arab Republic 4,586 25 – 10 x 9 x 75 x – – – – 61 32 – 6 xTajikistan 1,710 20 – 13 2 47 – 47 – 89 98 68 9 – Thailand 9,207 13 7 14 9 60 9 9 – – 128 130 45 47The formeryugoslav Republic of Macedonia 253 12 – 4 2 19 – 14 – – 83 76 – 23 x
Timor-Leste 314 25 0 8 9 x 54 x 72 81 61 62 87 65 15 x 11 xTogo 1,665 22 1 13 15 77 19 26 67 63 68 36 28 23Tokelau – – – – – 30 – – – – 206 – – – Tonga 24 23 4 5 2 30 29 27 92 95 103 56 13 10Trinidad and Tobago 177 13 – 6 x – 36 x – 10 x – – – – – 49 xTunisia 1,618 14 – 1 1 7 – 27 – 98 103 78 – 15Turkey 13,335 17 – 7 6 29 – 10 – – 99 106 – – Turkmenistan 954 17 – 6 1 21 x – 17 – 100 73 120 – 19Turks and Caicos Islands – – – – – 29 x – – – – – – – – Tuvalu – – 2 x 8 x 3 x 42 x 83 x 69 x 89 x 95 x 99 56 57 x 31 xUganda 9,920 24 2 20 33 140 52 62 88 82 – – 40 41
TABLE 9. ADOLESCENTS

189
Countries and areas
Adolescent populationAdolescents
currently married/ in union
(%)2010–2016*
Births by age 18
(%)Adolescent
birth rate
Justification of wife-beating among
adolescents (%)
2010–2016*
Use of mass media among adolescents
(%)2010–2016*
Lower secondary
school gross enrolment ratio
Upper secondary
school gross enrolment ratio
Comprehensive knowledge of HIV
among adolescents (%)
2011–2016* Aged 10–19 (thousands)
Proportion of total
population (%)
2016 2016 male female2011–2016* 2009–2014* male female male female 2011–2016* male female
Ukraine 4,059 9 0 7 4 27 2 2 97 96 102 93 37 43United Arab Emirates 682 7 – – – 34 – – – – 92 – – – United Kingdom 7,309 11 – – – 21 – – – – 113 138 – – United Republic of Tanzania 12,505 23 2 23 22 128 x 50 59 61 57 43 9 42 37United States 42,010 13 – – – 27 – – – – 102 93 – – Uruguay 508 15 – 7 – 60 – 3 – – 110 81 – 36Uzbekistan 5,360 17 – 5 x 2 x 26 x 63 x 63 x – – 97 95 – 27 xVanuatu 54 20 4 11 13 78 63 56 58 58 70 34 – 14 xVenezuela (Bolivarian Republic of) 5,655 18 – 16 24 101 – – – – 97 79 – – Viet Nam 13,605 14 – 10 5 36 – 28 – 97 97 – – 51Yemen 6,297 23 – 17 17 67 – 49 – 85 58 39 – 2 xZambia 3,956 24 1 17 31 145 41 49 75 69 63 – 42 39Zimbabwe 3,557 22 1 20 22 120 49 54 57 53 68 37 41 41
SUMMARYEast Asia and Pacific 297,721 13 2 6 7 ** 21 43 ** 34 ** – 89 ** 96 87 13 ** 22 **Europe and Central Asia 101,795 11 – – – 19 – – – – 104 112 – –
Eastern Europe and Central Asia 50,903 12 – 7 4 29 – 12 – – 100 102 – – Western Europe 50,892 10 – – – 11 – – – – 109 119 – –
Latin America and Caribbean 109,829 17 3 11 19 74 – – – – 107 81 – – Middle East and North Africa 73,653 17 – 13 8 41 – 49 – – 96 70 – – North America 45,978 13 – – – 25 – – – – 102 96 – – South Asia 340,270 19 – – 20 ‡ 44 – – – – 83 59 8 ‡ 6 ‡Sub-Saharan Africa 232,069 22 2 23 28 122 39 49 61 54 53 37 31 27
Eastern and Southern Africa 122,663 23 2 20 26 113 38 49 64 56 52 31 36 35West and Central Africa 109,406 22 1 27 29 130 41 48 58 52 54 42 26 20
Least developed countries 217,756 22 2 26 27 112 45 50 62 57 55 33 27 23World 1,201,315 16 – 16 18 ‡** 50 – 35 ** – – 86 70 – 21 ‡**
For a complete list of countries and areas in the regions, subregions and country categories, see page 150 or visit <data.unicef.org/regionalclassifications>.It is not advisable to compare data from consecutive editions of The State of the World’s Children.
TABLE 9. ADOLESCENTS
Adolescents currently married/ in union – Percentage of boys and girls aged 15–19 who are currently married or in union. This indicator is meant to provide a snapshot of the current marital status of boys and girls in this age group. However, it is worth noting that those not married at the time of the survey are still exposed to the risk of marrying before they exit adolescence.Births by age 18 – Percentage of women aged 20–24 who gave birth before age 18. This standardized indicator from population-based surveys captures levels of fertility among adolescents up to the age of 18. Note that the data are based on the answers of women aged 20–24, whose risk of giving birth before the age of 18 is behind them.Adolescent birth rate – Number of births per 1,000 adolescent girls aged 15–19.Justification of wife-beating among adolescents – The percentage of boys and girls aged 15–19 who consider a husband to be justified in hitting or beating his wife for at least one of the specified reasons: if his wife burns the food, argues with him, goes out without telling him, neglects the children or refuses sexual relations.
Use of mass media among adolescents – The percentage of boys and girls aged 15–19 who make use of at least one of the following types of information media at least once a week: newspaper, magazine, television or radio.Lower secondary school gross enrolment ratio – Number of children enrolled in lower secondary school, regardless of age, expressed as a percentage of the total number of children of official lower secondary school age.Upper secondary school gross enrolment ratio – Number of children enrolled in upper secondary school, regardless of age, expressed as a percentage of the total number of children of official upper secondary school age.Comprehensive knowledge of HIV among adolescents – Percentage of young men and women aged 15–19 who correctly identify the two major ways of preventing the sexual transmission of HIV (using condoms and limiting sex to one faithful, uninfected partner), who reject the two most common local misconceptions about HIV transmission and who know that a healthy-looking person can be HIV-positive.
Adolescent population – United Nations Population Division.Adolescents currently married/ in union – Demographic and Health Surveys (DHS), Multiple Indicator Cluster Surveys (MICS), other national surveys and censuses.Births by age 18 – DHS, MICS and other national surveys.Adolescent birth rate – United Nations Population Division.
Justification of wife-beating among adolescents – DHS, MICS and other national surveys.Use of mass media among adolescents – DHS, MICS and other national surveys.Gross enrolment ratio – UNESCO Institute for Statistics (UIS).Comprehensive knowledge of HIV among adolescents – AIDS Indicator Surveys (AIS), DHS, MICS and other national household surveys.
– Data not availablep Based on small denominators
(typically 25–49 unweighted cases).x Data refer to years or periods other
than those specified in the column heading. Such data are not included in the calculation of regional and global averages. Data from years prior to 2000 are not displayed.
y Data differ from the standard defini-tion or refer to only part of a country. If they fall within the noted reference period, such data are included in the calculation of regional and global averages.
* Data refer to the most recent year available during the period specified in the column heading.
** Excludes China. ‡ Excludes India.
NOTES
MAIN DATA SOURCESDEFINITIONS OF THE INDICATORS
Italicized data are from different sources than the data presented for the same indicators in other tables of the report.

UNICEF – THE STATE OF THE WORLD’S CHILDREN 2017
Countries and areas
Birth registration (%)++
2010–2016*
Skilled birth attendant (%)
2011–2016*
Stunting prevalence in children under 5
(moderate & severe)θ (%) 2011–2016*
Oral rehydration salts (ORS) treatment for children with diarrhoea
(%) 2011–2016*
Primary school net attendance ratio
2011–2016*
Comprehensive knowledge of HIV/AIDS
(%) Females 15–242011–2016*
Use of basic sanitation services
(%)2015
urban rural
ratio of urban
to rural urban rural
ratio of urban
to rural urban rural
ratio of rural to urban urban rural
ratio of urban to
rural urban rural
ratio of urban to
rural urban rural
ratio of urban to
rural urban rural
ratio of urban
to rural
Afghanistan 64 36 1.8 79 42 1.9 – – – 44 47 0.9 80 59 1.4 2 1 2.1 56 33 1.7Albania 99 x 98 x 1.0 x 100 x 99 x 1.0 x 23 x 23 x 1.0 x – – – 93 92 1.0 51 x 26 x 2.0 x 98 97 1.0Algeria 100 100 1.0 98 95 1.0 11 12 1.1 25 26 1.0 98 97 1.0 11 7 1.7 90 82 1.1Andorra – – – – – – – – – – – – – – – – – – 100 100 1.0Angola 33 14 2.4 68 21 3.2 32 46 1.4 49 32 1.5 84 61 1.4 42 9 4.4 62 21 2.9Anguilla – – – – – – – – – – – – – – – – – – 97 – –Antigua and Barbuda – – – – – – – – – – – – – – – – – – – – –Argentina – – – – – – – – – – – – – – – – – – 95 94 1.0Armenia 99 98 1.0 100 100 1.0 6 13 2.2 – – – 100 99 1.0 25 14 1.7 96 83 1.2Australia – – – – – – – – – – – – – – – – – – – – –Austria – – – – – – – – – – – – – – – – – – 100 100 1.0Azerbaijan 96 x 92 x 1.0 x 99 95 1.0 15 21 1.4 11 11 1.0 68 y 67 y 1.0 y 7 x 2 x 3.3 x 92 87 1.1Bahamas – – – – – – – – – – – – – – – – – – – – –Bahrain – – – – – – – – – – – – – – – – – – – – –Bangladesh 23 19 1.2 61 36 1.7 31 38 1.2 83 75 1.1 91 92 1.0 14 8 1.8 54 43 1.2Barbados 98 100 1.0 98 100 1.0 8 7 0.9 – – – 100 99 1.0 67 69 1.0 – – –Belarus – – – 100 100 1.0 3 x 8 x 2.6 x – – – 91 93 1.0 56 57 1.0 94 95 1.0Belgium – – – – – – – – – – – – – – – – – – 99 99 1.0Belize 97 95 1.0 98 96 1.0 11 18 1.7 54 56 1.0 99 94 1.0 55 33 1.7 91 84 1.1Benin 88 82 1.1 83 73 1.2 29 38 1.3 26 25 1.1 83 69 1.2 25 18 1.3 25 5 4.6Bhutan 100 100 1.0 96 67 1.4 28 x 36 x 1.3 x 64 x 60 x 1.1 x 98 94 1.0 32 x 15 x 2.1 x 72 57 1.3Bolivia (Plurinational State of) 79 x,y 72 x,y 1.1 x,y 94 68 1.4 14 25 1.8 23 20 1.2 98 x 96 x 1.0 x 32 x 9 x 3.5 x 64 27 2.4Bosnia and Herzegovina 99 x 100 x 1.0 x 100 100 1.0 11 8 0.7 – – – 95 97 1.0 50 47 1.1 99 92 1.1Botswana 78 x 67 x 1.2 x 99 x 90 x 1.1 x – – – – – – – – – – – – 75 39 1.9Brazil – – – 98 x 94 x 1.0 x 7 x 8 x 1.1 x – – – – – – – – – 91 58 1.6British Virgin Islands – – – – – – – – – – – – – – – – – – – – –Brunei Darussalam – – – – – – – – – – – – – – – – – – 96 97 1.0Bulgaria – – – – – – – – – – – – – – – – – – 87 84 1.0Burkina Faso 93 74 1.3 95 77 1.2 21 x 37 x 1.8 x 46 38 1.2 83 45 1.8 46 x 24 x 1.9 x 48 12 4.0Burundi 87 74 1.2 96 84 1.1 28 59 2.1 30 36 0.8 91 84 1.1 61 51 1.2 46 51 0.9Cabo Verde – – – 91 x 64 x 1.4 x – – – – – – – – – – – – 73 51 1.4Cambodia 84 72 1.2 98 88 1.1 24 34 1.4 30 36 0.8 97 92 1.1 55 33 1.7 88 39 2.3Cameroon 84 53 1.6 88 49 1.8 23 38 1.7 24 12 2.1 94 79 1.2 37 18 2.1 56 19 2.9Canada – – – – – – – – – – – – – – – – – – – – –Central African Republic 78 52 1.5 74 x 22 x 3.4 x 38 42 1.1 23 x 12 x 2.0 x 86 66 1.3 19 x 16 x 1.2 x 49 9 5.4Chad 36 6 5.6 54 12 4.6 32 42 1.3 28 18 1.5 72 45 1.6 25 6 4.0 33 3 11.3Chile – – – 100 x 99 x 1.0 x – – – – – – – – – – – – 100 99 1.0China – – – 100 100 1.0 4 11 2.6 – – – 97 y 96 y 1.0 y – – – 86 61 1.4Colombia 99 98 1.0 99 88 1.1 11 x 17 x 1.5 x 57 x 49 x 1.2 x 94 94 1.0 26 x 17 x 1.5 x 88 72 1.2Comoros 90 87 1.0 92 79 1.2 26 35 1.4 40 37 1.1 90 82 1.1 24 17 1.4 47 29 1.6Congo 95 85 1.1 98 84 1.2 20 30 1.5 31 22 1.4 – – – 16 10 1.5 20 6 3.6Cook Islands – – – – – – – – – – – – – – – – – – – – –Costa Rica 100 99 1.0 99 97 1.0 – – – 43 35 1.2 97 95 1.0 37 27 1.4 98 94 1.0Côte d'Ivoire 85 54 1.6 84 45 1.9 22 34 1.6 22 14 1.5 85 71 1.2 22 8 2.7 45 13 3.5Croatia – – – – – – – – – – – – – – – – – – 98 96 1.0Cuba 100 100 1.0 99 100 1.0 – – – 62 59 1.0 – – – 61 63 1.0 92 88 1.0Cyprus – – – – – – – – – – – – – – – – – – 100 99 1.0Czechia – – – – – – – – – – – – – – – – – – 99 99 1.0Democratic People's Republic of Korea 100 x 100 x 1.0 x 100 x 100 x 1.0 x 23 x 45 x 1.9 x 75 x 73 x 1.0 x 100 99 1.0 11 x 4 x 2.8 x 83 68 1.2
Democratic Republic of the Congo 30 22 1.3 94 74 1.3 33 47 1.4 44 37 1.2 93 84 1.1 24 15 1.6 23 18 1.3Denmark – – – – – – – – – – – – – – – – – – 100 100 1.0Djibouti 92 x 84 x 1.1 x 98 55 1.8 30 42 1.4 – – – – – – 18 x 9 x 2.0 x 63 13 4.8Dominica – – – – – – – – – – – – – – – – – – – – –Dominican Republic 90 82 1.1 98 97 1.0 7 6 0.9 50 42 1.2 – – – 49 38 1.3 85 74 1.2Ecuador 95 91 1.0 98 x 99 x 1.0 x – – – 52 35 1.5 97 y 97 y 1.0 y – – – 89 80 1.1Egypt 100 99 1.0 97 89 1.1 23 21 0.9 26 29 0.9 97 97 1.0 5 4 1.5 97 90 1.1El Salvador 98 99 1.0 99 96 1.0 11 17 1.5 72 68 1.1 97 95 1.0 37 22 1.7 93 87 1.1Equatorial Guinea 60 47 1.3 86 53 1.6 20 32 1.6 55 27 2.0 – – – 27 9 2.9 80 71 1.1Eritrea – – – 74 x 17 x 4.4 x 38 x 56 x 1.4 x 51 x 41 x 1.2 x 91 y 77 y 1.2 y 32 x 20 x 1.7 x 29 6 4.7Estonia – – – – – – – – – – – – – – – – – – 100 100 1.0Ethiopia 12 2 7.2 80 21 3.8 25 40 1.6 41 28 1.4 80 y 63 y 1.3 y 38 19 2.0 18 4 4.3Fiji – – – – – – – – – – – – – – – – – – 96 95 1.0Finland – – – – – – – – – – – – – – – – – – 99 99 1.0
TABLE 10. DISPARITIES BY RESIDENCE

191TABLE 10. DISPARITIES BY RESIDENCE
Countries and areas
Birth registration (%)++
2010–2016*
Skilled birth attendant (%)
2011–2016*
Stunting prevalence in children under 5
(moderate & severe)θ (%) 2011–2016*
Oral rehydration salts (ORS) treatment for children with diarrhoea
(%) 2011–2016*
Primary school net attendance ratio
2011–2016*
Comprehensive knowledge of HIV/AIDS
(%) Females 15–242011–2016*
Use of basic sanitation services
(%)2015
urban rural
ratio of urban
to rural urban rural
ratio of urban
to rural urban rural
ratio of rural to urban urban rural
ratio of urban to
rural urban rural
ratio of urban to
rural urban rural
ratio of urban to
rural urban rural
ratio of urban
to rural
France – – – – – – – – – – – – – – – – – – 99 99 1.0Gabon 89 91 1.0 93 69 1.3 15 30 2.0 27 21 1.3 98 98 1.0 32 15 2.2 42 32 1.3Gambia 72 72 1.0 75 41 1.9 19 29 1.5 62 57 1.1 74 y 58 y 1.3 y 32 18 1.8 46 35 1.3Georgia 100 100 1.0 99 x 98 x 1.0 x 10 x 12 x 1.2 x 44 x 36 x 1.2 x 98 97 1.0 – – – 95 73 1.3Germany – – – – – – – – – – – – – – – – – – 99 99 1.0Ghana 79 63 1.3 87 57 1.5 15 22 1.5 48 49 1.0 75 66 1.1 23 17 1.4 19 9 2.1Greece – – – – – – – – – – – – – – – – – – 99 98 1.0Grenada – – – – – – – – – – – – – – – – – – – – –Guatemala 97 y 96 y 1.0 y 84 55 1.5 35 53 1.5 51 48 1.1 96 92 1.0 30 16 1.9 81 53 1.5Guinea 83 49 1.7 84 32 2.7 18 36 2.0 46 30 1.5 82 49 1.7 32 16 2.0 34 15 2.3Guinea-Bissau 34 18 2.0 72 29 2.5 21 32 1.5 42 30 1.4 74 53 1.4 26 18 1.4 35 8 4.1Guyana 91 88 1.0 99 82 1.2 10 13 1.3 – – – 96 97 1.0 64 47 1.4 89 85 1.0Haiti 85 77 1.1 59 25 2.4 16 25 1.6 56 51 1.1 90 81 1.1 41 29 1.4 37 22 1.7Holy See – – – – – – – – – – – – – – – – – – – – –Honduras 95 93 1.0 94 73 1.3 15 29 2.0 59 61 1.0 92 92 1.0 42 23 1.9 84 75 1.1Hungary – – – – – – – – – – – – – – – – – – 98 99 1.0Iceland – – – – – – – – – – – – – – – – – – 99 100 1.0India 83 67 1.2 90 78 1.2 31 41 1.3 59 48 1.2 88 x 82 x 1.1 x 33 x 14 x 2.4 x 65 34 1.9Indonesia 79 y 65 y 1.2 y 97 88 1.1 32 41 1.3 41 37 1.1 100 99 1.0 14 9 1.6 77 57 1.4Iran (Islamic Republic of) 99 y 98 y 1.0 y 98 x 93 x 1.1 x 5 9 1.7 64 x 58 x 1.1 x 97 95 1.0 – – – 92 79 1.2Iraq 99 99 1.0 94 85 1.1 22 24 1.1 25 19 1.3 94 84 1.1 4 1 3.7 86 86 1.0Ireland – – – – – – – – – – – – – – – – – – 91 95 1.0Israel – – – – – – – – – – – – – – – – – – 100 100 1.0Italy – – – – – – – – – – – – – – – – – – 99 99 1.0Jamaica 100 99 1.0 100 98 1.0 – 3 – – – – 98 98 1.0 – – – 84 87 1.0Japan – – – – – – – – – – – – – – – – – – – – –Jordan 99 100 1.0 100 100 1.0 8 9 1.2 20 23 0.9 98 98 1.0 8 11 0.7 97 96 1.0Kazakhstan 100 100 1.0 99 99 1.0 7 9 1.2 – – – 99 100 1.0 31 21 1.5 97 99 1.0Kenya 79 61 1.3 82 50 1.6 20 29 1.5 58 52 1.1 89 84 1.1 63 52 1.2 35 28 1.3Kiribati 95 x 93 x 1.0 x 84 x 77 x 1.1 x – – – – – – – – – 45 x 43 x 1.1 x 49 32 1.5Kuwait – – – – – – – – – – – – – – – – – – – – –Kyrgyzstan 99 97 1.0 99 98 1.0 12 13 1.1 34 33 1.0 99 100 1.0 18 21 0.9 93 99 0.9Lao People's Democratic Republic 88 71 1.2 79 29 2.7 27 49 1.8 65 40 1.6 95 83 1.1 39 18 2.2 93 60 1.6Latvia – – – – – – – – – – – – – – – – – – 97 84 1.2Lebanon – – – – – – – – – – – – – – – – – – – – –Lesotho 54 40 1.3 90 73 1.2 27 35 1.3 53 54 1.0 94 91 1.0 44 35 1.3 46 43 1.1Liberia 29 y 20 y 1.5 y 73 50 1.5 31 34 1.1 57 63 0.9 52 31 1.7 40 27 1.5 28 6 4.7Libya – – – – – – – – – – – – – – – – – – – – –Liechtenstein – – – – – – – – – – – – – – – – – – – – –Lithuania – – – – – – – – – – – – – – – – – – 97 86 1.1Luxembourg – – – – – – – – – – – – – – – – – – 97 99 1.0Madagascar 97 81 1.2 78 39 2.0 43 x 50 x 1.2 x 16 14 1.1 86 y 66 y 1.3 y 44 18 2.5 16 6 2.6Malawi 75 66 1.1 95 89 1.1 25 39 1.6 60 66 0.9 97 93 1.0 47 40 1.2 49 43 1.1Malaysia – – – – – – – – – – – – – – – – – – 100 99 1.0Maldives 93 x 92 x 1.0 x 99 x 93 x 1.1 x 16 x 22 x 1.3 x – – – 94 94 1.0 43 x 32 x 1.4 x 93 98 0.9Mali 97 85 1.1 73 x 14 x 5.2 x 17 34 2.0 29 x 20 x 1.5 x 83 46 1.8 32 16 2 46 22 2.1Malta – – – – – – – – – – – – – – – – – – 100 100 1.0Marshall Islands 96 x 96 x 1.0 x 97 x 68 x 1.4 x – – – 39 x 37 x 1.1 x – – – 33 x 12 x 2.7 x 95 66 1.4Mauritania 75 49 1.5 88 49 1.8 25 33 1.3 26 14 2.0 – – – 9 4 2.7 63 17 3.7Mauritius – – – – – – – – – – – – – – – – – – 94 93 1.0Mexico 96 94 1.0 99 94 1.1 10 19 1.9 61 63 1.0 98 98 1.0 33 25 1.3 91 81 1.1Micronesia (Federated States of) – – – – – – – – – – – – – – – – – – – – –Monaco – – – – – – – – – – – – – – – – – – 100 – –Mongolia 99 99 1.0 99 98 1.0 8 15 1.7 46 38 1.2 99 98 1.0 36 x 21 x 1.7 x 66 41 1.6Montenegro 99 100 1.0 99 100 1.0 10 9 1.0 – – – 97 99 1.0 47 49 1.0 98 92 1.1Montserrat – – – – – – – – – – – – – – – – – – – – –Morocco 97 y 91 y 1.1 y 92 55 1.7 9 21 2.4 23 21 1.1 96 x 83 x 1.2 x – – – 89 75 1.2Mozambique 51 47 1.1 80 44 1.8 36 46 1.3 65 50 1.3 83 67 1.2 39 25 1.6 47 12 3.8Myanmar 94 78 1.2 88 52 1.7 20 32 1.6 67 61 1.1 96 92 1.1 28 11 2.5 76 59 1.3Namibia 89 y 86 y 1.0 y 95 82 1.2 16 27 1.7 75 69 1.1 95 91 1.0 67 55 1.2 55 15 3.6Nauru – – – – – – – – – – – – – – – – – – 66 – –Nepal 57 58 1.0 68 47 1.4 32 40 1.3 36 38 0.9 80 76 1.1 25 14 1.7 52 45 1.2Netherlands – – – – – – – – – – – – – – – – – – 98 100 1.0

UNICEF – THE STATE OF THE WORLD’S CHILDREN 2017
TABLE 10. DISPARITIES BY RESIDENCE
Countries and areas
Birth registration (%)++
2010–2016*
Skilled birth attendant (%)
2011–2016*
Stunting prevalence in children under 5
(moderate & severe)θ (%) 2011–2016*
Oral rehydration salts (ORS) treatment for children with diarrhoea
(%) 2011–2016*
Primary school net attendance ratio
2011–2016*
Comprehensive knowledge of HIV/AIDS
(%) Females 15–242011–2016*
Use of basic sanitation services
(%)2015
urban rural
ratio of urban
to rural urban rural
ratio of urban
to rural urban rural
ratio of rural to urban urban rural
ratio of urban to
rural urban rural
ratio of urban to
rural urban rural
ratio of urban to
rural urban rural
ratio of urban
to rural
New Zealand – – – – – – – – – – – – – – – – – – 100 100 1.0Nicaragua – – – 97 79 1.2 15 x 30 x 2.0 x 74 57 1.3 76 x,y 64 x,y 1.2 x,y – – – 86 63 1.4Niger 92 60 1.5 83 32 2.6 34 45 1.3 47 44 1.1 83 45 1.9 31 9 3.3 44 6 7.4Nigeria 50 y 19 y 2.7 y 62 21 3.0 26 43 1.7 45 28 1.6 87 57 1.5 30 20 1.4 39 27 1.4Niue – – – – – – – – – – – – 100 100 1.0 – – – – – –Norway – – – – – – – – – – – – – – – – – – 98 98 1.0Oman – – – 99 98 1.0 14 15 1.1 58 62 0.9 98 97 1.0 – – – 99 99 1.0Pakistan 59 23 2.6 71 44 1.6 37 48 1.3 42 37 1.1 75 59 1.3 – – – 74 48 1.5Palau – – – – – – – – – – – – – – – – – – 100 100 1.0Panama 98 93 1.1 100 78 1.3 – – – 61 44 1.4 97 97 1.0 – – – 86 59 1.4Papua New Guinea – – – 88 x 48 x 1.9 x 36 x 51 x 1.4 x – – – – – – – – – 55 13 4.2Paraguay 87 y 80 y 1.1 y 94 x 79 x 1.2 x 12 10 0.8 – – – 92 y 90 y 1.0 y – – – 98 81 1.2Peru 98 y 96 y 1.0 y 98 75 1.3 9 28 3.0 37 22 1.7 92 y 92 y 1.0 y 27 x 8 x 3.3 x 82 58 1.4Philippines – – – 83 64 1.3 28 38 1.3 54 45 1.2 90 x 87 x 1.0 x 23 x 17 x 1.4 x 79 72 1.1Poland – – – – – – – – – – – – – – – – – – 98 98 1.0Portugal – – – – – – – – – – – – – – – – – – 99 100 1.0Qatar – – – – – – – – – – – – – – – – – – – – –Republic of Korea – – – – – – – – – – – – – – – – – – – – –Republic of Moldova 100 100 1.0 100 99 1.0 4 8 2.2 – – – 98 99 1.0 41 32 1.3 89 70 1.3Romania – – – 94 96 1.0 14 x 13 x 0.9 x – – – – – – – – – 93 68 1.4Russian Federation – – – – – – – – – – – – – – – – – – 93 76 1.2Rwanda 55 56 1.0 97 89 1.1 27 40 1.5 33 27 1.3 96 94 1.0 74 62 1.2 57 64 0.9Saint Kitts and Nevis – – – – – – – – – – – – – – – – – – – – –Saint Lucia 91 92 1.0 – – – 4 2 0.6 – – – 99 100 1.0 57 63 0.9 86 92 0.9Saint Vincent and the Grenadines – – – – – – – – – – – – – – – – – – – – –Samoa 68 57 1.2 97 79 1.2 4 5 1.1 – – – 89 y 88 y 1.0 y 5 x 2 x 2.4 x 98 96 1.0San Marino – – – – – – – – – – – – – – – – – – – – –Sao Tome and Principe 96 93 1.0 95 88 1.1 16 19 1.2 46 57 0.8 94 94 1.0 43 40 1.1 47 28 1.7Saudi Arabia – – – – – – – – – – – – – – – – – – – – –Senegal 87 58 1.5 70 44 1.6 14 24 1.7 32 31 1.0 72 43 1.7 – – – 66 35 1.9Serbia 100 99 1.0 98 99 1.0 7 5 0.8 50 x 22 x 2.3 x 100 98 1.0 63 x 41 x 1.5 x 98 91 1.1Seychelles – – – – – – – – – – – – – – – – – – – – –Sierra Leone 80 76 1.1 79 53 1.5 30 40 1.4 86 85 1.0 88 71 1.2 38 22 1.7 24 8 2.8Singapore – – – – – – – – – – – – – – – – – – 100 – –Slovakia – – – – – – – – – – – – – – – – – – 99 98 1.0Slovenia – – – – – – – – – – – – – – – – – – 99 99 1.0Solomon Islands 89 88 1.0 96 84 1.1 27 32 1.2 45 35 1.3 – – – 34 x 28 x 1.2 x 76 18 4.1Somalia 6 x 2 x 3.7 x 21 x 3 x 7.4 x 32 x 48 x 1.5 x 25 x 9 x 3.0 x 39 x 11 x 3.4 x 7 x 2 x 4.1 x 28 8 3.5South Africa – – – 98 95 1.0 26 y 29 y 1.1 y 53 49 1.1 – – – – – – 76 69 1.1South Sudan 45 32 1.4 31 x 15 x 2.0 x 29 x 32 x 1.1 x 44 x 37 x 1.2 x 40 19 2.1 16 x 7 x 2.3 x 28 6 4.3Spain – – – – – – – – – – – – – – – – – – 100 100 1.0Sri Lanka 97 x 98 x 1.0 x 99 x 99 x 1.0 x – – – – – – – – – – – – 89 95 0.9State of Palestine 99 100 1.0 100 100 1.0 8 8 1.0 30 34 0.9 99 99 1.0 8 x 6 x 1.3 x 95 99 1.0Sudan 89 59 1.5 93 72 1.3 27 43 1.6 25 18 1.4 86 61 1.4 12 7 1.9 58 23 2.5Suriname 100 98 1.0 93 x 84 x 1.1 x 7 x 12 x 1.8 x 33 x 55 x 0.6 x 97 94 1.0 45 x 33 x 1.4 x 88 61 1.4Swaziland 64 51 1.3 93 86 1.1 19 27 1.4 64 90 0.7 98 98 1.0 56 47 1.2 58 58 1.0Sweden – – – – – – – – – – – – – – – – – – 99 100 1.0Switzerland – – – – – – – – – – – – – – – – – – 100 100 1.0Syrian Arab Republic 97 x 95 x 1.0 x 99 x 93 x 1.1 x 28 x 28 x 1.0 x 56 x 44 x 1.3 x 98 x 96 x 1.0 x 7 x 7 x 1.0 x 96 89 1.1Tajikistan 88 89 1.0 93 86 1.1 22 28 1.3 58 61 0.9 87 85 1.0 11 8 1.4 94 96 1.0Thailand 99 y 100 y 1.0 y 99 100 1.0 10 11 1.1 68 75 0.9 95 95 1.0 55 56 1.0 94 96 1.0The former Yugoslav Republic of Macedonia 100 100 1.0 94 88 1.1 4 6 1.4 19 x 30 x 0.6 x 98 98 1.0 33 x 18 x 1.8 x 97 83 1.2
Timor-Leste 50 57 0.9 59 x 20 x 2.9 x 39 55 1.4 65 x 74 x 0.9 x 80 70 1.1 14 x 12 x 1.2 x 73 30 2.4Togo 95 69 1.4 82 24 3.4 16 33 2.1 18 19 0.9 96 85 1.1 28 19 1.5 28 5 6.2Tokelau – – – – – – – – – – – – – – – – – – – 93 0.0Tonga 92 94 1.0 94 96 1.0 9 8 0.9 – – – 92 y 93 y 1.0 y 11 13 0.8 97 92 1.0Trinidad and Tobago – – – – – – – – – – – – – – – – – – – – –Tunisia 100 98 1.0 77 67 1.1 8 14 1.7 69 59 1.2 99 97 1.0 22 13 1.7 98 83 1.2Turkey 99 y 98 y 1.0 y 99 92 1.1 8 14 1.8 – – – 95 96 1.0 – – – 99 89 1.1Turkmenistan 100 100 1.0 100 100 1.0 12 11 0.9 – – – 98 98 1.0 7 x 4 x 2.0 x 94 99 1.0Turks and Caicos Islands – – – – – – – – – – – – – – – – – – – – –Tuvalu 60 x 38 x 1.6 x 93 x 93 x 1.0 x 10 x 11 x 1.1 x – – – 98 x,y 99 x,y 1.0 x,y 38 x 41 x 0.9 x 92 91 1.0Uganda 38 29 1.3 89 52 1.7 24 30 1.3 53 45 1.2 91 86 1.1 55 42 1.3 28 17 1.6

193TABLE 10. DISPARITIES BY RESIDENCE
Countries and areas
Birth registration (%)++
2010–2016*
Skilled birth attendant (%)
2011–2016*
Stunting prevalence in children under 5
(moderate & severe)θ (%) 2011–2016*
Oral rehydration salts (ORS) treatment for children with diarrhoea
(%) 2011–2016*
Primary school net attendance ratio
2011–2016*
Comprehensive knowledge of HIV/AIDS
(%) Females 15–242011–2016*
Use of basic sanitation services
(%)2015
urban rural
ratio of urban
to rural urban rural
ratio of urban
to rural urban rural
ratio of rural to urban urban rural
ratio of urban to
rural urban rural
ratio of urban to
rural urban rural
ratio of urban to
rural urban rural
ratio of urban
to rural
Ukraine 100 100 1.0 99 99 1.0 – – – – – – 100 100 1.0 52 45 1.1 97 93 1.1United Arab Emirates – – – – – – – – – – – – – – – – – – 100 100 1.0United Kingdom – – – – – – – – – – – – – – – – – – 99 99 1.0United Republic of Tanzania 51 18 2.9 87 55 1.6 25 38 1.5 46 44 1.0 91 77 1.2 52 36 1.5 37 17 2.2United States – – – – – – – – – – – – – – – – – – 100 100 1.0Uruguay 100 100 1.0 98 98 1.0 – – – – – – 97 97 1.0 34 – – 96 95 1.0Uzbekistan 100 x 100 x 1.0 x 100 100 1.0 18 x 19 x 1.1 x 34 x 31 x 1.1 x – – – 33 x 30 x 1.1 x 100 100 1.0Vanuatu 61 y 37 y 1.7 y 96 87 1.1 19 32 1.6 38 52 0.7 77 y 77 y 1.0 y 23 x 13 x 1.8 x 61 51 1.2Venezuela (Bolivarian Republic of) – – – – – – – – – – – – – – – – – – 98 72 1.4Viet Nam 97 96 1.0 99 92 1.1 12 27 2.3 58 49 1.2 98 97 1.0 54 47 1.1 91 72 1.3Yemen 48 24 2.0 73 34 2.1 34 51 1.5 24 26 0.9 85 73 1.2 4 x 1 x 6.7 x 90 44 2.1Zambia 20 7 3.0 88 51 1.7 36 42 1.2 68 62 1.1 92 84 1.1 50 34 1.5 49 19 2.6Zimbabwe 67 34 1.9 93 71 1.3 22 29 1.3 46 38 1.2 98 94 1.0 56 41 1.4 54 31 1.7
SUMMARYEast Asia and Pacific 85 ** 77 ** 1.1 ** 98 91 1.1 13 21 1.7 49 ** 46 ** 1.1 ** 98 96 1.0 29 ** 23 ** 1.3 ** 87 63 1.4Europe and Central Asia – – – – – – – – – – – – – – – – – – 98 92 1.1
Eastern Europe and Central Asia 99 97 1.0 99 96 1.0 10 r 14 r 1.4 r – – – 96 96 1.0 – – – 95 87 1.1Western Europe – – – – – – – – – – – – – – – – – – 99 99 1.0
Latin America and Caribbean 96 93 1.0 – – – 13 N 23 N 1.8 N – – – 95 93 1.0 – – – 90 68 1.3Middle East and North Africa 96 87 1.1 93 76 1.2 17 21 1.2 27 27 1.0 96 91 1.0 – – – 94 81 1.2North America – – – – – – – – – – – – – – – – – – 100 100 1.0South Asia 73 56 1.3 84 68 1.2 32 42 1.3 57 49 1.2 86 79 1.1 13 ‡ 7 ‡ 1.8 ‡ 65 37 1.8Sub-Saharan Africa 57 35 1.6 80 46 1.7 26 39 1.5 43 36 1.2 86 68 1.3 37 23 1.6 42 20 2.1
Eastern and Southern Africa 52 33 1.6 86 50 1.7 26 38 1.5 47 39 1.2 87 73 1.2 45 30 1.5 48 21 2.2West and Central Africa 60 38 1.6 76 41 1.8 26 40 1.5 41 32 1.3 86 61 1.4 28 17 1.7 37 19 2.0
Least developed countries 52 36 1.5 81 48 1.7 28 40 1.4 49 42 1.2 87 72 1.2 31 18 1.7 46 26 1.8World 82 ** 59 ** 1.4 ** 89 67 1.3 23 32 1.4 48 ** 42 ** 1.1 ** 92 81 1.1 30 ‡** 20 ‡** 1.5 ‡** 83 50 1.7
For a complete list of countries and areas in the regions, subregions and country categories, see page 150 or visit <data.unicef.org/regionalclassifications>.It is not advisable to compare data from consecutive editions of The State of the World’s Children.
Italicized data are from different sources than the data presented for the same indicators in other tables of the report.
Birth registration – Percentage of children under age 5 who were registered at the moment of the survey. The numerator of this indicator includes children reported to have a birth certificate, regardless of whether or not it was seen by the interviewer, and those without a birth certificate whose mother or caregiver says the birth has been registered.Skilled birth attendant – Percentage of births attended by skilled health personnel (doctor, nurse or midwife).Stunting prevalence in children under 5–Percentage of children aged 0–59 months who are below minus two standard deviations from median height-for-age of the WHO Child Growth Standards.Stunting – Moderate and severe: Percentage of children aged 0–59 months who are below minus two standard deviations from median height-for-age of the WHO Child Growth Standards.Diarrhoea treatment with oral rehydration salts (ORS) – Percentage of children under age 5 who had diarrhoea in the two weeks preceding the survey and who received oral rehydration salts (ORS packets or pre-packaged ORS fluids).
Primary school net attendance ratio – Number of children attending primary or secondary school who are of official primary school age, expressed as a percentage of the total number of children of official primary school age. Because of the inclusion of primary-school-aged children attending secondary school, this indicator can also be referred to as a primary adjusted net attendance ratio.Comprehensive knowledge of HIV – Percentage of young women (aged 15–24) who correctly identify the two major ways of preventing the sexual transmission of HIV (using condoms and limiting sex to one faithful, uninfected partner), who reject the two most common local misconceptions about HIV transmission and who know that a healthy-looking person can be HIV-positive.Use of basic sanitation services – Percentage of the population using an improved sanitation facility that is not shared with other households (improved facilities include: flush/pour flush to piped sewerage systems, septic tanks or pit latrines; ventilated improved pit latrines; composting toilets or pit latrines with slabs.
Birth registration – Demographic and Health Surveys (DHS), Multiple Indicator Cluster Surveys (MICS), other national surveys, censuses and vital registration systems.Skilled birth attendant – DHS, MICS and other nationally representative sources.Stunting prevalence in children under 5 – DHS, MICS, other national household surveys, WHO and UNICEF.Diarrhoea treatment with oral rehydration salts (ORS) – DHS, MICS and other national household surveys.
Primary school attendance ratio – DHS, MICS and other national household surveys.Comprehensive knowledge of HIV – AIDS Indicator Surveys (AIS), DHS, MICS, and other national household surveys; DHS STATcompiler, www.statcompiler.com.Use of basic sanitation services – WHO/UNICEF Joint Monitoring Programme for Water Supply, Sanitation and Hygiene (JMP).
– Data not available.p Based on small denominators
(typically 25–49 unweighted cases). No data based on fewer than 25 unweighted cases are displayed.
x Data refer to years or periods other than those specified in the column heading. Such data are not included in the calculation of regional and global averages, with the exception of 2005–2006 data on primary attendance from India. Estimates from data years prior to 2000 are not displayed.
y Data differ from the standard defini-tion or refer to only part of a country. If they fall within the noted reference period, such data are included in the calculation of regional and global averages.
++ Changes in the definition of birth reg-istration were made from the second and third rounds of MICS (MICS2 and MICS3) to the fourth round (MICS4). In order to allow for comparability with later rounds, data from MICS2 and MICS3 on birth registration were recalculated according to the MICS4 indicator definition. Therefore, the recalculated data presented here may differ from estimates included in MICS2 and MICS3 national reports.
θ Global and regional averages for stunting (moderate and severe) are estimated using statistical modelling data from the UNICEF-WHO-World Bank Group Joint Child Manutrition Estimates, May 2017 Edition. For more information see <data.unicef.org/malnutrition>. Disaggregations for stunting (moderate and severe) are population-weighted, which means using the most recent estimate for each country with data between 2011 and 2016; therefore disaggregations may not coincide with total estimates at the global and regional level.
* Data refer to the most recent year available during the period specified in the column heading.
** Excludes China.‡ Excludes India.r Excludes the Russian Federation. N Excludes Brazil.
NOTESDEFINITIONS OF THE INDICATORS
MAIN DATA SOURCES

UNICEF – THE STATE OF THE WORLD’S CHILDREN 2017
Countries and areas
Birth registration (%)++
2010–2016*
Skilled birth attendant (%)
2011–2016*
Stunting prevalence in children under 5
(moderate & severe)θ (%) 2011–2016*
Oral rehydration salts (ORS) treatment for
children with diarrhoea (%) 2011–2016*
Primary school net attendance ratio
2011–2016*
Comprehensive knowledge of HIV/AIDS
(%) Females 15–24 2011–2016*
Comprehensive knowledge of HIV/
AIDS (%) Males 15–242011–2016*
poorest 20%
richest 20%
ratio of richest
to poorest
poorest 20%
richest 20%
ratio of richest
to poorest
poorest 20%
richest 20%
ratio of poorest to
richestpoorest
20%richest
20%
ratio of richest to poorest
poorest 20%
richest 20%
ratio of richest to poorest
poorest 20%
richest 20%
ratio of richest to poorest
poorest 20%
richest 20%
ratio of richest to poorest
Afghanistan 30 70 2.3 24 85 3.6 49 31 1.6 45 42 0.9 59 83 1.4 0 5 23.0 – – –Albania 98 x 99 x 1.0 x 98 x 100 x 1.0 x 27 x 13 x 2.1 x – – – 91 94 1.0 20 x 60 x 3.0 x 10 x 38 x 3.8 xAlgeria 99 100 1.0 95 99 1.0 3 11 0.2 21 31 1.5 96 98 1.0 4 17 3.8 – – –Andorra – – – – – – – – – – – – – – – – – – – – –Angola 10 55 5.7 17 90 5.2 47 7 6.8 29 57 1.9 56 95 1.7 8 58 7.3 10 46 4.8Anguilla – – – – – – – – – – – – – – – – – – – – –Antigua and Barbuda – – – – – – – – – – – – – – – – – – – – –Argentina 99 y 100 y 1.0 y – – – – – – 26 6 0.2 98 99 1.0 – 54 – – – –Armenia 98 99 1.0 100 100 1.0 12 6 2.0 – – – 99 100 1.0 13 30 2.3 4 23 5.5Australia – – – – – – – – – – – – – – – – – – – – –Austria – – – – – – – – – – – – – – – – – – – – –Azerbaijan 92 x 97 x 1.1 x 90 100 1.1 28 16 1.8 3 x 36 x 13.3 x 67 y 70 y 1.0 y 1 x 12 x 10.3 x 2 x 14 x 6.3 xBahamas – – – – – – – – – – – – – – – – – – – – –Bahrain – – – – – – – – – – – – – – – – – – – – –Bangladesh 15 28 1.8 18 74 4.2 50 21 2.4 72 81 1.1 88 93 1.1 2 18 8.9 – – –Barbados 98 99 1.0 – – – 8 3 2.4 – – – 99 100 1.0 57 66 1.2 – – –Belarus – – – 100 100 1.0 11 x 2 x 5.3 x – – – 93 93 1.0 55 55 1.0 42 43 1.0Belgium – – – – – – – – – – – – – – – – – – – – –Belize 94 99 1.1 93 99 1.1 26 5 4.8 – – – 93 99 1.1 20 53 2.7 – – –Benin 69 96 1.4 61 91 1.5 46 18 2.6 20 31 1.6 54 92 1.7 15 29 2.0 26 42 1.6Bhutan 100 100 1.0 34 x 95 x 2.8 x 41 x 21 x 1.9 x 60 x 56 x 0.9 x – – – 7 x 32 x 4.4 x – – –Bolivia (Plurinational State of) 68 x,y 90 x,y 1.3 x,y 57 99 1.7 32 9 3.5 18 27 1.5 95 x 99 x 1.0 x 5 x 40 x 8.4 x 11 x 45 x 4.3 xBosnia and Herzegovina 100 x 99 x 1.0 x 100 100 1.0 10 10 1.0 – – – 93 94 1.0 37 44 1.2 38 45 1.2Botswana – – – – – – 38 x 20 x 1.9 x – – – – – – – – – – – –Brazil – – – – – – 7 x 3 x 2.1 x – – – – – – – – – – – –British Virgin Islands – – – – – – – – – – – – – – – – – – – – –Brunei Darussalam – – – – – – – – – – – – – – – – – – – – –Bulgaria – – – – – – – – – – – – – – – – – – – – –Burkina Faso 62 95 1.5 68 95 1.4 42 x 19 x 2.3 x 38 47 1.2 31 85 2.8 8 x 37 x 4.4 x – – –Burundi 64 87 1.4 77 96 1.2 34 38 1.1Cabo Verde – – – – – – – – – – – – – – – – – – – – –Cambodia 59 87 1.5 75 98 1.3 42 19 2.3 40 27 0.7 86 98 1.1 27 55 2.1 28 63 2.2Cameroon 38 92 2.4 21 98 4.7 42 15 2.9 9 37 4.3 65 99 1.5 12 x 50 x 4.0 x – – –Canada – – – – – – – – – – – – – – – – – – – – –Central African Republic 46 85 1.8 18 x 79 x 4.3 x 45 30 1.5 11 x 28 x 2.5 x 57 90 1.6 12 x 21 x 1.7 x 19 x 29 x 1.5 xChad 6 39 6.5 11 58 5.3 41 32 1.3 14 30 2.2 44 76 1.7 6 x 18 x 2.9 x – – –Chile – – – – – – – – – – – – – – – – – – – – –China – – – – – – – – – – – – – – – – – – – – –Colombia 96 98 1.0 86 99 1.2 19 x 7 x 2.9 x 47 x 61 x 1.3 x 93 96 1.0 15 x 32 x 2.2 x – – –Comoros 85 93 1.1 66 93 1.4 38 22 1.7 39 36 0.9 72 95 1.3 – – – – – –Congo 80 99 1.2 78 99 1.3 35 9 3.7 22 37 1.7 – – – 5 x 12 x 2.4 x 12 x 27 x 2.3 xCook Islands – – – – – – – – – – – – – – – – – – – – –Costa Rica 99 100 1.0 97 99 1.0 – – – – – – 94 98 1.0 20 54 2.7 – – –Côte d'Ivoire 44 90 2.0 35 91 2.6 38 16 2.5 6 24 3.7 62 94 1.5 – – – – – –Croatia – – – – – – – – – – – – – – – – – – – – –Cuba – – – – – – – – – – – – – – – – – – – – –Cyprus – – – – – – – – – – – – – – – – – – – – –Czechia – – – – – – – – – – – – – – – – – – – – –Democratic People's Republic of Korea – – – – – – – – – – – – – – – – – – – – –
Democratic Republic of the Congo 16 38 2.4 66 98 1.5 50 23 2.2 31 42 1.4 79 94 1.2 8 x 24 x 2.8 x – – –Denmark – – – – – – – – – – – – – – – – – – – – –Djibouti – – – – – – – – – – – – – – – – – – – – –Dominica – – – – – – – – – – – – – – – – – – – – –Dominican Republic 73 98 1.4 96 99 1.0 11 4 2.9 43 57 1.3 91 98 1.1 34 55 1.6 – – –Ecuador 90 96 1.1 99 x 98 x 1.0 x 37 14 2.6 41 64 1.6 97 y 98 y 1.0 y – – – – – –Egypt 99 100 1.0 82 99 1.2 24 23 1.0 27 23 0.9 95 98 1.0 6 14 2.1 2 10 5.8El Salvador 98 99 1.0 94 99 1.1 24 5 4.5 71 68 1.0 92 99 1.1 17 46 2.8 17 46 2.8Equatorial Guinea 60 60 1.0 48 88 1.8 28 19 1.5 – – – – – – – – – – – –Eritrea – – – 9 x 90 x 10.5 x 57 x 27 x 2.1 x 42 x 50 x 1.2 x 71 y 96 y 1.3 y 9 x 37 x 4.3 x 21 x 43 x 2.0 xEstonia – – – – – – – – – – – – – – – – – – – – –Ethiopia 1 10 11.9 13 67 5.1 42 27 1.6 32 37 1.2 49 y 82 y 1.7 y – – – – – –Fiji – – – – – – – – – – – – – – – – – – – – –Finland – – – – – – – – – – – – – – – – – – – – –
TABLE 11. DISPARITIES BY HOUSEHOLD WEALTH

195TABLE 11. DISPARITIES BY HOUSEHOLD WEALTH
Countries and areas
Birth registration (%)++
2010–2016*
Skilled birth attendant (%)
2011–2016*
Stunting prevalence in children under 5
(moderate & severe)θ (%) 2011–2016*
Oral rehydration salts (ORS) treatment for
children with diarrhoea (%) 2011–2016*
Primary school net attendance ratio
2011–2016*
Comprehensive knowledge of HIV/AIDS
(%) Females 15–24 2011–2016*
Comprehensive knowledge of HIV/
AIDS (%) Males 15–242011–2016*
poorest 20%
richest 20%
ratio of richest
to poorest
poorest 20%
richest 20%
ratio of richest
to poorest
poorest 20%
richest 20%
ratio of poorest to
richestpoorest
20%richest
20%
ratio of richest to poorest
poorest 20%
richest 20%
ratio of richest to poorest
poorest 20%
richest 20%
ratio of richest to poorest
poorest 20%
richest 20%
ratio of richest to poorest
France – – – – – – – – – – – – – – – – – – – – –Gabon 92 86 0.9 74 95 1.3 30 6 5.2 24 19 0.8 96 98 1.0 – – – – – –Gambia 69 75 1.1 46 82 1.8 30 15 1.9 56 58 1.0 60 y 80 y 1.3 y 20 x 48 x 2.4 x – – –Georgia 99 100 1.0 95 x 99 x 1.0 x – – – – – – – – – – – – – – –Germany – – – – – – – – – – – – – – – – – – – – –Ghana 58 88 1.5 42 94 2.2 25 9 2.9 47 50 1.1 63 84 1.3 18 53 2.9 19 49 2.6Greece – – – – – – – – – – – – – – – – – – – – –Grenada – – – – – – – – – – – – – – – – – – – – –Guatemala – – – 37 96 2.6 66 17 3.8 49 55 1.1 89 98 1.1 7 41 6.0 7 36 5.4Guinea 38 89 2.4 19 92 4.9 34 15 2.2 25 49 1.9 38 87 2.3 – – – – – –Guinea-Bissau 13 43 3.3 26 83 3.2 31 15 2.1 26 30 1.2 56 76 1.4 21 27 1.3 13 32 2.5Guyana 84 95 1.1 70 96 1.4 21 7 2.9 – – – 96 97 1.0 40 62 1.5 28 56 2.0Haiti 71 92 1.3 10 78 8.1 31 7 4.7 52 62 1.2 73 96 1.3 18 x 41 x 2.2 x 28 x 52 x 1.9 xHoly See – – – – – – – – – – – – – – – – – – – – –Honduras 92 95 1.0 58 98 1.7 42 8 5.3 63 52 0.8 – – – 13 x 44 x 3.4 – – –Hungary – – – – – – – – – – – – – – – – – – – – –Iceland – – – – – – – – – – – – – – – – – – – – –India 57 86 1.5 64 95 1.5 51 22 1.9 33 45 1.4 70 x 96 x 1.4 x 4 x 45 x 11.7 x 15 x 55 x 3.8 xIndonesia 41 88 2.2 63 98 1.6 48 29 1.7 39 34 0.9 99 100 1.0 3 x 23 x 7.5 x 2 x 27 x 12.2 xIran (Islamic Republic of) – – – – – – 21 1 17.3 – – – – – – – – – – – –Iraq 98 100 1.0 82 96 1.2 25 22 1.1 19 22 1.1 79 98 1.2 1 8 7.2 – – –Ireland – – – – – – – – – – – – – – – – – – – – –Israel – – – – – – – – – – – – – – – – – – – – –Italy – – – – – – – – – – – – – – – – – – – – –Jamaica 99 100 1.0 97 100 1.0 4 8 0.5 – – – 98 99 1.0 – – – – – –Japan – – – – – – – – – – – – – – – – – – – – –Jordan 98 100 1.0 99 100 1.0 14 2 7.7 22 21 1.0 97 99 1.0 – – – – – –Kazakhstan 99 100 1.0 100 100 1.0 10 6 1.7 – – – 100 99 1.0 15 33 2.2 – – –Kenya 52 89 1.7 31 93 3.0 36 14 2.6 52 55 1.0 69 94 1.4 29 x 61 x 2.1 x 42 x 68 x 1.6 xKiribati 93 x 94 x 1.0 x 76 x 93 x 1.2 x – – – – – – – – – 42 x 49 x 1.2 x 38 x 51 x 1.3 xKuwait – – – – – – – – – – – – – – – – – – – – –Kyrgyzstan 96 99 1.0 97 99 1.0 18 11 1.7 – – – 99 100 1.0 22 18 0.8 – – –Lao People's Democratic Republic 66 93 1.4 11 90 8.5 61 20 3.1 35 69 2.0 71 97 1.4 6 41 6.5 12 43 3.6Latvia – – – – – – – – – – – – – – – – – – – – –Lebanon – – – – – – – – – – – – – – – – – – – – –Lesotho 34 63 1.8 60 94 1.6 46 13 3.4 – – – 88 95 1.1 26 48 1.8 19 36 1.9Liberia 16 y 31 y 1.9 y 43 89 2.1 35 20 1.8 57 44 0.8 25 65 2.6 14 x 29 x 2.1 x 17 x 37 x 2.2 xLibya – – – – – – – – – – – – – – – – – – – – –Liechtenstein – – – – – – – – – – – – – – – – – – – – –Lithuania – – – – – – – – – – – – – – – – – – – – –Luxembourg – – – – – – – – – – – – – – – – – – – – –Madagascar 72 94 1.3 27 73 2.7 48 x 44 x 1.1 x 11 17 1.6 54 y 82 y 1.5 y 10 40 4.1 13 41 3.2Malawi 65 74 1.1 87 95 1.1 46 24 1.9 63 61 1.0 89 98 1.1 34 48 1.4 32 53 1.7Malaysia – – – – – – – – – – – – – – – – – – – – –Maldives 92 x 94 x 1.0 x 89 x 99 x 1.1 x 22 x 16 x 1.4 x – – – 94 94 1.0 23 x 48 x 2.0 x – – –Mali 69 98 1.4 6 x 81 x 12.6 x 41 15 3.0 18 x 25 x 1.4 x 27 86 3.2 12 33 2.7 17 53 3.2Malta – – – – – – – – – – – – – – – – – – – – –Marshall Islands 92 x 98 x 1.1 x 68 x 99 x 1.5 x – – – – – – – – – 12 x 39 x 3.3 x 37 x 58 x 1.6 xMauritania 33 84 2.6 27 96 3.6 39 18 2.2 9 33 3.8 – – – 2 12 7.9 – – –Mauritius – – – – – – – – – – – – – – – – – – – – –Mexico 83 99 1.2 92 100 1.1 23 5 4.7 – – – 96 99 1.0 21 39 1.9 – – –Micronesia (Federated States of) – – – – – – – – – – – – – – – – – – – – –Monaco – – – – – – – – – – – – – – – – – – – – –Mongolia 99 100 1.0 97 99 1.0 19 6 3.3 35 43 1.3 96 99 1.0 17 x 42 x 2.5 x 12 x 48 x,p 4.1 x,pMontenegro 99 99 1.0 99 100 1.0 5 9 0.5 – – – 95 100 1.0 39 51 1.3 33 47 p 1.4Montserrat – – – – – – – – – – – – – – – – – – – – –Morocco – – – 38 96 2.5 28 7 4.2 14 23 1.7 77 x 97 x 1.3 x – – – – – –Mozambique 42 60 1.4 32 90 2.8 51 24 2.1 41 70 1.7 58 93 1.6 19 44 2.3 20 44 2.2Myanmar 69 97 1.4 36 97 2.7 38 16 2.4 – – – 84 97 1.2 – – – – – –Namibia 83 y 93 y 1.1 y 73 98 1.4 31 9 3.6 64 70 1.1 88 97 1.1 61 x 69 x 1.1 x 55 x 67 x 1.2 xNauru 71 x 88 x 1.2 x 97 x 98 x 1.0 x 52 x 18 x 2.9 x – – – – – – 13 x,p 10 x,p 0.8 x,p – 25 x,p –Nepal 55 58 1.1 34 89 2.6 49 17 3.0 – – – 81 82 1.0 26 54 2.1 – – –Netherlands – – – – – – – – – – – – – – – – – – – – –

UNICEF – THE STATE OF THE WORLD’S CHILDREN 2017
TABLE 11. DISPARITIES BY HOUSEHOLD WEALTH
Countries and areas
Birth registration (%)++
2010–2016*
Skilled birth attendant (%)
2011–2016*
Stunting prevalence in children under 5
(moderate & severe)θ (%) 2011–2016*
Oral rehydration salts (ORS) treatment for
children with diarrhoea (%) 2011–2016*
Primary school net attendance ratio
2011–2016*
Comprehensive knowledge of HIV/AIDS
(%) Females 15–24 2011–2016*
Comprehensive knowledge of HIV/
AIDS (%) Males 15–242011–2016*
poorest 20%
richest 20%
ratio of richest
to poorest
poorest 20%
richest 20%
ratio of richest
to poorest
poorest 20%
richest 20%
ratio of poorest to
richestpoorest
20%richest
20%
ratio of richest to poorest
poorest 20%
richest 20%
ratio of richest to poorest
poorest 20%
richest 20%
ratio of richest to poorest
poorest 20%
richest 20%
ratio of richest to poorest
New Zealand – – – – – – – – – – – – – – – – – – – – –Nicaragua – – – 42 x 99 x 2.4 x 35 x 6 x 6.0 x 53 x 64 x 1.2 x – – – – – – – – –Niger 50 89 1.8 12 71 6.0 47 35 1.4 34 49 1.4 35 81 2.3 6 30 5.0 6 42 7.2Nigeria 7 y 65 y 9.7 y 5 81 15.6 54 18 3.0 20 53 2.6 28 95 3.3 15 33 2.2 23 43 1.9Niue – – – – – – – – – – – – 100 100 1.0 – – – – – –Norway – – – – – – – – – – – – – – – – – – – – –Oman – – – – – – – – – – – – – – – – – – – – –Pakistan 5 71 14.3 30 85 2.9 62 23 2.7 34 48 1.4 39 87 2.2 – – – – – –Palau – – – – – – – – – – – – – – – – – – – – –Panama 90 97 1.1 72 100 1.4 – – – – – – 96 97 1.0 – – – – – –Papua New Guinea – – – – – – – – – – – – – – – – – – – – –Paraguay 67 y 89 y 1.3 y – – – 28 13 2.2 – – – – – – – – – – – –Peru 95 y 99 y 1.0 y 71 100 1.4 32 3 11.3 23 44 1.9 92 y 92 y 1.0 y – – – – – –Philippines – – – 42 96 2.3 49 15 3.3 – – – 79 x 92 x 1.2 x 14 x 26 x 1.8 x – – –Poland – – – – – – – – – – – – – – – – – – – – –Portugal – – – – – – – – – – – – – – – – – – – – –Qatar – – – – – – – – – – – – – – – – – – – – –Republic of Korea – – – – – – – – – – – – – – – – – – – – –Republic of Moldova 99 100 1.0 98 99 1.0 11 3 4.2 – – – 98 99 1.0 14 47 3.3 13 40 3.1Romania – – – – – – – – – – – – – – – – – – – – –Russian Federation – – – – – – – – – – – – – – – – – – – – –Rwanda 43 64 1.5 84 97 1.2 49 21 2.3 22 37 1.7 88 97 1.1 – – – – – –Saint Kitts and Nevis – – – – – – – – – – – – – – – – – – – – –Saint Lucia – – – – – – – – – – – – 98 100 1.0 – – – – – –Saint Vincent and the Grenadines – – – – – – – – – – – – – – – – – – – – –Samoa 47 77 1.6 72 94 1.3 6 3 2.3 – – – 85 y 91 y 1.1 y 3 x 3 x 1.0 x 3 x 9 x 2.7 xSan Marino – – – – – – – – – – – – – – – – – – – – –Sao Tome and Principe 88 100 1.1 85 98 1.1 26 7 3.8 – – – 92 96 1.1 39 51 1.3 38 56 1.5Saudi Arabia – – – – – – – – – – – – – – – – – – – – –Senegal 44 93 2.1 29 81 2.8 28 10 2.8 28 23 0.8 43 78 1.8 – – – – – –Serbia 97 100 1.0 98 95 1.0 14 4 3.3 – – – 97 100 1.0 28 x 69 x 2.4 x 28 x 66 x 2.4 xSeychelles – – – – – – – – – – – – – – – – – – – – –Sierra Leone 77 80 1.0 51 84 1.6 43 28 1.5 87 88 1.0 62 92 1.5 14 x 36 x 2.6 x – – –Singapore – – – – – – – – – – – – – – – – – – – – –Slovakia – – – – – – – – – – – – – – – – – – – – –Slovenia – – – – – – – – – – – – – – – – – – – – –Solomon Islands 87 88 1.0 72 96 1.3 36.2 25 – 37 39 1.0 – – – 17 x 37 x 2.1 x 35 x 50 x 1.5 xSomalia 1 x 7 x 6.6 x 1 x 27 x 27.1 x 52 x 25 x 2.0 x 7 x 31 x 4.8 x 4 x 50 x 13.2 x 1 x 8 x 13.5 x – – –South Africa – – – 93 99 1.1 36 13 2.9 – – – – – – – – – – – –South Sudan 21 57 2.7 8 x 41 x 5.1 x 31 x 27 x 1.2 x 27 x 52 x 1.9 x 10 50 5.1 3 x 18 x 6.1 x – – –Spain – – – – – – – – – – – – – – – – – – – – –Sri Lanka 97 x 98 x 1.0 x 97 x 99 x 1.0 x 19 10 2.0 – – – – – – – – – – – –State of Palestine 100 99 1.0 100 99 1.0 8 7 1.1 23 31 1.3 99 99 1.0 5 x 10 x 2.1 x – – –Sudan 37 98 2.6 48 99 2.1 44 21 2.1 16 21 1.3 48 94 1.9 2 19 8.7 – – –Suriname 98 100 1.0 83 x 94 x 1.1 x 13 x 6 x 2.4 x – – – 92 97 1.1 26 x 52 x 2.0 x – – –Swaziland 39 78 2.0 76 95 1.2 30 9 3.3 – – – 97 98 1.0 38 54 1.4 40 69 1.7Sweden – – – – – – – – – – – – – – – – – – – – –Switzerland – – – – – – – – – – – – – – – – – – – – –Syrian Arab Republic 93 x 99 x 1.1 x 75 x 99 x 1.3 x 35 x 25 x 1.4 x 46 x 59 x 1.3 x 92 x 99 x 1.1 x 4 x 10 x 2.9 x – – –Tajikistan 86 90 1.0 74 96 1.3 32 21 1.5 53 62 1.2 85 88 1.0 – – – – – –Thailand 100 y 100 y 1.0 y 98 100 1.0 13 12 1.1 78 81 1.0 92 97 1.1 42 53 1.3 37 53 1.4The former Yugoslav Republic of Macedonia 99 100 1.0 78 97 1.2 7 2 3.6 – – – 96 99 1.0 9 x 45 x 5.0 x – – –
Timor-Leste 50 56 1.1 10 x 69 x 6.9 x 59 39 1.5 70 x 71 x 1.0 x 60 84 1.4 9 x 16 x 1.8 x 11 x 35 x 3.0 xTogo 67 97 1.5 11 87 8.1 33 11 3.2 28 25 0.9 80 97 1.2 18 x 42 x 2.3 x 20 x 55 x 2.7 xTokelau – – – – – – – – – – – – – – – – – – – – –Tonga 92 96 1.1 93 97 1.0 7 10 0.7 – – – 94 y 94 y 1.0 y 11 16 1.4 13 14 1.1Trinidad and Tobago 96 x 99 x 1.0 x 98 x 99 x 1.0 x – – – – – – 95 98 1.0 48 x 62 x 1.3 x – – –Tunisia 98 100 1.0 63 89 1.4 16 8 2.0 – – – 96 99 1.0 10 p 29 2.8 – – –Turkey 98 y 99 y 1.0 y 91 100 1.1 18 4 4.3 – – – 92 96 1.0 – – – – – –Turkmenistan 100 99 1.0 100 100 1.0 16 11 1.4 – – – 98 98 1.0 17 p 32 1.9 – – –Turks and Caicos Islands – – – – – – – – – – – – – – – – – – – – –Tuvalu 39 x 71 x 1.8 x 95 x 90 x 1.0 x 8 x 13 x 0.6 x – – – 99 x,y 100 x,y 1.0 x,y 34 x,p 39 x 1.2 x – 67 x,p –Uganda 27 44 1.6 43 88 2.0 32 17 1.9 48 53 1.1 79 92 1.2 20 x,p 47 x 2.3 x 28 x 47 x 1.6 x

197TABLE 11. DISPARITIES BY HOUSEHOLD WEALTH
Countries and areas
Birth registration (%)++
2010–2016*
Skilled birth attendant (%)
2011–2016*
Stunting prevalence in children under 5
(moderate & severe)θ (%) 2011–2016*
Oral rehydration salts (ORS) treatment for
children with diarrhoea (%) 2011–2016*
Primary school net attendance ratio
2011–2016*
Comprehensive knowledge of HIV/AIDS
(%) Females 15–24 2011–2016*
Comprehensive knowledge of HIV/
AIDS (%) Males 15–242011–2016*
poorest 20%
richest 20%
ratio of richest
to poorest
poorest 20%
richest 20%
ratio of richest
to poorest
poorest 20%
richest 20%
ratio of poorest to
richestpoorest
20%richest
20%
ratio of richest to poorest
poorest 20%
richest 20%
ratio of richest to poorest
poorest 20%
richest 20%
ratio of richest to poorest
poorest 20%
richest 20%
ratio of richest to poorest
Ukraine 100 99 1.0 99 100 1.0 – – – – – – 100 100 1.0 41 p 53 1.3 40 54 1.3United Arab Emirates – – – – – – – – – – – – – – – – – – – – –United Kingdom – – – – – – – – – – – – – – – – – – – – –United Republic of Tanzania 8 65 8.5 42 95 2.3 40 19 2.1 40 45 1.1 63 95 1.5 39 x,p 55 x 1.4 x 34 x 56 x 1.7 xUnited States – – – – – – – – – – – – – – – – – – – – –Uruguay – – – – – – – – – – – – 97 98 1.0 – – – – – –Uzbekistan 100 x 100 x 1.0 x 99 x 100 x 1.0 x 21 x 15 x 1.4 x 27 x 19 x 0.7 x – – – 25 x 33 x 1.3 x – – –Vanuatu 33 y 59 y 1.8 y 77 95 1.2 40 16 2.4 – – – 75 y 80 y 1.1 y 9 x 23 x 2.7 x – – –Venezuela (Bolivarian Republic of) – – – 99 93 0.9 – – – – – – 86 99 1.2 – – – – – –Viet Nam 91 98 1.1 73 100 1.4 41 6 6.7 – – – 94 98 1.0 30 65 2.2 – – –Yemen 17 56 3.3 19 81 4.2 59 26 2.3 27 21 0.8 56 90 1.6 0 x 4 x – x – – –Zambia 5 29 6.0 45 94 2.1 47 28 1.7 59 68 1.1 75 97 1.3 24 x 48 x 2.0 x 24 x 51 x 2.1 xZimbabwe 24 79 3.3 62 96 1.6 33 17 2.0 30 44 1.5 91 100 1.1 47 65 1.4 43 67 1.6
SUMMARYEast Asia and Pacific 59 ** 92 ** 1.6 ** 60 ** 98 ** 1.6 ** 44 ** 20 ** 2.2 ** – – – 95 ** 99 ** 1.0 ** – – – – – –Europe and Central Asia – – – – – – – – – – – – – – – – – – – – –
Eastern Europe and Central Asia 98 98 1.0 93 99 1.1 18 r 8 r 2.4 r – – – 94 96 1.0 – – – – – –Western Europe – – – – – – – – – – – – – – – – – – – – –
Latin America and Caribbean 88 98 1.1 80 98 1.2 30 N 7 N 4.3 N – – – 94 97 1.0 – – – – – –Middle East and North Africa 88 94 1.1 72 96 1.3 24 15 1.6 23 24 1.0 86 97 1.1 – – – – – –North America – – – – – – – – – – – – – – – – – – – – –South Asia 45 78 1.7 53 91 1.7 52 22 2.0 37 49 1.3 67 94 1.4 5 ‡ 21 ‡ 4.1 ‡ – – –Sub-Saharan Africa 27 63 2.3 34 87 2.6 44 19 2.3 31 45 1.5 54 91 1.7 – – – – – –
Eastern and Southern Africa 27 55 2.1 40 87 2.2 42 19 2.2 37 46 1.2 63 90 1.4 – – – – – –West and Central Africa 28 70 2.5 28 86 3.1 46 19 2.4 25 45 1.8 46 91 2.0 14 34 2.4 – – –
Least developed countries 30 56 1.9 36 85 2.4 45 21 2.1 39 47 1.2 64 89 1.4 – – – – – –World 56 ** 82 ** 1.5 ** 51 ** 91 ** 1.8 ** 44 19 2.2 34 ** 45 ** 1.3 ** 70 ** 94 ** 1.3 ** – – – – – –
For a complete list of countries and areas in the regions, subregions and country categories, see page 150 or visit <data.unicef.org/regionalclassifications>.It is not advisable to compare data from consecutive editions of The State of the World’s Children.
Birth registration – Percentage of children under age 5 who were registered at the moment of the survey. The numerator of this indicator includes children reported to have a birth certificate, regardless of whether or not it was seen by the interviewer, and those without a birth certificate whose mother or caregiver says the birth has been registered.Skilled birth attendant – Percentage of births attended by skilled health personnel (doctor, nurse or midwife).Stunting prevalence in children under 5–Percentage of children aged 0–59 months who are below minus two standard deviations from median height-for-age of the WHO Child Growth Standards.Stunting – Moderate and severe: Percentage of children aged 0–59 months who are below minus two standard deviations from median height-for-age of the WHO Child Growth Standards.
Diarrhoea treatment with oral rehydration salts (ORS) – Percentage of children under age 5 who had diarrhoea in the two weeks preceding the survey and who received oral rehydration salts (ORS packets or pre-packaged ORS fluids). Primary school net attendance ratio – Number of children attending primary or secondary school who are of official primary school age, expressed as a percentage of the total number of children of official primary school age. Because of the inclusion of primary-school-aged children attending secondary school, this indicator can also be referred to as a primary adjusted net attendance ratio.Comprehensive knowledge of HIV – Percentage of young men and women (aged 15–24) who correctly identify the two major ways of preventing the sexual transmission of HIV (using condoms and limiting sex to one faithful, uninfected partner), who reject the two most common local misconceptions about HIV transmission and who know that a healthy-looking person can be HIV-positive.
DEFINITIONS OF THE INDICATORS
Italicized data are from different sources than the data presented for the same indicators in other tables of the report.
Birth registration – Demographic and Health Surveys (DHS), Multiple Indicator Cluster Surveys (MICS), other national surveys, censuses and vital registration systems.Skilled birth attendant – DHS, MICS and other nationally representative sources.Stunting prevalence in children under 5 – DHS, MICS, other national household surveys, WHO and UNICEF.
Diarrhoea treatment with oral rehydration salts (ORS) – DHS, MICS and other national household surveys.Primary school attendance ratio – DHS, MICS and other national household surveys.Comprehensive knowledge of HIV – AIDS Indicator Surveys (AIS), DHS, MICS, and other national household surveys; DHS STATcompiler, www.statcompiler.com.
MAIN DATA SOURCES
– Data not available.p Based on small denominators
(typically 25–49 unweighted cases). No data based on fewer than 25 unweighted cases are displayed.
x Data refer to years or periods other than those specified in the column heading. Such data are not included in the calculation of regional and global averages, with the exception of 2005–2006 data on primary attendance from India. Estimates from data years prior to 2000 are not displayed.
y Data differ from the standard defini-tion or refer to only part of a country. If they fall within the noted reference period, such data are included in the calculation of regional and global averages.
++ Changes in the definition of birth reg-istration were made from the second and third rounds of MICS (MICS2 and MICS3) to the fourth round (MICS4). In order to allow for comparability with later rounds, data from MICS2 and MICS3 on birth registration were recalculated according to the MICS4 indicator definition. Therefore, the recalculated data presented here may differ from estimates included in MICS2 and MICS3 national reports.
θ Global and regional averages for stunting (moderate and severe) are estimated using statistical modelling data from the UNICEF-WHO-World Bank Group Joint Child Malnutrition Estimates, May 2017 Edition. For more information see <data.unicef.org/malnutrition>. Disaggregations for stunting (moderate and severe) are population-weighted, which means using the most recent estimate for each country with data between 2011 and 2016; therefore disaggregations may not coincide with total estimates at the global and regional level.
* Data refer to the most recent year available during the period specified in the column heading.
** Excludes China.‡ Excludes India.r Excludes the Russian Federation.N Excludes Brazil.
NOTES

UNICEF – THE STATE OF THE WORLD’S CHILDREN 2017
Countries and areas
Attendance in early childhood education2005–2016*
Adult support for learning ++
2005–2016*
Father’s support
for learning
++
2005–2016*
Learning materials at home 2005–2016* Children with inadequate
supervision2005–2016*Children’s books Playthings ++
total male femalepoorest
20%richest
20% total male femalepoorest
20%richest
20% totalpoorest
20%richest
20% totalpoorest
20%richest
20% total male femalepoorest
20%richest
20%
Afghanistan 1 1 1 0 4 73 74 73 72 80 62 y 2 1 5 53 52 57 40 42 39 43 27Albania 40 39 42 26 60 86 85 87 68 96 53 y 32 16 52 53 57 48 13 14 11 9 16Algeria 17 17 16 7 31 78 79 78 64 92 79 y 11 3 23 35 32 36 6 6 5 6 6Andorra – – – – – – – – – – – – – – – – – – – – – –Angola – – – – – – – – – – – – – – – – – – – – – –Anguilla – – – – – – – – – – – – – – – – – – – – – –Antigua and Barbuda – – – – – – – – – – – – – – – – – – – – – –Argentina 63 61 66 46 85 84 83 85 73 95 57 y 61 40 83 61 58 63 8 9 8 10 5Armenia – – – – – – – – – – – – – – – – – – – – – –Australia – – – – – – – – – – – – – – – – – – – – – –Austria – – – – – – – – – – – – – – – – – – – – – –Azerbaijan – – – – – – – – – – – – – – – – – – – – – –Bahamas – – – – – – – – – – – – – – – – – – – – – –Bahrain – – – – – – – – – – – – – – – – – – – – – –Bangladesh 13 13 14 12 18 78 78 78 64 94 10 9 2 23 60 57 60 12 11 12 14 12Barbados 90 88 91 90 p 97 p 97 97 97 100 p 100 p 46 y 85 83 89 76 68 77 1 2 1 0 3Belarus 88 86 89 75 91 96 94 97 90 99 68 y 92 83 96 79 77 79 4 4 4 4 5Belgium – – – – – – – – – – – – – – – – – – – – – –Belize 55 52 58 29 72 88 89 86 80 94 24 44 23 73 68 70 66 13 15 11 15 11Benin 13 13 14 2 38 28 28 27 18 48 5 1 0 6 48 39 65 34 35 34 39 25Bhutan 10 10 10 3 27 54 52 57 40 73 51 y 6 1 24 52 36 60 14 13 15 17 7Bolivia (Plurinational State of) – – – – – – – – – – – – – – – – – – – – – –Bosnia and Herzegovina 13 12 14 2 31 95 95 96 87 100 76 y 56 39 73 56 58 60 2 2 2 3 1Botswana 18 – – – – – – – – – – – – – – – – – – – – –Brazil 70 y – – – – – – – – – – – – – – – – – – – – –British Virgin Islands – – – – – – – – – – – – – – – – – – – – – –Brunei Darussalam – – – – – – – – – – – – – – – – – – – – – –Bulgaria – – – – – – – – – – – – – – – – – – – – – –Burkina Faso 3 y 3 y 3 y – – 14 14 14 12 26 24 y – – – – – – – – – – –Burundi 5 5 5 4 10 34 35 34 32 38 20 y – – – – – – – – – – –Cabo Verde – – – – – – – – – – – – – – – – – – – – – –Cambodia 15 y 12 y 17 y 7 y 38 y 59 y 57 y 62 y 48 y 73 y 9 y 4 y 1 y 12 y 34 y 20 y 53 y 10 y 10 y 10 y 16 y 4 yCameroon 28 27 29 2 66 44 45 44 50 52 4 4 0 17 53 47 65 34 34 35 52 23Canada – – – – – – – – – – – – – – – – – – – – – –Central African Republic 5 5 6 2 17 74 74 74 70 78 42 y 1 0 3 49 41 51 61 60 62 58 60Chad 3 y 3 y 3 y 1 y 11 y 47 y 48 y 46 y 41 y 51 y 20 y 1 y 1 y 2 y 41 y 33 y 52 y 47 y 50 y 45 y 43 y 46 yChile – – – – – – – – – – – – – – – – – – – – – –China – – – – – – – – – – – – – – – – – – – – – –Colombia 37 y – – – – – – – – – – – – – – – – – – – – –Comoros – – – – – – – – – – – – – – – – – – – – – –Congo 36 – – – – 59 – – – – 6 3 – – 51 – – 42 – – – –Cook Islands – – – – – – – – – – – – – – – – – – – – – –Costa Rica 18 17 18 8 40 68 69 66 54 88 52 y 37 13 70 73 68 74 4 4 4 6 3Côte d'Ivoire 5 5 5 1 15 50 50 51 55 57 40 y 5 3 13 39 44 35 59 60 58 62 51Croatia 74 y 75 y 73 y – – – – – – – – – – – – – – – – – – –Cuba 76 75 77 – – 89 89 90 – – 18 48 – – 78 – – 4 4 4 – –Cyprus – – – – – – – – – – – – – – – – – – – – – –Czechia – – – – – – – – – – – – – – – – – – – – – –Democratic People's Republic of Korea 98 98 97 – – 91 88 93 – – 75 y 79 – – 47 – – 17 17 16 – –
Democratic Republic of the Congo 7 y 7 y 7 y 1 y 20 y 52 y 55 y 48 y 45 y 64 y 4 y 1 y 0 y 2 y 27 y 18 y 49 y 49 y 50 y 48 y 57 y 29 yDenmark – – – – – – – – – – – – – – – – – – – – – –Djibouti 14 12 16 – – 37 y 38 y 35 y – – 28 y 15 – – 24 – – 8 8 8 – –Dominica – – – – – – – – – – – – – – – – – – – – – –Dominican Republic 40 39 40 16 72 58 58 59 38 73 6 10 2 28 57 57 58 5 5 5 7 3Ecuador – – – – – – – – – – – – – – – – – – – – – –Egypt 47 y 48 y 47 y 34 y 50 y – – – – – – – – – – – – 4 4 4 7 2El Salvador 25 24 26 19 44 59 57 62 45 78 8 18 6 44 62 62 58 4 4 3 4 4Equatorial Guinea – – – – – – – – – – – – – – – – – – – – – –Eritrea – – – – – – – – – – – – – – – – – – – – – –Estonia – – – – – – – – – – – – – – – – – – – – – –Ethiopia – – – – – – – – – – – – – – – – – – – – – –Fiji – – – – – – – – – – – – – – – – – – – – – –Finland – – – – – – – – – – – – – – – – – – – – – –France – – – – – – – – – – – – – – – – – – – – – –
TABLE 12. EARLY CHILDHOOD DEVELOPMENT

199TABLE 12. EARLY CHILDHOOD DEVELOPMENT
Countries and areas
Attendance in early childhood education2005–2016*
Adult support for learning ++
2005–2016*
Father’s support
for learning
++
2005–2016*
Learning materials at home 2005–2016* Children with inadequate
supervision2005–2016*Children’s books Playthings ++
total male femalepoorest
20%richest
20% total male femalepoorest
20%richest
20% totalpoorest
20%richest
20% totalpoorest
20%richest
20% total male femalepoorest
20%richest
20%
Gabon – – – – – – – – – – – – – – – – – – – – – –Gambia 18 17 19 12 32 48 49 47 50 55 21 y 1 0 4 42 28 50 21 22 19 25 18Georgia 62 y – – – – 83 82 84 85 82 35 y 58 y 40 y 74 y 38 41 41 6 y 6 y 7 y 6 y 8 yGermany – – – – – – – – – – – – – – – – – – – – – –Ghana 68 65 72 42 97 40 38 42 23 78 30 y 6 1 23 41 31 51 21 21 21 27 15Greece – – – – – – – – – – – – – – – – – – – – – –Grenada – – – – – – – – – – – – – – – – – – – – – –Guatemala – – – – – – – – – – – – – – – – – – – – – –Guinea – – – – – – – – – – – – – – – – – – – – – –Guinea-Bissau 13 13 14 3 46 34 41 28 33 51 0 1 0 3 31 24 46 31 31 31 27 38Guyana 61 63 59 45 76 87 85 90 82 94 16 47 25 76 69 65 70 5 5 5 10 1Haiti – – – – – – – – – – – – – – – – – – – – – –Holy See – – – – – – – – – – – – – – – – – – – – – –Honduras 19 17 21 13 28 48 47 49 28 75 59 y 11 1 34 78 74 81 4 5 4 8 2Hungary – – – – – – – – – – – – – – – – – – – – – –Iceland – – – – – – – – – – – – – – – – – – – – – –India – – – – – – – – – – – – – – – – – – – – – –Indonesia 17 16 18 – – – – – – – – – – – – – – – – – – –Iran (Islamic Republic of) 20 y 19 y 22 y – – 70 y 69 y 70 y – – 60 y 36 y – – 67 y – – 15 y 15 y 15 y – –Iraq 4 4 4 1 10 58 58 59 40 78 55 y 5 1 16 34 34 32 8 8 7 9 8Ireland – – – – – – – – – – – – – – – – – – – – – –Israel – – – – – – – – – – – – – – – – – – – – – –Italy – – – – – – – – – – – – – – – – – – – – – –Jamaica 92 92 91 88 100 88 86 90 76 86 28 y 55 34 73 61 64 56 2 2 2 2 1Japan – – – – – – – – – – – – – – – – – – – – – –Jordan 22 y 21 y 23 y 11 y 39 y 82 y 81 y 83 y 75 y 87 y 72 y 23 y 11 y 40 y 70 y 68 y 74 y 9 y 9 y 9 y 11 y 8 yKazakhstan 55 53 58 45 70 86 84 87 83 95 7 51 35 73 60 63 61 5 4 6 8 3Kenya – – – – – – – – – – – – – – – – – – – – – –Kiribati – – – – – – – – – – – – – – – – – – – – – –Kuwait – – – – – – – – – – – – – – – – – – – – – –Kyrgyzstan 23 23 23 12 50 72 74 70 63 73 3 27 15 54 59 63 54 5 5 4 6 5Lao People's Democratic Republic 23 21 25 5 73 57 58 57 42 87 52 y 5 1 24 41 29 50 14 15 13 20 8Latvia – – – – – – – – – – – – – – – – – – – – – –Lebanon 62 63 60 – – 56 y 58 y 54 y – – 74 y 29 – – 16 y – – 9 8 10 – –Lesotho – – – – – – – – – – – – – – – – – – – – – –Liberia – – – – – – – – – – – – – – – – – – – – – –Libya – – – – – – – – – – – – – – – – – – – – – –Liechtenstein – – – – – – – – – – – – – – – – – – – – – –Lithuania – – – – – – – – – – – – – – – – – – – – – –Luxembourg – – – – – – – – – – – – – – – – – – – – – –Madagascar – – – – – – – – – – – – – – – – – – – – – –Malawi 39 37 41 26 67 29 29 30 22 44 3 1 0 6 45 35 66 37 37 37 39 28Malaysia 53 52 55 – – 25 25 24 – – – 56 – – 62 – – 3 3 3 – –Maldives – – – – – – – – – – – – – – – – – – – – – –Mali 5 6 5 1 21 55 55 55 53 65 5 0 0 2 52 42 70 32 32 32 31 27Malta – – – – – – – – – – – – – – – – – – – – – –Marshall Islands – – – – – – – – – – – – – – – – – – – – – –Mauritania 12 – – – – 44 – – – – 5 1 − − 33 – – 34 – – – –Mauritius – – – – – – – – – – – – – – – – – – – – – –Mexico 60 58 62 58 71 76 71 80 62 94 14 35 15 64 76 74 85 5 5 5 8 3Micronesia (Federated States of) – – – – – – – – – – – – – – – – – – – – – –Monaco – – – – – – – – – – – – – – – – – – – – – –Mongolia 68 68 68 36 90 55 55 55 38 71 10 33 13 57 56 57 58 10 9 11 15 8Montenegro 40 39 42 7 66 98 97 99 93 98 45 73 48 87 60 61 66 3 3 3 2 3Montserrat – – – – – – – – – – – – – – – – – – – – – –Morocco 39 36 41 6 78 35 y 34 y 35 y 16 y 59 y 58 y 21 y 9 y 52 y 14 y 19 y 7 y 11 – – – –Mozambique – – – – – 47 45 48 48 50 20 y 3 2 10 – – – 33 33 32 – –Myanmar 23 y 22 y 25 y 11 y 42 y 54 y 53 y 56 y 43 y 77 y 6 y 5 y 1 y 15 y 72 y 64 y 76 y 13 y 14 y 13 y 21 y 5 yNamibia – – – – – – – – – – – – – – – – – – – – – –Nauru – – – – – – – – – – – – – – – – – – – – – –Nepal 51 52 49 41 84 67 70 64 51 90 10 5 1 16 59 60 60 21 20 21 30 12Netherlands – – – – – – – – – – – – – – – – – – – – – –New Zealand – – – – – – – – – – – – – – – – – – – – – –Nicaragua – – – – – – – – – – – – – – – – – – – – – –

UNICEF – THE STATE OF THE WORLD’S CHILDREN 2017
Countries and areas
Attendance in early childhood education2005–2016*
Adult support for learning ++
2005–2016*
Father’s support
for learning
++
2005–2016*
Learning materials at home 2005–2016* Children with inadequate
supervision2005–2016*Children’s books Playthings ++
total male femalepoorest
20%richest
20% total male femalepoorest
20%richest
20% totalpoorest
20%richest
20% totalpoorest
20%richest
20% total male femalepoorest
20%richest
20%
Niger – – – – – – – – – – – – – – – – – – – – – –Nigeria 43 42 43 10 84 65 66 64 48 89 37 y 6 0 19 38 29 48 40 40 40 40 34Niue – – – – – – – – – – – – – – – – – – – – – –Norway – – – – – – – – – – – – – – – – – – – – – –Oman 29 28 31 − − 81 78 84 − − 22 25 − − 75 − − 45 44 45 − −Pakistan – – – – – – – – – – – – – – – – – – – – – –Palau – – – – – – – – – – – – – – – – – – – – – –Panama 37 38 35 28 67 74 73 74 55 89 45 y 26 7 59 69 67 68 3 3 2 6 1Papua New Guinea – – – – – – – – – – – – – – – – – – – – – –Paraguay – – – – – – – – – – – – – – – – – – – – – –Peru 77 y 76 y 79 y 70 y 90 y – – – – – – – – – – – – – – – – –Philippines – – – – – – – – – – – – – – – – – – – – – –Poland – – – – – – – – – – – – – – – – – – – – – –Portugal – – – – – – – – – – – – – – – – – – – – – –Qatar 41 41 41 – – 88 89 88 – – 85 y 40 – – 55 – – 12 12 11 – –Republic of Korea – – – – – – – – – – – – – – – – – – – – – –Republic of Moldova 71 74 67 50 88 89 86 92 81 95 47 y 68 33 87 68 75 69 6 6 6 9 5Romania 82 y 82 y 83 y – – – – – – – – – – – – – – – – – – –Russian Federation – – – – – – – – – – – – – – – – – – – – – –Rwanda 13 y 12 y 14 y 3 y 45 y 49 y 49 y 49 y 36 y 66 y 3 y 1 y 0 y 3 y 30 y 21 y 41 y 35 y 35 y 35 y 38 y 21 ySaint Kitts and Nevis – – – – – – – – – – – – – – – – – – – – – –Saint Lucia 85 87 84 – – 93 89 96 – – 50 y 68 – – 59 – – 5 5 5 – –Saint Vincent and the Grenadines – – – – – – – – – – – – – – – – – – – – – –Samoa – – – – – – – – – – – – – – – – – – – – – –San Marino – – – – – – – – – – – – – – – – – – – – – –Sao Tome and Principe 36 34 39 21 63 63 63 63 48 74 3 6 1 20 65 65 57 16 17 14 26 8Saudi Arabia – – – – – – – – – – – – – – – – – – – – – –Senegal 35 y 35 y 34 y 12 y 68 y – – – – – – – – – – – – – – – – –Serbia 50 52 49 9 82 96 95 96 87 98 37 72 44 83 75 78 76 1 2 1 3 2Seychelles – – – – – – – – – – – – – – – – – – – – – –Sierra Leone 14 13 15 5 42 54 53 55 45 79 42 y 2 0 10 35 24 50 32 33 32 29 28Singapore – – – – – – – – – – – – – – – – – – – – – –Slovakia – – – – – – – – – – – – – – – – – – – – – –Slovenia – – – – – – – – – – – – – – – – – – – – – –Solomon Islands – – – – – – – – – – – – – – – – – – – – – –Somalia 2 2 2 1 6 79 80 79 76 85 48 y – – – – – – – – – – –South Africa 48 y – – – – – – – – – – – – – – – – – – – – –South Sudan 6 6 6 2 13 – – – – – – – – – – – – – – – – –Spain – – – – – – – – – – – – – – – – – – – – – –Sri Lanka – – – – – – – – – – – – – – – – – – – – – –State of Palestine 26 27 26 21 38 78 77 78 69 87 12 20 13 31 69 64 72 14 14 15 15 12Sudan 22 22 23 7 59 − − − − − − 2 0 7 46 36 55 − − − − −Suriname 34 33 35 16 63 73 71 75 56 91 26 y 25 4 61 59 61 60 7 7 7 9 8Swaziland 30 26 33 28 48 39 33 44 25 59 2 6 2 19 67 56 78 17 16 17 18 15Sweden – – – – – – – – – – – – – – – – – – – – – –Switzerland – – – – – – – – – – – – – – – – – – – – – –Syrian Arab Republic 8 8 7 4 18 70 70 69 52 84 62 y 30 12 53 52 52 51 17 17 17 22 15Tajikistan 6 – – – – 74 73 74 56 86 23 y 17 4 33 46 43 44 13 13 12 15 11Thailand 85 84 85 86 84 93 93 92 87 98 34 41 23 73 76 81 67 2 6 6 8 3The former Yugoslav Republic of Macedonia 30 – – – – 92 92 91 81 96 71 y 52 18 81 71 70 79 5 5 5 11 1
Timor-Leste – – – – – – – – – – – – – – – – – – – – – –Togo 26 y 26 y 26 y 15 y 52 y 25 y 25 y 25 y 20 y 42 y 21 y 1 y 0 y 3 y 34 y 22 y 48 y 29 y 26 y 33 y 36 y 26 yTokelau – – – – – – – – – – – – – – – – – – – – – –Tonga – – – – – – – – – – – – – – – – – – – – – –Trinidad and Tobago 75 74 76 65 87 98 98 98 96 100 63 y 81 66 93 65 63 72 1 1 1 2 0Tunisia 44 42 47 13 81 71 68 74 44 90 71 y 18 3 40 53 46 56 13 13 14 18 9Turkey – – – – – – – – – – – – – – – – – – – – – –Turkmenistan 43 43 43 17 81 94 94 95 92 98 15 48 30 66 53 59 56 1 0 1 1 1Turks and Caicos Islands – – – – – – – – – – – – – – – – – – – – – –Tuvalu – – – – – – – – – – – – – – – – – – – – – –Uganda – – – – – – – – – – – – – – – – – – – – – –Ukraine 52 54 50 30 68 98 97 98 95 99 71 y 91 92 92 52 61 51 7 6 7 11 5United Arab Emirates – – – – – – – – – – – – – – – – – – – – – –United Kingdom – – – – – – – – – – – – – – – – – – – – – –
TABLE 12. EARLY CHILDHOOD DEVELOPMENT

201
Countries and areas
Attendance in early childhood education2005–2016*
Adult support for learning ++
2005–2016*
Father’s support
for learning
++
2005–2016*
Learning materials at home 2005–2016* Children with inadequate
supervision2005–2016*Children’s books Playthings ++
total male femalepoorest
20%richest
20% total male femalepoorest
20%richest
20% totalpoorest
20%richest
20% totalpoorest
20%richest
20% total male femalepoorest
20%richest
20%
United Republic of Tanzania – – – – – – – – – – – – – – – – – – – – – –United States – – – – – – – – – – – – – – – – – – – – – –Uruguay 81 83 80 – – 93 94 91 – – 66 y 59 – – 75 – – 3 3 3 – –Uzbekistan 21 y 21 y 21 y – – 91 91 90 83 95 54 y 43 32 59 67 74 62 5 5 5 6 7Vanuatu – – – – – – – – – – – – – – – – – – – – – –Venezuela (Bolivarian Republic of) 66 y – – – – – – – – – – – – – – – – – – – – –Viet Nam 71 74 69 53 86 76 76 76 52 96 15 26 6 58 52 44 54 7 6 8 14 2Yemen 3 3 3 0 8 33 34 32 16 56 37 y 10 4 31 49 45 49 34 36 33 46 22Zambia – – – – – – – – – – – – – – – – – – – – – –Zimbabwe 22 20 23 17 34 43 43 43 35 59 3 3 1 12 62 48 74 19 19 18 25 7
SUMMARYEast Asia and Pacific 37 ** 37 ** 37 ** − − − − − − − − − − − − − − − − − − −Europe and Central Asia − − − − − − − − − − − − − − − − − − − − − −
Eastern Europe and Central Asia − − − − − − − − − − − − − − − − − − − − − −Western Europe − − − − − − − − − − − − − − − − − − − − − −
Latin America and Caribbean 61 − − − − − − − − − − − − − − − − − − − − −Middle East and North Africa 26 25 26 15 37 61 61 61 – – 58 19 – – 45 − − 11 12 11 14 8North America − − − − − − − − − − − − − − − − − − − − − −South Asia − − − − − − − − − − − − − − − − − − − − − −Sub-Saharan Africa 27 25 26 8 54 53 53 52 44 69 23 3 0 12 39 – – 39 – – − −
Eastern and Southern Africa – – – – – – – – – – – – – – – – – – – – – –West and Central Africa 27 27 28 8 58 54 55 53 44 72 24 4 0 13 38 30 50 41 41 41 44 32
Least developed countries 13 13 14 7 29 55 56 55 47 69 17 4 1 11 47 40 57 31 − − − −World − − − − − − − − − − − − − − − − − − − − − −
For a complete list of countries and areas in the regions, subregions and country categories, see page 150 or visit <data.unicef.org/regionalclassifications>.It is not advisable to compare data from consecutive editions of The State of the World’s Children.
TABLE 12. EARLY CHILDHOOD DEVELOPMENT
Attendance in early childhood education – Percentage of children 36–59 months old who are attending an early childhood education programme.Adult support for learning – Percentage of children 36–59 months old with whom an adult has engaged in four or more of the following activities to promote learning and school readiness in the past 3 days: a) reading books to the child, b) telling stories to the child, c) singing songs to the child, d) taking the child outside the home, e) playing with the child, and f) spending time with the child naming, counting or drawing things.Father’s support for learning – Percentage of children 36–59 months old whose father has engaged in four or more of the following activities to promote learning and school readiness in the past 3 days: a) reading books to the child, b) telling stories to the child, c) singing songs to the child, d) taking the child outside the home, e) playing with the child, and f) spending time with the child naming, counting or drawing things.
Learning materials at home: Children’s books – Percentage of children 0–59 months old who have three or more children’s books at home.Learning materials at home: Playthings – Percentage of children 0–59 months old with two or more of the following playthings at home: household objects or objects found outside (sticks, rocks, animals, shells, leaves etc.), homemade toys or toys that came from a store.Children with inadequate supervision – Percentage of children 0–59 months old left alone or in the care of another child younger than 10 years of age for more than one hour at least once in the past week.
Attendance in early childhood education – Demographic and Health Surveys (DHS), Multiple Indicator Cluster Surveys (MICS), and other national surveys.Adult support for learning – DHS, MICS and other national surveys.Father’s support for learning – DHS, MICS and other national surveys.Learning materials at home: Children’s books – DHS, MICS and other national surveys.
Learning materials at home: Playthings – DHS, MICS and other national surveys.Children with inadequate supervision – DHS, MICS and other national surveys.
– Data not available.p Based on small denominators
(typically 25–49 unweighted cases). No data based on fewer than 25 unweighted cases are displayed.
y Data differ from the standard defini-tion or refer to only part of a country. If they fall within the noted reference period, such data are included in the calculation of regional and global averages.
++ Changes in the definitions of several ECD indicators were made between the third and fourth round of MICS (MICS3 and MICS4). In order to allow for comparability with MICS4, data from MICS3 for the adult support
for learning, father’s support for learning and learning materials at home (playthings) indicators were recalculated according to MICS4 indicator definitions. Therefore, the recalculated data presented here will differ from estimates reported in MICS3 national reports.
* Data refer to the most recent year available during the period specified in the column heading.
NOTESDEFINITIONS OF THE INDICATORS
MAIN DATA SOURCES

UNICEF – THE STATE OF THE WORLD’S CHILDREN 2017
Countries and areas
Population below international poverty line of
US$1.90 per day (%)
National monetary child poverty
(%)P ODA inflow in millions US$ODA inflow
as a % of recipient GNI
Share of household income
(%, 2009–2013*)2010–2014* 2010–2016* 2015 2015 poorest 40% richest 20%
Afghanistan – – 4,239 21 – –Albania 1 – 334 3 22 38Algeria – – 88 0 – –Andorra – – – – – –Angola 30 x – 380 0 15 x 49 xAnguilla – – – – – –Antigua and Barbuda – 24 x 1 0 – –Argentina 2 – -23 0 15 47Armenia 2 34 348 3 21 40Australia – – – – 19 42Austria – – – – 21 38Azerbaijan 1 x 5 70 0 21 x 41 xBahamas – – – – – –Bahrain – – – – – –Bangladesh 19 – 2,570 1 21 42Barbados – 32 – – – –Belarus 0 9 105 0 24 36Belgium – – – – 23 36Belize 14 x – 27 2 11 x 58 xBenin 53 – 430 5 16 51Bhutan 2 – 97 5 18 46Bolivia (Plurinational State of) 7 – 787 2 12 52Bosnia and Herzegovina 0 – 355 2 19 41Botswana 18 x 26 66 0 9 65Brazil 4 – 999 0 11 57British Virgin Islands – 29 x – – – –Brunei Darussalam – – – – – –Bulgaria 2 25 – – 18 43Burkina Faso 44 – 997 9 17 47Burundi 78 x 55 367 12 21 x 43 xCabo Verde 8 x – 153 10 14 x 53 xCambodia 2 – 677 4 22 40Cameroon 24 – 664 2 15 x 49 xCanada – – – – 20 41Central African Republic 66 x – 487 31 10 x 61 xChad 38 – 607 6 15 49Chile 1 18 50 0 13 57China 2 7 y -332 0 15 48Colombia 6 – 1,347 0 11 58Comoros 14 x – 66 12 11 x 61 xCongo 37 54 x 89 1 12 54Cook Islands – – – – – –Costa Rica 2 – 109 0 12 54Côte d'Ivoire 29 x – 653 2 – –Croatia 1 21 – – 20 40Cuba – – 553 – – –Cyprus – – – – 20 43Czechia 0 – – – 24 36Democratic People's Republic of Korea – – 131 – – –
Democratic Republic of the Congo 77 – 2,599 8 16 48Denmark – – – – 23 38Djibouti 23 – 170 – 15 50Dominica – 38 x 11 2 – –Dominican Republic 2 – 278 0 14 53Ecuador 4 – 311 0 13 53Egypt – 29 2,488 1 – –El Salvador 3 44 88 0 15 50Equatorial Guinea – – 8 0 – –Eritrea – – 92 – – –Estonia 1 – – – 20 41Ethiopia 34 – 3,234 5 21 42Fiji 4 x – 102 2 16 x 50 xFinland – – – – 23 37
TABLE 13. ECONOMIC INDICATORS

203
Countries and areas
Population below international poverty line of
US$1.90 per day (%)
National monetary child poverty
(%)P ODA inflow in millions US$ODA inflow
as a % of recipient GNI
Share of household income
(%, 2009–2013*)2010–2014* 2010–2016* 2015 2015 poorest 40% richest 20%
France – – – – 20 41Gabon 8 x – 99 1 16 x 49 xGambia 45 x – 108 12 14 x 53 xGeorgia 10 27 448 3 16 46Germany – – – – 22 39Ghana 25 x – 1,768 5 15 x 49 xGreece – – – – 17 42Grenada – 51 x 23 2 – –Guatemala 9 68 408 1 12 57Guinea 35 – 538 9 20 42Guinea-Bissau 67 – 95 9 13 57Guyana 14 x – 31 1 14 x 50 xHaiti 54 – 1,043 12 8 64Holy See – – – – – –Honduras 16 74 537 3 10 58Hungary 0 – – – 21 39Iceland – – – – 23 36India 21 – 3,163 0 20 44Indonesia 8 17 x -43 0 18 47Iran (Islamic Republic of) 0 – 111 – 18 45Iraq – – 1,485 1 – –Ireland – – – – 20 41Israel – – – – 14 47Italy – – – – 19 42Jamaica 2 x – 57 0 15 x 52 xJapan – – – – 20 x 40 xJordan – 19 2,150 6 – –Kazakhstan 0 45 83 0 24 36Kenya 34 x – 2,474 4 13 x 54 xKiribati 14 x – 65 19 18 x 44 xKuwait – – – – – –Kyrgyzstan 1 46 769 12 23 38Lao People's Democratic Republic 17 – 471 3 18 46Latvia 1 – – – 19 42Lebanon – – 975 2 – –Lesotho 60 – 83 3 10 58Liberia 69 x – 1,094 62 18 x 44 xLibya – – 158 – – –Liechtenstein – – – – – –Lithuania 1 – – – 19 42Luxembourg – – – – 19 42Madagascar 78 78 677 7 16 49Malawi 71 – 1,049 17 15 52Malaysia 0 x – -1 0 13 51Maldives 7 x – 27 1 17 45Mali 49 x – 1,200 10 20 41Malta – – – – – –Marshall Islands – – 57 24 – –Mauritania 6 – 318 7 18 x 42 xMauritius 1 – 77 1 19 44Mexico 3 54 309 0 14 54Micronesia (Federated States of) 17 – 81 22 15 48Monaco – – – – – –Mongolia 0 – 236 2 20 42Montenegro 0 13 100 2 20 40Montserrat – 47 x – – – –Morocco 3 x – 1,369 1 17 x 48 xMozambique 69 x – 1,815 12 15 x 51 xMyanmar – – 1,169 2 – –Namibia 23 x 34 142 1 9 66Nauru – – 31 25 – –Nepal 15 – 1,216 6 20 42Netherlands – – – – 23 37New Zealand – – – – – –
TABLE 13. ECONOMIC INDICATORS

UNICEF – THE STATE OF THE WORLD’S CHILDREN 2017
Countries and areas
Population below international poverty line of
US$1.90 per day (%)
National monetary child poverty
(%)P ODA inflow in millions US$ODA inflow
as a % of recipient GNI
Share of household income
(%, 2009–2013*)2010–2014* 2010–2016* 2015 2015 poorest 40% richest 20%
Nicaragua 6 – 454 4 14 51Niger 46 63 x 866 12 22 41Nigeria 54 x – 2,432 1 15 49Niue – – – – – –Norway – – – – 24 35Oman – – – – – –Pakistan 6 – 3,790 1 22 40Palau – – 14 5 – –Panama 4 – 9 0 11 56Papua New Guinea 39 x – 590 – 14 49Paraguay 3 32 56 0 13 53Peru 3 – 332 0 14 50Philippines 13 – 515 0 15 50Poland 0 – – – 20 41Portugal – – – – 19 43Qatar – – – – – –Republic of Korea – – – – – –Republic of Moldova 0 13 313 4 – –Romania 0 38 – – 23 36Russian Federation 0 – – – 16 48Rwanda 60 47 1,082 13 14 57Saint Kitts and Nevis – 31 x – – – –Saint Lucia 36 x 37 x 13 1 15 x 48 xSaint Vincent and the Grenadines – 38 x 13 2 – –Samoa 1 x – 94 12 16 x 50 xSan Marino – – – – – –Sao Tome and Principe 32 – 49 15 21 40Saudi Arabia – – – – – –Senegal 38 49 879 7 17 47Serbia 0 30 313 1 22 38Seychelles 1 – 7 0 15 53Sierra Leone 52 – 946 23 20 42Singapore – – – – – –Slovakia 0 – – – 23 35Slovenia 0 – – – 24 35Solomon Islands 46 x – 190 17 14 x 52 xSomalia – – 1,254 23 – –South Africa 17 56 1,421 0 7 69South Sudan 43 x – 1,675 21 13 51Spain – – – – 18 42Sri Lanka 2 – 427 1 18 47State of Palestine 0 x – 1,873 13 20 43Sudan 15 x – 900 1 19 42Suriname 23 x – 15 0 – x – xSwaziland 42 x – 93 2 12 57Sweden – – – – 23 36Switzerland – – – – 21 40Syrian Arab Republic – – 4,882 – – –Tajikistan 20 – 426 5 22 40Thailand 0 – 59 0 18 45The former Yugoslav Republic of Macedonia 1 x 29 214 2 15 x 50 x
Timor-Leste 47 x 48 212 8 22 x 41 xTogo 54 – 200 5 14 52Tokelau – – – – – –Tonga 1 x – 68 16 18 45Trinidad and Tobago 3 x – – – – –Tunisia 2 – 475 1 18 43Turkey 0 33 2,145 0 16 47Turkmenistan 42 x – 24 0 16 x 48 xTurks and Caicos Islands – 26 – – – –Tuvalu 3 – 50 89 16 48Uganda 35 22 1,628 6 17 48Ukraine 0 – 1,458 2 25 35
TABLE 13. ECONOMIC INDICATORS

205
Countries and areas
Population below international poverty line of
US$1.90 per day (%)
National monetary child poverty
(%)P ODA inflow in millions US$ODA inflow
as a % of recipient GNI
Share of household income
(%, 2009–2013*)2010–2014* 2010–2016* 2015 2015 poorest 40% richest 20%
United Arab Emirates – – – – – –United Kingdom – – – – 20 40United Republic of Tanzania 47 29 2,580 6 19 46United States – – – – 15 46Uruguay 0 – 19 0 15 48Uzbekistan 67 x 13 448 1 19 x 43 xVanuatu 15 – 187 – 18 44Venezuela (Bolivarian Republic of) 9 x – 37 – 12 x 51 xViet Nam 3 – 3,157 2 17 46Yemen – – 1,531 4 – –Zambia 64 65 797 4 11 61Zimbabwe 21 78 788 5 15 50
SUMMARYEast Asia and Pacific 3 – 7,781 0 16 48Europe and Central Asia – – 7,950 1 20 42
Eastern Europe and Central Asia 1 – 7,950 1 19 44Western Europe – – – – 20 40
Latin America and Caribbean 5 – 7,896 0 12 55Middle East and North Africa – – 17,585 1 – –North America – – – – 16 46South Asia 19 – 15,530 1 20 43Sub-Saharan Africa 45 – 40,194 3 16 49
Eastern and Southern Africa 40 – 22,915 3 16 50West and Central Africa – – 17,279 2 16 48
Least developed countries 40 – 42,980 5 18 45World 13 – 96,936 0 17 46
For a complete list of countries and areas in the regions, subregions and country categories, see page 150 or visit <data.unicef.org/regionalclassifications>.It is not advisable to compare data from consecutive editions of The State of the World’s Children.
TABLE 13. ECONOMIC INDICATORS
Population below international poverty line of US$1.90 per day – Poverty headcount ratio at $1.90 a day is the percentage of the population living on less than $1.90 a day at 2011 international prices. As a result of revisions in PPP exchange rates, poverty rates for individual countries cannot be compared with poverty rates reported in earlier editions.National monetary child poverty – Percentage of children aged 0–17 years old living in households with income or consumption below the government defined national monetary poverty threshold.
ODA – Net official development assistance.Share of household income – Percentage of income received by the 20 per cent of households with the highest income and by the 40 per cent of households with the lowest income.
Population below international poverty line of US$1.90 per day – The World Bank.National monetary child poverty – Data are compiled from official national government sources such as Statistical Office tabulations and national household survey and poverty reports, and from official regional databases such as those compiled by Eurostat. National estimates are based on representative household income or expenditure surveys.
ODA – Organisation for Economic Co-operation and Development.Share of household income – The World Bank.
– Data not available.x Data refer to years or periods other
than those specified in the column heading. Such data are not included in the calculation of regional and global averages.
y Data differ from the standard defini-tion or refer to only part of a country. If they fall within the reference period, such data are included in the calculation of regional and global averages.
P This indicator reflects very different national methodologies, and current coverage is insufficient to establish robust profiles at the regional level and global level.
* Data refer to the most recent year available during the period specified in the column heading.
NOTES
MAIN DATA SOURCES
DEFINITIONS OF THE INDICATORS


The State of the World’s Children 2017 examines the ways in which digital technology has already changed children’s lives and life chances – and explores what the future may hold.
If leveraged in the right way and made universally accessible, digital technology can be a game changer for children being left behind – whether because of poverty, race, ethnicity, gender, disability, displacement or geographic isolation – connecting them to a world of opportunity and providing them with the skills they need to succeed in a digital world.
But unless we expand access, digital technology may create new divides that prevent children from fulfilling their potential. And if we don’t act now to keep pace with rapid change, online risks may make vulnerable children more susceptible to exploitation, abuse and even trafficking – as well as more subtle threats to their well-being.
This report argues for faster action, focused investment and greater cooperation to protect children from the harms of a more connected world – while harnessing the opportunities of the digital age to benefit every child.
9 789280 649307
ISBN: 978-92-806-4930-7
© United Nations Children’s Fund (UNICEF) December 2017