
Validation of the Body Checking Questionnaire (BCQ) in an Eating Disorders Population
Upload
khangminh22Category
view
4download
0
Children at high-familial risk for Eating Disorders: study of
psychopathology, neuropsychology and
neuroimaging
Manuela Martinez-Barona Soyer, MSc
A thesis submitted to University College London
for the degree of
Doctor of Philosophy in Psychology
UCL Great Ormond Street Institute of Child Health
November 2019

2
‘I, Manuela Martinez-Barona Soyer confirm that the work presented in this thesis
is my own. Where information has been derived from other sources, I confirm that
this has been indicated in the thesis.'
‘The content of chapters 5 and 6 have been published (see appendix A) and the
papers put as appendices. The inclusion of the content of the papers in chapter
form adheres to University regulations (http://www.ucl.ac.uk/srs/academic-
regulations/docs/rd-section2.pdf; p.6. Section 1.2) and has been authorised by
Mr. Toby Whyte, UCL Research Degree Officer, 3rd Sept. 15.’
3
Abstract
Evidence suggest that a diagnosis of an eating disorder (ED) is associated with differential
neurocognitive functioning and neural mechanisms. However, whether differences are
present prior to the onset of the disorder (‘trait’), possibly affecting risk status for
development of an ED; or whether differences are a consequence of secondary features
of the disorder such as low nutritional intake (‘state’), is not clear. Family studies have
established that first-degree relatives of individuals with ED are at higher risk of developing
an ED than the general population, therefore, children of mothers with an ED (current or
history) are the perfect group to study risk pathways to developing ED.
This is the first study to explore neural alterations as well as neurocognitive functioning in
girls at high-familial risk of developing an ED, in comparison to children who are not. High
risk status of girls were defined using a maternal clinical interview to confirm lifetime ED
diagnosis. Intelligence, social cognition, reward responsiveness, neuropsychological
function and brain imaging were investigated in girls at high-familial risk.
Girls at high familial risk demonstrated difficulties in set-shifting (cognitive flexibility) and
increased reward responsiveness when compared to girls at low risk. Girls at risk also had
overall increased Gray matter (GM) volume, and specifically increased GM in amygdala,
caudate, hippocampus and orbitofrontal cortex when compared to girls at low risk. There
were no differences in white matter (WM) connectivity from amygdala to areas of the cortex
in girls at risk compared to girls at low risk.
Results suggest that differences observed may constitute putative intermediate
phenotypes for ED, although this requires further study with larger samples. Findings are
important as they support hypothesis of altered set-shifting as an endophenotype for ED.
They also provide evidence of alterations in ventral (limbic) neurcircuit that includes the
amygdala and caudate, both of which are of importance for identifying emotional stimuli
and generation of affective response to these as well as playing a role in reward processes
and behaviour regulation.

4
Acknowledgments
I would like to thank my supervisors Nadia Micali and Christopher Clark for their support
and guidance through my PhD. I have been very grateful for their support and
encouragement of independence and personal development. I am also grateful to my
supervisor Nadia for encouraging me to undertake this PhD and her support and
encouragement to do this while working as the research coordinator in her team. I have
benefited greatly from the experience which has allowed me to learn more about the
research world that I would have ever done had I not had the working experience alongside
my PhD. While this has been challenging at times, I have always been supported and
encouraged to work independently and trust my skills.
I am hugely thankful to Kiran Seunarine, research associate at Developmental
Neurosciences Department at UCL Great Ormond Street Institute of Child Health. Over
the duration of my PhD he has been the person who has supported me through never
ending questions about neuroimaging methodology and has not only done this but also
developed specific scripts to help explore my own developing hypotheses. He has been
extremely kind in his support even when this has taken an important time from his working
day.
I would like to thank Roz Shafran, who I have considered a mentor during my time at the
Institute of Child health, and my dear friend Sophie Bennet who has had to suffer through
my worries and questions while also completing her own PhD. Both have helped me and
supported me in pursuing my clinical career while supporting my research and helping me
balance them both.
I have to say thank you to everyone who took part in my study. This has not been an easy
thing for these families to undertake and I appreciate their honesty about their own
difficulties and their support in helping us understand them better. I have nothing but praise
for them and I wish that they continue to do well.
Lastly, but by no means least, I have to thank my wonderful husband who has had to
endure more than anyone else. For putting his own career development on hold for two
years to allow me to finish my PhD, for his kindness, love, support and encouragement. It
has been a long few years during which we got married and had our wonderful daughter
and I couldn’t have asked for a better companion. I will eternally be grateful for his
unwavering belief in my capacity.
5
Impact Statement
The study undertaken within this Ph.D. has been the first neuroimaging study to be
conducted in this cohort. ED have the highest mortality rates of any other psychiatric
disorder, great social and economic burden and current treatment options are limited in
their effectiveness. Therefore, the understanding of its neurobiological underpinnings,
which can help understand risk and maintenance factors, is of great importance.
In the short term, the pilot study will inform a larger study by developing testable
hypotheses. A larger study may then be able to consolidate findings and explore further
hypotheses that were unable to be explored given the current sample size; such as
possible differences in risk stratified by maternal diagnosis and to correct for multiple
comparisons clarifying the differences between false positive and false negative findings.
Results will then be able to help disentangle a long lasting question in the study of ED, i.e.
what neurocognitive and neural alterations found in acute patients are due to
undernutrition and should be considered ‘state’ and what can be considered ‘trait’ and may
therefore influence risk for the development of the disorder. This will help further our
understanding of the neurobiological underpinnings of these disorders.
In the long term, understanding of altered neural pathways can help develop new
treatments for resistant ED patients. With the development of neuromodulation
technologies, we may be able to directly target specific brain areas that have been
identified as central to ED psychopathology. An understanding of altered neurocognitive
functions will help develop treatments aimed at improving cognitive impairments which
have may in turn allow patients to engage better in ED focused treatments. Currently
Cognitive Remediation Therapy has already shown to improve treatment engagement and
recovery and more targeted treatment may improve this further.
6
Table of contents
Abstract ............................................................................................................... 3
Acknowledgments .............................................................................................. 4
Impact Statement ................................................................................................ 5
Table of contents ................................................................................................ 6
List of figures .....................................................................................................10
List of tables ......................................................................................................12
List of abbreviations .........................................................................................13
Dissemination ....................................................................................................16
Chapter 1. Introduction to Eating Disorders ..................................................17 1.1. Chapter overview .............................................................................................. 17 1.2. Diagnoses .......................................................................................................... 17
1.2.1. Anorexia Nervosa ......................................................................................... 18 1.2.2. Bulimia Nervosa ........................................................................................... 19 1.2.4. Binge Eating Disorder ................................................................................... 20 1.2.5. Other Specified Feeding or Eating Disorders (OSFED) and Unspecified
Feeding or Eating Disorder (UFED) ........................................................................ 21 1.3. Eating Disorders Prevalence ............................................................................ 22
1.3.1. Anorexia Nervosa ......................................................................................... 22 1.3.2. Bulimia Nervosa ........................................................................................... 23 1.3.3. Binge Eating Disorder ................................................................................... 23
1.4. Eating Disorders Mortality ................................................................................ 24 1.5. Eating Disorders Aetiology .............................................................................. 25
1.5.1. Genetic Risk ................................................................................................. 26 1.5.2. Socio-cultural Factors ................................................................................... 27
1.6. Neurocognitive Findings .................................................................................. 27 1.6.1. Intelligence ................................................................................................... 29 1.6.2. Set-shifting (Cognitive flexibility) ................................................................... 29 1.6.3. Central Coherence ....................................................................................... 32 1.6.4. Social and emotional processing .................................................................. 34
1.7. Interim conclusion ............................................................................................ 37
Chapter 2. Neuroimaging in Eating Disorders ................................................38 2.1. Chapter overview .......................................................................................... 38 2.2. Basics of MRI ................................................................................................. 38
2.2.1. Origin of MR signal ................................................................................... 39 2.2.2. Relaxation time and contrast .................................................................... 40 2.2.3. Spin echo and Gradient echo ................................................................... 43 2.2.4. Generating MR scans and quality ................................................................. 44
2.3. Diffusion MRI ................................................................................................. 45 2.3.1. Basics of Diffusion MRI ................................................................................. 45 2.3.2. Diffusion-Weighted Imaging (DWI) ................................................................ 46 2.3.3. Diffusion Tensor Imaging (DTI) ..................................................................... 47 2.3.4. Analysis methods of diffusion data ................................................................ 49 2.3.5. Limitation of the diffusion tensor model ......................................................... 51

7
2.4. Neuroimaging findings in Eating Disorders ................................................ 53 2.4.1. Structural/volumetric brain differences in patients with ED ............................ 54 2.4.2. fMRI findings in patients with ED .................................................................. 59 2.4.3. Diffusion imaging findings in patients with ED ............................................... 62
2.6. Interim conclusion ........................................................................................ 63
Chapter 3. Ph.D. Aims and methodological considerations (familial high-
risk study)………... .............................................................................................64 3.1. Chapter overview .............................................................................................. 64 3.2. The potential of high risk research .................................................................. 64
3.2.1. Heritability and genetic liability ...................................................................... 64 3.22. Endophenotypes and the Research Domain Criteria (RDoC) initiative ........... 65
3.2. Comorbidities with EDs and the use of transdiagnostic research ................ 68 3.2.1. Anxiety based disorders ............................................................................... 69 3.2.2. ASD .............................................................................................................. 71
3.3. Familial high-risk design in children at risk for Eating Disorders ................. 72 3.2.1. Feeding ........................................................................................................ 73 3.2.2. Psychological/emotional development and psychopathology ........................ 74 3.2.3. Cognitive development ................................................................................. 75
3.3. General aims .................................................................................................. 84
Chapter 4. Methodology ....................................................................................87 4.1. Sample 1: The Danish National Birth Cohort (DNBC) ................................. 87 4.2. Sample 2: Brain in high-Risk for Eating Disorders Study (BREDS) ........... 87
4.2.1. Study overview ......................................................................................... 87 4.2.2. Aims and objectives ................................................................................. 88 4.2.3. Participants .............................................................................................. 88 4.2.4. Demographics .......................................................................................... 90 4.2.3. Screening and psychopathology ............................................................... 93 4.2.4. Cognitive testing ....................................................................................... 96 4.2.5. MRI scanning ......................................................................................... 103 4.2.6. Inclusion/exclusion criteria ...................................................................... 107 4.2.7. Procedure .............................................................................................. 107
Chapter 5. Cognitive development and psychopathology in children at
high-risk for eating disorders: findings from the Danish National Birth
Cohort 109 5.1 Introduction ...................................................................................................... 109 5.2. Methods ....................................................................................................... 111
5.2.1. Study overview ....................................................................................... 111 5.2.2. Participants and procedure ..................................................................... 111 5.2.3. Measures ............................................................................................... 113 5.2.4. Scoring and data preparation ...................................................................... 117 5.2.5. Ethical approval ...................................................................................... 119
5.3. Results ......................................................................................................... 119 5.3.1. Socio-demographic data......................................................................... 119 5.3.2. Maternal ED and development, temperament, and mother child relation at
18 months of age .................................................................................................. 122 5.3.3. Maternal ED and child SDQ at 7 years ................................................... 122 5.3.4. Post-hoc mediation analyses .................................................................. 123
5.4. Discussion ................................................................................................... 127 5.4.1. Strengths and limitations ........................................................................ 131

8
5.5. Conclusion ................................................................................................... 132
Chapter 6. White matter alterations in anorexia nervosa: evidence from a
voxel-based meta-analysis .............................................................................133 6.1. Introduction ..................................................................................................... 133 6.2. Methods and materials ................................................................................... 135
6.2.1. Data source ................................................................................................ 135 6.2.2. Study selection ........................................................................................... 135 6.2.3. Quality assessment and data extraction ..................................................... 135 6.2.4. Voxel-based meta-analysis ......................................................................... 136 6.2.5. Meta-regression .......................................................................................... 137
6.3. Results ............................................................................................................. 138 6.3.1. Meta-analysis: Included studies and sample characteristics ....................... 139 6.3.2. Regional differences in FA .......................................................................... 143 6.3.3. Sensitivity analysis ..................................................................................... 146 6.3.4. Meta-regression .......................................................................................... 148 6.3.5. Findings in the acute stage and in adults .................................................... 148
6.4. Discussion ....................................................................................................... 154
Chapter 7. Neurocognitive differences in children at high-familial risk for
ED: findings from BREDS ...............................................................................165 7.1. Introduction ..................................................................................................... 165 7.2. Methods ........................................................................................................... 168
7.2.1. Demographics ............................................................................................ 168 7.2.2. Exposure .................................................................................................... 168 7.2.3. Neurocognitive measures ........................................................................... 169 7.2.4. Missing data ............................................................................................... 171 7.2.5. Statistical analyses ..................................................................................... 171
7.3. Results ............................................................................................................. 172 7.3.1. Demographics ............................................................................................ 172 7.3.1. General Intelligence .................................................................................... 174 7.3.2. Neurocognitive ............................................................................................ 175 7.3.2.2. Social cognition ....................................................................................... 179
7.4. Discussion ....................................................................................................... 184 Limitations .............................................................................................................. 190
Chapter 8. Subcortical and cerebellar volumetric differences in children at
familial high-risk for ED: findings from BREDS ............................................192 8.1. Introduction ..................................................................................................... 192 8.2. Methods ........................................................................................................... 194
8.2.1. Participants ................................................................................................. 194 8.2.3. MRI Acquisition ........................................................................................... 195 8.2.4. Pre-processing ........................................................................................... 195 8.2.5. Statistical analyses ..................................................................................... 199
8.3. Results ............................................................................................................. 200 8.3.1. Sample characteristics ................................................................................ 200 8.3.2. Image analyses .......................................................................................... 200
8.4. Discussion ....................................................................................................... 210
Chapter 9. Microstructural and connectivity differences in children at
familial high-risk for ED: whole brain WM differences and amygdala
connectivity findings from BREDS ................................................................219
9
9.1. Introduction ..................................................................................................... 219 9.2. Methods ........................................................................................................... 220
9.2.1. Participants ................................................................................................. 220 8.2.2. Clinical measures ....................................................................................... 221 9.2.3. MRI Data Acquisition and preprocessing .................................................... 222 9.2.4. Tract Based Spatial Statistics (TBSS) Whole-Brain Analysis ...................... 222 9.2.5. Region of interest volume estimation and parcellation ................................ 224 8.2.7. Estimation of DTI parameters in WM tracts ................................................. 225 8.2.7. Association between amygdala structural connectivity measures and
neurocognitive scores ........................................................................................... 226 8.3. Results ............................................................................................................. 226
8.3.1. Whole-Brain Tract Brain Analyses .............................................................. 226 9.3.2. Amygdala parcellation results ..................................................................... 227 9.3.3. Amygdala WM tract microstructure group comparison ................................ 228 9.3.4. Association between amygdala structural connectivity measures and
neurocognitive scores ........................................................................................... 228 9.4. Discussion ....................................................................................................... 228
Chapter 10 Considerations and limitations, final discussion, and future
work ..................................................................................................................237 10.1. Considerations .............................................................................................. 237
10.2.1. Recruitment .............................................................................................. 237 10.2.2. Controlling for multiple comparisons ......................................................... 239
10.2. Final discussion ............................................................................................ 240
References .......................................................................................................252
Appendix A: Publications attributed to this Thesis ......................................285
Appendix B: Presentations attributed to this Thesis ...................................287
Appendix C: Ethics approvals ........................................................................290
Appendix C: Webpage developed ..................................................................292
Appendix D: Visual protocol ...........................................................................294
Appendix E: Puberty questionnaire ...............................................................295
Appendix F: MRI safety screening .................................................................298

10
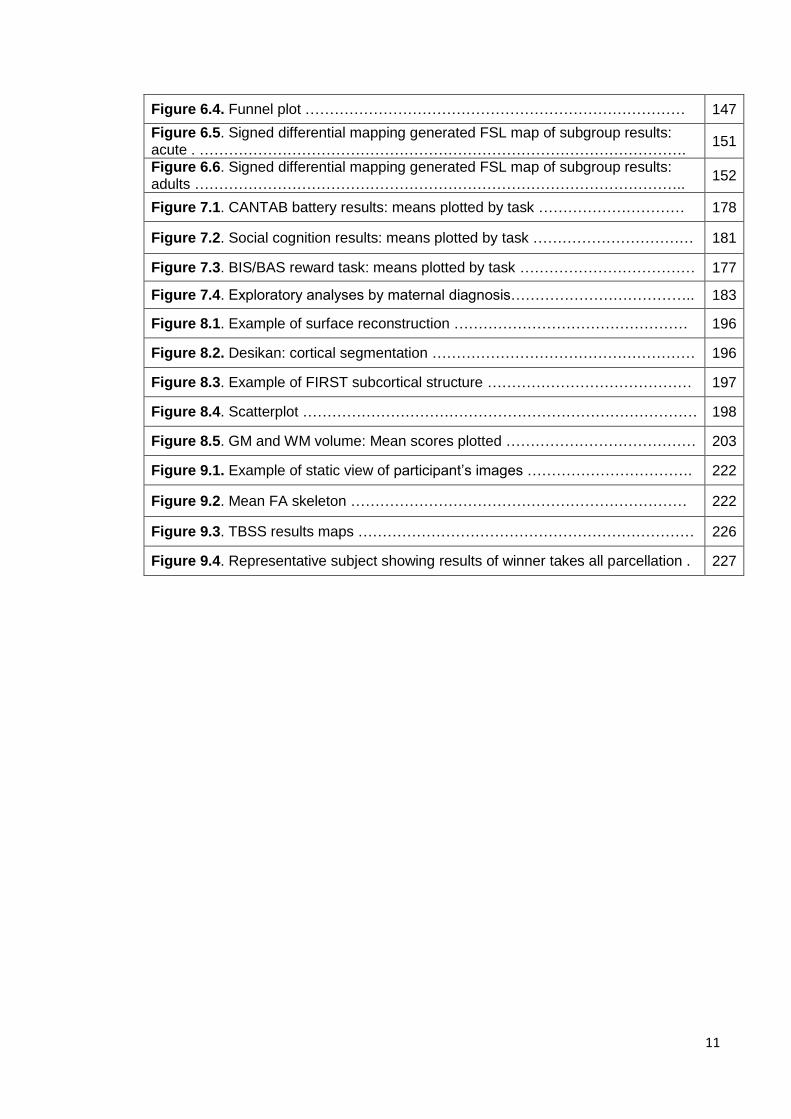
List of figures
Figure 1.1. Deaths due to eating disorders ……………………………………………… 24
Figure 1.2. Visual depiction of biopsychosocial model for ED ………………………… 25
Figure 2.1 MRI components diagram ……..……………………………………………… 39
Figure 2.2. Proton precession ……………………………………………………………. 40
Figure 2.3. Differences in TR and TE …………………………………………………… 41
Figure 2.4. Relaxation times of various tissues at 3T …………………………………. 42
Figure 2.5. T1 and T2 weighted images ………………………………………………… 43
Figure 2.6. Spin echo versus gradient …………………………………………………… 43
Figure 2.7. Diffusion characteristics of different tissues ………………………………. 46
Figure 2.8. Anisotropic vs Isotropic diffusion …………………………………………… 47
Figure 2.9. Fractional Anisotropy map…………………………………………………… 48
Figure 2.10. Mean Diffusivity map ……………………………………………………….. 49
Figure 2.11. Diffusion Tensor Colour map ………………………………………………. 50
Figure 2.11. Example of modelling of the diffusion signal ……………………………… 52
Figure 2.12. Example of DTI and spherical deconvolution tractography …………….. 52
Figure 2.13. Visual guide of brain regions implicated in ED …………………………… 60
Figure 3.1. Visual graph of endophenotypes ……………………………………………. 66
Figure 3.2. Potential endophenotype overlap between DSM-IV diagnoses …………. 67
Figure 4.1. Recruitment: cases …………………………………………………………… 87
Figure 4.2. Recruitment: controls ………………………………………………………… 88
Figure 4.4. Reading the Mind in the Eyes web caption ………………………………… 101
Figure 4.5. Example of morphed photographic image …………………………………. 102
Figure 4.6. Example of surface reconstruction …………………………………………. 105
Figure 4.7. Subcortical parcellation ………………………………………………………. 106
Figure 5.1. Flowchart of participation in the DNBC cohort ……………………………. 113
Figure 5.2. Flowchart of DNBC inclusion numbers……………………………………… 118
Figure 6.1. Flow diagram for the identification and exclusion of studies …………… 139
Figure 6.2. Signed differential mapping-generated FSL map of areas of altered FA 145
Figure 6.3. Tractography images of main replicable cluster in the corpus callosum 146
11
Figure 6.4. Funnel plot …………………………………………………………………… 147
Figure 6.5. Signed differential mapping generated FSL map of subgroup results: acute . ……………………………………………………………………………………….
151
Figure 6.6. Signed differential mapping generated FSL map of subgroup results: adults ………………………………………………………………………………………..
152
Figure 7.1. CANTAB battery results: means plotted by task ………………………… 178
Figure 7.2. Social cognition results: means plotted by task …………………………… 181
Figure 7.3. BIS/BAS reward task: means plotted by task ……………………………… 177
Figure 7.4. Exploratory analyses by maternal diagnosis……………………………….. 183
Figure 8.1. Example of surface reconstruction ………………………………………… 196
Figure 8.2. Desikan: cortical segmentation ……………………………………………… 196
Figure 8.3. Example of FIRST subcortical structure …………………………………… 197
Figure 8.4. Scatterplot ……………………………………………………………………… 198
Figure 8.5. GM and WM volume: Mean scores plotted ………………………………… 203
Figure 9.1. Example of static view of participant’s images ……………………………. 222
Figure 9.2. Mean FA skeleton …………………………………………………………… 222
Figure 9.3. TBSS results maps …………………………………………………………… 226
Figure 9.4. Representative subject showing results of winner takes all parcellation . 227
12
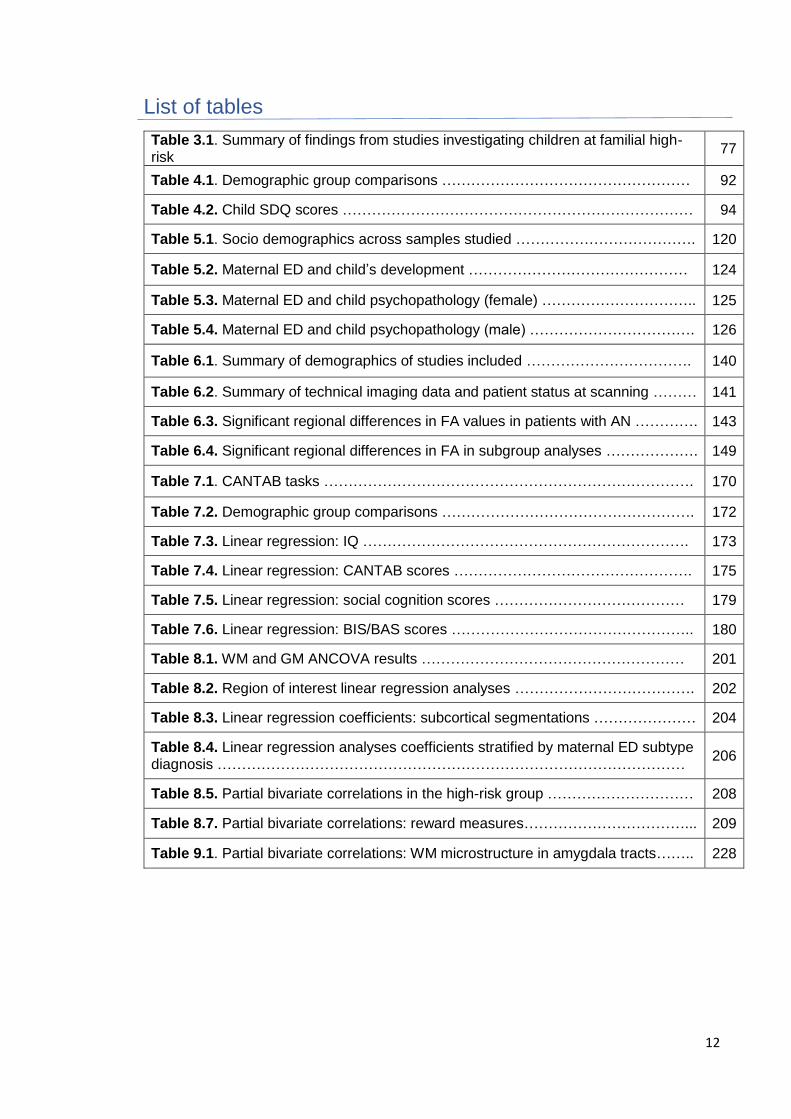
List of tables
Table 3.1. Summary of findings from studies investigating children at familial high-risk
77
Table 4.1. Demographic group comparisons …………………………………………… 92
Table 4.2. Child SDQ scores ……………………………………………………………… 94
Table 5.1. Socio demographics across samples studied ………………………………. 120
Table 5.2. Maternal ED and child’s development ……………………………………… 124
Table 5.3. Maternal ED and child psychopathology (female) ………………………….. 125
Table 5.4. Maternal ED and child psychopathology (male) ……………………………. 126
Table 6.1. Summary of demographics of studies included ……………………………. 140
Table 6.2. Summary of technical imaging data and patient status at scanning ……… 141
Table 6.3. Significant regional differences in FA values in patients with AN …………. 143
Table 6.4. Significant regional differences in FA in subgroup analyses ………………. 149
Table 7.1. CANTAB tasks …………………………………………………………………. 170
Table 7.2. Demographic group comparisons ……………………………………………. 172
Table 7.3. Linear regression: IQ …………………………………………………………. 173
Table 7.4. Linear regression: CANTAB scores …………………………………………. 175
Table 7.5. Linear regression: social cognition scores ………………………………… 179
Table 7.6. Linear regression: BIS/BAS scores ………………………………………….. 180
Table 8.1. WM and GM ANCOVA results ……………………………………………… 201
Table 8.2. Region of interest linear regression analyses ………………………………. 202
Table 8.3. Linear regression coefficients: subcortical segmentations ………………… 204
Table 8.4. Linear regression analyses coefficients stratified by maternal ED subtype diagnosis ……………………………………………………………………………………
206
Table 8.5. Partial bivariate correlations in the high-risk group ………………………… 208
Table 8.7. Partial bivariate correlations: reward measures……………………………... 209
Table 9.1. Partial bivariate correlations: WM microstructure in amygdala tracts…….. 228

13
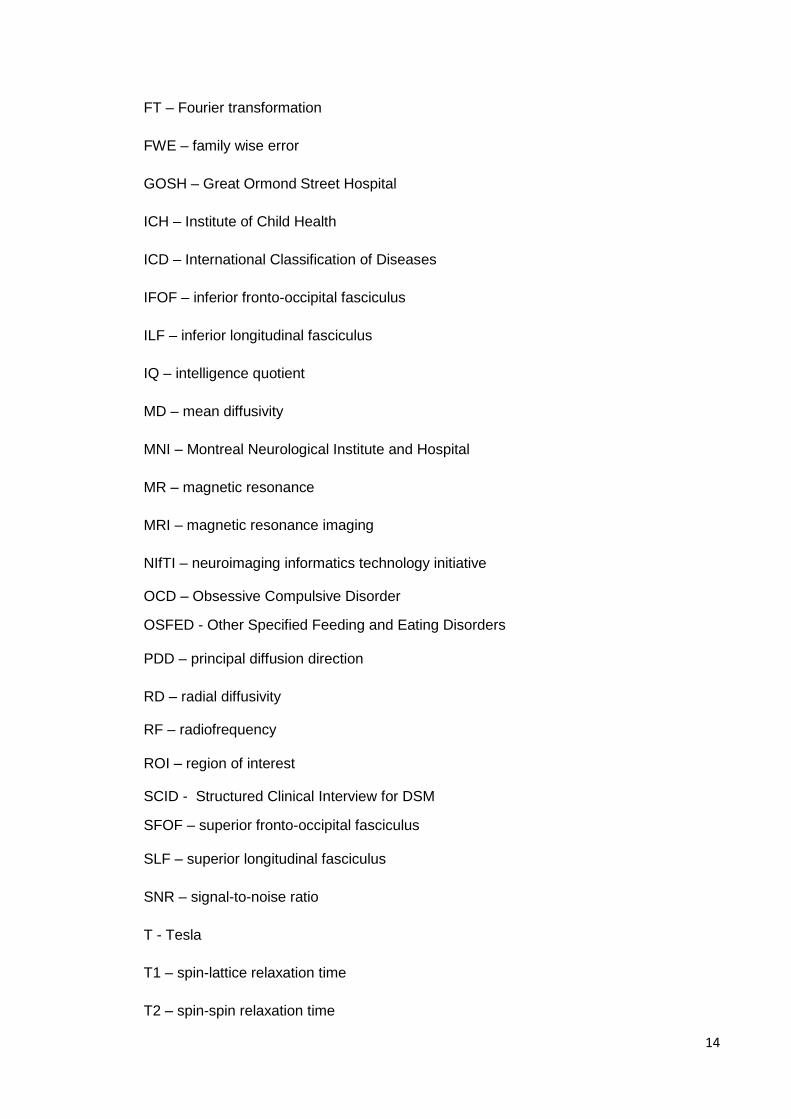
List of abbreviations
AD – axial diffusivity
ADC – apparent diffusion coefficient
ADHD – attention deficit hyperactivity disorder
AN – Anorexia nervosa
APA – American Psychiatric Association
ASD – autism spectrum disorder
BEN – Binge eating disorder
BAS – Behavioural activation system
BIS – Behavioural Inhibition System
BN – Bulimia Nervosa
CANTAB - Cambridge Neuropsychological Test Automated Battery
CC – corpus callosum
CSD – constrained spherical deconvolution
CSF – cerebrospinal fluid
ED – Eating Disorders
EDNOS – Eating Disorder Not Otherwise Specified
DICOM – digital imaging and communications in medicine
DSM – Diagnostic and Statistical Manual of Mental Disorders
DTI – diffusion tensor imaging
EPI – echo planar imaging
FA – fractional anisotropy
FDR – false discovery rate
fMRI – functional magnetic resonance imaging
FOV – field of view
FSL – FMRIB software library
14
FT – Fourier transformation
FWE – family wise error
GOSH – Great Ormond Street Hospital
ICH – Institute of Child Health
ICD – International Classification of Diseases
IFOF – inferior fronto-occipital fasciculus
ILF – inferior longitudinal fasciculus
IQ – intelligence quotient
MD – mean diffusivity
MNI – Montreal Neurological Institute and Hospital
MR – magnetic resonance
MRI – magnetic resonance imaging
NIfTI – neuroimaging informatics technology initiative
OCD – Obsessive Compulsive Disorder
OSFED - Other Specified Feeding and Eating Disorders
PDD – principal diffusion direction
RD – radial diffusivity
RF – radiofrequency
ROI – region of interest
SCID - Structured Clinical Interview for DSM
SFOF – superior fronto-occipital fasciculus
SLF – superior longitudinal fasciculus
SNR – signal-to-noise ratio
T - Tesla
T1 – spin-lattice relaxation time
T2 – spin-spin relaxation time

15
TBSS – tract-based spatial statistics
TE – echo time
TFCE – threshold-free cluster enhancement
TR – repetition time
UCL – University College London
UF – uncinate fasciculus
VBM – voxel-based morphometry
WASI – Wechsler abbreviated scale of intelligence
16
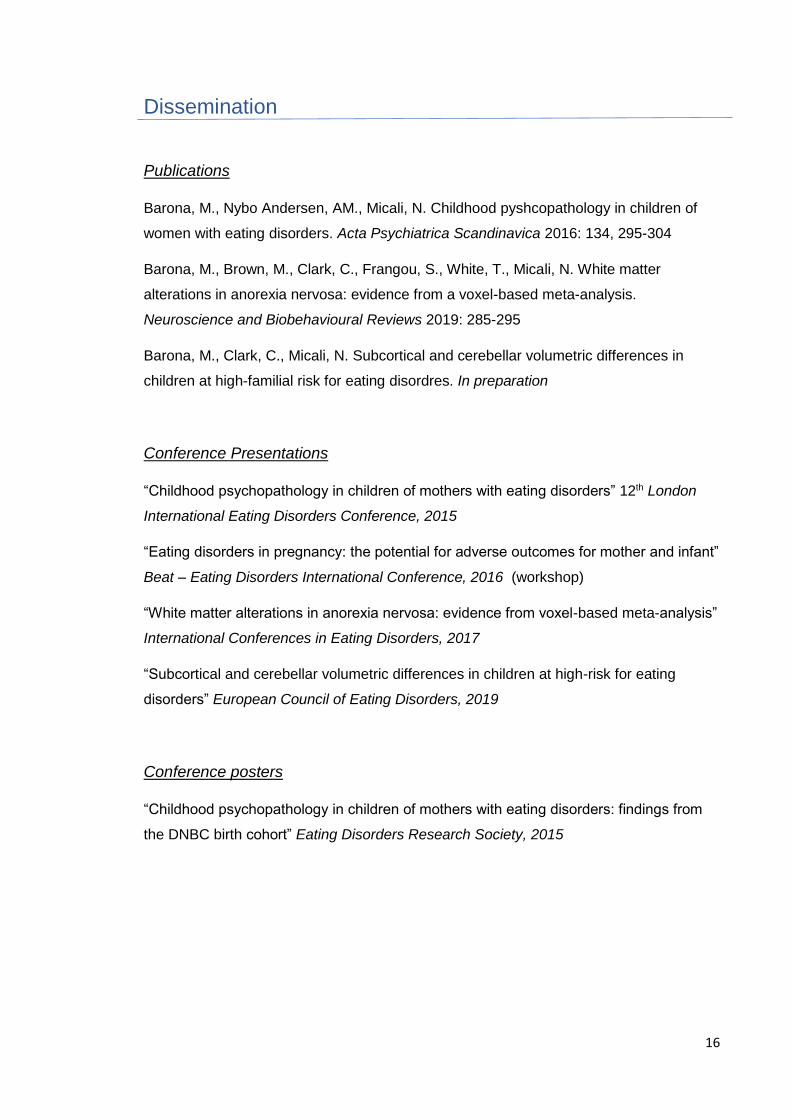
Dissemination
Publications
Barona, M., Nybo Andersen, AM., Micali, N. Childhood pyshcopathology in children of
women with eating disorders. Acta Psychiatrica Scandinavica 2016: 134, 295-304
Barona, M., Brown, M., Clark, C., Frangou, S., White, T., Micali, N. White matter
alterations in anorexia nervosa: evidence from a voxel-based meta-analysis.
Neuroscience and Biobehavioural Reviews 2019: 285-295
Barona, M., Clark, C., Micali, N. Subcortical and cerebellar volumetric differences in
children at high-familial risk for eating disordres. In preparation
Conference Presentations
“Childhood psychopathology in children of mothers with eating disorders” 12th London
International Eating Disorders Conference, 2015
“Eating disorders in pregnancy: the potential for adverse outcomes for mother and infant”
Beat – Eating Disorders International Conference, 2016 (workshop)
“White matter alterations in anorexia nervosa: evidence from voxel-based meta-analysis”
International Conferences in Eating Disorders, 2017
“Subcortical and cerebellar volumetric differences in children at high-risk for eating
disorders” European Council of Eating Disorders, 2019
Conference posters
“Childhood psychopathology in children of mothers with eating disorders: findings from
the DNBC birth cohort” Eating Disorders Research Society, 2015
17
Chapter 1. Introduction to Eating Disorders
1.1. Chapter overview
The aim of this chapter is to provide an up to date account of our current understanding of
eating disorders, to explore the diagnosis, prevalence, mortality rates and aetiology. The
chapter will also provide an overview of current neurocognitive findings in eating disorders,
which will provide a background for result chapters.
1.2. Diagnoses
Eating disorders are severe psychiatric illnesses characterised by abnormal attitudes
towards food and weight that interfere with many areas of a person’s life and are
associated with numerous negative outcomes, including medical and psychological
complications.
In 1952 the American Psychological Association (APA) developed the first edition of the
Diagnostic and Statistical Manual of Mental Disorders (DSM), which included diagnostic
categories and had a clinical focus. Anorexia Nervosa was first introduced in this first
version of the DSM, however, it was then introduced as a psycho physiological reaction (a
neurotic illness) and it wasn’t until the second edition in 1968 when it was placed under
the section of special symptoms – feeding disturbances. It was not until the following
version of DSM in 1980 that Bulimia was included as well although it wasn’t until 1987 that
the term Bulimia Nervosa was coined.
Currently, the Diagnostic and Statistical Manual of Mental Disorders version 5 (DSM-5)
(APA, 2013) recognizes three primary diagnoses: Anorexia Nervosa (AN), Bulimia
Nervosa (BN), Binge Eating Disorders (BED). ED presentations that do not fit into the
above diagnoses are classified as OSFED (Other Specified Feeding or Eating Disorder).
It is important to note that one of the biggest changes in the diagnostic categories from
DSM-IV to DSM-5 is the change of chapter name, from “Eating Disorders” to “Feeding and
Eating Disorders”. This has led to an increase in the number of diagnoses under the
18
category, from three in DSM-IV to eight in DSM-5. These include: Pica, Rumination
Disorder, Avoidant/Restrictive Food Intake Disorder, AN, BN and BED. As well as the
change from Eating Disorder Not Otherwise Specified (EDNOS) category, to Other
Specified Feeding or Eating Disorders (OSFED) and the inclusion of Unspecified Feeding
or Eating Disorder (UFED). For the purpose of this chapter, we will only discuss AN, BN,
BED and OSFED as they are the disorders of interest for this thesis.
Although in previous years, review articles have showed that groups at higher risk for ED
are those who are female, young and Western, ED also occur in older women, men and
in non-Western countries (Hoek, 2014).
1.2.1. Anorexia Nervosa
According to DSM-5, Anorexia Nervosa (AN) is characterized by a severe restriction of
calorie intake leading to a significant low body weight (in the context of what is minimally
expected for age, sex, developmental trajectory and physical health); either an intense
fear of gaining weight even when underweight, or persistent behaviour that interferes with
weight gain (even when significantly low weight); and a disturbance in the way they
perceive their body weight or shape, undue influence of body shape and weight on self-
evaluation or a persistent lack of recognition of the seriousness of the current low body
weight (APA, 2013). One of the changes incurred in DSM-5, is the change from “body
weight less than 85% of that expected” to “significantly low body weight” which allows
clinicians to introduce clinical judgment as opposed to adhering to a rigid percentage of
ideal or expected body weight as a necessary criteria for diagnosis. Both main
classification manuals for mental health disorders (DSM (APA, 2013) and the International
Classification of mental Disorders- ICD (Organization, 1992)) have a weight criterion for
the diagnosis of AN, with ICD-10 stating 15% below expected weight for age and height.
Accompanying behaviours can include excessive exercise, purging behaviours (e.g.
vomiting, excessive use of laxatives, diuretics or other weight suppressants, etc.) and
episodes of binge eating (episodes of over eating in a discrete period of time accompanied
by a sense of lack of control). Depending on the presence of these accompanying
behaviours, individuals with AN can fall into two sub-types: binge-purge subtype (for those
that engage in binge eating and/or purging behaviours) and restricting subtype (for those
19
who reach and maintain low weight through food restriction and behaviours such as
excessive exercising).
The onset for AN is typically in mid-adolescence (Attia, 2010), with epidemiologic studies
suggesting the highest incidence for AN to be in females aged between 15 to 19 years old
(Hoek, van Hoeken, & Katzman, 2003). However, in recent years, there have been more
discussions regarding increasing earlier onset for eating disorders (Madden, Morris,
Zurynski, Kohn, & Elliot, 2009). Although a common discussion amongst clinicians, data
is lacking. A study by Hindler et al. (Hindler, Crisp, McGuigan, & Joughin, 1994) in 1994
examined the pattern of presentation of AN patients who had been referred in a period of
30 years (from 1960 to 1990) and found that during this period there was no change in
age of onset. However, a more recent study by Favaro et al. (Favaro, Caregaro, Tenconi,
Bosello, & Santonastaso, 2009) conducted in a large sample of patients with AN (N =
1,666) who had been referred to a clinical department between 1985 and 2008, found that
the age of onset was indeed decreased in younger generations. Although age of onset
might be decreasing, the peak for onset continues to be in late adolescence for AN. It has
been proposed that an earlier onset (below the age of 15 years old) is associated with
worse outcomes however, early onset AN shows some differences in presentation to later
onset AN. For example the ratio of girls to boys for this group is 4:1, in contrast to the 10:1
ratio for later onset (Lask, Waugh, & Gordon, 1997).
1.2.2. Bulimia Nervosa
Bulimia Nervosa (BN) is characterized by recurrent episodes of binge eating, recurrent
compensatory behaviours in order to prevent gain weight and self-evaluation influenced
by body shape and weight. Due to the combination of both binge eating and behaviours to
prevent gain weight, patients with BN are general of normal weight.
For a diagnosis of BN according to the DSM-5, the following criteria must be met:
Recurrent episodes of binge eating, where an episode of binge eating is characterised
by both of the following:
a. Eating, in a discrete period of time (for example, within a two hour period), an
amount of food that is larger than what most people would eat during a similar
period of time and under similar circumstances.
20
b. A sense of lack of control over eating during the binge eating episode (e.g. a
feeling that one cannot stop eating or control what or how much one is eating).
Recurrent inappropriate compensatory behaviour in order to prevent weight gain: such
as self-induced vomiting, use of laxatives, enemas, diuretics, excessive exercising,
etc.
The binge eating and inappropriate compensatory behaviours both occur, on average,
at least once a week for a period of three months.
Self-evaluation is unduly influenced by body shape and weight.
The disturbance does not occur exclusively during episodes of AN.
Onset of BN is usually found to be later than that for AN, with some studies suggesting an
onset in the early twenties (Hoek et al., 2003), however, a more recent study by Favaro et
al. (Favaro et al., 2009) found that by 20 years of age 65% of patients with BN were already
affected. Similarly to AN, Favaro and colleagues (Favaro et al., 2009) found that the age
of onset for BN is decreasing.
1.2.4. Binge Eating Disorder
The new diagnostic category of Binge Eating Disorder (BED) was first proposed by Spitzer
et al. in 1993(Robert L. Spitzer et al., 1991; R. L. Spitzer et al., 1993) and was first
introduced in DSM-IV (as a Not Otherwise Specified category) for further study. During the
DSM-IV task force, clinicians and researchers were in agreement regarding the fact that
there was a need for a diagnosis for patients who engaged in binge eating but did not
engage in the inappropriate compensatory behaviours that are characteristic for BN. In
DSM-5, BED was included as a distinct eating disorder outside of the EDNOS category.
According to DSM-5 (APA, 2013), BED is characterized by recurrent episodes of binge
eating, associated with at least three of the following symptoms (eating more rapidly than
normal, eating until uncomfortably full, eating when not feeling hungry, eating alone
because of feelings of embarrassment and feeling disgusted/guilty with one self) and
accompanied by a marked distress. Episodes of binge eating must happen at least once
a week for three months. Importantly, binge eating cannot be associated with the recurrent
use of inappropriate compensatory behaviours as in BN (such as self-induced vomiting)
and cannot occur exclusively during the course of either BN or AN.
21
BED has been found to be associated with obesity, however, not all obese patients have
BED and not all BED patients are obese. As with AN and BN, BED is more common among
females than males(Robert L. Spitzer et al., 1991).
1.2.5. Other Specified Feeding or Eating Disorders (OSFED) and Unspecified Feeding or
Eating Disorder (UFED)
According to DSM-5 in order for an individual to be diagnosed with OSFED, they must
present with feeding or eating behaviours that cause clinically significant distress and
impairment in areas of functioning, but not meet full criteria for any of the other feeding or
eating disorders.
The difference between OSFED and UFED is that in OSFED a diagnosis might be given
with a specification of why it does not meet full criteria, whilst in UFED there is no need for
specification.
The following are examples of OSFED:
1. Since the revision of the DSM-IV-TR (Association, 2000) individuals can also be
classified as “Atypical AN” if they meet all other criteria but maintain a normal weight. Over
40 years ago a study was conducted showing that there is no specific amount of weight
loss associated with any other AN symptoms (HALMI, 1974). This change was included in
the fifth revision of the manual in order to help reduce the number of patients who were
previously diagnosed as Eating Disorder Not Otherwise Specified (EDNOS) (Fairburn &
Bohn, 2005) but who only did not meet the weight criteria for AN.
2. If all of the criteria for BN are met, except that the binge eating and inappropriate
compensatory behaviours occur at a lower frequency (less than once a week) and/or for
less than three months, then the diagnosis is of “OSFED-BN”.
3. Individuals with BED who meet all criteria except for the frequency and/or duration, are
classified as “OSFED BED”.
4. Purging Disorder: recurrent purging behaviour to influence weight or shape in the
absence of binge eating.
5. Night Eating Syndrome: recurrent episodes of night eating.
22
1.3. Eating Disorders Prevalence
Prevalence is defined as the proportion of individuals in a population who have a disease
or characteristic. It is a statistical concept that refers to the number of cases of a disease
that are present in a population at a given time. On the other hand, incidence refers to the
number of new cases that develop in a given period of time in a given population.
Making an estimation of lifetime ED prevalence is difficult, not only due to the rarity of the
disorder but also to the secrecy associated with it. Patients with ED frequently deny any
problems and often only seek treatment due to concerns of those close to them or when
their lives might be in danger because of the disorder.
Epidemiological studies use medical and psychiatric records to estimate prevalence,
however, these figures are likely to be an underestimate, as not all individuals who suffer
from an eating disorder will be diagnosed or treated. In fact, it has been estimated that
only one third to one half of the cases of AN, BN and BED in the population seek treatment
(James I. Hudson, Hiripi, Pope, & Kessler, 2007; A. Keski-Rahkonen et al., 2007). Most
prevalence studies to date have been done using DMS-IV criteria; however, with the
changes to the diagnosis in DSM-5, prevalence is likely to be higher. As one of the reasons
for the revision of diagnostic criteria in DSM-5 was to reduce the number of patients who
received a diagnosis of EDNOS (up to 60% in specialized ED units) (Fairburn & Bohn,
2005), the introduction of the new criteria should show changes in the prevalence to AN
and BN categories and reduce the number included in EDNOS (now OSFED). A recent
study by Smink et al., (Smink, van Hoeken, Oldehinkel, & Hoek, 2014) found the lifetime
diagnosis of ED to increase from DSM-IV (4.4%) to DSM-5 (5.7%), in adolescence, and a
study on adult women showed an increase of 50% for AN diagnosis and 40% of BN ones
(N. Micali et al., 2017).
1.3.1. Anorexia Nervosa
Most prevalence studies up to 2006 provided a prevalence that ranged between 0% and
0.9%, with an average of 0.29% among young females (Hoek, 1993; Hoek & van Hoeken,
23
2003; Rosenvinge & Pettersen, 2014). A review by Wade and colleagues in 2011 (Tracey
D Wade, Keski‐Rahkonen, & Hudson, 2011) gave a lifetime prevalence ranges for AN
across studies published in Australia/New Zeland, Europe and North America (using DSM-
IV criteria) of 0.9 to 2.2%. As part of the study they also incorporated the prevalence of
partial AN syndromes (all criteria met except for amenorrhoea, one of the changes in DSM-
5) which ranged between 3.0 and 4.6%. Three large population-based cohorts studies of
twins have investigated prevalence of AN, yielding prevalence’s for broad AN (all criteria
met, except for amenorrhea – DSM-IV diagnosis) of 1.2% - 2.2% and 2.4 – 4.3% (Bulik et
al., 2006; A. Keski-Rahkonen et al., 2007; T. D. Wade, Bergin, Tiggemann, Bulik, &
Fairburn, 2006). A study by Mustelin et al. in 2016 (Mustelin et al., 2016) examined the
impact of the diagnostic criteria changes to the prevalence of ED in a nationwide
longitudinal study of Finnish twins and found a 60% increase in the lifetime prevalence of
AN using the new diagnostic criteria.
1.3.2. Bulimia Nervosa
Prevalence figures for BN range in from 0.9% to 1.5% (Hoek, 1993; Hoek & van Hoeken,
2003; Rosenvinge & Pettersen, 2014). A review by Wade and colleagues in 2011 (Tracey
D Wade et al., 2011) gave a lifetime prevalence ranges for BN across studies published
in Australia/New Zeland, Europe and North America (using DSM-IV criteria) of 1.5 to 4.6%.
As part of the study they also incorporated the prevalence of partial BN syndromes, which
ranged between 4.0 and 6.7%. Keski-Rahkonen and colleagues found a lifetime
prevalence of 1.7% for BN in a large Finnish twin cohort (A. Keski-Rahkonen et al., 2009).
1.3.3. Binge Eating Disorder
Two large studies investigated BED prevalence using DSM-IV criteria (James I. Hudson
et al., 2007; R. C. Kessler et al., 2013). The first one, the 2001-2003 US National
Comorbidity Survey Replication Study(James I. Hudson et al., 2007) reported estimates
of lifetime BED of 2.6% and a 12-month prevalence estimate of 1.2% in a population of
9,282. The second large study, studied a population of 24,124 using a series of surveys
across 14 countries and reported a 12-month and lifetime BED prevalence estimate of
0.8% and 1.9% respectively (R. C. Kessler et al., 2013). A recent study (Smink et al., 2014)
investigating prevalence and severity of DSM-5 ED diagnosis in a community cohort of
adolescents reported a lifetime prevalence for BED of 2.3% for women, and 0.7% for men.
24
1.4. Eating Disorders Mortality
Eating disorders have been identified as an important cause of mortality in young
individuals. The most common reported causes of death in patients with ED are electrolyte
imbalance, sudden cardiac arrest, and suicide (Cartwright, 2004), however, since ED are
not usually mentioned in death certificates, it is possible that the frequency of ED
contributing to death is underestimated. In fact, we know that there is an increased risk of
suicide amongst patients with ED, however, this will not always be apparent in death
certificates. Another limitation is that a large majority of mortality research in ED has
focused on AN.
A meta-analysis of 36 studies in 2011 (Arcelus, Mitchell, Wales, & Nielsen, 2011) found
that the crude mortality rate for AN was of 5.1 deaths (95% CI: 4.0 – 6.1) per 1000 person-
years, of which 1.3 deaths were the results of suicide. Of the thirty six studies, only 12
described mortality rates of patients with BN. The mortality rate for BN was found to be
lower than for AN, with a crude mortality rate of 1.74 (95% CI: 1.1 – 2.4) per 100 person-
years. Only six studies investigate mortality rates in EDNOS patients and found a crude
mortality rate of 3.31 deaths (95% CI, 1.5 – 5.8) per 1000 person-years.
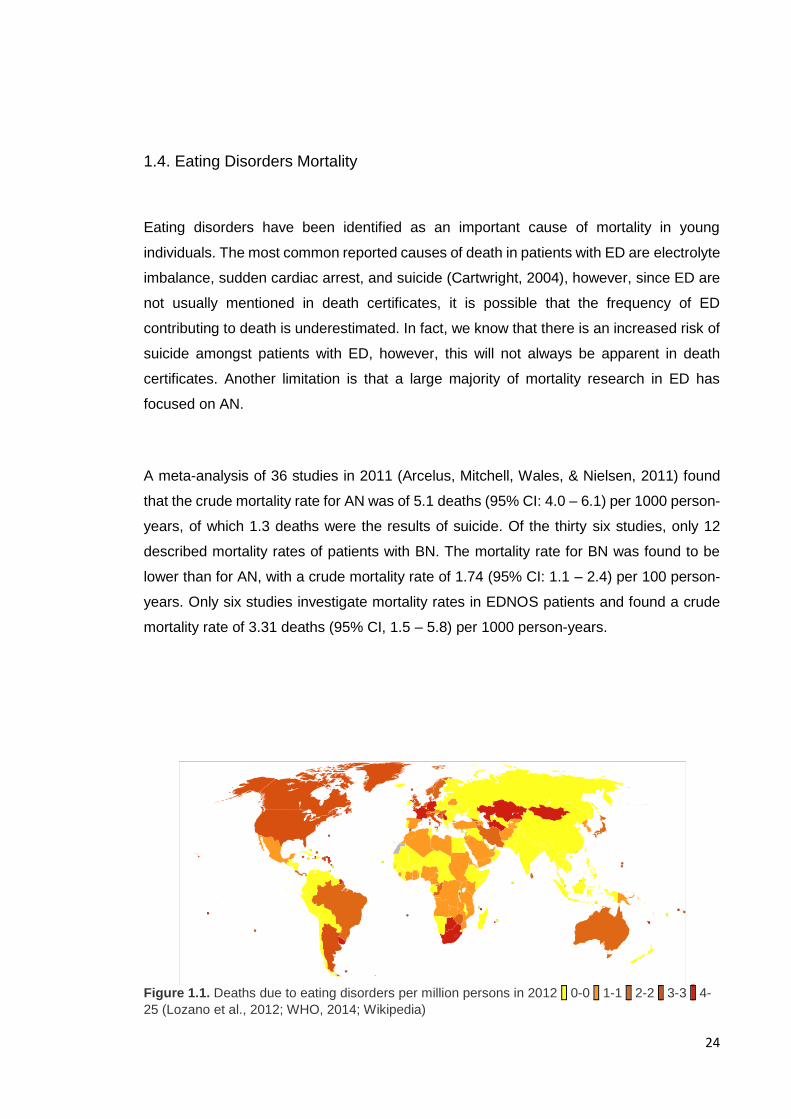
Figure 1.1. Deaths due to eating disorders per million persons in 2012 0-0 1-1 2-2 3-3 4-
25 (Lozano et al., 2012; WHO, 2014; Wikipedia)
25
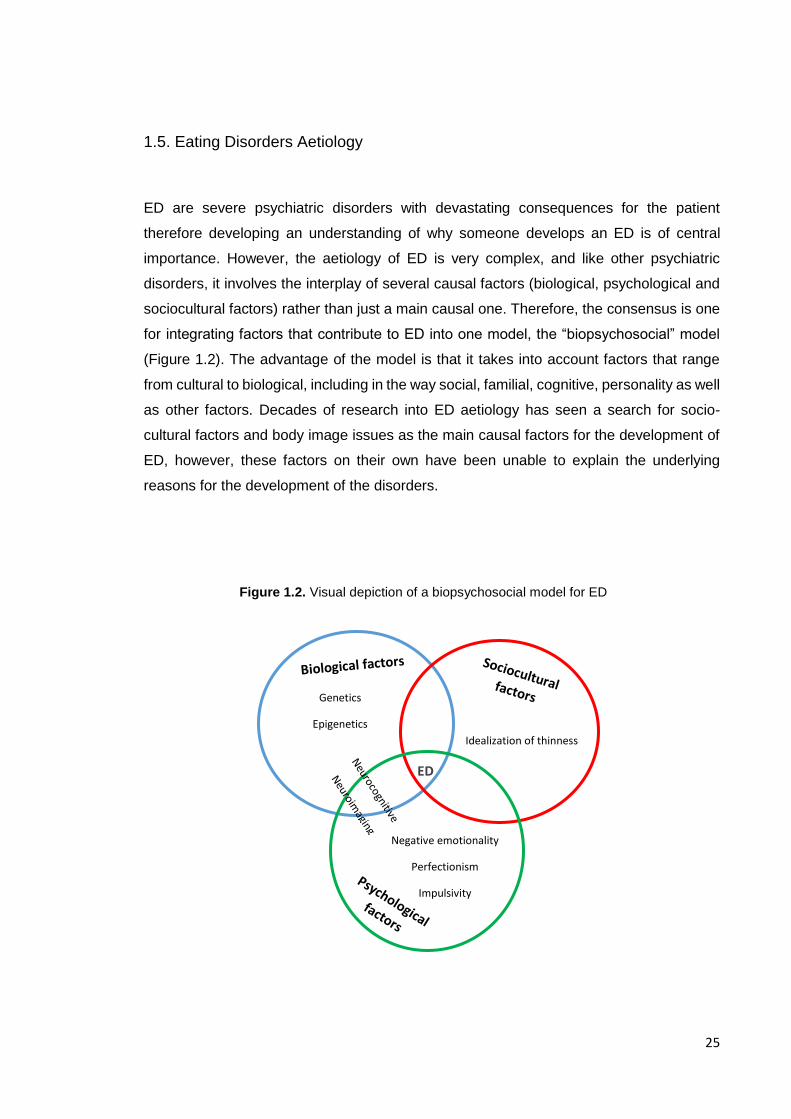
1.5. Eating Disorders Aetiology
ED are severe psychiatric disorders with devastating consequences for the patient
therefore developing an understanding of why someone develops an ED is of central
importance. However, the aetiology of ED is very complex, and like other psychiatric
disorders, it involves the interplay of several causal factors (biological, psychological and
sociocultural factors) rather than just a main causal one. Therefore, the consensus is one
for integrating factors that contribute to ED into one model, the “biopsychosocial” model
(Figure 1.2). The advantage of the model is that it takes into account factors that range
from cultural to biological, including in the way social, familial, cognitive, personality as well
as other factors. Decades of research into ED aetiology has seen a search for socio-
cultural factors and body image issues as the main causal factors for the development of
ED, however, these factors on their own have been unable to explain the underlying
reasons for the development of the disorders.
Figure 1.2. Visual depiction of a biopsychosocial model for ED
ED
Idealization of thinness
Genetics
Epigenetics
Negative emotionality
Perfectionism
Impulsivity
26
There has been an increase in the search for biological factors as well as any other
neurocognitive and neural factors that can explain the aetiology of ED. It is important to
note that just like biological and socio-cultural factors, these factors are not completely
distinct and most likely influence each other creating a model of risk. The following sections
will briefly summarise research on genetic and social cultural factors. A more in depth
overview of the research on neurocognitive and interpersonal risk factors for ED will be
given in this chapters as an understanding of these is central for hypotheses development
in this thesis.
1.5.1. Genetic Risk
Family studies have established a 10-fold greater lifetime risk of developing an ED in first
degree relatives of individuals with AN than those of unaffected individuals (L. R. Lilenfeld
et al., 1998; Strober, Freeman, Lampert, Diamond, & Kaye, 2000). However, family studies
are unable to discern between what percentage of increased risk is due to genetic factors
and what is due to environmental ones.
To determine the genetic risk for ED, twin studies have been performed, consistently
pointing towards an influence of genetics in the development of AN. Twin studies support
a genetic basis for AN with heritability estimates ranging between 48% to 74% (Yilmaz,
Hardaway, & Bulik, 2015). Studies have also revealed that genetic effects also contribute
to the risk for BN (Bulik, Sullivan, Wade, & Kendler, 2000).
Over the last 10 years, the development of Genome-wide associations studies (GWAS)
has allowed to further our understanding of genetic variants that are associated with ED
traits. GWAS studies compare cases with healthy controls and are able to investigate up
to 1,000,000 genetic markers in hundreds of thousands of participants. Although initial
GWAS studies were underpowered, a recent study by Duncan and colleagues combined
existing samples in order to conduct a more powerful GWAS of AN (Duncan et al., 2017).
Results were obtained from 10,641,224 single nucleotide polymorhpisms (SNPs), from a
total of 3,495 anorexia nervosa cases and 10,982 controls. The study found that the
genome-wide common variant heritability of anorexia nervosa was 0.20 (SE=0.02),
suggesting that a substantial fraction of the twin-based heritability arises from common
genetic variation. More recently, Watson et al (Hunna J. Watson et al., 2019) have
published the largest GWAS to date which allowed the authors to characterize in more
detail the metabolic contribution to AN. No large GWAS has been performed in either BN
or BED.
27
1.5.2. Socio-cultural Factors
The majority of models of risk investigating socio cultural factors have mainly focused on
the idealization of thinness in women as a driving factor in ED. The supporting evidence
for this comes from historical records and differences in prevalence across different
cultures, with larger prevalence for ED found in Western countries (P. K. Keel & Forney,
2013). Moreover, during the 20th century, the idealization of thinness, specifically in women
although in men too, increased in the Western culture and so did the incidence and
prevalence of AN and BN (P. K. Keel & Forney, 2013). With this respect, it is important to
note that differences exist between ED diagnoses in relation to culture based incidence.
For example, although it is true that BN is mostly detected in Western countries, the same
cannot be said for AN, which has been found in non-western regions and for which we
have historical accounts that take us back hundreds of years (Bemporad, 1996). Gender
differences in those affected by the disorder have also been used as supporting evidence
for the models of risk investigating socio-cultural factors as most of the idealization of
thinness messages are directed towards women. However, data on using idealization of
thinness doesn’t fully explain gender differences.
Importantly, while idealization of thinness may play a role in the overall model of risk for
ED it cannot solely explain it. Body dissatisfaction is high in women and this can be in part
attributed to socio cultural factors, which in turn can increase risk for disordered eating and
ED. However, these individual risk factors have been shown to have low predictive power
(Stice, 2002) suggesting it is important to continue the search for further individual risk
factors.
1.6. Neurocognitive Findings
Neurocognitive functions are cognitive functions that are closely linked to the function of a
particular brain area, neural pathway or cortical networks in the brain (Posner &
DiGirolamo, 2000). Neurocognitive processes have gained an increasing amount of
attention in the study of psychiatric disorders and have been proposed as potential
transdiagnostic mechanisms contributing to psychopathology. One reason for this was the
28
introduction of The Research Domain Criteria (RDoC) developed by the US National
Institute of Mental Health (NIMH) which offers a framework for investigating mental health
disorders across domains of functioning (Cuthbert & Insel, 2013) (a more detailed account
of the RDoC framework will be given in Chapter 3, Methodological considerations).
Many neurocognitive functions have been studied in the last 20 years, leading to a picture
of difficulties in large constructs of neurocognitive functioning. Measures of intelligence
and areas of executive function (set of processes required for planning and goal formation,
goal directed behaviour and effective performance) have been largely studied in ED.
However there is no real formal definition of executive function and, although widely used
and researched, the concept is quite flexible (Friedman & Miyake, 2017; Jurado & Rosselli,
2007). One issue with the measurement of executive function is that it is complex to
measure the components individually, as tasks that measure one component in many
cases are also tapping into another. Therefore, most tasks rely upon more than one aspect
of the overall construct. This makes research exploring executive functioning in ED not
always consistent, with many different measures being used and different components
being explored. It is therefore not clear if there is a lack of evidence for deficits in executive
functioning in ED, or if variability in results is highlighting the difficulties in understanding
executive functioning. However, to date, a large amount of the research in ED has focused
on executive functions that tap onto the construct of central coherence and set shifting (or
cognitive flexibility), which will be described below.
It is important to note that most studies have investigated cognitive markers primarily in ill
patients. An increasing amount of studies are also assessing recovered patients which
has helped elucidate differences between characteristics considered scars (or state) of the
disorder and longstanding characteristics, considered traits. More recently, research has
also been conducted in unaffected relatives and children at high-familial risk for ED to help
clarify these differences and help develop models of risk, which can in turn inform early
intervention and treatments.
The following section will provide a review of neurocognitive processes studied in ED and
which are relevant for this Ph.D. Later in the thesis (Chapter 3) an up to date overview of
findings in the children at risk literature will be provided.

29
1.6.1. Intelligence
Although intelligence is not the focus of this thesis, it is worth noting that in the past it has
been an area of interest in the study of ED. As the study of neuropsychological profiles
has become more popular in mental health disorders, there are several studies which have
aimed to explore Intelligence Quotient (IQ) in patients with ED.
The IQ is a composite score from a range of tests which have been developed in order to
measure general ability or intelligence (Lezak, 2007). One of the most popular instruments
used to measure IQ are the Wechsler Intelligence Scales, first released in the mid 1950’s.
The scales are formed of subtests which alternate verbal and visual-perceptual tests which
form the verbal and performance subscales and which together assess general
intelligence.
It has been hypothesized, that patients with AN have a higher IQ level in comparison to
the general population which could be partly driving or contributing to the manipulation and
planning that allows the disorder to go undetected as well as better school performance
(Lopez, Stahl, & Tchanturia, 2010). However, another hypothesis is that the perfectionistic
style attributed to AN could explain this too (Dura & Bornstein, 1989). Although higher IQ
has been hypothesized for patients in AN, the literature has shown a large amount of
variability and it has been hypothesized that the differences in samples studied (clinical
vs. community) might be playing a role in findings.
1.6.2. Set-shifting (Cognitive flexibility)
Cognitive flexibility has been described as an executive function that involves the ability to
shift attention from one task or operation to another, usually in response to a change in
rules or demands (Dajani & Uddin, 2015). It has been largely studied as a construct, as
well as in relation to other psychiatric disorders (such as OCD (Gruner & Pittenger, 2017)
and ASD (Demetriou et al., 2018; H. Westwood, Stahl, Mandy, & Tchanturia, 2016)).
Cognitive flexibility can also be more broadly thought of as the ability to overcome
responses that have become habitual in order to create more adaptable ones. It requires
several executive functions, such as salience detention and attention, inhibition, working
memory and switching that encompass the larger construct (Dajani & Uddin, 2015) located
30
primarily in the prefrontal cortex (Armbruster, Ueltzhoffer, Basten, & Fiebach, 2012).
Cognitive flexibility is typically measured using set-shifting or task-switching behavioural
tasks (such as the Wisconsin Card Sort Task, Go/no-go tasks, Attention switching tasks).
One of the features of ED is compulsivity and rigidity to which cognitive inflexibility may
contribute (Holliday, Tchanturia, Landau, Collier, & Treasure, 2005). Patients with ED
present with rigid behavioural features related to eating behaviours (such as counting
calories, exercising, in some cases rigid purging behaviours), they have also been shown
to present with rigid rituals in their daily routine (e.g. cleaning, housekeeping, homework;
possibly mediated by perfectionistic behaviours) and can experience difficulties in seeing
alternative ways of coping with problems.
Deficits in cognitive flexibility (or set shifting) have been largely studied in ED (Galimberti
et al., 2013; N. Kanakam, Raoult, Collier, & Treasure, 2013; Naor-Ziv & Glicksohn, 2016;
Roberts, Tchanturia, Stahl, Southgate, & Treasure, 2007; J. E. Steinglass, Walsh, & Stern,
2006; K. Tchanturia, Davies, Roberts, et al., 2012; H. Westwood et al., 2016; Wu et al.,
2014), and have been found to be present in recovered patients (I. C. Gillberg et al., 2010;
Lindner, Fichter, & Quadflieg, 2014; K. Tchanturia et al., 2004) as well as in first degree
relatives of patients with ED (Natalie Kanakam & Treasure, 2013; Lang, Treasure, &
Tchanturia, 2016). These findings have led to the hypothesis of set shifting deficits as
proposed endophenotypes for ED (Holliday et al., 2005; N. Kanakam et al., 2013; Natalie
Kanakam & Treasure, 2013; Roberts et al., 2007). Tchanturia and colleagues in 2011
(Kate Tchanturia et al., 2011) found that severity of illness (measured by the length of the
illness) could not fully explain the set shifting deficit findings in AN and EDNOS thus
supporting the nature of these deficits as endophenotypes.
As with previous executive function constructs, different tasks have been used to assess
set shifting, making comparison between studies complex. However, unlike with other
smaller constructs of executive function, a large number of studies have investigated set
shifting leading to several reviews and meta-analysis to obtain a better picture of the
literature in the last few years. Tasks such as the Trail making task (Kravariti, Morris, Rabe-
Hesketh, Murray, & Frangou, 2003), the Brixton Task (Burgess & Shallice, 1997) and the
Wisconsin Card Sorting Tests among others have been used to assess this construct.
Roberts and colleagues performed a systematic review and meta-analysis of studies
31
investigating set shifting in adults with ED (Roberts et al., 2007). In total 15 studies were
included and the authors found a consistent deficit in set shifting ability across ED
diagnoses, stages of illness and different set shifting measures. Meta analyses were
performed separately for the most widely used tasks with effect sizes varying between
small (Trail making task), to medium (Wisconsin Card Sorting Task) to large (Haptic task).
A more recent meta-analysis (N = 22 studies) on set-shifting profiles of AN found a medium
effect size on studies using the Wisconsin Sorting Card Task, however, they did not find a
significant effect in studies that investigated children/adolescents. In 2013, Lang and
colleagues performed a meta-analysis of set shifting in children and adolescents with AN
and found that set shifting inefficiencies apparent in adults are not as pronounced in
children and adolescents with AN (Lang, Stahl, Espie, Treasure, & Tchanturia, 2014). The
authors suggest that a possible hypothesis for the differences between adults and
children/adolescents is that set shifting difficulties in the adult AN population are a result
of starvation or of a longer duration of the illness. However, this meta-analysis only
included 7 studies, therefore, more studies are needed in order to understand set shifting
in children and adolescents with AN. Recently, Smith and colleagues (K. E. Smith, Mason,
Johnson, Lavender, & Wonderlich, 2018) published a systematic review of reviews
investigating the neurocognitive profile of eating disorders in order to systemize a large
body of work in the last decades. They included a total of 28 review articles, of which 12
reviewed set shifting (6 of which were meta-analysis) and a total of 13 meta-analysis were
included in the review. In 2014 Wu and colleagues published the most recent meta-
analysis (Wu et al., 2014) and found evidence of poor set-shifting in patients with ED with
medium effect sizes in AN-R, BN, and BED, but not in AN-BP. Wu compared set-shifting
across DSM5 ED diagnoses and concluded that set-shifting did not vary across them.
Effect sizes of findings also varied across tasks used but those of the most used tasks
such as the Wisconsin Sorting Tasks were medium in size (WCST g = -0.53).
Importantly, set shifting deficits have been found to persist in recovery (Nakazato, 2008,
2010; Tchanturia, 2004; Tenconi, 2010). A meta-analysis found that patients recovered
from AN differed from controls with an overall small effect size (Natalie Kanakam &
Treasure, 2013). Furthermore, more recently there has been an interest in understanding
if set shifting is a trait rather than an effect of the disorder and therefore, first degree
relatives have been studied in order to understand this difference. Holliday et al in 2005
found that set-shifting difficulties in women with AN were also shared by their healthy
sisters. They found that in particular, both women with AN and their unaffected sisters took
a significant increased amount of time to shift between tasks in the CatBag cognitive set-
32
shifting task and the Haptic illusion task, both of which assess perceptual rigidity. Similar
results were also showed by Tenconi et al (Tenconi et al., 2010) were both patients with
AN and their healthy sisters showed poorer performance in tasks investigating set shifting
and central coherence. The meta-analysis by Kanakam and Treasure showed that overall,
first degree relatives of people with ED differ from controls with a medium effect size
(Holliday et al., 2005; Natalie Kanakam & Treasure, 2013). These results provide further
evidence for the hypothesis that cognitive inflexibility may constitute a biological marker or
heritable endophenotype in AN.
There are limitations to the study of cognitive flexibility as the definition of the construct is
variable depending on studies and tasks used which leads to inconsistent findings in the
literature. Therefore, there is a need for defining and operationalizing the construct and
further studies using the same definition and paradigms in order to gain a better
understanding of cognitive flexibility in ED.
1.6.3. Central Coherence
Weak central coherence refers to a bias towards detailed or local focus over processing
the information in a more global manner. It can also be explained as a limited ability to see
the “big picture” or understand the context of something and it was originally proposed as
a central disturbance in Autistic Spectrum Disorder (ASD) (Uta Frith, 1989; F. Happe &
Frith, 2006). More recently, it has been suggested that weak central coherence could be
considered as part of the neuropsychological profile of ED and possibly play a role in the
development and maintenance (I. C. Gillberg et al., 2010). Gillberg and colleagues raised
the possibility that there could be some overlap between ASD and AN after finding high
prevalence of ASD and ASD traits in a cohort of patients with AN who had been followed
for over 20 years (C. Gillberg & Råstam, 1992; I. C. Gillberg, Råstam, & Gillberg, 1994;
Wentz, Gillberg, Gillberg, & Rastam, 2001). As with other neurocognitive functions there
is a need to study not only the overall construct but the different domains that load onto
the construct (such as visuospatial, verbal, auditory). In 2008 Happe and Booth (F. G.
Happe & Booth, 2008) re-examined the concept of central coherence and concluded that
it consisted of two dimensions: (1) global integration and (2) detailed or local information
processing. Various tasks have been used in order to investigate the construct such as
the Rey-Osterrieth Complex Figure Test (ROFT) (Rey, 1941), Group/Embedded Figures
33
Test (EFT/GEFT) (Witkin, Oltman, Raskin, & Karp, 1971) and Object Assembly (OA,
Wechsler 1974 , 1981 ).
Unlike set-shifting the study of central coherence in ED has not been as developed. In
2008 Lopez and colleagues (Lopez, Tchanturia, Stahl, & Treasure, 2008) published a
systematic review that found consistent evidence of difficulties with global integration but
not a bias towards local processing. Since then, further studies have been conducted.
Lopez and colleagues (Lopez, Tchanturia, Stahl, Booth, et al., 2008) found that patients
with AN show a superior detail focused processing at the expense of global processing, a
similar pattern to those of patients with high functioning ASD and Asperger’s. They also
found that OCD traits were also associated with poorer central coherence but did not find
an association between performance in tasks and measures of anxiety or depression.
Importantly, they did not find any correlation with Body Mass Index (BMI) suggesting the
central coherence could be a trait independent of starvation processes. In 2014, Lang and
colleagues (Lang, Lopez, Stahl, Tchanturia, & Treasure, 2014) published a meta-analysis
which included 12 studies using three different tasks to measure central coherence
(ROFT, G/EFT and OA) confirming weak central coherence in patients with ED. The
strongest evidence came from the studies using G/EFT with a medium effect of (d = -0.51)
and all studies included finding a bias towards detailed processing across all ED subtypes.
Inefficient global processing was demonstrated by studies using the ROFT with a medium
effect size (d = -0.62). A recent large study (N = 984) by Lang and colleagues (Lang,
Roberts, et al., 2016) (with data drawn from previous studies from the same group) found
poorer performance in global processing across all ED subtypes, however, they did not
find any differences in performance between recovered AN and HC subjects. Interestingly,
the study did yield significant results for poorer central coherence in unaffected sisters of
patients with AN which is surprising given that this meant that recovered AN patients
performed better than unaffected sisters. One possible explanation is that some of the
recovered patients would have received Cognitive Remediation Therapy (CRT) as a
treatment package which involved cognitive training as well as behavioural strategies for
weight gain. Although this is a hypothesis, it is supported by studies showing cognitive
improvement after CRT (K. Tchanturia, Giombini, Leppanen, & Kinnaird, 2017; K.
Tchanturia, Lounes, & Holttum, 2014).
Studies have also found similar results after recovery (A. Harrison, Tchanturia, & Treasure,
2011; Lopez, Tchanturia, Stahl, & Treasure, 2009; Roberts, Tchanturia, & Treasure, 2010;

34
Tenconi et al., 2010) and in first degree relatives of patients with AN (N. Kanakam et al.,
2013; Roberts, Tchanturia, & Treasure, 2013; Tenconi et al., 2010). Thus supporting the
hypothesis of weak central coherence as an endophenotype for ED.
1.6.4. Social and emotional processing
Difficulties in emotional processing have been proposed to underpin many psychological
disorders (Berenbaum, Raghavan, Le, Vernon, & Gomez, 2003), and together with social
functioning they have been theorised to play an important role in the development and
maintenance of ED (A. Oldershaw et al., 2011; Anna Oldershaw, Lavender, & Schmidt,
2018; Schmidt & Treasure, 2006). Poorer social and emotional processing have also been
shown to be associated with greater illness chronicity (A. Harrison, Tchanturia, Naumann,
& Treasure, 2012) in these patients. Both emotion generation and regulation as well as
social functioning have been studied in patients with ED and found to be altered.
In recent years, there has been an interest in understanding the role that emotional
regulation plays in development of ED. One hypothesis is that patients with ED may have
deficits in emotion regulation and therefore lack the skills to cope with negative affective
states, which can lead to the use of strategies for weight control (excessive exercise, binge
or purge behaviours) (Peñas‐Lledó, Vaz Leal, & Waller, 2002; Smyth et al., 2007). While
this model may have been developed focusing on binge/purge disorders, it has been
suggested that problems with emotion regulation might be present across all diagnoses.
In Fairburn, Cooper and Shafran’s 2003 transdiagnostic model (Fairburn, Cooper, &
Shafran, 2003), they suggested that mood intolerance could be a process involved in
maintenance of ED in general.
Evidence for difficulties in emotional regulation in ED comes from self-reported studies,
several of which have focused on alexithymia (difficulty identifying and describing one’s
own emotions). The majority of studies have found higher levels of alexithymia in patients
across ED diagnoses when compared to healthy controls (Brockmeyer et al., 2014;
Eizaguirre, Saenz de Cabezón, Alda, Olariaga, & Juaniz, 2004; Nowakowski, McFarlane,
& Cassin, 2013). In fact, the review by Nowakowski and colleagues (Nowakowski et al.,
2013) suggests that there is a strong evidence that alexithymia is not simply a product of
ED symptomatology and may play a role in its development.
35
Research in emotion recognition (the ability to recognise facial emotions) has yielded
inconsistent findings in ED. While several authors have reported deficits in patients with
ED (A. Harrison, Sullivan, Tchanturia, & Treasure, 2009; Kucharska-Pietura, Nikolaou,
Masiak, & Treasure, 2004; Legenbauer, Vocks, & Ruddel, 2008; Pollatos, Herbert,
Schandry, & Gramann, 2008), others have not (H. Kessler, Schwarze, Filipic, Traue, & von
Wietersheim, 2006; Mendlewicz, Linkowski, Bazelmans, & Philippot, 2005). In recent
years, two meta-analyses of emotion recognition have highlighted these discrepancies in
the literature and showed that differences are often small. Evidence with regards to
difficulties in emotion recognition in patients with ED, comes from studies using a range of
tasks, including experimental paradigms where patients have to recognise emotional state
in pictures of faces presented to them (Kucharska-Pietura et al., 2004). As shown in the
previous paragraph, patients with ED have higher levels of alexithymia which has been
proposed to also explain difficulties in emotion recognition (Brewer, Cook, Cardi, Treasure,
& Bird, 2015). This hypothesis could shed some light into inconsistencies in findings in
emotion recognition literature in ED, suggesting that difficulties in emotion recognition
might not be explained by the ED, but by co-occurring alexithymia. Further investigation is
needed in order to explain the differences in the literature. Interesting differences in
patterns of recognition depending on the type of emotion have been identified in studies,
although this needs further exploration. Furthermore, dysfunctional aspects such as
misinterpretation might be important in this group of patients (Wyssen et al., 2019).
Research into Event Related Potentials (ERPs) suggests that patients with BN may use
increased cognitive effort in order to evaluate facial expressions (Kuhnpast, Gramann, &
Pollatos, 2012), which they hypothesise could lead to difficulties in social interaction (as
they require more effort) and in turn lead to increase social withdrawal.
Differences in emotion recognition have not consistently been found in recovered AN
patients leading to the hypothesis that difficulties in emotion recognition might be an effect
of the acute stage of the disorder (it is well known the severe cognitive consequences that
starvation can play) rather than play a role in its development (A. Oldershaw, Hambrook,
Tchanturia, Treasure, & Schmidt, 2010). However, there are still reasons to hypothesise
that social cognitive deficits that require not just recognition of emotions but more complex
cognitive processes required for social interactions (similar to those present in ASD) may
be trait like features in AN. Evidence for this comes from premorbid social deficits and
social phobia in ED (Godart, Flament, Lecrubier, & Jeammet, 2000; W. H. Kaye, Bulik,
Thornton, Barbarich, & Masters, 2004; Schaumberg et al., 2019; J. Swinbourne et al.,
2012), and studies using tasks assessing theory of mind (ability to attribute mental states
36
to oneself and others and that this can be different from one’s own), as well as increased
prevalence of ASD diagnoses/traits in patients with AN. A recent meta-analysis and
systematic review (N = 30 studies) of emotion generation and regulation in AN, concluded
that patients with AN have difficulties in their ability to regulate their own emotional state
and understand the emotional states of others (A. Oldershaw et al., 2011). Oldershaw and
colleagues investigated 5 constructs of social emotional processing (first developed by
Ochsner (Ochsner, 2008)) and found alterations in patients with AN in affective values
(heightened sensitivity and bias or avoidance of threatening disorder specific emotional
stimuli), in recognition of emotions in others, poor theory of mind (high level mental
interference) and lastly some difficulty in regulation of emotional responses. A meta-
analysis of theory of mind in ED (n=15 studies) concluded that AN was associated with
significant deficits in theory of mind while small sized deficits were also present in patients
with BN and in those recovered from AN (E. Bora & Köse, 2016). The majority of studies
used reading the mind in the eyes test (Baron-Cohen, Wheelwright, Hill, Raste, & Plumb,
2001) to assess theory of mind. The test assesses decoding of affective stimuli, which is
not only important for emotion recognition but also the first step of inferring complex social
emotions. Meta-regression analyses showed a significant relationship between low BMI
and theory of mind scores suggesting that difficulties in theory of mind may be a
consequence of starvation effects (E. Bora & Köse, 2016), this however did not explain
the difference found in recovered patients. This poses a recurrent question regarding state
or trait related characteristics of ED. While the relationship between BMI and theory of
mind points to an effect of starvation it can also represent a worsening of an existing deficit
as deficits in theory of mind were also found in recovered patients and patients with normal
BMI. Interestingly, Oldershaw and colleagues found that even though recovered patients
overall performed similarly to HC in a theory of mind task, when examining by task,
recovered patients performed equal to currently ill patients in a task that required
recognizing positive emotions (A. Oldershaw et al., 2010).
Some alterations in social emotional processing have in fact been demonstrated to be
present both premorbidly as well as during the acute phase of the disorder leading to
questions with regards to the influence that these social emotional aspects may have in
the development of ED. In recent years aspects of social cognitive functioning in patients
with ED has been largely studied, leading to findings of an over representation of Autism
Spectrum Disorder (ASD) traits in patients with AN (Heather Westwood & Tchanturia,
2017). Both group of patients shared underlying difficulties with both central coherence
and set-shifting tasks (H. Westwood et al., 2016) as well as increased levels of anxiety

37
and difficulties in aspects of social cognition (Zhou, McAdam, & Donnelly, 2018) (further
details on the overlap between ASD and AN will be discussed in Chapter 3).
Overall there is some evidence of altered social and emotional processing deficits in
patients with ED although the role that starvation plays in these deficits is not clear. Of
course, little evidence clarifies if social emotional difficulties are present before the onset
of the disorder and therefore could contribute to its development. Different strategies have
been used to support the hypothesis that social functioning alterations in ED are premorbid
difficulties rather than an artefact of the ill state or a manifestation of malnutrition. Some
studies have looked at retrospective reports of childhood social functioning and
comorbidity with childhood diagnoses defined by social deficits (such as separation
anxiety, social phobia or ASD) and have found that difficulties predated the onset of ED
(W. H. Kaye et al., 2004; Råstam, 2008; Silberg & Bulik, 2005).
1.7. Interim conclusion
ED are complex mental health disorders with the highest mortality rate of any other mental
health disorder despite having a relatively low prevalence. They have an early onset in
early adolescence (childhood in some cases) and if not treated promptly, can become
chronic and last over 20 years. ED have a devastating effect for both the patient and the
family. Furthermore, there is a stigma associated with the development of the disorder,
which has an effect on treatment seeking and hinders patients’ chances to recover.
Although, as said previously, the aetiology is not well understood, we know that bio-
psycho-social factors play a role in the development of ED. In more recent years, the
exploration of the neurocognitive and socio-emotional profile of patients with ED has led
to hypotheses of how alterations in cognitive processing can play a role in the maintenance
and/or development of the disorder.
38
Chapter 2. Neuroimaging in Eating Disorders
2.1. Chapter overview
Magnetic Resonance Imaging (MRI) is a safe and non-invasive technique developed in
the 1970s and 1980s. The following section (2.1.) describes the basic principles of MRI
physics and has been referenced from selected textbooks. After introducing the principles
of MRI this Chapter will provide an overview of neuroimaging findings in patients with ED.
While the current thesis will also explore white matter alterations in children at risk, to date
most studies have been conducted using small samples and using at least two different
approaches to analysing the findings resulting in mixed results. No meta-analysis of white
matter alterations in ED has been published and therefore Chapter 7 will focus on meta-
analysing these data and providing an overview on the current literature. Thus this chapter
will only cover findings in volumetric and functional findings in ED.
2.2. Basics of MRI
MRI stands for Magnetic Resonance Imaging and is an imaging method which uses a
powerful magnetic field (B0) to align the magnetization of hydrogen protons found in water
content of tissue and radio frequency fields to systematically alter the alignment of this
magnetization.
An MR machine consists of the following components:
- Magnet: a large magnet that generates the magnetic field. The strength of the magnet is
measures in Teslas (T), and with a higher strength the image resolution improves.
- Shim coils: in order to make the magnetic field as homogenous as possible.
- Gradient coil: provide spatial localization of the signals. Three sets of coils are used in
the x, y and z directions.
- Radiofrequency (RF) coil: which transmits a radiofrequency signal into the body part
being imaged.

39
2.2.1. Origin of MR signal
On average, a human body is formed by 75% water. Water contains hydrogen protons
containing an electron which rotates (precess) in its own axes and is positively charged.
These hydrogen protons get aligned with the main magnetic field in the MRI in two possible
ways: in the direction of the magnet (spin-up or parallel) or against it (spin-down or anti-
parallel). The direction in which the proton aligns itself is dependent on how much energy
it has, with the anti-parallel direction requiring more energy than the parallel one. The rate
of precession is directly proportional to the strength of the local magnetic field (B0) and can
be determined by the Larmor equation:
Where frequency (ω) is the frequency of the spins, ϒ is the gyro-magnetic ratio (a property
of the nucleus, for hydrogen protons the value is 42.56 mHzT-1) and B0 is the magnitude
of the magnetic field strength. At different T, the Larmor frequency of the hydrogen protons
changes: at 3T, protons precess around the main magnetic field at 127 MHz. See figure
2.2.
Figure 2.1. MRI components diagram
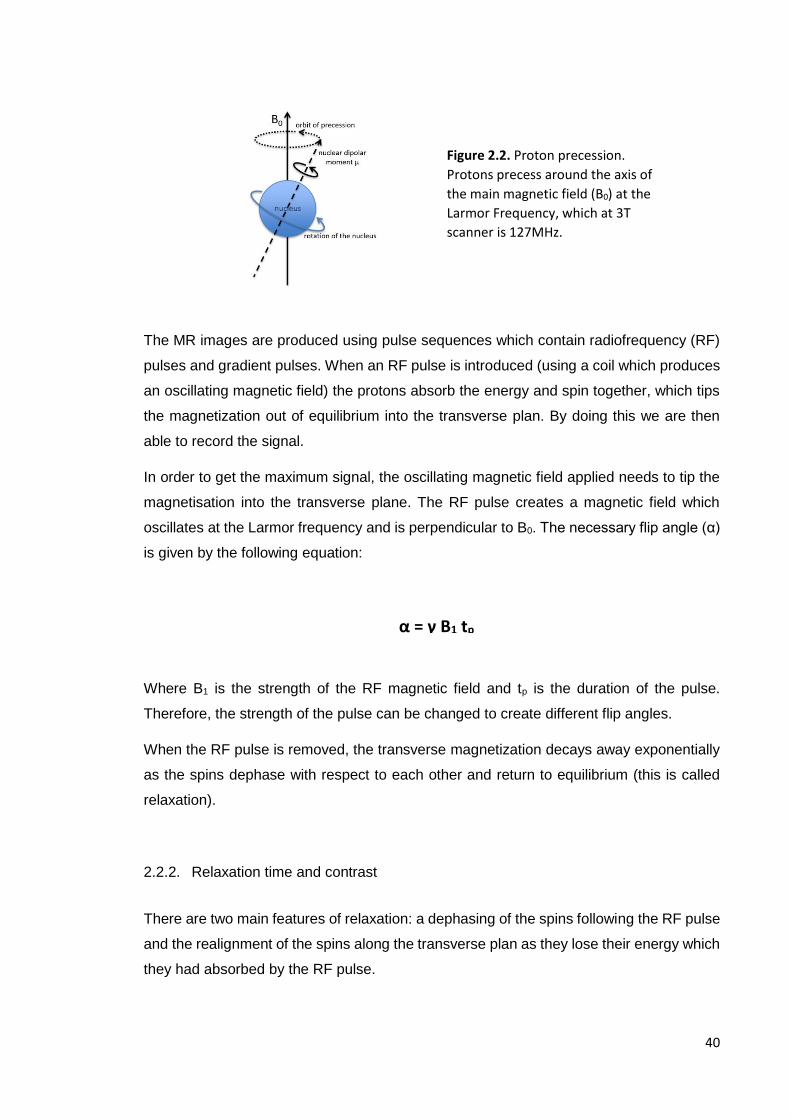
40
The MR images are produced using pulse sequences which contain radiofrequency (RF)
pulses and gradient pulses. When an RF pulse is introduced (using a coil which produces
an oscillating magnetic field) the protons absorb the energy and spin together, which tips
the magnetization out of equilibrium into the transverse plan. By doing this we are then
able to record the signal.
In order to get the maximum signal, the oscillating magnetic field applied needs to tip the
magnetisation into the transverse plane. The RF pulse creates a magnetic field which
oscillates at the Larmor frequency and is perpendicular to B0. The necessary flip angle (α)
is given by the following equation:
Where B1 is the strength of the RF magnetic field and tp is the duration of the pulse.
Therefore, the strength of the pulse can be changed to create different flip angles.
When the RF pulse is removed, the transverse magnetization decays away exponentially
as the spins dephase with respect to each other and return to equilibrium (this is called
relaxation).
2.2.2. Relaxation time and contrast
There are two main features of relaxation: a dephasing of the spins following the RF pulse
and the realignment of the spins along the transverse plan as they lose their energy which
they had absorbed by the RF pulse.
Figure 2.2. Proton precession.
Protons precess around the axis of
the main magnetic field (B0) at the
Larmor Frequency, which at 3T
scanner is 127MHz.
α = γ B1 tp

41
T1 relaxation (spin-lattice relaxation or longitudinal relaxation) refers to the exponantial
growth of the longitudinal magnetization. During T1 relaxation, the spins return back into
their low energy state, back to equilibrium in the main magnetic field B0.
T2 relaxation (spin-spin relaxation or transverse relaxation) refers to the process in which
the protons get out of phase with each other, they stop spinning together, causing a loss
of magnetisation in the transverse plan.
Relaxation are important parameters that reflect the tissue environment. Protons in our
body have different local environments, some associated with free water molecules and
some fixed in position. Different protons have characteristic differences in their T1 and T2
relaxation. Therefore, in order to accentuate and measure these differences, we can
change how quickly we place the RF pulses (TR or Repetition time) and how quickly we
choose to listen to the return signal after the first excitation RF pulse (TE or Echo time).
These two parameters are going to determine the contrast in the image. Changing the TR
is going to affect the contrast between tissues with different T1 relaxation times, whilst
changing the TE will affect contrast between tissues with different T2 relaxation times.
Figure 2.3. Differences in TR and TE for different weighted images.
Proton density (PD) represents the number of hydrogen atoms in a particular volume, for
example, fluids such as cerebral spinal fluid (CSF) and blood have higher PD than tendon
and bone. Each tissue is going to have a different PD, T1 and T2, and these three factors
are going to determine the signal (Figure 2.4).
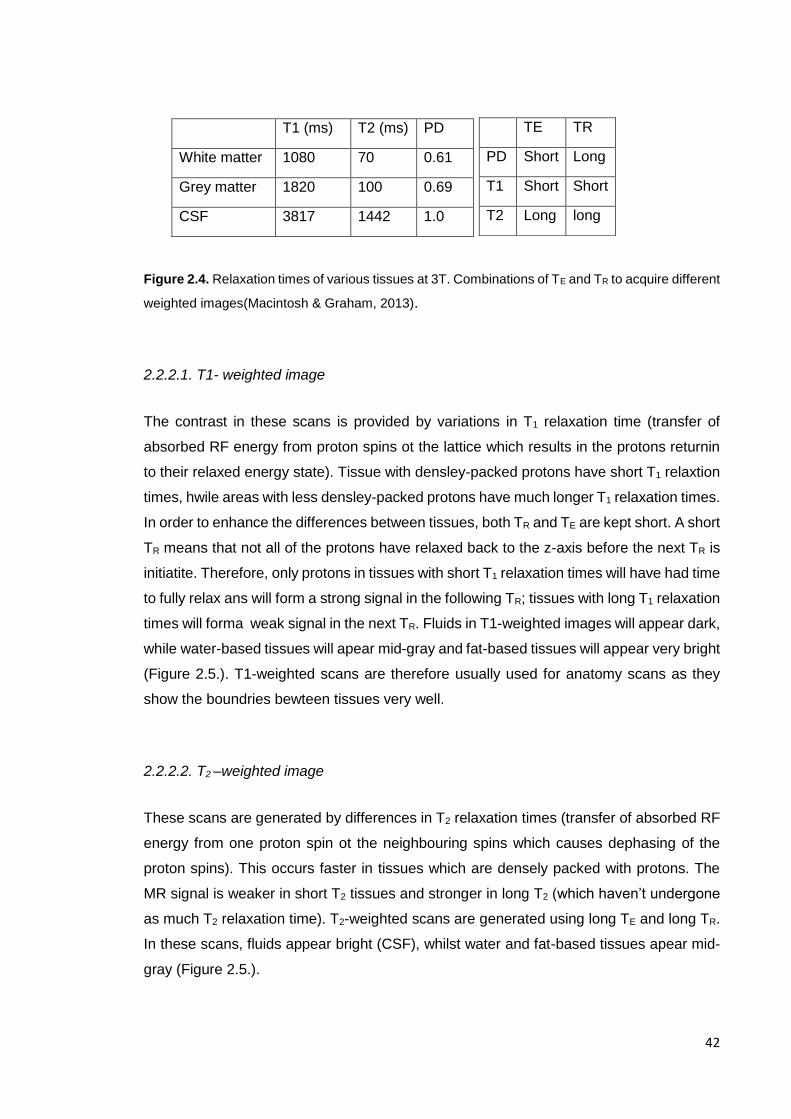
42
Figure 2.4. Relaxation times of various tissues at 3T. Combinations of TE and TR to acquire different
weighted images(Macintosh & Graham, 2013).
2.2.2.1. T1- weighted image
The contrast in these scans is provided by variations in T1 relaxation time (transfer of
absorbed RF energy from proton spins ot the lattice which results in the protons returnin
to their relaxed energy state). Tissue with densley-packed protons have short T1 relaxtion
times, hwile areas with less densley-packed protons have much longer T1 relaxation times.
In order to enhance the differences between tissues, both TR and TE are kept short. A short
TR means that not all of the protons have relaxed back to the z-axis before the next TR is
initiatite. Therefore, only protons in tissues with short T1 relaxation times will have had time
to fully relax ans will form a strong signal in the following TR; tissues with long T1 relaxation
times will forma weak signal in the next TR. Fluids in T1-weighted images will appear dark,
while water-based tissues will apear mid-gray and fat-based tissues will appear very bright
(Figure 2.5.). T1-weighted scans are therefore usually used for anatomy scans as they
show the boundries bewteen tissues very well.
2.2.2.2. T2 –weighted image
These scans are generated by differences in T2 relaxation times (transfer of absorbed RF
energy from one proton spin ot the neighbouring spins which causes dephasing of the
proton spins). This occurs faster in tissues which are densely packed with protons. The
MR signal is weaker in short T2 tissues and stronger in long T2 (which haven’t undergone
as much T2 relaxation time). T2-weighted scans are generated using long TE and long TR.
In these scans, fluids appear bright (CSF), whilst water and fat-based tissues apear mid-
gray (Figure 2.5.).
T1 (ms) T2 (ms) PD
White matter 1080 70 0.61
Grey matter 1820 100 0.69
CSF 3817 1442 1.0
TE TR
PD Short Long
T1 Short Short
T2 Long long
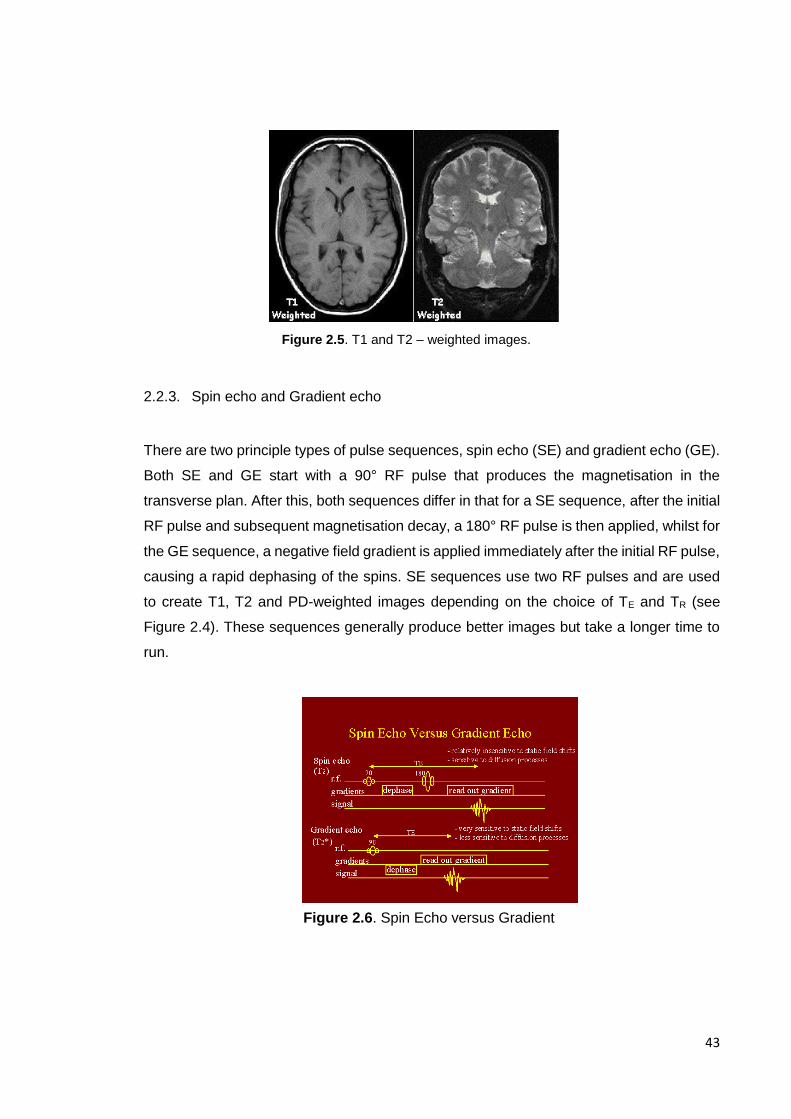
43
2.2.3. Spin echo and Gradient echo
There are two principle types of pulse sequences, spin echo (SE) and gradient echo (GE).
Both SE and GE start with a 90° RF pulse that produces the magnetisation in the
transverse plan. After this, both sequences differ in that for a SE sequence, after the initial
RF pulse and subsequent magnetisation decay, a 180° RF pulse is then applied, whilst for
the GE sequence, a negative field gradient is applied immediately after the initial RF pulse,
causing a rapid dephasing of the spins. SE sequences use two RF pulses and are used
to create T1, T2 and PD-weighted images depending on the choice of TE and TR (see
Figure 2.4). These sequences generally produce better images but take a longer time to
run.
Figure 2.5. T1 and T2 – weighted images.
Figure 2.6. Spin Echo versus Gradient
eCHOeeCHOeEcho
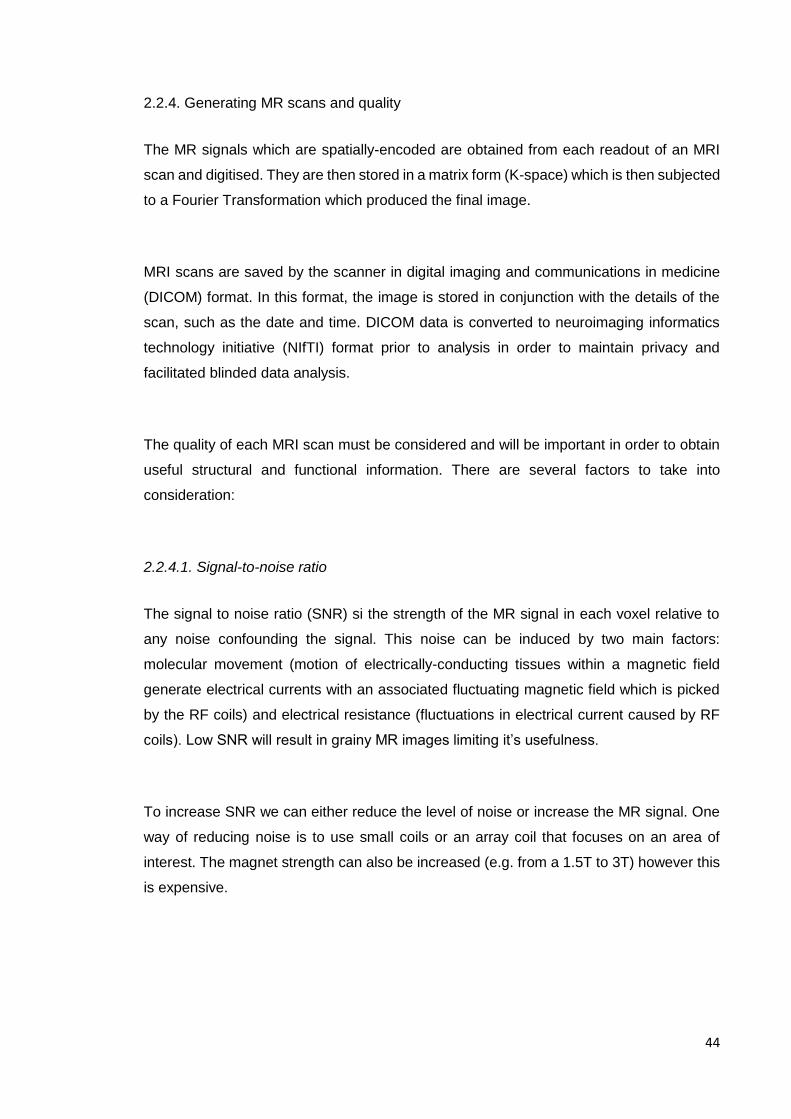
44
2.2.4. Generating MR scans and quality
The MR signals which are spatially-encoded are obtained from each readout of an MRI
scan and digitised. They are then stored in a matrix form (K-space) which is then subjected
to a Fourier Transformation which produced the final image.
MRI scans are saved by the scanner in digital imaging and communications in medicine
(DICOM) format. In this format, the image is stored in conjunction with the details of the
scan, such as the date and time. DICOM data is converted to neuroimaging informatics
technology initiative (NIfTI) format prior to analysis in order to maintain privacy and
facilitated blinded data analysis.
The quality of each MRI scan must be considered and will be important in order to obtain
useful structural and functional information. There are several factors to take into
consideration:
2.2.4.1. Signal-to-noise ratio
The signal to noise ratio (SNR) si the strength of the MR signal in each voxel relative to
any noise confounding the signal. This noise can be induced by two main factors:
molecular movement (motion of electrically-conducting tissues within a magnetic field
generate electrical currents with an associated fluctuating magnetic field which is picked
by the RF coils) and electrical resistance (fluctuations in electrical current caused by RF
coils). Low SNR will result in grainy MR images limiting it’s usefulness.
To increase SNR we can either reduce the level of noise or increase the MR signal. One
way of reducing noise is to use small coils or an array coil that focuses on an area of
interest. The magnet strength can also be increased (e.g. from a 1.5T to 3T) however this
is expensive.

45
2.2.4.2. Spatial resolution
Spatial resolution is the number of voxels that are utilised in the creation of the MRI image
(a higher number of voxels means higher resolution). The field of view (FOV) is the total
area scanned and is fixed for a study. A FOV that is large enough to cover a multitude of
patients (with different body masses) has to be selected. The spatial resolution is defined
by the size of the voxels in the image: smaller voxel size means that a greater number of
voxels can fill the FOV and therefore will incur in greater spatial resolution.
2.2.4.3. Artefacts
Artefacts are unwanted features on an MRI. A large number of different artefacts can occur
during a scan acquisition; however, the most common ones are due to patient motion,
magnetic field inhomogeneity or image processing anomalies.
2.3. Diffusion MRI
In the last thirty years Diffusion MRI has become an important modality in radiography to
help in-vivo imaging of ischemia and has more recently been used as a research tool to
understand white matter microstructure and directionality. Diffusion MRI has become a
tool to help understand both cognition and disease.
2.3.1. Basics of Diffusion MRI
The thermal energy carried by molecules results in a random movement of molecules, also
called Brownian motion, which move on average over distances around 10 µm (Le Bihan
et al., 2001). Molecules travel randomly in space over a distance that is described by the
diffusion coefficient (D). This coefficient is dependent on the size of the molecules, the
temperature and the nature of the medium.
Where X2 is the average mean-squared diffusion distance along one direction and Td is
diffusion time. Free water molecules diffuse in water at 37°C and the diffusion coefficient
X2 = 2DTd

46
for them is 3.10-3 mm2.s-1. However, in biological tissues compared to free water, the
diffusion coefficient is no longer Gaussian and water molecules move in a different way,
bouncing and interacting with the tissue. Therefore, whilst a short diffusion time would
reflect the local intrinsic viscosity, a longer diffusion time reflects the presence of obstacles.
Therefore, the observation of the diffusion distribution in tissue provides an insight into the
microstructure of the neural tissues in which molecules move.
2.3.2. Diffusion-Weighted Imaging (DWI)
Since the human brain does not consist of free flowing water, but also has structures such
as axons, myelin and glial cells, the mobility of the water molecules is affected and varies
depending of the tissue in which they are in.
The apparent diffusion coefficient (ADC) measures the diffusion of water molecules within
each voxel. In areas where there is little hindrance to the movement, water has an isotropic
diffusion. The water molecules movement is unrestricted and they can move in any
direction, diffusion is isotropic in CSF (where there is high diffusivity). Therefore, the
directionality of water diffusion in a tissue arises from its microstructural organisation.
For diffusion weighted images we start with a T2 weighted spin-echo sequence where the
sequences are made sensitive to diffusion by adding diffusion gradients in certain
Figure 2.7. Diffusion characteristics in different tissues. Diffusion is influenced by the structure of the
tissues, restricting mobility of water molecules. In isotropic diffusion such as in the CSF (A), molecules
can move in all directions; in anisotropic diffusion, such as white matter fibre tracts (B), axonal
membranes and myelin restrict the diffusion of the water molecules (anisotropic).
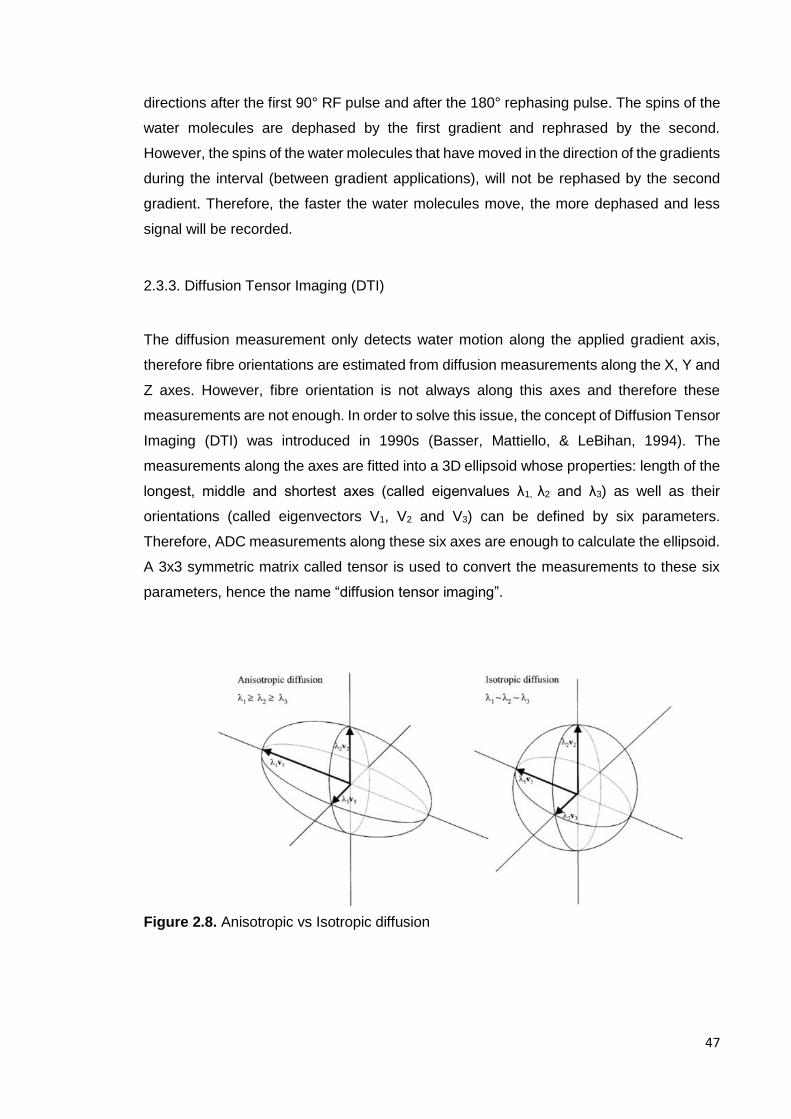
47
directions after the first 90° RF pulse and after the 180° rephasing pulse. The spins of the
water molecules are dephased by the first gradient and rephrased by the second.
However, the spins of the water molecules that have moved in the direction of the gradients
during the interval (between gradient applications), will not be rephased by the second
gradient. Therefore, the faster the water molecules move, the more dephased and less
signal will be recorded.
2.3.3. Diffusion Tensor Imaging (DTI)
The diffusion measurement only detects water motion along the applied gradient axis,
therefore fibre orientations are estimated from diffusion measurements along the X, Y and
Z axes. However, fibre orientation is not always along this axes and therefore these
measurements are not enough. In order to solve this issue, the concept of Diffusion Tensor
Imaging (DTI) was introduced in 1990s (Basser, Mattiello, & LeBihan, 1994). The
measurements along the axes are fitted into a 3D ellipsoid whose properties: length of the
longest, middle and shortest axes (called eigenvalues λ1, λ2 and λ3) as well as their
orientations (called eigenvectors V1, V2 and V3) can be defined by six parameters.
Therefore, ADC measurements along these six axes are enough to calculate the ellipsoid.
A 3x3 symmetric matrix called tensor is used to convert the measurements to these six
parameters, hence the name “diffusion tensor imaging”.
Figure 2.8. Anisotropic vs Isotropic diffusion
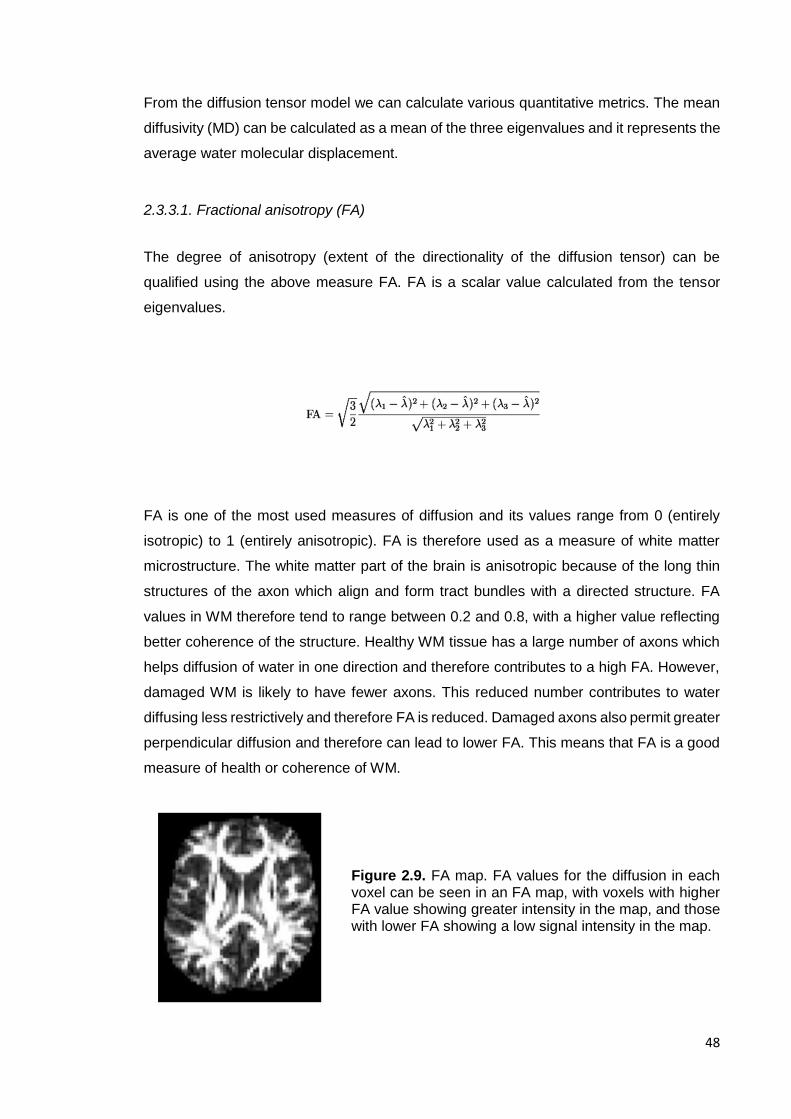
48
From the diffusion tensor model we can calculate various quantitative metrics. The mean
diffusivity (MD) can be calculated as a mean of the three eigenvalues and it represents the
average water molecular displacement.
2.3.3.1. Fractional anisotropy (FA)
The degree of anisotropy (extent of the directionality of the diffusion tensor) can be
qualified using the above measure FA. FA is a scalar value calculated from the tensor
eigenvalues.
FA is one of the most used measures of diffusion and its values range from 0 (entirely
isotropic) to 1 (entirely anisotropic). FA is therefore used as a measure of white matter
microstructure. The white matter part of the brain is anisotropic because of the long thin
structures of the axon which align and form tract bundles with a directed structure. FA
values in WM therefore tend to range between 0.2 and 0.8, with a higher value reflecting
better coherence of the structure. Healthy WM tissue has a large number of axons which
helps diffusion of water in one direction and therefore contributes to a high FA. However,
damaged WM is likely to have fewer axons. This reduced number contributes to water
diffusing less restrictively and therefore FA is reduced. Damaged axons also permit greater
perpendicular diffusion and therefore can lead to lower FA. This means that FA is a good
measure of health or coherence of WM.
Figure 2.9. FA map. FA values for the diffusion in each voxel can be seen in an FA map, with voxels with higher FA value showing greater intensity in the map, and those with lower FA showing a low signal intensity in the map.

49
2.3.3.2. Mean Diffusivity (MD)
Mean diffusivity provides a measure of the amount of water diffusion happening in a
specified area. MD is independent of the direction of the water. Low values for this
measure reflect low movement of water in a voxel, whilst high values reflect high
movement of water within a voxel. Low movement is due to water being restricted by tightly
packed cells or myelinated membranes, whilst increased movement can be due less cell
density or larger axon diameter. Conversely to FA values, a higher MD is therefore
indicative of less packed WM structure.
Figure 2.10. Mean diffusivity map. MD values for
diffusion in each voxel can be seen in the map, with
voxels with higher MD showing a greater intensity in the
map and voxels with lower MD less signal intensity.
2.3.4. Analysis methods of diffusion data
DTI scans can be used to obtain information regarding the microstructure of tissues with
an inherent directionality, such as the white matter of the brain. There are two common
ways of analysing DTI data: a region-of-interest (ROI) or voxel-based approach across the
whole brain and tractography.
2.3.4.1. Region-of-interest/voxel-based analysis
Both approaches look at measures of FA and MD within each voxel of a DTI scan and
compares them between groups. Methods such as voxel-based morphometry (VBM)
(Wright et al., 1995) and tract based spatial statistics (TBSS) (S. M. Smith et al., 2006)
compare voxel by voxel between groups and provide precise localisation and identification

50
of abnormalities in the microstructure of WM. However, both methods are limited by the
need of scans from multiple participants, which must be registered and aligned perfectly.
A collection of voxels can also be grouped together to form a ROI from which we can
average their FA and MD values and then compare this between subjects. ROI’s can be
defined manually or using automated software. The ROI approach is not free from
limitations and is dependent on the accuracy of the segmentation and restrict analysis to
specific regions on the basis of a priori predictions.
2.3.4.2. Tractography
The WM axons in the brain form tracts which structurally connect regions of grey matter
to one another. Information is transferred between brain regions along the WM tracts using
action potentials which enable different areas of the brain to interact and operate
coherently. The restrictions placed by the directionally-restrictive structure of the WM tracts
means that we can assume that the path of greatest diffusion occurs parallel to the tract
(where diffusion is less hindered). Tractography aims to reconstruct the tracts connection
ROIs along the principal diffusion direction. During the DTI data processing the PDD within
each voxel is recoded and this represents the path of greatest diffusion. Figure 2.11. shows
a colour coded representation of the principal diffusion direction of each voxel as well as
the colour label definition.
Figure 2.11. Diffusion Tensor
colour map.
The figure shows a diffusion
tensor map including the
principal diffusion direction of
each voxel and the colour
representation.
There are two tractography methodologies: deterministic and probabilistic. In the first one,
the principal diffusion direction of each voxel is used to determine the lines of connections

51
across voxels which form the pathway of the greatest diffusion. DTI tractography uses the
orientation of water diffusion (diffusion orientation density function, dODF) as a proxy for
the true WM fibre orientation known as the fibre ODF. Therefore, it estimates the most
likely fibre orientation, which carries an intrinsic grade of uncertainty. In order to reduce
some of the uncertainty, probabilistic tractography uses repeated sample in order to obtain
the probability of different white matter pathway and weighing each of them based on its
probability.
There are limitations to both methodologies, false positives can arise in probabilistic
tractography due to the inclusion of a range of likely pathways while deterministic
tractography is often associated with false negatives because it doesn’t take uncertainty
into account.
2.3.5. Limitation of the diffusion tensor model
There are limitations to the use of the diffusion tensor model which were identified early
on, the main one being how strongly it is affected by crossing fibres (which are present in
60% – 90% of WM) (Farquharson et al., 2013; Jbabdi, Behrens, & Smith, 2010; Jeurissen,
Leemans, Tournier, Jones, & Sijbers, 2013; Jones, Knösche, & Turner, 2013). Basser and
Pierpaoli, identified how their proposed measure of anisotropy was highly dependent on
the degree of coherence of fibre tract directions (Basser & Pierpaoli, 2011). Nonetheless,
the ability to study orientation information from living biological tissues in a non-invasive
way has made DTI one of the main tools in modern neuroimaging and has been
successfully used for both clinical and research purposes (Horsfield & Jones, 2002).
However, with the development of new techniques the limitations of the tensor model have
become more apparent and ways of overcoming some of the tensor model limitations have
been developed in the last few years. A number of techniques have been proposed: multi-
tensor fitting (Tuch et al., 2002), Q-ball imaging (Tuch, 2004), ball and sticks (Behrens,
Berg, Jbabdi, Rushworth, & Woolrich, 2007) and constrained spherical deconvolution
(Dell'Acqua et al., 2007; Dell'acqua et al., 2010; Dell'Acqua & Tournier, 2019; J. D.
Tournier, Calamante, & Connelly, 2007; J. D. Tournier et al., 2008).
There are however limitations to the use of these new methods and many studies remain
reliant on diffusion tensor model to provide microstructural measure (e.g. fractional

52
anisotropy, raid and axial diffusivities). This is due to the new fibre estimations methods
relied on the assumption that white matter fibres do not vary in their diffusion properties
between different tracts. The assumption is that any observed differences in the tensor-
derived measures are a result by partial volume effects (e.g. crossing fibres).
Figure 2.12. Example of modelling of the diffusion signal. Left: diffusion tensor model
provides information for a single fibre orientation. Right: multiple fibre orientations can be
visualised using a multi-fibre approach.
Figure 2.13. Example of DTI and spherical deconvolution tractography of the corpus
callosum. In the example, the lateral projections of the corpus callosum are lost using the
DTI model because they are interrupted by more dominant components of the
corticospinal tract.
53
For the purpose of this thesis only constrained spherical deconvolution will be described
as it is the method used in this thesis.
Constrained Spherical Deconvolution (CSD) (J. D. Tournier et al., 2007) estimates a white
matter fibre Orientation Distribution Function (fODF) based on an estimate of the signal
expected for a single-fibre white matter population (response function). This is used as the
kernel in a deconvolution operation to extract a white matter fODF from dMRI signal
measured within each voxel. For the white matter, the response function models the signal
expected for a voxel containing a single, coherently oriented bundle of axons (J. D.
Tournier et al., 2007; J. D. Tournier, Calamante, Gadian, & Connelly, 2004). In case of
multi-tissue variants of spherical deconvolution, response functions for other tissue types
are introduced as well; typically to represent grey matter(-like) and/or CSF(-like) signals
(Jeurissen, Tournier, Dhollander, Connelly, & Sijbers, 2014).
2.4. Neuroimaging findings in Eating Disorders
Brain imaging provides a way of understanding the living human brain and may help
elucidate neural mechanisms that are related to ED pathophysiology. Given the complex
interplay of psychosocial and neurobiological abnormalities in ED, the study of neural
mechanisms relevant to ED has been a complex one. Over the last few decades, a number
of neuroimaging tools have been developed allowing us to further our understanding of
neural mechanisms in ED and other psychiatric disorders. As seen in earlier sections, MRI
is commonly used to study brain gray and white matter volumes. With the development of
neuroimaging tools, we are now able to study measures of cortical thickness, surface area
and with the development of DTI we are also able to study white matter integrity. While the
above provide an understanding of the ‘make up’ of the brain, functional magnetic
resonance imaging (fMRI) (which measures changes in local blood flow and resulting
deoxyhemoglobin levels during brain activation) allows us to understand ‘function’ in the
brain both during tasks and while resting.
Imaging can further our knowledge of altered areas or networks based on ED phenotypes
and neurocognitive research. Hypotheses have been based on wondering if disturbances
of brain pathways are related to the modulation of feeding behaviours and reward? Or in
54
those that modulate factors related to body proprioception and thus may result in body
image distortion? Or could there be alterations in pathways related to cognitive control?
This chapter will focus on summarising neuroimaging findings in ED that can guide the
investigation in children at high risk for ED. While the methods used in this thesis focus on
volumetric and white matter integrity, functional imaging research provides information on
altered function that can help elucidate differences in structure. Therefore, this chapter will
review the current state of functional research in ED as well as volumetric and white matter
findings.
2.4.1. Structural/volumetric brain differences in patients with ED
A large number of studies investigating structural differences in patients with ED have
been undertaken since the mid – 90’s and structural changes have been observed in the
majority of studies investigating patients with AN. However, very little research has been
conducted in patients with BN and in general differences are not found between these
patients and healthy controls. Recently, there has been a wider interest in studying both
adolescents with a shorter illness duration and patients who are recovered with the aim of
further understanding whether the differences observed in acute patients are a
consequence of the (semi-) starvation during acute stages of the disorder or could reflect
a possible endophenotype for the disorder.
A few systematic reviews and meta-analysis of structural differences in individuals with AN
have been conducted. In 2013 a systematic review investigating the neurobiology of AN
was published by Phillipou and colleagues (Phillipou, Rossell, & Castle, 2014). The review
concluded that structural differences (reduced gray matter (GM) volumes and larger total
CSF volumes) are observed in most studies of patients with AN, and that these differences
are thought to reflect the effects of malnutrition. The review also included studies
investigating specific brain structures and found reduced GM in several regions,
particularly areas of the limbic system, including the amygdala, hippocampus and
cingulate cortex (areas that have been proposed to be involved in the processing of
emotions) (J. E. LeDoux, 2000).
55
A meta-analysis by Titova and colleagues (Titova, Hjorth, Schioth, & Brooks, 2013)
including 7 studies and a total of 126 patients with AN and 120 healthy controls, was
conducted in 2013 and found that acute patients with AN showed a global reduction in GM
(effect size = -0.66) and WM (effect size = -0.74) as well as increased cerebrospinal fluid
(effect size = 0.98). They also found a regional decrease in GM in left hypothalamus, left
inferior parietal lobe, right lentiform nucleus and right caudate. The meta-analysis only
included studies investigating structural differences using MRI and using a voxel-by-voxel
technique known as voxel-based morphometry (VBM) (Titova et al., 2013) The authors
used a meta-analysis technique called the activation likelihood estimation (ALE) used to
estimate consistent regional brain changes across different imaging studies (Laird et al.,
2005).
More recent meta-analyses of both acutely ill and weight recovered patients with AN have
been conducted by Seitz and colleagues (Seitz, Buhren, Von Polier, et al., 2014; Seitz,
Herpertz-Dahlmann, & Konrad, 2016). In the 2014 meta-analysis the authors calculated
standardised global changes in GM, WM and CSF and compared results separately for
acutely ill patients, weight-recovered patients (directly after weight-restoration, short term
recovery) and long term weight-recovered patients. In total, 13 studies were included that
reported changes in whole-brain volumes in acute AN patients (both adolescents and
adults) with a total of 214 patients and 213 healthy controls. In these patients, the meta-
analysis found that GM volume was on average reduced by 5.6% compared with HC; WM
volumes were on average reduced by 3.7% and CSF was increased by 12.9% compared
to HC. All results for acutely ill patients were significant. In total, 8 studies were identified
that reported changes in whole-brain volumes in long term recovered patients with AN with
a total of 177 patients and 195 controls. On average, the studies had a duration of weight
recovery of 4.4 years. The meta-analysis found that GM tended to remain reduced by
1.0%, as well as WM by 0.7% and CSF tended to remain increased by 1.3%. The
differences in long term weight recovered patients were lower than those found in the
acutely ill group and did not reach significance. In the group of studies that investigated
differences on patients with a short-term recovery (weight restoration), initial reductions in
GM volumes were found to be restored by 43%, WM volumes were completely restored
to normality and CSF increase was restored by 50%, when compared to initial changes in
acutely ill patients. Both WM and CSF differences between acutely ill and weight restored
were significant, however, GM deficit reduction did not reach significance. Interestingly,
this meta-analysis showed that studies on adolescent patients with acute AN showed
larger effects for changes in GM and CSF when compared to those of adults.
56
In their 2016 meta-analysis, Seitz and colleagues aimed to expand earlier findings as well
as differences between adult and adolescents patients. This second meta-analysis
included a larger number of studies, hence the power to detect differences was higher. In
total, 22 studies calculating whole brain volumetric differences in acutely ill AN patients
were found, of which 9 studied an adolescent population, with a total of 463 AN patients
(297 adults and 166 adolescents) and 450 HC (304 adults and 146 adolescents). Global
GM was found to be reduced by 4.6% (1% less than in their earlier meta-analysis), global
WM was found to be reduced by 2.7% (1% less that in their earlier meta-analysis) and
CSF was found to be increased by 14.2% (1.3% more than in their earlier meta-analysis).
All were found to be significant. As in their previous meta-analysis, adolescents showed
to have a more significant reduction of GM than adults (adolescents: -8.4% vs. adults:
3.1%, p = 0.02), both WM decrease and CSF increase was lower and higher respectively
between adolescents and adults but the differences were not significant. Six studies in
total were found reporting volumetric differences in short-term recovered AN patients, four
of which studied an adolescent sample, with a total of 121 AN patients and 87 HC. Global
GM was found to remain significantly reduced (3.6%, p = 0.02) and CSF significantly
increased (9.3%, p < 0.001). Ten studies were found reporting volumetric differences in
long-term recovered AN patients, only one of which studied an adolescent sample, with a
total of 255 patients and 257 HC. At this stage, the meta-analysis did not find any
significant volume changes, however, volumetric differences were still found between
patients and controls in the same direction as before. (GM: -0.4%, p = 0.34; WM: -0.7%, p
= 0.33; CSF: 1.0%, p = 0.29).
Overall, it has been well established that malnutrition plays a role in early findings of
decreased volume in gray and white matter in patients with ED, with the reduction being
mostly reversible with weight restoration (although small deficits cannot be ruled out as all
volumes remain partially changed even after long term recovery) (Seitz, Buhren, von
Polier, et al., 2014; Seitz et al., 2016; Wagner et al., 2006). However, although meta-
analyses are powerful statistical ways of analysing published data, it is important to note
specific findings as well. Although overall gray and white matter volumes have been found
to be reversed after recovery it is important to note that during acute illness stages these
volume alterations have been found to be correlated with neurocognitive deficits
(McCormick et al., 2008; Seitz et al., 2016; Seitz et al., 2015), with increased desire for
thinness (Joos et al., 2010) and linked to worse outcomes after one year (Seitz et al.,

57
2015). Therefore, we can’t rule out the role that reduced volume plays at different stages
of the illness or effects in chronic patients.
Differences in the reversibility of white vs. gray matter volume as well as differences
between adults and adolescents are also important to consider. Although more research
is being completed in adolescents, there is still less data available on long term recovered
brain volumetric differences (Seitz et al., 2016). Preliminary analyses showed good
reversibility of cortical gray matter reductions with remaining subcortical deficits (King et
al., 2015) in adolescents. Adolescents also showed a greater initial deficit compared to
adult patients. This might not be surprising given that the brain is continuing to mature
during adolescence and therefore may be more susceptible to adverse effects of AN.
While most studies have found a correlation between GM loss and low BMI, hypothesising
that GM loss is then likely due to starvation.
The underlying mechanisms for the reduction in brain volume during acute stages remains
unclear although various hypotheses have been studied such as fluid shifting from the
intra- to the extracellular space (Artmann, Grau, Adelmann, & Schleiffer, 1985), loss of
glial cells, or hormone alterations such as decreased leptin. A recent study by King et al
showed that a volume reduction solely based on fluid shifts may be unlikely after analysing
measures of serum and urine osmolarity (King et al., 2015). A recent study by Frintrop et
al (Frintrop et al., 2019) explored whether brain volume reduction in AN is associated with
astrocyte loss using an activity-based anorexia (ABA) model in rodents which includes
food reduction and exercise (running wheels) in female rats. The research found a loss of
GFAP-positive astrocytes (after a 3 week starvation period) which was then reversible
upon refeeding. Specifically, the authors found that cell reduction was derived from
reduced proliferation (rather than increased apopotosis). Interestingly, the authors found
that only white matter in the corpus callosum was still reduced after refeeding. Astrocytes
have been shown to play a role in synapse formation influencing learning and brain
plasticity (Molofsky et al., 2012; Panatier & Robitaille, 2012) and have been shown to be
implicated in mood and sleep disturbances. Given the role that astrocytes play in synapse
formation, it is possible that they could be responsible for the decrease in cognitive
flexibility and increased attention to detail found in patients with AN in the acute stage. In
chronic patients with long-term starvation, astrocyte loss could be in part responsible for
maintenance of symptomatology.

58
As established above, studies have found associations between clinical parameters (such
as BMI) and brain volumetric differences, however, the studied parameters are largely
heterogeneous making it difficult to draw any overall conclusions. Furthermore, most
studies to date have been conducted with relatively small samples. One of the most
reported associations is between GM and WM volume reductions and BMI, with mostly
studies in adolescents finding a negative correlation (Bomba et al., 2013; Fuglset,
Endestad, Landro, & Ro, 2015; Muhlau et al., 2007; Seitz et al., 2015).
Associations with other neuropsychological measures have also been studied. Castro-
Fornieles in 2009 found that GM volume decrease was associated with visuospatial
functioning in a sample of acutely ill adolescents (Castro-Fornieles et al., 2009).
McCormick and colleagues also found that reductions in Anterior Cingulate Cortex (ACC)
were associated with perceptual organization and reasoning skills in a sample of acutely
ill (McCormick et al., 2008) and Bodell and colleagues found that reduction in orbitofrontal
volume was negatively associated with reduced decision making skills (Bodell et al., 2014)
in acutely ill adults.
While brain gray matter deficits have been shown to largely recover, small deficits cannot
be ruled out as all volumes remain partially changed even after long term recovery (Seitz
et al., 2016). Some well-controlled studies have found larger frontal and subcortical
volumes (Samantha J. Brooks et al., 2011; G. K. Frank, Shott, Hagman, & Mittal, 2013; G.
K. Frank, M. E. Shott, J. O. Hagman, & T. T. Yang, 2013). Regional differences in GM and
WM have been established. A review by Van den Eynde and colleagues (F Van den Eynde
et al., 2012) suggested reduced GM volume in patients with AN in the insula, frontal
operculum, occipital and cingulate cortex, however, they highlighted a large level of
heterogeneity and inconsistencies across studies. In a well-controlled study for the effects
of malnutrition, Frank and colleagues (G. K. Frank, M. E. Shott, J. O. Hagman, & T. T.
Yang, 2013) found increased GM volume of the medial orbitofrontal cortex and increased
insula volumes (AN patients – ill and recovered- increased right side while BN patients
had increased left side) compared to healthy controls. Interestingly, dorsal striatum
volumes were reduced in BN and recovered AN and predicted sensitivity to reward in all
groups. Both the orbitofrontal cortex and the insula have been hypothesised to be central
for the development and/or maintenance of ED. The orbitofrontal cortex is of importance
for food intake control and could therefore be associated with food avoidance and be a
key structure in ED. In a recent publication, Frank (G. K. Frank, 2015) proposes that the

59
alterations in either side of the insula related to phenotypic presentation (restricting vs
binges), could play a role in either mediating feelings of fullness in BN (left side) and with
self-recognition and self awareness in AN (right insula). The cingulate cortex is another
commonly reported area of interest in ED (S. Gaudio et al., 2011; McCormick et al., 2008;
Muhlau et al., 2007) as well as the basal ganglia, both of which may play a role in emotion
regulation and reward.
Not many studies have investigated volumetric brain differences in patients with BN (Joos
et al., 2010; Schafer, Vaitl, & Schienle, 2010), however, the few that have, did not find
consistent differences between patients with BN and healthy controls. A recent review
(Donnelly et al., 2018) found a small number of consistent findings in patients with BN and
BED during the acute stage of the illness. The review included sixteen studies on
participants with BN, eleven studies on participants with BN and AN, three on participants
with BN and BED and two on participants with BED. These studies included a variety of
methods: MRI, fMRI, SPECT and/or PET. Only seven studies were conducted on
participants using MRI and the findings were mixed.
2.4.2. fMRI findings in patients with ED
As established earlier in the section, while this thesis will not study functional differences
in children at-risk, the functional literature allows us to explore hypothesis for altered
mechanisms in the development of ED and therefore this section will provide a brief
summary of findings and theories based on functional brain findings. Functional Magnetic
Resonance Imaging (fMRI) is a neuroimaging technique used to assess brain activity
associated with temporal changes in regional cerebral blood flow. This type of imaging can
be performed in conjunction with a task designed to elucidate neural areas correlated with
specific ED pathophysiology (e.g. decision making food-or other and body-image
perception). Resting-state fMRI (rsfMRI) has also become a widely-used tool that allows
to study brain function when at rest and have provided information of temporal correlations
between brain areas, based on spontaneous fluctuations of signals in the brain (Ugurbil,
2016). Through rsfMRI a number of resting-state networks (sets of brain areas that show
strong temporal coherence in the resting brain) have been identified and studied.

60
Fig. 2.14. Visual guide of brain regions implicated in ED symptomatology: based on fMRI findings.
Picture from Review Article: Steward et al. Neural Networks Alterations Across Eating Disorders: a
narrative review of fMRI studies (Steward, Menchon, Jimenez-Murcia, Soriano-Mas, & Fernandez-
Aranda, 2018).
Given the central role that food intake plays in ED, the study of mechanisms involved in
food intake has been of great importance in ED research. Food intake is driven by a
complex interplay of cognitive, emotional and energy homeostasis processes, part of
which are regulated by the brain reward system. Important brain regions that regulate
these processes are the insula, higher order brain centres such as prefrontal and cingulate
cortex (integrate cognition and emotions), orbitofrontal cortex (determines when to stop)
and the amygdala (associates stimuli with emotional experience) (Kent C. Berridge, 2009;
Kringelbach & Rolls, 2004; O'Reilly, 2006). Patients with ED have consistently shown
altered pathways when processing food images or tasting food. Most consistently research
has found altered responses to food images in the ventral striatum (in both AN and BN)
(W. H. Kaye, Wagner, Fudge, & Paulus, 2011; Phillipou et al., 2014). Studies have used
other stimuli to assess reward (such as monetary rewards and more recently reward in the
context of social stimuli) (Esther Via et al., 2015; Wagner et al., 2007) in order to help
understand if reward response is altered in stimuli unrelated to food.
Another area of interest in fMRI ED research has been cognitive control. It has been long
established that patients with AN show cognitive characteristics such as weak central
coherence and difficulties set-shifting (K. E. Smith et al., 2018) and personality traits such

61
as perfectionism (Fairburn et al., 2003) and obsessive compulsive traits (Cederlöf et al.,
2015; C. A. Levinson et al., 2019). In contrast, patients with binge-type ED display
difficulties in impulse control behaviours. Overall, patients with ED show alterations in
cognitive control which refers to processes related to mindful deployment of attention and
cognitive resources, including domains such as working memory, set shifting, decision
making and emotion regulation, all of which have been shown to be altered in some degree
in ED. Not many studies have directly studied specific aspects of cognitive control in ED,
although more research is being conducted.
Body image distortions have been of great interest in the study of ED given the central role
they play in its presentation. In fact, body image distortion has been hypothesised to
precede the onset of AN (Jacobi, Hayward, de Zwaan, Kraemer, & Agras, 2004) and its
persistence may determine poor outcome and relapses (P. K. Keel, Dorer, Franko,
Jackson, & Herzog, 2005). The behavioural components of the body image construct have
been outlined as covering three dimensions: perceptive (relative to detection of one’s body
size), affective (feelings that the individual develops towards their bodies’ appearance) and
cognitive (beliefs concerning body shape and appearance) (Thomas F. Cash & Deagle Iii,
1997). Alterations in self-perception in AN are hypothesised to be driven by cognitive
distortions regarding the patient’s own weight and shape and therefore their neurological
underpinnings have received a lot of attention, although mainly based on visual stimuli. A
number of regions have been found to show altered activation (either hyper – or hypo)
when presenting a patient with images of body shape, such as the fusiform gyrus,
precuneus, insula and areas of the prefrontal cortex (PFC) (Esposito, Cieri, di
Giannantonio, & Tartaro, 2018; S. Gaudio & Quattrocchi, 2012). Specifically, the
precuenus has been of great interest, although some fMRI studies have not obtained
differences in parietal lobe activations when comparing patients and HC (S. Gaudio &
Quattrocchi, 2012; Santino Gaudio & Riva, 2013; Nico et al., 2010; E. Via et al., 2018).
Gaudio and Quattrocchi in 2012 published a review of fMRI studies on body image in AN
including a total of 12 studies and proposed a model which conceptualized body image
distortion as consisting of three main components: perceptive, affective and cognitive.
They concluded that with regards to the perceptive component, the literature supported
that patients with AN may suffer from processing bias of self-body image identification with
associated neural alterations in the Inferior Parietal Lobule and the precuneus.
Interestingly, studies have shown that, when presented with images of other women
patients with ED showed increased activation in the amygdala (as well as increased
activation of parietal areas and thalamus). Higher activity in amygdala was suggested as
62
a neural correlate of negative emotional activation. Studies showing distorted images of
patients’ body were hypothesised to tap into the affective component and showed
involvement of the amygdala (although this has also been shown to be true for healthy
controls (Yoshie Miyake et al., 2010)). Significant activation of the prefrontal cortex and
insula has also been found during presentation of distorted body images in patients with
ED (Yoshie Miyake et al., 2010; Mohr et al., 2010; Wagner, Ruf, Braus, & Schmidt, 2003).
Resting-state fMRI analyses results have been consistent over studies (although
methodologies used varies greatly) identifying cortico-limbic network abnormalities in
patients with ED (S. Gaudio, Wiemerslage, Brooks, & Schioth, 2016). Gaudio and
colleagues recently published a systematic review including 15 published papers using
seed-based, whole-brain independent component analysis (ICA), network of interest ICA
and graph analysis approaches. Importantly the review identified that studies have
reported functional alterations in networks and/or areas that are relevant to AN phenotypic
presentation and in line with neurocognitive findings (impaired cognitive control and
flexibility, impaired visual and somatosensory integration).
Overall findings from volumetric and fMRI studies may offer some insight into the
development of more targeted treatment strategies focused on symptoms of impaired
cognitive flexibility and integration of visual/body signals.
2.4.3. Diffusion imaging findings in patients with ED
The majority of the research in neuroimaging in eating disorders has been structural and
functional, however, in the last few years, a growing number of studies have capitalized
on advances in MR technology with the introduction of DTI. To date, 15 studies have been
published using this method, the majority of which have been conducted in patients with
AN, with only two studies focused on BN. Before reporting results from the studies, it is
worth noting that to date most studies have been conducted using small samples and
using at least two different approaches to analysing the findings (voxel-based approach
and Tractography) resulting in mixed results. Studies have been conducted in adult and
adolescent samples as well as in acute and recovered. Initial findings from adult studies
show involvement of white matter microstructure in several areas of the brain including the
63
fornix, fronto-occipital fasciculus, cingulum, posterior thalamic radiation, thalamus,
superior longitudinal fasciculus, and cerebellum.
To date, no meta-analysis have been published, therefore Chapter 7 will be dedicated to
present the findings from the first meta-analysis I conducted with DTI findings from patients
with AN.
2.6. Interim conclusion
Overall, volumetric and functional differences in ED have been found in several brain
regions linked to overt symptoms of ED. However, the role that starvation plays in these
alteratios continues to be unclear, both during acute stages of the illness, particularly for
AN, and as a possible scar of the disorder once patients are recovered. Given the
complexity of ED it is clear that a complex interplay of neural mechanisms play a role in
its development and/or maintenance.
64
Chapter 3. Ph.D. Aims and methodological
considerations (familial high-risk study)
Sections of this chapter have been published in a book Chapter and the studies summaries
in the final table has been included in a systematic review currently under review for
publication.
3.1. Chapter overview
The aim of this chapter is to provide an overview of the methodological considerations for
the thesis. The previous chapters have provided an overview of the current neurocognitive
and neural profile findings in patients with ED. It is clear from gaps in the research that
there is a need to help understand what are scars and what could be traits for the disorder
and given the effects that ED have on both the brain and neurocognitive markers, it is
difficult to know what is considered ‘state’ (mainly due to undernutrition) and what could
constitute of possible ‘traits’. Findings from recovered patients have elucidated some of
the possible differences. One other way of disentangling these differences is to study a
group young enough to not have developed the disorder but with an increased risk for it
developing in the future. This chapter will introduce the potential of high-risk research
exploring endophenotypes and translational research and will give an overview of findings
from children at risk for ED.
3.2. The potential of high risk research
3.2.1. Heritability and genetic liability
There is indeed now a great deal of evidence indicating considerable genetic liability for
ED (Chapter 1); however, it is important that high risk studies in the field of ED are
conducted with a sample young enough not to have developed any serious ED concerns
or behaviours (Lee et al., 2007), making the children of women with a lifetime ED an ideal
high risk population for investigation.

65
3.22. Endophenotypes and the Research Domain Criteria (RDoC) initiative
In the last 10 years, the way in which we think of psychiatric diagnoses has started to
change, this was helped the introduction of a new initiative (Research Domain Criteria –
RdoC) developed by US National Institute of Mental Health. This initiative aims to be a
new framework that can add to the way we currently diagnose and think of psychiatric
disorders. The "RDoC is an attempt to create a new kind of taxonomy for mental disorders
by bringing the power of modern research approaches in genetics, neuroscience, and
behavioural science to the problem of mental illness" (Thomas R. & Jeffrey A., 2013).
Currently, the diagnosis of psychiatric disorders is based on overt symptoms that can be
observed through a clinical assessment. The Diagnostic Statistical Manual of Mental
Disorders (DSM) (APA, 2013), currently on version 5, and the International Classification
of Diseases (ICD), currently on version 10 offer a standard criteria for the classification of
psychiatric disorders based on a series of symptom criteria, including symptoms, duration
and impact on day-to-day life. However, in the last decades, research into psychiatric
disorders has seen a search for something to add to overt symptoms that can help
elucidate the development of disorders and risk makers, this has been aided with the
development of the study of biological and neuroscientific approaches.
A phenotype is defined as an observable characteristic, which can be the product of both
genetic and environmental influences. A large number of medical diseases have a genetic
base and therefore phenotypes are an expression of the genotype. However, in psychiatry,
where the causes are complex and where the genetics are not certain the relation between
phenotypes and genotypes is not simple. Epigenetics, involves genetic control by factors
other than the individual’s DNA sequence. Changes that interact with the genetic material
and, whilst they do not change the underlying sequence, they can change its expression
by indicating when genes should be turned on or expressed (Slatkin, 2009). These
epigenetic factors are also of great importance in modifying the development of
phenotypes. Although there have been great advances in the understanding of the human
genome, within the discipline of psychiatry there has been little success in identifying
underlying genes based on the current diagnostic criteria (Cloninger, 2002; Cowan,
Kopnisky, & Hyman, 2002).
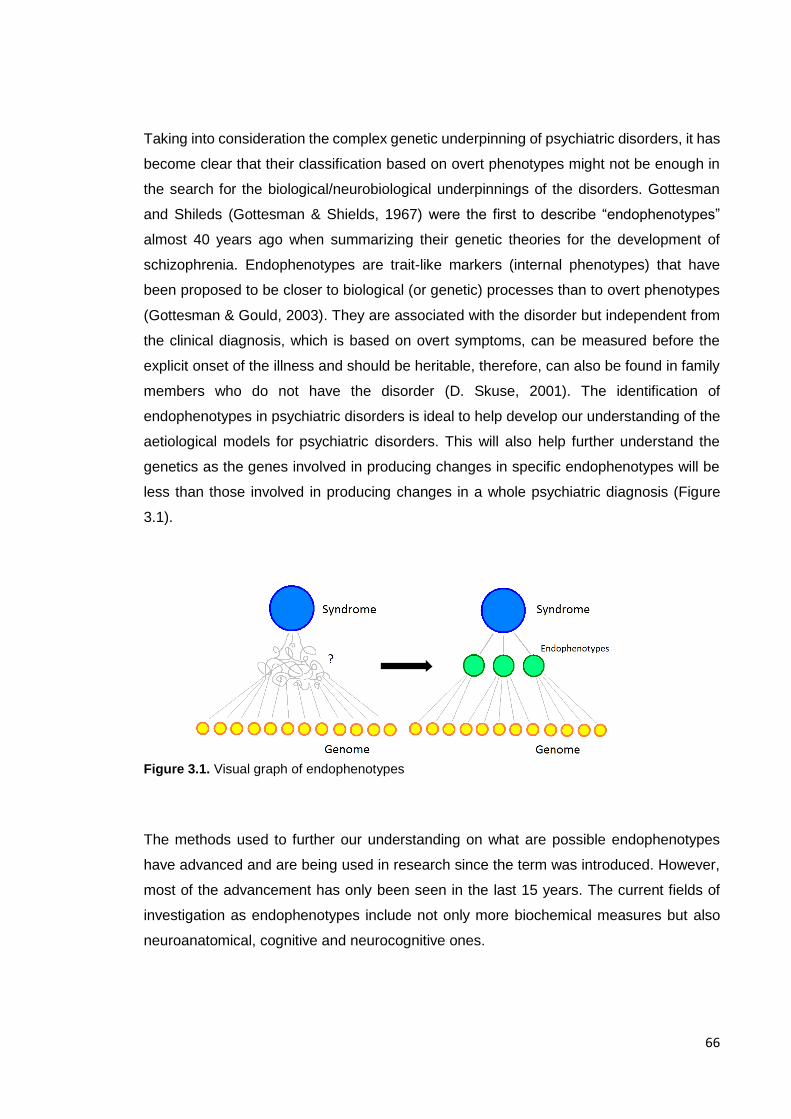
66
Taking into consideration the complex genetic underpinning of psychiatric disorders, it has
become clear that their classification based on overt phenotypes might not be enough in
the search for the biological/neurobiological underpinnings of the disorders. Gottesman
and Shileds (Gottesman & Shields, 1967) were the first to describe “endophenotypes”
almost 40 years ago when summarizing their genetic theories for the development of
schizophrenia. Endophenotypes are trait-like markers (internal phenotypes) that have
been proposed to be closer to biological (or genetic) processes than to overt phenotypes
(Gottesman & Gould, 2003). They are associated with the disorder but independent from
the clinical diagnosis, which is based on overt symptoms, can be measured before the
explicit onset of the illness and should be heritable, therefore, can also be found in family
members who do not have the disorder (D. Skuse, 2001). The identification of
endophenotypes in psychiatric disorders is ideal to help develop our understanding of the
aetiological models for psychiatric disorders. This will also help further understand the
genetics as the genes involved in producing changes in specific endophenotypes will be
less than those involved in producing changes in a whole psychiatric diagnosis (Figure
3.1).
Figure 3.1. Visual graph of endophenotypes
The methods used to further our understanding on what are possible endophenotypes
have advanced and are being used in research since the term was introduced. However,
most of the advancement has only been seen in the last 15 years. The current fields of
investigation as endophenotypes include not only more biochemical measures but also
neuroanatomical, cognitive and neurocognitive ones.
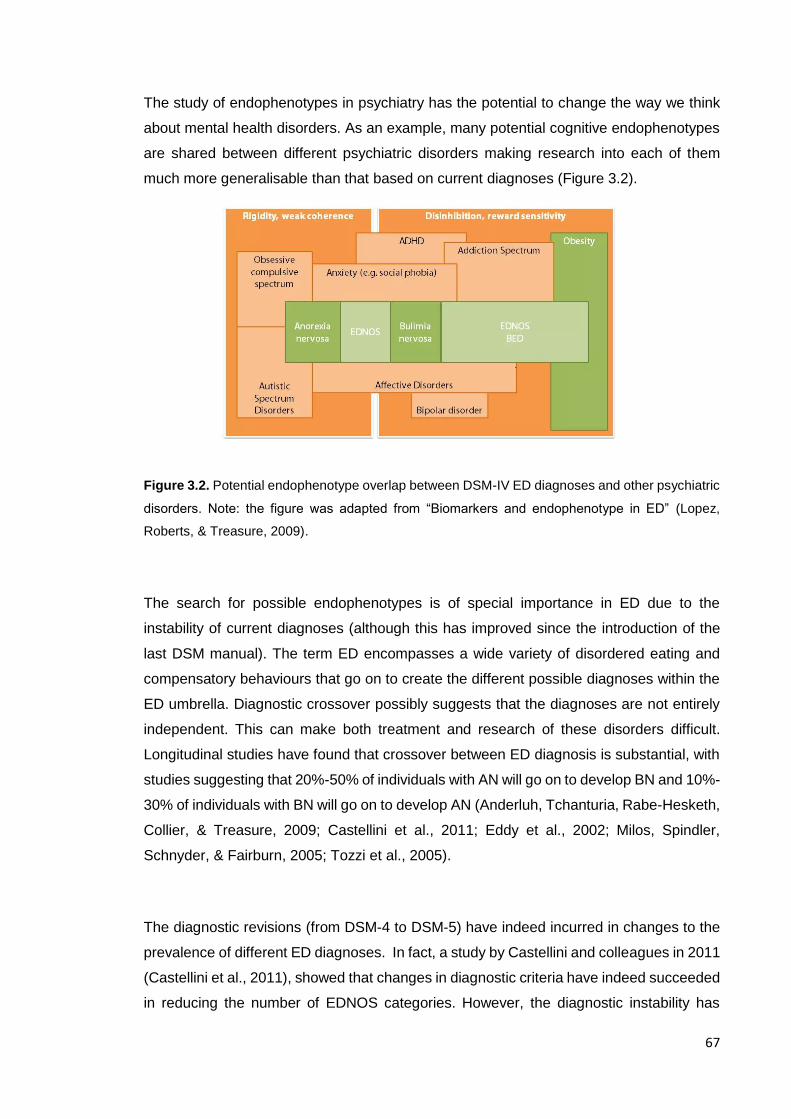
67
The study of endophenotypes in psychiatry has the potential to change the way we think
about mental health disorders. As an example, many potential cognitive endophenotypes
are shared between different psychiatric disorders making research into each of them
much more generalisable than that based on current diagnoses (Figure 3.2).
Figure 3.2. Potential endophenotype overlap between DSM-IV ED diagnoses and other psychiatric
disorders. Note: the figure was adapted from “Biomarkers and endophenotype in ED” (Lopez,
Roberts, & Treasure, 2009).
The search for possible endophenotypes is of special importance in ED due to the
instability of current diagnoses (although this has improved since the introduction of the
last DSM manual). The term ED encompasses a wide variety of disordered eating and
compensatory behaviours that go on to create the different possible diagnoses within the
ED umbrella. Diagnostic crossover possibly suggests that the diagnoses are not entirely
independent. This can make both treatment and research of these disorders difficult.
Longitudinal studies have found that crossover between ED diagnosis is substantial, with
studies suggesting that 20%-50% of individuals with AN will go on to develop BN and 10%-
30% of individuals with BN will go on to develop AN (Anderluh, Tchanturia, Rabe-Hesketh,
Collier, & Treasure, 2009; Castellini et al., 2011; Eddy et al., 2002; Milos, Spindler,
Schnyder, & Fairburn, 2005; Tozzi et al., 2005).
The diagnostic revisions (from DSM-4 to DSM-5) have indeed incurred in changes to the
prevalence of different ED diagnoses. In fact, a study by Castellini and colleagues in 2011
(Castellini et al., 2011), showed that changes in diagnostic criteria have indeed succeeded
in reducing the number of EDNOS categories. However, the diagnostic instability has

68
remained a crucial point for ED and therefore, the search for endophenotypes in ED has
become of more importance.
3.2. Comorbidities with EDs and the use of transdiagnostic research
The overlap of neurocognitive markers between a number of psychiatric disorders has also
motivated the search for endophenotypes. While these overlaps with other disorders have
been researched, and considered for a long time in ED, it is more recently that
comorbidities with other Axis I diagnoses have been considered in the search for
endophenotypes, specifically within neurocognitive and neural profiles. This section will
provide an overview of the current state of research in ED and overlap with other
psychiatric disorders as well as their potential for transdiagnostic research.
Comorbidities with other psychiatric disorders such as OCD (Cederlöf et al., 2015; W. H.
Kaye et al., 2004; C. A. Levinson et al., 2019; N. Micali, Hilton, et al., 2011; J. M.
Swinbourne & Touyz, 2007), other anxiety based disorders (Goddard & Treasure, 2013;
Cheri A Levinson & Rodebaugh, 2016; Schaumberg et al., 2019; J. Swinbourne et al.,
2012) and more recently autistic spectrum disorders (Heather Westwood & Tchanturia,
2017; Zhou et al., 2018) have been researched in ED and informed translational models
for the disorder.
Approaches within cognitive, behavioural and interpersonal frameworks have informed
psycho-social models for both the development and the maintenance of ED. Fairburn and
colleagues developed a transdiagnostic model in which they described perfectionism, low
self-esteem, low mood and interpersonal difficulties as possible factors maintaining ED
(Fairburn et al., 2003). Schmidt and Treasure have described a cognitive interpersonal
model, empathizing perfectionism, experiential avoidance, beliefs about the value of the
illness and interpersonal difficulties as maintaining factors, highlighting traits underpinned
by poor set-shifting and central coherence as well as social-emotional processing
difficulties which produce anxiety and encourage avoidance (Schmidt & Treasure, 2006;
Janet Treasure & Ulrike Schmidt, 2013).
The development of the study of neural and neurocognitive markers in psychiatry has led
to a better understanding of the overlap between ED and other disorders such as OCD
69
and ASD. This in turn has allowed for the investigation of underlying mechanisms that may
be common to these disorders. Both obsessive thinking, impulsivity and perfectionism
have been considered as intermediate traits, that could arise from cognitive processes
such as weak central coherence and cognitive inflexibility.
3.2.1. Anxiety based disorders
There is evidence in research of high comorbidity between anxiety based disorders and
ED (Godart et al., 2000; Godart, Flament, Perdereau, & Jeammet, 2002; J. I. Hudson,
Pope, Yurgelun-Todd, Jonas, & Frankenburg, 1987; W. H. Kaye et al., 2004; Perdereau,
Faucher, Jeammet, & Godart, 2007; J. Swinbourne et al., 2012). Several hypothesis have
been proposed, such as anxiety being a risk factor for ED; anxiety being secondary to the
development of an ED or a shared vulnerability between both disorders (Godart et al.,
2003b). In order to help clarify these hypothesis retrospective studies have been done
although they have their limitations given the way data was collected. Prospective studies
would help clarify the temporal relationship between both disorders, however these data
is difficult to obtain as it would require following patients up for a long period of time before
the develop the disorder. A large number of retrospective studies have reported onset of
social phobias (or elevated social anxiety traits) when comparing patients to the general
population prior to the onset of the eating disorder (Godart et al., 2002; W. H. Kaye et al.,
2004; Schaumberg et al., 2019). For example, Godart et al. (Godart et al., 2003b) studied
a group of women with ED and comorbid anxiety disorders and found that 47% had at
least one anxiety disorder prior to the onset of their ED. They did also find differences
based on the type of anxiety disorder (OCD, Generalise Anxiety Disorders (GAD), specific
phobias and social phobias). The authors found higher incidences of social phobia
(between 51.2% and 71.4% depending of ED type). In another study, Kaye et al found that
agoraphobia and panic were more commonly developed after the ED onset (W. H. Kaye
et al., 2004). Thinking back to the initial hypothesis, it is possible that ED could exacerbate
specific anxiety based disorders such as GAD and panic (possible due to starvations
effects) (Serpell, Livingstone, Neiderman, & Lask, 2002). It is however possible, that other
anxiety based disorders such as social phobia are present prior to the onset of ED and
play a role in its development.
An alternative explanation for the frequent comorbidity between anxiety based disorders
and ED is that rather than one causing the other, they both result from a common
70
vulnerability factor (Godart et al., 2003a). For example, rigid, obsessional and impulsive
behaviours are seen across ED types. Both impulsivity (trait leading to actions which are
not well conceived and prematurely expressed, or risky or inappropriate including
elements of dyscontrol, sensitivity to reward and poor planning) and compulsivity
(characterised by similar actions to impulsivity but leading to actions that may be
inappropriate for the given situation which persist and have no obvious relationship to the
goal) are also present in other psychiatric disorders such as OCD. The exploration of these
characteristics across psychiatric disorders has led to its transdiagnostic use across OCD
and ED. It has been found that first degree relatives of patients with ED, exhibit deficits in
cognitive flexibility and inhibition processes (Boisseau et al., 2012; Chamberlain et al.,
2007; Gruner & Pittenger, 2017; Shott et al., 2012; Talbot, Hay, Buckett, & Touyz, 2015;
K. Tchanturia, Davies, Roberts, et al., 2012; K. Tchanturia et al., 2014). In Treasure and
Schmidt’s cognitive interpersonal model for AN (Janet Treasure & Ulrike Schmidt, 2013),
they suggest that both obsessive compulsive and perfectionistic traits can increase
vulnerability towards developing AN, both of which are suggested to arise from cognitive
processing styles such as cognitive inflexibility and weak central coherence.
Whilst it is not clear if anxiety disorders are a risk factor for developing an ED, it is clear
that some traits in anxiety based disorders are present in ED and therefore studying
features that are common to both disorders can help further our understanding the
aetiology of these psychiatric disorders. Both impulsivity and compulsivity are features
shared between ED and disorders such as OCD. Compulsivity has been formulated as an
imbalance between behaviour that is guided by goals and behaviour that has become
habit. Both of which have been proposed to be mediated by the ventral medial prefrontral
cortex and the dorsal striatum respectively (Gillan & Robbins, 2014; Robbins, Gillan,
Smith, de Wit, & Ersche, 2012). The habit system uses information from past behaviours
and links the stimulus with a specific response which leads to repetition of behaviour,
leading to automatization of these behaviours (Graybiel, 2008). On the other hand, the
system guided by goals predicts outcomes based on their values and bases behaviours
on this (Dolan & Dayan, 2013). It has been suggested that compulsive behaviour results
from from an override of the influence of the habit system over the goal directed system
(Gillan, Robbins, Sahakian, van den Heuvel, & van Wingen, 2016). Based on this, it has
been hypothesised that food restriction may be a behaviour which is driven by the habit
system and could therefore be considered a compulsive behaviour (Godier & Park, 2014).
More recently, et al (Lloyd, Frampton, Verplanken, & Haase, 2017) extended Godier et

71
al’s model by suggesting a central role of anxiety which may contribute to the formation of
habit (Godier & Park, 2014).
3.2.2. ASD
Similarities between ED and ASD were first suggested in the 1980s (Christopher Gillberg,
1983), and since then, their temporal relationship has been studied, suggesting that ASD
may precede the onset of ED (Mandy & Tchanturia, 2015; Rastam & Gillberg, 1992). A
possible overlap between both behavioural and neurocognitive features has led to new
areas of research (Zucker et al., 2007), investigating specific neurocognitive functions
impaired in both such as cognitive flexibility and central coherence. As established earlier,
there is also a great overlap between social anxiety and ED, with social anxiety having
been suggested to precede ED (Godart et al., 2003b). Aspects of theory of mind (ability to
attribute mental states to oneself and others) which are a central characteristic of ASD,
have also been suggested to be altered in AN (Russell, Schmidt, Doherty, Young, &
Tchanturia, 2009). A recent meta-analysis found that patients with AN and those with ASD
showed a similar theory of mind profile, with the latter showing greater difficulties
(Leppanen, Sedgewick, Treasure, & Tchanturia, 2018). It has also been recently shown
that patients with AN may have greater difficulties with the implicit response (bias in the
interpretation) rather than the explicit labelling of the emotion (Cardi et al., 2017; Leppanen
et al., 2017), while people with ASD may have difficulties in the recognition of the emotion
(Uljarevic & Hamilton, 2013). Anhedonia (reduced feeling of pleasure from social
stimulation) and alexithymia (inability to identify and describe emotions in the self) have
both been found in ED and ASD and support difficulties in social interactions (Chevallier,
Grèzes, Molesworth, Berthoz, & Happé, 2012; K. Tchanturia, Davies, Harrison, et al.,
2012).
Zucker and colleagues (Zucker et al., 2007) investigated social cognitive endophenotypes
in AN using the roadmap of investigation followed into social cognitive processes in ASD
to guide their review (Figure 4.3). They proposed that exploring transdiagnostic similarities
with Autistic Spectrum Disorder (ASD) (which has social cognition deficits at its core) can
help draw a roadmap to understand social cognition differences in ED. Furthermore,
relative to AN, social information processing in ASD has been largely studied and therefore
we can draw from this knowledge to guide investigation in ED and provide a framework of
study. The authors identified premorbid traits of anxiety as well as comorbidities with ASD

72
(social withdrawal and rigidity as well as impaired social information processing), social
phobia and OCD (excessive rigidity).
Conclusions
Overall, it is clear that certain neurocognitive profiles, involving cognitive inflexibility,
central coherence, rigidity and aspects of social cognition difficulties are shared between
several psychiatric disorders and therefore could be considered shared vulnerabilities. The
study of these neurocognitive constructs and it’s correlated neural pathways can shed
more light into potential mechanisms involved in development and/or maintenance of ED.
3.3. Familial high-risk design in children at risk for Eating Disorders
One of the criteria for a measure to become an endophenotype is for it to heritable, and
therefore could be found in family members who does not have the disorder (D. Skuse,
2001). High-risk research refers to a method of studying the aetiology of a specific disorder
by investigating individuals who have an increased risk of developing that disorder.
Specifically in psychiatry, this method has been used to investigate the development or
possible development of psychopathology in children of parents with psychopathology
against children of parents without psychopathology. Since familial history of the disorder
has been found to be a consistent predictor for the development of the disorder, studies
of high-risk children provide an ideal method to identify premorbid vulnerability factors and
potential endophenotypes.
The high-risk design has been used to investigate a large number of possible
endophenotypes including cognitive function and brain volumetric differences as well as
structural and functional connectivity differences in groups at high risk for schizophrenia
(Chan, Di, McAlonan, & Gong, 2011; Eack, 2010; Gilmore, 2010; Snitz, MacDonald, &
Carter, 2006), autism (Bosl, 2011; Luyster, 2011; Tierney, Gabard-Durnam, Vogel-Farley,
Tager-Flusberg, & Nelson, 2012), and depression (Peterson et al., 2009), and progress is
being made in identifying markers of risk and therefore potentiating early diagnosis of
these disorders.

73
Although this method has been largely used in other psychiatric disorders, the same
cannot be said for the field of ED, where only recently more research has been undertaken
using this methodology. One of the reasons for this comes from the difficulty in studying
this group (ED) prospectively. Since the prevalence for the disorder is low, large samples
are needed in order to have enough people who will develop the disorder. However, it
could be considered that since there is a need for prospective studies in the field of ED in
order to better understand the poorly understood aetiology, this is in fact the field that
would benefit from studying a group of children who are more likely to develop the disorder.
By studying a group who has a higher risk of developing the disorder we would increase
the incidence of the disorder in the population studied.
As previously said, this methodology has been largely used in other psychiatric disorders
but only recently used to investigate potential risk mechanisms for ED. In the next section
I will provide a systematic review of the findings of any studies focused on understanding
the development of children at familial high-risk for ED and therefore potential risk
mechanisms for ED. It is worth noting that a large number of the studies published have
been conducted by our team.
As a summary, all studies reviewed were included when the exposure studied was
mothers diagnosed with any form of ED (AN, BN or BED) either active or past; and where
the outcome was a measure of the child’s development assessed from birth until
adolescence. Overall a large number of studies have assessed child’s development in
relation to feeding/eating, as this is at the core of the ED. However, recently more studies
have focused on studying general development, temperament, cognitive development and
psychopathology in this group.
For a simpler overview of these studies, below is a summary of findings for each outcome
studied and a table summarising aspects of these studies as well as main findings for each
of them.
3.2.1. Feeding
Classified as feeding, this category includes studies investigating feeding, diet patterns,
nutritional intake and interaction during mealtimes (N. Micali, Simonoff, Stahl, & Treasure,
2011; Nadia Micali, Simonoff, & Treasure, 2009; Reba-Harrelson et al., 2010; Alan Stein,
Woolley, Cooper, & Fairburn, 1994; Whelan & Cooper, 2000). Overall, the studies found
that feeding problems appear to be present amongst infants of mothers with ED, however,
74
it is important to note that the use of different measures to assess feeding practices makes
it difficult to generalise.
Two cohort studies conducted by Micali and colleagues (N. Micali, Simonoff, et al., 2011;
Nadia Micali et al., 2009) studied infants of mothers with a past or present ED during the
first few months and up to a year after birth and found that mothers reported more
difficulties in their child’s feeding practices. Stein and colleagues also reported that mother-
infant interactions during mealtimes and play was affected, with mothers with current or
past ED being more negative and less facilitating in their observational study (Alan Stein
et al., 1994). Amongst three to four year olds (Reba-Harrelson et al., 2010; Whelan &
Cooper, 2000) several studies found strong associations between feeding difficulties and
maternal ED. The remaining two papers measured the nutritional intake and dietary
patterns in infants of mothers with ED (Easter et al., 2013). When compared to controls
Easter’s et al. study showed that children of mothers with ED had a more ‘health
conscious/vegetarian’ diet.
In conclusion, the studies showed that maternal ED is a predictor of eating difficulties in
their offspring. However, it is important to note that most of the studies relied on maternal
report to measure child feeding difficulties and therefore, we cannot discard the possibility
that the children have no problems in their feeding practices but that the mothers who
might be more concerned with feeding are in fact perceiving their child as more difficult
when he or she is not. Although this is a possibility, it is an important fact to note as this in
the long turn could affect the child’s feeding practices.
3.2.2. Psychological/emotional development and psychopathology
Classified as psychological and psychopathology development, this section includes five
studies (Barbin et al., 2002; Cimino, Cerniglia, Paciello, & Sinesi, 2013; S. Cimino,
Cerniglia, & Paciello, 2015; Nadia Micali, Bianca De Stavola, George B. Ploubidis, Emily
Simonoff, & Janet Treasure, 2014; N. Micali, Stahl, Treasure, & Simonoff, 2013). Overall,
not many studies have focused on this, however, of those that have done, most found
significantly higher psychological and emotional difficulties as well as higher indices of
psychopathology in children of mothers with ED.
75
Both Cimino and Barbin used the children behaviour checklist (CBCL) to assess
internalising and externalising behavioural/emotional characteristics in children. Cimino
found higher scores of emotional-adaptive, internalising and externalising problems in
children of mothers with ED, whilst Barbin only found significantly higher levels in children
of depressed mothers. However, he did find that mothers with ED reported more significant
pregnancy and birth complications, parenting stress, and symptoms of clinical depression
when compared to the control group. Cimino found that externalising problems in children
of mothers with ED increased with age.
Further studies have investigated psychopathology in children of mothers with ED, and the
results support earlier results found in the previous studies, pointing to an effect of
maternal ED in children’s emotional and psychopathology development. Two large cohort
studies by Micali and colleagues (Nadia Micali et al., 2014; N. Micali et al., 2013) found
that maternal ED strongly predicted emotional and anxiety disorders in children at ages
seven, ten and thirteen. Micali and colleagues used the Strengths and Difficulties
Questionnaire (SDQ) (Goodman, 1997) and the Developmental and Wellbeing
Assessment (DAWBA) (Goodman, Ford, Richards, Gatward, & Meltzer, 2000) to assess
psychopathology at the different ages. Specifically, they found gender was predictive of
conduct problems, hyperactivity/inattention but not emotional problems. They also found
maternal disorder and gender specific results, where girls of mother with AN were more
likely to have emotional, conduct and hyperactivity problems, whilst girls of mothers with
BN were more likely to have hyperactivity and inattention problems. Boys of mothers with
AN were at higher risk for emotional problems whereas boys of mothers with BN were also
at higher risk for conduct problems. Importantly, higher odds of psychopathology were
found in all cases in children of mothers with ED.
3.2.3. Cognitive development
More recent studies have focused on cognitive development in children of mothers with
ED (R. Kothari, Barona, Treasure, & Micali, 2015; Radha Kothari, Rosinska, Treasure, &
Micali, 2013; R. Kothari, Solmi, Treasure, & Micali, 2012). Although only few studies have
focused on cognitive and neuropsychological development, they have yielded interesting
results with regards to possible endophenotypes for the disorder. Kothari and colleagues
(R. Kothari et al., 2012) found that children of mothers with AN had higher full-scale and
performance IQ, increased working memory capacity and decreased attentional control

76
when compared to children of control mothers. Children of mothers with BN were found to
have lower scores in object assembly (WISC) which suggests poor visual organisational
ability and poor visual motor coordination. Social cognition was also studied in children of
mothers with ED (R. Kothari et al., 2015) showing differential patters of cognition for
children born to mothers with different ED diagnoses. The Social Communication
Disorders Checklist (SCDC) (D. H. Skuse, Mandy, & Scourfield, 2005), the Diagnostic
Analysis of Non Verbal Accuracy (DANVA) and the Emotional Triangles (ET) were used
to assess social cognition. The SCDC is a questionnaire that assessed social trait
characteristics where higher scores above a cut-off have been found to be predictive of
ASD. In the study it was children of mothers with bingeing and purging disorders who were
found to have higher scores in the SCDC. The DANVA was used to assess facial emotion
recognition and ET was used to assess the ability to attribute an emotional state to an
inanimate object (a little triangle in a screen). For both tests, children of mothers with
bingeing and purging disorders had higher odds of misattributing emotion in faces and
showed poorer recognition of fear in ET. Overall, the study found that children of mothers
with bingeing and purging subtypes were at higher risk for social cognition difficulties. The
findings are in line with previous research showing social cognitive style characteristics as
being specifically associated with binge-purge subtypes of ED vs. restrictive subtypes
(Troop & Bifulco, 2002). The authors concluded that social cognition difficulties could
contribute to the development of binge/purge disorders. Interestingly, there is a large
number of studies that have observed deficits in social communication and interpersonal
function in patients with AN, and therefore suggest a possible link between the disorders.
Kothari and colleagues did not find any social communication difficulties associated with
a restrictive (AN type) pattern (R. Kothari et al., 2015). One possible explanation is that
social communication difficulties in patients with AN could be a result of low weight in these
patients which therefore only develops after the onset of AN. However, more studies are
needed in order to better understand the associations between ED and social
communication difficulties.

77
Table 3.1. Summary of findings from studies investigating children at familial high-risk for ED
Study, design Participants: n, age (SD),
diagnoses and recruitment Results
Stein et al;
Case-control
Total n = 58.
Cases recruited from community
(any ED disorder)
Negative expressed emotion was more frequent among the case mothers compared to controls during mealtimes but not during play
Mothers with ED were less facilitating during both mealtimes and play, had significantly more conflict with infants.
Case infants were rated as less happy than the controls during both mealtime and play No significant differences on either mental or motor scales
Waugh et al.
Case-control
Total n = 20
Cases recruited from community
(Any ED disorder)
Two case mothers chose not to breastfeed prior to the birth of their child: one due to embarrassment and one due to being depressed
Rate of 6 case and 10 control children being breastfed till weaning was statistically significant
Case children consumed significantly more sodium and thiamin than the control children Mothers with ED made significantly less positive eating comments
Whelan et al.
Total n = 128
Clinical group (any ED disorder)
Children in the feeding problem group were rated as significantly more disturbed than the disturbed comparison and control group (feeding disturbances such as refusal, faddiness and spitting)
Child disturbance
Severity of child disturbance was not related to the relationship between feeding problems
and maternal ED
Blisset et al
Total n = 96
Clinical group (BN)
Eating psychopathology did not explain mealtime negativity in boys Eating psychopathology failed to explain mealtime negativity in girls Food refusal
Eating psychopathology failed to explain food refusal in boys Eating psychopathology added significantly to the variance explained in food refusal of girls*
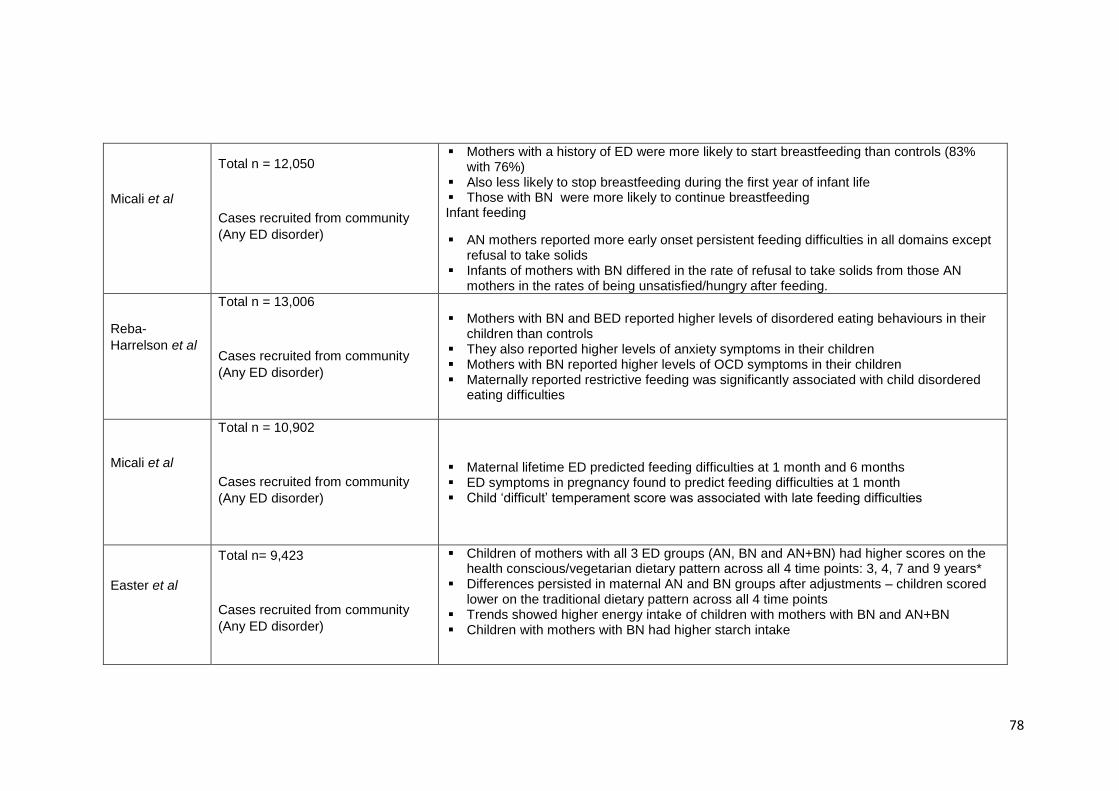
78
Micali et al
Total n = 12,050
Cases recruited from community
(Any ED disorder)
Mothers with a history of ED were more likely to start breastfeeding than controls (83% with 76%)
Also less likely to stop breastfeeding during the first year of infant life Those with BN were more likely to continue breastfeeding Infant feeding
AN mothers reported more early onset persistent feeding difficulties in all domains except refusal to take solids
Infants of mothers with BN differed in the rate of refusal to take solids from those AN mothers in the rates of being unsatisfied/hungry after feeding.
Reba-
Harrelson et al
Total n = 13,006
Cases recruited from community
(Any ED disorder)
Mothers with BN and BED reported higher levels of disordered eating behaviours in their children than controls
They also reported higher levels of anxiety symptoms in their children Mothers with BN reported higher levels of OCD symptoms in their children Maternally reported restrictive feeding was significantly associated with child disordered
eating difficulties
Micali et al
Total n = 10,902
Cases recruited from community
(Any ED disorder)
Maternal lifetime ED predicted feeding difficulties at 1 month and 6 months ED symptoms in pregnancy found to predict feeding difficulties at 1 month Child ‘difficult’ temperament score was associated with late feeding difficulties
Easter et al
Total n= 9,423
Cases recruited from community
(Any ED disorder)
Children of mothers with all 3 ED groups (AN, BN and AN+BN) had higher scores on the health conscious/vegetarian dietary pattern across all 4 time points: 3, 4, 7 and 9 years*
Differences persisted in maternal AN and BN groups after adjustments – children scored lower on the traditional dietary pattern across all 4 time points
Trends showed higher energy intake of children with mothers with BN and AN+BN Children with mothers with BN had higher starch intake

79
de Barse et al
Total n = 4,851
Cases recruited from community
(Any ED disorder)
Mothers with a history of ED used less pressure to eat than mothers without Mothers with a history of AN were likely to use low levels of pressure to eat Children of mothers with an ED had higher levels of emotional overeating than controls –
this was strongest with mothers with a history of AN
Torgersen et al
Total n = 46,628, mean age = 29.6
(4.6)
Cases recruited from community
(Any ED disorder)
Percentages of mothers breastfeeding at 6 months: BN (79%), BED (76%), EDNOS-P (59%), AN (58%), no-ED (82%)
Infants of mothers with BN had significantly lower odds of being in the homemade traditional food class than the commercial jarred baby food class
Infants of mothers with BED were significantly less likely to be in the homemade vegetarian food class than the commercial jarred baby food
Evans and le
Grange
Total n = 20
Cases (AN and BN)
Positive correlation found in both case and control groups between mothers’ satisfaction with their body size and their children’s satisfaction with their own weight and shape
Mothers in the clinical group complained of not feeling successful in breastfeeding Infants in the clinical group were schedule fed – this rigid adherence caused some
confusion and anxiety for mothers when their infants displayed signs of hunger outside the recommended feeding times
Half the children were described by their mothers as displaying behavioural difficulties such as hyperactivity, avoidant behaviour, enuresis, insecure attachment, depression, fears, personality problems, stuttering, violent temperament and oppositional defiant behaviour
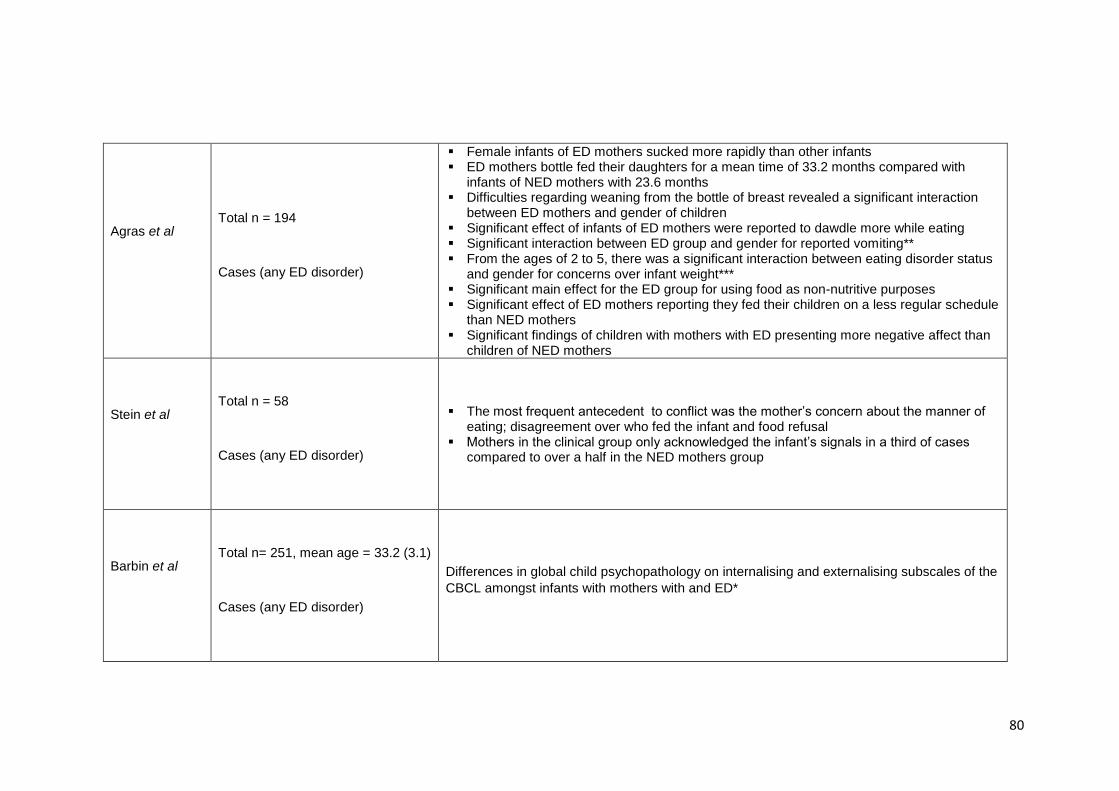
80
Agras et al
Total n = 194
Cases (any ED disorder)
Female infants of ED mothers sucked more rapidly than other infants ED mothers bottle fed their daughters for a mean time of 33.2 months compared with
infants of NED mothers with 23.6 months Difficulties regarding weaning from the bottle of breast revealed a significant interaction
between ED mothers and gender of children Significant effect of infants of ED mothers were reported to dawdle more while eating Significant interaction between ED group and gender for reported vomiting** From the ages of 2 to 5, there was a significant interaction between eating disorder status
and gender for concerns over infant weight*** Significant main effect for the ED group for using food as non-nutritive purposes Significant effect of ED mothers reporting they fed their children on a less regular schedule
than NED mothers Significant findings of children with mothers with ED presenting more negative affect than
children of NED mothers
Stein et al
Total n = 58
Cases (any ED disorder)
The most frequent antecedent to conflict was the mother’s concern about the manner of eating; disagreement over who fed the infant and food refusal
Mothers in the clinical group only acknowledged the infant’s signals in a third of cases compared to over a half in the NED mothers group
Barbin et al
Total n= 251, mean age = 33.2 (3.1)
Cases (any ED disorder)
Differences in global child psychopathology on internalising and externalising subscales of the
CBCL amongst infants with mothers with and ED*
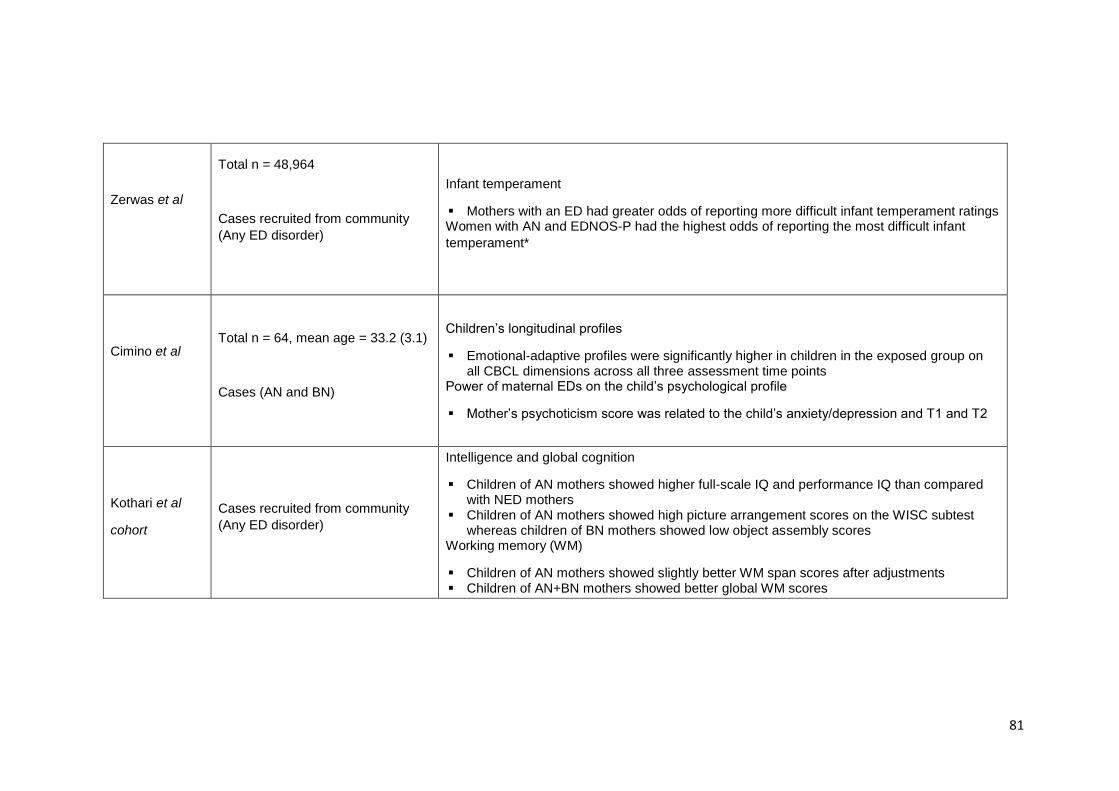
81
Zerwas et al
Total n = 48,964
Cases recruited from community
(Any ED disorder)
Infant temperament
Mothers with an ED had greater odds of reporting more difficult infant temperament ratings Women with AN and EDNOS-P had the highest odds of reporting the most difficult infant
temperament*
Cimino et al
Total n = 64, mean age = 33.2 (3.1)
Cases (AN and BN)
Children’s longitudinal profiles
Emotional-adaptive profiles were significantly higher in children in the exposed group on all CBCL dimensions across all three assessment time points
Power of maternal EDs on the child’s psychological profile
Mother’s psychoticism score was related to the child’s anxiety/depression and T1 and T2
Kothari et al
cohort
Cases recruited from community
(Any ED disorder)
Intelligence and global cognition
Children of AN mothers showed higher full-scale IQ and performance IQ than compared with NED mothers
Children of AN mothers showed high picture arrangement scores on the WISC subtest whereas children of BN mothers showed low object assembly scores
Working memory (WM)
Children of AN mothers showed slightly better WM span scores after adjustments Children of AN+BN mothers showed better global WM scores
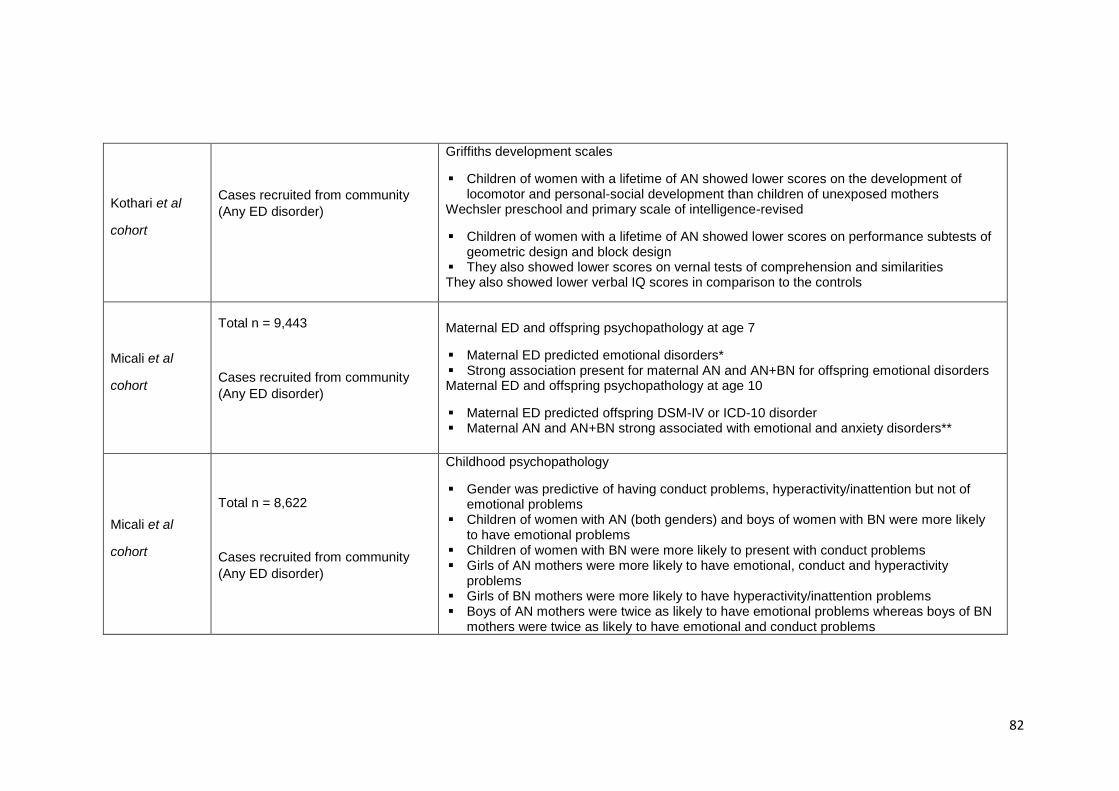
82
Kothari et al
cohort
Cases recruited from community
(Any ED disorder)
Griffiths development scales
Children of women with a lifetime of AN showed lower scores on the development of locomotor and personal-social development than children of unexposed mothers
Wechsler preschool and primary scale of intelligence-revised
Children of women with a lifetime of AN showed lower scores on performance subtests of geometric design and block design
They also showed lower scores on vernal tests of comprehension and similarities They also showed lower verbal IQ scores in comparison to the controls
Micali et al
cohort
Total n = 9,443
Cases recruited from community
(Any ED disorder)
Maternal ED and offspring psychopathology at age 7
Maternal ED predicted emotional disorders* Strong association present for maternal AN and AN+BN for offspring emotional disorders Maternal ED and offspring psychopathology at age 10
Maternal ED predicted offspring DSM-IV or ICD-10 disorder Maternal AN and AN+BN strong associated with emotional and anxiety disorders**
Micali et al
cohort
Total n = 8,622
Cases recruited from community
(Any ED disorder)
Childhood psychopathology
Gender was predictive of having conduct problems, hyperactivity/inattention but not of emotional problems
Children of women with AN (both genders) and boys of women with BN were more likely to have emotional problems
Children of women with BN were more likely to present with conduct problems Girls of AN mothers were more likely to have emotional, conduct and hyperactivity
problems Girls of BN mothers were more likely to have hyperactivity/inattention problems Boys of AN mothers were twice as likely to have emotional problems whereas boys of BN
mothers were twice as likely to have emotional and conduct problems
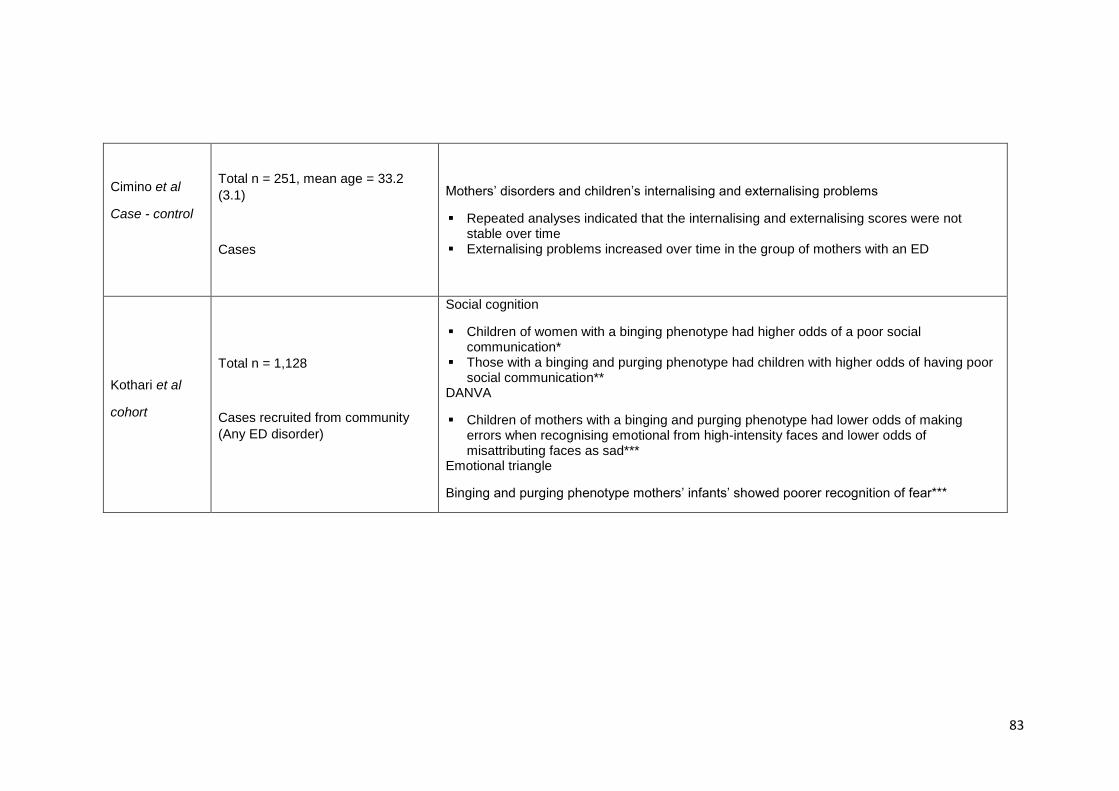
83
Cimino et al
Case - control
Total n = 251, mean age = 33.2
(3.1)
Cases
Mothers’ disorders and children’s internalising and externalising problems
Repeated analyses indicated that the internalising and externalising scores were not stable over time
Externalising problems increased over time in the group of mothers with an ED
Kothari et al
cohort
Total n = 1,128
Cases recruited from community
(Any ED disorder)
Social cognition
Children of women with a binging phenotype had higher odds of a poor social communication*
Those with a binging and purging phenotype had children with higher odds of having poor social communication**
DANVA
Children of mothers with a binging and purging phenotype had lower odds of making errors when recognising emotional from high-intensity faces and lower odds of misattributing faces as sad***
Emotional triangle
Binging and purging phenotype mothers’ infants’ showed poorer recognition of fear***

84
3.3. General aims
The general aim of the PhD is to investigate psychopathology, neurocognitive and neural
profile of children at familial high risk of developing eating disorders. In the studies included
in the PhD, high risk status was defined as being born to a mother with ED. The studies
conducted include two different samples which will be described in detail below. This
chapter aims to provide details on both samples, including recruitment, measures, MRI
protocol and additional information from both study samples.
This will be achieved through the completion of the following objectives:
1.1.1. To study psychopathology in children at familial-high-risk for eating disorders in
a large community sample (Study one).
1.1.2. To further our understanding of white matter microstructural differences in
patients with ED to inform hypotheses of risk in children at high-risk (Study two).
1.1.3. To pilot the investigation of brain structural and diffusion parameter patterns as
well as neurocognitive function in children at familial-high-risk for eating
disorders (Study three). This study includes (a) study of neurocognitive function;
(b) study of cerebellar and subcortical volumetric differences and (c) study of
whole brain and region of interest white matter differences.
Study one:
Psychopathology and early cognitive development in children at high risk for
developing an eating disorder (Chapter 5)
The aim of this study was to investigate the early cognitive development of children at high
risk for eating disorders and whether they were at risk for developing other mental health
disorders. For this study data was collected from a large cohort study (Danish National
Birth Cohort) and the high risk status of children was defined via self-report of an ED
diagnosis by the mother. The children of mothers who had self-reported ever having an
ED were compared to the children of mothers who had not.
Study two:
85
Meta-analysis of white matter microstructure differences in patients with Anorexia
Nervosa (Chapter 6)
The aim of this chapter was to systematically review and meta-analyse the literature on
white matter microstructure in patients with ED.
Study three:
Neurocognitive differences in children at risk for ED: findings from BREDS (Chapter
7)
The aim of this study was to investigate whether children at high risk for developing ED
showed differences in their neurocognitive profile when compared to children at low risk
(of mothers without an ED). Data on maternal lifetime ED was collected using a structured
interview and data on neurocognitive profile was collected using the following tasks: WASI
(General intelligence), CANTAB (motor processing, inhibition control, set-shifting, risk
taking behaviour, sustained attention and visual working memory), Reading the Mind in
the Eyes (social cognition), Morphed Emotion Identification and BIS/BAS (reward).
Subcortical and cerebellar volumetric differences and amygdala connectivity in
BREDS (Chapter 8)
The aim of this study was to investigate whether children at high risk for developing an ED
showed differences in brain volume when compared to children at low risk (children of
mothers without an ED). Data on maternal lifetime ED was collected using a structured
interview and data on children’s brain volume and regional cortical thickness was collected
using a T1 weighted scan using a Magnetic Resonance Imaging (MRI) scanner.
White matter microstructure whole brain and ROI differences in children at familial
high-risk for ED (Chapter 9)
The aim of this study was to investigate whether children at high risk for developing an ED
showed differences in white matter microstructure when compared to children who are not
at high risk. For this study high risk status in children was defined as the presence of a
maternal ED over their lifetime. Data on maternal lifetime ED was collected using a
structured interview and data on children’s brain volume and regional cortical thickness

86
was collected using Diffusion Tensor Imaging (DTI) in an MRI scanner. Differences in
whole brain white matter microstructure and region of interest tractography were studied.
Final conclusions (Chapter 10)
Final summaries of each result chapters, as well as conclusions, theoretical implications
and future work are presented in this chapter. Overall limitations and considerations
including thoughts on recruitment and controlling for multiple comparisons.

87
Chapter 4. Methodology
4.1. Sample 1: The Danish National Birth Cohort (DNBC)
Methodology for sample 1 will be described in detail within the results chapter (Chapter 5).
4.2. Sample 2: Brain in high-Risk for Eating Disorders Study (BREDS)
4.2.1. Study overview
The Brain in children at high-Risk for Eating Disorders Study (BREDS) in an observational
prospective pilot study of daughters of women with a current or a history of an eating
disorder.
Children at high-risk and controls were recruited from different ethical approval
applications and NHS sites across London from 2015 until 2017. Figures 4.2 and 4.3
outlines participant recruitment.
Figure 4.1. Cases contacted and percentage of recruitment outcome. Concluded: patients
consented and who took part (N=17; 52%); excluded: met one of exclusion criteria (N=1;
screened positive for ED) (3%); did not consent to take part (N=6; 18%); no answer after
providing details (N=7; 21%); initial interest but did not sign consent form (N=2; 6%).
52%
3%
18%
21%
6%
Cases (Total contacted = 33)
Concluded
Excluded
Did not consent
No answer
Withdrew consent
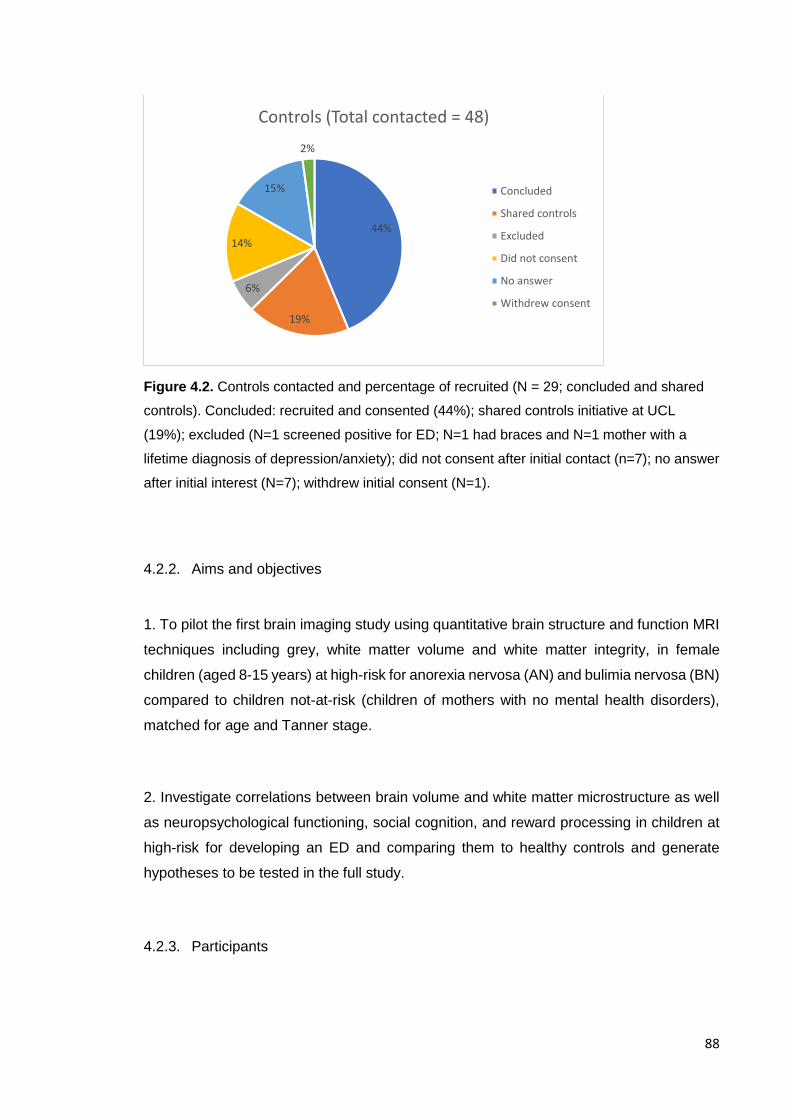
88
Figure 4.2. Controls contacted and percentage of recruited (N = 29; concluded and shared
controls). Concluded: recruited and consented (44%); shared controls initiative at UCL
(19%); excluded (N=1 screened positive for ED; N=1 had braces and N=1 mother with a
lifetime diagnosis of depression/anxiety); did not consent after initial contact (n=7); no answer
after initial interest (N=7); withdrew initial consent (N=1).
4.2.2. Aims and objectives
1. To pilot the first brain imaging study using quantitative brain structure and function MRI
techniques including grey, white matter volume and white matter integrity, in female
children (aged 8-15 years) at high-risk for anorexia nervosa (AN) and bulimia nervosa (BN)
compared to children not-at-risk (children of mothers with no mental health disorders),
matched for age and Tanner stage.
2. Investigate correlations between brain volume and white matter microstructure as well
as neuropsychological functioning, social cognition, and reward processing in children at
high-risk for developing an ED and comparing them to healthy controls and generate
hypotheses to be tested in the full study.
4.2.3. Participants
44%
19%
6%
14%
15%
2%
Controls (Total contacted = 48)
Concluded
Shared controls
Excluded
Did not consent
No answer
Withdrew consent
89
Women and their daughters (between the ages of 8 and 15) were recruited. The sample
included women with a history or a present ED and their healthy daughters. The healthy
control sample was formed by mothers with no history of an ED or any other psychiatric
disorder and their healthy daughters.
4.2.3.1. Recruitment
Several recruitment methods were used to recruit for the study: Initially, UCL ethics were
obtained which allowed recruitment from the general population using posters, emails,
social media, eating disorders societies (BEAT, Charlotte Helix) and a large university
database that the PI had been involved in establishing. E-mails were sent to staff and
students at UCL. A later amendment to initial ethics allowed for recruitment to be
conducted through posters not only in the university but in different cafes and parks in
London. Social media (Facebook, Twitter and eating disorders blogs) were also used to
promote the study with the help of the eating disorder experts in the community. Webpages
visited by mothers were also utilised to post questionnaires and assess possible
participation in the study (such as netmums, mumsnet, Dulwich forum). A third amendment
was requested to extend the UCL ethics and be able to recruit through schools. Personal
contacts were used to contact several schools as well as the Schools in mind network.
Information on the study was published in schools’ newsletters with contact details.
After a year of slow recruitment, NHS ethics were drafted to be able to recruit from ED
clinics. Once NHS ethics were granted, recruitment was attempted through the following
NHS sites: SLAM, Vincent Square, St. Anns, Oxford health and Southern Health. In order
to aid with recruitment, regular attendance of meetings in each of the sites was
established. Only 2 mothers with a current ED were included through NHS sites. A further
5 showed initial interest but did not take part.
Finally, a webpage was developed in order to aid recruitment and Google Adwords were
used to drive activity to the webpage. A total of 5 mothers with a history of ED were
recruited through the webpage, with 3 contacted but no consent was granted.
90
Recruitment related documents, including ethics approvals and webpage screenshots can
be found in the C and D. Overall, recruitment for the study was complex and this will be
discussed in the final discussion chapter.
4.2.4. Demographics
Mothers were asked to report information on demographics during the day of testing. Data
on maternal age, education, ethnicity and marital status was gathered.
Mothers were asked to report their acquired education using a likert scale with the
following possible answers: (1) No formal qualifications; (2) no qualifications higher than
CSE or GSCE level; (3) A-level or equivalent; (4) Higher qualifications. Due to the low
number of mothers with low qualification level and for ease of use in statistical analysis,
the variable was dichotomized into two categories: (0) qualifications up to A levels; (1)
Higher qualifications. All mothers responded/ reported full information.
Mothers were asked to report their marital status using a likert scale with the following
possible answers: (1) Single (no partner); (2) Single (with partner); (3) Cohabitating; (4)
Married. Due to most mothers being in the last category and for ease of use in statistical
analysis, the variable was dicothomized into two categories: (0) single (partner and no
partner); (1) cohabitating or married.
Mothers were asked to report their ethnicity using a likert scale with the following possible
answers: (1) White (British or other), (2) Black African, (3) Black Caribbean, (4) Asian
(Indian, Pakistani, Bangladeshi), (5) Chinese, (6) Other. Due to most mothers being the
first category and for ease of statistical analysis, the variable was dicothomized into two
categories: (0) white; (1) other.
4.2.4.1. Tanner stages of development
Mothers were asked a set of questions with regards to their daughters development,
including menarche. Pubertal development was assessed through a set of questions and
pictures (Marshall & Tanner, 1969) (Appendix E). The questionnaire involves two pages
91
with a set of scaled drawings depicting external sex characteristics such as size of breasts
and development of pubic hair. Participants can select between 6 options depending on
the stage of development they are currently in. A series of questions were also developed
regarding menstrual periods.
4.2.4.1. Analyses of demographics
The distribution of the demographics was studied according to the main predictor using
chi-square (for categorical variables) and F-tests (for continuous variables) in order to
provide a comparison between exposure groups. No differences were found between
groups in maternal education, ethnicity and age. Both groups were matched in terms of
child’s age and development (Table 4.1.).

92
Table 4.1. Demographic group comparisons dependent on distribution of variable.
ED (N = 17) Unexposed (N = 20) Statistic
Maternal education
Up to A levels 3 (17.6%) 1 (5%) χ2 = 1.524, p = 0.217
Higher education 14 (82.4%) 19 (95%)
Maternal ethnicity
White 14 (82.4%) 17 (85%) χ2 = 0.047 p = 0.217
Other ethnicity 3 (17.6%) 2 (15%)
Child development
Menarche yes 9 (52.9%) 11 (55%) χ2 = 0.016, p = 0.900
Menarche no 8 (47.1%) 9 (45%)
Breast Development (6 stages) χ2 = 5.200, p = 0.392
Pubic Hair Development (6 stages) χ2 = 6.448, p = 0.265
Maternal age 44 (5.48) 45.55 (5.34) t = 0.87, p = 0.39
Childs’ age 11.94 (2.14) 12.25 (1.94) t = 0.46, p = 0.65

93
4.2.3. Screening and psychopathology
4.2.3.1. Screener questionnaire
The screener questionnaire contained questions assessing both eating disorders and
other psychiatric disorders (anxiety and depression) in mothers and children. The
questions were extracted from the Structured Clinical Interview for Axis I DSM-IV
Disorders (SCID-I) (First, Gibbon, Spitzer, Williams & Janet, 2002) screener questionnaire
to assess the need to complete a more detailed assessment. If any of the girls screened
positive for an ED they were excluded (2 participants were excluded after endorsing
questions in the ED screener). Further investigations were done using the DAWBA in order
to assess other mental health.
4.2.3.2. ED diagnosis
ED diagnosis was determined at baseline using the Structured Clinical Interview for Axis I
DSM-IV Disorders (SCID-I) (First, Gibbon, Spitzer, Williams & Janet, 2002). The SCID-IV
is a semi-structured diagnostic interview used to determine Axis I DSM-V disorders
(American Psychiatric Association, 2000). The measure is formed by a series of open
ended questions on the presence of ED symptoms (i.e. restricting, bingeing or purging)
and cognitions (i.e. fear of fatness or denial of low weight). The measure also uses a series
of skip rules in order to only ask for relevant questions. The SCID-IV has a high inter-rater
reliability for the diagnosis of ED, with kappa being reported between 0.61 and 0.77
(Lobbestael, Leurgans & Agntz, 2010).
For the present study, we were interested in a lifetime history of ED symptoms, therefore
relevant questions were repeated at appropriate times to determine the timeline of
presence of symptoms.
Of the 17 recruited mothers, 14 had a history of AN while 3 had a history of BN.
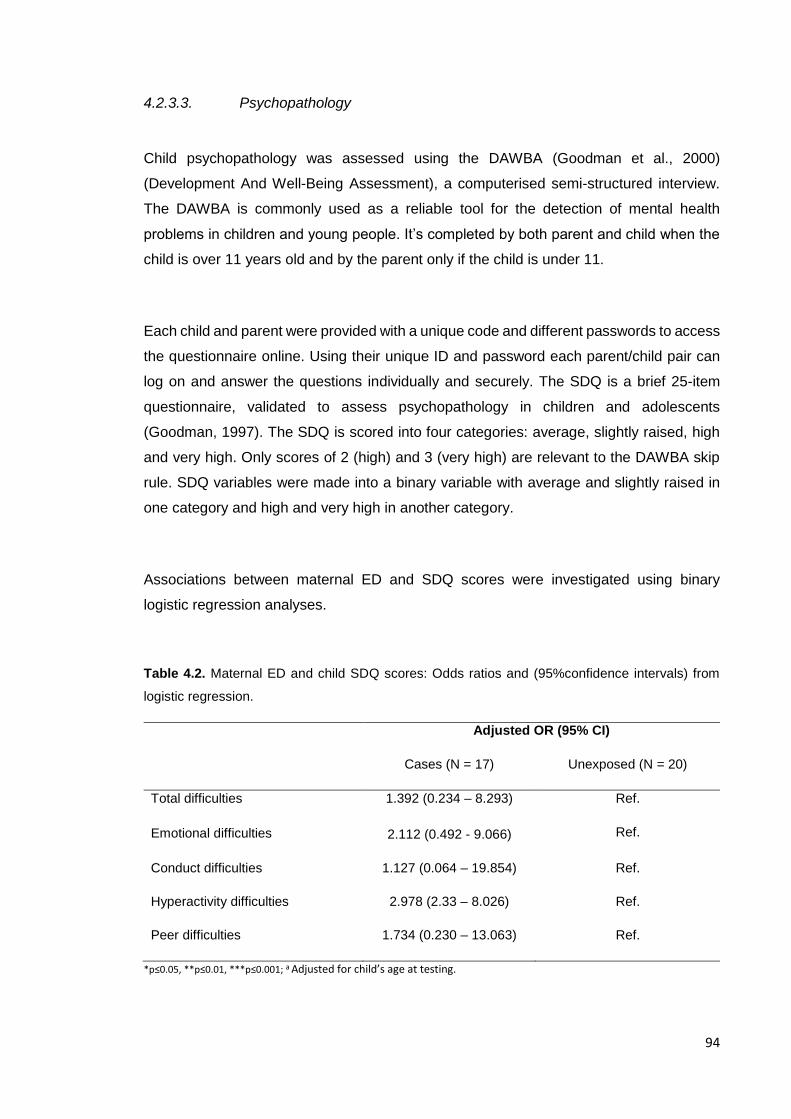
94
4.2.3.3. Psychopathology
Child psychopathology was assessed using the DAWBA (Goodman et al., 2000)
(Development And Well-Being Assessment), a computerised semi-structured interview.
The DAWBA is commonly used as a reliable tool for the detection of mental health
problems in children and young people. It’s completed by both parent and child when the
child is over 11 years old and by the parent only if the child is under 11.
Each child and parent were provided with a unique code and different passwords to access
the questionnaire online. Using their unique ID and password each parent/child pair can
log on and answer the questions individually and securely. The SDQ is a brief 25-item
questionnaire, validated to assess psychopathology in children and adolescents
(Goodman, 1997). The SDQ is scored into four categories: average, slightly raised, high
and very high. Only scores of 2 (high) and 3 (very high) are relevant to the DAWBA skip
rule. SDQ variables were made into a binary variable with average and slightly raised in
one category and high and very high in another category.
Associations between maternal ED and SDQ scores were investigated using binary
logistic regression analyses.
Table 4.2. Maternal ED and child SDQ scores: Odds ratios and (95%confidence intervals) from
logistic regression.
Adjusted OR (95% CI)
Cases (N = 17) Unexposed (N = 20)
Total difficulties 1.392 (0.234 – 8.293) Ref.
Emotional difficulties 2.112 (0.492 - 9.066) Ref.
Conduct difficulties 1.127 (0.064 – 19.854) Ref.
Hyperactivity difficulties 2.978 (2.33 – 8.026) Ref.
Peer difficulties 1.734 (0.230 – 13.063) Ref.
*p≤0.05, **p≤0.01, ***p≤0.001; a Adjusted for child’s age at testing.

95
In order to minimise the time involvement of both parents and child, the DAWBA has skip
rules which apply depending on the answers given to the questions.
- Initially the parent/child answers a set of questions which form the Strengths and
Difficulties Questionnaire (SDQ) (Goodman, 1997). The SDQ is then scored by the
program and was used to inform the use of the skip rules for each section (only positive
scores of 2 or more in the SDQ sections are relevant to the DAWBA skip rule).
- The parent/child then goes on to complete each of the sections. In each section, they
complete two or three screening questions at the beginning, if the screening questions
are positive or they initially reported problems in the SDQ then the interview continues
and the parent/child will see the rest of questions. However, if they respond negatively
to the screener questions then the questions for that specific section end there and the
entire section is skipped.
- If they go on to complete the entire section, they are then asked in detail about the
presence or severity of symptoms in that specific domain. If the symptoms are present
the rest of the interview continues, however, if they are not then the rest of the section
might be omitted. Questions regarding how long the symptoms have been present and
when they started are also asked. At the end of the section there is a question
regarding the impact of symptoms on the child and family.
The following sections are included in the DAWBA:
- Separation anxiety
- Specific phobias
- Social phobias
- Panic attacks and agoraphobia
- Post Traumatic Stress Disorder
- Compulsions and obsessions
- Generalized anxiety
- Depression
- Attention and activity
- Awkward and troublesome behaviour
- Eating disorders
96
Once the questionnaire is completed, the program generates the probability of DSM5
psychiatric diagnosis. The full questionnaire is then reviewed by a clinician who rates the
probability of disorder and provides a final DSM5 diagnosis.
For this study, the full DAWBA was rated blindly by a researcher (Psychiatrist) who is not
involved in the recruitment or testing of participants.
While the questionnaire is confidential, it is explained to both child and mother that if there
are any answers that depict risk to the young person or others, confidentiality would be
broken an with the mother or appropriate services would be contacted. If necessary,
referrals to appropriate services could be done. Only one participant endorsed questions
with regards to a history self-harm which were discussed with the PI and with the mother.
4.2.4. Cognitive testing
4.2.4.1. Global intelligence
Intelligence and Global Cognition was assessed using the Wechsler Abbreviated Scale of
Intelligence II (WASI-II)(Wechsler, 2011), a quick and reliable measure of intelligence and
global cognition that has been well validated in a variety of populations (Irby & Floyd,
2013). The WASI comprises of four individual tests that together assess full-scale IQ
(FSIQ). Two of the four tests go on to form the Verbal IQ (VIQ) score and the other two go
on to form the Performance IQ (PIQ) score.
- VIQ is formed by Vocabulary and Similarities:
o Vocabulary: participants are given several words and are asked to give a
definition for them in their own words. This test measures semantic
knowledge and verbal comprehension and expression.
o Similarities: participants are given two words or concepts and are asked to
describe in which way they are similar. This test measures abstract verbal
reasoning and semantic knowledge.
97
- PIQ is formed by Block Design and Matrix Reasoning:
o Block Design: This test measures visual spatial processing and problem
solving as well as visual motor construction.
o Matrix reasoning: this test measures nonverbal abstract problem solving
and inductive reasoning.
4.2.4.1. Neurocognitive function
Neurocognitive Function was assessed using the CANTAB computerised tests of cognition
(for test demonstrations see www.cambridgecognition.com). The tests were assessed
using a tablet with the downloaded tests. Children were seated in front of the tablet and
were instructed to carry out the test by touching the screen. Before each test the
researcher explained the detailed instructions (following a script provided by the software
developers) and asked if the child had understood, then proceeded to demonstrate the
test allowing the child to do a practice test. All tests were run in the same mode for every
child. Children were given short breaks whenever needed (between tests), and beverages
were provided when requested.
One of the advantages of CANTAB is the number of outcome measures available through
the software. Not all available outcome measures were used for analyses – only
appropriate ones based on a priori hypotheses.
The following subtests were be used:
Motor Screening Test (MOT)
This task is a good introduction to the CANTAB touchscreen, and also assesses whether
the participant has any sensorimotor and/or comprehension limitations that may limit
collection of valid data. Participants are required to touch a flashing cross that appears on
different locations on the screen.
Administration time: 2 minutes

98
Outcome measures: (1) Speed of response
(2) Accuracy of pointing
All participants completed this test.
Affective Go/No-go (AGN)
This task is an assessment of information processing biases for positive and negative
stimuli. Over a series of blocks the participant is presented with a series of words from
three categories: positive (i.e. joyful), negative (i.e. hopeless), or neutral (e.g. element).
Words from two categories are presented during each block, and the participant is required
to press the pad when they see a word matching a given target category.
Administration time: 10 minutes
Outcome measures: 12 outcome measures are provided which represent latency, and
errors of commission and omission.
All participants completed this test.
Cambridge Gambling Task (CGT) – minimum age 11 years old
This task assesses decision-making and risk-taking behaviours, outside of a learning
context. During the task the participant is shown a row of ten red and blue boxes, and has
to guess whether a yellow token is hidden in a red or blue box. The participant is given a
number of points, which are shown to be rising or falling in each trial, and they are able to
gamble a chosen proportion of these points based upon their confidence in their guess
(gambling stages). The goal is to accumulate as many points as possible. The task
dissociates “risk-taking” from “impulsivity” due to a condition in which making a risky bet
99
requires the participant to wait patiently for it to appear (the ascending bet condition when
the points are rising).
Administration time: up to 30 minutes
Outcome measures: (1) Risk taking
(2) Quality of decision making
(3) Deliberation time
(4) Risk adjustment
(5) Delay aversion
(6) Overall proportion bet
Only 10 girls at high genetic risk were old enough to complete the test and 17 girls of
healthy control mothers were also old enough to complete the test.
Attention Switching Task (AST)
This task assesses the participant’s ability to switch attention between an arrow’s location
and direction, and their ability to ignore task-irrelevant information in the face of interfering
or distracting events. The arrow can be displayed either on the left or the right side of the
screen, and can be pointing towards the left or the right. A cue at the beginning of each
screen indicates whether a participant is required to press left or right according to the
direction or the location of the arrow. In some trials information is congruent (arrow on right
side of screen and pointing right), and in others information is incongruent, requiring higher
cognitive demand. The task measures top-down cognitive control and is associated with
the prefrontal cortex.
Administration time: 8 minutes

100
Outcome measures: Response latencies and error scores reflecting attention switching
ability and interference of task irrelevant information (i.e. Stroop-like effect).
All participants completed this test.
Rapid Visual Information Processing (RVP)
This task is a sensitive measure of sustained attention in which digits from 2 to 9 appear
in a pseudo-random order at the rate of 100 digits per minute. Participants are required to
detect target sequences of digits (i.e. 2-4-6, 3-5-7, 4-6-8).
Administration Time: 10 minutes
Outcome measures: nine outcomes measures reflecting response accuracy, target
sensitivity, and reaction times.
All participants completed this test.
Spatial Working Memory (SWM)
This task requires the participant to retain and manipulate visuospatial information, and
measures strategy and memory errors. In each trial the participant is shown a number of
boxes and through a process of elimination is required to find the one that contains a blue
token. The number of boxes increases through trials.
Administration time: 8 minutes
Outcome measures: 24 outcome measures are provided reflecting errors, strategy, and
latency.
4.2.4.2. Social cognition

101
Social cognition was assessed using the Reading the mind in the eyes (Baron Cohen)
(Baron-Cohen et al., 2001) and Morphed Emotion Identification. Both tasks were
completed in a computer using a web based experiment designed for research use (L.
Germine et al., 2012) initially developed at Harvard University and which is currently
managed by the non-profit Many Brains Project, the Laboratory for Brain and Cognitive
Health Technology at McLean Hospital & Harvard Medical School, and the Human
Variation Lab at Wellesley College .
Reading the mind in the eyes (RME)
RME measures social cognition by presenting the child with a series of 25 standardized
photographs of the eye region of different male and female faces for a total of three
seconds. Participants were presented with 36 pictures of the eye region and were given a
forced choice question between four different mental states under each eye caption
(Figure 4.3). The participant has to decide which mental state best describes what mental
state the eyes depict. Test-retest reliability estimates are acceptable (Olderbak et al.,
2015).
Figure 4.3. Reading the Mind in the Eyes web caption.
Morphed emotion identification
The task uses morphed face stimuli adapted from tests previously used in depression,
schizophrenia and psychosis research (Bediou et al., 2007; Bediou et al., 2005; L. T.
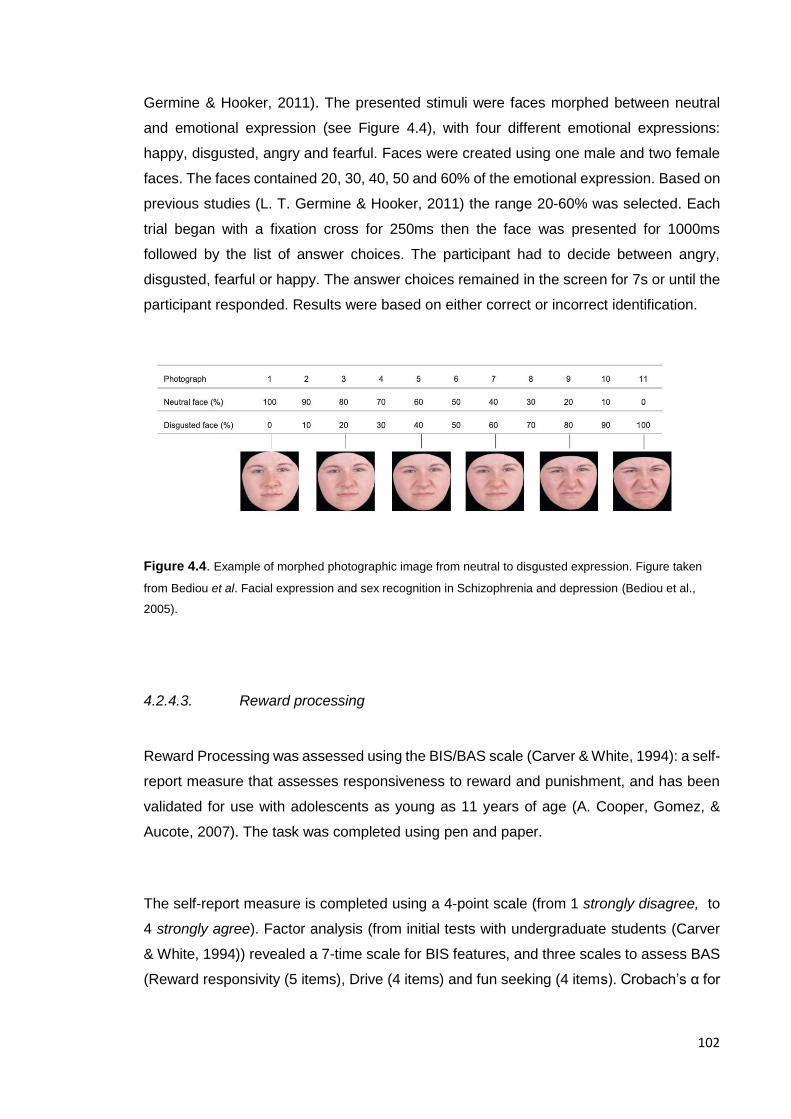
102
Germine & Hooker, 2011). The presented stimuli were faces morphed between neutral
and emotional expression (see Figure 4.4), with four different emotional expressions:
happy, disgusted, angry and fearful. Faces were created using one male and two female
faces. The faces contained 20, 30, 40, 50 and 60% of the emotional expression. Based on
previous studies (L. T. Germine & Hooker, 2011) the range 20-60% was selected. Each
trial began with a fixation cross for 250ms then the face was presented for 1000ms
followed by the list of answer choices. The participant had to decide between angry,
disgusted, fearful or happy. The answer choices remained in the screen for 7s or until the
participant responded. Results were based on either correct or incorrect identification.
Figure 4.4. Example of morphed photographic image from neutral to disgusted expression. Figure taken
from Bediou et al. Facial expression and sex recognition in Schizophrenia and depression (Bediou et al.,
2005).
4.2.4.3. Reward processing
Reward Processing was assessed using the BIS/BAS scale (Carver & White, 1994): a self-
report measure that assesses responsiveness to reward and punishment, and has been
validated for use with adolescents as young as 11 years of age (A. Cooper, Gomez, &
Aucote, 2007). The task was completed using pen and paper.
The self-report measure is completed using a 4-point scale (from 1 strongly disagree, to
4 strongly agree). Factor analysis (from initial tests with undergraduate students (Carver
& White, 1994)) revealed a 7-time scale for BIS features, and three scales to assess BAS
(Reward responsivity (5 items), Drive (4 items) and fun seeking (4 items). Crobach’s α for
103
the BIS and BAS scales in the derivation sample were 0.74, 0.73, 0.76 and 0.66
respectively.
The scales measure the following constructs:
- Behavioural Inhibition System (BIS): sensitivity to punishment.
- Behavioural Action System (BAS):
o Reward responsiveness: anticipation or occurrence of reward.
o Drive: pursue of desired goals.
o Fun seeking: desire of new rewards and impulsive approach to potential
rewards.
4.2.5. MRI scanning
Patients and controls were scanned on a Siemens Avanto 3T clinical MRI system at Great
Ormond Street Hospital (GOSH) using a 64-channel head coil by experienced research
radiographers. An MRI safety questionnaire (Appendix F) was completed prior to scanning
in order to screen for MRI-incompatible conditions, such as pregnancy or the presence of
non-MR-safe medical implants, and to ensure the removal of any loose metallic objects.
Recruited subjects were scanned with the following MRI protocol with a total duration of
45 minutes. The imaging protocol consists of three sequences; T1 MPRAGE, diffusion
MRI and resting-state fMRI. A movie was playing during the acquisitions of all sequences
except from when the resting-state images were being acquired. Analysis of the T1-
weighted and diffusion-weighted data were completed as part of this thesis. All T1-
weighted and diffusion-weighted data were visually inspected for abnormalities, motion
and other artefacts during scanning procedures. When possible, sequences were
repeated in the scanner (with consent from the child) in order to adjust for movement.
Abnormalities were discovered in one scan.
fMRI data was analysed separately by a post-doctoral researcher at Mount Sinai, NY,
therefore the results from this data will not be included or discussed in this thesis.
104
An extra nine participants MRI data was include in the study from a shared control data
initiative in the department. Information on exclusion/inclusion criteria was obtained by a
researcher who contacted participants using our initial screener questionnaire.
All neuroimaging data was analysed with extensive help and supervision from members
of the Neuroimaging department who played an instrumental role in designing pipelines
for analyses and checking results.
All scans were converted from DICOM to NIfTI format using TractoR version 3.3.0
(Clayden et al., 2011) (http://www.tractor-mri.org.uk). The TractorR software includes R
packages for reading, writing and visualising MRI images and it also includes functions
designed for working with diffusion MRI and Tractography.
4.2.5.1. T1-weighted scans
The T1- weighted 3D MPRAGE (Magnetization Prepared Rapid Acquisition Gradient Echo)
scan was acquired using the following parameters: flip angle=8°; TR=2300ms;
TE=2.74ms; TI=909ms; voxel size=1x1x1mm3; field of view=256mm; slice
thickness=1mm.
Freesurfer
Following conversion to NIFTI, volumetric segmentation and cortical surface
reconstruction was performed with the FreeSurfer image analysis suite (version 6.0. for
Linux, documented at the website: https://surfer.nmr.mgh.harvard.edu/). FreeSurfer is a
software package for the analysis and visualization of both structural and functional
neuroimaging studies and has been described in technical detail previously (Fischl, Liu, &
Dale, 2001; Fischl et al., 2002; Fischl, Salat, et al., 2004; Fischl, van der Kouwe, et al.,
2004; Han et al., 2006; Jovicich et al., 2006; Segonne et al., 2004). FreeSurfer provides a
full processing stream for structural MRI data.
For each individual the following steps were conducted using ‘recon-all’: FreeSurfer inputs
whole head high resolution T1 weighted images after which the processing stream
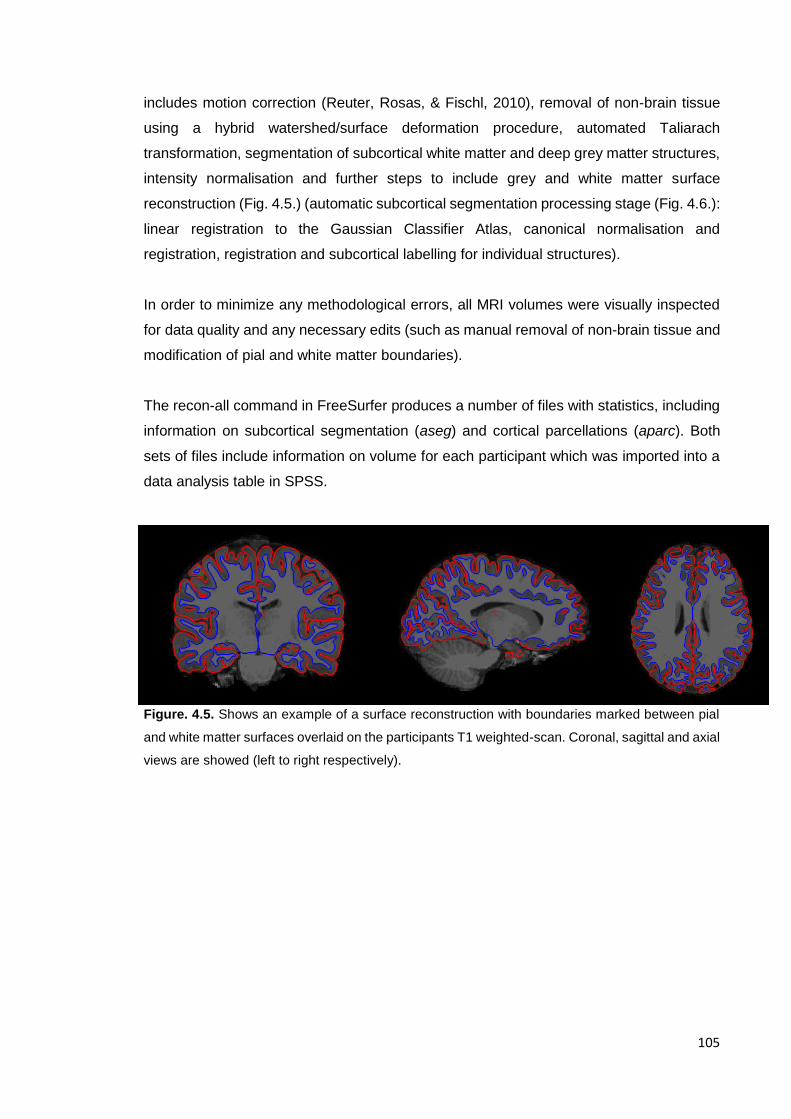
105
includes motion correction (Reuter, Rosas, & Fischl, 2010), removal of non-brain tissue
using a hybrid watershed/surface deformation procedure, automated Taliarach
transformation, segmentation of subcortical white matter and deep grey matter structures,
intensity normalisation and further steps to include grey and white matter surface
reconstruction (Fig. 4.5.) (automatic subcortical segmentation processing stage (Fig. 4.6.):
linear registration to the Gaussian Classifier Atlas, canonical normalisation and
registration, registration and subcortical labelling for individual structures).
In order to minimize any methodological errors, all MRI volumes were visually inspected
for data quality and any necessary edits (such as manual removal of non-brain tissue and
modification of pial and white matter boundaries).
The recon-all command in FreeSurfer produces a number of files with statistics, including
information on subcortical segmentation (aseg) and cortical parcellations (aparc). Both
sets of files include information on volume for each participant which was imported into a
data analysis table in SPSS.
Figure. 4.5. Shows an example of a surface reconstruction with boundaries marked between pial
and white matter surfaces overlaid on the participants T1 weighted-scan. Coronal, sagittal and axial
views are showed (left to right respectively).
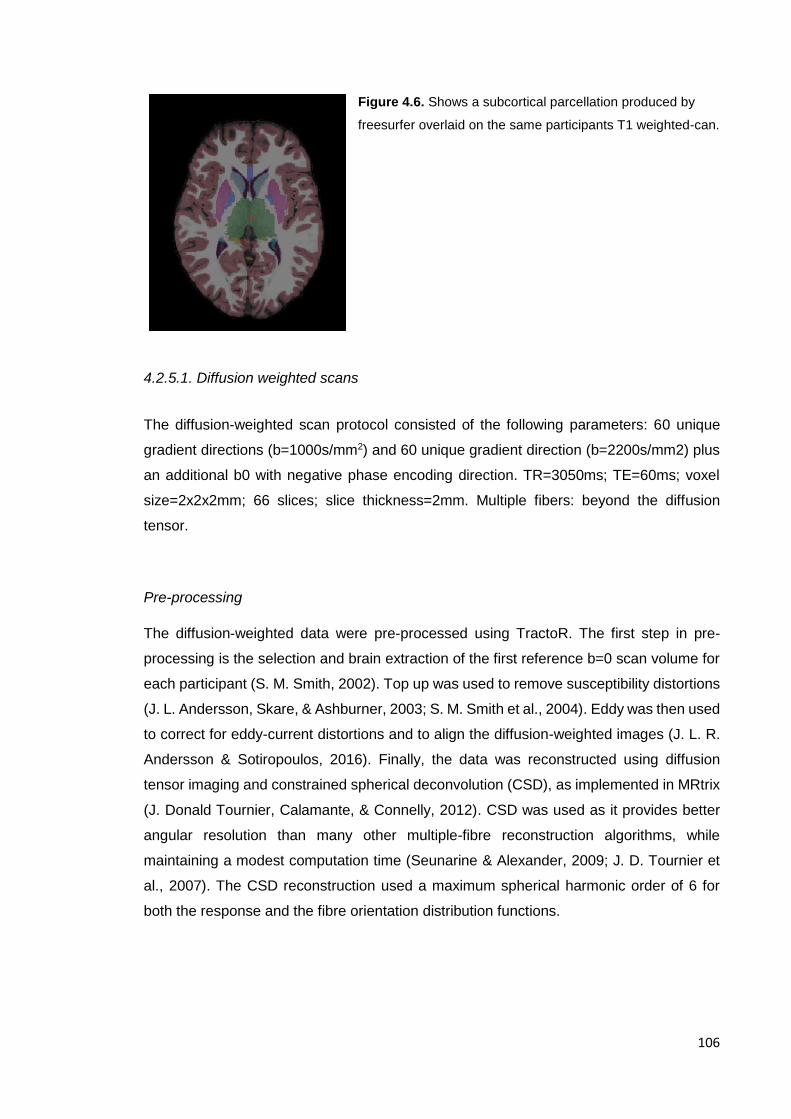
106
Figure 4.6. Shows a subcortical parcellation produced by
freesurfer overlaid on the same participants T1 weighted-can.
4.2.5.1. Diffusion weighted scans
The diffusion-weighted scan protocol consisted of the following parameters: 60 unique
gradient directions (b=1000s/mm2) and 60 unique gradient direction (b=2200s/mm2) plus
an additional b0 with negative phase encoding direction. TR=3050ms; TE=60ms; voxel
size=2x2x2mm; 66 slices; slice thickness=2mm. Multiple fibers: beyond the diffusion
tensor.
Pre-processing
The diffusion-weighted data were pre-processed using TractoR. The first step in pre-
processing is the selection and brain extraction of the first reference b=0 scan volume for
each participant (S. M. Smith, 2002). Top up was used to remove susceptibility distortions
(J. L. Andersson, Skare, & Ashburner, 2003; S. M. Smith et al., 2004). Eddy was then used
to correct for eddy-current distortions and to align the diffusion-weighted images (J. L. R.
Andersson & Sotiropoulos, 2016). Finally, the data was reconstructed using diffusion
tensor imaging and constrained spherical deconvolution (CSD), as implemented in MRtrix
(J. Donald Tournier, Calamante, & Connelly, 2012). CSD was used as it provides better
angular resolution than many other multiple-fibre reconstruction algorithms, while
maintaining a modest computation time (Seunarine & Alexander, 2009; J. D. Tournier et
al., 2007). The CSD reconstruction used a maximum spherical harmonic order of 6 for
both the response and the fibre orientation distribution functions.
107
4.2.6. Inclusion/exclusion criteria
Participants were excluded if they exhibited any ED related behaviours or if their mothers
had a primary lifetime diagnosis of a psychiatric disorder other than an ED. Participants
were also excluded if they were left handed, or if their first language was not English.
Exclusion criteria required for the use of an MRI machine (i.e. if the child has braces) was
also applied (only one child was excluded based on MRI exclusion criteria).
4.2.7. Procedure
A visual representation of the protocol can be found in Appendix D.
Step One
Mothers initially recruited into the study were informed about the aims and details of the
study. After consent was taken (initially on the phone) for both themselves and their child,
they completed a screener questionnaire in order to assess inclusion and exclusion
criteria.
Mothers who were eligible for the study were then called by a trained researcher who
conducted a tailored version of the Structure Clinical Interview for DSM-V (SCID-I: 5), used
to assess past or current mental health disorders in healthy control mothers, and to confirm
lifetime diagnosis of ED in the experimental group. This tailored version of the SCID-I
included the overview, ED modules, and questions concerning presence of anxiety, and
mood disorders.
Step Two
If mother and child met inclusion criteria for the study, mothers were asked to talk through
the study with their children and to confirm their willingness to participate in the study
(separate information sheets tailored to the child’s age (8 to 10 and 11 to 15 years old)
were provided for this step).

108
All children and mothers that were willing to take part were then asked to complete an
online DAWBA (Development and Wellbeing Assessment) to screen for the presence of
ED and other psychiatric disorders in the child. For children under the age of 11 this was
not done.
Step Three
The mothers of children who were eligible for inclusion (based on results from the DAWBA)
were contacted to book in the testing session. A link was provided for the completion of
online questionnaires prior to the assessment session (social cognition measures).
Step Four
Children attended one session at the Institute of Child Health, where they completed the
selected tests from the Cambridge Neuropsychological Testing Assessment Battery
(CANTAB: details below), the BIS/BAS measure, Tanner development stage and an MRI
scan (details above).
109
Chapter 5. Cognitive development and psychopathology
in children at high-risk for eating disorders: findings from the
Danish National Birth Cohort
This chapter has been published in Acta Psychiatrica Scandinavia and findings were
presented at the International Eating Disorders Conference 2015 and the Eating Disorders
Research Society meeting in 20151.
5.1 Introduction
Research into recovered patients has been conducted in order to attempt to understand
possible mechanisms for the development of the disorders, however, due to the nature of
ED and the effect that malnutrition can have in cognitive processes and brain mechanisms,
it is difficult to discern what are scars of the disorder and what are possible traits.
Furthermore, recovery takes a long time and ED have high rates of relapses adding to the
difficulty of discerning between state and trait difficulties. Another added difficulty is the
low prevalence of the disorders and young age of onset which makes it harder to
understand the effect that ED psychopathology can have on development and future
scars. In an attempt to further our understanding of what can constitute as risk markers for
the disorder and given the high genetic component of the disorders, studies have
increasingly started investigating healthy first degree relatives. Both the study of recovered
patients and healthy first degree relatives have helped to develop hypothesis of what could
be risk mechanisms. Chapter 2 presented the evidence for possible neurocognitive
markers for the disorder, such as weak central coherence and deficits in set-shifting, both
of which have been proposed as endophenotypes for the disorder. Interestingly, both have
been proposed to be altered across all ED subtypes and have been largely studied.
Chapter 1 also presented evidence of comorbid psychopathology in ED and posted the
question of the order of onset. There is evidence that anxiety disorders were present
before the onset of ED and therefore could be considered as a risk factor for it’s
development. Risk models for the development of ED have been proposed, however,
unless we are able to do prospective longitudinal studies of ED starting from a young age,
we won’t be able to elucidate what constitutes as a risk factor for the development of ED.
110
The prospective longitudinal study of children at high genetic risk for ED allows us to start
to understand possible mechanisms for the development of the disorder as well as help
distinguish what difficulties found in patients with ED could be present before the disorder
and therefore possibly qualify as endophenotypes for the disorder. A place to start
investigating has been guided by research into possible endophenotypes and risk
mechanisms for the disorder, such as cognitive markers. This type of research has been
conducted in other disorders such as ASD and ADHD and has led to findings into biological
mechanisms for the development of these disorders.
It has been established that children of parents with psychiatric disorders are at a higher
risk of developing a range of emotional, behavioural, cognitive and social difficulties
(Leverton, 2003). However, this has not been as studied in children of parents with ED.
Furthermore, it is not clear the role that early psychopathology can play in the development
of an ED and if traits of other disorders such as anxiety, conduct or social difficulties could
be considered as intermediate phenotypes for the disorder that play a role its development
and maintenance or a general higher risk for any psychopatholoy.
The large majority of research on children of mothers with ED has focused on the early
years of child development, when formal psychopathology is rare (Brinch, Isager, &
Tolstrup, 1988). Case series have reported psychological disturbance in areas
independent of eating in the offspring of mothers with ED, such as emotional, speech
(Franzen & Gerlinghoff, 1997; Hodes, Timimi, & Robinson, 1997), behavioural problems
(Timimi & Robinson, 1996) and general psychopathology(A. Stein et al., 2006). However,
these findings rely on small clinical samples and therefore might be biased. Two recent
studies(N. Micali et al., 2013; Nadia Micali, Stavola, Ploubidis, Simonoff, & Treasure, 2013)
using data from a large population-based study, the Avon Longitudinal Study of Parents
And Children (ALSPAC) investigated childhood psychopathology in children of mothers
with ED at three and a half years (N. Micali et al., 2013) and in late childhood and early
adolescence (Nadia Micali et al., 2013). Children of women with eating disorders, both
anorexia and bulimia, had a higher risk of developing psychopathology at 3 and 1/2 years
than unexposed children. These children also had higher prevalence of psychiatric
disorders at age 10 years (N. Micali et al., 2013). Recent research has also found that
children of mothers with ED show differences in cognitive performance compared to
healthy children, such as difficulties with social understanding, visual-motor planning and
abstract reasoning (R. Kothari, Solmi, Treasure, & Micali, 2013a). However, less is known
111
about mid childhood, when children start formal education, leading to new demands on
cognitive and social functioning and potential difficulties becoming more prominent.
In order to help elucidate whether other psychopathology is present in children at high
genetic risk of developing an ED and therefore could be a potential mechanism for the
development of ED, we aimed to investigate children’s psychopathology as measured by
the Strengths and Difficulties Questionnaire at 7 years of age (which measures levels of
conduct, emotional, hyperactivity, social problems and overall psychopathology). We also
studied whether maternal eating disorders predicted early child development: motor,
cognitive and language; as well as child difficult temperament at 18 months. Based on
previous findings on gender differences in past studies in children of mothers with ED we
focused on specific differences stratified by gender. We also aimed to explore whether
child temperament might be a mediator in the associations between maternal ED and child
psychopathology
5.2. Methods
5.2.1. Study overview
The Danish National Birth Cohort (DNBC)(Olsen et al., 2001) is a longitudinal and
prospective population-based study of women (from pregnancy) and their children. The
DNBC was developed in order to investigate exposure in the period from conception to
early childhood that may have a long-lasting impact on health and disease susceptibility.
The initial recruitment aim was of 100,000 women in early pregnancy. Data collection
started in 1996 and was extended to cover all regions in Denmark by 1999. The goal of
100,000 pregnant women had been reached by October 2002. Information has been
collected through computer assisted telephone interviews with the women, twice during
pregnancy, when their children were six and 18 months old, and seven and 11 years old.
5.2.2. Participants and procedure
112
Participants (pregnant women) were initially recruited through their General Practitioners
(GPs) (approximately 3,500). When women visited their GP during their first ante-natal
appointment (6 -12 weeks of pregnancy) the GP gave them an invitation to take part in the
study. As almost all women have their GP as their first point of contact once they become
pregnant this initial recruitment included a large number of women, however, a second
recruitment procedure was also set in place through midwifes who look after pregnant
women throughout pregnancy. Overall, more than 95% of the cohort where recruited
through their GPs.
Initial inclusion criteria included wanting to carry the pregnancy to term and being able to
speak Danish well enough to be able to take part on telephone interviews. No other
exclusion criteria were used. Recruitment was undertaken in several Danish counties.
Information was collected on exposure and minor diseases (not registered in medical
records) by using computerized telephone interviews in order to minimize the time
involvement and increase response rate. The interviews were developed with external
experts and steering groups. Information in a number of national registers were also used
to access information on: maternal age, pregnancy-related smoking status, birth date, sex,
birth weight and length, parity and multiple births (from the National Medical Birth
Registry); information on hospital admissions, both outpatient and emergency room
events, including diagnoses (from the National Hospital Discharge Register) as well as
social conditions and occupational status of participants taking part in the study.
Initially, women enrolled agreed to complete 4 computerised assisted telephone
interviews, four times at gestational weeks 12 and 30 and when the child was six and 18
months old. The telephone interviews lasted on average 18, 10, 16 and 10 minutes. As
part of the study, participants were given a food frequency questionnaire at 25-26 weeks
gestation as well. Participants also agreed to be invited to participate in subsequent data
collection waves throughout childhood and the children who were born into the cohort will
be given the opportunity to continue as part of the cohort after they turn 18 years old. Blood
samples were also taken by GPs during routine visits in gestational weeks 6-12 and 24
months and an umbilical cord sample was also taken at time of birth by midwifes and
nurses. After the initial four telephone interviews, further follow-ups were established, a 7
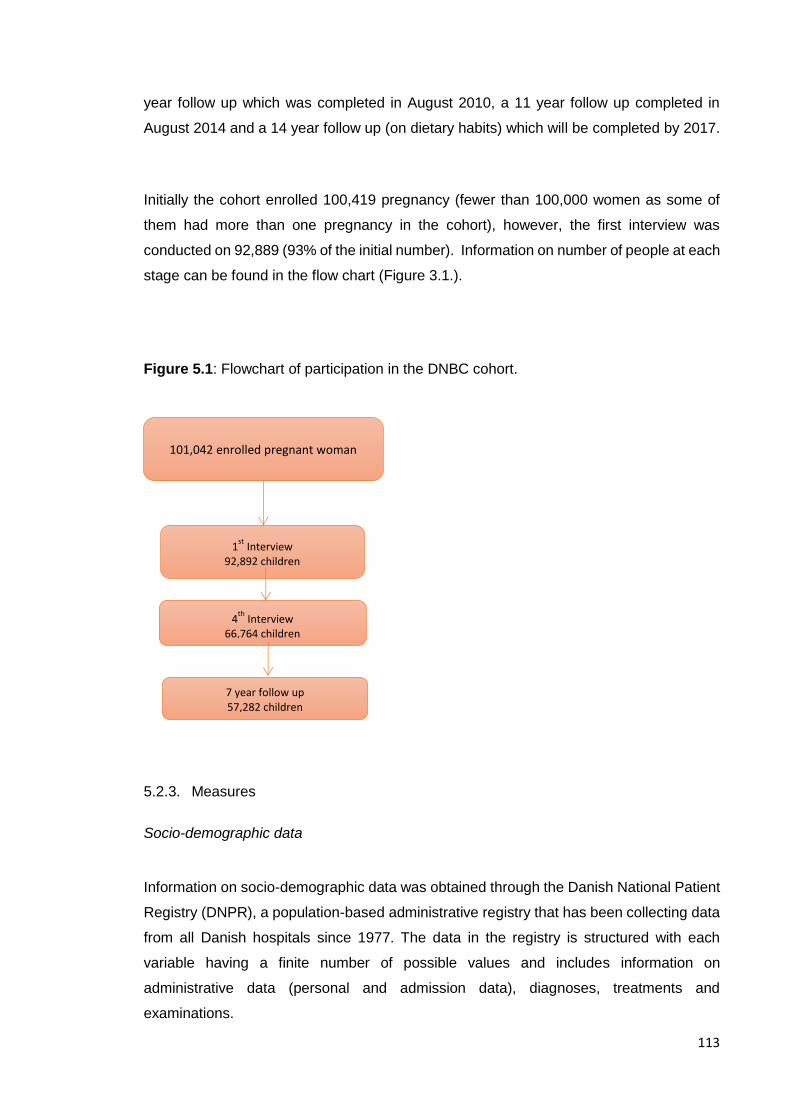
113
year follow up which was completed in August 2010, a 11 year follow up completed in
August 2014 and a 14 year follow up (on dietary habits) which will be completed by 2017.
Initially the cohort enrolled 100,419 pregnancy (fewer than 100,000 women as some of
them had more than one pregnancy in the cohort), however, the first interview was
conducted on 92,889 (93% of the initial number). Information on number of people at each
stage can be found in the flow chart (Figure 3.1.).
Figure 5.1: Flowchart of participation in the DNBC cohort.
5.2.3. Measures
Socio-demographic data
Information on socio-demographic data was obtained through the Danish National Patient
Registry (DNPR), a population-based administrative registry that has been collecting data
from all Danish hospitals since 1977. The data in the registry is structured with each
variable having a finite number of possible values and includes information on
administrative data (personal and admission data), diagnoses, treatments and
examinations.
101,042 enrolled pregnant woman
1st
Interview 92,892 children
4th
Interview 66,764 children
7 year follow up 57,282 children

114
Information on maternal age, maternal social status (not in labour market, student, high
and low grade professional and skilled or unskilled worker), parity (primiparae and
multiparae), birthweight and gender of the child was extracted from the DNPR.
Maternal age: maternal age at the time of having the child included in the study. These
data were used as a continuous variable.
Parity: mothers number of children was reported. The variable was dichotomized into
primiparae or multiparae for ease of use.
Social status was based on parental current occupation. Maternal occupation was coded
on a scale with four possible categories: (1) not in labour market, (2) student, (3) skilled or
unskilled worker and (4) high/low grade professional. For this study the first two categories
were combined into one.
Prematurity: data on weeks of gestation for the study child was extracted. The variable
was dichotomized into less than 37 weeks gestation (premature) and more than 37 weeks
gestation (term).
Gestational age (weeks): data on weeks of gestation for the study child was extracted.
This data were used as a continuous variable.
Birthweight: information on birthweight of the study child was extracted and used as a
continuous variable.
Child gender: information on the gender of the study child was extracted and was used as
a dichotomous variable (male or female).

115
Maternal eating disorder
Information on maternal eating disorder was extracted from the first interview for the
DNBC. During this interview women were asked whether they suffered from or had ever
suffered from anorexia or bulimia nervosa (BN), and if they had BN at the time of the
interview (N. Micali, Stemann Larsen, Strandberg-Larsen, & Nybo Andersen, 2015).
Women were grouped into different exposure groups depending on having ever suffered
from AN or from BN, and those who answered yes to having ever had both disorders were
included in a separate group.
Women who reported ever having suffered from BN were also asked if they have suffered
any episodes in the last six months. Women who reported having ever suffered from AN
were also asked about the age at the onset of the disorder. These follow up information
was then used to created further groups based on recency of the disorder.
Women were grouped into the following exposure groups: lifetime BN (N=1,751, 2.1%)
and lifetime anorexia nervosa (AN) (N=1,673, 2.0%). Women who answered yes to having
ever suffered from both disorders were included as a separate exposure group
(N=658,0.8%), given previous evidence from Micali et al. 2007(Nadia Micali, Simonoff, &
Treasure, 2007) that this group differs from the other two. Women with no history of ED
were classified as unexposed (N=79,738, 95.1%).
A total of 83,820 women had complete data on maternal diagnoses.
Strengths and difficulties questionnaire (SDQ)
The SDQ is a brief 25-item questionnaire, validated to assess psychopathology in children
and adolescents (Goodman, 1997); it has been validated in children across four large
Danish cohorts, supporting its use in the Danish population [reliability (chronbach’s alpha:
0.75-0.88)] (Janni Niclasen et al., 2012). The reliability and validity of the SDQ makes it a
useful short measure of psychopathology in children and adolescents (Goodman, 2001)
and all scales are associated with the relevant DSM-IV diagnoses (Goodman, 2001).
Furthermore, the SDQ algorithm capitalises on the high level of detection of comorbidities;
a well-recognised feature of child psychopathology (Angold, Costello, & Erkanli, 1999).
The SDQ is completed by parents about their child’s behaviour in the past six months and
comprises five different subscales (emotional, conduct, hyperactivity/inattention, pro-
116
social and peer-relations) as well as a total scale. The responses for each item are coded
in a 3-point Likert scale (not true, somewhat true, certainly true). We used recognised cut-
offs for the SDQ (which roughly correspond to 80% of children: “normal” range, 10%:
borderline range and 10%: clinical range), commonly used in clinical practice. The specific
cut-off scores used were developed by Niclasen in 2012 based on a sample of almost
60,000 Danish children and are used to identify the 20% of the sample with the highest
problem scores (http://www.sdqinfo.org/DanishNorms/DanishNorms.html) (J. Niclasen).
The categories normal, borderline and clinical so derived were used as an ordered
variable.
A total of 53,695 (63% of those originally enrolled) women completed the SDQ(Goodman,
1997) when the child was 7 years of age.
Developmental milestones
In the 18-month interview, mothers answered 11 questions pertaining to delays in their
infant’s milestones. Five questions pertaining to motor development delays, (two assessed
age for sitting and standing up, and three assessed whether the infant could climb stairs,
remove his/her socks and shoes, and drink from a cup or glass by him-/herself). Six
cognitive and language development questions were also asked. A developmental delay
summary score for motor (0–5 points) and cognitive/language (0–6 points) development
was calculated. Consistent with previous studies (J. L. Zhu, Basso, Obel, Hvidtjorn, &
Olsen, 2009), to summarize motor, cognitive and language milestones, we defined as
“delayed” those infants whose scores for motor or cognitive/language development
corresponded to the highest 5% of all infants for each of the 2 summary measures (motor
delay and cognitive/language delay). This cut-offs have been used previously in the DNBC
cohort (J. L. Zhu et al., 2009).
A total of 58,637 children had complete data on developmental milestones.
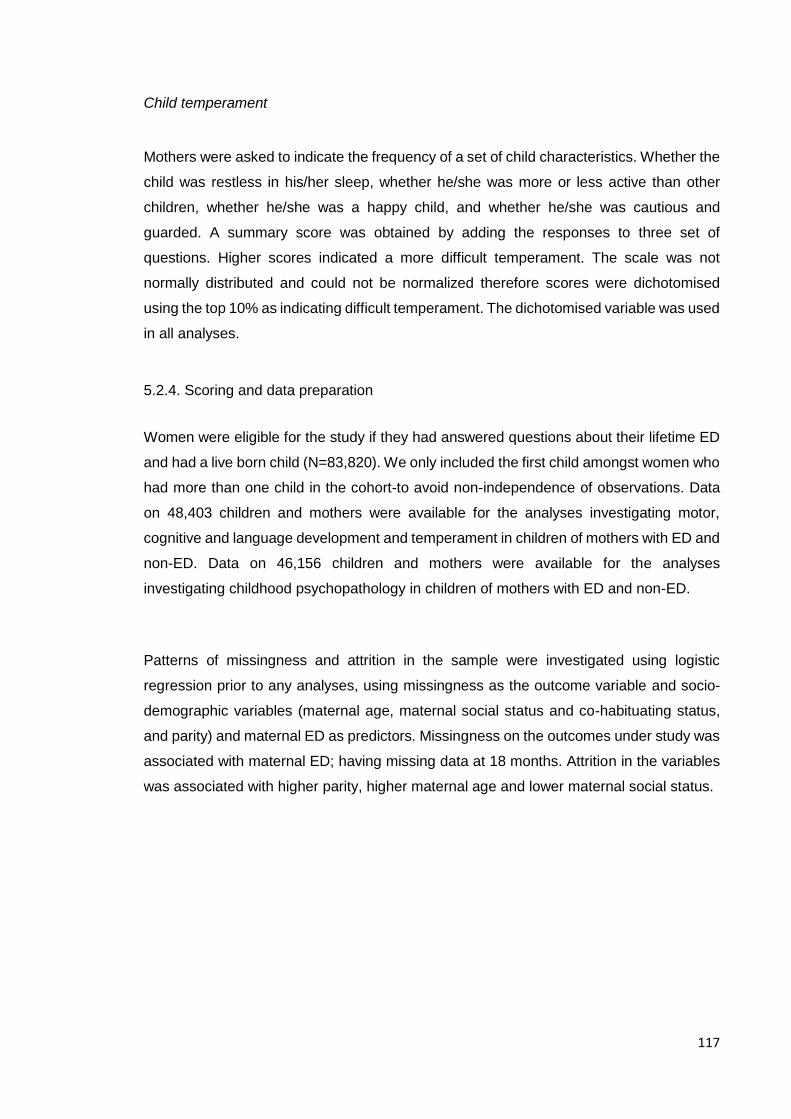
117
Child temperament
Mothers were asked to indicate the frequency of a set of child characteristics. Whether the
child was restless in his/her sleep, whether he/she was more or less active than other
children, whether he/she was a happy child, and whether he/she was cautious and
guarded. A summary score was obtained by adding the responses to three set of
questions. Higher scores indicated a more difficult temperament. The scale was not
normally distributed and could not be normalized therefore scores were dichotomised
using the top 10% as indicating difficult temperament. The dichotomised variable was used
in all analyses.
5.2.4. Scoring and data preparation
Women were eligible for the study if they had answered questions about their lifetime ED
and had a live born child (N=83,820). We only included the first child amongst women who
had more than one child in the cohort-to avoid non-independence of observations. Data
on 48,403 children and mothers were available for the analyses investigating motor,
cognitive and language development and temperament in children of mothers with ED and
non-ED. Data on 46,156 children and mothers were available for the analyses
investigating childhood psychopathology in children of mothers with ED and non-ED.
Patterns of missingness and attrition in the sample were investigated using logistic
regression prior to any analyses, using missingness as the outcome variable and socio-
demographic variables (maternal age, maternal social status and co-habituating status,
and parity) and maternal ED as predictors. Missingness on the outcomes under study was
associated with maternal ED; having missing data at 18 months. Attrition in the variables
was associated with higher parity, higher maternal age and lower maternal social status.
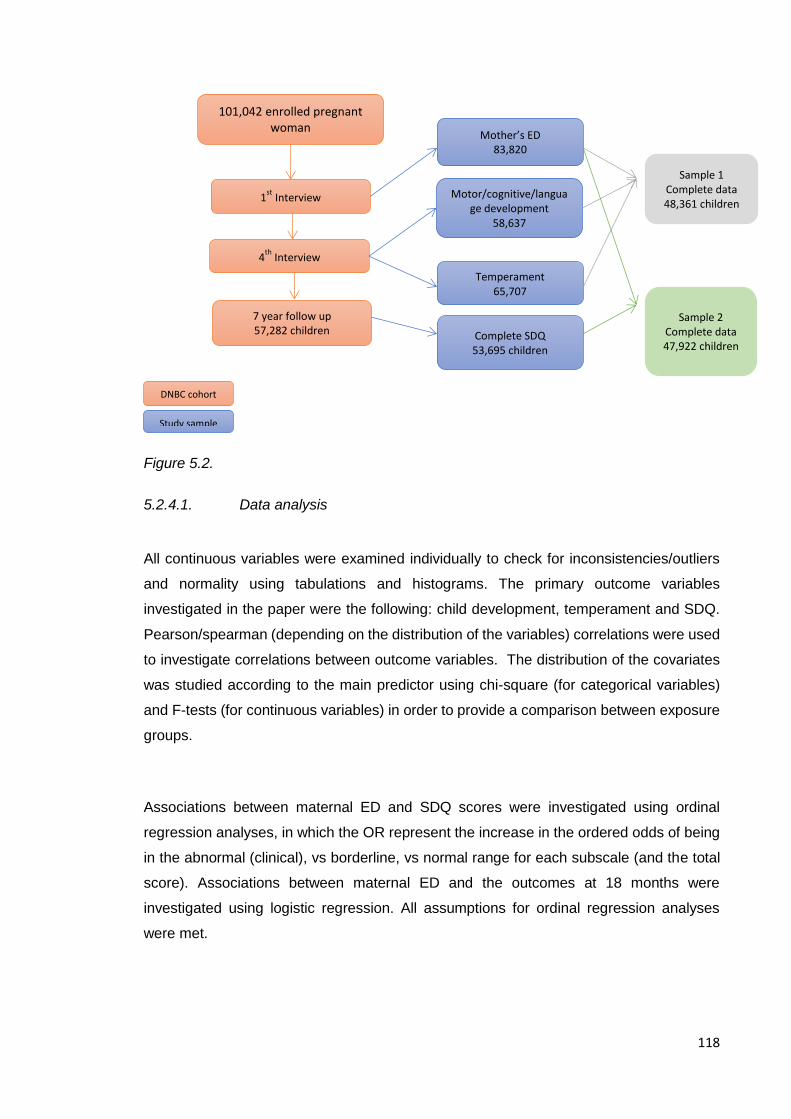
118
Figure 5.2.
5.2.4.1. Data analysis
All continuous variables were examined individually to check for inconsistencies/outliers
and normality using tabulations and histograms. The primary outcome variables
investigated in the paper were the following: child development, temperament and SDQ.
Pearson/spearman (depending on the distribution of the variables) correlations were used
to investigate correlations between outcome variables. The distribution of the covariates
was studied according to the main predictor using chi-square (for categorical variables)
and F-tests (for continuous variables) in order to provide a comparison between exposure
groups.
Associations between maternal ED and SDQ scores were investigated using ordinal
regression analyses, in which the OR represent the increase in the ordered odds of being
in the abnormal (clinical), vs borderline, vs normal range for each subscale (and the total
score). Associations between maternal ED and the outcomes at 18 months were
investigated using logistic regression. All assumptions for ordinal regression analyses
were met.
101,042 enrolled pregnant woman
1st
Interview 92,892 children
4th
Interview 66,764 children
7 year follow up 57,282 children Complete SDQ
53,695 children
Motor/cognitive/language development
58,637
Temperament 65,707
Mother’s ED 83,820
DNBC cohort
Study sample
Sample 2 Complete data 47,922 children
Sample 1 Complete data 48,361 children
119
All analyses were stratified by gender based on previous results highlighting differences
based on gender. Initially crude analyses were run. Additional a priori confounders
(maternal age, maternal social status, birth-weight and parity) were included in adjusted
models. All analyses were run using SPSS 21 (SPSS Inc., USA), and a two-tailed
significance level of 5% was used.
Post-hoc mediation analyses
We investigated the role of temperament as a possible mediator of the associations
between maternal ED and child psychopathology. Mediation was tested in SPSS following
the methodology by MacKinnon and Dwyer for mediation with categorical variables
(MacKinnon & Dwyer, 1993).
5.2.5. Ethical approval
The DNBC was approved by the Committee on Biomedical Research Ethics and all
women who participated in the study gave informed written consent. The present study
was approved by the DNBC steering committee (ref. 2010-33).
5.3. Results
5.3.1. Socio-demographic data
Results are shown in table 1. Socio demographic characteristics were studied across
exposed and unexposed women. Co-habitation status (χ2=51.26, p<0.01), parity
(χ2=31.74, p<0.01), social status (χ2=106.61, p<0.01), birth weight (F=10.24, p<0.01) and
maternal age (F=9.86, p<0.01) were found to be significantly different between groups.
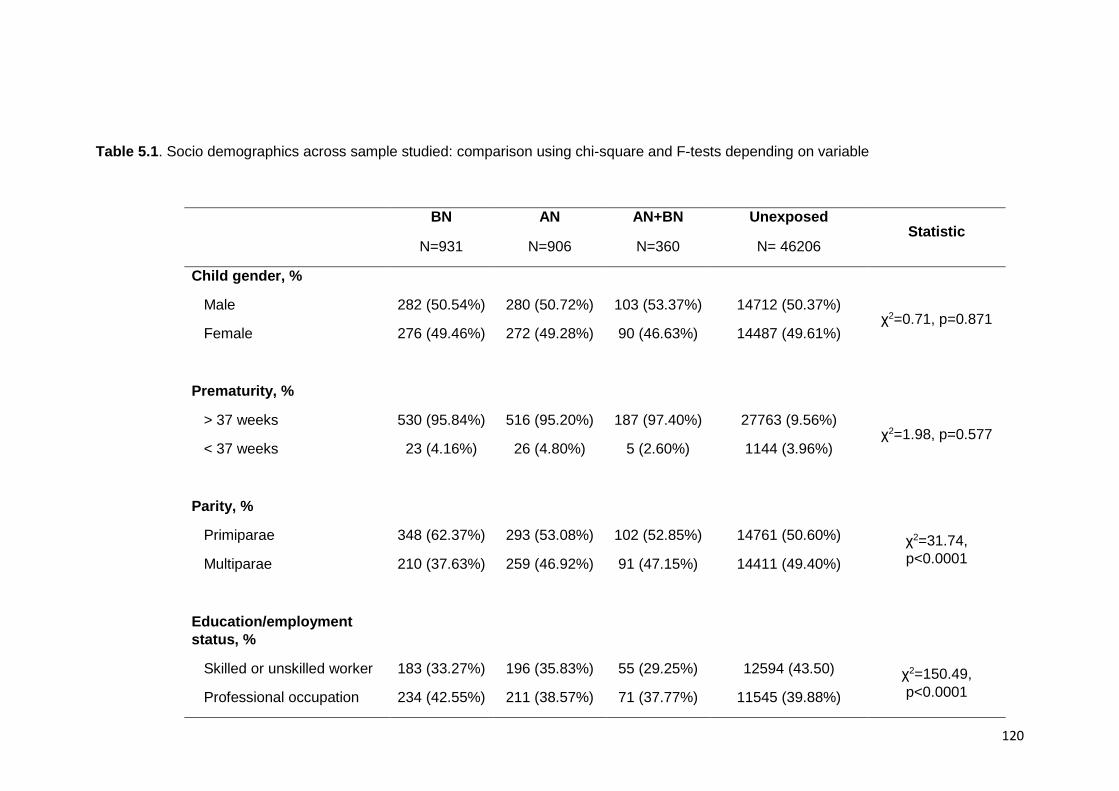
120
Table 5.1. Socio demographics across sample studied: comparison using chi-square and F-tests depending on variable
BN AN AN+BN Unexposed Statistic
N=931 N=906 N=360 N= 46206
Child gender, %
Male 282 (50.54%) 280 (50.72%) 103 (53.37%) 14712 (50.37%) χ2=0.71, p=0.871
Female 276 (49.46%) 272 (49.28%) 90 (46.63%) 14487 (49.61%)
Prematurity, %
> 37 weeks 530 (95.84%) 516 (95.20%) 187 (97.40%) 27763 (9.56%) χ2=1.98, p=0.577
< 37 weeks 23 (4.16%) 26 (4.80%) 5 (2.60%) 1144 (3.96%)
Parity, %
Primiparae 348 (62.37%) 293 (53.08%) 102 (52.85%) 14761 (50.60%) χ2=31.74,
p<0.0001 Multiparae 210 (37.63%) 259 (46.92%) 91 (47.15%) 14411 (49.40%)
Education/employment
status, %
Skilled or unskilled worker 183 (33.27%) 196 (35.83%) 55 (29.25%) 12594 (43.50) χ2=150.49,
p<0.0001 Professional occupation 234 (42.55%) 211 (38.57%) 71 (37.77%) 11545 (39.88%)
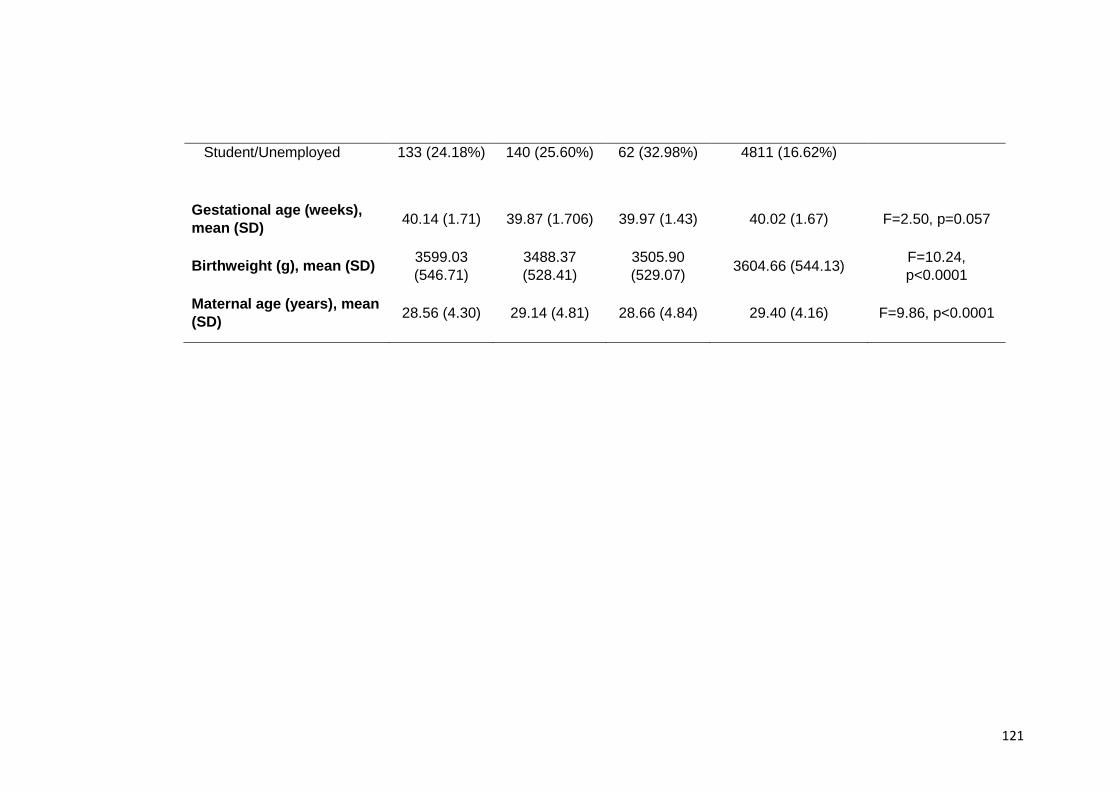
121
Student/Unemployed 133 (24.18%) 140 (25.60%) 62 (32.98%) 4811 (16.62%)
Gestational age (weeks),
mean (SD) 40.14 (1.71) 39.87 (1.706) 39.97 (1.43) 40.02 (1.67) F=2.50, p=0.057
Birthweight (g), mean (SD) 3599.03
(546.71)
3488.37
(528.41)
3505.90
(529.07) 3604.66 (544.13)
F=10.24,
p<0.0001
Maternal age (years), mean
(SD) 28.56 (4.30) 29.14 (4.81) 28.66 (4.84) 29.40 (4.16) F=9.86, p<0.0001
122
5.3.2. Maternal ED and development, temperament, and mother child relation at 18
months of age
5.3.2.1. Cognitive and language development
Girls: girls of mothers with ED were comparable to girls of non-ED women (table 2).
Boys: Boys of women with AN were less likely to have delayed cognitive and language
development in crude and adjusted analyses (OR=0.75, 95%CI: 0.62-0.91) compared to
boys of unexposed women (Table 2).
5.3.2.2. Child temperament
Girls: Women with BN were more likely to perceive their daughter as having a difficult
temperament in crude and adjusted analyses (OR=1.85, 95%CI: 1.30-2.65) compared to
unexposed women (Table 2).
Boys: Women with AN and those with both AN and BN were more likely to perceive their
son as having a difficult temperament in crude and adjusted analyses (OR=2.33, 95%CI:
1.34-4.07) compared to unexposed women. (Table 2).
5.3.3. Maternal ED and child SDQ at 7 years
Girls: Girls of women who reported BN had higher odds of conduct difficulties in crude and
adjusted analyses (OR=1.41,95% CI: 1.09-1.83) compared to girls of unexposed women
(Table 3). Girls of women who reported AN had higher odds of emotional difficulties in
crude and adjusted analyses (OR=1.28,95% CI: 1.00-1.63) compared to girls of
unexposed women (table 3).
Boys: Boys of women with BN had higher odds of having total, conduct, hyperactivity and
peer difficulties in crude and adjusted analyses (respectively: OR = 1.51, 95%CI: 1.23-
1.84; OR=1.32, 95% CI: 1.05-1.66; OR=1.33, 95%CI: 1.08-1.64; OR=1.37, 95%CI: 1.12-
1.67) when compared to boys of unexposed women (Table 3). Boys of women with AN
123
had higher odds of total, emotional and conduct difficulties in crude and adjusted analyses
(respectively: OR=1.37, 95% CI: 1.10-1.70; OR=1.56, 95%CI: 1.23-1.98; OR=1.32, 95%
CI: 1.04-1.67) compared to boys of unexposed women (Table 3).
Boys of women with AN and BN had higher odds of total, emotional and peer difficulties in
crude and adjusted analyses (respectively: OR=1.91, 95%CI: 1.41-2.59; OR = 1.92, 95%
CI: 1.36-2.70; OR = 1.71, 95% CI: 1.26-2.32) compared to boys of unexposed women
(table 3).
5.3.4. Post-hoc mediation analyses
There was a significant indirect effect of maternal BN on SDQ total, emotion, conduct,
hyperactivity and peer scores mediated via child temperament (respectively:
estimate=0.16, SE=0.01, p< 0.01; estimate=0.24, SE=0.01, p<0.01; estimate=0.08,
SE=0.01, p< 0.01; estimate=0.07, SE=0.01 p< 0.01 and estimate=0.10, SE=0.01, p<
0.01). The direct effects from maternal BN to SDQ total, conduct and hyperactivity scores
were also significant (respectively: estimate=0.05, SE=0.01, p<0.01; estimate=0.29
SE=0.10, p<0.01 and estimate=0.32, SE=0.09, p<0.01).
Child temperament also mediated the effect of maternal AN on SDQ total, emotion,
conduct, hyperactivity and peer scores (indirect effects respectively: estimate=0.16,
SE=0.01, p<0.01; estimate=0.24, SE=0.01 p<0.01; estimate=0.08, SE=0.01, p<0.01;
estimate=0.07, SE=0.01, p<0.01 and estimate=0.10, SE=0.01, p<0.01). There were no
significant direct effects.
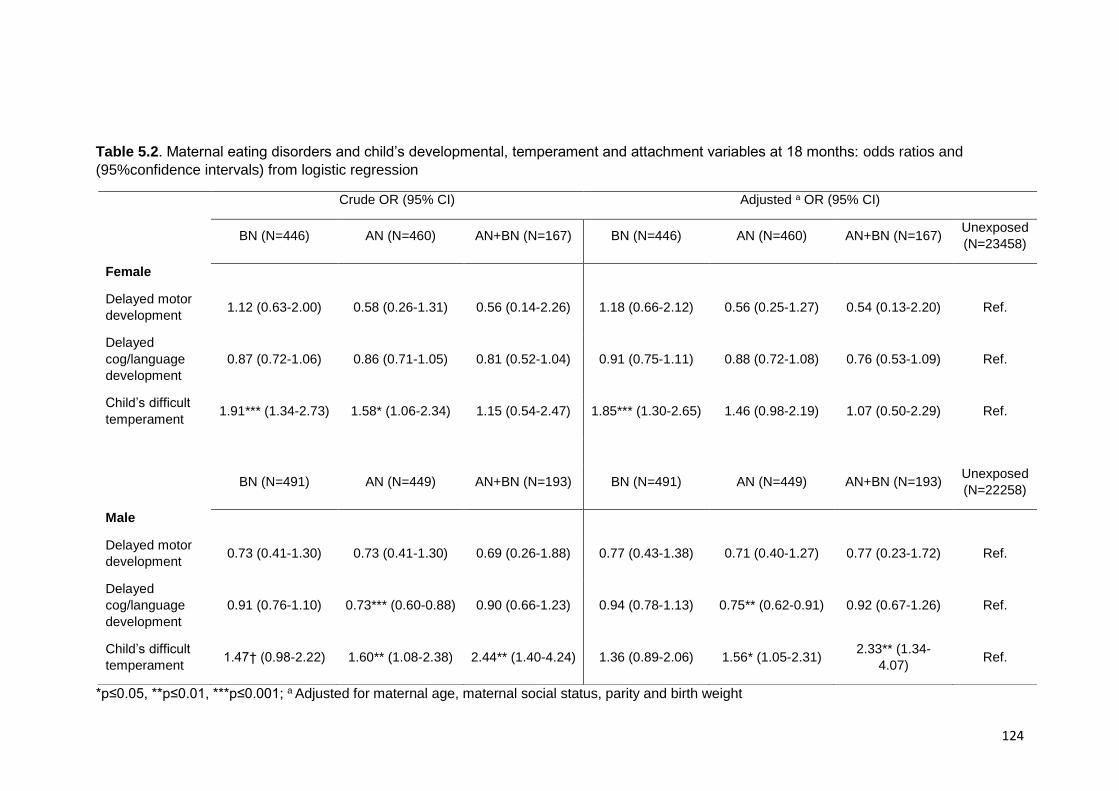
124
Table 5.2. Maternal eating disorders and child’s developmental, temperament and attachment variables at 18 months: odds ratios and
(95%confidence intervals) from logistic regression
*p≤0.05, **p≤0.01, ***p≤0.001; a Adjusted for maternal age, maternal social status, parity and birth weight
Crude OR (95% CI) Adjusted a OR (95% CI)
BN (N=446) AN (N=460) AN+BN (N=167) BN (N=446) AN (N=460) AN+BN (N=167)
Unexposed
(N=23458)
Female
Delayed motor
development 1.12 (0.63-2.00) 0.58 (0.26-1.31) 0.56 (0.14-2.26) 1.18 (0.66-2.12) 0.56 (0.25-1.27) 0.54 (0.13-2.20) Ref.
Delayed
cog/language
development
0.87 (0.72-1.06) 0.86 (0.71-1.05) 0.81 (0.52-1.04) 0.91 (0.75-1.11) 0.88 (0.72-1.08) 0.76 (0.53-1.09) Ref.
Child’s difficult
temperament 1.91*** (1.34-2.73) 1.58* (1.06-2.34) 1.15 (0.54-2.47) 1.85*** (1.30-2.65) 1.46 (0.98-2.19) 1.07 (0.50-2.29) Ref.
BN (N=491) AN (N=449) AN+BN (N=193) BN (N=491) AN (N=449) AN+BN (N=193)
Unexposed
(N=22258)
Male
Delayed motor
development 0.73 (0.41-1.30) 0.73 (0.41-1.30) 0.69 (0.26-1.88) 0.77 (0.43-1.38) 0.71 (0.40-1.27) 0.77 (0.23-1.72) Ref.
Delayed
cog/language
development
0.91 (0.76-1.10) 0.73*** (0.60-0.88) 0.90 (0.66-1.23) 0.94 (0.78-1.13) 0.75** (0.62-0.91) 0.92 (0.67-1.26) Ref.
Child’s difficult
temperament 1.47† (0.98-2.22) 1.60** (1.08-2.38) 2.44** (1.40-4.24) 1.36 (0.89-2.06) 1.56* (1.05-2.31)
2.33** (1.34-
4.07) Ref.
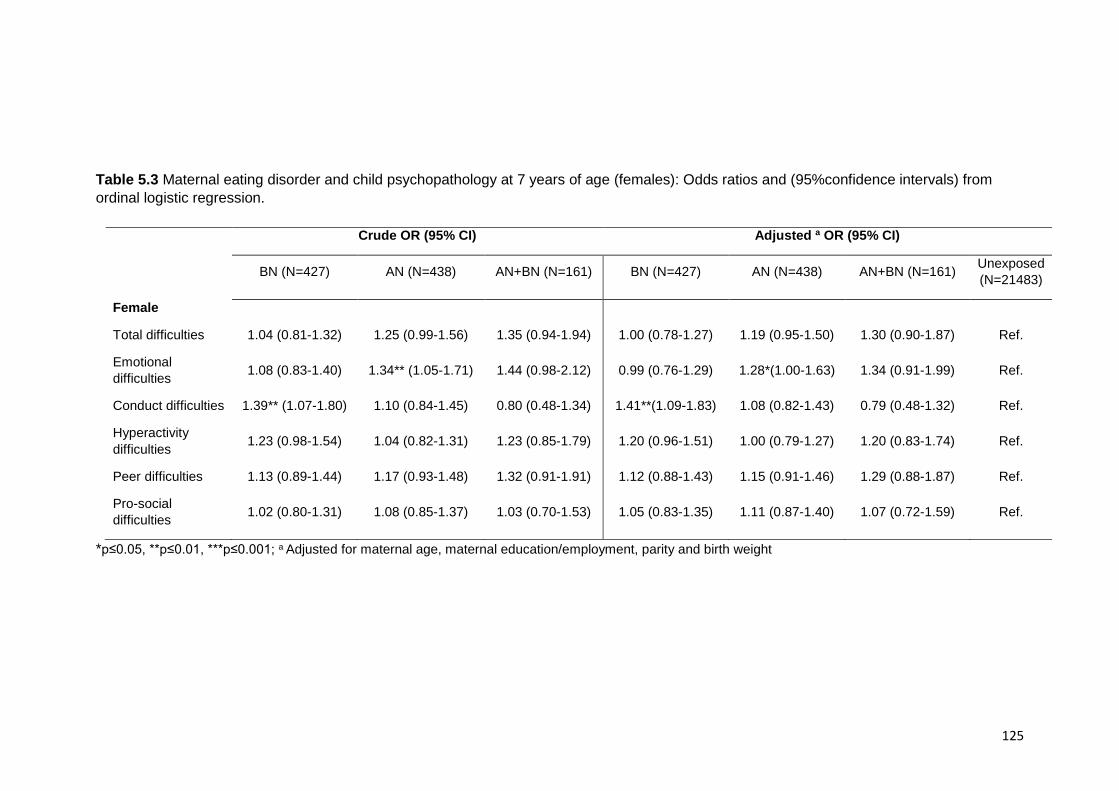
125
Table 5.3 Maternal eating disorder and child psychopathology at 7 years of age (females): Odds ratios and (95%confidence intervals) from
ordinal logistic regression.
*p≤0.05, **p≤0.01, ***p≤0.001; a Adjusted for maternal age, maternal education/employment, parity and birth weight
Crude OR (95% CI) Adjusted a OR (95% CI)
BN (N=427) AN (N=438) AN+BN (N=161) BN (N=427) AN (N=438) AN+BN (N=161)
Unexposed
(N=21483)
Female
Total difficulties 1.04 (0.81-1.32) 1.25 (0.99-1.56) 1.35 (0.94-1.94) 1.00 (0.78-1.27) 1.19 (0.95-1.50) 1.30 (0.90-1.87) Ref.
Emotional
difficulties 1.08 (0.83-1.40) 1.34** (1.05-1.71) 1.44 (0.98-2.12) 0.99 (0.76-1.29) 1.28*(1.00-1.63) 1.34 (0.91-1.99) Ref.
Conduct difficulties 1.39** (1.07-1.80) 1.10 (0.84-1.45) 0.80 (0.48-1.34) 1.41**(1.09-1.83) 1.08 (0.82-1.43) 0.79 (0.48-1.32) Ref.
Hyperactivity
difficulties 1.23 (0.98-1.54) 1.04 (0.82-1.31) 1.23 (0.85-1.79) 1.20 (0.96-1.51) 1.00 (0.79-1.27) 1.20 (0.83-1.74) Ref.
Peer difficulties 1.13 (0.89-1.44) 1.17 (0.93-1.48) 1.32 (0.91-1.91) 1.12 (0.88-1.43) 1.15 (0.91-1.46) 1.29 (0.88-1.87) Ref.
Pro-social
difficulties 1.02 (0.80-1.31) 1.08 (0.85-1.37) 1.03 (0.70-1.53) 1.05 (0.83-1.35) 1.11 (0.87-1.40) 1.07 (0.72-1.59) Ref.
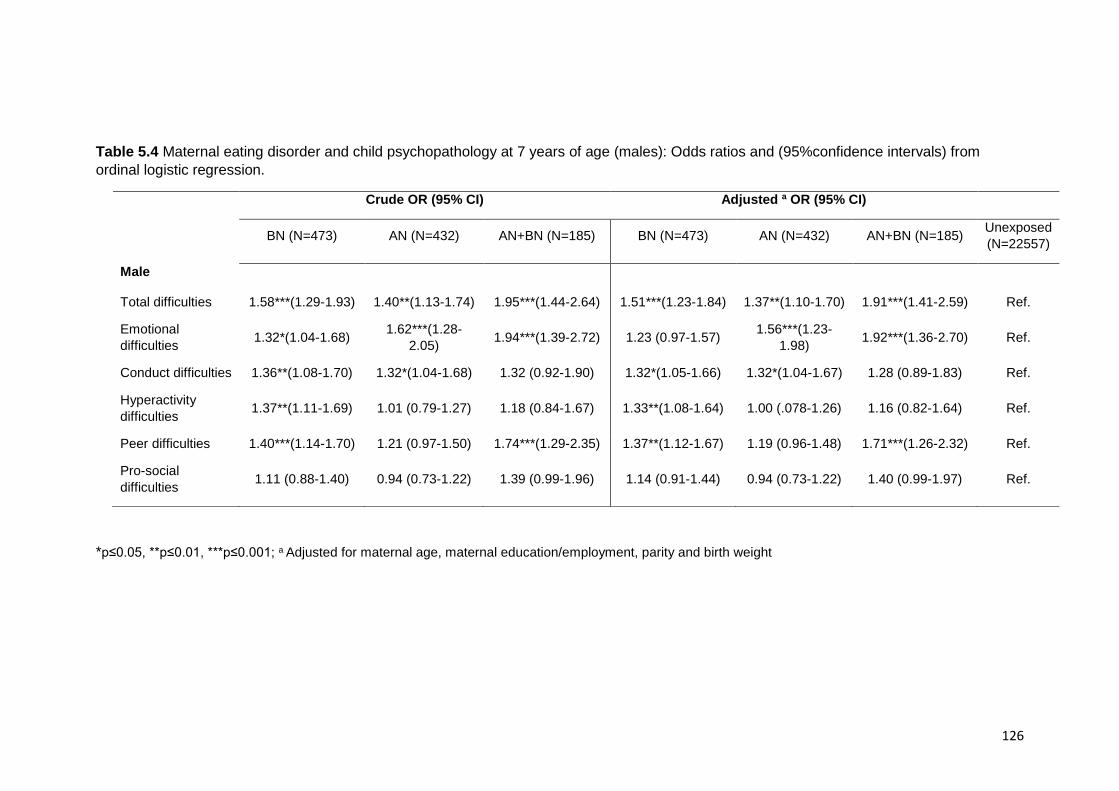
126
Table 5.4 Maternal eating disorder and child psychopathology at 7 years of age (males): Odds ratios and (95%confidence intervals) from
ordinal logistic regression.
*p≤0.05, **p≤0.01, ***p≤0.001; a Adjusted for maternal age, maternal education/employment, parity and birth weight
Crude OR (95% CI) Adjusted a OR (95% CI)
BN (N=473) AN (N=432) AN+BN (N=185) BN (N=473) AN (N=432) AN+BN (N=185)
Unexposed
(N=22557)
Male
Total difficulties 1.58***(1.29-1.93) 1.40**(1.13-1.74) 1.95***(1.44-2.64) 1.51***(1.23-1.84) 1.37**(1.10-1.70) 1.91***(1.41-2.59) Ref.
Emotional
difficulties 1.32*(1.04-1.68)
1.62***(1.28-
2.05) 1.94***(1.39-2.72) 1.23 (0.97-1.57)
1.56***(1.23-
1.98) 1.92***(1.36-2.70) Ref.
Conduct difficulties 1.36**(1.08-1.70) 1.32*(1.04-1.68) 1.32 (0.92-1.90) 1.32*(1.05-1.66) 1.32*(1.04-1.67) 1.28 (0.89-1.83) Ref.
Hyperactivity
difficulties 1.37**(1.11-1.69) 1.01 (0.79-1.27) 1.18 (0.84-1.67) 1.33**(1.08-1.64) 1.00 (.078-1.26) 1.16 (0.82-1.64) Ref.
Peer difficulties 1.40***(1.14-1.70) 1.21 (0.97-1.50) 1.74***(1.29-2.35) 1.37**(1.12-1.67) 1.19 (0.96-1.48) 1.71***(1.26-2.32) Ref.
Pro-social
difficulties 1.11 (0.88-1.40) 0.94 (0.73-1.22) 1.39 (0.99-1.96) 1.14 (0.91-1.44) 0.94 (0.73-1.22) 1.40 (0.99-1.97) Ref.
127
5.4. Discussion
A recent population-based prospective study showed that children at high-risk for ED
(children of mothers with lifetime ED) had increased odds of specific psychopathology in
adolescence. However attrition in early adolescence means small sample sizes were
achieved by this stage (N. Micali, B. De Stavola, G. B. Ploubidis, E. Simonoff, & J.
Treasure, 2014). The present study aimed to extend and replicate these findings by using
data from a larger population-based study and investigate the development of
psychopathology at seven years of age. Reproducibility is a defining feature of science
and replication of results using different samples in different countries, with a different
confounding structure can lead to increased confidence in the findings (Collaboration,
2015). Results show that children of women with eating disorders were at risk of
developing psychopathology in mid-childhood across most domains (emotional, conduct,
hyperactivity and peer difficulties); and were more likely to have a difficult temperament.
Boys of mothers with AN were less likely to have a delayed language and cognitive
development. Mediation analyses showed that there was a significant indirect effect of
maternal AN and maternal BN on psychopathology mediated via child temperament at 18
months.
Boys of women with AN had lower odds of having delayed cognitive and language
development. These results are consistent with previous findings from a study in children
of mothers with AN (R. Kothari et al., 2013a). However, this study did not replicate the
association between maternal eating disorder and motor development. This might be due
to the latter study using an objective measure of development, rather than the maternally
reported one used in the current study.
Mothers with ED tended to report their children as having a more difficult temperament.
However, because the present study used maternal report rather than direct observational
measures for child temperament, the nature of the associations remains unclear.
Questions included in this section included ratings on the child’s perceived restlessness,
activity and happiness compared to other children their own age, all of which are
subjective. One possible explanation is that children of mothers with ED are objectively
more difficult than those of healthy control mothers, however, we cannot discard the
possibility that mothers with ED may perceive their child as being more difficult. Mothers

128
with ED have been shown to have difficulties with greater anxiety, which in turn has been
shown to predict a difficult infant temperament (Austin, Hadzi-Pavlovic, Leader, Saint, &
Parker, 2005). It has also been suggested that social information processing bias
(previously observed in ED (A. Harrison, Tchanturia, & Treasure, 2010)) may lead mothers
to interpret their child’s behaviour as more negative (H. J. Watson et al., 2014). However,
even if these difficulties are in ‘the eye of the beholder’ mothers perception is likely to
impact on their own sense of being a mother (Crockenberg & Acredolo, 1983) and are
likely to negatively impact on the child’s later development.
Boys of women with BN had higher odds of developing psychopathology across most
domains. In particular, findings that hyperactivity in boys was associated with maternal BN
are consistent with a previous study by Micali et al (N. Micali et al., 2013). This might be
due to the fact that BN and attention deficit and hyperactivity (ADHD) disorder share
several key features. Studies have shown that individuals with a diagnosis of ADHD are
at greater risk of developing an ED (Biederman et al., 2010; Sonneville et al., 2015;
Yoshimasu et al., 2012) and this association is particularly true for BN/binge eating (Nazar
et al., 2008). However, in this study, this was only significant for boys. One possible
explanation for this finding is that it might be due to the gender distribution of hyperactivity
and attention difficulties, which are more common in boys. An alternative explanation is
that mothers might be more likely to report these difficulties selectively by gender. Despite
this, the findings partly underscore the strong association between
hyperactivity/inattention and BN. Whether the nature of this association is via a shared
genetic link or whether hyperactivity/inattention is an intermediate phenotype for BN
remains to be determined.
Both girls and boys of women with AN had higher odds of having emotional problems
(internalising problems such as anxiety). These results are consistent with previous
research which highlighted the association between AN and emotional/anxiety disorders
(Pamela K Keel, Klump, Miller, McGue, & Iacono, 2005; Tracey D Wade, Bulik, Neale, &
Kendler, 2000), and are consistent with results from studies by Micali et al (N. Micali, B.
De Stavola, et al., 2014; N. Micali et al., 2013) using a large community cohort (ALSPAC).
Results are also consistent with the hypothesis that anxiety may represent an intermediate
phenotype for ED (Goddard & Treasure, 2013) across diagnoses. The study by Goddard
and Treasure recruited family trios (an offspring and both her parents) in which the
offspring either had an eating disorders or was a healthy control and examined trait
129
anxiety, social anxiety and emotional difficulties. They found that trait anxiety was elevated
in ED offspring and in parents of ED offspring who had never had an ED. These results
support a predispositional model of trait anxiety in the development of EDs (L. R. R.
Lilenfeld, Wonderlich, Riso, Crosby, & Mitchell, 2006; J. Swinbourne et al., 2012; J. M.
Swinbourne & Touyz, 2007) and are consistent with previous studies that have suggested
anxiety is a familial risk factor for EDs with genetic underpinnings (L. R. Lilenfeld et al.,
1998; Strober, Freeman, Lampert, & Diamond, 2007). Kaye et al (W. H. Kaye et al., 2004)
proposed that premorbid high anxiety in individuals with ED can make them more
vulnerable to perceive feedback from their environment in a negative way. Furthermore,
testimonies from ED patients, also show calorie restriction as a way of gaining control and
reducing anxiety levels (becoming intrinsically rewarding) (Dignon, Beardsmore, Spain, &
Kuan, 2006).
Another interesting finding relates to peer difficulties in this sample. Results showed that
boys of women with a lifetime history of BN (both those who reported BN only and AN+BN)
have more peer problems when compared to children of healthy women. The questions in
the SDQ that load to the peer problems reflect problems engaging and communicating
with other children, which could be a reflection of social communication problems. We
have previously shown that children at risk for BN had difficulties in recognising emotions
and had worse social communication (R. Kothari, Barona, Treasure, & Micali, Under
review) compared to controls. These results might point to an overlap between BN and
social communication difficulties. Interestingly, in the literature it is patients with AN who
have been suggested to have social communication difficulties. Gillberg and colleagues
(C. Gillberg & Råstam, 1992) proposed that some cases of AN reflected underlying social
communication difficulties. Since then, more research has investigated traits present in
both disorders and common possible intermediate phenotypes have been suggested for
both disorders. Furthermore, the interpersonal model for AN (Chapter 2) proposes that
anxiety and social communication difficulties can be a vulnerability for the development of
the disorder (J. Treasure & U. Schmidt, 2013). Zucker and colleagues (Zucker et al., 2007)
identified premorbid traits of anxiety as well as comorbidities with ASD (as well as social
phobia and OCD) as aspects of central importance in the development of a risk model for
AN.
It is important to take into account the possibility that children of parents with a
psychopathology have a general higher risk of having any psychopathology, and that
130
findings of higher internalizing or externalising disorders are not intermediate phenotypes
but a general non-specific risk for psychopathology. However, it has been found that
specific anxious/depressed behaviours, somatic problems or conduct behaviours in
children were best predicted by the same problem behaviour in the parent (van Meurs,
Reef, Verhulst, & van der Ende, 2009). Similar results have been found for the relationship
between depression in children of mothers with depression (Beck, 1999), although they
were also found to be at risk of developing conduct behaviour (Beck, 1999). Importantly,
research has consistently found a higher prevalence of ED in first degree relatives of those
with an ED (Bulik, 2005; Bulik et al., 2006; L. R. Lilenfeld et al., 1998; Mazzeo & Bulik,
2009), and numerous twin studies suggest that liability to AN and BN is significantly
influences by additive genetic factors (Klump, Miller, Keel, McGue, & Iacono, 2001; T.
Wade, Martin, & Tiggemann, 1998; Tracey D Wade et al., 2000; Tracey D Wade et al.,
2011). It is also important to consider the complex interplay of genetic and environmental
factors in the development of psychopathology. Many associates have been found
between parental practices as childhood anxiety, such as parental control (McLeod, Wood,
& Weisz, 2007; Weijers, van Steensel, & Bögels, 2018). Of course, children also learn from
their parents (e.g. vie conditioning or operant learning procedures, or via imitation and
listening), and through their own personalities and ways of copying, in this sense parental
psychopathology can plan a role as part of a learned behaviour. For example, parental
stress has been found to predict child behaviour problems (Ashford, Smit, van Lier,
Cuijpers, & Koot, 2008) (e.g., Ashfort et al., 2008). Thus, parents may play a role in the
development of their child’s psychopathology in multiple ways, both through genetic
charge and environmentally. In ED, one way of trying to discern between genetic and
environmental parental load is by studying children or mothers with a current ED and those
with a past ED. The hypothesis being that in both cases children will have a higher-genetic
risk, but for current cases their environment might be another predictor. In the current
study, mediation analysis were used to understand the direct or indirect nature of maternal
ED diagnosis. We used the data collected with regards to child temperament, where
mothers reported their child as having a difficult temperament which we hypothesise will
have an impact on their behaviour and parenting. Our mediation analyses suggest some
differences in mediation pathways across maternal diagnosis; for example, whilst child
temperament partially mediated the effect of BN on child psychopathology (pointing to a
potential genetic and environmental effect), for maternal AN, there was no direct effect of
the ED on child psychopathology.
131
Finally, there were some significant differences in maternal age and parity between groups
which may shed some light into differences between maternal diagnosis. There was a
higher proportion of mothers with only one child in mother with BN compared to mothers
with AN, AN+BN and unexposed. It is possible to hypothesise that mother with BN find
motherhood a ore overwhelming experience, with difficult conflicts between the demands
of bringing up a child and the bulimic disorder. This in turn could create tension in the
mother-child relationship. Mothers with BN and those with AN+BN were also younger than
those with AN and unexposed. BN has been linked to a more impulsive personality profile
(Seitz et al., 2013) which could partly explain a younger age in mothers with BN. These
significant differences between maternal ED groups provide some more insight into
differences between diagnoses and could possibly be linked with neuropsychological
profiles identified in AN and BN. Further investigation is warranted.
5.4.1. Strengths and limitations
The main strengths of this study are the large sample size, the prospective data collection,
and the availability of register-based information on socio-demographic data. This is the
largest study investigating maternal ED and the effect of childhood psychopathology to
date.
Limitations have to be taken into account: firstly the information on maternal ED was
obtained from self-report during interviews. However, a recent study validated self-
reported ED in a similar population based sample of pregnant women with very good
sensitivity and specificity of self-reported AN and BN (N Micali et al., 2012). Furthermore,
there is evidence from past research that self-report measures might be as reliable, as
other, more frequently, used measures (Anna Keski-Rahkonen et al., 2006). Another
important limitation is that data on the children were obtained from mothers (shared
method variance). The variables on child temperament and difficulties looking after the
child were based on questionnaires designed for DNBC and have therefore not been
validated. While measures obtained from mothers can be subjective, it is an important way
of acquiring information in large samples and at a young age, when the child cannot self-
report and an informant (e.g. teacher) is not available. Taking this into consideration, it is
important that future studies should explore the psychometric properties of these
measures in order to validate them. One possible future study, could consider if early
temperament can predict later childhood psychopathology as a way of helping clarify the
132
validity of the measure. We found evidence of selective attrition amongst women with ED,
therefore generalizability of this study might be affected. It is difficult to know whether the
selective attrition might be reflective of more severely ill mothers being lost to follow up or
whether children with lower levels of psychopathology might be lost to follow up, therefore
whether results are biased towards the null or not. However in a previous similar study
(Nadia Micali et al., 2013), children with higher psychopathology were more likely to be
lost to follow-up therefore suggesting that OR might be biased towards the null. This
means that we may be underestimating the effect found in our study if we expect more
severely ill mothers to be lost to the study.
5.5. Conclusion
This study has important research implications for our understanding of shared diathesis
for psychopathology and ED. At risk studies have the potential to provide important
information about intermediate phenotypes. Further investigation of specific risk pathways
and mechanisms in the intergenerational transmission of psychopathology in children of
parents with ED is needed. Studies focusing on children at risk and on understanding risk
mechanisms will be indispensable for developing early intervention programs as well as
prevention strategies, and to improve our understanding of ED and their pathophysiology.
133
Chapter 6. White matter alterations in anorexia nervosa:
evidence from a voxel-based meta-analysis
This chapter has been published in Neuroscience and Biobehavioural reviews (Barona et
al., 2019) and findings were presented at International Conference on Eating Disorders in
2017.
6.1. Introduction
As established in Chapter 1, in the last decades there have been a number of advances
in our understanding of volumetric and functional brain differences in ED’s. The
heterogeneity of findings and large number of areas involved in the pathophysiology of
ED’s suggests a critical role of interconnections of cortical and subcortical regions,
warranting therefore further exploration of the structural connectivity in ED. More recently
thanks to the development of neuroimaging techniques that allow us to study white matter
structures through their water diffusion properties we have been able to investigate these
connections and microstructure of white matter bundles.
As established in Chapter 2, diffusion tensor imaging (DTI), a non-invasive magnetic
resonance method based on the diffusion characteristics of water, has been used to study
WM microstructure (Beaulieu, 2002; Le Bihan & Johansen-Berg, 2012). One of the most
commonly used parameters for measuring WM microstructure is fractional anisotropy
(FA), a scalar value that measures the directionality of water diffusion. To date, the large
majority of DTI studies in AN have been based on small samples (n < 25) and have mostly
used voxel-based approaches to study water diffusion in the brain, with only three studies
to date utilising tractography, however, results have been mixed (for a review see Monzon
et. al. 2016 (Martin Monzon, Hay, Foroughi, & Touyz, 2016)). WM microstructure
alterations have been found in acute patients with AN, both adults (J. Cha et al., 2016a;
Frieling et al., 2012b; Hayes et al., 2015; Kazlouski et al., 2011a; Nagahara et al., 2014;
Shott, Pryor, Yang, & Frank, 2016; E. Via et al., 2014; Yau et al., 2013) and adolescents
(J. Cha et al., 2016a; G. K. Frank, M. E. Shott, J. O. Hagman, & T. T. Yang, 2013; S.
Gaudio et al., 2017; Hu et al., 2017; Travis et al., 2015; Vogel et al., 2016), in multiple WM
134
tracts, including the fornix, cingulum, posterior thalamic-radiations, fronto-occipital
fasciculus, superior longitudinal fasciculus and cerebellum. Studies have also found
differences in recovered patients (J. Cha et al., 2016a; Frieling et al., 2012b; Shott et al.,
2016; Yau et al., 2013). However, other studies have also yielded non-significant findings
in both acute and recovered patients. Only three studies have used tractography to provide
further detail on WM microstructure. Travis and colleagues in 2015 (Travis et al., 2015)
studied adolescents with acute AN and found both increased FA (in thalamic radiation and
left anterior longitudinal fasciculus) and decreased FA (in fornix and superior longitudinal
fasciculus); whilst Hayes and colleagues in 2015(Hayes et al., 2015) studied adults with
acute AN who were treatment-resistant and found decreased FA in several areas including
the fornix and cingulum. More recently Pfuhl and colleagues (Pfuhl et al., 2016) found no
differences in WM microstructure in acute or recovered patients with AN. Although most
studies have found FA to be reduced, two studies, one by Frank and colleagues in 2013
(G. K. Frank, M. E. Shott, J. O. Hagman, & T. T. Yang, 2013) and a second by Vogel and
colleagues in 2016 (Vogel et al., 2016) reported an increase in FA (Vogel only reported
increase while Frank and colleagues reported both increased and decreased FA), both
studies only included adolescents. Available evidence therefore suggests that FA
alterations are present in AN, however there is significant between-study variability as to
the spatial distribution of these abnormalities making any conclusions on WM
microstructure in patients with AN complex.
To date only two studies have investigated WM microstructural differences in BN (He,
Stefan, Terranova, Steinglass, & Marsh, 2016; Mettler, Shott, Pryor, Yang, & Frank, 2013).
Both studies found alteration in WM microstructure in patients with BN. The studies
showed alterations in projection, association and commissural tracts. Specifically both
studies found alterations in the inferior fronto-occipital and uncinate fasciculi. Other areas
showed to be altered were the corona radiata, corpus callosum, forceps minor and major,
SLF and cingulum were also found. Although both studies showed lowered FA in patients
with BN compared to healthy controls, these alterations in BN are poorly explored and
therefore understood.
The current study aims to identify whether consistent changes in regional FA could be
identified in AN patients compared to controls in order to inform further research in children
at-risk. To this purpose, we conducted a search of the available DTI literature in AN
followed by a meta-analysis of eligible studies using anisotropic effect size-signed
135
differential mapping (AES-SDM). As the most common method used in the area of study
are voxel-based methods, with only three tractography studies published to date, the meta-
analysis will focus only on voxel-based methodology. We also performed a meta-
regression to examine the mediating effect of Body Mass Index (BMI). Two exploratory
subgroup analyses were also undertaken to determine the effect of age (looking only at
adult studies) and stage of the disorder (looking only at acute studies).
6.2. Methods and materials
6.2.1. Data source
We adhered to the guidelines detailed in the PRISMA Statement (Moher, Liberati, Tetzlaff,
& Altman, 2009) and registered this study in PROSPERO (registration number
CRD42016042525). A systematic and comprehensive search of databases, including
Embase, PubMed and Psychinfo was carried out for studies published between January
1990 and May 2018. The search was performed using the following MESH terms and
keywords: (‘eating disorders’ or ‘anorexia nervosa’ or ‘AN’ or ‘anorexia’) and (‘dti’ or
‘diffusion tensor imaging’ or ‘diffusion weighted imaging’ or ‘tractography’). The search was
finalized on the 1st May 2018.
6.2.2. Study selection
Eligible DTI studies fulfilled the following inclusion criteria: (1) conducted voxel-based
analyses; (2) compared FA values between AN and healthy controls; (3) reported whole-
brain results in 3-dimensional coordinates (x, y, z); (4) used a threshold for significance
and (5) were published in English.
Studies were excluded if: (1) it was a tractography based study; (2) studies of eating
disorders other than AN.
6.2.3. Quality assessment and data extraction
Two authors independently screened, extracted and cross-checked the data from retrieved
articles based on the eligibility criteria outlined above. The quality of the final studies was
136
also independently checked by both authors using the Newcastle-Ottawa Scale (Wells et
al.) for assessing the quality of non-randomized studies in meta-analyses. For each study
the following data were extracted: demographic information (age), sample size (sample
size), age (mean age), BMI (mean BMI), AN type and AN status (acute vs recovered) and
the three-dimensional peak coordinates of case-control differences in each study.
6.2.4. Voxel-based meta-analysis
A voxel-based meta-analysis of regional case-control differences in FA values of WM was
performed using SDM software v4.31 (http://www.sdmproject.com) (Radua & Mataix-Cols,
2009). The above method improves upon existing methods and has been used in several
meta-analyses of voxel-based studies (Emre Bora, Fornito, Yücel, & Pantelis, 2010;
Radua, Via, Catani, & Mataix-Cols, 2011). The software’s main advantage is that it uses
restricted maximum likelihood estimation of the variance with the reported peak
coordinates to recreate maps of the positive and negative FA differences between patients
and controls, rather than just assessing the probability or likelihood of a peak.
The method has three steps: (1) coordinates and magnitude of cluster peaks of case-
control differences (e.g. the voxels where the differences between patients and health
controls were highest in each study) are selected according to inclusion criteria, (2) the
coordinates are used to recreate statistical maps, effect-size maps and their variances
derived from t-statistics (Z- or p- values for significant clusters which were then converted
to t-statistics using the SDM online conversion utilities), and (3) individual study maps are
entered into the meta-analysis and the outcome is further tested in terms of sensitivity and
heterogeneity.
In more detail, after the conversion of the coordinates to MNI space, an SDM map is
created for each study using a specific mask (e.g. TBSS). The coordinates are then used
to recreate statistical maps and effect sized maps. Pre-processing of reported peak
coordinates (from each study) are done by recreating the clusters of difference by means
on an anisotropic un-normalized Gaussian Kernel, so that the voxels more correlated with
the peak coordinate have effect-sizes similar to those of the peak. Finally, the resulting
individual maps are meta-analyzed to complement the main outcome with sensitivity and
137
heterogeneity analyses (The meta-analytic value of each voxel in the m-a map is defined
as the proportion of studies reporting a coordinate around the voxel).
We first calculated the mean of the FA voxel peaks in the different studies, accounting for
the variance and inter-study heterogeneity. A systematic whole-brain voxel-based jack-
knife sensitivity analysis was performed using the leave-one out method. Exploratory
subgroup analyses were also conducted to check for main differences based on age
(adults vs. adolescents (under 18 years old) and illness status (acute vs. recovered).
The analytical parameters of SDM were those suggested by the software developers
(Emre Bora et al., 2010; Radua & Mataix-Cols, 2009; Radua et al., 2012; Radua et al.,
2011) and as follows: anisotropy = 1.0; isotropic full-width at half-maximum (FWHM) = 20
mm; voxel p = 0.005; cluster = 10 voxels with 500 repetitions of standard randomization
tests. A specific mask and correlation template for white matter was used. We used FSL
visualization software (http://fsl.fmrib.ox.ac.uk/fsl/fslwiki/) to visualize SDM maps that were
overlaid onto a high resolution brain template (White matter atlas; http://www.dtiatlas.org/).
An uncorrected p < 0.001 was used, which has been described by the authors to be
empirically equivalent to a corrected p < 0.05. All parameters where used as suggested
by the authors of the meta-analytic method (28, 29, 31) and as previously used in other
studies.
The coordinates for one of the main significant area were extracted and separately
mapped into a standard diffusion image to provide a three dimensional image of the most
likely tracts traversing a bounding 5mm box centred on the coordinates using MRtrix
software (http://www.mrtrix.org/).
6.2.5. Meta-regression
The effect of BMI was examined by means of simple linear regression, weighted by the
square root of the sample size and restricted to only predict possible SDM values (i.e. from
-1 to 1) in the observed range of values of the variable. The main output for each variable
is a map of the regression slope. In order to minimize the detection of spurious
relationships we decreased the probability threshold to 0.0005. Required abnormalities

138
need to be detected both in the slope and in one of the extremes of the regressor. Findings
in regions other than those detected in the main analyses were discarded. Further
regression analyses were done using only adult and acute subgroups. Since the BMI used
for adolescent sample was not standardized and a low BMI for adult could a near normal
for adolescents we run the regression analyses using the adult sample only. The acute
group has a lower BMI and therefore we could expect the correlation to exist only in this
group. Meta-regression results should be taken with some caution because of the limited
variability in the data and the low sample size.
6.3. Results
The search strategy yielded a total of 387 studies, of which 13 met criteria for inclusion.
The PRISMA diagram in Fig. 6.1 shows selection and exclusion of studies.

139
Figure 6.1. Flow diagram for the identification and exclusion of studies.
6.3.1. Meta-analysis: Included studies and sample characteristics
Table 6.1 summarizes the characteristics of the 13 studies included in the meta-analysis.
Table 6.2 summarizes the technical characteristics of studies included in the meta-
analysis.
The included studies reported FA alterations of WM in individuals with AN (N = 227, mean
age 22.5) relative to healthy controls (N = 243, mean age 21.9).
Iden
tifi
cati
on
Sc
reen
ing
Elig
ibili
ty
Incl
ud
ed
Records identified through database
searching (N = 387)
Records after removing duplicates
(n=137) (N = 250)
Abstracts screened (N = 250) Wrong exposure/outcome (N = 213)
Wrong measure (N = 17)
Conference abstract (N = 13)
Review (N = 7) Full-text articles assessed for eligibility
(N = 16)
Excluded: wrong analysis
(tractography) (N = 3)
Articles included for meta-analysis and
review (N = 13)
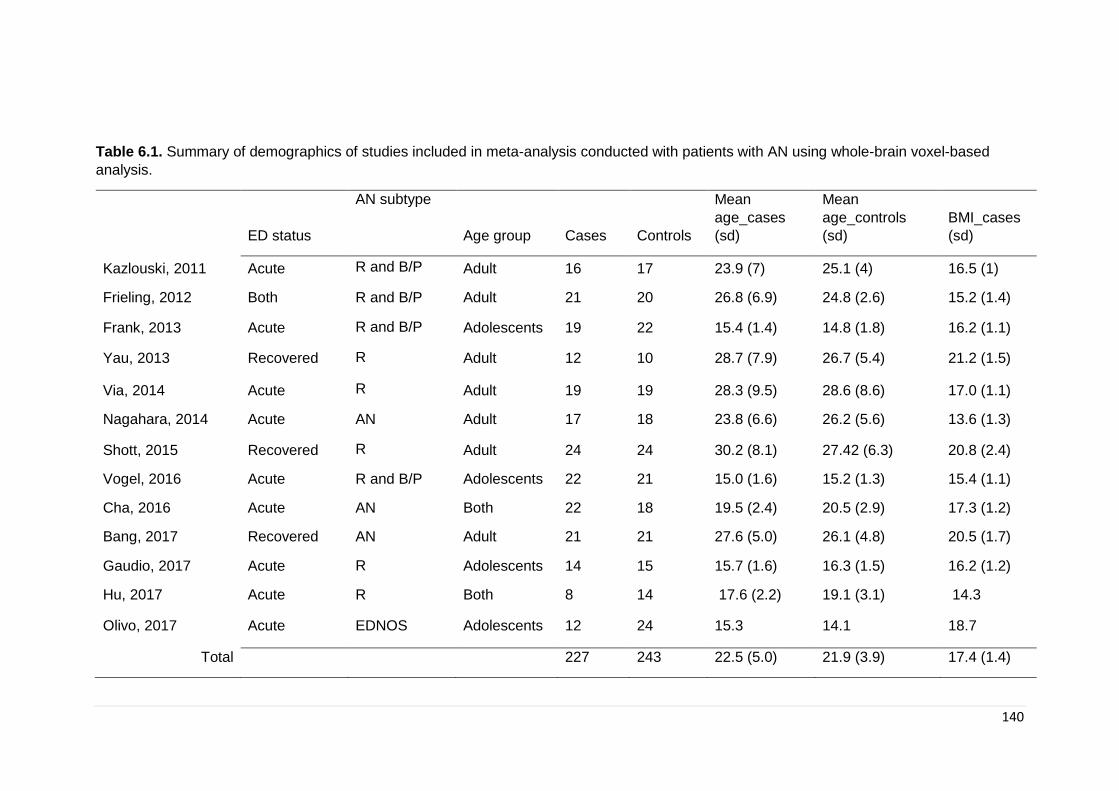
140
Table 6.1. Summary of demographics of studies included in meta-analysis conducted with patients with AN using whole-brain voxel-based
analysis.
ED status
AN subtype
Age group Cases Controls
Mean
age_cases
(sd)
Mean
age_controls
(sd)
BMI_cases
(sd)
Kazlouski, 2011 Acute R and B/P Adult 16 17 23.9 (7) 25.1 (4) 16.5 (1)
Frieling, 2012 Both R and B/P Adult 21 20 26.8 (6.9) 24.8 (2.6) 15.2 (1.4)
Frank, 2013 Acute R and B/P Adolescents 19 22 15.4 (1.4) 14.8 (1.8) 16.2 (1.1)
Yau, 2013 Recovered R Adult 12 10 28.7 (7.9) 26.7 (5.4) 21.2 (1.5)
Via, 2014 Acute R Adult 19 19 28.3 (9.5) 28.6 (8.6) 17.0 (1.1)
Nagahara, 2014 Acute AN Adult 17 18 23.8 (6.6) 26.2 (5.6) 13.6 (1.3)
Shott, 2015 Recovered R Adult 24 24 30.2 (8.1) 27.42 (6.3) 20.8 (2.4)
Vogel, 2016 Acute R and B/P Adolescents 22 21 15.0 (1.6) 15.2 (1.3) 15.4 (1.1)
Cha, 2016 Acute AN Both 22 18 19.5 (2.4) 20.5 (2.9) 17.3 (1.2)
Bang, 2017 Recovered AN Adult 21 21 27.6 (5.0) 26.1 (4.8) 20.5 (1.7)
Gaudio, 2017 Acute R Adolescents 14 15 15.7 (1.6) 16.3 (1.5) 16.2 (1.2)
Hu, 2017 Acute R Both 8 14 17.6 (2.2) 19.1 (3.1) 14.3
Olivo, 2017 Acute EDNOS Adolescents 12 24 15.3 14.1 18.7
Total
227 243 22.5 (5.0) 21.9 (3.9) 17.4 (1.4)

141
Table 6.2. Summary of technical imaging data and patient status at scanning time of studies included in meta-analysis conducted with patients
with AN using whole-brain voxel-based analysis.
MRI Software p value Patient status at scanning
Kazkiysju, 2011 3T SPM5a P < 0.05, corrected (FDRc) within one or two weeks of admission, no electrolyte
abnormalities
Frieling, 2012 3T SPM2 P < 0.05, corrected (FDR) recovered: BMI of 18.5 and no ED behaviours one year; acute:
AN diagnosis
Frank, 2013 3T SPM8 p < 0.005 uncorrected within two weeks of start of treatment no rehydration
Yau, 2013 - FSL - Recovered: 12 months
Via, 2014 1.5T FSLb p < 0.05, corrected (FWEd) at least one week of rehydration
Nagahara, 2014 3T FSL p < 0.05, corrected no signs of rehydration
Shott, 2015 - FSL p < 0.05, corrected (FWE) Recovered: 12 months, no ED behaviours
Vogel, 2016 3T FSL/SPM P < 0.05, corrected Weight at admission
Cha, 2016 1.5T FSL - at least 24 hours of rehydration
Bang, 2016 3T FSL p < 0.05, corrected (FWE) Recovered: 12 month

142
Gaudio, 2017 1.5T FSL p < 0.05, corrected (FWE) duration of less than 6 months and scanned within a week of
diagnosis
Hu, 2017 3T SPM P < 0.05, corrected (FDR) at least one week of rehydration
Olivo, 2017 3T FSL P < 0.05, corrected (FDR) upon diagnosis
aSPM: statistical parametric mapping; bFSL: FMRIB software library; cFDR: false discovery rate; dFWE: family-wise error rate
143
6.3.2. Regional differences in FA
MNI coordinates for the SDM meta-analysis were obtained from all 13 studies. As shown
in table 6.3 and figure 6.2 and 6.3, patients with AN had significantly lower FA values in
five clusters compared to healthy controls. Three of the five clusters exhibited a peak in
the corpus callosum (CC) (MNI: -2,-18,18; 18,-58,30 and -22,24,30). The first peak (MNI
= 2,-18,18) included voxels in the corpus callosum, thalamus, anterior thalamic
projections, caudate nucleus, cortico-spinal projections and pons; the second peak (MNI
= 18,-58,30) included voxels located in the corpus callosum, right precuneus and right
cuneus and the third peak and smallest (MNI = -22,24,30) included voxels only in the
corpus callosum. The two other peaks were found in the left superior longitudinal
fasciculus II (MNI = -31,-34,36) and the left precentral gyrus, BA44 (MNI = -48,6,20). In
addition, patients with AN had significantly higher FA values in the right cortico-spinal
projections (MNI: 6,-16,-24), and right and left lingual gyrus BA18 (respectively: MNI = 10,-
86,-12 and MNI = -28,-90,-14).
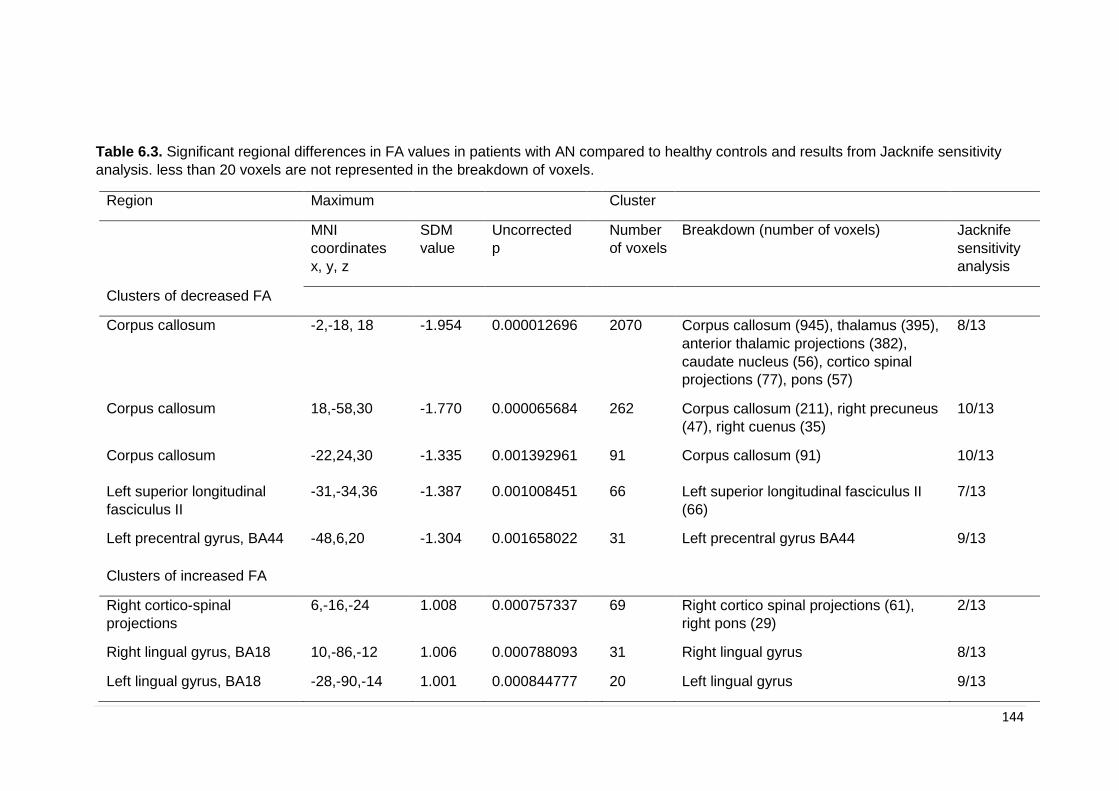
144
Table 6.3. Significant regional differences in FA values in patients with AN compared to healthy controls and results from Jacknife sensitivity
analysis. less than 20 voxels are not represented in the breakdown of voxels.
Region Maximum Cluster
MNI
coordinates
x, y, z
SDM
value
Uncorrected
p
Number
of voxels
Breakdown (number of voxels) Jacknife
sensitivity
analysis
Clusters of decreased FA
Corpus callosum -2,-18, 18 -1.954 0.000012696 2070 Corpus callosum (945), thalamus (395),
anterior thalamic projections (382),
caudate nucleus (56), cortico spinal
projections (77), pons (57)
8/13
Corpus callosum 18,-58,30 -1.770 0.000065684
262 Corpus callosum (211), right precuneus
(47), right cuenus (35)
10/13
Corpus callosum -22,24,30 -1.335 0.001392961 91 Corpus callosum (91) 10/13
Left superior longitudinal
fasciculus II
-31,-34,36 -1.387 0.001008451 66 Left superior longitudinal fasciculus II
(66)
7/13
Left precentral gyrus, BA44 -48,6,20 -1.304 0.001658022
31 Left precentral gyrus BA44 9/13
Clusters of increased FA
Right cortico-spinal
projections
6,-16,-24 1.008 0.000757337
69 Right cortico spinal projections (61),
right pons (29)
2/13
Right lingual gyrus, BA18 10,-86,-12 1.006 0.000788093
31 Right lingual gyrus 8/13
Left lingual gyrus, BA18 -28,-90,-14 1.001 0.000844777
20 Left lingual gyrus 9/13
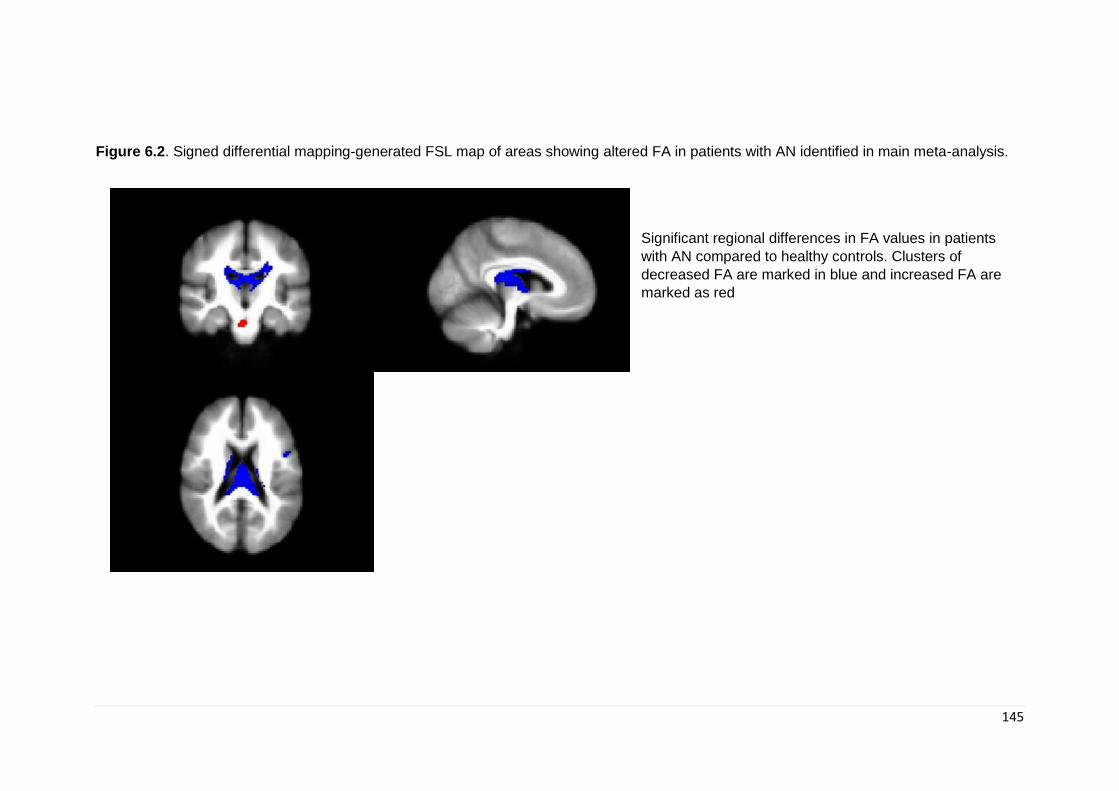
145
Figure 6.2. Signed differential mapping-generated FSL map of areas showing altered FA in patients with AN identified in main meta-analysis.
Significant regional differences in FA values in patients
with AN compared to healthy controls. Clusters of
decreased FA are marked in blue and increased FA are
marked as red
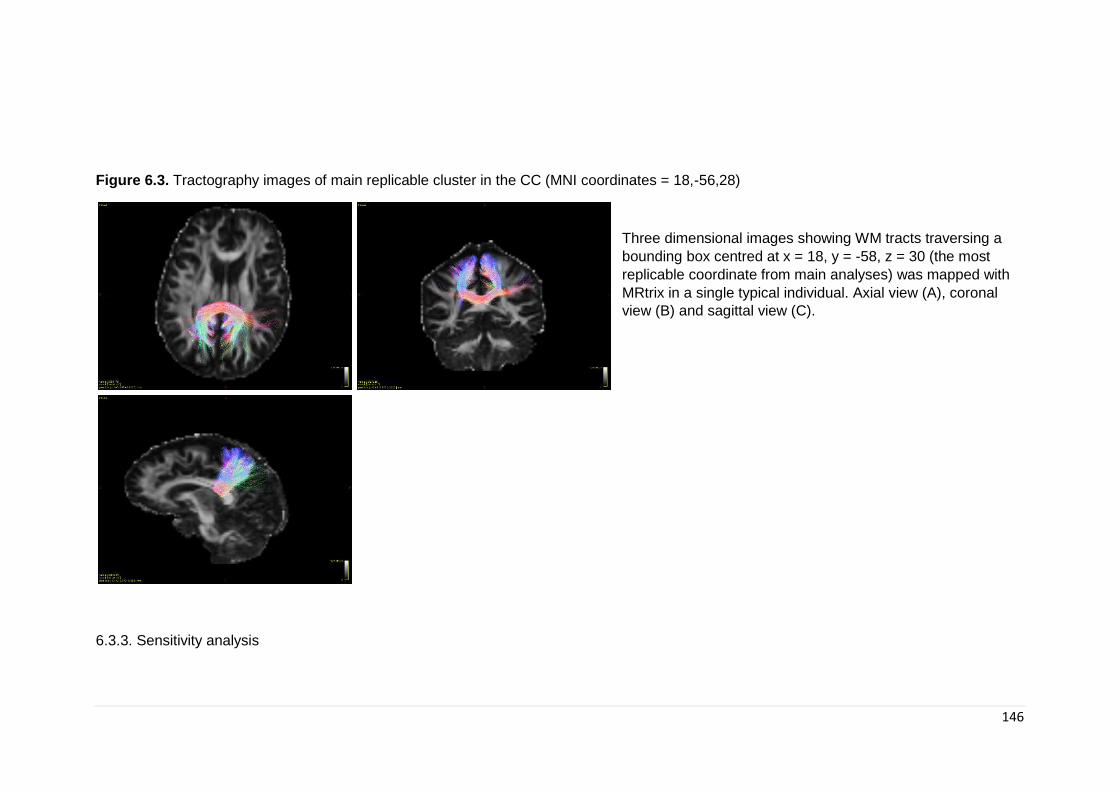
146
Figure 6.3. Tractography images of main replicable cluster in the CC (MNI coordinates = 18,-56,28)
Three dimensional images showing WM tracts traversing a
bounding box centred at x = 18, y = -58, z = 30 (the most
replicable coordinate from main analyses) was mapped with
MRtrix in a single typical individual. Axial view (A), coronal
view (B) and sagittal view (C).
6.3.3. Sensitivity analysis
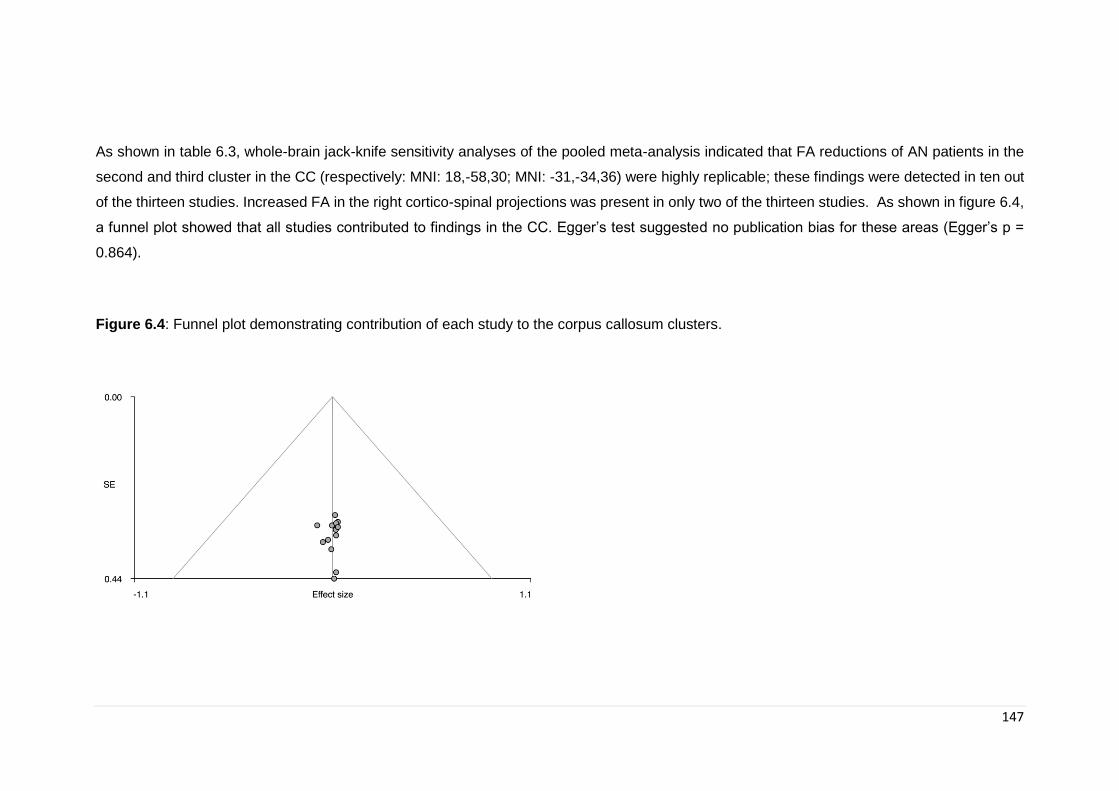
147
As shown in table 6.3, whole-brain jack-knife sensitivity analyses of the pooled meta-analysis indicated that FA reductions of AN patients in the
second and third cluster in the CC (respectively: MNI: 18,-58,30; MNI: -31,-34,36) were highly replicable; these findings were detected in ten out
of the thirteen studies. Increased FA in the right cortico-spinal projections was present in only two of the thirteen studies. As shown in figure 6.4,
a funnel plot showed that all studies contributed to findings in the CC. Egger’s test suggested no publication bias for these areas (Egger’s p =
0.864).
Figure 6.4: Funnel plot demonstrating contribution of each study to the corpus callosum clusters.
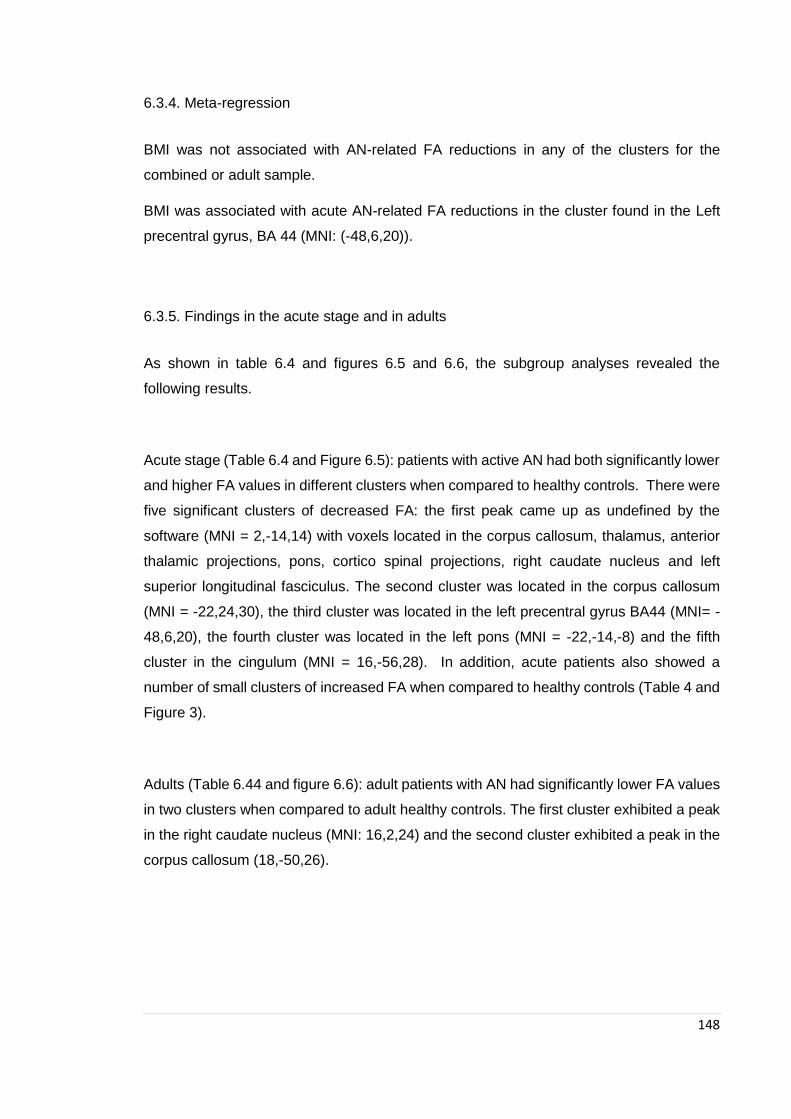
148
6.3.4. Meta-regression
BMI was not associated with AN-related FA reductions in any of the clusters for the
combined or adult sample.
BMI was associated with acute AN-related FA reductions in the cluster found in the Left
precentral gyrus, BA 44 (MNI: (-48,6,20)).
6.3.5. Findings in the acute stage and in adults
As shown in table 6.4 and figures 6.5 and 6.6, the subgroup analyses revealed the
following results.
Acute stage (Table 6.4 and Figure 6.5): patients with active AN had both significantly lower
and higher FA values in different clusters when compared to healthy controls. There were
five significant clusters of decreased FA: the first peak came up as undefined by the
software (MNI = 2,-14,14) with voxels located in the corpus callosum, thalamus, anterior
thalamic projections, pons, cortico spinal projections, right caudate nucleus and left
superior longitudinal fasciculus. The second cluster was located in the corpus callosum
(MNI = -22,24,30), the third cluster was located in the left precentral gyrus BA44 (MNI= -
48,6,20), the fourth cluster was located in the left pons (MNI = -22,-14,-8) and the fifth
cluster in the cingulum (MNI = 16,-56,28). In addition, acute patients also showed a
number of small clusters of increased FA when compared to healthy controls (Table 4 and
Figure 3).
Adults (Table 6.44 and figure 6.6): adult patients with AN had significantly lower FA values
in two clusters when compared to adult healthy controls. The first cluster exhibited a peak
in the right caudate nucleus (MNI: 16,2,24) and the second cluster exhibited a peak in the
corpus callosum (18,-50,26).
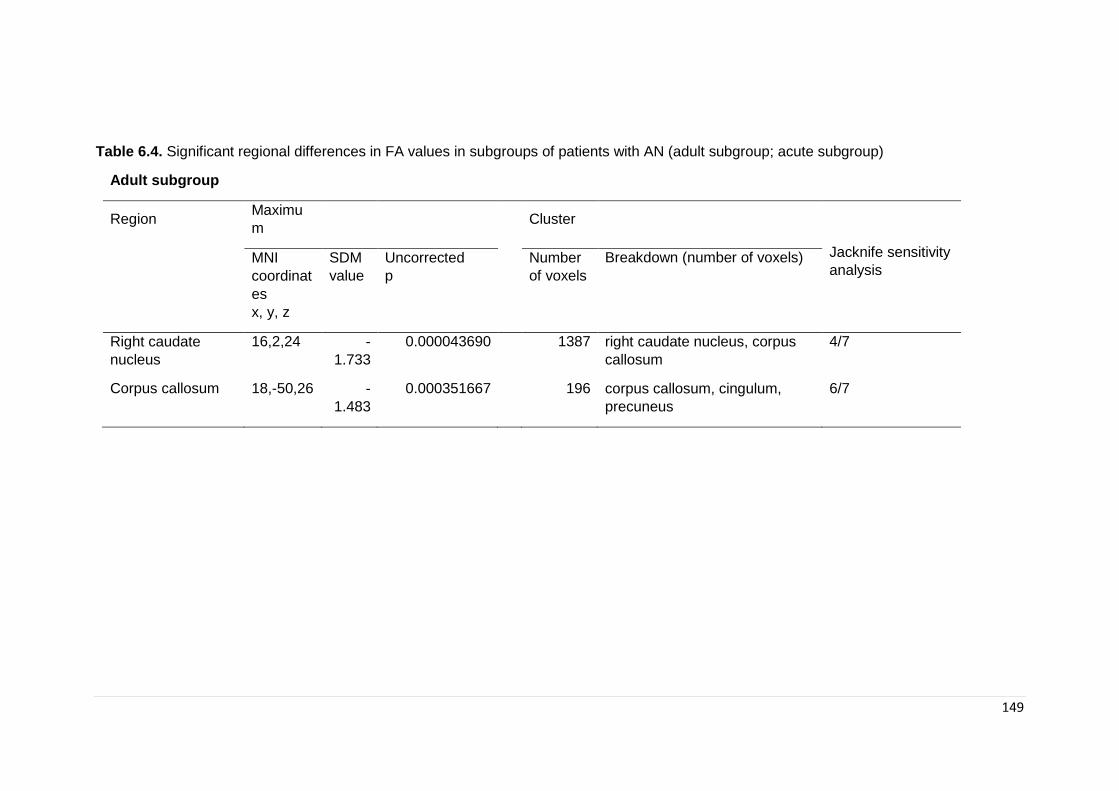
149
Table 6.4. Significant regional differences in FA values in subgroups of patients with AN (adult subgroup; acute subgroup)
Adult subgroup
Region Maximu
m
Cluster
Jacknife sensitivity
analysis
MNI
coordinat
es
x, y, z
SDM
value
Uncorrected
p
Number
of voxels
Breakdown (number of voxels)
Right caudate
nucleus
16,2,24 -
1.733
0.000043690 1387 right caudate nucleus, corpus
callosum
4/7
Corpus callosum 18,-50,26 -
1.483
0.000351667 196 corpus callosum, cingulum,
precuneus
6/7
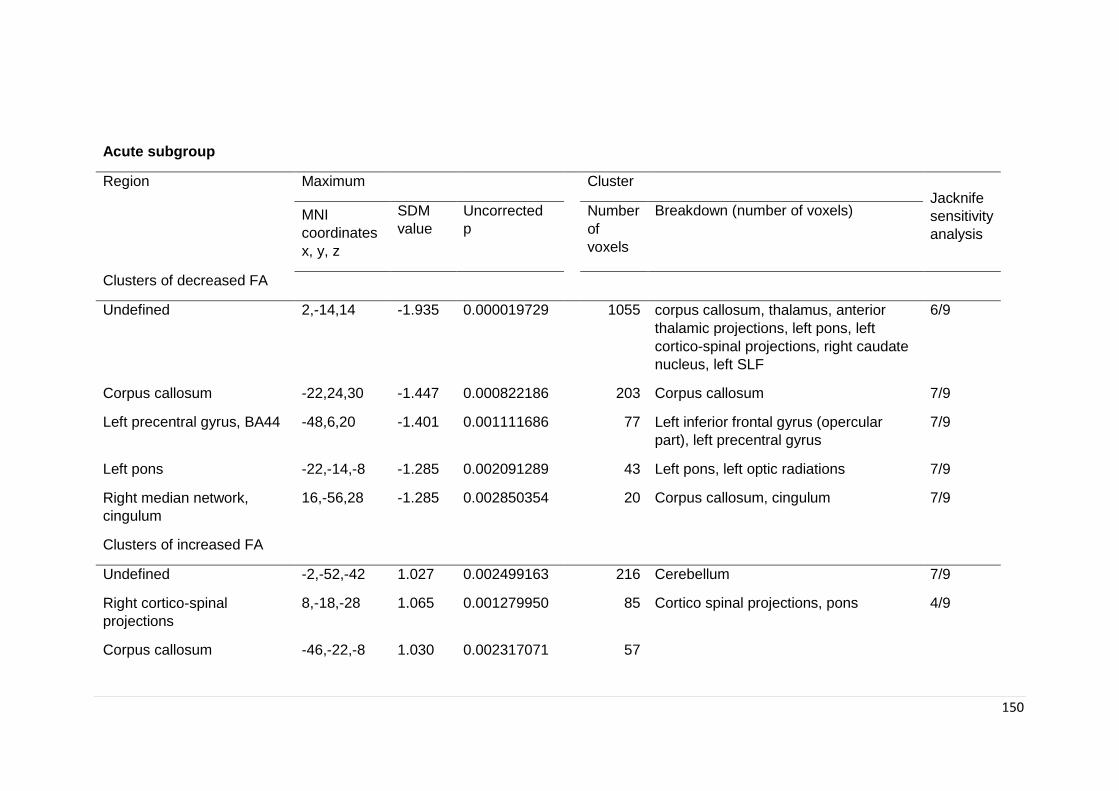
150
Acute subgroup
Region Maximum Cluster Jacknife
sensitivity
analysis
MNI
coordinates
x, y, z
SDM
value
Uncorrected
p
Number
of
voxels
Breakdown (number of voxels)
Clusters of decreased FA
Undefined 2,-14,14 -1.935 0.000019729 1055 corpus callosum, thalamus, anterior
thalamic projections, left pons, left
cortico-spinal projections, right caudate
nucleus, left SLF
6/9
Corpus callosum -22,24,30 -1.447 0.000822186 203 Corpus callosum 7/9
Left precentral gyrus, BA44 -48,6,20 -1.401 0.001111686
77 Left inferior frontal gyrus (opercular
part), left precentral gyrus
7/9
Left pons -22,-14,-8 -1.285 0.002091289
43 Left pons, left optic radiations 7/9
Right median network,
cingulum
16,-56,28 -1.285 0.002850354
20 Corpus callosum, cingulum 7/9
Clusters of increased FA
Undefined -2,-52,-42 1.027 0.002499163
216 Cerebellum 7/9
Right cortico-spinal
projections
8,-18,-28 1.065 0.001279950
85 Cortico spinal projections, pons 4/9
Corpus callosum -46,-22,-8 1.030 0.002317071
57
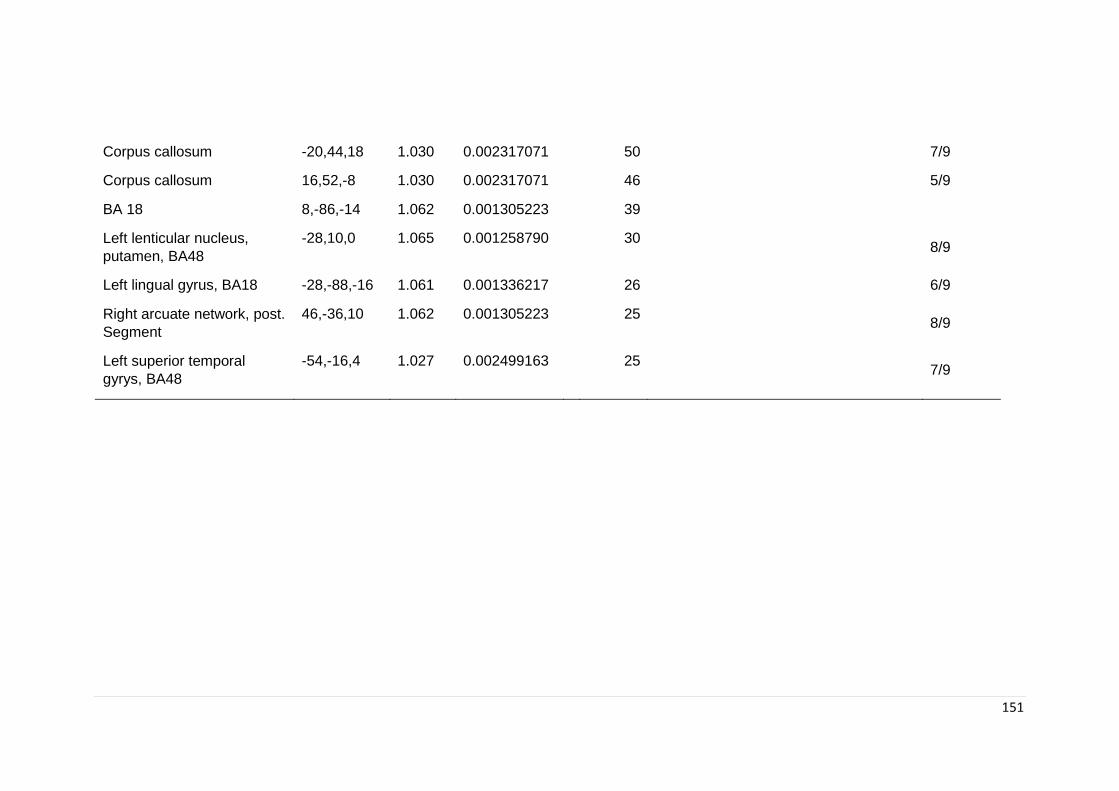
151
Corpus callosum -20,44,18 1.030 0.002317071
50
7/9
Corpus callosum 16,52,-8 1.030 0.002317071
46
5/9
BA 18 8,-86,-14 1.062 0.001305223
39
Left lenticular nucleus,
putamen, BA48
-28,10,0 1.065 0.001258790
30
8/9
Left lingual gyrus, BA18 -28,-88,-16 1.061 0.001336217
26
6/9
Right arcuate network, post.
Segment
46,-36,10 1.062 0.001305223 25 8/9
Left superior temporal
gyrys, BA48
-54,-16,4 1.027 0.002499163 25 7/9
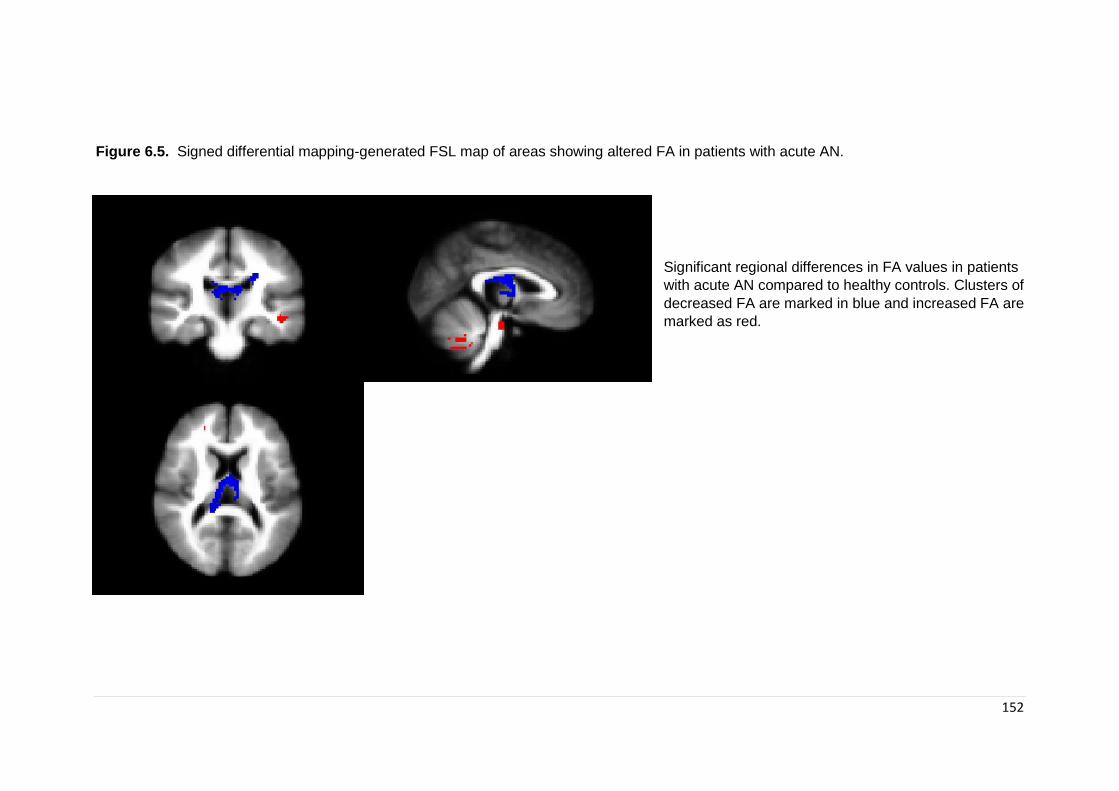
152
Figure 6.5. Signed differential mapping-generated FSL map of areas showing altered FA in patients with acute AN.
Significant regional differences in FA values in patients
with acute AN compared to healthy controls. Clusters of
decreased FA are marked in blue and increased FA are
marked as red.
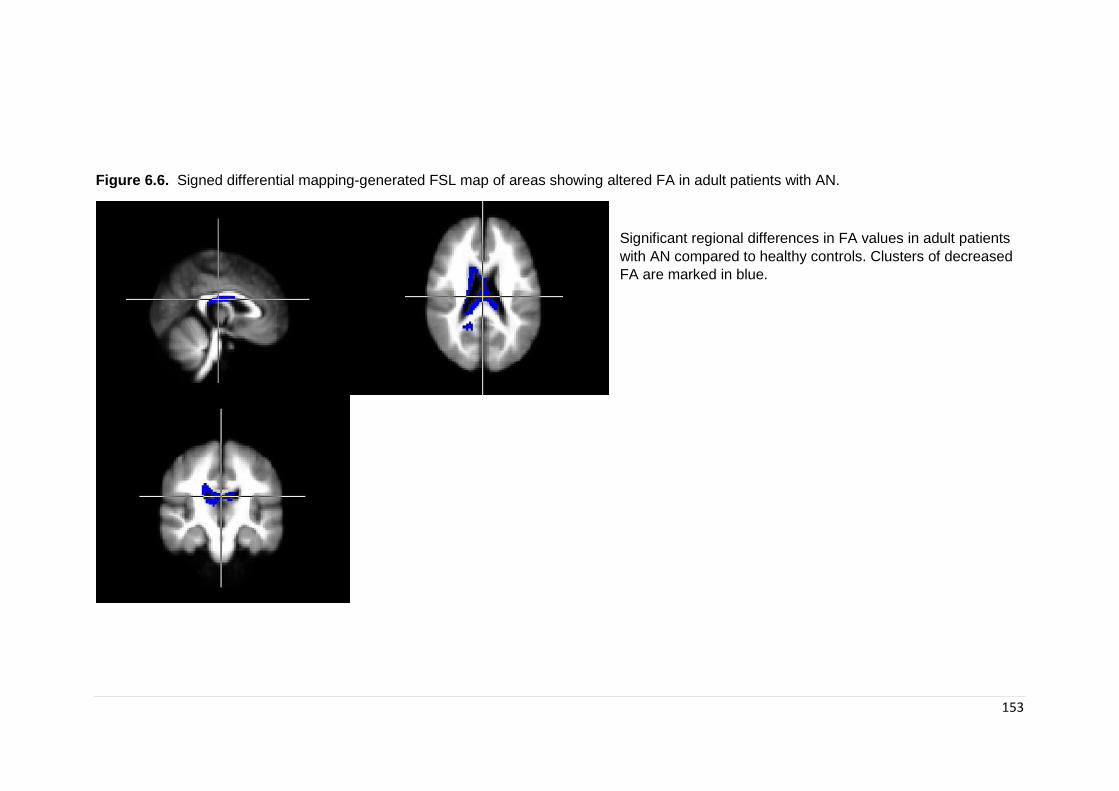
153
Figure 6.6. Signed differential mapping-generated FSL map of areas showing altered FA in adult patients with AN.
Significant regional differences in FA values in adult patients
with AN compared to healthy controls. Clusters of decreased
FA are marked in blue.
154
6.4. Discussion
This is the first meta-analysis comparing white matter microstructure between patients with
AN and healthy controls. We found that patients with AN had reduced FA in the CC, left
SLF and precentral gyrus; and increased FA in the right-corticospinal projections and
lingual gyrus. The areas in the peri-splenial CC were robust and survived sensitivity
analyses. FA reduction in the most posterior part of the CC survived sensitivity analyses
in adult patients; this was also the case for the area in the precentral gyrus in the acute
subgroup.
The CC is the largest WM tract containing more than 300 million axons connecting regions
in both hemispheres and has been found to be critically involved in the integration of
emotional, attentional, perceptual, and cognitive functions. The rostrum, genu, and rostral
body of the CC contain fibres connecting homologous regions in the left and right prefrontal
cortex; the midbody is formed by fibres connecting premotor, motor, and posterior parietal
regions between the two hemispheres; and the splenium comprises connections between
the superior and inferior temporal and occipital cortex (Hofer & Frahm, 2006). Based on
our results, AN was associated with changes in the perisplenial CC consistent with a
tractography study by Travis et al. (Travis et al., 2015) which found FA reduction in patients
with AN in subdivisions of the CC, including parietal, temporal and occipital projections.
Although the most robust peaks of case-control differences in the main analysis were
located in the perisplenial CC (MNI = 18,-58,30; MNI = -22,24,30), the largest cluster (MNI
= 18,-58,30), extended to the right precuneus and right cuneus. We used MRtrix in order
to identify the major tracts which traverse this cluster (Figure 6.3). The reduction in FA in
these tracts would most likely impact the transfer of information between parietal and
occipital regions and within the limbic system. Both structural and functional neuroimaging
studies have also consistently found the parietal cortex to be involved in AN (e.g. reduced
GM and differential activation during tasks). This brain region is involved in the integration
of proprioceptive and visual information of the body (Shimada, Hiraki, & Oda, 2005),(Zhang
et al., 2013). Furthermore, atypical patterns of activation in task fMRI studies have been
found in areas of the occipitotemporal region (including the extrastriate body areas) and
parietal cortex in patients with AN when observing digitally distorted images of their bodies
(Grönemeyer & Herpertz, 2010; Uher et al., 2005). Abnormal structural connectivity in
these regions involved in body-image information processing might explain distorted body
perception, a key feature in AN (APA, 2013).
155
The largest cluster in the main analysis (MNI = -2,-18,18) was found in the CC as well,
with most voxels located within the CC. However, there was involvement of other areas,
including the anterior thalamic projections (ATR) and thalamus. Almost the same cluster,
with same involvement of areas (CC, thalamus and ATR) was found (although classified
as undefined) in the acute subgroup. This is of special importance as it could point to some
stability of brain alterations and could point to more stable markers of the disorder and
neuropsychological differences associated with the brain alterations. However, it is also
true that due to the the nature of these analyses (with an heterogeneous sample) and our
small sample, we are only able to propose this as a hypothesis. Due to the large number
of acute studies included in the main sample, it is also possible that these studies are
driving the effect found in the main analysis. More studies are therefore needed in order
to help elucidate this hypothesis. The ATR are fiber pathways that connect the anterior
part of the thalamus with the frontal lobe, while the thalamus is part of a network that
projects relevant sensory information to numerous brain areas (Fan, McCandliss,
Fossella, Flombaum, & Posner, 2005) and also plays a role in higher-order cognition
through relevant cortico-thalamic-cortical projections (Klostermann et al., 2006; Sherman,
2007). Cognitive behavioural inflexibility is an AN trait and has be conceptualized as
impaired cognitive set shifting (rigid approaches to changing rules) and impaired
behavioural response shifting (perseverative behaviours). Numerous studies in the
literature have found this trait in patients with AN, both ill and recovered as well is healthy
sisters (Roberts et al., 2007). These findings suggest that impaired set shifting could be
an endophenotype in AN (Holliday et al., 2005). Our results of decreased FA in areas of
the thalamus and anterior thalamic projections suggests a possible dysregulation in the
pathways that project information relevant for set shifting and behavioural response. In
fact, areas of the fronto-striato-thalamic pathway have been found to be altered in patients
with AN (Shafritz, Kartheiser, & Belger, 2005; Zastrow et al., 2009).
A main limitation of the findings in these areas, is that they could be influenced by partial
volume effects (PVE) given their proximity to the ventricles, and therefore results should
be considered carefully. In 2017 Kaufmann (Kaufmann et al., 2017) questioned previous
results of altered fornix FA in AN after using a new method by which he corrected DTI
images for increased CSF. Given the proximity of the fornix to ventricles it is logical to think
that as CSF increases (and thus the ventricles), this could lead to increased partial volume
effects and falsely reduced FA. This was reiterated in a commentary by Seitz (Seitz, 2017)
156
who suggested that not only new studies should correct for PVE, but that some of the old
studies with findings of altered FA in the fornix should be re-assessed. Given that the
studies which found differences in FA in the fornix are included in this meta-analysis, and
are likely largely contributing to the two main clusters around the peri-splenial CC, it is
important to take these results with some caution.
A main finding is the cluster of reduced FA in the left precentral gyrus in an area also
known as the pars opercularis of the inferior frontal gyrus, in Broadman area 44. Although
this cluster was the smallest in the main combined analyses, it was also found in the acute
sample and was one of the most robust findings for this group. Furthermore, this cluster
was found to be associated with BMI in the acute sample as well. This cluster is located
in a motor area which lies in front of the central sulcus in the frontal lobe. Specifically the
cluster was found in the Broadman area number 44 which has be recently found to be
involved in suppression of response tendencies (Forstmann, van den Wildenberg, &
Ridderinkhof, 2008), such as during go no go tasks. Interestingly, the fact that this area
was found to be associated with BMI indicates that it’s associated with weight and
therefore could be more an effect of the reduced weight during the acute stage of the
disorder rather than a more permanent marker of the disorder. However, this area was
also found in the combined analysis. One possible explanation is that this area is more
affected than others by the decreased in weight and the physiological aspects of the
disorder and can be a permanent scar of the disorders. However, we can’t disregard the
possibility that differences in this area are present before the onset of the disorder and are
further affected by it. Kothari and colleagues in 2013 (R. Kothari, Solmi, Treasure, & Micali,
2013b) studied a large community sample of children at high risk for ED’s and found poorer
behavioural inhibition in children of mothers with Bulimia Nervosa (BN) as well as a trend
towards significance in children of mothers with AN. Therefore it is possible that alterations
in the area already exist and become exacerbated during the acute stage of the disorder.
Interestingly, Broadman area 44 is an area of GM and unlike WM, GM is a heterogeneous
mixture of neurons, axons and neuroglia. This makes it harder to conclude the meaning
for changes in FA, as anisotropic diffusion is much lower than in WM. In fact, interpretation
of DTI diffusivity parameters in GM is not greatly reported and still a matter of debate. An
important limitation is that it could be biased by PVE, given the convoluted structured of
GM and proximity to CSF spaces. One possibility, would be to study ADC in the cortex,
being careful to segment out the effects of CFS.

157
We did not find an association between BMI and FA in combined or adult samples. This is
contrary to previous findings of a positive correlation between FA and current BMI in adult
AN patients (Kazlouski et al., 2011a; Nagahara et al., 2014; Yau et al., 2013). However,
in order to control for spurious results, the meta regression is limited to results found in the
main areas reported in the meta-analysis, therefore, we can only conclude that there is no
association in these areas. Studies have indeed reported associations with BMI involving
regions which were not identified in this meta-analysis. Therefore, one possible
explanation for this discrepancy is that FA decreases found are independent of low BMI
and malnutrition and a manifestation of trait abnormalities in AN. However, another
possible explanation is that FA decreases in these areas are secondary to malnutrition
and do not recover with weight restoration. It is important to note that due to the small
sample size of this meta-analysis, we cannot discard that the lack of association could be
due to methodological issues and not a real lack of association. Therefore, this requires
further investigating in future meta-analyses.
The last major cluster of reduced FA in the main analysis was found in the SLF, a major
intra-hemispheric fiber tract composed of four separate components. Our results show
involvement of the left parietal part of SLF II which occupies the central core of the WM
above the insula, lateral to the corona radiata and CC (Makris et al., 2005). The SLF II
fibers connect posterior parts of the superior temporal cortex with dorsolateral and
ventrolateral prefrontal areas (Makris et al., 2005) and plays a major role in visual and
oculomotor aspects of spatial function (Makris et al., 2005). Similar to the area in the CC
extending towards the precuneus, the SLF is functionally relevant to body image distortion
in AN. The SLF II is the major WM tract connecting areas of important for body self-image
(parietal) and body image perception (prefrontal and parietal network). The inferior parietal
areas involved in proprioception, spatial judgment and the integration of visual information,
forming the neural basis for representation of body self-image (S. Gaudio & Quattrocchi,
2012). Several studies have found differences in parietal areas in patients with AN as well
as in prefrontal areas during visualization of own body image during fMRI studies (S.
Gaudio & Quattrocchi, 2012).
As well as areas identified in the main meta-analysis, a cluster of decreased FA was found
in the pons only in the acute group. The pons connects the limbic forebrain and brainstem
and is vital to autonomic functions necessary for life, including food pleasure (Kent C.
Berridge, 2009). Areas in the pons and thalamus receive information from the lower
158
brainstem in relation to the properties of food and project to the amygdala and frontal
cortex, which perform higher order functions pertaining to the rewarding and aversive
aspects of food. Thus, alterations in pontine white matter could disrupt the food reward
system, which has been shown to be altered in eating disorders (Kent C. Berridge, 2009;
Lassek, 1942). Malnutrition during the acute phases of the illness may contribute to
persistent reduction in FA in the pons. This possibility is supported by reports of central
pontine myelinolysis (CPM) in AN (Amann, Schäfer, Sterr, Arnold, & Grunze, 2001;
Keswani, 2004; Ramírez, Arranz, Martín, & San, 2007); this is a demyelinative lesion in
the pons that was first reported in cases of malnutrition and alcoholism. Since decreased
FA only appeared in subgroup acute analysis, it is possible that alterations found in the
pons are due to malnutrition.
Analyses in adult patients only implicated the right caudate nucleus and the most robust
area in the CC. The caudate nucleus is one of the structures that makes up the dorsal
striatum, a component of the basal ganglia. This area has shown to be involved in several
roles, including executive functions (Grahn, Parkinson, & Owen, 2008; Villablanca, 2010)
(especially inhibitory control and planning) and it has been shown to also play a role in the
reward system as part of the cortico-basal ganglia-thalamic loop. The basal ganglia has
also been found to be of importance in disorders such as obsessive compulsive disorder
(OCD) and attention-deficit/hyperactivity disorder (ADHD), which have been found to co-
occur with ED’s (Murphy, Timpano, Wheaton, Greenberg, & Miguel, 2010).
Finally, one small cluster of decreased FA in the cingulum was found in the acute subgroup
and showed involvement of the CC as well. The cingulum is a projection of white matter
fibers that allow communication between components of the limbic system and that is
located adjacent to the CC. The area of decreased FA was found in the middle towards
the anterior part of the cingulum. The anterior part of the cingulum has been linked with
emotion, motivation and executive functions (Bubb, Metzler-Baddeley, & Aggleton, 2018).
Alterations in this structure have been found to be associated with altered emotion
identification in AN, as well as difficulties with cognitive control.
Both the main analyses and acute ones found areas of increased FA, however, these
results should be taken with some caution as they were driven by results in adolescent
studies and therefore disappeared when analyzing adult groups only. Three out of the four
159
studies on adolescents found increased FA and were therefore driving the findings of
increased FA. Furthermore, results only show small sized clusters (less than 100 voxels)
compared to those found for decreased FA. In the combined analyses, only three clusters
of increased FA were found, however, the acute subgroup had a larger and more
widespread number of increased FA clusters. Only nine studies were included in the acute
sample and three of those were the studies on adolescents with increased FA, therefore
it is likely that these studies had more weight in this analyses than they did in the combined
ones were 13 studies were included.
Given that increased FA was a finding mainly reported in adolescent samples, it is possible
to hypothesise reasons for the differences from a developmental perspective. Both GM
and WM follow a trajectory of development from birth until early adulthood. The onset of
puberty initiates a number of changes, not only physical but psychological and social. It is
during this time that there are substantial increases in hormonal levels as well as changes
in brain structure and function. Alongside these changes, there is a sharp increase in
difficulties associated with the regulation of emotion and behaviour, with more mental
health difficulties (Dahl, 2004). The normal trajectory of GM and WM development is
opposite, with GM volume decreasing with age and WM volume increasing (Lenroot et al.,
2007). In general, maturation of WM in adolescence is associated with increase in both
myelination and fibre density (Paus et al., 1999). It is possible that different mechanisms
could play a role in the still-developing brain of adolescents and they may be differentially
affected by starvation, with a restructuring of WM. It is however possible that increased FA
found in studies in adolescent patients could be explained by preexisting WM differences
in AN and be considered a vulnerability. Localisation of the most robust FA findings were
found in areas that have been shown to play a role in supporting rewarding behaviours
(O'Doherty et al., 2004) which have been hypothesized to be altered in AN and could play
a role in development (A. Harrison, O'Brien, Lopez, & Treasure, 2010) (Harrison 2010). It
is clear that further studies in at risk populations are necessary in order to clarify these
differences.
The first cluster found in both the combined and acute sample analyses is located in the
corticospinal projections. Interestingly, to date, studies on white matter microstructure in
adolescents with AN have found mixed results, with some brain regions showing increased
FA and others showing decreased FA compared to controls. The differences in the
direction (increased rather than decreased FA) of FA might be due to an unmasking effect.
160
The corticospinal tract has significant crossing fibres, therefore, if one of these pathways
has low FA this might result in a higher FA overall. Interestingly, in the cluster breakdown
of the largest peak of decreased FA, some voxels were located in the cortico spinal
projections. However, it is important to note that there are only four studies investigating
adolescent samples have been published to date and therefore more studies are needed
in order to understand the differences between adolescent and adult samples.
The two most robust findings of increased FA in the acute sample were found in the
putamen and the arcuate network. The putamen is a structure located at the base of the
forebrain and together with the caudate nucleus it forms the dorsal striatum which is one
of the structures that composes the basal ganglia. Alterations in the dorsal striatum are of
interest for ED as they have been shown to play a role in supporting rewarding behaviors
based on previous experience (O'Doherty et al., 2004). Dorsal striatum responds to reward
and punishment and contributes to reward based decision making (Balleine, Delgado, &
Hikosaka, 2007). Although the results show increased FA, it could still reflect damage as
increased tissue anisotropy of the basal ganglia is thought to reflect microstructural GM
damage (Cavallari et al., 2014; Hannoun et al., 2012). This results would therefore support
those found by Frank and colleagues (G. K. Frank, M. E. Shott, J. O. Hagman, & V. A.
Mittal, 2013) who found alterations in GM in the putamen which predicted sensitivity to
reward. Therefore, alterations in the putamen could therefore play a role in differences in
sensitivity to punishment and reward found in patients with AN (A. Harrison, O'Brien, et
al., 2010).
An undefined area with voxels mostly in the cerebellum was also a replicable finding of
increased FA. Findings in the cerebellum are of interest for the pathophysiology of AN due
to the role it plays in feeding behavior. The cerebellum connects to the hypothalamus
through cerebello-hypothalamic circuits which are thought to be involved in the regulation
of food intake and feelings of satiety (J. N. Zhu & Wang, 2008). Studies have also focused
on the role that the cerebellum plays in cognition and emotional experience (Stoodley &
Schmahmann, 2009) which again is of interest for the development and maintenance of
AN. Volumetric reductions in cerebellar GM have been found in patients with AN (Boghi et
al., 2011) as well as deficits in functions associated to the cerebellum. This meta-analysis
has found increased FA in this area, however, because FA is sensitive to several tissue
characteristics it needs to be interpreted carefully, a range of tissue characteristics might
change in such a way that the resulting FA obscures subtle changes. More research is
161
needed to further understand alterations in the cerebellum and the direction as well as
associations with deficits in AN.
The cross-sectional design of the available studies does not address the issue of causality
and specifically the contribution of nutritional status. GM and WM volumes can show
significant reductions in otherwise psychiatrically healthy individuals after only 2-3 days of
dehydration (Streitburger et al., 2012) and WM volumes can be restored following re-
feeding. Furthermore, a commentary by Frank in 2015 (G. K. Frank, 2015) discussed the
variance in time between start of re-alimentation and scanning as another point of
variability that might account for differences between structural MRI studies in AN. In fact,
the studies included in the meta-analysis show a degree of variance with regards to this
issue, with six of the ten studying acute patients (12,14,15,20) controlling for the effect of
re-feeding in some respect, most of them scanned patients after one to two weeks of
rehydration. However, it is not known whether more subtle WM differences persist over
time following recovery. Axons in the corticospinal tracts and the corpus callosum are
some of the largest axons in the brain (Lassek, 1942) and therefore have thicker myelin
and larger concentrations of lipids (Paus, 2010). As such, these areas could be
predisposed to greater degree of myelin loss secondary to malnutrition or chronicity.
Whilst the meta-analysis sheds some light into what could be more stable WM
microstructure alterations in AN, it does not help elucidate if these alterations are a cause
or a consequence of the disorder. Although subgroup analyses are exploratory because
of the sample size, there are differences in the number of areas found between the main
analysis (which include both acute and recovered) and only the acute group, with the
second subgroup analysis finding a larger number of areas relevant to AN. One possible
explanation for this is that in the acute stage, patients have a more widespread number of
white matter micro-structural abnormalities, and that one year after recovery (criteria for
inclusion in both studies with recovered patients) only some differences persist. These
differences could either be more permanent scars of the disorder or could possibly be
present before the onset and therefore contribute to the development of the disorder. To
date, four studies have investigated recovered patients, however, only three met criteria
for inclusion in this meta-analysis and therefore we were not able to run subgroup
analyses. Taken together, these four studies (J. Cha et al., 2016a; Frieling et al., 2012b;
Shott et al., 2016; Yau et al., 2013) showed inconsistencies in WM integrity abnormalities
identified, with two studies finding decreased FA, one finding increased FA and one only
162
finding decreased MD. It is important to note that not all studies use the same criteria for
recovery making comparability of the results complex. However, the studies included in
the meta-analysis used a 1-year criterion of weight restoration and no engagement in ED
behaviours for their recovered patients. Only one of the studies had a short recovery
criteria, only weight restoration for two weeks (19). Although this study was included in the
meta analysis, whole brain white matter differences were only reported during the acute
period and not in the second stage at weight restoration. Of the studies with more stringent
recovery criteria (one year recovery and not ED behaviours), two did not find any
differences in FA, however, these studies only included nine and twelve recovered
patients, while the study by Shott and colleagues (16) included 24 patients providing them
with increased power for their analyses. Importantly, more studies with recovered patients
are needed to ascertain if differences do persist after recovery or if WM alterations are a
temporary scar of the disorder. Furthermore, although, methodological differences in the
studies could account for some variability in results, they are unlikely to account for
differences in the direction of DTI parameter changes. Taken together, these studies
suggest that some FA alterations may be present in weight recovered patients but also
that WM integrity and myelin may be improved with weight restoration in AN in some brain
areas. It is unclear whether the differences found in recovered patients are an antecedent
or a scar of the disorder (related to severity of illness or specific symptoms), and/or an
artefact of heterogeneous methodology employed to measure WM integrity. Importantly,
there is a need for longitudinal prospective studies investigating an at-risk population that
will allow us to investigate differences before the onset of the disorder.
Limitations
Overall, results from DTI studies should be taken with caution as there are some limitations
to the technique that should be acknowledged. One of the most common issues with DTI
is the data interpretation, usually higher MD and lower FA indicate damaged or impaired
fiber integrity due to increased diffusion and loss of coherence in movement direction.
However, this is not always true, and it can be dependent on brain region, cellular basis
or the sample studied. Studies in schizophrenic patients have shown an overall reduction
of FA, however, increased FA (Kubicki et al., 2007) has been found in interhemispheric
auditory fibers in those patients suffering from hallucinations. Therefore, it cannot be said
that increased FA is always better. Another potential limitation involves the questions of
how much FA abnormalities truly reflect altered WM integrity. Usually, FA is described as
a marker for WM integrity, however it can be altered due to a variety of reasons (Jones et

163
al., 2013; Jones & Leemans, 2011) such as larger axon diameter and lower packing
density of fibers (both contributing to fewer barriers to diffusion leading to lower FA), or
increased membrane permeability and reduced myelination.(Jones et al., 2013) Crossing
fibers (previously discussed in this section) are also problematic in DTI result
interpretation. A single voxel can be composed by fiber populations with different spatial
orientation which can result in an average increase in FA, however, in this case, this is not
due to changes in axonal or myelin structure.
The present meta-analysis has several limitations. First, the number of studies utilizing
DTI in AN is rather small, and not all studies of AN could be included due to methodological
differences, therefore the results are preliminary and further meta-analyses are necessary
as studies continue to be published. Second, although the meta-analytic methods used
provide good control of false positive results, it does not so for false negative results
(Radua et al., 2012). Third, the studies included in this meta-analysis used different
statistical thresholds. However, although thresholds involving correction for multiple
corrections are desired, it is still statistically correct to include those studies using more
liberal thresholds (Radua et al., 2012). Fourth, the heterogeneity of the MRI acquisition,
including differences in acquisition parameters and the use of two different methods (TBSS
and VBA) to undertake whole brain analysis may lead to inconsistencies between studies.
However, these limitations are inherent to all meta-analyses and in spite of them, some
findings were quite robust. Meta-analysis combining TBSS and VBA analysis have been
published including a study by the developers of the software. As published in the
methods, to allow combinations of VBA and TBSS studies the TBSS template included in
AES-SDM was adopted. Fifth, the studies varied in terms of patient characteristics, not
only in terms of illness status (acute and recovered) and duration of illness, but also for
the inclusion of both binge/purge and restricting types of AN. As further studies are
published, future meta-analytic studies should subcategorize between types of AN in order
to ascertain neural differences between both binge/purge and restricting AN as well as
different stages of illness duration. Sixth, the main finding in this meta-analysis involves a
cluster of voxels in the CC, however, Figure 2 shows how these areas surround ventricular
areas. Although the image is just a rough illustration of the location, it is worth noting that
since ventricles are enlarged in AN, a biased estimation of FA in these areas can be due
to partial volumes effects (Jones & Cercignani, 2010). Finally, this meta-analysis only
focused on FA as it is the most commonly reported variable to show differences in WM
164
microstructure (both in the wider literature and in the studies included in this meta-
analysis).
Conclusions
In conclusion, by summarizing WM microarchitecture studies to date, we have
demonstrated significant FA alterations in patients with AN, affecting white matter tracts in
the CC and in subcortical regions. This evidence implicates regions likely to be involved
in body image processing and cognitive behavioural inflexibility. Further studies are
needed to examine the direction of causality of these findings. These results integrate
previous findings from DTI studies in AN and provide a more coherent picture of the most
prominent and replicable abnormalities in WM integrity in patients with AN.

165
Chapter 7. Neurocognitive differences in children at high-
familial risk for ED: findings from BREDS
7.1. Introduction
There is a large body of evidence indicating neurocognitive deficits in patients with ED
(see Chapter 1 for summary). Earlier neurocognitive studies in ED focused on general
cognitive deficits, however, subsequent research has examined specific constructs that
have been hypothesised to play a role in ED psychopathology. Areas of executive
functioning (multidimensional construct which refers to “top-down” processes that allow an
individual to adapt information processing and behaviour to their goals (Diamond, 2013))
have been studied in ED, including working memory, attention, cognitive flexibility and
cognitive and behavioural inhibitory control.
Inhibitory control refers to a set of processes that allow the individual to suppress or
interrupt responses. There is some evidence of ineffective inhibitory control in ED, with
binge-eating type ED falling within deficient inhibitory control and restricting type ED
characterized by excessive inhibitory control. This construct has been generally assessed
using go/no-go and stop signal tasks (requiring participants to inhibit responses to a
specific target which is less frequently presented). The majority of research has been
conducted with adults with binge-type ED, with nine systematic reviews conducted to date
(K. E. Smith et al., 2018). Evidence suggests that inhibitory control deficits are present in
patients with binge-purge type disorders while the evidence is not as clear for restricting
subtypes.
In the last decades, set-shifting (or cognitive flexibility, which refers to the ability to shift
thoughts or actions according to situations) has obtained evidence as a transdiagnostic
mechanisms contributing to ED psychopathology (although most of this literature focuses
on AN patients) (Lang, Treasure, et al., 2016; Naor-Ziv & Glicksohn, 2016; Talbot et al.,
2015). It has been found to be altered in both ill patients, recovered and more recently in
first degree relatives of patients. To date there have been 12 systematic reviews, including
meta-analyses focused on set-shifting difficulties (K. E. Smith et al., 2018). Interestingly,

166
one meta-analytic review failed to find significant differences in set-shifting in children and
adolescents with AN compared to HC (Lang, Stahl, et al., 2014), suggesting that deficits
may be an effect of longer term duration of the disorder. However, this review included
fewer studies than a later one by Wu and colleagues (Wu et al., 2014) which did not find
differences between adolescents and adult samples. With regards to central coherence
(focus in details rather than global integration when processing information), there is less
evidence to support its possible trait status (Garrett et al., 2014; N. Kanakam et al., 2013;
Lang, Roberts, et al., 2016; Lang, Treasure, et al., 2016; C. Lopez et al., 2009; Talbot et
al., 2015; Tenconi et al., 2010).
Other executive functions such as working memory (ability to hold and work with
information in mind in order to guide behaviour) have also been investigated in EDs
suggesting some dysfunction in these measures of executive function (K. E. Smith et al.,
2018). Lastly, decision making (construct which involves multiple processes of executive
function) has also been examined in ED, using tasks such as Iowa Gabling Task (IGT)
(Bechara, Damasio, Damasio, & Anderson, 1994) and Game of Dice Task (GDT) (Brand,
Franke-Sievert, Jacoby, Markowitsch, & Tuschen-Caffier, 2007). It has been proposed that
decision making may be altered across different ED subtypes given inconsistencies in
goals and actions (related to binge-purging subtypes) and persistence in actions despite
the need to modify behaviour (restriction given seriously low weight). Overall findings vary
depending on tasks, with results from the two main tasks (IGT and GDT) showing
impairments in both AN and BN with medium to small effect sizes (K. E. Smith et al., 2018).
Approach and avoidance processes and their motivation (linked to reward) have been
proposed to play a role in the development and maintenance of ED (Ehrlich et al., 2015;
A. Harrison, O'Brien, et al., 2010; Amy Harrison, Treasure, & Smillie, 2011; Wu et al.,
2016). The BIS/BAS scale has been used to measure sensitivity to reward and punishment
in ED populations and was developed based on Gray’s Reinforcement Sensitivity Theory,
who proposed two broad motivational systems that regulate approach and withdrawal
behaviour: the activation system (BAS, sensitive to reward) and the inhibition system (BIS,
sensitive to punishment) (A. Cooper et al., 2007; Jeffrey Alan Gray, 1987). Higher
sensitivity to reward and punishment have been proposed to be contributing factors to ED
psychopathology (Loxton & Dawe, 2001). As seen in Chapter 2, there has been extensive
research into neural correlates of alterations in the reward system and areas in the
frontostriatal regions have been shown to be altered and correlated to higher sensitivity
167
for reward and punishment in patients with ED (Jiook Cha et al., 2016; Olivo et al., 2017;
Shott et al., 2016; Steward et al., 2018).
To date very few studies have been published studying the neurocognitive profile of
children at risk. A large community based study by Kothari and colleagues found that
children of women with AN showed higher full scale IQ, increased WM capacity, better
visuo-spatial function and decreased attentional control, while children of women with BN
showed poor visuo-spatial functioning (R. Kothari et al., 2013b). A later study found that
younger children at high risk for ED had difficulties in social understanding, visual-motor
function, planning and abstract reasoning (R. Kothari, Rosinska, Treasure, & Micali, 2014).
More recently, Kothari and colleagues found differences in social cognition in children at
high risk for ED (R. Kothari et al., 2015).
Overall there are limitations to neurocognitive research that need to be taken into account.
As described in Chapter 1, a large number of tasks have been used to assess these
constructs with conflicting results at times, most likely because these tasks can tap into
different executive functions and therefore may not be necessarily measuring the same
thing. Importantly there are possible confounds that may influence neurocognitive
functioning which need to be taken into account as well as duration of illness and
differences between adults and adolescents. It is important to consider neurodevelopment,
particularly since ED generally have an onset in adolescence. Frontal regions, which
continue to develop into late adolescence, are key areas in executive functions.
Furthermore, frontolimbic circuits underlie evaluation and response to reward, risk and
emotion regulation (Steinberg, 2005) all of which play an important role in maintenance
and/or development of ED.
As established in Chapter 1 and 3, available literature makes it difficult to ascertain if these
neurocognitive deficits in patients are an effect of the acute illness (state) or are present
prior to the onset and therefore play a role in the development of the disorder (trait).
Different approaches have been taken to ascertain what is state and what is trait, including
studying recovered patients, first-degree relatives and more recently, children at high-risk
for developing the disorder.

168
The aim of this chapter is to expand on previous findings on neurocognitive dysfunction in
children at risk for ED by studying specific executive function constructs: attention, working
memory, inhibition, set-shifting, decision making and measures of reward. The chapter will
also explore measures of emotion identification and theory of mind in children at risk for
ED. Further in Chapters 8 and 9, neurocognitive measures will be investigated within
neural correlates.
7.2. Methods
Data from both cases and controls were collected as part of the Brain in high-Risk for
Eating Disorders Study. A total of 21 healthy controls and 17 at-risk cases were recruited
as part of the study. For inclusion in this study, demographics, data on maternal lifetime
ED and childrens’ neurocognitive measures were included.
Full details on the study’s protocol, inclusion and exclusion criteria can be found in chapter
4 (Methodology). Assessments were conducted when the children were between the ages
of 8 and 15 years old, with mean age: children of mothers with ED 11.94 and children of
healthy control mothers 12.25.
7.2.1. Demographics
Information on maternal demographic details (age, marital status, ethnicity and education)
was collected at the time of testing.
7.2.2. Exposure
Data on maternal eating disorders was gathered via an in depth interview using the
Structured Clinical Interview for DSM-IV-TR (Research version)(First, Spitzer, Gibbon, &
Janet, 2002) which was adapted for the new DSM-5 diagnoses. A full explanation of both
the measure and the interview protocol can be found in chapter 4 (Aims and methodology).
Mothers received a diagnosis of AN or BN, current or past with a detailed description of
lifetime ED.
169
7.2.3. Neurocognitive measures
Data was collected on General Intelligence (WASI) (Wechsler, 2011), social cognition
(Reading the Mind in the eyes (Baron-Cohen et al., 2001) and Morphed Emotion
Recognition (Bediou et al., 2005)), reward (BIS/BAS (A. Cooper et al., 2007)) and a range
of neuropsychological constructs using subtests of the Cambridge Neuropsychological
Test Automated Battery (CANTAB) (J. Fray, W. Robbins, & J. Sahakian, 1996; Luciana,
2003). The following CANTAB tests were used:
- Affective go/no-go: affective shifting task that requires inhibitory control over
different components of cognitive and emotional processing. Measures of affective
response bias (difference between correct latency for positive and negative blocks;
a higher score means a bias towards negative words) and correct latency (time to
respond correctly to each word in all blocks).
- Attention switching task: set-shifting. Measures of correct trials, reaction time,
switching cost (difference in response between blocks with switching rule vs rule
that remains constant, a positive score means quicker response in non-switching
blocks and closer to 0 means less variation between rules) and congruency cost
(differences in response time between congruent vs incongruent, positive scores
indicate faster response on congruent trials).
- Spatial working memory: measures of errors (number of times a subject touches a
box that doesn’t contain a token) and strategy (use of heuristic search sequence
to complete the task in the most efficient way, lower scores mean more effective
use).
- Rapid visual information processing: measure of sustained attention capacity with
a working memory component. Higher scores in mean latency indicate longer time
taken to respond correctly and higher scores in probability of hits corresponds with
a higher probability of responding correctly.
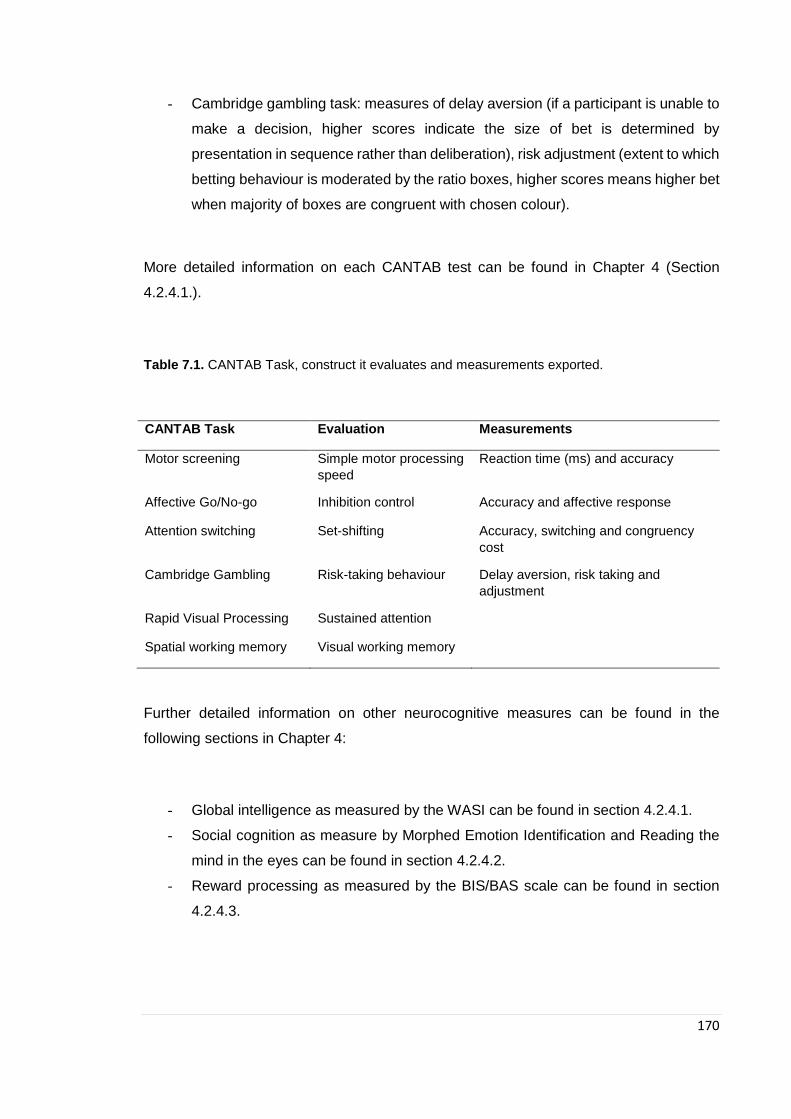
170
- Cambridge gambling task: measures of delay aversion (if a participant is unable to
make a decision, higher scores indicate the size of bet is determined by
presentation in sequence rather than deliberation), risk adjustment (extent to which
betting behaviour is moderated by the ratio boxes, higher scores means higher bet
when majority of boxes are congruent with chosen colour).
More detailed information on each CANTAB test can be found in Chapter 4 (Section
4.2.4.1.).
Table 7.1. CANTAB Task, construct it evaluates and measurements exported.
CANTAB Task Evaluation Measurements
Motor screening Simple motor processing
speed
Reaction time (ms) and accuracy
Affective Go/No-go Inhibition control Accuracy and affective response
Attention switching Set-shifting Accuracy, switching and congruency
cost
Cambridge Gambling Risk-taking behaviour Delay aversion, risk taking and
adjustment
Rapid Visual Processing Sustained attention
Spatial working memory Visual working memory
Further detailed information on other neurocognitive measures can be found in the
following sections in Chapter 4:
- Global intelligence as measured by the WASI can be found in section 4.2.4.1.
- Social cognition as measure by Morphed Emotion Identification and Reading the
mind in the eyes can be found in section 4.2.4.2.
- Reward processing as measured by the BIS/BAS scale can be found in section
4.2.4.3.
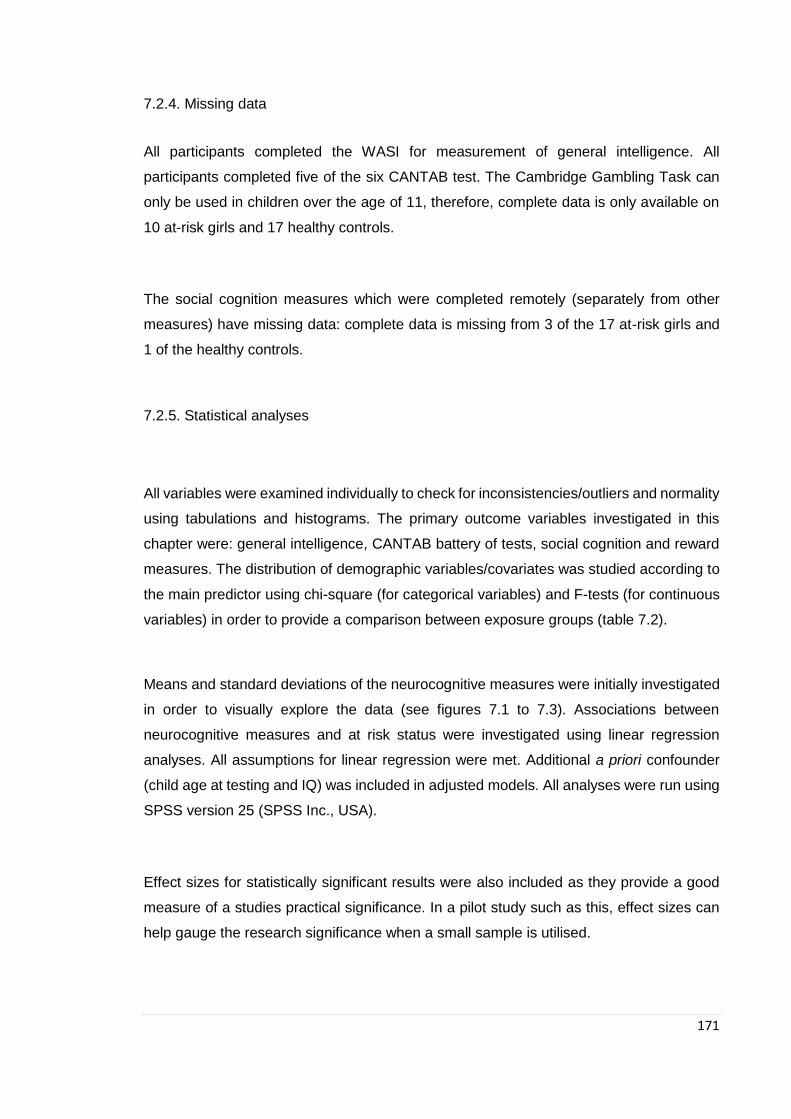
171
7.2.4. Missing data
All participants completed the WASI for measurement of general intelligence. All
participants completed five of the six CANTAB test. The Cambridge Gambling Task can
only be used in children over the age of 11, therefore, complete data is only available on
10 at-risk girls and 17 healthy controls.
The social cognition measures which were completed remotely (separately from other
measures) have missing data: complete data is missing from 3 of the 17 at-risk girls and
1 of the healthy controls.
7.2.5. Statistical analyses
All variables were examined individually to check for inconsistencies/outliers and normality
using tabulations and histograms. The primary outcome variables investigated in this
chapter were: general intelligence, CANTAB battery of tests, social cognition and reward
measures. The distribution of demographic variables/covariates was studied according to
the main predictor using chi-square (for categorical variables) and F-tests (for continuous
variables) in order to provide a comparison between exposure groups (table 7.2).
Means and standard deviations of the neurocognitive measures were initially investigated
in order to visually explore the data (see figures 7.1 to 7.3). Associations between
neurocognitive measures and at risk status were investigated using linear regression
analyses. All assumptions for linear regression were met. Additional a priori confounder
(child age at testing and IQ) was included in adjusted models. All analyses were run using
SPSS version 25 (SPSS Inc., USA).
Effect sizes for statistically significant results were also included as they provide a good
measure of a studies practical significance. In a pilot study such as this, effect sizes can
help gauge the research significance when a small sample is utilised.

172
Supplementary analyses for significant results were run based on maternal diagnosis.
Associations between neurocognitive measures and at risk status stratified by maternal
diagnosis were investigated using independent t-test.
Sample size for a larger scale study was calculated using pilot study results. Analysis was
run using G*Power version 3 (Faul, Erdfelder, Lang, & Buchner, 2007).
7.3. Results
7.3.1. Demographics
Results are shown in table 7.2. There were no significant differences between the groups
in any of the demographic variables studied, both maternal and child based.
Table 7.2. Demographic group comparisons dependent on distribution of variable.
ED
(N = 17)
Unexposed
(N = 20) Statistic
Maternal education
Up to A levels 3 (17.6%) 1 (5%) χ2 = 1.524, p = 0.217
Higher education 14 (82.4%) 19 (95%)
Maternal ethnicity
White 14 (82.4%) 17 (85%) χ2 = 0.047 p = 0.217
Other ethnicity 3 (17.6%) 2 (15%)
Child development
Menstrual period yes 9 (52.9%) 11 (55%) χ2 = 0.016, p = 0.900
Menstrual period no 8 (47.1%) 9 (45%)
Breast Development (6
stages) χ2 = 5.200, p = 0.392

173
Pubic Hair Development (6
stages) χ2 = 6.448, p = 0.265
Maternal age 44 (5.48) 45.55 (5.34) t = 0.87, p = 0.39
Child age 11.94 (2.14) 12.25 (1.94) t = 0.46, p = 0.65

174
7.3.1. General Intelligence
Girls at high- and low-risk were comparable in General Intelligence.
Table 7.3. Linear regression of children’s IQ: comparisons of girls at high-risk and girls of healthy control mothers (B coefficients and 95% confidence
intervals)
Crude B (95% CI) Adjusted a B (95% CI)
Girls at risk Unexposed Girls at risk Unexposed
Full-scale IQ 2.32 (-9.01, 13.64) p=0.68 Ref. 1.94 (-8.11, 12.00) p=0.69 Ref.
Verbal IQ 3.67 (-8.41, 15.74) p=0.54 Ref. 3.25 (-7.30, 13.81) p=0.53 Ref.
Performance IQ -2.46 (-12.08, 7.16) p=0.60 Ref. -2.80 (-11.50, 5.91) p=0.51 Ref.
*p≤0.05, **p≤0.01, ***p≤0.001; a Adjusted for child age at testing

175
7.3.2. Neurocognitive
7.3.2.1. CANTAB
See figures 7.1 to 7.3 for distribution of mean scores between groups and Table 7.4 for
linear regression results.
Girls at-risk for ED showed higher switching costs scores in the attention switching task in
comparison to girls at low-risk (table 7.4) (effect size: Cohen d = 0.742). Girls at-risk had more
variability in scores between switching a non-switching blocks (responses were quicker in non-
switching). Girls at-risk for ED showed better working memory (table 7.4.) (Effect size: Cohen
d = 0.603).
Girls at risk and girls of healthy control mothers were comparable in all other CANTAB suite
tasks.
Table 7.4. Linear regression of children’s CANTAB scores: comparisons of girls at high-risk and girls
of healthy control mothers (B coefficients and 95% confidence intervals)

176
Crude B (95% CI) Adjusted a B (95% CI)
Girls at risk (N = 17) Unexposed (N = 20) Girls at risk (N = 17) Unexposed (N = 20)
MOT
Mean latency -27.82 (-158.173 to 102.60) p=0.67 Ref -36.71 (-163.35 to 89.91) p=0.56 Ref
AST
Correct trials 2.37 (-2.54 to 6.27) p=0.23 Ref 2.62 (-1.18 to 6.42) p=0.17 Ref
Mean latency 65.29 (-39.67 to 170.24) p=0.22 Ref 56.52 (-42.89 to 155.92) p=0.26 Ref
Switching cost 76.01(7.83 to 144.19) p=0.03* Ref 71.18 (5.21 to 137.15)* p=0.035 Ref.
Congruency cost 25.91 (-8.18 to 59.99) p=0.13 Ref 23.10 (-9.26 to 55.46) p=0.16 Ref
AGN
Mean correct -0.17 (-52.40 to 53.05) p=0.99 Ref -5.21 (-53.36 to 42.93) p=0.83 Ref
Total omissions -0.05 (-4.07 to 3.40) p=0.97 Ref -0.48 (-4.09 to 3.12) p=0.79 Ref
Total commissions -2.14 (-11.22 to 6.94) p=0.64 Ref -3.02 (-11.38 to 5.34) p=0.47 Ref
Affective response 12.23 (-11.56 to 36.01) p=0.30 Ref 11.83 (-12.34 to 36.01) p=0.327 Ref
RVP
Mean latency 3.15 (-58.07 to 64.37) p=0.92 Ref -2.55 (-59.42 to 54.31) p=0.93 Ref

177
*p≤0.05, **p≤0.01, ***p≤0.001; a Adjusted for child age at testing and child IQ
Crude B (95% CI) Adjusted a B (95% CI)
Girls at risk (N = 10) Unexposed (N = 17) Girls at risk (N = 10) Unexposed (N = 17)
CGT
Risk adjustment ascending -0.48 (-1.48 to 0.53) p=0.34 Ref -0.53 (-1.58 to 0.52) p=0.31 Ref
Risk adjustment descending 0.01(-0.80 to 0.82) p=0.97 Ref -0.12 (-0.92 to 0.67) p=0.75 Ref
*p≤0.05, **p≤0.01, ***p≤0.001; a Adjusted for child age at testing and child IQ
SWM
Total errors -2.55 (-17.62 to 12.52) p=0.73 Ref -3.92 (-17.99 to 10.16) p=0.58 Ref
Strategy 0.39 (1.61 to 16.92) p=0.02* Ref 3.90 (1.34 to 17.02) p=0.02* Ref
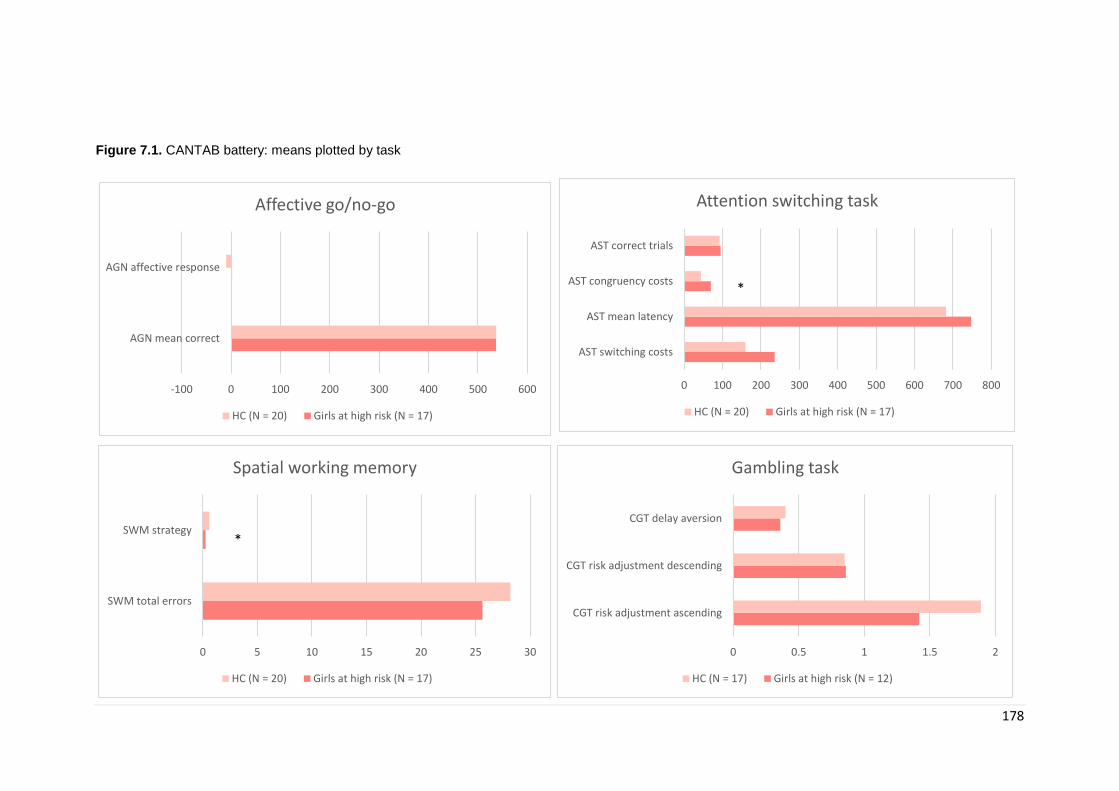
178
Figure 7.1. CANTAB battery: means plotted by task
-100 0 100 200 300 400 500 600
AGN mean correct
AGN affective response
Affective go/no-go
HC (N = 20) Girls at high risk (N = 17)
0 5 10 15 20 25 30
SWM total errors
SWM strategy
Spatial working memory
HC (N = 20) Girls at high risk (N = 17)
0 0.5 1 1.5 2
CGT risk adjustment ascending
CGT risk adjustment descending
CGT delay aversion
Gambling task
HC (N = 17) Girls at high risk (N = 12)
0 100 200 300 400 500 600 700 800
AST switching costs
AST mean latency
AST congruency costs
AST correct trials
Attention switching task
HC (N = 20) Girls at high risk (N = 17)
*
*
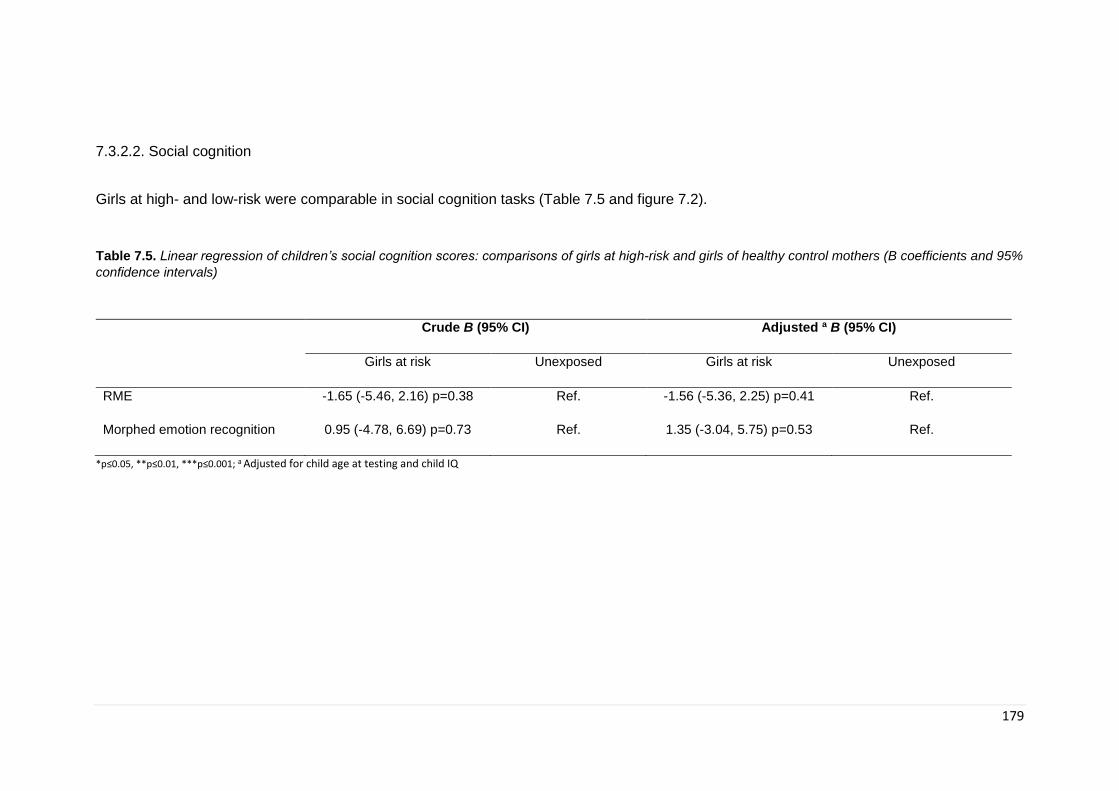
179
7.3.2.2. Social cognition
Girls at high- and low-risk were comparable in social cognition tasks (Table 7.5 and figure 7.2).
Table 7.5. Linear regression of children’s social cognition scores: comparisons of girls at high-risk and girls of healthy control mothers (B coefficients and 95%
confidence intervals)
Crude B (95% CI) Adjusted a B (95% CI)
Girls at risk Unexposed Girls at risk Unexposed
RME -1.65 (-5.46, 2.16) p=0.38 Ref. -1.56 (-5.36, 2.25) p=0.41 Ref.
Morphed emotion recognition 0.95 (-4.78, 6.69) p=0.73 Ref. 1.35 (-3.04, 5.75) p=0.53 Ref.
*p≤0.05, **p≤0.01, ***p≤0.001; a Adjusted for child age at testing and child IQ
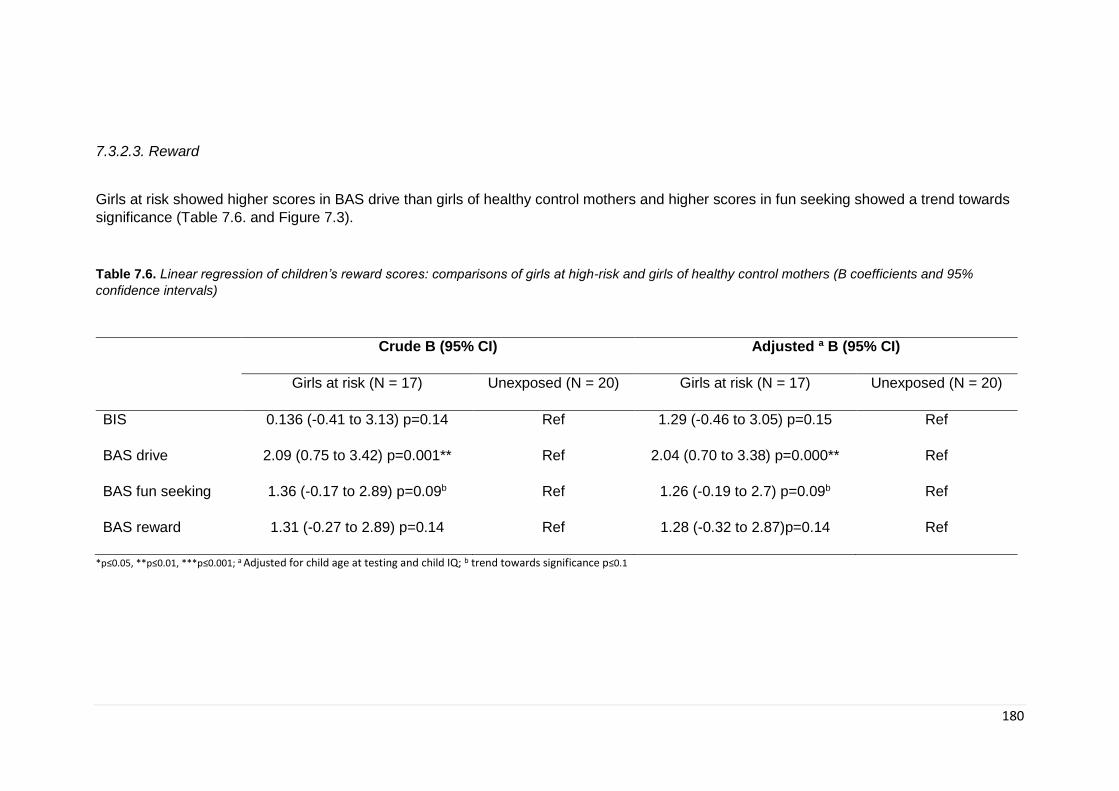
180
7.3.2.3. Reward
Girls at risk showed higher scores in BAS drive than girls of healthy control mothers and higher scores in fun seeking showed a trend towards
significance (Table 7.6. and Figure 7.3).
Table 7.6. Linear regression of children’s reward scores: comparisons of girls at high-risk and girls of healthy control mothers (B coefficients and 95%
confidence intervals)
Crude B (95% CI) Adjusted a B (95% CI)
Girls at risk (N = 17) Unexposed (N = 20) Girls at risk (N = 17) Unexposed (N = 20)
BIS 0.136 (-0.41 to 3.13) p=0.14 Ref 1.29 (-0.46 to 3.05) p=0.15 Ref
BAS drive 2.09 (0.75 to 3.42) p=0.001** Ref 2.04 (0.70 to 3.38) p=0.000** Ref
BAS fun seeking 1.36 (-0.17 to 2.89) p=0.09b Ref 1.26 (-0.19 to 2.7) p=0.09b Ref
BAS reward 1.31 (-0.27 to 2.89) p=0.14 Ref 1.28 (-0.32 to 2.87)p=0.14 Ref
*p≤0.05, **p≤0.01, ***p≤0.001; a Adjusted for child age at testing and child IQ; b trend towards significance p≤0.1
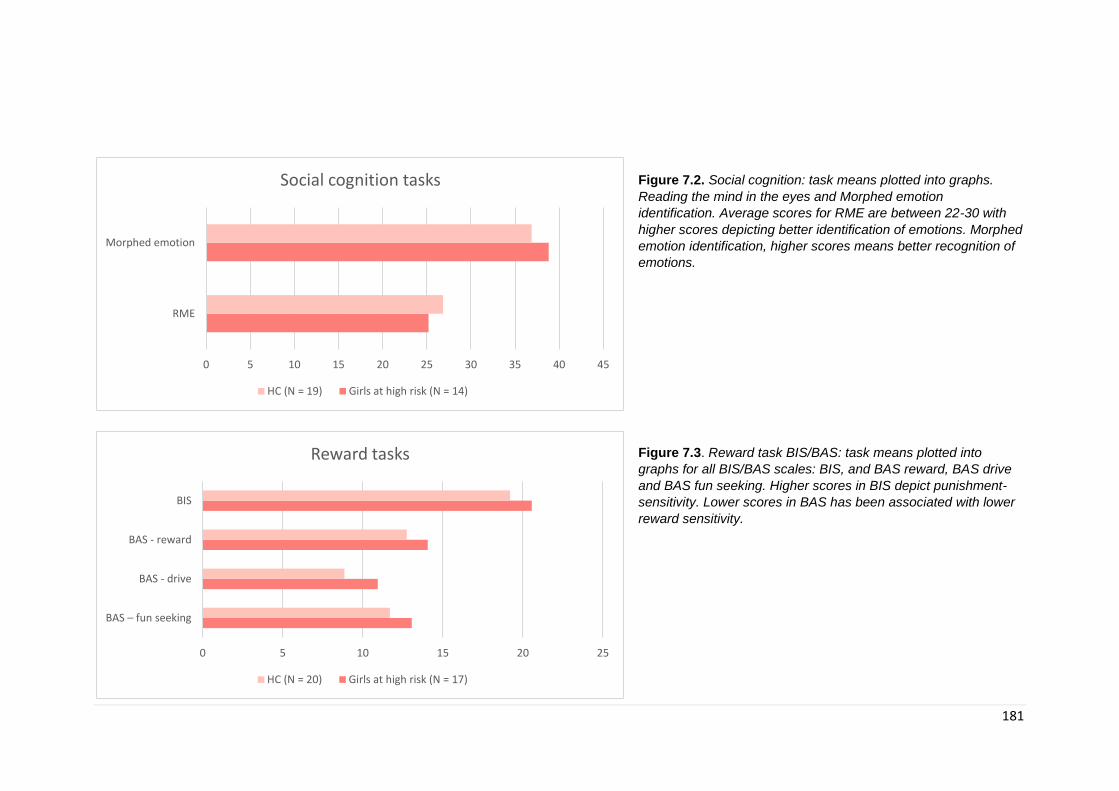
181
Figure 7.2. Social cognition: task means plotted into graphs.
Reading the mind in the eyes and Morphed emotion
identification. Average scores for RME are between 22-30 with
higher scores depicting better identification of emotions. Morphed
emotion identification, higher scores means better recognition of
emotions.
Figure 7.3. Reward task BIS/BAS: task means plotted into
graphs for all BIS/BAS scales: BIS, and BAS reward, BAS drive
and BAS fun seeking. Higher scores in BIS depict punishment-
sensitivity. Lower scores in BAS has been associated with lower
reward sensitivity.
0 5 10 15 20 25 30 35 40 45
RME
Morphed emotion
Social cognition tasks
HC (N = 19) Girls at high risk (N = 14)
0 5 10 15 20 25
BAS – fun seeking
BAS - drive
BAS - reward
BIS
Reward tasks
HC (N = 20) Girls at high risk (N = 17)
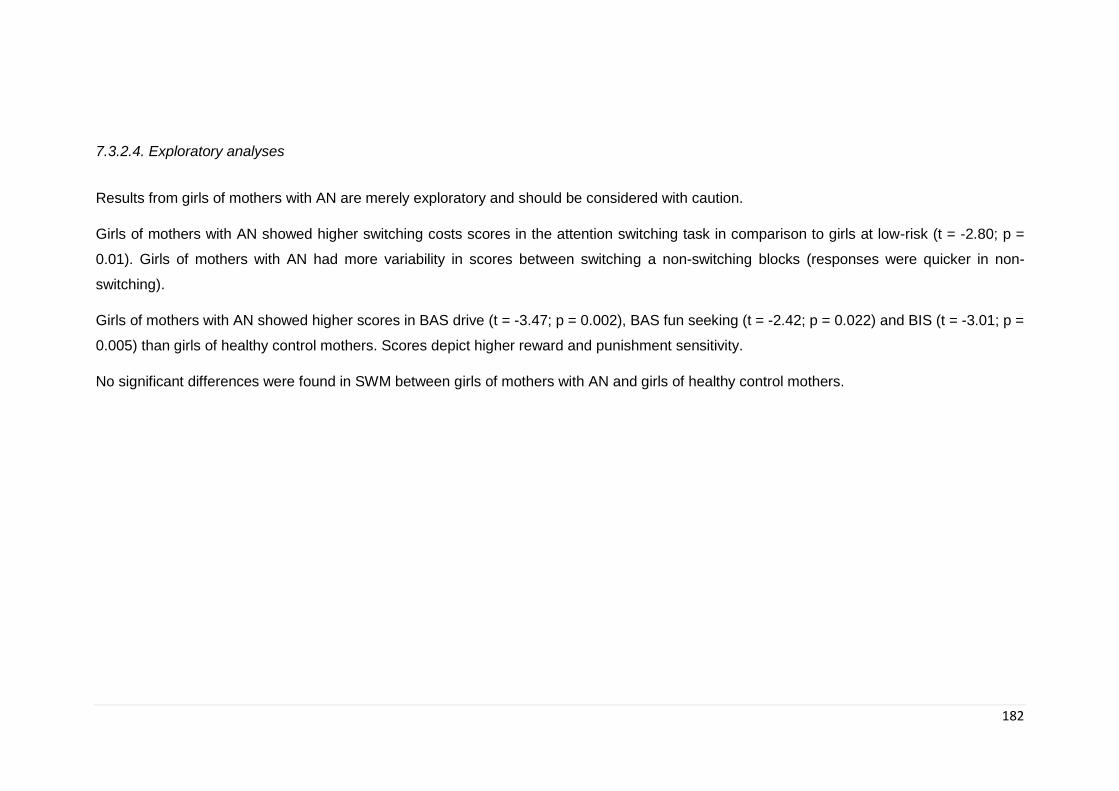
182
7.3.2.4. Exploratory analyses
Results from girls of mothers with AN are merely exploratory and should be considered with caution.
Girls of mothers with AN showed higher switching costs scores in the attention switching task in comparison to girls at low-risk (t = -2.80; p =
0.01). Girls of mothers with AN had more variability in scores between switching a non-switching blocks (responses were quicker in non-
switching).
Girls of mothers with AN showed higher scores in BAS drive (t = -3.47; p = 0.002), BAS fun seeking (t = -2.42; p = 0.022) and BIS (t = -3.01; p =
0.005) than girls of healthy control mothers. Scores depict higher reward and punishment sensitivity.
No significant differences were found in SWM between girls of mothers with AN and girls of healthy control mothers.
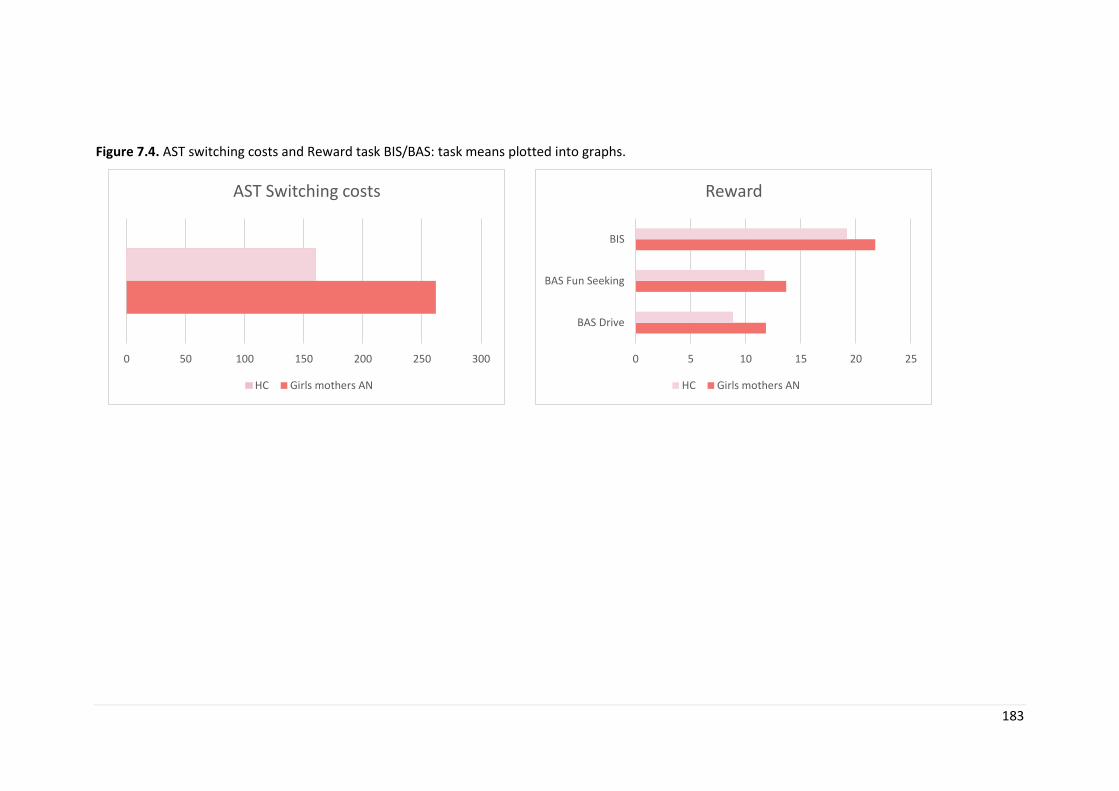
183
Figure 7.4. AST switching costs and Reward task BIS/BAS: task means plotted into graphs.
0 50 100 150 200 250 300
AST Switching costs
HC Girls mothers AN
0 5 10 15 20 25
BAS Drive
BAS Fun Seeking
BIS
Reward
HC Girls mothers AN

184
7.3.2.5. Sample size
One of the aims of this pilot study was to be able to examine the sample size needed in a
larger scale study, and the feasibility of such a study (given that this was the first ever
study of children at risk for ED). Specifically in this study we wanted to examine the
feasibility of recruitment and find the appropriate sample size for a larger scale study.
G*Power (Faul et al., 2007) was used to calculate sample size based on neurocognitive
results. Calculations for a later larger study showed that the sample size in each group
should be 49 at an alpha of 0.05 and a power of 0.80.
7.4. Discussion
The main findings from this chapter are difficulties in attention switching, more effective
working memory strategy and higher drive towards pursuing goals (measures by BAS
drive) in girls at risk for ED compared to girls of healthy control mothers. No other
measures showed significant differences, however, the main aim of this study is to
generate hypothesis for a larger study and therefore limitations in power should be
considered.
One of the main findings form this study is difficulties in set-shifting in children at risk
(taking significantly longer to shift rule than children at low risk). Cognitive flexibility or set-
shifting is an aspect of executive function that refers to the brain’s ability to transition from
thinking in one dimension or concept to another. The quicker you are able to shift your
thinking from one rule or concept to another, the greater your cognitive flexibility is.
Cognitive flexibility can therefore affect how quickly we are able to adapt to changes in our
environment and has been related to difficulties found in individuals with psychiatric
disorders such as ASD and OCD (characterized by maladaptive patterns of repetitive,
inflexible cognition and behaviour) (Gruner & Pittenger, 2017). Patients with OCD have
difficulties shifting between mental processes that influence changes in their behaviour
(especially in the context of their symptoms). Individuals with ASD have trouble adapting
185
to variable demands in their environment and can show rigid behaviours and difficulties
changing plans or altering routines and overall show deficits in tasks that require cognitive
flexibility. It has also been suggested that ineffective set-shifting could underlie AN
phenotypic presentation of inflexible thinking (rigidity in restricting calories and inability to
change behaviour in the presence of extreme low weight). While the literature is clearer
for adults, showing greater and more consistent deficits in set-shifting, results are not as
clear in adolescents (Shott et al., 2012; K. E. Smith et al., 2018). This may suggest that
difficulties in set-shifting are a consequence of malnutrition and become worse the longer
the patient is ill, which may indicate that these findings in recovered patients are a
permanent scar of the disorder. On the other hand, it is possible that some deficits are
present even before the onset and play a role in the aetiology of the disorder, but are also
worsened by the effects of malnutrition which may explain why differences are more
evident in adults with ED. It is of course important to take into consideration the effect of
neurodevelopment during adolescence and how this may affect differences in set-shifting.
It has been suggested that tasks that require cognitive flexibility also require inhibitory
control (Koch, Gade, Schuch, & Philipp, 2010) (as the individual has to inhibit a prepotent
response (previous rule) in order to shift to another one) and therefore better inhibitory
control could be masking difficulties in set-shifting (Weinbach, Bohon, & Lock, 2019).
Results from our study suggest that difficulties in set-shifting might be present in children
at risk and therefore could play a role in the pathophysiology of ED. These findings build
upon findings from Holliday et al. study in 2005 (Holliday et al., 2005) and Tenconi et al in
2010 (Tenconi et al., 2010), both of which found that set-shifting difficulties were not only
evident in patients with AN but also shared by their healthy sisters. Interestingly, while
findings of cognitive inflexibility are regularly shown in patients with AN, the same cannot
be said for patients with BN, where findings are less clear, with some studies finding
altered set-shifting in BN (Roberts et al., 2010) and others not (Darcy et al., 2012; F. Van
den Eynde et al., 2011). Results from exploratory analyses showed that when stratified by
maternal diagnoses, girls of mothers with AN had significant difficulties in set-shifting
compared to controls. The results from this study were in agreement with the hypothesis
that specific set-shifting difficulties may constitute a biological marker or heritable
endophenotype for AN (as they are present in first degree relatives who do not have the
disorder).
Results also show better working memory (as shown by better use of strategy in a working
memory visuospatial test) in girls at high-risk compared to girls of healthy control mothers.
186
A systematic review of studies published between 2010 and 2017 which examined working
memory in patients with ED, showed that 45% of studies found that patients with AN had
better performance in working memory tests than healthy controls or those who binge;
18% showed worse performance and 37% reported no differences (S. J. Brooks, 2016; S.
J. Brooks, Funk, Young, & Schiöth, 2017). As with previous systematic reviews of
neurocognitive measures, the heterogeneity in findings is possibly due to a number of
factors such as mixing ED subtypes, different duration of illness and the use of different
experiments (such as testing verbal versus visuospatial working memory). These results
confirm previous results from a large community study by Kothari and colleagues in
children at high-risk for ED (R. Kothari et al., 2013a). It has been suggested that working
memory may underpin the ability to maintain attention on longer term goals (Hofmann,
Gschwendner, Friese, Wiers, & Schmitt, 2008) which in turn may facilitate engaging in
actions towards them (Hofmann, Schmeichel, & Baddeley, 2012). It is therefore possible
that better working memory may facilitate sticking to diet goals. Interestingly, when
stratifying by maternal diagnosis, results showing better use of strategy in SWM stopped
being significant. This could mean that full sample results could be driven by girls of
mothers with BN. Given the small sample, it is also possible that we do not have the power
to stratify as differences are not as strong. Upon visual inspection of the data, two of the
three participants with mothers with BN had significant higher scores compared to the
average for the maternal AN group and could therefore be driving the differences. Because
of the small BN sample, its not possible to further investigate if these differences were due
to outliers or there is a significant difference between maternal diagnosis. A larger sample
will allow to further investigate. Working memory has also been implicated in behavioural
control, linked to excessive appetite control in AN (S. J. Brooks, 2016). It is therefore
possible that better working memory could be considered an intermediate phenotype of
ED.
The current study found differences in the approach system (Behavioural Activation
System BAS) (A. Cooper et al., 2007) in children at risk, reflecting higher reward sensitivity.
The BAS system has been conceptualised as a feedback loop where we are constantly
monitoring the environment for signals of reward. When a cue is associated with reward,
the BAS system is activated. As such, individuals with high BAS are thought to be more
sensitive to reward cues and be more prone to engage in approach behaviour (Carver &
White, 1994). The BAS section of the BIS/BAS questionnaire contains a further three
subscales: BAS drive (which reflects persistence in pursuing goals even in the event of

187
delayed reward or just a potential for reward); BAS Reward responsiveness (measures
seeking new incentives) and BAS Fun seeking (associated with positive feelings when
incentives are attained). On the other hand, the Behavioural Inhibition System (BIS)
underlies the inhibition of behaviour (associated with an increase in attention to
conditioned cues of punishment). The Reinforcement Sensitivity Theory (RST) (J. A. Gray,
1970) provides a framework that explores the different brain systems that are responsible
of responding to punishment and reward and how these are reflected in individual
personality. This theory suggests that personality dimensions such as anxiety and
impulsivity are controlled by the behavioural activation system and that individuals with
altered sensitivity in these dimensions may then be at increased risk for psychopathology
(Bijttebier, Beck, Claes, & Vandereycken, 2009). A meta-analysis by Harrison and
colleagues (A. Harrison, O'Brien, et al., 2010) showed that patients with AN-restricting had
a tendency to be lower in novelty seeking than HC, while patients with AN-binge/purge
and patients with BN did not differ in novelty seeking compared to controls. Overall, the
meta-analysis found that patients with AN-restrictive and binge/purge as well as patients
with BN demonstrated higher harm avoidance than HC. These findings suggest that there
is a difference in performance depending on phenotypic presentation of the disorder
(restrictive vs. binge/purge). Patients with BN and AN-binge/purge showed higher reward
sensitivity; while a high level of harm avoidance may be a more transdiagnostic feature
across phenotypic presentations (Dawe & Loxton, 2004). Interestingly, more recent
studies have shown that patients with both restricting and binge/purge presentations of AN
reported higher sensitivity to reward (Glashouwer, Bloot, Veenstra, Franken, & de Jong,
2014; Jappe et al., 2011). Inconsistencies in the literature could be due to differences in
measures used, although it has been suggested that individuals with AN-binge/purge may
not differ from AN-restrictive in their sensitivity to reward but perhaps in their impulsivity
(Glashouwer et al., 2014).
It has long been shown that individuals with ED show high co-morbid anxiety disorders,
that often predate the emergence of the ED (W. H. Kaye et al., 2004). Patients with AN
have also been shown to be perfectionistic and controlling as well as showing
temperament traits such as shy, fearful, worrying behaviours and avoidance of perceived
punishment. These characteristics have led to the hypothesis of the role that heightened
sensitivity to experiences that are associated with reward or punishment may play in the
development of ED behaviours, as a way of mitigating the emotional and physiological
reactions.
188
This study only found higher sensitivity in girls at risk compared to girls at low-risk as
measured by BAS drive. Our results of higher sensitivity to reward are in line with findings
in patients with ED (Glashouwer et al., 2014; A. Harrison, O'Brien, et al., 2010; Jappe et
al., 2011) although as discussed earlier, differences between phenotypic presentations
are still not clear. Larger studies may be able to explore further differences in reward
sensitivity based on maternal ED phenotypic expression (AN-binge/purge vs AN-
restrictive) to further clarify differences. Interestingly, BAS drive has also been shown to
be correlated with measures of self-directed perfectionism (beliefs that striving for
perfection in oneself is important) (Stoeber & Corr, 2015) which has also been shown to
be a possible maintaining or risk factor in AN (Bardone-Cone et al., 2007; Fairburn et al.,
2003). It is possible that results of high reward sensitivity in this sample could also be
tapping into this construct.
This study did not find higher sensitivity to punishment in girls at ED risk compared to girls
at low risk although supplementary analysis stratified by maternal diagnosis showed a
difference between girls of mothers with AN and healthy girls. The BIS system has been
implicated in the expression of negative affective states such as fear and anxiety in
response to punishment cues. It has been suggested that elevated anxiety might have a
basis in dispositional punishment sensitivity (Amy Harrison et al., 2011; Jappe et al., 2011).
In fact, a factor analysis of the STAI (measure of state and trait anxiety) and BIS suggested
that they are strongly correlated constructs (A. J. Cooper, Perkins, & Corr, 2007). Girls at
risk did have higher scores in the BIS scale, which became significant once stratifying by
maternal diagnosis. It is therefore possible, that higher sensitivity to punishment is linked
to AN rather than BN. Given the directionality of results and differences when stratifying
by maternal diagnosis, it is worth further investigating this in a larger sample.
Overall, as shown in Chapter 2, fMRI studies have also shown altered reward processing
in patients with both AN and BN using both taste and monetary paradigms (J. Cha et al.,
2016a; Olivo et al., 2017; Steward et al., 2018; Wu et al., 2016) suggesting alterations in
the ventral striatal region. Voxel-based morphometry methods have also shown positive
associations between sensitivity to punishment and reward and gray matter volume in both
the amygdala and the hippocampal area (Barros-Loscertales et al., 2006). Gray (J. A.
Gray, 1970) proposed that elevated scores on trait anxiety measures (reflecting overactive

189
BIS – higher sensitivity to punishment) would represent a specific risk factor for generalise
anxiety disorders. It is possible to hypothesise that alterations in the ventral striatal region
and increased gray matter in amygdala and hippocampal area could represent an
endophenotype related to reward sensitivity.
Interestingly, this study did not confirm past findings of alterations in social cognition
measures in children at risk (R. Kothari et al., 2015). This could be due to a number of
factors. First of which is the sample studied. While Kothari and colleagues studied a large
sample, we were only able to study less than 40 girls in total, therefore, lack of findings
could be due to a lack of power. Secondly, differences could be due to the use of tasks
and the way these were administered. While Kothari and colleagues used three measures
to asses social cognition (Social Communication Disorders Checklist, Faces subtest of the
Diagnostic Analysis of Non-verbal accuracy and Emotional Triangles), we used two
measures focused on assessing emotions based on faces and eyes (the second measure
was design to explore more complex theory of mind traits). There were also limitations in
the way our tasks were administered, as they were done remotely online, hence testing
environment was not controlled for, other variables unknown to the researchers could have
influenced performance. Interestingly, Kothari and colleagues did not find differences
overall in emotion recognition, but found that children of mothers with binge-purge type
disorders had differential facial emotional processing and poorer recognition from fear and
social motion cues. It is possible that by exploring an overall measure of emotion
recognition we were not able to differentiate between recognition of different types of
emotions or measures of misinterpretation rather than recognition. While research has
suggested that patients with BN may have difficulties categorising emotional faces
(Kucharska-Pietura et al., 2004; Kuhnpast et al., 2012; Legenbauer et al., 2008; Pollatos
et al., 2008), Kothari and colleagues only found misinterpretation of emotions in children
at risk. It has been suggested that deficits in the ability to recognise emotional information
in faces could contribute to interpersonal stress by misunderstandings in interpersonal
relationships and poor social communication (Kuhnpast et al., 2012). It is possible that
given that a part of the research in poor emotional identification focuses on patients with
BN, these difficulties are more associated with risk for binge-purge subtype ED. While we
did not have the power to run analyses based on maternal ED subtype, in our sample we
only had a total of 3 mothers with a lifetime diagnosis of maternal BN (two of which had
had both AN and BN and only one of which was purely BN) and 14 with a lifetime diagnosis
of AN. This differences between maternal ED subtype could offer an explanation for why
190
we did not find similar results to those found by Kothari and colleagues. It is of course not
clear what the relation between emotion recognition and ED is and it warrants further
study.
It is worth noting the differences between what processes our two measures (Morphed
emotion identification and Reading the mind in the eyes) are tapping into. Reading the
mind in the eyes, requires higher order mentalization of emotional states and therefore is
used as a measure of theory of mind (Baron-Cohen et al., 2001; Olderbak et al., 2015),
while morphed emotion identification is a clearer emotion recognition task. While
differences did not reach significance, differences in performance based on different social
cognition tasks warrant some thoughts. Girls at risk performed better than controls in
morphed emotion identification but worse than controls in Reading the mind in the eyes.
As suggested in the previous paragraph, it is possible that difficulties in emotion
recognition are linked to binge-purge type ED while difficulties in theory of mind which
require higher order processing and understanding of others emotional state might be
linked to restricting type ED. This could possibly explain why children in our sample, the
majority of which were at high-risk for AN performed worse in these tasks, while they
performed better in the morphed emotion recognition one. Interestingly, deficits in theory
of mind are one of the main findings in ASD (U. Frith & Happe, 1994). In recent years, the
has been an increase in the exploration of the overlap in deficits in ASD and those in AN
after finding an overrepresentation of ASD and/or ASD traits in samples of girls with AN
(Heather Westwood & Tchanturia, 2017; Zhou et al., 2018). Interestingly, deficits in set
shifting abilities are also commonly found in people with ASD and are one of the significant
deficits shown in this chapter between children at risk and children of HC mothers (H.
Westwood et al., 2016).
Limitations
There are limitations that need to be considered. Although this is a pilot study, it is
important to consider the small sample a limitation. Another limitation is the fact that some
of the tasks (social cognition) were completed at home, which can limit the comparability
between subjects. Some of the measures were also for 11 years old and over, which meant
that not all of our subjects could complete them, reducing further our current sample. As
previously stated, this is a pilot study and therefore we did not correct for multiple
191
comparisons. Given that the aim of the study is to develop hypotheses that may guide a
full study in children at risk, it is important to include possible false positives.
Interim conclusion
In conclusion, this chapter shows that girls at high-risk show alterations in set-shifting and
reward processing. While difficulties in cognitive flexibility refer to the ability to shift from
thinking in one dimension to a different one. This influences how quickly we adapt to our
environment and could therefore represent an aspect of rigidity which is shown in patients
with ED. Difficulties in reward processing have long been proposed to play a role in
psychopathology. The role that they play in ED has only recently been investigated and
theories of ED development based on reward processing have been developed. Given the
role that reward plays in food consumption, alterations in reward systems have been
suggested to play an important role in the pathophysiology of ED.
192
Chapter 8. Subcortical and cerebellar volumetric differences in
children at familial high-risk for ED: findings from BREDS
8.1. Introduction
As outlined in Chapter 2, neuroimaging studies in patients with ED have exponentially
increased over the last decades, although they continue to lag behind those of other
psychiatric disorders. As demonstrated, volumetric differences in ED have been found in
patients with AN during acute stages of the disorder (Phillipou et al., 2014; Seitz et al.,
2016). However, it has been proposed that these more obvious differences are most likely
due to the pathophysiology of the disorder characterized by extreme weight loss and self-
starvation. Further research is needed to clarify this as results are not conclusive. As
demonstrated by studies with recovered patients, some of these alterations may normalize
following successful treatment of the disorder (Wagner et al., 2006). However, recent well
controlled studies have also demonstrated some subcortical and cerebellar volumetric
alterations in patients who have been long-term recovered (Roberto et al., 2011; Seitz,
Buhren, Von Polier, et al., 2014). Therefore, further research into subcortical and
cerebellar volumetric differences is important to shed light into possible neural risk markers
for these disorders.
The phenotypic presentation of ED has been widely studied and has informed our current
treatments as well as helped develop hypotheses for possible risk mechanisms that can
help guide neuroimaging research. In 2015, Culbert and colleagues (Culbert, Racine, &
Klump, 2015) wrote a review in which they outlined possible risk factors based on results
from studies using integrative methodologies (e.g. twin studies, gene-environment
interactions) and/or data at the biological and behavioural level (e.g. neuroimaging). This
review identified a variety of risk factors that could predispose an individual to develop an
ED: these included factors such as negative emotionality, inhibitory control, and cognitive
inflexibility amongst others. In 2016 McAdams and Smith wrote a targeted review focused
on identifying cognitive neuroimaging data with translational relevance for the treatment of
ED (McAdams & Smith, 2015). The authors reviewed 32 papers and identified three major
neural systems which are disrupted in ED: reward, decision making, and social processing.
In order to provide a neuroanatomical context to the review, the authors also performed a
Neurosynth meta-analysis that highlights the neural regions most commonly identified in
193
studies of reward (functional MRI of reward studies using food-based and monetary
paradigms, N=560 studies), as well as studies involving decision making (N=569 studies)
and those using social cognition paradigms (N=960 studies). Results from the nerosynth
meta-analysis highlighted the nucleus accumbens (NA), putamen, caudate, anterior insula
as well as the midbrain, the anterior cingulate and ventromedial prefrontal cortex (vmPFC)
as the neural regions most commonly identified in studies of reward. Many areas
highlighted in studies in patients with ED involved in decision making overlapped with
those in reward, such as the caudate and insula with the addition of part of the frontal
cortex. Lastly, there was some overlap between areas highlighted in studies of social
cognition and those in reward and decision making, such as areas in the medial prefrontal
cortex and insula. However, more areas were highlighted such as the bilateral
temporoparietal junctions, bilateral amygdala, and smaller clusters in the right temporal
pole, right fusiform and superior frontal gyrus. Findings from this review conclude patients
with ED have altered neural systems that mediate reward response, decision-making and
social behaviours, and highlighted subcortical areas such as NA, caudate, cingulate,
insula, amygdala and areas from the prefrontal cortex (vmPFC) as being altered in this
group of patients.
As established in earlier chapters research suggests that alteration in brain circuits related
to cognitive control and emotion are of importance to the maintenance (Walter H Kaye,
Wierenga, Bailer, Simmons, & Bischoff-Grethe, 2013) and possibly development of AN.
Neuroimaging studies have found alterations in prefrontal and anterior cingulate cortices
in relation to cognitive control in AN (Ehrlich et al., 2015; Sato et al., 2013), while altered
areas related to reward sensitivity have also been identified in both BN and AN (Jiook Cha
et al., 2016; G. K. Frank, Shott, & Mittal, 2013; Garcia-Garcia et al., 2013; A. Harrison,
O'Brien, et al., 2010; W. H. Kaye et al., 2011; Titova et al., 2013; Wu et al., 2016). Ample
evidence exists with regards to the association between AN and alterations in emotion
processing. In fact, the comorbidity between AN and Autism Spectrum Disorder (ASD) has
been largely studied (Coombs, Brosnan, Bryant-Waugh, & Skevington, 2011). Most
evidence in AN suggests an alteration of circuits related to the perception and processing
of emotional stimuli, and studies investigating emotional processing in depressed and
anxious adolescents have identified the amygdala as playing a central role in the mediation
and processing of emotional stimuli (Fusar-Poli et al., 2009). In fact, research in patients
with AN found that when exposed to emotionally salient stimuli that are specific for ED
pathophysiology (such as images of food and bodies) both patients with AN and those
194
recovered (relative to HC) show greater activation in cortical and subcortical brain circuits,
including the anterior cingulate, prefrontal cortex and amygdala (Bang, Ro, & Endestad,
2016; Seeger, Braus, Ruf, Goldberger, & Schmidt, 2002; Vocks et al., 2010).
Although as established, research into children at familial-high risk for developing ED is of
great importance, little has been published to date. As highlighted in Chapter 3, early
research on the neuropsychological and cognitive profile of children at high-familial risk
has already identified that children of mothers with ED show poorer performance on social
cognition tasks, have higher odds of having emotional difficulties and have decreased
attentional control (Barona, Nybo Andersen, & Micali, 2016; Barona et al., 2017; R. Kothari
et al., 2015; R. Kothari et al., 2014; R. Kothari et al., 2013b).
Alterations in reward, decision making, and social cognition processes as well as other
interpersonal processes (such as negative emotionality) and their neural correlates have
been proposed as possible risk mechanisms for ED and have been found to be altered not
only in recovered patients but in healthy first degree relatives (e.g. siblings or parents) of
patients with ED. The aims of this chapter are: first, to explore whole brain volume and
subcortical brain volumetric differences in children at risk, in order to help elucidate if areas
correlated to these functions (reward, decision and social cognition) are found to be altered
in children at high-risk of developing ED. Second, given the suggested role that specific
regions such as anterior cingulate, orbitofrontal cortex, and insula play in the development
of ED, this study focused on these specific regions to explore hypothesis-driven analyses.
8.2. Methods
8.2.1. Participants
Data from both cases and controls were collected as part of the Brain in high-Risk for
Eating Disorders Study. For further details on methodology see Chapter 4.
Information on maternal and child demographics, maternal ED diagnosis and children
intelligence and neurocognitive measures can be found in Chapter 4.
As a summary, this study explored measures of general intelligence (WASI) , social
cognition (Reading the Mind in the Eyes and Morphed Emotion Recognition) (Baron-
195
Cohen et al., 2001), CANTAB neurocognitive measures: motor screening, inhibitory
control, set-shifting of cognitive flexibility, risk-taking behaviour, sustained attention and
visual working memory (J. Fray et al., 1996) and reward measures (BIS/BAS) (A. Cooper
et al., 2007). Significant differences between groups were found in set-shifting (girls at risk
took a significantly longer time to switch when compared to controls) and BAS drive (girls
at risk had higher drive towards pursuing goals when compared to controls) (see Chapter
7 for detailed information).
8.2.3. MRI Acquisition
Data acquisition and pre-processing proceeded as described in Chapter 4.
8.2.4. Pre-processing
The raw MRI data (DICOM file) was converted into NIFTI format using Tractor software
(Clayden et al., 2011) (http://www.tractor-mri.org.uk). The TractorR software includes R
packages for reading, writing and visualising MRI images and it also includes functions
designed for working with diffusion MRI data and Tractography.
8.2.4.1. Freesurfer
Freesurfer was used to acquire full surface reconstructions (Fig. 7.1) and subcortical
reconstructions (Fig. 7.2) (full details in Chapter 4). FreeSurfer image analysis suite
(http://surfer.nmr.mgh.harvard.edu/), provides a set of tools to reconstruct topologically
correct surface models of the inner and outer cortical boundaries. FreeSurfer produces a
number of files with volume information, including data on subcortical segmentation (aseg)
and cortical parcellations (aparc) volumes.
Following automated processing steps outlined in Chapter 4, each individual cortical
reconstruction was visually inspected to ensure optimal grey/white matter classification
with the support of quality assurance tools implemented in FreeSurfer
(https://surfer.nmr.mgh.harvard.edu/fswiki/QATools). Manual edits were used where
necessary. Following this process, measurements were directly obtained from the
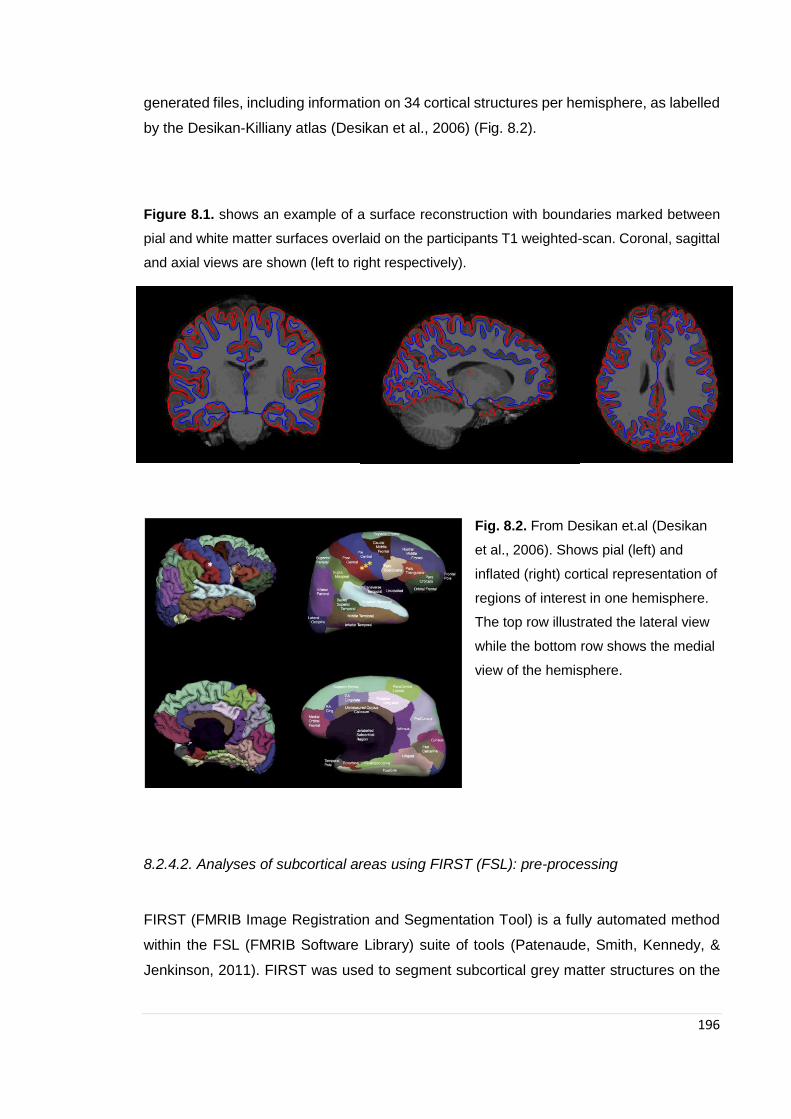
196
generated files, including information on 34 cortical structures per hemisphere, as labelled
by the Desikan-Killiany atlas (Desikan et al., 2006) (Fig. 8.2).
Figure 8.1. shows an example of a surface reconstruction with boundaries marked between
pial and white matter surfaces overlaid on the participants T1 weighted-scan. Coronal, sagittal
and axial views are shown (left to right respectively).
Fig. 8.2. From Desikan et.al (Desikan
et al., 2006). Shows pial (left) and
inflated (right) cortical representation of
regions of interest in one hemisphere.
The top row illustrated the lateral view
while the bottom row shows the medial
view of the hemisphere.
8.2.4.2. Analyses of subcortical areas using FIRST (FSL): pre-processing
FIRST (FMRIB Image Registration and Segmentation Tool) is a fully automated method
within the FSL (FMRIB Software Library) suite of tools (Patenaude, Smith, Kennedy, &
Jenkinson, 2011). FIRST was used to segment subcortical grey matter structures on the

197
T1-weighted scans. The structures included were the amygdala, caudate, globus pallidus,
nucleus accumbens and thalamus (see Figure 8.3).
FIRST begins by using an affine-registration of all T1-weighted scans to the MNI152
standard-space template in two different steps: first the tool registers the image to the
entire template and follows with a separate registration to a subcortical mask of the
template in order to optimally align the subcortical structures.
FIRST uses shape and appearance models that have been generated from manually-
traced masks combined with signal intensity information that helps guide the segmentation
of each subcortical grey matter structure.
The last stage of FIRST is a boundary correction which is done in order to correct for any
overlapping voxels. Before extracting the volumes for each subcortical structure, all
registrations and segmentations were visually inspected for accuracy. FIRST produces an
html link in order to inspect each parcellation. FIRST has been optimized and no
discernible issues were found while inspecting the structures.
Volumes for each of the subcortical structures were then obtained using FSL utilities.
Figure 8.3. shows an example of FIRST output of subcortical structures overlaid on a T1-
weighted scan. Coronal, sagittal and axial views are shown (left to right respectively). The
following subcortical structures were segmented: caudate (blue-grey), nucleus accumbens
(orange), putamen (pink), globus pallidus (dark blue), thalamus (green), amygdala (bright light
blue) and hippocampus (yellow).

198
7.2.4.2. Freesurfer vs. FSL FIRST
Delineation of brain regions in MR images is an important technique that plays an
expanding role in neuroscience research. While traditionally, brain regions were
segmented manually, this method can be subjective (depending on ability) and very time
consuming. Therefore, automated segmentation tools have been proposed with FSL-
FIRST and Freesurfer methods being the two most widely used. Despite both being
validated, there is evidence that they are not always equally accurate.
Given the importance of striatal structures in the study of ED and because their
segmentation can be challenging (Patenaude et al., 2011), we chose to use FIRST as it
has been shown to be more accurate (compared to manual tracing) in the automated
segmentation of caudate and putamen (Perlaki et al., 2017), and nucleus accumbens
(Rane, Plassard, Landman, Claassen, & Donahue, 2017).
Visual inspection showed problems in nucleus accumbens and putamen Freesurfer
segmentation in some of our images. Further analyses showed that left nucleus
accumbens volumes segmented by FIRST and those segmented by Freesurfer were not
correlated (Fig. 8.4).
Figure 8.4. Scatterplot showing considerable variability between software’s. (Correlation
results: r = 0.225, p = 0.156)

199
8.2.5. Statistical analyses
Independent sample t-tests were used to compare demographic measures between the
at-risk and control groups (Chapter 4). All variables were examined to check for
inconsistencies and outliers and normality using tabulations, graphs and plots.
Associations between children at risk status and cerebellar and subcortical volumes were
investigated using crude and adjusted linear regression analyses. Further hypothesis
driven region of interest analyses were performed to investigate associations between
specific cortical structures: orbitofrontal cortex (lateral and medial divisions), anterior
cingulate (rostral and caudal divisions), and insula. A priori confounders (children age at
testing, and total intracranial volume) were included in all adjusted models. Further post-
hoc analyses were conducted in order to investigate associations between specific
maternal ED diagnoses (lifetime AN) and outcomes under study.
Correlation analyses were run to investigate the correlation between outcomes and
neuropsychological variables. All analyses were run using SPSS 23 (IBM Corp, Armonk,
NY), and a two-tailed significance level of p ≤ .05 was used.
8.2.5.1. Freesurfer GM and WM volumes
GM and WM total volumes produced by Freesurfer were initially compared between
groups using a one-way between-subjects’ analysis of covariance (ANCOVA) to
investigate interactive effects between groups (HC and at high-risk) while controlling for
age and total intracranial volume (TIV) in SPSS version 24 (SPSS Inc. 2012, Chicago, IL.).
Although age did not differ significantly between groups, due to the large age range
sampled (8 – 15 years old), age was included as a covariate and could contribute to GM
variations.
8.2.5.3. FIRST: subcortical volume analyses
Volume data were extracted from each subcortical area using FSL utilities as described
previously and input into SPSS. Data was then checked for normality and outliers and then
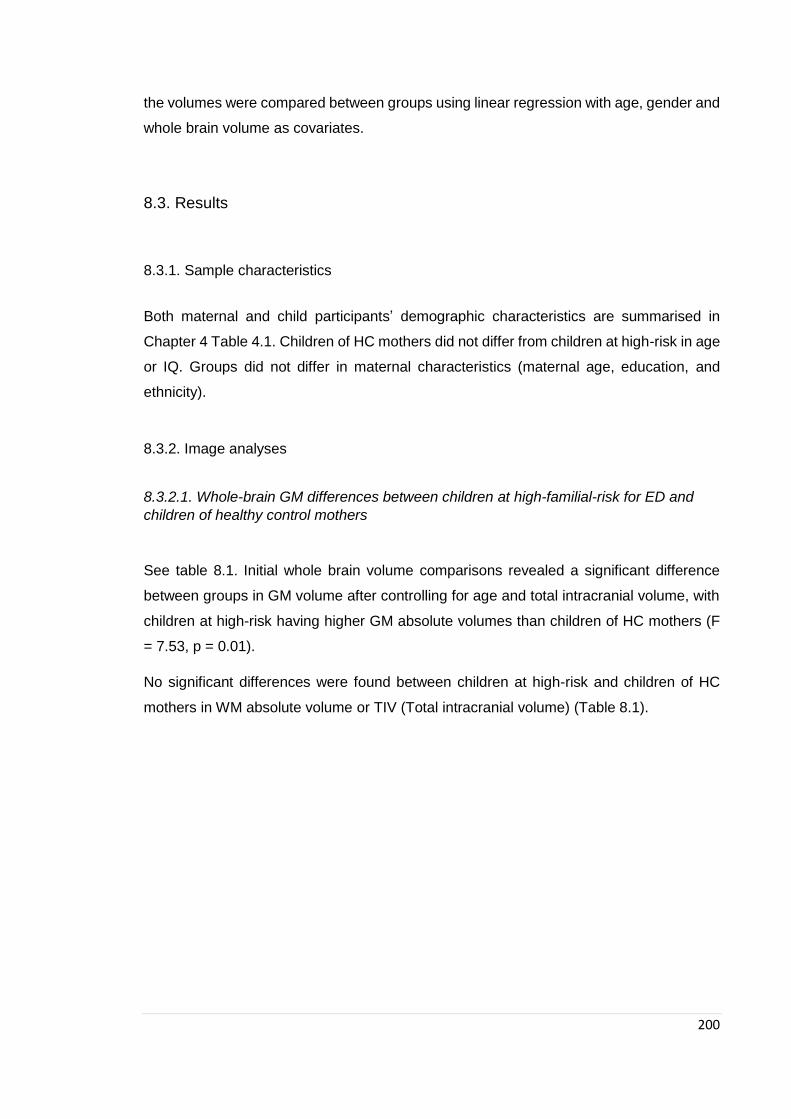
200
the volumes were compared between groups using linear regression with age, gender and
whole brain volume as covariates.
8.3. Results
8.3.1. Sample characteristics
Both maternal and child participants’ demographic characteristics are summarised in
Chapter 4 Table 4.1. Children of HC mothers did not differ from children at high-risk in age
or IQ. Groups did not differ in maternal characteristics (maternal age, education, and
ethnicity).
8.3.2. Image analyses
8.3.2.1. Whole-brain GM differences between children at high-familial-risk for ED and
children of healthy control mothers
See table 8.1. Initial whole brain volume comparisons revealed a significant difference
between groups in GM volume after controlling for age and total intracranial volume, with
children at high-risk having higher GM absolute volumes than children of HC mothers (F
= 7.53, p = 0.01).
No significant differences were found between children at high-risk and children of HC
mothers in WM absolute volume or TIV (Total intracranial volume) (Table 8.1).
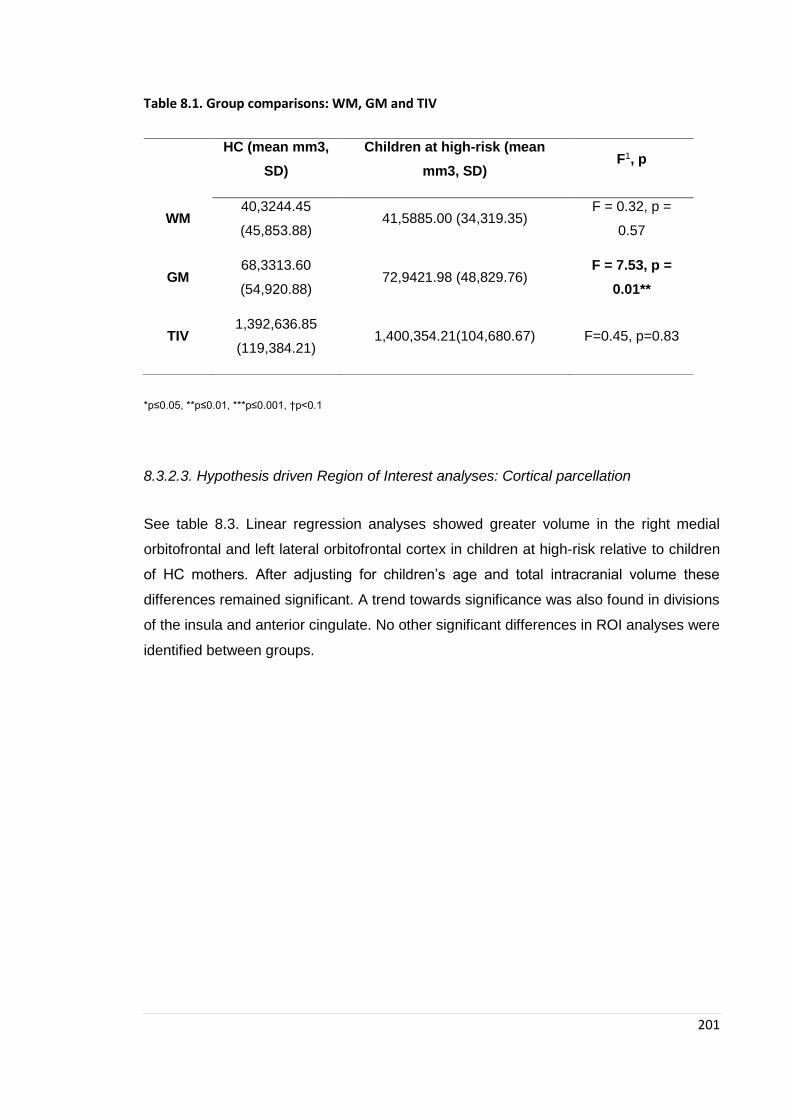
201
Table 8.1. Group comparisons: WM, GM and TIV
*p≤0.05, **p≤0.01, ***p≤0.001, †p<0.1
8.3.2.3. Hypothesis driven Region of Interest analyses: Cortical parcellation
See table 8.3. Linear regression analyses showed greater volume in the right medial
orbitofrontal and left lateral orbitofrontal cortex in children at high-risk relative to children
of HC mothers. After adjusting for children’s age and total intracranial volume these
differences remained significant. A trend towards significance was also found in divisions
of the insula and anterior cingulate. No other significant differences in ROI analyses were
identified between groups.
HC (mean mm3,
SD)
Children at high-risk (mean
mm3, SD) F1, p
WM 40,3244.45
(45,853.88) 41,5885.00 (34,319.35)
F = 0.32, p =
0.57
GM 68,3313.60
(54,920.88) 72,9421.98 (48,829.76)
F = 7.53, p =
0.01**
TIV 1,392,636.85
(119,384.21) 1,400,354.21(104,680.67) F=0.45, p=0.83
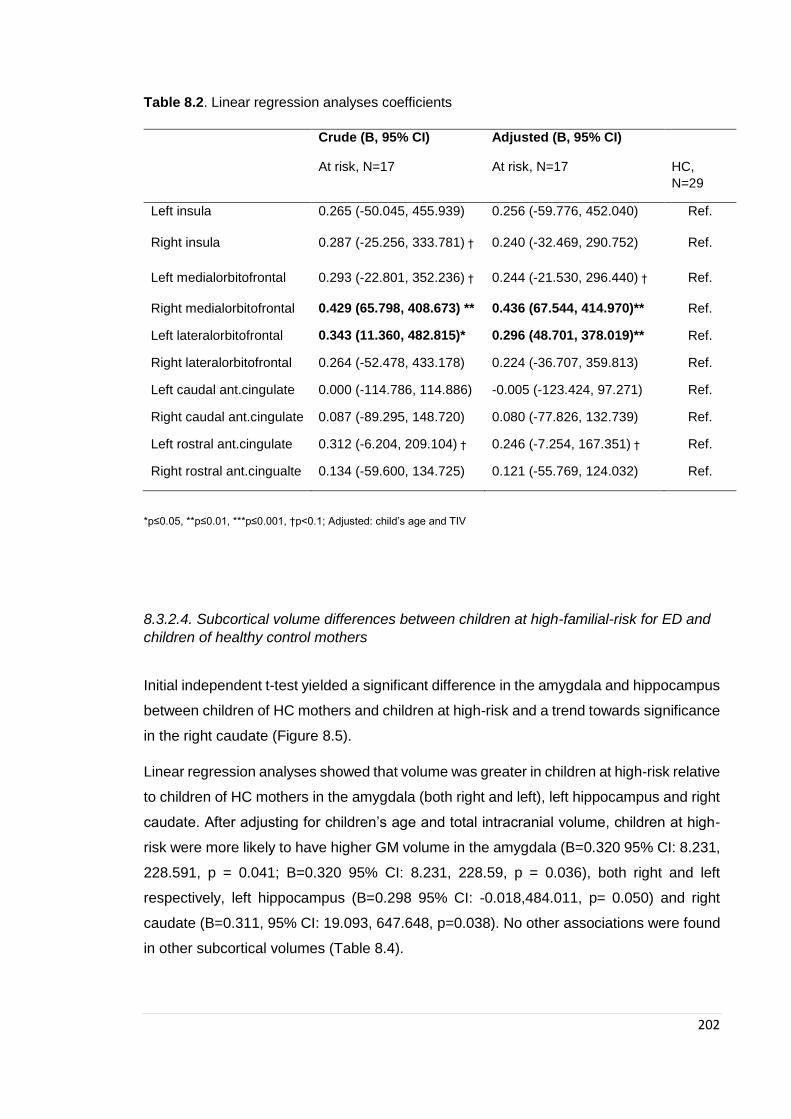
202
Table 8.2. Linear regression analyses coefficients
Crude (B, 95% CI) Adjusted (B, 95% CI)
At risk, N=17 At risk, N=17 HC,
N=29
Left insula 0.265 (-50.045, 455.939) 0.256 (-59.776, 452.040) Ref.
Right insula 0.287 (-25.256, 333.781) † 0.240 (-32.469, 290.752) Ref.
Left medialorbitofrontal 0.293 (-22.801, 352.236) † 0.244 (-21.530, 296.440) † Ref.
Right medialorbitofrontal 0.429 (65.798, 408.673) ** 0.436 (67.544, 414.970)** Ref.
Left lateralorbitofrontal 0.343 (11.360, 482.815)* 0.296 (48.701, 378.019)** Ref.
Right lateralorbitofrontal 0.264 (-52.478, 433.178) 0.224 (-36.707, 359.813) Ref.
Left caudal ant.cingulate 0.000 (-114.786, 114.886) -0.005 (-123.424, 97.271) Ref.
Right caudal ant.cingulate 0.087 (-89.295, 148.720) 0.080 (-77.826, 132.739) Ref.
Left rostral ant.cingulate 0.312 (-6.204, 209.104) † 0.246 (-7.254, 167.351) † Ref.
Right rostral ant.cingualte 0.134 (-59.600, 134.725) 0.121 (-55.769, 124.032) Ref.
*p≤0.05, **p≤0.01, ***p≤0.001, †p<0.1; Adjusted: child’s age and TIV
8.3.2.4. Subcortical volume differences between children at high-familial-risk for ED and
children of healthy control mothers
Initial independent t-test yielded a significant difference in the amygdala and hippocampus
between children of HC mothers and children at high-risk and a trend towards significance
in the right caudate (Figure 8.5).
Linear regression analyses showed that volume was greater in children at high-risk relative
to children of HC mothers in the amygdala (both right and left), left hippocampus and right
caudate. After adjusting for children’s age and total intracranial volume, children at high-
risk were more likely to have higher GM volume in the amygdala (B=0.320 95% CI: 8.231,
228.591, p = 0.041; B=0.320 95% CI: 8.231, 228.59, p = 0.036), both right and left
respectively, left hippocampus (B=0.298 95% CI: -0.018,484.011, p= 0.050) and right
caudate (B=0.311, 95% CI: 19.093, 647.648, p=0.038). No other associations were found
in other subcortical volumes (Table 8.4).
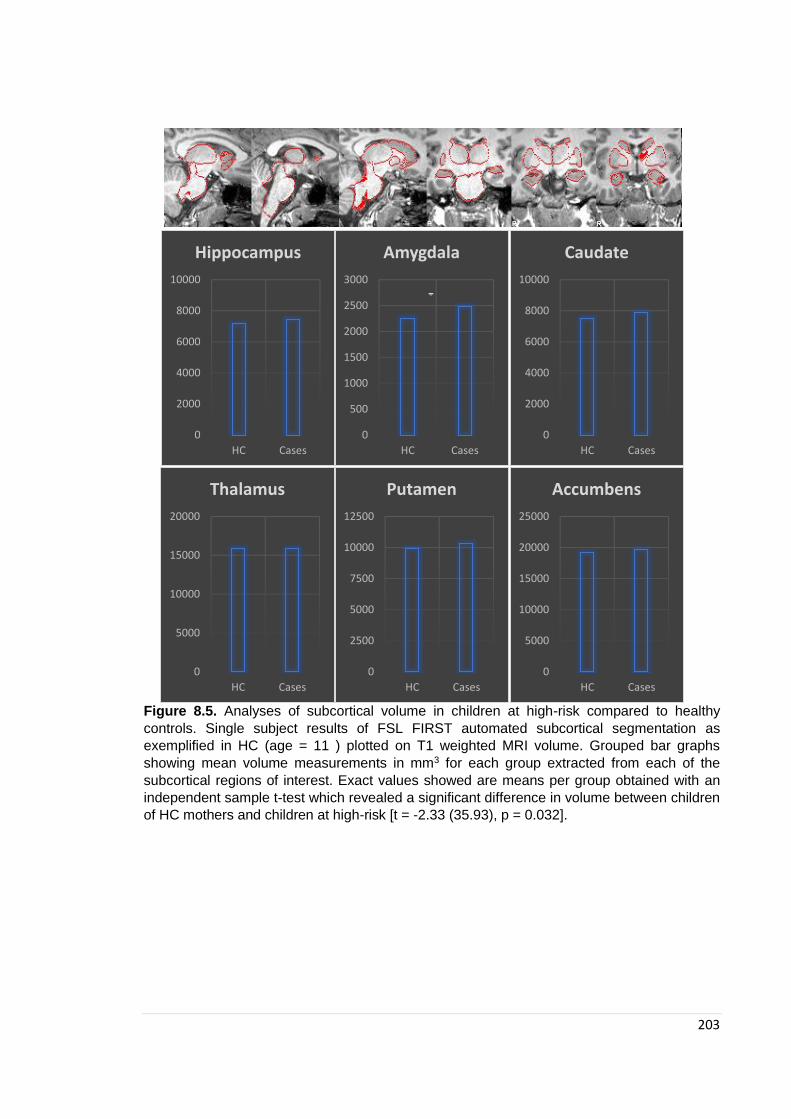
203
Figure 8.5. Analyses of subcortical volume in children at high-risk compared to healthy
controls. Single subject results of FSL FIRST automated subcortical segmentation as
exemplified in HC (age = 11 ) plotted on T1 weighted MRI volume. Grouped bar graphs
showing mean volume measurements in mm3 for each group extracted from each of the
subcortical regions of interest. Exact values showed are means per group obtained with an
independent sample t-test which revealed a significant difference in volume between children
of HC mothers and children at high-risk [t = -2.33 (35.93), p = 0.032].
0
2000
4000
6000
8000
10000
HC Cases
Hippocampus
0
500
1000
1500
2000
2500
3000
HC Cases
Amygdala
*
0
2000
4000
6000
8000
10000
HC Cases
Caudate
0
5000
10000
15000
20000
HC Cases
Thalamus
0
2500
5000
7500
10000
12500
HC Cases
Putamen
0
5000
10000
15000
20000
25000
HC Cases
Accumbens
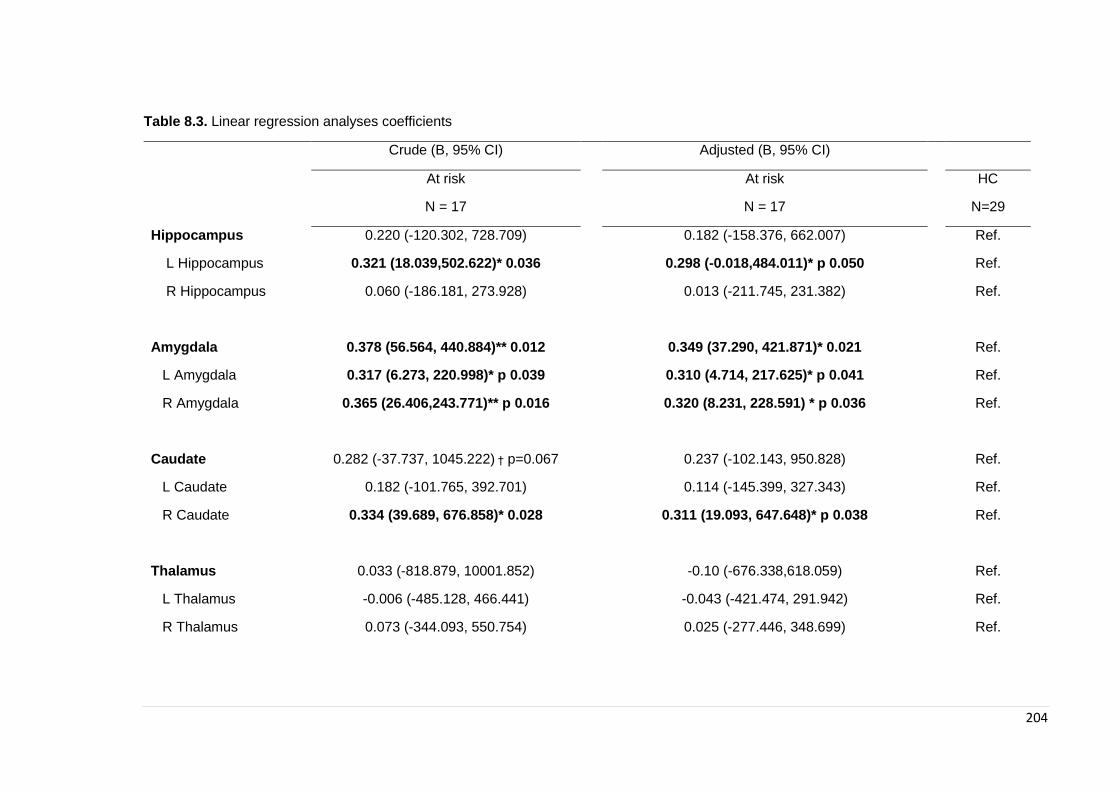
204
Table 8.3. Linear regression analyses coefficients
Crude (B, 95% CI) Adjusted (B, 95% CI)
At risk At risk HC
N = 17 N = 17 N=29
Hippocampus 0.220 (-120.302, 728.709)
0.182 (-158.376, 662.007)
Ref.
L Hippocampus 0.321 (18.039,502.622)* 0.036
0.298 (-0.018,484.011)* p 0.050
Ref.
R Hippocampus 0.060 (-186.181, 273.928)
0.013 (-211.745, 231.382)
Ref.
Amygdala 0.378 (56.564, 440.884)** 0.012
0.349 (37.290, 421.871)* 0.021
Ref.
L Amygdala 0.317 (6.273, 220.998)* p 0.039
0.310 (4.714, 217.625)* p 0.041
Ref.
R Amygdala 0.365 (26.406,243.771)** p 0.016
0.320 (8.231, 228.591) * p 0.036
Ref.
Caudate 0.282 (-37.737, 1045.222) † p=0.067
0.237 (-102.143, 950.828)
Ref.
L Caudate 0.182 (-101.765, 392.701)
0.114 (-145.399, 327.343)
Ref.
R Caudate 0.334 (39.689, 676.858)* 0.028
0.311 (19.093, 647.648)* p 0.038
Ref.
Thalamus 0.033 (-818.879, 10001.852)
-0.10 (-676.338,618.059)
Ref.
L Thalamus -0.006 (-485.128, 466.441)
-0.043 (-421.474, 291.942)
Ref.
R Thalamus 0.073 (-344.093, 550.754)
0.025 (-277.446, 348.699)
Ref.
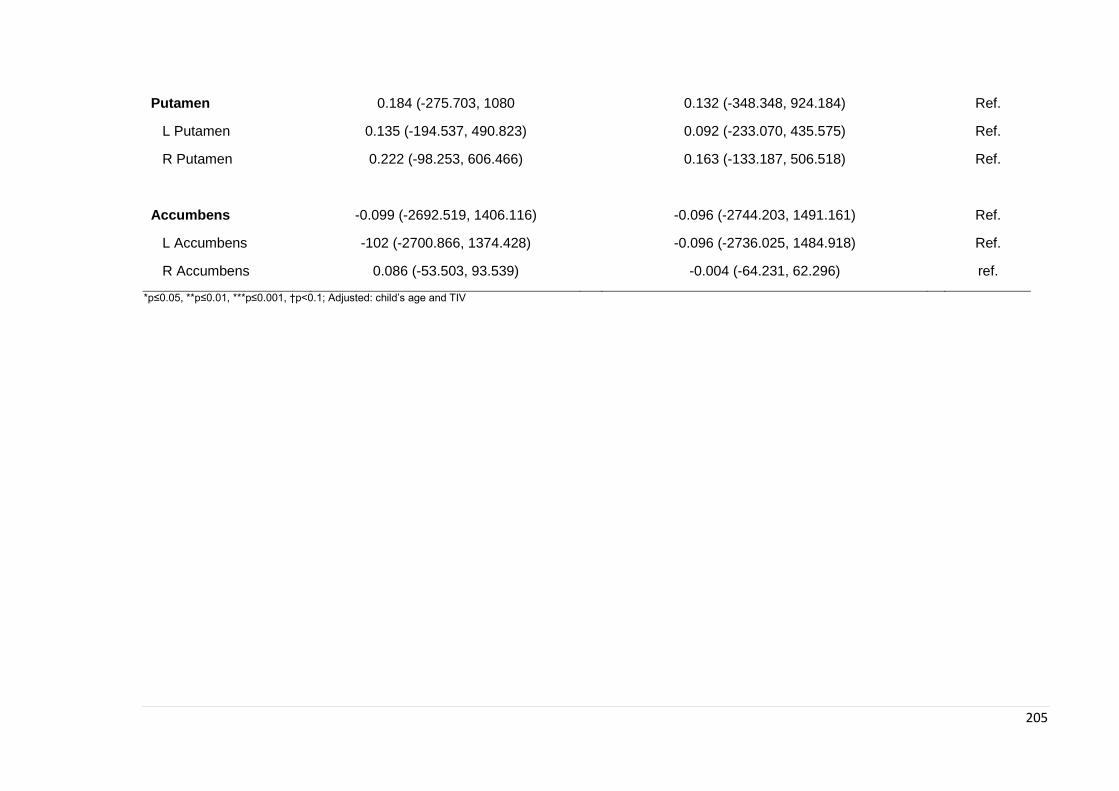
205
Putamen 0.184 (-275.703, 1080
0.132 (-348.348, 924.184)
Ref.
L Putamen 0.135 (-194.537, 490.823)
0.092 (-233.070, 435.575)
Ref.
R Putamen 0.222 (-98.253, 606.466)
0.163 (-133.187, 506.518)
Ref.
Accumbens -0.099 (-2692.519, 1406.116)
-0.096 (-2744.203, 1491.161)
Ref.
L Accumbens -102 (-2700.866, 1374.428)
-0.096 (-2736.025, 1484.918)
Ref.
R Accumbens 0.086 (-53.503, 93.539)
-0.004 (-64.231, 62.296)
ref.
*p≤0.05, **p≤0.01, ***p≤0.001, †p<0.1; Adjusted: child’s age and TIV

206
8.3.2.4. Exploratory analyses
When stratifying analyses by maternal diagnosis, linear regression analyses showed that
volume of the right amygdala was greater in children at high-risk (for AN) relative to
children of HC mothers. After adjusting for children’s age and total intracranial volume,
children at high-risk (for AN) were more likely to have higher GM volume in the amygdala
(B = 0.33, 95% CI: 21.43, 440.88, p = 0.032), the right amygdala specifically. No other
associations were found in other subcortical volumes with previous significant differences
in the whole group (Table 8.5).
Table 8.4. Linear regression analyses coefficients divided by maternal ED subtype diagnosis
(AN)
Crude (B, 95% CI) Adjusted (B, 95% CI)
At risk At risk HC
N = 14 N = 14 N=28
Hippocampus 0.064 (-372.639, 553.288)
0.097 (-317.388, 590.384)
Ref.
L Hippocampus 0.135 (-154.952, 374.848)
0.165 (-133.515, 402.726)
Ref.
R Hippocampus -0.025 (-273.979, 234.731)
0.002 (-246.637, 250.422)
Ref.
Amygdala 0.309 (-2.353, 406.462)†
0.345 (22.225, 429.510)*
Ref.
L Amygdala 0.197 (-46.210, 192.285)
0.254 (-25.198, 213.432)
Ref.
R Amygdala 0.361 (12.67, 237.814)*
0.370 (21.991, 241.509)*
Ref.
Caudate 0.139 (-315.023, 786.305)
0.170 (-247.878, 824.878)
Ref.
L Caudate 0.063 (-195.927, 289.602)
0.071 (-177.529, 282.887)
Ref.
R Caudate 0.181 (-148.327, 525.934)
0.226 (-99.416, 571.058)
Ref.
p≤0.05, **p≤0.01, ***p≤0.001, †p<0.1; Adjusted: child’s age and TIV

207
8.3.2.5. Correlation analyses with neuropsychological scores
Partial correlation analyses in the familial high-risk group showed a significant correlation
between attention switching measures (congruency cost and switching cost) and
hippocampal volume (right and left respectively). No other correlations were found
between neuropsychological measures and hippocampus, amygdala and caudate. See
table 8.6.
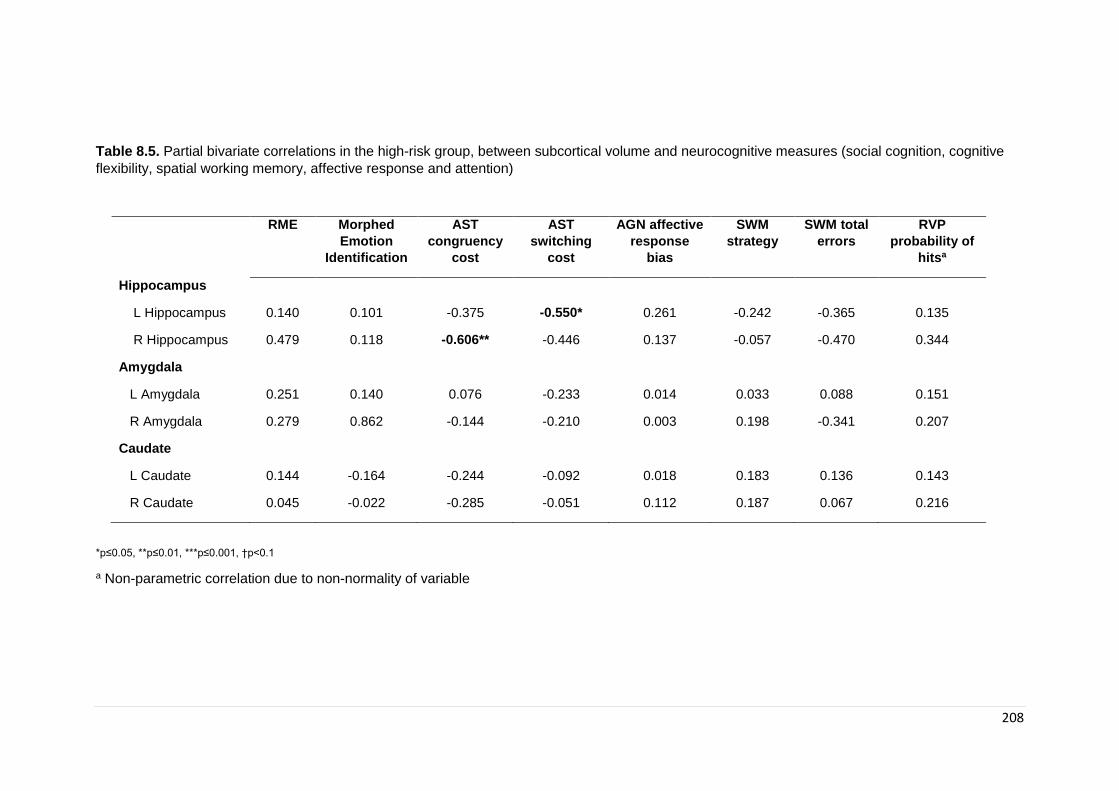
208
Table 8.5. Partial bivariate correlations in the high-risk group, between subcortical volume and neurocognitive measures (social cognition, cognitive
flexibility, spatial working memory, affective response and attention)
RME Morphed
Emotion
Identification
AST
congruency
cost
AST
switching
cost
AGN affective
response
bias
SWM
strategy
SWM total
errors
RVP
probability of
hitsa
Hippocampus
L Hippocampus 0.140 0.101 -0.375 -0.550* 0.261 -0.242 -0.365 0.135
R Hippocampus 0.479 0.118 -0.606** -0.446 0.137 -0.057 -0.470 0.344
Amygdala
L Amygdala 0.251 0.140 0.076 -0.233 0.014 0.033 0.088 0.151
R Amygdala 0.279 0.862 -0.144 -0.210 0.003 0.198 -0.341 0.207
Caudate
L Caudate 0.144 -0.164 -0.244 -0.092 0.018 0.183 0.136 0.143
R Caudate 0.045 -0.022 -0.285 -0.051 0.112 0.187 0.067 0.216
*p≤0.05, **p≤0.01, ***p≤0.001, †p<0.1
a Non-parametric correlation due to non-normality of variable
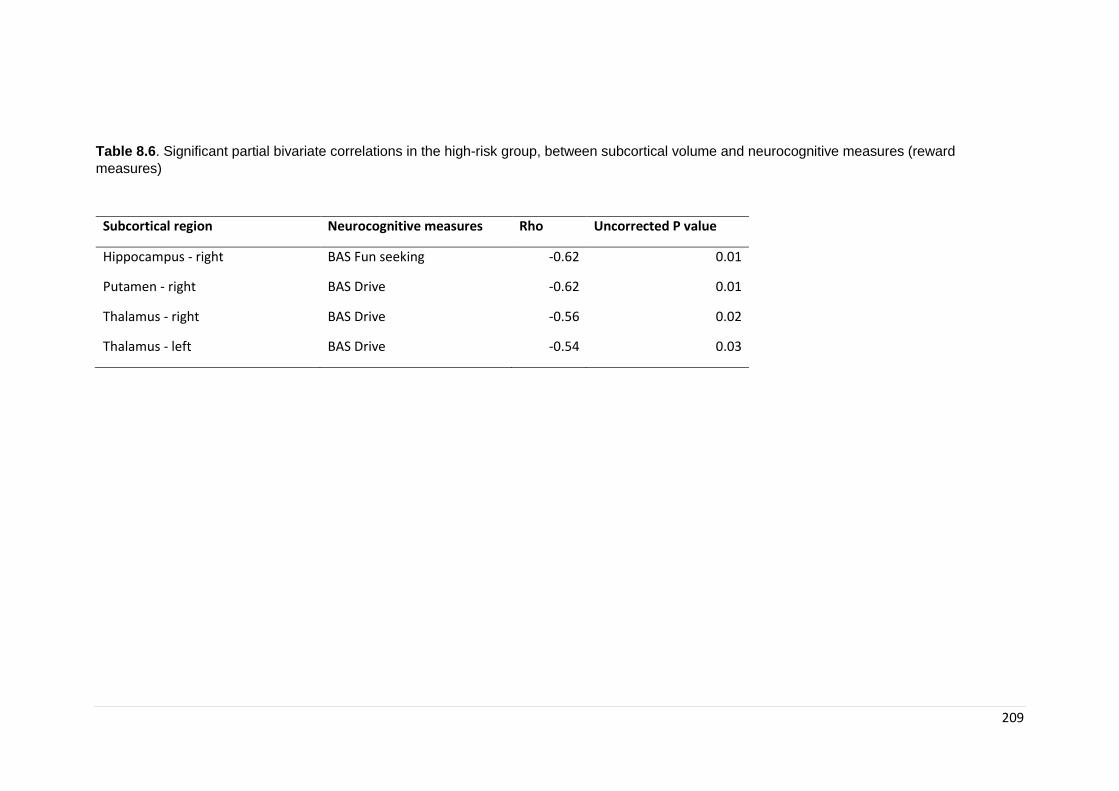
209
Table 8.6. Significant partial bivariate correlations in the high-risk group, between subcortical volume and neurocognitive measures (reward
measures)
Subcortical region Neurocognitive measures Rho Uncorrected P value
Hippocampus - right BAS Fun seeking -0.62 0.01
Putamen - right BAS Drive -0.62 0.01
Thalamus - right BAS Drive -0.56 0.02
Thalamus - left BAS Drive -0.54 0.03
210
8.4. Discussion
We investigated grey and white matter volume alterations in children at high familial risk
for ED compared to children of healthy control mothers. Our main findings in this study are
of greater GM volume in children at high-familial risk for ED. The second aim of this study
was to investigate subcortical volumetric differences. Significantly greater volume was
found in the amygdala (both left and right), left hippocampus and right caudate in children
at high familial risk for ED compared to children of healthy control mothers. Exploratory
analyses showed that children of mothers with lifetime AN diagnosis had significantly
greater volume in the amygdala. Hypothesis driven analyses of cortical regions showed
greater volume in medial orbitofrontal areas and trends towards significance in the insula
in girls at risk compared to girls of healthy control mothers. Lastly, we found significant
correlations between measures of cognitive flexibility and hippocampus volume. Reward
sensitivity was also correlated with volume in hippocampus, putamen and thalamus.
Interestingly, all significant differences show increased GM, in both cerebellar volumes,
sub-cortical regions and specific cortical regions. It is worth noting that although most
studies in patients with acute ED have generally found decreased GM in both cerebellar
and subcortical volumes this has been hypothesised to be largely due to the effects of
starvation, although some studies have shown persistent decreased GM after weight
recovery (Katzman, Zipursky, Lambe, & Mikulis, 1997; Swayze et al., 2003). In contrast to
studies on adults, that have generally found decreased GM and decreased WM diffusivity,
some studies investigating adolescents have found increased GM (G. K. Frank, M. E.
Shott, J. O. Hagman, & T. T. Yang, 2013) as well as increased measures of WM diffusivity
(see chapter 6). Since the current research studies children and young people it is more
likely that results would be similar to those found in adolescents. One possible explanation
for these differences is that increased GM volumes may highlight a dysfunction in
developmentally appropriate synaptic pruning, which can lead to an increased GM volume
and influence connectivity. Inappropriate myelination along the GM/WM border could also
be a reason for greater GM volume. In our sample, although not significant, WM volume
was also increased in children at risk compared to HC and therefore suggests that
myelination is also greater in children at risk. However, speculation on the possible
mechanisms involved in larger volumes in children and young people at-risk vs adults in
the ill state requires further clarification. The normal trajectory of GM and WM volume
during childhood and adolescence is opposite, with GM decreasing (following an inverted
211
U shaped trajectory) and WM increasing with age (Lenroot et al., 2007). It is possible, that
in ED differences between children/young people and adults in these trajectories reflect
abnormalities (perhaps delays) in brain maturation, which in turn could underlie risk.
Longitudinal studies in ADHD have shown a developmental delay of cortical thickness
trajectories compared to healthy controls which could reflect some of the difficulties in this
group (Shaw et al., 2007). Longitudinal brain MRI studies in healthy siblings of children
with early onset schizophrenia showed initial alterations in cortical GM change that were
then normalised in adulthood, unlike their siblings, suggesting that GM longitudinal
abnormalities may be, at least in part, a possible endophenotype (Cannon et al., 2003).
Clinical studies have shown that diagnosis-specific brain differences are beginning to
elucidate the timing and nature of deviations from typical development. Therefore, using
trajectories of change in morphometric measures may act as an endophenotype.
Altered subcortical areas found in this study are areas known to play a role in the mediation
of processes such as reward and decision making, affect regulation, and interpersonal
processes which have been shown to be altered in patients with ED. The main finding in
the study was of bilateral increased amygdala volume. This finding persisted in exploratory
analyses after stratifying by maternal ED diagnosis, only including children at risk for AN.
The amygdala is a region located in the brain’s medial temporal lobe forming part of the
limbic system, and it is at the core of the brain’s emotion circuitry. The amygdala has been
described as the fear centre of the brain and has been found to be altered in different
psychiatric disorders including anxiety disorders (Scott L. Rauch, Shin, & Wright, 2003),
OCD (Milad & Rauch, 2012), ADHD (Cubillo, Halari, Smith, Taylor, & Rubia, 2012).
Furthermore, the role of the amygdala in ASD psychopathology, specifically in social
cognition, has been highlighted in numerous neuropathological and neuroimaging studies
(Park et al., 2016).
Disturbance in interpersonal deficits in AN has been proposed to be a trait rather than
state marker, with evidence suggesting premorbid impairment (C. Gillberg & Råstam,
1992). Interpersonal deficits have also been shown to interfere on treatment outcome and
have a negative impact on illness prognosis (P. K. Keel et al., 2005). Studies have
identified premorbid traits of anxiety, patterns of comorbidity with social phobia, ASD and
OCD as being of importance for a cognitive interpersonal model of AN. As discussed in
chapter 2, Zucker and colleagues (Zucker et al., 2007) identified premorbid traits of anxiety
as well as comorbidities with ASD (social withdrawal and rigidity as well as impaired social
212
information processing), social phobia and OCD (excessive rigidity), as the aspects of
central importance in the development of their risk model for AN. Anxiety traits have been
shown to emerge early in AN and to be family transmitted (Strober et al., 2007) (Chapter
1). One possible hypothesis is that cortico-limbic dysfunctions implicated in anxiety might
predispose to ED. In line with this hypothesis, in study one (Chapter 5) (Barona et al.,
2016), results showed an increased level of emotional disorders in children at risk for ED;
it was hypothesised the role that anxiety may play in the development of ED and the
possible shared risk between ED and other psychopathology (including anxiety disorders).
At the core of ED pathophysiology there is a debilitating fear of gaining weight that
overrides the body’s need for calorie intake necessary for survival. As previously stated,
research on neural processes underlying anxiety and fear behaviour have the amygdala
at its centre. The output connections from the medial part of the amygdala go to areas
responsible for physiological responses of anxiety (such as production of cortisol and
autonomic nervous responses through the hypothalamus). Therefore, alterations in the
amygdala could play a role in the development of fear and anxiety responses in ED.
Extensive research has been conducted studying the role of the amygdala in fear
conditioning/anxiety (Lupien, McEwen, Gunnar, & Heim, 2009). For example, increased
GM volume in the amygdala has been repeatedly found in Generalised Anxiety Disorder
(GAD) (Etkin, Prater, Schatzberg, Menon, & Greicius, 2009) patients and increased right
amygdala volume has specifically been associated with prolonged reaction times in GAD
patients, indicating attentional difficulties (Makovac et al., 2016). A study by De Bellis and
colleagues (De Bellis et al., 2000) found increased amygdala volumes in paediatric
Generalised Anxiety Disorder, suggesting an increased sensitivity to threat cues creating
a vulnerability to the disorder. Alternatively, the authors considered a developmental
hypothesis where increased amygdala volume might be the result of increased
anticipatory anxiety during development (A pilot study of amygdala volumes in pediatric
generalized anxiety disorder). A study by Qin and colleagues in 2014 (Qin et al., 2014)
found that in children as young as 7 to 9 years old, anxiety can be reliably predicted by the
volume and connectivity pattern of the amygdala. Animal models have also shown that
early life stress can lead to increased formation of synapses which can lead to an
increased rate of growth of the amygdala (Lupien et al., 2009; Vyas, Jadhav, & Chattarji,
2006). Electrical stimulation of the amygdaloid region has also been associated with fearful
behaviours and physiological responses of anxiety such as increase heart rate, blood
pressure, freezing and activation of fear-related movements (review Davis 1992) (Davis,
1992). A study on autistic children also found a correlation between anxious symptoms

213
and increased amygdala volume (Juranek 2006; Association Between Amygdala Volume
and Anxiety Level: Magnetic Resonance Imaging (MRI) Study in Autistic Children). It is
possible that enlargement of the amygdala is not unique to specific disorders but that cuts
across diagnostic boundaries when there is an underlying element of anxiety.
Most of the work conducted to date exploring fear responses in AN has been focused on
symptoms of AN related to eating and body image. In these studies, greater amygdala
activation has been demonstrated in response to cues relating to food or weight relative
to healthy control participants (G. K. Frank, Bailer, Henry, Wagner, & Kaye, 2004), which
is in line with increased activation in anxiety disorders. Interestingly, in our study we did
not find significant differences in internalising disorders measures between the at-risk
group and HC (as measured by the SDQ). Given the measures used, it is possible that we
were not able to identify specific high anxiety traits, measures such as the STAI, which
was one of the first anxiety measures to measure both trait and state anxiety, may be
worth exploring in the future. Interestingly, when stratifying by maternal diagnosis, results
showed that girls of mothers with AN had higher sensitivity to punishment as measured by
the BIS/BAS. The BIS system mediates reactivity to threat and punishment and can predict
response to anxiety cues. In the 2004 review of the model, McNaughton (McNaughton &
Corr, 2004) described the amygdala as having a central role in anxiety due to its
participation in both the processing of warnings of punishment and promoting arousal
reaction of the BIS. In this study, we did not find any correlations between amygdala and
BIS/BAS measures.
More recently emerging evidence suggests emotion regulation and social cognition as
possible endophenotypes for ED (Ambwani et al., 2016; Lang, Larsson, et al., 2016) (see
chapter 2). The amygdala has also been identified as an area of importance in the study
of social cognition. Ocshner (Ochsner, 2008) in his development of constructs for social
cognition identified the amygdala as the area of importance in the acquisition, recognition
and response to social-affective stimuli. In 1990 Brothers (Brothers, 1990) proposed that
the amygdala is a key component of a circuit that forms the basis of social perception and
studies of lesions in the amygdala have been shown to result in impaired social functioning
in animal research (Emery et al., 2001). These last studies have also shown that the
amygdala is involved in the recognition of emotional facial expressions (in particular fear)
as well as in the development of “theory of mind” (Adolphs, Tranel, Damasio, & Damasio,
1994; Shaw et al., 2004).
214
The association between the amygdala and social cognition suggests that alterations in
this limbic structure could play a pivotal role in the at-risk status for the development of
ED. Extensive research has been conducted in social cognition in patients with ASD, with
amygdala alterations being consistently found. However the evidence is ambiguous:
studies report both amygdala enlargement (Abell et al., 1999; Howard et al., 2000) and
reduction (Rojas et al., 2004) in ASD and fMRI studies have found both hypoactivation
and hyperactivation in response to social cognition tasks. A study by Gibbard (Gibbard,
Ren, Skuse, Clayden, & Clark, 2018) found larger right amygdala in young adults with
ASD. Gibbard also investigated amygdala connectivity and found reduced microstructural
integrity of amygdala-parietal and amygdala-temporal connections all related to ASD
difficulties. Enlarged amygdala has also been found to be associated with anxiety in ASD
and therefore it is possible that amygdala enlargement is associated with anxiety levels
(known to be high in ASD) rather than social cognition. Correlations between subcortical
regions (and the amygdala specifically) and emotion recognition and theory of mind tasks
in our sample were not statistically significant. This could be due to many reasons, the
main one being that our sample once divided into high risk and controls is small and it is
possible that we did not have the power to find significant differences in the at-risk group
(N = 17). Interestingly, Kothari and colleagues (R. Kothari et al., 2015) found that children
at high familial risk for ED performed worse than children of healthy control mothers in
tasks of facial emotion recognition. In this large longitudinal sample children at high familial
risk for ED were more likely to misattribute faces as fearful than children of healthy control
mothers. Another possibility is that differences in the findings could be due to
heterogeneity of the measures used to assess social cognition. While this study used a
validated online version of Reading the mind in the Eyes and facial emotional recognition
tasks, a limitation was the lack of control in the way children completed the task (as this
could be done without the supervision of a researcher). Therefore, the results might not
be an adequate representation of their social cognition abilities. Theory of mind and
emotion recognition both require involvement of different areas and connections, therefore
looking at the connectivity and alterations between the amygdala and other areas involved
in social cognition processing might further explain differences in this group. It is possible
that correlations lie within a specific amygdala-cortical connectivity, which will be explored
in the next chapter. Of course, we cannot disregard the possibility that there is no
relationship between measures of social cognition and alterations in the amygdala and
that differences in amygdala volume in this group are unrelated to social cognition
difficulties and more related to underlying trait anxiety.

215
Main regression analyses showed significantly increased volume in the right caudate, an
area that has been investigated in relation to reward sensitivity. The caudate and the
putamen together comprise the striatum, two areas which form the main input nuclei to the
basal ganglia, receiving axons from nearly every area in the cortex. The caudate and the
putamen are then reciprocally interconnected with the substantia nigra, the main output
area for the basal ganglia. This cortico-striatal loop has been widely studied (Alexander,
DeLong, & Strick, 1986). These relationships show that the putamen plays a critical role
within the so called ‘motor circuit’ whilst the caudate forms part of the oculomotor,
dorsolateral and ventral/orbital circuits which is of importance in goal-directed behaviour
and is sensitive to reward and punishment. The ventral striatum (which also incorporates
the nucleus accumbens) has been proposed as integral for coding the pleasure of a reward
and its motivational salience (K. C. Berridge & Robinson, 1998). It has been suggested
that eating disorders are associated with alterations in cortico-striatal circuits given the role
these circuits play in reward-guided learning, decision-making, affect regulation and
reappraisal. Findings from this chapter have shown alterations in striatal areas, which
could suggest alterations in cortico-striatal circuits including the OFC. The OFC occupies
the entire ventral surface of the frontal lobes and plays a role in many of the complex
functions that are central in cognition, such as processing of reward expectation and value
as well as controlling aspects of behaviour (such as how much we eat and food avoidance
(Plassmann, O'Doherty, & Rangel, 2010; Rolls, Rolls, Rowe, & Sweeney, 1981)). The OFC
has been suggested to play a role in many psychiatric disorders (Drevets, 2007; Melloni
et al., 2012; Shott et al., 2015) including ED (J. Cha et al., 2016a; Schafer et al., 2010).
Findings from supplementary region of interest (ROI) analyses showed a significant
difference between children at high and low risk in the right medial OFC and left lateral
OFC. Surface area data was obtained from the automatic surface parcellation in Fresurfer
using the Desikan-Killiany atlas (Desikan et al., 2006). Larger OFC has been suggested
by Frank et al (G. K. Frank, 2016) in his bio-psycho-social model of risk as a possible risk
marker for ED and could play a role in reward and compulsive behaviours, both of which
have been suggested as possible endophenotypes for ED. Interestingly, results from
surface area analyses showed that the differences were in the medial OFC, which has
been previously found to be altered in both adults and adolescents with ED (G. K. Frank,
M. E. Shott, J. O. Hagman, & V. A. Mittal, 2013; G. K. Frank, M. E. Shott, J. O. Hagman,
& T. T. Yang, 2013).
216
Alterations in the cortical-striatal system connecting the caudate and prefrontal cortex
have also been found in other disorders such as OCD and been proposed to underlie
compulsive behaviours. OCD is characterised by obsessions (recurrent intrusive thoughts)
and compulsions (repetitive actions or mental acts) aimed at reducing the anxiety created
by the obsessions. It has been suggested that some characteristics may be shared with
other psychiatric disorders, and specifically the overlap between OCD and AN has been
widely studied. It has been suggested that some of the stereotyped and often ritualistic
behaviours seen in AN have the same neurobiology as those in OCD (J. Steinglass &
Walsh, 2006). In fact, comorbidity between AN and OCD is often found (Halmi et al., 1991)
and it has been found that the presence of obsessive-compulsive symptoms is a risk factor
for developing AN (Anderluh et al., 2009). A study by Godier and Park (Godier & Park,
2014) suggested the compulsive nature of weight loss behaviour which are central in AN,
as a transdiagnostic concept. Models of neurocircuitry involved in compulsive behaviour
suggest involvement of a cortico-striatal circuit, with the caudate (striatal component)
suggested to be responsible for the compulsive behaviour (while the OFC – prefrontal
component is supposed to inhibit behaviour). Several studies have found alterations in the
caudate in OCD, although there are some conflicting results (Radua & Mataix-Cols, 2009;
Rotge et al., 2009). The caudate has also been associated with cognitive processes that
are altered in OCD patients (Britton JC, Rauch SL, Rosso IM, Killgore WD, Price LM,
Ragan J et al (2010) Cognitive inflexibility and frontal-cortical activation in pediatric
obsessive–compulsive disorder. J Am Acad Child Adolesc Psychiatry 49(9):944–953) as
well as in AN. While to our knowledge, there are no studies investigating children at risk
for OCD, recently, a study by Dong et al. (Dong et al., 2019) suggested impairment in the
cortico-striatal learning system as a biomarker for OCD after alterations in both patients
and their unaffected first-degree relatives. It is therefore possible, that alterations in the
caudate and the OFC could underlie difficulties in cognitive inflexibility and leading to
compulsive behaviour that could be considered a potential endophenotype in AN.
Sensitivity to reward has been hypothesised as a risk and/or maintenance factor in ED. In
AN, the persistence of dieting to the point of starvation has led to the proposal that dieting
is rewarding for these patients (Charlotte Keating, 2010; C. Keating, Tilbrook, Rossell,
Enticott, & Fitzgerald, 2012; Zink & Weinberger, 2010). In these hypotheses, restriction of
calories may become rewarding due to several factors, including an initial social
reinforcement due to weight loss, development of a sense of achievement or possibly as
an alleviation of negative effect. In BN, it has been hypothesised that food becomes more
rewarding than in healthy controls and drives the need to eat even when not hungry. A
217
meta-analysis in 2010 concluded that patients with ED had higher sensitivity for
punishment compared to controls, while those with bingeing type disorders (BED, BN and
AN-B/P) were more sensitive to reward and those with restricting type disorders (AN-R)
were less sensitive to reward (A. Harrison, O'Brien, et al., 2010). This meta-analysis
included studies using behavioural measures of reward and highlighted the heterogeneity
of measures used as well as the need for more studies using similar measures. More
recent findings have shown higher sensitivity to reward across all ED subtypes (rather than
differentiating between restrictive and binge/purge phenotypes) (Glashouwer et al., 2014;
Jappe et al., 2011). A more recent meta-analysis focused on neuropsychological
measures on reward-related decisions found that “altered general reward-related decision
making” is altered across all eating disorders (in adults) (Wu et al., 2016). Interestingly, in
our study we found results in line with newer findings, of higher sensitivity to reward in
children at risk as shown by higher scores in BAS drive when compared to children of HC
mothers. Interestingly we also found an association between BAS Drive and putamen
volume.
Imaging studies have also investigated reward sensitivity and its neural correlates in
patients with ED. In AN, studies have demonstrated functional and structural abnormalities
in areas of the brain known to be involved in reward processing (W. H. Kaye, Fudge, &
Paulus, 2009), including the ventral striatum. Most functional MRI research has focused
on reward to food cues (by delivering visual or actual food stimuli) although other studies
have also studied monetary reward. Both types of paradigms have generally found
alterations in reward processing across all ED subtypes (Guido KW Frank, 2013). These
findings further point to altered reward processing as a potential biomarker in ED, with
women recovered from AN and BN also showing altered response in reward tasks
(Wagner et al., 2010; Wagner et al., 2007). Findings also correspond to the hypothesis
that altered eating is a consequence of dysregulated reward, and/or awareness of
homeostatic needs, which could also be related to the executive ability to inhibit some
motivational drives (Walter H Kaye et al., 2013).
Interim conclusion
In summary, findings from this study show alterations in a more ventral (limbic) neurocircuit
that includes the amygdala, hippocampus, and caudate which are associated with
identification of the importance of emotional stimuli and generation of affective response

218
to these (M. L. Phillips, Drevets, Rauch, & Lane, 2003a, 2003b), as well as playing a role
in reward processes (Walter H Kaye et al., 2013) and behaviour regulation.
219
Chapter 9. Microstructural and connectivity differences in
children at familial high-risk for ED: whole brain WM
differences and amygdala connectivity findings from BREDS
9.1. Introduction
Given our lack of understanding of the pathophysiology of ED, gaining a better
understanding of the underlying neurobiology will be key in aiding more effective
treatments. As seen in Chapters 2, 6 and 8, research has been conducted to further
develop our understanding of brain differences in ED. Although this has focused mostly
on patients with active illness (with the large majority of studies conducted in patients with
AN), more recently studies have also included recovered patients in order to help elucidate
what could be ‘trait’ vs. ‘state’ of each disorder. Specific alterations in both GM and WM
structure and volume have been identified although findings are inconsistent (Seitz,
Buhren, Von Polier, et al., 2014; Seitz et al., 2016; Titova et al., 2013; F Van den Eynde
et al., 2012). Similarly, findings for white matter integrity and connectivity are not
conclusive (Barona et al., 2019; S. Gaudio, Carducci, Piervincenzi, Olivo, & Schioth, 2019;
Martin Monzon et al., 2016). This can be due to a number of reasons, including the
heterogeneity of ED presentations, not only in their different types (AN, BN, BED as well
as subtypes) but also due to the permanent effect that malnutrition and altered eating
behaviours may have in neurocognitive and neural markers.
Given the complexity of ED it is expected that alterations will not only appear at the
structural level but that connectivity between brain areas might also be affected.
Understanding neural computations that underlie cognitive abilities in humans requires a
framework that studies neural events in the context of overall brain connectivity. Diffusion
tractography studies aim to identify anatomical connections in the brain ("Diffusion
tractography," ; Jones et al., 2013). This method shows how strongly anatomical areas
connect by measuring diffusion in WM tracts expressed by streamlines as an indicator of
fiber count (Jones et al., 2013). These connections show the pathways of information
transfer between remote brain regions and are therefore of great importance to our
understanding of brain structural organisation and tractography is a non-invasive and in-
vivo method for identifying and measuring these pathways. Multimodal neuroimaging
analyses (DWI data in combination with data from segmentation of grey matter tissue
220
(derived from T1-weighted images)) allow for the quantification of WM pathways
connecting grey matter ROI’s (Hagmann et al., 2008). Therefore, the structural brain
connectome (an individualized whole-brain map of WM connectivity) (Hagmann et al.,
2008) can be obtained by looking at the DWI connectivity between all possible
combinations of grey matter ROI’s. The use of DWI provides us with the ability to identify
altered tracts and their integrity, which will in turn help interpret the alterations
underpinning the illness. As described in chapter 6 (meta-analysis of WM differences in
AN), little research has been conducted studying WM microstructural differences in ED.
Following up from findings in Chapter 8 of increased gray matter in the amygdala in girls
at high-risk compared to girls of healthy control mothers, we wanted to further explore
connectivity from this region. The amygdala plays a central role in anxiety which has been
found to pre-date ED (Schaumberg et al., 2019) and may play a role in an increase in
vulnerability to the disorder. Amygdala functions are served through several connections
with cortical and subcortical areas including sensory and perceptual association cortices,
limbic-paralimbic affective systems, fronto-parietal network and medio prefrontal network
(Dolan & Vuilleumier, 2003; J. E. LeDoux, 2000; O'Doherty et al., 2004; Pessoa & Adolphs,
2010). The amygdala can be divided into distinctive areas based on its connectivity with
each area playing a distinctive role and therefore investigations of these connectivity
patterns can help elucidate altered circuits that have the potential to be considered for
aetiological models of the disorder.
As established earlier, the current study aims to be exploratory in nature and therefore the
main aim was to conduct whole brain WM voxel-based analysis in children at high-risk for
ED compared to those at low risk. Since previous chapters have resulted in findings that
can lead to hypotheses of altered connectivity we wanted to explore this using a Region
Of Interest (ROI) approach. Given results of altered GM in the amygdala this study aims
to explore connectivity from the amygdala to five cortical areas (frontal, parietal, temporal,
occipital and insula)(the insula was included given its hypothesised role in ED).
9.2. Methods
9.2.1. Participants
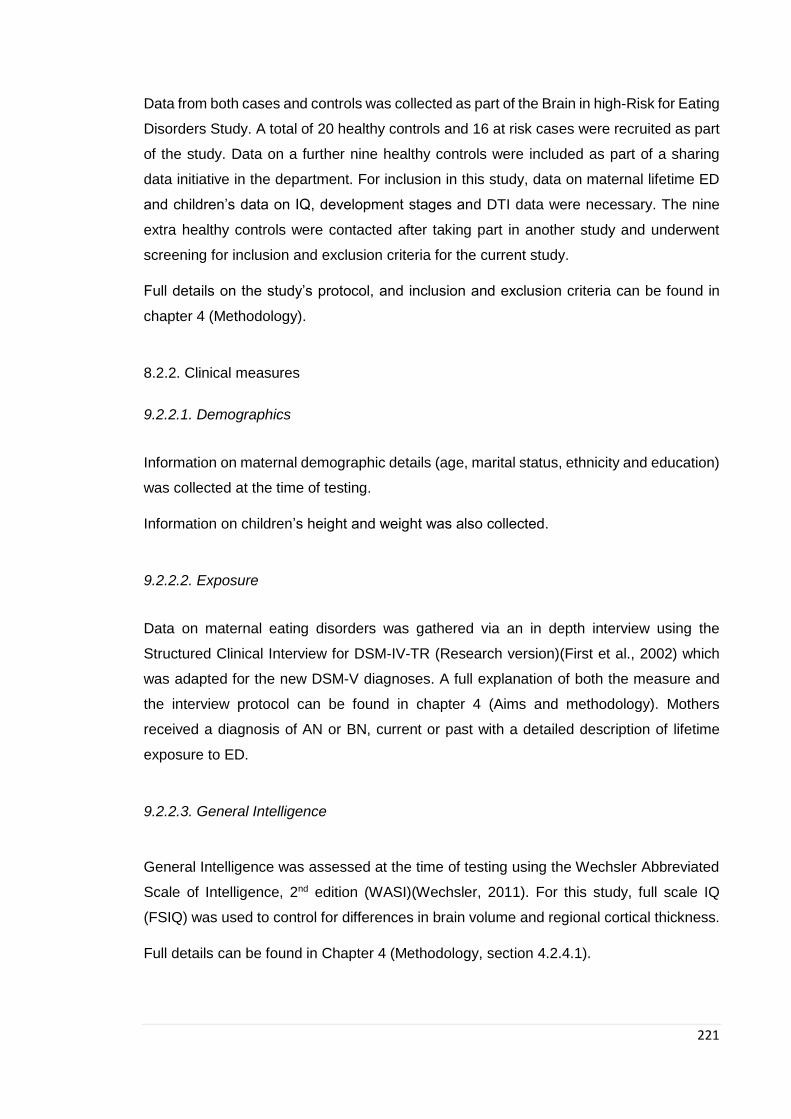
221
Data from both cases and controls was collected as part of the Brain in high-Risk for Eating
Disorders Study. A total of 20 healthy controls and 16 at risk cases were recruited as part
of the study. Data on a further nine healthy controls were included as part of a sharing
data initiative in the department. For inclusion in this study, data on maternal lifetime ED
and children’s data on IQ, development stages and DTI data were necessary. The nine
extra healthy controls were contacted after taking part in another study and underwent
screening for inclusion and exclusion criteria for the current study.
Full details on the study’s protocol, and inclusion and exclusion criteria can be found in
chapter 4 (Methodology).
8.2.2. Clinical measures
9.2.2.1. Demographics
Information on maternal demographic details (age, marital status, ethnicity and education)
was collected at the time of testing.
Information on children’s height and weight was also collected.
9.2.2.2. Exposure
Data on maternal eating disorders was gathered via an in depth interview using the
Structured Clinical Interview for DSM-IV-TR (Research version)(First et al., 2002) which
was adapted for the new DSM-V diagnoses. A full explanation of both the measure and
the interview protocol can be found in chapter 4 (Aims and methodology). Mothers
received a diagnosis of AN or BN, current or past with a detailed description of lifetime
exposure to ED.
9.2.2.3. General Intelligence
General Intelligence was assessed at the time of testing using the Wechsler Abbreviated
Scale of Intelligence, 2nd edition (WASI)(Wechsler, 2011). For this study, full scale IQ
(FSIQ) was used to control for differences in brain volume and regional cortical thickness.
Full details can be found in Chapter 4 (Methodology, section 4.2.4.1).
222
9.2.2.4. Neurocognitive measures
Explanation on neurocognitive measures used in this study can be found in Chapter 4
(section 4.2.4.) with explorations of differences between groups in Chapter 7.
As a summary, this study explored measures of general intelligence (WASI), social
cognition (Reading the Mind in the Eyes and Morphed Emotion Recognition) (Baron-
Cohen et al., 2001), CANTAB neurocognitive measures: motor screening, inhibitory
control, set-shifting of cognitive flexibility, risk-taking behaviour, sustained attention and
visual working memory (J. Fray et al., 1996) and reward measures (BIS/BAS) (A. Cooper
et al., 2007). Significant differences between groups were found in set-shifting (girls at risk
took a significantly longer time to switch when compared to controls) and BAS drive (girls
at risk had higher drive towards pursuing goals when compared to controls) (see Chapter
7 for detailed information).
9.2.3. MRI Data Acquisition and preprocessing
Whole-brain MRI was carried out on a 3T Siemens Prisma at Great Ormond Street
Hospital (GOSH) using a 64-channel head coil by experienced research radiographers.
For inclusion in this chapter, T1 – weighted and diffusion weighted scans were used. More
details on acquisition parameters and pre-processing are described in Chapter 4.
All scans were visually inspected for abnormalities, motion and other artefacts. One scan
was discarded due to image artefacts. T1 – weighted images were processed as per
Chapter 4. The DTI data was preprocessed using TractoR (Tractography with R) (Clayden
et al., 2011), a project which includes R packages for reading, writing and visualising MRI
data in DICOM format (as well as others). Further details on procedures were described
previously in Chapter 4.
9.2.4. Tract Based Spatial Statistics (TBSS) Whole-Brain Analysis
TBSS was carried out using FSL version 5.0. The software has a comprehensive manual,
which was used to follow the required steps to carry out TBSS analyses.

223
1. Participants’ FA images are first slightly eroded and the end slices are zeroed (to
remove outliers). An overview containing a static view of each inputted image is
created so that they can be visually inspected for errors.
Figure 9.1. Example of static view of participant’s images (Patient B46)
2. All FA images are aligned to a 1x1x1mm standard space using nonlinear
registration. The target image used was the recommended FMRIB58_FA
standard-space image. This step involves carrying out just one registration per
subject and generally gives good alignment results.
3. The nonlinear transform found in the previous stage is applied to all subjects to
bring them into standard space. All images are then merged into a single 4D image.
The mean of all FA images is created, which is then used to derive the FA skeleton
(figure 8.2). Finally, the FA data for each individual scan is projected onto the
skeleton to ensure that only the centre of the white-matter tracts are included in
the analysis (the maximal FA orthogonal to the skeleton is projected onto the
skeleton. This is done for every voxel on the skeleton and for every subject).
Figure 9.2. Mean FA Skeleton
4. In the last step, the mean FA skeleton image is thresholded at a specified value
(recommended is 0.2) in order to remove any voxels that have a low FA and are
therefore unlikely to represent white matter or be highly variable between subjects.
MD was also projected onto the skeleton using the transforms calculated for the FA
224
maps, and these data were used for voxel-wise permutation-based analysis.
Each participant’s aligned FA and MD data were projected onto the skeleton and voxel-
wise cross-participant statistics were applied. Age and whole brain volume were entered
as covariates in the TBSS analyses. Results were corrected for multiple comparisons
using family wise error (FWE) correction, in which each p-value is adjusted in light of the
number of statistical tests performed, thus reducing the likelihood of false positives.
Threshold-free cluster enhancement (TFCE) was applied, as per the TBSS protocol. TFCE
compares neighbouring voxels in order to identify clusters of similar voxels; this increases
confidence that each voxel’s results are genuine and not an isolated chance occurrence.
Only clusters surviving FWE p<0.05 are reported.
9.2.5. Region of interest volume estimation and parcellation
Whole brain volume was calculated as described in the previous chapter from the T1 –
weighted images using Freesurfer (version 6.0. for Linux, documented at the website:
https://surfer.nmr.mgh.harvard.edu/) (Fischl, Sereno, Tootell, & Dale, 1999). Motion
correction was carried out prior to removal of non-brain tissue and transformation to
Talairach space. Intensity normalization was then applied prior to estimation of great
matter/WM and grey matter/cerebrospinal fluid boundaries. Finally, cortical and subcortical
regions of interest were generated by segmenting the T1-weighted image using Freesurfer
(Desikan et al., 2006) . Cortical grey matter regions of interest were grouped into frontal,
parietal, occipital, temporal and insula lobes. All registrations and segmentations were
visually inspected for accuracy. Subcortical segmentations had been previously calculated
using Freesurfer, and amygdala volume had been found to be significantly increased in
children at-risk (both left and right side) (Chapter 8).
Regions of interest were registered from T1 space into diffusion space using a combination
of NiftyReg (http://cmictig.cs.ucl.ac.uk/wiki/index.php/NiftyReg). Specifically, the T1W
image was aligned to an unweighted b0 image using a rigid transform. The same transform
was then applied to each of the segmentations, using nearest-neighbour interpolation, to
transfer them to diffusion space. All registrations were visually inspected.
TractoR was used to seed probabilistic tractography from each amygdala voxel using the
five ipsilateral cortical regions of interest as targets. A hemisphere mask was used in order
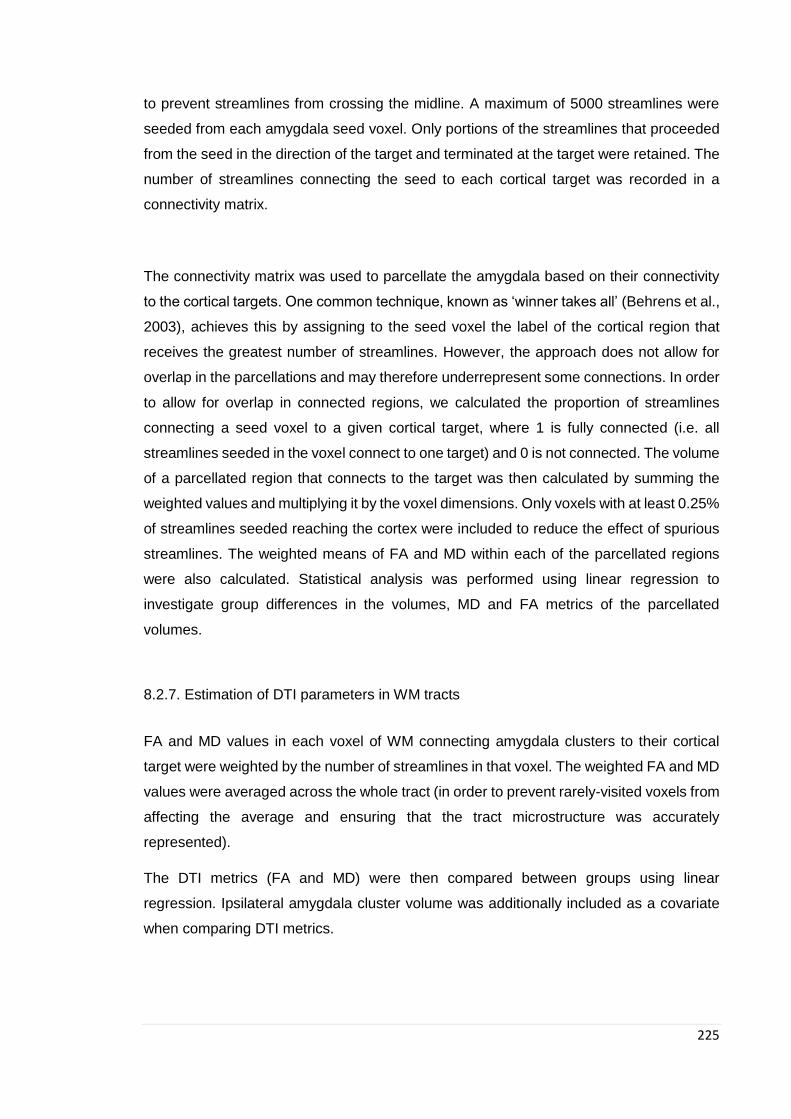
225
to prevent streamlines from crossing the midline. A maximum of 5000 streamlines were
seeded from each amygdala seed voxel. Only portions of the streamlines that proceeded
from the seed in the direction of the target and terminated at the target were retained. The
number of streamlines connecting the seed to each cortical target was recorded in a
connectivity matrix.
The connectivity matrix was used to parcellate the amygdala based on their connectivity
to the cortical targets. One common technique, known as ‘winner takes all’ (Behrens et al.,
2003), achieves this by assigning to the seed voxel the label of the cortical region that
receives the greatest number of streamlines. However, the approach does not allow for
overlap in the parcellations and may therefore underrepresent some connections. In order
to allow for overlap in connected regions, we calculated the proportion of streamlines
connecting a seed voxel to a given cortical target, where 1 is fully connected (i.e. all
streamlines seeded in the voxel connect to one target) and 0 is not connected. The volume
of a parcellated region that connects to the target was then calculated by summing the
weighted values and multiplying it by the voxel dimensions. Only voxels with at least 0.25%
of streamlines seeded reaching the cortex were included to reduce the effect of spurious
streamlines. The weighted means of FA and MD within each of the parcellated regions
were also calculated. Statistical analysis was performed using linear regression to
investigate group differences in the volumes, MD and FA metrics of the parcellated
volumes.
8.2.7. Estimation of DTI parameters in WM tracts
FA and MD values in each voxel of WM connecting amygdala clusters to their cortical
target were weighted by the number of streamlines in that voxel. The weighted FA and MD
values were averaged across the whole tract (in order to prevent rarely-visited voxels from
affecting the average and ensuring that the tract microstructure was accurately
represented).
The DTI metrics (FA and MD) were then compared between groups using linear
regression. Ipsilateral amygdala cluster volume was additionally included as a covariate
when comparing DTI metrics.
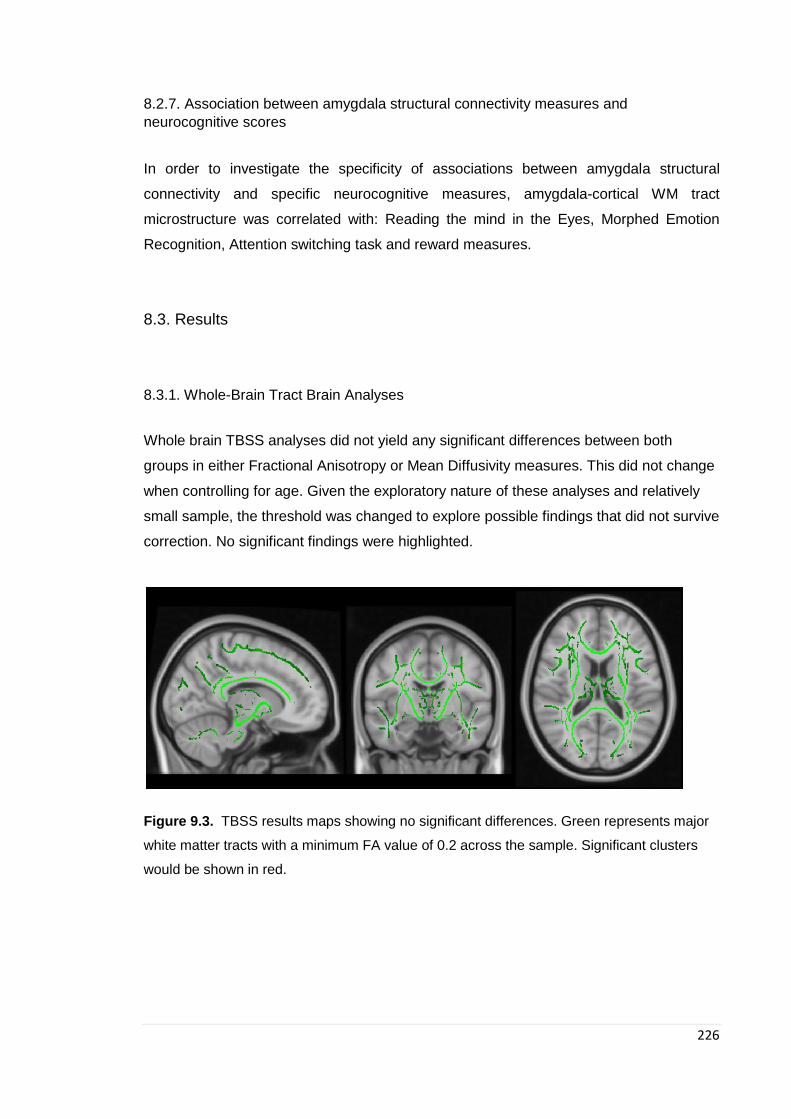
226
8.2.7. Association between amygdala structural connectivity measures and
neurocognitive scores
In order to investigate the specificity of associations between amygdala structural
connectivity and specific neurocognitive measures, amygdala-cortical WM tract
microstructure was correlated with: Reading the mind in the Eyes, Morphed Emotion
Recognition, Attention switching task and reward measures.
8.3. Results
8.3.1. Whole-Brain Tract Brain Analyses
Whole brain TBSS analyses did not yield any significant differences between both
groups in either Fractional Anisotropy or Mean Diffusivity measures. This did not change
when controlling for age. Given the exploratory nature of these analyses and relatively
small sample, the threshold was changed to explore possible findings that did not survive
correction. No significant findings were highlighted.
Figure 9.3. TBSS results maps showing no significant differences. Green represents major
white matter tracts with a minimum FA value of 0.2 across the sample. Significant clusters
would be shown in red.

227
9.3.2. Amygdala parcellation results
Amygdala parcellation identified clusters of voxels demonstrating maximal structural connectivity to the same cortical target, thus segmenting
the amygdala in vivo based on its structural connectivity (see figure 9.4). Bilaterally this resulted in five possible clusters connecting to the
frontal lobe, parietal lobe, temporal lobe, occipital lobe and insular cortices. Linear regression analyses showed significantly larger volume in
right amygdala temporal cluster in girls at high-risk compared to controls (β = 0.312 95% CI (9.158, 277.143), p = 0.037). Results became a
trend towards significance in analyses adjusted for amygdala volume for the right side (β = 0.282 95% CI (-13.864, 272.060), p = 0.076). No
other significant findings were found in other amygdala clusters.
Figure 9.4. A representative subject showing the results of VCP ‘winner takes all’ parcellation of the amygdala in vivo overlaid on the participants’ T1-
weighted scan. Parcellation was based on the amygdala’s structural connectivity profile: probabilistic tractography was seeded from each amygdala
voxel to ipsilateral frontal, parietal, temporal, occipital and insula (as per colours above) cortices. Each voxel was assigned a target representing its
maximum connectivity.
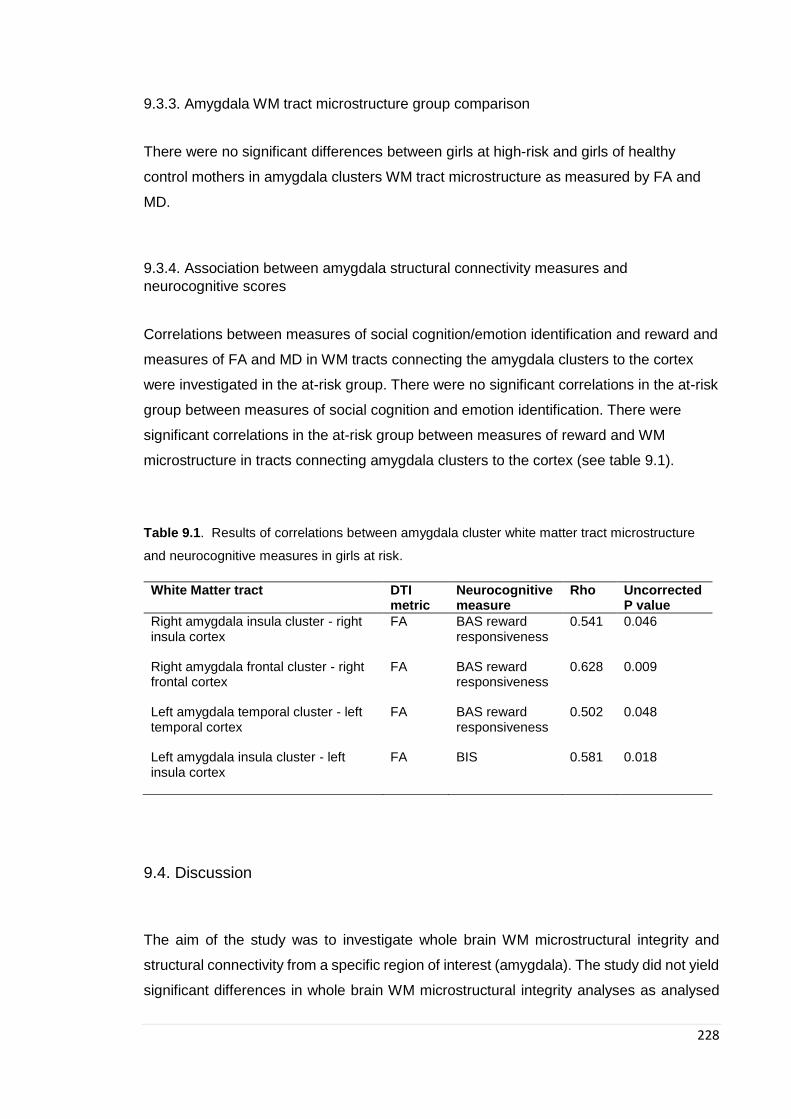
228
9.3.3. Amygdala WM tract microstructure group comparison
There were no significant differences between girls at high-risk and girls of healthy
control mothers in amygdala clusters WM tract microstructure as measured by FA and
MD.
9.3.4. Association between amygdala structural connectivity measures and
neurocognitive scores
Correlations between measures of social cognition/emotion identification and reward and
measures of FA and MD in WM tracts connecting the amygdala clusters to the cortex
were investigated in the at-risk group. There were no significant correlations in the at-risk
group between measures of social cognition and emotion identification. There were
significant correlations in the at-risk group between measures of reward and WM
microstructure in tracts connecting amygdala clusters to the cortex (see table 9.1).
Table 9.1. Results of correlations between amygdala cluster white matter tract microstructure
and neurocognitive measures in girls at risk.
White Matter tract DTI metric
Neurocognitive measure
Rho Uncorrected P value
Right amygdala insula cluster - right insula cortex
FA BAS reward responsiveness
0.541 0.046
Right amygdala frontal cluster - right frontal cortex
FA BAS reward responsiveness
0.628 0.009
Left amygdala temporal cluster - left temporal cortex
FA BAS reward responsiveness
0.502 0.048
Left amygdala insula cluster - left insula cortex
FA BIS 0.581 0.018
9.4. Discussion
The aim of the study was to investigate whole brain WM microstructural integrity and
structural connectivity from a specific region of interest (amygdala). The study did not yield
significant differences in whole brain WM microstructural integrity analyses as analysed

229
using Tract-Based Spatial Statistic (TBSS) analyses. TBSS uses a non-linear image
transformation that carries out localised statistical testing of FA and MD data (aimed to
alleviate alignment problems), and aims to combine the strength of voxelwise and
tractography based analyses (S. M. Smith et al., 2006). The targeted hypothesis driven
analyses of the structural connectivity of the amygdala yielded no differences between
groups in white matter integrity in tracts studied. There was a significant difference in
volume in one of the amygdala parcellations (cluster connecting to temporal cortex),
although it became a trend towards significance after adjusting for total amygdala volume.
As discussed in Chapter 6, research investigating WM microstructure in ED lags behind
that of other psychiatric disorders, and to date, less than 20 studies have been published
and overall, only few studies have compiled samples of more than 20 participants. Given
the variability in the methodology and samples studied it is not surprising the results are
mixed: with different sample sizes (few studies had more than 20 participants in their case
group), scanner type, software used for analysis as well as the differences in the group of
patients: mostly AN (only two BN studies have been published to date (G. K. Frank,
Mettler, Shott, & Yang, 2013; He et al., 2016; Mettler, Shott, Rollin, & Frank, 2012)),
combined binge/purge and restrictive, recovered and acute, long and short term
recovered. However, it is important to note that most studies have shown widespread
alterations in projection, association and commissural WM fibres during the acute stage in
adults with AN (Frieling et al., 2012b; Hayes et al., 2015; Kazlouski et al., 2011b; Nagahara
et al., 2014). Results for adolescents have been less consistent with findings of both
increased (Travis et al., 2015; Vogel et al., 2016) and reduced FA (G. K. W. Frank, M. E.
Shott, J. O. Hagman, & T. T. Yang, 2013; Travis et al., 2015). On the other hand, some
studies have not found any differences between patients and healthy controls (Olivo et al.,
2019; Pfuhl et al., 2016), although most have been those studying recovered patients
(Frieling et al., 2012b; Olivo et al., 2017; Pfuhl et al., 2016; von Schwanenflug et al., 2018).
It has therefore been hypothesised that alterations in WM microstructure in patients with
acute illness could be due to a reduction of myelin content secondary to malnutrition.
Myelin is composed of various types of lipids and may therefore be particularly vulnerable
to injury from malnutrition during adolescence (Giedd, 2008). To help elucidate differences
between ‘state’ (secondary to undernutrition) and ‘trait’, three studies have longitudinally
investigated WM microstructure alterations in AN (J. Cha et al., 2016b; Vogel et al., 2016;
von Schwanenflug et al., 2019). Vogel and colleagues found that differences in bilateral
frontal, parietal and temporal areas in acute adolescent AN patients were partially
normalized after nutritional treatment, however, this study only had a small sample of 9
230
patients. Cha and colleagues (J. Cha et al., 2016b) did not find any differences after short-
term weight restoration (although they did find increased WM FA in the fronto-accumbal
pathway in a hypothesis driven ROI analysis). Lastly, von Schwanenflug and colleagues
(von Schwanenflug et al., 2019) also found normalizing of alterations in FA after weight-
gain. Findings from this study could therefore be pointing to alterations in WM
microstructure in patients with ED being secondary to malnutrition rather than being a risk
factor for its development. It is of course important to consider the methodology and
sample size of this study as further research with larger samples and targeted hypothesis
are needed to help elucidate these findings.
Overall findings in patients after weight restoration and in recovered patients point to
alterations in WM microstructure being highly dynamic and critically dependent on weight
status, however, as discussed, most studies have small sample sizes and have used
exploratory methodological approaches (mostly whole brain comparison analyses). Whole
brain analyses allow the investigation of differences without a priori hypotheses regarding
possible specific alterations, mainly based on a good understanding of the
pathophysiology of the disorder and provide better comparability across studies. From a
methodological perspective, most studies undergo whole brain comparisons which are
exploratory in nature, this however means that generally they do not have the statistical
power to find significant differences in small brain regions. This was recently highlighted
by Phillipou and colleagues (Phillipou, Castle, Abel, Gurvich, & Rossell, 2018; Phillipou et
al., 2014) who after adopting a behaviourally driven ROI approach identified structural and
functional dysfunction in a hypothesised area (superior colliculus) that had not yielded
significant findings in their initial whole-brain analysis. Given the small sample size of most
studies to date, it is possible that a lack of power is responsible for non-significant findings.
However, in order to be able to conduct more hypothesis-driven studies, specific
hypotheses with regards to ‘state’ vs ‘trait’ WM microstructural differences need to be
developed.
Given some of the above limitations to whole brain analyses, targeted, hypothesis-driven
analyses were used to investigate structural connectivity of the amygdala after findings of
increased GM in the amygdala in girls at-risk compared to girls of healthy control mothers
in the previous chapter. Volume differences of the amygdala based on its structural
connectivity yielded a trend towards significance in the right amygdala temporal cluster
(cluster based on the connectivity from the right amygdala to the right temporal cortex).
231
While these results are only showing a trend towards significance, it is possible that this is
due to our sample size and a larger study may be able to confirm this finding. If so, this
suggests that heterogeneous abnormalities in specific amygdala subdivisions may
underlie the development of vulnerability to eating disorders.
A larger volume of the amygdala cluster with winning connections to the temporal cortex
may indicate altered structural connectivity in that region. It is therefore reasonable to
hypothesise that alterations in the subdivision of amygdala with main connectivity to a
cortical area may underlie alterations in this cortical area as well. The temporal cortex
automated parcellation in Freesurfer includes regions that lie within the temporal cortex as
well as the fusiform gyrus, which extends to the occipital lobe as well. This is of importance
given the functions of this region. The extrastriate body area (EBA) (Downing, Jiang,
Shuman, & Kanwisher, 2001) is located in the lateral occipito-temporal cortex and
responds to visual images of human bodies and body parts. This region has been of
interest in the study of ED given its role in body perception and the significance for the ED
behavioural phenotype. Concerns about weight and shape are central to ED and related
to these, “a disturbance in the way in which one’s body weight or shape is experienced”
(APA, 2013) is central for the development of the disorder. This is manifested by an
overestimation of one’s own body size, with the bias being much stronger in patients with
AN than in BN (T. F. Cash & Deagle, 1997). It has been suggested that this disturbance
is likely to involve both perceptual and affective components and therefore engage a
neural network of different regions involved in these processes (Thompson, Heinberg,
Altabe, & Tantleff-Dunn, 1999). Functional MRI studies in patients with ED have previously
supported the concept of dysfunction in areas of the brain (such as occipital-temporal) that
are of importance for analysing perceptual aspects of body image. In a study by Uher and
colleagues (Uher et al., 2005), patients with ED had lower activation in these regions when
presented with drawings of body images. The authors suggested that low functionality in
this ‘body perception’ network might facilitate the development of body image disturbance
in ED. Selective display of images of bodies that express emotions (anger, disgust,
happiness, fear) have also been shown to activate the EBA, and this activation seems to
be supported by a close correlation with the amygdala, suggesting a modulation of
emotional information (Myers & Sowden, 2008). Research suggests that increased brain
activity in the amygdala might be involved in fearful emotional processing concerning body
images (Y. Miyake et al., 2010; Pruis, Keel, & Janowsky, 2012). On the other hand a
number of fMRI studies of perception of self-body image and visual self-other body
discrimination in patients with AN have also shown contradictory results with regards to
232
the role of the EBA and therefore further investigation is needed (Esposito et al., 2018).
Whilst further investigation in larger studies is required, considering the evidence, it is
possible to hypothesise and altered structural connectivity between amygdala and
temporal cortex may underlie alterations in self-perception given the role that the EBA
(found partly in the temporal cortex) plays in processing of body images and previous
findings of this region being altered in patients with ED.
Interestingly, there were no differences in diffusion measures in WM tracts connecting the
amygdala to their cortical targets. Therefore, results point to alterations in amygdala
volume but no differences in the microstructure of WM tracts connecting amygdala clusters
to their winning targets. This suggests that while the amygdala may be functioning
differently in children at-risk, the microstructure of its connections to the investigated
cortical targets are intact at this stage. It is interesting that we found a trend towards
significance in amygdala volume cluster based on its winning connectivity as this may
suggest differences in the way the amygdala is structurally connected in girls at-risk but
not in the microstructure of the WM tracts connecting to the target. However, since this
was only a trend it requires further investigation. Given that this study is an exploratory
pilot study, it is important to still consider that findings are due to small sample size and
therefore it is important to investigate this further in a large sample.
It is also possible that non-significant findings are due to methodology used and
connectivity is indeed altered in a more global manner. One possible way of investigating
structural connectivity from the amygdala is based on its anatomical subregions (rather
than based on structural connectivity), which have distinct roles in the modulation of
cognitive and affective functions (Dolan & Vuilleumier, 2003). The basolateral (BLA) and
centromedial amygdala (CMA), are the two most widely characterized subdivisions of the
amygdala and service distinct functions as well as having distinct connectivity profiles to
both cortical and subcortical regions (J. E. LeDoux, 2000). The BLA plays an important
role in perception and regulation of emotionally significant events and does this via
interaction with multiple brain regions (Dolan & Vuilleumier, 2003; J. LeDoux, 2007; J. E.
LeDoux, 2000), while the CMA is essential for controlling the automatic expression of
emotion (such as the fight-flight response) through projections to the brainstem,
cerebellum and sensorimotor system (J. E. LeDoux, 2000; Roy et al., 2009). Enlarged left
BLA has been shown to be present in children with subclinical anxiety as young as 7 years
old (Qin et al., 2014), as well as being a consistent finding in adults with generalised
233
anxiety disorder (Hettema et al., 2012; Schienle, Ebner, & Schafer, 2011). Given the BLA’s
correlation with anxiety and previous findings of premorbid anxiety in patients with ED
(Schaumberg et al., 2019) and the role this may play in ED development, it is possible that
by dividing the amygdala in these regions and studying its connectivity we may be able to
see different results to those found in this study. From previous findings of enlarged
amygdala in the at-risk group, it is possible to hypothesise that increased GM in amygdala
is related to increased/heightened anxiety in our group. This heightened anxiety can lead
to an exacerbation of vulnerability to ED by biasing the reward system towards withdrawal
or avoidance behaviour to alleviate anxious states. It is possible that increased GM in the
amygdala acts as a risk factor which is exacerbated by other biopsychosocial risk factors
as explained by the diathesis-stress model of mental health (Monroe & Simons, 1991).
Findings from this study suggest that a possible diathesis of ED may be alterations in
amygdala structure leading to the emergence of trait-like susceptibility to anxiety. It is
possible that interactions between such diathesis as well as other risk factors can lead to
negative consequences such as ED.
Another possible hypothesis worth exploring is that connectivity from the amygdala to
other subcortical regions is altered as this was not investigated in this study. The amygdala
has connections with the ventral striatum, which is important for reward and therefore may
be of interest as a hypothesis driven analysis. A ventral (limbic) neurocircuit that includes
the amygdala, insula, ventral striatum and ventral regions of the anterior cingulate cortex
(ACC) and the orbitofrontal cortex (OFC) is of importance for identifying stimuli that are
emotionally significant and generating an affective response (M. L. Phillips et al., 2003a,
2003b) and may underlie some of the common behaviours found in both ill an recovered
ED patients such as anxiety and obsessionality. Prior knowledge about WM tract anatomy
and those that have been found to be altered in patients with ED may also be of guidance
in future hypothesis driven analyses. Chapter 6 highlighted the role that the corpus
callosum may play in the neurobiology of ED and a recent systematic review by Gaudio
and colleagues (S. Gaudio et al., 2019) suggested altered thalamo-cortical WM
connections (including corona radiate, thalamic radiations and internal capsule) as well as
occipital-parietal-temporal-frontal WM connections (such as the inferior fronto-occipital
fasciculus, superior longitudinal fasciculus and cingulum).
Lastly, given the stage of development at which this study was performed and the
development of myelination during childhood and adolescence, it is possible to
234
hypothesise that changes in WM connectivity in children at high-risk may happen at
different stages of development. Given our sample size it was not possible to stratify by
age as this made groups too small (with the majority of participants being over the age of
11). As this is a pilot study that will be informing a larger study, it will be important to have
equal numbers of two age groups (8 to 11 and 12 to 15) to help elucidate some of the
differences that may be due to different stages of brain development.
Correlation analyses between specific neurocognitive measure and WM connectivity from
amygdala parcellation yielded significant results for reward measures. Specifically, BAS
reward responsiveness was correlated with FA in WM tracts connecting the right frontal
and insular amygdala and the left temporal amygdala clusters with their corresponding
cortical target. BIS scores were also correlated with FA in WM tracts connecting the left
insular amygdala cluster with its corresponding cortex target. Although we did not find any
differences in diffusion metrics between the groups, it is interesting that we found
correlations with reward measures in the at-risk group which were not present in the low-
risk group. Importantly, these differences are relating to reward mechanisms which have
been widely explored in connection to ED, both behaviourally and in neuroimaging studies
(J. Cha et al., 2016b; McAdams & Smith, 2015; O'Hara, Campbell, & Schmidt, 2015; Olivo
et al., 2017; J. E. Steinglass, Berner, & Attia, 2019; Wu et al., 2016). Due the exploratory
nature of this study, it is worth further exploring the association between reward
responsiveness and amygdala connectivity.
This study did not find any WM microstructure alterations in tracts connecting the
amygdala and insula cortex. Given the proposed role that the insula plays in ED one
hypothesis in this study is that connectivity between amygdala and insula may be altered.
The insular cortex lies deep within the lateral fissure and is located between the anterior
and posterior cerebral hemispheres. Importantly, this cortex contains a complex set of
connections between anterior and posterior structures, left and right hemispheres and
cortical and sub-cortical structures. Among others the insula has been proposed to play a
central role in the regulation of appetite and eating, monitoring of body state, perception
and integration of disgust and taste and integration of thoughts and feelings (Nunn,
Frampton, Gordon, & Lask, 2008). Given the role that the insula plays in these regulatory
processes it is not surprising that a central role of the insula in ED has been proposed.
Nunn et al (Nunn et al., 2008) proposed that individuals at risk for AN have a dysfunctional
neural network converging upon the insular cortex leading to an alteration in the capacity
235
to effectively integrate visual and body perception with emotions and the inhibition of
higher cognitive processes. This study did not find altered connectivity between amygdala
and insula, however this could be due to a lack of power or limitations in the methods used.
Connectivity with insula was based on parcellation of the amygdala based on connectivity
and whole amygdala-insula connectivity was not studied. Equally, only measures of FA
and MD were investigated in this study. Other WM neuroimaging biomarkers axial and
radial diffusivities and fibre count. Axial and radial diffusivities are simply the diffusivity
along the principal axis of diffusion (former) and an average of diffusion along its two minor
axes (later) and have been associated with axonal damage, axonal diameter and fibre
coherence. While fibre count is not strictly a DTI parameter it can also provide information
with regards to tracts connecting ROI (Curran, Emsell, & Leemans, 2016). It is also
possible that the insula and its connectivity to other regions of the brain may be altered,
but not its connectivity with the amygdala.
Limitations
This study has some limitations. Overall while this is only a pilot study aimed at forming
hypotheses to inform a larger study, our sample size was not large enough for the number
of tests carried out. There was no correction for multiple comparisons given the aim of
exploring possible hypotheses, which means that false negatives would be more costly
than false positives. Connection probability decreases with distance; to limit the effects of
this a high number of streamlines were seeded and DTI values were averaged over the
tracts. The low resolution of MRI scans relative to actual white matter tract dimensions
may cause partial volume effects, and the directionality of white matter connections cannot
be determined using tractography; post-mortem or tracer studies would be necessary.
Errors may be introduced during registration and segmentation, although visual inspection
aimed to mitigate this. It is not possible to infer causality using correlation analyses, and
some of these might be driven by outliers.
Interim conclusion
Results from this chapter highlight the need for hypothesis driven brain imaging analyses.
As highlighted by Phillipou and colleagues, ROI driven analyses may result in significant
findings that were not previously highlighted by whole brain analyses. In this study, no
significant findings were found using a whole brain approach while a trend towards
significance was found in ROI analyses based on results from the previous chapter.

236
Further exploration of amygdala connectivity using different methodology is warranted
given previous results of alterations in the amygdala in this at-risk group.

237
Chapter 10 Considerations and limitations, final discussion,
and future work
10.1. Considerations
10.2.1. Recruitment
One main limitation in this study was recruitment which led to delays in the study and a
reduced sample size (compared to initial proposal). Several factors played a role, and
given the exploratory nature of this study it is important to discuss them:
1. Although not only a limitation in this study, given the relative low prevalence of ED,
finding participants with a current ED or a history of one in the community can be
difficult. While a lot of studies in the field will recruit currently ill patients from clinics,
there is a drive to focus more on recovered patients in order to help elucidate
mechanisms involved in the development of the disorder. I believe that the stigma still
associated with the disorder makes it difficult for recovered patients to be found in the
community and for them to want to take part in a research study. While as a society,
over the last decade, we have become more aware and accepting of mental health
and its biological underpinnings, there is a sense that we are not there when it comes
to ED.
2. Specifically, for this study, most of the mothers recruited had a history of an ED, and
surprisingly (or maybe not as much), they felt that this was not something that they
could share with their family and therefore they felt they could not take part in the study.
Although not formal questions within the initial interview, during recruitment calls, it
was common for mothers to say that they did not ‘want their daughters to go through
what they went through’. Of course, this is very understandable, however, there was a
sense that if they told their daughters that they had an ED, this would affect their
daughters. Equally some mothers felt that given their daughters already had increased
risk of having an ED, talking about it would only drive attention to an issue that is better
kept undiscussed and might increase their daughter’s chances of developing the
disorder even further. While this fear might be understandable given the severity of ED

238
and the consequences for the young person, it poses an interesting question about
why is it difficult for parents to discuss EDs? A similar situation was also present in
recruitment of healthy control mothers. It is important to note, that in general, healthy
controls were recruited mostly at the university (UCL) and attached hospital (Great
Ormond Street) with a couple of schools and community and therefore this might not
apply to the whole of the community. Healthy control mothers who initially showed an
interest in the study felt that they might find it difficult to explain to their daughters what
the study was about as they did not feel comfortable (given the girls ages) discussing
eating disorders. This was interesting given that these mothers had never had a
difficulty with ED, but felt that the topic was not one that they would approach with their
children. While we have become more ready to discuss worries and ‘feeling low’ in
schools and at home, worries and thoughts about shape and weight continue to not be
discussed. It is possible, that given that dieting and/or ideas about body shape are very
present in everyday life we feel that this is not something we can influence change in.
Furthermore, there may be a perception that ED are caused only by pressure to have
a specific body shape and therefore there may not be such a drive to discuss them.
While recruiting for this study it was difficult not to wonder about what people in the
community know and understand about ED; as well as wanting to understand better what
patients who have recovered from an ED feel about causes of ED. Mothers (with a history
of ED) reluctance to speak about ED (even after being recovered for over 20 years in some
cases) with their daughters poses an interesting hypothesis about the way individuals think
about their own ED and the way they approach discussions about weight/shape or even
food with their own children. Could this possibly play a role in their children’s own view of
weight/shape and/or food? We know from phobia studies that even when parents do not
discuss their phobia with their child, driven by a worry that their child will develop the same
phobia, the child might pick up the cues from the parents’ behaviour, which in turn can
influence their views and beliefs about the phobic situation.
Given the stigma associated with ED, do people with a past history of an ED feel judged
when discussing ED? Studies have found negative stereotypes and social rejection of
individuals with eating disorders including attributions to personal responsibility (Puhl &
Suh, 2015). Unlike people with other psychiatric disorders, individual with ED are
frequently regarded as personally responsible for and to blame for their condition.
Furthermore, stigmatization of ED has been found to predict alienation and social
239
withdrawal which in turn predicts symptoms severity (Griffiths, Mitchison, Murray, Mond,
& Bastian, 2018). It has also been shown to be a barrier to seeking help (Ali et al., 2017).
As a result of these problems, some studies have aimed to reduce ED stigma in the
community. One of these techniques (used in general to help people change their
perception of mental health disorders) has been to inform of etiological explanations to the
disorders. While attributing the development of the disorder to biological factors may help
reduce the stigma, it doesn’t solely explain the disorder, and therefore it may cause more
harm. Other strategies have used education about ED and breaking barriers by
encouraging discussions with patients with ED.
In this study, it is clear that there continues to be some stigma related to ED and this can
in turn lead to secrecy and reduced understanding of the disorder. Research aimed at
elucidating biological mechanisms that play a role in the development of the disorder can
not only help our understanding but would also shape our attitudes towards diagnosis and
treatment. This will in turn help reduce the stigma by helping people understand the
complex nature of these disorders.
10.2.2. Controlling for multiple comparisons
When performing a large number of statistical tests, by chance, some of these will have p
values that are less than 0.05 (even if all the null hypotheses are true). Therefore,
controlling for multiple comparisons is a way of reducing false positives. Adjusting for
multiple comparisons has received increased attention given the development in
techniques such as neuroimaging, in which results are estimated from 100,000 or more
three dimensional bits of the brain (voxels).
A classic approach to multiple comparisons is to control for the familywise error rate, by
which, instead of having a critical p of 0.05, we use a lower critical value. The most
common used method has been to use the Bonferroni correction (Simes, 1986). This
correction method uses the number of tests to find the new critical p value (by dividing the
alpha for an individual test between the number of tests). However, this type of correction
comes with its limitations. If you are hoping to find multiple results that might be significant,
the Bonferroni correction can lead to a high rate of false negatives. Another issue to take
into account is deciding what a “family” of statistical tests is. An alternative approach is to
240
control for the false discovery rate (Benjamini & Hochberg, 1995) (proportion of discoveries
that are actually false positives). This approach, allows the researcher to set a false
discovery rate based on what the percentage of acceptable false positives that they might
allow is. As an example, if the cost of additional experiments is low and the cost of false
negatives is high, then a fairly high false discovery rate might be used (Akey).
Overall, the goal of multiple comparisons is to reduce the number of false positives,
however, this may lead to an increase the rate of false negatives (which can be very
costly). Therefore, one could argue that given the exploratory nature of this study, the
costs of false negatives is far too great, as the aim of this study is to help develop new
hypotheses that can lead to later findings in better powered studies. The main aim of the
study was to cast a wide net, which means performing a large number of statistical tests
in a relative small sample size where false negatives would be very costly. Therefore, while
I can’t conclude that the findings of this thesis are not false positives, I can hypothesise
what the findings might mean and how hypotheses can be developed further in future
studies.
10.2. Final discussion
As established in Chapter 1, ED are complex psychiatric disorders that should be
considered within a biopsychosocial model, with risk factors that operate within a
genetic/epigenetic predisposition, a cultural context that idealizes a thin female body, as
well as psychological, neurocognitive and neural endophenotypes or biomarkers. This
PhD has initially focused on gaining an understanding of psychopathological,
neurocognitive, and neural biomarkers in children at high-familial risk for developing an
ED (and who are young enough that they might go on to develop the disorder). In order to
do this, the first chapter explores psychopathology in children at high-familial risk
compared to healthy controls in a large community sample. The next chapter is a meta-
analysis of white matter alterations in patients with AN to help inform hypothesis to be
explored in a larger study in children at high-familial risk for ED. Finally, the last three
chapters show results from a pilot study (BREDS) undertaken during this PhD, aimed at
exploring neurocognitive and neural (volumetric and white matter) alterations in girls at
high- familial risk for developing ED. This section will summarise findings from each result
chapter and propose final conclusions and hypotheses based on results:
241
Chapter 5 demonstrates in a large community sample that children at high-risk of ED have
higher odds of having emotional difficulties (internalising difficulties such as anxiety) whilst
boys showed higher odds of having hyperactivity and social communication difficulties.
The first results related to increased odds of internalising difficulties confirm previous
studies, that have found heightened anxiety as a risk factor for the development of an ED.
Whilst results relating to boys may be shedding some light into shared vulnerabilities
between psychiatric disorders (ADHD and ASD and ED) as well as gender-specific
vulnerabilities. While it has been suggested that girls with AN may have increased levels
of ASD traits (Zhou et al., 2018) it is also true that individuals with ASD (the majority of
which are boys) have increased difficulties with eating compared to healthy controls. It is
of course important to consider the shared diathesis of psychiatric disorders and therefore
results shown could simply show the direct link between psychiatric disorders at a genetic
level. While this finding may not be specific to ED, it is important to consider when working
on early interventions that will help encourage better mental health in young people and
may therefore reduce the risk of developing any disorder.
Chapter 6 highlights how research into WM microstructure in ED lags behind other
psychiatric disorders (Barona et al., 2019; S. Gaudio et al., 2019), with less than 20 studies
published, and only three focused on patients with BN. It is also important to note that a
large number of studies had relatively small samples (with some studies published with
samples under 10). Furthermore, within such a small sample of studies, many different
methodologies for analysing data were used. Given all these factors, it is not surprising
that results are mixed. One of the main findings in the meta-analysis in Chapter 6 is of
alterations of WM microstructure (as measured by reduced Fractional Anisotropy) in the
corpus callosum which has been reported in several studies of patients with AN (J. Cha et
al., 2016a; G. K. W. Frank et al., 2013; Nagahara et al., 2014; Olivo et al., 2019; Travis et
al., 2015; von Schwanenflug et al., 2019). The corpus callosum is the main
interhemispheric commissure involved in multimodal sensory and motoric signal
processing and altered WM microstructure in the peri-splenial region (as highlighted in the
meta-analysis – with involvement form the cuneus and precuneus regions) may contribute
to distorted body perception in AN (Santino Gaudio & Riva, 2013; S. Gaudio et al., 2016).
A second cluster in the corpus callosum extended to anterior thalamic projections. Despite
some discrepancies between directionality of DTI specific measures, several studies have
found altered thalamo-cortical connections in patients with AN (Frieling et al., 2012a; S.
Gaudio et al., 2017; Hayes et al., 2015; Olivo et al., 2017; Vogel et al., 2016), including

242
one study with recovered patients (Shott et al., 2016). It has been proposed that posterior
thalamic-radiations play a role in body-image disturbances in AN as well.
Results from the high-risk for ED study (BREDS)
The remaining three chapters show results from the main study of this PhD: the Brain in
high-Risk for Eating Disorders Study (BREDS) which aims to further our understanding of
neurocognitive and neural differences in children at high-risk for ED compared to those at
low-risk for ED (based on maternal diagnosis of ED – both past and present).
Chapter 7 demonstrates alterations in set-shifting (cognitive flexibility) and reward
processing (measured by BAS drive) in girls at high risk for ED. Difficulties in cognitive
flexibility refer to the ability to transition from thinking in one dimension/concept to another,
and can therefore affect how quickly we are able to adapt to our environment. Alterations
in this process have been found in individuals with different psychiatric disorders, including
ASD and OCD and they have been suggested to underlie AN phenotypic presentation
(rigidity in restricting calories and inability to change behaviour in the presence of extreme
low weight). Findings from this study build upon findings in healthy sisters of patients with
AN (Holliday et al., 2005; Tenconi et al., 2010) which suggest that cognitive inflexibility
may be considered an endophenotype of the disorder and therefore may play a role in its
development.
My study found higher sensitivity to reward in girls at high-risk compared to controls as
reflected by higher scores in the BAS drive sub-scale. Given that the BAS drive subscale
reflects persistence in pursuing goals even in the event of delayed reward or potential for
reward, it is possible to hypothesise that this measure is an index of perfectionistic traits,
know to be maintaining and risk factors for AN (Bardone-Cone et al., 2007). Interestingly,
it can also be argued that drive persistence matches with the phenotypic expressions of
AN (and binge-purge type disorders to some extent), characterised by the pursuit of a goal
such as thinness even in the presence of little reward.

243
Interestingly, in this sample, we did not replicate findings of increased difficulties in
identification of emotions from facial expressions (R. Kothari et al., 2015), however, this
could be due to limitations inherent in the measures used as well as administration
method, and small sample size.
Chapters 8 and 9
Chapters 8 and 9 explore volumetric and white matter alterations in girls at high-risk for
ED compared to controls. The main findings from chapter 8 are of altered GM volume in
subcortical regions: amygdala, hippocampus and caudate. Chapter 9 builds upon findings
from the previous chapter by further exploring connectivity from the amygdala.
Amygdala, hippocampus and caudate nucleus are regions which are known to play a role
in the mediation of processes such as reward, decision making, affect regulation and
interpersonal processes, all of which have been found to be altered in patients with ED.
The caudate and putamen together form the striatum and play an important role in reward
circuitry and together with cortical areas play a crucial role in goal directed behaviour
(which is sensitive to reward). Whilst not in the main analyses, a larger OFC was also
found in this sample, suggesting an alteration in fronto-striatal structures. Alterations in
these regions have been implicated in hypotheses regarding an imbalance between the
influence of the goal directed and the habit system (with the dorsal striatum at its core).
Findings regarding connectivity between amygdala and cortical areas (frontal, parietal,
temporal, occipital and insula), which were based on amygdala parcellation (depending
on best connectivity with each area) did not yield any differences. It is possible that
connectivity from the amygdala to cortical areas is not altered in children at risk, however,
it is also possible that these findings are due to our relative small sample size or the
methodology used. Further exploration of connectivity from the amygdala is warranted.
Final conclusions and theoretical implications
This thesis highlights our lack of understanding of the neurobiological biomarkers or
mechanisms responsible for ED development and/or maintenance; and the importance of
244
developing research methods and hypotheses that can clarify these. Given the complexity
of ED and the effect that undernutrition has on neurocognitive and neural mechanisms,
elucidating what are ‘state’ (due to undernutrition) and what are ‘trait’ mechanisms has
proven complex. To better understand the aetiology of psychiatric illnesses, the Research
Domain Criteria (RDoC), resulting from the National Institute of Mental Health (NIMH) 2008
strategic plan (Cuthbert & Insel, 2013; Thomas R. & Jeffrey A., 2013) encourages a
transdiagnostic approach in the research aimed at advancing our understanding of
psychiatric disorders. Central to this approach is the search for endophenotypes (which
reflects the function of a discrete biological system and is heritable) that can be common
to several disorders. Results from this PhD highlight the role that negative affect, cognitive
flexibility and reward play in the aetiology of ED. These alterations map into negative and
positive valance, as well as cognitive control and social processing systems mapped in
the RDoC cognitive systems (Morris & Cuthbert, 2012). These proposed domains also
identify specific neural correlates that have been shown to be involved in these processes.
The primary neural mechanisms of reward sensitivity involve the ventral striatum and the
orbitofrontal cortex (OFC), and involves other neural regions including the amygdala
(Baxter & Murray, 2002; Zalla et al., 2000), dorsal anterior cingulate cortex (ACC) (Bush
et al., 2002), and the hippocampus (Berns, McClure, Pagnoni, & Montague, 2001). The
negative valence system includes responses to acute threat (fear) and potential harm
(anxiety). Fear conditioning has been most consistently associated with amygdala (R. G.
Phillips & LeDoux, 1992) and insular cortex (Etkin & Wager, 2007), while ventral and dorsal
striatum are associated with anticipation of negative outcome (loss or punishment)
(Delgado, Locke, Stenger, & Fiez, 2003).
From the literature review in this thesis, it is clear that the complex interaction between
psychosocial, neurocognitive, and neural abnormalities in ED have made the study and
development of neurocognitive and neuroscientific treatments more complex than those
in order disorders. In the past decades, research techniques have facilitated better
understanding of the bi-directional ‘vectors of influence’ that link the genes, brain and
social behaviour and it is clear the search for biomarkers in psychiatric disorders is of great
importance and an important path towards better understanding the development of ED.
Biomarkers or endophenotypes are of critical importance for diagnosis as well as
predicting treatment response. Furthermore, the study of biomarkers can help us study
disease mechanisms by detecting pathology early and following its development.
245
One well-known difficulty in ED is the instability of diagnoses (AN, BN and OSFED) (Milos
et al., 2005). Since the introduction of DSM-5, there has been a reduction in number of
OSFED (previously EDNOS) diagnoses, however, instability in cross-over in diagnoses
continues to be problematic. Results from my PhD show how most of the research
available has been conducted with patients with AN, therefore hypotheses with regards to
cognitive and neural biomarkers are mostly based on patients with these ED subtype.
While the aim of the search for endophenotypes is to improve our understanding of the
pathophysiology of ED, the majority of research investigates endophenotypes for DSM or
ICD disorders. However we still do not know if ED diagnoses reflect different
pathophysiological and biological phenotypes. In a recent study by Kothari and colleagues
(R. Kothari et al., 2015), one way of addressing the instability and heterogeneity in ED
diagnosis was to use observable phenotypic features of ED (i.e. ED behaviours), which
may be more directly associated with differences in cognitive functioning than DSM or ICD
diagnoses. Another possibility is to focus on processes common across ED diagnoses to
investigate neural and neurocognitive differences associated with them. Fairburn and
colleagues proposed a model suggesting that common processes operate across all ED
diagnostic categories (Z. Cooper & Fairburn, 2011; Fairburn et al., 2003): clinical
perfectionism, low self-esteem and interpersonal difficulties. While this pilot study was not
able to distinguish between diagnoses or ED behaviours because of its sample size, this
will be crucial when trying to understand neural and neurocognitive commonalities
between ED diagnostic categories.
My first chapter, with data from a large community sample, allowed for gender differences
in the exploration of psychopathology in children at high-familial risk for ED. Results show
interesting gender differences, specifically when exploring differences of internalising vs.
externalising difficulties. While overall children at familial-high risk showed an increased
risk for emotional difficulties (internalising), when stratified by gender, boys showed a
specific increase in odds for hyperactivity and social communication difficulties
(considered more externalising difficulties). While the inclusion of both girls and boys was
possible in this large community based study, when designing BREDS, only girls were
included. While it is a limitation, and may restrict investigation of specific hypothesis with
regards to gender differences, it would be difficult to recruit a sample big enough to allow
for these investigations. ED are more common in females with sex ratio estimates ranging
from 3:1 to 18:1 (Raevuori, Keski-Rahkonen, & Hoek, 2014) which would affect the sample
size needed.
246
The RDoC encourages a transdiagnostic approach to help explore shared diathesis of
psychiatric disorders that can in turn help develop a hierarchal structure of definition of
psychiatric disorders with broad genetic vulnerability factors which may branch into more
narrowly defined clinical phenotypes. The co-occurrence of disorders and symptoms
(within different disorders) has been of great interest in research for some time and can
help point to different ways of understanding the neural and genetic underpinnings of these
psychiatric illnesses that commonly co-occur. More importantly, leading to the study of
underlying processes and neural circuits that can be shared biomarkers for a larger
number of disorders. It is possible to use our developing understanding of brain alterations
in patients with ED to help guide our focus outside of diagnostic boundaries, understanding
the underlying neurobiology of ED ‘type’ and how this can help create more individualized
treatments. The study of overlapping features between ED and psychiatric disorders such
as ASD, OCD, and social anxiety is important and can help guide research and
development of testable hypotheses. Fronto-striatal alterations have been found in several
psychiatric disorders, including OCD, schizophrenia and depression and
neurodevelopmental disorders such as ASD and ADHD. Findings of the overlap in brain
alterations between several psychiatric disorders may be viewed as a supporting
argument for reformulation of the nosological status of ED in DMS-5 to a broader taxonomy
of psychiatric disorders that are hierarchically structured, defined at the highest level by
broad, genetic vulnerability factors which may branch into more narrowly defined clinical
phenotypes. This may help combine research efforts in the search for candidate genes
and neural endophenotypes causally related to fundamental characteristics of ED.
My PhD also highlights the role that altered developmental neural processes may play. It
is possible that abnormalities in GM and WM highlighted in this pilot study reflect not just
pure structural alterations, but also altered developmental processes (e.g., pruning,
myelination) that are then further disrupted by the onset of ED and its correlates (such as
malnutrition). A major phase of synaptogenesis, pruning and myelination occurs around
the time of puberty and adolescence (predominantly in frontal and limbic areas) (Benes,
1998) and alterations in these processes may play a role in the integration of emotional
processing with cognition. It has been demonstrated that until pruning improves the
efficiency in frontal circuity, reaction time for emotional recognition can be altered as well
as speed in cognitive flexibility (Casey et al., 1997; McGivern, Andersen, Byrd, Mutter, &
247
Reilly, 2002). Therefore, it is possible that alterations in the form of later pruning are a
biomarker for the onset of ED.
Theoretical implications
Overall, the differences in cognitive, structural and neural alterations observed in this
sample of children at high risk may work in combination to increase the risk for
development of an ED. Heightened anxiety could result in a hypervigilant behaviour with
a specific bias towards body related stimuli (which is already present during adolescence
given the bodily changes during puberty and the pressure for an ideal body type).
Cognitive inflexibility may further enhance difficulties by leading individuals to be unable
to shift from their negative thoughts. Higher drive may also work against them by
enhancing their pursue of unhealthy goals. While this study did not find differences
between neurocognitive measures of social cognition, alterations found in amygdala and
its connectivity overlap with those found in patients with ASD and therefore are suggestive
of difficulties in social cognition in this group. If this is true, this may play a role by making
it difficult for individuals to navigate a social life and increase heightened anxiety. These
neurocognitive processes and heightened anxiety can lead to specific behaviours that are
repeated after time and are more likely to become habitual, and altered fronto-striatal
pathways may play a role in these mechanisms of habit formation.
One of the main findings in this thesis is in relation to higher odds of internalising difficulties
(such as anxiety) in children at risk for ED and grey matter alterations in regions of the
brain which are central in anxiety disorders. Anxiety, fear and reward play an important
role in ED and have been proposed as central in the development of AN (and other ED to
some extent). Anatomic structures of importance to the anxiety circuit include the
amygdala, hippocampus, ventral striatum and OFC, all of which have been shown to be
altered in this PhD. In both human and animals studies, a wide range of anxiety
phenotypes have been linked to altered volume in areas that regulate anxiety and fear-
related behaviours (M. L. Phillips et al., 2003a, 2003b), overactivity of the amygdala and
of the hippocampus (which plays a critical role in emotional memory) (J. Gray &
McNaughton, 2000) (Scott L. Rauch et al., 2003) and dysfunction in frontal systems that
regulate amygdala activation by threatening stimuli (reduced top-down control over threat-
related distractors) (Bishop, Duncan, Brett, & Lawrence, 2004; S. L. Rauch et al., 2005).
This finding not only confirms retrospective research about the role that anxiety may play
in the development of an ED (J. M. Swinbourne & Touyz, 2007) but builds upon research
248
in children at risk for ED which has demonstrated higher odds of psychopathology in this
group (Nadia Micali et al., 2014; N. Micali, Stahl, Treasure, & Simonoff, 2014). Importantly,
understanding the role that anxiety plays in the course of the development of an ED may
help elucidate the mechanisms by which ED develops and lead to earlier interventions.
As said in an earlier paragraph, it is possible that heightened anxiety could result in
hypervigilant behaviour (with a specific bias towards body related stimuli given the age of
onset and the gender bias) leading to dieting behaviours which can be in itself rewarding
and is thereby positively reinforced. Patients with AN also report that dieting helps them
cope with negative effect which makes the behaviours even more reinforcing, becoming
more rewarding. The response of the ventral striatum (central for the assessment of the
potential reward value of stimuli) has been shown to be greater in adolescents than in
children and adults (suggesting that the same reward is viewed as more rewarding at this
stage of development) (Somerville, Hare, & Casey, 2011). The attraction of rewarding
stimuli paired with an underdeveloped inhibitory neural system, may contribute to the
development of an ED. In Frank’s paper in 2016 (G. K. Frank, 2016), he proposes a model
of risk which includes predisposing traits including a disposition to heightened anxiety,
increased sensitivity to salient stimuli and a larger OFC which could alter the individuals
ability to stop eating.
AN is one of the deadliest psychiatric disorders and one possible reason for its chronicity
is how remarkably persistent and resistant it is to current interventions. A shorter duration
of illness is amongst the factors associated with a more favourable outcome (Steinhausen,
2002). Given the possible protective factor of a shorter duration of illness, combined with
the persistence of behaviours (despite the risk to health associated with them), it has been
suggested that reward processing and habit formation plays an important role in the
maintenance of AN. The ventral striatum and OFC have been hypothesised to play a role
in habit formation which has been suggested to explain extreme weight restriction in AN
(with anxiolytic effects reinforcing effects of starvation which then become a habit reducing
the function of the goal-directed system) (Lloyd et al., 2017). Individuals with AN achieve
and maintain a significantly low body weight mainly through food restriction, which over
time becomes highly entrenched and resistant to change, and has therefore been
suggested to fulfil the definition of a habit “behaviours that are not innate, that are engaged
in repeatedly and become fixed, that appear to occur without conscious effort, and that
are elicited by a variety of stimuli” (Graybiel, 2008). While initially a behaviour may be goal-
249
directed and associated with the receipt of a reward, as it gets repeated overtime, it
becomes automatic and far less depended in reward. As this change happens, so do the
neural systems that support this behaviour. Animal and human research show that once
a behaviour becomes habitual it is under the control of neural systems that include the
dorsal striatum (including basal ganglia, caudate and putamen) and associated
dorsolateral frontal cortex (Balleine & O'Doherty, 2010). Interestingly, these neural
systems have been identified as being of importance in persistent behaviours across
psychiatric illnesses (Robbins et al., 2012). It is therefore possible, that alterations in these
systems may play a role the process by which behaviours become habitual.
Future work
Given the age of our sample it is important to continue to consider the role that changes
in development may play in the onset of an ED. To better understand the role of cognitive
control and flexibility in ED it is important to think about it within a developmental context,
since the onset of the disorder is generally during adolescence. Brain development
undergoes significant changes during adolescence, and the development of executive
functions (driven by frontal lobes development) is especially dynamic during this time
(Nelson, Leibenluft, McClure, & Pine, 2005). Of special importance are connections with
the PFC, which help modulate interconnected subcortical structures. My results suggest
that developmental factors related to executive functioning and cognitive processing might
be important as biomarkers of ED. Being able to study different age groups at risk may
shed more light into biomarkers/endophenotypes within a developmental framework.
Being able to study different age groups at risk may shed more light into
biomarkers/endophenotypes within a developmental framework. In ED, it is worth
considering studying both younger patients and those who have short duration of illness
to help our understanding of biomarkers. This is an important factor to consider not only
in ED but generally in mental health disorders with an onset in adolescence. The study of
major mental health disorders and age of onset would also help shed some light into the
overlap between these disorders (such as OCD, anxiety, depression) and create a
roadmap for the study of neural correlates for these disorders. Future studies in young
people with ED could consider stratifying patients by age in order to see neural
developmental changes and influence of the disorder.
This work established alterations of the fronto-striatal circuit, which have been suggested
as possible biomarkers for ED (as well as other psychiatric disorders). Given some of the

250
behavioural differences between different ED types, it is possible that a dysregulation of
the frontostriatal (or fronto-amygdala) circuits can lead to under- or overcontrol depending
on how reward is experienced. Therefore, the study of connectivity of cortical and sub-
cortical regions may be of special importance in understanding what regions may drive
altered behaviour.
Results from this thesis show greater GM volume of the OFC which has been suggested
to be a trait marker for AN after findings of altered GM volume in healthy sisters of patients
(G. K. W. Frank, Shott, & DeGuzman, 2019). While it is unclear what the implications for
illness are, further investigation of volume and connectivity of this region is warranted. The
OFC plays a central role in reversal learning, a cognitive function whereby behaviour is
flexibly altered after negative feedback and has been suggested to play a central role in
OCD and be found to be altered in healthy first degree relatives (Chamberlain et al., 2008).
As highlighted in early chapters, OCD and AN can present together and patients with AN
have been shown to present with numerous OCD traits which has led to research on the
overlap between the disorders (Dong et al., 2019; C. A. Levinson et al., 2019; N. Micali,
Hilton, et al., 2011; Murphy et al., 2010; Serpell et al., 2002). Results from neurocognitive
testing highlight set-shifting difficulties as being present in children at risk, making it a good
candidate for an endophenotype. Lesion studies in animals have shown a link between
specific regions of the PFC and ability to perform in Cantab AST task. Specifically the OFC
has been shown to be linked to performance in AST (McAlonan & Brown, 2003). Given
similar results in OCD and the link between OFC and cognitive inflexibility, further
investigation is warranted on the influence that increased or decreased OFC volume and
it’s connectivity may have in increased vulnerability towards ED and the link with inflexibly
thinking.
While this study was not able to stratify by maternal diagnosis or ED phenotype, future
studies should do so in order to help clarify whether differences in fronto-striatal
connectivity might be an important biomarker and therefore future studies should explore
this further using both structural and functional imaging techniques Given results from this
thesis future studies should consider an approach differentiating patients by phenotypic
presentation to help elucidate neural differences in patients with ED.
251
It is important to note how difficult it is to integrate findings from this study, especially given
the complexity of ED and the number of different processes that play a role in their
development. The main aim of this study, could be seen as ‘casting a wide net’, where
results may be related to different processes but not necessarily paint a coherent picture,
but that can help guide a number of later investigations. I believe that it is possible to
tentatively assume that high trait anxiety can lead to hypervigilance which can lead to
behaviour changes: possibly more goal directed behaviour (partly influenced by how
reward is processed given results from reward measures and alterations in the caudate,
or by a hypothesised perfectionistic behaviour) as well as a difficulty to shift from anxious
thoughts (explained by cognitive inflexibility). This study did not find any differences in FA
between the at risk group and healthy control girls, however, it is possible that hypothesise,
that in time, these behaviour changes (led by anxiety and reward sensitivity), can lead to
increased coherence of WM through a process of specialisation (increased FA found in
adolescent studies) in areas responsible for reward and behaviour control, such as results
on increased FA in orbitofrontal areas found by Frank in 2013.
Finally, this thesis shows the importance of at-risk studies to further our understanding of
the complex bio-psycho-social model of ED. Given the role that malnutrition plays in neural
mechanisms, it’s important that we investigate healthy children and first degree relatives
in order to understand what neural differences can be considered traits.
252
References
Abell, F., Krams, M., Ashburner, J., Passingham, R., Friston, K., Frackowiak, R., . . . Frith, U. (1999). The neuroanatomy of autism: a voxel-based whole brain analysis of structural scans. Neuroreport, 10(8), 1647-1651.
Adolphs, R., Tranel, D., Damasio, H., & Damasio, A. (1994). Impaired recognition of emotion in facial expressions following bilateral damage to the human amygdala. Nature, 372(6507), 669-672. doi:10.1038/372669a0
Akey, J. Lecture 10: Multiple Testing. Retrieved from http://www.gs.washington.edu/academics/courses/akey/56008/lecture/lecture10.pdf.
Alexander, G. E., DeLong, M. R., & Strick, P. L. (1986). Parallel organization of functionally segregated circuits linking basal ganglia and cortex. Annu Rev Neurosci, 9, 357-381. doi:10.1146/annurev.ne.09.030186.002041
Ali, K., Farrer, L., Fassnacht, D. B., Gulliver, A., Bauer, S., & Griffiths, K. M. (2017). Perceived barriers and facilitators towards help-seeking for eating disorders: A systematic review. International Journal of Eating Disorders, 50(1), 9-21. doi:10.1002/eat.22598
Amann, B., Schäfer, M., Sterr, A., Arnold, S., & Grunze, H. (2001). Central pontine myelinolysis in a patient with anorexia nervosa. Int J Eat Disord, 30(4), 462-466.
Ambwani, S., Berenson, K. R., Simms, L., Li, A., Corfield, F., & Treasure, J. (2016). Seeing things differently: An experimental investigation of social cognition and interpersonal behavior in anorexia nervosa. Int J Eat Disord, 49(5), 499-506. doi:10.1002/eat.22498
Anderluh, M., Tchanturia, K., Rabe-Hesketh, S., Collier, D., & Treasure, J. (2009). Lifetime course of eating disorders: design and validity testing of a new strategy to define the eating disorders phenotype. Psychol Med, 39(1), 105-114. doi:10.1017/s0033291708003292
Andersson, J. L., Skare, S., & Ashburner, J. (2003). How to correct susceptibility distortions in spin-echo echo-planar images: application to diffusion tensor imaging. Neuroimage, 20(2), 870-888. doi:10.1016/s1053-8119(03)00336-7
Andersson, J. L. R., & Sotiropoulos, S. N. (2016). An integrated approach to correction for off-resonance effects and subject movement in diffusion MR imaging. Neuroimage, 125, 1063-1078. doi:10.1016/j.neuroimage.2015.10.019
Angold, A., Costello, E. J., & Erkanli, A. (1999). Comorbidity. Journal of Child Psychology and Psychiatry and Allied Disciplines, 40(1), 57-87. doi:10.1017/s0021963098003448
APA. (2013). Diagnostic and Statistical Manual of Mental Disorders (DSM-5®). Washington, DC: American Psychiatric Association.
Arcelus, J., Mitchell, A. J., Wales, J., & Nielsen, S. (2011). Mortality rates in patients with anorexia nervosa and other eating disorders: A meta-analysis of 36 studies. Archives of general psychiatry, 68(7), 724-731.
Armbruster, D. J., Ueltzhoffer, K., Basten, U., & Fiebach, C. J. (2012). Prefrontal cortical mechanisms underlying individual differences in cognitive flexibility and stability. J Cogn Neurosci, 24(12), 2385-2399. doi:10.1162/jocn_a_00286
Artmann, H., Grau, H., Adelmann, M., & Schleiffer, R. (1985). Reversible and non-reversible enlargement of cerebrospinal fluid spaces in anorexia nervosa. Neuroradiology, 27(4), 304-312.
Ashford, J., Smit, F., van Lier, P. A., Cuijpers, P., & Koot, H. M. (2008). Early risk indicators of internalizing problems in late childhood: a 9-year longitudinal study. J Child Psychol Psychiatry, 49(7), 774-780. doi:10.1111/j.1469-7610.2008.01889.x
Association, A. P. (2000). Diagnostic and statistical manual of mental disorders: DSM-IV-TR. In. Washington, DC: American Psychiatric Association.
Attia, E. (2010). Anorexia nervosa: current status and future directions. Annu Rev Med, 61, 425-435. doi:10.1146/annurev.med.050208.200745
253
Austin, M. P., Hadzi-Pavlovic, D., Leader, L., Saint, K., & Parker, G. (2005). Maternal trait anxiety, depression and life event stress in pregnancy: relationships with infant temperament. Early Hum Dev, 81(2), 183-190. doi:10.1016/j.earlhumdev.2004.07.001
Balleine, B. W., Delgado, M. R., & Hikosaka, O. (2007). The role of the dorsal striatum in reward and decision-making. J Neurosci, 27(31), 8161-8165. doi:10.1523/JNEUROSCI.1554-07.2007
Balleine, B. W., & O'Doherty, J. P. (2010). Human and rodent homologies in action control: corticostriatal determinants of goal-directed and habitual action. Neuropsychopharmacology, 35(1), 48-69. doi:10.1038/npp.2009.131
Bang, L., Ro, O., & Endestad, T. (2016). Amygdala alterations during an emotional conflict task in women recovered from anorexia nervosa. Psychiatry Research: Neuroimaging, 248, 126-133.
Barbin, J. M., Williamson, D. A., Stewart, T. M., Reas, D. L., Thaw, J. M., & Guarda, A. S. (2002). Psychological adjustment in the children of mothers with a history of eating disorders. Eat Weight Disord, 7(1), 32-38.
Bardone-Cone, A. M., Wonderlich, S. A., Frost, R. O., Bulik, C. M., Mitchell, J. E., Uppala, S., & Simonich, H. (2007). Perfectionism and eating disorders: Current status and future directions. Clinical Psychology Review, 27(3), 384-405. doi:http://doi.org/10.1016/j.cpr.2006.12.005
Baron-Cohen, S., Wheelwright, S., Hill, J., Raste, Y., & Plumb, I. (2001). The "Reading the Mind in the Eyes" Test revised version: a study with normal adults, and adults with Asperger syndrome or high-functioning autism. Journal of child psychology and psychiatry, and allied disciplines, 42(2), 241-251.
Barona, M., Brown, M., Clark, C., Frangou, S., White, T., & Micali, N. (2019). White matter alterations in anorexia nervosa: Evidence from a voxel-based meta-analysis. Neurosci Biobehav Rev, 100, 285-295. doi:10.1016/j.neubiorev.2019.03.002
Barona, M., Nybo Andersen, A. M., & Micali, N. (2016). Childhood psychopathology in children of women with eating disorders. Acta Psychiatrica Scandinavica, 295-304. doi:10.1111/acps.12616
Barona, M., Taborelli, E., Corfield, F., Pawlby, S., Easter, A., Schmidt, U., . . . Micali, N. (2017). Neurobehavioural and cognitive development in infants born to mothers with eating disorders. J Child Psychol Psychiatry, 58(8), 931-938. doi:10.1111/jcpp.12736
Barros-Loscertales, A., Meseguer, V., Sanjuan, A., Belloch, V., Parcet, M. A., Torrubia, R., & Avila, C. (2006). Behavioral Inhibition System activity is associated with increased amygdala and hippocampal gray matter volume: A voxel-based morphometry study. Neuroimage, 33(3), 1011-1015. doi:10.1016/j.neuroimage.2006.07.025
Basser, P. J., Mattiello, J., & LeBihan, D. (1994). MR diffusion tensor spectroscopy and imaging. Biophys J, 66(1), 259-267. doi:10.1016/s0006-3495(94)80775-1
Basser, P. J., & Pierpaoli, C. (2011). Microstructural and physiological features of tissues elucidated by quantitative-diffusion-tensor MRI. 1996. J Magn Reson, 213(2), 560-570. doi:10.1016/j.jmr.2011.09.022
Baxter, M. G., & Murray, E. A. (2002). The amygdala and reward. Nat Rev Neurosci, 3(7), 563-573. doi:10.1038/nrn875
Beaulieu, C. (2002). The basis of anisotropic water diffusion in the nervous system - a technical review. NMR Biomed, 15(7-8), 435-455.
Bechara, A., Damasio, A. R., Damasio, H., & Anderson, S. W. (1994). Insensitivity to future consequences following damage to human prefrontal cortex. Cognition, 50(1-3), 7-15.
Beck, C. T. (1999). Maternal depression and child behaviour problems: a meta-analysis. J Adv Nurs, 29(3), 623-629.

254
Bediou, B., Asri, F., Brunelin, J., Krolak-Salmon, P., D'Amato, T., Saoud, M., & Tazi, I. (2007). Emotion recognition and genetic vulnerability to schizophrenia. Br J Psychiatry, 191, 126-130. doi:10.1192/bjp.bp.106.028829
Bediou, B., Krolak-Salmon, P., Saoud, M., Henaff, M. A., Burt, M., Dalery, J., & D'Amato, T. (2005). Facial expression and sex recognition in schizophrenia and depression. Can J Psychiatry, 50(9), 525-533.
Behrens, T. E., Berg, H. J., Jbabdi, S., Rushworth, M. F., & Woolrich, M. W. (2007). Probabilistic diffusion tractography with multiple fibre orientations: What can we gain? Neuroimage, 34(1), 144-155. doi:10.1016/j.neuroimage.2006.09.018
Behrens, T. E., Johansen-Berg, H., Woolrich, M. W., Smith, S. M., Wheeler-Kingshott, C. A., Boulby, P. A., . . . Matthews, P. M. (2003). Non-invasive mapping of connections between human thalamus and cortex using diffusion imaging. Nat Neurosci, 6(7), 750-757. doi:10.1038/nn1075
Bemporad, J. R. (1996). Self-starvation through the ages: Reflections on the pre-history of anorexia nervosa. International Journal of Eating Disorders, 19(3), 217-237. doi:10.1002/(SICI)1098-108X(199604)19:3<217::AID-EAT1>3.0.CO;2-P
Benes, F. M. (1998). Brain development, VII. Human brain growth spans decades. Am J Psychiatry, 155(11), 1489. doi:10.1176/ajp.155.11.1489
Benjamini, Y., & Hochberg, Y. (1995). Controlling the False Discovery Rate: A Practical and Powerful Approach to Multiple Testing. Journal of the Royal Statistical Society. Series B (Methodological), 57(1), 289-300.
Berenbaum, H., Raghavan, C., Le, H. N., Vernon, L. L., & Gomez, J. J. (2003). A taxonomy of emotional disturbances. Clinical Psychology: Science and Practice, 10(2), 206-226.
Berns, G. S., McClure, S. M., Pagnoni, G., & Montague, P. R. (2001). Predictability modulates human brain response to reward. J Neurosci, 21(8), 2793-2798.
Berridge, K. C. (2009). ‘Liking’ and ‘wanting’ food rewards: Brain substrates and roles in eating disorders. Physiology & Behavior, 97(5), 537-550. doi:http://dx.doi.org/10.1016/j.physbeh.2009.02.044
Berridge, K. C., & Robinson, T. E. (1998). What is the role of dopamine in reward: hedonic impact, reward learning, or incentive salience? Brain Res Brain Res Rev, 28(3), 309-369.
Biederman, J., Petty, C. R., Monuteaux, M. C., Fried, R., Byrne, D., Mirto, T., . . . Faraone, S. V. (2010). Adult psychiatric outcomes of girls with attention deficit hyperactivity disorder: 11-year follow-up in a longitudinal case-control study. American Journal of Psychiatry, 167(4), 409-417.
Bijttebier, P., Beck, I., Claes, L., & Vandereycken, W. (2009). Gray's Reinforcement Sensitivity Theory as a framework for research on personality-psychopathology associations. Clin Psychol Rev, 29(5), 421-430. doi:10.1016/j.cpr.2009.04.002
Bishop, S., Duncan, J., Brett, M., & Lawrence, A. D. (2004). Prefrontal cortical function and anxiety: controlling attention to threat-related stimuli. Nat Neurosci, 7(2), 184-188. doi:10.1038/nn1173
Bodell, L. P., Keel, P. K., Brumm, M. C., Akubuiro, A., Caballero, J., Tranel, D., . . . McCormick, L. M. (2014). Longitudinal examination of decision-making performance in anorexia nervosa: Before and after weight restoration. Journal of Psychiatric Research, 56, 150-157.
Boghi, A., Sterpone, S., Sales, S., D'Agata, F., Bradac, G. B., Zullo, G., & Munno, D. (2011). In vivo evidence of global and focal brain alterations in anorexia nervosa. Psychiatry Research - Neuroimaging, 192(3), 154-159.
Boisseau, C. L., Thompson-Brenner, H., Caldwell-Harris, C., Pratt, E., Farchione, T., & Harrison Barlow, D. (2012). Behavioral and cognitive impulsivity in obsessive–compulsive disorder and eating disorders. Psychiatry Research, 200(2), 1062-1066. doi:https://doi.org/10.1016/j.psychres.2012.06.010
255
Bomba, M., Riva, A., Veggo, F., Grimaldi, M., Morzenti, S., Neri, F., & Nacinovich, R. (2013). Impact of speed and magnitude of weight loss on the development of brain trophic changes in adolescents with anorexia nervosa: A case control study. Italian Journal of Pediatrics, 39 (1) (no pagination)(14).
Bora, E., Fornito, A., Yücel, M., & Pantelis, C. (2010). Voxelwise Meta-Analysis of Gray Matter Abnormalities in Bipolar Disorder. Biological psychiatry, 67(11), 1097-1105. doi:http://dx.doi.org/10.1016/j.biopsych.2010.01.020
Bora, E., & Köse, S. (2016). Meta-analysis of theory of mind in anorexia nervosa and bulimia nervosa: A specific İmpairment of cognitive perspective taking in anorexia nervosa? Int J Eat Disord, 49(8), 739-740. doi:10.1002/eat.22572
Bosl, W. (2011). EEG complexity as a biomarker for autism spectrum disorder risk. BMC medicine, 9(1), 18.
Brand, M., Franke-Sievert, C., Jacoby, G. E., Markowitsch, H. J., & Tuschen-Caffier, B. (2007). Neuropsychological correlates of decision making in patients with bulimia nervosa. Neuropsychology, 21(6), 742-750. doi:10.1037/0894-4105.21.6.742
Brewer, R., Cook, R., Cardi, V., Treasure, J., & Bird, G. (2015). Emotion recognition deficits in eating disorders are explained by co-occurring alexithymia. R Soc Open Sci, 2(1), 140382. doi:10.1098/rsos.140382
Brinch, M., Isager, T., & Tolstrup, K. (1988). Anorexia nervosa and motherhood: reproduction pattern and mothering behavior of 50 women. Acta Psychiatrica Scandinavica, 77(5), 611-617.
Brockmeyer, T., Skunde, M., Wu, M., Bresslein, E., Rudofsky, G., Herzog, W., & Friederich, H. C. (2014). Difficulties in emotion regulation across the spectrum of eating disorders. Compr Psychiatry, 55(3), 565-571. doi:10.1016/j.comppsych.2013.12.001
Brooks, S. J. (2016). A debate on working memory and cognitive control: Can we learn about the treatment of substance use disorders from the neural correlates of anorexia nervosa? BMC Psychiatry, 16 (1) (no pagination)(10).
Brooks, S. J., Barker, G. J., O'Daly, O. G., Brammer, M., Williams, S. C. R., Benedict, C., . . . Campbell, I. C. (2011). Restraint of appetite and reduced regional brain volumes in anorexia nervosa: a voxel-based morphometric study. BMC Psychiatry, 11(1), 179. doi:10.1186/1471-244X-11-179
Brooks, S. J., Funk, S. G., Young, S. Y., & Schiöth, H. B. (2017). The Role of Working Memory for Cognitive Control in Anorexia Nervosa versus Substance Use Disorder. Front Psychol, 8, 1651. doi:10.3389/fpsyg.2017.01651
Brothers, L. (1990). The social brain: A project for integrating primate behavior and neurophysiology in a new domain. Concepts in Neuroscience, 1, 27-51.
Bubb, E. J., Metzler-Baddeley, C., & Aggleton, J. P. (2018). The cingulum bundle: Anatomy, function, and dysfunction. Neurosci Biobehav Rev, 92, 104-127. doi:10.1016/j.neubiorev.2018.05.008
Bulik, C. M. (2005). Exploring the gene-environment nexus in eating disorders. J Psychiatry Neurosci, 30(5), 335-339.
Bulik, C. M., Sullivan, P. F., Tozzi, F., Furberg, H., Lichtenstein, P., & Pedersen, N. L. (2006). Prevalence, heritability, and prospective risk factors for anorexia nervosa. Arch Gen Psychiatry, 63(3), 305-312. doi:10.1001/archpsyc.63.3.305
Bulik, C. M., Sullivan, P. F., Wade, T. D., & Kendler, K. S. (2000). Twin studies of eating disorders: a review. Int J Eat Disord, 27(1), 1-20.
Burgess, P. W., & Shallice, T. (1997). The hayling and brixton tests. Bush, G., Vogt, B. A., Holmes, J., Dale, A. M., Greve, D., Jenike, M. A., & Rosen, B. R. (2002).
Dorsal anterior cingulate cortex: a role in reward-based decision making. Proc Natl Acad Sci U S A, 99(1), 523-528. doi:10.1073/pnas.012470999
256
Cannon, T. D., van Erp, T. G., Bearden, C. E., Loewy, R., Thompson, P., Toga, A. W., . . . Tsuang, M. T. (2003). Early and late neurodevelopmental influences in the prodrome to schizophrenia: contributions of genes, environment, and their interactions. Schizophr Bull, 29(4), 653-669. doi:10.1093/oxfordjournals.schbul.a007037
Cardi, V., Turton, R., Schifano, S., Leppanen, J., Hirsch, C. R., & Treasure, J. (2017). Biased Interpretation of Ambiguous Social Scenarios in Anorexia Nervosa. Eur Eat Disord Rev, 25(1), 60-64. doi:10.1002/erv.2493
Cartwright, M. M. (2004). Eating disorder emergencies: understanding the medical complexities of the hospitalized eating disordered patient. Crit Care Nurs Clin North Am, 16(4), 515-530. doi:10.1016/j.ccell.2004.07.002
Carver, C. S., & White, T. L. (1994). Behavioral inhibition, behavioral activation, and affective responses to impending reward and punishment: The BIS/BAS Scales. Journal of personality and social psychology, 67(2), 319.
Casey, B. J., Trainor, R., Giedd, J., Vauss, Y., Vaituzis, C. K., Hamburger, S., . . . Rapoport, J. L. (1997). The role of the anterior cingulate in automatic and controlled processes: A developmental neuroanatomical study. Developmental Psychobiology, 30(1), 61-69. doi:10.1002/(SICI)1098-2302(199701)30:1<61::AID-DEV6>3.0.CO;2-T
Cash, T. F., & Deagle, E. A., 3rd. (1997). The nature and extent of body-image disturbances in anorexia nervosa and bulimia nervosa: a meta-analysis. Int J Eat Disord, 22(2), 107-125.
Cash, T. F., & Deagle Iii, E. A. (1997). The nature and extent of body‐image disturbances in anorexia nervosa and bulimia nervosa: A meta‐analysis. International Journal of Eating Disorders, 22(2), 107-126.
Castellini, G., Lo Sauro, C., Mannucci, E., Ravaldi, C., Rotella, C. M., Faravelli, C., & Ricca, V. (2011). Diagnostic crossover and outcome predictors in eating disorders according to DSM-IV and DSM-V proposed criteria: a 6-year follow-up study. Psychosom Med, 73(3), 270-279. doi:10.1097/PSY.0b013e31820a1838
Castro-Fornieles, J., Bargallo, N., Lazaro, L., Andres, S., Falcon, C., Plana, M. T., & Junque, C. (2009). A cross-sectional and follow-up voxel-based morphometric MRI study in adolescent anorexia nervosa. Journal of Psychiatric Research, 43(3), 331-340.
Cavallari, M., Ceccarelli, A., Wang, G. Y., Moscufo, N., Hannoun, S., Matulis, C. R., . . . Guttmann, C. R. (2014). Microstructural changes in the striatum and their impact on motor and neuropsychological performance in patients with multiple sclerosis. PLoS One, 9(7), e101199. doi:10.1371/journal.pone.0101199
Cederlöf, M., Thornton, L. M., Baker, J., Lichtenstein, P., Larsson, H., Rück, C., . . . Mataix-Cols, D. (2015). Etiological overlap between obsessive-compulsive disorder and anorexia nervosa: a longitudinal cohort, multigenerational family and twin study. World Psychiatry, 14(3), 333-338. doi:10.1002/wps.20251
Cha, J., Ide, J. S., Bowman, F., Simpson, H. B., Posner, J., & Steinglass, J. E. (2016). Abnormal reward circuitry in anorexia nervosa: A longitudinal, multimodal MRI study. Human Brain Mapping, 37(11), 3835-3846.
Cha, J., Ide, J. S., Bowman, F. D., Simpson, H. B., Posner, J., & Steinglass, J. E. (2016a). Abnormal reward circuitry in anorexia nervosa: A longitudinal, multimodal MRI study. Hum Brain Mapp. doi:10.1002/hbm.23279
Cha, J., Ide, J. S., Bowman, F. D., Simpson, H. B., Posner, J., & Steinglass, J. E. (2016b). Abnormal reward circuitry in anorexia nervosa: A longitudinal, multimodal MRI study. Hum Brain Mapp, 37(11), 3835-3846. doi:10.1002/hbm.23279
Chamberlain, S. R., Fineberg, N. A., Menzies, L. A., Blackwell, A. D., Bullmore, E. T., Robbins, T. W., & Sahakian, B. J. (2007). Impaired Cognitive Flexibility and Motor Inhibition in Unaffected First-Degree Relatives of Patients With Obsessive-Compulsive Disorder. American Journal of Psychiatry, 164(2), 335-338. doi:10.1176/ajp.2007.164.2.335
257
Chamberlain, S. R., Menzies, L., Hampshire, A., Suckling, J., Fineberg, N. A., del Campo, N., . . . Sahakian, B. J. (2008). Orbitofrontal Dysfunction in Patients with Obsessive-Compulsive Disorder and Their Unaffected Relatives. Science, 321(5887), 421. doi:10.1126/science.1154433
Chan, R. C. K., Di, X., McAlonan, G. M., & Gong, Q.-y. (2011). Brain Anatomical Abnormalities in High-Risk Individuals, First-Episode, and Chronic Schizophrenia: An Activation Likelihood Estimation Meta-analysis of Illness Progression. Schizophrenia Bulletin, 37(1), 177-188. doi:10.1093/schbul/sbp073
Chevallier, C., Grèzes, J., Molesworth, C., Berthoz, S., & Happé, F. (2012). Brief report: Selective social anhedonia in high functioning autism. J Autism Dev Disord, 42(7), 1504-1509. doi:10.1007/s10803-011-1364-0
Cimino, Cerniglia, Paciello, & Sinesi. (2013). A Six-year Prospective Study on Children of Mothers with Eating Disorders: The Role of Paternal Psychological Profiles. European Eating Disorders Review, 21(3), 238-246. doi:doi:10.1002/erv.2218
Cimino, S., Cerniglia, L., & Paciello, M. (2015). Mothers with Depression, Anxiety or Eating Disorders: Outcomes on Their Children and the Role of Paternal Psychological Profiles. Child Psychiatry & Human Development, 46(2), 228-236. doi:10.1007/s10578-014-0462-6
Clayden, J. D., Maniega, S. M., Storkey, A. J., King, M. D., Bastin, M. E., & Clark, C. A. (2011). TractoR: Magnetic Resonance Imaging and Tractography with R. Journal of statistical software, 44(Article), 1-18.
Cloninger, C. R. (2002). The discovery of susceptibility genes for mental disorders. Proceedings of the National Academy of Sciences of the United States of America, 99(21), 13365-13367. doi:10.1073/pnas.222532599
Collaboration, O. S. (2015). Estimating the reproducibility of psychological science. science, 349(6251), aac4716. doi:10.1126/science.aac4716
Coombs, E., Brosnan, M., Bryant-Waugh, R., & Skevington, S. M. (2011). An investigation into the relationship between eating disorder psychopathology and autistic symptomatology in a non-clinical sample. The British journal of clinical psychology / the British Psychological Society, 50(3), 326-338. doi:10.1348/014466510X524408
Cooper, A., Gomez, R., & Aucote, H. (2007). The Behavioural Inhibition System and Behavioural Approach System (BIS/BAS) Scales: Measurement and structural invariance across adults and adolescents. Personality and Individual Differences, 43(2), 295-305. doi:http://dx.doi.org/10.1016/j.paid.2006.11.023
Cooper, A. J., Perkins, A. M., & Corr, P. J. (2007). A confirmatory factor analytic study of anxiety, fear, and behavioral inhibition system measures. Journal of Individual Differences, 28(4), 179-187. doi:10.1027/1614-0001.28.4.179
Cooper, Z., & Fairburn, C. G. (2011). The Evolution of "Enhanced" Cognitive Behavior Therapy for Eating Disorders: Learning From Treatment Nonresponse. Cogn Behav Pract, 18(3), 394-402. doi:10.1016/j.cbpra.2010.07.007
Cowan, W. M., Kopnisky, K. L., & Hyman, S. E. (2002). The human genome project and its impact on psychiatry. Annu Rev Neurosci, 25, 1-50. doi:10.1146/annurev.neuro.25.112701.142853
Crockenberg, S., & Acredolo, C. (1983). Infant temperament ratings: A function of infants, of mothers, or both? Infant Behavior and Development, 6(1), 61-72. doi:http://dx.doi.org/10.1016/S0163-6383(83)80008-3
Cubillo, A., Halari, R., Smith, A., Taylor, E., & Rubia, K. (2012). A review of fronto-striatal and fronto-cortical brain abnormalities in children and adults with Attention Deficit Hyperactivity Disorder (ADHD) and new evidence for dysfunction in adults with ADHD during motivation and attention. cortex, 48(2), 194-215.
258
Culbert, K. M., Racine, S. E., & Klump, K. L. (2015). Research Review: What we have learned about the causes of eating disorders – a synthesis of sociocultural, psychological, and biological research. Journal of Child Psychology and Psychiatry, n/a-n/a. doi:10.1111/jcpp.12441
Curran, K. M., Emsell, L., & Leemans, A. (2016). Quantitative DTI Measures. In W. Van Hecke, L. Emsell, & S. Sunaert (Eds.), Diffusion Tensor Imaging. New York: Springer.
Cuthbert, B. N., & Insel, T. R. (2013). Toward the future of psychiatric diagnosis: the seven pillars of RDoC. BMC Med, 11, 126. doi:10.1186/1741-7015-11-126
Dahl, R. E. (2004). Adolescent brain development: a period of vulnerabilities and opportunities. Keynote address. Ann N Y Acad Sci, 1021, 1-22. doi:10.1196/annals.1308.001
Dajani, D. R., & Uddin, L. Q. (2015). Demystifying cognitive flexibility: Implications for clinical and developmental neuroscience. Trends Neurosci, 38(9), 571-578. doi:10.1016/j.tins.2015.07.003
Darcy, A. M., Fitzpatrick, K. K., Colborn, D., Manasse, S., Datta, N., Aspen, V., . . . Lock, J. (2012). Set-shifting among adolescents with bulimic spectrum eating disorders. Psychosom Med, 74(8), 869-872. doi:10.1097/PSY.0b013e31826af636
Davis, M. (1992). The role of the amygdala in fear and anxiety. Annu Rev Neurosci, 15, 353-375. doi:10.1146/annurev.ne.15.030192.002033
Dawe, S., & Loxton, N. J. (2004). The role of impulsivity in the development of substance use and eating disorders. Neurosci Biobehav Rev, 28(3), 343-351. doi:10.1016/j.neubiorev.2004.03.007
De Bellis, M. D., Casey, B. J., Dahl, R. E., Birmaher, B., Williamson, D. E., Thomas, K. M., . . . Ryan, N. D. (2000). A pilot study of amygdala volumes in pediatric generalized anxiety disorder. Biol Psychiatry, 48(1), 51-57. doi:10.1016/s0006-3223(00)00835-0
Delgado, M. R., Locke, H. M., Stenger, V. A., & Fiez, J. A. (2003). Dorsal striatum responses to reward and punishment: effects of valence and magnitude manipulations. Cogn Affect Behav Neurosci, 3(1), 27-38.
Dell'Acqua, F., Rizzo, G., Scifo, P., Clarke, R. A., Scotti, G., & Fazio, F. (2007). A model-based deconvolution approach to solve fiber crossing in diffusion-weighted MR imaging. IEEE Trans Biomed Eng, 54(3), 462-472. doi:10.1109/tbme.2006.888830
Dell'acqua, F., Scifo, P., Rizzo, G., Catani, M., Simmons, A., Scotti, G., & Fazio, F. (2010). A modified damped Richardson-Lucy algorithm to reduce isotropic background effects in spherical deconvolution. Neuroimage, 49(2), 1446-1458. doi:10.1016/j.neuroimage.2009.09.033
Dell'Acqua, F., & Tournier, J. D. (2019). Modelling white matter with spherical deconvolution: How and why? NMR Biomed, 32(4), e3945. doi:10.1002/nbm.3945
Demetriou, E. A., Lampit, A., Quintana, D. S., Naismith, S. L., Song, Y. J. C., Pye, J. E., . . . Guastella, A. J. (2018). Autism spectrum disorders: a meta-analysis of executive function. Mol Psychiatry, 23(5), 1198-1204. doi:10.1038/mp.2017.75
Desikan, R. S., Segonne, F., Fischl, B., Quinn, B. T., Dickerson, B. C., Blacker, D., . . . Killiany, R. J. (2006). An automated labeling system for subdividing the human cerebral cortex on MRI scans into gyral based regions of interest. Neuroimage, 31(3), 968-980. doi:10.1016/j.neuroimage.2006.01.021
Diamond, A. (2013). Executive functions. Annu Rev Psychol, 64, 135-168. doi:10.1146/annurev-psych-113011-143750
Diffusion tractography. Retrieved from https://www.humanconnectome.org/study/hcp-young-adult/project-protocol/diffusion-tractography
Dignon, A., Beardsmore, A., Spain, S., & Kuan, A. (2006). 'Why I won't eat': patient testimony from 15 anorexics concerning the causes of their disorder. J Health Psychol, 11(6), 942-956. doi:10.1177/1359105306069097

259
Dolan, R. J., & Dayan, P. (2013). Goals and habits in the brain. Neuron, 80(2), 312-325. doi:10.1016/j.neuron.2013.09.007
Dolan, R. J., & Vuilleumier, P. (2003). Amygdala automaticity in emotional processing. Ann N Y Acad Sci, 985, 348-355.
Dong, C., Yang, Q., Liang, J., Seger, C. A., Han, H., Ning, Y., . . . Peng, Z. (2019). Impairment in the goal-directed corticostriatal learning system as a biomarker for obsessive-compulsive disorder. Psychol Med, 1-11. doi:10.1017/s0033291719001429
Donnelly, B., Touyz, S., Hay, P., Burton, A., Russell, J., & Caterson, I. (2018). Neuroimaging in bulimia nervosa and binge eating disorder: a systematic review. J Eat Disord, 6, 3. doi:10.1186/s40337-018-0187-1
Downing, P. E., Jiang, Y., Shuman, M., & Kanwisher, N. (2001). A cortical area selective for visual processing of the human body. Science, 293(5539), 2470-2473. doi:10.1126/science.1063414
Drevets, W. C. (2007). Orbitofrontal cortex function and structure in depression. Ann N Y Acad Sci, 1121, 499-527. doi:10.1196/annals.1401.029
Duncan, L., Yilmaz, Z., Gaspar, H., Walters, R., Goldstein, J., Anttila, V., . . . Bulik, C. M. (2017). Significant Locus and Metabolic Genetic Correlations Revealed in Genome-Wide Association Study of Anorexia Nervosa. Am J Psychiatry, 174(9), 850-858. doi:10.1176/appi.ajp.2017.16121402
Dura, J. R., & Bornstein, R. A. (1989). Differences between IQ and school achievement in anorexia nervosa. J Clin Psychol, 45. doi:3.0.co;2-x
Eack, S. M. (2010). Social cognition deficits among individuals at familial high risk for schizophrenia. Schizophrenia Bulletin, 36(6), 1081.
Easter, A., Naumann, U., Northstone, K., Schmidt, U., Treasure, J., & Micali, N. (2013). A longitudinal investigation of nutrition and dietary patterns in children of mothers with eating disorders. The Journal of pediatrics, 163(1), 173-178 e171. doi:10.1016/j.jpeds.2012.11.092
Eddy, K. T., Keel, P. K., Dorer, D. J., Delinsky, S. S., Franko, D. L., & Herzog, D. B. (2002). Longitudinal comparison of anorexia nervosa subtypes. Int J Eat Disord, 31(2), 191-201.
Ehrlich, S., Geisler, D., Ritschel, F., King, J. A., Seidel, M., Boehm, I., . . . Kroemer, N. B. (2015). Elevated cognitive control over reward processing in recovered female patients with anorexia nervosa. Journal of Psychiatry & Neuroscience, 40(5), 307-315.
Eizaguirre, A. E., Saenz de Cabezón, A. O., Alda, I. O. d., Olariaga, L. J., & Juaniz, M. (2004). Alexithymia and its relationships with anxiety and depression in eating disorders. Personality and Individual Differences, 36(2), 321-331. doi:10.1016/S0191-8869(03)00099-0
Emery, N. J., Capitanio, J. P., Mason, W. A., Machado, C. J., Mendoza, S. P., & Amaral, D. G. (2001). The effects of bilateral lesions of the amygdala on dyadic social interactions in rhesus monkeys (Macaca mulatta). Behav Neurosci, 115(3), 515-544.
Esposito, R., Cieri, F., di Giannantonio, M., & Tartaro, A. (2018). The role of body image and self-perception in anorexia nervosa: the neuroimaging perspective. J Neuropsychol, 12(1), 41-52. doi:10.1111/jnp.12106
Etkin, A., Prater, K. E., Schatzberg, A. F., Menon, V., & Greicius, M. D. (2009). Disrupted amygdalar subregion functional connectivity and evidence of a compensatory network in generalized anxiety disorder. Arch Gen Psychiatry, 66(12), 1361-1372. doi:10.1001/archgenpsychiatry.2009.104
Etkin, A., & Wager, T. D. (2007). Functional neuroimaging of anxiety: a meta-analysis of emotional processing in PTSD, social anxiety disorder, and specific phobia. Am J Psychiatry, 164(10), 1476-1488. doi:10.1176/appi.ajp.2007.07030504

260
Fairburn, C. G., & Bohn, K. (2005). Eating disorder NOS (EDNOS): an example of the troublesome “not otherwise specified” (NOS) category in DSM-IV. Behaviour Research and Therapy, 43(6), 691-701. doi:10.1016/j.brat.2004.06.011
Fairburn, C. G., Cooper, Z., & Shafran, R. (2003). Cognitive behaviour therapy for eating disorders: a “transdiagnostic” theory and treatment. Behaviour Research and Therapy, 41(5), 509-528. doi:https://doi.org/10.1016/S0005-7967(02)00088-8
Fan, J., McCandliss, B. D., Fossella, J., Flombaum, J. I., & Posner, M. I. (2005). The activation of attentional networks. Neuroimage, 26(2), 471-479. doi:10.1016/j.neuroimage.2005.02.004
Farquharson, S., Tournier, J. D., Calamante, F., Fabinyi, G., Schneider-Kolsky, M., Jackson, G. D., & Connelly, A. (2013). White matter fiber tractography: why we need to move beyond DTI. J Neurosurg, 118(6), 1367-1377. doi:10.3171/2013.2.jns121294
Faul, F., Erdfelder, E., Lang, A. G., & Buchner, A. (2007). G*Power 3: a flexible statistical power analysis program for the social, behavioral, and biomedical sciences. Behav Res Methods, 39(2), 175-191. doi:10.3758/bf03193146
Favaro, A., Caregaro, L., Tenconi, E., Bosello, R., & Santonastaso, P. (2009). Time trends in age at onset of anorexia nervosa and bulimia nervosa. J Clin Psychiatry, 70(12), 1715-1721. doi:10.4088/JCP.09m05176blu
First, M., Spitzer, R., Gibbon, M., & Janet, B. (2002). Structured Clinical Interview for DSM-IV-TR Axis I Disorders, Research Version, Non-patient Edition. (SCID-I/NP). New York State Psychiatric Institute: New York: Biometrics Research.
Fischl, B., Sereno, M. I., Tootell, R. B. H., & Dale, A. M. (1999). High-resolution intersubject averaging and a coordinate system for the cortical surface. Human Brain Mapping, 8(4), 272--284. doi:10.1002/(SICI)1097-0193(1999)8:4<272::AID-HBM10>3.0.CO;2-4
Forstmann, B. U., van den Wildenberg, W. P., & Ridderinkhof, K. R. (2008). Neural mechanisms, temporal dynamics, and individual differences in interference control. J Cogn Neurosci, 20(10), 1854-1865. doi:10.1162/jocn.2008.20122
Frank, G. K. (2013). Altered brain reward circuits in eating disorders: chicken or egg? Current psychiatry reports, 15(10), 1-7.
Frank, G. K. (2015). Advances from neuroimaging studies in eating disorders. CNS Spectr, 20(4), 391-400. doi:10.1017/s1092852915000012
Frank, G. K. (2016). The Perfect Storm - A Bio-Psycho-Social Risk Model for Developing and Maintaining Eating Disorders. Front Behav Neurosci, 10, 44. doi:10.3389/fnbeh.2016.00044
Frank, G. K., Bailer, U. F., Henry, S., Wagner, A., & Kaye, W. H. (2004). Neuroimaging studies in eating disorders. CNS Spectr, 9(7), 539-548.
Frank, G. K., Mettler, L., Shott, M., & Yang, T. (2013). White matter integrity is reduced in bulimia nervosa. Biological Psychiatry, 1), 91S.
Frank, G. K., Shott, M. E., Hagman, J. O., & Mittal, V. A. (2013). Alterations in brain structures related to taste reward circuitry in ill and recovered anorexia nervosa and in bulimia nervosa. American Journal of Psychiatry, 170(10), 1152-1160.
Frank, G. K., Shott, M. E., Hagman, J. O., & Yang, T. T. (2013). Localized brain volume and white matter integrity alterations in adolescent anorexia nervosa. Journal of the American Academy of Child and Adolescent Psychiatry, 52(10), 1066-1075.
Frank, G. K., Shott, M. E., & Mittal, V. (2013). Taste reward circuitry related brain structures characterize ill and recovered anorexia nervosa and bulimia nervosa. Biological Psychiatry, 1), 90S-91S.
Frank, G. K. W., Shott, M. E., & DeGuzman, M. C. (2019). Recent advances in understanding anorexia nervosa. F1000Res, 8. doi:10.12688/f1000research.17789.1
261
Frank, G. K. W., Shott, M. E., Hagman, J. O., & Yang, T. T. (2013). Localized brain volume and white matter integrity alterations in adolescent anorexia nervosa. Journal of the American Academy of Child and Adolescent Psychiatry, 52(10), 1066-1075.e1065.
Franzen, U., & Gerlinghoff, M. (1997). Parenting by patients with eating disorders: Experiences with a mother-child group. Eating Disorders, 5(1), 5-14. doi:10.1080/10640269708249199
Friedman, N. P., & Miyake, A. (2017). Unity and diversity of executive functions: Individual differences as a window on cognitive structure. Cortex, 86, 186-204. doi:10.1016/j.cortex.2016.04.023
Frieling, H., Fischer, J., Wilhelm, J., Engelhorn, T., Bleich, S., Hillemacher, T., . . . Peschel, T. (2012a). Microstructural abnormalities of the posterior thalamic radiation and the mediodorsal thalamic nuclei in females with anorexia nervosa - A voxel based diffusion tensor imaging (DTI) study. Journal of Psychiatric Research, 46(9), 1237-1242.
Frieling, H., Fischer, J., Wilhelm, J., Engelhorn, T., Bleich, S., Hillemacher, T., . . . Peschel, T. (2012b). Microstructural abnormalities of the posterior thalamic radiation and the mediodorsal thalamic nuclei in females with anorexia nervosa--a voxel based diffusion tensor imaging (DTI) study. J Psychiatr Res, 46(9), 1237-1242. doi:10.1016/j.jpsychires.2012.06.005
Frintrop, L., Trinh, S., Liesbrock, J., Leunissen, C., Kempermann, J., Etdöger, S., . . . Seitz, J. (2019). The reduction of astrocytes and brain volume loss in anorexia nervosa—the impact of starvation and refeeding in a rodent model. Translational Psychiatry, 9(1), 159. doi:10.1038/s41398-019-0493-7
Frith, U. (1989). Autism: Explaining the Enigma: Oxford:Basil Blackwell. Frith, U., & Happe, F. (1994). Autism: beyond "theory of mind". Cognition, 50(1-3), 115-132. Fuglset, T. S., Endestad, T., Landro, N. I., & Ro, O. (2015). Brain structure alterations associated
with weight changes in young females with anorexia nervosa: A case series. Neurocase, 21(2), 169-177.
Fusar-Poli, P., Placentino, A., Carletti, F., Landi, P., Allen, P., Surguladze, S., . . . Politi, P. (2009). Functional atlas of emotional faces processing: a voxel-based meta-analysis of 105 functional magnetic resonance imaging studies. J Psychiatry Neurosci, 34(6), 418-432.
Galimberti, E., Fadda, E., Cavallini, M. C., Martoni, R. M., Erzegovesi, S., & Bellodi, L. (2013). Executive functioning in anorexia nervosa patients and their unaffected relatives. Psychiatry Res, 208(3), 238-244. doi:10.1016/j.psychres.2012.10.001
Garcia-Garcia, I., Narberhaus, A., Marques-Iturria, I., Garolera, M., Radoi, A., Segura, B., . . . Jurado, M. (2013). Neural responses to visual food cues: Insights from functional magnetic resonance imaging. European Eating Disorders Review, 21(2), 89-98.
Garrett, A. S., Lock, J., Datta, N., Beenhaker, J., Kesler, S. R., & Reiss, A. L. (2014). Predicting clinical outcome using brain activation associated with set-shifting and central coherence skills in Anorexia Nervosa. Journal of Psychiatric Research, 57, 26-33.
Gaudio, S., Carducci, F., Piervincenzi, C., Olivo, G., & Schioth, H. B. (2019). Altered thalamo-cortical and occipital-parietal- temporal-frontal white matter connections in patients with anorexia and bulimia nervosa: a systematic review of diffusion tensor imaging studies. J Psychiatry Neurosci, 44(3), 1-16. doi:10.1503/jpn.180121
Gaudio, S., Nocchi, F., Franchin, T., Genovese, E., Cannata, V., Longo, D., & Fariello, G. (2011). Gray matter decrease distribution in the early stages of Anorexia Nervosa restrictive type in adolescents. Psychiatry Res, 191(1), 24-30. doi:10.1016/j.pscychresns.2010.06.007
Gaudio, S., & Quattrocchi, C. C. (2012). Neural basis of a multidimensional model of body image distortion in anorexia nervosa. Neurosci Biobehav Rev, 36(8), 1839-1847. doi:10.1016/j.neubiorev.2012.05.003
262
Gaudio, S., Quattrocchi, C. C., Piervincenzi, C., Zobel, B. B., Montecchi, F. R., Dakanalis, A., . . . Carducci, F. (2017). White matter abnormalities in treatment-naive adolescents at the earliest stages of Anorexia Nervosa: A diffusion tensor imaging study. Psychiatry Res Neuroimaging, 266, 138-145. doi:10.1016/j.pscychresns.2017.06.011
Gaudio, S., & Riva, G. (2013). Body image in anorexia nervosa: The link between functional connectivity alterations and spatial reference frames. Biological Psychiatry, 73(9), e25-e26.
Gaudio, S., Wiemerslage, L., Brooks, S. J., & Schioth, H. B. (2016). A systematic review of resting-state functional-MRI studies in anorexia nervosa: Evidence for functional connectivity impairment in cognitive control and visuospatial and body-signal integration. Neurosci Biobehav Rev, 71, 578-589. doi:10.1016/j.neubiorev.2016.09.032
Germine, L., Nakayama, K., Duchaine, B. C., Chabris, C. F., Chatterjee, G., & Wilmer, J. B. (2012). Is the Web as good as the lab? Comparable performance from Web and lab in cognitive/perceptual experiments. Psychon Bull Rev, 19(5), 847-857. doi:10.3758/s13423-012-0296-9
Germine, L. T., & Hooker, C. I. (2011). Face emotion recognition is related to individual differences in psychosis-proneness. Psychol Med, 41(5), 937-947. doi:10.1017/s0033291710001571
Gibbard, C. R., Ren, J., Skuse, D. H., Clayden, J. D., & Clark, C. A. (2018). Structural connectivity of the amygdala in young adults with autism spectrum disorder. Hum Brain Mapp, 39(3), 1270-1282. doi:10.1002/hbm.23915
Giedd, J. N. (2008). The teen brain: insights from neuroimaging. J Adolesc Health, 42(4), 335-343. doi:10.1016/j.jadohealth.2008.01.007
Gillan, C. M., & Robbins, T. W. (2014). Goal-directed learning and obsessive-compulsive disorder. Philos Trans R Soc Lond B Biol Sci, 369(1655). doi:10.1098/rstb.2013.0475
Gillan, C. M., Robbins, T. W., Sahakian, B. J., van den Heuvel, O. A., & van Wingen, G. (2016). The role of habit in compulsivity. Eur Neuropsychopharmacol, 26(5), 828-840. doi:10.1016/j.euroneuro.2015.12.033
Gillberg, C. (1983). Are Autism and Anorexia Nervosa Related? British Journal of Psychiatry, 142(4), 428-428. doi:10.1192/bjp.142.4.428b
Gillberg, C., & Råstam, M. (1992). Do some cases of anorexia nervosa reflect underlying autistic-like conditions? Behav Neurol, 5(1), 27-32. doi:10.3233/BEN-1992-5105
Gillberg, I. C., Billstedt, E., Wentz, E., Anckarsater, H., Rastam, M., & Gillberg, C. (2010). Attention, executive functions, and mentalizing in anorexia nervosa eighteen years after onset of eating disorder. J Clin Exp Neuropsychol, 32(4), 358-365. doi:10.1080/13803390903066857
Gillberg, I. C., Råstam, M., & Gillberg, C. (1994). Anorexia nervosa outcome: six-year controlled longitudinal study of 51 cases including a population cohort. J Am Acad Child Adolesc Psychiatry, 33(5), 729-739. doi:10.1097/00004583-199406000-00014
Gilmore, J. H. (2010). Prenatal and neonatal brain structure and white matter maturation in children at high risk for schizophrenia. The American journal of psychiatry, 167(9), 1083.
Glashouwer, K. A., Bloot, L., Veenstra, E. M., Franken, I. H. A., & de Jong, P. J. (2014). Heightened sensitivity to punishment and reward in anorexia nervosa. Appetite, 75, 97-102. doi:https://doi.org/10.1016/j.appet.2013.12.019
Godart, N. T., Flament, M. F., Curt, F., Perdereau, F., Lang, F., Venisse, J. L., . . . Fermanian, J. (2003a). Anxiety disorders in subjects seeking treatment for eating disorders: a DSM-IV controlled study. Psychiatry Research, 117(3), 245-258. doi:https://doi.org/10.1016/S0165-1781(03)00038-6
Godart, N. T., Flament, M. F., Curt, F., Perdereau, F., Lang, F., Venisse, J. L., . . . Fermanian, J. (2003b). Anxiety disorders in subjects seeking treatment for eating disorders: a DSM-IV controlled study. Psychiatry Res, 117(3), 245-258.
263
Godart, N. T., Flament, M. F., Lecrubier, Y., & Jeammet, P. (2000). Anxiety disorders in anorexia nervosa and bulimia nervosa: co-morbidity and chronology of appearance. Eur Psychiatry, 15(1), 38-45.
Godart, N. T., Flament, M. F., Perdereau, F., & Jeammet, P. (2002). Comorbidity between eating disorders and anxiety disorders: a review. Int J Eat Disord, 32(3), 253-270. doi:10.1002/eat.10096
Goddard, E., & Treasure, J. (2013). Anxiety and Social-Emotional Processing in Eating Disorders: Examination of Family Trios. Cognitive Therapy and Research, 37(5), 890-904. doi:10.1007/s10608-013-9535-2
Godier, L. R., & Park, R. J. (2014). Compulsivity in anorexia nervosa: a transdiagnostic concept. Front Psychol, 5, 778. doi:10.3389/fpsyg.2014.00778
Goodman, R. (1997). The Strengths and Difficulties Questionnaire: a research note. Journal of child psychology and psychiatry, and allied disciplines, 38(5), 581-586.
Goodman, R. (2001). Psychometric properties of the strengths and difficulties questionnaire. Journal of the American Academy of Child and Adolescent Psychiatry, 40(11), 1337-1345. doi:10.1097/00004583-200111000-00015
Goodman, R., Ford, T., Richards, H., Gatward, R., & Meltzer, H. (2000). The Development and Well-Being Assessment: description and initial validation of an integrated assessment of child and adolescent psychopathology. Journal of child psychology and psychiatry, and allied disciplines, 41(5), 645-655.
Gottesman, II, & Gould, T. D. (2003). The endophenotype concept in psychiatry: etymology and strategic intentions. Am J Psychiatry, 160(4), 636-645. doi:10.1176/appi.ajp.160.4.636
Gottesman, II, & Shields, J. (1967). A polygenic theory of schizophrenia. Proceedings of the National Academy of Sciences of the United States of America, 58(1), 199-205.
Grahn, J. A., Parkinson, J. A., & Owen, A. M. (2008). The cognitive functions of the caudate nucleus. Progress in Neurobiology, 86(3), 141-155. doi:http://dx.doi.org/10.1016/j.pneurobio.2008.09.004
Gray, J., & McNaughton, N. (2000). The Neuropsychology of anxiety: an enquiry into the functions of the septo-hippocampal system. New York, NY: Oxford University Press.
Gray, J. A. (1970). The psychophysiological basis of introversion-extraversion. Behav Res Ther, 8(3), 249-266. doi:10.1016/0005-7967(70)90069-0
Gray, J. A. (1987). The psychology of fear and stress (Vol. 5): CUP Archive. Graybiel, A. M. (2008). Habits, rituals, and the evaluative brain. Annu Rev Neurosci, 31, 359-387.
doi:10.1146/annurev.neuro.29.051605.112851 Griffiths, S., Mitchison, D., Murray, S. B., Mond, J. M., & Bastian, B. B. (2018). How might eating
disorders stigmatization worsen eating disorders symptom severity? Evaluation of a stigma internalization model. International Journal of Eating Disorders, 51(8), 1010-1014. doi:10.1002/eat.22932
Gruner, P., & Pittenger, C. (2017). Cognitive inflexibility in Obsessive-Compulsive Disorder. Neuroscience, 345, 243-255. doi:10.1016/j.neuroscience.2016.07.030
Grönemeyer, D., & Herpertz, S. (2010). Neural correlates of viewing photographs of one's own body and another woman's body in anorexia and bulimia nervosa: an fMRI study. Journal of psychiatry & neuroscience: JPN, 35(3), 163.
Hagmann, P., Cammoun, L., Gigandet, X., Meuli, R., Honey, C. J., Wedeen, V. J., & Sporns, O. (2008). Mapping the structural core of human cerebral cortex. PLoS Biol, 6(7), e159. doi:10.1371/journal.pbio.0060159
HALMI, K. A. (1974). Comparison of demographic and clinical features in patietn groups with different ages and weights at onset of anorexia nervosa. The Journal of Nervous and Mental Disease, 158(3), 222-225.

264
Halmi, K. A., Eckert, E., Marchi, P., Sampugnaro, V., Apple, R., & Cohen, J. (1991). Comorbidity of psychiatric diagnoses in anorexia nervosa. Arch Gen Psychiatry, 48(8), 712-718. doi:10.1001/archpsyc.1991.01810320036006
Hannoun, S., Durand-Dubief, F., Confavreux, C., Ibarrola, D., Streichenberger, N., Cotton, F., . . . Sappey-Marinier, D. (2012). Diffusion tensor-MRI evidence for extra-axonal neuronal degeneration in caudate and thalamic nuclei of patients with multiple sclerosis. AJNR Am J Neuroradiol, 33(7), 1363-1368. doi:10.3174/ajnr.A2983
Happe, F., & Frith, U. (2006). The weak coherence account: detail-focused cognitive style in autism spectrum disorders. J Autism Dev Disord, 36(1), 5-25. doi:10.1007/s10803-005-0039-0
Happe, F. G., & Booth, R. D. (2008). The power of the positive: revisiting weak coherence in autism spectrum disorders. Q J Exp Psychol (Hove), 61(1), 50-63. doi:10.1080/17470210701508731
Harrison, A., O'Brien, N., Lopez, C., & Treasure, J. (2010). Sensitivity to reward and punishment in eating disorders. Psychiatry Res, 177(1-2), 1-11. doi:10.1016/j.psychres.2009.06.010
Harrison, A., Sullivan, S., Tchanturia, K., & Treasure, J. (2009). Emotion recognition and regulation in anorexia nervosa. Clin Psychol Psychother, 16(4), 348-356. doi:10.1002/cpp.628
Harrison, A., Tchanturia, K., Naumann, U., & Treasure, J. (2012). Social emotional functioning and cognitive styles in eating disorders. Br J Clin Psychol, 51(3), 261-279. doi:10.1111/j.2044-8260.2011.02026.x
Harrison, A., Tchanturia, K., & Treasure, J. (2010). Attentional bias, emotion recognition, and emotion regulation in anorexia: state or trait? Biol Psychiatry, 68(8), 755-761. doi:10.1016/j.biopsych.2010.04.037
Harrison, A., Tchanturia, K., & Treasure, J. (2011). Measuring state trait properties of detail processing and global integration ability in eating disorders. World J Biol Psychiatry, 12(6), 462-472. doi:10.3109/15622975.2010.551666
Harrison, A., Treasure, J., & Smillie, L. D. (2011). Approach and avoidance motivation in eating disorders. Psychiatry Research, 188(3), 396-401. doi:https://doi.org/10.1016/j.psychres.2011.04.022
Hayes, D. J., Lipsman, N., Chen, D. Q., Woodside, D. B., Davis, K. D., Lozano, A. M., & Hodaie, M. (2015). Subcallosal Cingulate Connectivity in Anorexia Nervosa Patients Differs From Healthy Controls: A Multi-tensor Tractography Study. Brain Stimulation, 8(4), 758-768.
He, X., Stefan, M., Terranova, K., Steinglass, J., & Marsh, R. (2016). Altered white matter microstructure in adolescents and adults with bulimia nervosa. Neuropsychopharmacology, 41(7), 1841-1848.
Hettema, J. M., Kettenmann, B., Ahluwalia, V., McCarthy, C., Kates, W. R., Schmitt, J. E., . . . Fatouros, P. (2012). Pilot multimodal twin imaging study of generalized anxiety disorder. Depress Anxiety, 29(3), 202-209. doi:10.1002/da.20901
Hindler, C. G., Crisp, A. H., McGuigan, S., & Joughin, N. (1994). Anorexia nervosa: change over time in age of onset, presentation and duration of illness. Psychological medicine, 24(3), 719-729.
Hodes, M., Timimi, S., & Robinson, P. (1997). Children of mothers with eating disorders: a preliminary study. European Eating Disorders Review, 5(1), 11-24.
Hoek, H. W. (1993). Review of the epidemiological studies of eating disorders. International Review of Psychiatry, 5(1), 61-74.
Hoek, H. W. (2014). Epidemiology of eating disorders in persons other than the high-risk group of young Western females. Curr Opin Psychiatry, 27(6), 423-425. doi:10.1097/yco.0000000000000104
Hoek, H. W., & van Hoeken, D. (2003). Review of the prevalence and incidence of eating disorders. Int J Eat Disord, 34(4), 383-396. doi:10.1002/eat.10222
265
Hoek, H. W., van Hoeken, D., & Katzman, M. A. (2003). Epidemiology and Cultural Aspects of Eating Disorders. In Eating Disorders (pp. 75-138): John Wiley & Sons, Ltd.
Hofer, S., & Frahm, J. (2006). Topography of the human corpus callosum revisited—Comprehensive fiber tractography using diffusion tensor magnetic resonance imaging. Neuroimage, 32(3), 989-994. doi:http://dx.doi.org/10.1016/j.neuroimage.2006.05.044
Hofmann, W., Gschwendner, T., Friese, M., Wiers, R. W., & Schmitt, M. (2008). Working memory capacity and self-regulatory behavior: toward an individual differences perspective on behavior determination by automatic versus controlled processes. J Pers Soc Psychol, 95(4), 962-977. doi:10.1037/a0012705
Hofmann, W., Schmeichel, B. J., & Baddeley, A. D. (2012). Executive functions and self-regulation. Trends Cogn Sci, 16(3), 174-180. doi:10.1016/j.tics.2012.01.006
Holliday, J., Tchanturia, K., Landau, S., Collier, D. A., & Treasure, J. (2005). Is impaired set-shifting an endophenotype of anorexia nervosa? Am J Psychiatry, 162. doi:10.1176/appi.ajp.162.12.2269
Horsfield, M. A., & Jones, D. K. (2002). Applications of diffusion-weighted and diffusion tensor MRI to white matter diseases - a review. NMR Biomed, 15(7-8), 570-577. doi:10.1002/nbm.787
Howard, M. A., Cowell, P. E., Boucher, J., Broks, P., Mayes, A., Farrant, A., & Roberts, N. (2000). Convergent neuroanatomical and behavioural evidence of an amygdala hypothesis of autism. Neuroreport, 11(13), 2931-2935.
Hu, S. H., Feng, H., Xu, T. T., Zhang, H. R., Zhao, Z. Y., Lai, J. B., . . . Xu, Y. (2017). Altered microstructure of brain white matter in females with anorexia nervosa: a diffusion tensor imaging study. Neuropsychiatr Dis Treat, 13, 2829-2836. doi:10.2147/NDT.S144972
Hudson, J. I., Hiripi, E., Pope, H. G., & Kessler, R. C. (2007). The Prevalence and Correlates of Eating Disorders in the National Comorbidity Survey Replication. Biological psychiatry, 61(3), 348-358. doi:10.1016/j.biopsych.2006.03.040
Hudson, J. I., Pope, H. G., Yurgelun-Todd, D., Jonas, J. M., & Frankenburg, F. R. (1987). A controlled study of lifetime prevalence of affective and other psychiatric disorders in bulimic outpatients. Am J Psychiatry, 144(10), 1283-1287. doi:10.1176/ajp.144.10.1283
Irby, S. M., & Floyd, R. G. (2013). Test Review: Wechsler Abbreviated Scale of Intelligence. Canadian Journal of School Psychology, 28(3), 295-299.
J. Fray, P., W. Robbins, T., & J. Sahakian, B. (1996). Neuorpsychiatyric applications of CANTAB. International Journal of Geriatric Psychiatry, 11(4), 329-336. doi:10.1002/(sici)1099-1166(199604)11:4<329::aid-gps453>3.0.co;2-6
Jacobi, C., Hayward, C., de Zwaan, M., Kraemer, H. C., & Agras, W. S. (2004). Coming to Terms With Risk Factors for Eating Disorders: Application of Risk Terminology and Suggestions for a General Taxonomy. Psychological Bulletin, 130(1), 19-65. doi:10.1037/0033-2909.130.1.19
Jappe, L. M., Frank, G. K. W., Shott, M. E., Rollin, M. D. H., Pryor, T., Hagman, J. O., . . . Davis, E. (2011). Heightened sensitivity to reward and punishment in anorexia nervosa. International Journal of Eating Disorders, 44(4), 317-324. doi:10.1002/eat.20815
Jbabdi, S., Behrens, T. E., & Smith, S. M. (2010). Crossing fibres in tract-based spatial statistics. Neuroimage, 49(1), 249-256. doi:10.1016/j.neuroimage.2009.08.039
Jeurissen, B., Leemans, A., Tournier, J. D., Jones, D. K., & Sijbers, J. (2013). Investigating the prevalence of complex fiber configurations in white matter tissue with diffusion magnetic resonance imaging. Hum Brain Mapp, 34(11), 2747-2766. doi:10.1002/hbm.22099
Jeurissen, B., Tournier, J. D., Dhollander, T., Connelly, A., & Sijbers, J. (2014). Multi-tissue constrained spherical deconvolution for improved analysis of multi-shell diffusion MRI data. Neuroimage, 103, 411-426. doi:10.1016/j.neuroimage.2014.07.061
266
Jones, D. K., & Cercignani, M. (2010). Twenty-five pitfalls in the analysis of diffusion MRI data. NMR Biomed, 23(7), 803-820. doi:10.1002/nbm.1543
Jones, D. K., Knösche, T. R., & Turner, R. (2013). White matter integrity, fiber count, and other fallacies: the do's and don'ts of diffusion MRI. Neuroimage, 73, 239-254. doi:10.1016/j.neuroimage.2012.06.081
Jones, D. K., & Leemans, A. (2011). Diffusion tensor imaging. Methods Mol Biol, 711, 127-144. doi:10.1007/978-1-61737-992-5_6
Joos, A., Kloppel, S., Hartmann, A., Glauche, V., Tuscher, O., Perlov, E., . . . Tebartz van Elst, L. (2010). Voxel-based morphometry in eating disorders: correlation of psychopathology with grey matter volume. Psychiatry Res, 182(2), 146-151. doi:10.1016/j.pscychresns.2010.02.004
Jurado, M. B., & Rosselli, M. (2007). The elusive nature of executive functions: a review of our current understanding. Neuropsychol Rev, 17(3), 213-233. doi:10.1007/s11065-007-9040-z
Kanakam, N., Raoult, C., Collier, D., & Treasure, J. (2013). Set shifting and central coherence as neurocognitive endophenotypes in eating disorders: a preliminary investigation in twins. World J Biol Psychiatry, 14(6), 464-475. doi:10.3109/15622975.2012.665478
Kanakam, N., & Treasure, J. (2013). A review of cognitive neuropsychiatry in the taxonomy of eating disorders: State, trait, or genetic? Cognitive neuropsychiatry, 18(1-2), 83-114.
Katzman, D. K., Zipursky, R. B., Lambe, E. K., & Mikulis, D. J. (1997). A longitudinal magnetic resonance imaging study of brain changes in adolescents with anorexia nervosa. Archives of Pediatrics and Adolescent Medicine, 151(8), 793-797.
Kaufmann, L. K., Baur, V., Hanggi, J., Jancke, L., Piccirelli, M., Kollias, S., . . . Milos, G. (2017). Fornix Under Water? Ventricular Enlargement Biases Forniceal Diffusion Magnetic Resonance Imaging Indices in Anorexia Nervosa. Biol Psychiatry Cogn Neurosci Neuroimaging, 2(5), 430-437. doi:10.1016/j.bpsc.2017.03.014
Kaye, W. H., Bulik, C. M., Thornton, L., Barbarich, N., & Masters, K. (2004). Comorbidity of anxiety disorders with anorexia and bulimia nervosa. Am J Psychiatry, 161(12), 2215-2221. doi:10.1176/appi.ajp.161.12.2215
Kaye, W. H., Fudge, J. L., & Paulus, M. (2009). New insights into symptoms and neurocircuit function of anorexia nervosa. Nat Rev Neurosci, 10(8), 573-584. doi:10.1038/nrn2682
Kaye, W. H., Wagner, A., Fudge, J. L., & Paulus, M. (2011). Neurocircuity of eating disorders. Curr Top Behav Neurosci, 6, 37-57. doi:10.1007/7854_2010_85
Kaye, W. H., Wierenga, C. E., Bailer, U. F., Simmons, A. N., & Bischoff-Grethe, A. (2013). Nothing tastes as good as skinny feels: the neurobiology of anorexia nervosa. Trends in neurosciences, 36(2), 110-120.
Kazlouski, D., Rollin, M. D., Tregellas, J., Shott, M. E., Jappe, L. M., Hagman, J. O., . . . Frank, G. K. (2011a). Altered fimbria-fornix white matter integrity in anorexia nervosa predicts harm avoidance. Psychiatry research, 192(2), 109-116. doi:10.1016/j.pscychresns.2010.12.006
Kazlouski, D., Rollin, M. D. H., Tregellas, J., Shott, M. E., Jappe, L. M., Hagman, J. O., . . . Frank, G. K. W. (2011b). Altered fimbria-fornix white matter integrity in anorexia nervosa predicts harm avoidance. Psychiatry Research - Neuroimaging, 192(2), 109-116.
Keating, C. (2010). Theoretical perspective on anorexia nervosa: the conflict of reward. Neuroscience & Biobehavioral Reviews, 34(1), 73-79.
Keating, C., Tilbrook, A. J., Rossell, S. L., Enticott, P. G., & Fitzgerald, P. B. (2012). Reward processing in anorexia nervosa. Neuropsychologia, 50(5), 567-575. doi:10.1016/j.neuropsychologia.2012.01.036
Keel, P. K., Dorer, D. J., Franko, D. L., Jackson, S. C., & Herzog, D. B. (2005). Postremission predictors of relapse in women with eating disorders. Am J Psychiatry, 162(12), 2263-2268. doi:10.1176/appi.ajp.162.12.2263
267
Keel, P. K., & Forney, K. J. (2013). Psychosocial risk factors for eating disorders. Int J Eat Disord, 46(5), 433-439. doi:10.1002/eat.22094
Keel, P. K., Klump, K. L., Miller, K. B., McGue, M., & Iacono, W. G. (2005). Shared transmission of eating disorders and anxiety disorders. International Journal of Eating Disorders, 38(2), 99-105.
Keski-Rahkonen, A., Hoek, H. W., Linna, M. S., Raevuori, A., Sihvola, E., Bulik, C. M., . . . Kaprio, J. (2009). Incidence and outcomes of bulimia nervosa: a nationwide population-based study. Psychological medicine, 39(5), 823-831. doi:10.1017/s0033291708003942
Keski-Rahkonen, A., Hoek, H. W., Susser, E. S., Linna, M. S., Sihvola, E., Raevuori, A., . . . Rissanen, A. (2007). Epidemiology and course of anorexia nervosa in the community. Am J Psychiatry, 164(8), 1259-1265. doi:10.1176/appi.ajp.2007.06081388
Keski-Rahkonen, A., Sihvola, E., Raevuori, A., Kaukoranta, J., Bulik, C. M., Hoek, H. W., . . . Kaprio, J. (2006). Reliability of self-reported eating disorders: Optimizing population screening. International Journal of Eating Disorders, 39(8), 754-762. doi:10.1002/eat.20277
Kessler, H., Schwarze, M., Filipic, S., Traue, H. C., & von Wietersheim, J. (2006). Alexithymia and facial emotion recognition in patients with eating disorders. Int J Eat Disord, 39(3), 245-251. doi:10.1002/eat.20228
Kessler, R. C., Berglund, P. A., Chiu, W. T., Deitz, A. C., Hudson, J. I., Shahly, V., . . . Xavier, M. (2013). The prevalence and correlates of binge eating disorder in the World Health Organization World Mental Health Surveys. Biol Psychiatry, 73(9), 904-914. doi:10.1016/j.biopsych.2012.11.020
Keswani, S. C. (2004). Central pontine myelinolysis associated with hypokalaemia in anorexia nervosa. J Neurol Neurosurg Psychiatry, 75(4), 663; author reply 663.
King, J. A., Geisler, D., Ritschel, F., Boehm, I., Seidel, M., Roschinski, B., . . . Ehrlich, S. (2015). Global cortical thinning in acute anorexia nervosa normalizes following long-term weight restoration. Biological Psychiatry, 77(7), 624-632.
Klostermann, F., Wahl, M., Marzinzik, F., Schneider, G. H., Kupsch, A., & Curio, G. (2006). Mental chronometry of target detection: human thalamus leads cortex. Brain, 129(Pt 4), 923-931. doi:10.1093/brain/awl014
Klump, K. L., Miller, K. B., Keel, P. K., McGue, M., & Iacono, W. G. (2001). Genetic and environmental influences on anorexia nervosa syndromes in a population-based twin sample. Psychol Med, 31(4), 737-740.
Koch, I., Gade, M., Schuch, S., & Philipp, A. M. (2010). The role of inhibition in task switching: a review. Psychon Bull Rev, 17(1), 1-14. doi:10.3758/pbr.17.1.1
Kothari, R., Barona, M., Treasure, J., & Micali, N. (2015). Social cognition in children at familial high-risk of developing an eating disorder. Front Behav Neurosci, 9, 208. doi:10.3389/fnbeh.2015.00208
Kothari, R., Barona, M., Treasure, J., & Micali, N. (Under review). Social Cognition in Children at Familial High-risk of Developing an Eating Disorder.
Kothari, R., Rosinska, M., Treasure, J., & Micali, N. (2013). The Early Cognitive Development of Children at High Risk of Developing an Eating Disorder. European Eating Disorders Review.
Kothari, R., Rosinska, M., Treasure, J., & Micali, N. (2014). The early cognitive development of children at high risk of developing an eating disorder. Eur Eat Disord Rev, 22(2), 152-156. doi:10.1002/erv.2274
Kothari, R., Solmi, F., Treasure, J., & Micali, N. (2012). The neuropsychological profile of children at high risk of developing an eating disorder. Psychological Medicine, 1, 12.
Kothari, R., Solmi, F., Treasure, J., & Micali, N. (2013a). The neuropsychological profile of children at high risk of developing an eating disorder. Psychological medicine, 43(7), 1543-1554. doi:10.1017/S0033291712002188

268
Kothari, R., Solmi, F., Treasure, J., & Micali, N. (2013b). The neuropsychological profile of children at high risk of developing an eating disorder. Psychol Med, 43(7), 1543-1554. doi:10.1017/S0033291712002188
Kravariti, E., Morris, R. G., Rabe-Hesketh, S., Murray, R. M., & Frangou, S. (2003). The Maudsley Early-Onset Schizophrenia Study: cognitive function in adolescent-onset schizophrenia. Schizophr Res, 65(2-3), 95-103.
Kringelbach, M. L., & Rolls, E. T. (2004). The functional neuroanatomy of the human orbitofrontal cortex: evidence from neuroimaging and neuropsychology. Prog Neurobiol, 72(5), 341-372. doi:10.1016/j.pneurobio.2004.03.006
Kubicki, M., McCarley, R., Westin, C. F., Park, H. J., Maier, S., Kikinis, R., . . . Shenton, M. E. (2007). A review of diffusion tensor imaging studies in schizophrenia. J Psychiatr Res, 41(1-2), 15-30. doi:10.1016/j.jpsychires.2005.05.005
Kucharska-Pietura, K., Nikolaou, V., Masiak, M., & Treasure, J. (2004). The recognition of emotion in the faces and voice of anorexia nervosa. Int J Eat Disord, 35(1), 42-47. doi:10.1002/eat.10219
Kuhnpast, N., Gramann, K., & Pollatos, O. (2012). Electrophysiologic evidence for multilevel deficits in emotional face processing in patients with bulimia nervosa. Psychosom Med, 74(7), 736-744. doi:10.1097/PSY.0b013e31825ca15a
Laird, A. R., Fox, P. M., Price, C. J., Glahn, D. C., Uecker, A. M., Lancaster, J. L., . . . Fox, P. T. (2005). ALE meta-analysis: controlling the false discovery rate and performing statistical contrasts. Hum Brain Mapp, 25(1), 155-164. doi:10.1002/hbm.20136
Lang, K., Larsson, E. E., Mavromara, L., Simic, M., Treasure, J., & Tchanturia, K. (2016). Diminished facial emotion expression and associated clinical characteristics in Anorexia Nervosa. Psychiatry Res, 236, 165-172. doi:10.1016/j.psychres.2015.12.004
Lang, K., Lopez, C., Stahl, D., Tchanturia, K., & Treasure, J. (2014). Central coherence in eating disorders: an updated systematic review and meta-analysis. World J Biol Psychiatry, 15(8), 586-598. doi:10.3109/15622975.2014.909606
Lang, K., Roberts, M., Harrison, A., Lopez, C., Goddard, E., Khondoker, M., . . . Tchanturia, K. (2016). Central Coherence in Eating Disorders: A Synthesis of Studies Using the Rey Osterrieth Complex Figure Test. PLoS One, 11(11), e0165467. doi:10.1371/journal.pone.0165467
Lang, K., Stahl, D., Espie, J., Treasure, J., & Tchanturia, K. (2014). Set shifting in children and adolescents with anorexia nervosa: an exploratory systematic review and meta-analysis. Int J Eat Disord, 47(4), 394-399. doi:10.1002/eat.22235
Lang, K., Treasure, J., & Tchanturia, K. (2016). Is inefficient cognitive processing in anorexia nervosa a familial trait? A neuropsychological pilot study of mothers of offspring with a diagnosis of anorexia nervosa. World J Biol Psychiatry, 17(4), 258-265. doi:10.3109/15622975.2015.1112035
Lask, B., Waugh, R., & Gordon, I. (1997). Childhood‐onset Anorexia Nervosa Is a Serious Illness. Annals of the New York Academy of Sciences, 817(1), 120-126.
Lassek, A. M. (1942). The human pyramidal tract. IV. A study of the mature, myelinated fibers of the pyramid. The Journal of Comparative Neurology, 76(2), 217-225. doi:10.1002/cne.900760203
Le Bihan, D., & Johansen-Berg, H. (2012). Diffusion MRI at 25: exploring brain tissue structure and function. Neuroimage, 61(2), 324-341.
Le Bihan, D., Mangin, J. F., Poupon, C., Clark, C. A., Pappata, S., Molko, N., & Chabriat, H. (2001). Diffusion tensor imaging: concepts and applications. J Magn Reson Imaging, 13(4), 534-546.
LeDoux, J. (2007). The amygdala. Curr Biol, 17(20), R868-874. doi:10.1016/j.cub.2007.08.005 LeDoux, J. E. (2000). Emotion circuits in the brain. Annu Rev Neurosci, 23, 155-184.
doi:10.1146/annurev.neuro.23.1.155
269
Lee, S. W., Stewart, S. M., Striegel-Moore, R. H., Lee, S., Ho, S.-y., Lee, P. W. H., . . . Lam, T.-h. (2007). Validation of the eating disorder diagnostic scale for use with Hong Kong adolescents. International Journal of Eating Disorders, 40(6), 569-574. doi:10.1002/eat.20413
Legenbauer, T., Vocks, S., & Ruddel, H. (2008). Emotion recognition, emotional awareness and cognitive bias in individuals with bulimia nervosa. J Clin Psychol, 64(6), 687-702. doi:10.1002/jclp.20483
Lenroot, R. K., Gogtay, N., Greenstein, D. K., Wells, E. M., Wallace, G. L., Clasen, L. S., . . . Giedd, J. N. (2007). Sexual dimorphism of brain developmental trajectories during childhood and adolescence. Neuroimage, 36(4), 1065-1073. doi:10.1016/j.neuroimage.2007.03.053
Leppanen, J., Dapelo, M. M., Davies, H., Lang, K., Treasure, J., & Tchanturia, K. (2017). Computerised analysis of facial emotion expression in eating disorders. PLoS One, 12(6), e0178972. doi:10.1371/journal.pone.0178972
Leppanen, J., Sedgewick, F., Treasure, J., & Tchanturia, K. (2018). Differences in the Theory of Mind profiles of patients with anorexia nervosa and individuals on the autism spectrum: A meta-analytic review. Neurosci Biobehav Rev, 90, 146-163. doi:10.1016/j.neubiorev.2018.04.009
Leverton, T. J. (2003). Parental psychiatric illness: the implications for children. Current Opinion in Psychiatry, 16(4), 395-402.
Levinson, C. A., & Rodebaugh, T. L. (2016). Clarifying the prospective relationships between social anxiety and eating disorder symptoms and underlying vulnerabilities. Appetite, 107, 38-46.
Levinson, C. A., Zerwas, S. C., Brosof, L. C., Thornton, L. M., Strober, M., Pivarunas, B., . . . Bulik, C. M. (2019). Associations between dimensions of anorexia nervosa and obsessive-compulsive disorder: An examination of personality and psychological factors in patients with anorexia nervosa. Eur Eat Disord Rev, 27(2), 161-172. doi:10.1002/erv.2635
Lezak, M. (2007). Neuropsychological Assessment. Oxford, UK: Oxford University Press. Lilenfeld, L. R., Kaye, W. H., Greeno, C. G., Merikangas, K. R., Plotnicov, K., Pollice, C., . . . Nagy, L.
(1998). A controlled family study of anorexia nervosa and bulimia nervosa: psychiatric disorders in first-degree relatives and effects of proband comorbidity. Arch Gen Psychiatry, 55(7), 603-610.
Lilenfeld, L. R. R., Wonderlich, S., Riso, L. P., Crosby, R., & Mitchell, J. (2006). Eating disorders and personality: A methodological and empirical review. Clinical Psychology Review, 26(3), 299-320. doi:http://doi.org/10.1016/j.cpr.2005.10.003
Lindner, S. E., Fichter, M. M., & Quadflieg, N. (2014). Set-shifting and its relation to clinical and personality variables in full recovery of anorexia nervosa. Eur Eat Disord Rev, 22(4), 252-259. doi:10.1002/erv.2293
Lloyd, E. C., Frampton, I., Verplanken, B., & Haase, A. M. (2017). How extreme dieting becomes compulsive: A novel hypothesis for the role of anxiety in the development and maintenance of anorexia nervosa. Med Hypotheses, 108, 144-150. doi:10.1016/j.mehy.2017.09.001
Lopez, C., Roberts, M., & Treasure, J. (2009). Biomarkers and Endophenotypes in Eating Disorders. In M. S. Ritsner (Ed.), The Handbook of Neuropsychiatric Biomarkers, Endophenotypes and Genes: Neuropsychological Endophenotypes and Biomarkers (pp. 227-237). Dordrecht: Springer Netherlands.
Lopez, C., Stahl, D., & Tchanturia, K. (2010). Estimated intelligence quotient in anorexia nervosa: a systematic review and meta-analysis of the literature. Annals of General Psychiatry, 9(1), 1-10. doi:10.1186/1744-859x-9-40
Lopez, C., Tchanturia, K., Stahl, D., Booth, R., Holliday, J., & Treasure, J. (2008). An examination of the concept of central coherence in women with anorexia nervosa. Int J Eat Disord, 41. doi:10.1002/eat.20478
270
Lopez, C., Tchanturia, K., Stahl, D., & Treasure, J. (2008). Central coherence in eating disorders: a systematic review. Psychol Med, 38. doi:10.1017/s0033291708003486
Lopez, C., Tchanturia, K., Stahl, D., & Treasure, J. (2009). Weak central coherence in eating disorders: a step towards looking for an endophenotype of eating disorders. J Clin Exp Neuropsychol, 31(1), 117-125. doi:10.1080/13803390802036092
Loxton, N. J., & Dawe, S. (2001). Alcohol abuse and dysfunctional eating in adolescent girls: the influence of individual differences in sensitivity to reward and punishment. Int J Eat Disord, 29(4), 455-462.
Lozano, R., Naghavi, M., Foreman, K., Lim, S., Shibuya, K., Aboyans, V., . . . Murray, C. J. L. (2012). Global and regional mortality from 235 causes of death for 20 age groups in 1990 and 2010: a systematic analysis for the Global Burden of Disease Study 2010. The Lancet, 380(9859), 2095-2128. doi:http://dx.doi.org/10.1016/S0140-6736(12)61728-0
Luciana, M. (2003). Practitioner review: computerized assessment of neuropsychological function in children: clinical and research applications of the Cambridge Neuropsychological Testing Automated Battery (CANTAB). J Child Psychol Psychiatry, 44(5), 649-663.
Lupien, S. J., McEwen, B. S., Gunnar, M. R., & Heim, C. (2009). Effects of stress throughout the lifespan on the brain, behaviour and cognition. Nat Rev Neurosci, 10(6), 434-445. doi:10.1038/nrn2639
Luyster, R. J. (2011). Neural correlates of familiar and unfamiliar face processing in infants at risk for autism spectrum disorders. Brain topography, 24(3-4), 220.
Macintosh, B. J., & Graham, S. J. (2013). Magnetic resonance imaging to visualize stroke and characterize stroke recovery: a review. Front Neurol, 4, 60. doi:10.3389/fneur.2013.00060
MacKinnon, D. P., & Dwyer, J. H. (1993). Estimating mediated effects in prevention studies. Evaluation review, 17(2), 144-158.
Madden, S., Morris, A., Zurynski, Y. A., Kohn, M., & Elliot, E. J. (2009). Burden of eating disorders in 5-13-year-old children in Australia. Med J Aust, 190(8), 410-414.
Makovac, E., Meeten, F., Watson, D. R., Garfinkel, S. N., Critchley, H. D., & Ottaviani, C. (2016). Neurostructural abnormalities associated with axes of emotion dysregulation in generalized anxiety. Neuroimage Clin, 10, 172-181. doi:10.1016/j.nicl.2015.11.022
Makris, N., Kennedy, D. N., McInerney, S., Sorensen, A. G., Wang, R., Caviness, V. S., & Pandya, D. N. (2005). Segmentation of subcomponents within the superior longitudinal fascicle in humans: a quantitative, in vivo, DT-MRI study. Cereb Cortex, 15(6), 854-869. doi:10.1093/cercor/bhh186
Mandy, W., & Tchanturia, K. (2015). Do women with eating disorders who have social and flexibility difficulties really have autism? A case series. Molecular Autism, 6(1), 6. doi:10.1186/2040-2392-6-6
Marshall, W. A., & Tanner, J. M. (1969). Variations in pattern of pubertal changes in girls. Archives of Disease in Childhood, 44(235), 291-303.
Martin Monzon, B., Hay, P., Foroughi, N., & Touyz, S. (2016). White matter alterations in anorexia nervosa: A systematic review of diffusion tensor imaging studies. World J Psychiatry, 6(1), 177-186. doi:10.5498/wjp.v6.i1.177
Mazzeo, S. E., & Bulik, C. M. (2009). Environmental and genetic risk factors for eating disorders: what the clinician needs to know. Child and adolescent psychiatric clinics of North America, 18(1), 67-82.
McAdams, C. J., & Smith, W. (2015). Neural correlates of eating disorders: translational potential. Neurosci Neuroecon, 4, 35-49. doi:10.2147/nan.s76699
McAlonan, K., & Brown, V. J. (2003). Orbital prefrontal cortex mediates reversal learning and not attentional set shifting in the rat. Behav Brain Res, 146(1-2), 97-103. doi:10.1016/j.bbr.2003.09.019
271
McCormick, L. M., Keel, P. K., Brumm, M. C., Bowers, W., Swayze, V., Andersen, A., & Andreasen, N. (2008). Implications of starvation-induced change in right dorsal anterior cingulate volume in anorexia nervosa. Int J Eat Disord, 41. doi:10.1002/eat.20549
McGivern, R. F., Andersen, J., Byrd, D., Mutter, K. L., & Reilly, J. (2002). Cognitive efficiency on a match to sample task decreases at the onset of puberty in children. Brain Cogn, 50(1), 73-89.
McLeod, B. D., Wood, J. J., & Weisz, J. R. (2007). Examining the association between parenting and childhood anxiety: a meta-analysis. Clin Psychol Rev, 27(2), 155-172. doi:10.1016/j.cpr.2006.09.002
McNaughton, N., & Corr, P. J. (2004). A two-dimensional neuropsychology of defense: fear/anxiety and defensive distance. Neurosci Biobehav Rev, 28(3), 285-305. doi:10.1016/j.neubiorev.2004.03.005
Melloni, M., Urbistondo, C., Sedeno, L., Gelormini, C., Kichic, R., & Ibanez, A. (2012). The extended fronto-striatal model of obsessive compulsive disorder: convergence from event-related potentials, neuropsychology and neuroimaging. Front Hum Neurosci, 6, 259. doi:10.3389/fnhum.2012.00259
Mendlewicz, L., Linkowski, P., Bazelmans, C., & Philippot, P. (2005). Decoding emotional facial expressions in depressed and anorexic patients. J Affect Disord, 89(1-3), 195-199. doi:10.1016/j.jad.2005.07.010
Mettler, L. N., Shott, M., Rollin, M., & Frank, G. (2012). White matter integrity in insula and fornix implicated in bulimia nervosa nervosa. Journal of Investigative Medicine, 60 (1), 166.
Mettler, L. N., Shott, M. E., Pryor, T., Yang, T. T., & Frank, G. K. (2013). White matter integrity is reduced in bulimia nervosa. Int J Eat Disord, 46(3), 264-273.
Micali, N., De Stavola, B., dos‐Santos‐Silva, I., Steenweg‐de Graaff, J., Jansen, P., Jaddoe, V., . . . Tiemeier, H. (2012). Perinatal outcomes and gestational weight gain in women with eating disorders: a population‐based cohort study. BJOG: An International Journal of Obstetrics & Gynaecology, 119(12), 1493-1502.
Micali, N., De Stavola, B., Ploubidis, G. B., Simonoff, E., & Treasure, J. (2014). The effects of maternal eating disorders on offspring childhood and early adolescent psychiatric disorders. International Journal of Eating Disorders, 47(4), 385-393. doi:10.1002/eat.22216
Micali, N., De Stavola, B., Ploubidis, G. B., Simonoff, E., & Treasure, J. (2014). The effects of maternal eating disorders on offspring childhood and early adolescent psychiatric disorders. Int J Eat Disord, 47(4), 385-393. doi:10.1002/eat.22216
Micali, N., Hilton, K., Nakatani, E., Heyman, I., Turner, C., & Mataix-Cols, D. (2011). Is childhood OCD a risk factor for eating disorders later in life? A longitudinal study. Psychol Med, 41(12), 2507-2513. doi:10.1017/s003329171100078x
Micali, N., Martini, M. G., Thomas, J. J., Eddy, K. T., Kothari, R., Russell, E., . . . Treasure, J. (2017). Lifetime and 12-month prevalence of eating disorders amongst women in mid-life: a population-based study of diagnoses and risk factors. BMC Med, 15(1), 12. doi:10.1186/s12916-016-0766-4
Micali, N., Simonoff, E., Stahl, D., & Treasure, J. (2011). Maternal eating disorders and infant feeding difficulties: maternal and child mediators in a longitudinal general population study. Journal of child psychology and psychiatry, and allied disciplines, 52(7), 800-807. doi:10.1111/j.1469-7610.2010.02341.x
Micali, N., Simonoff, E., & Treasure, J. (2007). Risk of major adverse perinatal outcomes in women with eating disorders. The British Journal of Psychiatry, 190(3), 255-259.
Micali, N., Simonoff, E., & Treasure, J. (2009). Infant feeding and weight in the first year of life in babies of women with eating disorders. The Journal of pediatrics, 154(1), 55-60. e51.
272
Micali, N., Stahl, D., Treasure, J., & Simonoff, E. (2013). Childhood psychopathology in children of women with eating disorders: understanding risk mechanisms. Journal of child psychology and psychiatry, and allied disciplines. doi:10.1111/jcpp.12112
Micali, N., Stahl, D., Treasure, J., & Simonoff, E. (2014). Childhood psychopathology in children of women with eating disorders: understanding risk mechanisms. J Child Psychol Psychiatry, 55(2), 124-134. doi:10.1111/jcpp.12112
Micali, N., Stavola, B., Ploubidis, G. B., Simonoff, E., & Treasure, J. (2013). The effects of maternal eating disorders on offspring childhood and early adolescent psychiatric disorders. International Journal of Eating Disorders.
Micali, N., Stemann Larsen, P., Strandberg-Larsen, K., & Nybo Andersen, A. M. (2015). Size at birth and preterm birth in women with lifetime eating disorders: a prospective population-based study. Bjog. doi:10.1111/1471-0528.13825
Milad, M. R., & Rauch, S. L. (2012). Obsessive-compulsive disorder: beyond segregated cortico-striatal pathways. Trends in cognitive sciences, 16(1), 43-51.
Milos, G., Spindler, A., Schnyder, U., & Fairburn, C. G. (2005). Instability of eating disorder diagnoses: prospective study (Vol. 187).
Miyake, Y., Okamoto, Y., Onoda, K., Kurosaki, M., Shirao, N., Okamoto, Y., & Yamawaki, S. (2010). Brain activation during the perception of distorted body images in eating disorders. Psychiatry Research: Neuroimaging, 181(3), 183-192.
Miyake, Y., Okamoto, Y., Onoda, K., Shirao, N., Otagaki, Y., & Yamawaki, S. (2010). Neural processing of negative word stimuli concerning body image in patients with eating disorders: an fMRI study. Neuroimage, 50(3), 1333-1339. doi:10.1016/j.neuroimage.2009.12.095
Moher, D., Liberati, A., Tetzlaff, J., & Altman, D. G. (2009). Preferred reporting items for systematic reviews and meta-analyses: the PRISMA statement. BMJ, 339. doi:10.1136/bmj.b2535
Mohr, H. M., Zimmermann, J., Röder, C., Lenz, C., Overbeck, G., & Grabhorn, R. (2010). Separating two components of body image in anorexia nervosa using fMRI. Psychological medicine, 40(9), 1519-1529.
Molofsky, A. V., Krenick, R., Ullian, E., Tsai, H.-h., Deneen, B., Richardson, W. D., . . . Rowitch, D. H. (2012). Astrocytes and disease: a neurodevelopmental perspective. Genes & development, 26(9), 891-907.
Monroe, S. M., & Simons, A. D. (1991). Diathesis-stress theories in the context of life stress research: implications for the depressive disorders. Psychol Bull, 110(3), 406-425.
Morris, S. E., & Cuthbert, B. N. (2012). Research Domain Criteria: cognitive systems, neural circuits, and dimensions of behavior. Dialogues Clin Neurosci, 14(1), 29-37.
Muhlau, M., Gaser, C., Ilg, R., Conrad, B., Leibl, C., Cebulla, M. H., . . . Nunnemann, S. (2007). Gray matter decrease of the anterior cingulate cortex in anorexia nervosa. American Journal of Psychiatry, 164(12), 1850-1857.
Murphy, D. L., Timpano, K. R., Wheaton, M. G., Greenberg, B. D., & Miguel, E. C. (2010). Obsessive-compulsive disorder and its related disorders: a reappraisal of obsessive-compulsive spectrum concepts. Dialogues Clin Neurosci, 12(2), 131-148.
Mustelin, L., Silén, Y., Raevuori, A., Hoek, H. W., Kaprio, J., & Keski-Rahkonen, A. (2016). The DSM-5 diagnostic criteria for anorexia nervosa may change its population prevalence and prognostic value. J Psychiatr Res, 77, 85-91. doi:http://dx.doi.org/10.1016/j.jpsychires.2016.03.003
Myers, A., & Sowden, P. T. (2008). Your hand or mine? The extrastriate body area. Neuroimage, 42(4), 1669-1677. doi:10.1016/j.neuroimage.2008.05.045
Nagahara, Y., Nakamae, T., Nishizawa, S., Mizuhara, Y., Moritoki, Y., Wada, Y., . . . Fukui, K. (2014). A tract-based spatial statistics study in anorexia nervosa: abnormality in the
273
fornix and the cerebellum. Prog Neuropsychopharmacol Biol Psychiatry, 51, 72-77. doi:10.1016/j.pnpbp.2014.01.009
Naor-Ziv, R., & Glicksohn, J. (2016). Investigating Cognitive Deficits as Risk Factors for Developing Eating Disorders During Adolescence. Dev Neuropsychol, 41(1-2), 107-124. doi:10.1080/87565641.2016.1170129
Nazar, B. P., Pinna, C. M. d. S., Coutinho, G., Segenreich, D., Duchesne, M., Appolinario, J. C., & Mattos, P. (2008). Review of literature of attention-deficit/hyperactivity disorder with comorbid eating disorders. Revista Brasileira de Psiquiatria, 30(4), 384-389.
Nelson, E. E., Leibenluft, E., McClure, E. B., & Pine, D. S. (2005). The social re-orientation of adolescence: a neuroscience perspective on the process and its relation to psychopathology. Psychol Med, 35(2), 163-174. doi:10.1017/s0033291704003915
Niclasen, J. SDQ Danish cut off scores: 5-7-year-olds. Niclasen, J., Teasdale, T. W., Andersen, A.-M. N., Skovgaard, A. M., Elberling, H., & Obel, C.
(2012). Psychometric properties of the Danish Strength and Difficulties Questionnaire: the SDQ assessed for more than 70,000 raters in four different cohorts. PloS one, 7(2), e32025.
Nico, D., Daprati, E., Nighoghossian, N., Carrier, E., Duhamel, J. R., & Sirigu, A. (2010). The role of the right parietal lobe in anorexia nervosa. Psychol Med, 40(9), 1531-1539. doi:10.1017/s0033291709991851
Nowakowski, M. E., McFarlane, T., & Cassin, S. (2013). Alexithymia and eating disorders: a critical review of the literature. J Eat Disord, 1, 21. doi:10.1186/2050-2974-1-21
Nunn, K., Frampton, I., Gordon, I., & Lask, B. (2008). The fault is not in her parents but in her insula—A neurobiological hypothesis of anorexia nervosa. European Eating Disorders Review, 16(5), 355-360. doi:10.1002/erv.890
O'Doherty, J., Dayan, P., Schultz, J., Deichmann, R., Friston, K., & Dolan, R. J. (2004). Dissociable roles of ventral and dorsal striatum in instrumental conditioning. Science, 304(5669), 452-454. doi:10.1126/science.1094285
O'Hara, C. B., Campbell, I. C., & Schmidt, U. (2015). A reward-centred model of anorexia nervosa: a focussed narrative review of the neurological and psychophysiological literature. Neurosci Biobehav Rev, 52, 131-152. doi:10.1016/j.neubiorev.2015.02.012
O'Reilly, R. C. (2006). Biologically based computational models of high-level cognition. Science, 314(5796), 91-94. doi:10.1126/science.1127242
Ochsner, K. N. (2008). The social-emotional processing stream: five core constructs and their translational potential for schizophrenia and beyond. Biol Psychiatry, 64(1), 48-61. doi:10.1016/j.biopsych.2008.04.024
Olderbak, S., Wilhelm, O., Olaru, G., Geiger, M., Brenneman, M. W., & Roberts, R. D. (2015). A psychometric analysis of the reading the mind in the eyes test: toward a brief form for research and applied settings. Front Psychol, 6, 1503. doi:10.3389/fpsyg.2015.01503
Oldershaw, A., Hambrook, D., Stahl, D., Tchanturia, K., Treasure, J., & Schmidt, U. (2011). The socio-emotional processing stream in Anorexia Nervosa. Neuroscience & Biobehavioral Reviews, 35(3), 970-988. doi:http://dx.doi.org/10.1016/j.neubiorev.2010.11.001
Oldershaw, A., Hambrook, D., Tchanturia, K., Treasure, J., & Schmidt, U. (2010). Emotional theory of mind and emotional awareness in recovered anorexia nervosa patients. Psychosom Med, 72(1), 73-79. doi:10.1097/PSY.0b013e3181c6c7ca
Oldershaw, A., Lavender, T., & Schmidt, U. (2018). Are socio-emotional and neurocognitive functioning predictors of therapeutic outcomes for adults with anorexia nervosa? European Eating Disorders Review, 26(4), 346-359. doi:10.1002/erv.2602
Olivo, G., Swenne, I., Zhukovsky, C., Tuunainen, A. K., Saaid, A., Salonen-Ros, H., . . . Schiöth, H. B. (2019). Preserved white matter microstructure in adolescent patients with atypical anorexia nervosa. Int J Eat Disord, 52(2), 166-174. doi:10.1002/eat.23012

274
Olivo, G., Wiemerslage, L., Swenne, I., Zhukowsky, C., Salonen-Ros, H., Larsson, E. M., . . . Schiöth, H. B. (2017). Limbic-thalamo-cortical projections and reward-related circuitry integrity affects eating behavior: A longitudinal DTI study in adolescents with restrictive eating disorders. PLoS One, 12(3), e0172129. doi:10.1371/journal.pone.0172129
Olsen, J., Melbye, M., Olsen, S. F., Sørensen, T. I., Aaby, P., Andersen, A.-M. N., . . . Schow, T. B. (2001). The Danish National Birth Cohort-its background, structure and aim. Scandinavian journal of public health, 29(4), 300-307.
Organization, W. H. (1992). The ICD‐10 classification of mental and behavioural disorders:
clinical descriptions and diagnostic guidelines. Geneva. Panatier, A., & Robitaille, R. (2012). Astrocyte, a key partner of neurons during basal synaptic
transmission. Medecine sciences: M/S, 28(6-7), 582. Park, H. R., Lee, J. M., Moon, H. E., Lee, D. S., Kim, B.-N., Kim, J., . . . Paek, S. H. (2016). A short
review on the current understanding of autism spectrum disorders. Experimental neurobiology, 25(1), 1-13.
Patenaude, B., Smith, S. M., Kennedy, D. N., & Jenkinson, M. (2011). A Bayesian model of shape and appearance for subcortical brain segmentation. Neuroimage, 56(3), 907-922. doi:10.1016/j.neuroimage.2011.02.046
Paus, T. (2010). Growth of white matter in the adolescent brain: myelin or axon? Brain Cogn, 72(1), 26-35. doi:10.1016/j.bandc.2009.06.002
Paus, T., Zijdenbos, A., Worsley, K., Collins, D. L., Blumenthal, J., Giedd, J. N., . . . Evans, A. C. (1999). Structural maturation of neural pathways in children and adolescents: in vivo study. Science, 283(5409), 1908-1911. doi:10.1126/science.283.5409.1908
Perdereau, F., Faucher, S., Jeammet, P., & Godart, N. T. (2007). [Mood and anxiety disorders in relatives of anorexia nervosa patients: a review]. Encephale, 33(2), 144-155.
Perlaki, G., Horvath, R., Nagy, S. A., Bogner, P., Doczi, T., Janszky, J., & Orsi, G. (2017). Comparison of accuracy between FSL's FIRST and Freesurfer for caudate nucleus and putamen segmentation. Sci Rep, 7(1), 2418. doi:10.1038/s41598-017-02584-5
Pessoa, L., & Adolphs, R. (2010). Emotion processing and the amygdala: from a 'low road' to 'many roads' of evaluating biological significance. Nat Rev Neurosci, 11(11), 773-783. doi:10.1038/nrn2920
Peterson, B. S., Warner, V., Bansal, R., Zhu, H., Hao, X., Liu, J., . . . Weissman, M. M. (2009). Cortical thinning in persons at increased familial risk for major depression. Proceedings of the National Academy of Sciences, 106(15), 6273-6278. doi:10.1073/pnas.0805311106
Peñas‐Lledó, E., Vaz Leal, F. J., & Waller, G. (2002). Excessive exercise in anorexia nervosa and bulimia nervosa: relation to eating characteristics and general psychopathology. International Journal of Eating Disorders, 31(4), 370-375.
Pfuhl, G., King, J. A., Geisler, D., Roschinski, B., Ritschel, F., Seidel, M., . . . Ehrlich, S. (2016). Preserved white matter microstructure in young patients with anorexia nervosa? Human Brain Mapping, No Pagination Specified.
Phillipou, A., Castle, D. J., Abel, L. A., Gurvich, C., & Rossell, S. L. (2018). An Overlooked Brain Region in the Aetiology of Anorexia Nervosa: The Importance of Behaviourally Driven Neuroimaging Analysis. J Exp Neurosci, 12, 1179069518820068. doi:10.1177/1179069518820068
Phillipou, A., Rossell, S. L., & Castle, D. J. (2014). The neurobiology of anorexia nervosa: a systematic review. Aust N Z J Psychiatry, 48(2), 128-152. doi:10.1177/0004867413509693
Phillips, M. L., Drevets, W. C., Rauch, S. L., & Lane, R. (2003a). Neurobiology of emotion perception I: The neural basis of normal emotion perception. Biol Psychiatry, 54(5), 504-514.
275
Phillips, M. L., Drevets, W. C., Rauch, S. L., & Lane, R. (2003b). Neurobiology of emotion perception II: Implications for major psychiatric disorders. Biol Psychiatry, 54(5), 515-528.
Phillips, R. G., & LeDoux, J. E. (1992). Differential contribution of amygdala and hippocampus to cued and contextual fear conditioning. Behav Neurosci, 106(2), 274-285. doi:10.1037//0735-7044.106.2.274
Plassmann, H., O'Doherty, J. P., & Rangel, A. (2010). Appetitive and aversive goal values are encoded in the medial orbitofrontal cortex at the time of decision making. J Neurosci, 30(32), 10799-10808. doi:10.1523/jneurosci.0788-10.2010
Pollatos, O., Herbert, B. M., Schandry, R., & Gramann, K. (2008). Impaired central processing of emotional faces in anorexia nervosa. Psychosom Med, 70(6), 701-708. doi:10.1097/PSY.0b013e31817e41e6
Pruis, T. A., Keel, P. K., & Janowsky, J. S. (2012). Recovery from anorexia nervosa includes neural compensation for negative body image. Int J Eat Disord, 45(8), 919-931. doi:10.1002/eat.22034
Puhl, R., & Suh, Y. (2015). Stigma and eating and weight disorders. Curr Psychiatry Rep, 17(3), 552. doi:10.1007/s11920-015-0552-6
Qin, S., Young, C. B., Duan, X., Chen, T., Supekar, K., & Menon, V. (2014). Amygdala subregional structure and intrinsic functional connectivity predicts individual differences in anxiety during early childhood. Biol Psychiatry, 75(11), 892-900. doi:10.1016/j.biopsych.2013.10.006
Radua, J., & Mataix-Cols, D. (2009). Voxel-wise meta-analysis of grey matter changes in obsessive-compulsive disorder. Br J Psychiatry, 195(5), 393-402. doi:10.1192/bjp.bp.108.055046
Radua, J., Mataix-Cols, D., Phillips, M. L., El-Hage, W., Kronhaus, D. M., Cardoner, N., & Surguladze, S. (2012). A new meta-analytic method for neuroimaging studies that combines reported peak coordinates and statistical parametric maps. Eur Psychiatry, 27(8), 605-611. doi:10.1016/j.eurpsy.2011.04.001
Radua, J., Via, E., Catani, M., & Mataix-Cols, D. (2011). Voxel-based meta-analysis of regional white-matter volume differences in autism spectrum disorder versus healthy controls. Psychological medicine, 41(7), 1539-1550. doi:10.1017/S0033291710002187
Raevuori, A., Keski-Rahkonen, A., & Hoek, H. W. (2014). A review of eating disorders in males. Curr Opin Psychiatry, 27(6), 426-430. doi:10.1097/yco.0000000000000113
Ramírez, N., Arranz, B., Martín, C., & San, L. (2007). [Course and prognosis of a case of central pontine myelinolysis in eating behavior disorder]. Actas Esp Psiquiatr, 35(2), 141-144.
Rane, S., Plassard, A., Landman, B. A., Claassen, D. O., & Donahue, M. J. (2017). Comparison of Cortical and Subcortical Measurements in Normal Older Adults across Databases and Software Packages. J Alzheimers Dis Rep, 1(1), 59-70. doi:10.3233/adr-170008
Rastam, M., & Gillberg, C. (1992). Background factors in anorexia nervosa : A controlled study of 51 teenage cases including a population sample. Eur Child Adolesc Psychiatry, 1(1), 54-65. doi:10.1007/bf02084434
Rauch, S. L., Milad, M. R., Orr, S. P., Quinn, B. T., Fischl, B., & Pitman, R. K. (2005). Orbitofrontal thickness, retention of fear extinction, and extraversion. Neuroreport, 16(17), 1909-1912. doi:10.1097/01.wnr.0000186599.66243.50
Rauch, S. L., Shin, L. M., & Wright, C. I. (2003). Neuroimaging studies of amygdala function in anxiety disorders. Annals of the New York Academy of Sciences, 985(1), 389-410.
Reba-Harrelson, L., Von Holle, A., Hamer, R. M., Torgersen, L., Reichborn-Kjennerud, T., & Bulik, C. M. (2010). Patterns of maternal feeding and child eating associated with eating disorders in the Norwegian Mother and Child Cohort Study (MoBa). Eating behaviors, 11(1), 54-61.
276
Rey, A. (1941). L'examen psychologique dans les cas d'encéphalopathie traumatique.(Les problems.). Archives de psychologie.
Robbins, T. W., Gillan, C. M., Smith, D. G., de Wit, S., & Ersche, K. D. (2012). Neurocognitive endophenotypes of impulsivity and compulsivity: towards dimensional psychiatry. Trends Cogn Sci, 16(1), 81-91. doi:10.1016/j.tics.2011.11.009
Roberto, C. A., Mayer, L. E. S., Brickman, A. M., Barnes, A., Muraskin, J., Yeung, L. K., . . . Walsh, B. T. (2011). Brain tissue volume changes following weight gain in adults with anorexia nervosa. International Journal of Eating Disorders, 44(5), 406-411.
Roberts, M. E., Tchanturia, K., Stahl, D., Southgate, L., & Treasure, J. (2007). A systematic review and meta-analysis of set shifting ability in eating disorders. Psychol Med, 37. doi:10.1017/s0033291707009877
Roberts, M. E., Tchanturia, K., & Treasure, J. L. (2010). Exploring the neurocognitive signature of poor set-shifting in anorexia and bulimia nervosa. J Psychiatr Res, 44(14), 964-970. doi:10.1016/j.jpsychires.2010.03.001
Roberts, M. E., Tchanturia, K., & Treasure, J. L. (2013). Is attention to detail a similarly strong candidate endophenotype for anorexia nervosa and bulimia nervosa? World J Biol Psychiatry, 14(6), 452-463. doi:10.3109/15622975.2011.639804
Rojas, D. C., Smith, J. A., Benkers, T. L., Camou, S. L., Reite, M. L., & Rogers, S. J. (2004). Hippocampus and amygdala volumes in parents of children with autistic disorder. Am J Psychiatry, 161(11), 2038-2044. doi:10.1176/appi.ajp.161.11.2038
Rolls, B. J., Rolls, E. T., Rowe, E. A., & Sweeney, K. (1981). Sensory specific satiety in man. Physiol Behav, 27(1), 137-142. doi:10.1016/0031-9384(81)90310-3
Rosenvinge, J. H., & Pettersen, G. (2014). Epidemiology of eating disorders part II: an update with a special reference to the DSM-5. Advances in Eating Disorders: Theory, Research and Practice(ahead-of-print), 1-23.
Rotge, J. Y., Guehl, D., Dilharreguy, B., Tignol, J., Bioulac, B., Allard, M., . . . Aouizerate, B. (2009). Meta-analysis of brain volume changes in obsessive-compulsive disorder. Biol Psychiatry, 65(1), 75-83. doi:10.1016/j.biopsych.2008.06.019
Roy, A. K., Shehzad, Z., Margulies, D. S., Kelly, A. M., Uddin, L. Q., Gotimer, K., . . . Milham, M. P. (2009). Functional connectivity of the human amygdala using resting state fMRI. Neuroimage, 45(2), 614-626. doi:10.1016/j.neuroimage.2008.11.030
Russell, T. A., Schmidt, U., Doherty, L., Young, V., & Tchanturia, K. (2009). Aspects of social cognition in anorexia nervosa: Affective and cognitive theory of mind. Psychiatry research, 168(3), 181-185. doi:http://dx.doi.org/10.1016/j.psychres.2008.10.028
Råstam, M. (2008). Eating disturbances in autism spectrum disorders with focus on adolescent and adult years. Clinical Neuropsychiatry: Journal of Treatment Evaluation.
Sato, Y., Saito, N., Utsumi, A., Aizawa, E., Shoji, T., Izumiyama, M., . . . Fukudo, S. (2013). Neural basis of impaired cognitive flexibility in patients with anorexia nervosa. PLoS ONE Vol 8(5), 2013, ArtID e61108, 8(5).
Schafer, A., Vaitl, D., & Schienle, A. (2010). Regional grey matter volume abnormalities in bulimia nervosa and binge-eating disorder. Neuroimage, 50(2), 639-643. doi:10.1016/j.neuroimage.2009.12.063
Schaumberg, K., Zerwas, S., Goodman, E., Yilmaz, Z., Bulik, C. M., & Micali, N. (2019). Anxiety disorder symptoms at age 10 predict eating disorder symptoms and diagnoses in adolescence. J Child Psychol Psychiatry, 60(6), 686-696. doi:10.1111/jcpp.12984
Schienle, A., Ebner, F., & Schafer, A. (2011). Localized gray matter volume abnormalities in generalized anxiety disorder. Eur Arch Psychiatry Clin Neurosci, 261(4), 303-307. doi:10.1007/s00406-010-0147-5
Schmidt, U., & Treasure, J. (2006). Anorexia nervosa: valued and visible. A cognitive-interpersonal maintenance model and its implications for research and practice. Br J Clin Psychol, 45(Pt 3), 343-366.
277
Seeger, G., Braus, D. F., Ruf, M., Goldberger, U., & Schmidt, M. H. (2002). Body image distortion reveals amygdala activation in patients with anorexia nervosa -- a functional magnetic resonance imaging study. Neurosci Lett, 326(1), 25-28.
Seitz, J. (2017). Readdressing Fornix Pathology in Anorexia Nervosa. Biol Psychiatry Cogn Neurosci Neuroimaging, 2(5), 386-387. doi:10.1016/j.bpsc.2017.05.002
Seitz, J., Buhren, K., von Polier, G. G., Heussen, N., Herpertz-Dahlmann, B., & Konrad, K. (2014). Morphological changes in the brain of acutely ill and weight-recovered patients with anorexia nervosa. A meta-analysis and qualitative review. Z Kinder Jugendpsychiatr Psychother, 42(1), 7-17; quiz 17-18. doi:10.1024/1422-4917/a000265
Seitz, J., Buhren, K., Von Polier, G. G., Heussen, N., Herpertz-Dahlmann, B., & Konrad, K. (2014). Morphological changes in the brain of acutely ill and weight-recovered patients with anorexia nervosa: A meta-analysis and qualitative review. [German, English]. [Hirnmorphologische Veranderungen in akut kranken und gewichtsrehabilitierten Patientinnen mit Anorexia nervosa:- Meta-Analyse und qualitativer Review.]. Zeitschrift fur Kinder- und Jugendpsychiatrie und Psychotherapie, 42(1), 7-18.
Seitz, J., Herpertz-Dahlmann, B., & Konrad, K. (2016). Brain morphological changes in adolescent and adult patients with anorexia nervosa. Journal of Neural Transmission, 1-11. doi:10.1007/s00702-016-1567-9
Seitz, J., Kahraman-Lanzerath, B., Legenbauer, T., Sarrar, L., Herpertz, S., Salbach-Andrae, H., . . . Herpertz-Dahlmann, B. (2013). The role of impulsivity, inattention and comorbid ADHD in patients with bulimia nervosa. PLoS One, 8(5), e63891. doi:10.1371/journal.pone.0063891
Seitz, J., Walter, M., Mainz, V., Herpertz-Dahlmann, B., Konrad, K., & von Polier, G. (2015). Brain volume reduction predicts weight development in adolescent patients with anorexia nervosa. Journal of Psychiatric Research, 68, 228-237.
Serpell, L., Livingstone, A., Neiderman, M., & Lask, B. (2002). Anorexia nervosa: Obsessive–compulsive disorder, obsessive–compulsive personality disorder, or neither? Clinical Psychology Review, 22(5), 647-669. doi:https://doi.org/10.1016/S0272-7358(01)00112-X
Seunarine, K., & Alexander, D. (2009). Multiple fibers: beyond the diffusion tensor. In Diffusion MRI: from quantitative measurement to in vivo neuroanatomy (pp. 55-72): Academic Press.
Shafritz, K. M., Kartheiser, P., & Belger, A. (2005). Dissociation of neural systems mediating shifts in behavioral response and cognitive set. Neuroimage, 25(2), 600-606. doi:10.1016/j.neuroimage.2004.12.054
Shaw, P., Eckstrand, K., Sharp, W., Blumenthal, J., Lerch, J. P., Greenstein, D., . . . Rapoport, J. L. (2007). Attention-deficit/hyperactivity disorder is characterized by a delay in cortical maturation. Proc Natl Acad Sci U S A, 104(49), 19649-19654. doi:10.1073/pnas.0707741104
Shaw, P., Lawrence, E. J., Radbourne, C., Bramham, J., Polkey, C. E., & David, A. S. (2004). The impact of early and late damage to the human amygdala on 'theory of mind' reasoning. Brain, 127(Pt 7), 1535-1548. doi:10.1093/brain/awh168
Sherman, S. M. (2007). The thalamus is more than just a relay. Curr Opin Neurobiol, 17(4), 417-422. doi:10.1016/j.conb.2007.07.003
Shimada, S., Hiraki, K., & Oda, I. (2005). The parietal role in the sense of self-ownership with temporal discrepancy between visual and proprioceptive feedbacks. Neuroimage, 24(4), 1225-1232. doi:10.1016/j.neuroimage.2004.10.039
Shott, M. E., Cornier, M. A., Mittal, V. A., Pryor, T. L., Orr, J. M., Brown, M. S., & Frank, G. K. (2015). Orbitofrontal cortex volume and brain reward response in obesity. Int J Obes (Lond), 39(2), 214-221. doi:10.1038/ijo.2014.121
278
Shott, M. E., Filoteo, J. V., Bhatnagar, K. A., Peak, N. J., Hagman, J. O., Rockwell, R., . . . Frank, G. K. (2012). Cognitive set-shifting in anorexia nervosa. Eur Eat Disord Rev, 20(5), 343-349. doi:10.1002/erv.2172
Shott, M. E., Pryor, T. L., Yang, T. T., & Frank, G. K. W. (2016). Greater Insula White Matter Fiber Connectivity in Women Recovered from Anorexia Nervosa. Neuropsychopharmacology, 41(2), 498-507.
Silberg, J. L., & Bulik, C. M. (2005). The developmental association between eating disorders symptoms and symptoms of depression and anxiety in juvenile twin girls. J Child Psychol Psychiatry, 46(12), 1317-1326. doi:10.1111/j.1469-7610.2005.01427.x
Simes, R. J. (1986). An improved Bonferroni procedure for multiple tests of significance. Biometrika, 73(3), 751-754. doi:10.1093/biomet/73.3.751
Skuse, D. (2001). Endophenotypes and child psychiatry. The British Journal of Psychiatry, 178(5), 395-396. doi:10.1192/bjp.178.5.395
Skuse, D. H., Mandy, W. P., & Scourfield, J. (2005). Measuring autistic traits: heritability, reliability and validity of the Social and Communication Disorders Checklist. The British journal of psychiatry : the journal of mental science, 187, 568-572. doi:10.1192/bjp.187.6.568
Slatkin, M. (2009). Epigenetic Inheritance and the Missing Heritability Problem. Genetics, 182(3), 845-850. doi:10.1534/genetics.109.102798
Smink, F. R., van Hoeken, D., Oldehinkel, A. J., & Hoek, H. W. (2014). Prevalence and severity of DSM-5 eating disorders in a community cohort of adolescents. Int J Eat Disord, 47(6), 610-619. doi:10.1002/eat.22316
Smith, K. E., Mason, T. B., Johnson, J. S., Lavender, J. M., & Wonderlich, S. A. (2018). A systematic review of reviews of neurocognitive functioning in eating disorders: The state-of-the-literature and future directions. Int J Eat Disord, 51(8), 798-821. doi:10.1002/eat.22929
Smith, S. M. (2002). Fast robust automated brain extraction. Hum Brain Mapp, 17(3), 143-155. doi:10.1002/hbm.10062
Smith, S. M., Jenkinson, M., Johansen-Berg, H., Rueckert, D., Nichols, T. E., Mackay, C. E., . . . Behrens, T. E. (2006). Tract-based spatial statistics: voxelwise analysis of multi-subject diffusion data. Neuroimage, 31(4), 1487-1505. doi:10.1016/j.neuroimage.2006.02.024
Smith, S. M., Jenkinson, M., Woolrich, M. W., Beckmann, C. F., Behrens, T. E., Johansen-Berg, H., . . . Matthews, P. M. (2004). Advances in functional and structural MR image analysis and implementation as FSL. Neuroimage, 23(1), S208-219.
Smyth, J. M., Wonderlich, S. A., Heron, K. E., Sliwinski, M. J., Crosby, R. D., Mitchell, J. E., & Engel, S. G. (2007). Daily and momentary mood and stress are associated with binge eating and vomiting in bulimia nervosa patients in the natural environment. Journal of consulting and clinical psychology, 75(4), 629.
Snitz, B. E., MacDonald, A. W., & Carter, C. S. (2006). Cognitive Deficits in Unaffected First-Degree Relatives of Schizophrenia Patients: A Meta-analytic Review of Putative Endophenotypes. Schizophrenia Bulletin, 32(1), 179-194. doi:10.1093/schbul/sbi048
Somerville, L. H., Hare, T., & Casey, B. J. (2011). Frontostriatal maturation predicts cognitive control failure to appetitive cues in adolescents. J Cogn Neurosci, 23(9), 2123-2134. doi:10.1162/jocn.2010.21572
Sonneville, K. R., Calzo, J. P., Horton, N. J., Field, A. E., Crosby, R. D., Solmi, F., & Micali, N. (2015). Childhood hyperactivity/inattention and eating disturbances predict binge eating in adolescence. Psychological medicine, FirstView, 1-10.
Spitzer, R. L., Devlin, M. J., Walsh, B. T., Hasin, D., Wing, R., Marcus, M. D., . . . Nonas, C. (1991). Binge eating disorder: To be or not to be in DSM-IV. International Journal of Eating Disorders, 10(6), 627-629. doi:10.1002/1098-108X(199111)10:6<627::AID-EAT2260100602>3.0.CO;2-4
279
Spitzer, R. L., Yanovski, S., Wadden, T., Wing, R., Marcus, M. D., Stunkard, A., . . . Horne, R. L. (1993). Binge eating disorder: its further validation in a multisite study. Int J Eat Disord, 13(2), 137-153.
Stein, A., Woolley, H., Cooper, S., Winterbottom, J., Fairburn, C. G., & Cortina-Borja, M. (2006). Eating habits and attitudes among 10-year-old children of mothers with eating disorders: longitudinal study. The British journal of psychiatry : the journal of mental science, 189, 324-329. doi:10.1192/bjp.bp.105.014316
Stein, A., Woolley, H., Cooper, S. D., & Fairburn, C. G. (1994). An observational study of mothers with eating disorders and their infants. Journal of Child Psychology and Psychiatry, 35(4), 733-748.
Steinberg, L. (2005). Cognitive and affective development in adolescence. Trends Cogn Sci, 9(2), 69-74. doi:10.1016/j.tics.2004.12.005
Steinglass, J., & Walsh, B. T. (2006). Habit learning and anorexia nervosa: a cognitive neuroscience hypothesis. Int J Eat Disord, 39(4), 267-275. doi:10.1002/eat.20244
Steinglass, J. E., Berner, L. A., & Attia, E. (2019). Cognitive Neuroscience of Eating Disorders. Psychiatr Clin North Am, 42(1), 75-91. doi:10.1016/j.psc.2018.10.008
Steinglass, J. E., Walsh, T., & Stern, Y. (2006). Set shifting deficit in anorexia nervosa. J Int Neuropsychol Soc, 12. doi:10.1017/s1355617706060528
Steinhausen, H. C. (2002). The outcome of anorexia nervosa in the 20th century. Am J Psychiatry, 159(8), 1284-1293. doi:10.1176/appi.ajp.159.8.1284
Steward, T., Menchon, J. M., Jimenez-Murcia, S., Soriano-Mas, C., & Fernandez-Aranda, F. (2018). Neural Network Alterations Across Eating Disorders: A Narrative Review of fMRI Studies. Curr Neuropharmacol, 16(8), 1150-1163. doi:10.2174/1570159x15666171017111532
Stice, E. (2002). Risk and maintenance factors for eating pathology: a meta-analytic review. Psychol Bull, 128(5), 825-848.
Stoeber, J., & Corr, P. J. (2015). Perfectionism, personality, and affective experiences: New insights from revised Reinforcement Sensitivity Theory. Personality and Individual Differences, 86, 354-359. doi:https://doi.org/10.1016/j.paid.2015.06.045
Stoodley, C. J., & Schmahmann, J. D. (2009). Functional topography in the human cerebellum: a meta-analysis of neuroimaging studies. Neuroimage, 44(2), 489-501. doi:10.1016/j.neuroimage.2008.08.039
Streitburger, D. P., Moller, H. E., Tittgemeyer, M., Hund-Georgiadis, M., Schroeter, M. L., & Mueller, K. (2012). Investigating structural brain changes of dehydration using voxel-based morphometry. PloS one, 7(8), e44195. doi:10.1371/journal.pone.0044195
Strober, M., Freeman, R., Lampert, C., & Diamond, J. (2007). The association of anxiety disorders and obsessive compulsive personality disorder with anorexia nervosa: evidence from a family study with discussion of nosological and neurodevelopmental implications. Int J Eat Disord, 40 Suppl, S46-51. doi:10.1002/eat.20429
Strober, M., Freeman, R., Lampert, C., Diamond, J., & Kaye, W. (2000). Controlled family study of anorexia nervosa and bulimia nervosa: evidence of shared liability and transmission of partial syndromes. Am J Psychiatry, 157(3), 393-401. doi:10.1176/appi.ajp.157.3.393
Swayze, I. V. W., Andersen, A. E., Andreasen, N. C., Arndt, S., Sato, Y., & Ziebell, S. (2003). Brain tissue volume segmentation in patients with anorexia nervosa before and after weight normalization. International Journal of Eating Disorders, 33(1), 33-44.
Swinbourne, J., Hunt, C., Abbott, M., Russell, J., St Clare, T., & Touyz, S. (2012). The comorbidity between eating disorders and anxiety disorders: prevalence in an eating disorder sample and anxiety disorder sample. Aust N Z J Psychiatry, 46(2), 118-131. doi:10.1177/0004867411432071
Swinbourne, J. M., & Touyz, S. W. (2007). The co-morbidity of eating disorders and anxiety disorders: a review. Eur Eat Disord Rev, 15(4), 253-274. doi:10.1002/erv.784
280
Talbot, A., Hay, P., Buckett, G., & Touyz, S. (2015). Cognitive deficits as an endophenotype for anorexia nervosa: an accepted fact or a need for re-examination? Int J Eat Disord, 48(1), 15-25. doi:10.1002/eat.22332
Tchanturia, K., Davies, H., Harrison, A., Fox, J. R., Treasure, J., & Schmidt, U. (2012). Altered social hedonic processing in eating disorders. Int J Eat Disord, 45(8), 962-969. doi:10.1002/eat.22032
Tchanturia, K., Davies, H., Roberts, M., Harrison, A., Nakazato, M., Schmidt, U., . . . Morris, R. (2012). Poor cognitive flexibility in eating disorders: examining the evidence using the Wisconsin Card Sorting Task. PLoS One, 7(1), e28331. doi:10.1371/journal.pone.0028331
Tchanturia, K., Giombini, L., Leppanen, J., & Kinnaird, E. (2017). Evidence for Cognitive Remediation Therapy in Young People with Anorexia Nervosa: Systematic Review and Meta-analysis of the Literature. Eur Eat Disord Rev, 25(4), 227-236. doi:10.1002/erv.2522
Tchanturia, K., Harrison, A., Davies, H., Roberts, M., Oldershaw, A., Nakazato, M., . . . Treasure, J. (2011). Cognitive Flexibility and Clinical Severity in Eating Disorders. PLOS ONE, 6(6), e20462. doi:10.1371/journal.pone.0020462
Tchanturia, K., Lounes, N., & Holttum, S. (2014). Cognitive remediation in anorexia nervosa and related conditions: a systematic review. Eur Eat Disord Rev, 22(6), 454-462. doi:10.1002/erv.2326
Tchanturia, K., Morris, R., Anderluh, M., Collier, D., Nikolaou, V., & Treasure, J. (2004). Set shifting in anorexia nervosa: an examination before and after weight gain, in full recovery and relationship to childhood and adult OCPD traits. J Psychiatr Res, 38. doi:10.1016/j.jpsychires.2004.03.001
Tenconi, E., Santonastaso, P., Degortes, D., Bosello, R., Titton, F., Mapelli, D., & Favaro, A. (2010). Set-shifting abilities, central coherence, and handedness in anorexia nervosa patients, their unaffected siblings and healthy controls: exploring putative endophenotypes. World J Biol Psychiatry, 11(6), 813-823. doi:10.3109/15622975.2010.483250
Thomas R., I., & Jeffrey A., L. (2013). DSM-5 and RDoC: Shared Interests [Press release] Thompson, J. K., Heinberg, L. J., Altabe, M., & Tantleff-Dunn, S. (1999). Exacting beauty: Theory,
assessment, and treatment of body image disturbance: American Psychological Association.
Tierney, A. L., Gabard-Durnam, L., Vogel-Farley, V., Tager-Flusberg, H., & Nelson, C. A. (2012). Developmental Trajectories of Resting EEG Power: An Endophenotype of Autism Spectrum Disorder. PloS one, 7(6), e39127. doi:10.1371/journal.pone.0039127
Timimi, S., & Robinson, P. (1996). Disturbances in children of patients with eating disorders. European Eating Disorders Review, 4(3), 183-188.
Titova, O. E., Hjorth, O. C., Schioth, H. B., & Brooks, S. J. (2013). Anorexia nervosa is linked to reduced brain structure in reward and somatosensory regions: A meta-analysis of VBM studies. BMC Psychiatry, 13 (no pagination)(110).
Tournier, J. D., Calamante, F., & Connelly, A. (2007). Robust determination of the fibre orientation distribution in diffusion MRI: non-negativity constrained super-resolved spherical deconvolution. Neuroimage, 35(4), 1459-1472. doi:10.1016/j.neuroimage.2007.02.016
Tournier, J. D., Calamante, F., & Connelly, A. (2012). MRtrix: Diffusion tractography in crossing fiber regions. International Journal of Imaging Systems and Technology, 22(1), 53-66. doi:10.1002/ima.22005
Tournier, J. D., Calamante, F., Gadian, D. G., & Connelly, A. (2004). Direct estimation of the fiber orientation density function from diffusion-weighted MRI data using spherical deconvolution. Neuroimage, 23(3), 1176-1185. doi:10.1016/j.neuroimage.2004.07.037
Tournier, J. D., Yeh, C. H., Calamante, F., Cho, K. H., Connelly, A., & Lin, C. P. (2008). Resolving crossing fibres using constrained spherical deconvolution: validation using diffusion-
281
weighted imaging phantom data. Neuroimage, 42(2), 617-625. doi:10.1016/j.neuroimage.2008.05.002
Tozzi, F., Thornton, L. M., Klump, K. L., Fichter, M. M., Halmi, K. A., Kaplan, A. S., . . . Kaye, W. H. (2005). Symptom fluctuation in eating disorders: correlates of diagnostic crossover. Am J Psychiatry, 162(4), 732-740. doi:10.1176/appi.ajp.162.4.732
Travis, K. E., Golden, N. H., Feldman, H. M., Solomon, M., Nguyen, J., Mezer, A., . . . Dougherty, R. F. (2015). Abnormal white matter properties in adolescent girls with anorexia nervosa. Neuroimage Clin, 9, 648-659. doi:10.1016/j.nicl.2015.10.008
Treasure, J., & Schmidt, U. (2013). The Cognitive-Interpersonal Maintenance Model of Anorexia Nervosa Revisited: A summary of the evidence for cognitive, socio-emotional and interpersonal predisposing and perpetuating factors. J Eat Disord.
Treasure, J., & Schmidt, U. (2013). The cognitive-interpersonal maintenance model of anorexia nervosa revisited: a summary of the evidence for cognitive, socio-emotional and interpersonal predisposing and perpetuating factors. J Eat Disord, 1, 13. doi:10.1186/2050-2974-1-13
Troop, N. A., & Bifulco, A. (2002). Childhood social arena and cognitive sets in eating disorders. The British journal of clinical psychology / the British Psychological Society, 41(Pt 2), 205-211.
Tuch, D. S. (2004). Q-ball imaging. Magn Reson Med, 52(6), 1358-1372. doi:10.1002/mrm.20279 Tuch, D. S., Reese, T. G., Wiegell, M. R., Makris, N., Belliveau, J. W., & Wedeen, V. J. (2002). High
angular resolution diffusion imaging reveals intravoxel white matter fiber heterogeneity. Magn Reson Med, 48(4), 577-582. doi:10.1002/mrm.10268
Ugurbil, K. (2016). What is feasible with imaging human brain function and connectivity using functional magnetic resonance imaging. Philos Trans R Soc Lond B Biol Sci, 371(1705). doi:10.1098/rstb.2015.0361
Uher, R., Murphy, T., Friederich, H.-C., Dalgleish, T., Brammer, M. J., Giampietro, V., . . . Williams, S. C. (2005). Functional neuroanatomy of body shape perception in healthy and eating-disordered women. Biological psychiatry, 58(12), 990-997.
Uljarevic, M., & Hamilton, A. (2013). Recognition of emotions in autism: a formal meta-analysis. J Autism Dev Disord, 43(7), 1517-1526. doi:10.1007/s10803-012-1695-5
Van den Eynde, F., Guillaume, S., Broadbent, H., Stahl, D., Campbell, I. C., Schmidt, U., & Tchanturia, K. (2011). Neurocognition in bulimic eating disorders: a systematic review. Acta Psychiatr Scand, 124(2), 120-140. doi:10.1111/j.1600-0447.2011.01701.x
Van den Eynde, F., Suda, M., Broadbent, H., Guillaume, S., Van den Eynde, M., Steiger, H., . . . Schmidt, U. (2012). Structural Magnetic Resonance Imaging in Eating Disorders: A Systematic Review of Voxel-Based Morphometry Studies. European Eating Disorders Review, 20(2), 94-105. doi:10.1002/erv.1163
van Meurs, I., Reef, J., Verhulst, F. C., & van der Ende, J. (2009). Intergenerational transmission of child problem behaviors: a longitudinal, population-based study. J Am Acad Child Adolesc Psychiatry, 48(2), 138-145. doi:10.1097/CHI.0b013e318191770d
Via, E., Goldberg, X., Sanchez, I., Forcano, L., Harrison, B. J., Davey, C. G., . . . Menchon, J. M. (2018). Self and other body perception in anorexia nervosa: The role of posterior DMN nodes. World J Biol Psychiatry, 19(3), 210-224. doi:10.1080/15622975.2016.1249951
Via, E., Soriano-Mas, C., Sánchez, I., Forcano, L., Harrison, B. J., Davey, C. G., . . . Cardoner, N. (2015). Abnormal Social Reward Responses in Anorexia Nervosa: An fMRI Study. PLOS ONE, 10(7), e0133539. doi:10.1371/journal.pone.0133539
Via, E., Zalesky, A., Sanchez, I., Forcano, L., Harrison, B. J., Pujol, J., . . . Fornito, A. (2014). Disruption of brain white matter microstructure in women with anorexia nervosa. J Psychiatry Neurosci, 39(6), 367-375.
Villablanca, J. R. (2010). Why do we have a caudate nucleus? Acta Neurobiol Exp (Wars), 70(1), 95-105.

282
Vocks, S., Busch, M., Grönemeyer, D., Schulte, D., Herpertz, S., & Suchan, B. (2010). Neural correlates of viewing photographs of one's own body and another woman's body in anorexia and bulimia nervosa: an fMRI study. J Psychiatry Neurosci, 35(3), 163-176.
Vogel, K., Timmers, I., Kumar, V., Nickl-Jockschat, T., Bastiani, M., Roebroek, A., . . . Seitz, J. (2016). White matter microstructural changes in adolescent anorexia nervosa including an exploratory longitudinal study. NeuroImage : Clinical, 11, 614-621. doi:10.1016/j.nicl.2016.04.002
von Schwanenflug, N., Muller, D. K., King, J. A., Ritschel, F., Bernardoni, F., Mohammadi, S., . . . Ehrlich, S. (2019). Dynamic changes in white matter microstructure in anorexia nervosa: findings from a longitudinal study. Psychol Med, 49(9), 1555-1564. doi:10.1017/s003329171800212x
von Schwanenflug, N., Müller, D. K., King, J. A., Ritschel, F., Bernardoni, F., Mohammadi, S., . . . Ehrlich, S. (2018). Dynamic changes in white matter microstructure in anorexia nervosa: findings from a longitudinal study. Psychol Med, 1-10. doi:10.1017/S003329171800212X
Vyas, A., Jadhav, S., & Chattarji, S. (2006). Prolonged behavioral stress enhances synaptic connectivity in the basolateral amygdala. Neuroscience, 143(2), 387-393. doi:10.1016/j.neuroscience.2006.08.003
Wade, T., Martin, N. G., & Tiggemann, M. (1998). Genetic and environmental risk factors for the weight and shape concerns characteristic of bulimia nervosa. Psychol Med, 28(4), 761-771.
Wade, T. D., Bergin, J. L., Tiggemann, M., Bulik, C. M., & Fairburn, C. G. (2006). Prevalence and long-term course of lifetime eating disorders in an adult Australian twin cohort. Aust N Z J Psychiatry, 40(2), 121-128. doi:10.1111/j.1440-1614.2006.01758.x
Wade, T. D., Bulik, C. M., Neale, M., & Kendler, K. S. (2000). Anorexia nervosa and major depression: shared genetic and environmental risk factors. American Journal of Psychiatry, 157(3), 469-471.
Wade, T. D., Keski‐Rahkonen, A., & Hudson, J. I. (2011). Epidemiology of eating disorders. Textbook in Psychiatric Epidemiology, Third Edition, 343-360.
Wagner, A., Aizenstein, H., Venkatraman, V. K., Bischoff-Grethe, A., Fudge, J., May, J. C., . . . Kaye, W. H. (2010). Altered striatal response to reward in bulimia nervosa after recovery. International Journal of Eating Disorders, 43(4), 289-294. doi:10.1002/eat.20699
Wagner, A., Aizenstein, H., Venkatraman, V. K., Fudge, J., May, J. C., Mazurkewicz, L., . . . Kaye, W. H. (2007). Altered Reward Processing in Women Recovered From Anorexia Nervosa. American Journal of Psychiatry, 164(12), 1842-1849. doi:10.1176/appi.ajp.2007.07040575
Wagner, A., Greer, P., Bailer, U. F., Frank, G. K., Henry, S. E., Putnam, K., . . . Kaye, W. H. (2006). Normal brain tissue volumes after long-term recovery in anorexia and bulimia nervosa. Biol Psychiatry, 59(3), 291-293. doi:10.1016/j.biopsych.2005.06.014
Wagner, A., Ruf, M., Braus, D. F., & Schmidt, M. H. (2003). Neuronal activity changes and body image distortion in anorexia nervosa. Neuroreport, 14(17), 2193-2197. doi:10.1097/01.wnr.0000089567.45990.d9
Watson, H. J., Torgersen, L., Zerwas, S., Reichborn-Kjennerud, T., Knoph, C., Stoltenberg, C., . . . Bulik, C. M. (2014). Eating Disorders, Pregnancy, and the Postpartum Period: Findings from the Norwegian Mother and Child Cohort Study (MoBa). Nor Epidemiol, 24(1-2), 51-62. doi:10.5324/nje.v24i1-2.1758
Watson, H. J., Yilmaz, Z., Thornton, L. M., Hübel, C., Coleman, J. R. I., Gaspar, H. A., . . . Eating Disorders Working Group of the Psychiatric Genomics, C. (2019). Genome-wide association study identifies eight risk loci and implicates metabo-psychiatric origins for anorexia nervosa. Nature Genetics. doi:10.1038/s41588-019-0439-2
283
Wechsler, D. (2011). Wechsler Abbreviated Scale of Intelligence - Second Edition. San Antonio: San Antonio TX: Pearson.
Weijers, D., van Steensel, F. J. A., & Bögels, S. M. (2018). Associations between Psychopathology in Mothers, Fathers and Their Children: A Structural Modeling Approach. J Child Fam Stud, 27(6), 1992-2003. doi:10.1007/s10826-018-1024-5
Weinbach, N., Bohon, C., & Lock, J. (2019). Set-shifting in adolescents with weight-restored anorexia nervosa and their unaffected family members. J Psychiatr Res, 112, 71-76. doi:10.1016/j.jpsychires.2019.02.022
Wells, G., Shea, B., O’Connell, D., Peterson, J., Welch, V., Losos, M., & Tugwell, P. The Newcastle-Ottawa Scale (NOS) for assessing the quality if nonrandomized studies in meta-analyses. Retrieved from http://www.ohri.ca/programs/clinical_epidemiology/oxford.htm
Wentz, E., Gillberg, C., Gillberg, I. C., & Rastam, M. (2001). Ten-year follow-up of adolescent-onset anorexia nervosa: psychiatric disorders and overall functioning scales. Journal of child psychology and psychiatry, and allied disciplines, 42(5), 613-622.
Westwood, H., Stahl, D., Mandy, W., & Tchanturia, K. (2016). The set-shifting profiles of anorexia nervosa and autism spectrum disorder using the Wisconsin Card Sorting Test: a systematic review and meta-analysis. Psychol Med, 46(9), 1809-1827. doi:10.1017/S0033291716000581
Westwood, H., & Tchanturia, K. (2017). Autism Spectrum Disorder in Anorexia Nervosa: An Updated Literature Review. Current Psychiatry Reports, 19(7), 41. doi:10.1007/s11920-017-0791-9
Whelan, E., & Cooper, P. J. (2000). The association between childhood feeding problems and maternal eating disorder: a community study. Psychological medicine, 30(1), 69-77.
WHO. (2014). Global Health Estimates Techinical Paper. Retrieved 14/12/2016 Wikipedia. Eating Disorders. Retrieved from
https://en.wikipedia.org/wiki/Eating_disorder#cite_note-Loz2012-259 Witkin, H. A., Oltman, P., Raskin, E., & Karp, S. A. (1971). A manual for the group embedded
figures test. Palo Alto, California. Wright, I. C., McGuire, P. K., Poline, J. B., Travere, J. M., Murray, R. M., Frith, C. D., . . . Friston, K.
J. (1995). A voxel-based method for the statistical analysis of gray and white matter density applied to schizophrenia. Neuroimage, 2(4), 244-252. doi:10.1006/nimg.1995.1032
Wu, M., Brockmeyer, T., Hartmann, M., Skunde, M., Herzog, W., & Friederich, H. C. (2014). Set-shifting ability across the spectrum of eating disorders and in overweight and obesity: a systematic review and meta-analysis. Psychol Med, 44(16), 3365-3385. doi:10.1017/s0033291714000294
Wu, M., Brockmeyer, T., Hartmann, M., Skunde, M., Herzog, W., & Friederich, H. C. (2016). Reward-related decision making in eating and weight disorders: A systematic review and meta-analysis of the evidence from neuropsychological studies. Neurosci Biobehav Rev, 61, 177-196. doi:10.1016/j.neubiorev.2015.11.017
Wyssen, A., Lao, J., Rodger, H., Humbel, N., Lennertz, J., Schuck, K., . . . Munsch, S. (2019). Facial Emotion Recognition Abilities in Women Experiencing Eating Disorders. Psychosom Med, 81(2), 155-164. doi:10.1097/psy.0000000000000664
Yau, W.-Y. W., Bischoff-Grethe, A., Theilmann, R. J., Torres, L., Wagner, A., Kaye, W. H., & Fennema-Notestine, C. (2013). Alterations in white matter microstructure in women recovered from anorexia nervosa. International Journal of Eating Disorders, 46(7), 701-708. doi:10.1002/eat.22154
Yilmaz, Z., Hardaway, J. A., & Bulik, C. M. (2015). Genetics and Epigenetics of Eating Disorders. Adv Genomics Genet, 5, 131-150. doi:10.2147/agg.s55776
Yoshimasu, K., Barbaresi, W. J., Colligan, R. C., Voigt, R. G., Killian, J. M., Weaver, A. L., & Katusic, S. K. (2012). Childhood ADHD is strongly associated with a broad range of psychiatric
284
disorders during adolescence: a population-based birth cohort study. Journal of child psychology and psychiatry, and allied disciplines, 53(10), 1036-1043. doi:10.1111/j.1469-7610.2012.02567.x
Zalla, T., Koechlin, E., Pietrini, P., Basso, G., Aquino, P., Sirigu, A., & Grafman, J. (2000). Differential amygdala responses to winning and losing: a functional magnetic resonance imaging study in humans. Eur J Neurosci, 12(5), 1764-1770. doi:10.1046/j.1460-9568.2000.00064.x
Zastrow, A., Kaiser, S., Stippich, C., Walther, S., Herzog, W., Tchanturia, K., . . . Friederich, H. C. (2009). Neural correlates of impaired cognitive-behavioral flexibility in anorexia nervosa. Am J Psychiatry, 166(5), 608-616. doi:10.1176/appi.ajp.2008.08050775
Zhang, H. W., Li, D. Y., Zhao, J., Guan, Y. H., Sun, B. M., & Zuo, C. T. (2013). Metabolic imaging of deep brain stimulation in anorexia nervosa: a 18F-FDG PET/CT study. Clin Nucl Med, 38(12), 943-948. doi:10.1097/rlu.0000000000000261
Zhou, Z. C., McAdam, D. B., & Donnelly, D. R. (2018). Endophenotypes: A conceptual link between anorexia nervosa and autism spectrum disorder. Research in Developmental Disabilities, 82, 153-165. doi:https://doi.org/10.1016/j.ridd.2017.11.008
Zhu, J. L., Basso, O., Obel, C., Hvidtjorn, D., & Olsen, J. (2009). Infertility, infertility treatment and psychomotor development: the Danish National Birth Cohort. Paediatr Perinat Epidemiol, 23(2), 98-106. doi:10.1111/j.1365-3016.2008.00989.x
Zhu, J. N., & Wang, J. J. (2008). The cerebellum in feeding control: possible function and mechanism. Cell Mol Neurobiol, 28(4), 469-478. doi:10.1007/s10571-007-9236-z
Zink, C. F., & Weinberger, D. R. (2010). Cracking the moody brain: the rewards of self starvation. Nature Medicine, 16(12), 1382.
Zucker, N. L., Losh, M., Bulik, C. M., LaBar, K. S., Piven, J., & Pelphrey, K. A. (2007). Anorexia nervosa and autism spectrum disorders: guided investigation of social cognitive endophenotypes. Psychological bulletin, 133(6), 976.
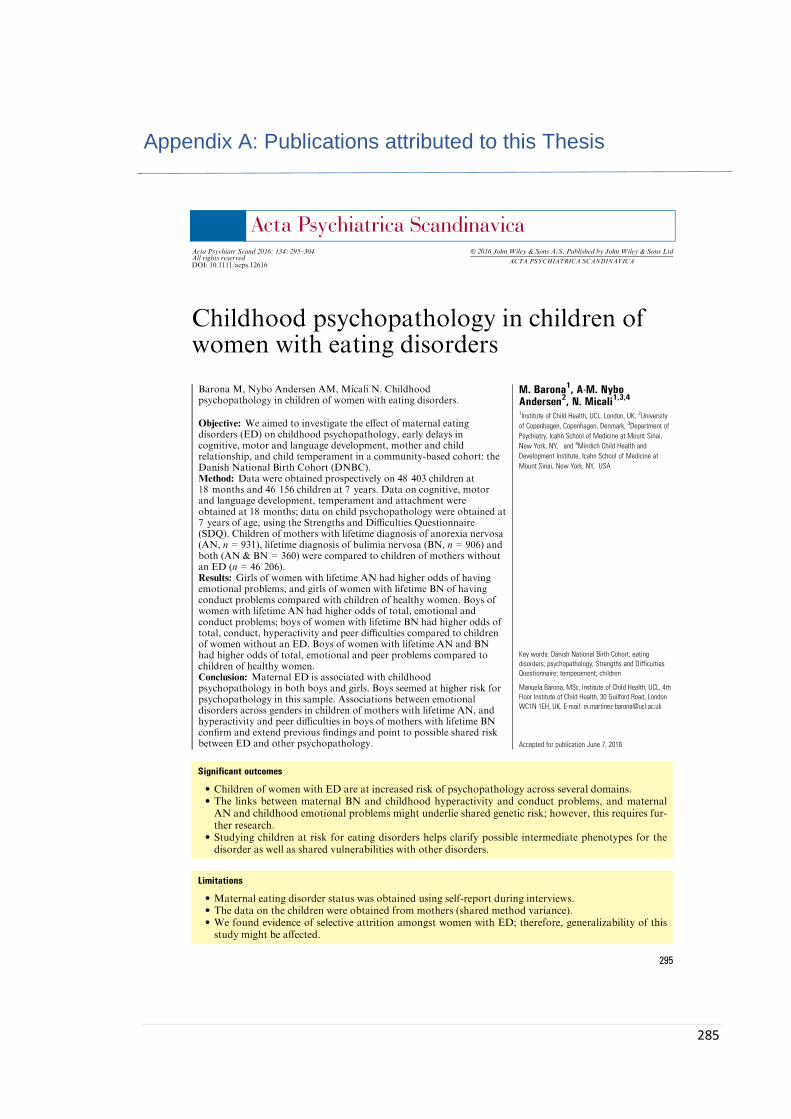
285
Appendix A: Publications attributed to this Thesis
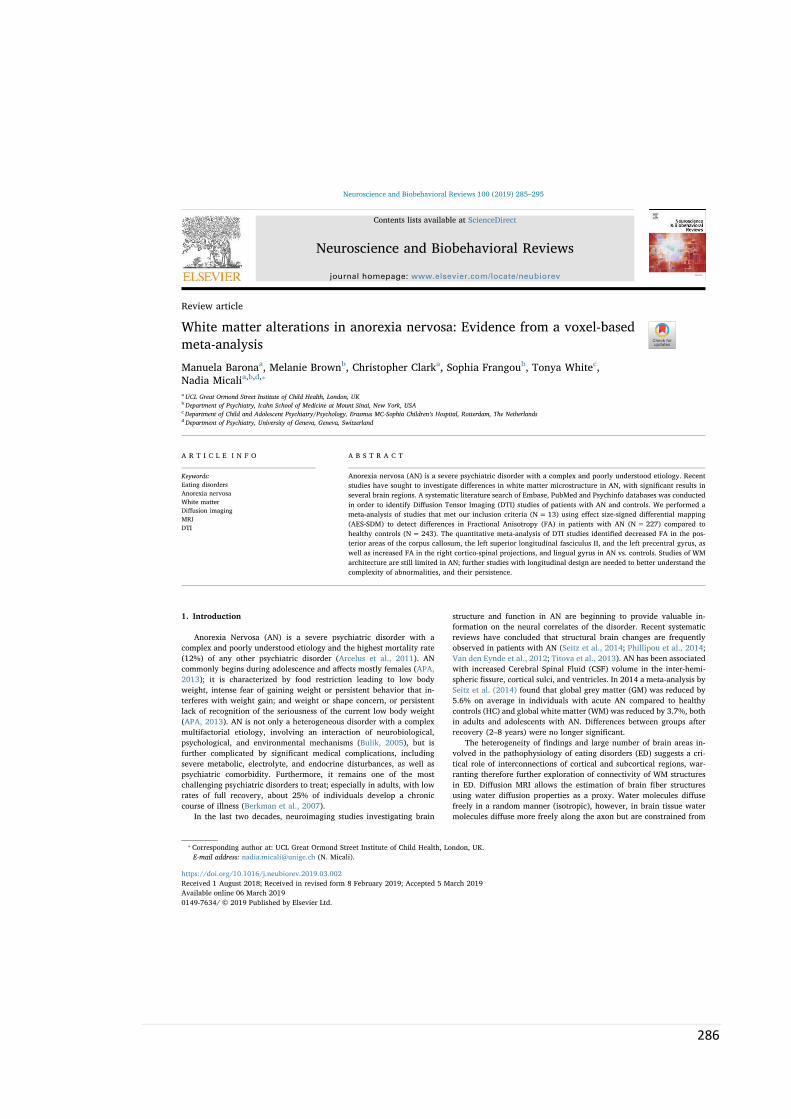
286
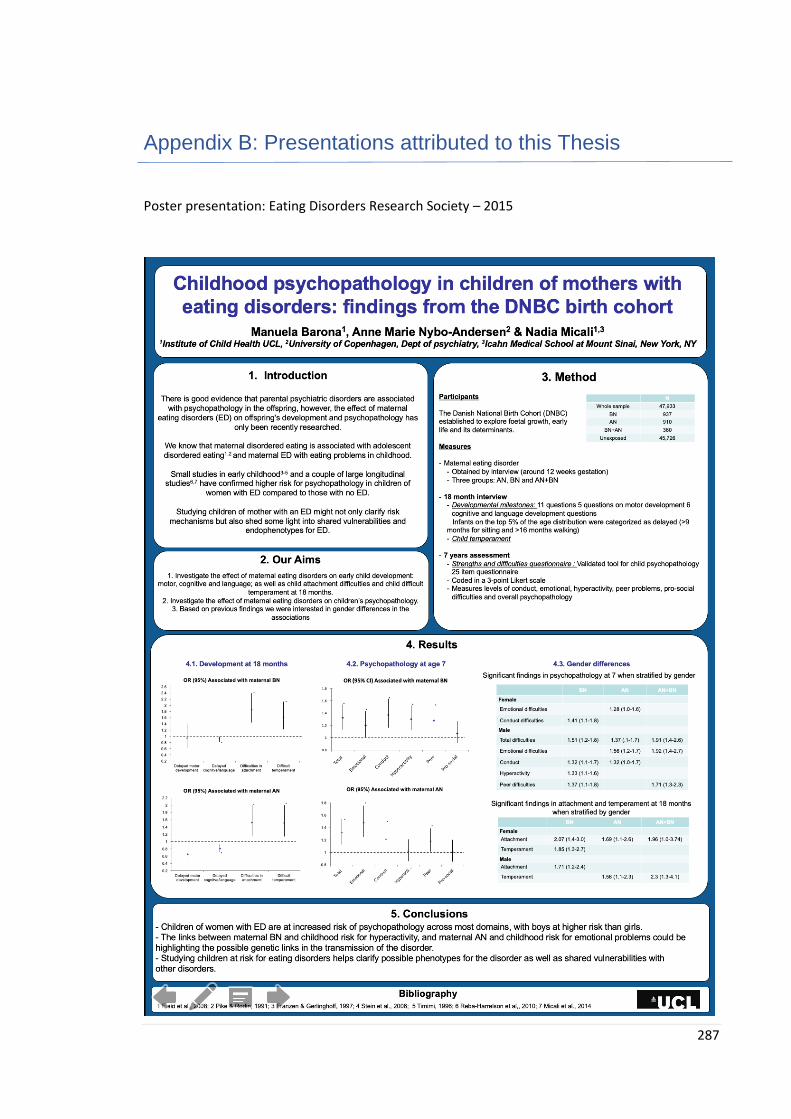
287
Appendix B: Presentations attributed to this Thesis
Poster presentation: Eating Disorders Research Society – 2015

288
Oral presentation: London International Eating Disorders Conference – 2015
Workshop: Eating Disorders International Conference – 2016
289
Oral presentation: International Conference on Eating Disorders – 2017
Oral presentation: European Council of Eating Disorders – 2019

290
Appendix C: Ethics approvals

291

292
Appendix C: Webpage developed

293

294
Appendix D: Visual protocol

295
Appendix E: Puberty questionnaire
Maternal Eating and Adolescent Brain Development Study
1. Has your daughter starter her menstrual periods yet?
Yes No
2. How old was your daughter when she had her first period?
3. When was her first period?
Month Year
We would like to assess the stage of your daughter’s physical development using some a set of
drawings on the next pages. These indicate various stages of puberty commonly used by doctors to
assess the growth and development of girls. Not all children follow the same pattern of
development.
We need to know which drawings most closely match your daughter’s stage of development at the
moment. Just pick the stage that is closest, based on both the picture and the description.
Project ID: …………….
UCL INSTITUTE OF CHILD HEALTH

296

297
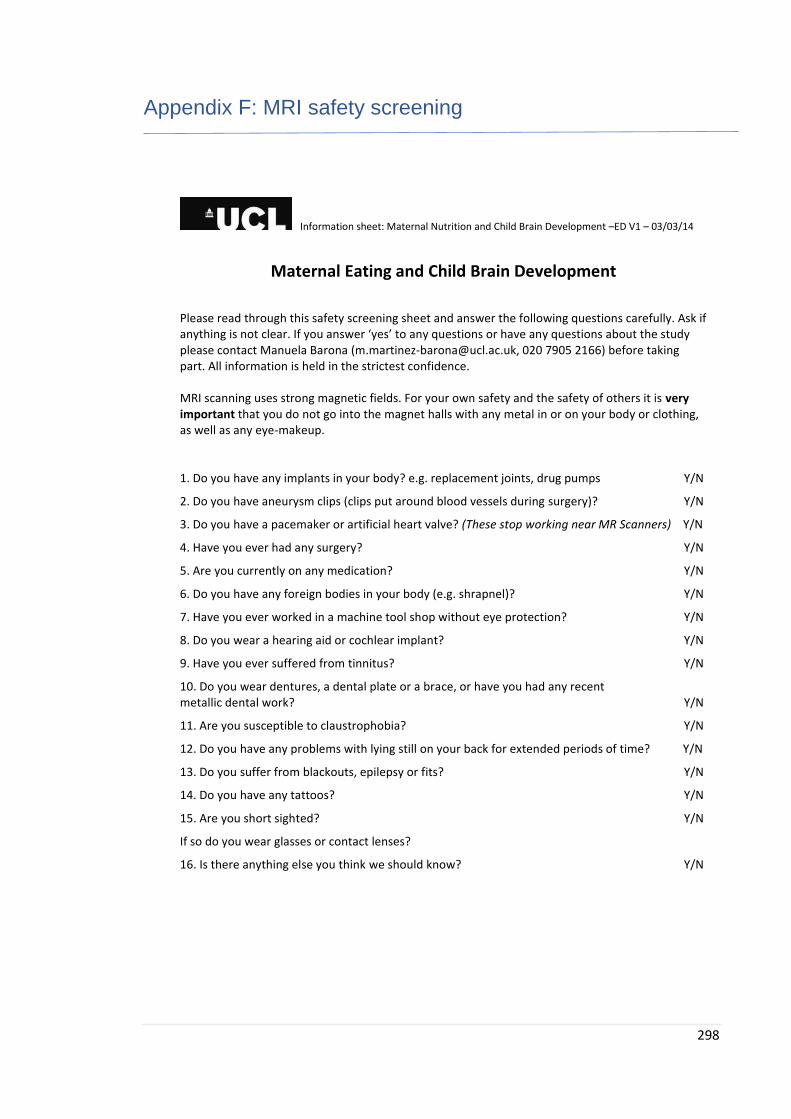
298
Appendix F: MRI safety screening
Information sheet: Maternal Nutrition and Child Brain Development –ED V1 – 03/03/14
Maternal Eating and Child Brain Development
Please read through this safety screening sheet and answer the following questions carefully. Ask if anything is not clear. If you answer ‘yes’ to any questions or have any questions about the study please contact Manuela Barona ([email protected], 020 7905 2166) before taking part. All information is held in the strictest confidence. MRI scanning uses strong magnetic fields. For your own safety and the safety of others it is very important that you do not go into the magnet halls with any metal in or on your body or clothing, as well as any eye-makeup.
1. Do you have any implants in your body? e.g. replacement joints, drug pumps Y/N
2. Do you have aneurysm clips (clips put around blood vessels during surgery)? Y/N
3. Do you have a pacemaker or artificial heart valve? (These stop working near MR Scanners) Y/N
4. Have you ever had any surgery? Y/N
5. Are you currently on any medication? Y/N
6. Do you have any foreign bodies in your body (e.g. shrapnel)? Y/N
7. Have you ever worked in a machine tool shop without eye protection? Y/N
8. Do you wear a hearing aid or cochlear implant? Y/N
9. Have you ever suffered from tinnitus? Y/N
10. Do you wear dentures, a dental plate or a brace, or have you had any recent metallic dental work? Y/N
11. Are you susceptible to claustrophobia? Y/N
12. Do you have any problems with lying still on your back for extended periods of time? Y/N
13. Do you suffer from blackouts, epilepsy or fits? Y/N
14. Do you have any tattoos? Y/N
15. Are you short sighted? Y/N
If so do you wear glasses or contact lenses?
16. Is there anything else you think we should know? Y/N
Copyright © 2022 FDOKUMEN


![[Obesity and Eating Disorders. Indications for the different levels of care. An Italian Expert Consensus Document]](https://static.fdokumen.com/doc/165x107/633765f90026af93cb02b6a5/obesity-and-eating-disorders-indications-for-the-different-levels-of-care-an-1682931931.jpg)