Changing Family Size in England and Wales: Place, Class and Demography, 1891–1911. By Eilidh...
38
Changing Family Size in England and Wales Place, Class and Demography, 1891–1911 EILIDH GARRETT Cambridge Group for the History of Population and Social Structure ALICE REID St John’s College, Cambridge KEVIN SCHÜRER Department of History, University of Essex SIMON SZRETER St John’s College, Cambridge
Transcript of Changing Family Size in England and Wales: Place, Class and Demography, 1891–1911. By Eilidh...
Changing Family Sizein England and WalesPlace, Class and Demography, 1891–1911
EILIDH GARRETTCambridge Group for the History of Population and Social Structure
ALICE REIDSt John’s College, Cambridge
KEVIN SCHÜRERDepartment of History, University of Essex
SIMON SZRETERSt John’s College, Cambridge
published by the press syndicate of the university of cambridgeThe Pitt Building, Trumpington Street, Cambridge, United Kingdom
cambridge university pressThe Edinburgh Building, Cambridge CB2 2RU, UK40 West 20th Street, New York, NY 10011-4211, USA
10 Stamford Road, Oakleigh, VIC 3166, AustraliaRuiz de Alarcón 13, 28014 Madrid, Spain
Dock House, The Waterfront, Cape Town 8001, South Africa
http://www.cambridge.org
© Eilidh Garrett, Alice Reid, Kevin Schürer and Simon Szreter 2001
This book is in copyright. Subject to statutory exceptionand to the provisions of relevant collective licensing agreements,
no reproduction of any part may take place withoutthe written permission of Cambridge University Press.
First published 2001
Printed in the United Kingdom at the University Press, Cambridge
Typeface Adobe Palatino 10/12 pt. System QuarkXPress™ [se ]
A catalogue record for this book is available from the British Library
Library of Congress Cataloguing in Publication data
Changing family size in England and Wales: place, class, and demography, 1891–1911/Eilidh Garrett . . . [et al.].
p. cm.Includes bibliographical references and index.
ISBN 0 521 80153 21. Family size–England–History. 2. Family size–Wales–History. 3. Fertility,
Human–England–History. 4. Fertility, Human–Wales–History. 5.Infants–England–Mortality. 6. Infants–Wales–Mortality. 7. Social
classes–England–History. 8. Social classes–Wales–History. 9. England–Population.10. Wales–Population. I. Garrett, Eilidh.
HQ766.5.G7 C45 2001304.6�34�0941–dc21 00-045557
isbn 0 521 80153 2 hardback
Contents
List of figures page xList of tables xivPreface and acknowledgements xxi
1 Introduction 11.1 The fast-changing demography of England and Wales,
c. 1880–1920 11.2 Demography, national anxiety and the 1911 census 41.3 A new approach to infant and child mortality – the
historiographical context 81.4 Fertility and nuptiality – debates and description 101.5 Limitations of the present study 161.6 Summary 20
2 Locations for study 242.1 Introduction 242.2 Selecting communities for study 252.3 Brief histories of the thirteen locales 312.4 Selection of the enumeration districts within locales 47
3 Studying locations 563.1 From census enumerators’ books to data files 563.2 Understanding the census variables 633.3 The Fertility Inquiry 853.4 Data analysis – some concepts 893.5 Data analysis – spatial or social units? The ‘environments’ 96
4 Infant and child mortality from the 1911 census 1054.1 Introduction 1054.2 Measuring infant and child mortality from the 1911 census 107
vii
viii Contents
4.3 A comparison with the experience of the USA 1144.4 The influence of environment versus social class in infant and
child mortality 1394.5 Multiple regression techniques 1474.6 Confirming the relationships between environment, social class
and infant and child mortality 1494.7 The effects of social class and other socio-economic variables on
infant and child mortality within different environments 1544.8 Parity and infant and child mortality 1604.9 The relative importance of variables 1674.10 Do the influences on infant and child mortality operate through
individual- or community-level characteristics? 1724.11 Infant and child mortality differentials across time 1854.12 Conclusions 197
5 Fertility and fertility behaviour 1891–1911 2105.1 Introduction 2105.2 Nuptiality 2135.3 Calculating age-specific marital fertility rates and total marital
fertility rates from census data 2335.4 Measures of ‘stopping’ behaviour in marital fertility: M and m 2495.5 An alternative measure of fertility – CPA 2605.6 Retrospective histories of childbearing 2685.7 Male occupation and fertility 2895.8 Female occupations and fertility 2995.9 The fertility of couples where both husband and wife returned an
occupation in 1911 3135.10 Conclusion 321
6 The national picture 3376.1 Introduction 3376.2 ‘Environment’ at the national scale 3436.3 National patterns of infant and child mortality 3536.4 Nuptiality 3666.5 The jigsaw that was national fertility in 1911 3766.6 Conclusion 399
7 Class, place and demography: the mosaic of demographicchange in England and Wales from Waterloo to the Great War 4077.1 Environment and demographic change 4077.2 Class, place and demography 4127.3 Mortality in the nineteenth century from a compositional
perspective 4217.4 Decomposing fertility and reproduction 4257.5 Conclusions 433

Appendices 441Appendix A The indirect estimation of infant and child mortality and
related applications 441Appendix B Choice of regression method 468Appendix C The values of community-level variables for each sector 471Appendix D The percentage of the population of each county living in
each type of place, subdivided by environment, England and Wales,1921 474
References 478Index 501
Contents ix
Figures
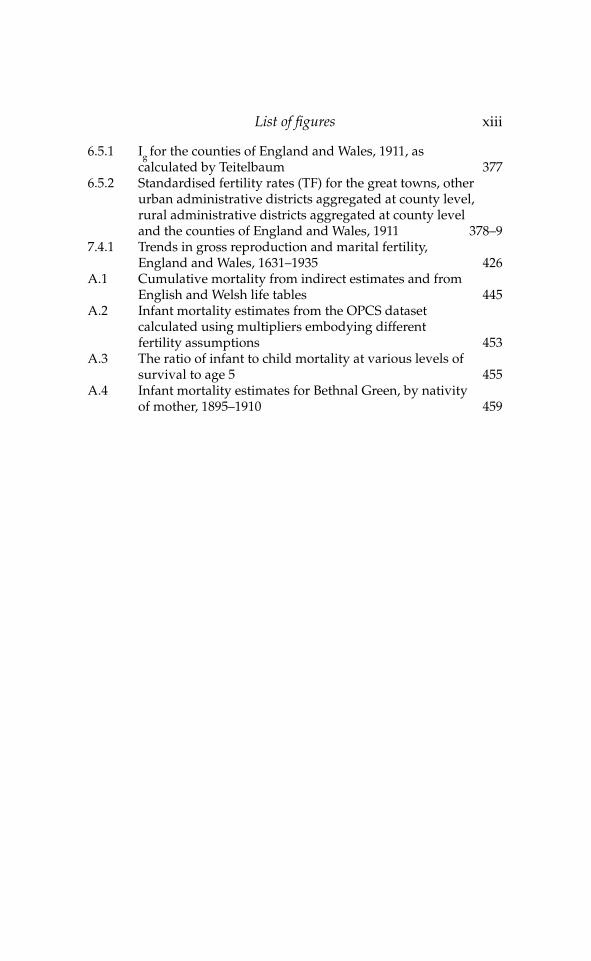
1.1.1 Fertility and mortality trends in England and Wales,1838–1937; crude birth rate, crude death rate and infantmortality page 2
1.2.1 The form of the questions concerning the fertility ofmarriage as presented in the census schedule for Englandand Wales, 1911 6
2.2.1 The location of the registration districts (RDs) containingcommunities included in the OPCS study: showing theRD name and the three-letter reference code for eachcommunity 26
3.2.1 Population pyramids for Bolton, Pinner and Earsdonlocales, comparing 1891 and 1911 70
3.3.1 The number of couples recorded by duration of marriage;OPCS population, 1911 87
3.4.1 The elements of a lexis diagram: time, age and cohort 923.4.2A A lexis diagram representing a ‘prospective’ longitudinal
survey 933.4.2B A lexis diagram representing a ‘retrospective’ longitudinal
survey 933.4.3 A diagram representing the calculation of synthetic cohort
measures from age-specific period measures 954.2.1 Infant mortality estimates: comparing OPCS estimates,
national estimates and rates calculated from vitalregistration, 1890–1915 113
4.11.1 Infant mortality estimates by social class, 1895–1911;England and Wales and OPCS population compared 187
4.11.2 The proportion of deaths due to different causes, byage, for the urban counties of England and Wales,1906–10 196
x
5.2.1A The proportion of women single, married and widowedindexed against 1851, England and Wales, 1851–1931 215
5.2.1B The proportion of men single, married and widowedindexed against 1851, England and Wales, 1851–1931 216
5.2.2A Changes in the Princeton fertility indices, by place andenvironment, OPCS 1891–1911 218
5.2.2B Changes in the Princeton fertility indices, byenvironment: OPCS 1891–1911 219
5.2.3 The marital status distribution of females aged 15–49,by place within environment, OPCS 1911 221
5.2.4 The marital status distribution of males aged 15–49, byplace within environment, OPCS 1911 228
5.3.1 Age-specific marital fertility rates for each OPCSenvironment in 1891, 1901 and 1911 plotted against theASMFR curve for England, 1800–24 240
5.3.2 Total marital fertility rates by class and environment,OPCS 1891–1911 242
5.3.3 Total marital fertility rate for each class, by environment,OPCS 1891–1911 245
5.3.4 Total marital fertility for places within environments,OPCS 1891–1911 247
5.4.1 The relationship between n(a), R(a), v(a) and m 2505.4.2 Selected OPCS age-specific marital fertility schedules
and four schedules from twentieth-century England andWales compared with the Coale-Trussell standard‘natural fertility’ schedule and the ASMFR schedule forEngland, 1800–24 253
5.4.3 v(a)�ln(r(a)/n(a)) for each age group of wife, 1891, 1901and 1911, for each environment 258
5.5.1 Upper and lower CPA bounds for the populations of thefour OPCS environments, England and Wales, Scotlandand urban Ireland, 1911, by marital duration anddifferentiating those wives married at ages 20–24 fromthose married aged 25–29 265
5.6.1 The percentage of couples achieving given parities foreach class in the OPCS White Collar and StapleIndustry environments: 1866–81 and 1881–91 marriagecohorts 279
5.7.1 Differences between OPCS environments in thepercentage of couples achieving given parities where thehusband is a dealer, by marital duration for wivesmarried aged 20–29 298
List of figures xi
5.8.1 The percentage of women aged 15 or over returning anoccupation, by marital status and place withinenvironment: OPCS 1911 302
5.8.2 The number of single women employed in service, andin other occupations, per thousand single women, byplace within environment 303
5.8.3 The percentage of wives aged less than 50 in each place,within each environment, who are in paidemployment, in employment and keeping a boarder, orkeeping a boarder only; OPCS 1911 305
5.8.4 The percentage of women employed in textilesachieving an actual or effective parity of 0 or 1, bymarital duration, compared with women not in paidemployment: Bolton 1911 308
6.1.1 The location of the areas, census divisions and countiesof England and Wales used in analysis 339
6.2.1 The location of the great towns of England and Wales,1911 345
6.2.2 The geographic distribution of all urban administrativedistricts, all administrative districts with a White Collarenvironment, all administrative districts with a LightIndustry environment, and all administrative districtswith a Staple Industry environment: England andWales, 1911 346–7
6.2.3 The distribution of environments amongst the greattowns, the other urban administrative districtsaggregated at county level and the rural administrativedistricts aggregated at county level: England andWales, 1911 350–1
6.3.1 Standardised Mortality Rates for the ‘great towns’,‘other urban’ administrative districts aggregated atcounty level, rural administrative districts aggregatedat county level and the counties of England andWales, 1911 356–7
6.4.1 Im for the counties of England and Wales, 1911, ascalculated by Teitelbaum 367
6.4.2 Celibacy rates for females and males, as measured by theproportion of those who have never married aged 45–49,by county, England and Wales, 1911 369
6.4.3 Celibacy rates for females and males, for themetropolitan boroughs of London, 1911 373
6.4.4 The female marriage regions of England and Wales, 1911 375
xii List of figures
6.5.1 Ig for the counties of England and Wales, 1911, ascalculated by Teitelbaum 377
6.5.2 Standardised fertility rates (TF) for the great towns, otherurban administrative districts aggregated at county level,rural administrative districts aggregated at county leveland the counties of England and Wales, 1911 378–9
7.4.1 Trends in gross reproduction and marital fertility,England and Wales, 1631–1935 426
A.1 Cumulative mortality from indirect estimates and fromEnglish and Welsh life tables 445
A.2 Infant mortality estimates from the OPCS datasetcalculated using multipliers embodying differentfertility assumptions 453
A.3 The ratio of infant to child mortality at various levels ofsurvival to age 5 455
A.4 Infant mortality estimates for Bethnal Green, by nativityof mother, 1895–1910 459
List of figures xiii
Tables
2.4.1 Relationship between locales, sectors and enumerationdistricts in the OPCS dataset, 1891 to 1911 page 49
2.4.2 The enumeration district clusters or sectors representingthe OPCS locales 50–1
3.1.1 Errors detected for the parish of Colyton, 1891,comparing the OPCS material with microfilms of theoriginal census enumerators’ returns 62
3.2.1 The percentage of women and men aged 15 and overwho, although returned as ‘married’ on the censusforms, are not living with their spouse on census night,1911, by OPCS locale 66
3.2.2 The percentage of employed males aged 15–64 inoccupational orders, for the 13 OPCS locales, 1911 74–5
3.2.3 The percentage of employed females aged 15–64 inselected occupational orders, for the 13 OPCS locales,1911 77
3.2.4 The percentage of all males aged 15–64 in each of the five‘social’ classes and each of the three ‘occupational’classes, for the 13 OPCS locales, 1911 79
3.2.5 The number and percentage of females and males aged15 or over in employment who are reported as working‘at home’, for the 13 OPCS locales, 1911; plus thepercentage of those working ‘at home’ who areemployed in selected occupations 81
3.2.6 Percentage of inhabitants in each place of birth category,for the 13 OPCS locales, 1911 83
3.3.1 Mis-statement of duration of marriage, England andWales, compared with OPCS data, for married,co-resident couples, 1911 86
xiv
3.5.1 The allocation of the sectors comprising OPCS locales tothe environmental classification, giving sector numbersand the population (N) of those sectors in 1911 99
4.3.1 Mortality indices for place size variable: OPCS 1911and US 1900 117
4.3.2 Mortality indices for variables relating to parentalorigins: OPCS 1911 and US 1900 119
4.3.3 Child mortality of the children of immigrant womencompared to mortality in countries of origin 121
4.3.4 Percentage distribution of men used in the calculationof the mortality index, by social class within birthplace 123
4.3.5 Mortality indices for variables relating to father’soccupation and status: OPCS 1911 and US 1900 126–7
4.3.6 Mortality indices for variables relating to mother’semployment: OPCS 1911 and US 1900 129
4.3.7 Mortality indices for variables relating to householdstructure: OPCS 1911 and US 1900 134
4.3.8 Mortality indices for variables relating to housingconditions: OPCS 1911 and US 1900 137
4.4.1 Mortality indices by environment 1404.4.2 Distribution of population living in households headed
by men of different social classes, by environment andwithin environment 142
4.4.3 Mortality indices by social class and environment 144–54.6.1 Multiple regression: the effect of environment and
social class on infant and child mortality 1504.6.2 Multiple regression: the effect of environment, social
class and other socio-economic variables on infant andchild mortality 152–3
4.7.1 Multiple regression: the effect of social class and othersocio-economic variables on infant and child mortality,by environment 156–7
4.8.1 Mortality indices by parity of mother, for each maritalduration group 161
4.8.2 Multiple regression: the effect of social class and othersocio-economic variables on infant and child mortality,with parity, by environment 164–5
4.9.1 The relative importance of variables: as shown bydifferences between coefficients of high and lowmortality categories of variables 168
4.9.2 The relative importance of variables, as shown byadjusted R2 and marginal adjusted R2 for each variable 170
List of tables xv
4.10.1 Variables measured at individual and community levels 1734.10.2 Comparing the effect of individual-level and
community-level variables on infant and child mortality 174–54.10.3 Comparing the effect of individual- and community-
level variables on infant and child mortality: decreasesin coefficients on the addition of the individual orcommunity-level variable pair 177–8
4.10.4 Comparing the explanatory power of individual- andcommunity-level variables on infant and child mortality;marginal adjusted-R2s 180
4.11.1 Infant and child mortality change over time, by socialclass and environment, OPCS 188
4.11.2 Infant mortality percentage change over time, by socialclass and environment 190
4.11.3 Multiple regression: the effect of social class and othersocio-economic variables on infant and child mortality,with parity, by marital duration group 192–3
5.2.1 The average age of marriage (under 35 years) of wivesby husband’s class and by environment, for selectedmarriage cohorts, OPCS 1911 223
5.2.2 Average age at marriage of brides (aged less than 35) byclass and environment; 10–14 year marital durationcohort, OPCS 1911 224
5.2.3 Rates of celibacy (percentage unmarried aged 45–54)among females and males by environment and bysectors within environment: OPCS 1911 226
5.2.4 The average age of marriage (under 35 years) of groomsby class and by environment for selected marriagecohorts, OPCS 1911 229
5.2.5 Average age of men marrying aged less than 35,marriage duration 10–14, by environment and class,OPCS 1911 230
5.2.6 The average age of brides marrying aged less than35 years, the average age of their husbands, and thedifference between the two, by husband’s class for fourmarriage cohorts, OPCS 1911 231
5.2.7 The average age of groom and the average difference inspousal age (in years) at marriage of couples where thebride married aged less than 35 in 1896–1901 by classand environment, OPCS 1911 232
5.3.1 Living arrangements per thousand children: all OPCSchildren aged <5 years and 5–9 years 236
xvi List of tables
5.3.2 Living arrangements per thousand children: OPCSchildren aged <5 years by environment, 1891 and 1911 237
5.3.3 Total marital fertility rates (TMFRs), by OPCSenvironment 1891, 1901 and 1911 241
5.4.1 Coale and Trussell’s n(a), R(a) and v(a) for seven agegroups of mothers 252
5.4.2 The values of M and m and the mean square error termscalculated using the Coale and Trussell parameters, forthe four OPCS environments in 1891, 1901 and 1911 255
5.5.1 The upper and lower bounds of the percentages ofcouples controlling their fertility in England and Walesand target OPCS populations, as calculated by CPA 264
5.6.1 Number of co-resident married women in 1911 OPCSpopulation by age of marriage and duration ofmarriage 269
5.6.2 The number of couples available to calculate paritydistribution, wives aged 20–29 at marriage, byenvironment and marital duration, OPCS 1911 270–1
5.6.3 Numbers and proportions marrying aged <35 years, bywife’s five-year age group, by class and environment,1896–1901 marriage cohort 274–5
5.6.4 Average number of live births achieved, byenvironment, class and duration of marriage, OPCS1911: wife married aged 20–29 (weighted) 276–7
5.6.5A Family building in early marriage by couples where thenumber of children ever born as reported in the 1911census equals the number of own children living in thehousehold on census night 1911, wives married aged20–24 282–3
5.6.5B Family building in early marriage by couples where thenumber of children ever born as reported in the 1911census equals the number of own children living in thehousehold on census night 1911, wives married aged25–29 284–5
5.7.1 Total marital fertility rates, by male occupation, allOPCS, 1891, 1901 and 1911 291
5.7.2 The number of ‘other workers in agriculture’ aged 15–64,per 100 farmers and farmers’ relatives aged 15–64, in fiveAgricultural OPCS locales, 1891–1911 292
5.7.3 Total marital fertility rates for males in ‘mining’occupations for selected OPCS locales, 1891, 1901 and1911 294
List of tables xvii
5.7.4 Total marital fertility rates, by male occupation andOPCS environment, 1891, 1901 and 1911 296–7
5.8.1 Proportion of women returning an occupation in eachcensus, by marital status and age (15 and over), OPCSpopulation 1891–1911 300
5.8.2 Percentage of wives who were in employment, bymarital duration, in selected places and environments,OPCS 1911 306
5.8.3 The percentage of couples in selected OPCS locales, bywife’s employment status and marital duration, whohad achieved an actual and effective parity of 2 310
5.8.4 Actual achieved and effective fertility of employed, non-employed and all women in four selected communities,1911, for three marital durations 312
5.9.1 Standardised total fertility and child mortalityexperience of couples where the wife is aged less than45 years and where the husband or wife works inselected occupations, England and Wales, 1911 314
5.9.2 The occupational distribution of the wives of husbandsreported to be working in selected occupations, allOPCS 1911 316
5.9.3 The total fertility, effective fertility and ‘survival ratio’for selected husband/wife occupation combinations,by marital duration. Selected communities, OPCS 1911 318
6.1.1 The constituent geographical divisions of England andWales 340–1
6.1.2 Geographic variation in child mortality and fertility inthe census divisions of England and Wales, 1911 342
6.2.1 The geographic distribution of the population living ineach of the OPCS environments: England and Walescensus divisions (percentages based on 1921 populationfigures) 349
6.3.1 The relationships between standardised child mortalityand other factors: regression analysis, England andWales, 1911 358–9
6.3.2 Mortality regressions, the national picture: the relativeimportance of variables, as shown by adjusted R2 andmarginal adjusted R2 for each variable 361
6.4.1 The position within their household of unmarriedwomen aged 45–49, by OPCS environment, 1911 370
6.5.1 The relationships between standardised fertility and otherfactors: regression analysis, England and Wales, 1911 382–3
xviii List of tables
6.5.2 The employment of women aged 10 and over in thecounties of England and Wales, 1911 385–7
6.5.3 The proportion of marriages by denomination, bycounty, England and Wales, 1910 391–2
6.5.4 Occupations, fertility and religion in the great townsand rural districts of Lancashire and the West Riding,1851 and 1911 396–7
7.2.1 Percentage distributions for the population of Englandand Wales, 1700 and 1801–1911; by size of place, andpercentage growth per decade in all towns and citieswith over 10,000 inhabitants 414
A.1 Calculation of proportions of children who have died,for England and Wales, showing transformation ofproportions died into probabilities of dying usingmultipliers 443
A.2 Time trending: the calculation of the reference periodfor each estimate 447
A.3 Expressing all the estimates as infant mortality 448A.4 Calculation of the mortality index 461–3
List of tables xix
1
Introduction
1.1 The fast-changing demography of England and Wales, c. 1880–1920
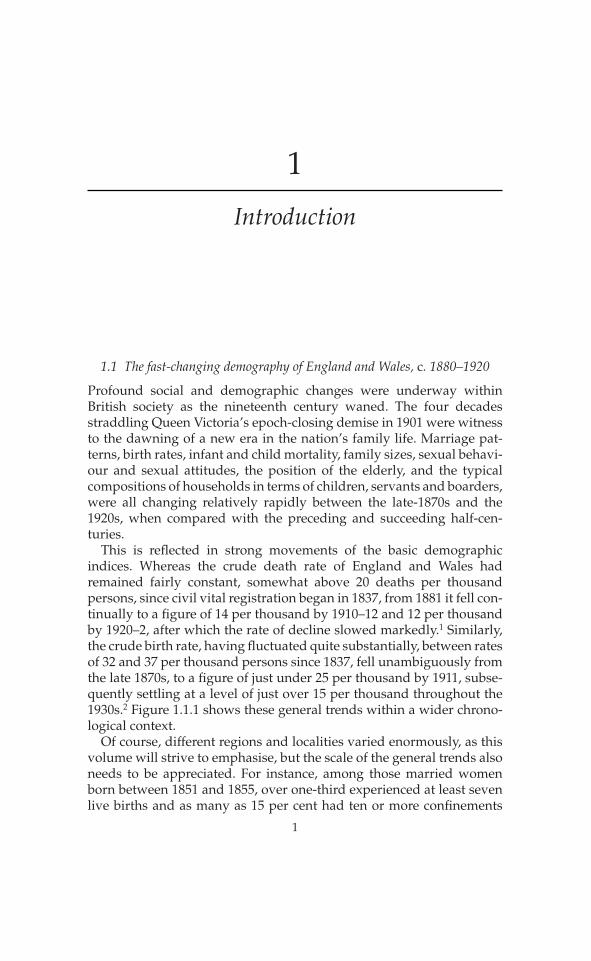
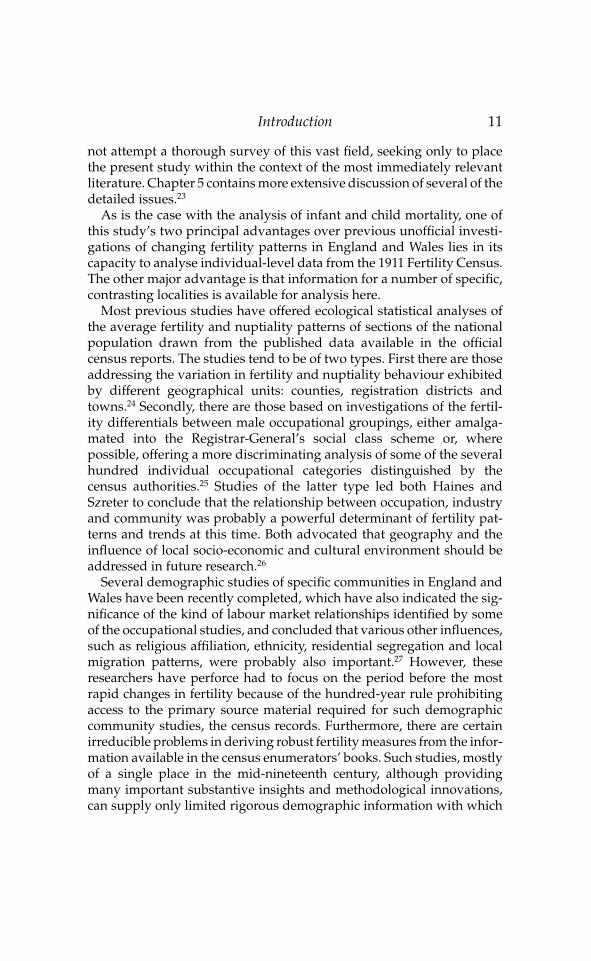
Profound social and demographic changes were underway withinBritish society as the nineteenth century waned. The four decadesstraddling Queen Victoria’s epoch-closing demise in 1901 were witnessto the dawning of a new era in the nation’s family life. Marriage pat-terns, birth rates, infant and child mortality, family sizes, sexual behavi-our and sexual attitudes, the position of the elderly, and the typicalcompositions of households in terms of children, servants and boarders,were all changing relatively rapidly between the late-1870s and the1920s, when compared with the preceding and succeeding half-cen-turies.
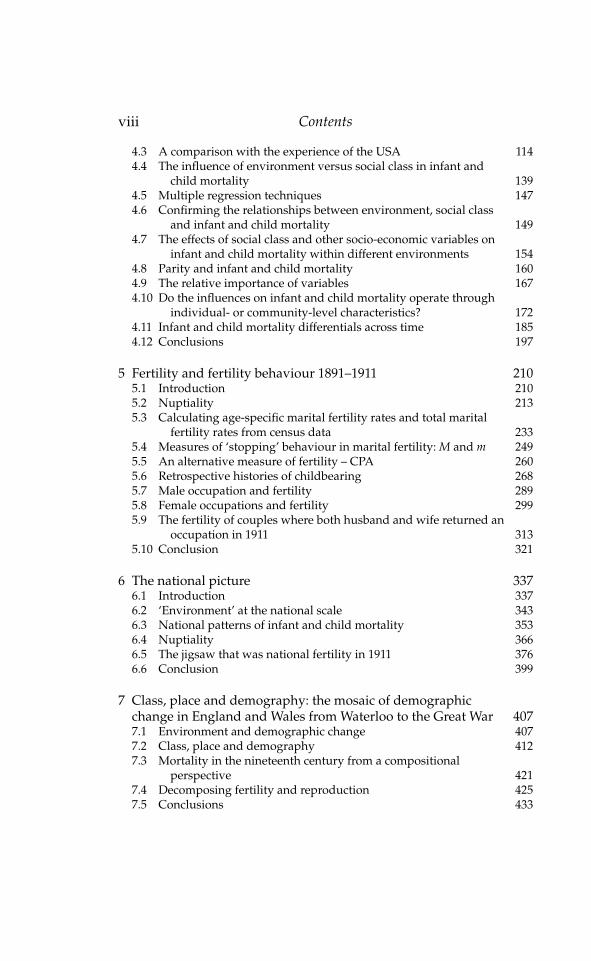
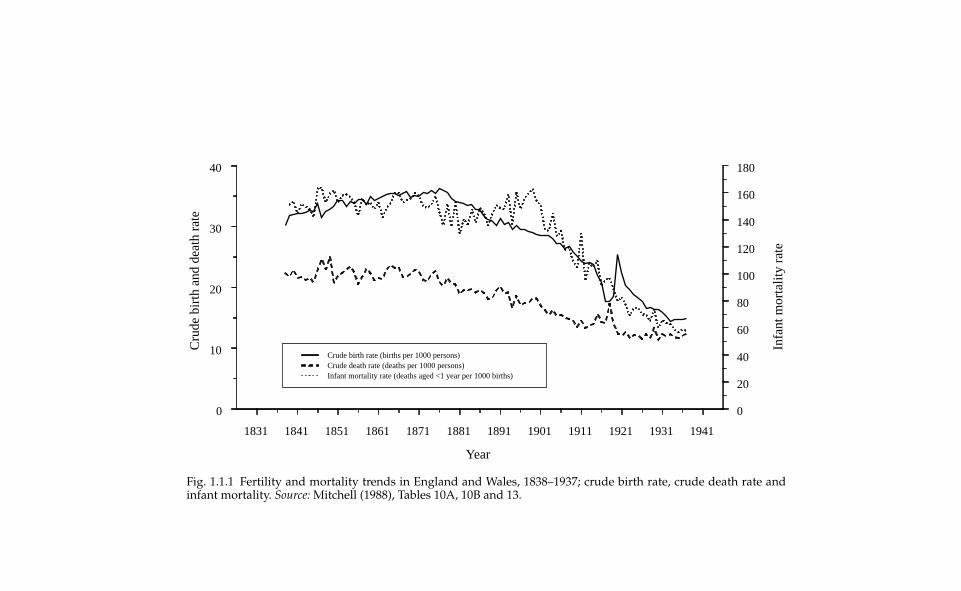
This is reflected in strong movements of the basic demographicindices. Whereas the crude death rate of England and Wales hadremained fairly constant, somewhat above 20 deaths per thousandpersons, since civil vital registration began in 1837, from 1881 it fell con-tinually to a figure of 14 per thousand by 1910–12 and 12 per thousandby 1920–2, after which the rate of decline slowed markedly.1 Similarly,the crude birth rate, having fluctuated quite substantially, between ratesof 32 and 37 per thousand persons since 1837, fell unambiguously fromthe late 1870s, to a figure of just under 25 per thousand by 1911, subse-quently settling at a level of just over 15 per thousand throughout the1930s.2 Figure 1.1.1 shows these general trends within a wider chrono-logical context.
Of course, different regions and localities varied enormously, as thisvolume will strive to emphasise, but the scale of the general trends alsoneeds to be appreciated. For instance, among those married womenborn between 1851 and 1855, over one-third experienced at least sevenlive births and as many as 15 per cent had ten or more confinements
1
1831 1841 1851 1861 1871 1881 1891 1901 1911 1921 1931 1941
Year
0
10
20
30
40
Cru
de b
irth
and
dea
th r
ate
0
20
40
60
80
100
120
140
160
180
Infa
nt m
orta
lity
rate
Crude birth rate (births per 1000 persons)Crude death rate (deaths per 1000 persons)Infant mortality rate (deaths aged <1 year per 1000 births)
Fig. 1.1.1 Fertility and mortality trends in England and Wales, 1838–1937; crude birth rate, crude death rate andinfant mortality. Source: Mitchell (1988), Tables 10A, 10B and 13.
during the course of their lives. But of those women born half a centurylater, between 1901 and 1905, less than 5 per cent of those who marriedhad seven or more children and only 1 per cent had ten or more. Sixteenper cent of the earlier cohort and 21 per cent of the later cohort werechildless. Whereas 15 per cent of the former had only one or two chil-dren, almost 50 per cent of the latter cohort had families of this smallsize.
The kinship simulation calculations of Zhao, based on data from the1911 and 1961 censuses of England and Wales, have demonstrated howthese demographic changes had important implications for the typicalpattern of family life and individuals’ personal experiences.Grandparenthood or, reciprocally, the experience of knowing one’sgrandparents, is a good example of this. Only 34 per cent of the womenborn in the 1850s still had both parents alive in the 1880s when theythemselves were in their thirties and bringing up young families; butover 60 per cent were in this position among those born in the 1900s andbringing up their families in the 1930s.3 Contrary to popular assump-tions that grandparents are now less involved with their children’s fam-ilies than in the past, the simulations show that full and activegrandparenthood has only become a general demographic possibilityrelatively recently. The capacity of parents with young children to callon their own parents for assistance during the child rearing years andthe possibility of children learning from and coming to know their owngrandparents was a rarity in the mid-nineteenth century; it only becamea common possibility in the twentieth century. Change also engulfedthe experience of the grandparental generation. Of those women fromthe 1850s birth cohort who survived to be 75, over half would have morethan five living grandchildren. Among the women from the 1900 birthcohort surviving to the same age, fewer than 14 per cent had such a largenumber of grandchildren. More than half of this generation had nograndchildren to help celebrate their seventy-fifth birthday; indeed, 43per cent had no children with whom to celebrate. Among the cohortfrom the 1850s the equivalent figures were, respectively, about 35 percent and 31 per cent.
The dramatic fertility and mortality changes occurring during thethree to four decades preceding the Great War were thus exerting arange of powerful short-, medium- and long-term effects on family life,individual experience and society. In combination, the changes createdan inter-war Brave New World of ‘demographic certainty’, a societywhere individuals found themselves relatively emancipated from thenatural caprices of birth and death, probably for the first time in humanhistory.4 The present volume is a further contribution towards the
Introduction 3
academic enterprise of attempting to understand and explain how andwhy these fundamental demographic shifts occurred. The ensuingstudy focuses in particular on fertility change and that dimension ofmortality change which has been most closely related to fertility: deathsamong infants and children.
1.2 Demography, national anxiety and the 1911 census
For the present study, among many others, the most important materi-als for studying these historical demographic phenomena in Englandand Wales remain the official products of the General Register Office(GRO), the department of state responsible for administering thenation’s vital registration system and its decennial population census.By the Edwardian era the nation’s decennial census had been in regularoperation for just over a century, having been in the capable hands ofthe GRO from the beginning of Victoria’s reign.5
The GRO quite justifiably long enjoyed a reputation for demographicand epidemiological expertise of a high order. It always did much morethan just manage the mammoth intelligence exercise of the collection ofregistration and census data, as stipulated in the relevant Acts ofParliament governing its duties. The GRO very quickly establisheditself as the principal analyst and interpreter of the nation’s changingdemographic and epidemiological patterns.6 Until the inter-war periodit was staffed by an unbroken succession of extraordinarily able, medi-cally trained statisticians, each with a profound interest in the promo-tion of the environmentalist, preventive public health programme, inwhich they had typically served an apprenticeship as a local MedicalOfficer of Health (MOH). The GRO’s analytical capacity with respect toepidemiological change was therefore highly developed by the begin-ning of the twentieth century. In that same era, however, the GRO’s offi-cials, as the nation’s medical and social scientific experts on populationquestions, found themselves inadequately equipped in terms of statis-tical tools, available data and relevant knowledge to analyse and com-prehend the increasingly obvious downward plunge of the nationalbirth rate.
In the 1880s and 1890s there had been an upsurge of concern over aset of long-standing worries about the ‘degenerating’ effects of urbanexistence on the human organism. This came to a head in the Edwardiandecade as the nation underwent a prolonged bout of public soul-search-ing in the wake of the South African Wars of 1899–1902. The great BritishEmpire had found itself militarily humbled at the hands of the Boerfarmers and, with bizarre logic, placed the blame for this ignominy not
4 Changing family size in England and Wales
on defective military leadership or ineffectively conducted campaignsbut on the poor physical quality of those members of the workingclasses who did not fight. The high rejection rates of those trying toenlist at urban recruiting stations was seen to be symptomatic of a with-ering of vitality and virility which was undermining ‘national effi-ciency’; a sign that the ‘lower orders’ with their high fertility, poor childsurvival rates and low standards of health were reducing the averageBriton’s physical and mental prowess.7
Explanations and remedies for this state of affairs divided into twomain camps. Hereditarian eugenicists argued that the higher infant andchild mortality among the urban poor reflected their deficient biologi-cal stock. To achieve ‘national efficiency’, the hereditarians argued, thestate must abandon expensive ameliorative social policies towards thepoor. Instead, this strata of society should be discouraged from repro-ducing themselves, while the wealthy should be given greater incen-tives to increase the number of their children in order to increase theaverage quality of the nation once more. Karl Pearson in particularbrought this line of thought to public attention, highlighting the class-differential aspect of both the infant mortality and the birth rates.8
In opposition to these views stood the environmentalists who arguedthat the high mortality, deficient health and physical development, poorlearning capacities and large families of the poor all resulted from theharsh and insecure urban industrial environment in which so manylived. The public health movement of the Edwardian era had well overhalf a century of work based on such environmentalist thinking behindit.9 The nascent systems of social, medical and educational services putin place through the efforts of the movement were now being deridedby their eugenic opponents as a waste of public money. The publichealth officials thus had strong political motivation to test and refuteeugenic views. The Registrar-General, W. C. Dunbar, the Chief MedicalOfficer of the Local Government Board, Arthur Newsholme, and theChief Superintendents of Statistics at the GRO, John Tatham and T. H. C.Stevenson, all took great pains over the first decade of the century toperfect various demographic measuring techniques, both to increasetheir own understanding and to provide counter-arguments to theeugenicists’ claims.10 In so doing they collated and analysed the mostimportant sources of demographic information available for studyingchanges in infant and child survival and fertility behaviour, andplanned the 1911 census inquiry.
In 1911, following the 1900 census of the USA and the New SouthWales census of 1901, and in tandem with the census of Scotlandand Ireland, the census of England and Wales carried a new suite of
Introduction 5
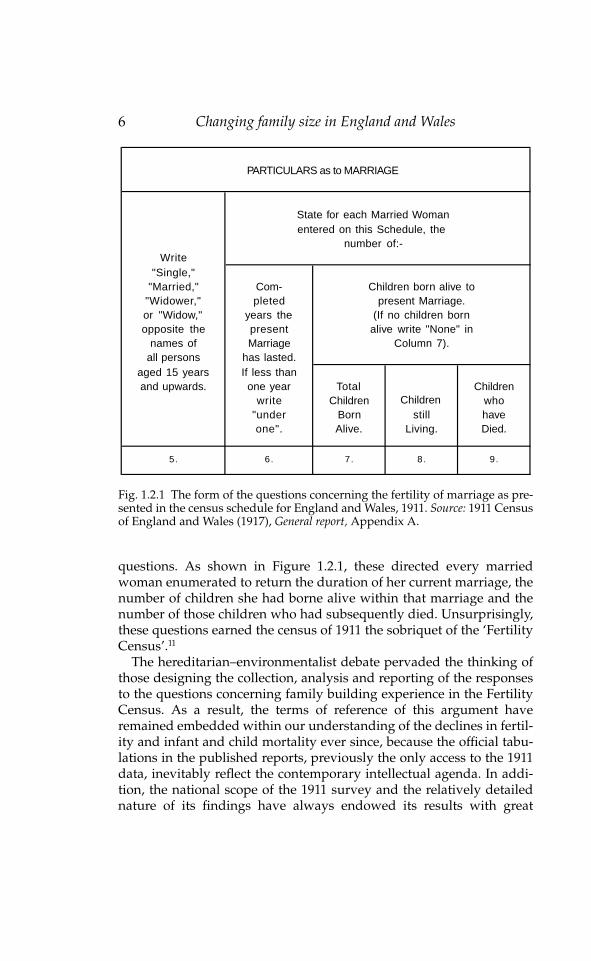
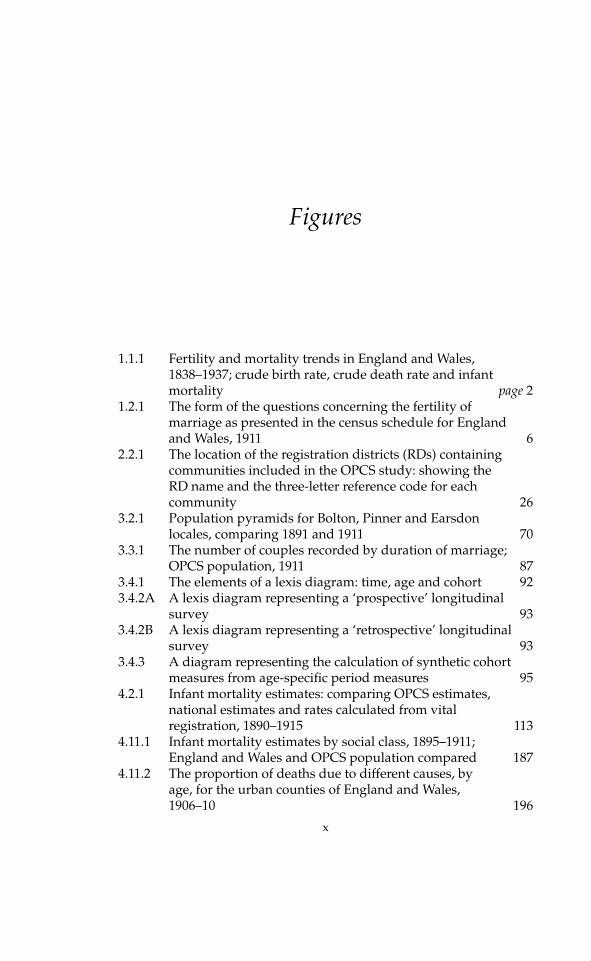
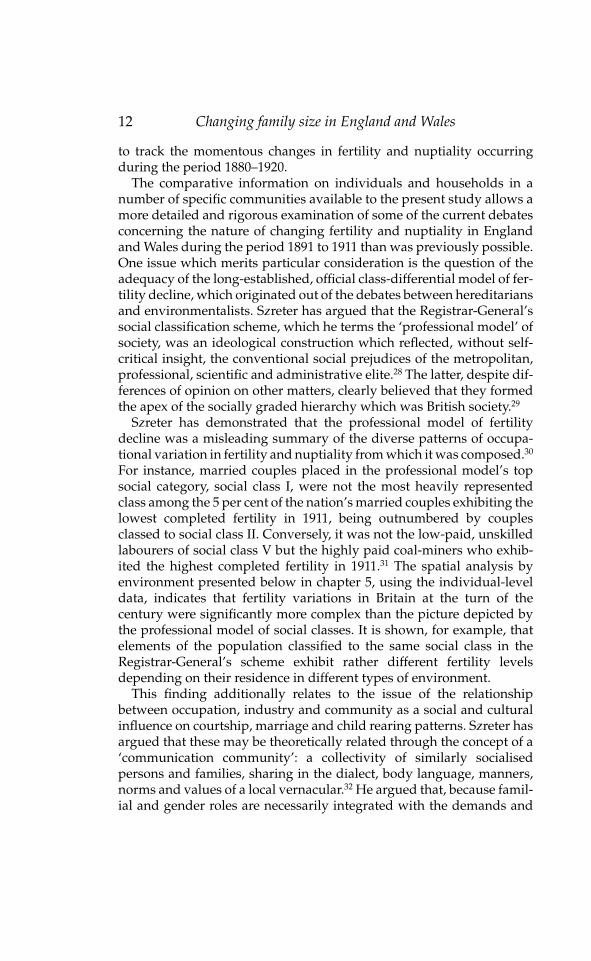
questions. As shown in Figure 1.2.1, these directed every marriedwoman enumerated to return the duration of her current marriage, thenumber of children she had borne alive within that marriage and thenumber of those children who had subsequently died. Unsurprisingly,these questions earned the census of 1911 the sobriquet of the ‘FertilityCensus’.11
The hereditarian–environmentalist debate pervaded the thinking ofthose designing the collection, analysis and reporting of the responsesto the questions concerning family building experience in the FertilityCensus. As a result, the terms of reference of this argument haveremained embedded within our understanding of the declines in fertil-ity and infant and child mortality ever since, because the official tabu-lations in the published reports, previously the only access to the 1911data, inevitably reflect the contemporary intellectual agenda. In addi-tion, the national scope of the 1911 survey and the relatively detailednature of its findings have always endowed its results with great
6 Changing family size in England and Wales
Fig. 1.2.1 The form of the questions concerning the fertility of marriage as pre-sented in the census schedule for England and Wales, 1911. Source: 1911 Censusof England and Wales (1917), General report, Appendix A.
PARTICULARS as to MARRIAGE
State for each Married Womanentered on this Schedule, the
number of:-Write
"Single,""Married," Com- Children born alive to
"Widower," pleted present Marriage.or "Widow," years the (If no children bornopposite the present alive write "None" in
names of Marriage Column 7).all persons has lasted.
aged 15 years If less thanand upwards. one year Total Children
write Children Children who"under Born still haveone". Alive. Living. Died.
5. 6. 7. 8. 9.

authority, overshadowing subsequent studies exploring alternativesources of demographic information.
It has long been recognised that the 1911 census returns represent, forBritain, the most important and comprehensive body of historical dem-ographic evidence compiled for the study of changing fertility, nuptial-ity and mortality among the young during the period before the GreatWar. In England and Wales present law prohibits public access to theoriginal individual-level census returns for a century after their collec-tion. Previously, therefore, students have had to content themselveswith secondary analysis of the official tabulations published by theGRO. Thanks to the interest and persistence of Stevenson, the GRO’schief statistician at the time, a great deal of extremely valuable materialfrom the 1911 census was abstracted and published in two volumes: aninterim report presenting results in tabular form was published in 1917,while a much lengthier, more exhaustive and analytic report came outin 1923.12 As a form of shorthand these are referred to as the Fertility ofmarriage report, Parts I and II throughout the ensuing text. Much can beand has been done with this and with other related official evidence –work which is briefly surveyed in the ensuing historiographical review– but conclusive and rigorous analysis and verification of varioushypotheses concerning the detailed course of demographic changeduring this period necessarily awaits direct access to the original house-hold enumeration records from the 1911 census, scheduled to bereleased into the public domain on 2 January 2012.13
In the mid-1980s, however, the Cambridge Group was able to com-mission the production of abstracts of a sample of anonymisedindividual-level returns drawn from the 1891, 1901, 1911 and 1921Census of England and Wales from the Office of Population Censusesand Surveys (OPCS) which were provided on magnetic tape. Namesand addresses were not provided in the abstracts, and members of theGroup working with OPCS at the time were required to sign the OfficialSecrets Act. The abstracts were provided only for research carried outby the Group and remained in its custody at all times. The abstractshave now been returned to the Office for National Statistics, successorto OPCS. The early release of a certain amount of data from the 1911Fertility Census, drawn from 13 localities across England and Wales,provides the opportunity to examine afresh the evidence for demo-graphic change at the level of the individual couple and the community.Furthermore, since parents were asked by the 1911 census to record notonly the number of children ever born to their current marriage but alsothe number who had subsequently died, their answers provideretrospective data which allow analysis of comparative levels and
Introduction 7
trends in infant and child mortality as well as fertility. The ability of thepresent study to use individual-level data largely overcomes the limita-tions associated with analysis based on ecological correlations oftenencountered by previous studies based on the published 1911 censustabulations. This study will be able to demonstrate some of the kinds ofinsights which the original census returns permit above and beyondthose detailed in the published reports. The two facets of the originalinquiry, infant and child mortality and marital fertility, are examinedseparately in the following chapters; a convention followed in thehistoriographical sections below.
1.3 A new approach to infant and child mortality – the historiographicalcontext
The study of fertility and mortality change has, of course, attracted anenormous range and volume of contributions over the course of thetwentieth century, beginning with the preoccupations of the contempo-rary social commentators, academics and officials discussed in the pre-vious section. Within this field the idea of demographic transition hasbeen a long-lived and influential model. In its classic formulation, pub-lished by F. W. Notestein in 1945, it emerged as a well-elaborated, com-prehensive and testable theory which provided an integrated accountof both mortality and fertility change, with economic growth providingthe prime mover.14 However, it has long been acknowledged that thewell-documented historical populations of France, USA and Hungaryall refuted one of the theory’s central specifications – that mortality fellbefore fertility. Furthermore, in Britain’s case it has always been consid-ered a major embarrassment for the theory that fertility appears to havefallen long before infant mortality. Since the demise of transition theoryno other thesis has succeeded in commanding attention in the sameway. The term demographic transition has therefore continued to beused to refer to the two principal dimensions of modern demographicchange, fertility and mortality decline, but in practice they have beenstudied for many decades as quite distinct processes, each with its ownseparate literature. Moreover, the study of infant mortality has beensubstantially conducted as a specialist subject in its own right, reflect-ing its quite distinctive aetiology and epidemiological patterns.
The aim of explaining the overall mortality decline at all ages has con-tinued to attract grandiose theories, such as the McKeown thesis ofnutritional determinism.15 But the effort to understand changing pat-terns of death specifically among the very young has been characterisedby a more inductive and exploratory approach. Such research has exam-
8 Changing family size in England and Wales
ined a wide range of theses, principally including the role of the follow-ing factors: poverty, class, overcrowding, maternal and infant nutrition,inadequacy of domestic hygiene facilities and feeding practices, sani-tary state of the wider environment outside the home, breast-feeding,general child care and its interaction with female working practices, andfamily size and frequency of childbearing. In the attempt to throw lighton the relative importance of these various factors much effort has beendevoted by a number of scholars to careful statistical inference from arange of comparative epidemiological data. The changing infant andchild mortality rates of various different populations have thereforebeen compared: the Registrar-General’s social classes, urban versusrural rates, distinct regions of the country, socially different parts of thesame city, and different kinds of city.16 Other studies have shown thatthe distinct child rearing and feeding practices of different ethnicgroups can substantially influence mortality among the young – aclassic example being the low fatality rate of immigrant Jews inLondon’s East End, regardless of exposure to a whole battery of the neg-ative influences most strongly implicated elsewhere.17 Woods and hiscolleagues have maintained that a very wide range of factors were allinvolved in explaining infant mortality change; and, in a completeinversion of classic demographic transition theory, they have even sug-gested that falling fertility may also have been a factor, enhancing sur-vivorship chances in smaller, more widely spaced families.18
By contrast, in their major comparative study of the USA andEngland and Wales Preston and Haines indicated that social class diffe-rentials were the most significant determinants of infant mortality inEngland and Wales, whereas other factors were more important in theUSA. They used published data from the census of 1911 of England andWales to analyse infant mortality differentials between the Registrar-General’s social classes along with a range of socio-economic vari-ables.19 In a separate publication Haines appeared to show that theseclass differentials had been widening down to 1911.20 The authors did,however, point out that they suspected these social class findings mightbe reflecting the influence of various spatial factors, such as residentialsegregation, but were not able to pursue this possibility further.21 Thisis certainly one aspect of analysis on which the present study has beenable to cast significantly greater light.
The likely significance of spatial factors has already been indicated byWatterson, who analysed different tabulations from the 1911 censuspublications, according to place of residence.22 Watterson found impor-tant differentials between urban and rural populations but, further-more, argued that type of urban place appeared to be of considerable
Introduction 9
significance, suggesting that the more industrial a town, the less healthyit was. This approach is further developed in chapters 4 and 6 of thepresent study through the application of a typology of ‘environments’,enabling the largely urban population of early twentieth-centuryEngland and Wales to be classified according to its local occupationaland industrial complexion. Using this scheme it has been possible todemonstrate that the suspicions both of Preston and Haines and ofWatterson, regarding the greater significance of residential environmentrather than class affiliation according to the Registrar-General’s socialclassification scheme, are indeed well founded. A multiple regressionanalysis finds that the new analytical category of ‘environment’ is con-sistently able to explain more variance in infant and child mortality thanthe Registrar-General’s social classes.
In chapter 6 the published, tabulated census material for the wholepopulation of England and Wales is re-examined, applying an ‘envi-ronmental’ analysis to the urban and rural patterns of infant and childmortality in the very early twentieth century. Some interesting perspec-tives on the overall geography of mortality among the young are pro-duced, and the chapter emphasises the greater quantitative importanceof the populous and often very unhealthy regions of Lancashire andWest Yorkshire, dominated by the classic staple industries of textiles,mining, engineering and metal founding, over the less industrialisedcapital city of London, in influencing trends in the nation’s mortalityrates during this period. It can also be shown through this approach thatLondon was not in fact as healthy as some contemporary observersseemed to believe.
It has also proved possible, using the individual-level census data, toexamine rigorously a favourite thesis among many contemporaryEdwardian analysts of infant mortality: the supposed negative effects ofmaternal employment on infant mortality rates. The research reportedin chapters 4 and 5 concludes that figures supporting the ‘maternalemployment hypothesis’ published in the 1911 Fertility of marriagereport (and also the putative finding by Haines of widening class diffe-rentials in mortality among the young) are essentially the product of sta-tistical artefacts in a retrospective source such as the 1911 census.
1.4 Fertility and nuptiality – debates and description
Where the study of change and variation in human fertility is concernedthe output from both historians and social scientists since the SecondWorld War has been very substantial, even if only those works strictlyrelevant to British history are considered. This brief introduction does
10 Changing family size in England and Wales
not attempt a thorough survey of this vast field, seeking only to placethe present study within the context of the most immediately relevantliterature. Chapter 5 contains more extensive discussion of several of thedetailed issues.23
As is the case with the analysis of infant and child mortality, one ofthis study’s two principal advantages over previous unofficial investi-gations of changing fertility patterns in England and Wales lies in itscapacity to analyse individual-level data from the 1911 Fertility Census.The other major advantage is that information for a number of specific,contrasting localities is available for analysis here.
Most previous studies have offered ecological statistical analyses ofthe average fertility and nuptiality patterns of sections of the nationalpopulation drawn from the published data available in the officialcensus reports. The studies tend to be of two types. First there are thoseaddressing the variation in fertility and nuptiality behaviour exhibitedby different geographical units: counties, registration districts andtowns.24 Secondly, there are those based on investigations of the fertil-ity differentials between male occupational groupings, either amalga-mated into the Registrar-General’s social class scheme or, wherepossible, offering a more discriminating analysis of some of the severalhundred individual occupational categories distinguished by thecensus authorities.25 Studies of the latter type led both Haines andSzreter to conclude that the relationship between occupation, industryand community was probably a powerful determinant of fertility pat-terns and trends at this time. Both advocated that geography and theinfluence of local socio-economic and cultural environment should beaddressed in future research.26
Several demographic studies of specific communities in England andWales have been recently completed, which have also indicated the sig-nificance of the kind of labour market relationships identified by someof the occupational studies, and concluded that various other influences,such as religious affiliation, ethnicity, residential segregation and localmigration patterns, were probably also important.27 However, theseresearchers have perforce had to focus on the period before the mostrapid changes in fertility because of the hundred-year rule prohibitingaccess to the primary source material required for such demographiccommunity studies, the census records. Furthermore, there are certainirreducible problems in deriving robust fertility measures from the infor-mation available in the census enumerators’ books. Such studies, mostlyof a single place in the mid-nineteenth century, although providingmany important substantive insights and methodological innovations,can supply only limited rigorous demographic information with which
Introduction 11
to track the momentous changes in fertility and nuptiality occurringduring the period 1880–1920.
The comparative information on individuals and households in anumber of specific communities available to the present study allows amore detailed and rigorous examination of some of the current debatesconcerning the nature of changing fertility and nuptiality in Englandand Wales during the period 1891 to 1911 than was previously possible.One issue which merits particular consideration is the question of theadequacy of the long-established, official class-differential model of fer-tility decline, which originated out of the debates between hereditariansand environmentalists. Szreter has argued that the Registrar-General’ssocial classification scheme, which he terms the ‘professional model’ ofsociety, was an ideological construction which reflected, without self-critical insight, the conventional social prejudices of the metropolitan,professional, scientific and administrative elite.28 The latter, despite dif-ferences of opinion on other matters, clearly believed that they formedthe apex of the socially graded hierarchy which was British society.29
Szreter has demonstrated that the professional model of fertilitydecline was a misleading summary of the diverse patterns of occupa-tional variation in fertility and nuptiality from which it was composed.30
For instance, married couples placed in the professional model’s topsocial category, social class I, were not the most heavily representedclass among the 5 per cent of the nation’s married couples exhibiting thelowest completed fertility in 1911, being outnumbered by couplesclassed to social class II. Conversely, it was not the low-paid, unskilledlabourers of social class V but the highly paid coal-miners who exhib-ited the highest completed fertility in 1911.31 The spatial analysis byenvironment presented below in chapter 5, using the individual-leveldata, indicates that fertility variations in Britain at the turn of thecentury were significantly more complex than the picture depicted bythe professional model of social classes. It is shown, for example, thatelements of the population classified to the same social class in theRegistrar-General’s scheme exhibit rather different fertility levelsdepending on their residence in different types of environment.
This finding additionally relates to the issue of the relationshipbetween occupation, industry and community as a social and culturalinfluence on courtship, marriage and child rearing patterns. Szreter hasargued that these may be theoretically related through the concept of a‘communication community’: a collectivity of similarly socialisedpersons and families, sharing in the dialect, body language, manners,norms and values of a local vernacular.32 He argued that, because famil-ial and gender roles are necessarily integrated with the demands and
12 Changing family size in England and Wales

opportunities available in the local labour market, if a specific industryor form of employment predominates in a particular locality, it willendow that community with particular norms for family life. These, ofcourse, may change over time, especially if the relevant characteristicsof the main industries change. The point is that an intimate connectionbetween the employment and industrial complexion of a communityand its fertility, courtship and nuptiality characteristics can be expected.Chapters 5 and 6 of the present study add further evidence and supportto the argument that distinctive local demographic regimes existed,especially where there was the dominant presence of a particular kindof employment, as in middle-class Pinner with its high demand fordomestic servants, the potteries of Stoke, the coalfields of South Walesand the North East, or the mill towns on either side of the Pennines.Indeed, the thesis is amplified by demonstrating that the differentlygendered and class-specific local labour markets led to quite diverse ageand sex structures in the communities under examination. Since suchdiversity was particularly marked at the key marriage ages, there werestrong implications in this for local marriage markets, courtship prac-tices and sexual codes. This therefore explains why fertility and nuptial-ity patterns may have varied as an attribute of ‘communicationcommunities’.
Szreter’s vision of distinctive communication communities, eachwith its own trajectories of fertility and nuptiality change, raises theissue of multiple, independent fertility declines in Britain. This contrastssharply with the long-established professional model of a single,socially graded process of fertility decline gradually diffusing down aputative social hierarchy.33 Woods, too, has called into question thenotion of a change starting at the social apex and subsequently spread-ing from there, noting that the Registrar-General’s social classes tend toexhibit a close simultaneity in the downward movement of their fertil-ity indices, with the main difference being that the higher social classesexhibit lower fertility, but not necessarily earlier reductions in fertility.34
This is a major area of contention in the historiography, since the mostimportant previous interpretations of fertility change have presentedtheir respective theses on the premise that a single, identifiable causalprocess, albeit complex and not necessarily reducible to a single factor,was at work in producing falling fertility throughout British society,with argument centring on the extent to which economic, cultural orsocial forces were of primary significance.35
Unfortunately, conclusive, relevant analyses to test the thesis thatBritain’s late-nineteenth-century demography was fragmented into anumber of distinctive communication communities were beyond the
Introduction 13
reach of the present study. The anonymous nature and spatial structure ofthe data extracted from the 13 locales precluded any record linkage meth-odology and thus prevented a thorough socio-economic and culturalreconstruction of each community. The application of the fourfold envi-ronmental typology to national data, presented in chapter 5, does,however, identify at least two spatially distinct geographical regions of thecountry in which low fertility emerged relatively early, substantiatingWoods’ point. The first, in the South, comprised many districts in whichthere was a strong middle-class residential presence, although it is impor-tant to recognise, as demonstrated in chapter 5, that the low fertility ofthese areas was by no means confined only to the upper- and middle-classhouseholds they contained. Secondly, there were the ‘textile regions’: anarea encompassing not just the mill towns of Lancashire and Yorkshire’sWest Riding, but also the textile districts of the neighbouring East Midlandcounties of Derbyshire, Nottinghamshire and Leicestershire. While it iseasy to conceive of connecting communications within each of these twovery diverse regions, it is much more difficult to envisage connections spe-cifically between them and no other regions; and thus the concepts of com-munication communities and of multiple fertility declines rather than theunitary ‘diffusion’ process do gain a degree of support from the workundertaken here, although many questions still remain.
There has always been much debate over the relationship betweenfemale employment and fertility, and the present study is also able tooffer an important contribution in this area. It was clearly recognised byEdwardian observers that those parts of the country in which womenworked outside the home in textile factories tended to exhibit relativelylow birth rates. As mentioned above, it was also noted that such areasrecorded relatively high rates of infant mortality. In both cases, there wasan obvious, straightforward causal inference which it was tempting todraw and which contemporaries, including Stevenson at the GRO,sought to verify in empirical studies. On the fertility side it has been sup-posed that the need for, or desire of, a mother to remain in paid employ-ment militated against large families. On the mortality side, workingmothers were condemned on the grounds that their infants suffered fromthe lack of breast-feeding and care which their mothers’ absence fromhome entailed. Stevenson was able to produce tables from the 1911 censusreturns demonstrating that mothers in the labour force did indeed recordboth extremely low fertility and very high infant mortality.36
Although many historians have been rightly critical of the ideologi-cal bias which is evident in such studies, slanted as they were againstworking-class women and their means of earning a living, there hasbeen little previous attempt to question the statistical associations
14 Changing family size in England and Wales
which they reported.37 Using the individual-level data available fromthe 1911 OPCS localities, it is demonstrated in chapters 4 and 5 that thestatistical association between maternal employment and both highinfant mortality and low fertility probably flowed in precisely the oppo-site direction to that supposed by contemporaries. Married womentended to be enumerated in employment at the census, it is argued,because of their low effective fertility: they had either had few childrenor suffered a high rate of child loss. In other words, those mothersreported by the census to be in the labour force were selected for theirprior low fertility or high infant mortality. Mothers worked because theyhad few children to care for; they did not necessarily have few childrenbecause they worked. Of course, in many parts of the country there waslittle paid work outside the home available for women, and so this selec-tion effect only became statistically obvious in those few areas, such asthe textiles regions, where female employment opportunities wereavailable in abundance. This important finding also implies that theremarkably low fertility of most mill towns was not simply due to thedirect consequences of married women working. This returns us onceagain to consideration of the probable importance of the overall socio-demographic character and unusual labour markets of these particulartowns in creating a particular set of social relationships and familialroles conducive to low-fertility norms of family life, shared by all in thecommunication community.
Finally, this brief historiographical introduction should draw atten-tion to the relevance of the work reported below in chapter 5 for therecent debates within the fertility literature on the question of ‘stopping’versus ‘spacing’ or ‘starting’. Until the 1980s the historical demographyof fertility was dominated by the Henry-Coale-Trussell concept of‘natural fertility’ and its associated investigative methodologies.38 Thiswas a model which predisposed researchers to think primarily in termsof parity-specific ‘stopping’ behaviour – the relatively abrupt curtail-ment of births at higher parities – as the only significant divergencefrom uncontrolled, unplanned or natural fertility. Although it was rec-ognised that the historical and ethnographic evidence showed that therate of childbearing at lower parities could vary significantly in differ-ent populations, this was considered to be principally the result of thevast range of involuntary social, cultural, biological, epidemiological,institutional and economic factors which were known to operate andany of which could cause the rate of childbearing to vary without anyconscious intervention.39 Thus, a wide range of absolute levels ofnatural fertility was recognised, but only one significant form of‘modern’ birth control: parity-specific stopping.
Introduction 15
During the course of the 1980s and 1990s, however, the self-imposedconceptual limitations and related methodological weaknesses of thedichotomy between natural fertility and stopping have come to be rec-ognised; and alternative generic methods for detecting other forms ofdeliberate birth control in the past have been devised, although thesetoo have their problems.40 Furthermore, detailed empirical research onfalling fertility, both in nineteenth-century USA and in England andWales, has demonstrated that stopping was by no means the principalmethod of birth control used when these populations began deliberatefertility restraint: there was much ‘spacing’ in evidence, and this quiteprobably also entailed extensive ‘starting’ (a long gap between marriageand the first birth).41 Using the responses to the special questions in the1911 Fertility Census, chapter 5 reports on the detailed assessments ofthe contribution of stopping, spacing and starting to the family build-ing strategies of England and Wales at the dawn of the twentiethcentury.
1.5 Limitations of the present study
Without anticipating the detailed considerations covered in later chap-ters, one or two words of general caution are in order regarding thescope of the 1911 census material available to this study and its relation-ship to fertility and infant and child mortality – the main subjects ofresearch. As will become obvious from the various technical discus-sions, the data used here required cautious and careful exegesis.Constraints, as already suggested, were imposed on the range of pos-sible social and demographic analyses by the requirements of OPCSthat the data supplied be both anonymised and in most cases relatedonly to a part, not the whole, of any definable community or settlement.It was therefore not possible to pursue a set of conventional ‘communitystudies’, although analysis could be conducted at the level of relativelysmall geographical areas.
Secondly, it needs to be fully acknowledged at the outset that, despitetheir detailed statistical nature, the official sources of household anddemographic information, such as the census, have their limitations,especially with respect to the issues of changing fertility. In regard to thelatter, there are two key questions to which historical demographerswould ideally wish an answer. What motives and intentions promptedindividuals in the late nineteenth century to commence controlling theirfertility to a quite unprecedented extent? And what methods were usedto achieve this reduction in live births? Unfortunately, statisticalmaterial such as that used here cannot, by its nature, offer direct
16 Changing family size in England and Wales
answers to either of these questions. It may seem strange to commencea long volume which devotes much of its space to the study of fertilitychange with the admission that none of the following evidence relatesdirectly to the key questions. However, in this constraint we are littledifferent from virtually all other historical researchers in this field.Inference from the indirect evidence provided by the changing patternsof fertility, nuptiality and child survival has had to remain our principalmethod of inquiry.
When considering fertility, the extreme paucity of surviving, directevidence on intentions and techniques is the result of two compound-ing silences in the historical record. First, until the very end of the nine-teenth century there was little public acknowledgement of thewidespread nature of the fertility changes occurring. Second, Britishsociety had evolved a general code of euphemism and evasion in virtu-ally all sexual matters.42 The rapidly falling birth rate necessarilyimplied significant modifications in sexual behaviour between spouses,presumably involving less frequent intercourse or contraceptive beha-viour or both, but as it was considered indelicate and vulgar to pursuesuch matters in explicit public discussion, even the most fearless pio-neering sexologists have left remarkably little explicit and direct infor-mation on the changes which were occurring.43
Such evidence as is available indicates a generally negative and mor-alistic attitude towards contraceptives, something that was endorsed asmuch by a medical profession anxious to avoid slurs on its reputation,as by the Anglican clergy and by working-class leaders.44 There seemsto be a rare consensus among those historians who have conducted oralhistory investigations that the working classes in the first half of thetwentieth century genuinely shared much of this sense of opprobriumregarding birth control and, indeed, for many women this seems to haveextended to their attitude to sexuality in general.45 This is certainly con-sistent with the general state of profound public ignorance on mattersof basic sexual functioning and anatomy which has been found in manycommunities throughout the period to the Second World War, evenamong trained doctors.46
Despite discussion of the moral and social issues involved in fertilitydecline in the novels of the period, from Thomas Hardy’s frank and har-rowing Jude the Obscure, which proved too shocking for contemporarytaste in the late 1890s, to Galsworthy’s more urbane, subsequent reflec-tions in the Forsyte Saga, there was little precise or well-defined appreci-ation of the changes under way.47 Only a self-consciously radical fringeof sexologists, who were so daring as to attempt to reconstruct a languageof sexuality at this time, were trying to discuss sexual behaviour at all.48
Introduction 17
If letters addressed to Marie Stopes are at all representative, it was notuntil the publication of Married Love in 1918 that the wider British publicreceived some form of explicit instruction in the sensual arts of the mar-riage bed and acquired a vocabulary which permitted correspondence onthese matters.49
In the relative absence of substantial and representative direct testi-mony, historians have championed many different methods of birthcontrol as the ones they believe to have been most prevalent, with thecondom or sheath, coitus interruptus and abortion having been most fre-quently favoured.50 Most recently, Szreter has concluded, from a criticalreview of the available qualitative and quantitative evidence, thatvarious regimes involving attempted abstinence within marriage, someno doubt incorporating the use of coitus interruptus and some quite pos-sibly countenancing the resort to abortion, were probably the predomi-nant culture of birth control in England and Wales, before the arrival oflatex condoms, caps and diaphragms after 1930.51
When attention turns to the marked improvement in the survivalprospects of the nation’s young at the dawn of the twentieth century, themeans by which this was achieved is obscured not so much by thesilence of the historical record as by the clamour created by the plethoraof different authorities involved, each acting, as well as monitoring andreporting developments, within their own particular terms of reference.
In 1858 central government had effectively stepped out of the arenaof environmental improvement, placing the matter in the hands of localgovernment. In that year compulsory preventive health clausesincluded in the 1848 Public Health Act were repealed.52 From then, untilwell into the following century, the orthodoxy of laissez-faire meant thatit was the local governments of Britain, ranging from the municipalcouncils of wealthy cities to the councils of the most sparsely populatedof the rural administrative districts, which largely decided and fundedlocal amenities.53 Certainly Parliament passed much enabling legisla-tion with regard to health measures but compelling laws were much,much rarer. Thus the four decades before the outbreak of hostilities in1914 witnessed enormous variation in the way in which different com-munities, towns and cities managed their local environments. The vari-ation was manifest even in such absolute basics as the quality of thewater supply and the extent to which the population had access to ade-quate sewerage; there were still many medium-size towns lacking suchbasic amenities even in the inter-war years.
Why certain cities should be leaders in instigating public healthimprovements while others, often close by, were laggards remains asubject of historical debate, although continuing research is beginning
18 Changing family size in England and Wales

to point to certain principal reasons. A major factor was finance. In anera when the principal fiscal source for urban environmental mainte-nance, along with other social services, was the local ratepayers, theavailability of funds for improvements was dictated by two compo-nents. The first was the ability to generate the required capital forimprovements. London in the 1860s had been the first British city tomake the colossal investment necessary to construct a comprehensivearterial mains sewerage system.54 Initially, only the largest cities, suchas Glasgow and Birmingham, had the capacity to raise and service theenormous loans required to follow London’s lead, and thus maintaintheir ethos of ‘civic pride’. The ability of smaller towns to finance publichealth measures was often dictated by the historical accident of howmuch productive property was owned by the council, or by their will-ingness to become involved in ‘municipal trading’: the collective own-ership of amenities such as gas works or tramways.55 The latter couldact as a source of revenue, providing funding for environmentalimprovement.
The ability to raise finance was tempered by the political will to spendthe money on projects of benefit to all.56 Much depended upon in whosehands power lay. In the towns by the last quarter of the nineteenthcentury there were three forces in the political arena: the civic leaders,very often drawn from the industrial and commercial elite, the proper-tied ratepaying class, representing petty capital, who throughout thenineteenth century had been vehemently opposed to moves whichwould increase the rates, and the non-property-holding voters who hadbeen given a voice in municipal affairs by the franchise reforms of thelate 1860s. Civic leaders had to have the good of their constituents atheart as well as their support before serious urban improvementbecame possible in Victorian Britain. In the rural areas power lay formuch longer with the landowning classes, and this may in part explainwhy rural health, long protected by the generally more salubrious envi-ronment, failed to improve at a pace similar to that of the urban areas inthis period.
The picture of piecemeal environmental improvement found inEngland and Wales over the last decades of the nineteenth century hasimplications for national trends in mortality. The inhabitants of the largetowns and cities may have been subjected for longest to the poorest sur-vival chances, but, once improvements were engendered, their largesize meant that, in combination, they would create the impression of anaccelerated decline in the national mortality trends.
Thus, while council minute books and local MOH reports detail thedebates, discussions and decisions surrounding various authorities’
Introduction 19

march towards health reform, the very weight of material in all its diver-sity perhaps obscures the general outline of the path to better health. Fora broader picture historians have once again to resort to inference,mainly from geographical and temporal patterns of mortality, to gaugethe extent, efficacy and intentions behind the measures put in place. Thepresent study is constrained in its ability to further our understandingby the fact that details on neither the age nor the cause of death of thechildren were reported in the data used here. Nevertheless, becausedata are drawn at an individual level from a selection of widely spreadcommunities, observations can be made regarding the interaction ofstatus, location and environment which illuminate the processes bywhich health improvements were achieved.
1.6 Summary
The current volume represents a further attempt to reach behind andbeyond the agenda of the contemporary officials who created the origi-nal source materials for studying the demographic history of Englandand Wales during the last quarter of the nineteenth century and the firstdecade of the twentieth. We are, of course, profoundly in their debt forthe Herculean tasks which they performed, but we are not so bound bydebts of gratitude that we must continue to accept and work with theparticular models of society and the hypotheses relating to fertility andmortality which emerged from the policy debates of the time. Wherepreviously the analysis of occupational variation has provided a princi-pal means to develop an alternative perspective on the findings of the1911 Fertility Census, here the primary focus will be the influence ofgeography: the importance of the social and physical environment inaccounting for the changing demography of this period. As mentionedabove, a number of other scholars, studying both fertility and mortalityduring the nineteenth and early twentieth centuries, have also recentlyfocused increasingly on place and environment, as potentially offeringimportant insights into the way in which demographic changeoccurred.57 This volume aims to take up the lead offered by these recentinitiatives: studying the processes of change in fertility and infant andchild mortality by exploiting data of a higher demographic quality anda more discriminating geographic character than has previously beenavailable for England and Wales in the late nineteenth and early twen-tieth centuries.
20 Changing family size in England and Wales
Notes
1 Mitchell and Deane (1962), pp. 36–7.2 Ibid., pp. 29–30.3 Zhao (1996), pp. 262–3, Tables 7 and 8.4 On the concept of ‘demographic certainty’ see Anderson (1985), pp. 86–7.5 On the administrative history of the GRO, see Glass (1973); Cullen (1974);
Eyler (1979); Higgs (1989, 1996a, 1996b, 1996c).6 Eyler (1979); Higgs (1988b, 1991); Szreter (1991).7 The literature on ‘national efficiency’ is copious. See, inter alia, Searle (1971);
Soloway (1982); Szreter (1996b), chs. 4–5.8 Pearson (1896), pp. 301–5; Heron (1906); Webb (1907).9 On the public health movement see Eyler (1979); Smith, F. B. (1979); Wohl
(1983); Szreter (1991); Hardy (1993); Eyler (1997).10 See, for instance: Stevenson and Newsholme (1905, 1906). For a full account
of the developments summarised here, see Szreter (1996b), chs. 4–5.11 The 1911 census was not the only British census to include questions on fer-
tility. Questions directly concerned with fertility were asked in 1951 and in1961. These census schedules did not, however, record the number of childrenwho had subsequently died. Questions concerning ‘orphanhood and depen-dency’ asked in the 1921 census give an indirect means of considering fertil-ity, but give no indication of the mortality experienced by the children born;Office of Population Censuses and Surveys and GRO, Edinburgh (1977).
12 A very few statistics based on the ‘fertility’ questions in the 1911 census werereported in: 1911 Census of England and Wales (1915), Vol. X, Occupationsand industries, Part II. The 1911 Census of England and Wales (1917), Vol. XIII,Fertility of marriage, Part I (hereafter Fertility of marriage, Part I) contained alarge amount of tabulated information, principally relating to the nation asa whole, but Part II (hereafter Fertility of marriage, Part II), published in 1923,presented far more detailed analyses and tables. For full BritishParliamentary Paper references see the bibliography.
13 Examples of studies of fertility using different sources include: Glass (1938);Innes (1938); Haines (1979); Teitelbaum (1984); Hinde (1985); Garrett (1987);Walker, S. P. (1988); Kemmer (1990); Rainger (1995).
14 Notestein (1945). On the complex history of the idea of demographic transi-tion, see Szreter (1993a).
15 McKeown (1976). Szreter (1988) provides a critique of McKeown’s thesis andindications for an alternative approach.
16 Williamson, J. G. (1981); Woods (1984); Buchanan (1985); Watterson (1986,1988); Lee, C. H. (1991); Preston and Haines (1991); Williams, N. (1992);Williams and Mooney (1994).
17 Marks (1994). On other ethnic groups see, for instance, Goldstein et al. (1994);Fitzpatrick (1986).
18 Woods, Watterson and Woodward (1988, 1989).19 Preston and Haines (1991), pp. 177–98.20 Haines (1995).21 Preston and Haines (1991), p. 197.22 Watterson (1986).23 For a recent review focusing on literature of relevance to Britain, see Szreter
(1996b), ch. 1. Other helpful and wide-ranging reviews include: Hauser andDuncan (1959); Hawthorn (1970); Cleland and Wilson (1987); Alter (1992).
Introduction 21
24 Glass (1938); Anderson (1976); Friedlander (1983); Teitelbaum (1984); Woods(1987); Crafts (1989).
25 On social classes, see Stevenson (1925, 1928); Innes (1938); Haines (1989,1992). On occupations, see Haines (1979); Banks (1981), ch. 8; Szreter (1996b),Parts III and IV. The studies of Walker, S.P. (1988), Kemmer (1990) andRainger (1995), focusing on distinct occupational sections of the Edinburghpopulation, were able to use Scottish vital registration records, a category ofevidence which remains inaccessible to historical researchers in Englandand Wales, to good effect. On Scottish occupations see Anderson (1998b),Table 3.
26 Haines (1979); Szreter (1996b).27 Hinde (1985); Garrett (1987); Dupree (1994); Reay (1994, 1996).28 Szreter (1996b), Part II and ch. 6. For the argument that the British official
model of social classes privileged the professions, see Szreter (1993b).29 Ibid., pp. 365–6.30 Ibid., ch. 6.31 Ibid., pp. 305–6.32 Ibid., pp. 546–55. The concept of communication community is therefore an
attempt to emphasise the significance of the range of characteristics givenprominence in Pierre Bourdieu’s notion of habitus. Bourdieu (1977).
33 Szreter (1996b), ch. 7.34 Woods (1987). The earliest cohorts surviving to report their fertility in the
1911 census were married in the 1850s and 1860s. Among these couples fer-tility appears to have been particularly low in both class I and class VI,‘Textile workers’. However, as little evidence exists concerning class diffe-rentials in fertility prior to the mid-nineteenth century, it is hard to saywhether this differential was due to an earlier decline in fertility or to longer-established lower levels of fertility.
35 Banks (1954, 1981); Caldwell (1982); Teitelbaum (1984); Coale (1986); Levine(1987), ch. 4; Gillis et al. (1992); Seccombe (1993), ch. 5. See Cleland andWilson (1987) on the stand-off between economic and cultural theories offertility decline.
36 Fertility of marriage, Part II (1923), Table XLIX, p. cxiii and Table L, p. cxv.37 Davin (1978); Dyhouse (1978); Lewis (1980).38 Henry (1961); Coale (1967); Coale and Trussell (1974, 1975).39 Davis and Blake (1956); Bongaarts and Potter (1983); Weinstein et al. (1990).40 Wilson et al. (1988); David and Sanderson (1988, 1990); Okun (1994). For a
review of the relevance of this methodological literature to the current study,see below, chapter 5, sections 5.3 to 5.5.
41 Crafts (1989); Bean et al. (1990); Szreter (1996b), ch. 8.42 Mason (1994a, 1994b); Porter and Hall (1995), Part II; Szreter (1996b), chs. 8
and 10. For an account which helpfully draws on the scattered literary testi-mony available, see Kane (1995), chs. 6–8.
43 There has been considerable debate among historians over whether or notmiddle-class Victorians really were as ‘Victorian’ in their sexual behaviourand attitudes as has been proverbially supposed. The principal revisionistwork was Gay (1986). The most recent, and much more fully documentedstudies of Victorian sexuality and sexual knowledge have, however, tendedto confirm the original view of a relatively inhibited Victorian sexuality,albeit far from monolithic and uniform in its manifestations: Mason (1994a,
22 Changing family size in England and Wales
1994b); Porter and Hall (1995). Nevertheless, there may well be room forargument over greater licence in the earlier half of the nineteenth century;see Robin (1986); Barret-Ducrocq (1991). For a systematic review of the smallamount of direct evidence on these matters that is available, both for theperiod before the Great War and for the inter-war decades, see Szreter(1996b), ch. 8.
44 McLaren (1978), ch. 7; Soloway (1982), chs. 5–6, 11–14; Hall, L. (1991), ch. 2;Porter and Hall (1995), ch. 10.
45 Roberts, E. (1984), pp. 71–80, 84–100; Chinn (1988), pp. 141–8.46 Roberts, E. (1984), pp. 16–17, 80, 109–10; Hall, L. (1985, 1991, chs. 1, 3, 5 and
6); Cohen (1993); Porter and Hall (1995) ch. 11.47 For a fuller discussion of Galsworthy’s treatment of the issues see the
opening section of chapter 5.48 Those such as Olive Schreiner, Eleanor Marx, Annie Besant and Maria
Sharpe, who were associated with Karl Pearson’s Men and Women’s Clubin the late-1880s, were among early female examples of such sexual radicals,though several of the most advanced male radicals of the time, such asHavelock Ellis and Bernard Shaw, were excluded from participation byPearson: Walkowitz (1992), ch. 5, esp. n.27. In general, see Porter and Hall(1995), chs. 7–8; Bland (1995).
49 Stopes (1918).50 Himes (1936); Banks (1954); Fryer (1967); McLaren (1978); Gittins (1982);
Davey (1988); Seccombe (1990); Mason (1994b), ch. 2; Santow (1995).51 Szreter (1996b), ch. 8. For an important earlier contribution emphasising the
role of abstinence among the Edinburgh professional class, see Kemmer(1990).
52 The 1848 clauses had been fought for by Edwin Chadwick and had includeda compulsion on local authorities to fund expensive sanitary improvementsif either 10 per cent of ratepayers petitioned central government for suchimprovements or if the Registrar-General found the town’s death rate to beabove the national average of 23 per thousand living: Szreter (1988).
53 Ibid.54 Ibid., p. 20.55 Millward and Sheard (1995) suggest that municipal trading was very much
a feature of northern and midland industrial towns.56 Szreter (1997).57 Haines (1979); Woods, Watterson and Woodward (1988, 1989); Crafts (1989);
Lee, C. H. (1991); Williams, N. (1992); Mooney (1994a); Williams andMooney (1994); Williams and Galley (1995).
Introduction 23