CENTURY - Researchbytes
51
CENTURY TEXTILES AND INDUSTRIES LIMITED REGD. OFFICE: 'CENTURY BHA VAN' DR. ANNIE BESANT ROAD, WORLI, MUMBAI - 400 030, INDIA Tel: +9 1-22-2495700 Fax +9 1-2224309491 +91 -22-2436 1980 Email: [email protected] website: www.cennuytextind.com CIN:- L17120MH1897PLC000163 SH/XII/2020 Corporate Relationship Department BSE Ltd. 1 st Floor, Phiroze Jeejebhoy Towers Dalal Street, Fort, Mumbai-400 001 Scrip Code: 500040 Dear Sir, 25.06.2020 Listing Department National Stock Exchange of India Ltd. "Exchange Plaza" 5th floor, Bandra-Kurla Complex Bandra (East), Mumbai-400 051. Scrip Code: CENTURYTEX Sub: Disclosure under Regulation 30 of the Securities and Exchange Board of India (Listing Obligations and Disclosure Requirements) Regulations, 2015 Intimation of Investor's meeting. Please refer our letter dated 23rd June, 2020 and 24th June, 2020 informing you about the Investor's meeting to be held on 25 th June, 2020 and 26 th June, 2020. In this connection, please find attached herewith a copy of the presentation to be shared with the Investors at the aforesaid meeting. This is for your information and record. Thanking you, Encl: as above Yours truly, For Century Textiles and Industries Ltd., •
-
Upload
khangminh22 -
Category
Documents
-
view
4 -
download
0
Transcript of CENTURY - Researchbytes

CENTURY TEXTILES AND INDUSTRIES
LIMITED REGD. OFFICE: 'CENTURY BHA VAN' DR. ANNIE BESANT ROAD, WORLI, MUMBAI - 400 030, INDIA
Tel: +9 1-22-2495700 Fax +9 1-2224309491 +91 -22-2436 1980 Email: [email protected] website: www.cennuytextind.com
CIN:- L17120MH1897PLC000163
SH/XII/2020
Corporate Relationship Department BSE Ltd . 1st Floor, Phiroze Jeejebhoy Towers Dalal Street, Fort, Mumbai-400 001 Scrip Code: 500040
Dear Sir,
25.06.2020
Listing Department National Stock Exchange of India Ltd. "Exchange Plaza" 5th floor, Bandra-Kurla Complex Bandra (East), Mumbai-400 051. Scrip Code: CENTURYTEX
Sub: Disclosure under Regulation 30 of the Securities and Exchange Board of India (Listing Obligations and Disclosure Requirements) Regulations, 2015 Intimation of Investor's meeting.
Please refer our letter dated 23rd June, 2020 and 24th June, 2020 informing you about the Investor's meeting to be held on 25th June, 2020 and 26th June, 2020.
In this connection, please find attached herewith a copy of the presentation to be shared with the Investors at the aforesaid meeting.
This is for your information and record.
Thanking you ,
Encl: as above
Yours truly, For Century Textiles and Industries Ltd.,
•
~---:-,

TextilesPulp & PaperReal Estate
June, 2020 Stock Code : BSE : 500040 | NSE : CENTURYTEX | Reuters : CNTY.NS | Bloomberg :
CENT:IN
Overseas
INVESTOR PRESENTATION
Century Textiles & Industries
Limited

TABLE OF CONTENTS
Financials
Real Estate
Pulp & Paper
Textiles
2

Fina
ncia
lsR
eal E
stat
eP
ulp
& P
aper
Text
iles
Textile (12 Months)
3
PERFORMANCE AT A GLANCE - CONSOLIDATED
Pulp & Paper(12 Months)
Real Estate(12 Months)
Total Net Debt Outstanding is ~Rs. 1382 Cr. as on 31st March, 2020
Rs. In Crore
#Turnover & EBITDA for 12 months of CTIL also includes Rs. 67 Crore & Rs. 51 Crores respectively from Rayon & Salt Works businesses apart from above 3 main businesses.
Sales 735
EBITDA 34
EBITDA % 4.6%
Sales 2383
EBITDA 511
EBITDA % 21.4%
Rental Income 146
EBITDA 4
EBITDA % 2.7%
Cement demerged with UTCL as on 30/09/2019
w.e.f.20/05/2018
The above figures are of continuing operation. Discontinuing operations (not shown above) includes Cement, Yarn & Denim divisions. EBITDA loss of discontinuing operations during FY 2019-20 was Rs.26 Crs as against Rs.5 Crs gain during FY 2018-19.
*
Turnover # 770 843 3331 3633
EBITDA # 89 295 600 1061
Less : One time income : TDR Sale 160
Reversal of EPCG & it's interest liability 128 128
Adjusted EBITDA 89 167 600 773
EBITDA %age 11.6% 19.8% 18.0% 21.3%
DescriptionFY20
(Q4)
FY19
(Q4)
FY20
(12M) *
FY19
(12M) *

Fina
ncia
lsR
eal E
stat
eP
ulp
& P
aper
Text
iles
941
210
137
88
851
161
87 50
854
158
77 42
770
896
80
Turnover EBITDA PBT PAT
Quarterly Q3 FY 19 Q2 FY 20 Q3 FY 20 Q4 FY 20
3633
1061
766
500
3331
600
284
378
Turnover EBITDA PBT PAT
12 MonthsFY 19 FY 20
23%
70%
5% 2%
Revenue Pie – Q4 FY 20
Textiles
Pulp & Paper
Real Estate
Others
22%
72%
4% 2%
Revenue Pie – FY 20
Textiles
Pulp & Paper
Real Estate
Others
CONSOLIDATED PERFORMANCE SNAPSHOT
4

Fina
ncia
lsR
eal E
stat
eP
ulp
& P
aper
Text
iles
KEY HIGHLIGHTS
2 Projects launched in FY 20 - Birla Vanya, Kalyan and Birla Alokya, Bengaluru
Birla Vanya, Kalyan – Sold BV 342 Crs. Project construction was as per schedule.
Birla Alokya,Bengaluru – Sold BV 108 Crs. Project construction was as per schedule
Birla Navya, Gurugram (AnantRaj deal) –Project was ready for launch in Q4 FY 20 with RERA approval but launch had to be shifted to FY 21 due to outbreak of Covid-19
The progress on Company’s project at Magadi Road, Bengaluru was as per schedule. Expected Launch in FY 22
Real Estate Pulp & Paper
Capacity Utilization during Q4 FY20 was at 96% same as Q4 FY19
Sales in Q4 FY20 were down by 1% compared to Q4 FY19. Drop in sales revenue by 13%
Realization drop got majorly compensated by drop in input costs by around 10% & partially by improved operational efficiency.
Textiles
Capacity Utilization in Q4 is 85%, 2% lower as compared to Q4 FY19.
Sales revenue in Q4 is down by 17 % compared to Q4 FY19
The EBITDA was impacted during current quarter primarily due reversal of MEIS retrospectively by government and lower sales due to COVID-19.
5

Fina
ncia
lsR
eal E
stat
eP
ulp
& P
aper
Text
iles
6
Production
Pro rata
Capacity Q4 20 Q4 19 % Var
Annual
Capacity FY20 FY19 % Var
Paper MT 49,182 50,484 55,898 -10% 1,97,810 2,19,042 2,31,854 -6%
Pulp MT 7,787 10,303 5,719 80% 31,320 40,844 33,323 23%
Tissue Paper MT 8,951 5,608 6,712 -16% 36,000 25,670 26,843 -4%
Multilayer Packaging Board MT 44,754 39,800 37,569 6% 1,80,000 1,61,202 1,65,182 -2%
1,10,674 1,06,196 1,05,898 0% 4,45,130 4,46,759 4,57,202 -2%
Capacity Utilisation 96% 96% 100% 103%
Cloth K Mtrs 10,010 8,537 8,689 -2% 39,270 35,942 37,353 -4%
Capacity Utilisation 85% 87% 92% 95%
P R O D U C T I O N (MT)
Product Unit

Fina
ncia
lsR
eal E
stat
eP
ulp
& P
aper
Text
iles
7
Sales
Q4 20 Q419 % Var FY20 FY19 % Var Q4 20 Q419 % Var FY20 FY19 % Var
Paper MT 49,406 56,557 -14% 2,16,005 2,33,248 -7% 264.51 345.12 -30% 1,207.42 1,374.50 -12%
Pulp MT 3,700 2,177 41% 14,110 15,550 -9% 22.12 15.00 32% 89.00 97.72 -9%
Tissue Paper MT 5,655 7,147 -26% 25,308 27,230 -7% 40.12 54.68 -36% 189.55 202.63 -6%
Multilayer Packaging Board MT 38,988 33,234 15% 1,59,855 1,56,105 2% 214.89 207.67 3% 897.50 960.01 -7%
Traded goods ( Board ) MT - - 0% - 2,071 -100% - - 0% - 7.89 -100%
97,749 99,115 -1% 4,15,278 4,34,204 -4% 541.64 622.47 -13% 2,383.47 2,642.75 -10%
Cloth K Mtrs 5,402 8,828 -39% 30,449 33,283 -9% 72.65 121.16 -40% 468.48 507.67 -8%
Bed Sheets Sets 3,93,246 2,04,379 92% 15,00,291 14,30,497 5% 40.47 23.07 75% 156.23 162.65 -4%
Yarn MT 736 569 29% 2,232 2,807 -20% 19.86 16.24 22% 59.84 77.97 -23%
Others 12.53 32.02 -61% 50.45 16.71 202%
145.51 192.49 -24% 735.00 765.00 -4%
S A L E S (Volume) N E T S A L E S ( Rs in Crores )UnitProduct
Fina
ncia
lsR
eal E
stat
eP
ulp
& P
aper
Text
iles
(With Q1 FY 19 as base)
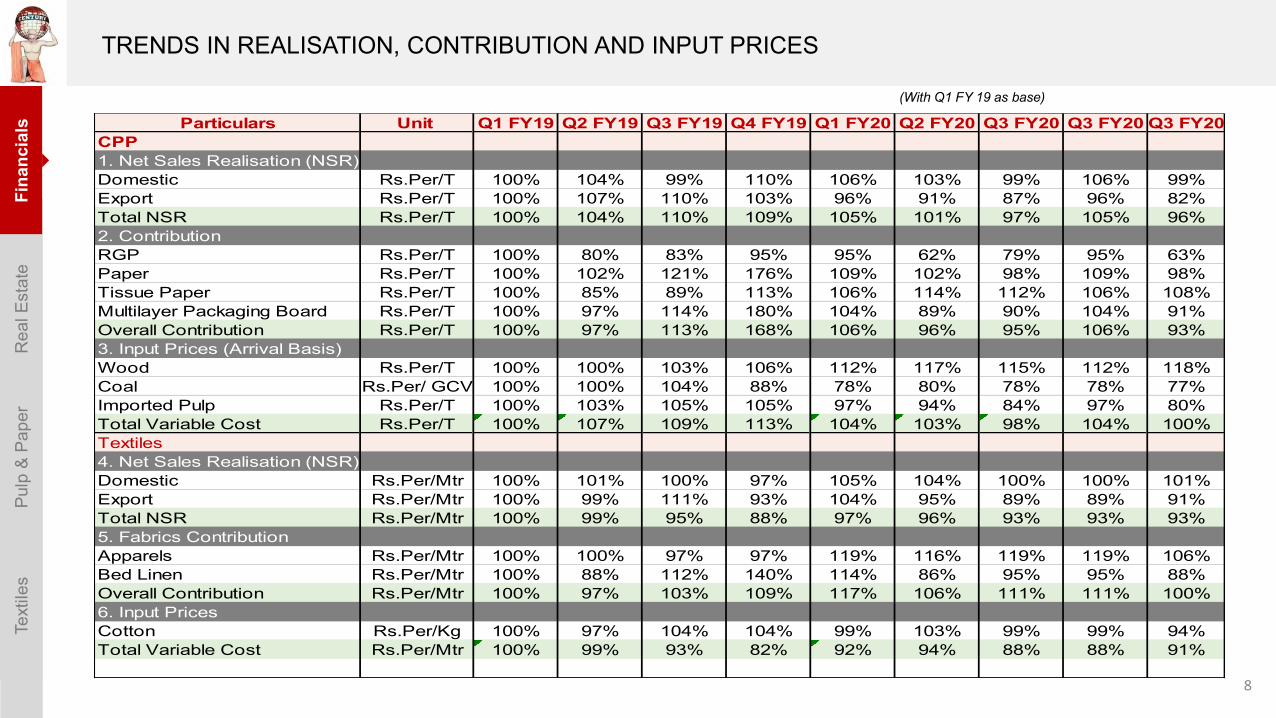
TRENDS IN REALISATION, CONTRIBUTION AND INPUT PRICES
8
Particulars Unit Q1 FY19 Q2 FY19 Q3 FY19 Q4 FY19 Q1 FY20 Q2 FY20 Q3 FY20 Q3 FY20 Q3 FY20CPP1. Net Sales Realisation (NSR)Domestic Rs.Per/T 100% 104% 99% 110% 106% 103% 99% 106% 99%Export Rs.Per/T 100% 107% 110% 103% 96% 91% 87% 96% 82%Total NSR Rs.Per/T 100% 104% 110% 109% 105% 101% 97% 105% 96%2. ContributionRGP Rs.Per/T 100% 80% 83% 95% 95% 62% 79% 95% 63%Paper Rs.Per/T 100% 102% 121% 176% 109% 102% 98% 109% 98%Tissue Paper Rs.Per/T 100% 85% 89% 113% 106% 114% 112% 106% 108%Multilayer Packaging Board Rs.Per/T 100% 97% 114% 180% 104% 89% 90% 104% 91%Overall Contribution Rs.Per/T 100% 97% 113% 168% 106% 96% 95% 106% 93%3. Input Prices (Arrival Basis)Wood Rs.Per/T 100% 100% 103% 106% 112% 117% 115% 112% 118%Coal Rs.Per/ GCV 100% 100% 104% 88% 78% 80% 78% 78% 77%Imported Pulp Rs.Per/T 100% 103% 105% 105% 97% 94% 84% 97% 80%Total Variable Cost Rs.Per/T 100% 107% 109% 113% 104% 103% 98% 104% 100%Textiles4. Net Sales Realisation (NSR)Domestic Rs.Per/Mtr 100% 101% 100% 97% 105% 104% 100% 100% 101%Export Rs.Per/Mtr 100% 99% 111% 93% 104% 95% 89% 89% 91%Total NSR Rs.Per/Mtr 100% 99% 95% 88% 97% 96% 93% 93% 93%5. Fabrics ContributionApparels Rs.Per/Mtr 100% 100% 97% 97% 119% 116% 119% 119% 106%Bed Linen Rs.Per/Mtr 100% 88% 112% 140% 114% 86% 95% 95% 88%Overall Contribution Rs.Per/Mtr 100% 97% 103% 109% 117% 106% 111% 111% 100%6. Input PricesCotton Rs.Per/Kg 100% 97% 104% 104% 99% 103% 99% 99% 94%Total Variable Cost Rs.Per/Mtr 100% 99% 93% 82% 92% 94% 88% 88% 91%
Fina
ncia
lsR
eal E
stat
eP
ulp
& P
aper
Text
iles
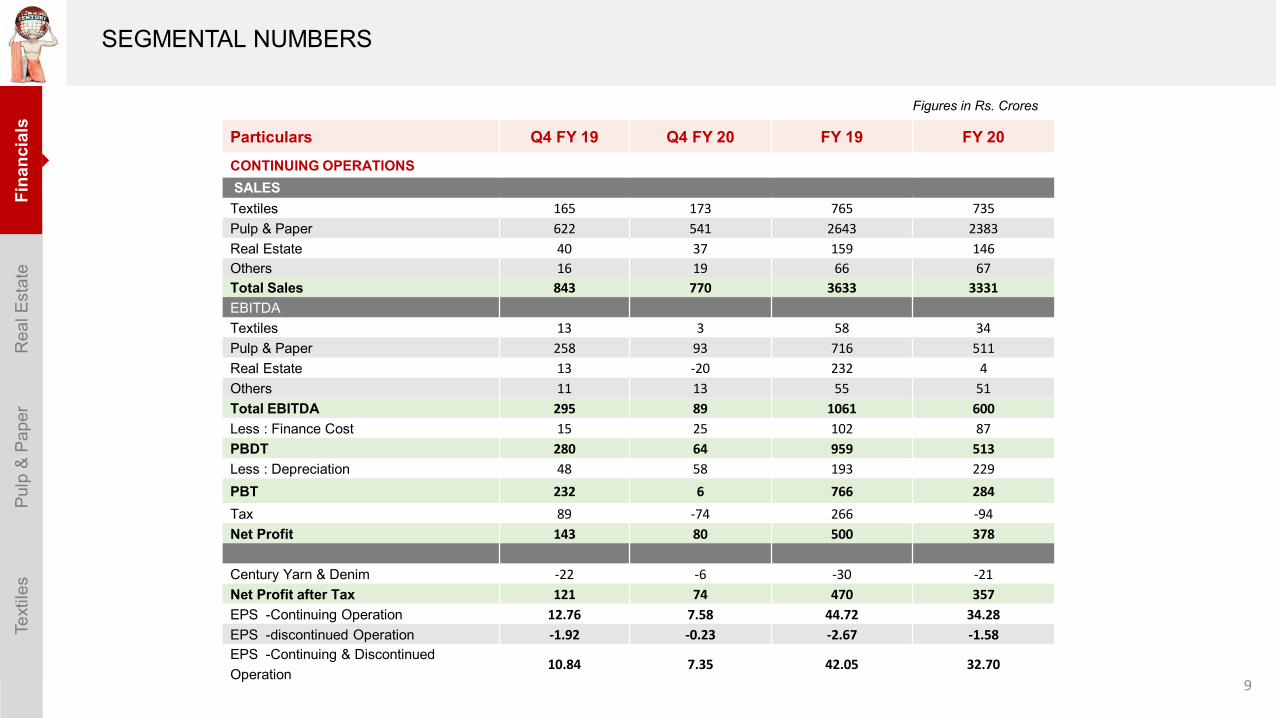
Figures in Rs. Crores
Particulars Q4 FY 19 Q4 FY 20 FY 19 FY 20
CONTINUING OPERATIONSSALESTextiles 165 173 765 735
Pulp & Paper 622 541 2643 2383
Real Estate 40 37 159 146
Others 16 19 66 67
Total Sales 843 770 3633 3331
EBITDATextiles 13 3 58 34
Pulp & Paper 258 93 716 511
Real Estate 13 -20 232 4
Others 11 13 55 51
Total EBITDA 295 89 1061 600
Less : Finance Cost 15 25 102 87
PBDT 280 64 959 513
Less : Depreciation 48 58 193 229
PBT 232 6 766 284
Tax 89 -74 266 -94
Net Profit 143 80 500 378
Century Yarn & Denim -22 -6 -30 -21
Net Profit after Tax 121 74 470 357
EPS -Continuing Operation 12.76 7.58 44.72 34.28
EPS -discontinued Operation -1.92 -0.23 -2.67 -1.58
EPS -Continuing & Discontinued Operation
10.84 7.35 42.05 32.70
SEGMENTAL NUMBERS
9

Fina
ncia
lsR
eal E
stat
eP
ulp
& P
aper
Text
iles
*Figures in Rs. Crore
ParticularsContinued Operations
Dis Ops (Y&D) Grand TotalTextiles Fabrics Rayon Pulp & Paper Birla Estates Total
Net Block 416 277 2558 1,502 4753 4753(i) Current Assets 307 23 576 627 1533 2 1536(ii) Current Liabilities 118 164 435 321 1038 45 1083
Net Working Capital 189 -141 141 306 495 -43 452
Cash & Bank Balances 0 0 1 13 14 0 14
Capital Employed in the Segment 605 136 2700 1821 5262 -43 5219
PBIT 6 368 -36 338 - 338
Loan Allotment to Segment
i. Specific Loan 3 14 23 40 40ii. Allocated Loan 196 355 791 1342 1342Total 199 369 814 1382 1382Ratios
Net Debt / EBITDA 2.43Debt / Equity 0.38
CAPITAL EMPLOYED – AS ON 31st MAR 2020
10

Fina
ncia
lsR
eal E
stat
eP
ulp
& P
aper
Text
iles
11
STATEMENT OF OUTSTANDING LOANRs. In Crore
O/s as on O/s as on O/s as on31-03-2019 31-12-2019 31-03-2020
Long Term Loans 109 68 202Average Rate of Interest 7.60% 7.04% 7.79%
Short Term and Working Capital Loans 212 621 57Average Rate of Interest 7.63% 5.53% 6.48%
NCD 700 700 1100Average Rate of Interest 7.99% 7.99% 7.87%
Total CTIL Loans 1021 1389 1359Average Rate of Interest as on date 7.87% 6.84% 7.80%
Standalone Loan Taken by Birla Estate Pvt.Ltd 16 23
Total Consolidated Loans 1021 1405 1382Average Interest for 12M FY20 7.36%Average Interest for 12M FY19 8.07%
Particulars

Fina
ncia
lsR
eal E
stat
eP
ulp
& P
aper
Text
iles
Tax Rate Old Regime New regime
Option 1 Option 2
Regular 34.94% 34.94% 25.17%
MAT 21.55% 17.47% NA
Particulars DTL DTA Net
Balance as at March 31, 2019 903 -496 407
Expected to reverse in current regime 285 -366 -81
Balance 618 -130 488
Remeasure @ 25.17% 445 -94 351
Net Impact 173 -36 137
Rs. Cr
Irrevocable option can be exercised in any year
Beneficial to move to new tax regime post utilisation of :▪ MAT credit
▪ Unabsorbed depreciation
Deferred tax liability expected to reverse in or after utilisation of above, to be remeasured at new tax rate (25.17%)
DTL – Deferred tax liability on property plant & equipmentDTA – Deferred tax asset on Upfront royalty and provision towards litigations
TAX ORDINANCE, 2019
12

Fina
ncia
lsR
eal E
stat
eP
ulp
& P
aper
Text
iles
13
Cash Flow – Q4 FY20Rs. In Crore
Particulars Textile Rayon * Pulp & Paper
Birla Estates
Sub Total
Yarn & Denim H.O. Grand
TotalEBITDA 3 13 93 (20) 89 (3) - 86 MAT Paid - - - - - - (20) (20) Net Change in Working Capital 35 (13) (46) (31) (55) (5) 10 # (50)
A) Operating Cash Flow 38 - 47 (51) 34 (8) (10) 16 Capital Expenditure (15) - (66) (30) (111) - - (111)
B) Investing Cash Flow (15) - (66) (30) (111) - - (111) Dividend Paid ( Including Tax)Interest (7) - (4) (14) (25) - - (25) Interest accrual on bond - - - - - - 15 15
C) Financing Cash Flow (7) - (4) (14) (25) - 15 (10) D) Free Cash Flow (A+B+C) 16 - (23) (95) (102) (8) 5 (105)
Sources of Fund RequiredLoan Taken / (Repaid) (23) Bank Balance & Investment Reduced /(Increase) 128 Net 105
*Change in working capital at Rayon is due to unwinding of Commuted Royalty & Security Deposit which is non-cash item, added at EBITDA & reduced at Working Capital# Amount paid on behalf of UTCL, in previous quarter, recovered.

Fina
ncia
lsR
eal E
stat
eP
ulp
& P
aper
Text
iles
14
Cash Flow – FY20Rs. In Crore
Particulars Rayon Pulp & Paper
Birla Estates
Sub Total
Yarn & Denim H.O. Grand
TotalEBITDA 34 51 511 4 600 (26) - 574 MAT Paid - - - - - - (102) (102) Net Change in Working Capital (15) (44) (73) (286) (418) (4) - (422)
A) Operating Cash Flow 19 7 438 (282) 182 (30) (102) 50 Capital Expenditure (45) - (144) (72) (261) - - (261) Sale of Assets 4 # - - - 4 - - 4
B) Investing Cash Flow (41) - (144) (72) (257) - - (257) Dividend Paid ( Including Tax) - - - - - - (101) (101) Interest (24) (6) (26) (31) (87) - - (87)
C) Financing Cash Flow (24) (6) (26) (31) (87) - (101) (188) D) Free Cash Flow (A+B+C) (46) 1 268 (385) (162) (30) (203) (395)
Sources of Fund RequiredLoan Taken / (Repaid) 361 Bank Balance & Investment Reduced /(Increase) 34 Net 395
* Interest at Rayon is non-cash item and is adjusted in bank balance. Change in working capital at Rayon is due to unwinding of Commuted Royalty & Security Deposit which is non-cash item, added at EBITDA & reduced at Working Capital# During the year there was a sale of old Gas based turbines.
Textile

Financials Real Estate Pulp & Paper Textiles
15
Over 23 lakh sq. ft. under construction across 2 projects

Rea
l Est
ate
Fina
ncia
lsP
ulp
& P
aper
Text
iles
16
COVID – 19 IMPACT AND MITIGATION
▪ Covid 19 Impact
‒ Birla Navya, Gurugram was ready for launch in Q4 FY 21. The prelaunch activities were well received by the market. However, due
to Covid-19 epidemic the launch has now been shifted to FY 21
‒ Existing Residential Projects (Birla Vanya, Kalyan and Birla Alokya, Bengaluru)
• Construction had been halted on the sites due to the epidemic in late March 2020.
• Collections have slowed down due to logistical challenges, particularly for milestones falling in March 2020
‒ Consumer sentiment impacted due to the uncertainty around the economic conditions emanating from the country wide lockdown
▪ Work has resumed at the sites with complete focus on implementation of SOPs on labor safety, sanitization and hygiene
▪ Mitigation measures
‒ Close monitoring of cash and cost for optimum working capital management
‒ Digitization of the sales process to minimize physical visits by creation of a digital platform
▪ Future Opportunities
‒ Increase in customer preference for branded products and corporate developers will create an opportunity for corporate players likeus to increase our market share

Rea
l Est
ate
Fina
ncia
lsP
ulp
& P
aper
Text
iles
Strengths Opportunities Strong Vision & Strategy
Leveraging: Encash on: Strong focus on:
▪ The Birla Brand ▪ Rapid urbanization and nuclearizationof families
▪ Maintaining a capital efficient, asset light model
▪ Valuable portfolio of premium land parcels
▪ Rising per capita income in the long term
▪ Delivering an exceptional experience and creating value for stakeholders
▪ Dynamic team with extensive real estate experience ▪ Government thrust on Housing for All ▪ Residential development, opportunistic
approach to commercial
▪ Robust project pipeline of owned and joint development land parcels
▪ Rapid shift to becoming a professional and organised business
▪ Premium / mid-income residential segment
▪ Strong sales and execution capability ▪ Strong governance standards driven by RERA and GST implementation
▪ Mumbai, NCR, Bengaluru & Pune Markets
STEP TOWARDS MORE FOCUS ON GROWING BUSINESS
17

Rea
l Est
ate
Fina
ncia
lsP
ulp
& P
aper
Text
ilesBIRLA ESTATES HAS CREATED LANDMARK COMMERCIAL PROJECTS
Birla Aurora, Worli▪ 2.55 Lakh sq. ft. of commercial
space
▪ 22-storey building
Birla Centurion, Worli▪ 3.5 Lakh sq. ft. of commercial
space
▪ 13-storey building
Overview of the Buildings
▪ Superior Quality
▪ LEED Platinum certified Buildings
▪ Strong execution abilities
▪ Assets almost 100% leased, commanding high rentals
▪ INR 125 Crs annual leasing revenue from assets
▪ Commanding best rentals in Worli micro market (~ Rs.185 /sq. ft.)
18
Rea
l Est
ate
Fina
ncia
lsP
ulp
& P
aper
Text
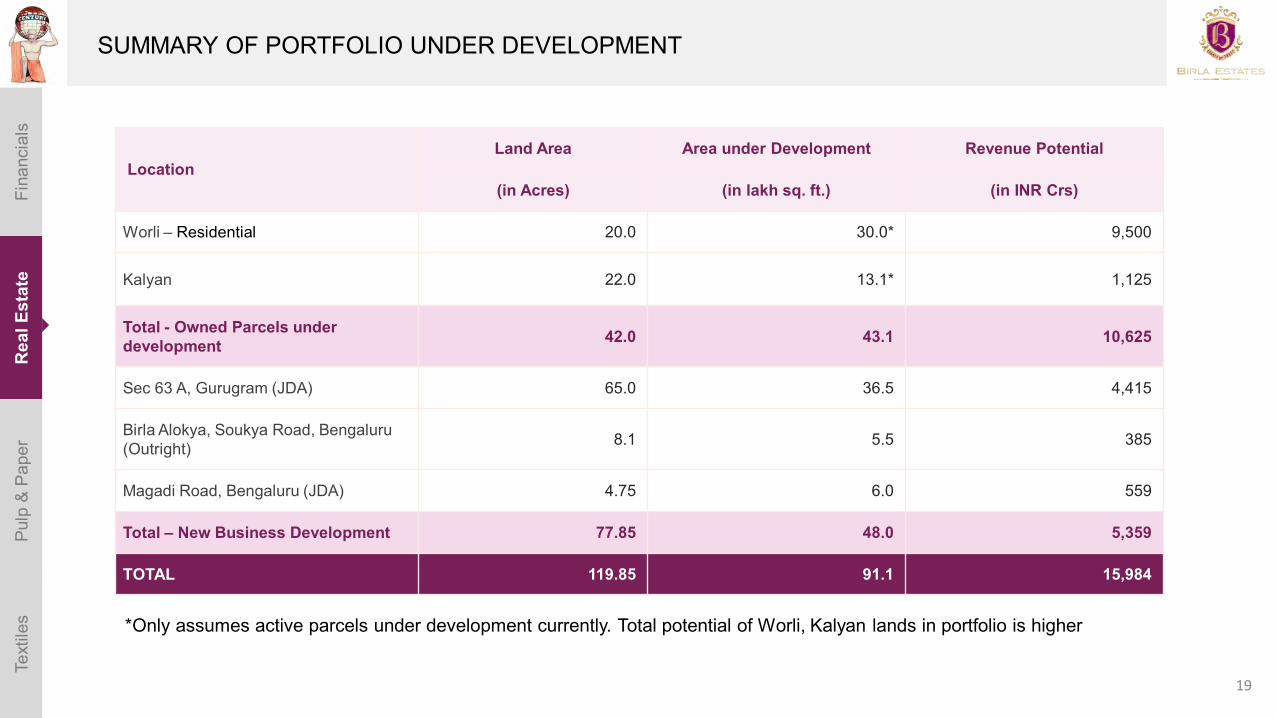
ilesSUMMARY OF PORTFOLIO UNDER DEVELOPMENT
*Only assumes active parcels under development currently. Total potential of Worli, Kalyan lands in portfolio is higher
Location Land Area Area under Development Revenue Potential
(in Acres) (in lakh sq. ft.) (in INR Crs)
Worli – Residential 20.0 30.0* 9,500
Kalyan 22.0 13.1* 1,125
Total - Owned Parcels under development 42.0 43.1 10,625
Sec 63 A, Gurugram (JDA) 65.0 36.5 4,415
Birla Alokya, Soukya Road, Bengaluru (Outright) 8.1 5.5 385
Magadi Road, Bengaluru (JDA) 4.75 6.0 559
Total – New Business Development 77.85 48.0 5,359
TOTAL 119.85 91.1 15,984
19

Rea
l Est
ate
Fina
ncia
lsP
ulp
& P
aper
Text
iles
20
CAPEX – FY 20
Century Estates Rs. In Cr.
Amt
Capex
Facility Capex 1.1
Total Capex 1.1
CWIP
Worli (East) 37.2
Worli West : MHADA / Colony 3.9
Birla Vanya - Kalyan 1.0
Kalyan Kamba 0.1
Talegaon 0.2
Total CWIP 42.3
Interest Capitalized 19.2
Total CWIP (incl. Interest) 61.6
Total CAPEX + CWIP 62.7
BEPL: Rs. In Cr.Spent Advance Total
CapexCorp IT Capex 1.8 1.8 Vehicles for Emp 0.6 0.6 Capex - Birla Vanya 0.7 0.7 Capex - Birla Alokya 0.2 0.2
Total Capex 3.3 - 3.3
CWIP
Birla Vanya - Kalyan 66.0 10.3 76.3
Kalyan 22 Acres - KDMC 0.3 - 0.3
Birla Alokya - Soukya Road, Bangalore 16.8 4.5 21.3
Total CWIP 83.1 14.9 98.0
Total Capex + CWIP 86.4 14.9 101.3
Rea
l Est
ate
Fina
ncia
lsP
ulp
& P
aper
Text
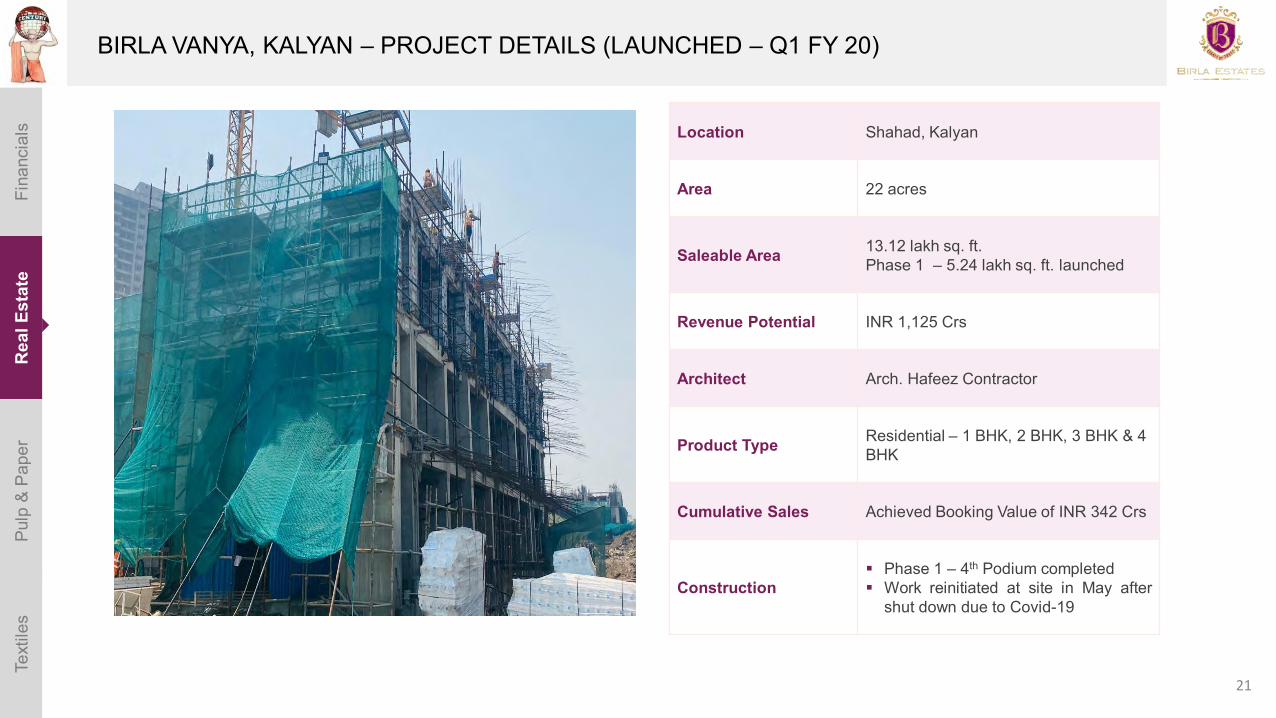
ilesBIRLA VANYA, KALYAN – PROJECT DETAILS (LAUNCHED – Q1 FY 20)
Location Shahad, Kalyan
Area 22 acres
Saleable Area 13.12 lakh sq. ft. Phase 1 – 5.24 lakh sq. ft. launched
Revenue Potential INR 1,125 Crs
Architect Arch. Hafeez Contractor
Product Type Residential – 1 BHK, 2 BHK, 3 BHK & 4 BHK
Cumulative Sales Achieved Booking Value of INR 342 Crs
Construction▪ Phase 1 – 4th Podium completed▪ Work reinitiated at site in May after
shut down due to Covid-19
21

Rea
l Est
ate
Fina
ncia
lsP
ulp
& P
aper
Text
ilesBIRLA ALOKYA, BENGALURU (Outright) – PROJECT DETAILS (LAUNCHED – Q3 FY 20)
Location Soukya Road, Bengaluru
Area 8.1 acres
Saleable Area 5.47 lakh sq. ft.
Revenue Potential INR 385 Crs
Architect Synergy
Product Type Residential – 3-Bed and 4-Bed Villaments
Cumulative Sales Achieved Booking Value of INR 114 Crs
Construction
▪ Foundation work completed asplanned
▪ Work reinitiated at site in May aftershut down due to Covid-19
22

Rea
l Est
ate
Fina
ncia
lsP
ulp
& P
aper
Text
ilesBIRLA NAVYA, GURUGRAM (JV) – PROJECT DETAILS
Location Sector 63 A, Gurugram, NCR
Area 65 acres
Saleable Area 36.5 lakh sq. ft.
Revenue Potential INR 4,415 Crs
Architect R Corp
Product Type Residential – 2 BHK, 3 BHK & 4 BHK
Launch Year FY 21
Current Update▪ RERA Approval obtained and Project
ready for launch
23

Rea
l Est
ate
Fina
ncia
lsP
ulp
& P
aper
Text
ilesCENTURY MILLS, WORLI – PROJECT DETAILS
24
Location Worli, Mumbai
Area 20 acres
Saleable Area 30 lakh sq. ft.
Revenue Potential INR 9,500 Crs
Architect Foster & Partners
Product Type Residential – 2 BHK, 3 BHK, 4 BHK and 5 BHK Penthouse
Launch Year FY 22
Current Update ▪ Pre launch activities ongoing

Rea
l Est
ate
Fina
ncia
lsP
ulp
& P
aper
Text
ilesMAGADI ROAD, BENGALURU (JV) – PROJECT DETAILS
Location Magadi Road, Bengaluru
Area 4.75 acres
Saleable Area 5.97 lakh sq. ft.
Revenue Potential INR 559 Crs
Architect RSP
Product Type Residential – 2 BHK, 2.5 BHK, 3 BHK & 4 BHK
Launch Year FY 22
Current Update ▪ Pre launch activities ongoing
25

Financials Real Estate Pulp & Paper Textiles
26
Flag bearer in Paper Industry

Rea
l Est
ate
Fina
ncia
lsPu
lp &
Pap
erTe
xtile
s
27
Covid – 19 Impact and Mitigation – Pulp & Paper
▪ Covid 19 Impact
‒ Overall Indian Pulp & Paper sector hit hard since the sector is highly dependent on global markets for exports and imports.
‒ Disruptions in supply chain and subdued market condition has adversely impacted the overall demand of all variants of paper.
‒ In future, Packaging Board demand to grow due to higher consumption of packaging material by e-commerce, FMCG, Food and pharma industries.
‒ Tissue Paper demand to grow due to Government awareness programs towards hygiene and sanitation.
‒ Writing & Printing Paper demand will remain subdued due to deferment in academic sessions by institutions.
▪ Mitigation measures
‒ First priority is people and their safety
• Created SOP’s & ERT’s for Factory, Cutting Centers and office meeting 100% compliance of MHA guidelines.
• Training provided to all the people entering the plant on personal hygiene & social distancing.
• Tracking of people movement inside the colony as well as people working with us.
‒ Highest priority to cash conservation by daily monitoring of cash position by the LT and deferment of capital expenditure. Tight control on fixed expenses.
‒ Digitalization of the S&OP processes by implementation of a CRM system and automation of certain operations activities is under way
‒ Engagement with all stakeholders is continuous process
• Virtual dealer meet, for North, East and West region for all the three product segments. Issues addressed and few relaxation given in payment terms.
• Virtual supplier meet where 90 people participated,
▪ Board & Tissue Plants started on 17th of April and the production was bought to 100% by 20th of April. This accounted for 45% of our entireplant capacity. From 10th May the entire plant is running with manpower of 2500 @ 70 % of total manufacturing capacity.

Rea
l Est
ate
Fina
ncia
lsPu
lp &
Pap
erTe
xtile
sABOUT CENTURY PULP & PAPER
35 years ofExcellence
Established in 1984.
The India’s only integrated Pulp and Paper mill that delivers comprehensive solutions in finest varieties of Writing & Printing Paper , Virgin fiber grade fine tissue, Multilayer Packaging Board and Rayon Grade Pulp.
Entered into Tissue retail business with its own branding.
28

Rea
l Est
ate
Fina
ncia
lsPu
lp &
Pap
erTe
xtile
s
Capacity Spectrum
4.45 Lakh MTPA(Board Paper Tissue RGP)
Total Capacity
> 5,000(Approx)
Manpower
86 MW(Self Generation Turbine)
Power
Rs. 2,530 Cr(Approx. opening FY21)
Fixed Assets
RGPTechnology/ Capacity:
MECHANO/ 87 TPD
PM 1 & 2Technology/ Capacity:
MECHANO/ 110 TPD
PM 3Technology/ Capacity: VOITH
SUZLER/ 250 TPD
PM 4Technology/ Capacity: VOITH
SUZLER/ 250 TPD
PM 5 (Tissue)Technology/ Capacity:
METSO/ 100 TPD
BM 6 (Board)Technology/ Capacity:
VOITH/ 500 TPD
1984
1984
1995
2007
2009
2012
OUR JOURNEY
29
2020
PM 7 (Tissue)Technology/ Capacity:
VALMET/100 TPD
Rea
l Est
ate
Fina
ncia
lsPu
lp &
Pap
erTe
xtile
sOUR PRODUCTS
30

Rea
l Est
ate
Fina
ncia
lsPu
lp &
Pap
erTe
xtile
s
Board Capacity– 500 ton per dayPaper Capacity – 650 ton per dayTissue Capacity– 100 ton per day*Rayon Grade Pulp – 100 ton per day*Excluding , Additional Capacity in Tissue of 100 ton per day in October’20
Flag bearer in Paper Industry
India’s only integrated mill that delivers comprehensive solutions in Paper, Tissue & Board from a single location
Fastest growing paper company in the industry
CENTURY PULP & PAPER MILL - CAPACITIES
Present Annual Production Capacity4,45,000 tons
31

Rea
l Est
ate
Fina
ncia
lsPu
lp &
Pap
erTe
xtile
sTHE FLAG BEARER OF INDIAN PAPER INDUSTRY
Products Global Presence
BOARD
5Countries
TISSUE
Countries 19WRITING & PRINTING
PAPER
Countries 43
RGP - RAYON GRADE PAPERRayon Grade Pulp is a highly purified form ofcellulose made from wood and used in a widevariety of consumer applications. Century'sRayon Grade Pulp is well-accepted due to itshigh purity, minimal inorganic impurities,good whiteness and optimal viscosity. Usesof the pulp include Viscose Staple Fiber,Viscose Filament Yarn (for textiles and nonwoven products for household, hygiene,medical and industrial absorbent products)and cellophane papers.
BOARD PAPERCentury board machine has 4 head boxesand 4 wire meshes. Shoe press removeswater from pulp while retaining maximumbulk, Yankee provides good gloss. In thecalendaring process, there are soft nips forless bulk loss and increased smoothness.Has a well equipped and advancedlaboratory with all the latest equipment.Laboratory testing is done in a temperatureand humidity controlled environment, as perTAPPI.
TISSUESet up in 2009, Century is the largest and most advancedmanufacturer of Jumbo Soft Tissue Paper Rolls in India.Spread over 60,000 sq. m, its plant houses the state-of-the-art "Metso Machine with Crescent Former" thatproduces world-class tissue paper. As a result, qualitystandards are consistently high and this contributes to thehigh hygiene levels and overall cleanliness AH & AFH.New Valmet Advantage Tissue Line of 100 MTDcapacity upcoming by Oct’2020 with ViscoNipTechnology & Redry giving consumers advantage ofworld class quality standards
INDUSTRIAL PAPERCentury manufacture different type ofpaper used in Industrial use: widerange of packaging, cardboard,tissue, insulation and wrappingproducts. Demand for industrialpaper is often affected by thesefactors:• Industrial production• Growth in the packaging industry• Development in technology• Substitution by other materials.
WRITING & PRINTING PAPERS
Century Pulp & Paper range ofwriting and printing paper is used toproduce a wide range of stationerysuch as notebooks and envelopes.Entry-level varieties such as creamwove, maplitho and coated paperare popular. Although the marketshare of higher-quality paper hasbeen increasing, the entry-levelvarieties still form the bulk ofdemand.
COPIERS
Copier Paper is typically a white commodityin writing paper grade. Copier Paper nowmarketed as multi-purpose paper to beused in most common type of officemachines including photocopiers, computerprinting paper and various other printertypes.
Copier Paper is of good quality and uniformdimension paper, which is used forphotocopying. 32

Rea
l Est
ate
Fina
ncia
lsPu
lp &
Pap
erTe
xtile
s
33
RAW MATERIAL FLEXIBILITY
Captive
Captive – 268035 MT Imported – 89240 MT
Grand Total – 357275 MT
Fiber Line Pulp Mill
Raw Material Storage and Chipping
Bagasse Pulp Mill Fiber Line
RGP Pulp Mill
DIP
3%11447
8%26681
35%126570
8%29337
15%54451
6%19549
25%89240
0
20000
40000
60000
80000
100000
120000
140000
160000
RGP PGP Fiber Line WPP Bagasse DIP Imported
Volu
me
in M
T

Rea
l Est
ate
Fina
ncia
lsPu
lp &
Pap
erTe
xtile
s
Industry Growth Industry Composition Per Capita Consumption
• India accounts for 4.5% of global paper industry
• Projected growth at a CAGR of 5.5% in FY 19-23
• Total Demand- 19.8 Million MT in FY 20-21
• Total Supply
- Domestic: ~15.8 Million
- Imports: ~4 Million
• Highly fragmented, cyclical and capital-intensive
• Top 9 players supply 35% of the domestic supply.
• 2/3rd players are sub-scale (<65,000 TPA capacity)
• India’s per capita consumption is very low
• Indian consumption stands at ~13.0 kg /capita as compared to world’s average of 57 kg / capita. (Per capita consumption of Indonesia 32 kg, China 78 kg and US 229 kg)
Market facts
Growth Drivers
• Higher spends by government on education programs
• Rising literacy levels and hygiene awareness
• Better packaging for FMCG, FMCD, Pharma & e-commerce products
• Substitution of plastic (Paper straw, cups and food wraps)
• Eco-friendly tableware industry is growing at a rapid pace (Bagasse pulp)
Source: CRISIL, Care Ratings report and Business Analysis
INDUSTRY OVERVIEW – INDIAN PAPER SECTOR
34

Rea
l Est
ate
Fina
ncia
lsPu
lp &
Pap
erTe
xtile
s
20%
51%
17%12%
32%
49%
4%
16%
0%
10%
20%
30%
40%
50%
60%
WPP Packaging Board Speciality Newsprint
India vs World – Segment-wise consumption
Global India
Paper board and tissue will increase their share of total paper consumption to be on par globally
CAGR growth: ~3-4% for FY 20 to FY 24
Demand : 5.7 million MT in FY 20-21
CAGR growth: ~6-7% for FY 20 to FY 24
Demand: 10.2 million MT in FY 20-21
CAGR Growth : ~10% for FY 20 to FY 24
Demand: 1.1 million MT in FY 20-21
✓Rising literacy levels, Spends in Education sector
✓Growth of service sector and increased usage in corporates
✓Requirement of better quality packaging in FMCG, FMCD, Pharma and e-Commerce
✓Substitution of plastic (Paper straw and Cups)
✓ Increased usage in hospitality sector
✓Personal hygiene awareness is increasing
✓ Increased urbanization/ household commodity
Segment Growth Drivers
WPP
Packaging Board
Specialty
Source: CRISIL, Care Ratings report
SEGMENT-WISE CONSUMPTION
35

Rea
l Est
ate
Fina
ncia
lsPu
lp &
Pap
erTe
xtile
s
Plant locations
CPP is operating at 100% capacity utilization.
Source: IPMA, Market Intelligence
COMPETITIVE LANDSCAPE
% Market share during FY20 - H1
36
TISSUE MARKET SIZE (VIRGIN+RECYCLE)
MILLS NZ EZ WZ SZ
MARKET SHARE 39,000 3,500 33,800 36,600
CPP 12.6% 4.0% 4.5% 5.3%
ORIENT 10.3% 45.7% 10.7% 8.7%OTHERS VIRGIN GRADE MILLS 0.0% 0.0% 1.8% 1.7%
IMPORTS 4.4% 0.0% 10.4% 2.0%
OTHERS -RECYCLE GRADE 72.8% 50.3% 72.6% 82.2%
BOARD MARKET SIZE (RELEVANT SEGMENT ONLY)MILLS NZ EZ WZ SZ
MARKET SHARE 1,27,200 19,950 1,83,900 96,900CPP 29.9% 12.4% 12.0% 0.0%JK 9.1% 3.5% 15.8% 6.2%ITC 27.7% 50.1% 42.1% 45.4%
TNPL 4.7% 3.8% 8.2% 17.5%EMAMI 14.7% 30.1% 9.5% 6.2%WCPM 0.9% 0.0% 2.7% 19.5%
OTHERS 12.9% 0.1% 9.7% 5.2%

Rea
l Est
ate
Fina
ncia
lsPu
lp &
Pap
erTe
xtile
s
Other Income - Rs 19 CrCapex Incurred - Rs 80 Cr
164 Cr
FY 13
FY 15
177 Cr FY 16
289 Cr FY 17
424 Cr FY 18
481 Cr FY 19
716 Cr
FY 14(-)16 Cr
Volume Growth 60K MT - Rs 29 CrRM Cost Reduction - Rs 13 Cr
Realisation increase - Rs 67 CrOther Income - Rs 13 Cr
Capex Incurred - Rs 49 Cr
Volume Growth 55K MT - Rs 44 CrReduction in RM cost- Rs 43 Cr
Improved Boiler Efficiency - Rs 12 CrOther Income - Rs 29 Cr
Capex Incurred - Rs 51 Cr
Volume Growth 17K MT - Rs 18 CrRM Cost Reduction - Rs 100 Cr
Capex Incurred - Rs 58 Cr
Volume Growth 13K MT - Rs 18 CrRealization increase - Rs 58 Cr
Reversal - Rs 128 Cr
RM Cost Reduction - Rs 40 CrCapex Incurred - Rs 13 Cr
EBITDA MOVEMENT & KEY LEVERS
37
510 Cr
FY 20
Volume Drop 19K MT – Rs 21 CrRealisation Drop – Rs 57 Cr

Rea
l Est
ate
Fina
ncia
lsPu
lp &
Pap
erTe
xtile
s
EBIT
DA
in C
rore
s
Financial Performance
EBITD
A % as Total
Sales Revenue
Capacity Utilization Percentage
STRATEGIC PERFORMANCE (2013-2020)
38
-16.41
163.76 176.86
288.88
423.73480.97
716
510
-1.3%
9.5% 10.2%
14.7%
20.2%21.9%
27.1%
21.4%
-5.0%
0.0%
5.0%
10.0%
15.0%
20.0%
25.0%
30.0%
-100
0
100
200
300
400
500
600
700
800
2012-13 2013-14 2014-15 2015-16 2016-17 2017-18 2018-19 2019-20YoY Growth
1282
1726 17341966 2093
2198
2643
2383
152 205 165 140 100 204 319398
0
500
1000
1500
2000
2500
3000
2012-2013 2013-2014 2014-2015 2015-2016 2016-2017 2017-2018 2018-2019 2019-2020
Sales Turnover in CroresDomestic Exports
62%
76%
75%
88%
94%
97%
104%
100%
2012-2013
2013-2014
2014-2015
2015-2016
2016-2017
2017-2018
2018-2019
2019-2020

Rea
l Est
ate
Fina
ncia
lsPu
lp &
Pap
erTe
xtile
s
39
CAPEX – FY 20
Rs. In Cr.
Capex (including advances) Amt
Paper Machine 3 & 4 11
New Tissue Plant 81
Evaporator 14
SAP 4
Others (including civil/ road works) 6
Total CAPEX 121

Rea
l Est
ate
Fina
ncia
lsPu
lp &
Pap
erTe
xtile
sKEY INITIATIVES ENVISAGED
Rs 100 crs on avg per year envisaged to be allocated for next 3-5 years on growth plans
Re-structuring
EPCG
Operations Procurement & IT
Capacity Expansion
Financial
Lean Senior Leadership Team
Workmen Optimization
Apprentice appointment
Induct MT in sales and train them for direct sales rather than thru dealer
Increased Exports
Group Company export benefit
Plan to fulfill licenses by 2021
Sweating of existing assets
Efficiency Drive
Effective utilization of Power/Steam
Debottlenecking of key ingredient - White Liquor (wherever possible)
Asset Care Process Implementation –condition monitoring, MTBF/MTTR
Continuous Cost Reduction Processes
Tissue expansion 36k MT
New VAP products
PM 3 & 4 Upgradation
Increased speed
Bharuch Plant 250 TPD
BCTMP Plant
3rd party outsourcing Project
New Evaporator
New PCC Plant
New Recovery Boiler/Turbine
Extended credit days
Lease renewal – Revenue Reversal
Working Capital Optimization
Effective Management of debtors
Sustainable Wood Procurement
Cost Effective Pulp combination
Effective Coal Procurement
SAP implementation
Consolidation of MIS
JIT Procurement
VMI – Vendor Managed InventoryB2C ChannelIncrease Dealer
NetworkInnovation
Asset Light Model (Outsourcing)
Working Capital management
Reduce Logistic Cost
FUTURE AHEAD
40

Financials Real Estate Pulp & Paper Textiles
World’s 2nd and India’s 1st LEED V4 certified textile mfg co.

Rea
l Est
ate
Fina
ncia
lsP
ulp
& P
aper
Text
ilesTEXTILES
Plant Overview
Shirting Bottom Wear Finer Fabrics Bed Linen
42

Rea
l Est
ate
Fina
ncia
lsP
ulp
& P
aper
Text
iles
43
Covid – 19 Impact and Mitigation – Textiles
• Covid-19 Impact:
- Cancellation or suspension of confirmed orders. This led to building up of inventory in the entire supply chain.
- Unilateral increase in payment terms by retailers and importers.
- Scarcity of skilled workforce in India as people migrated to hometown.
- Exports a big challenge as Europe and the USA are the most affected regions.
- Most of the retail stores across the world have shut the stores and their survival depends on their strong finance backup.
Even if they survive, they will be more price sensitive while releasing the orders
• Mitigation measures
- Conserve cash by focusing on liquidation of existing inventory.
- Focus on cost-cutting measures. To reduce rejection % and work on reducing lead times. Effort on Just-In-Time inventory
model.
- Produce competitive products having features of “use and throw” for health care and hospitality industry.
- Develop anti-bacterial, anti-viral, dust-free products both for Apparel and Home-linen that will be in demand in time to
come.
- Move towards a sustainable business model that is environmentally acceptable and helps in capturing the impacted
business share.
- New orders to be reworked with strict payment terms and with the security of payments.

Rea
l Est
ate
Fina
ncia
lsP
ulp
& P
aper
Text
ilesSTEP TOWARDS MORE FOCUS ON GROWING BUSINESS
State-of-the-Art Vertically Integrated Plant (Fibre to Finishing).
Birla Century Brand
Fine spinning up to count 200 ne.
Legacy of Textile for more than 100 years.
STEP Certification – 1st fabric manufacturing company in India to receive this for sustainability
US-China trade war has increased demand of Indian products in USA
RCEP (Regional Comprehensive Economic Partnership) non signing at present helps India’s domestic market.
Go-green & zero discharge at Bharuch unit, justifies parameters of global brand
Open LLC at USA to cater big brands, regional retailers, hospitality industries, etc.
Increased penetration of organised retail, better demographics and rising income levels
Abundant availability of raw material cotton.
Growing exports demand and direct catering to big brands in USA
Textile
Strengths Growth Drivers Advantages
44

Rea
l Est
ate
Fina
ncia
lsP
ulp
& P
aper
Text
ilesBUSINESS – OVERVIEW & CAPEX SPEND
Particulars Rs. Cr.
Total Amount Spent 45
Spinning 6
Processing 4
Power Plant 25
Others 10
Year of Installation 2008
Installed Capacity 39.77 Million Meters
Actual Production for FY 2019-20 35.94 Million Meters
Capacity Utilization FY 2019-20 92.%
Actual Turnover for 12 Months 735 Crore
EBITDA 12 Months 34 Crore
Business intends to maintain the current capacities and normal modernisation and upgradation of facilities will be done to ensure growth in EBITDA
45

Rea
l Est
ate
Fina
ncia
lsP
ulp
& P
aper
Text
iles
46
BIRLA CENTURY, STRATEGIC PERFORMANCE
2015-16 2016-17 2017-18 2018-19 2019-20EBITDA (INR Crs) 60 53 51 58 34EBITDA (in %) 9.27% 8.56% 7.90% 7.60% 4.67%
3.00%4.00%5.00%6.00%7.00%8.00%9.00%10.00%
20253035404550556065
Financial Performance
96%
91%
90%
96%
92%
80% 85% 90% 95% 100%
2015-16
2016-17
2017-18
2018-19
2019-20
Capacity Utilisation
539 505562 582
533
112 114 83
183 202
50
150
250
350
450
550
650
750
2015-16 2016-17 2017-18 2018-19 2019-20
Sales Turnover (INR Crs)
Domestic Exports

Rea
l Est
ate
Fina
ncia
lsP
ulp
& P
aper
Text
ilesBIRLA CENTURY - DISTRIBUTION PATTERN
51, 51%49, 49%
0, 0%
Export ( USA, Aus, HK, Phil, UK, Can)ConverterDomestic
28%
19%44%
9%
Zone Wise
NorthSouthWestEast
Home TextilesApparels
47
33%
29%
19%
6%
13%
Segment-wise
BrandsTradersOTCRTSExports

Rea
l Est
ate
Fina
ncia
lsP
ulp
& P
aper
Text
ilesBIRLA CENTURY- JOURNEY OF BUSINESS SUSTAINABILITY
Accreditation & Awards for sustainable business Environment
Name of Certification Validity Impact of Business Sustainability
1 Oeko-Tex Standard 100 31-Mar-21 For assuring product safety that it is safe for use from 300 harmful chemicals
2 NABL Accreditation for our Testing Laboratory of Birla Century 11-Oct-20 Important for sustainable businesses by assuring accuracy of test results on
an international platform
3 STEP– Certification 30-Sep-22 To assure that the manufacturing site is sustainable for producing clean, safe and eco-friendly products
4 MIG Tags 15-Nov-22 QR Code based web solution for transparent & responsible supply chain
5 SA 8000- 2014 3-Sep-20 To assure social accountability at manufacturing plant
6 LEED ( Leadership in Energy and Environmental Design) 3-Aug-22 To assure that building is green i.e. safe for industrial manufacturing
7 BCI Registered Member ( Better cotton Initiative ) 1-Nov-20 Social initiative for sustainable farming practices for farmers to improve their economical conditions
8 Global Organic textile Standards( GOTS) 20-Nov-20 For promoting and assuring right organic products
Apart from above, Birla Century has similar certifications from world renowned international accreditation institutes, certifying either Go-Green, product safety, safer environment, social performance expectation, healthy working conditions, sustainability etc. Other sustainability initiatives include Fair Trade, HIGG Index Level 3, ZDHC participation, Joint Life Program approved unit from Inditex (Zara). Birla Century is the approved supplier of international brands like Macy's, West point Home, William Sonama, COSTCO, Standard Fibre etc. for Bed linens.
48

Rea
l Est
ate
Fina
ncia
lsP
ulp
& P
aper
Text
ilesDISCLAIMER
No statement in this presentation is intended as a profit forecast or estimate for any period and no statement in this presentation should be interpreted to mean that cash flow from operations, free cash flow, earnings, earnings per share basis for any of parties, as appropriate, for the current or future financial years would necessarily match or exceed the historical published cash flow from operations, free cash flow, earnings, earnings per share or income on a clean current cost of supplies basis for any of the parties, as appropriate.
This presentation includes statements that are, or may be deemed to be "forward-looking statements" and other estimates and projections with respect to management’s subjective views of the anticipated future performance, financial condition, results of operations and business of the Company. Forward-looking statements are statements of future expectations that are based on management’s current expectations and assumptions and involve known and unknown risks and uncertainties that could cause actual results, performance or events to differ materially from those expressed or implied in these statements. No assurance can be given that the forward-looking statements in this presentation will be realised. Forward-looking statements include, among other things, statements concerning the potential exposure of the Company, to market risks and statements expressing management’s expectations, beliefs, estimates, forecasts, projections and assumptions including as to future potential cost savings, synergies, earnings, cash flow, return on average capital employed, production and prospects.
Century Textile & Industries Limited. Registered Office : “Century Bhavan”, Dr. Annie Besant Road, Worli, Mumbai, 400030. Tel : +91-22-24957000 FAX : +91-22-24309491E-Mail : [email protected] website : www.centurytextind.comCorporate Identity Number : L17120MH1897PLC000163
49

54
Thank You