Case study on the impacts of climate change on Milkfish pond production Panay Island, Philippines
89
Case study report Case study on the impacts of climate change on Milkfish pond producƟon in the MunicipaliƟes of Borotok Nueva and Dumangas, Panay Island, Philippines
-
Upload
independent -
Category
Documents
-
view
4 -
download
0
Transcript of Case study on the impacts of climate change on Milkfish pond production Panay Island, Philippines
Case study report
Case study on the impacts of climate change on Milkfish pond produc on in the Municipali es of Borotok Nueva and Dumangas, Panay Island, Philippines
2
Executive summary The Aquaclimate Project is a three-year initiative to strengthen adaptive capacities of rural farming communities to the impacts of climate change. The report highlights policy implications, research agenda and on-farm adaptations that will be required to sustain the industry and its contribution to the livelihoods of farmers and food security. In the Philippines, the project has focused on studying the impacts of climate change on milkfish brackishwater fishpond farmers in the towns of Barotac Nuevo and Dumangas situated in the province of Iloilo. Milkfish (Chanos chanos) is an important food fish in the Philippines. It is mostly grown in pens and cages, but the bulk of production comes from brackishwater fishponds. In 2011, production reached 225,000 tons (Bureau of Agricultural Statistics). The province of Iloilo is one of the top milkfish-producing provinces in the country, with production reaching 24,744 tons. The towns of Barotac Nuevo and Dumangas, in particular, have extensive fishpond areas leased from the government (FLAs) dedicated to milkfish farming, which make them suitable sites for the study. The perceptions, attitudes and adaptation strategies of milkfish farmers from these sites were mapped out using several tools. Focus group discussions were held over several sessions to (1) map farmer perceptions about climate change and likely impacts; (2) assess vulnerability of the production system; (3) estimate the economic losses for the farmers; (4) map adaptation measures that farmers/ communities respond with, when exposed to extreme climate events; and (5) map the agencies involved with aquaculture planning and management and their involvement. During the workshops, the stakeholder-participants were able to determine the fish farmers’ perception of climate change; come up with crop and seasonal calendars; risk assessment; and adaptation measures/recommendations. Stakeholder workshops were also conducted to identify vulnerability indicators and to develop adaptation measures to future predicted climate change. Mapping and analysis were further held to identify the importance and influence of key stakeholders and institutions. Fish farmers from the two towns who operate in government-leased fishponds were surveyed using a questionnaire to determine socioeconomic profile, production data, farm information, farmer perception of climate change, and adaptation measures used. Data derived from these were further evaluated and analyzed. The data gathered and analyzed during the course of the study were used to come up with briefs aimed specifically at target stakeholders, which include policymakers, scientists and the fish farmers themselves. Outlined in these briefs are recommendations and priority activities that may be used to better prepare them on the effects of climate change. Milkfish farmers are vulnerable to the effects of climate change. It is therefore important that they adapt strategies to lessen their vulnerability. Measures that could be done include sustainable aquaculture practices; diversification of farmers’ income sources; diversification of culture species; coming up with more efficient ways to utilize natural resources to increase productivity; building farmer capacities through access to information and knowledge; and forging partnerships between the public and private sectors. With the current change in climate, it is thus recommended to shift culture practices, from an extensive system relying mostly on wild fry and natural feeding, to a more intensive system where formulated diets are used to grow fish at higher densities.
3
Table of Contents 1. Introduction .................................................................................................................................. 4
2. Climate change impacts on aquaculture ....................................................................................... 8
3. Climate change impacts and vulnerability .................................................................................. 17
4. Stakeholder and Institutional mapping and analysis .................................................................. 27
5. Farmer’s perception on climate change. .................................................................................... 31
6. Green House Gas production and resource use bench marking .................................................. 6
7. Recommended adaptation measures for future predicted Climate Change .............................. 22
8. Conclusions ................................................................................................................................. 31
9. Recommendations ...................................................................................................................... 32
References ........................................................................................................................................... 33
Annex 1 – Generic project methodology used .................................................................................... 35
4
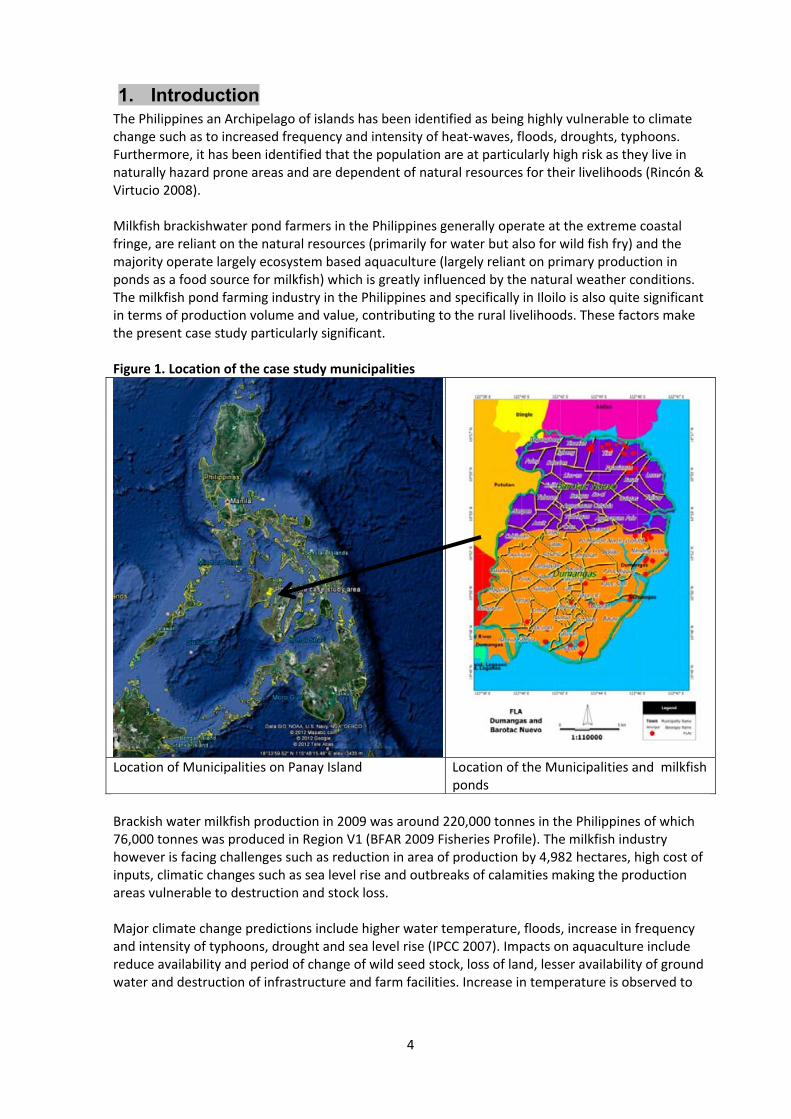
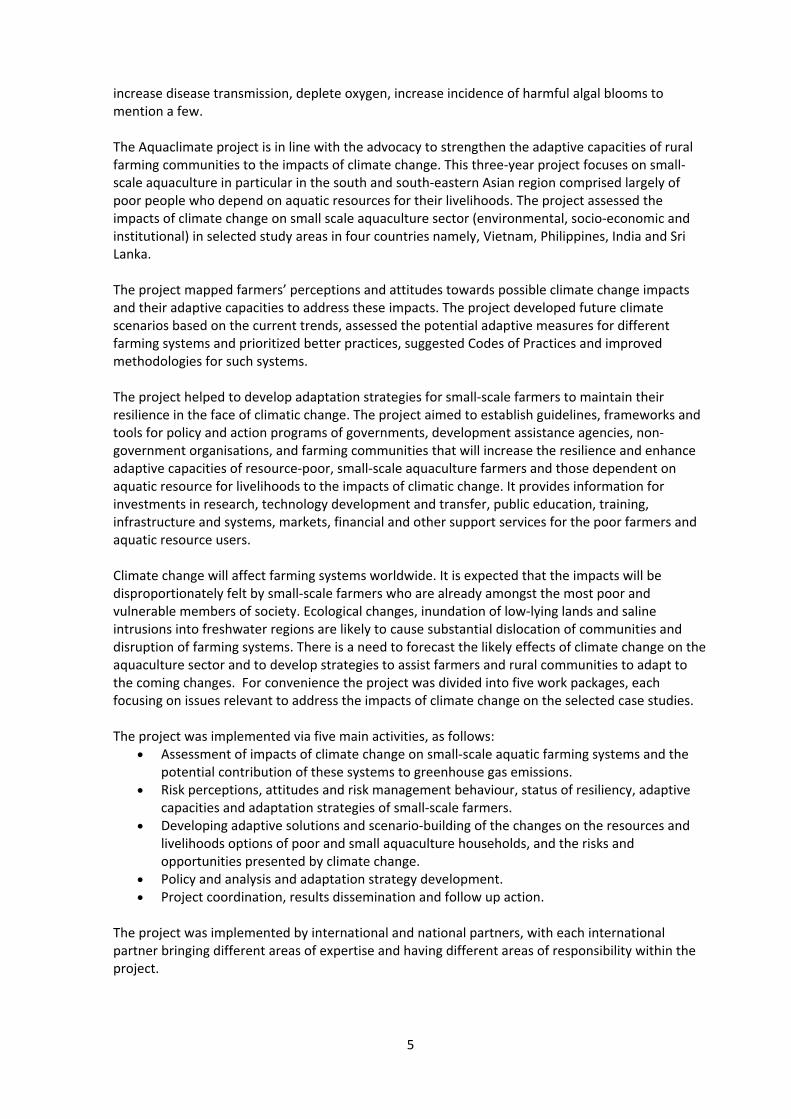
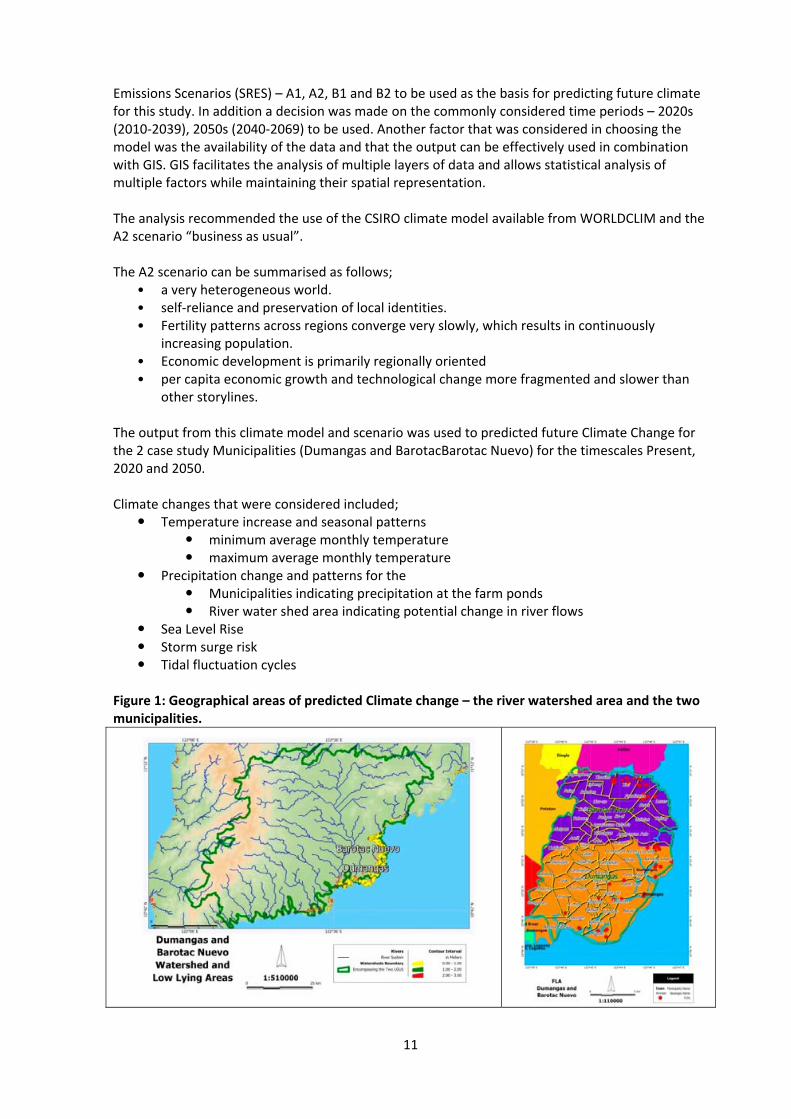
1. Introduction The Philippines an Archipelago of islands has been identified as being highly vulnerable to climate change such as to increased frequency and intensity of heat-waves, floods, droughts, typhoons. Furthermore, it has been identified that the population are at particularly high risk as they live in naturally hazard prone areas and are dependent of natural resources for their livelihoods (Rincón & Virtucio 2008). Milkfish brackishwater pond farmers in the Philippines generally operate at the extreme coastal fringe, are reliant on the natural resources (primarily for water but also for wild fish fry) and the majority operate largely ecosystem based aquaculture (largely reliant on primary production in ponds as a food source for milkfish) which is greatly influenced by the natural weather conditions. The milkfish pond farming industry in the Philippines and specifically in Iloilo is also quite significant in terms of production volume and value, contributing to the rural livelihoods. These factors make the present case study particularly significant. Figure 1. Location of the case study municipalities
Location of Municipalities on Panay Island Location of the Municipalities and milkfish ponds
Brackish water milkfish production in 2009 was around 220,000 tonnes in the Philippines of which 76,000 tonnes was produced in Region V1 (BFAR 2009 Fisheries Profile). The milkfish industry however is facing challenges such as reduction in area of production by 4,982 hectares, high cost of inputs, climatic changes such as sea level rise and outbreaks of calamities making the production areas vulnerable to destruction and stock loss. Major climate change predictions include higher water temperature, floods, increase in frequency and intensity of typhoons, drought and sea level rise (IPCC 2007). Impacts on aquaculture include reduce availability and period of change of wild seed stock, loss of land, lesser availability of ground water and destruction of infrastructure and farm facilities. Increase in temperature is observed to
5
increase disease transmission, deplete oxygen, increase incidence of harmful algal blooms to mention a few. The Aquaclimate project is in line with the advocacy to strengthen the adaptive capacities of rural farming communities to the impacts of climate change. This three-year project focuses on small-scale aquaculture in particular in the south and south-eastern Asian region comprised largely of poor people who depend on aquatic resources for their livelihoods. The project assessed the impacts of climate change on small scale aquaculture sector (environmental, socio-economic and institutional) in selected study areas in four countries namely, Vietnam, Philippines, India and Sri Lanka. The project mapped farmers’ perceptions and attitudes towards possible climate change impacts and their adaptive capacities to address these impacts. The project developed future climate scenarios based on the current trends, assessed the potential adaptive measures for different farming systems and prioritized better practices, suggested Codes of Practices and improved methodologies for such systems. The project helped to develop adaptation strategies for small-scale farmers to maintain their resilience in the face of climatic change. The project aimed to establish guidelines, frameworks and tools for policy and action programs of governments, development assistance agencies, non-government organisations, and farming communities that will increase the resilience and enhance adaptive capacities of resource-poor, small-scale aquaculture farmers and those dependent on aquatic resource for livelihoods to the impacts of climatic change. It provides information for investments in research, technology development and transfer, public education, training, infrastructure and systems, markets, financial and other support services for the poor farmers and aquatic resource users. Climate change will affect farming systems worldwide. It is expected that the impacts will be disproportionately felt by small-scale farmers who are already amongst the most poor and vulnerable members of society. Ecological changes, inundation of low-lying lands and saline intrusions into freshwater regions are likely to cause substantial dislocation of communities and disruption of farming systems. There is a need to forecast the likely effects of climate change on the aquaculture sector and to develop strategies to assist farmers and rural communities to adapt to the coming changes. For convenience the project was divided into five work packages, each focusing on issues relevant to address the impacts of climate change on the selected case studies. The project was implemented via five main activities, as follows:
• Assessment of impacts of climate change on small-scale aquatic farming systems and the potential contribution of these systems to greenhouse gas emissions.
• Risk perceptions, attitudes and risk management behaviour, status of resiliency, adaptive capacities and adaptation strategies of small-scale farmers.
• Developing adaptive solutions and scenario-building of the changes on the resources and livelihoods options of poor and small aquaculture households, and the risks and opportunities presented by climate change.
• Policy and analysis and adaptation strategy development. • Project coordination, results dissemination and follow up action.
The project was implemented by international and national partners, with each international partner bringing different areas of expertise and having different areas of responsibility within the project.
6
The coordinating organisation of the Aquaclimate project is the Network of Aquaculture Centers in Asia-Pacific (NACA) – Bangkok, Thailand. The international project partners for the study were:
• Bioforsk – The Norwegian Institute for Agricultural and Environmental Research, Ãs, Norway
• Kasetsart University, Coastal Development Centre & Aquaculture Business Research Centre of Fisheries Environmental Science Department, Thailand
• Akvaplan-niva ÃS, Tromso, Norway The national partner for the Philippines case study was the Bureau of Fisheries and Aquatic Resources (BFAR), specifically BFAR central office and BFAR region 6. This was an advantage in Philippines as BFAR is the main agency responsible for fisheries and aquaculture sector in the Philippines. Policy recommendations developed in this case were endorsed by BFAR, the key stakeholder and this is itself is an indicator showing the relevance of the policy inputs from the project. Such guidelines developed in cooperation with the key stakeholders.
1.1. Milkfish Culture Milkfish is scientifically known as Chanos chanos. Adults spawn at sea, the larvae migrate to shore, juvenile settle in shallow-water habitats, and large juveniles and sub-adults return to sea thus Milkfish have a wide tolerance to variations in salinity. Fry and juvenile stages occupy estuarine environments and the adult form lives in the open ocean. They can live as long as 15 years and grow to a maximum weight of 14 kg. Milkfish have a large bio-geographic distribution within the Pacific and Indian Oceans with the Philippines, Indonesia and Taiwan at the center of geographic distribution. Milkfish have been recorded as far north as Japan and as far south in eastern Australia. They extend eastwards to America and are common in the bays and lagoons of Mexico. Milkfish is a desirable species for aquaculture for a number of reasons:
• Milkfish fry supply from the wild is abundant because of the high fecundity of spawners; • Milkfish fry are hardy and easy to handle; with a high tolerance and adaptability to salinity
change; • Milkfish are herbivorous, thus benthic algae grown from fertilization of pond bottom is a
suitable food; • Growth rate of milkfish is much faster than other herbivorous fish; • Milkfish are not cannibalistic, thus stocking density can be high; and • Milkfish has high resistance to diseases
1.2. Milkfish production in the Philippines Milkfish production generally is practiced in cages, inland ponds and coastal ponds. Cage culture of milkfish is intensive with high stocking densities and artificial diets to feed the milkfish. Pond culture is practiced under a range of intensities from intensive to extensive. The extensive milkfish pond farming is the largest sector and is the subject of the present study. Extensive ponds tend to be shallow (about 30-40 cm deep), around and typically use tidal changes to manage water movement into and out from the farm. The majority of extensive pond farms rely on fertilization of ponds and primary production as the feed source of fish. Milkfish is an important commodity in the Philippines. It is cultured in different culture systems i.e. intensive, modified intensive and extensive. Fry is produced in the hatchery and fry are also collected along the coastlines during breeding season. The milkfish industry is confronted with
7
problems such as variable fry supply, high cost of farm inputs, lack of technology for value-added, lack of manpower to effectively transfer technology, and multi-layered marketing system. Fishponds in the Philippines consists of 3 pond types i.e. nursery, transition and rearing ponds. Some farms have nursery ponds where the fry or fingerlings are initially stocked and nurtured before they are transferred to the rearing pond. Water depth is relatively shallow (15–25 cm).There are transition ponds where fry and fingerlings normally stay for 30-45 days. All farms have rearing pond where the fingerlings are raised to marketable sizes. The water depth is deeper than the nursery pond (30 – 50 cm deep) and size ranges from less than a hectare (for very small fishponds) to as big as 20 hectares (for very big fishponds).
The pond are surrounded by dikes are the main structures that hold water in the pond. They are built out of soil materials that are present on the farm site. The top is called the crown and the bottom is called the base. There are three classifications of dikes:
• Perimeter Dike - The main dike that protects the whole fishpond from the outside environment. It has to be high and big to withstand flooding and erosion.
• Secondary Dike - The dike that is used for the main supply canal and for the rearing pond compartments. They are a little lower and smaller than the perimeter dike.
• Tertiary dike – Dikes used mainly for nursery ponds. They are lower and smaller than the secondary dike
Water management is an important part of the overall farming practice. Ponds are periodically filled and drained both prior to stocking and for harvesting. In addition, water in the ponds must be exchanged from time to time while fish are stocked to manage salinity and dissolved oxygen levels. A sluice gate, culvert, or pipe is used to control water flow. A conventional milkfish pond has a main gate which is the main entrance of water that supplies the whole fishpond system. Secondary gates control water supply to the rearing ponds. Organic fertilizers such as chicken manure are sometimes used for milkfish culture to encourage the development the benthic algal mat (“lablab”) that milkfish feed on. Lablab is a benthic mat with various components including unicellular, colonial and filamentous blue-green algae or cyanobacteria, a great variety of diatoms, some unicellular or very fine threads of green algae, bacteria, protozoans, minute worms, copepods and other small crustaceans. However due to concerns regarding antibiotic residues in the chicken manure, the practices is not prevalent and is being discouraged. Another important brackishwater pond natural feeds for milkfish include ‘Lumut’ (filamentous green algae) and Phytoplankton. Cyanobacteria dominate in fertilized ponds, but diatoms take over in unfertilized ponds. Under some conditions, the benthic mat can detach and float. Lablab is about 6–20% protein, and is preferred by all sizes of milkfish. Fingerlings are usually stocked into growout ponds at several different sizes classes: ‘dampalit’ (2.4cm, 1-3g), ‘hatirin’ (4-7cm. 3-6g) and ‘garongin’ (23-25 cm, 5-10g) and harvested at between 200 to 400+ grams. The culture cycle from fingerling to market size usually lasts 4 to 5 months and growout farmers can produce up to two crops per year.

8
Farmers from Fishpond Lease Agreement (FLA1
) farms were selected as the target segment for the study. FLA holders generally have extensive milkfish farms of less than 25 ha and can be considered as small-scale farmers. Fish pond lease agreements (FLAs) are lease agreements over coastal Government land for the purpose of fish pond development. FLA entitles the holder certain rights but also comes with certain obligations. FLA entitlements include ability to develop fish ponds and undertake aquaculture activities. FLA obligations include establishing and or maintaining a mangrove buffer zone between the fish ponds and the ocean.
classification traditional/extensive modified extensive 80%
environment river system
profitability most susceptible to climate change most practical
feed filamentous algae lablab: high salinity, high temp
feeding natural food, low fertility, NF + high organic load
stocking density 1000/ha/crop 1500-3000 ha/crop
water depth 20-30 cm; 30-50 cm
production/ha 600 kg/ha; 800-1000/ha
pond size 5-20 ha; 5-10 ha
1.3. Milkfish culture in Iloilo and case study areas The case study sites chosen were two municipalities located in Iloilo namely, municipalities of Dumangas and Barotac Nuevo. These municipalities have the highest production of farmed milkfish from brackishwater ponds. Moreover, in the recent years, typhoons, tidal surge, river flooding and seasonal changes were seen adversely affecting the cropping season, production and wild fry collection. Milkfish production in Iloilo province in 2008 was 18,956Mt from 11,579 Ha of culture area, of this about 4,500 ha were within Dumangas municipality and 1,799 ha within Barotac Nuevo municipality (the case study areas).
2. Climate change impacts on aquaculture There are a number of climate changes that impact aquaculture. These include; Climate change (seasonal change, gradual change, extreme events) Aquaculture is vulnerable to direct and indirect effects of climate change on;
• Wild fisheries. In the past Milkfish production was much more dependent on wild fisheries for the collection of wild broodstock and collection of wild fry. However, broodstock are now grown in ponds or cages until they reach the desired age or size for breeding. Also the role of wild fry collection has greatly diminished with greater
1
FAO 197 – An agreement entered into by and between the Secretary of Agriculture and qualified fishpond
applicant for the use of public land for fishpond development purposes for a period of 25 years
9
availability of hatchery reared fry from both domestic and foreign hatcheries. However for wild fry that is still collected, the wild Milkfish fisheries will be impacted mainly due to the direct and indirect effects of climate change on the abundance and distribution of the wild stocks with a likely increased variation in the supply of juveniles from changes to the location and suitability of inshore habitats for collection of fry driven by increasing temperatures, sea-level rise, and variation in coastal currents and salinity regimes.
• Aquaculture (the farming operations and infrastructure). Changes in temperature and rainfall patterns and their effects on salinity and oxygen can be expected to affect the reproduction, growth and survival of the fish as well as affect pond productivity. The direct effects of the projected increases in water temperature in the colder seasons are likely to be beneficial to milkfish farming. In particular, they are expected to
o lengthen the season in which wild fry are available for stocking ponds; o extend the geographical range of milkfish spawning to higher latitudes; o improve growth rate and so reduce the time to harvest. o Improve Food Conversion Rate
However peak maximum pond water temperatures will cause stress to the fish due to low oxygen levels and may affect pond productivity. Direct and indirect impacts
• Direct Impacts. There are direct effects of climate change for example the infrastructure for aquaculture ponds and water supply damaged by severe weather conditions.
• Indirect impacts. There are indirect effects of climate on the viability of aquaculture operations including the reduced availability and higher cost of feed ingredients due to the effects of the El Niño-Southern Oscillation (ENSO) on the supplies of fishmeal and the impacts of drought on crops.
Milkfish feed producers are no longer dependent on fishmeal and fish oil from Peru and so will not be greatly affected by changes in availability of fishmeal and fish oil. However, ENSO may affect the supply of rice bran (local) and the cost of soyabean meal (imported) Short term and long term impacts Climate change is the combination of short-term climate fluctuations, some of which can be seen as short-term trends, and long-term trends, because both are occurring together. Short-term climate fluctuations (including extreme events) are seasonal patterns and oscillations, such as the El Niño-La Niña Southern Oscillation (ENSO), as well as variable temperature patterns, heavy precipitation patterns (associated with typhoons and monsoons) and severe storms. Short-term climate fluctuations are those having increasing frequency and amplitudes, while what were formerly regarded as normal patterns become less frequent, and the near-term climate becomes more and more unpredictable. Extreme weather events are increasing in frequency and severity and occurring in wider areas. Extreme weather is defined with reference to the recorded historical distribution of a climatic event. Long-term climate change is defined as gradual climate change over decadal-scale timescales, including: sea-level rise; oceanic currents; gradual warming; acidification of open waters; and changes in the availability of freshwater. The impacts of climate change on aquaculture could be positive or negative, arising from direct and indirect impacts on the farmed organisms and on the natural resources that aquaculture requires, especially water, land, seed, feed and energy. As fisheries provide significant feed and seed inputs

10
for aquaculture, the impacts of climate change on them will also, in turn, affect the productivity and profitability of aquaculture systems. Handisyde et al. (2006) and De Silva and Soto (2009) reviewed the likely impacts of climate change on world aquaculture, including indirect impacts such as price fluctuations of competitive capture fisheries produce and impacts on the availability of fishmeal and fish oil. Climate change will increase physiological stress in some farmed fish. This will not only affect productivity, but will also increase vulnerability to diseases and, in turn, impose higher risks and reduce returns to farmers. Interactions of fisheries and aquaculture subsectors could create other impacts. For example, extreme weather events could result in escapes of farmed fish and contribute to reductions in genetic diversity of wild populations, affecting biodiversity more widely. These impacts will be combined with other factors that affect adaptive capabilities, including: increased pressure from ever larger human populations on natural resources; political, institutional and management rigidity that negatively impacts the adaptive strategies of aquaculture-dependent communities; deficiencies in monitoring and early-warning systems or in emergency and risk planning; and other non-climate factors such as poverty, inequality, food insecurity, conflict and disease. However, positive impacts can also emerge from changes in farmed species, increased growth rate and productivity and possible improved Food Conversion Rate in the cooler season. These opportunities are not yet well understood. A community’s ability to benefit will depend also on its adaptive capacity. Table 2 summarises the main negative impacts and outcomes of climate change for aquaculture. Table 2. Main impacts and outcomes of climatic change for aquaculture
Change Impacts and outcomes
Short-term heat/cold extremes
Hypoxia, heat and disease challenges kill fish and reduce productivity
Long-term warming
Reduced water quality, broodstock and seed availability and disease challenges force changes in farm locations; some fish grow faster, with better feed conversion and increase productivity
Sea-level rise Coastal land is lost and eroded, damaging coastal ponds; salt water intrudes and forces relocation of freshwater farms, but increases brackishwater and marine farming areas
Ocean circulation
Variable supplies of fishmeal, fish oil and some low value/trash fish, sometimes increasing fish feed costs; availability of some wild seed is reduced
Acidification Calcareous shell formation is compromised, especially for molluscs; water quality and plankton populations change, threatening fish health and potentially threatening reproductive processes of aquatic species
Precipitation
Predictability of water supply is reduced; flooding and droughts increase, compromising water supply and water quality, damaging farms, allowing fish escapes and killing fish; increased agricultural run-off can restrict safe harvesting from coastal aquaculture (e.g. oysters)
Severe storms; storm surges
Severe storms and storm surges increase in frequency and strength and in wider areas; farms are damaged with fish escapes and fish kills
2.1 Predicted future climate for BarotacBarotac Nuevo and Dumangas Climatic factors, such as air and water temperature, and precipitation and wind patterns, strongly influence fish health, productivity and distribution. An analysis was made of the 16 models used in the Asia Pacific region and the Intergovernmental Panel on Climate Change (IPCC) Special Report on
11
Emissions Scenarios (SRES) – A1, A2, B1 and B2 to be used as the basis for predicting future climate for this study. In addition a decision was made on the commonly considered time periods – 2020s (2010-2039), 2050s (2040-2069) to be used. Another factor that was considered in choosing the model was the availability of the data and that the output can be effectively used in combination with GIS. GIS facilitates the analysis of multiple layers of data and allows statistical analysis of multiple factors while maintaining their spatial representation. The analysis recommended the use of the CSIRO climate model available from WORLDCLIM and the A2 scenario “business as usual”. The A2 scenario can be summarised as follows;
• a very heterogeneous world. • self-reliance and preservation of local identities. • Fertility patterns across regions converge very slowly, which results in continuously
increasing population. • Economic development is primarily regionally oriented • per capita economic growth and technological change more fragmented and slower than
other storylines. The output from this climate model and scenario was used to predicted future Climate Change for the 2 case study Municipalities (Dumangas and BarotacBarotac Nuevo) for the timescales Present, 2020 and 2050. Climate changes that were considered included;
Temperature increase and seasonal patterns minimum average monthly temperature maximum average monthly temperature
Precipitation change and patterns for the Municipalities indicating precipitation at the farm ponds River water shed area indicating potential change in river flows
Sea Level Rise Storm surge risk Tidal fluctuation cycles
Figure 1: Geographical areas of predicted Climate change – the river watershed area and the two municipalities.
12
River watershed area modelled for climate change Location of the Municipalities and milkfish ponds
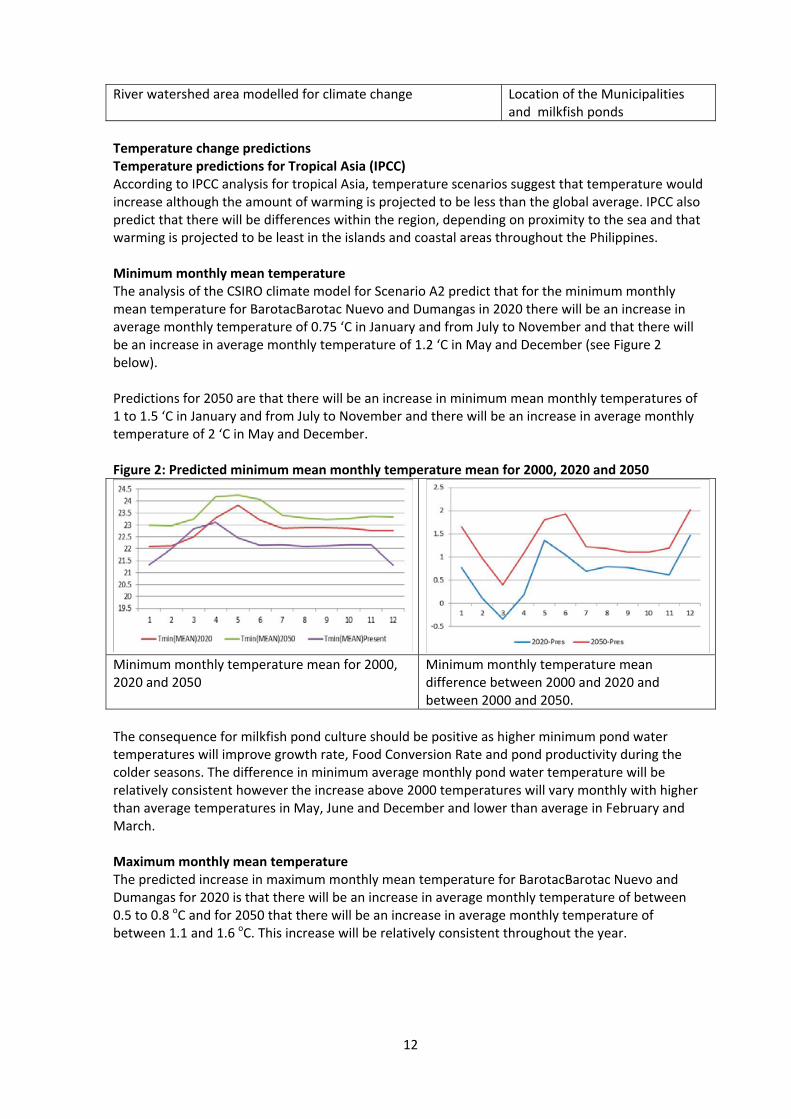
Temperature change predictions Temperature predictions for Tropical Asia (IPCC) According to IPCC analysis for tropical Asia, temperature scenarios suggest that temperature would increase although the amount of warming is projected to be less than the global average. IPCC also predict that there will be differences within the region, depending on proximity to the sea and that warming is projected to be least in the islands and coastal areas throughout the Philippines. Minimum monthly mean temperature The analysis of the CSIRO climate model for Scenario A2 predict that for the minimum monthly mean temperature for BarotacBarotac Nuevo and Dumangas in 2020 there will be an increase in average monthly temperature of 0.75 ‘C in January and from July to November and that there will be an increase in average monthly temperature of 1.2 ‘C in May and December (see Figure 2 below). Predictions for 2050 are that there will be an increase in minimum mean monthly temperatures of 1 to 1.5 ‘C in January and from July to November and there will be an increase in average monthly temperature of 2 ‘C in May and December. Figure 2: Predicted minimum mean monthly temperature mean for 2000, 2020 and 2050
Minimum monthly temperature mean for 2000, 2020 and 2050
Minimum monthly temperature mean difference between 2000 and 2020 and between 2000 and 2050.
The consequence for milkfish pond culture should be positive as higher minimum pond water temperatures will improve growth rate, Food Conversion Rate and pond productivity during the colder seasons. The difference in minimum average monthly pond water temperature will be relatively consistent however the increase above 2000 temperatures will vary monthly with higher than average temperatures in May, June and December and lower than average in February and March. Maximum monthly mean temperature The predicted increase in maximum monthly mean temperature for BarotacBarotac Nuevo and Dumangas for 2020 is that there will be an increase in average monthly temperature of between 0.5 to 0.8 oC and for 2050 that there will be an increase in average monthly temperature of between 1.1 and 1.6 oC. This increase will be relatively consistent throughout the year.
13
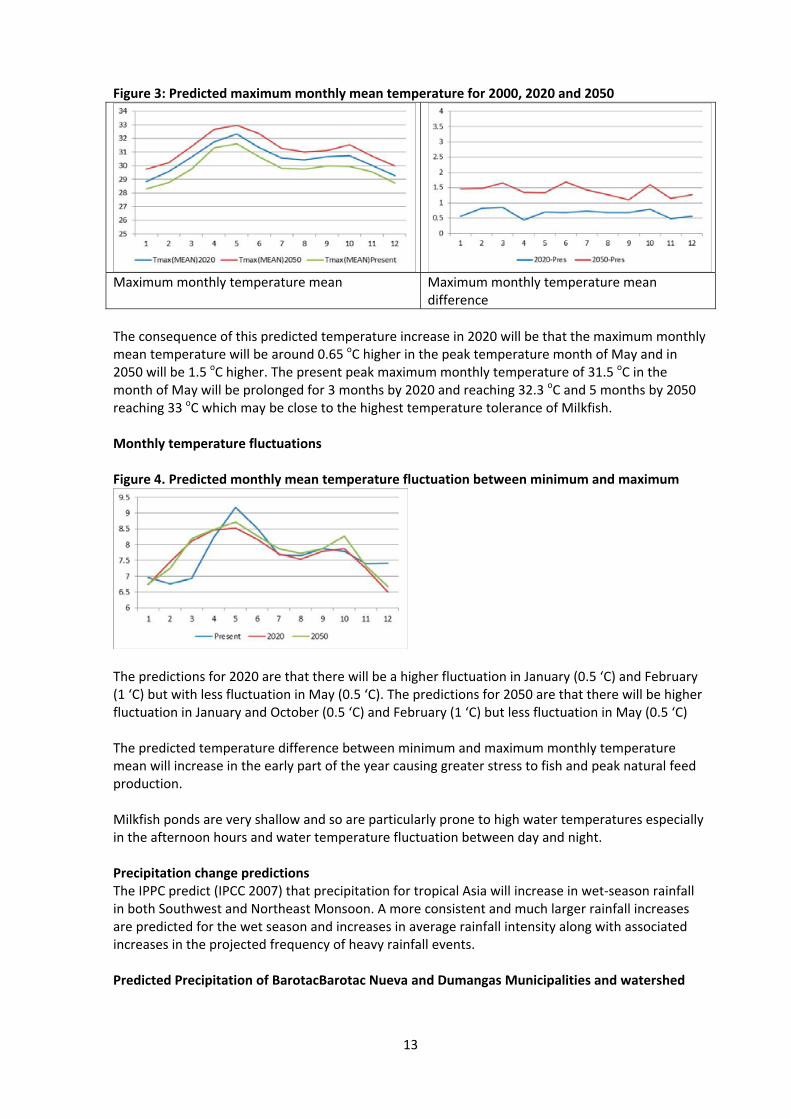
Figure 3: Predicted maximum monthly mean temperature for 2000, 2020 and 2050
Maximum monthly temperature mean Maximum monthly temperature mean difference
The consequence of this predicted temperature increase in 2020 will be that the maximum monthly mean temperature will be around 0.65 oC higher in the peak temperature month of May and in 2050 will be 1.5 oC higher. The present peak maximum monthly temperature of 31.5 oC in the month of May will be prolonged for 3 months by 2020 and reaching 32.3 oC and 5 months by 2050 reaching 33 oC which may be close to the highest temperature tolerance of Milkfish. Monthly temperature fluctuations Figure 4. Predicted monthly mean temperature fluctuation between minimum and maximum
The predictions for 2020 are that there will be a higher fluctuation in January (0.5 ‘C) and February (1 ‘C) but with less fluctuation in May (0.5 ‘C). The predictions for 2050 are that there will be higher fluctuation in January and October (0.5 ‘C) and February (1 ‘C) but less fluctuation in May (0.5 ‘C) The predicted temperature difference between minimum and maximum monthly temperature mean will increase in the early part of the year causing greater stress to fish and peak natural feed production. Milkfish ponds are very shallow and so are particularly prone to high water temperatures especially in the afternoon hours and water temperature fluctuation between day and night. Precipitation change predictions The IPPC predict (IPCC 2007) that precipitation for tropical Asia will increase in wet-season rainfall in both Southwest and Northeast Monsoon. A more consistent and much larger rainfall increases are predicted for the wet season and increases in average rainfall intensity along with associated increases in the projected frequency of heavy rainfall events. Predicted Precipitation of BarotacBarotac Nueva and Dumangas Municipalities and watershed
14
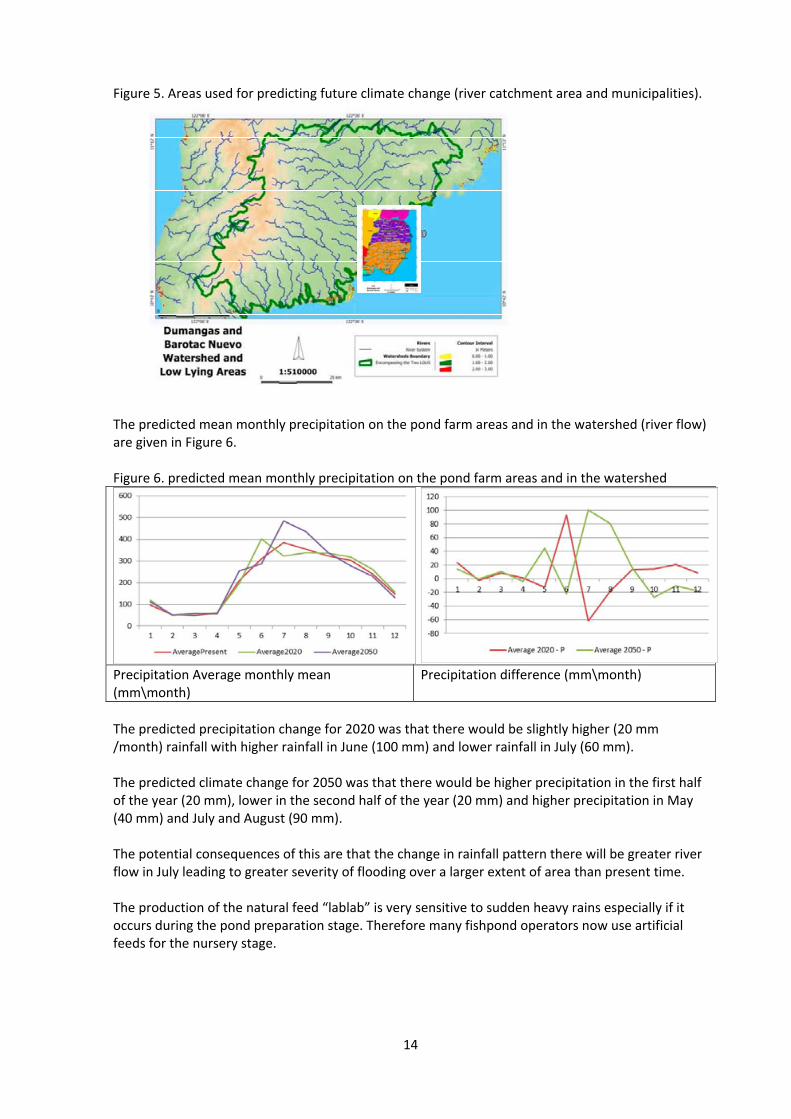
Figure 5. Areas used for predicting future climate change (river catchment area and municipalities).
The predicted mean monthly precipitation on the pond farm areas and in the watershed (river flow) are given in Figure 6. Figure 6. predicted mean monthly precipitation on the pond farm areas and in the watershed
Precipitation Average monthly mean (mm\month)
Precipitation difference (mm\month)
The predicted precipitation change for 2020 was that there would be slightly higher (20 mm /month) rainfall with higher rainfall in June (100 mm) and lower rainfall in July (60 mm). The predicted climate change for 2050 was that there would be higher precipitation in the first half of the year (20 mm), lower in the second half of the year (20 mm) and higher precipitation in May (40 mm) and July and August (90 mm).
The potential consequences of this are that the change in rainfall pattern there will be greater river flow in July leading to greater severity of flooding over a larger extent of area than present time. The production of the natural feed “lablab” is very sensitive to sudden heavy rains especially if it occurs during the pond preparation stage. Therefore many fishpond operators now use artificial feeds for the nursery stage.

15
2.2 Sea level rise change predictions In 2001 the IPCC (IPCC 2001) made predictions for projected sea level rise for the various SRES scenarios with a prediction for A2 scenario of 6 cm rise by 2020 and 18 cm rise by 2050. Figure 7. Predicted sea level rise (IPCC2002)
However the measured changes are following the most pessimistic predictions and if this continues, then the sea level rise will be 12 cm rise by 2020, 30 cm rise by 2050 and close to a meter by 2100. In addition there are some regional differences in sea level rise. The Milkfish ponds in Dumangas and Barotac Nueva are located close to sea level and are prone to flooding from the increase in river height and exceptional high tides and storm surge exasperated by sea level rise. Figure 8. Low lying areas in the Municipalities of of Barotac Nuevo and Dumangas
2.3 Storm surge predictions Storm surge is water that is pushed toward the shore by the force of the winds swirling around the storm. This advancing surge can combine with the normal tides to create the storm tide, which can dramatically increase the mean water level. In addition, wind driven waves are superimposed on the storm tide. This rise in water level can cause severe flooding in coastal areas, particularly when the storm tide coincides with the normal high tides.

16
The milkfish pond areas of Barotac Nuevo and Dumangas are prone to storm surge from the North-east monsoon winds and storms due to the long fetch. Figure 9. Potential low lying areas that could be prone to storm surge
Fetch from the North-east Low lying areas prone to storm surge 2.4 Predicted change in typhoons pattern (IPCC) The IPCC (IPCC2007) declared that it was difficult to predict future change in typhoon frequency, path and intensity. However recent studies indicate that the maximum potential intensities of cyclones will remain the same or undergo a modest increase of up to 10-20%. These predicted changes are small compared with observed natural variations and fall within the uncertainty range in current studies. The figure below show the typhoon tracks since 1945 Figure10. Typhoon tracks since 1945
For example Tropical storm Ondoy (international name Ketsana) hit the Philippines on September 26, 2009, causing widespread flooding. Ondoy, the equivalent of a Category I storm, brought an unusually high volume of rain which inundated the central part of Luzon. Tropical storm Ondoy was quickly followed by typhoon Pepeng (international name Parma). Typhoon Pepeng, a Category III storm, affected the Philippines during October 3-9, 2009, following an irregular path which crossed over Central and Northern Luzon three times. It initially brought powerful winds with gusts of up to 230 km/hr then an extended period of heavy rains, with cumulative rainfall amounts exceeding 1,000 mm in some areas. The resulting rainfall and river floods should only occur on average once in every 50 years.
17
Typhoons can devastate milkfish pond farms by damaging infrastructure, escape of fish, stress and mortality. 2.5 Predicted change in Extreme Events The IPCC predict that there will be increasing frequency and intensity of extreme events particularly droughts during the summer months and El Niño events, increase in extreme rainfall and winds associated with Typhoons, intense rainfall events causing severe floods and heat waves/hot spells in summer of longer duration, more intense and more frequent. Small-scale Milkfish farmers have had to endure occasional extreme events in the past but increasing frequency and increasing severity place great strain on the farm resources to recover. The Farmers need to be supported by calamity insurance for such events that are declared a disaster.
3. Climate change impacts and vulnerability 3.1 Socio-economic vulnerability and adaptation to climate change IPCC (2001) broadly defined the terms vulnerability and adaptability focusing on climate change and the importance of vulnerability assessment to develop meaningful adaptation strategies. According to Moser (2008), it can be broadly defined as a susceptibility to harm or a potential for change applicable to any region, community, sector and social or ecological system. Aquaculture is an important sector for providing livelihoods in the South East Asia, and in particular to millions of small scale farmers. Developing adaptation strategies for such sectors will not be meaningful without assessing the socio-economic vulnerability of small scale farmers, their resilient capacity and the kind of help they need in the wake of climate change and extreme weather events. 3.1.1 Socio-economic profile Traditional milkfish farming in the Philippines has been undertaken for a very long time (it is thought to have been practiced even before Magellan landed in 1521. However commercial production of milkfish grew rapidly in the 1970’s. AquaClimate project has made attempts to map
the socio-economic vulnerability of milkfish farmers2
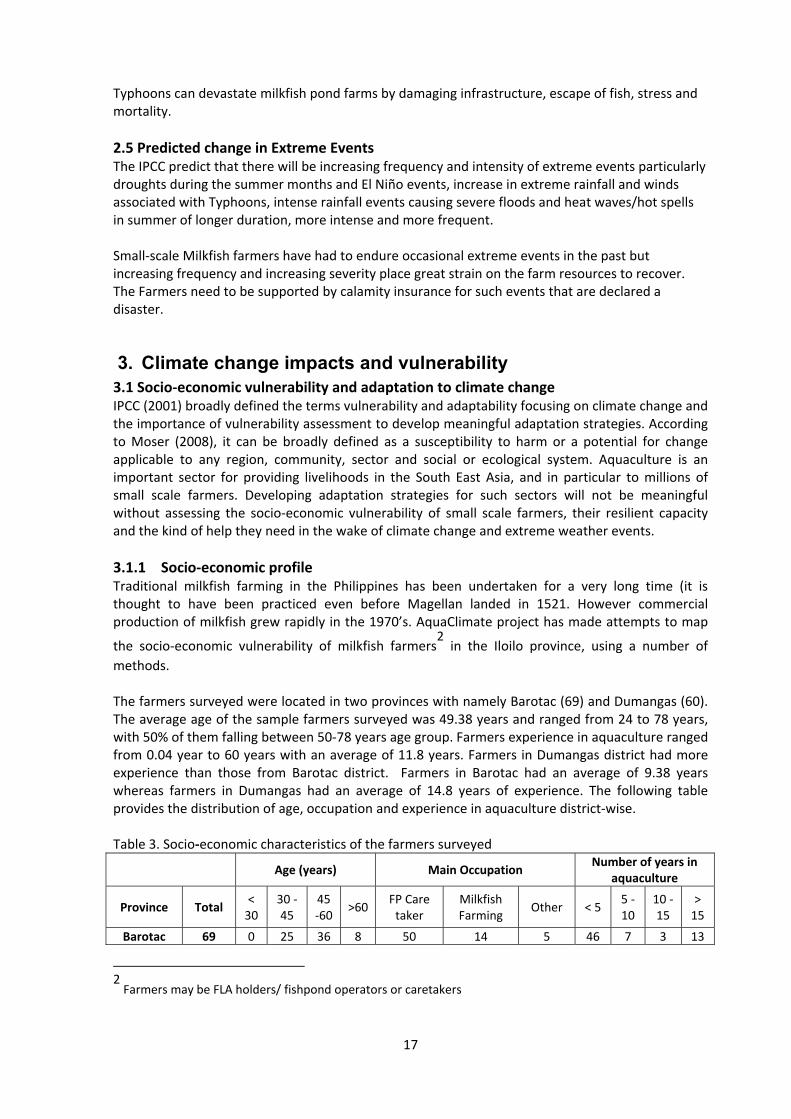
in the Iloilo province, using a number of methods. The farmers surveyed were located in two provinces with namely Barotac (69) and Dumangas (60). The average age of the sample farmers surveyed was 49.38 years and ranged from 24 to 78 years, with 50% of them falling between 50-78 years age group. Farmers experience in aquaculture ranged from 0.04 year to 60 years with an average of 11.8 years. Farmers in Dumangas district had more experience than those from Barotac district. Farmers in Barotac had an average of 9.38 years whereas farmers in Dumangas had an average of 14.8 years of experience. The following table provides the distribution of age, occupation and experience in aquaculture district-wise. Table 3. Socio-economic characteristics of the farmers surveyed
Age (years) Main Occupation Number of years in
aquaculture
Province Total <
30 30 -45
45 -60
>60 FP Care
taker Milkfish Farming
Other < 5 5 -10
10 -15
> 15
Barotac 69 0 25 36 8 50 14 5 46 7 3 13
2
Farmers may be FLA holders/ fishpond operators or caretakers
18
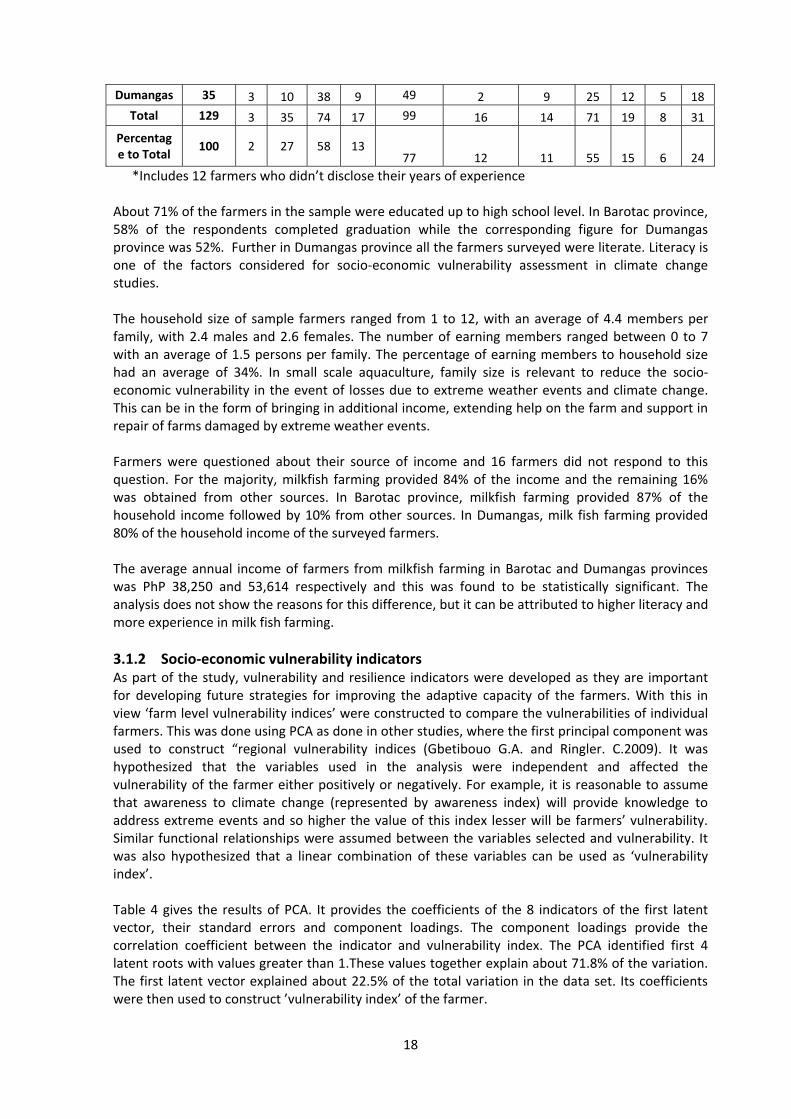
Dumangas 35 3 10 38 9 49 2 9 25 12 5 18 Total 129 3 35 74 17 99 16 14 71 19 8 31
Percentage to Total
100 2 27 58 13 77 12 11 55 15 6 24
*Includes 12 farmers who didn’t disclose their years of experience About 71% of the farmers in the sample were educated up to high school level. In Barotac province, 58% of the respondents completed graduation while the corresponding figure for Dumangas province was 52%. Further in Dumangas province all the farmers surveyed were literate. Literacy is one of the factors considered for socio-economic vulnerability assessment in climate change studies. The household size of sample farmers ranged from 1 to 12, with an average of 4.4 members per family, with 2.4 males and 2.6 females. The number of earning members ranged between 0 to 7 with an average of 1.5 persons per family. The percentage of earning members to household size had an average of 34%. In small scale aquaculture, family size is relevant to reduce the socio-economic vulnerability in the event of losses due to extreme weather events and climate change. This can be in the form of bringing in additional income, extending help on the farm and support in repair of farms damaged by extreme weather events. Farmers were questioned about their source of income and 16 farmers did not respond to this question. For the majority, milkfish farming provided 84% of the income and the remaining 16% was obtained from other sources. In Barotac province, milkfish farming provided 87% of the household income followed by 10% from other sources. In Dumangas, milk fish farming provided 80% of the household income of the surveyed farmers.
The average annual income of farmers from milkfish farming in Barotac and Dumangas provinces was PhP 38,250 and 53,614 respectively and this was found to be statistically significant. The analysis does not show the reasons for this difference, but it can be attributed to higher literacy and more experience in milk fish farming. 3.1.2 Socio-economic vulnerability indicators As part of the study, vulnerability and resilience indicators were developed as they are important for developing future strategies for improving the adaptive capacity of the farmers. With this in view ‘farm level vulnerability indices’ were constructed to compare the vulnerabilities of individual farmers. This was done using PCA as done in other studies, where the first principal component was used to construct “regional vulnerability indices (Gbetibouo G.A. and Ringler. C.2009). It was hypothesized that the variables used in the analysis were independent and affected the vulnerability of the farmer either positively or negatively. For example, it is reasonable to assume that awareness to climate change (represented by awareness index) will provide knowledge to address extreme events and so higher the value of this index lesser will be farmers’ vulnerability. Similar functional relationships were assumed between the variables selected and vulnerability. It was also hypothesized that a linear combination of these variables can be used as ‘vulnerability index’. Table 4 gives the results of PCA. It provides the coefficients of the 8 indicators of the first latent vector, their standard errors and component loadings. The component loadings provide the correlation coefficient between the indicator and vulnerability index. The PCA identified first 4 latent roots with values greater than 1.These values together explain about 71.8% of the variation. The first latent vector explained about 22.5% of the total variation in the data set. Its coefficients were then used to construct ’vulnerability index’ of the farmer.
19
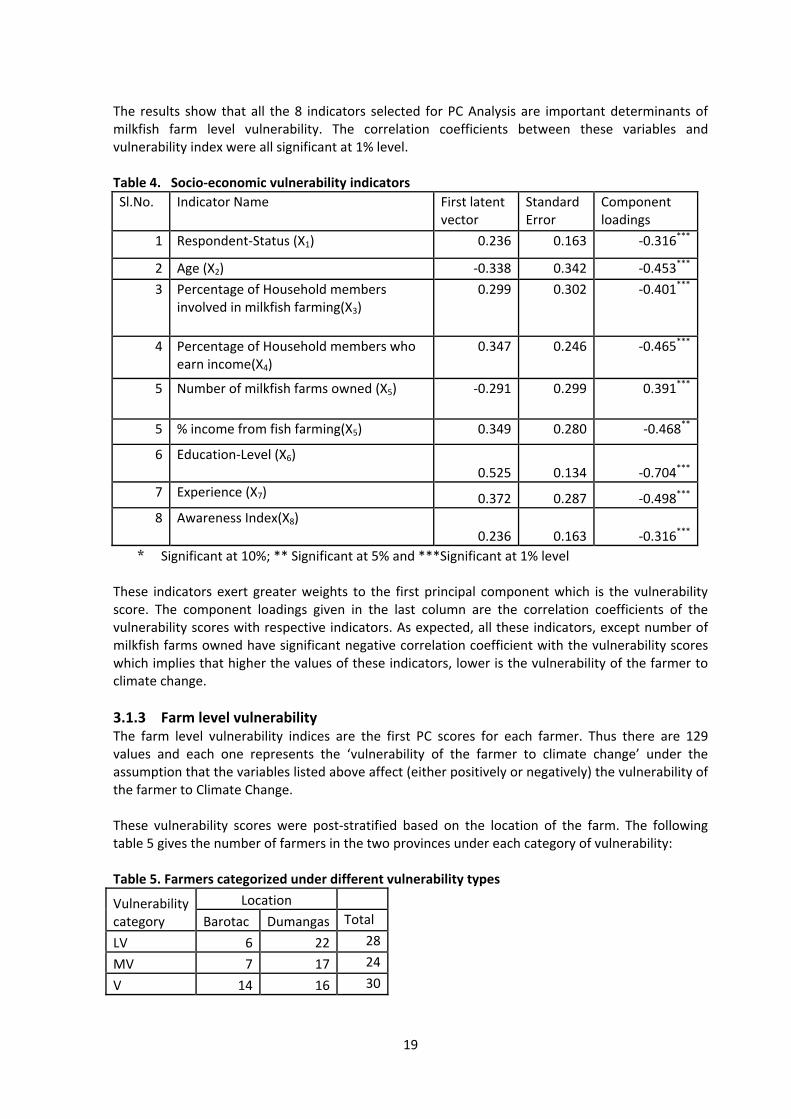
The results show that all the 8 indicators selected for PC Analysis are important determinants of milkfish farm level vulnerability. The correlation coefficients between these variables and vulnerability index were all significant at 1% level. Table 4. Socio-economic vulnerability indicators Sl.No. Indicator Name First latent
vector Standard Error
Component loadings
1 Respondent-Status (X1) 0.236 0.163 -0.316***
2 Age (X2) -0.338 0.342 -0.453***
3 Percentage of Household members involved in milkfish farming(X3)
0.299 0.302 -0.401***
4 Percentage of Household members who earn income(X4)
0.347 0.246 -0.465***
5 Number of milkfish farms owned (X5) -0.291 0.299 0.391***
5 % income from fish farming(X5) 0.349 0.280 -0.468**
6 Education-Level (X6) 0.525 0.134 -0.704***
7 Experience (X7) 0.372 0.287 -0.498***
8 Awareness Index(X8) 0.236 0.163 -0.316***
* Significant at 10%; ** Significant at 5% and ***Significant at 1% level
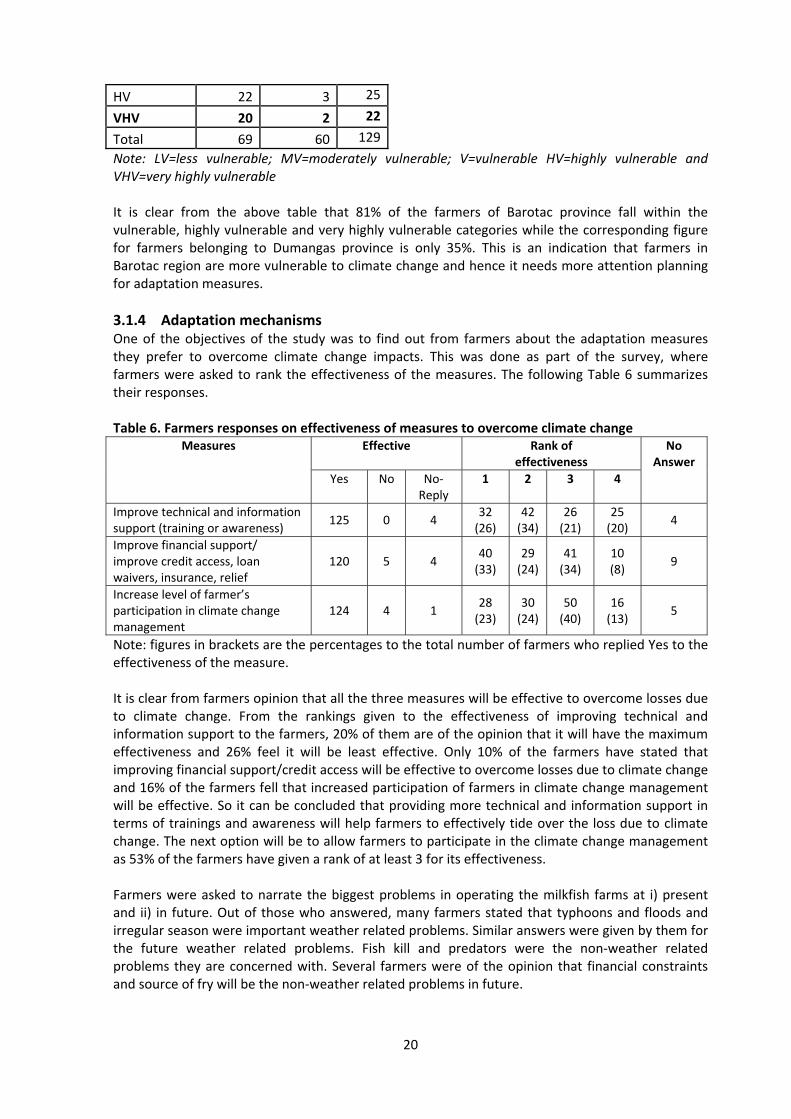
These indicators exert greater weights to the first principal component which is the vulnerability score. The component loadings given in the last column are the correlation coefficients of the vulnerability scores with respective indicators. As expected, all these indicators, except number of milkfish farms owned have significant negative correlation coefficient with the vulnerability scores which implies that higher the values of these indicators, lower is the vulnerability of the farmer to climate change. 3.1.3 Farm level vulnerability The farm level vulnerability indices are the first PC scores for each farmer. Thus there are 129 values and each one represents the ‘vulnerability of the farmer to climate change’ under the assumption that the variables listed above affect (either positively or negatively) the vulnerability of the farmer to Climate Change. These vulnerability scores were post-stratified based on the location of the farm. The following table 5 gives the number of farmers in the two provinces under each category of vulnerability: Table 5. Farmers categorized under different vulnerability types
Vulnerability category
Location
Barotac Dumangas Total
LV 6 22 28
MV 7 17 24
V 14 16 30
20
HV 22 3 25
VHV 20 2 22
Total 69 60 129
Note: LV=less vulnerable; MV=moderately vulnerable; V=vulnerable HV=highly vulnerable and VHV=very highly vulnerable It is clear from the above table that 81% of the farmers of Barotac province fall within the vulnerable, highly vulnerable and very highly vulnerable categories while the corresponding figure for farmers belonging to Dumangas province is only 35%. This is an indication that farmers in Barotac region are more vulnerable to climate change and hence it needs more attention planning for adaptation measures. 3.1.4 Adaptation mechanisms One of the objectives of the study was to find out from farmers about the adaptation measures they prefer to overcome climate change impacts. This was done as part of the survey, where farmers were asked to rank the effectiveness of the measures. The following Table 6 summarizes their responses. Table 6. Farmers responses on effectiveness of measures to overcome climate change
Measures Effective Rank of effectiveness
No Answer
Yes No No-Reply
1 2 3 4
Improve technical and information support (training or awareness)
125 0 4 32
(26) 42
(34) 26
(21) 25
(20) 4
Improve financial support/ improve credit access, loan waivers, insurance, relief
120 5 4 40
(33) 29
(24) 41
(34) 10 (8)
9
Increase level of farmer’s participation in climate change management
124 4 1 28
(23) 30
(24) 50
(40) 16
(13) 5
Note: figures in brackets are the percentages to the total number of farmers who replied Yes to the effectiveness of the measure. It is clear from farmers opinion that all the three measures will be effective to overcome losses due to climate change. From the rankings given to the effectiveness of improving technical and information support to the farmers, 20% of them are of the opinion that it will have the maximum effectiveness and 26% feel it will be least effective. Only 10% of the farmers have stated that improving financial support/credit access will be effective to overcome losses due to climate change and 16% of the farmers fell that increased participation of farmers in climate change management will be effective. So it can be concluded that providing more technical and information support in terms of trainings and awareness will help farmers to effectively tide over the loss due to climate change. The next option will be to allow farmers to participate in the climate change management as 53% of the farmers have given a rank of at least 3 for its effectiveness. Farmers were asked to narrate the biggest problems in operating the milkfish farms at i) present and ii) in future. Out of those who answered, many farmers stated that typhoons and floods and irregular season were important weather related problems. Similar answers were given by them for the future weather related problems. Fish kill and predators were the non-weather related problems they are concerned with. Several farmers were of the opinion that financial constraints and source of fry will be the non-weather related problems in future.

21
Preferred interventions Farmers were asked to rank the following five variables in order to find out which agencies were most useful to farmers to overcome losses due to climate change.
1. Government agencies 2. Village authorities 3. Friends & family 4. Own sources 5. Private
Out of 129 farmers, 116 farmers ranked all the five options and Garret ranking technique was followed to summarize the rankings. The Table 7 below provides the frequency of scores based on the ranking. Table 7. Farmers ranking of agencies that provide help during extreme weather events
Rank
Factors 1 2 3 4 5 Total
Govt agencies 3 8 72 30 3 116
Village auth. 1 5 30 48 32 116
Friends & family 8 96 4 7 1 116
Own sources 102 5 3 3 3 116
Private 2 2 7 28 77 116
Total 116 116 116 116 116 580
Garret-Score 75 60 50 40 25
Table 8. Garret scores for the factors and the summary of rankings.
Rank
1 2 3 4 5 Total Average
Factors Total Score Rank Government agencies
225 480 3600 1200 75 5580 48.1 3
Village authority
75 300 1500 1920 800 4595 39.6 4
Friends & family
600 5760 200 280 25 6865 59.2 2
Own sources 7650 300 150 120 75 8295 71.5 1
Private 150 120 350 1120 1925 3665 31.6 5
From Table 8 it could be concluded that, for farmers, own resources was the first factor followed friends and family and government agencies who helped to overcome losses due to climate change. Help from village authorities and private agencies ranked as 4th and 5th.
22
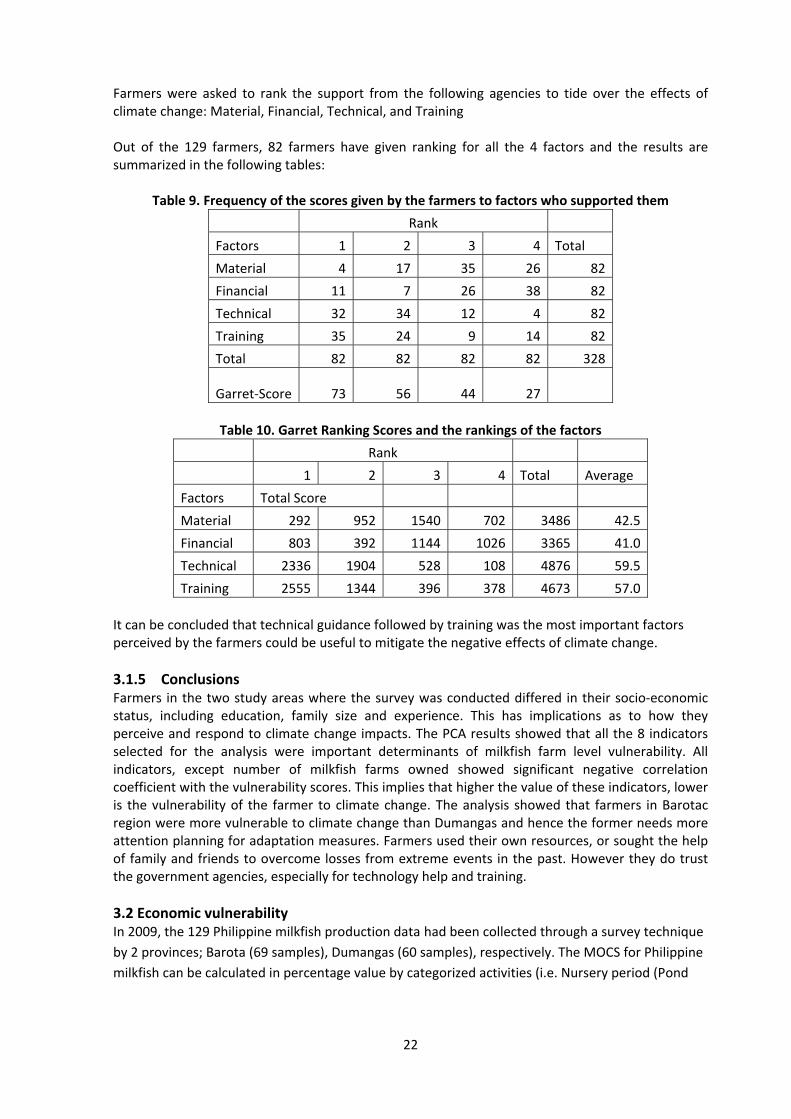
Farmers were asked to rank the support from the following agencies to tide over the effects of climate change: Material, Financial, Technical, and Training Out of the 129 farmers, 82 farmers have given ranking for all the 4 factors and the results are summarized in the following tables:
Table 9. Frequency of the scores given by the farmers to factors who supported them
Rank
Factors 1 2 3 4 Total
Material 4 17 35 26 82
Financial 11 7 26 38 82
Technical 32 34 12 4 82
Training 35 24 9 14 82
Total 82 82 82 82 328
Garret-Score 73 56 44 27
Table 10. Garret Ranking Scores and the rankings of the factors
Rank
1 2 3 4 Total Average
Factors Total Score
Material 292 952 1540 702 3486 42.5
Financial 803 392 1144 1026 3365 41.0
Technical 2336 1904 528 108 4876 59.5
Training 2555 1344 396 378 4673 57.0
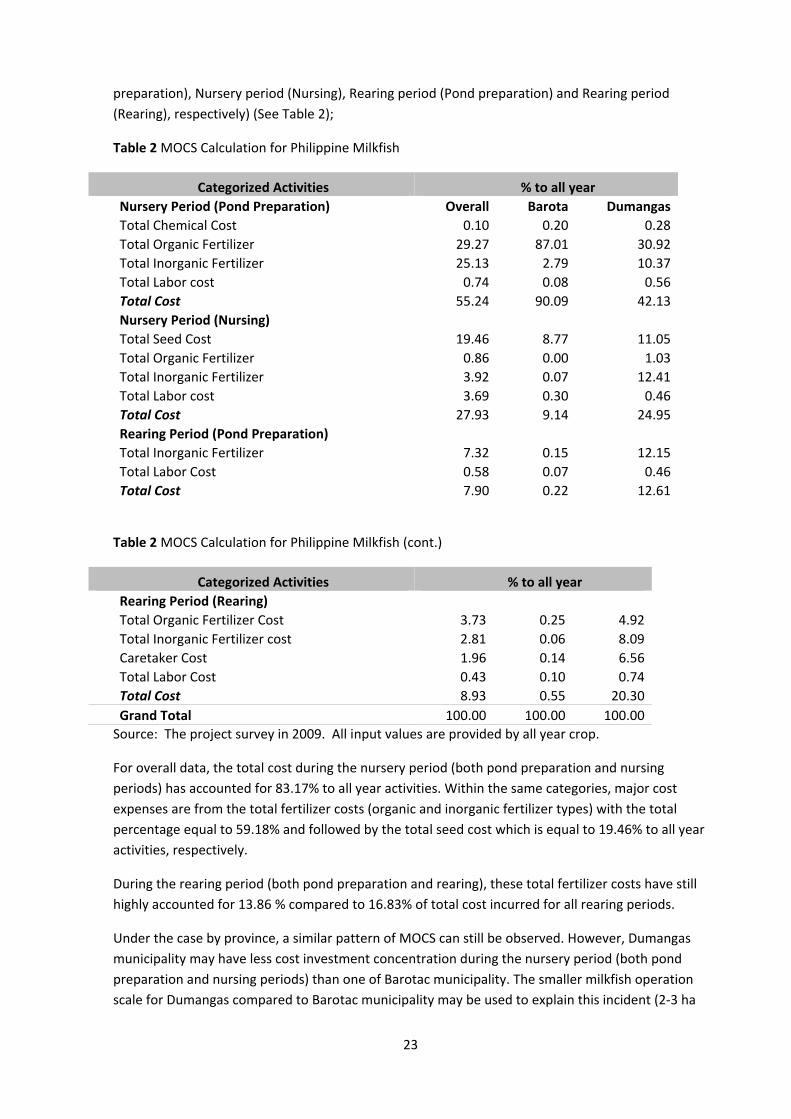
It can be concluded that technical guidance followed by training was the most important factors perceived by the farmers could be useful to mitigate the negative effects of climate change. 3.1.5 Conclusions Farmers in the two study areas where the survey was conducted differed in their socio-economic status, including education, family size and experience. This has implications as to how they perceive and respond to climate change impacts. The PCA results showed that all the 8 indicators selected for the analysis were important determinants of milkfish farm level vulnerability. All indicators, except number of milkfish farms owned showed significant negative correlation coefficient with the vulnerability scores. This implies that higher the value of these indicators, lower is the vulnerability of the farmer to climate change. The analysis showed that farmers in Barotac region were more vulnerable to climate change than Dumangas and hence the former needs more attention planning for adaptation measures. Farmers used their own resources, or sought the help of family and friends to overcome losses from extreme events in the past. However they do trust the government agencies, especially for technology help and training. 3.2 Economic vulnerability In 2009, the 129 Philippine milkfish production data had been collected through a survey technique by 2 provinces; Barota (69 samples), Dumangas (60 samples), respectively. The MOCS for Philippine milkfish can be calculated in percentage value by categorized activities (i.e. Nursery period (Pond
23
preparation), Nursery period (Nursing), Rearing period (Pond preparation) and Rearing period (Rearing), respectively) (See Table 2);
Table 2 MOCS Calculation for Philippine Milkfish
Categorized Activities % to all year Nursery Period (Pond Preparation) Overall Barota Dumangas Total Chemical Cost 0.10 0.20 0.28 Total Organic Fertilizer 29.27 87.01 30.92 Total Inorganic Fertilizer 25.13 2.79 10.37 Total Labor cost 0.74 0.08 0.56 Total Cost 55.24 90.09 42.13 Nursery Period (Nursing) Total Seed Cost 19.46 8.77 11.05 Total Organic Fertilizer 0.86 0.00 1.03 Total Inorganic Fertilizer 3.92 0.07 12.41 Total Labor cost 3.69 0.30 0.46 Total Cost 27.93 9.14 24.95 Rearing Period (Pond Preparation) Total Inorganic Fertilizer 7.32 0.15 12.15 Total Labor Cost 0.58 0.07 0.46 Total Cost 7.90 0.22 12.61
Table 2 MOCS Calculation for Philippine Milkfish (cont.)
Categorized Activities % to all year Rearing Period (Rearing) Total Organic Fertilizer Cost 3.73 0.25 4.92 Total Inorganic Fertilizer cost 2.81 0.06 8.09 Caretaker Cost 1.96 0.14 6.56 Total Labor Cost 0.43 0.10 0.74 Total Cost 8.93 0.55 20.30 Grand Total 100.00 100.00 100.00
Source: The project survey in 2009. All input values are provided by all year crop.
For overall data, the total cost during the nursery period (both pond preparation and nursing periods) has accounted for 83.17% to all year activities. Within the same categories, major cost expenses are from the total fertilizer costs (organic and inorganic fertilizer types) with the total percentage equal to 59.18% and followed by the total seed cost which is equal to 19.46% to all year activities, respectively.
During the rearing period (both pond preparation and rearing), these total fertilizer costs have still highly accounted for 13.86 % compared to 16.83% of total cost incurred for all rearing periods.
Under the case by province, a similar pattern of MOCS can still be observed. However, Dumangas municipality may have less cost investment concentration during the nursery period (both pond preparation and nursing periods) than one of Barotac municipality. The smaller milkfish operation scale for Dumangas compared to Barotac municipality may be used to explain this incident (2-3 ha

24
and 10-12 ha of Barotac municipality for average total pond area for nursery and rearing activities compared to 0.06-0.7 ha and 4 ha of Dumangas municipality for average total pond area for nursery and rearing activities, respectively).
The mFCR has been calculated by a summation of total expense for feed related inputs for all crops (i.e. total organic and inorganic fertilizer costs) and divided by a summation of total revenue incurred/expected from milkfish sales. The mFCR has been further calculated for 2 different activity categories; namely mFCR for Nursery period and mFCR for both nursery and rearing periods (see Table 3).
Table 3 mFCR Calculation for Philippine Milkfish Production
Category Overall Barota Dumangas
mFCR Nursery 0.10 0.22 7.20
mFCR Nursery and Rearing
0.25 0.58 0.21
Source: The project survey in 2009.
Discussion
Being compared MOCS ranking (Table 1) with mFCR (Table 2), the total fertilizer cost which is generally ranked 1st for all activity period, indicate a degree of system dependency to these major input expenses. For overall and Barotac cases, the mFCR for nursery period which has a lower value than mFCR obtained for both nursery and rearing periods indicates that the nursery period has received a higher efficiency level for converting a total fertilizer expense to total revenue from milkfish fry value. On the contrary, Dumangas case has shown opposite direction for calculated mFCR. It might indicate, among other impacts including climate change impacts, a different impact from different scale of operation and type of management practice which is required a further study to confirm this result.
3.3 Production vulnerability and adaptation measures to climate change This paper aims to determine the climate change vulnerability indicators of small-scale milkfish pond production and rank the potential of the adaptation measures the farmers are currently employing.
Two sites were chosen for this case study, the Barotac Nuevo and Dumangas. The respondents were randomly chosen using random stratified sampling. They were chosen on the basis of being a small-scale farmer and a Fishpond Lease Agreement (FLA) holder. There were a total of 104 respondents, wherein 69 come from Barotac Nuevo and 35 from Dumangas. A semi-structured questionnaire was designed covering information on the following areas: socio-economic profile of the respondents’ household, farm information, farm production information: Nursery, Rearing, and Transition Ponds, climate change perception: Risk and Likelihood Ratings and Consequence and Adaptation, adaptability, Climate Change Mitigation, and Home-made Feed Information. This paper will focus on the effects of climate change on fish pond productivity, taking into consideration the vulnerability indicators and farmers’ adaptation measures currently employed.
25
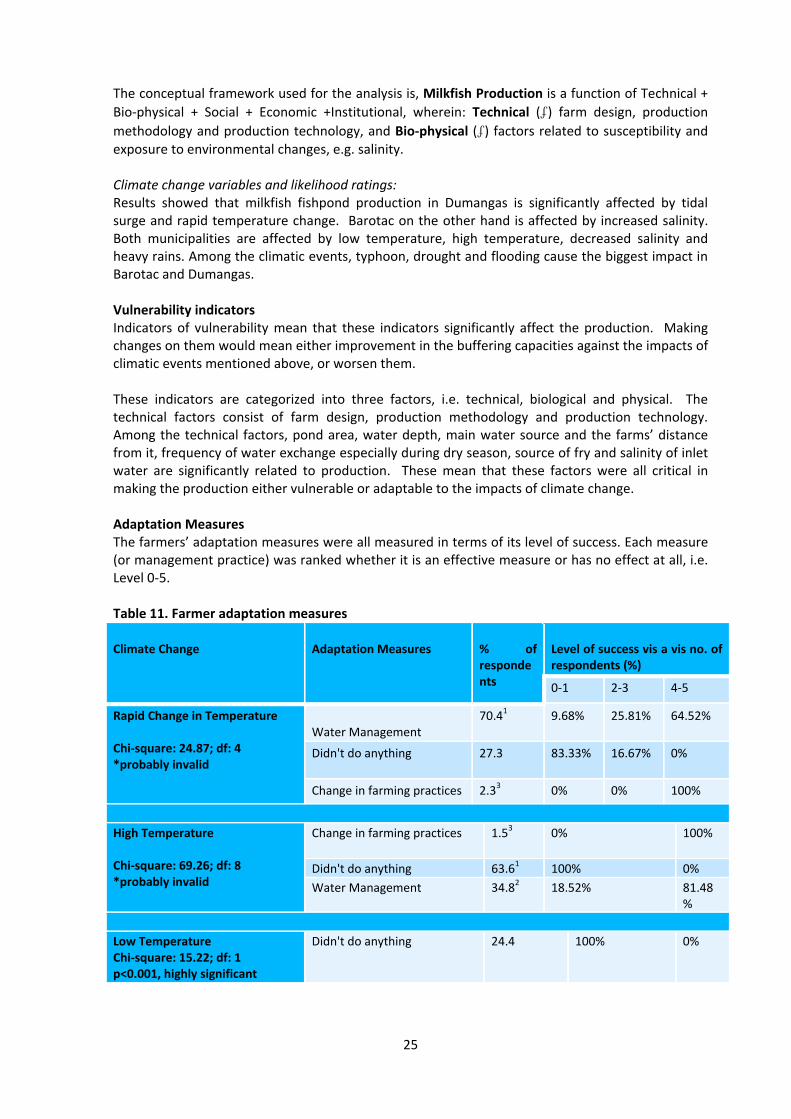
The conceptual framework used for the analysis is, Milkfish Production is a function of Technical + Bio-physical + Social + Economic +Institutional, wherein: Technical (ʄ) farm design, production methodology and production technology, and Bio-physical (ʄ) factors related to susceptibility and exposure to environmental changes, e.g. salinity. Climate change variables and likelihood ratings: Results showed that milkfish fishpond production in Dumangas is significantly affected by tidal surge and rapid temperature change. Barotac on the other hand is affected by increased salinity. Both municipalities are affected by low temperature, high temperature, decreased salinity and heavy rains. Among the climatic events, typhoon, drought and flooding cause the biggest impact in Barotac and Dumangas. Vulnerability indicators Indicators of vulnerability mean that these indicators significantly affect the production. Making changes on them would mean either improvement in the buffering capacities against the impacts of climatic events mentioned above, or worsen them. These indicators are categorized into three factors, i.e. technical, biological and physical. The technical factors consist of farm design, production methodology and production technology. Among the technical factors, pond area, water depth, main water source and the farms’ distance from it, frequency of water exchange especially during dry season, source of fry and salinity of inlet water are significantly related to production. These mean that these factors were all critical in making the production either vulnerable or adaptable to the impacts of climate change. Adaptation Measures The farmers’ adaptation measures were all measured in terms of its level of success. Each measure (or management practice) was ranked whether it is an effective measure or has no effect at all, i.e. Level 0-5. Table 11. Farmer adaptation measures Climate Change
Adaptation Measures % of
respondents
Level of success vis a vis no. of respondents (%)
0-1 2-3 4-5
Rapid Change in Temperature Chi-square: 24.87; df: 4 *probably invalid
Water Management
70.41 9.68% 25.81% 64.52%
Didn't do anything 27.3 83.33% 16.67% 0%
Change in farming practices 2.33 0% 0% 100%
High Temperature Chi-square: 69.26; df: 8 *probably invalid
Change in farming practices 1.53 0% 100%
Didn't do anything 63.61 100% 0%Water Management 34.82 18.52% 81.48
% Low Temperature Chi-square: 15.22; df: 1 p<0.001, highly significant
Didn't do anything 24.4 100% 0%

26
Climate Change Adaptation Measures % of
respondents
Level of success vis a vis no. of respondents (%)
0-1 2-3 4-5
Heavy Rain Chi-square: 21.39; df: 4 *probably invalid
Improvement of dikes 44.781
23.33% 76.67%
Change in farming practices 5.97
50% 50%
Seek outside help 1.49 0% 100%
Shift to other occupations 1.49 100% 0%
Didn't do anything 28.362
84.21% 15.69%
Water management 17.913
75% 25% Tidal surge Chi-square: 7.43; df: 1 p=0.006, highly significant
Improvement of dikes 48.39 20% 80% Didn't do anything 51.611 68.75% 31.25%
Didn't do anything 51.611 68.75% 31.25%
Water salinity increase Chi-square: 10.30; df: 2 p=0.006, highly significant
Didn't do anything 25.58 81.82% 18.18%
Water management 65.1235.71% 64.29%
Change in farming practices 9.3 0% 100%
Water salinity decrease Chi-square:18.67; df: 3 *probably invalid
Improvement of dikes 69.971 22.50% 77.50% Didn't do anything 27.592
81.25% 18.75% Water management 1.72 0% 100% Change in farming practices 1.72
0% 100% These results showed that among the adaptation measures used, the most effective practices are improvement of dikes, water management, and changes in farming practices. Not doing anything didn’t improve the situation. Conclusion Barotac Nuevo Scenario The present management practices and climatic conditions show that the tidal surge, increased salinity, low temperature, high temperature and rapid temperature changes have a minor negative impact on milkfish fishpond production. This means that there is a significant reduction in economic performance but occurs in isolated cases. Heavy rains, on the other hand, have a moderate negative impact. This means that it causes a significant general reduction in economic performance affecting the whole municipality.
27
Dumangas Scenario Low temperature, rapid change in temperature, heavy rains, tidal surge and increased salinity have insignificant negative impact on Dumangas’ farmers production. This means that these climatic changes have a minor effect on their profitability. On the other hand, decreased salinity and high temperature have an insignificant positive effect on farmers. This means that they have a minor effect on the profitability. It is because farmers in Dumangas rely heavily in the production of lablab, which grows best in high temperature. In general, initial findings of this study shows that the climate change variables have insignificant to moderate negative effects in Barotac farms while Dumangas will have a minor negative and minor beneficial effects.
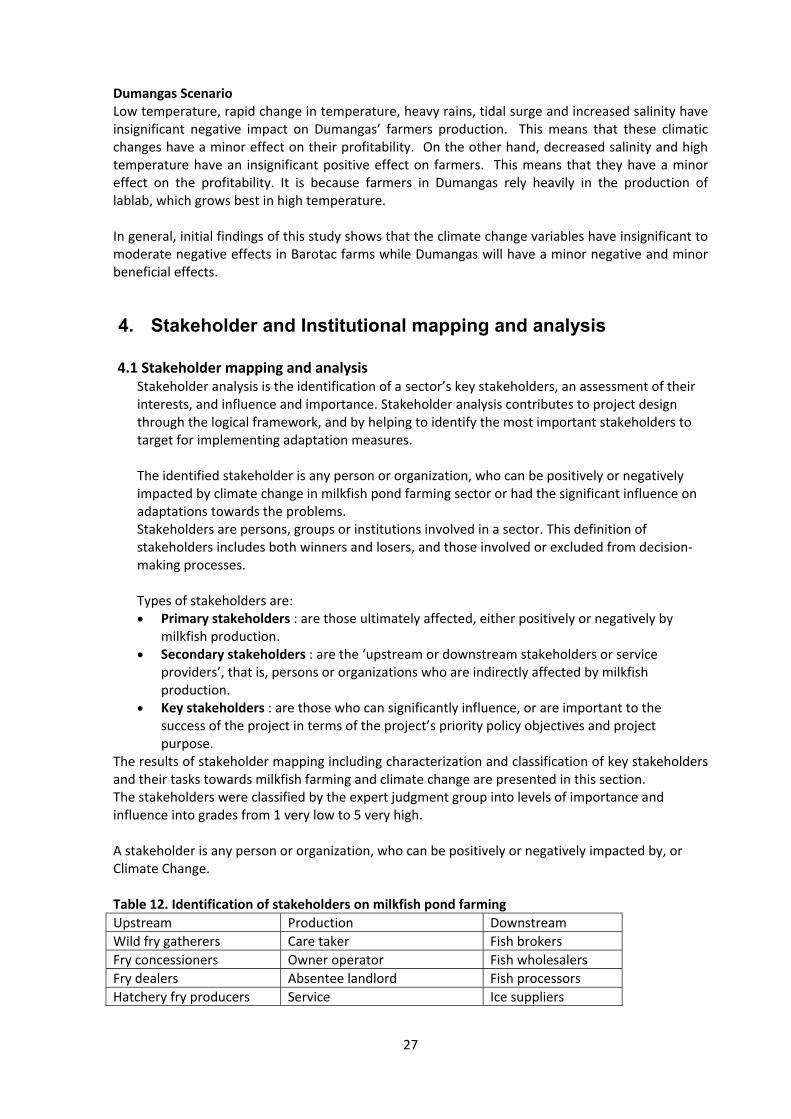
4. Stakeholder and Institutional mapping and analysis 4.1 Stakeholder mapping and analysis
Stakeholder analysis is the identification of a sector’s key stakeholders, an assessment of their interests, and influence and importance. Stakeholder analysis contributes to project design through the logical framework, and by helping to identify the most important stakeholders to target for implementing adaptation measures. The identified stakeholder is any person or organization, who can be positively or negatively impacted by climate change in milkfish pond farming sector or had the significant influence on adaptations towards the problems. Stakeholders are persons, groups or institutions involved in a sector. This definition of stakeholders includes both winners and losers, and those involved or excluded from decision-making processes. Types of stakeholders are: • Primary stakeholders : are those ultimately affected, either positively or negatively by
milkfish production. • Secondary stakeholders : are the ‘upstream or downstream stakeholders or service
providers’, that is, persons or organizations who are indirectly affected by milkfish production.
• Key stakeholders : are those who can significantly influence, or are important to the success of the project in terms of the project’s priority policy objectives and project purpose.
The results of stakeholder mapping including characterization and classification of key stakeholders and their tasks towards milkfish farming and climate change are presented in this section. The stakeholders were classified by the expert judgment group into levels of importance and influence into grades from 1 very low to 5 very high. A stakeholder is any person or organization, who can be positively or negatively impacted by, or Climate Change. Table 12. Identification of stakeholders on milkfish pond farming Upstream Production Downstream Wild fry gatherers Care taker Fish brokers Fry concessioners Owner operator Fish wholesalers Fry dealers Absentee landlord Fish processors Hatchery fry producers Service Ice suppliers

28
Nursery fry producers Private service providers Transporters Feed manufacturers Government service suppliers Exporters Fertiliser suppliers Academic service suppliers Stakeholder influence A stakeholder’s degree of influence translates into the relative power they have over milkfish farming as well as the degree to which they can help desired changes to be implemented or blocked. In broad terms, a stakeholder’s influence derives from their economic, social or political position, or their position in the hierarchy. Other forms of influence may be more informal (for example, personal connections to ruling politicians). Stakeholder importance Importance is distinct from influence. There will often be stakeholders, especially unorganised primary stakeholders, upon which the project places great priority (e.g. caretakers, owner operators, etc.). Importance indicates the priority given to satisfying stakeholders' needs and interests through the project. Table 13. Assessment of stakeholder importance and influence Stakeholder Importance Influence Caretaker or manager 5 3 Owner operator 4 4.5 Nursery operator 5 3 Fish wholesaler 3 3 Fertiliser manufacturer 3.5 3.5 Fish trader 2.5 2.5 Fish broker 2.5 2.5 Fry dealer 5 2 Chemical/medication supplier 2 2 Fry Gatherers 4 1 Stakeholders can then be classified into different categories, which helps to identify key stakeholders to target with adaptation measures. Stakeholders with low importance and low influence Stakeholders with low influence and low importance and so are considered low priority to develop adaptation measures for or low ability to implement the adaptation measures such as chemical and medication suppliers, fish traders and fish brokers. Stakeholders with high importance but low influence Stakeholders of high importance to the project, but with low influence. This implies that they will require special initiatives if their interests are to be protected such as fry gatherers and fry dealers. Stakeholders with low importance but high influence Stakeholders with high influence, who can therefore affect the implementation of adaptive measures, but have low interest in Milkfish production. This implies that these stakeholders may be a source of significant risk, and they will need careful monitoring and management such as local policy makers. Stakeholders with high importance and high influence
29
Stakeholders appearing to have a high degree of influence on the project, who are also of high importance for its success. These are the key stakeholders that adaptation measures should be developed for. Key stakeholders were therefore identified as
• Farm owner operators. These are stakeholders that are most affected by climate change impact on productivity and profitability.
• Fertiliser manufacturers. These stakeholders are important as they can provide credit and technical advice to the farmers.
• Farm caretakers. The care takers are the stakeholders who manage the ponds on a day to day basis so better management practices should be aimed and implemented by them.
• Nursery operators. Nursery operators can ensure the supply of good quality and hardy fry that will help reduce levels of disease, stress and mortality.
• Fish wholesalers. Fish wholesalers can also provide credit to pond operators and have a great influence on the profitability of the farm operation.
4.2 Institutional Mapping and Analysis
Institutions play a critical role in supporting or constraining people’s capacity to adapt to climate change. In order to better understand which institutions are most important to people in the target communities, an institutional mapping exercise is useful. The institutional analysis provides useful in identifying the institutions that should be engaged in the adaptation process, as well as potential allies and opponents in addressing vulnerability at the local level. The institution is any organization, who can be positively or negatively impacted by climate change in milkfish pond farming sector or had the significant influence on adaptations towards the problems. The Institutions were classified by the expert judgment group into levels of importance and influence into grades from 1 very low to 5 very high. Institution influence Influence is the power institutions have over a sector - to control what decisions are made, facilitate its implementation, or exert influence which affects the sector positively or negatively. Influence is perhaps best understood as the extent to which institutions are able to persuade or coerce others into making decisions, and following certain courses of action. Power may derive from the nature of a institution, or their position in relation to other institutions (for example, line ministries which control budgets and other departments). An institution’s degree of influence translates into the relative power they have over Milkfish farming as well as the degree to which they can help desired changes to be implemented or funded or to which extent they can block changes. The Institution’s influence derives from their political position and funds available. Institution importance An institution’s level of importance indicates the extent to which a adaptations would be ineffective if they were not taken into account. Table 14. Assessment of Institution importance and influence for milkfish culture Institution Importance Influence
30
BFAR Regional Offices 5 5 BFAR Central Office 4.5 5 BFAR Inland Fisheries and Aquatic Resources division (IFAD)
5 3
BFAR Planning Division 4 4 BFAR Fisheries Resource P Division (FLAs) 4 4 Regional Fisheries Training Centers 5 3 National Fisheries Research and Development Institute
3 2
Key stakeholders with high influence and importance for the implementation of adaptation measures and are likely to be the target institutions for recommendations, technical and policy briefs, and are potential partners in planning and implementation of adaptation measures. Conversely, key stakeholders with high influence, but with low importance to project success may be involved by being consulted or informed. Key BFAR Institutions The institution description such as activities, scale (National/State/local level) and institutional characteristics such as their information level, interest and influence over CC adaptation resources available to support the shrimp farmers for CC adaptation are presented in Annex 4. Key BFAR Institutions were therefore identified as
• BFAR Regional Offices. The BFAR Regional Offices are important and have strong influence as they implement BFAR policy at the regional level throughout the Philippines.
• BFAR Central Office. The BFAR Central office is the line agency for the development and management of aquaculture in the Philippines and so develops policy and have access and control of budgets to implement.
• Inland Fisheries and Aquaculture Division (IFAD). IFAD are the Division within BFAR that is directly involved with inland and marine aquaculture.
• Regional Fishermen's Training Centres (RFTC). The RFTC provide practical training for aquaculture farmers at the regional level and so have great importance and influence in disseminating adaptation measures.
• BFAR Fisheries planning, policy and economics Division (BFAR-FPPED). The FPPED analyzes industry, economic, institutions to form bases in the formulation and recommendation of appropriate policies and programs for the utilization, management, development, conservation and allocation system of aquaculture, fisheries and aquatic resources
• DENR - Forest Resources Conservation Division (DENR-FRCD). This Division has importance and influence on upland tree planning to reduce heavy rainfall run off and mangrove planting for coastal protection.
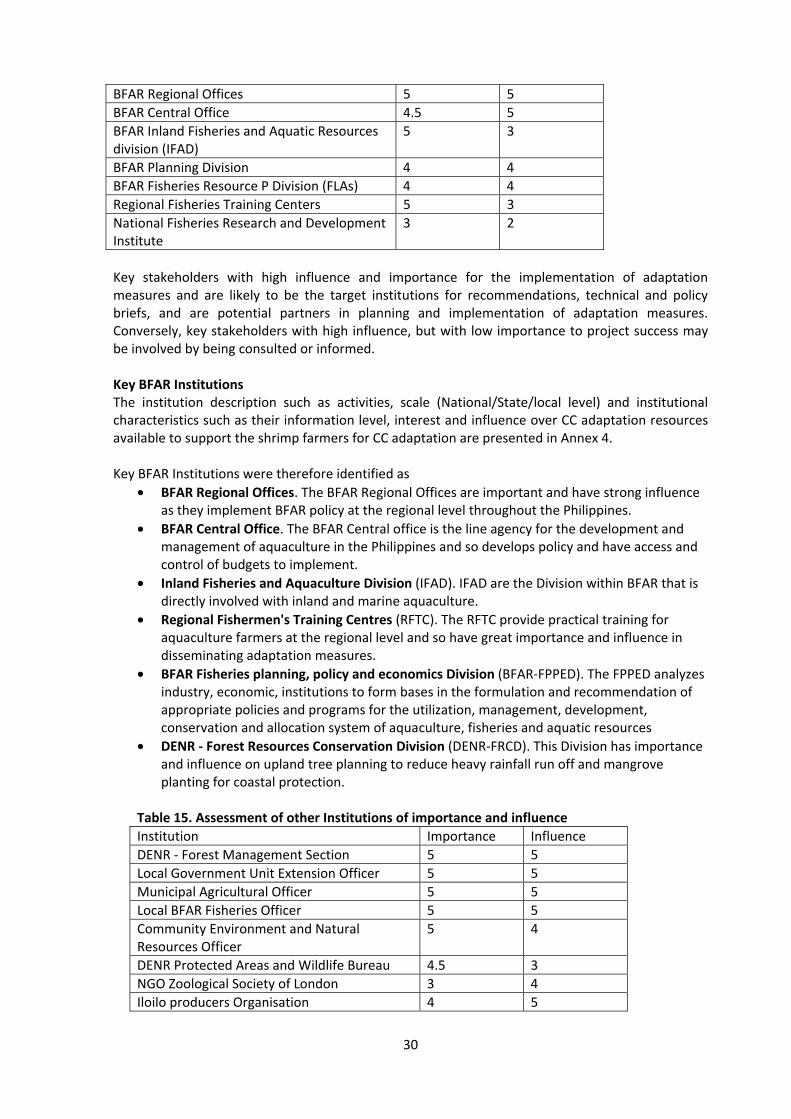
Table 15. Assessment of other Institutions of importance and influence Institution Importance Influence DENR - Forest Management Section 5 5 Local Government Unit Extension Officer 5 5 Municipal Agricultural Officer 5 5 Local BFAR Fisheries Officer 5 5 Community Environment and Natural Resources Officer
5 4
DENR Protected Areas and Wildlife Bureau 4.5 3 NGO Zoological Society of London 3 4 Iloilo producers Organisation 4 5
31
Dumangas Producers Organisation 4 5 University of Philippines MSI/V 3 4 SEAFDEC 2.5 3 Other Institution characteristics and classification The other institution description such as activities, scale (National/State/local level) and institutional characteristics such as their information level, interest and influence over CC adaptation resources available to support the shrimp farmers for CC adaptation. Key other institutions were therefore identified as
• DENR Forest management Section • LGU Extension Officers • Municipal Agricultural Officers • BFAR Fisheries officers • Community Environment and Natural Resources Officer • Iloilo Producers Organisation • Dumangas Producers Organisation
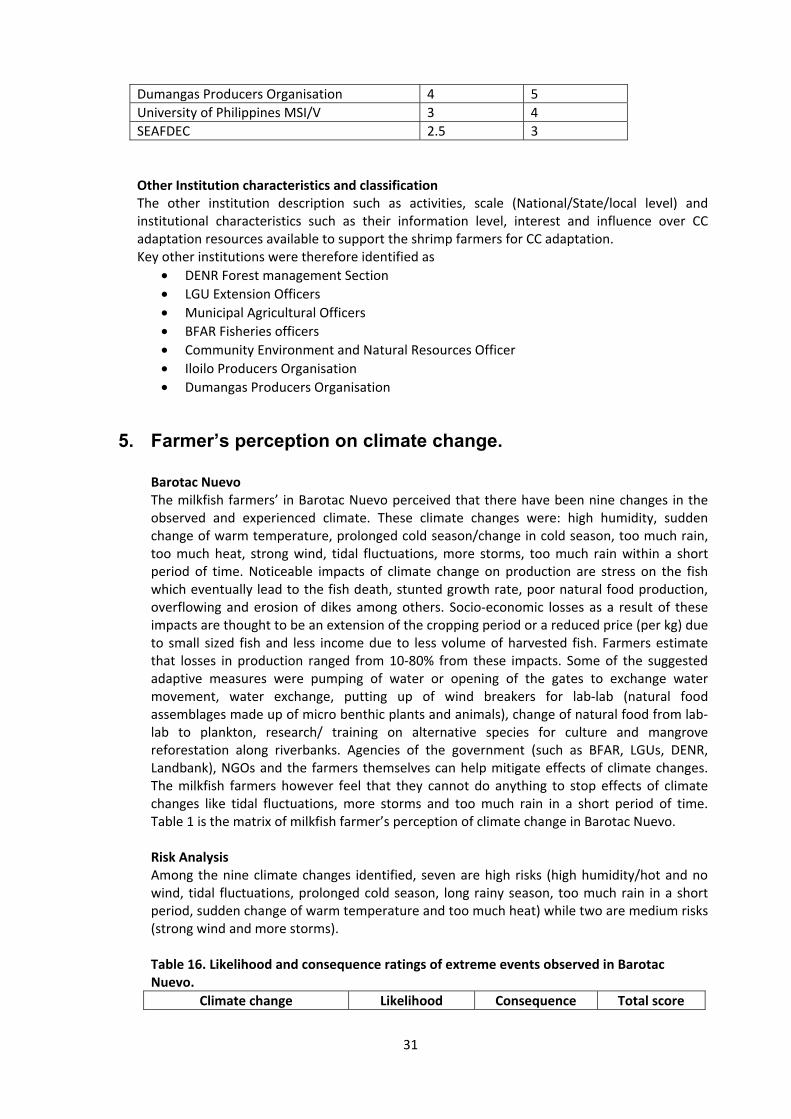
5. Farmer’s perception on climate change.
Barotac Nuevo The milkfish farmers’ in Barotac Nuevo perceived that there have been nine changes in the observed and experienced climate. These climate changes were: high humidity, sudden change of warm temperature, prolonged cold season/change in cold season, too much rain, too much heat, strong wind, tidal fluctuations, more storms, too much rain within a short period of time. Noticeable impacts of climate change on production are stress on the fish which eventually lead to the fish death, stunted growth rate, poor natural food production, overflowing and erosion of dikes among others. Socio-economic losses as a result of these impacts are thought to be an extension of the cropping period or a reduced price (per kg) due to small sized fish and less income due to less volume of harvested fish. Farmers estimate that losses in production ranged from 10-80% from these impacts. Some of the suggested adaptive measures were pumping of water or opening of the gates to exchange water movement, water exchange, putting up of wind breakers for lab-lab (natural food assemblages made up of micro benthic plants and animals), change of natural food from lab-lab to plankton, research/ training on alternative species for culture and mangrove reforestation along riverbanks. Agencies of the government (such as BFAR, LGUs, DENR, Landbank), NGOs and the farmers themselves can help mitigate effects of climate changes. The milkfish farmers however feel that they cannot do anything to stop effects of climate changes like tidal fluctuations, more storms and too much rain in a short period of time. Table 1 is the matrix of milkfish farmer’s perception of climate change in Barotac Nuevo. Risk Analysis Among the nine climate changes identified, seven are high risks (high humidity/hot and no wind, tidal fluctuations, prolonged cold season, long rainy season, too much rain in a short period, sudden change of warm temperature and too much heat) while two are medium risks (strong wind and more storms). Table 16. Likelihood and consequence ratings of extreme events observed in Barotac Nuevo.
Climate change Likelihood Consequence Total score
32
High humidity/hot no wind 3 5 15 Tidal fluctuations 5 3 15 Prolonged cold season/change in cold season
5 3.5 17.5
Long rainy season 4 3.5 14 Too much rain in a short period 4.5 3 13.5 Sudden change of warm temperature
4 3 12
Too much heat-long dry season 4 3 12 Strong wind 4 2.5 10 More storms 4 2.5 10
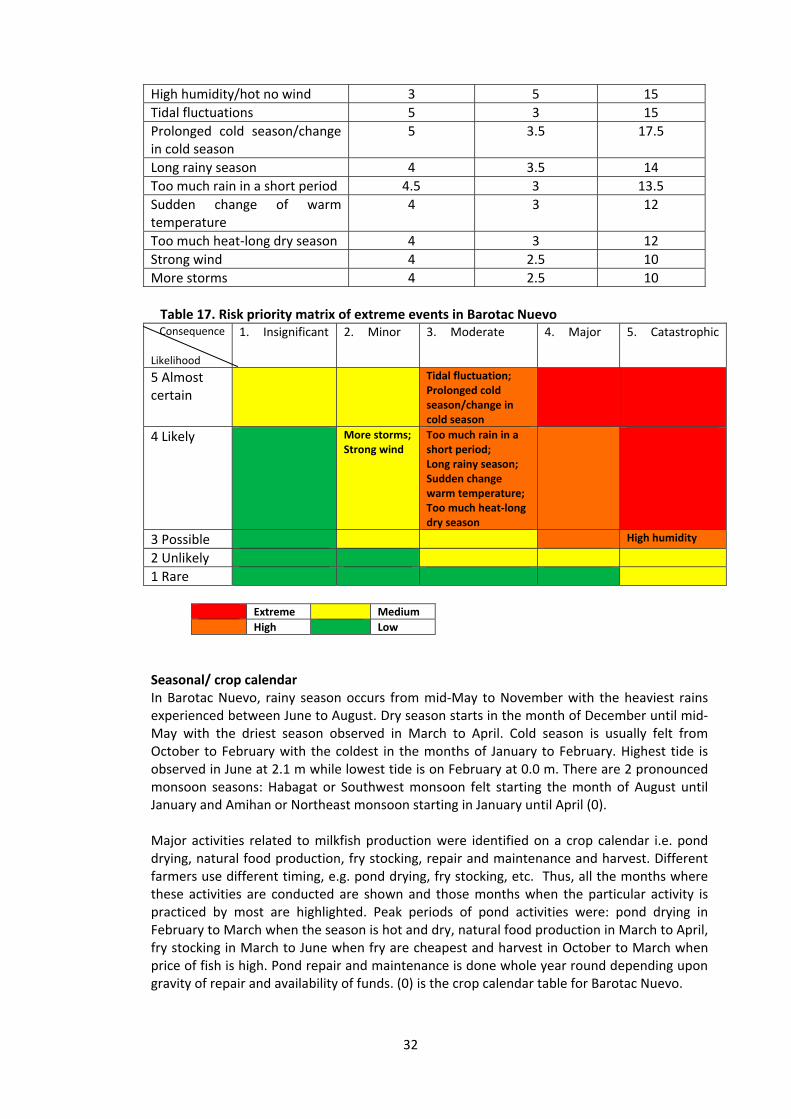
Table 17. Risk priority matrix of extreme events in Barotac Nuevo Consequence
Likelihood
1. Insignificant 2. Minor 3. Moderate 4. Major 5. Catastrophic
5 Almost certain
Tidal fluctuation; Prolonged cold season/change in cold season
4 Likely More storms; Strong wind
Too much rain in a short period; Long rainy season; Sudden change warm temperature; Too much heat-long dry season
3 Possible High humidity
2 Unlikely 1 Rare
Extreme Medium High Low
Seasonal/ crop calendar In Barotac Nuevo, rainy season occurs from mid-May to November with the heaviest rains experienced between June to August. Dry season starts in the month of December until mid-May with the driest season observed in March to April. Cold season is usually felt from October to February with the coldest in the months of January to February. Highest tide is observed in June at 2.1 m while lowest tide is on February at 0.0 m. There are 2 pronounced monsoon seasons: Habagat or Southwest monsoon felt starting the month of August until January and Amihan or Northeast monsoon starting in January until April (0). Major activities related to milkfish production were identified on a crop calendar i.e. pond drying, natural food production, fry stocking, repair and maintenance and harvest. Different farmers use different timing, e.g. pond drying, fry stocking, etc. Thus, all the months where these activities are conducted are shown and those months when the particular activity is practiced by most are highlighted. Peak periods of pond activities were: pond drying in February to March when the season is hot and dry, natural food production in March to April, fry stocking in March to June when fry are cheapest and harvest in October to March when price of fish is high. Pond repair and maintenance is done whole year round depending upon gravity of repair and availability of funds. (0) is the crop calendar table for Barotac Nuevo.
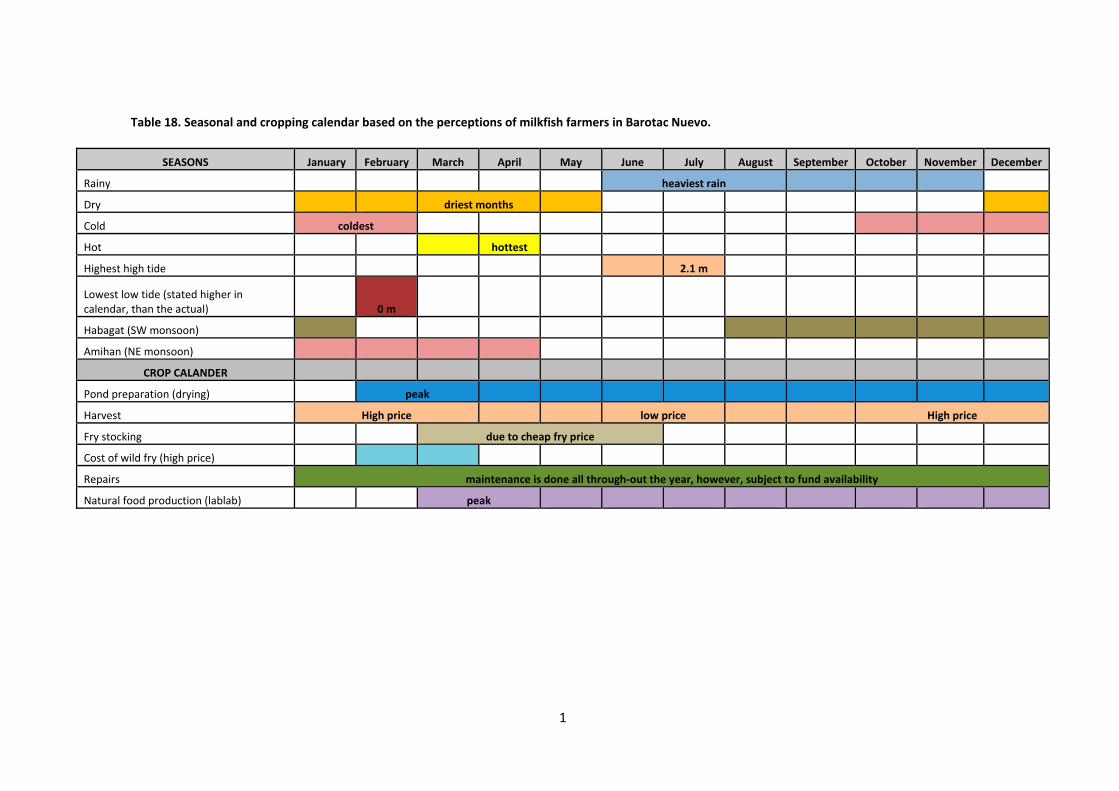
1
Table 18. Seasonal and cropping calendar based on the perceptions of milkfish farmers in Barotac Nuevo.
SEASONS January February March April May June July August September October November December
Rainy heaviest rain
Dry driest months
Cold coldest
Hot hottest
Highest high tide 2.1 m
Lowest low tide (stated higher in calendar, than the actual) 0 m
Habagat (SW monsoon)
Amihan (NE monsoon)
CROP CALANDER
Pond preparation (drying) peak
Harvest High price low price High price
Fry stocking due to cheap fry price
Cost of wild fry (high price)
Repairs maintenance is done all through-out the year, however, subject to fund availability
Natural food production (lablab) peak

1
Farmer’s perception on climate change. The Dumangas group identified 4 major extreme events: rainfall (prolonged rainfall/ rainfall variability), flood, sea level rise and extreme temperature (too hot/too cold). As a result of the occurrence of extreme events impacts on production were delayed/poor pond preparation (lab-lab dissolved, snails abundant), slow growth, fish kill, changes in bio-physical properties i.e. ph, salinity and temperature, dike destruction to mention a few. Loss in production is estimated at 30%. Some farmers observe flock of migratory birds to come to the area as temperature varies hence destroying 50% of fingerling stocked. Some of the mitigating measures adapted were manual picking of snails, sun drying, use of chemicals, use of fine screen, technical assistance, trainings and loan assistance. Agencies identified to help were SEAFDEC, BFAR, Banks, LGUs and NGOs. Attachment 14 is the matrix of farmer’s perception of climate change in Dumangas. Risk Analysis From the Farmer Discussion Group in Dumangas, the farmer’s consider all extreme events i.e. rainfall, sea level rise, extreme temperatures and flood as medium risks.
Figure 11. Farmer Discussion Group in Dumangas
Figure 1. FGD with MF farmer’s in Dumangas.
Table 19. Likelihood and consequence ratings of extreme events observed in Dumangas. Climate change Likelihood Consequence Total score
Rain (prolonged rainfall/ rainfall variability)
3.75 3.5 13.125
Flood 2.5 4.5 11.25 Sea level rise 3.75 3.25 12.18 Extreme temperature (too hot/ too cold)
3 3.75 11.25
Table 20. Risk priority matrix of extreme events in Dumangas Consequence Likelihood
1 Insignificant 2Minor 3Moderate 4Major 5Catastrophic
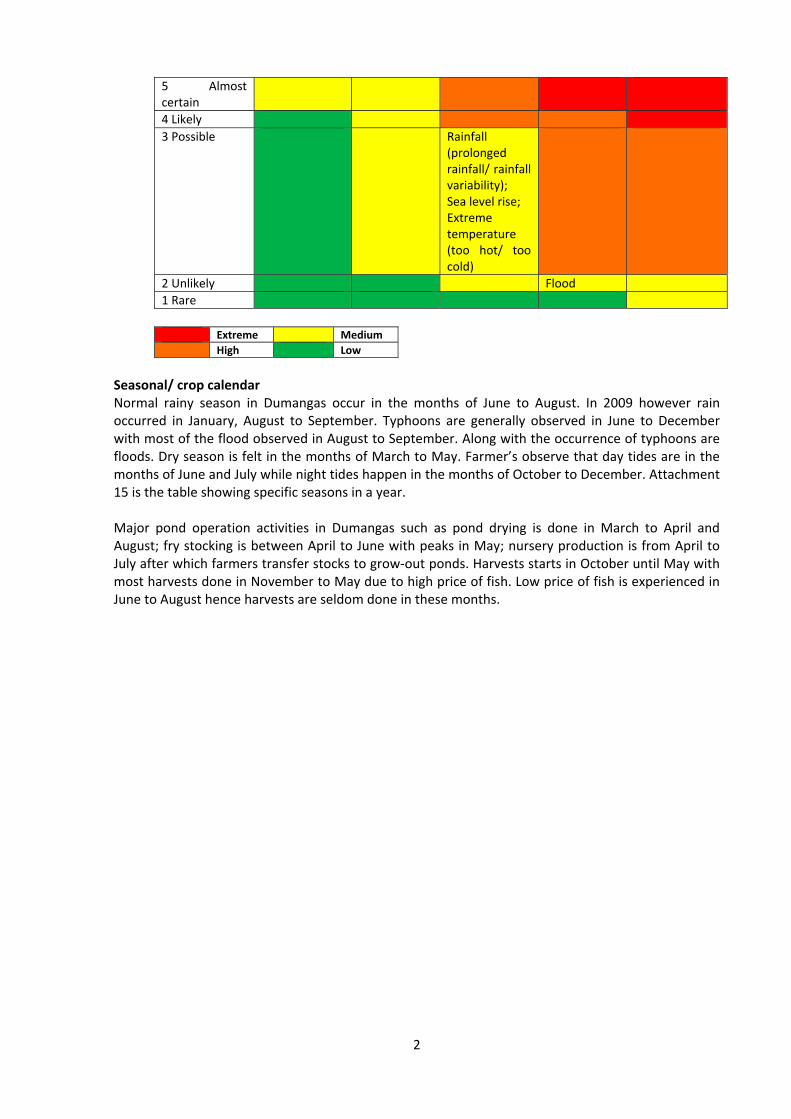
2
5 Almost certain
4 Likely 3 Possible Rainfall
(prolonged rainfall/ rainfall variability); Sea level rise; Extreme temperature (too hot/ too cold)
2 Unlikely Flood 1 Rare
Extreme Medium High Low
Seasonal/ crop calendar Normal rainy season in Dumangas occur in the months of June to August. In 2009 however rain occurred in January, August to September. Typhoons are generally observed in June to December with most of the flood observed in August to September. Along with the occurrence of typhoons are floods. Dry season is felt in the months of March to May. Farmer’s observe that day tides are in the months of June and July while night tides happen in the months of October to December. Attachment 15 is the table showing specific seasons in a year. Major pond operation activities in Dumangas such as pond drying is done in March to April and August; fry stocking is between April to June with peaks in May; nursery production is from April to July after which farmers transfer stocks to grow-out ponds. Harvests starts in October until May with most harvests done in November to May due to high price of fish. Low price of fish is experienced in June to August hence harvests are seldom done in these months.

Table 21. Crop calendar of milkfish farmer’s in Dumangas.
SEASONS January February March April May June July August September October November December
Rain (normal)
rain (2009)
Flood peak
Dry
Typhoon peak
day and night tide day tide night tide
CROP CALANDER
Pond preparation (drying)
Harvest
Harvest (high price) highest highest
Harvest (low price)
Fry stocking peak
Production (nursery)
Production (P)
The farmers were already undertaking adaptation measures to cope with the present Climate changes (including prolonged cold season, changes in tidal fluctuations, extremely hot temperatures and prolonged rainy season) that were perceived. Prolonged cold season A prolonged cold season results in less primary production and reduced growth of milkfish (milkfish are pykilothermic- their metabolism regulated by the temperature of their environment). The consequence of this is that fish will be smaller than they would usually be for the same culture time and farmer’s total yield will be less. The market price per kilogram for milkfish increases with fish size thus compounding economic losses (lower total yield and price per unit). Some suggested simple adaptation measures that farmers can do themselves included increasing the copping period to allow fish to grow to a larger size and thus obtaining a higher price per kilogram, however yield is still less. Another is to stock more fry to increase the density and thus total yield, however it is unclear if reduced growth is because fish metabolisms are lower or because primary production is lower and thus fish are food limited. If the poor growth is because of the latter (food is limited) then stocking more fry may not increase the total yield, rather the fish would grow even slower. This may be an area of research that could be easily conducted by farmers with the assistance of a research organisation the results could be validated. However, there is still the additional cost from the purchase of more fry. Farmers expressed interest in the culture of alternative species that are suitable to the environment and are profitable for farmers to culture. A breeding program that selects for fish that perform better under colder conditions may also be an option to increase the productivity under cold conditions, though it is better to consider a number of factors (such as disease resistance) not just performance under cold conditions. Lessons may be able to be learned from the tilapia GIFT breeding program that is recognized to be very successful. There was also uncertainty about if the reason for slower growth was in fact due to a prolonged dry season, there was speculation that there may have been problems with fry quality that caused slow growth (not cold weather). Tidal fluctuations Tidal fluctuations were unanimously thought by farmers to have changed from historic trends. Farmers claim that they can no longer rely on their historic tide charts to plan tidal water exchange activities. Farmers claim that at tides can be low when the historic tide chart indicates that it will be high or vice a versa and that at times there is no tide and that most importantly the high tide is becoming progressively higher. Due to the low elevation of the most of the brackishwater pond milkfish farming areas farmers use an outside high-tide protection dyke. However, farmers claim that in more recent years tides have exceeded previous maximum tides and have overtopped their high-tide protection dykes flooding their farms with damage to infrastructure and loss of stock. A key question asked by some farmers was “How high do I have to build up my dyke every year to keep up with the increasing high tides?”. High tides/tide surges tend to impact on dyke stability thus a related issue is the stabilization of dykes, using mangroves or other structures/methods. The Philippine regulations (REPUBLIC ACT NO. 7881 Sec 65c) require in Fish Pond Lease Agreements (FLAs) a portion of the fishpond area to be planted with mangroves. However, this is presently not enforced.
"REPUBLIC ACT NO. 7881 Sec. 65-C. Protection of Mangrove Areas. — In existing Fishpond Lease Agreements (FLAs) and those that will be issued after the effectivity of this Act, a portion of the fishpond area fronting the sea, sufficient to protect the environment, shall be established as a

buffer zone and be planted to specified mangrove species to be determined in consultation with the regional office of the DENR. The Secretary of Environment and Natural Resources shall provide the penalties for any violation of this undertaking as well as the rules for its implementation."
Enforcement of this regulation or programs to implement mangrove planting may help in reducing the impacts of tidal surges on the coastal milkfish farmers. Prolonged rainy season A prolonged rainy season was perceived by milkfish farmers, specifically important was rain during their peek pond drying time. Farmers complained that they can have trouble completely drying their ponds as they had rainy days during that period. Milkfish farmers dry their ponds to oxidize pond sediments, flush out toxic substances, improve water quality and eradicate pest species (Bagarinao 1999). The farmers claim that the major impact of incomplete drying of the fish pond is that they are unable to remove all the pest species this way. A particularly significant pest when farmers cannot completely dry their ponds are snails (Cerithidea cingulata), these snail (as with some other pest species) compete with milkfish for natural food (lablab). It is reported that snail can reach from 700-7,000 individuals or 3-4 kg per square meter in impacted ponds (Bagarinao 1999). Previously Aquatin and Brestan (triphenyltin compounds) chemicals have been used to eradicate snails however they were banned by the Department of Agriculture in 1993 due to their negative consequences on farm workers and their persistence in soils and fish flesh. Some suggested adaptation measures included manually removing snails, using chemicals, and extension of the drying period to ensure that ponds sun-dry. There are currently chemicals available for pond disinfection (i.e. tea seed cake), however this is an additional cost to farmers and its effectiveness is unknown. Manual removal of snails appears to be a labour intensive and thus costly approach, however if are harvested in large quantities there is the possibility to utilize them as a resource (for example made into a dry product they may be a nutritious fish feed ingredient). Extremely hot temperatures Farmers perceived that there is now an increase in extremely hot temperatures and in association with little or no wind or high humidity which causes massive fish kills. The mechanism that causes the fish kills in not clear, it may be that milkfish are intolerant to a rapid change in temperature or the change in temperature depletes the oxygen of ponds and thus the milkfish die of lack of oxygen. It is most probably a combination of factors that contribute to fish kills such as the combination of high temperatures or quick temperature change and poor water quality such as high ammonia, nitrite and low oxygen (Bagarinao and Lantin-Olaguer 1999). The extensive milkfish ponds are very shallow (30-40 cm deep) to encourage high levels of productivity this also means that the water volume is small and thus can heat up and cool very quickly thus causing the problems due to heating. Maintaining good water quality throughout the culture cycle and exchanging water during times of extremely hot temperatures is a possible adaptation measure. Introducing new cooler water before the water temperature becomes too high or the dissolved oxygen becomes too low for the milkfish to tolerate. Another adaptation measure may be to deepen the pond (or part of the pond) so that a the water volume is larger (increasing the time it takes to heat up) and creating a refuge area of cooler water for fish. However, to deepen the whole pond or even deep part of the pond may have an impact on primary productivity and feed for milkfish and thus reduce fish growth. There are a number of possible adaptation measures that require further investigation. There is opportunity for the farmers themselves to trial some of these possible adaptation measures by themselves. However, if these possible adaptation measures were trialled on farm in collaboration with a scientific organisation monitoring key parameters and scientific analysis
more confidence would be gained in any results and thus confidence in any recommendations about if measure should be recommended for other farmers.
6. Green House Gas production and resource use bench marking
In order to identify culture systems that produce the most GHGs and prioritise better practices for the culture systems with high environmental impact, the different case studies need to be benchmarked against each other and other aquaculture technologies. This analysis uses resource use analysis to estimate the resource use and nutrient impact to the environment and Life Cycle analyses to estimate GHG emission. In this way the aquaculture culture systems that are resource heavy or have high GHG emissions can be highlighted and best practice guidelines to reduce impacts. The analysis assesses the GHG emissions and resource use per tonne of food produced by the case study culture systems. The Bangkok Declaration expressed the need to develop resource-efficient farming systems which make efficient use of water, land, seed and feed inputs by exploring the potential for commercial use of species feeding low in the food chain. Although significant resource competition exists, significant technological advancements in aquaculture over the past decade have occurred to make production systems less consumptive of land, water and energy, to the point where aquaculture resource use, overall, is comparable to poultry production. However, the next 20 years will see an increase in the efficient use of land, water, food, seed and energy through intensification and widespread adoption of integrated agriculture-aquaculture farming ecosystems approaches. However, this will not be enough to increase aquaculture production as these will improve only the efficiency of use, and increase aquaculture yields per unit of inputs. An exponentially growing population will require aquaculture to expand rapidly into land and water areas that are currently held as common pool resources (commons). This raises issues of access to and management of common pool resources, which could result in conflicts with exiting users and potentially acute social, political, and economic problems. Assessing environmental performance of aquaculture is difficult because activities and potential impacts are extremely diverse. However there is an increasing emphasis on using holistic analyses to compare overall impacts of different agricultural production systems and to assess impacts and resource use within a production process to identify opportunities for increasing resource use efficiency. Life Cycle Assessment is the most common comprehensive analytical tool currently used to quantify environmental impacts of a production process. The LCA concept has been formalized into an analytical methodology under ISO 14000 standards and has been proposed as a measure of environmental performance and sustainability by numerous agencies and environmental groups The LCA approach is useful because the impacts of all activities involved in production, use, and retirement of a product are expressed in a single “common currency”—energy use, for example—thereby making it easy to compare impacts among various products, processes, or activities. Life cycle assessment must have clearly defined boundaries because impacts can, in theory, flow almost endlessly upstream and downstream of the actual production process. For example, an energy LCA for aquaculture may include energy costs to procure pelagic fish for reduction to fish meal that will be used in aquafeeds. The energy cost of fishing is primarily embodied in the fuel used by the fishing vessel, but can also include the energy used to manufacture the fishing vessel, to produce the steel and fiberglass used to fabricate the vessel, to produce the nylon used in nets, and so on. In this analysis the boundary for analysis is set to the production phase only. Production data and resource use was collected through detailed questionnaires from owner operators. Combining the
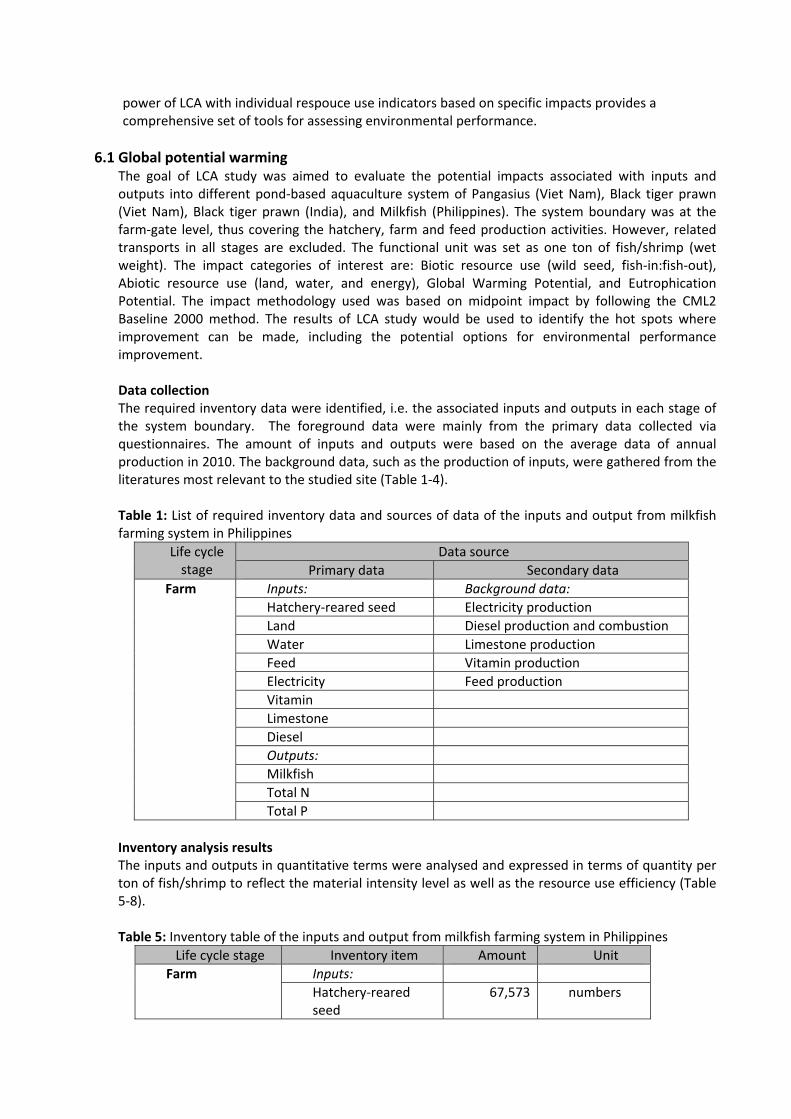
power of LCA with individual respouce use indicators based on specific impacts provides a comprehensive set of tools for assessing environmental performance.
6.1 Global potential warming The goal of LCA study was aimed to evaluate the potential impacts associated with inputs and outputs into different pond-based aquaculture system of Pangasius (Viet Nam), Black tiger prawn (Viet Nam), Black tiger prawn (India), and Milkfish (Philippines). The system boundary was at the farm-gate level, thus covering the hatchery, farm and feed production activities. However, related transports in all stages are excluded. The functional unit was set as one ton of fish/shrimp (wet weight). The impact categories of interest are: Biotic resource use (wild seed, fish-in:fish-out), Abiotic resource use (land, water, and energy), Global Warming Potential, and Eutrophication Potential. The impact methodology used was based on midpoint impact by following the CML2 Baseline 2000 method. The results of LCA study would be used to identify the hot spots where improvement can be made, including the potential options for environmental performance improvement. Data collection The required inventory data were identified, i.e. the associated inputs and outputs in each stage of the system boundary. The foreground data were mainly from the primary data collected via questionnaires. The amount of inputs and outputs were based on the average data of annual production in 2010. The background data, such as the production of inputs, were gathered from the literatures most relevant to the studied site (Table 1-4). Table 1: List of required inventory data and sources of data of the inputs and output from milkfish farming system in Philippines
Life cycle stage
Data source Primary data Secondary data
Farm Inputs: Background data: Hatchery-reared seed Electricity production Land Diesel production and combustion Water Limestone production Feed Vitamin production Electricity Feed production Vitamin Limestone Diesel Outputs: Milkfish Total N Total P
Inventory analysis results The inputs and outputs in quantitative terms were analysed and expressed in terms of quantity per ton of fish/shrimp to reflect the material intensity level as well as the resource use efficiency (Table 5-8). Table 5: Inventory table of the inputs and output from milkfish farming system in Philippines
Life cycle stage Inventory item Amount Unit Farm Inputs:
Hatchery-reared seed
67,573 numbers
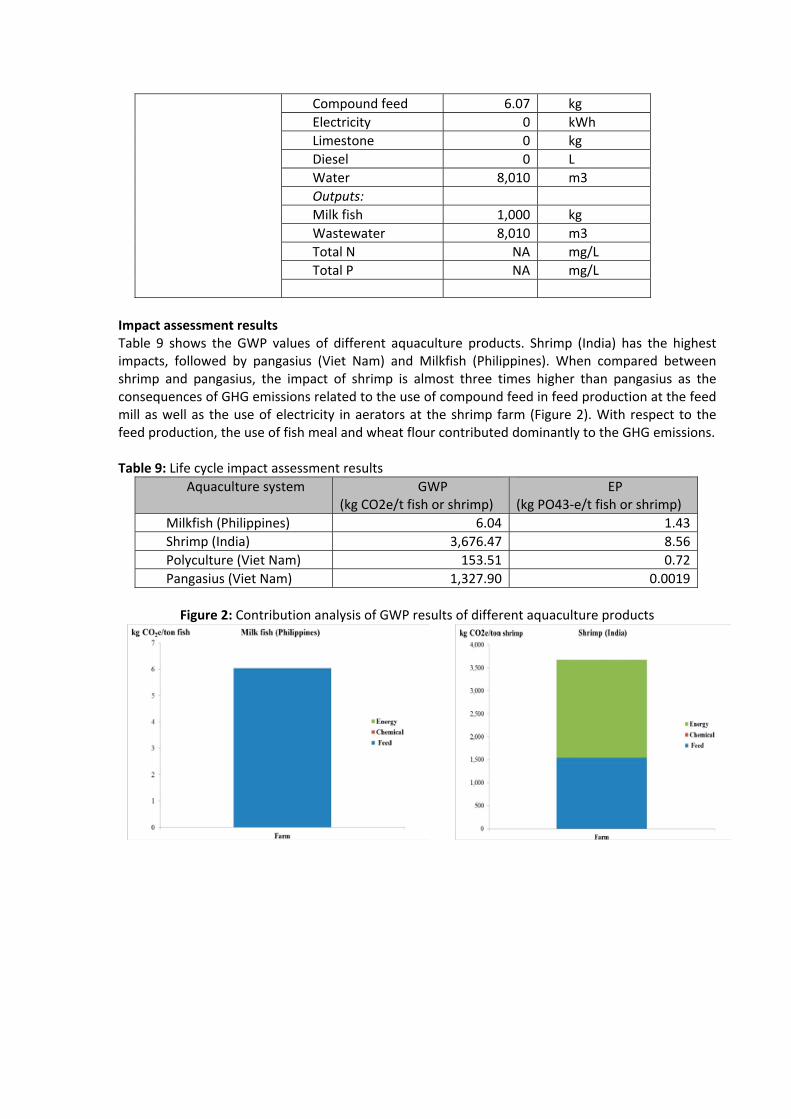
Compound feed 6.07 kg Electricity 0 kWh Limestone 0 kg Diesel 0 L Water 8,010 m3 Outputs: Milk fish 1,000 kg Wastewater 8,010 m3 Total N NA mg/L Total P NA mg/L
Impact assessment results Table 9 shows the GWP values of different aquaculture products. Shrimp (India) has the highest impacts, followed by pangasius (Viet Nam) and Milkfish (Philippines). When compared between shrimp and pangasius, the impact of shrimp is almost three times higher than pangasius as the consequences of GHG emissions related to the use of compound feed in feed production at the feed mill as well as the use of electricity in aerators at the shrimp farm (Figure 2). With respect to the feed production, the use of fish meal and wheat flour contributed dominantly to the GHG emissions. Table 9: Life cycle impact assessment results
Aquaculture system GWP (kg CO2e/t fish or shrimp)
EP (kg PO43-e/t fish or shrimp)
Milkfish (Philippines) 6.04 1.43Shrimp (India) 3,676.47 8.56Polyculture (Viet Nam) 153.51 0.72Pangasius (Viet Nam) 1,327.90 0.0019
Figure 2: Contribution analysis of GWP results of different aquaculture products
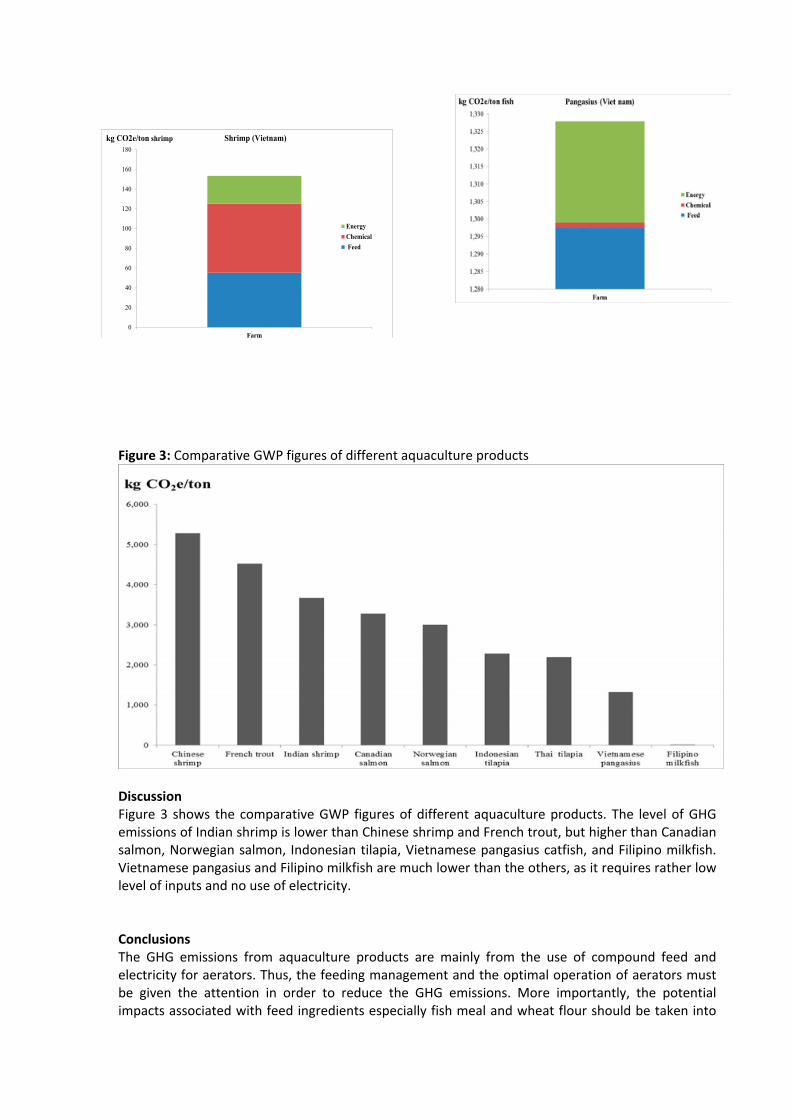
Figure 3: Comparative GWP figures of different aquaculture products
Discussion Figure 3 shows the comparative GWP figures of different aquaculture products. The level of GHG emissions of Indian shrimp is lower than Chinese shrimp and French trout, but higher than Canadian salmon, Norwegian salmon, Indonesian tilapia, Vietnamese pangasius catfish, and Filipino milkfish. Vietnamese pangasius and Filipino milkfish are much lower than the others, as it requires rather low level of inputs and no use of electricity.
Conclusions The GHG emissions from aquaculture products are mainly from the use of compound feed and electricity for aerators. Thus, the feeding management and the optimal operation of aerators must be given the attention in order to reduce the GHG emissions. More importantly, the potential impacts associated with feed ingredients especially fish meal and wheat flour should be taken into
0
20
40
60
80
100
120
140
160
180
Farm
EnergyChemical Feed
kg CO2e/ton shrimp Shrimp (Vietnam)
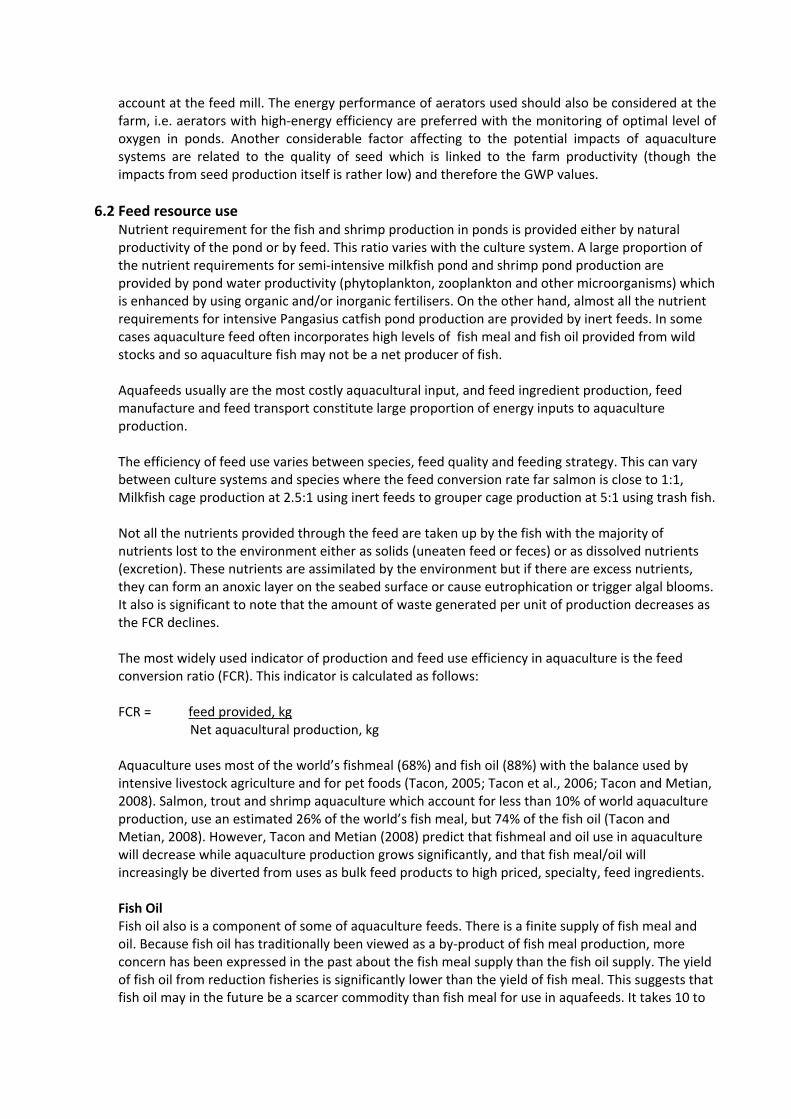
account at the feed mill. The energy performance of aerators used should also be considered at the farm, i.e. aerators with high-energy efficiency are preferred with the monitoring of optimal level of oxygen in ponds. Another considerable factor affecting to the potential impacts of aquaculture systems are related to the quality of seed which is linked to the farm productivity (though the impacts from seed production itself is rather low) and therefore the GWP values.
6.2 Feed resource use Nutrient requirement for the fish and shrimp production in ponds is provided either by natural productivity of the pond or by feed. This ratio varies with the culture system. A large proportion of the nutrient requirements for semi-intensive milkfish pond and shrimp pond production are provided by pond water productivity (phytoplankton, zooplankton and other microorganisms) which is enhanced by using organic and/or inorganic fertilisers. On the other hand, almost all the nutrient requirements for intensive Pangasius catfish pond production are provided by inert feeds. In some cases aquaculture feed often incorporates high levels of fish meal and fish oil provided from wild stocks and so aquaculture fish may not be a net producer of fish. Aquafeeds usually are the most costly aquacultural input, and feed ingredient production, feed manufacture and feed transport constitute large proportion of energy inputs to aquaculture production. The efficiency of feed use varies between species, feed quality and feeding strategy. This can vary between culture systems and species where the feed conversion rate far salmon is close to 1:1, Milkfish cage production at 2.5:1 using inert feeds to grouper cage production at 5:1 using trash fish. Not all the nutrients provided through the feed are taken up by the fish with the majority of nutrients lost to the environment either as solids (uneaten feed or feces) or as dissolved nutrients (excretion). These nutrients are assimilated by the environment but if there are excess nutrients, they can form an anoxic layer on the seabed surface or cause eutrophication or trigger algal blooms. It also is significant to note that the amount of waste generated per unit of production decreases as the FCR declines. The most widely used indicator of production and feed use efficiency in aquaculture is the feed conversion ratio (FCR). This indicator is calculated as follows: FCR = feed provided, kg
Net aquacultural production, kg Aquaculture uses most of the world’s fishmeal (68%) and fish oil (88%) with the balance used by intensive livestock agriculture and for pet foods (Tacon, 2005; Tacon et al., 2006; Tacon and Metian, 2008). Salmon, trout and shrimp aquaculture which account for less than 10% of world aquaculture production, use an estimated 26% of the world’s fish meal, but 74% of the fish oil (Tacon and Metian, 2008). However, Tacon and Metian (2008) predict that fishmeal and oil use in aquaculture will decrease while aquaculture production grows significantly, and that fish meal/oil will increasingly be diverted from uses as bulk feed products to high priced, specialty, feed ingredients. Fish Oil Fish oil also is a component of some of aquaculture feeds. There is a finite supply of fish meal and oil. Because fish oil has traditionally been viewed as a by-product of fish meal production, more concern has been expressed in the past about the fish meal supply than the fish oil supply. The yield of fish oil from reduction fisheries is significantly lower than the yield of fish meal. This suggests that fish oil may in the future be a scarcer commodity than fish meal for use in aquafeeds. It takes 10 to
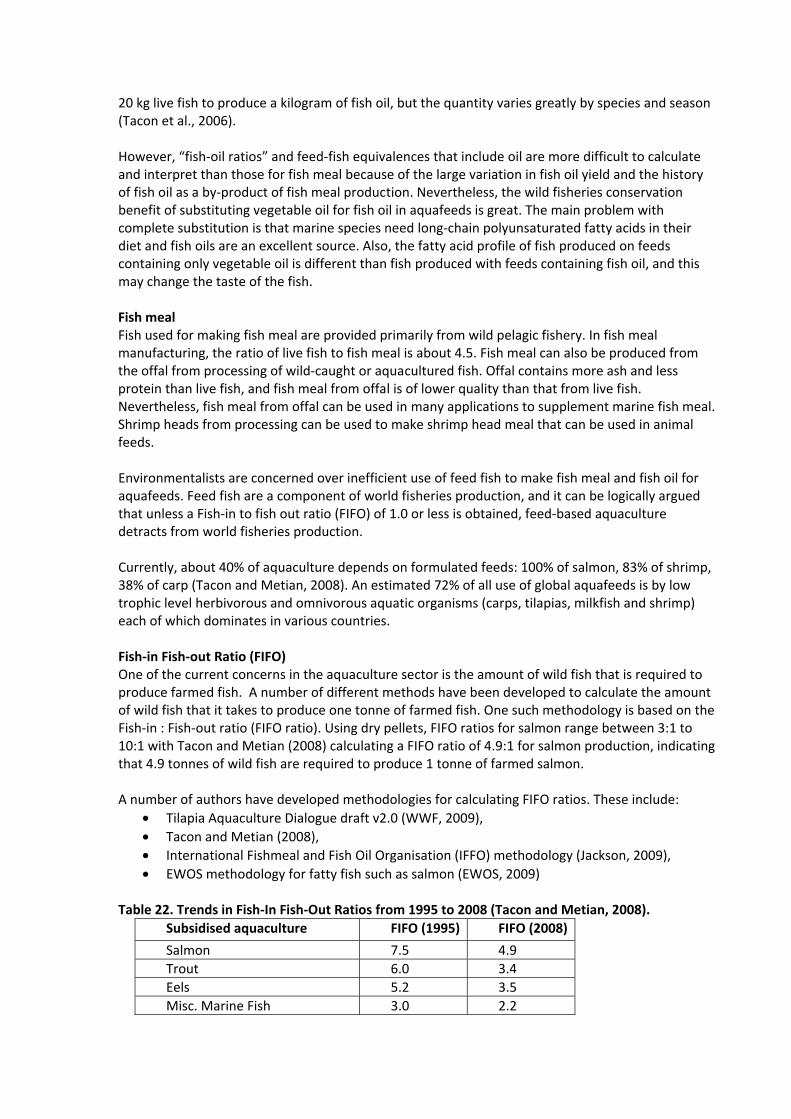
20 kg live fish to produce a kilogram of fish oil, but the quantity varies greatly by species and season (Tacon et al., 2006). However, “fish-oil ratios” and feed-fish equivalences that include oil are more difficult to calculate and interpret than those for fish meal because of the large variation in fish oil yield and the history of fish oil as a by-product of fish meal production. Nevertheless, the wild fisheries conservation benefit of substituting vegetable oil for fish oil in aquafeeds is great. The main problem with complete substitution is that marine species need long-chain polyunsaturated fatty acids in their diet and fish oils are an excellent source. Also, the fatty acid profile of fish produced on feeds containing only vegetable oil is different than fish produced with feeds containing fish oil, and this may change the taste of the fish. Fish meal Fish used for making fish meal are provided primarily from wild pelagic fishery. In fish meal manufacturing, the ratio of live fish to fish meal is about 4.5. Fish meal can also be produced from the offal from processing of wild-caught or aquacultured fish. Offal contains more ash and less protein than live fish, and fish meal from offal is of lower quality than that from live fish. Nevertheless, fish meal from offal can be used in many applications to supplement marine fish meal. Shrimp heads from processing can be used to make shrimp head meal that can be used in animal feeds. Environmentalists are concerned over inefficient use of feed fish to make fish meal and fish oil for aquafeeds. Feed fish are a component of world fisheries production, and it can be logically argued that unless a Fish-in to fish out ratio (FIFO) of 1.0 or less is obtained, feed-based aquaculture detracts from world fisheries production. Currently, about 40% of aquaculture depends on formulated feeds: 100% of salmon, 83% of shrimp, 38% of carp (Tacon and Metian, 2008). An estimated 72% of all use of global aquafeeds is by low trophic level herbivorous and omnivorous aquatic organisms (carps, tilapias, milkfish and shrimp) each of which dominates in various countries. Fish-in Fish-out Ratio (FIFO) One of the current concerns in the aquaculture sector is the amount of wild fish that is required to produce farmed fish. A number of different methods have been developed to calculate the amount of wild fish that it takes to produce one tonne of farmed fish. One such methodology is based on the Fish-in : Fish-out ratio (FIFO ratio). Using dry pellets, FIFO ratios for salmon range between 3:1 to 10:1 with Tacon and Metian (2008) calculating a FIFO ratio of 4.9:1 for salmon production, indicating that 4.9 tonnes of wild fish are required to produce 1 tonne of farmed salmon. A number of authors have developed methodologies for calculating FIFO ratios. These include:
• Tilapia Aquaculture Dialogue draft v2.0 (WWF, 2009), • Tacon and Metian (2008), • International Fishmeal and Fish Oil Organisation (IFFO) methodology (Jackson, 2009), • EWOS methodology for fatty fish such as salmon (EWOS, 2009)
Table 22. Trends in Fish-In Fish-Out Ratios from 1995 to 2008 (Tacon and Metian, 2008).
Subsidised aquaculture FIFO (1995) FIFO (2008)
Salmon 7.5 4.9 Trout 6.0 3.4 Eels 5.2 3.5 Misc. Marine Fish 3.0 2.2
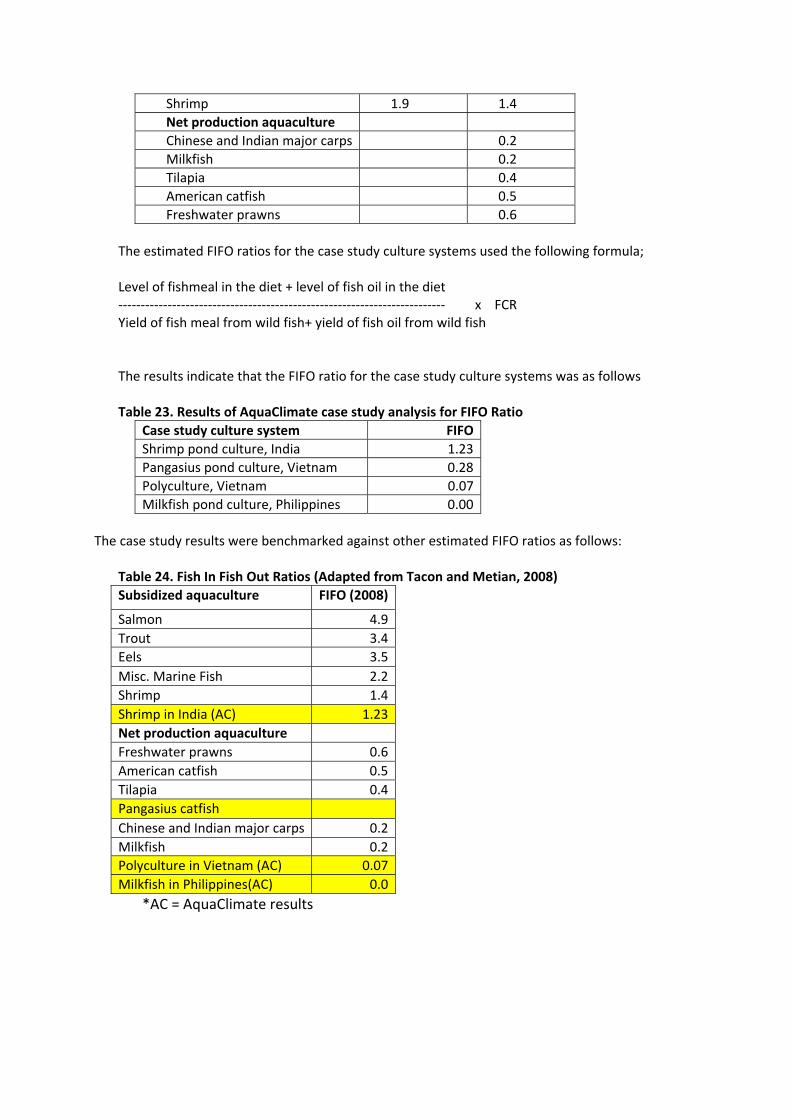
Shrimp 1.9 1.4 Net production aquaculture Chinese and Indian major carps 0.2 Milkfish 0.2 Tilapia 0.4 American catfish 0.5 Freshwater prawns 0.6
The estimated FIFO ratios for the case study culture systems used the following formula; Level of fishmeal in the diet + level of fish oil in the diet ------------------------------------------------------------------------- x FCR Yield of fish meal from wild fish+ yield of fish oil from wild fish The results indicate that the FIFO ratio for the case study culture systems was as follows Table 23. Results of AquaClimate case study analysis for FIFO Ratio
Case study culture system FIFOShrimp pond culture, India 1.23Pangasius pond culture, Vietnam 0.28Polyculture, Vietnam 0.07Milkfish pond culture, Philippines 0.00
The case study results were benchmarked against other estimated FIFO ratios as follows:
Table 24. Fish In Fish Out Ratios (Adapted from Tacon and Metian, 2008) Subsidized aquaculture FIFO (2008)
Salmon 4.9 Trout 3.4 Eels 3.5 Misc. Marine Fish 2.2 Shrimp 1.4 Shrimp in India (AC) 1.23Net production aquaculture Freshwater prawns 0.6 American catfish 0.5 Tilapia 0.4 Pangasius catfish Chinese and Indian major carps 0.2 Milkfish 0.2 Polyculture in Vietnam (AC) 0.07Milkfish in Philippines(AC) 0.0
*AC = AquaClimate results
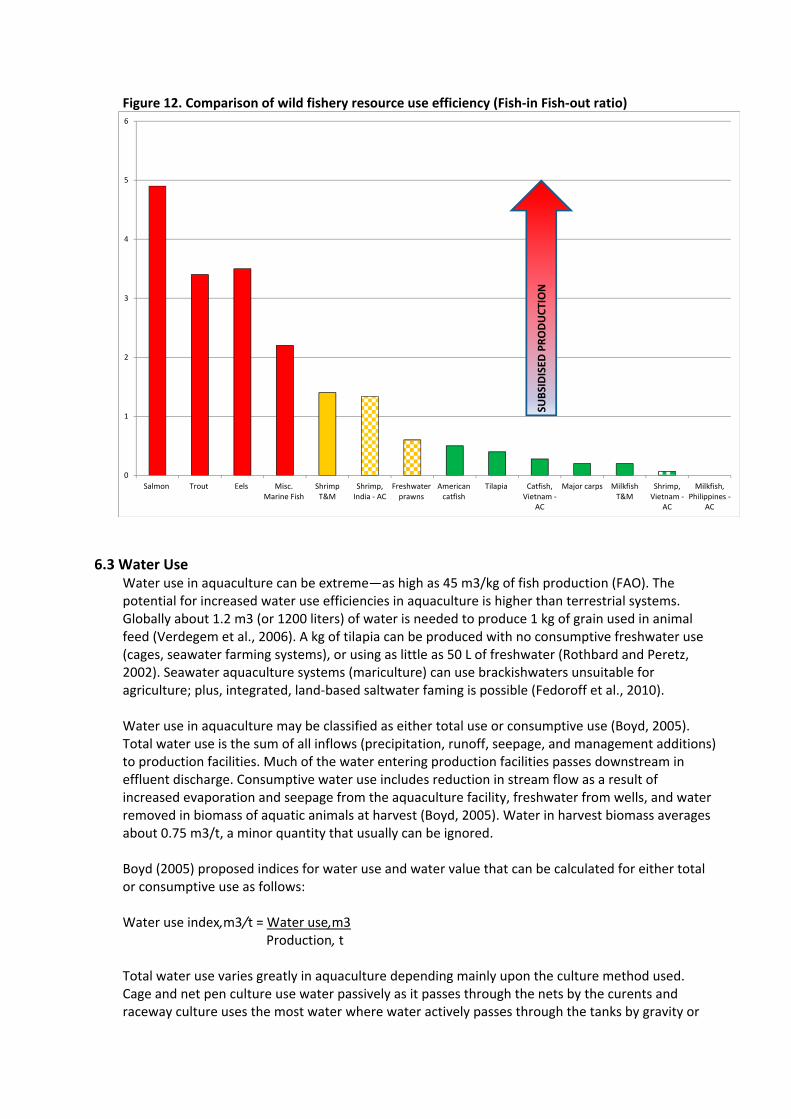
Figure 12. Comparison of wild fishery resource use efficiency (Fish-in Fish-out ratio)
6.3 Water Use
Water use in aquaculture can be extreme—as high as 45 m3/kg of fish production (FAO). The potential for increased water use efficiencies in aquaculture is higher than terrestrial systems. Globally about 1.2 m3 (or 1200 liters) of water is needed to produce 1 kg of grain used in animal feed (Verdegem et al., 2006). A kg of tilapia can be produced with no consumptive freshwater use (cages, seawater farming systems), or using as little as 50 L of freshwater (Rothbard and Peretz, 2002). Seawater aquaculture systems (mariculture) can use brackishwaters unsuitable for agriculture; plus, integrated, land-based saltwater faming is possible (Fedoroff et al., 2010). Water use in aquaculture may be classified as either total use or consumptive use (Boyd, 2005). Total water use is the sum of all inflows (precipitation, runoff, seepage, and management additions) to production facilities. Much of the water entering production facilities passes downstream in effluent discharge. Consumptive water use includes reduction in stream flow as a result of increased evaporation and seepage from the aquaculture facility, freshwater from wells, and water removed in biomass of aquatic animals at harvest (Boyd, 2005). Water in harvest biomass averages about 0.75 m3/t, a minor quantity that usually can be ignored. Boyd (2005) proposed indices for water use and water value that can be calculated for either total or consumptive use as follows: Water use index,m3/t = Water use,m3
Production, t Total water use varies greatly in aquaculture depending mainly upon the culture method used. Cage and net pen culture use water passively as it passes through the nets by the curents and raceway culture uses the most water where water actively passes through the tanks by gravity or
0
1
2
3
4
5
6
Salmon Trout Eels Misc.Marine Fish
ShrimpT&M
Shrimp,India - AC
Freshwaterprawns
Americancatfish
Tilapia Catfish,Vietnam -
AC
Major carps MilkfishT&M
Shrimp,Vietnam -
AC
Milkfish,Philippines -
AC
SUBS
IDIS
ED P
ROD
UCT
ION
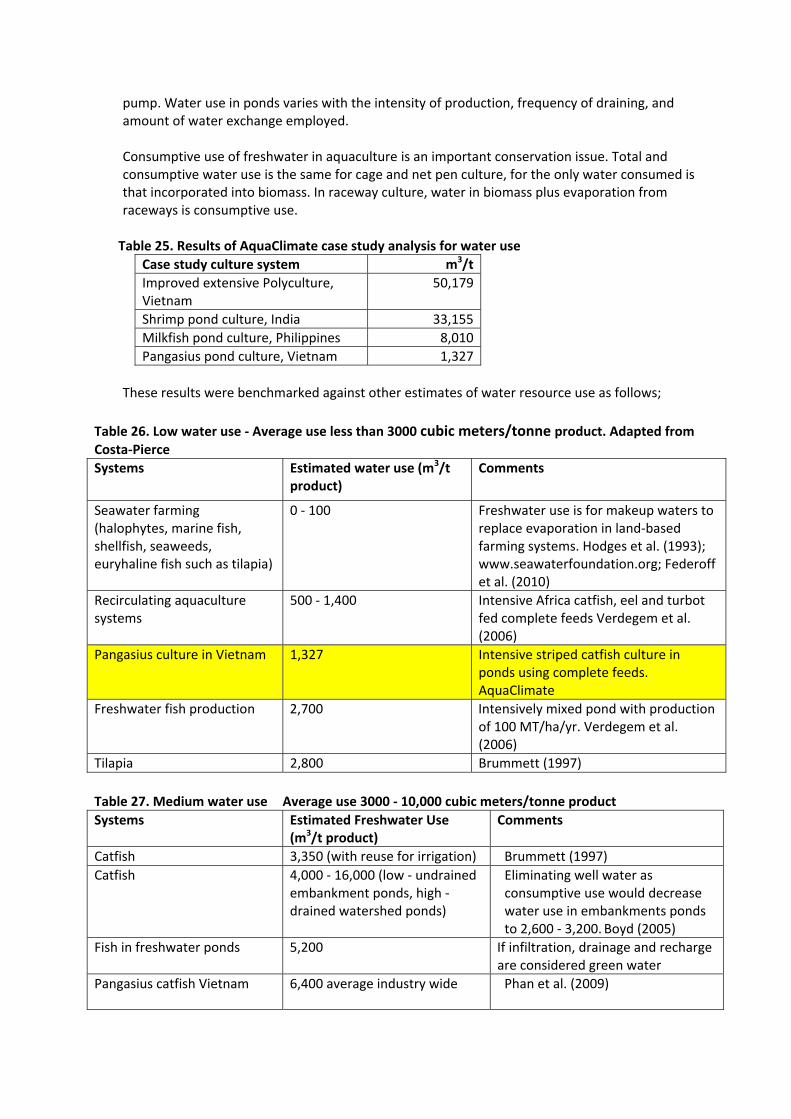
pump. Water use in ponds varies with the intensity of production, frequency of draining, and amount of water exchange employed. Consumptive use of freshwater in aquaculture is an important conservation issue. Total and consumptive water use is the same for cage and net pen culture, for the only water consumed is that incorporated into biomass. In raceway culture, water in biomass plus evaporation from raceways is consumptive use.
Table 25. Results of AquaClimate case study analysis for water use Case study culture system m3/tImproved extensive Polyculture, Vietnam
50,179
Shrimp pond culture, India 33,155Milkfish pond culture, Philippines 8,010Pangasius pond culture, Vietnam 1,327
These results were benchmarked against other estimates of water resource use as follows;
Table 26. Low water use - Average use less than 3000 cubic meters/tonne product. Adapted from Costa-Pierce Systems Estimated water use (m3/t
product) Comments
Seawater farming (halophytes, marine fish, shellfish, seaweeds, euryhaline fish such as tilapia)
0 - 100 Freshwater use is for makeup waters to replace evaporation in land-based farming systems. Hodges et al. (1993); www.seawaterfoundation.org; Federoff et al. (2010)
Recirculating aquaculture systems
500 - 1,400 Intensive Africa catfish, eel and turbot fed complete feeds Verdegem et al. (2006)
Pangasius culture in Vietnam 1,327 Intensive striped catfish culture in ponds using complete feeds. AquaClimate
Freshwater fish production 2,700 Intensively mixed pond with production of 100 MT/ha/yr. Verdegem et al. (2006)
Tilapia 2,800 Brummett (1997) Table 27. Medium water use Average use 3000 - 10,000 cubic meters/tonne product Systems Estimated Freshwater Use
(m3/t product) Comments
Catfish 3,350 (with reuse for irrigation) Brummett (1997)
Catfish 4,000 - 16,000 (low - undrained embankment ponds, high - drained watershed ponds)
Eliminating well water as consumptive use would decrease water use in embankments ponds to 2,600 - 3,200. Boyd (2005)
Fish in freshwater ponds 5,200 If infiltration, drainage and recharge are considered green water
Pangasius catfish Vietnam 6,400 average industry wide Phan et al. (2009)
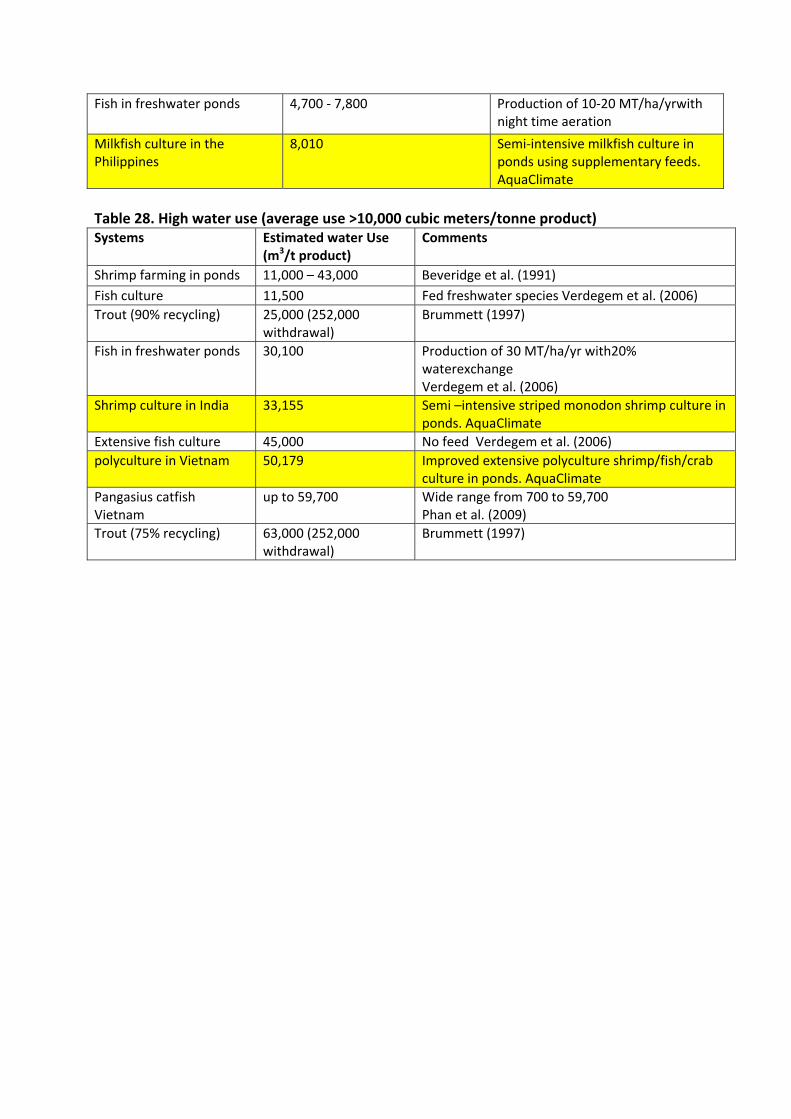
Fish in freshwater ponds 4,700 - 7,800 Production of 10-20 MT/ha/yrwith night time aeration
Milkfish culture in the Philippines
8,010 Semi-intensive milkfish culture in ponds using supplementary feeds. AquaClimate
Table 28. High water use (average use >10,000 cubic meters/tonne product) Systems Estimated water Use
(m3/t product) Comments
Shrimp farming in ponds 11,000 – 43,000 Beveridge et al. (1991) Fish culture 11,500 Fed freshwater species Verdegem et al. (2006) Trout (90% recycling) 25,000 (252,000
withdrawal) Brummett (1997)
Fish in freshwater ponds 30,100 Production of 30 MT/ha/yr with20% waterexchange Verdegem et al. (2006)
Shrimp culture in India 33,155 Semi –intensive striped monodon shrimp culture in ponds. AquaClimate
Extensive fish culture 45,000 No feed Verdegem et al. (2006) polyculture in Vietnam 50,179 Improved extensive polyculture shrimp/fish/crab
culture in ponds. AquaClimate Pangasius catfish Vietnam
up to 59,700 Wide range from 700 to 59,700 Phan et al. (2009)
Trout (75% recycling) 63,000 (252,000 withdrawal)
Brummett (1997)
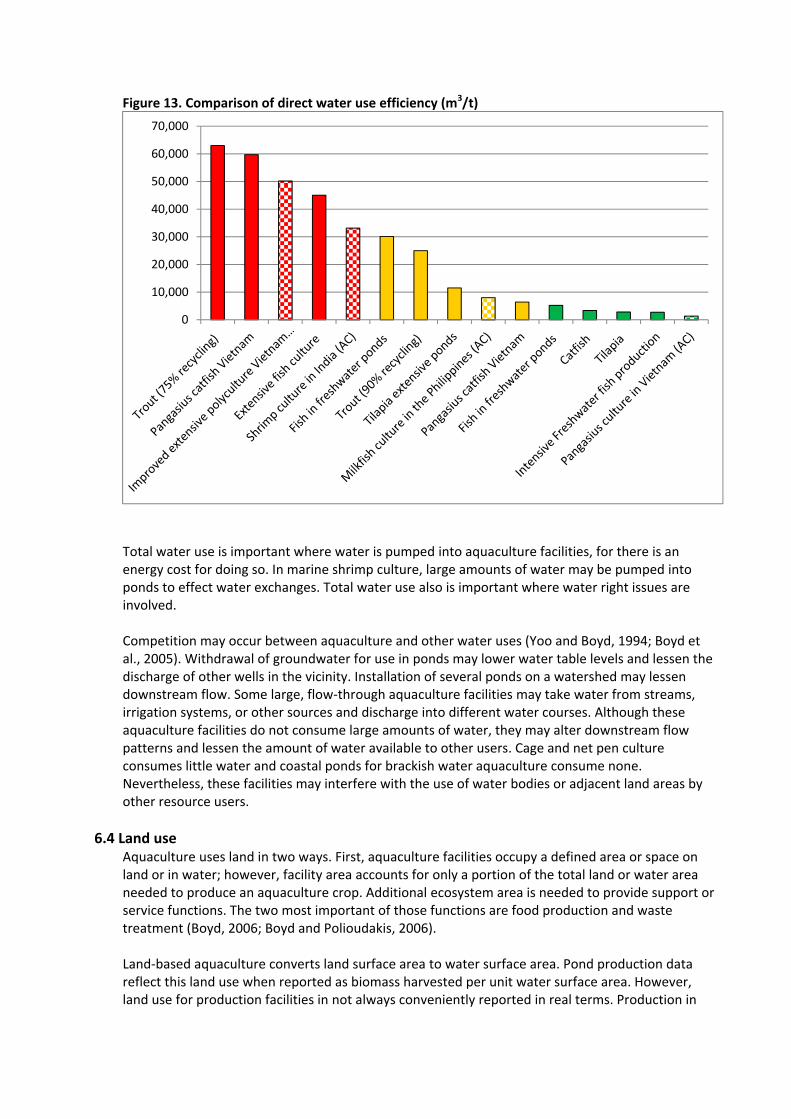
Figure 13. Comparison of direct water use efficiency (m3/t)
Total water use is important where water is pumped into aquaculture facilities, for there is an energy cost for doing so. In marine shrimp culture, large amounts of water may be pumped into ponds to effect water exchanges. Total water use also is important where water right issues are involved. Competition may occur between aquaculture and other water uses (Yoo and Boyd, 1994; Boyd et al., 2005). Withdrawal of groundwater for use in ponds may lower water table levels and lessen the discharge of other wells in the vicinity. Installation of several ponds on a watershed may lessen downstream flow. Some large, flow-through aquaculture facilities may take water from streams, irrigation systems, or other sources and discharge into different water courses. Although these aquaculture facilities do not consume large amounts of water, they may alter downstream flow patterns and lessen the amount of water available to other users. Cage and net pen culture consumes little water and coastal ponds for brackish water aquaculture consume none. Nevertheless, these facilities may interfere with the use of water bodies or adjacent land areas by other resource users.
6.4 Land use Aquaculture uses land in two ways. First, aquaculture facilities occupy a defined area or space on land or in water; however, facility area accounts for only a portion of the total land or water area needed to produce an aquaculture crop. Additional ecosystem area is needed to provide support or service functions. The two most important of those functions are food production and waste treatment (Boyd, 2006; Boyd and Polioudakis, 2006). Land-based aquaculture converts land surface area to water surface area. Pond production data reflect this land use when reported as biomass harvested per unit water surface area. However, land use for production facilities in not always conveniently reported in real terms. Production in
0
10,000
20,000
30,000
40,000
50,000
60,000
70,000
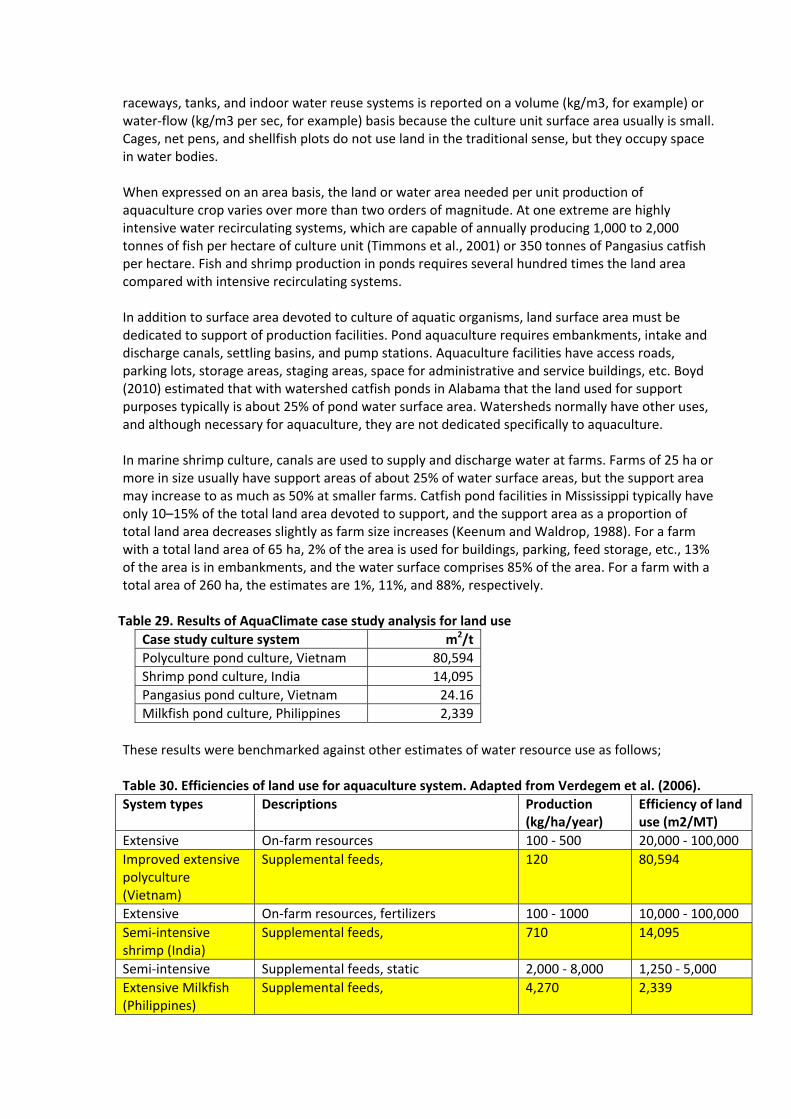
raceways, tanks, and indoor water reuse systems is reported on a volume (kg/m3, for example) or water-flow (kg/m3 per sec, for example) basis because the culture unit surface area usually is small. Cages, net pens, and shellfish plots do not use land in the traditional sense, but they occupy space in water bodies. When expressed on an area basis, the land or water area needed per unit production of aquaculture crop varies over more than two orders of magnitude. At one extreme are highly intensive water recirculating systems, which are capable of annually producing 1,000 to 2,000 tonnes of fish per hectare of culture unit (Timmons et al., 2001) or 350 tonnes of Pangasius catfish per hectare. Fish and shrimp production in ponds requires several hundred times the land area compared with intensive recirculating systems. In addition to surface area devoted to culture of aquatic organisms, land surface area must be dedicated to support of production facilities. Pond aquaculture requires embankments, intake and discharge canals, settling basins, and pump stations. Aquaculture facilities have access roads, parking lots, storage areas, staging areas, space for administrative and service buildings, etc. Boyd (2010) estimated that with watershed catfish ponds in Alabama that the land used for support purposes typically is about 25% of pond water surface area. Watersheds normally have other uses, and although necessary for aquaculture, they are not dedicated specifically to aquaculture. In marine shrimp culture, canals are used to supply and discharge water at farms. Farms of 25 ha or more in size usually have support areas of about 25% of water surface areas, but the support area may increase to as much as 50% at smaller farms. Catfish pond facilities in Mississippi typically have only 10–15% of the total land area devoted to support, and the support area as a proportion of total land area decreases slightly as farm size increases (Keenum and Waldrop, 1988). For a farm with a total land area of 65 ha, 2% of the area is used for buildings, parking, feed storage, etc., 13% of the area is in embankments, and the water surface comprises 85% of the area. For a farm with a total area of 260 ha, the estimates are 1%, 11%, and 88%, respectively.
Table 29. Results of AquaClimate case study analysis for land use Case study culture system m2/tPolyculture pond culture, Vietnam 80,594Shrimp pond culture, India 14,095Pangasius pond culture, Vietnam 24.16Milkfish pond culture, Philippines 2,339
These results were benchmarked against other estimates of water resource use as follows; Table 30. Efficiencies of land use for aquaculture system. Adapted from Verdegem et al. (2006). System types Descriptions Production
(kg/ha/year) Efficiency of land use (m2/MT)
Extensive On-farm resources 100 - 500 20,000 - 100,000 Improved extensive polyculture (Vietnam)
Supplemental feeds, 120 80,594
Extensive On-farm resources, fertilizers 100 - 1000 10,000 - 100,000 Semi-intensive shrimp (India)
Supplemental feeds, 710 14,095
Semi-intensive Supplemental feeds, static 2,000 - 8,000 1,250 - 5,000 Extensive Milkfish (Philippines)
Supplemental feeds, 4,270 2,339
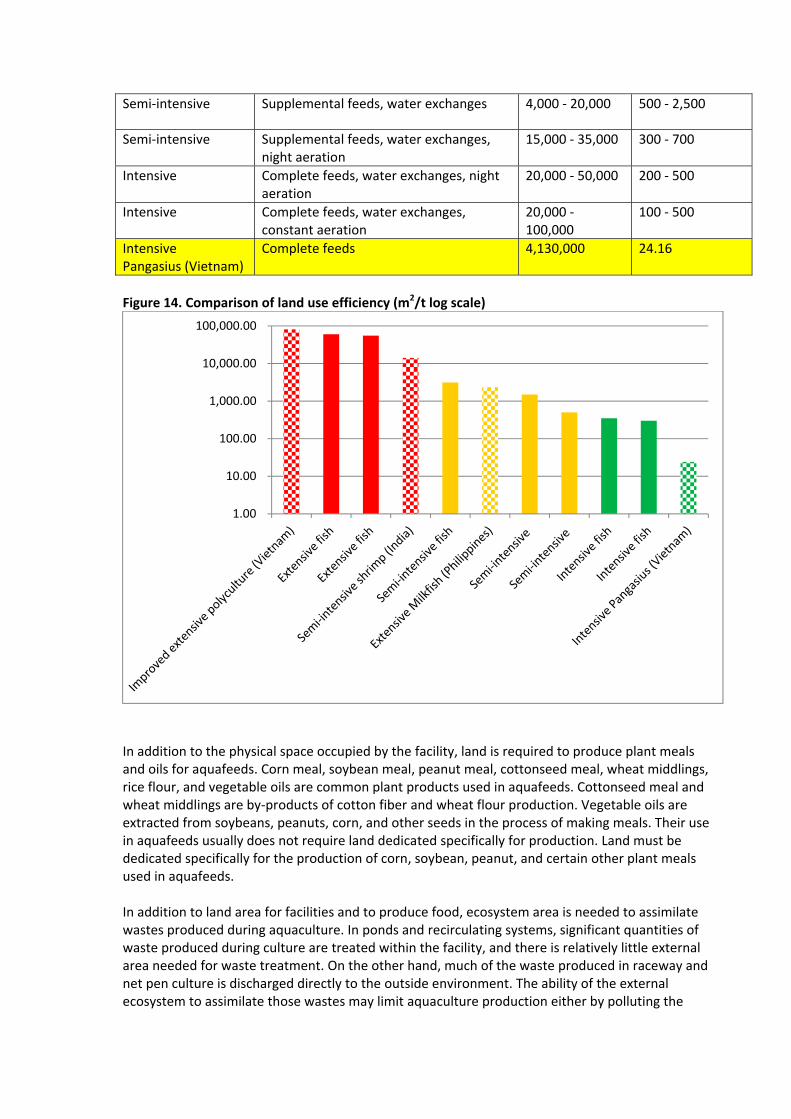
Semi-intensive Supplemental feeds, water exchanges 4,000 - 20,000 500 - 2,500
Semi-intensive Supplemental feeds, water exchanges, night aeration
15,000 - 35,000 300 - 700
Intensive Complete feeds, water exchanges, night aeration
20,000 - 50,000 200 - 500
Intensive Complete feeds, water exchanges, constant aeration
20,000 - 100,000
100 - 500
Intensive Pangasius (Vietnam)
Complete feeds 4,130,000 24.16
Figure 14. Comparison of land use efficiency (m2/t log scale)
In addition to the physical space occupied by the facility, land is required to produce plant meals and oils for aquafeeds. Corn meal, soybean meal, peanut meal, cottonseed meal, wheat middlings, rice flour, and vegetable oils are common plant products used in aquafeeds. Cottonseed meal and wheat middlings are by-products of cotton fiber and wheat flour production. Vegetable oils are extracted from soybeans, peanuts, corn, and other seeds in the process of making meals. Their use in aquafeeds usually does not require land dedicated specifically for production. Land must be dedicated specifically for the production of corn, soybean, peanut, and certain other plant meals used in aquafeeds. In addition to land area for facilities and to produce food, ecosystem area is needed to assimilate wastes produced during aquaculture. In ponds and recirculating systems, significant quantities of waste produced during culture are treated within the facility, and there is relatively little external area needed for waste treatment. On the other hand, much of the waste produced in raceway and net pen culture is discharged directly to the outside environment. The ability of the external ecosystem to assimilate those wastes may limit aquaculture production either by polluting the
1.00
10.00
100.00
1,000.00
10,000.00
100,000.00

surrounding water to the point where animal welfare inside the facility is endangered (“self-pollution”) or by imposing limits to the amount of waste that can be discharged due to regulatory constraints. In addition to effects on aquaculture production, waste discharge into public waters creates societal externalities such as degraded water quality, water treatment costs, and other downstream impacts. However in this study we do not estimate land requirement for feed ingredient production or effluent water treatment.
6.5 Energy use There are many uses of energy in aquaculture including energy used for construction of facilities, production of liming materials, fertilizers, production and transport of feed and feed ingredients, operation of machines and vehicles during culture and harvesting, processing, transportation, etc. However, only two of these energy inputs can be readily estimated at the farm level. These are energy uses for pumping water and for mechanical aeration, and, at the farm level, they are the major, direct energy inputs. This discussion will be limited to pumping and aeration, but studies of total energy use per tonne of aquacultural production should be conducted for a number of species and culture methods. Mechanical aerators powered by internal combustion engines or electric motors are used to supplement the natural supply of dissolved oxygen in grow-out systems. Aeration allows greater stocking and feeding rates to increase production. Aeration rates in pond aquaculture often are expressed in horsepower per hectare or horsepower applied per volume (Boyd and Tucker, 1998). In channel catfish farming, aeration usually is applied at 4 to 8 hp/ha, while in intensive marine shrimp culture, rates of 10 to 30 hp/ha may be applied. Use of electricity typically is measured in kilowatt·hours (kW·h), and 1 hp = 0.745 kW. However, there are inefficiencies in the use of electricity by machines, and for aerators, the typical efficiency is about 90% (Boyd, 1998). Thus, electricity use for aeration can be estimated as follows: Aeration energy, kW = Aerator power, hp × Aeration time, hr × 0.745 kW/hp
Production, t × 0.9 Aerators in channel catfish ponds in the southeastern United States normally are operated between May and September for about 10 h/night. Aeration at 6 hp/ha in a catfish pond will use 7,599 kW·h of electricity during a crop year or about 950 kW·h/t for production of 8,000 kg/ha. Production of marine shrimp in a pond with 15 hp aeration/ha might be 8,000 kg/ha for a 120-day crop. Aeration usually is supplied 24 h per day for at least 100 days, but only half of the aerators may be operated during the day. The total electrical use will be about 27,000 kW·h or 3,375 kW·h/t—over three times the amount of aeration used for channel catfish. In Asia, paddlewheel aerators often are driven by small, internal combustion engines powered by diesel fuel or gasoline. Energy use can be estimated from fuel consumption; 1 L diesel fuel is equal to 3.27 kW-h while 1 L of gasoline equates to 2.21 kW-h (Yoo and Boyd, 1994). The energy use for pumping water to supply ponds can be estimated as follows: P = γQH E
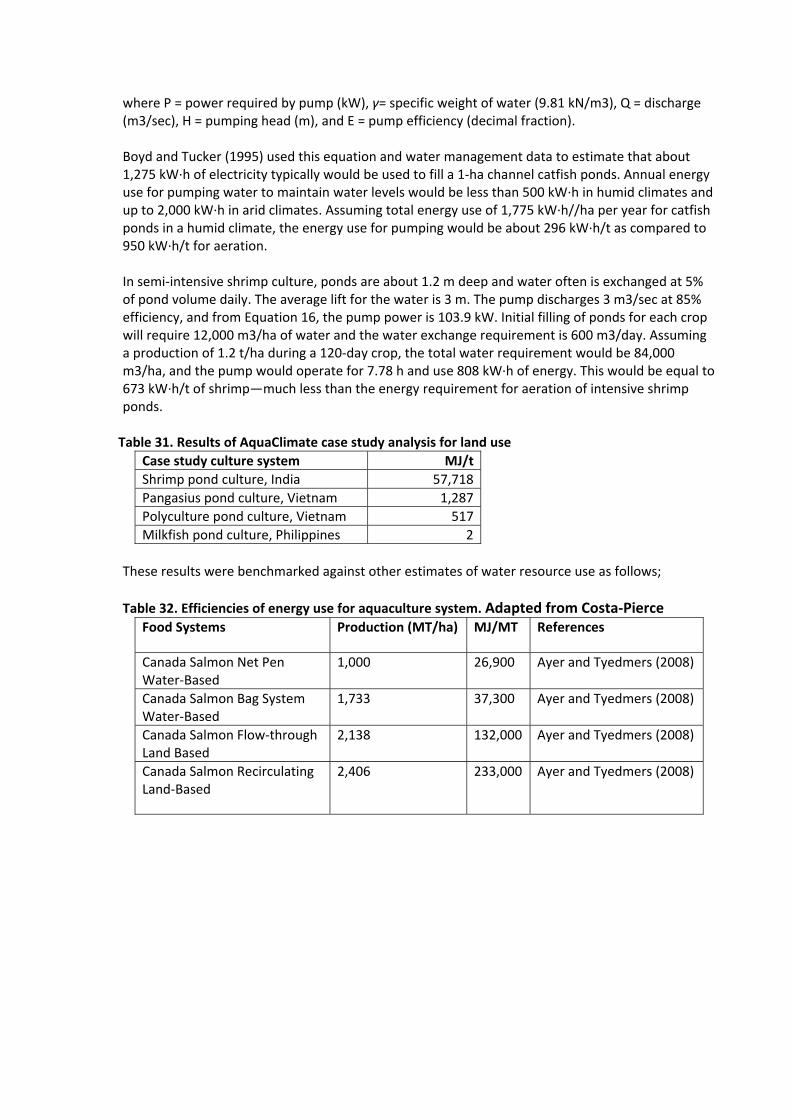
where P = power required by pump (kW), γ= specific weight of water (9.81 kN/m3), Q = discharge (m3/sec), H = pumping head (m), and E = pump efficiency (decimal fraction). Boyd and Tucker (1995) used this equation and water management data to estimate that about 1,275 kW·h of electricity typically would be used to fill a 1-ha channel catfish ponds. Annual energy use for pumping water to maintain water levels would be less than 500 kW·h in humid climates and up to 2,000 kW·h in arid climates. Assuming total energy use of 1,775 kW·h//ha per year for catfish ponds in a humid climate, the energy use for pumping would be about 296 kW·h/t as compared to 950 kW·h/t for aeration. In semi-intensive shrimp culture, ponds are about 1.2 m deep and water often is exchanged at 5% of pond volume daily. The average lift for the water is 3 m. The pump discharges 3 m3/sec at 85% efficiency, and from Equation 16, the pump power is 103.9 kW. Initial filling of ponds for each crop will require 12,000 m3/ha of water and the water exchange requirement is 600 m3/day. Assuming a production of 1.2 t/ha during a 120-day crop, the total water requirement would be 84,000 m3/ha, and the pump would operate for 7.78 h and use 808 kW·h of energy. This would be equal to 673 kW·h/t of shrimp—much less than the energy requirement for aeration of intensive shrimp ponds.
Table 31. Results of AquaClimate case study analysis for land use Case study culture system MJ/tShrimp pond culture, India 57,718Pangasius pond culture, Vietnam 1,287Polyculture pond culture, Vietnam 517Milkfish pond culture, Philippines 2
These results were benchmarked against other estimates of water resource use as follows; Table 32. Efficiencies of energy use for aquaculture system. Adapted from Costa-Pierce
Food Systems Production (MT/ha) MJ/MT References
Canada Salmon Net Pen Water-Based
1,000 26,900 Ayer and Tyedmers (2008)
Canada Salmon Bag System Water-Based
1,733 37,300 Ayer and Tyedmers (2008)
Canada Salmon Flow-through Land Based
2,138 132,000 Ayer and Tyedmers (2008)
Canada Salmon Recirculating Land-Based
2,406 233,000 Ayer and Tyedmers (2008)
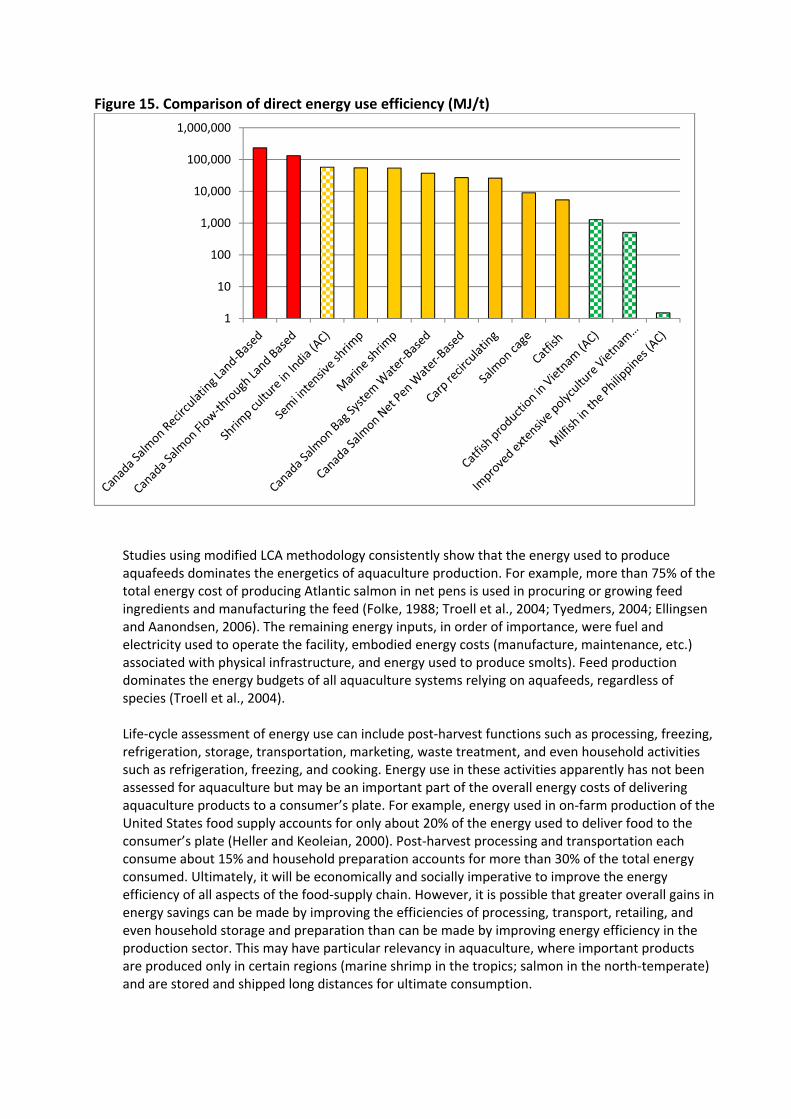
Figure 15. Comparison of direct energy use efficiency (MJ/t)
Studies using modified LCA methodology consistently show that the energy used to produce aquafeeds dominates the energetics of aquaculture production. For example, more than 75% of the total energy cost of producing Atlantic salmon in net pens is used in procuring or growing feed ingredients and manufacturing the feed (Folke, 1988; Troell et al., 2004; Tyedmers, 2004; Ellingsen and Aanondsen, 2006). The remaining energy inputs, in order of importance, were fuel and electricity used to operate the facility, embodied energy costs (manufacture, maintenance, etc.) associated with physical infrastructure, and energy used to produce smolts). Feed production dominates the energy budgets of all aquaculture systems relying on aquafeeds, regardless of species (Troell et al., 2004). Life-cycle assessment of energy use can include post-harvest functions such as processing, freezing, refrigeration, storage, transportation, marketing, waste treatment, and even household activities such as refrigeration, freezing, and cooking. Energy use in these activities apparently has not been assessed for aquaculture but may be an important part of the overall energy costs of delivering aquaculture products to a consumer’s plate. For example, energy used in on-farm production of the United States food supply accounts for only about 20% of the energy used to deliver food to the consumer’s plate (Heller and Keoleian, 2000). Post-harvest processing and transportation each consume about 15% and household preparation accounts for more than 30% of the total energy consumed. Ultimately, it will be economically and socially imperative to improve the energy efficiency of all aspects of the food-supply chain. However, it is possible that greater overall gains in energy savings can be made by improving the efficiencies of processing, transport, retailing, and even household storage and preparation than can be made by improving energy efficiency in the production sector. This may have particular relevancy in aquaculture, where important products are produced only in certain regions (marine shrimp in the tropics; salmon in the north-temperate) and are stored and shipped long distances for ultimate consumption.
1
10
100
1,000
10,000
100,000
1,000,000
Energy comparisons between systems have become part of more detailed analyses of life cycles (Papatryphon et al., 2004; Ayer and Tyedmers, 2008). Comparisons of these with terrestrial farming show clearly the huge production benefits of intensive aquaculture albeit at a much higher energy cost, contained mostly in feed (Ayer and Tyedmers, 2008). Over the coming decades, increasing global energy, processing, shipping/transportation costs of both products and feeds are predicted (FAO, 2008; Tacon and Metian, 2008). In this study, we only consider the use of energy on the farm.
7. Recommended adaptation measures for future predicted Climate Change Following the first stakeholders workshop where the present adaptation measures by farmers to perceived Climate changes already taking place were documented, a second stake holder workshop was held to develop potential adaptation measures to future predicted climate changes in 2020 and 2050. The future adaptation measures are summarised below. Adaptation to climate change by small-scale milkfish pond farmers. Milkfish pond farmers are highly vulnerable to climate change, as production is highly influences by the weather. They are affected by changes in the normal weather plans. They are located on low lying land close to river estuary and the coast and susceptible to flooding and sea level rise. They are prone to extreme events such as heavy rains, strong winds and changing climate conditions such as increased temperatures and changing precipitation patterns. They are not only losing yields due to these climatic impacts but it is also affecting the quality of their produce. As farmers, they have developed mechanisms to cope with small changes in the weather patterns but they are not prepared for quick changes in seasonality or extreme events which can hit farmers hard, leading to crops not giving the expected output, reducing productivity and thus family income. Farmers are furthermore vulnerable to environmental and economic risks due to the lack of money and capacity to adapt.
7.1 Farmer Adaptation measures Building farmer resilience The farmer can implement a wide range of adaptation measures on the farm ranging from purchase and use of technology, changes in pond design to changes in production methodology and timing. However, small scale farmers do not have the financial resources to undertake many of the potential adaptation measures and with present market prices for milkfish, they are barely breaking even. Therefore it is important to assist the farmers now to become more profitable so that they can cope with the stronger and more unpredictable weather conditions and afford make the recommended adaption measures. Improving profitability Profitability can only be increased by a reduction in operating costs, increase in productivity or an increase in market price of milkfish or raising higher value species. Already the farmers have reduced their inputs by not fertilising with organic manure which has also led to reduced productivity. Productivity can be increased by direct feeding of the fish but this also increases operational cost.
Stable market prices can be achieved by encouraging processors to locate close by and for the farmers to agree yearly contract price to supply the processors. Higher prices can be achieved by reducing the number of fish trader transactions between the farmer and the retail outlet. Higher value species could be farmed such as Asian seabass or mangrove snapper but these species need high quality feed and have a long growth period increasing the risk to the farmer. There needs to be a systematic techno-economic study undertaken to analyse the most cost effective solution for the farmers to improve their profitability Resist climate change or accept climate change? The farmer needs to make a decision to resist climate change or to accept climate change and find ways to live with the consequences. For example, increased peak rainfall together with increasing sea level rise is leading to increased frequency and higher floods. To resist this impact the farmer can resist flooding by strengthening and increasing the height of the perimeter dikes. To live with flooding, the farmer can purchase nets that are deployed on the top of the dykes so that when a flood occurs, the fish remain in the ponds. Farmer adaptation measures for future predicted Climate Change – Priority measures The second stakeholder meeting identified potential future adaptation measures and these were then prioritised by the farmers. The priority adaptation measures identified for farmers were as follows • Strengthening (heighten and widen) perimeter dykes • Install wave breakers (limestone rip rap) on coastal dykes (sea side) • Improve pond water fertilisation techniques • Purchase of support equipment Farmer adaptation priority 1: Strengthening perimeter dykes. It is predicted that sea level rise will be at least 16 cm by 2050 which will lead to higher tides and make the coast more prone to storm surge. In addition it is predicted that peak rainfall will increase by 20% leading to increased incidence and height of flooding. The dykes need heightened and strengthening in order to prevent fish escape during intense rainfall and during storm surge, flood or extreme tide to prevent damage during storm, very strong winds, typhoons to cope with rising Sea Level and tides would also increase pond perimeter depth (adaptation measure for cold and hot spells). Higher dikes together with sea level rise will allow deeper water depth and this would allow farmers to move to the plankton method of milkfish production which was mentioned bt farmers in Barotac Nuevo. There is a need to increase the height of the dike by 0.5 strengthen the dike by increasing the width of main perimeter dykes (towards pond). The estimated cost for this is around PhP 1,000 per m length. For this to be implemented there need to be loans or preferably incentives made available for the farmers. Farmer adaptation priority 2: Install wave breakers
Install wave breakers (limestone rip rap) on coastal dykes (sea side) to reduce wave action on perimeter dykes, to encourage siltation between rip rap and perimeter dyke and allow natural development of mangroves. This would; • Reduce erosion of perimeter dyke during increased frequency and intensity of storms • Encourage mangrove fringe/buffer on coastal perimeter dykes • Reduce impact of storm surge There is a need for research on engineering design (for example height/width, distance from shore, life span). The farmer could share costs but also need incentives from Department of Public Works and Highways to encourage wave breaker installation. DENR legislation on coastal green belt could encourage comprehensive wave breaker installation. BFAR enforcement of mangrove buffer ordinance could encourage comprehensive wave breaker installation. SEAFDEC to investigate the potential for funding of mangroves through the REDD + program. However, allowing natural development of mangroves in spaces to be created by putting up wavebreakers in front of the dikes maybe too slow. Furthermore many if not most of the fishponds may have exceeded their limits by encroaching into the subtidal foreshore area. It could be more advisable to enforce the buffer zone by sacrificing the outermost pond by partially breach the outer perimeter dike to allow for free tidal flow so that the original perimeter dike will become the wave breaker. Then the space between the original dike and the new dike will become the mangrove zone. Farmer adaptation priority 3: Improve pond water fertilisation techniques Improve pond water fertilisation techniques using organic and inorganic fertilisation (organic fertiliser but needs maturation period before stocking). This can be undertaken by the farmer but there is a need for research to be undertaken on optimal fertilisation rate and N:P ratio to encourage chlorophyte productivity (suggested institutions UPV, SEAFDEC or BFAR Achlan) with the research funded by a Donor or NGO. Improving pond fertilization techniques is always advisable but this should also be done in deep water ponds for plankton culture not just for lablab culture. Furthermore the new technique should focus on proper N:P ratio rather than merely blind fertilization. The CRSP project already has devised a method for freshwater fishponds which enables farmers to determine the deficiency using simple bioassay techniques that does not require laboratory analysis. Test the efficacy of probiotics to improve water quality stability during fluctuating climate conditions. Farmer adaptation priority 4: Purchase of equipment The use of pumps may become necessary in deep water ponds for proper water management since the tidal levels may no longer be sufficient to maintain the desired depth whenever needed. Due to the high cost of fuel and energy it will be ideal to develop cost effective wind operated pumps for this purpose. Purchase of Equipment; Purchase and use of water pumps for pumping water into ponds to • increase pond depth and increase water exchange (mitigate water temperature fluctuations), • maintain water depth during low tides, • maintain water temperature during cold spells and • maintain oxygen levels during hot spells.
Purchase and use of aerators to; • Increase water mixing for better productivity • Increase oxygenation during hot spells • Increase oxygenation during the night There is a need to develop a loan facility mechanism for the purchase of equipment (suggested institution LandBank) with a repayment window of one crop duration and a Government guarantee on bank collateral needs. Additional support for adaptation measures. The farmer can adapt to small changes in weather patterns and short term gradual climate change but they are not prepared for rapid changes or long term continuous climate change. The farmer needs to be assisted by Scientific research and technology development to find solutions that will allow them to adapt to the predicted future climate changes.
7.2 Science and technology Technical adaptation measures The role of science and technology Scientific research and technology development can play a strong role to support farmers in developing new adaptation measures to predicted future climate change as well as developing standardised methodology for assessing socio-economic vulnerability of communities and culture systems and developing adaptation measures. Recommended Science and Technology Adaptation Measures for future predicted Climate Change – Priority measures Science Research Priority 1 - Enhancement of pond productivity It is predicted that pond productivity will be affected by high water temperatures, high water temperature fluctuations, rapidly changing water quality due to heavy rainfall, etc. There has already been research on this topic especially when it comes to lablab production, however there is need to review all such studies. The research should be oriented towards plankton culture in deep water ponds. The snail is a big problem in shallow ponds that are lablab based and may become moot and academic if deep water is employed. The use of ammonium sulphate and lime has been demonstrated to be an effective method (see study made by Norfolk (ca 1979 ?) in SEAFDEC AQO Leganes fishponds. To address this, there needs to be research on the following; • Pond preparation (rains during dry season February to May) disrupts the normal pond drying
(to eliminate predators, snails and encourage pond soil oxidation, acidity reduction and productivity)
• Biological pond snail eradication – test polyculture milkfish and mud crab – determine optimal mud crab stocking density and identify seed supply
• Determine correct levels of fertilisation to encourage lab lab growth and plankton growth especially during cold season. Investigate incubator ponds (kitchen ponds) to incubate lab lab, algae and plankton for inoculation release to the grow-out ponds. Determine proportion of inoculation pond to grow-out pond.
• Determine plankton succession and species dominance for ponds that will have predicted 0.75’C (2020 ) and 1.5’C (2050) increase in temperature
Need concept research proposals written and submitted to SEAFDEC, UPV, BFAR and submitted to donors for funding. Could take up to 3 years to get results Science Research priority 2 – Selective breeding It is predicted that pond water temperatures will be even higher and that water quality and environment will fluctuate more widely. The milkfish as it is already a very highly tolerant fish capable of surviving and growing from freshwater to hyper saline waters. So far also it seems to be resistant to most of the diseases affecting either fresh or salt water fish. It is not known if Milkfish will be able to tolerate this poorer pond environment. Any genetic research on milkfish will need to be highly focused on some desired trait. Research
• Reproductive performance at higher water temperatures (ΔT 0.75’C (2020) and 1.5’C (2050)
• Upper temperature tolerance level of Milkfish for effective productivity o SEAFEDC already studying egg hatching and larval survival at higher temperatures
• Need similar research program for juvenile and grow out • Genetic variability and growth performance, temperature tolerance upper and
fluctuating) between Taiwan, Indonesian and Philippine strains of Milkfish o UPMSI have some background data on Philippine strain already
• Research can also be focused on faster growth or better feed conversion to give the farmer better profitability and so be more resilient.
Research Priority 3 – Lessons learned Research Pagasa records for coldest years and hottest years and check against production data, market data, fish catch data and look for any correlation with productivity reduction with high rainfall or hot weather. Need to
o Undertake desk study o Collect and analyse the data
This would take around one year to undertake Science Research priority 4 – Research mangrove planting program There have been instances of mangrove reafforestation of river banks and coastal areas but with unsuitable mangrove species leading to high mortality of trees. Therefore there is a need to research to identify the correct zone for planting to give coastal protection and the correct species to plant.
o Undertake GIS analysis of storm surge vulnerability o Bathymetry and topography slope analysis o Fetch and wind /wave analysis o Identify most suitable areas for mangrove planting
The Barotac Nuevo farmers also mentioned mangrove reforestation along river banks. Actually mangrove reforestation should not be limited to riverbanks. Most if not all of the fishponds followed the prescribed 50 m buffer zone along the coastal zone and along riverbanks as per Section 13 of FAO 197 (Series of 2000). The survey should have tried to determine how many of
the fishponds actually adhered to the existing regulation on buffer zone. A wide belt of mangroves along the coast will effectively protect the perimeter dike against storm surges. BFAR Region 6 needs to request BFAR Central Office to instruct NIFTDC to undertake this research Research suitable mangroves species to be planted in different areas (This is already known for some areas). Science Research priority 5 – Strengthening fish disease surveillance and pest control Rapid changes in water quality parameters and consistently high water temperatures leads to a higher incidence of disease. Therefore SEAFDEC should arrange regular monitoring of fish disease outbreak and provide recommendations on treatment to the farmers. BFAR should do the same for the rest of the country under the national Bangus program. Science Research priority 6 – Climate change Training and awareness materials There is a lack of awareness and understanding on climate change by farmers particularly of predicted future climate change and potential adaptation measures. Therefore BFAR and SEAFDEC should collect science based resource materials from KLIMA, Pagasa, NAMRIA and elsewhere and then should prepare training materials on present and future predicted climate change, potential adaptation and mitigation measures for aquaculture. 3 different categories of training materials should be developed
• Fisheries school level • Farmer field school and regional fishermen training Center • Local, Regional and Central decision makers and implementers
SEFDEC should then arrange a series of Training of Trainer courses from
• Climate change field schools • DA Agricultural training (livestock) • Regional Fishermen Training Centres • SEAFDEC • NIFTDC • NFRDI • And others
As climate science research and lessons learned from adaptation measures developed elsewhere is developing rapidly, the resource materials and training materials should be updated regularly (at least yearly). This could be undertaken between 1 and 3 years.
7.3 Policy and institutional adaptation measures The following adaptation measures were identified during the Stakeholder Panel workshops in Iloilo, where representatives from fish farmer organizations, government agencies (BFAR, DENR), local governments (provincial and municipal levels), universities and research institutions participated. 1. To make the Provincial Disaster Risk Reduction Management Council (PDRRM) responsible for
implementation of climate adaptation measures. PDRRM is a multi-sectoral council with a legal mandate headed by the Governor as the chairperson. Hence it has the necessary legal and political mandate for coordination at the provincial and barangay level and also gets funding from the IRA.
2. To strengthen coastal defense system against storm surge and sea level rise by hazard mapping, mangrove planting, coral transplantation, and preparation of management and land-use plans. - Storm surge hazard mapping to be done by NAMRIA following a request from the LGU.
This mapping should be done in 3-5 years covering the whole Panya Island and identify the coastlines that are most vulnerable and at high risk. Geo-hazard maps from DENR can be used for this purpose.
- Mangrove belt as a protective barrier has a big potential to act as a natural barrier against storm surge. The benefits of mangrove belts were already seen in areas where they were established. Below are the proposed activities to be undertaken by different institutions:
DENR - To plan and coordinate mangrove replanting schemes (2-5 years) together with relevant
agencies. Lead agency from DENR should be the Coastal and Marine Management Office (CMMO).
- To continue the on-going initiatives on monitoring the status of mangroves using satellite imagery and GIS in collaboration with NAMRIA.
- To draft and issue a legislation on the establishment of a mangrove belt within 5 years. - To encourage LGUs to prepare a forest land use plan (FLUPs). - To be responsible for getting funding support.
BFAR - To be the lead agency that will be responsible in identifying abandoned FLAs. Conversion of
these abandoned FLAs into mangrove areas should be done in collaboration with the DENR, with assistance from an NGO. It will take 3 to 5 years to start up the process.
- On-going enforcement of a buffer zone among FLA areas that are designated for mangrove replanting; Review the existing policy on 50-m buffer zone designated as mangrove areas.
- To be responsible for providing the incentives. - LGU in conjunction with local NAMRIA should be responsible for monitoring the mangrove
replanting activities and send feedback to central government. - Coral reefs as protective barrier following the experiences from initiatives in other
municipalities wherein transplanting of corals is being taken up to repopulate barren areas, and serve as a protective barrier against tidal surge. However, there is a need to draft a policy covering issues on how to do it, where to place it, etc. to prevent the misuse and mishandling of corals. The policy should also address the protection of other vital ecosystems such as mangroves and seagrasses. The Fisheries Code (Republic Act 8550) specifies policies on protection and proper management of these systems.
- Preparation of management and land-use plan - A Joint Administrative Order Series 1, 2008 prepared by DILG, DENR and BFAR was issued to follow up the cancellation of fishpond leases that were abandoned and to be reverted into mangrove areas. In connection with this, the LGUs from 6 municipalities are tasked to prepare a comprehensive coastal management plan. Mangrove rehabilitation and concept of mangrove belts can be integrated in the management plan.
3. Better forecasting and early warning systems to overcome and/or minimize climate change
impacts is by being prepared. Preparedness coupled with appropriate measures are based on correct forecasting and early warning systems received by the farmers. Although weather forecasting is already in place, there is a need to improve the early warning system for the whole country. In order to improve the forecasting, the following measures were suggested by the stakeholders:

o Detailed regional studies on predicted climate changes should be done to improve forecasting by PAGASA and other scientific agencies and disseminate this information.
o Investment on forecasting equipment is necessary for better predictions (temperature, precipitation, storms and typhoons). These initiatives are already in place, but should be prioritized.
o Capacity building of the Philippine Atmospheric, Geophysical and Astronomical Services Administration (PAGASA), the government agency mandated to provide weather, flood, climate and astronomical products and services.
o Collaboration between PAGASA and LGU on info dissemination- The PAGASA should tie up with LGU in improving the early warning systems for unexpected weather and extreme events. In this way, dissemination of information and preparedness will be faster. Dissemination can be made through radio stations, texting, etc. This is an on-going initiative and should be in place within 3 years.
Currently, in Iloilo Province, the Agromet station located at the Climate field school gives daily, 3-day, and 5-day forecasting to the Office of the Mayor, Municapal Agricultural Office and Disaster Risk Reduction Management (DRRM) in Dumangas. This information is then sent to the barangay captains and the results to be posted in the barangay hall where the farmers can visit and see). 4. Training of trainers for climate change adaptation strategies - Training of technicians/trainers on climate change adaptation strategies. 5 day training
modules can include climate scenarios development, management, impacts, etc. Funding support should be sought from the Department of Agriculture.
- Training of caretakers and operators on climate change adaptation strategies. The 16 weeks course content should also include the training contents given Training of trainers.
- Capacity-building of Climate Field School Technicians - The Climate Field School is becoming popular, not only in the Philippines but in other countries and gets visitors from Indonesia, Pakistan, Cambodia and China. The local government in Iloilo sees the need to strengthen the capacity of the Climate Field School and train more people to be able to replicate these initiatives.
5. Flood Reduction Measures to be done through various measures suggested as follows. - Upland reforestation to reduce the run-off into the river system. Initial activities in
Dumangas and Barotac Nuevo that were conducted include the identification of denuded areas based on the land use maps that will be included in the National Greening Program of DENR. This program should instigate a tree planting program of agroforestry, using native and indigenous species, provide planting materials and technical assistance. This action should be coordinated with private-public partnership agreements, NGOs and volunteer community action for a collaborative greening and maintenance program.
- Ecosystem approach watershed management - Integrated Coastal Response Management Plan ("Ridge to Reef") is being implemented in the region at present. The LGUs should facilitate the inclusion of flood reduction measures during the planning of watershed and related marine waters.
- Ordinance on clearing of river and its tributaries – The LGU should develop ordinances regarding the clearing of rivers and estuary waterways. In terms of fish pens and nets, this should be done in conjunction with the BFAR. The implementation is seen to take effect in full within 3 to 5 years.
- Strengthen river banks against flooding - There were already previous construction of bridges along the rivers to avoid floodings, however, some more work is needed to solve the problem. The LGU should send a request to NAMRIA and the Department of Public Works
and Highways (DPWH) to undertake a study identifying flooding risks, using vulnerable sectors and predicted future climate change as a basis. A 3-10 year action plan should be incorporated based on the results of the study. The LGU should request the DPWH to strengthen the priority areas that were identified.
6. Calamity funding and insurance - Farmers need some buffer to overcome losses brought about
by flooding, storms, tidal surge, and other climate changes. Most of the small-scale farmers don't have enough disposable funds to invest on measures that will protect them from the impacts of these climate changes. There are three ways to address this. One is through the Department of Budget and Management (DBM) and National Disaster Risk Reduction and Management Council (NDRRMC), secondly through the Philippine Crop Insurance Corporation and lastly the LGUs. - Calamity Fund Compensation Scheme- In the first scheme, the Department of Agriculture
should request the DBM and NDRRMC to include fish farms under the calamity compensation scheme. The calamity funds should cover the relief, rehabilitation, reconstruction and other work or services. There is a need to investigate calamity insurance specific for climate change extreme events. Both strategies need 1 to 3 years to be implemented.
- National government Payment Scheme - The Philippine Crop Insurance Corporation (PCIC) is a government institution mandated to offer insurance to fish farmers against losses from unharnessed stocks in fish farms incurred by natural calamities and fortuitous events. The access for the insurance is voluntary, hence all farmers engaged in aquaculture are not automatically covered. Awareness amongst the farmers of the need to have this insurance should be created so they will be willing to invest on it.
- Local Government Payment Scheme- Lastly, the local government unit can allocate funds that will shoulder the insurance premium payments in behalf of the farmers. Farmers should pay back after the harvest season. In case farmers will not be able to pay due to losses incurred by the natural calamities, the insurance will compensate and cover repayment to LGUs. This strategy is already being practiced at agricultural sector in the Iloilo province. It can be adapted and replicated at the aquaculture sector.
7. Allocation of funds for "climate smart" research and technology - Research and technology have
a major role to play in looking for measures that the farmers and institutions can adapt to prepare them and minimize the effects of climate change. One area of research can be focused on adaptation measures that are considered "climate smart". Funding for these kind of studies can be accessed from the Department of Science and Technology (DOST) and Department of Agriculture (DA). It may take 3 years to initiate the program before it will be fully implemented.
8. Provide soft loans to farmers to fund "no regrets" adaptation measures - One way of addressing
this is through the Department of Agriculture, in conjunction with the Development Bank of the Philippines (DBP), Landbank of the Philippines (LBP) and other banks can create a scheme wherein soft loans will be available to small-scale farmers for the purpose of funding "no regrets" adaptation measures. No regrets adaptation measures refer to measures that can still be beneficial regardless the impacts from future climate changes will be realized or not. Repayments can be done through one production season window. It is seen that it will take around 3 to 5 years for this strategy to be fully implemented.
9. Inventory of Fishpond Lease Agreement- a country-wide inventory was proposed to be done.
Although BFAR has the mandate to do the job, the LGU can also help to hasten the process. However, logistics should be in place so that LGUs can execute the work. A policy ensuring the tenure of the staff that will be hired is needed, as not all LGUs have enough manpower to do the job.
10. Women's participation as an adaptation measure - Women have a vital role to play in
aquaculture. They are mostly involved in the management of finances and are responsible in some management decisions, concerning aquaculture production and post-harvest activities. Although their participation is already seen, it is recommended that their role should be increased, especially in areas of climate change adaptation. Some of the initiatives that were undertaken by the Provincial Government is the implementation of "Great Women", program, wherein it is required that in all trainings undertaken by the different departments, participation of women should be highlighted. Another area where women’s involvement was seen was on mangrove rehabilitation. The Zoological Society of London, an NGO working on mangroves, involved women to monitor and plant mangroves
• Need to increase awareness • Need to build capacity • Need for ecosystem based approach measures • Need for ‘no regrets’ measures • Need for ‘climate smart’ planning • Need to widen to other geographical area, other culture systems • Need for action now (lead in times)
8. Conclusions There are a number of strategies to increase farmer’s resilience to climate change including;
• Applying sustainable aquaculture practices; • Diversifying farmers’ income and food production reduces their dependence on
monocultures and spreads the risk of yield and income loss; • Diversification more resistant species that can tolerate the predicted future climate change; • Increasing the efficient use of natural resources such as water, feed, and energy increases
farmers’ productivity in the long run and in a sustainable way; • Building farmers’ capacity through providing access to information and knowledge
empowers them to take appropriate action and make informed decisions; • Building partnerships between different public and private actors helps farmers to benefit
from improved framework conditions to cope with climate change. However farmers cannot act alone and should be assisted by potential adaptation measures developed through science and technology and through measures implemented by local and central government institutions. Resiliency is the capacity to adapt to shocks, disturbances, and changing situations without collapsing. The secrets to strengthening resiliency and adapting to climate change lie in developing climate smart practices such as building soil and water fertility, conserving and efficient water exchange, practising good production methods and practices. These practices represent a blend of old and new - the best traditional practices modified by modern scientific research and new technology. There are a number of different forms of technology, “hard” technology such as new pumps for water exchange or use of tolerant strains, or “soft” technologies such as insurance schemes or crop rotation patterns or they could use a combination of hard and soft, as with early warning systems
that combine hard measuring devices with soft knowledge and skills that can raise awareness and stimulate appropriate action. The new adaptation technologies will need to be cost effective, environmentally sustainable, culturally compatible and socially acceptable. The technologies will also need to be implemented which will require widespread technology transfer supported by effective institutions, formal and informal. Even if new technologies are devised, and are suitable for local conditions, it can be difficult for the poorer farmers to adopt them. With small farm sizes and limited access to credit, they may have neither the ability nor the inclination to invest in new technology. Some adaptation measures are likely to be capital intensive and need to undertaken on the wider scale involving a number of municipalities such as flood prevention from rivers or storm surge in low lying coastal areas. This could be in the form of
– Hard structures – dykes, sea-walls, breakwaters – Soft structures – mangrove or wetland restoration or creation
In this case, action for adaptation can involve many organizations or institutions, but in practice the responsibility tends to fall on the public sector for which governments have prime responsibility. There are also opportunities for non-governmental organizations. In addition to raising public awareness, they can act as intermediaries – identifying technologies, facilitating investment and providing management, technical and other assistance. National action can be complemented with capacity or the resources for many forms of adaptation, and have to rely on overseas development assistance. So far donors have been more supportive of mitigation, though nowadays as they come to appreciate its importance they are allocating more funds to adaptation. Whatever the envisaged adaptation measures, it is clear that the Philippines now needs to devise national strategies for adaptation and identify the most vulnerable aquaculture systems and plan appropriately. This is becoming increasingly urgent since the quality of today’s decision-making on aquaculture development will soon be tested against future variations in climate. The scientific predictions may not yet provide the level of precision desired by many planners, but they portray with certainty a rapidly warming world with consequences that for most sectors are largely negative. A new climate is on the way and adaptation is not a choice, it is a necessity.
9. Recommendations While milkfish production in the country became popular in the past 5 decades, it was totally dependent on wild fry and natural food and thus the sustainability of the industry is threatened. With the present change in climate, it is evident that the production must shift from extensive to an more intensive system where formulated feeds are needed to grow milkfish in higher stocking densities. The shift also brought about a change in the nutrition of milkfish from dependency in natural food to artificial diet. It is timely for the country to have developed the marine cage culture and prepared the inputs required for an intensive system. Milkfish has joined other species cultured in cages and boosted the country's milkfish production to levels far exceeding those in last 40 years and meeting the country's food security.
The thrust of the government through the Bureau of Fisheries and Aquatic Resources for an alternative use of coastal resources formulated the mariculture parks similar to that of industrial parks. The marine cage culture is an integral part of mariculture parks. As such, there is a great regulation of marine cages to be installed in mariculture parks preventing environmental degradation and fish kills. This further led to an increase in milkfish production in the world. Not only was milkfish production increased, but the employment opportunities of villagers and fisherfolks were increased. Diversification opportunities for milkfish pond farmers Pond production of juveniles. The marine cage culture, however, requires pond-reared fingerlings that are healthy, strong and able to withstand waves and currents. This is the important role that ponds, especially those purely supplied by marine waters, play. It is well known that fry grows effectively to fingerlings in ponds rather than in tanks or cages. A break in the supply chain of fry to fingerlings can lead to at least 6 months of production disruption as has been observed in several mariculture parks in the country as an aftermath to typhoons and even heavy rains. The marine cage culture of milkfish can be assured of fingerling supply through nursery production of fry from ponds. While the country previously had fry banks to cope with the shortage of fry, these fingerling banks will also aim to prevent the shortage of fingerlings for cage culture. Milkfish Breeding in Marine Ponds. The radical leap in milkfish production in the country can be traced to 3 factors: year-round supply of fry, intensive cage aquaculture and value-added products. While milkfish breeding are commonly done in tanks and cages, marine ponds offer higher egg production. Thus, the marine ponds must be utilized for milkfish spawning. Even, large-scale fry production must also be done in marine ponds for its algal culture, rotifer production, and larval rearing.
References Agbayani, Renato F., Dan D. Baliao, Nilo M. Franco, Romulo B. Ticar and Nicolas G. Guanzon. 1989. An economic analysis of the modular pond system of milkfish production in the Philipines. Aquaculture. 83(1989):249-259.
FAO. 2009. Cultured Aquatic Species – Milkfish (Chanos Chanos) See the FAO Cultured Aquatic Species Information program. 2009.
Lee, C. S., P. S. Leung and M. S. Su. 1997. Bioeconomic evaluation of different fry production for milkfish (Chanos chanos). Aquaculture. 155(1997):367-376.
Otubusin, S.O. and Lim, C., 1985. The effect of duration of feeding on survival, growth and production of milkfish, Chanos chanos (Forskal), in brackishwater ponds in The Philippines. Aquaculture. 46(1985): 287-292.
Santiago, C.B., Pantastico, J.B., Baldia, S.F. and Reyes, O.S., 1989. Milkfish (Chanos chanos) fingerling production in freshwater ponds with the use of natural and artificial feeds. Aquaculture, 77(1989): 307-318.
Smith, I.R., Cas, F.C., Gibe, B.P. and Romillo, L.M., 1978. Preliminary analysis of the performance of the fry industry of the milkfish (Chanos chanos Forskal) in the Philippines. Aquaculture. 14(1978): 199 --219.
Annex 1 – Generic project methodology used 1. Project preparation 1.1 Climate Change model and scenario selection
The ability of the model to simulate the present climate conditions is an important consideration taken into account in the selection of GCM to be used in this study. The performance of individual GCMs may differ for individual climate variables as well as for different regions of the world. Typically, GCMs are validated for their ability to reproduce spatial patterns of selected variables and their annual cycles. GCMs are run by a number of research centres. Some differences exist among the models, which result in various climate sensitivities in a range. However, selecting appropriate models is difficult especially when many models are available with different projection results.
WORLDCLIM data set was chosen in favor of the data from the IPCC Distribution center because of the higher resolution data set available in WORLDCLIM that can be readily applied for impact studies. WORLDCLIM provides a number of outputs that have been downscaled from Global Circulation Models at no cost and the database has 400 times higher spatial resolution than previously available surfaces (New et al., 2002). Data is based on interpolated climate surfaces for global land areas in four different spatial resolutions; 30 seconds (about 0.86 km2 at the equator), 2.5 minutes, 5 minutes, and 10 minutes (about 344 km2 at the equator) and can easily be exported to GIS.
Emissions scenarios represent how greenhouse gas (carbon dioxide, methane, nitrous oxide) emissions, and thus the accumulation of greenhouse gases in the atmosphere, might unfold over the next century. The IPCC has developed a suite of emissions scenarios that are widely used to generate climate projections from GCMs. These are reported in the IPCC Special Report on Emissions Scenarios (SRES). The SRES emissions scenarios are based upon the many factors that will determine the future level of GHGs in the atmosphere: population growth, economic development, technological innovation, energy consumption, land-use, agricultural development, and environmental policy.
Scenarios are often based on a combination of expert judgement, extrapolation of trends, international comparisons, and model runs. Historical developments are a good guide for future developments. The scenarios are based on a set of four narrative story lines labelled A1, A2, B1 and B2. The storylines combine two sets of divergent tendencies: one set varies its emphasis between strong economic development and strong environmental protection; the other set between increasing globalization and increasing regionalization. The storylines can be briefly described as in the table below:
Summary of Emission Scenarios

A1 A2 B1 B2
Economic growth Very rapid. Converging.
Regionally based. Fragmented and slow
Converging. Service and information economy
Intermediate economic growth.
local solutions
Population growth
Peaks mid century
Continues increasing at same pace
Peaks mid century
Continues increasing slowly
technologies new and more efficient
technological change more fragmented and slower
clean and resource-efficient technologies
less rapid and more diverse technological change
Regional differences
reduction in regional differences
self-reliance and preservation of local identities
Global solutions local solutions
Environment Global environmental solutions
oriented towards environmental protection
Climate without additional climate initiatives
Making climate projections for a range of SRES scenarios such as the presently available in Worldclim, A2 and B2 emission scenario families can be one way to consider the uncertainties in emission scenarios. B2 emission scenarios for carbon dioxide emission rates are more than double in A2 scenario as compared to A1B and B2 scenarios towards the end of the century. A2 scenario is the more realistic scenario, particularly after the recent credit crunch and specifically A2a (business as usual) and is the recommended choice. The use of other SRES scenarios (A1B, A2, B1, B2) can be important for assessing future impacts and vulnerability to climate change and also one way of addressing uncertainty. Research efforts are needed to quantify future climate changes scenarios for Southeast Asia under different SRES emission scenarios.
B2 scenario may be a more realistic scenario, particularly after the recent credit crunch and specifically A2a (business as usual) and is the recommended choice. However, use of a range of scenarios may be a better approach to understand the range of possibilities (including the worst and best case scenarios) though this may not always be possible due to time and budget constraints.
1.2 Stakeholder panel purpose, identification and implementation
A major outcome of the project is the on-going dissemination of information and results to stakeholders and managers at all levels within the selected case study areas. These processes were two-way throughout the project period to ensure participation, deliberation, and dialogue
based on local knowledge. In order to achieve that, the project established a "stakeholder panel" that was comprised of 8 -10 representatives from key stakeholders such as farmers, community groups, local fisheries departments and policy makers. The stakeholder panel had a number of roles to play:
• Give inputs on the climate change effects already felt in the aquaculture industry • Give comments on the implementability of the recommendations • Give feedback on the socioeconomic effects of the recommendations
There was also a series of stakeholder consultations on scenario building during the case study areas analyses. A stakeholder panel is a tool that enables stakeholder integration in a project. It provides a platform for active consultation process, where stakeholders can express their problems and concerns about the given issue, provide feedback on the project results, help in developing scenarios and adaptation measures, and assist in networking with other stakeholders whenever needed. It is also a process where the experiential knowledge of stakeholders can be incorporated with the scientific knowledge. The identification of a Stakeholder Panel (SP) normally follows through several stages. In the process, the technical, political, and ethical rationality needs to be considered. The process has to address some important questions about legitimacy, representation, and credibility. This can be undertaken by stakeholder mapping. Stakeholders will be included based on how much they can influence the process. Clearly, the choices of whom to include, how, when, and why, are dependent on their effectiveness and value in the process (their interest and influence). A larger stakeholder workshop, could set the stage for a SP selection. The project team, with the help of some key stakeholders may come up with a probable panel as a starting point for SP selection. The list then needs to be circulated and discussed with key stakeholders, and based on their feedback it should be revised. After revision the members have to be approached for their consent to participate in the project panel. Whether a SP is possible has to be clear before actually involving the stakeholders. This must be discussed with some key stakeholders and also determine what the level of participation can be expected. Also a preliminary set of ground rules for the process have to be designed. Often this is a challenge in research projects, due to resource constraints. It is also difficult to motivate the stakeholders unless they see a direct benefit in the process for themselves. Check the following:
1. To check if the list includes relevant stakeholders interested in the issue. 2. To ensure that due representation is given based on their role (Managers, Farmers
organizations, NGOs, Extension agencies from local and regional level etc.) 3. To rate, if possible, the stakeholders on a 1-4 scale based on their influence and interest
(1 –Most influential and most interested and 4 –least influential and least interested), and select SP based on that.
Terms and conditions for SP members:
• To participate in meetings as agreed during the Aquaclimate project period (at least take part in two panel meetings in a year)
• To contribute positively and actively to the development of scenarios and adaptation measures or strategies in the Aquaclimate project
• To further take the results and communicate with policy makers
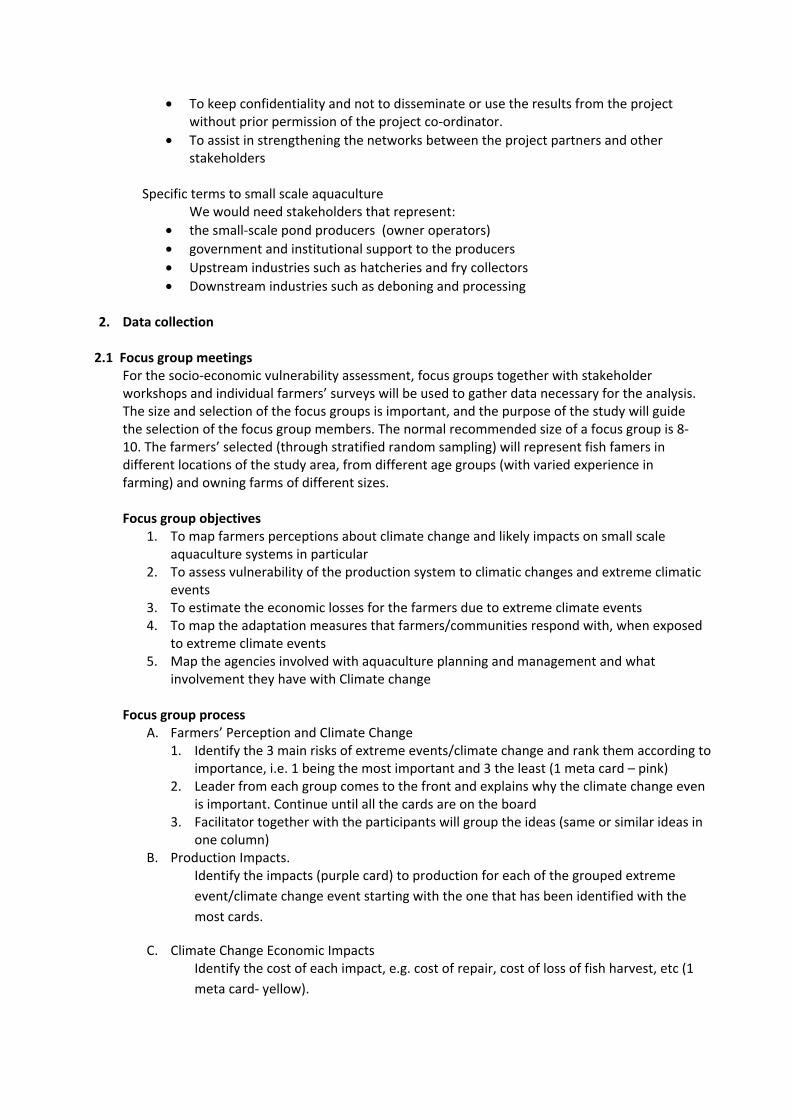
• To keep confidentiality and not to disseminate or use the results from the project without prior permission of the project co-ordinator.
• To assist in strengthening the networks between the project partners and other stakeholders
Specific terms to small scale aquaculture
We would need stakeholders that represent: • the small-scale pond producers (owner operators) • government and institutional support to the producers • Upstream industries such as hatcheries and fry collectors • Downstream industries such as deboning and processing
2. Data collection
2.1 Focus group meetings
For the socio-economic vulnerability assessment, focus groups together with stakeholder workshops and individual farmers’ surveys will be used to gather data necessary for the analysis. The size and selection of the focus groups is important, and the purpose of the study will guide the selection of the focus group members. The normal recommended size of a focus group is 8-10. The farmers’ selected (through stratified random sampling) will represent fish famers in different locations of the study area, from different age groups (with varied experience in farming) and owning farms of different sizes. Focus group objectives
1. To map farmers perceptions about climate change and likely impacts on small scale aquaculture systems in particular
2. To assess vulnerability of the production system to climatic changes and extreme climatic events
3. To estimate the economic losses for the farmers due to extreme climate events 4. To map the adaptation measures that farmers/communities respond with, when exposed
to extreme climate events 5. Map the agencies involved with aquaculture planning and management and what
involvement they have with Climate change Focus group process
A. Farmers’ Perception and Climate Change 1. Identify the 3 main risks of extreme events/climate change and rank them according to
importance, i.e. 1 being the most important and 3 the least (1 meta card – pink) 2. Leader from each group comes to the front and explains why the climate change even
is important. Continue until all the cards are on the board 3. Facilitator together with the participants will group the ideas (same or similar ideas in
one column) B. Production Impacts.
Identify the impacts (purple card) to production for each of the grouped extreme event/climate change event starting with the one that has been identified with the most cards.
C. Climate Change Economic Impacts Identify the cost of each impact, e.g. cost of repair, cost of loss of fish harvest, etc (1 meta card- yellow).
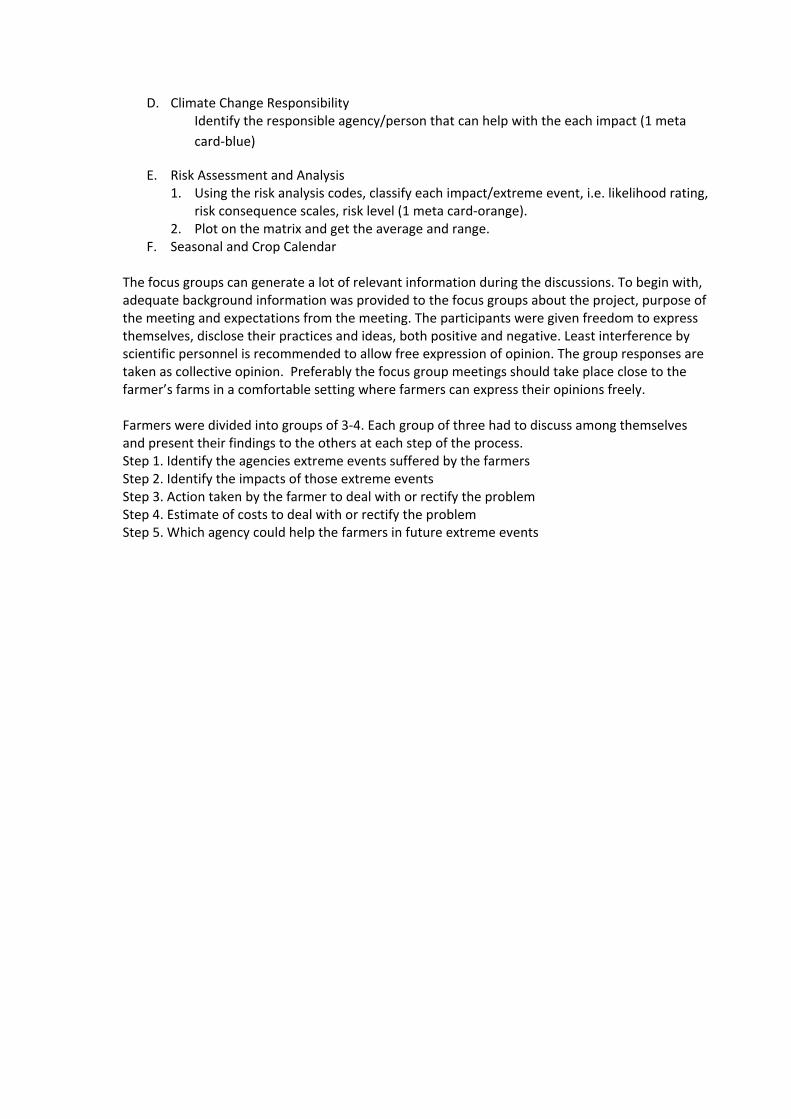
D. Climate Change Responsibility Identify the responsible agency/person that can help with the each impact (1 meta card-blue)
E. Risk Assessment and Analysis 1. Using the risk analysis codes, classify each impact/extreme event, i.e. likelihood rating,
risk consequence scales, risk level (1 meta card-orange). 2. Plot on the matrix and get the average and range.
F. Seasonal and Crop Calendar The focus groups can generate a lot of relevant information during the discussions. To begin with, adequate background information was provided to the focus groups about the project, purpose of the meeting and expectations from the meeting. The participants were given freedom to express themselves, disclose their practices and ideas, both positive and negative. Least interference by scientific personnel is recommended to allow free expression of opinion. The group responses are taken as collective opinion. Preferably the focus group meetings should take place close to the farmer’s farms in a comfortable setting where farmers can express their opinions freely. Farmers were divided into groups of 3-4. Each group of three had to discuss among themselves and present their findings to the others at each step of the process. Step 1. Identify the agencies extreme events suffered by the farmers Step 2. Identify the impacts of those extreme events Step 3. Action taken by the farmer to deal with or rectify the problem Step 4. Estimate of costs to deal with or rectify the problem Step 5. Which agency could help the farmers in future extreme events
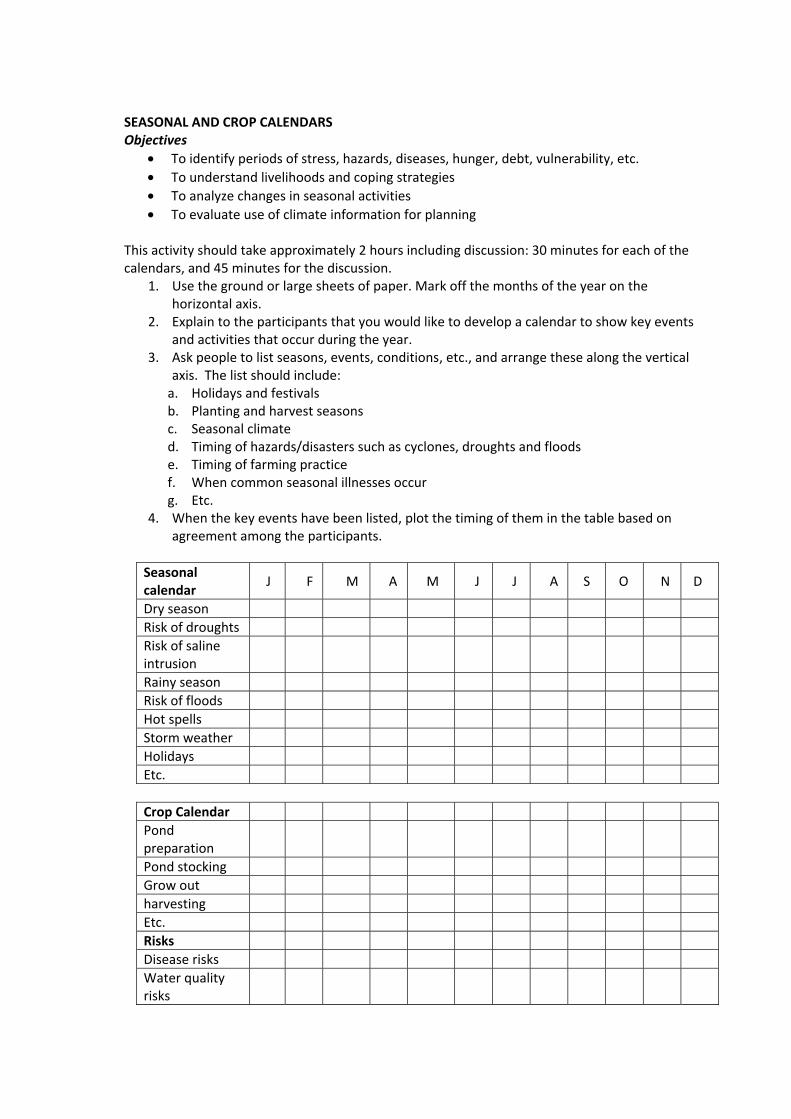
SEASONAL AND CROP CALENDARS Objectives
• To identify periods of stress, hazards, diseases, hunger, debt, vulnerability, etc. • To understand livelihoods and coping strategies • To analyze changes in seasonal activities • To evaluate use of climate information for planning
This activity should take approximately 2 hours including discussion: 30 minutes for each of the calendars, and 45 minutes for the discussion.
1. Use the ground or large sheets of paper. Mark off the months of the year on the horizontal axis.
2. Explain to the participants that you would like to develop a calendar to show key events and activities that occur during the year.
3. Ask people to list seasons, events, conditions, etc., and arrange these along the vertical axis. The list should include:
a. Holidays and festivals b. Planting and harvest seasons c. Seasonal climate d. Timing of hazards/disasters such as cyclones, droughts and floods e. Timing of farming practice f. When common seasonal illnesses occur g. Etc.
4. When the key events have been listed, plot the timing of them in the table based on agreement among the participants.
Seasonal calendar
J F M A M J J A S O N D
Dry season Risk of droughts Risk of saline intrusion
Rainy season Risk of floods Hot spells Storm weather Holidays Etc. Crop Calendar Pond preparation
Pond stocking Grow out harvesting Etc. Risks Disease risks Water quality risks
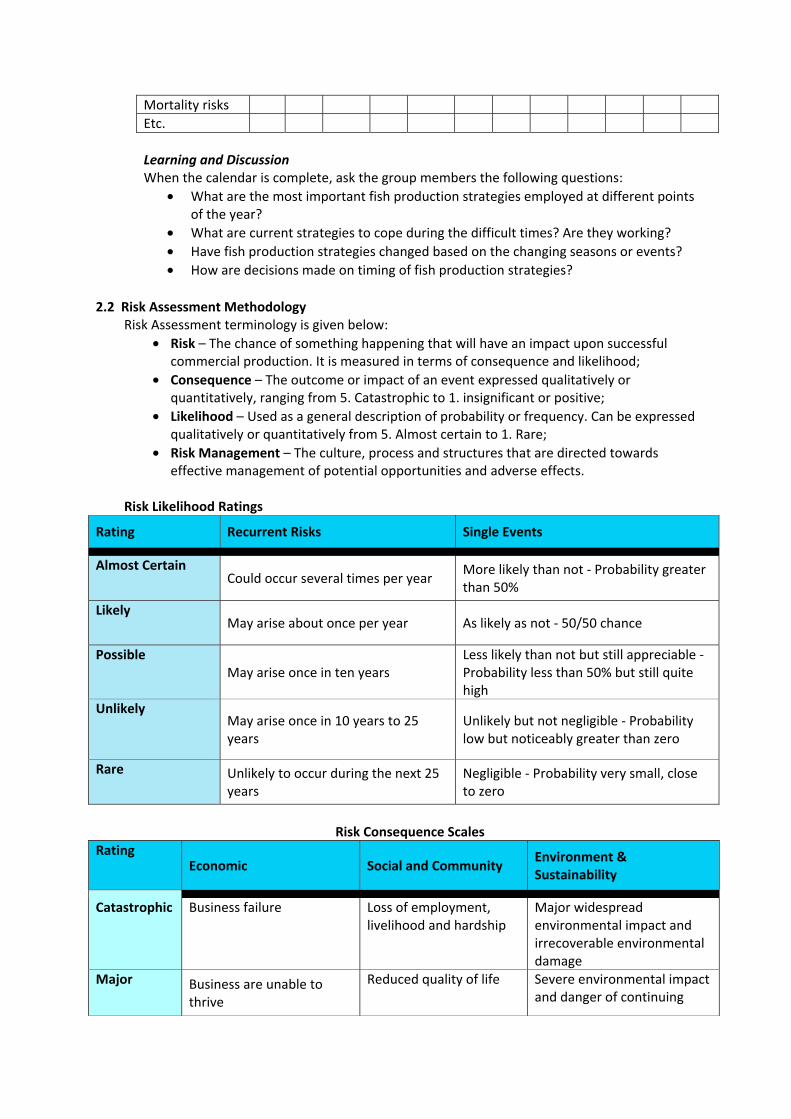
Mortality risks Etc.
Learning and Discussion When the calendar is complete, ask the group members the following questions:
• What are the most important fish production strategies employed at different points of the year?
• What are current strategies to cope during the difficult times? Are they working? • Have fish production strategies changed based on the changing seasons or events? • How are decisions made on timing of fish production strategies?
2.2 Risk Assessment Methodology
Risk Assessment terminology is given below: • Risk – The chance of something happening that will have an impact upon successful
commercial production. It is measured in terms of consequence and likelihood; • Consequence – The outcome or impact of an event expressed qualitatively or
quantitatively, ranging from 5. Catastrophic to 1. insignificant or positive; • Likelihood – Used as a general description of probability or frequency. Can be expressed
qualitatively or quantitatively from 5. Almost certain to 1. Rare; • Risk Management – The culture, process and structures that are directed towards
effective management of potential opportunities and adverse effects.
Risk Likelihood Ratings
Rating Recurrent Risks Single Events
Almost Certain Could occur several times per year
More likely than not - Probability greater than 50%
Likely May arise about once per year As likely as not - 50/50 chance
Possible May arise once in ten years
Less likely than not but still appreciable - Probability less than 50% but still quite high
Unlikely May arise once in 10 years to 25 years
Unlikely but not negligible - Probability low but noticeably greater than zero
Rare Unlikely to occur during the next 25 years
Negligible - Probability very small, close to zero
Risk Consequence Scales
Rating Economic Social and Community
Environment & Sustainability
Catastrophic Business failure Loss of employment, livelihood and hardship
Major widespread environmental impact and irrecoverable environmental damage
Major Business are unable to thrive
Reduced quality of life Severe environmental impact and danger of continuing
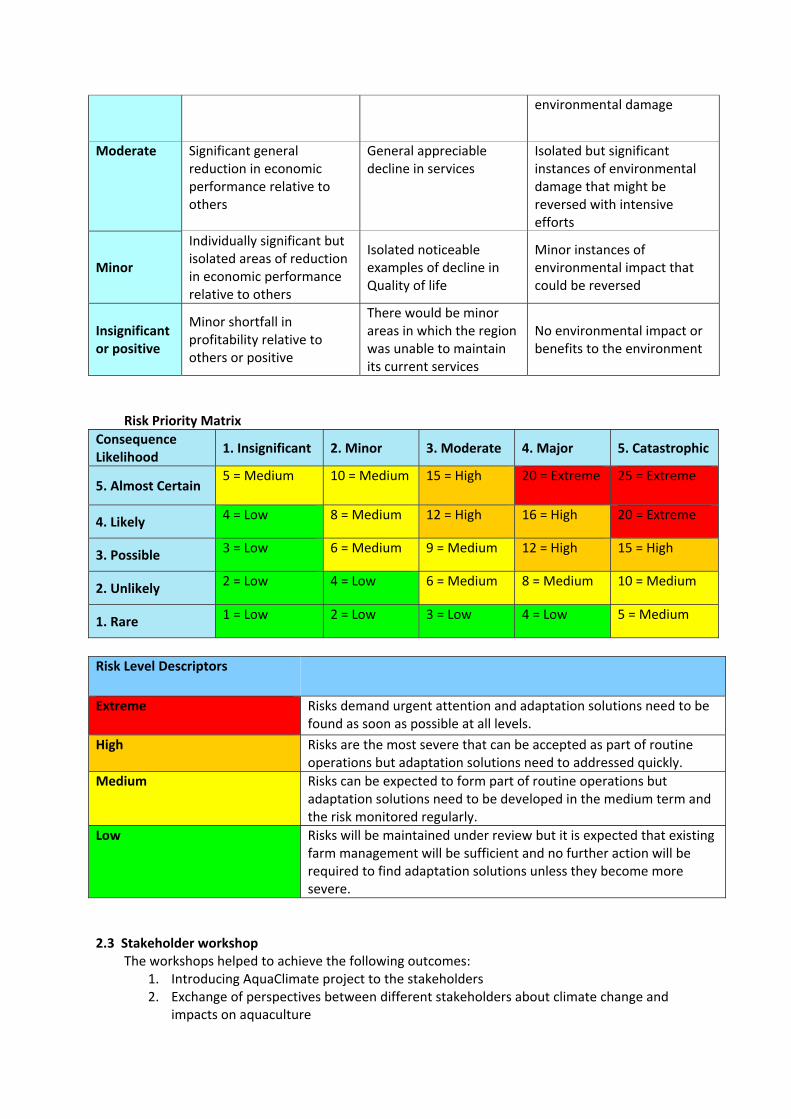
environmental damage
Moderate Significant general reduction in economic performance relative to others
General appreciable decline in services
Isolated but significant instances of environmental damage that might be reversed with intensive efforts
Minor
Individually significant but isolated areas of reduction in economic performance relative to others
Isolated noticeable examples of decline in Quality of life
Minor instances of environmental impact that could be reversed
Insignificant or positive
Minor shortfall in profitability relative to others or positive
There would be minor areas in which the region was unable to maintain its current services
No environmental impact or benefits to the environment
Risk Priority Matrix Consequence Likelihood
1. Insignificant 2. Minor 3. Moderate 4. Major 5. Catastrophic
5. Almost Certain 5 = Medium 10 = Medium 15 = High 20 = Extreme 25 = Extreme
4. Likely 4 = Low 8 = Medium 12 = High 16 = High 20 = Extreme
3. Possible 3 = Low 6 = Medium 9 = Medium 12 = High 15 = High
2. Unlikely 2 = Low 4 = Low 6 = Medium 8 = Medium 10 = Medium
1. Rare 1 = Low 2 = Low 3 = Low 4 = Low 5 = Medium
Risk Level Descriptors
Extreme Risks demand urgent attention and adaptation solutions need to be found as soon as possible at all levels.
High Risks are the most severe that can be accepted as part of routine operations but adaptation solutions need to addressed quickly.
Medium Risks can be expected to form part of routine operations but adaptation solutions need to be developed in the medium term and the risk monitored regularly.
Low Risks will be maintained under review but it is expected that existing farm management will be sufficient and no further action will be required to find adaptation solutions unless they become more severe.
2.3 Stakeholder workshop The workshops helped to achieve the following outcomes:
1. Introducing AquaClimate project to the stakeholders 2. Exchange of perspectives between different stakeholders about climate change and
impacts on aquaculture
3. Promoting awareness within the stakeholders about the on-going climate change related projects in the region and possible synergies
4. Exploring possibilities for co-operation with stakeholders in the AquaClimate project 5. Establishing a stakeholder panel that acted as the reference group for AquaClimate
project for close interaction and developing scenarios The morning session was dedicated to
• Workshop opening and introductions. To welcome people and enable participants and facilitators to get to know each other.
• Objectives and schedule. To outline the objectives, content, methods and timings of the workshop.
• Presentations. To give information about the project, climate change and potential impacts.
The afternoon session was totally devoted to “Facilitated Group Work” involving fish farmers, scientists, commercial companies and Government officials from related fields. The stakeholders were divided into three groups, each group consisting of 12-14 stakeholders, based on their occupation, in order to map the differences in perceptions related to climate change. The different groups were:
• Group I - Comprised mostly of fish farmers and from commercial companies. • Group II – Representatives from Academia, research and scientific staff • Group III - Managers from various government agencies
Each group was assisted by a facilitator and a translator to guide the discussions. During the discussions, the group members were made to sit into sub groups of 3-4 stakeholders each. This was to facilitate active participation of all stakeholders in the discussions. Process: Step 1. Scenario setting and CC Issue identification: Identify/define climate change (based on personal experience or observation) Step 2. Prioritisation of issues, and rank the CC identified Step 3. Identify the impacts Step 4. Identify mitigating measures (existing or ways on how to address) Step 5.. Identify the responsible agency that can implement the mitigating measures Each sub-group was given different colour cards to write down the most important major climate events, impacts and adaptation measures. The events were grouped and then ranked by stakeholders in the order of their seriousness. The stakeholders in the next stage listed the possible impacts of each event on cat fish farming based on their experience. The impacts were also then ranked based on the importance as perceived by stakeholders. This was followed by suggesting suitable adaptation measures, for each impact and agencies that should be responsible for implementing the measures. Workshop recaps. To provide a summary (usually by participants at the end of the identification and prioritisation ) to inform the other groups.
3. Data Analysis 3.1 Stakeholder mapping and analysis
A stakeholder is any person or organization, who can be positively or negatively impacted by,

or cause an impact on the actions of a company. Types of stakeholders are: • Primary stakeholders : are those ultimately affected, either positively or negatively by
corporation's actions. • Secondary stakeholders : are the ‘intermediaries’, that is, persons or
organizations who are indirectly affected by corporation's actions. • Key stakeholders : (who can also belong to the first two groups) have
significant influence or importance in corporation.
A stakeholder analysis is performed when there is a need to clarify the consequences of envisaged changes or at the start of new projects and in connection with organizational changes generally. It is important to identify all stakeholders for the purpose of identifying their success criteria and turning these into quality goals. Undertake stakeholder mapping The first step in building any stakeholder map is to develop a categorised list of the members of the stakeholder community. Once the list is reasonably complete it is then possible to assign priorities in some way, and then to translate the ‘highest priority’ stakeholders into a table or a picture. Interaction with the potential list of stakeholders for any project will always exceed both the time available for analysis and the capability of the mapping tool to sensibly display the results. The challenge is to focus on the ‘key stakeholders’ who are currently important and to use the tool to visualise this critical sub-set of the total community. The most common presentation styles use a matrix to represent two dimensions of interest with frequently a third dimension shown by the colour or size of the symbol representing the individual stakeholders. Some of the commonly used ‘dimensions’ include:
• Power (high, medium, low) • Support (positive, neutral, negative) • Influence (high or low)
3.2 Institutional Mapping and analysis
Institutions play a critical role in supporting or constraining people’s capacity to adapt to climate change. In order to better understand which institutions are most important to people in the target communities, an institutional mapping exercise is useful. Key issues in the analysis included:
• Which organizations (governmental and non-governmental) are involved in addressing key aquaculture issues and problems related to climate change?
• What are the policy or strategy documents that guide their work? • What are their activities that are relevant to adaptation? • Do they have a mandate to address climate change issues? • What is the institution’s level of influence in addressing adaptation? • What are their relationships with other organizations? • What are the strengths and weaknesses of the institutions?
The institutional analysis provided useful information to plan the scope of the policy analysis, and to identify key stakeholders for further investigation. The mapping exercise assisted in identifying the institutions that should be engaged in the process, as well as potential allies and opponents in addressing vulnerability at the community level.
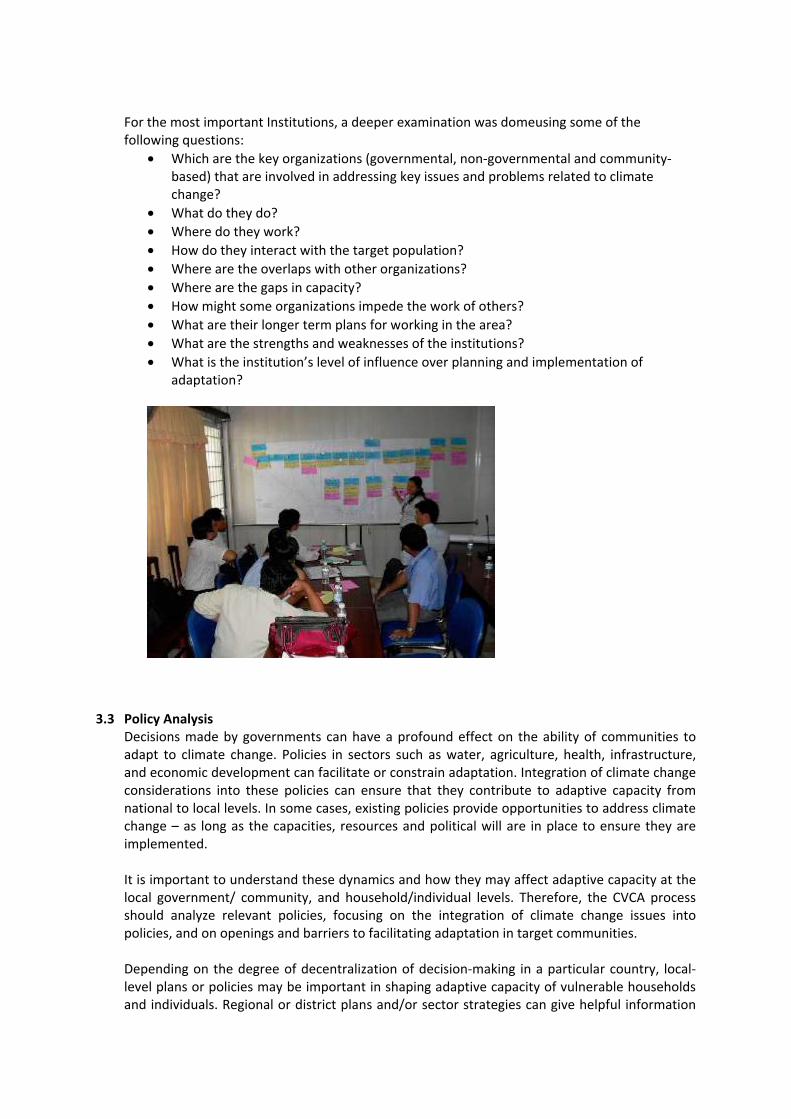
For the most important Institutions, a deeper examination was domeusing some of the following questions:
• Which are the key organizations (governmental, non-governmental and community-based) that are involved in addressing key issues and problems related to climate change?
• What do they do? • Where do they work? • How do they interact with the target population? • Where are the overlaps with other organizations? • Where are the gaps in capacity? • How might some organizations impede the work of others? • What are their longer term plans for working in the area? • What are the strengths and weaknesses of the institutions? • What is the institution’s level of influence over planning and implementation of
adaptation?
3.3 Policy Analysis Decisions made by governments can have a profound effect on the ability of communities to adapt to climate change. Policies in sectors such as water, agriculture, health, infrastructure, and economic development can facilitate or constrain adaptation. Integration of climate change considerations into these policies can ensure that they contribute to adaptive capacity from national to local levels. In some cases, existing policies provide opportunities to address climate change – as long as the capacities, resources and political will are in place to ensure they are implemented. It is important to understand these dynamics and how they may affect adaptive capacity at the local government/ community, and household/individual levels. Therefore, the CVCA process should analyze relevant policies, focusing on the integration of climate change issues into policies, and on openings and barriers to facilitating adaptation in target communities. Depending on the degree of decentralization of decision-making in a particular country, local-level plans or policies may be important in shaping adaptive capacity of vulnerable households and individuals. Regional or district plans and/or sector strategies can give helpful information
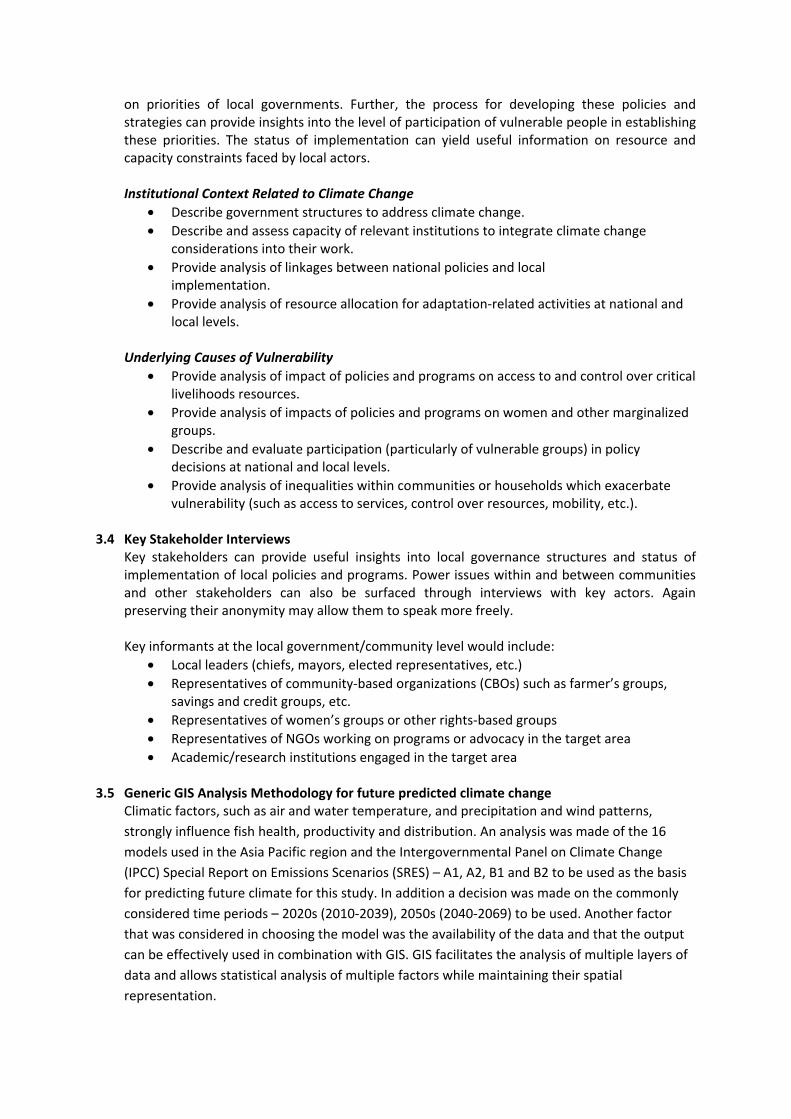
on priorities of local governments. Further, the process for developing these policies and strategies can provide insights into the level of participation of vulnerable people in establishing these priorities. The status of implementation can yield useful information on resource and capacity constraints faced by local actors. Institutional Context Related to Climate Change
• Describe government structures to address climate change. • Describe and assess capacity of relevant institutions to integrate climate change
considerations into their work. • Provide analysis of linkages between national policies and local
implementation. • Provide analysis of resource allocation for adaptation-related activities at national and
local levels. Underlying Causes of Vulnerability
• Provide analysis of impact of policies and programs on access to and control over critical livelihoods resources.
• Provide analysis of impacts of policies and programs on women and other marginalized groups.
• Describe and evaluate participation (particularly of vulnerable groups) in policy decisions at national and local levels.
• Provide analysis of inequalities within communities or households which exacerbate vulnerability (such as access to services, control over resources, mobility, etc.).
3.4 Key Stakeholder Interviews
Key stakeholders can provide useful insights into local governance structures and status of implementation of local policies and programs. Power issues within and between communities and other stakeholders can also be surfaced through interviews with key actors. Again preserving their anonymity may allow them to speak more freely. Key informants at the local government/community level would include:
• Local leaders (chiefs, mayors, elected representatives, etc.) • Representatives of community-based organizations (CBOs) such as farmer’s groups,
savings and credit groups, etc. • Representatives of women’s groups or other rights-based groups • Representatives of NGOs working on programs or advocacy in the target area • Academic/research institutions engaged in the target area
3.5 Generic GIS Analysis Methodology for future predicted climate change Climatic factors, such as air and water temperature, and precipitation and wind patterns, strongly influence fish health, productivity and distribution. An analysis was made of the 16 models used in the Asia Pacific region and the Intergovernmental Panel on Climate Change (IPCC) Special Report on Emissions Scenarios (SRES) – A1, A2, B1 and B2 to be used as the basis for predicting future climate for this study. In addition a decision was made on the commonly considered time periods – 2020s (2010-2039), 2050s (2040-2069) to be used. Another factor that was considered in choosing the model was the availability of the data and that the output can be effectively used in combination with GIS. GIS facilitates the analysis of multiple layers of data and allows statistical analysis of multiple factors while maintaining their spatial representation.

The analysis recommended the use of the CSIRO climate model available from WORLDCLIM and the A2 scenario “business as usual”.
The A2 scenario can be summarised as follows;
• a very heterogeneous world. • self-reliance and preservation of local identities. • Fertility patterns across regions converge very slowly, which results in continuously
increasing population. • Economic development is primarily regionally oriented • per capita economic growth and technological change more fragmented and slower
than other storylines.
The output from this climate model and scenario was used to predicted future Climate Change for the 4 case study areas for the timescales Present, 2020 and 2050.
Climate changes that were considered included;
• Temperature increase and seasonal patterns o minimum average monthly temperature o maximum average monthly temperature
• Precipitation change and patterns for the o Municipalities indicating precipitation at the farm ponds o River water shed area indicating potential change in river flows
• Sea Level Rise • Storms and cyclones • Storm surge risk
3.6 Global warming potential and resource use analysis This study uses the techniques of LCA to look at global warming potential and resource use from small scale aquaculture in Asia and benchmark this against other Aquaculture sectors.
LCA methods are initially developed for land-based industrial applications, and the methodology is so far not brought to the same level when it comes to food products, especially not for fish.
Several studies related to fish products, however, are available. Among these are Ziegler (2001), Ziegler et al. (2003), Thrane (2004), Christensen and Ritter (2000), Eyjolfsdóttir et al. (2003), Silvenius and Grönroos (2003) and Mattsson et al. (2003). It is generally agreed that better adapted environmental indicators are needed for both wild caught and farmed fish.
In practice, impact assessment components of LCAs concentrate on global impact categories (climate change and ozone depletion) and on regional impact categories (e.g. acidification, tropospheric ozone formation, and eutrophication).
Life cycle assessment (LCA) is the modelling of the interaction between the production of a product and the environment. LCAs compile the emissions (air, water, soil, waste etc.) and resource uses of a product much the same as a bookkeeper tallies up figures. The data usually describe the path of a product from "cradle to grave." This includes sourcing of raw materials, production of materials and the main product, and finally the usage of the product and disposal.
LCAs are developed in order to compare a product with respect to corresponding environmental and climate impacts. In order to accomplish this, the entire life cycle of the product must be identified and all relevant forms of known environmental interventions should be accounted (Nath et al. 1998). Analytic tools that are related to LCA include: life-cycle assessment, design for environment, life-cycle cost accounting, eco-efficiency, environmental auditing or profiling, environmental benchmarking, and environmental performance evaluation (Lowe 1997).
Global Warming Potential = The potential impacts on global warming associated with the inputs and outputs of the life cycle of product (i.e. the system boundary of LCA study).
The principle of GWP calculation is to multiply the amount of GHG emissions with the characterisation factor of each GHG (called as "Characterisation factor" in LCA), for instance, CO2 has the GWP = 1 kg CO2 while CH4 has the GWP = 25 kgCO2e (meaning that CH4 has the higher impacts than CO2 about 25 times).
Thus, if the whole life cycle of product emits 1 kg of CO2 and 1 kg of CH4 therefore the total GWP value = (1X1) + (25X1) = 26 kgCO2e
The unit is kgCO2e meaning kg CO2 equivalent, as equivalent to 26 kg of CO2 so it is the relative impacts not actual value.
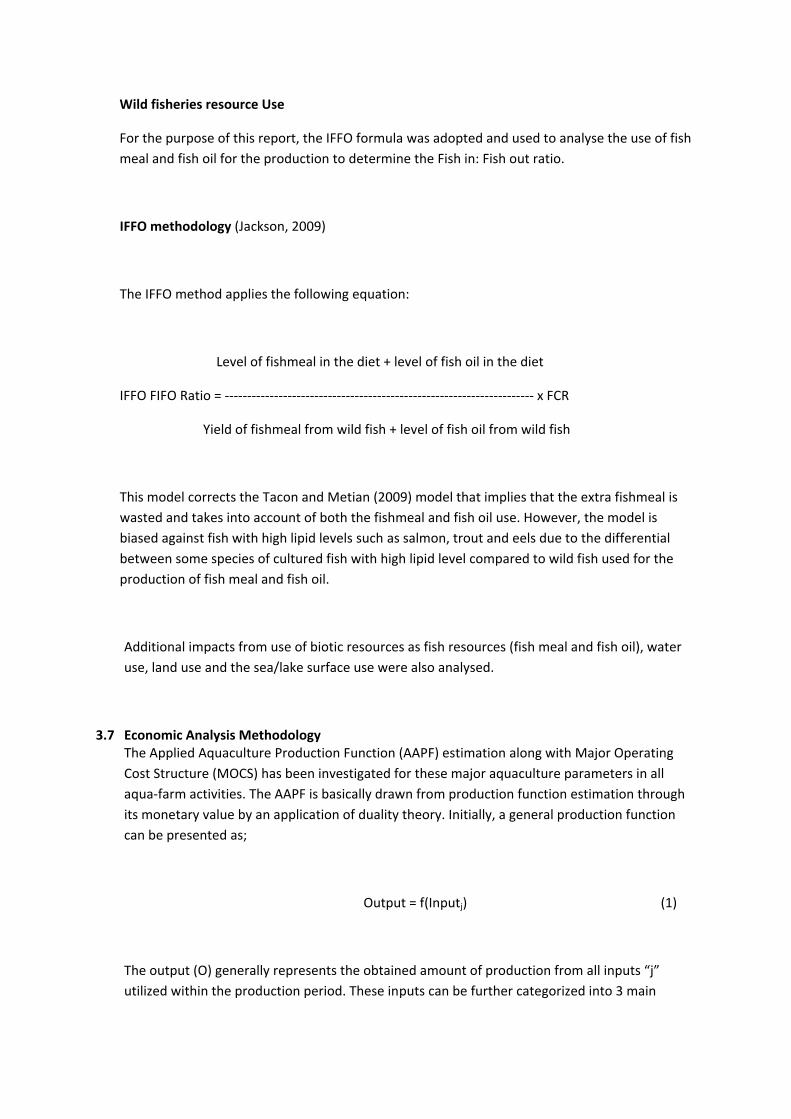
Wild fisheries resource Use
For the purpose of this report, the IFFO formula was adopted and used to analyse the use of fish meal and fish oil for the production to determine the Fish in: Fish out ratio.
IFFO methodology (Jackson, 2009)
The IFFO method applies the following equation:
Level of fishmeal in the diet + level of fish oil in the diet
IFFO FIFO Ratio = --------------------------------------------------------------------- x FCR
Yield of fishmeal from wild fish + level of fish oil from wild fish
This model corrects the Tacon and Metian (2009) model that implies that the extra fishmeal is wasted and takes into account of both the fishmeal and fish oil use. However, the model is biased against fish with high lipid levels such as salmon, trout and eels due to the differential between some species of cultured fish with high lipid level compared to wild fish used for the production of fish meal and fish oil.
Additional impacts from use of biotic resources as fish resources (fish meal and fish oil), water use, land use and the sea/lake surface use were also analysed.
3.7 Economic Analysis Methodology The Applied Aquaculture Production Function (AAPF) estimation along with Major Operating Cost Structure (MOCS) has been investigated for these major aquaculture parameters in all aqua-farm activities. The AAPF is basically drawn from production function estimation through its monetary value by an application of duality theory. Initially, a general production function can be presented as;
Output = f(Inputj) (1)
The output (O) generally represents the obtained amount of production from all inputs “j” utilized within the production period. These inputs can be further categorized into 3 main
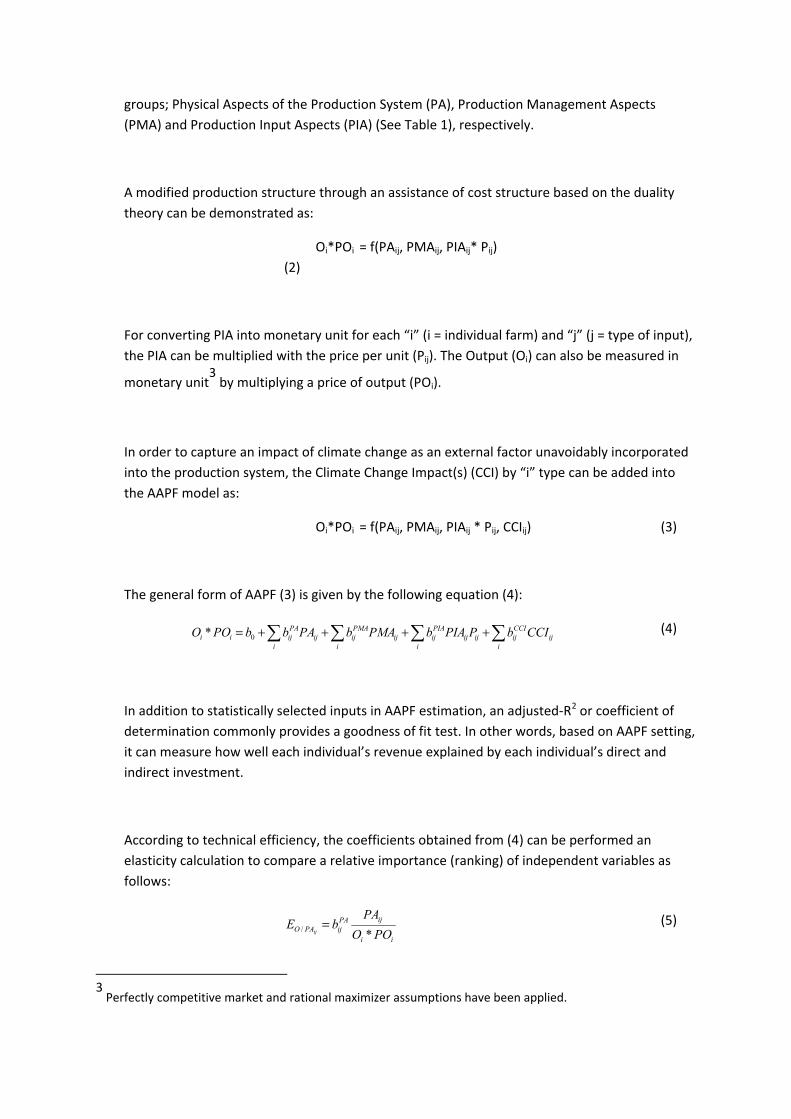
groups; Physical Aspects of the Production System (PA), Production Management Aspects (PMA) and Production Input Aspects (PIA) (See Table 1), respectively.
A modified production structure through an assistance of cost structure based on the duality theory can be demonstrated as:
Oi*POi = f(PAij, PMAij, PIAij* Pij) (2)
For converting PIA into monetary unit for each “i” (i = individual farm) and “j” (j = type of input), the PIA can be multiplied with the price per unit (Pij). The Output (Oi) can also be measured in
monetary unit3
by multiplying a price of output (POi).
In order to capture an impact of climate change as an external factor unavoidably incorporated into the production system, the Climate Change Impact(s) (CCI) by “i” type can be added into the AAPF model as:
Oi*POi = f(PAij, PMAij, PIAij * Pij, CCIij) (3)
The general form of AAPF (3) is given by the following equation (4):
ij
i
CCIijij
iij
PIAijij
i
PMAij
iij
PAijii CCIbPPIAbPMAbPAbbPOO ∑∑∑∑ ++++= 0* (4)
In addition to statistically selected inputs in AAPF estimation, an adjusted-R2 or coefficient of determination commonly provides a goodness of fit test. In other words, based on AAPF setting, it can measure how well each individual’s revenue explained by each individual’s direct and indirect investment.
According to technical efficiency, the coefficients obtained from (4) can be performed an elasticity calculation to compare a relative importance (ranking) of independent variables as follows:
ii
ijPAijPAO POO
PAbE
ij */ = (5)
3
Perfectly competitive market and rational maximizer assumptions have been applied.
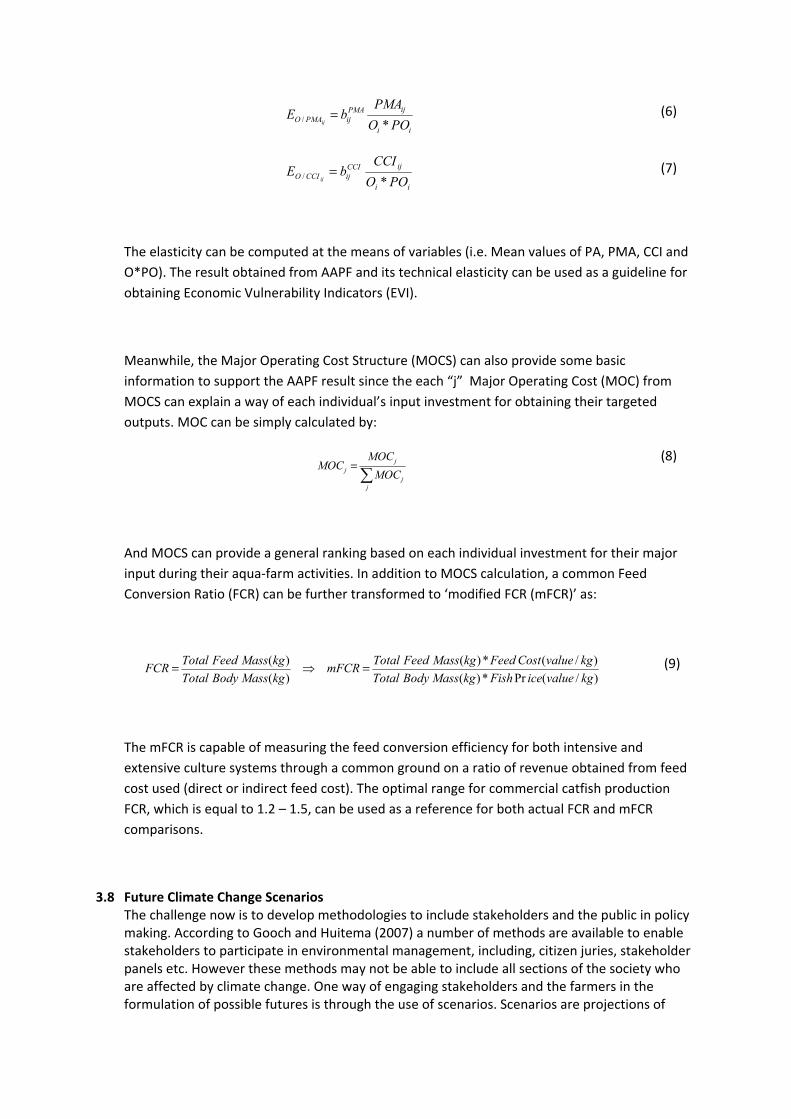
ii
ijPMAijPMAO POO
PMAbE
ij */ = (6)
ii
ijCCIijCCIO POO
CCIbE
ij */ = (7)
The elasticity can be computed at the means of variables (i.e. Mean values of PA, PMA, CCI and O*PO). The result obtained from AAPF and its technical elasticity can be used as a guideline for obtaining Economic Vulnerability Indicators (EVI).
Meanwhile, the Major Operating Cost Structure (MOCS) can also provide some basic information to support the AAPF result since the each “j” Major Operating Cost (MOC) from MOCS can explain a way of each individual’s input investment for obtaining their targeted outputs. MOC can be simply calculated by:
∑=
jj
jj MOC
MOCMOC
(8)
And MOCS can provide a general ranking based on each individual investment for their major input during their aqua-farm activities. In addition to MOCS calculation, a common Feed Conversion Ratio (FCR) can be further transformed to ‘modified FCR (mFCR)’ as:
)/(Pr*)()/(*)(
)()(
kgvalueiceFishkgMassBodyTotalkgvalueCostFeedkgMassFeedTotalmFCR
kgMassBodyTotalkgMassFeedTotalFCR =⇒= (9)
The mFCR is capable of measuring the feed conversion efficiency for both intensive and extensive culture systems through a common ground on a ratio of revenue obtained from feed cost used (direct or indirect feed cost). The optimal range for commercial catfish production FCR, which is equal to 1.2 – 1.5, can be used as a reference for both actual FCR and mFCR comparisons.
3.8 Future Climate Change Scenarios The challenge now is to develop methodologies to include stakeholders and the public in policy making. According to Gooch and Huitema (2007) a number of methods are available to enable stakeholders to participate in environmental management, including, citizen juries, stakeholder panels etc. However these methods may not be able to include all sections of the society who are affected by climate change. One way of engaging stakeholders and the farmers in the formulation of possible futures is through the use of scenarios. Scenarios are projections of
possible futures (Alcamo 2001; Shell 2003), not necessarily the most likely futures. In AquaClimate (www.enaca.org/aquaclimate), a major focus was on the involvement of stakeholders and the public in the development of scenarios and adaptation models for sustainable aquaculture in the respective case study areas. Scenarios provide a means to map possible future situation and the measures necessary for sustaining aquaculture production. Scenarios can also be used as a tool for improving stakeholder participation. Involvement of stakeholders in the development and validation of scenarios can provide insights not readily available for policy-makers. Scenario as a policy tool Scenarios essentially describe possible future situations and the path that may make it possible
to arrive at such a future situation.4
They are a useful tool to look at possible paths of
development, to illustrate how alternative policy pathways can raise awareness about the future environmental problems, pinpoint priority issues, identify the main actors in relation to the key variables and their strategies, and provide education and operational strategies.2 Scenarios are verbal picture of a situation or a phenomenon based on certain assumptions and factors (variables). Scenarios are used in estimating the probable effects of one or more variables, and are an integral part of situation analysis and long-range planning.
Scenarios can be made up of
1. a base year -usually the current year, which provides a starting point for assessing scenarios;
2. time horizon -the most distant future year or end year covered by a scenario; 3. pathways -description of the changes that may take place from the base year to the
end year; 4. drivers – the main factors or determinants that influence the pathways described in a
scenario; and 5. storyline – a narrative description of a scenario which highlights its main features and
their relationship to the driving forces. Advantages of developing scenarios together with stakeholders
1. The experiential knowledge of stakeholders together with the scientific knowledge will be useful to develop most realistic scenarios.
2. Scenarios are useful tools to integrate knowledge from various disciplines and sectors. 3. Stakeholder inputs would be useful to develop more meaningful adaptation strategies,
as they would be aware of the resources and limitations and the immediate needs. 4. The scenarios thus developed would be of direct use to managers and decision makers
and easy to implement. 5. Scenarios developed through active participation can increase awareness of the issue
4 ‘Scenarios’ has been defined as “a sequence of emerging events, an account of a projected course of action or events” (Webster’s Ninth Collegiate Dictionary, 1989); the IPPC define “scenarios” as “images of the future, or alternative futures that are neither predictions nor forecasts, but an alternative image of how the future might unfold” (Alcamo, J., "Scenarios as tools for international environmental assessments", Experts' corner report, Prospects and Scenarios No. 5, European Environment Agency, Copenhagen 2001, at 7).
amongst stakeholders and at the same time build trust between the scientific and civil society.
Constraints in the development and use of scenarios
1. Stakeholder involvement can be time consuming, as it requires several meetings, workshops, and interactive sessions, before trust is developed.
2. Identification of relevant stakeholders is one of the key constraint and often a cumbersome process. Selection can be biased and in the process potential stakeholders can be left out
3. In some situations it is difficult to communicate with local agencies and farmers due to language barriers.
4. Stakeholders might build some expectations when asked to participate and projects like AquaClimate may not be able to meet the expectations. It is better to inform about the purpose of their involvement and the project limitations.
4. Recommendations
4.1 Policy briefs
Policy makers seldom have the time to read through all the literature related to a specific policy question. To make well-informed decisions, they rely on short, tightly written briefs that quickly and cogently relay the important policy facts, questions, and arguments about an issue. The policy brief should advance a persuasive argument in a concise, clearly organized fashion. A policy brief does not include a lengthy analysis or review of the literature. The Policy brief should conclude with policy recommendations.
4.2 Science and Technology Briefs Scientific research and technology development can play a strong role to support farmers in developing new adaptation measures to predicted future climate change as well as developing standardised methodology for assessing socio-economic vulnerability of communities and culture systems and developing adaptation measures.
There is a need for scientific research to understand the underlying biological processes that are affecting productivity changes due to climate change and develop potential solutions for the farmer. This includes research on subjects such as the effect of temperature on breeding and fry fitness and the selective breeding of temperature tolerant stains, research on the effect on pond primary productivity and the biological control of snails in the ponds. In addition, there is a need for scientific research to better understand climate change and its potential impacts to support informed decision making by central, regional and local governments.
The development of technology can also pay an important role such as engineering stronger dikes, development of breakwaters that encourage natural mangrove development to protect coastlines vulnerable to sea level rise and storm surge.
The new adaptation technologies will need to be cost effective, environmentally sustainable, culturally compatible and socially acceptable. The technologies will also need to be implemented which will require widespread technology transfer supported by effective institutions, formal and informal. Funding will need to be identified to pay for the necessary research and technology development.
Even if new technologies are devised, and are suitable for local conditions, it can be difficult for the poorer farmers to adopt them. With small farm sizes and limited access to credit, they may have neither the ability nor the inclination to invest in new technology.
Whatever the envisaged levels of technology, it is clear that there is a need to devise national strategy for adaptation, assessing the communities and the locations at greatest risk and planning appropriately. The scientific predictions and warnings may not yet provide the level of precision desired by many planners, but they portray with certainty a rapidly warming world with consequences that globally, and for most sectors, are largely negative. A new climate is on the way. Adaptation is not a choice, it is a necessity
Many of these technologies are already available and widely used. The global climate system has always confronted human societies with extreme weather events and in many respects future climate change will simply exacerbate these events, altering their scale, duration or intensity. Thus it should be possible to adapt to some extent by modifying or extending existing technologies.
4.3 Farmer technical briefs The farmer can adapt to small changes in weather patterns and short term gradual climate change but they are not prepared for rapid changes or long term continuous climate change. The farmer needs to be assisted by scientific research and technology development to find solutions that will allow them to adapt to the predicted future climate changes.
The farmer can implement a wide range of adaptation measures on the farm ranging from purchase and use of technology, changes in pond design to changes in production methodology and timing.
However, small scale farmers do not have the financial resources to undertake many of the potential adaptation measures and with present market prices, they are barely breaking even.
Therefore it is important to assist the farmers now to become more profitable so that they can cope with the stronger and more unpredictable weather conditions and afford make the recommended adaption measures.
The farmer needs to make a decision to resist climate change or to accept climate change and find ways to live with the consequences. For example, increased peak rainfall together with increasing sea level rise is leading to increased frequency and higher floods. To resist this impact the farmer can resist flooding by strengthening and increasing the height of the perimeter dikes. To live with flooding, the farmer can purchase nets that are deployed on the top of the dykes so that when a flood occurs, the fish remain in the ponds.
4.4 Policy options and trade-offs One of the objectives of the AquaClimate Project is “to develop guidelines for policy measures and decision support tools”, which will contribute to an increase in resilience and enhance adaptive capacities of resource-poor, small-scale aquaculture farmers and those dependent on aquatic resource for their livelihoods, to the impacts of climatic change. As aquaculture has multiple sets of stakeholders that have direct and varying interests in (as well as influence on) the sector, and who might benefit or be harmed by an action or policy, it will be important to determine the attitudes and preferences of various interest groups towards the identified/proposed actions and policies. The prioritization of policy options based on stakeholder’s perceptions will help in guiding the policy makers to reformulate their strategies to cope with the expected climate change conditions.
The project identified three main groups of stakeholders, which are 1) farmer group, 2) science and technology group, and 3) policy and institution group. The weighting of policy options of each group was determined by using Analytical Hierarchy Process (AHP) (Saaty, 1977) as a tool and then the hierarchy (ranking) of decision elements was developed (Saaty, 1990). AHP provides the decision makers with a comprehensive framework for solving problems particularly when they make multi-criteria and multi-actors decisions. The perceptions and purposes can be integrated into an overall synthesis by using AHP (Saaty, 1990).
A trade-off analysis (also called a trade study) is an analytical method or tool for evaluating and comparing system designs based on stakeholder-defined criteria. The stakeholders were asked to investigate alternatives (issues/measures) and to compare and select the best alternative to answer a basis question, which is “Are the solutions that are being suggested as good as possible?”. The alternatives (issues/measure) were investigated based on the overall feasibilities, which are:
• Economic feasibility = “Cost-Benefit analysis” of related parties
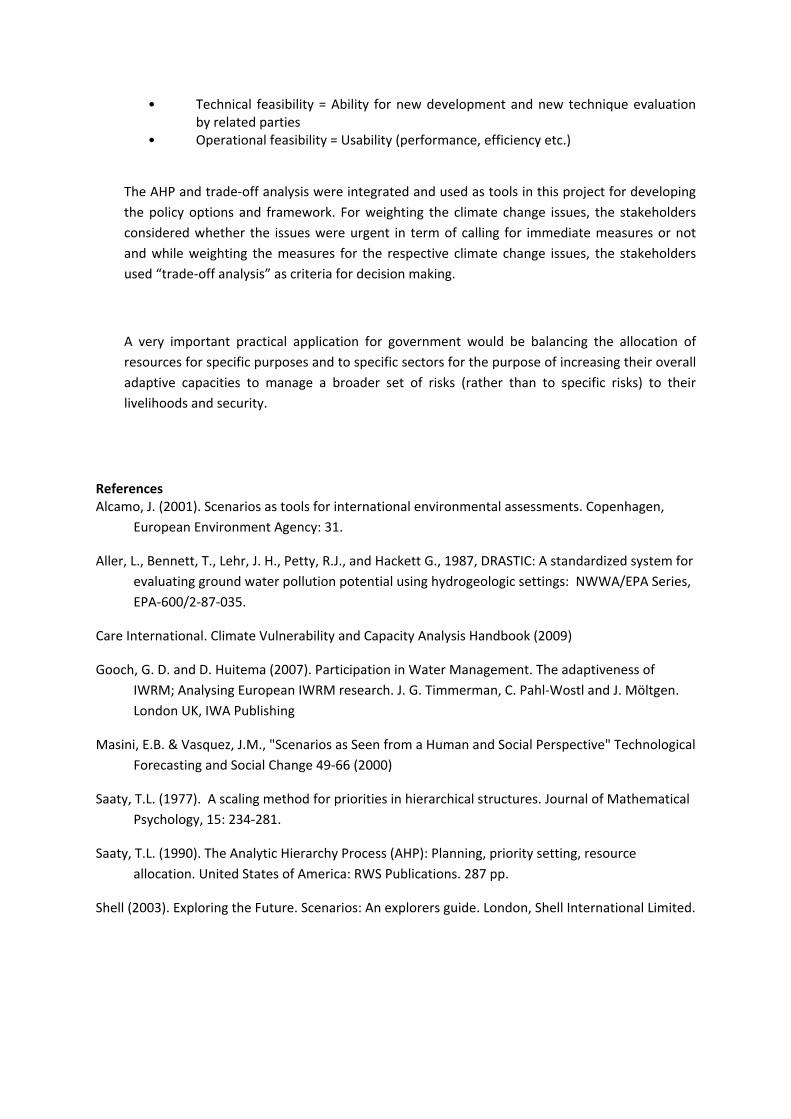
• Technical feasibility = Ability for new development and new technique evaluation by related parties
• Operational feasibility = Usability (performance, efficiency etc.)
The AHP and trade-off analysis were integrated and used as tools in this project for developing the policy options and framework. For weighting the climate change issues, the stakeholders considered whether the issues were urgent in term of calling for immediate measures or not and while weighting the measures for the respective climate change issues, the stakeholders used “trade-off analysis” as criteria for decision making.
A very important practical application for government would be balancing the allocation of resources for specific purposes and to specific sectors for the purpose of increasing their overall adaptive capacities to manage a broader set of risks (rather than to specific risks) to their livelihoods and security.
References Alcamo, J. (2001). Scenarios as tools for international environmental assessments. Copenhagen,
European Environment Agency: 31.
Aller, L., Bennett, T., Lehr, J. H., Petty, R.J., and Hackett G., 1987, DRASTIC: A standardized system for evaluating ground water pollution potential using hydrogeologic settings: NWWA/EPA Series, EPA-600/2-87-035.
Care International. Climate Vulnerability and Capacity Analysis Handbook (2009)
Gooch, G. D. and D. Huitema (2007). Participation in Water Management. The adaptiveness of IWRM; Analysing European IWRM research. J. G. Timmerman, C. Pahl-Wostl and J. Möltgen. London UK, IWA Publishing
Masini, E.B. & Vasquez, J.M., "Scenarios as Seen from a Human and Social Perspective" Technological Forecasting and Social Change 49-66 (2000)
Saaty, T.L. (1977). A scaling method for priorities in hierarchical structures. Journal of Mathematical Psychology, 15: 234-281.
Saaty, T.L. (1990). The Analytic Hierarchy Process (AHP): Planning, priority setting, resource allocation. United States of America: RWS Publications. 287 pp.
Shell (2003). Exploring the Future. Scenarios: An explorers guide. London, Shell International Limited.