CASE STUDY FOR PRIVATE LABEL PRODUCT ONLINE ...
90
CASE STUDY FOR PRIVATE LABEL PRODUCT ONLINE LAUNCH LAHTI UNIVERSITY OF APPLIED SCIENCES Degree Program in International Business Management Master’s Thesis 11.11.2016 Kimmo Perälä
-
Upload
khangminh22 -
Category
Documents
-
view
2 -
download
0
Transcript of CASE STUDY FOR PRIVATE LABEL PRODUCT ONLINE ...
CASE STUDY FOR PRIVATE
LABEL PRODUCT ONLINE
LAUNCH
LAHTI UNIVERSITY OF APPLIED SCIENCES
Degree Program in International Business
Management
Master’s Thesis
11.11.2016
Kimmo Perälä
Lahti University of Applied Sciences
Degree Programme in International Business Management
Perälä, Kimmo: Case Study for Private Label Product
Online Launch
Master’s Thesis in International Business Management; 81 pages, 7 pages of
appendices
Autumn 2016
ABSTRACT
This paper is a case study about starting a new online business. Target of the
paper is to analyze different possibilities for a new, but, sustainable business.
Different market places and all associated business models will be analyzed, and
the most suitable ones will be selected.
Sales potential for different products will be investigated. Market demand, market
depth, profitability and sustainability will all be considered. A new private label
brand will be created, and a new product will be customized. Selected products
will be purchased, and introduced on sale to the selected marketplace.
Sales data for these products will be gathered, and different factors impacting the
sales will be analyzed. Gathered data will be compared to the theoretical
conclusions done earlier.
This paper will use publicly available tools to analyze different online
marketplaces, business models and product sales opportunities. Actual sales data
will be collected, and analyzed in contrast to the research questions and to the
conclusions drawn during the theoretical phase of the paper.
Conclusions from the data will be drawn, and suggestions for future will be
addressed.
Key words: E-commerce, online, business model, private label, amazon, fba

CONTENTS
ABREVIATIONS vi
LIST OF FIGURES vii
LIST OF TABLES ix
1 INTRODUCTION 1
1.1 Background 1
1.2 Research Questions, Objectives and Scope 2
1.3 Knowledge Base of The Research 2
1.4 Research Approach 3
1.5 Structure for The Research Report 4
2 E-BUSINESS PLATFORM FOR THE CASE STUDY 4
2.1 Overview of The Global E-Business Market 4
2.2 Comparison of Different E-Business Platforms 5
2.3 Amazon 7
2.3.1 Amazon at A Glance 7
3 BUSINESS MODEL FOR THE CASE STUDY 8
3.1 Retail Arbitrage 8
3.2 Drop Shipping 8
3.3 Wholesale 9
3.4 Private Label 9
3.5 Fulfilment by Amazon 10
4 RESEARCH METHODOLOGY 11
4.1 Selection of Amazon Marketplace 11
4.2 How to Select A Good Product to Sell, And A Good Niche to
Enter? 12
4.3 Analysis of The Sales Potential 14
4.4 Tools for Investigations 16
4.5 Analysis of The Fitness Category 20
4.6 Seasonality and Long-Term Sustainability 22
4.7 Customer Review Analysis 26
4.8 Expense & Profit Analysis 28
4.9 Supplier Screening & Search for The Competitive Edge 35

5 MARKET ENTRY STRATEGY 38
5.1 Introduction 38
5.2 Product Launch Strategy 39
5.3 Keywords 40
5.4 PPC 41
5.5 Promotions & Reviews 42
6 SALES DATA ANALYSIS 43
6.1 Unit Sales Per Day 43
6.2 Variables Impacting Sales 45
6.2.1 Reviews 45
6.2.2 Images 47
6.2.3 Title 50
6.2.4 Bullets 51
6.2.5 Pricing 51
6.2.6 Description 52
6.2.7 PPC 53
7 CONCLUSIONS AND DISCUSSIONS 58
7.1 Key Results 58
7.1.1 Research Question #1: What Is the Best Online Platform to
Start Selling A New Product 58
7.1.2 Research Question #2: Is It Possible to Determine What Is A
Good Product To Sell Online? 59
7.1.3 Research Question #3: Is It Possible to Successfully
Introduce A New Product To A Selected Marketplace? 59
7.1.4 Research Question #4: What Are the Key Variables
Impacting the Successful Sale? 60
7.2 Lessons Learnt 62
7.2.1 Usage of Review Services and The Different Product Launch
Strategies 62
7.2.2 Differentiation and Market Entry Difficulty 64
7.3 Limitations and Suggestions for Future 66
7.3.1 Need for Capital Investment 66
7.3.2 Number of Products in Sale 67
7.3.3 Expanding to other Amazon Marketplaces and the Utilization
of FBA 67
7.3.4 Expanding Beyond Amazon 68

8 SUMMARY 69
APPENDICES 75

ABREVIATIONS
BSR - Best Seller Rank
FBA - Fulfillment by Amazon
FBM - Fulfillment by Merchant
PPC - Pay Per Click
URL - Uniform Resource Location
VAT - Value Added Tax

LIST OF FIGURES
Figure 1. Product BSR is visible in listing. ........................................................... 15
Figure 2. Jungle Scout reveals the selling data based on the products BSR for
different categories in Amazon.com. ..................................................................... 16
Figure 3. Method of analyzing the sale figures for the Amazon UK and the
Germany marketplaces. ......................................................................................... 17
Figure 4. The most important attributes of the listing include 1) product images, 2)
the number of reviews and the average rating of them, 3) product title and the 4)
bullet points to describe the product. ..................................................................... 18
Figure 5. Method of analyzing the scores for different products. ......................... 20
Figure 6. Selling and listing data summary based on median data values for both
the UK and the German marketplaces. .................................................................. 21
Figure 7. Selling and listing data summary based on median data values for both
the UK and the German marketplaces; sorted in decreasing order of interest. ..... 21
Figure 8. Example of resistance bands. ................................................................. 22
Figure 9. Google Trend data for resistance band words in Germany. ................... 23
Figure 10. CamelCamelCamel price history data for competitor product #1. ....... 24
Figure 11. CamelCamelCamel price history data for competitor product #2. ....... 25
Figure 12. CamelCamelCamel price history data for competitor product #3. ....... 25
Figure 13. Illustration of the overall FBA process ................................................ 29
Figure 14. Supplier quote comparison. .................................................................. 30
Figure 15. Logistics options comparison. .............................................................. 30
Figure 16. Revenue structure for the 1st order. ..................................................... 34
Figure 17. Supplier comparison. ............................................................................ 37
Figure 18. Daily sales figures. ............................................................................... 44
Figure 19. Impact of number of reviews on sales. ................................................. 46
Figure 20. Impact of number of review ratings on sales. ...................................... 47
Figure 21. PPC data sorted by impressions. .......................................................... 55
Figure 22. PPC data sorted by click rates. ............................................................. 56

Figure 23. PPC data sorted by conversion rate. ..................................................... 57
Figure 244. Selling and listing data analysis of hand strengtheners in Amazon UK
marketplace. ........................................................................................................... 76
Figure 255. Selling and listing data analysis of hand strengtheners in Amazon
German marketplace. ............................................................................................. 76
Figure 266. Selling and listing data analysis of weight lifting belts in Amazon UK
marketplace. ........................................................................................................... 77
Figure 277. Selling and listing data analysis of weight lifting belts in Amazon
German marketplace. ............................................................................................. 77
Figure 288. Selling and listing data analysis of exercise bands in Amazon UK
marketplace. ........................................................................................................... 78
Figure 290. Selling and listing data analysis of ab trainers in Amazon UK
marketplace. ........................................................................................................... 79
Figure 301. Selling and listing data analysis of ab trainers in Amazon German
marketplace. ........................................................................................................... 79
Figure 312. Selling and listing data analysis of pull-up bars in Amazon UK
marketplace. ........................................................................................................... 80
Figure 323. Selling and listing data analysis of pull-up bars in Amazon German
marketplace. ........................................................................................................... 80

LIST OF TABLES
Table 1. Total order expenses. ............................................................................... 32
Table 2. Daily sales and cumulative sales data...................................................... 45
Table 3. Impact of main image on the number of sessions. .................................. 48
Table 4. Impact of main image on the conversion rates. ....................................... 49
Table 5. Impact of additional image on the conversion rates. ............................... 49
Table 6. Average amount of daily sessions for different title options. .................. 50
Table 7. Impact of different bullet points in the conversion rates. ........................ 51
Table 8. Impact of pricing in the conversion rates. ............................................... 52
Table 9. Impact of proper description in the conversion rates. ............................. 53
1
1 INTRODUCTION
1.1 Background
The internet and the social media based innovations are changing the business
landscape on an increased speed. Online platforms offer easy and efficient tools to
compare products and services, and to purchase them by a push of a button.
As it is very easy for a consumer to buy products and services online, it is also
easier than ever to sell products and services online. The internet offers the
possibility to expose one’s online store in front of all people with an access to
internet.
There are several benefits in doing business online, in comparison to having an
actual physical store somewhere. Cheap expenses of establishing the business is
one of the most obvious ones (Mintzer, 2014). As an example, there is no need to
buy or rent an expensive store alongside a busy street. In the beginning, only
things needed are a web page, maybe a Facebook page, and depending on the type
of business, maybe an e-shop application. Because of the low level of investments
needed, also the associated risks will be small. For many starting entrepreneurs,
this is one of the attracting forms of an online business. (Daniel, Di Domenico and
Sharma, 2015)
Global reach is also one the most important aspects of e-business (Mintzer, 2014).
In theory, every single person who has an access to the internet, will have an
access to an online shop. There is absolutely no easier way to have a business
exposed to as wide customer base than doing it in an online world. Given the
nature of the internet, a very beneficial feature of e-business is that it is open 24/7
(Mintzer, 2014). Once the necessarily set ups have been done, pretty much
everything that are needed for an e-business to run, can be automized. There are
no restrictions from work hours or from time zones.
2
1.2 Research Questions, Objectives and Scope
This research is a case study to evaluate the opportunities of creating a new e-
commerce business.
The research questions of this study are:
1. What is the best online platform to start selling a new product?
2. Is it possible to determine what is a good product to sell online?
3. Is it possible to successfully introduce a new product to a selected market
place?
4. What are the key variables impacting the successful sale?
The objective of this study is to use theoretical tools to determine a successful
product to sell on a selected e-business platform, and then bring that product on
sale to verify the theory in practice. Target is to introduce a brand new physical
product, and to sell that profitable.
1.3 Knowledge Base of The Research
E-commerce in general is very popular and trendy way of conducting business.
For some of the more advanced and specific topics, there are very few literature or
academic research available. However, there are lots of online resources. Many
successful sellers are providing consulting, free education material, and online
courses.
The by far most popular way of gathering information of this topic, are the many
podcasts that are available. There are tens of podcasts available, and the most
famous ones are getting tens of thousands of downloads every week. Some of
these podcasts offer very detailed and even hands-on type of information, that can
be implemented to practice; and to launch different types of e-businesses. The

3
information is very practical and useful, intended for persons with little or no
previous background.
Some podcasts offer different strategies for product launches, marketing and other
vital aspects of the online businesses. Successful sellers are interviewed and they
share their tips and strategies for running their businesses. By combining and
filtering all this information, it is possible to gather a relatively comprehensive
skill set.
Many sellers are also sharing their experience and knowledge on different internet
forums and Facebook groups. Even though this is not quite an academic source of
information, these have proven to be quite meaningful and important. Search
engines and selling platforms are constantly changing the ways they operate, and
the way their algorithm work. People are relatively openly sharing their
observations with each other, which would otherwise take several days or even
weeks for others to observe.
All data in this research is verified on a practical level. Actual physical product
will be purchased, and introduced on sale. This sales data will be analyzed in
detail. Sales experiment will be conducted, and the impact of different variables
will be analyzed. Summary, conclusions and recommendations will close the
study.
1.4 Research Approach
The research methods include two main elements: Theoretical tools and actual
practical sales data.
The investigation is carried out using different industry specific tools that are
available. The market potential, sales volumes, and different variables impacting
the sales can be analyzed from publicly available data.
The theoretical data will be verified with actual sales data.

4
1.5 Structure for The Research Report
The research phase will first concentrate on the e-commerce market on a general
level. The investigation will then penetrate deeper into the specific options to
conduct e-business, and finally the best option will be chosen.
In the following chapter, the focus will be on the ways of determining suitable
products for sale; different tools will also be presented.
After the theoretical part, the actual physical product will be launched, and this
sales data will be analyzed. This is followed by the conclusions, discussions and
summary.
2 E-BUSINESS PLATFORM FOR THE CASE STUDY
2.1 Overview of The Global E-Business Market
There is a huge potential in the e-business worldwide. In 2014, the value of the
global B2C e-business was almost 2 trillion $. This is also a growing business,
there were 24% increase compared to the sales in 2013. Asia-Pacific is the biggest
e-business area with 770 billion $ sales in 2014 (39.6% share). Europe is slightly
larger market than the USA, with e-business values of 567 B$ (29.2%) and 523
B$ (26.9%), respectively. Latin America, Africa and other parts of the world split
the remaining business (4.3%). (About-Payments.com, 2016)
When comparing different countries, China is the biggest market area in e-
business, followed by the USA. According to Emarketer.com 2016, the list of
largest global e-commerce Market areas (by revenue) in 2014, were:
1. China 426.26 B$
Increase of 35% from 2013
Top online retailer: Alibaba
E-Commerce sales as % of total retail sales: 10.1%
2. The USA 305.65 B$

5
Increase of 15.7% from 2013
Top online retailer: Amazon
E-Commerce sales as % of total retail sales: 6.5%
3. The United Kingdom 82 B$
Increase of 16.5% from 2013
Top online retailer: Amazon
E-Commerce sales as % of total retail sales: 13.0%
4. Japan 70.83 B$
Increase of 14.0% from 2013
Top online retailer: Rakuten
E-Commerce sales as % of total retail sales: 4.9%
5. Germany 63.38 B$
Increase of 22.1% from 2013
Top online retailer: Amazon
E-Commerce sales as % of total retail sales: 7.3%
(The data doesn’t include travel website nor event tickets)
Smaller individual markets, like Finland, are not included in to the analysis, as the
target is to focus on the larger market areas.
With these impressive global e-business figures, it is easy to conclude that there is
a clear potential for a new e-business company to make revenue. Competition
must be tough, but the markets are very big and attractive.
2.2 Comparison of Different E-Business Platforms
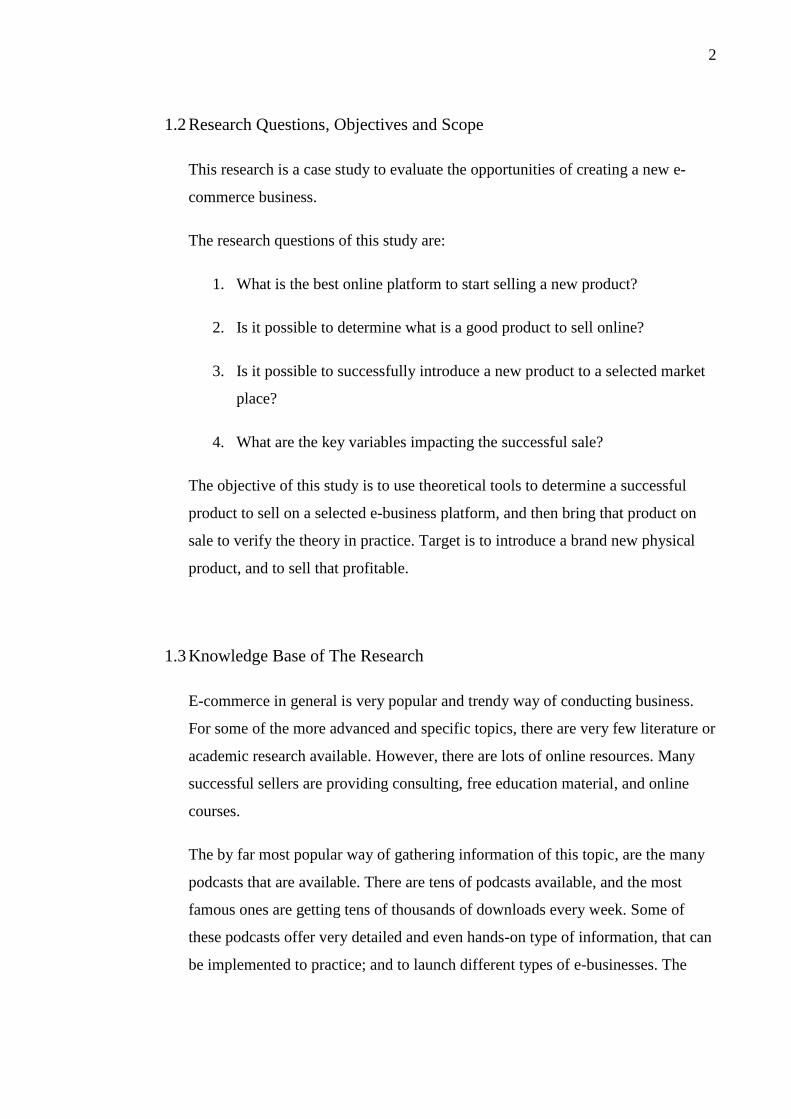
In terms of the numbers of the monthly unique visitors, the Alibaba group is
clearly the largest online retail platform. Based on the data from June 2014,
Taobao, Alipay and Alibaba have together over 800 million unique monthly
visitors, whereas Amazon has about 500 million unique monthly visitors. eBay
has around 268 million unique monthly visitors.
6
1. Taobao (part of Alibaba Group)
601 million unique monthly visitors
2. Amazon
524 million unique monthly visitors
3. eBay
268 million unique monthly visitors
4. Alipay (part of Alibaba Group)
105 million unique monthly visitors
5. Alibaba (part of Alibaba Group)
107 million unique monthly visitors
(RocketCompanies, 2016)
In this study, the focus of doing e-business will be in the western markets. Later
the business can be expanded to Asia, and possible to other areas as well, but for
now the focus is not there. This being said, Europe and North America are the
areas that will be investigated more closely.
Amazon is the clear market leader in the European E-commerce business, with
combined European operations revenue over 21 B€ in 2014. German based Otto
Group is the second largest with 6.50 B€ revenue in 2014. (Ecommerce News,
2016) eBay is Europe’s third largest online retailer, with 4.73 B€ revenue in 2014.
(Statista, 2016)
In North America, the net sales of Amazon reached 55.469 B$ in 2014 (Amazon,
2015). In 2014, eBay’s USA revenue was 8.495 B$ (Statista, 2016).
As Amazon is clearly the largest western platform for online retailing, it will be
chosen for more detailed analysis.
7
2.3 Amazon
2.3.1 Amazon at A Glance
Amazon is a US based online retailing company established in 1994 Seattle, USA
(Finance.yahoo.com, 2016). As of 2015, Amazon has over 120 million different
products on sale (Rankin, 2016), and as of the third quarter of 2015, the e-retailer
reported more than 294 million active Amazon customer accounts worldwide
(Statista, 2016).
In 2014, the net sales of Amazon reached 88.988 B$. Sales in North America
were 55.469 B$ and international sales were 33.519 B$ (Amazon, 2015). In 2014,
Amazon Germany sales were 11.9 B$, Amazon UK sales were 8.3 B$, and
Amazon Japan sales were 7.9 B$. In total, Germany, UK and Japan occupy 85%
of Amazon international sales. (Walsh, 2016)
In Amazon’s Marketplace, Amazon allows third-party sellers to compete against
each other and against Amazon’s own retail category management. This
competition is attracting new customers, which in turn attracts more third-party
sellers. Marketplace and third-party selling has originated from the US, but has
rapidly grown to be truly international. In 2014, Amazon had third-party sellers
from over 100 countries. 20% of the third-party sales occurred outside the seller’s
home country in 2014. In 2014, third-party sellers were responsible of around
40% of Amazon sales globally. They sold over 2 billion units in total. Third-party
sellers are an important part of Amazon’s strategy and Amazon is actively
supporting third-party sellers via different tools and automation in their software.
(Amazon, 2015)
Amazon Prime is a membership program for the Amazon customers, and an
important part of the Amazon’s business model. Free two-day shipping is the
biggest benefit for Prime members. Additional benefits include things like free
movies and TV shows, free e-books, unlimited music streaming and unlimited
photo storage. Third-party sellers are eligible to be part of the Amazon Prime.
This is a very attractive property for retailers. (Amazon.com, 2016)
Amazon is chosen as the platform to conduct the case study.

8
3 BUSINESS MODEL FOR THE CASE STUDY
There are different ways to conduct online business in Amazon. The most
common ones are discussed here.
3.1 Retail Arbitrage
Retail arbitrage is a process where a seller purchases products, typically from a
retail store, on a great discount, and then re-sells them with profit. Retail arbitrage
has been relatively popular especially in the USA; this market is quite suitable for
this business model. Large retail stores, like Wal-Mart, might have large number
of products on great discounts. Local sellers can purchase these, and then list on
some online site for sale. (The Work at Home Wife, 2016)
Retail arbitrage will not be selected for this case study. The entrepreneur is
operating from Finland, which is not suitable market for this business model.
Also, the scalability of this business model is not large enough.
3.2 Drop Shipping
In drop shipping, the seller will act as a middle-man. The seller will make a deal
with a manufacturer for a fixed price of the manufacturer’s product. After this, the
seller will list the product on his/her online selling platform. When a customer
orders the product from the seller, the seller will make an order to the
manufacturer, who will ship the product to the customer. The seller never sees the
product himself/herself (Atkins, 2016).
Drop shipping business model works only for small brands. Big brands would not
benefit from this kind of arrangement, but small brands might. If a brand is non-
established, it is typically beneficial for the manufacturer to offer its products to as
many selling platforms as possible. A good drop-shipper might be able to sell
large quantities, and he/she might have good discounts from the manufacturer.
9
Drop shipping is also excluded from this case study. The main reason is the lack
of long-term sustainability – all other sellers might be able to start selling the
same product. This could result in price competitions and decreased profits.
3.3 Wholesale
In wholesaling, the seller buys the inventory from the wholesaler. Wholesaler is a
middle-man, who buys large quantities from the manufacturer, and then sells
these to other sellers with smaller volumes. Wholesaler purchases large quantities
directly from the manufacturer, thus obtaining large discounts. Because of this,
the seller can buy the products cheaper from the wholesaler; if compared buying
directly from the manufacturer. (Investopedia, 2016)
Wholesaling is an interesting option, but this option is also excluded due to the
lack of sustainability – other sellers can always buy the same products. There is
no exclusivity for the brand, making it too vulnerable for price wars.
3.4 Private Label
In private label business model, the seller will create its own brand. The selected
products will be purchased from a manufacturer, who can sell unbranded
products. The seller will customize the products, together with the manufacturer,
to match the required specifications. In addition, the product will be customized to
reflect the sellers selected brand. Typical example is that the brand’s logo will be
inserted on to the product and the package. After these actions, the product is
totally new and “owned” by the seller. (BusinessDictionary.com, 2016)
To make this business model sustainable, the modifications and branding to the
product must be meaningful enough. It must be a unique product. When this is
done, it is possible to apply for patents and trademarks, and to make the product
and brand owning even more legitim.
10
Private label will be selected as the business model in this case study. If a private
labeling is performed successfully, it is possible to have a true exclusivity on the
selected product.
3.5 Fulfilment by Amazon
There are two methods of shipping the products to Amazon customers – either by
the seller, or letting Amazon to do it. Fulfillment by Merchant, FBM, is a method
where the seller will ship the product by himself/herself to the customers. This
method will be abandon in this case study – this is not a scalable business model
and the business will be operated from different country where they are sold. The
shipment fees would impact too much on the profits.
Amazon has made its Fulfilment by Amazon – FBA business model to be very
attractive and as easy to enter as possible. The key element in FBA is, that sellers
can start selling to a very large customer base very easily.
In FBA business model, the seller must ship the products to a selected Amazon
warehouse. The products must be packed and labeled per strict Amazon
instructions. Then the seller must list the products into the Amazon marketplace.
To do this, the seller must open an account into the Amazon seller central; but this
is very straightforward and easy thing to do. Also, the product listing must be
conducted following Amazon’s instructions.
Once the products have been successfully shipped and listed to Amazon, the seller
is basically ready. After that, Amazon will take care of everything else. When a
customer enters the Amazon marketplace, it will see the product listed in Amazon
– among all other products. If the customer chooses to buy the product, it will
only deal with Amazon. The purchase procedure will happen inside Amazon’s
secured web store system and the payment will be sent to Amazon.
Once Amazon has received the payment, they will process the product delivery.
Amazon will collect the item from their own warehouse, Amazon will pack the
product, and Amazon will ship the product to the customer. Additionally, if there
11
is any need for customer service or e.g. a refund; Amazon will take care of that as
well. Then, every other week, Amazon will pay the seller for the sales; after
reducing its own profit from the sales.
The benefits for a seller to start selling on Amazon marketplace hence are:
Ability to have own product on sale for a huge customer base
Amazon is very established e-commerce site with large sale volumes
Amazon will also take care of the product deliveries
Possibility to obtain so called “passive income”
Once the products are shipped to Amazon warehouse and listed to the
marketplace, the seller basically doesn’t have to do anything. Amazon will
take care of everything.
The disadvantage of FBA is, that Amazon will charge the seller for everything.
There is a monthly fee, a storing fee, a sales commission fee and a shipping fee.
So, each seller must calculate carefully that the large sales volumes will
compensate the high fees associated with it.
Amazon, with its FBA business model, is chosen as the platform to conduct the
case study.
4 RESEARCH METHODOLOGY
4.1 Selection of Amazon Marketplace
Amazon has multiple marketplaces. The original and largest is amazon.com,
which is the United States marketplace. In 2014, sales in the USA were 55.469 B$
and international sales were 33.519 B$ (Amazon, 2015). In 2014, Amazon
Germany sales were 11.9 B$, Amazon UK sales were 8.3 B$, and Amazon Japan
sales were 7.9 B$. In Europe, Amazon has marketplace also in France, Italy and in
Spain – but all these are clearly smaller in revenue. (Walsh, 2015)
12
Amazon.com would be the largest marketplace to start the FBA business, but this
is rejected in this case study for few reasons. The biggest reason is the complexity
of taxation and customs. The business in this case study will be operated from
Finland, and there are many additional customs and taxation related items that are
present in the USA sales operations; in comparison to the European operations.
Second reason not to go to amazon.com is the competition. Even though there are
more sales to be shared among sellers, there is also more competition. The FBA
business model is relatively popular in the USA.
Complexity of taxation and customs is the reason also for not to enter the Japan
market. This leaves the German and UK marketplaces as the two most interesting
ones. German marketplace is selected as the entry market in this case study. The
benefits of German marketplace over UK marketplace include three main points:
Sales volumes of amazon.de are larger than in amazon.co.uk
Competition is in many cases smaller in amazon.de than in amazon.co.uk
FBA business model is not so popular in amazon.de than in amazon.co.uk
(Ward, 2015)
There are fewer questions marks over German market than over the UK market
The UK is not part of Schengen and they are voting to resign from the EU
– taxation and legal issues might face some unwanted changes
So amazon.de marketplace is chosen. The only disadvantage of this is, that it
works in German language. But local native German speaking contacts will be
used to support the business.
4.2 How to Select A Good Product to Sell, And A Good Niche to Enter?
It is possible to sell almost anything in Amazon. As of 2015, Amazon had over
120 million different products on sale (Rankin, 2015). It is just a matter of
choosing what to sell. Depending on the motivation and on the targets, there are
different ways to determine what to sell. Some sellers are cherry picking
individual products from different categories and selling them with changing

13
success. In this case study, the target is to build a sustainable business around this
business model (and to expand it beyond Amazon later).
There are few critical elements that must be met when one is building a
sustainable business on the FBA business model. The first thing is to choose a
product niche that the entrepreneur is enthusiastic about, or at minimum is
somewhat interested in. As in any business, there are no fast track profits
expected, and it will take years to build a steady and profitable business. If the
niche is something that the entrepreneur doesn’t like, or even hates; it will not
have a very profound base for a long and sustainable business. There will be
customer service, product inquiries and other kind of activities that are related to
the product niche in question; and naturally everything will be much easier if the
market and products are appealing.
Second element is about building a brand. The business can be started with one
product, but to grow the business, more products should also be introduced. If the
products are somewhat related to each other, there are many benefits available. If
the customers are interested in one of the products, they will more likely be
interested in other products belonging to the same niche. E.g. if a customer
decides to buy a kitchen knife, he/she might be interested in buying a chopping
board also. If both products are available from the same company, with the same
brand; customer might easily buy them both. Additionally, Amazon marketplace
will promote similar type of products very actively to the customers. Amazon is
all about maximizing sales, and if one company can provide multiple products for
the same niche, Amazon will offer this kind of free advertisement.
Managing a brand is easier than managing a bundle of products that do not
correlate with each other. The customer base will be more homogeneous and there
is not so much need to be aware of different elements related to these topics. One
doesn’t need to be an expert on multiple areas. The last positive argument
favoring branding, is the exit plan. A successful brand is easy to sell, if one wants
to get rid of the business. (Coats, 2016)
As the target is to build a brand, it is essential to assure that there is enough depth
in the market. This means, that there must be enough existing sales. As discussed
14
earlier, this is quite easily demonstrated in the Amazon marketplaces using the
BSR numbers. Additionally, there must be room to enlarge the business; there
must be ability to have multiple products launched on the same niche. Naturally
there must also be enough sales volume available for all the intended products.
Competition analysis is also very important point. It does not make sense trying to
enter a market with very fierce competition. A start-up cannot fight against large
established international brands as an example. Additionally, if there are signs of a
brutal price war, it might make sense to stay away from that market segment.
(Landowski, 2016)
In summary, the key elements in choosing the product niche and first product are:
The niche is interesting to the entrepreneur
It is possible to build a brand on the niche, to launch multiple products
There is enough depth in the market: Multiple companies that are already selling
the same type of products considerable amounts
The competition is not overwhelming
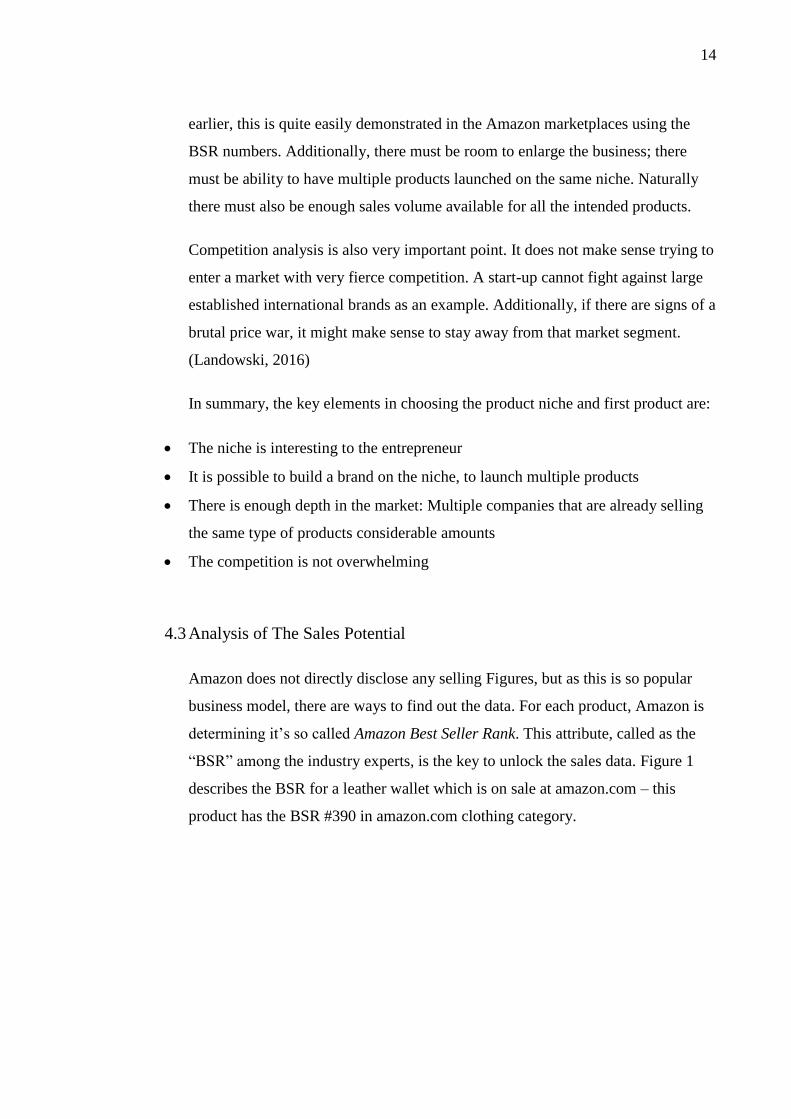
4.3 Analysis of The Sales Potential
Amazon does not directly disclose any selling Figures, but as this is so popular
business model, there are ways to find out the data. For each product, Amazon is
determining it’s so called Amazon Best Seller Rank. This attribute, called as the
“BSR” among the industry experts, is the key to unlock the sales data. Figure 1
describes the BSR for a leather wallet which is on sale at amazon.com – this
product has the BSR #390 in amazon.com clothing category.
15
Figure 1. Product BSR is visible in listing.
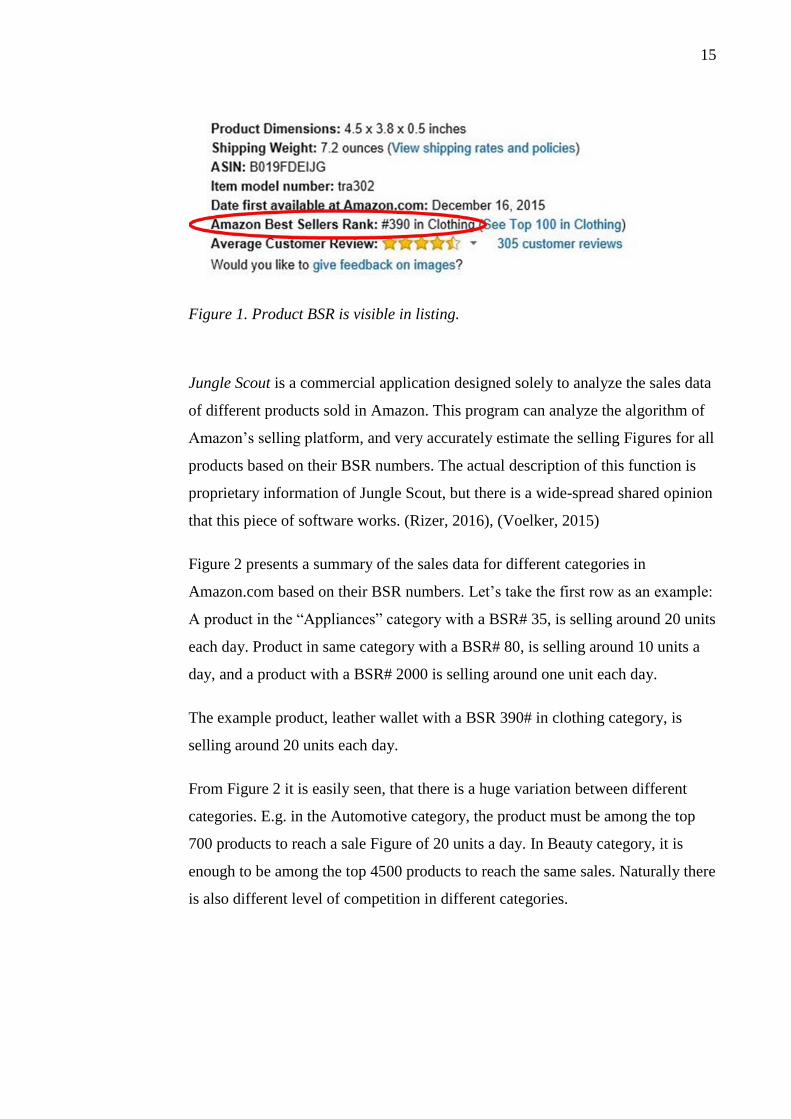
Jungle Scout is a commercial application designed solely to analyze the sales data
of different products sold in Amazon. This program can analyze the algorithm of
Amazon’s selling platform, and very accurately estimate the selling Figures for all
products based on their BSR numbers. The actual description of this function is
proprietary information of Jungle Scout, but there is a wide-spread shared opinion
that this piece of software works. (Rizer, 2016), (Voelker, 2015)
Figure 2 presents a summary of the sales data for different categories in
Amazon.com based on their BSR numbers. Let’s take the first row as an example:
A product in the “Appliances” category with a BSR# 35, is selling around 20 units
each day. Product in same category with a BSR# 80, is selling around 10 units a
day, and a product with a BSR# 2000 is selling around one unit each day.
The example product, leather wallet with a BSR 390# in clothing category, is
selling around 20 units each day.
From Figure 2 it is easily seen, that there is a huge variation between different
categories. E.g. in the Automotive category, the product must be among the top
700 products to reach a sale Figure of 20 units a day. In Beauty category, it is
enough to be among the top 4500 products to reach the same sales. Naturally there
is also different level of competition in different categories.
16
Figure 2. Jungle Scout reveals the selling data based on the products BSR for
different categories in Amazon.com.
4.4 Tools for Investigations
Fitness category is selected for a closer study.
The first thing to clarify is the tool for estimating the sales. As previously
discussed, there is a tool called Jungle Scout that is very efficient to estimate the
product sale Figures based on their BSR numbers. At this point, this data is
available only for the amazon.com marketplace, so some special tricks are needed
to develop a tool to analyze the sales for the German market. Figure 3 presents
how the USA marketplace data is used to approximate the sales Figures for the
UK and the German marketplaces. The UK marketplace is included here as a
reference.

17
Fitness belongs to the Sports & Outdoors category. In Figure 3, under the headline
“BSR in amazon.com”, the equivalent BSR numbers are presented for 20 pcs/day
and 10 pcs/day sales. Per the 2014 figures, Amazon.com had an annual revenue of
55.4 B$, while amazon.co.uk and amazon.de had 8.3 and 11.9 B$ revenues,
respectively. In another word, the Amazon UK sales are around 15% and the
Amazon Germany sales are around 22% of the Amazon North American sales.
These figures can be used to approximate the equivalent BSR numbers in these
marketplaces. The BSR numbers will roughly follow the relation of the revenues.
This means that for a product to sell around 20 units per day in Sports & Outdoors
category on average, its BSR number must be around 1800 in amazon.com, 272 in
amazon.co.uk and 393 in amazon.de.
This is quite logical. For a product to sell 20 units per day, it must be among the
top 1800 products in the huge amazon.com. In the smaller European
marketplaces, the product must be within the top 272 products in the UK and
within the top 393 products in the German marketplace. Similarly, the equivalent
BSR numbers for 10 sales per day are 528 for the UK and 764 for the German
marketplace. These numbers are verified also from other sources. (Ward, 2015)
Figure 3. Method of analyzing the sale figures for the Amazon UK and the
Germany marketplaces.
To have more accurate estimations, the column “Sales*BSR” is calculated. This is
a supportive number, resulting from multiplying the BSR number with the
equivalent daily sales. To minimize the tolerance errors, average values from
these two figures are calculated. These average values are in turn used to calculate
the corrected BSR numbers for the different daily sales. As can be seen from the
Figure 3, the BSR numbers to reach 10, 20 and 40 sales per day are 536, 268 and

18
134, respectively in the UK marketplace; and 775, 387 and 194 in the German
marketplace.
For any given product, its daily sales can be calculated as 5357/BSR in the UK
marketplace and as 7745/BSR in the German marketplace. So, as an example, if a
product in amazon.de Sports & Outdoors category has a BSR of 630, it is selling
around 7745/630 = 12 units per day.
So, this formula can be used to calculate the sales data for all products in Sports &
Outdoors category. But, there are also other elements in an interesting market
segment, that needs to be analyzed before entering. Figure 4 shows an example of
a typical product listing in the Amazon marketplace; the most relevant aspects are
highlighted.
Figure 4. The most important attributes of the listing include 1) product images,
2) the number of reviews and the average rating of them, 3) product title and the
4) bullet points to describe the product.
The competition in the niche must be understood thoroughly. There are few key
attributes in the product listings that the seller can modify to attract the customers
to make the purchase decision. One of the most important items is the amount of
reviews that the product has. This is so called “social proof” element. (Adams,
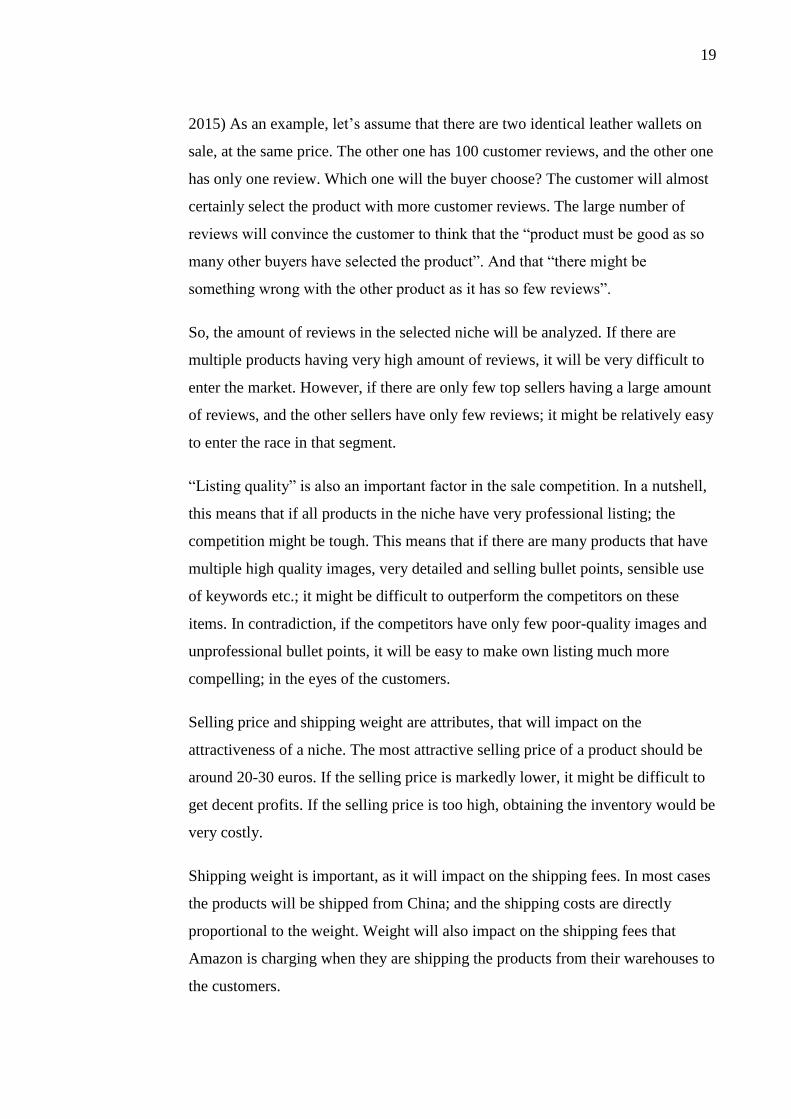
19
2015) As an example, let’s assume that there are two identical leather wallets on
sale, at the same price. The other one has 100 customer reviews, and the other one
has only one review. Which one will the buyer choose? The customer will almost
certainly select the product with more customer reviews. The large number of
reviews will convince the customer to think that the “product must be good as so
many other buyers have selected the product”. And that “there might be
something wrong with the other product as it has so few reviews”.
So, the amount of reviews in the selected niche will be analyzed. If there are
multiple products having very high amount of reviews, it will be very difficult to
enter the market. However, if there are only few top sellers having a large amount
of reviews, and the other sellers have only few reviews; it might be relatively easy
to enter the race in that segment.
“Listing quality” is also an important factor in the sale competition. In a nutshell,
this means that if all products in the niche have very professional listing; the
competition might be tough. This means that if there are many products that have
multiple high quality images, very detailed and selling bullet points, sensible use
of keywords etc.; it might be difficult to outperform the competitors on these
items. In contradiction, if the competitors have only few poor-quality images and
unprofessional bullet points, it will be easy to make own listing much more
compelling; in the eyes of the customers.
Selling price and shipping weight are attributes, that will impact on the
attractiveness of a niche. The most attractive selling price of a product should be
around 20-30 euros. If the selling price is markedly lower, it might be difficult to
get decent profits. If the selling price is too high, obtaining the inventory would be
very costly.
Shipping weight is important, as it will impact on the shipping fees. In most cases
the products will be shipped from China; and the shipping costs are directly
proportional to the weight. Weight will also impact on the shipping fees that
Amazon is charging when they are shipping the products from their warehouses to
the customers.

20
Figure 5 shows the principles of calculating product scores for different products.
The nominal values that will give a score of one are: price 25 euros, 50 reviews,
listing quality estimated as 3 (on scale 1-5), shipping weight of 500gr and BSR of
775. Different attributes have different weights, as shown in Figure 5.
Figure 5. Method of analyzing the scores for different products.
4.5 Analysis of The Fitness Category
The detailed data is presented in appendix a. Please refer to that.
There are different ways to analyze the data, but classification based on median
values is chosen. As can be seen from the data, in many categories there are one
or two sellers who sell very high numbers daily. Median values will ignore the
sellers who sell the most and the least, and should be more practical to use than
average values as an example.
Figure 6 describes the summary of the median values per each product. First
observation is, that the price point is little bit lower than targeted; median prices
are between 10€ and 20€. Second observation is, that each product has more
reviews in the UK marketplace than in the German marketplace. Only the pull-up
bar is an interesting exception. Third observation is that the products are mainly
selling more in the German marketplace, than they are in the UK marketplace.
This data is confirming our earlier conclusion that the German marketplace has
larger sales volumes and less competition.

21
Figure 6. Selling and listing data summary based on median data values for both
the UK and the German marketplaces.
There are two main options to rank the data presented in Figure 6. One way is to
rank them based on the revenue opportunity and another way is to rank them
based on the product scoring (i.e. niche entry difficulty). To rank the different
products, mathematical value “Score*Sales” will be used. This is a multiply of the
product score and the daily revenue. This value as such does not mean anything,
but can be used to analyze both niche entry difficulty and sales opportunity with
one number.
Figure 7 presents the data as ranked based on this value.
Figure 7. Selling and listing data summary based on median data values for both
the UK and the German marketplaces; sorted in decreasing order of interest.
Resistance band in the German marketplace has the highest score, followed by
resistance band in the UK marketplace. These are followed by Ab roller, hand
trainer and pull-up bar from the German marketplace. General trend is that
products in the German marketplace rank higher than in the UK marketplace, only
the weight lifting belt in German marketplace doesn’t rank that high.
Market Product Type Median Price Reviews
Listing
Quality
Shipping
Weight BSR
Product
Score Sales/Day
Revenue/
Day
Score*
Sales
UK Best Sellers in Hand Stengtheners MEDIAN: 12,16 € 116 3,0 200 766 1,0 7 66,61 € 4,9
DE Bestseller in Handtrainer MEDIAN: 11,48 € 50 3,0 199 433 1,2 18 151,61 € 19,0
UK Best Sellers in Weight Lifting Belts MEDIAN: 20,05 € 108 3,0 560 1288 0,8 4 93,94 € 3,5
DE Bestseller in Gewichthebergürtel MEDIAN: 25,74 € 45 3,0 825 3095 1,0 3 74,02 € 5,1
UK Best Sellers in Exercise Bands MEDIAN: 10,25 € 110 4,5 336 174 0,8 32 555,18 € 37,0
DE Bestseller in Fitnesbänder MEDIAN: 12,89 € 74 4,0 200 257 1,0 30 422,24 € 44,9
UKBest Sellers in Core & Abdominal Trainers (ab rollers)MEDIAN: 12,13 € 202 3,0 813 322 0,5 17 179,89 € 12,3
DE Bestseller in Bauchtrainer (AB Roller) MEDIAN: 13,99 € 123 4,0 680 184 0,5 42 841,48 € 22,9
UK Best Sellers in Pull-Up Bars MEDIAN: 16,63 € 46 3,0 2317 964 1,2 6 109,75 € 6,9
DE Bestseller in Klimmzugstangen MEDIAN: 16,47 € 293 3,5 2050 288 0,5 30 661,72 € 15,2
Market Product Type Median Price Reviews
Listing
Quality
Shipping
Weight BSR
Product
Score Sales/Day
Revenue/
Day
Score*
Sales
DE Bestseller in Fitnesbänder MEDIAN: 12,89 € 74 4,0 200 257 1,0 30 422,24 € 44,9
UK Best Sellers in Exercise Bands MEDIAN: 10,25 € 110 4,5 336 174 0,8 32 555,18 € 37,0
DE Bestseller in Bauchtrainer (AB Roller) MEDIAN: 13,99 € 123 4,0 680 184 0,5 42 841,48 € 22,9
DE Bestseller in Handtrainer MEDIAN: 11,48 € 50 3,0 199 433 1,2 18 151,61 € 19,0
DE Bestseller in Klimmzugstangen MEDIAN: 16,47 € 293 3,5 2050 288 0,5 30 661,72 € 15,2
UKBest Sellers in Core & Abdominal Trainers (ab rollers)MEDIAN: 12,13 € 202 3,0 813 322 0,5 17 179,89 € 12,3
UK Best Sellers in Pull-Up Bars MEDIAN: 16,63 € 46 3,0 2317 964 1,2 6 109,75 € 6,9
DE Bestseller in Gewichthebergürtel MEDIAN: 25,74 € 45 3,0 825 3095 1,0 3 74,02 € 5,1
UK Best Sellers in Hand Stengtheners MEDIAN: 12,16 € 116 3,0 200 766 1,0 7 66,61 € 4,9
UK Best Sellers in Weight Lifting Belts MEDIAN: 20,05 € 108 3,0 560 1288 0,8 4 93,94 € 3,5

22
The data for ab rollers and for pull-up bars were somewhat insufficient, so these
will be excluded for now. It is possible re-analyze these later, when additional
products are considered. Hand trainer in the German marketplace and resistance
bands in the UK marketplace are quite interesting as well, but the most interesting
option is resistance bands in the German marketplace.
Figure 8. Example of resistance bands.
4.6 Seasonality and Long-Term Sustainability
It is already confirmed that there is demand and depth in the selected market. In
addition to that, it would be important to understand how stabile the market is. In
some niches, the products are selling much more than average in certain time of
year. Typical examples are toys; most of the sales are generated before Christmas,
in November and early December. Another example are e.g. water sport apparels.
Hot season to sell these is obviously summer time, especially early summer. So,
as the demand and price level for resistance bands have been checked, it is needed
to confirm that the demand and price level is somewhat constant. (Voelker, 2015)
Google Trends is a good and free piece of software, that can be used to investigate
the trends in Google searches. Google is of course different thing than Amazon,
and the interpretation of the data must be done with caution. People come to
23
Google to find information, and they come to Amazon to buy stuff. There is no
clear linear correlation between the Google searches and Amazon sales, but some
conclusions can be drawn. If something is popular in Google, it will most likely
have at least some level of popularity also in Amazon. And same is true also in
the opposite situation; if something doesn’t exist in Google searches, most likely
there will be little or no interest towards that in Amazon either. (Voelker, 2015)
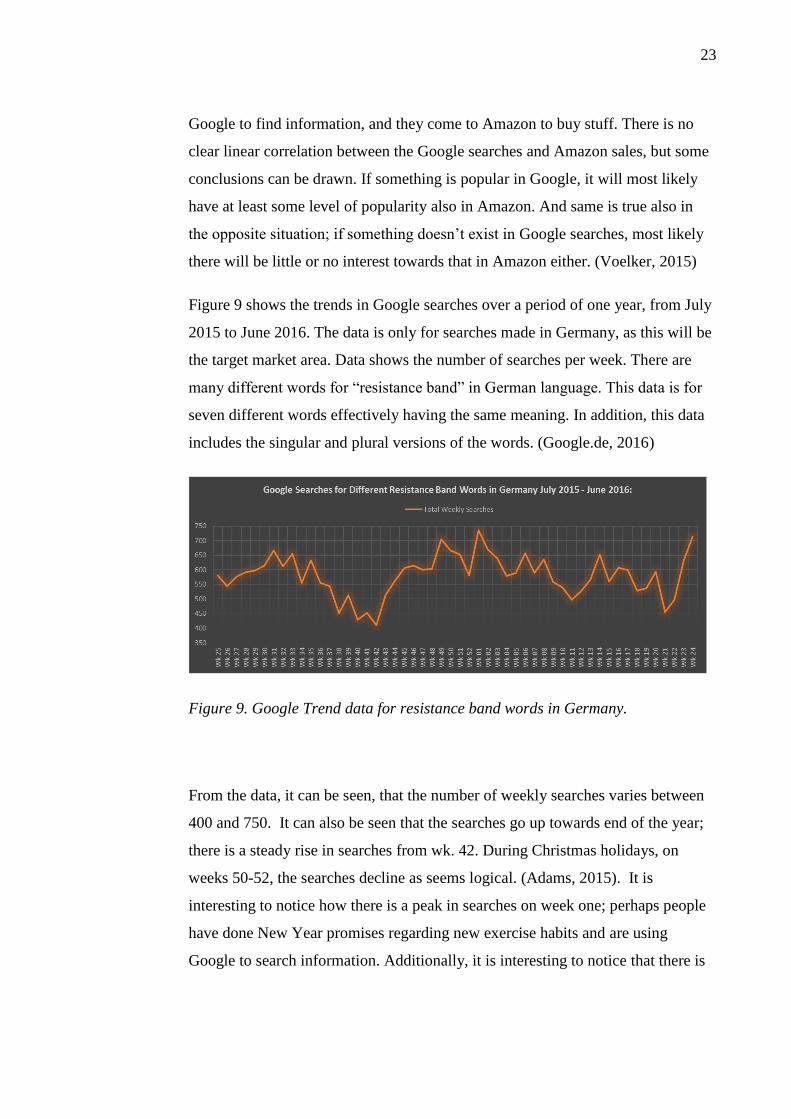
Figure 9 shows the trends in Google searches over a period of one year, from July
2015 to June 2016. The data is only for searches made in Germany, as this will be
the target market area. Data shows the number of searches per week. There are
many different words for “resistance band” in German language. This data is for
seven different words effectively having the same meaning. In addition, this data
includes the singular and plural versions of the words. (Google.de, 2016)
Figure 9. Google Trend data for resistance band words in Germany.
From the data, it can be seen, that the number of weekly searches varies between
400 and 750. It can also be seen that the searches go up towards end of the year;
there is a steady rise in searches from wk. 42. During Christmas holidays, on
weeks 50-52, the searches decline as seems logical. (Adams, 2015). It is
interesting to notice how there is a peak in searches on week one; perhaps people
have done New Year promises regarding new exercise habits and are using
Google to search information. Additionally, it is interesting to notice that there is

24
a clear decrease in searches roughly between weeks 30 and 42. Late summer and
early fall seems to be the most inactive time for this type of products.
Overall conclusion from the graph is, that there is seasonal variation in the interest
towards these products, but there is always some level of searches. There are no
“zero-interest” weeks or months.
Another free and interesting tool to use for analysis is CamelCanelCamel. This is
an online tool, that can be used to track down the pricing information of any
product on sale in the Amazon marketplaces. The URL of the product listing is
inserted into the search field, and result will be historical graph of the products
pricing history. Figures 10-12 show this data for three different competitor
products. (camelcamelcamel.com, 2016)
For product #1 in Figure 10, it can be seen, that the seller has decreased the price
in late November – early December time frame. This is most likely to boost their
Christmas sales, which is quite typical. Otherwise they have kept the price quite
steadily in the 13€ range.
For product #2 in Figure 11, it can be seen, that this seller has also decreased the
price in late November – early December time frame. Before Christmas sales, the
price has been around 14€, but after the Christmas sales, the price has settled to
around the 13€level. One possibility is that the price is adjusted to match
competitors price level.
Figure 10. CamelCamelCamel price history data for competitor product #1.

25
Figure 11. CamelCamelCamel price history data for competitor product #2.
Figure 12. CamelCamelCamel price history data for competitor product #3.
For product #3 in Figure 12, there is no Christmas period sales campaign. There is
a sharp price peak in late November, but this might be just an indication of low
inventory level. Sometimes sellers will make a huge price increase to the selling
price if they are about to run out of inventory. Amazon marketplace doesn’t like if
the buyers would like to buy, but the seller is unable to supply (Coats, 2016).
Many sellers overcome this challenge by pricing the product so high that there
would be no interested buyers. Besides that, the price is flat. This seller did
26
decrease the price after Christmas. This is also quite popular tactic. It is namely
commonly known, that the most silent time of sales is always the first quarter,
especially the first month or so. By decreasing the price, this seller has tried to
boost their sales in this slow season. Other than that, the price is quite steadily on
the 18€ level. This is little wider resistance band than the products #1 and #2 of
this comparison, which explains the difference in price.
Overall conclusion from this data is, that there are no reasons for concerns about
the market. There are normal seasonal variations in the prices, but there are e.g. no
signs of a price war. Also, there are no signs of any “panic selling”.
Based on the data from Google Trends and from CamelCamelCamel, it can be
concluded, that the planned niche and market is healthy, stabile and not over-
competitive.
4.7 Customer Review Analysis
Several vital observations were done by inspecting the customer review sections
for similar types of products. First learning is, that some customers are very
unhappy with the strong latex smell associated with the bands of some sellers.
Latex indeed does have its own unique smell, but the problem seems to be present
only with some special sellers. For some products, there are no mentions at all
about any smell problems. For those products that do have the problem, customers
were quite active in giving out their opinion in their reviews. This is clearly
something to pay attention to.
Skin irritation problem was another complain observed for some of the bands.
Again, some bands seem to be totally free of this kind of problem, but some bands
clearly seem to have an issue with this. The structure of some of the bands seems
to be quite sharp or they seem to be having a relatively high-friction, causing
irritation to the skin. On the other hand, some bands do not have any negative
reviews about this kind of issue. So, this is clearly something that can be
optimized for a better customer experience.

27
There seems to be a common problem of peeling with the thinnest bands. Many
product sellers have received negative feedback over this problem. These
resistance bands come with several different widths, which will give them
different resistance levels when stretched. The narrowest one will give the
smallest resistance. Based on the analysis, none of the wider bands have this
problem, so it clearly seems to be a problem with the narrowest band only. This is
obviously something to watch out for.
Lack of a carry bag is also one of the complaints mentioned in some reviews.
Some customers would like to have a carry bag where they could hand-carry the
bands with them. Surprisingly many companies are selling their bands without
any bag. Some sellers are offering a carry bag, but the quality of those bags look
relatively poor. This is clearly an area where there is room for a better customer
satisfaction.
Most of the reviews, good and bad, have been given to the narrowest versions of
the bands. Conclusion is, that these are the bands that customers are mainly
buying. Business-wise it would make sense to concentrate most of the efforts on
these.
Ability to give customer support in the native language of the customer, is also a
crucial element. Some customers are clearly disappointed, or at minimum
confused, about the poor German language support that some companies are
giving. In some cases, also the response time has been unsatisfactory.
So, the customer feedback analysis was quite informative. The conclusion is that
Customers don’t like resistance bands with strong latex smell
Customers don’t like resistance bands with high-friction surface that irritate skin
Material peeling seems to be a problem with the narrowest bands
Customers would value to have a carry bag with the bands
Customers seem to favor the narrowest bands

28
Customers value fast and native German customer support
4.8 Expense & Profit Analysis
Last but the most important aspect of determining the viability of this business
opportunity, is the expense and profit analysis. Known facts are the approximate
sales volume and the selling prices of all competitor products on the same sales
platform. To evaluate the available profitability of this business, the exact
expenses are needed to be known.
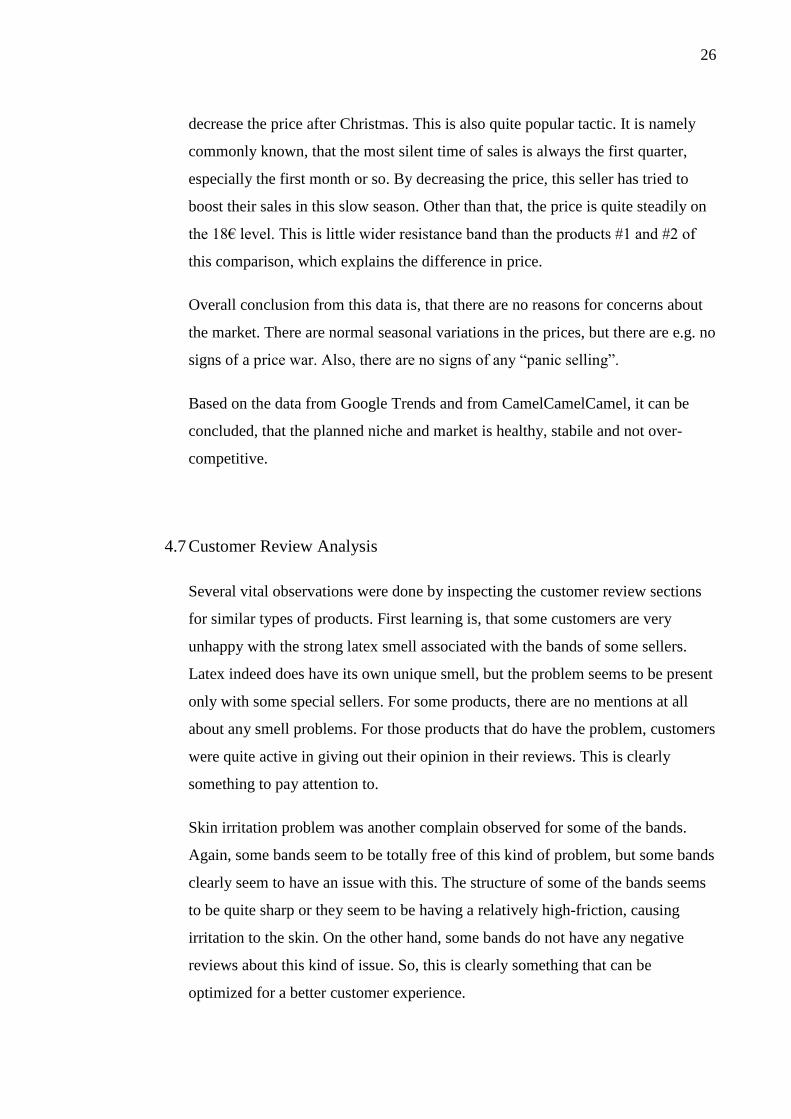
Illustration of the overall process of this business is presented in Figure 13. The
whole process is based on outsourcing everything. The entrepreneur doesn’t need
to be physically present in any of these steps. Product specifications are discussed
and agreed with the supplier, which in many cases is a factory somewhere in
China. Once the products are ready, they will be shipped to Amazon warehouse.
Customer is then able to purchase the products from Amazon. Customer will then
pay the products to Amazon, who will ship them to the customer. Amazon will
take its profits, and will pay rest of the payments to the entrepreneur. So, products
will move from factory to Amazon, and from Amazon to customer. Money in turn
will move from entrepreneur to supplier, and from customer to Amazon, and from
there to entrepreneur.
29
Figure 13. Illustration of the overall FBA process
This will create the opportunity for passive income, but it also means that all these
services need to be paid for. Careful planning is required to minimize risks and
making sure that the business can be executed profitable.
The main items contributing to the total expenses of the products will be 1) the
actual product purchase price, 2) shipment cost from China to Germany, 3) VAT,
4) advertisement costs, and 5) Amazon fees.
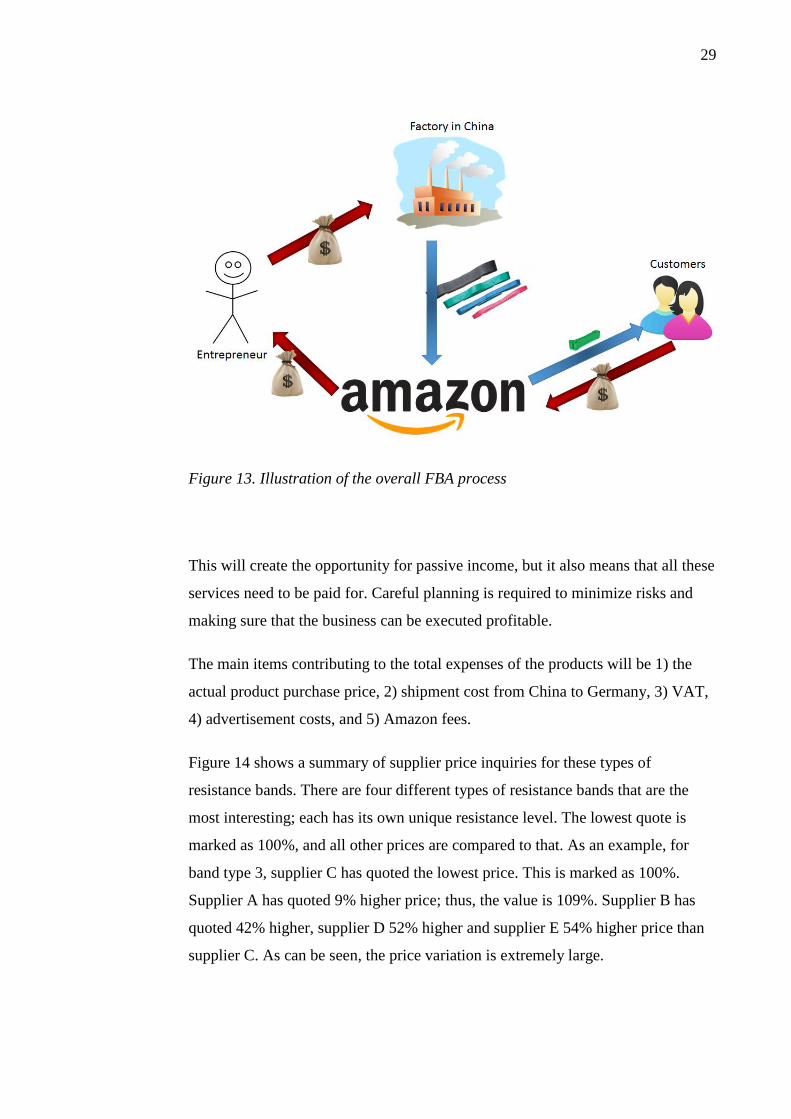
Figure 14 shows a summary of supplier price inquiries for these types of
resistance bands. There are four different types of resistance bands that are the
most interesting; each has its own unique resistance level. The lowest quote is
marked as 100%, and all other prices are compared to that. As an example, for
band type 3, supplier C has quoted the lowest price. This is marked as 100%.
Supplier A has quoted 9% higher price; thus, the value is 109%. Supplier B has
quoted 42% higher, supplier D 52% higher and supplier E 54% higher price than
supplier C. As can be seen, the price variation is extremely large.
30
Figure 14. Supplier quote comparison.
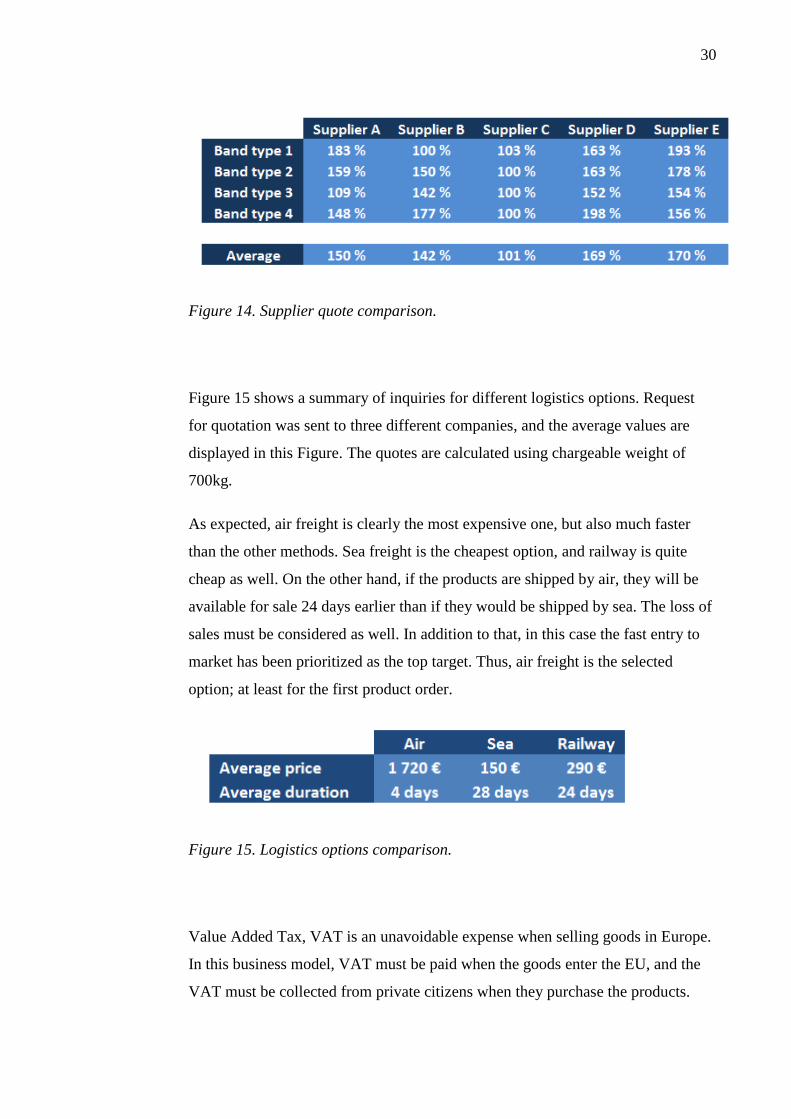
Figure 15 shows a summary of inquiries for different logistics options. Request
for quotation was sent to three different companies, and the average values are
displayed in this Figure. The quotes are calculated using chargeable weight of
700kg.
As expected, air freight is clearly the most expensive one, but also much faster
than the other methods. Sea freight is the cheapest option, and railway is quite
cheap as well. On the other hand, if the products are shipped by air, they will be
available for sale 24 days earlier than if they would be shipped by sea. The loss of
sales must be considered as well. In addition to that, in this case the fast entry to
market has been prioritized as the top target. Thus, air freight is the selected
option; at least for the first product order.
Figure 15. Logistics options comparison.
Value Added Tax, VAT is an unavoidable expense when selling goods in Europe.
In this business model, VAT must be paid when the goods enter the EU, and the
VAT must be collected from private citizens when they purchase the products.

31
These taxes must then be collected and paid to the German tax office. There is no
need for double-VAT, which means that the import VAT can be deducted from
the collected sales VAT. The effective VAT in Germany is 19% for these types of
products.
Advertisement costs are especially important in the beginning stage of the
business. When the products become available in the market place, there are many
things making difficult to sell them. First, there are no product history in Amazon.
This means that it is just another product among tens or typically hundreds of
similar types of products. They have zero sales and zero customer interest. In
Amazon world, this means that there are no reasons for Amazon to promote that
listing. When customers are searching for this product, it will be in the bottom of
the search results, typically somewhere around pages 10 to 30. In practice this
means that nobody can find that. Different promotion and advertisement actions
are essential to get the sales running.
Amazon fees are the fees that Amazon is collecting from its services. These fees
include 15% portion of the product selling price + the product packing and
shipping fee. These fees vary depending on the size and especially by the weight
of the product.
One important aspect of the expenses is the per unit cost. Economy of scale is an
important factor driving down the unit costs in several different phases of the
process. At first, this is evident in the actual product purchase: The price
negotiation power is totally different depending if one is to buy 10 units, 100
units, 1000 units or even 10 000 units. In many manufacturing processes, there are
fixed starting costs and machinery costs, which will be constant independently of
the product number. Naturally, the unit cost will be much lower if the quantity is
higher.
Shipment cost is typically calculated by the weight, which means that more
products will cost more. But there are also some fixed costs which will drive the
unit cost lower for higher quantities.

32
Table 1 summarizes the initial product purchase costs. The most important thing
is the economy of scale, which means that product purchase amount is maximized
within the given budget. Data in table 1 is based on the quotes from the best
manufacturer and from the best carrier.
Table 1. Total order expenses.
0%
10%
20%
30%
40%
50%
60%
70%
80%
90%
100%
Total Order Expenses
Sample orders Competitor analysis Product purchase price
Shipment Listing optimization Promotion
Storing Initial VAT
33
Sample orders are needed to evaluate different suppliers. This is a critical step in
the process; which is many times neglected. If there is even a slight problem in the
product quality in the samples, the alarm bells should ring. Additionally, it is
important to have own feeling and experience on the products that are planned for
sale.
Competitor analysis and listing optimization expenses are costs, that are reserved
for native German speaking assistant. Especially listing copy must be as fluent as
possible.
Promotion expense is an approximation at this point. The advertisement budget is
intentionally relatively large.
Storage fees are paid to Amazon for storing the goods, and initial VAT expense is
the tax paid, when the goods enter the EU. Customs fees are included in the
shipment costs.
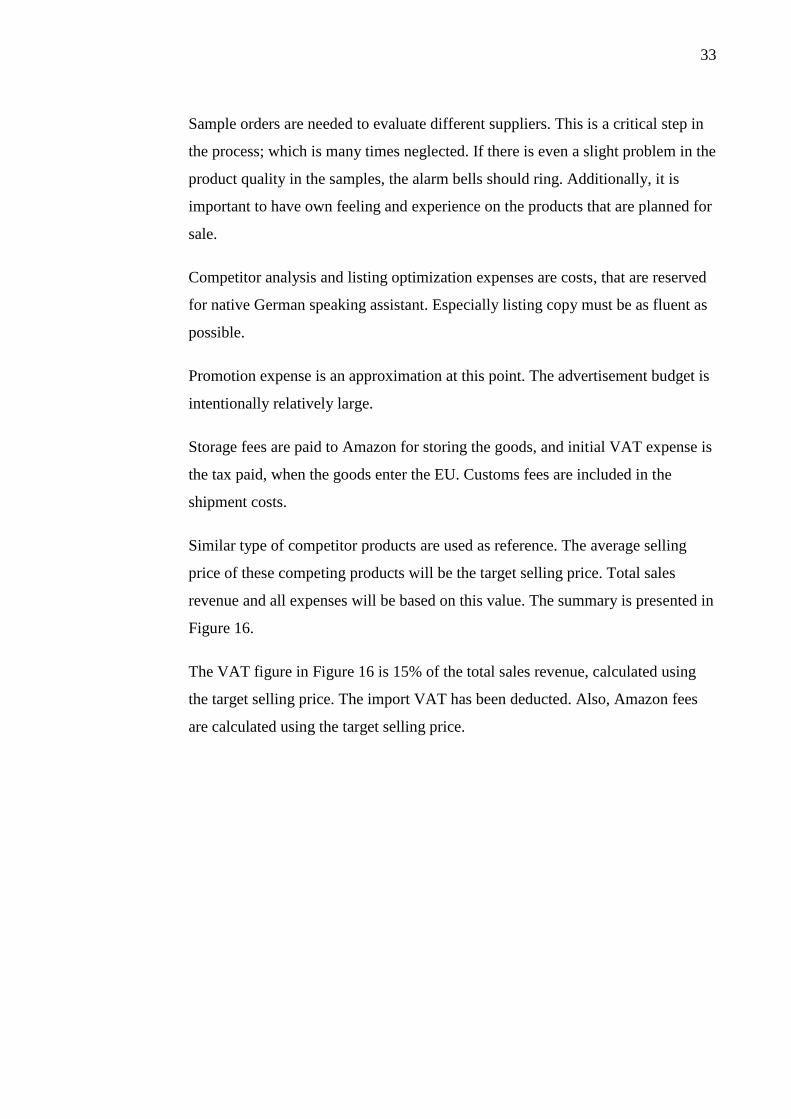
Similar type of competitor products are used as reference. The average selling
price of these competing products will be the target selling price. Total sales
revenue and all expenses will be based on this value. The summary is presented in
Figure 16.
The VAT figure in Figure 16 is 15% of the total sales revenue, calculated using
the target selling price. The import VAT has been deducted. Also, Amazon fees
are calculated using the target selling price.
34
Figure 16. Revenue structure for the 1st order.
By analyzing Figure 16, it can be concluded that there is a possibility for profit in
this business model. If all the products can be successfully sold using the target
selling prices, there should be a possibility for profit.
It should be noted, that some of the expenses are valid for the first order only.
Sample orders, competitor analysis and listing optimization are relatively
meaningless in the big picture, but reduced promotion expenses will be
significant. Some level of promotion should always be done, but the emphasis will
be clearly smaller once the product has reached its natural position in the market
place. This means that the available profit will be higher in future orders.
35
4.9 Supplier Screening & Search for The Competitive Edge
As the business opportunity and viability have been confirmed, the next step is to
find a good supplier for the goods. The target of this case study is to establish a
long-lasting sustainable business, so the intention is not just to find the cheapest
possible option. There are several important aspects impacting the supplier
selection.
Customer service quality is naturally very important factor in the supplier
selection. It is crucial that the communication is seamless, and that the supplier
can answer all questions promptly and efficiently. When dealing with suppliers
from China, the language barrier might sometimes be quite big. When product
specifications or invoice details are discussed; there are no room for
misunderstandings. Also, response time is an important factor in the fast-moving
e-commerce business. It is beneficial to have the questions answered in a timely
manner. Also, the willingness to find answers to also difficult questions is an
important attribute.
As was learned during the market study, there are certain key requirements to the
resistance bands, which need to be met to meet all the customer expectations. This
is the most important technical attribute in supplier selection – the products they
offer, must meet the technical requirements specified. If these items are not
fulfilled, there is no point in doing the business.
Supplier flexibility is also an important factor. The products will need to be
customized and modified, and the willingness of suppliers of doing these actions
is important. The flexibility can also be a combination of the customer service and
the product requirements.
Supplier’s experience on the market is an advantage. There are certain specific
requirements in e-commerce, and especially in the Amazon business; and if the
supplier is familiar with these, the cooperation will be much easier. One example
of this kind of requirements, is the product labeling per Amazon requirements.

36
If the supplier has international certifications, e.g. for trading, it is an advantage. If
the supplier is e.g. part of Alibaba’s Trade Assurance program, it will give a good
“trust element”. It will be safer to conduct business with them.
The Level of quality control is a good measure of the professionality of the
supplier. The quality certifications, documents, tools and practices are the items to
be analyzed when determining supplier’s abilities for effective quality control. As
can be easily understood, it is essential to make sure that the supplier can supply
high quality products. It is hard to recover the damage done, if a customer would
receive a defected product.
There are many good reasons for making sure that the supplier has high ethics.
Already the morale reasons are sufficient reasoning to demand that the supplier is
following all local laws and good practices. In addition to that, it is also very
important for the reputation of the company, not to co-operate with suppliers with
suspicious practices. In the world of the internet, all information is available for
everybody, and bad news will spread in social media very easily.
Lead-time is important for inventory management. Shorter lead-times enable
having less capital tied up in inventory, more rapid reaction ability to demand
fluctuation, and faster time-to-market value. (Private Label Journey, 2016).
Price is of course an important attribute as well. The whole bottom line value will
directly depend on the negotiated purchase price.
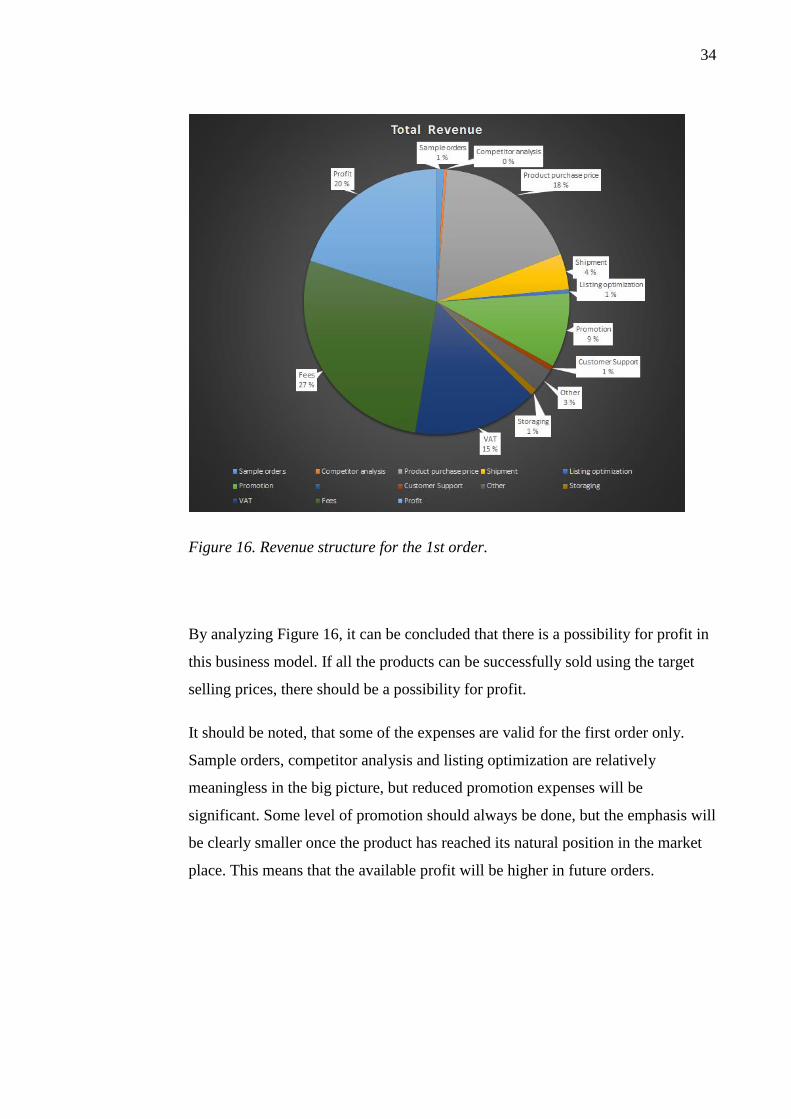
After a comprehensive screening, seven different suppliers were contacted.
Altogether 21 questions were asked, and a dialogue for the product purchase was
opened. Two of the suppliers never gave a decent answer, but rest of the five
suppliers did. After the negotiation was over, these suppliers were analyzed based
on these nine elements discussed above. The result is summarized in Figure 17.
37
Figure 17. Supplier comparison.
As can be seen, there is a large variation between suppliers. Some of the suppliers
are capable on some aspects, some on others. Product requirements, ethics and
price are attributes that might be considered as show-stoppers. Very poor grade in
one of those would in practice mean that the co-operation would be nearly
impossible. As an example, if the product is unable to meet the criteria discussed
above, there are no reasons to purchase those products. Similarly, if there is no
way of doing profitable business with the prices the supplier is offering, there is
no way the business could be sustainable with that supplier. Luckily ethical
aspects are on sustainable level for all suppliers.
As the Figure shows, supplier C is clearly the best option. This supplier is capable
of perfectly meeting all the technical requirements, and can offer very competitive
price, which would enable profitable business. The quality control processes are
on very high level, which gives confidence on the capabilities of this supplier. The
supplier is qualified for all the main ISO certifications, as well as for few other
smaller ones. The supplier is also fulfilling all Chinese market place Trade
assurance criteria.
The only small question marks with this supplier are the market experience and
lead-time. This supplier is not very experienced with Amazon as a marketplace.
However, this is not a show-stopper at all. Lead-time is perhaps the poorest
attribute for this supplier. However, when compared to other suppliers, it is pretty
much on same level.

38
Supplier C is selected as a partner for the 1st product order.
5 MARKET ENTRY STRATEGY
5.1 Introduction
Earlier it has been demonstrated, that there is a potential market existing in the
German market for the resistance bands. There are several manufacturers selling
tens of these items constantly every day. With this information, several important
things can be concluded. First, there is an existing demand. This means that it is
known for a fact that these types of products are selling; there is no need to spend
time or money in creating a demand for this niche. Secondly, there is depth in the
market. As there are several companies successfully offering this type of product,
it can be deduced, that this is not just a niche that one player is dominating.
Additionally, there is no one giant company overruling the other firms. There is
room and depth in the market for another well-run company. Third important
conclusion is, that the demand is continuous. The selling figures are solid over
period, and this is by no means a seasonal product. This information gives one
more certainty of the potential of this niche.
So, there is a market existing, but how it can be known that it is not saturated?
Under what grounds the customers could be expected to buy some new product
instead of the competitors’ products? To find answers to this question, it is
essential to dig deeper inside the Amazon platform. The answer to this question
namely lies in the customer reviews. As demonstrated earlier, there is a customer
review section for each product. This section is very crucial to the success of the
products. If there are no reviews, or if the reviews are poor; it is extremely hard to
convince any customer to buy the product. On the other hand, numerous high-
rating reviews will give enormous social proof element to the product. This is a
common phenomenon in the world of e-commerce, and this drives sellers to
actively ask for feedback from their buyers (Rizer, 2016). By inspecting the
customer reviews for similar types of competitor products, it is possible to get a

39
deeper understanding of the customer expectations and how they have been met
with different products.
There are few key things to consider for a successful market entry. The first one is
the differentiation. As there are many successful sellers already doing well, there
must be something extra in the new product that would make the customers to
want that instead of the competitor product. This is valid for all kinds of products
(and services for that matter), but especially relevant in the case of these
resistance bands. These bands have very simple structure, and there is very little
to play with the actual products. Some innovation is required.
Another key attribute is to create some additional value to the customers. If one
seller can provide something extra, the consumer will most likely select that one,
if all other variables are similar between the products. Many times, the additional
thing don’t need to be anything extraordinary or complex. Often the little things
might make the difference.
Third key aspect in a successful market entry for this kind of market place is the
ability to solve customer problems. Often this is the most powerful aspect. Many
customers are willing to pay if somebody will solve their problems.
5.2 Product Launch Strategy
Product launch is a critical phase in the process. When a new product enters the
marketplace, it will literally be just another product among tens or hundreds of
other similar products. When a new product enters the Amazon marketplace, it
will start from zero. This means, that Amazon has no historical data from that
product – there is no sales history, there is no conversion data, and there is no
keyword data.
Amazon uses many different attributes, when it is ranking products in its
marketplace. When a customer is searching for products, Amazon will display
results based on its search engine algorithm. As an example, when a customer is
searching for “resistance bands”, Amazon will display all results, that it thinks are

40
relevant to that search term. There can easily be many hundreds or even thousands
of search results.
So, how is Amazon determining in which order it will display the results? Answer
is, that it will show the results in the order that statistically makes the most profit
to them. This means, that Amazon will try to maximize the sales, and it will use
its algorithm to determine, which products will most likely result in a sale for a
given keyword. This means, that the products that have been selling for longer
time, will have the advantage. Amazon has the historical data for those products,
it knows that it is very likely that the customer will buy this product; if he/she is
searching e.g. resistance bands. If a new product – which has zero sales – enters
the market; it will be shown as the last search term result.
Luckily, there are few ways to get the sales started for new products as well.
5.3 Keywords
It is possible to assign keywords to each product in Amazon marketplace.
Entering keywords means, that the seller can tell Amazon search algorithm which
words are relevant to the product; from the seller’s perspective.
By optimizing the keywords, it is possible to get visibility for those search terms.
Most likely all the competitors are inserting the keywords as well, so careful
research of suitable keywords will be rewarded. Typically, there are few obvious
keywords for the products, these are good keywords, but everybody knows them,
and are using them. But in many cases, there are several other keywords as well.
These are not so popular, but still relevant.
Long tail keywords are also important. Long tail keywords are formed from
multiple words. E.g. in case of resistance bands, long tail keywords might be e.g.
“resistance band set” or “power bands for work-out”.
Keyword placement is also crucial. Nobody knows for sure, but there is some
evidence that keywords in different parts of the listings are weighted differently.
The most important part is the product title, followed by the bullets. Good
keyword placement includes different keywords in selected locations. But,
41
common sense is also essential. Just stuffing the title full of keywords is most
likely not the best practice.
5.4 PPC
Amazon Pay Per Click, PPC, is an advertisement tool inside the Amazon
marketplace. With PPC, it is possible to bid for keywords, and to have a product
displayed higher on the search results. This is vital especially in the beginning of
product’s lifecycle. Let’s take the word “Resistance Band” as an example. In the
beginning, when the product has no sales at all, it will be displayed among the last
products when a customer is searching for resistance bands. It can typically be on
page 20+ of the search results.
If a bid of 0.50 € is placed on that keyword, the product might be visible on page
four of the search results. This is just an estimation. If a bid of 1.00 € is placed on
that keyword, the product might be visible on page two of the search results. And
a bid of 1.50 € might result that the product would be visible on the first page of
the search results. When a customer clicks that paid advertisement, sum roughly
equivalent to the bid will be charged. When a bid is assigned to a keyword, that
bid is the maximum amount that can be charged from that paid ad. The charged
amount can also be less than that.
The logic behind the PPC is, that Amazon is comparing different bids for different
products. Some popular keywords are very competitive; many sellers are targeting
their advertisement campaigns for that keyword. The result is, that it will be very
costly to have an ad displayed on the first page.
If PPC is used carelessly, it can be very costly. There are several different
strategies for PPC campaigns, but these will not be discussed in detail in this
research. The most important thing is, that the most relevant keywords should be
found. In some cases, it might be an obvious word, but in many cases, there might
be big surprises. For each advertisement campaign, it is possible to analyze the
data in very detail. For each keyword, it can be seen e.g. how many times the ad
has been displayed, how many times customers have clicked the ad, and how

42
many of those clicks have resulted in a sale. Cost per click, conversion rate, click-
through-rate etc. can be analyzed.
As a summary, PPC is the best and fastest way to display a new product to
potential customers in the beginning of the product’s lifecycle.
5.5 Promotions & Reviews
The sales history will impact how Amazon will rank the product. But in addition,
also the sales velocity will impact (Coats, 216). Sales velocity means how many
sales the product achieves daily, and how that develops over time. This means,
that if the product’s daily sales are constantly increasing, Amazon algorithm will
notice that the product is picking up good sales velocity, and it will rank the
product higher in the search results.
A very common strategy of launching products and gaining sales velocity in the
beginning stage of a product’s lifecycle, is to use different kind of review
services. The principle of such services is, that a seller will offer the new product
at a discounted price; in exchange of an honest review. There are two obvious
benefits in performing this: The product will get the sales velocity, and it will
receive reviews. As discussed earlier, product reviews are an essential element of
an appealing product listing.
Many customer is interested in purchasing new products, if it is heavily
discounted. The review services are a massive business; both for the service
providers, but also for the reviewers. Professional reviewers are getting access to
large number of products with a very heavy discount. It is very typical to sell
products at 0.99€ or so.
In any case, using e.g. these kind of review services, it is possible to get the sales
going relatively easily and fast. Thus, the sales velocity will be improved.
43
6 SALES DATA ANALYSIS
Following the guidelines and principles addressed earlier in this research, a new
private label resistance band product was launched. The product was sourced from
China, after some adjustments and customization. The product was branded as per
the newly created private label brand. A relatively large purchase order was done,
and the products were shipped from China by air freight to Amazon warehouse in
Germany.
6.1 Unit Sales Per Day
Figure 18 and Table 2 illustrate the organic sales data from the seven first sales
week after the product launch. Organic sales mean products that were sold at a
normal price, without any promotions or discounts.
As can be seen, the sales started slowly, but one sale was done already on the first
selling day. The total sales amount for the first selling week was 14 units. Sales
for the second week was 36 units, followed by weekly sales of 15, 24, 22, 45 and
34 units. The total combined sales for the first seven weeks was 190 units.
Even though the selling figures aren’t massive, the first conclusion is that there
are sales. 190 customers have found this brand-new product representing a brand-
new brand; which has never been heard of before. This is already a proof that the
concept is working.

44
Figure 18. Daily sales figures.
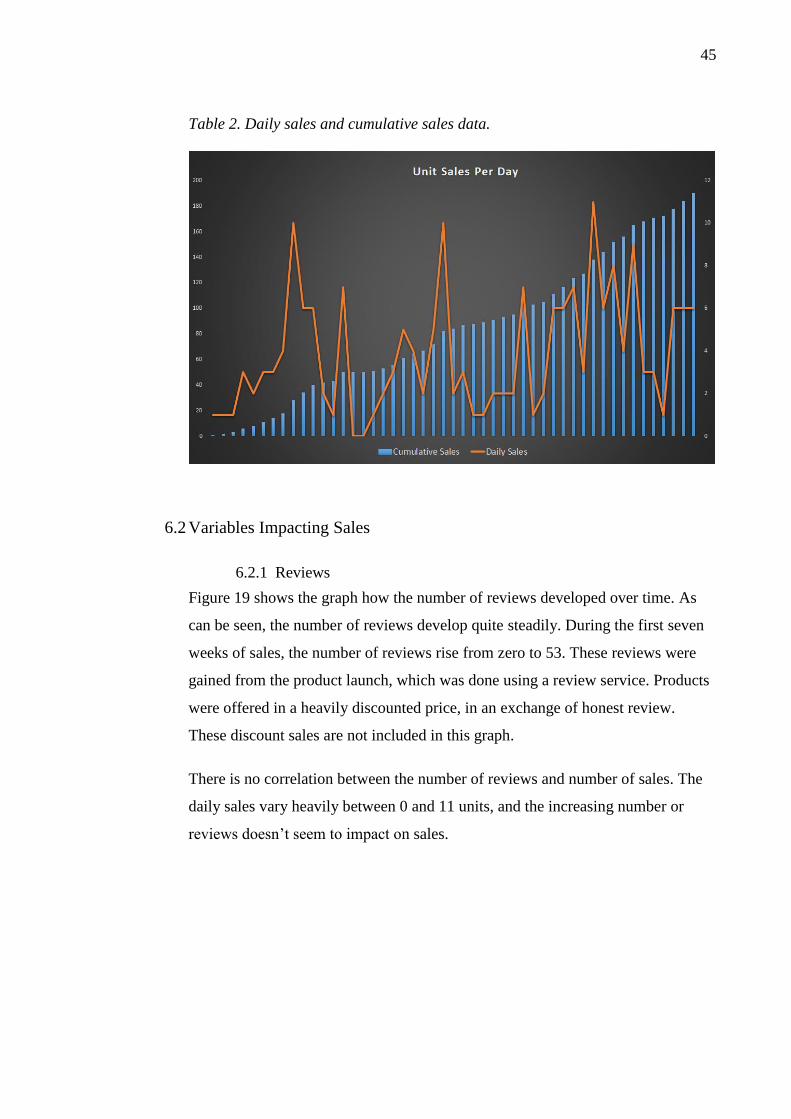
45
Table 2. Daily sales and cumulative sales data.
6.2 Variables Impacting Sales
6.2.1 Reviews
Figure 19 shows the graph how the number of reviews developed over time. As
can be seen, the number of reviews develop quite steadily. During the first seven
weeks of sales, the number of reviews rise from zero to 53. These reviews were
gained from the product launch, which was done using a review service. Products
were offered in a heavily discounted price, in an exchange of honest review.
These discount sales are not included in this graph.
There is no correlation between the number of reviews and number of sales. The
daily sales vary heavily between 0 and 11 units, and the increasing number or
reviews doesn’t seem to impact on sales.
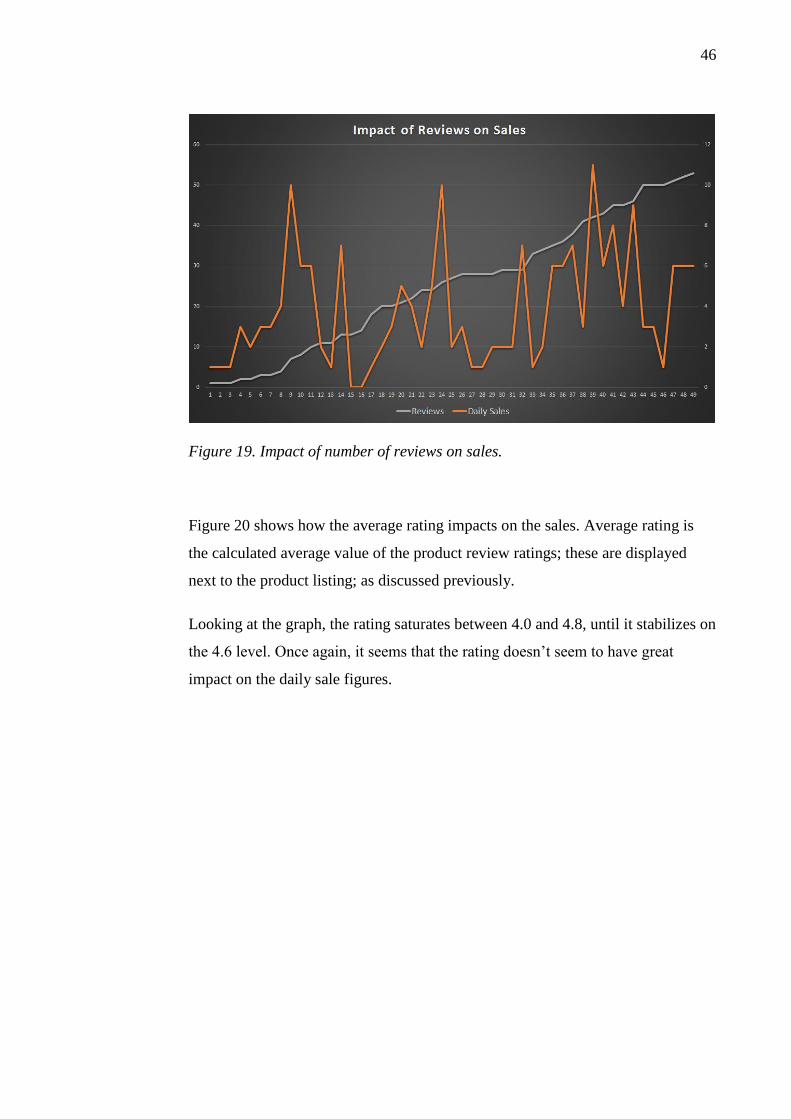
46
Figure 19. Impact of number of reviews on sales.
Figure 20 shows how the average rating impacts on the sales. Average rating is
the calculated average value of the product review ratings; these are displayed
next to the product listing; as discussed previously.
Looking at the graph, the rating saturates between 4.0 and 4.8, until it stabilizes on
the 4.6 level. Once again, it seems that the rating doesn’t seem to have great
impact on the daily sale figures.
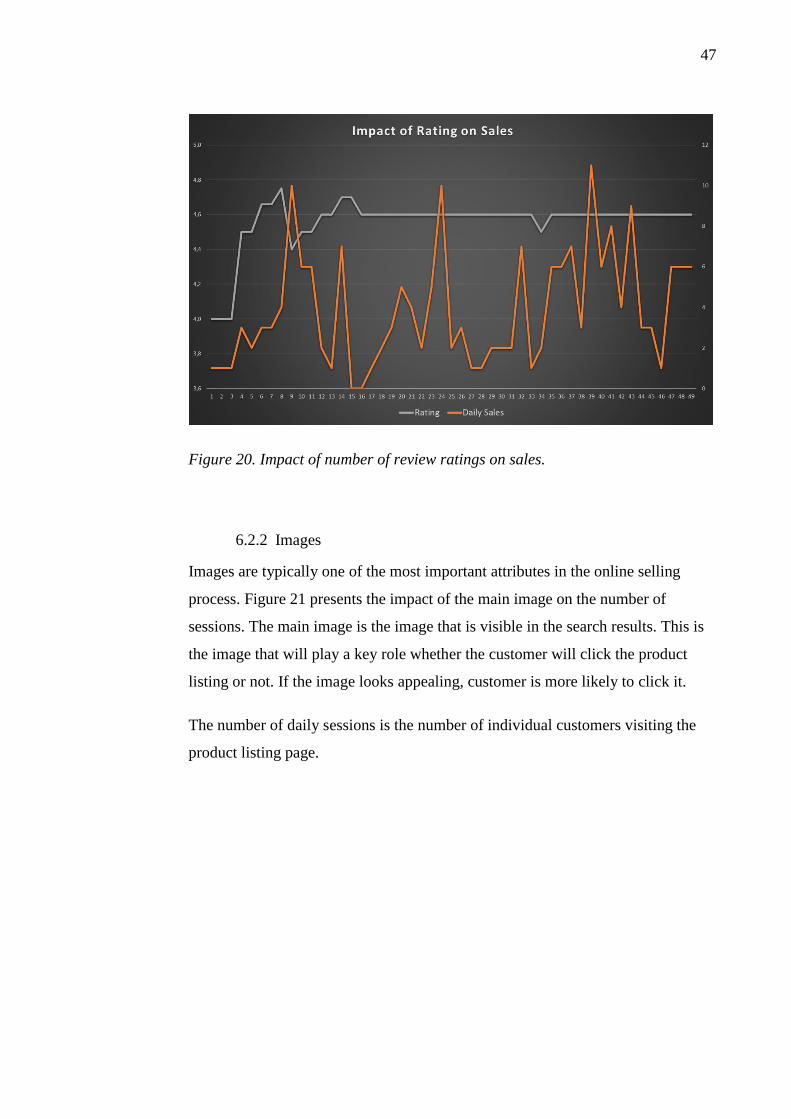
47
Figure 20. Impact of number of review ratings on sales.
6.2.2 Images
Images are typically one of the most important attributes in the online selling
process. Figure 21 presents the impact of the main image on the number of
sessions. The main image is the image that is visible in the search results. This is
the image that will play a key role whether the customer will click the product
listing or not. If the image looks appealing, customer is more likely to click it.
The number of daily sessions is the number of individual customers visiting the
product listing page.

48
Table 3. Impact of main image on the number of sessions.
The main image will clearly impact on the number of sessions. As can be seen
from the graph, the average daily sessions vary between 27.9 and 58.5. Main
image #1 gathered twice as much sessions than main image #4. This is a very
crucial observation.
The number of sessions as such doesn’t mean much. In addition, it is important to
know how much sales can be generated. The number of sessions tells how many
potential customer is visiting the product listing; the conversion rates tell how
many of these visitors are buying the product.
Table 4 shows what are the conversion rates for different main images. From the
Table, it can be seen, that 7.0% of all the visitors did purchase the product when
main image #1 was used. The conversion rates for main images #1, #2 and #3 are
all around 7%. Main image 4# has a conversion rate as low as 4.8%, while the
main image option #5 peaks at 9.5%.
So, while the main images #1 and #2 are driving more traffic, main image #5 can
convert higher percentage of visitors into paying customers.

49
Table 4. Impact of main image on the conversion rates.
In addition to the main image, there are also eight additional image slots available
for a product listing. These additional images can be used to further persuade
visitors to purchase the product. Table 5 presents the impact of three different
image sets on the conversion rates.
Table 5. Impact of additional image on the conversion rates.

50
Image sets #1 and #2 both result in around 7% conversion, while image set #3
result in clearly better 8.7% conversion. Conclusion is, that also the additional
images will impact the conversion rate.
6.2.3 Title
The product title is also visible in the search results. Together with the main
image and the reviews; product title is one of the key attributes that will make the
customers either click the product listing; or ignore the product.
Table 6 displays the results of the title experiment. Different title options were
used, and the amount of daily sessions were recorded. As can be seen, the title has
a clear impact on the amount of sessions. Title options #1, #2 and #3 could
generate 54-56 daily sessions on average; whereas title options #4 and #5 could
generate only 35-37 average daily sessions.
Title options #4 and #5 used more experimental wording, whereas titles #1, #2
and #3 were more traditional options.
Table 6. Average amount of daily sessions for different title options.
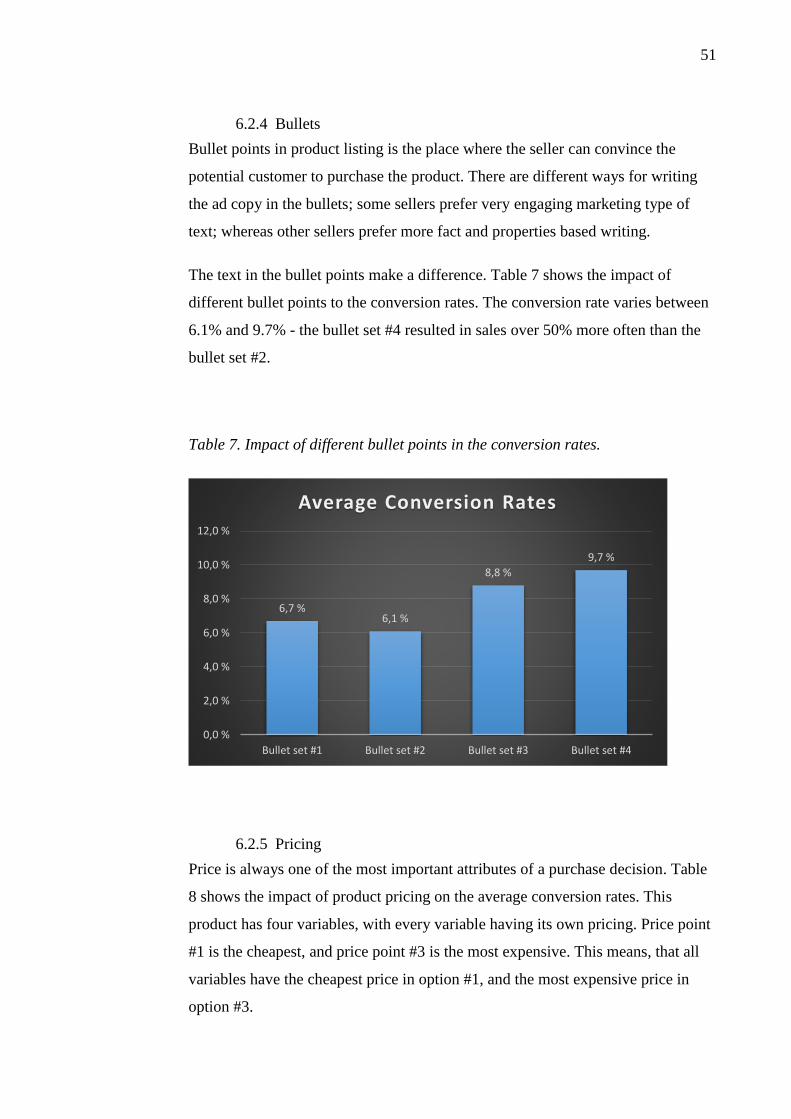
51
6.2.4 Bullets
Bullet points in product listing is the place where the seller can convince the
potential customer to purchase the product. There are different ways for writing
the ad copy in the bullets; some sellers prefer very engaging marketing type of
text; whereas other sellers prefer more fact and properties based writing.
The text in the bullet points make a difference. Table 7 shows the impact of
different bullet points to the conversion rates. The conversion rate varies between
6.1% and 9.7% - the bullet set #4 resulted in sales over 50% more often than the
bullet set #2.
Table 7. Impact of different bullet points in the conversion rates.
6.2.5 Pricing
Price is always one of the most important attributes of a purchase decision. Table
8 shows the impact of product pricing on the average conversion rates. This
product has four variables, with every variable having its own pricing. Price point
#1 is the cheapest, and price point #3 is the most expensive. This means, that all
variables have the cheapest price in option #1, and the most expensive price in
option #3.
6,7 %6,1 %
8,8 %
9,7 %
0,0 %
2,0 %
4,0 %
6,0 %
8,0 %
10,0 %
12,0 %
Bullet set #1 Bullet set #2 Bullet set #3 Bullet set #4
Average Conversion Rates
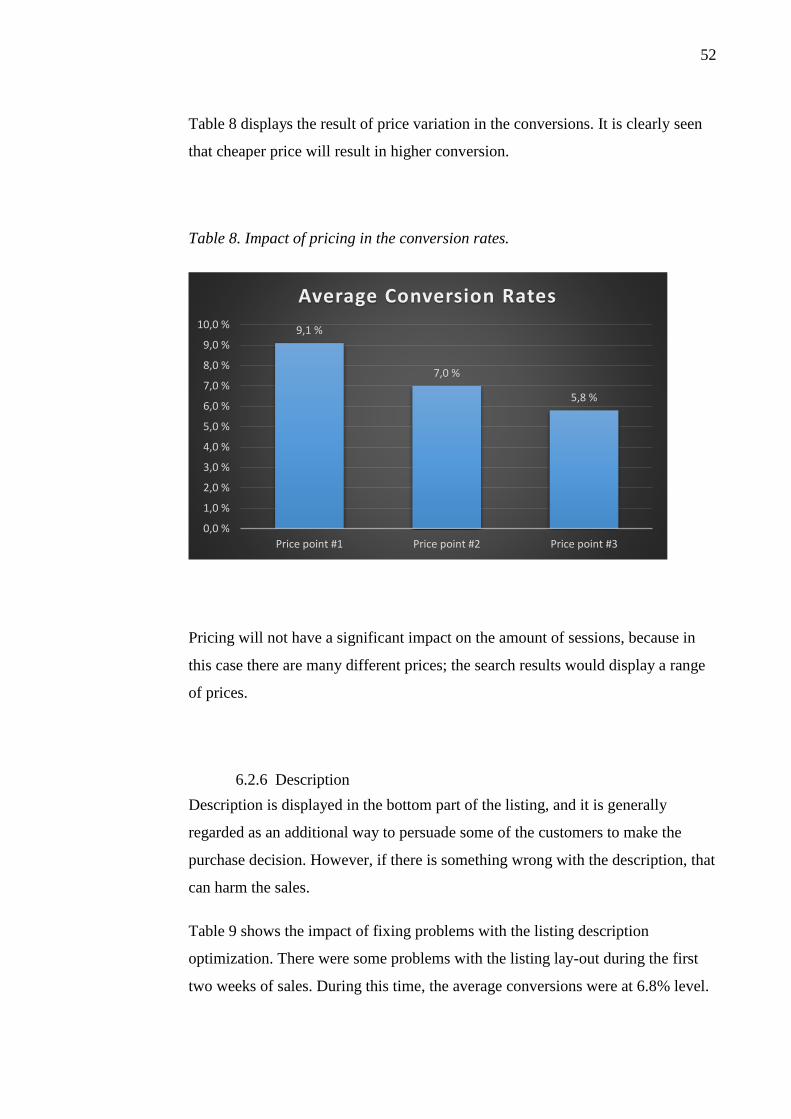
52
Table 8 displays the result of price variation in the conversions. It is clearly seen
that cheaper price will result in higher conversion.
Table 8. Impact of pricing in the conversion rates.
Pricing will not have a significant impact on the amount of sessions, because in
this case there are many different prices; the search results would display a range
of prices.
6.2.6 Description
Description is displayed in the bottom part of the listing, and it is generally
regarded as an additional way to persuade some of the customers to make the
purchase decision. However, if there is something wrong with the description, that
can harm the sales.
Table 9 shows the impact of fixing problems with the listing description
optimization. There were some problems with the listing lay-out during the first
two weeks of sales. During this time, the average conversions were at 6.8% level.
9,1 %
7,0 %
5,8 %
0,0 %
1,0 %
2,0 %
3,0 %
4,0 %
5,0 %
6,0 %
7,0 %
8,0 %
9,0 %
10,0 %
Price point #1 Price point #2 Price point #3
Average Conversion Rates
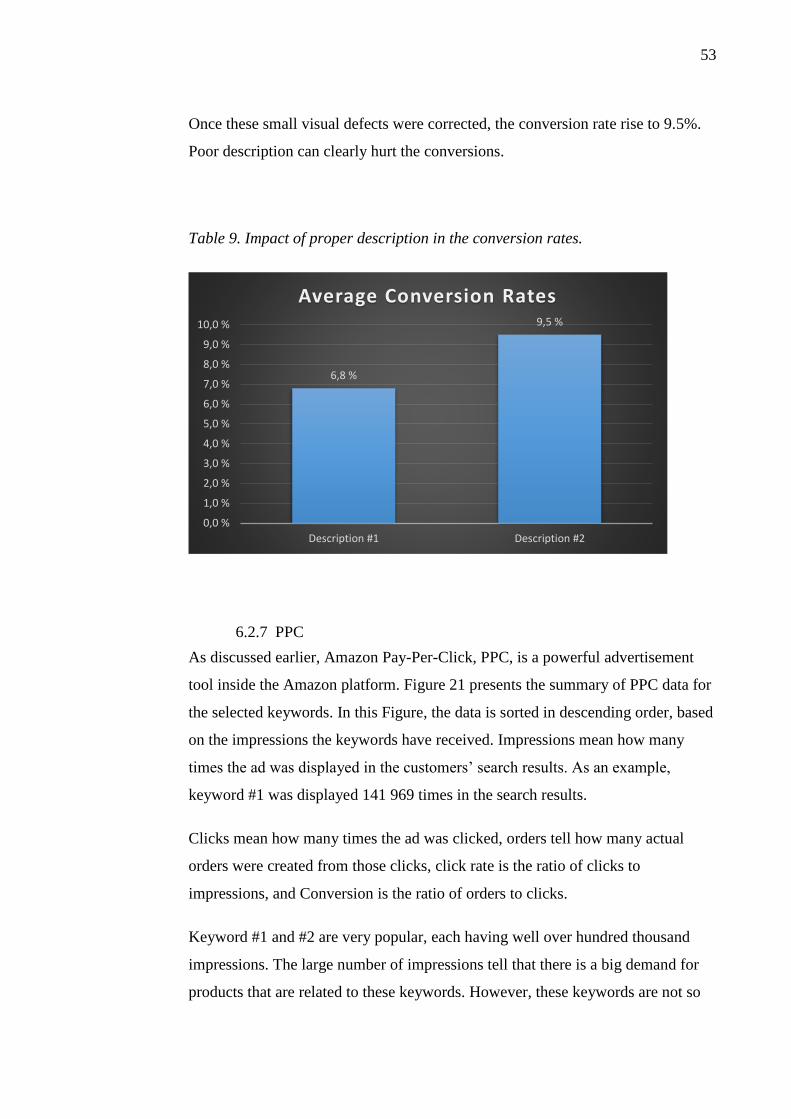
53
Once these small visual defects were corrected, the conversion rate rise to 9.5%.
Poor description can clearly hurt the conversions.
Table 9. Impact of proper description in the conversion rates.
6.2.7 PPC
As discussed earlier, Amazon Pay-Per-Click, PPC, is a powerful advertisement
tool inside the Amazon platform. Figure 21 presents the summary of PPC data for
the selected keywords. In this Figure, the data is sorted in descending order, based
on the impressions the keywords have received. Impressions mean how many
times the ad was displayed in the customers’ search results. As an example,
keyword #1 was displayed 141 969 times in the search results.
Clicks mean how many times the ad was clicked, orders tell how many actual
orders were created from those clicks, click rate is the ratio of clicks to
impressions, and Conversion is the ratio of orders to clicks.
Keyword #1 and #2 are very popular, each having well over hundred thousand
impressions. The large number of impressions tell that there is a big demand for
products that are related to these keywords. However, these keywords are not so
6,8 %
9,5 %
0,0 %
1,0 %
2,0 %
3,0 %
4,0 %
5,0 %
6,0 %
7,0 %
8,0 %
9,0 %
10,0 %
Description #1 Description #2
Average Conversion Rates

54
relevant to the product they are targeted for. Both keywords have only 0.1% click
rate and keyword #2 has 0% conversion. This means that the advertisement was
displayed 124 867 times, the ad was clicked 124 times, but these clicks didn’t
result in a single sale.
Figure 22 shows the same data sorted in descending order of click rate. Keyword
#38 seems to have very low number of traffic, as the ad was displayed only two
times. But this keyword is very much related to the product, as it was clicked once
and bought. Statistically more meaningful are products which have over hundred
impressions.
Finally, Figure 23 shows the PPC data sorted in descending order of conversions.
It can be seen, that the most relevant keywords have relatively low number of
traffic. The advertisement for keyword #35 was clicked only once, but this
customer bought two products. Keyword #38 was also clicked once, and resulted
in one sale.
Statistically most efficient keywords are #18, with 26 clicks and 5 orders,
keyword #13 with 36 clicks and 6 orders, and so on. Interesting keywords are also
#7 with 14 sales at 13.2% conversion; and keyword #4 with 22 sales at 13.3%
conversion.

55
Figure 21. PPC data sorted by impressions.
Keyword Impressions Clicks Orders Clickrate Conversion
#1 141969 184 10 0,1% 5,4%
#2 128467 124 0 0,1% 0,0%
#3 70492 275 15 0,4% 5,5%
#4 52453 179 22 0,3% 12,3%
#5 17794 78 4 0,4% 5,1%
#6 17272 83 7 0,5% 8,4%
#7 16108 106 14 0,7% 13,2%
#8 13949 77 7 0,6% 9,1%
#9 11117 51 4 0,5% 7,8%
#10 8186 43 0 0,5% 0,0%
#11 7979 59 6 0,7% 10,2%
#12 7975 24 2 0,3% 8,3%
#13 7816 36 6 0,5% 16,7%
#14 6103 28 4 0,5% 14,3%
#15 5585 17 0 0,3% 0,0%
#16 5290 13 1 0,2% 7,7%
#17 4602 9 0 0,2% 0,0%
#18 4180 26 5 0,6% 19,2%
#19 3595 21 0 0,6% 0,0%
#20 3279 13 0 0,4% 0,0%
#21 3205 7 0 0,2% 0,0%
#22 2918 9 0 0,3% 0,0%
#23 2806 10 0 0,4% 0,0%
#24 2216 3 0 0,1% 0,0%
#25 2055 5 0 0,2% 0,0%
#26 1744 18 0 1,0% 0,0%
#27 1442 9 1 0,6% 11,1%
#28 1416 5 2 0,4% 40,0%
#29 1358 8 1 0,6% 12,5%
#30 1295 2 0 0,2% 0,0%
#31 754 2 0 0,3% 0,0%
#32 673 3 0 0,4% 0,0%
#33 439 1 0 0,2% 0,0%
#34 418 5 0 1,2% 0,0%
#35 361 1 2 0,3% 200,0%
#36 160 4 3 2,5% 75,0%
#37 14 2 1 14,3% 50,0%
#38 2 1 1 50,0% 100,0%
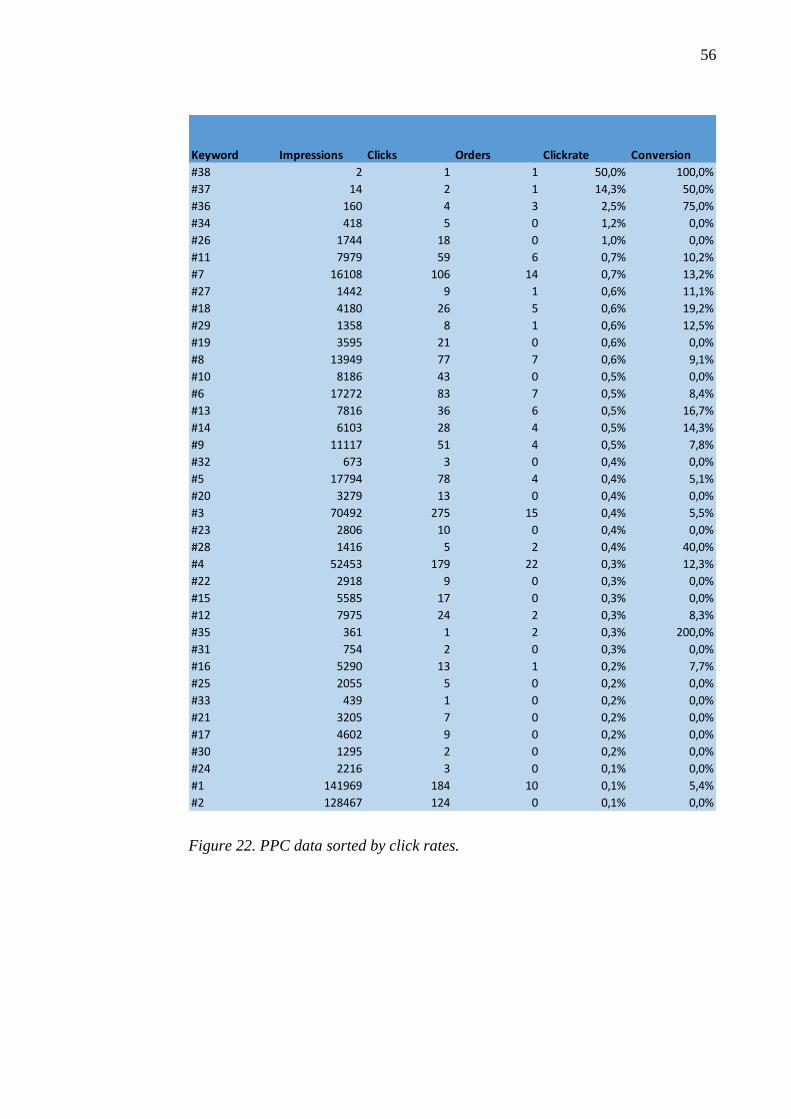
56
Figure 22. PPC data sorted by click rates.
Keyword Impressions Clicks Orders Clickrate Conversion
#38 2 1 1 50,0% 100,0%
#37 14 2 1 14,3% 50,0%
#36 160 4 3 2,5% 75,0%
#34 418 5 0 1,2% 0,0%
#26 1744 18 0 1,0% 0,0%
#11 7979 59 6 0,7% 10,2%
#7 16108 106 14 0,7% 13,2%
#27 1442 9 1 0,6% 11,1%
#18 4180 26 5 0,6% 19,2%
#29 1358 8 1 0,6% 12,5%
#19 3595 21 0 0,6% 0,0%
#8 13949 77 7 0,6% 9,1%
#10 8186 43 0 0,5% 0,0%
#6 17272 83 7 0,5% 8,4%
#13 7816 36 6 0,5% 16,7%
#14 6103 28 4 0,5% 14,3%
#9 11117 51 4 0,5% 7,8%
#32 673 3 0 0,4% 0,0%
#5 17794 78 4 0,4% 5,1%
#20 3279 13 0 0,4% 0,0%
#3 70492 275 15 0,4% 5,5%
#23 2806 10 0 0,4% 0,0%
#28 1416 5 2 0,4% 40,0%
#4 52453 179 22 0,3% 12,3%
#22 2918 9 0 0,3% 0,0%
#15 5585 17 0 0,3% 0,0%
#12 7975 24 2 0,3% 8,3%
#35 361 1 2 0,3% 200,0%
#31 754 2 0 0,3% 0,0%
#16 5290 13 1 0,2% 7,7%
#25 2055 5 0 0,2% 0,0%
#33 439 1 0 0,2% 0,0%
#21 3205 7 0 0,2% 0,0%
#17 4602 9 0 0,2% 0,0%
#30 1295 2 0 0,2% 0,0%
#24 2216 3 0 0,1% 0,0%
#1 141969 184 10 0,1% 5,4%
#2 128467 124 0 0,1% 0,0%

57
Figure 23. PPC data sorted by conversion rate.
Keyword Impressions Clicks Orders Clickrate Conversion
#35 361 1 2 0,3% 200,0%
#38 2 1 1 50,0% 100,0%
#36 160 4 3 2,5% 75,0%
#37 14 2 1 14,3% 50,0%
#28 1416 5 2 0,4% 40,0%
#18 4180 26 5 0,6% 19,2%
#13 7816 36 6 0,5% 16,7%
#14 6103 28 4 0,5% 14,3%
#7 16108 106 14 0,7% 13,2%
#29 1358 8 1 0,6% 12,5%
#4 52453 179 22 0,3% 12,3%
#27 1442 9 1 0,6% 11,1%
#11 7979 59 6 0,7% 10,2%
#8 13949 77 7 0,6% 9,1%
#6 17272 83 7 0,5% 8,4%
#12 7975 24 2 0,3% 8,3%
#9 11117 51 4 0,5% 7,8%
#16 5290 13 1 0,2% 7,7%
#3 70492 275 15 0,4% 5,5%
#1 141969 184 10 0,1% 5,4%
#5 17794 78 4 0,4% 5,1%
#2 128467 124 0 0,1% 0,0%
#10 8186 43 0 0,5% 0,0%
#19 3595 21 0 0,6% 0,0%
#26 1744 18 0 1,0% 0,0%
#15 5585 17 0 0,3% 0,0%
#20 3279 13 0 0,4% 0,0%
#23 2806 10 0 0,4% 0,0%
#17 4602 9 0 0,2% 0,0%
#22 2918 9 0 0,3% 0,0%
#21 3205 7 0 0,2% 0,0%
#25 2055 5 0 0,2% 0,0%
#34 418 5 0 1,2% 0,0%
#24 2216 3 0 0,1% 0,0%
#32 673 3 0 0,4% 0,0%
#30 1295 2 0 0,2% 0,0%
#31 754 2 0 0,3% 0,0%
#33 439 1 0 0,2% 0,0%

58
7 CONCLUSIONS AND DISCUSSIONS
7.1 Key Results
7.1.1 Research Question #1: What Is the Best Online Platform to Start
Selling A New Product
Different online platform options were analyzed and discussed in chapter two, and
the conclusion was, that Amazon Germany is the best platform for this study.
Naturally, the circumstances will impact a lot on this. The scope of this study was
on the western markets. It is obvious, that the situation would be totally different,
if the business would be operated from Asia. All the numbers presented in chapter
two, are in favor of Amazon. Amazon is by far the largest; both in terms of traffic
and in terms of sales. It clearly has the largest selling potential.
Second aspect in favor of Amazon, is the FBA business model. FBA offers a very
easy way to start an online business. This is a solid conclusion from this study as
well. In this case study, the business was operated from Finland, but as the
Finnish market area was concluded to be too small, a larger German market was
selected. Physical products were ordered from China, and shipped to Amazon
warehouse in Germany.
As the data in chapter six shows, 190 units were sold during the first seven weeks
of this case study. These 190 units were orders from private German citizens
(except those few from other countries), and these customers received their orders
within 1-2 days. It is hard to recognize any other system, which would enable
such an easy market entry, than this. If these products would have been shipped
e.g. from Finland, the shipment expenses and duration would not have been on a
sustainable level. Customers of today require fast and cheap (or free) shipment.
Even though one could argue that 190 sold units in seven weeks is not that much,
it can be argued that it is still enough to prove that the concept work. The starting
point for this case study was practically zero. There was no earlier know-how on
online selling, marketing, or even generic sales techniques for that matter. Despite
59
of these factors, a starting entrepreneur could sell 190 resistance bands to German
customers, and to deliver the orders within 1-2 days.
Conclusion is that Amazon, with its FBA business model, is the best online
platform to start selling a new product.
7.1.2 Research Question #2: Is It Possible to Determine What Is A Good
Product To Sell Online?
As FBA business has so good potential, and as it is so easy to start, its popularity
has increased a lot as well. There are quite many entrepreneurs and companies
making money from various aspects around the business model. Because of this,
there are lots of applications and tools out there to collect different kind of
information; as discussed in chapter four.
Even though Amazon does not publicly reveal the sales figures for its items, there
are easy ways to quite accurately determine the sales volumes for each product on
sale. The ability of being able to do that, is the key to the whole concept. It is
easily validated what is already selling on Amazon. If the analysis is done
properly, there are no open questions about the sales potential of individual items.
As demonstrated in chapter four, the sales potential and the depth of the market
can be relatively easily verified. Naturally all new sellers must work hard to
achieve success, but the uncertainty of the sales potential can be taken away from
the equation.
Conclusion is, that it is possible to determine a good product to sell online.
7.1.3 Research Question #3: Is It Possible to Successfully Introduce A
New Product To A Selected Marketplace?
As part of this case study, a totally new product was introduced to the markets. A
new brand was created, products were customized and manufactured in China,
and shipped to Europe.

60
190 units of this product, which brand is previously unheard of, were sold during
the first seven weeks. Even though the selling figures are not that significant, it is
still relatively good amount; taking the starting circumstances into account.
Thus, the conclusion is, that a new product is possible to be successfully
introduced to a selected marketplace.
7.1.4 Research Question #4: What Are the Key Variables Impacting the
Successful Sale?
Based on the data presented in chapter five, it can be concluded, that the most
important attributes impacting the successful sale are the main image, the bullet
points, the price point and the correct keyword identification in the advertisement.
The second important attributes are the title, and the additional images.
The number of reviews, and the average rating of them, don’t have that much of
an impact on the sales. This is a somewhat surprising observation.
Proper description will impact on the sales. In this case study, it was observed,
that visually correct description will convert better than visually incorrect.
The main image will impact on the sales in two ways. The first way is how much
traffic it can drive. As was discussed in chapter six, the best main image will
generate almost twice as much traffic than the worst main image option. The main
image will also have a major impact on the conversion rate. The best main image
option could convert twice as often than the worst main image option.
The importance of the main image is logical. In search results, the main image is
visually the most capturing element of the product listing. If that is attractive, the
customer will click on it, and the product detail page will be opened. If the main
image is truly reflecting the other content, it can also convert the visitors as
paying customers.
Bullet points are the selling arguments in written format. Each seller has five
bullet points, which can be used to persuade the interested customer to purchase
61
the product. As was shown in chapter six, the best set of bullet points could
convert over 50% better than the worst one. The importance of bullet points is
logical.
Price is always important in any purchase decision. For this product, the
conclusion is, that the cheaper the price point, the better was the conversion. The
lowest price point converted over 50% better than the highest price point.
Proper keyword selection play a major role in the success of an advertisement
campaign. As could be seen from the data discussed in chapter six, some
keywords are good in driving traffic, but they necessarily don’t convert to a sale.
Spending money on such keywords can be costly, and can easily decrease the
profitability, if used carelessly. On the other hand, good keywords can convert to
sale at a very high rate.
Product title has some, but not major, impact on the sale. If the title is catchy and
if it includes the correct keywords that help in the ranking, it will impact
positively on the sales. But different variations in the title don’t play a major role
on the conversion.
The additional images will help on improving the conversion. However, based on
this study, the different image set options don’t seem to have a major impact on
the conversion. All the image sets in this case study were of high quality, they just
had slightly different content. Situation might have been different, if the
comparison would have done between a “good” image set and a “bad” image set.
Somewhat surprisingly, the number of reviews and the average rating of reviews
don’t seem to have a great impact on the sales. It seems that it is enough that there
are some reviews; just enough to bring in the social proof. Whether there are 10 or
50 reviews, it does not have a clear impact.
In this case study, the average rating varies most of the time between 4.4 and 4.7.
There was no clear correlation between the rating and the number of sales;
however, the range might have been too narrow for proper conclusion. Situation
62
might have been different, if the rating would have varied between 3 and five as
an example.
7.2 Lessons Learnt
7.2.1 Usage of Review Services and The Different Product Launch
Strategies
Review service was used as a part of the launch strategy. The principle of the
review services is, that the members will get a discounted product in exchange of
an honest review. Amazon has strict rules about this, and the main points are that
there should be no obligation for the review, the review must be honest, and that
there must be a disclaimer in the review; stating that the product was received at a
discount in exchange of an honest review.
Using a review service, over 50 reviews were obtained within few weeks. This
was an efficient way of getting relatively high amount of reviews in a short time.
Especially in the beginning of a product’s lifecycle, it is often not easy to have
customers to leave a review for a product. In many cases customer don’t want to
spend too much time on the product evaluation, after the product has been
successfully purchased. Another benefit of this kind of service is the increase of
sales velocity. The Amazon algorithm notices that customers are buying the
product at an increasing speed, and this will result in the improvement of the
product’s ranking in the Amazon system.
However, using a review service has also disadvantages. The first, and the most
obvious one, is the cost. The first expense is the price the review service company
is charging; this is typically between 3 and 6 euros per review; so, the cost for 50
reviews could vary between 150€ and 300€. In this case study, the cost was
around 190€. The second cost is the fulfilment cost; Amazon will always charge
its expenses from the product delivery. The third cost is the product cost. This
means, that the product is often sold at a loss. As an example, the combined
product total cost might be 10€, and the normal selling price can be 20€. With the
63
review services, the product might be offered on a great discount, typically as an
example at 0.99€. By doing so, every product will mean a loss of 9.01€.
Another problem with these review services, is the unpredictability of the testing
audience. This problem came very evident in this case study. The motivation for
the people to be in these groups, is the free or discounted products. In some cases,
the people don’t realize the importance of the reviews to the sellers. In this case
study, some of the reviewers didn’t know anything about the product, and then
they left a public negative review, stating that the “product wasn’t something they
were expecting to be”. They clearly just ordered the product because it was so
cheap. For a review group to work properly, customized targeting would be
important. This means, that fitness product is only offered to people who are into
fitness; for people who are truly interested in the product. It is kind of a gamble to
give a product for a review for a person who is not interested in it.
Another lesson learnt regarding to the audience of the review groups, is the level
of commitment to the product. The discount price in this case study was only
0.99€. This was too low. The low price allowed those persons who didn’t know
anything about the product to have it easily for a review. If the price would have
been higher, say around 5€, most likely only those persons who would have
interested in the product, would have taken part of the review.
It is important to mention, that as of October 2016, Amazon has changed its
Terms of Service, and they have prohibited these review services in amazon.com.
They only allow the review service using their own paid Vine program. This is a
very expensive program, and in practice this change of the rules means, that the
using of review services is prohibited. It is likely that this change in their Terms of
Service will be rolled out to European marketplaces as well.
This change in the Terms of Service will make the usage of review services
impossible, and alternative ways to perform product launches must be used. This
is basically a good news for the small entrepreneurs. As the usage of the review
services has been very widely used system, this method has been used very
aggressively. In many cases, some large Chinese companies have rolled out quite
massive campaigns to rapidly gain large number of reviews in a short period. As
64
this is not possible anymore, the role of good customer service will start to play a
major role. The seller must offer such a great customer service experience, that the
customers wants to do a counter favor to the seller in the form of a good feedback
or review. Nurturing the customer experience will be more important than ever.
At the time of writing this, it is still somewhat unclear what are all the practical
implications of this change. Promotions are still allowed – and a customer who
has bought a product at a discounted price, is still able to leave a review. Some of
the review services have already announced that they have become a product
launch service. As discussed earlier, offering products at a discount, will boost the
sales, and will help ranking up the product organically. The question is, what
happens if a customer who has participated this kind of activity, decides to leave a
review?
As the business model is so popular, there are also alternative options. One quite
popular phenomenon are the numerous different Facebook groups focusing on
product reviews. These groups are combinations of people selling in Amazon and
looking for reviewers for their products; and of people willing to review these
products in exchange of the good discount they will be getting. But, this model is
problematic as well. In practice, the working mechanism is similar to review
groups. Time will tell how Amazon will treat these in future.
7.2.2 Differentiation and Market Entry Difficulty
As discussed in chapter four, the selected niche was relatively thoroughly
analyzed. During the investigation, it was concluded that there is a continuous
demand, there is depth in the market, and that the competition is not
overwhelming.
In addition, the competitor product customer reviews and the differentiation
possibilities were analyzed. Conclusions from these were, that the largest demand
is for the narrowest band, biggest problems are with the narrowest band, some
customers were annoyed with the latex smell associated with the bands, and that
some customers would have liked to have a carry bag with the band.
65
In some extend, the analysis was spot on. The sales data proves that there is a
demand, customer reviews reveal that they are happy with the neutral smell of the
bands, and there have been no quality issues; as the narrowest band is not in the
portfolio. However, also some wrong conclusions were drawn, and some elements
were not correctly observed and considered.
The greatest lesson learnt is, that the resistance band niche is too easy to enter,
and that it offers little room to differentiate. During the niche analysis stage, there
were only two major sellers in the German marketplace. These two companies
shared major part of the business, and even though there were other companies as
well, the number of skillful competition was minimal. Many of the suppliers that
time didn’t have very sophisticated listing, and they didn’t have that high sales
figures.
However, six months later, the situation is totally different. During the product
analysis, manufacturing, shipping and launch up phase – at least seven new
companies have introduced their product to the same marketplace. There are most
likely even more companies like these, but these seven are very skillful and
competitive companies. This has turned the competition to be very fierce.
The selected product is too simple; it is very easy for competitors to copy it,
customize it to reflect their own brand, and enter the race. The purchase price is
also too small; it is very easy for other small entrepreneurs to purchase these and
introduce to the market. Thus, the market has become too saturated; there are too
many products which are almost identical to each other. This has resulted in very
aggressive marketing. Competitors are spending money on PPC, so that they
would appear as high as possible in the search results. This is one reason why the
number of sessions for the case study product has been so small. The strategy has
been to be relatively careful with the advertisement spending. This might explain
the low conversion rates to some degree as well. Customers can see a wide range
of products looking like each other; so, it is easy for them to check few of them,
and buy the one they like most.
Differentiation possibilities and the difficultness to copy should be emphasized
more in the next product criteria.

66
7.3 Limitations and Suggestions for Future
7.3.1 Need for Capital Investment
FBA is an easy way to start an online business, but doing that using a private label
business model, is necessarily not. The problem with the private label model is
typically the relatively large capital investment needed – the products must be
purchased prior to putting them on sale.
Purchasing the inventory beforehand creates several different challenges. First, the
purchase of the products will tie up the capital into the inventory. This capital
cannot be used in anything else before the products starts to sell. Sometimes the
time span is quite long: The manufacturing might easily take one month,
depending naturally heavily on the product type. In addition to that, shipment, if
sea freight is used, can easily take another month; in the typical scenario where
the products are purchased from China. In many cases sea shipment is so much
cheaper, that it is preferred over air freight. Product launch-up and promotion
phase can easily take 2-4 additional weeks. When all these steps are combined,
the capital might be tied to the inventory up to three months – before the sales
start to roll in. In practice, it will in many case need few additional months before
the sales income has reached the level of the original investment.
Economy of scale is valid in private labeling, similarly than in other businesses.
The unit costs will in many cases be much cheaper, if the order quantity is larger.
This rule will always drive to make as large purchase orders as possible. Increased
product quantities will in turn increase the logistics expenses. And, naturally the
customs and importing VAT fees will always increase as the product quantity
increases.
Because the business model is relatively capital intense, each entrepreneur should
make detailed calculations of the affordable budget. As the capital is tied up to the
inventory for relatively long time, the cash flow calculations must be done very
carefully.

67
7.3.2 Number of Products in Sale
There was only one product type in sale in this case study. Because of this, there
were no possibilities for any cross-sales or up-sales. It would be possible to get
much more benefit from this business model, if there would be multiple related
products on sale simultaneously.
As discussed earlier, it would be easy and natural to promote similar types of
products, for the customers who have bought one product. If these products are
related, typically customers are interested also in the other similar types of
products. It would be possible to drive additional traffic to all the products using
insert cards and different promotions. Also, Amazon would automatically
promote the related products.
Naturally, the required capital investment will increase as the number of products
increases. But, to achieve more efficient and higher converting sales, it would be
beneficial to have multiple related products on sale at the same time.
As can be seen from the data presented in chapter six, the sales data can be
relatively small for some products. For the overall business to be profitable and
sustainable, it would be important to have multiple products generating revenue
and profit. It would be very risky to relay only on one product.
7.3.3 Expanding to other Amazon Marketplaces and the Utilization of
FBA
In addition to introducing additional products, another way of increasing the sales
volumes, is to introduce the product to other selling platform and utilizing the
Amazon fulfillment service.
The most obvious and simplest is to expand to other Amazon marketplaces. This
case study was conducted in the Amazon German marketplace; the logical next
steps would be Amazon marketplaces in UK, France, Spain and Italy. When the
products are listed in one of the Amazon marketplaces, they are easily listed on
sale on the other marketplaces as well. Using the FBA business model, the
product deliveries would be taken care of by Amazon.

68
Another way of utilizing the FBA model, is to list the products in other selling
platforms, and letting Amazon to do the fulfillment. One of the most common
ways is eBay. Products can be listed e.g. in ebay.de, and customer orders can be
fulfilled by Amazon. Such fulfillment orders are easily created from the seller
interface.
7.3.4 Expanding Beyond Amazon
Amazon, with the FBA business model, is very attractive way to start an online
business. Amazon has the traffic, customer trust, customer service, warehouses,
and the logistics in place. For a new entrepreneur, it would take lots of time and
money to achieve the same scale with relaying only on own resources. This is
especially true for an entrepreneur who is living outside the large market areas.
But, selling on Amazon has also some major risks associated with it. Amazon
owns the platform, and they are free to change the rules and regulations as they
wish. If Amazon decides to prohibit some products, or to shut down some seller
accounts, there is very little that an individual seller can do about it. In the worst-
case scenario, the seller might lose his/her selling rights over night. All the sales
history, sales momentum and inventory will be taken away in an instance.
Amazon also owns the customers. The customers are buying from Amazon, not
from the individual sellers. The credit card information, customer contact
information, customer sales history etc. are all properties of Amazon. Amazon
does not allow the sellers to take any actions for additional sales, or directing
customers e.g. into the seller’s own web store. Amazon does not give the
customers’ email addresses, so there is no easy way of contacting those customers
after the sale.
So, if something happens, and Amazon shuts down the seller account, the seller
might lose all the data it has regarding the customers and the products. Of course,
Amazon would not take any such actions randomly, and if the seller is following
all the rules and guidelines, he/she should be fine. But, some of the rules are
complicated, and there are possibilities for a human error.
69
To maintain the business sustainable, and to minimize the risks, it is vital for the
company to be more directly engaged with the customers. One of the most
common method regarding this, is the usage of insert cards. Many sellers include
an insert card into the product package. This card may include e.g. a discount
coupon to some other product from the seller, links to the company web pages or
Facebook pages or something else in that nature. Target is to get the customer’s
contact information.
Another typical way of gathering customer contact information, is via Facebook
marketing. Sellers will target groups on the same niche to offer e.g. discount
coupons. Those who opt in, will leave their contact information in the process.
Facebook fan pages can be used in similar manner.
Key idea is to engage the customer directly with the seller. The two most common
engagement techniques are the creation of a Facebook fan page with the
followers, and building up an email list. Both can be used to communicate directly
with the customers; increasing the engagement by providing useful content and
information. This database can be used for promoting new products and to direct
customers to the sellers own online store, rather than to Amazon.
8 SUMMARY
This case study demonstrated that it is possible to start a new vital online business
relatively easily, independently of the location of the entrepreneur.
The first phase of the study was the analysis of suitable online selling platforms.
Conclusion was that Amazon, and the Fulfillment by Amazon, model is the best
way to start a new e-commerce business. This business model will enable a quick
start of sales on a large market area.
Different business models were analyzed, and the conclusion was that private
label is the most sustainable and profitable business model, especially in the long
70
run. Using private label business model all the copyrights are in full control, and
there is no risk of other sellers offering the same product.
It was also demonstrated, that suitable product selection can be done successfully
using publicly available information. Selected product was sourced from China,
and successfully introduced to the selected German marketplace.
Gathered sales data proves that the business model works. The conclusions that
were drawn, proved to be correct. Selected marketplace and the FBA business
model are vital; product selection criteria work, and a new online business can be
established successfully following the methodology described.
All the research questions were answered, lessons learnt were discussed, and
suggestions for future were addressed.
71
REFERENCES
Written references
Daniel, E., Di Domenico, M. and Sharma, S. (2015). Effectuation and homebased
online business entrepreneurs. International Small Business Journal, 33(8), pp.799-
823.
Mintzer, R. (2014). Start Your Own e-Busines. 3rd ed. Entrepreneur Press.
Electronic references
About-Payments.com. (2016). Global E-commerce Sales Growth Figures 2014.
[online] Available at: https://www.about-payments.com/newsroom/news /30566/
global-e-commerce-sales-growth-figures-2014 [Accessed 18 Jan. 2016].
Adams, M. (2015). How To Get More Amazon Reviews. [podcast] The Private
Label Report. Available at: http://markscottadams.com/how-to-get-more-amazon-
reviews/ [Accessed 19 Jan. 2016].
Adams, M. (2015). How much should your Amazon sales increase in the Christmas
Season. [podcast] The Private Label Report. Available at:
http://markscottadams.com/how-much-should-your-amazon-sales-increase-in-the-
christmas-season/ [Accessed 6 Apr. 2016].
Amazon, (2015). Amazon Annual Report 2014.
Amazon.com. (2016). Amazon Prime. [online] Available at:
https://www.amazon.com/Amazon-Prime-One-Year-
Membership/dp/B00DBYBNEE [Accessed 20 Jan. 2016].
Atkins, I. (2016). What Is Drop Shipping? And How Does It Work?. [online]
Fitsmallbusiness.com. Available at: http://fitsmallbusiness.com/what-is-drop-
shipping/ [Accessed 2 Oct. 2016].

72
BusinessDictionary.com. (2016). What is private label? definition and meaning.
[online] Available at: http://www.businessdictionary.com/definition/private-
label.html [Accessed 2 Oct. 2016].
camelcamelcamel.com. (2016). Amazon price tracker, Amazon price history charts,
price watches, and price drop alerts. [online] Available at:
http://camelcamelcamel.com/ [Accessed 8 Jun. 2016].
Coats, M. (2016). EP10: AMAZON PRIVATE LABEL – PRICING
STRATEGIES, GETTING REVIEWS, AND SETTING GOALS. [podcast]
AM/PM Podcast. Available at: http://www.ampmpodcast.com/ep10-amazon-
private-label-pricing-strategies-getting-reviews-and-setting-goals/ [Accessed 12
Mar. 2016].
Coats, M. (2016). Pricing Strategies for your Private Label Products on Amazon.
[podcast] AM/MP Podcast. Available at: http://www.ampmpodcast.com/pricing-
strategies-private-label-products-amazon-ep16/ [Accessed 1 May 2016].
Ecommerce News. (2016). Otto opens its network to third-party sellers -
Ecommerce News. [online] Available at: http://ecommercenews.eu/otto-opens-its-
network-to-third-party-sellers/ [Accessed 3 Feb. 2016].
Emarketer.com. (2016). Retail Sales Worldwide Will Top $22 Trillion This Year -
eMarketer. [online] Available at: http://www.emarketer.com/Article/Retail-Sales-
Worldwide-Will-Top-22-Trillion-This-Year/1011765 [Accessed 18 Jan. 2016].
Google.de. (2016). Google Trends. [online] Available at:
https://www.google.de/trends/ [Accessed 8 Jun. 2016].
Investopedia. (2016). Wholesaling. [online] Available at:
http://www.investopedia.com/terms/w/wholesaling.asp [Accessed 2 Oct. 2016].
Landowski, N. (2016). Amazon Private Label Show Ep #2 – Starting Out Selling
On Amazon FBA. [podcast] The Private Labeler Show. Available at:
http://privatelabelershow.com/amazon-private-label-show-ep-2-starting-out-
selling-on-amazon-fba/ [Accessed 1 Feb. 2016].

73
Private Label Journey. (2016). Zusammenarbeit mit einem Logistiker im Detail –
Amazon FBA. [podcast] Available at:
http://privatelabeljourney.de/zusammenarbeit-mit-einem-logistiker-im-detail-
amazon-fba/ [Accessed 10 May 2016].
Rankin, J. (2016). Third-party sellers and Amazon - a double-edged sword in e-
commerce. [online] the Guardian. Available at:
https://www.theguardian.com/technology/2015/jun/23/amazon-marketplace-third-
party-seller-faustian-pact [Accessed 24 Jan. 2016].
Rizer, K. (2016). PLP 78 - Greg Mercer - Product Research with Jungle Scout.
[podcast] Private Label Podcast. Available at:
https://privatelabelpodcast.com/episodes/78 [Accessed 14 Feb. 2016].
Rizer, K. (2016). Listen and Learn Session 20 - Managing Reviews. [podcast]
Private Label Podcast. Available at: https://privatelabelpodcast.com/episodes/82
[Accessed 4 Apr. 2016].
RocketCompanies. (2016). Top 10 e-commerce sites in the world. [online]
Available at: http://www.rocketcompanies.com/reports/top-10-e-commerce-sites/
[Accessed 3 Feb. 2016].
Statista. (2016). eBay: regional distribution of net sales 2015 | Statistic. [online]
Available at: https://www.statista.com/statistics/266198/regional-distribution-of-
ebays-annual-net-revenue/ [Accessed 3 Feb. 2016].
The Work at Home Wife. (2016). Retail Arbitrage: 45 Ways to Buy Low & Sell
High. [online] Available at: http://theworkathomewife.com/45-ways-to-buy-low-
sell-high-with-retail-arbitrage/ [Accessed 2 Oct. 2016].
Voelker, S. (2015). HOW TO RESEARCH AND CHOOSE PRODUCTS THAT
WILL SELL ON AMAZON – STEP BY STEP. [podcast] The Amazing Seller
Podcast. Available at: http://theamazingseller.com/tas-004-how-to-research-and-
choose-products-that-will-sell-on-amazon-step-by-step/ [Accessed 3 Feb. 2016].
Voelker, S. (2015). 5 Tips for Using Google Trends to Predict the Future for
Maximum Sales. [podcast] The Amazing Seller. Available at:
74
http://theamazingseller.com/tas-072-5-tips-for-using-google-trends-to-predict-the-
future-for-maximum-sales/ [Accessed 17 May 2016].
Walsh, T. (2016). The 4 Largest Markets for Amazon.com, Inc. -- The Motley Fool.
[online] The Motley Fool. Available at:
http://www.fool.com/investing/general/2015/04/25/the-4-largest-markets-for-
amazoncom-inc.aspx [Accessed 3 Feb. 2016].
Ward, M. (2015). How to Dominate Amazon.de and Expand FBA Empires into
Europe – ALL34. [podcast] FBA Allstars. Available at:
http://www.fbaallstars.com/how-to-dominate-amazon-de-and-expand-fba-
empires-into-europe-all34 [Accessed 9 Feb. 2016].
Finance.yahoo.com. (2016). AMZN Income Statement | Balance Sheet | Cash
Flow | Amazon.com, Inc. Stock - Yahoo Finance. [online] Available at:
https://finance.yahoo.com/quote/AMZN/financials?p=AMZN [Accessed 24 Jan.
2016].

75
APPENDICES
Figures 24-33 present the data analysis of few key fitness products in both
amazon.co.uk and in amazon.de marketplaces. The data shows the best sellers in
each category. In some categories, there are wrong type of products classified into
the category, these have been ignored and they can be seen as empty lines in the
Figures.
The supplier names and ASIN codes are removed for confidentiality reasons.
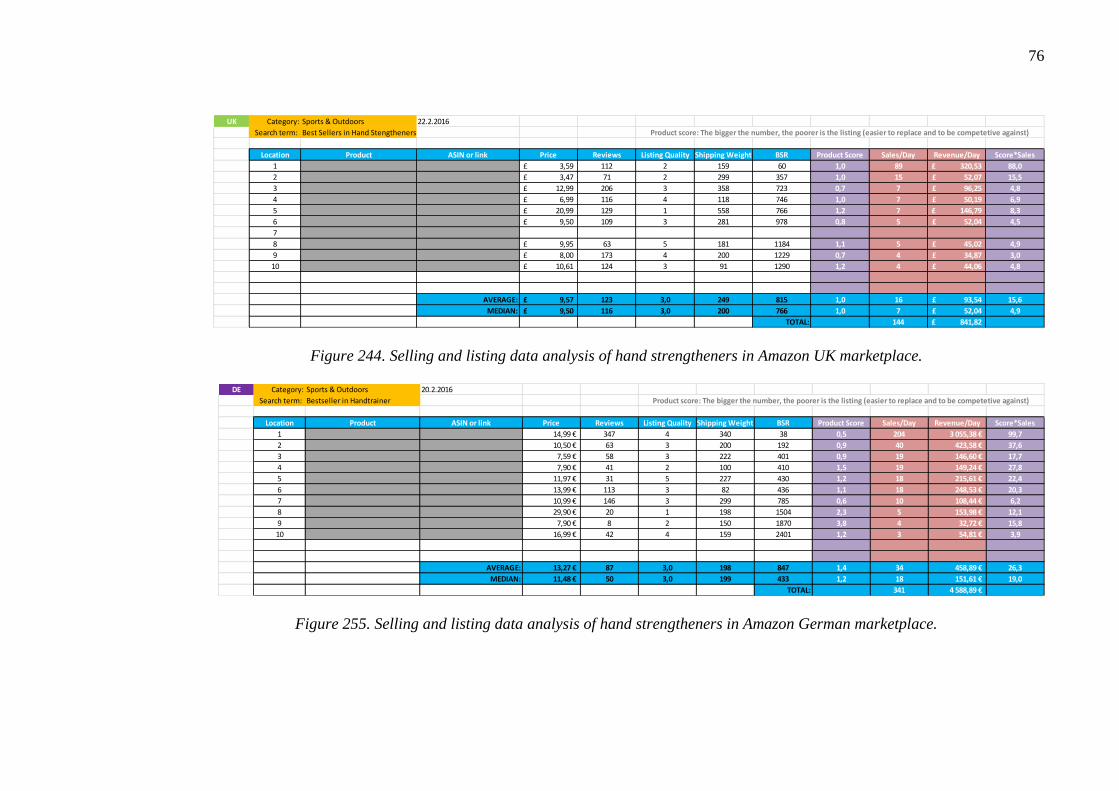
76
Figure 244. Selling and listing data analysis of hand strengtheners in Amazon UK marketplace.
Figure 255. Selling and listing data analysis of hand strengtheners in Amazon German marketplace.
UK Category: Sports & Outdoors 22.2.2016
Search term: Best Sellers in Hand Stengtheners Product score: The bigger the number, the poorer is the listing (easier to replace and to be competetive against)
Location Product ASIN or link Price Reviews Listing Quality Shipping Weight BSR Product Score Sales/Day Revenue/Day Score*Sales
1 3,59£ 112 2 159 60 1,0 89 320,53£ 88,0
2 3,47£ 71 2 299 357 1,0 15 52,07£ 15,5
3 12,99£ 206 3 358 723 0,7 7 96,25£ 4,8
4 6,99£ 116 4 118 746 1,0 7 50,19£ 6,9
5 20,99£ 129 1 558 766 1,2 7 146,79£ 8,3
6 9,50£ 109 3 281 978 0,8 5 52,04£ 4,5
7
8 9,95£ 63 5 181 1184 1,1 5 45,02£ 4,9
9 8,00£ 173 4 200 1229 0,7 4 34,87£ 3,0
10 10,61£ 124 3 91 1290 1,2 4 44,06£ 4,8
AVERAGE: 9,57£ 123 3,0 249 815 1,0 16 93,54£ 15,6
MEDIAN: 9,50£ 116 3,0 200 766 1,0 7 52,04£ 4,9
TOTAL: 144 841,82£
DE Category: Sports & Outdoors 20.2.2016
Search term: Bestseller in Handtrainer Product score: The bigger the number, the poorer is the listing (easier to replace and to be competetive against)
Location Product ASIN or link Price Reviews Listing Quality Shipping Weight BSR Product Score Sales/Day Revenue/Day Score*Sales
1 14,99 € 347 4 340 38 0,5 204 3 055,38 € 99,7
2 10,50 € 63 3 200 192 0,9 40 423,58 € 37,6
3 7,59 € 58 3 222 401 0,9 19 146,60 € 17,7
4 7,90 € 41 2 100 410 1,5 19 149,24 € 27,8
5 11,97 € 31 5 227 430 1,2 18 215,61 € 22,4
6 13,99 € 113 3 82 436 1,1 18 248,53 € 20,3
7 10,99 € 146 3 299 785 0,6 10 108,44 € 6,2
8 29,90 € 20 1 198 1504 2,3 5 153,98 € 12,1
9 7,90 € 8 2 150 1870 3,8 4 32,72 € 15,8
10 16,99 € 42 4 159 2401 1,2 3 54,81 € 3,9
AVERAGE: 13,27 € 87 3,0 198 847 1,4 34 458,89 € 26,3
MEDIAN: 11,48 € 50 3,0 199 433 1,2 18 151,61 € 19,0
TOTAL: 341 4 588,89 €

77
Figure 266. Selling and listing data analysis of weight lifting belts in Amazon UK marketplace.
Figure 277. Selling and listing data analysis of weight lifting belts in Amazon German marketplace.
UK Category: Sports & Outdoors 22.2.2016
Search term: Best Sellers in Weight Lifting Belts Product score: The bigger the number, the poorer is the listing (easier to replace and to be competetive against)
Size L
Location Product ASIN or link Price Reviews Listing Quality Shipping Weight BSR Product Score Sales/Day Revenue/Day Score*Sales
1 15,99£ 219 3 240 267 0,7 20 320,82£ 14,8
2 14,34£ 203 4 499 350 0,6 15 219,48£ 8,9
3 10,99£ 34 3 561 744 1,5 7 79,13£ 10,8
4 14,34£ 112 4 299 900 0,8 6 85,35£ 4,7
5 14,99£ 28 3 561 992 1,8 5 80,95£ 9,6
6 19,99£ 205 5 558 1583 0,6 3 67,65£ 2,0
7 24,34£ 84 4 898 2111 0,9 3 61,77£ 2,3
8 16,40£ 128 1 522 2611 1,2 2 33,65£ 2,4
9 15,34£ 103 3 649 2866 0,8 2 28,67£ 1,5
10 35,00£ 77 3 821 3226 1,1 2 58,12£ 1,8
AVERAGE: 18,17£ 119 3,3 561 1565 1,0 7 103,56£ 5,9
MEDIAN: 15,67£ 108 3,0 560 1288 0,8 4 73,39£ 3,5
TOTAL: 65 1 035,59£
DE Category: Sports & Outdoors 22.2.2016
Search term: Bestseller in Gewichthebergürtel Product score: The bigger the number, the poorer is the listing (easier to replace and to be competetive against)
Location Product ASIN or link Price Reviews Listing Quality Shipping Weight BSR Product Score Sales/Day Revenue/Day Score*Sales
1
2 13,60 € 144 1 825 510 0,9 15 206,55 € 14,3
3 26,89 € 101 2 921 1354 0,8 6 153,82 € 4,7
4
5
6 25,74 € 7 4 649 3095 4,0 3 64,42 € 10,0
7 32,95 € 14 3 1250 3448 2,3 2 74,02 € 5,1
8
9 14,99 € 45 3 481 3855 1,0 2 30,12 € 2,0
10
AVERAGE: 22,83 € 62 2,6 825 2452 1,8 6 105,78 € 7,2
MEDIAN: 25,74 € 45 3,0 825 3095 1,0 3 74,02 € 5,1
TOTAL: 28 528,92 €
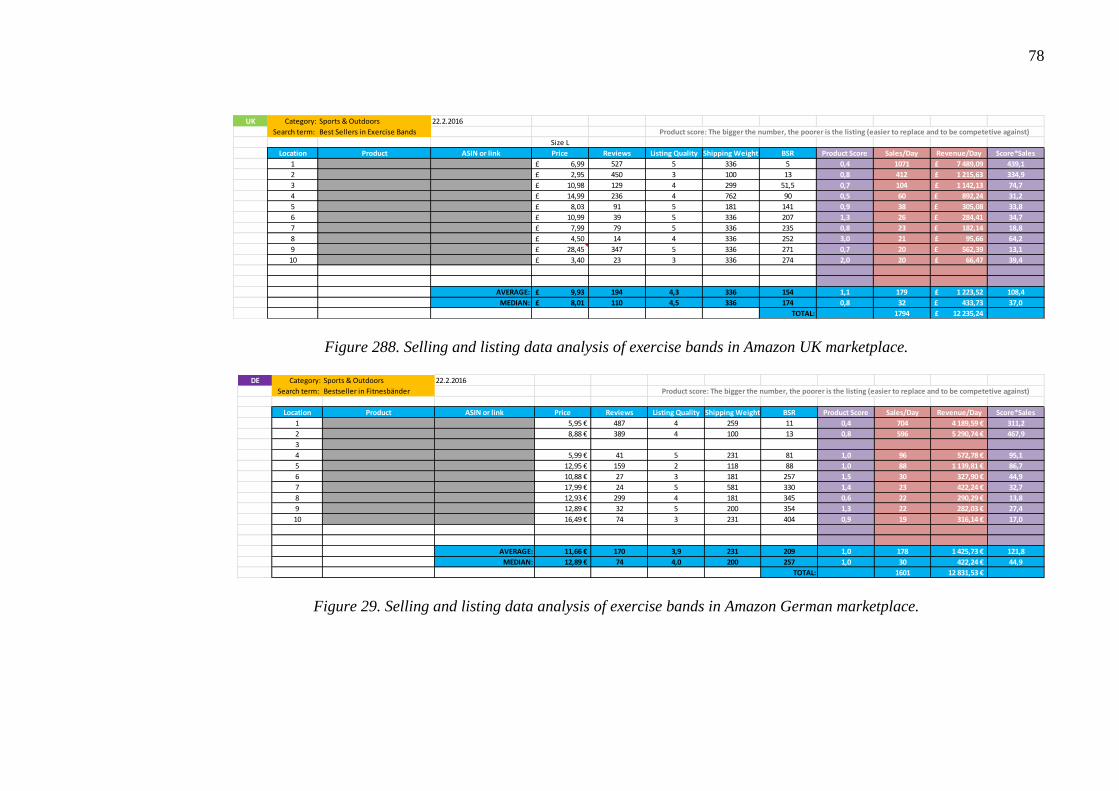
78
Figure 288. Selling and listing data analysis of exercise bands in Amazon UK marketplace.
Figure 29. Selling and listing data analysis of exercise bands in Amazon German marketplace.
UK Category: Sports & Outdoors 22.2.2016
Search term: Best Sellers in Exercise Bands Product score: The bigger the number, the poorer is the listing (easier to replace and to be competetive against)
Size L
Location Product ASIN or link Price Reviews Listing Quality Shipping Weight BSR Product Score Sales/Day Revenue/Day Score*Sales
1 6,99£ 527 5 336 5 0,4 1071 7 489,09£ 439,1
2 2,95£ 450 3 100 13 0,8 412 1 215,63£ 334,9
3 10,98£ 129 4 299 51,5 0,7 104 1 142,13£ 74,7
4 14,99£ 236 4 762 90 0,5 60 892,24£ 31,2
5 8,03£ 91 5 181 141 0,9 38 305,08£ 33,8
6 10,99£ 39 5 336 207 1,3 26 284,41£ 34,7
7 7,99£ 79 5 336 235 0,8 23 182,14£ 18,8
8 4,50£ 14 4 336 252 3,0 21 95,66£ 64,2
9 28,45£ 347 5 336 271 0,7 20 562,39£ 13,1
10 3,40£ 23 3 336 274 2,0 20 66,47£ 39,4
AVERAGE: 9,93£ 194 4,3 336 154 1,1 179 1 223,52£ 108,4
MEDIAN: 8,01£ 110 4,5 336 174 0,8 32 433,73£ 37,0
TOTAL: 1794 12 235,24£
DE Category: Sports & Outdoors 22.2.2016
Search term: Bestseller in Fitnesbänder Product score: The bigger the number, the poorer is the listing (easier to replace and to be competetive against)
Location Product ASIN or link Price Reviews Listing Quality Shipping Weight BSR Product Score Sales/Day Revenue/Day Score*Sales
1 5,95 € 487 4 259 11 0,4 704 4 189,59 € 311,2
2 8,88 € 389 4 100 13 0,8 596 5 290,74 € 467,9
3
4 5,99 € 41 5 231 81 1,0 96 572,78 € 95,1
5 12,95 € 159 2 118 88 1,0 88 1 139,81 € 86,7
6 10,88 € 27 3 181 257 1,5 30 327,90 € 44,9
7 17,99 € 24 5 581 330 1,4 23 422,24 € 32,7
8 12,93 € 299 4 181 345 0,6 22 290,29 € 13,8
9 12,89 € 32 5 200 354 1,3 22 282,03 € 27,4
10 16,49 € 74 3 231 404 0,9 19 316,14 € 17,0
AVERAGE: 11,66 € 170 3,9 231 209 1,0 178 1 425,73 € 121,8
MEDIAN: 12,89 € 74 4,0 200 257 1,0 30 422,24 € 44,9
TOTAL: 1601 12 831,53 €
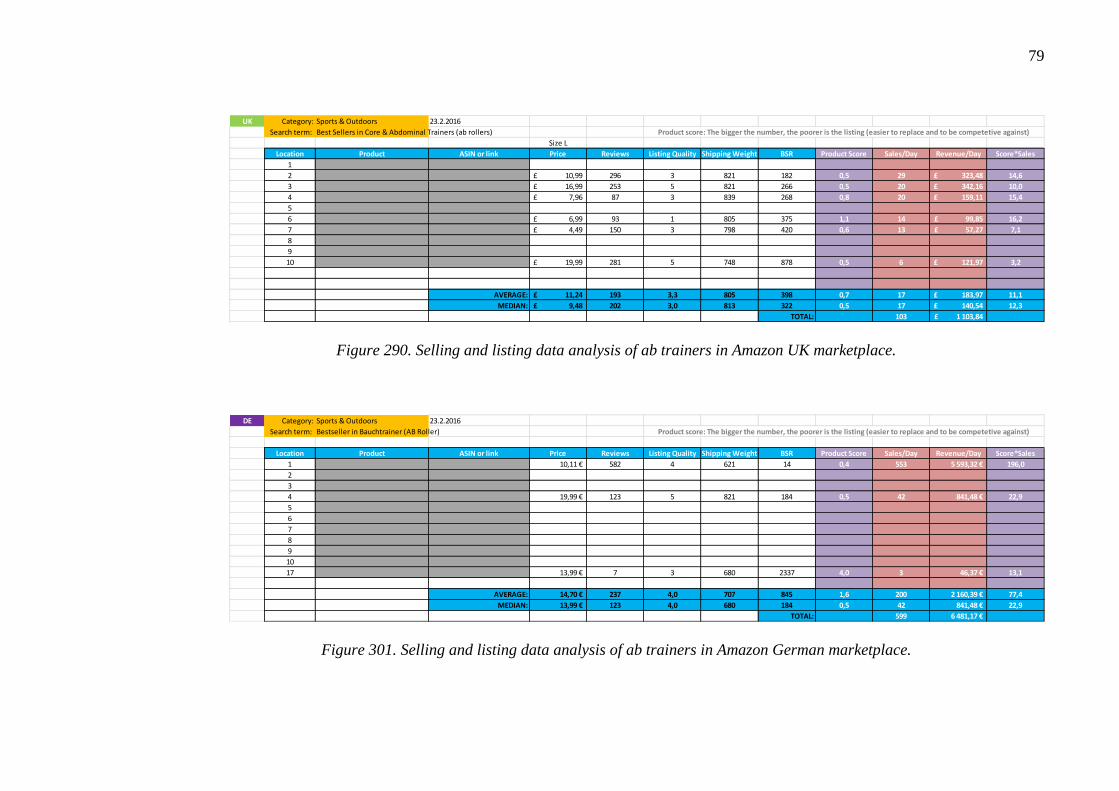
79
Figure 290. Selling and listing data analysis of ab trainers in Amazon UK marketplace.
Figure 301. Selling and listing data analysis of ab trainers in Amazon German marketplace.
UK Category: Sports & Outdoors 23.2.2016
Search term: Best Sellers in Core & Abdominal Trainers (ab rollers) Product score: The bigger the number, the poorer is the listing (easier to replace and to be competetive against)
Size L
Location Product ASIN or link Price Reviews Listing Quality Shipping Weight BSR Product Score Sales/Day Revenue/Day Score*Sales
1
2 10,99£ 296 3 821 182 0,5 29 323,48£ 14,6
3 16,99£ 253 5 821 266 0,5 20 342,16£ 10,0
4 7,96£ 87 3 839 268 0,8 20 159,11£ 15,4
5
6 6,99£ 93 1 805 375 1,1 14 99,85£ 16,2
7 4,49£ 150 3 798 420 0,6 13 57,27£ 7,1
8
9
10 19,99£ 281 5 748 878 0,5 6 121,97£ 3,2
AVERAGE: 11,24£ 193 3,3 805 398 0,7 17 183,97£ 11,1
MEDIAN: 9,48£ 202 3,0 813 322 0,5 17 140,54£ 12,3
TOTAL: 103 1 103,84£
DE Category: Sports & Outdoors 23.2.2016
Search term: Bestseller in Bauchtrainer (AB Roller) Product score: The bigger the number, the poorer is the listing (easier to replace and to be competetive against)
Location Product ASIN or link Price Reviews Listing Quality Shipping Weight BSR Product Score Sales/Day Revenue/Day Score*Sales
1 10,11 € 582 4 621 14 0,4 553 5 593,32 € 196,0
2
3
4 19,99 € 123 5 821 184 0,5 42 841,48 € 22,9
5
6
7
8
9
10
17 13,99 € 7 3 680 2337 4,0 3 46,37 € 13,1
AVERAGE: 14,70 € 237 4,0 707 845 1,6 200 2 160,39 € 77,4
MEDIAN: 13,99 € 123 4,0 680 184 0,5 42 841,48 € 22,9
TOTAL: 599 6 481,17 €

80
Figure 312. Selling and listing data analysis of pull-up bars in Amazon UK marketplace.
Figure 323. Selling and listing data analysis of pull-up bars in Amazon German marketplace.
UK Category: Sports & Outdoors 23.2.2016
Search term: Best Sellers in Pull-Up Bars Product score: The bigger the number, the poorer is the listing (easier to replace and to be competetive against)
Size L
Location Product ASIN or link Price Reviews Listing Quality Shipping Weight BSR Product Score Sales/Day Revenue/Day Score*Sales
1 13,40£ 58 3 2317 121 1,0 44 593,25£ 44,4
2 7,99£ 306 2 1200 422 0,5 13 101,43£ 6,9
3 24,00£ 234 3 3100 836 0,6 6 153,79£ 3,9
4 25,88£ 20 3 1900 749 2,4 7 185,10£ 16,9
5
6 8,98£ 9 2 2100 964 4,6 6 49,90£ 25,5
7 15,43£ 225 4 2900 964 0,5 6 85,75£ 2,7
8 12,99£ 46 3 2317 1179 1,2 5 59,02£ 5,3
9 9,99£ 26 2 2700 1460 1,9 4 36,66£ 6,8
10 7,97£ 9 2 2317 1656 4,6 3 25,78£ 14,8
AVERAGE: 14,07£ 104 2,7 2317 928 1,9 10 143,41£ 14,1
MEDIAN: 12,99£ 46 3,0 2317 964 1,2 6 85,75£ 6,9
TOTAL: 93 1 290,68£
DE Category: Sports & Outdoors 23.2.2016
Search term: Bestseller in Klimmzugstangen Product score: The bigger the number, the poorer is the listing (easier to replace and to be competetive against)
Location Product ASIN or link Price Reviews Listing Quality Shipping Weight BSR Product Score Sales/Day Revenue/Day Score*Sales
1 24,99 € 694 4 1900 24 0,4 323 8 064,95 € 133,0
2 14,99 € 408 4 2200 127 0,4 61 914,21 € 21,6
3 14,99 € 194 2 1700 159 0,6 49 730,22 € 28,2
4 17,95 € 391 2 5000 195 0,5 40 712,98 € 20,6
5 7,79 € 187 4 1300 380 0,4 20 158,78 € 7,8
6 24,99 € 170 4 3100 514 0,5 15 376,57 € 7,7
7 45,95 € 414 2 3500 583 0,7 13 610,47 € 9,9
8
9
10 9,99 € 46 3 1300 1060 0,9 7 73,00 € 6,3
AVERAGE: 20,21 € 313 3,1 2500 380 0,5 66 1 455,15 € 29,4
MEDIAN: 16,47 € 293 3,5 2050 288 0,5 30 661,72 € 15,2
TOTAL: 528 11 641,18 €

81